Charleston, MO Map & Demographics
Charleston Map
Charleston Overview
$14,991
PER CAPITA INCOME
$45,385
AVG FAMILY INCOME
$29,306
AVG HOUSEHOLD INCOME
37.7%
WAGE / INCOME GAP [ % ]
62.3¢/ $1
WAGE / INCOME GAP [ $ ]
0.50
INEQUALITY / GINI INDEX
4,683
TOTAL POPULATION
2,848
MALE POPULATION
1,835
FEMALE POPULATION
155.20
MALES / 100 FEMALES
64.43
FEMALES / 100 MALES
42.2
MEDIAN AGE
3.3
AVG FAMILY SIZE
2.4
AVG HOUSEHOLD SIZE
1,323
LABOR FORCE [ PEOPLE ]
33.8%
PERCENT IN LABOR FORCE
7.9%
UNEMPLOYMENT RATE
Charleston Zip Codes
Charleston Area Codes
Income in Charleston
Income Overview in Charleston
Per Capita Income in Charleston is $14,991, while median incomes of families and households are $45,385 and $29,306 respectively.
| Characteristic | Number | Measure |
| Per Capita Income | 4,683 | $14,991 |
| Median Family Income | 788 | $45,385 |
| Mean Family Income | 788 | $58,958 |
| Median Household Income | 1,340 | $29,306 |
| Mean Household Income | 1,340 | $46,382 |
| Income Deficit | 788 | $0 |
| Wage / Income Gap (%) | 4,683 | 37.73% |
| Wage / Income Gap ($) | 4,683 | 62.27¢ per $1 |
| Gini / Inequality Index | 4,683 | 0.50 |
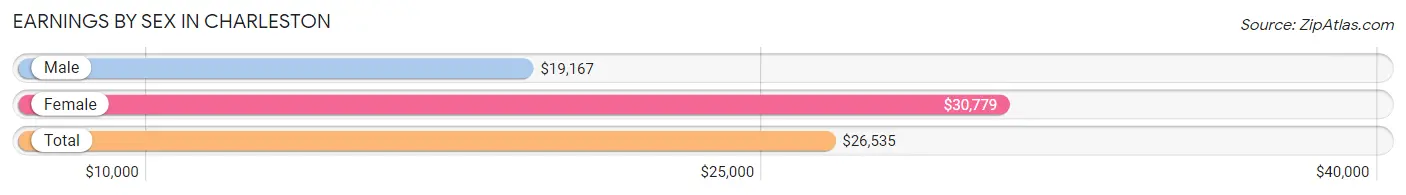
Earnings by Sex in Charleston
Average Earnings in Charleston are $26,535, $19,167 for men and $30,779 for women, a difference of 37.7%.
| Sex | Number | Average Earnings |
| Male | 918 (57.4%) | $19,167 |
| Female | 681 (42.6%) | $30,779 |
| Total | 1,599 (100.0%) | $26,535 |
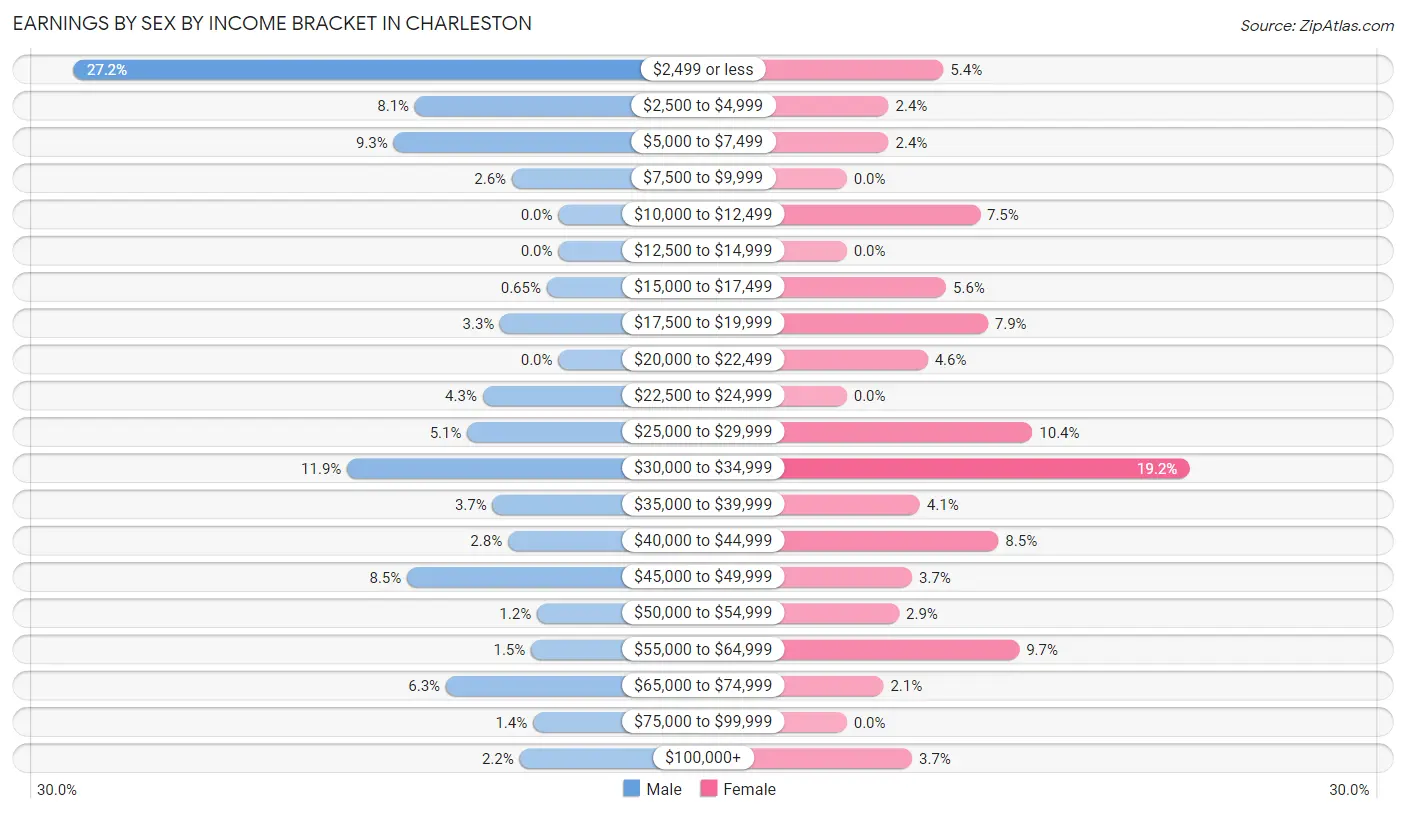
Earnings by Sex by Income Bracket in Charleston
The most common earnings brackets in Charleston are $2,499 or less for men (250 | 27.2%) and $30,000 to $34,999 for women (131 | 19.2%).
| Income | Male | Female |
| $2,499 or less | 250 (27.2%) | 37 (5.4%) |
| $2,500 to $4,999 | 74 (8.1%) | 16 (2.4%) |
| $5,000 to $7,499 | 85 (9.3%) | 16 (2.4%) |
| $7,500 to $9,999 | 24 (2.6%) | 0 (0.0%) |
| $10,000 to $12,499 | 0 (0.0%) | 51 (7.5%) |
| $12,500 to $14,999 | 0 (0.0%) | 0 (0.0%) |
| $15,000 to $17,499 | 6 (0.6%) | 38 (5.6%) |
| $17,500 to $19,999 | 30 (3.3%) | 54 (7.9%) |
| $20,000 to $22,499 | 0 (0.0%) | 31 (4.5%) |
| $22,500 to $24,999 | 39 (4.3%) | 0 (0.0%) |
| $25,000 to $29,999 | 47 (5.1%) | 71 (10.4%) |
| $30,000 to $34,999 | 109 (11.9%) | 131 (19.2%) |
| $35,000 to $39,999 | 34 (3.7%) | 28 (4.1%) |
| $40,000 to $44,999 | 26 (2.8%) | 58 (8.5%) |
| $45,000 to $49,999 | 78 (8.5%) | 25 (3.7%) |
| $50,000 to $54,999 | 11 (1.2%) | 20 (2.9%) |
| $55,000 to $64,999 | 14 (1.5%) | 66 (9.7%) |
| $65,000 to $74,999 | 58 (6.3%) | 14 (2.1%) |
| $75,000 to $99,999 | 13 (1.4%) | 0 (0.0%) |
| $100,000+ | 20 (2.2%) | 25 (3.7%) |
| Total | 918 (100.0%) | 681 (100.0%) |
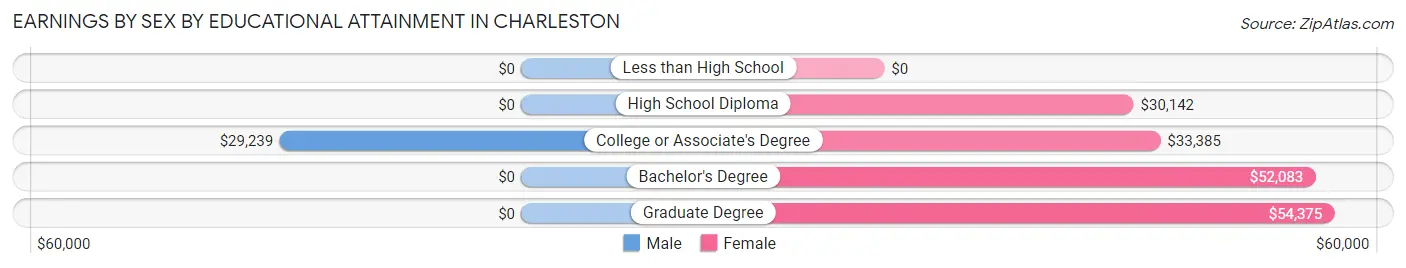
Earnings by Sex by Educational Attainment in Charleston
Average earnings in Charleston are $25,156 for men and $32,100 for women, a difference of 21.6%. Men with an educational attainment of college or associate's degree enjoy the highest average annual earnings of $29,239, while those with college or associate's degree education earn the least with $29,239. Women with an educational attainment of graduate degree earn the most with the average annual earnings of $54,375, while those with high school diploma education have the smallest earnings of $30,142.
| Educational Attainment | Male Income | Female Income |
| Less than High School | - | - |
| High School Diploma | - | - |
| College or Associate's Degree | $29,239 | $33,385 |
| Bachelor's Degree | - | - |
| Graduate Degree | - | - |
| Total | $25,156 | $32,100 |
Family Income in Charleston
Family Income Brackets in Charleston
According to the Charleston family income data, there are 231 families falling into the $35,000 to $49,999 income range, which is the most common income bracket and makes up 29.3% of all families. Conversely, the $10,000 to $14,999 income bracket is the least frequent group with only 27 families (3.4%) belonging to this category.
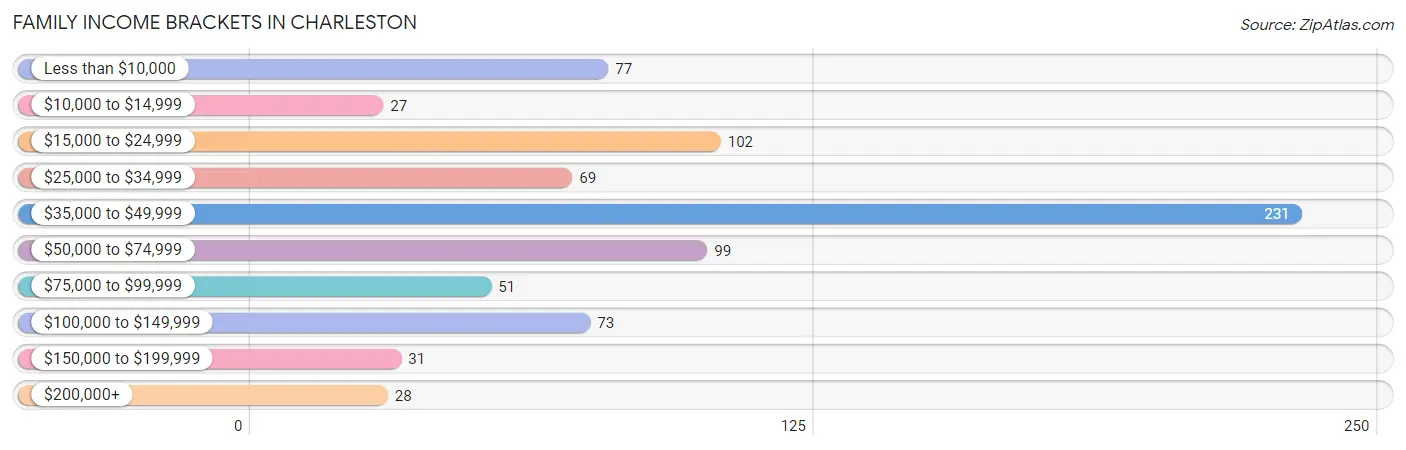
| Income Bracket | # Families | % Families |
| Less than $10,000 | 77 | 9.8% |
| $10,000 to $14,999 | 27 | 3.4% |
| $15,000 to $24,999 | 102 | 12.9% |
| $25,000 to $34,999 | 69 | 8.8% |
| $35,000 to $49,999 | 231 | 29.3% |
| $50,000 to $74,999 | 99 | 12.6% |
| $75,000 to $99,999 | 51 | 6.5% |
| $100,000 to $149,999 | 73 | 9.3% |
| $150,000 to $199,999 | 31 | 3.9% |
| $200,000+ | 28 | 3.6% |
Family Income by Famaliy Size in Charleston
2-person families (447 | 56.7%) account for the highest median family income in Charleston with $47,463 per family, while 2-person families (447 | 56.7%) have the highest median income of $23,732 per family member.
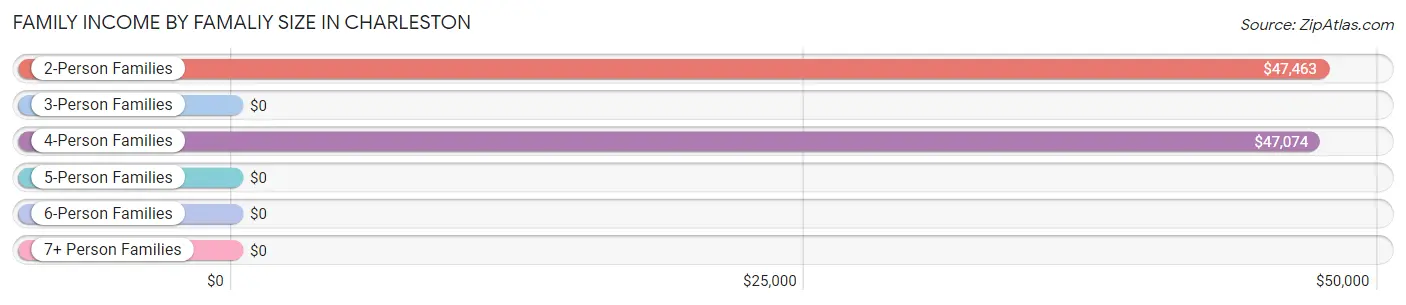
| Income Bracket | # Families | Median Income |
| 2-Person Families | 447 (56.7%) | $47,463 |
| 3-Person Families | 127 (16.1%) | $0 |
| 4-Person Families | 129 (16.4%) | $47,074 |
| 5-Person Families | 63 (8.0%) | $0 |
| 6-Person Families | 15 (1.9%) | $0 |
| 7+ Person Families | 7 (0.9%) | $0 |
| Total | 788 (100.0%) | $45,385 |
Family Income by Number of Earners in Charleston
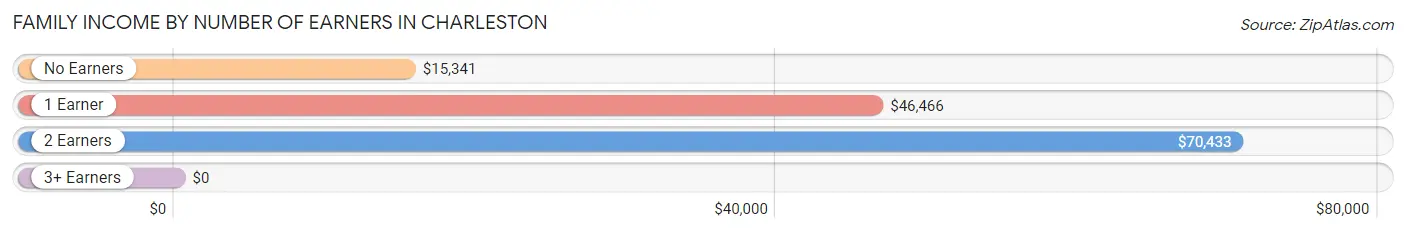
| Number of Earners | # Families | Median Income |
| No Earners | 163 (20.7%) | $15,341 |
| 1 Earner | 375 (47.6%) | $46,466 |
| 2 Earners | 187 (23.7%) | $70,433 |
| 3+ Earners | 63 (8.0%) | $0 |
| Total | 788 (100.0%) | $45,385 |
Household Income in Charleston
Household Income Brackets in Charleston
With 244 households falling in the category, the $35,000 to $49,999 income range is the most frequent in Charleston, accounting for 18.2% of all households. In contrast, only 34 households (2.5%) fall into the $200,000+ income bracket, making it the least populous group.
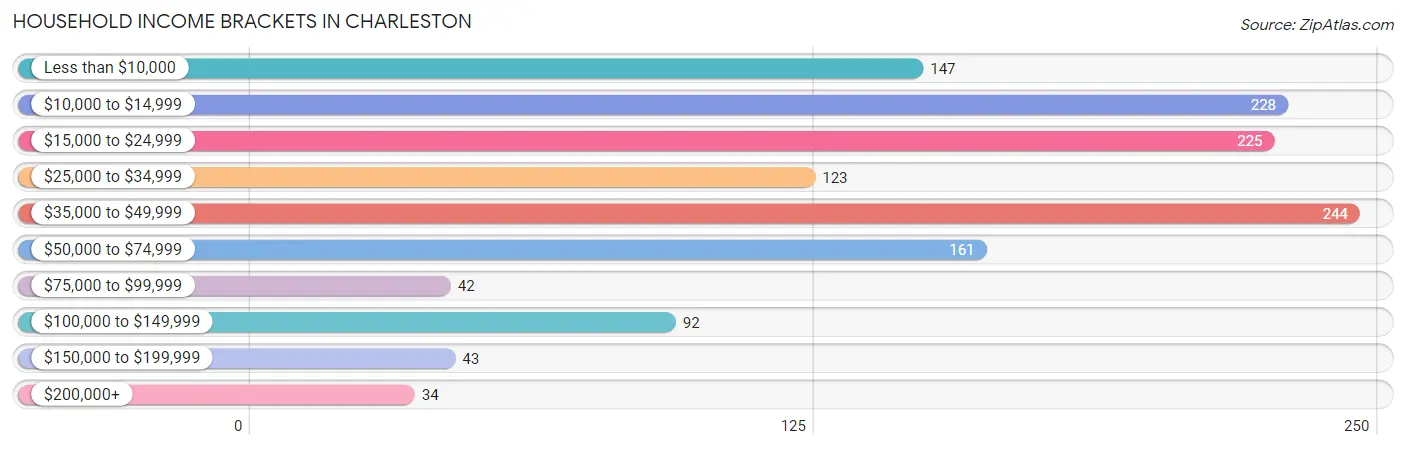
| Income Bracket | # Households | % Households |
| Less than $10,000 | 147 | 11.0% |
| $10,000 to $14,999 | 228 | 17.0% |
| $15,000 to $24,999 | 225 | 16.8% |
| $25,000 to $34,999 | 123 | 9.2% |
| $35,000 to $49,999 | 244 | 18.2% |
| $50,000 to $74,999 | 161 | 12.0% |
| $75,000 to $99,999 | 42 | 3.1% |
| $100,000 to $149,999 | 92 | 6.9% |
| $150,000 to $199,999 | 43 | 3.2% |
| $200,000+ | 34 | 2.5% |
Household Income by Householder Age in Charleston
The median household income in Charleston is $29,306, with the highest median household income of $37,917 found in the 45 to 64 years age bracket for the primary householder. A total of 445 households (33.2%) fall into this category. Meanwhile, the 15 to 24 years age bracket for the primary householder has the lowest median household income of $0, with 20 households (1.5%) in this group.
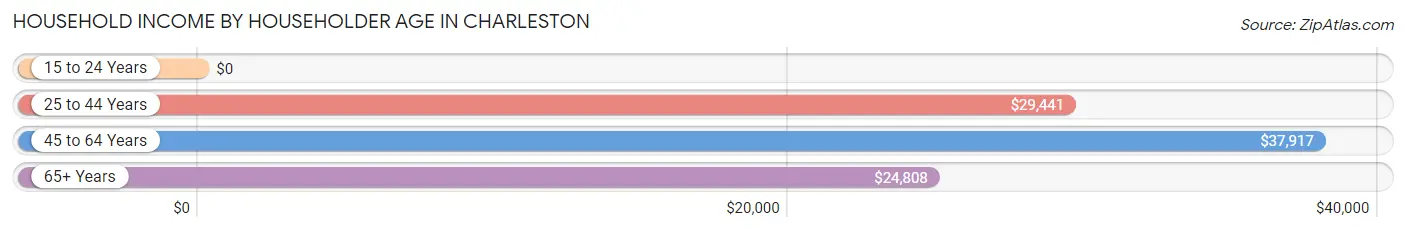
| Income Bracket | # Households | Median Income |
| 15 to 24 Years | 20 (1.5%) | $0 |
| 25 to 44 Years | 457 (34.1%) | $29,441 |
| 45 to 64 Years | 445 (33.2%) | $37,917 |
| 65+ Years | 418 (31.2%) | $24,808 |
| Total | 1,340 (100.0%) | $29,306 |
Poverty in Charleston
Income Below Poverty by Sex and Age in Charleston
With 33.1% poverty level for males and 30.6% for females among the residents of Charleston, 6 to 11 year old males and 35 to 44 year old females are the most vulnerable to poverty, with 134 males (69.4%) and 183 females (63.5%) in their respective age groups living below the poverty level.
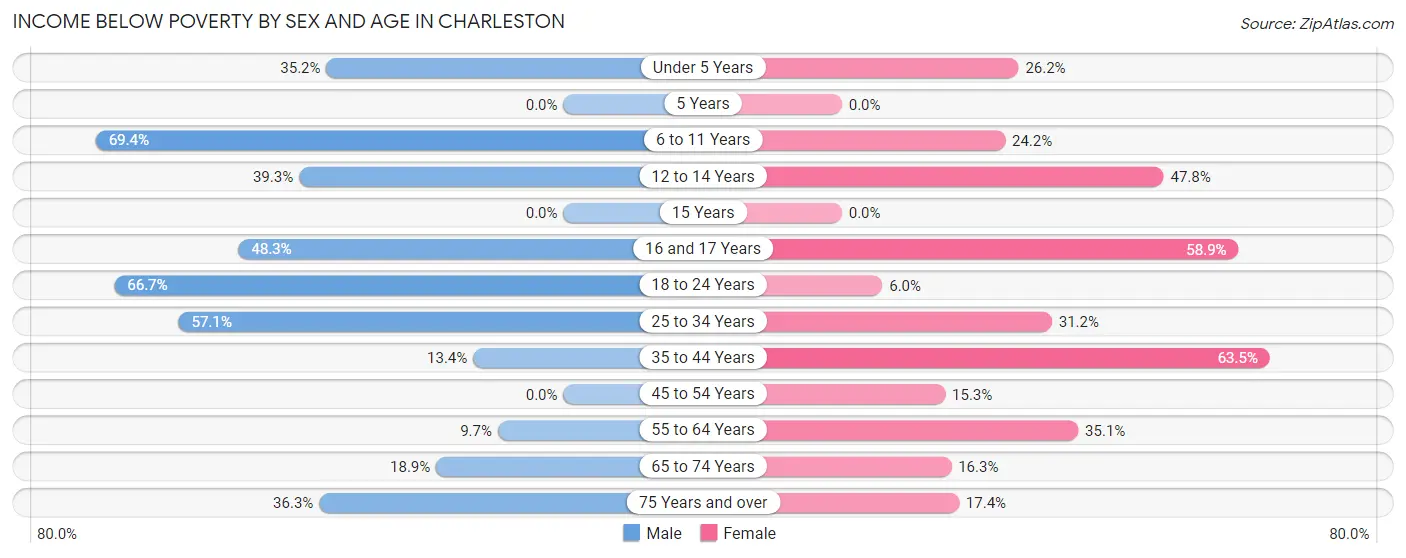
| Age Bracket | Male | Female |
| Under 5 Years | 38 (35.2%) | 16 (26.2%) |
| 5 Years | 0 (0.0%) | 0 (0.0%) |
| 6 to 11 Years | 134 (69.4%) | 24 (24.2%) |
| 12 to 14 Years | 53 (39.3%) | 43 (47.8%) |
| 15 Years | 0 (0.0%) | 0 (0.0%) |
| 16 and 17 Years | 55 (48.2%) | 53 (58.9%) |
| 18 to 24 Years | 52 (66.7%) | 11 (6.0%) |
| 25 to 34 Years | 64 (57.1%) | 53 (31.2%) |
| 35 to 44 Years | 26 (13.4%) | 183 (63.5%) |
| 45 to 54 Years | 0 (0.0%) | 27 (15.3%) |
| 55 to 64 Years | 18 (9.7%) | 86 (35.1%) |
| 65 to 74 Years | 17 (18.9%) | 39 (16.3%) |
| 75 Years and over | 33 (36.3%) | 16 (17.4%) |
| Total | 490 (33.1%) | 551 (30.6%) |
Income Above Poverty by Sex and Age in Charleston
According to the poverty statistics in Charleston, males aged 5 years and females aged 5 years are the age groups that are most secure financially, with 100.0% of males and 100.0% of females in these age groups living above the poverty line.
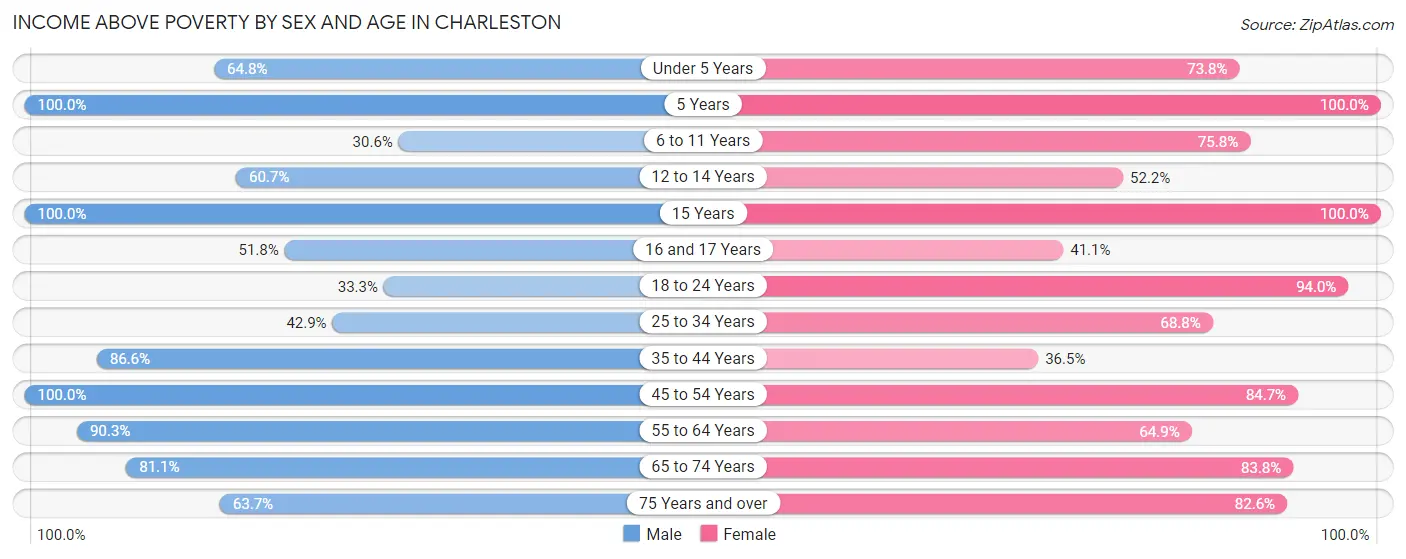
| Age Bracket | Male | Female |
| Under 5 Years | 70 (64.8%) | 45 (73.8%) |
| 5 Years | 9 (100.0%) | 58 (100.0%) |
| 6 to 11 Years | 59 (30.6%) | 75 (75.8%) |
| 12 to 14 Years | 82 (60.7%) | 47 (52.2%) |
| 15 Years | 8 (100.0%) | 7 (100.0%) |
| 16 and 17 Years | 59 (51.7%) | 37 (41.1%) |
| 18 to 24 Years | 26 (33.3%) | 172 (94.0%) |
| 25 to 34 Years | 48 (42.9%) | 117 (68.8%) |
| 35 to 44 Years | 168 (86.6%) | 105 (36.5%) |
| 45 to 54 Years | 164 (100.0%) | 149 (84.7%) |
| 55 to 64 Years | 167 (90.3%) | 159 (64.9%) |
| 65 to 74 Years | 73 (81.1%) | 201 (83.8%) |
| 75 Years and over | 58 (63.7%) | 76 (82.6%) |
| Total | 991 (66.9%) | 1,248 (69.4%) |
Income Below Poverty Among Married-Couple Families in Charleston
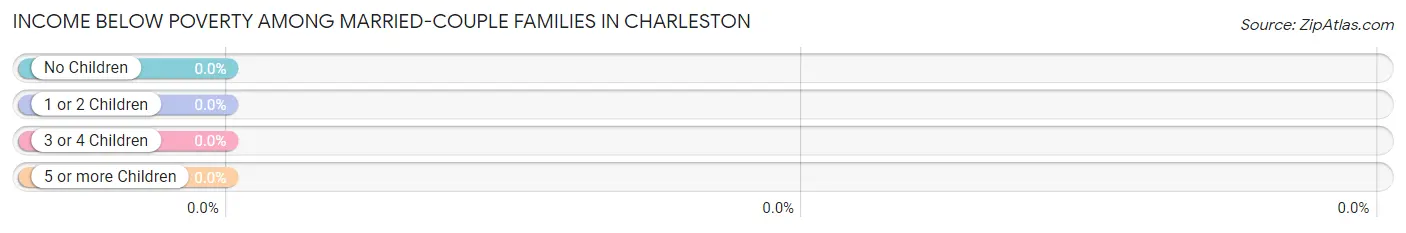
| Children | Above Poverty | Below Poverty |
| No Children | 276 (100.0%) | 0 (0.0%) |
| 1 or 2 Children | 113 (100.0%) | 0 (0.0%) |
| 3 or 4 Children | 59 (100.0%) | 0 (0.0%) |
| 5 or more Children | 0 (0.0%) | 0 (0.0%) |
| Total | 448 (100.0%) | 0 (0.0%) |
Income Below Poverty Among Single-Parent Households in Charleston
According to the poverty data in Charleston, 76.7% or 33 single-father households and 52.9% or 157 single-mother households are living below the poverty line. Among single-father households, those with no children have the highest poverty rate, with 33 households (100.0%) experiencing poverty. Likewise, among single-mother households, those with 3 or 4 children have the highest poverty rate, with 17 households (100.0%) falling below the poverty line.
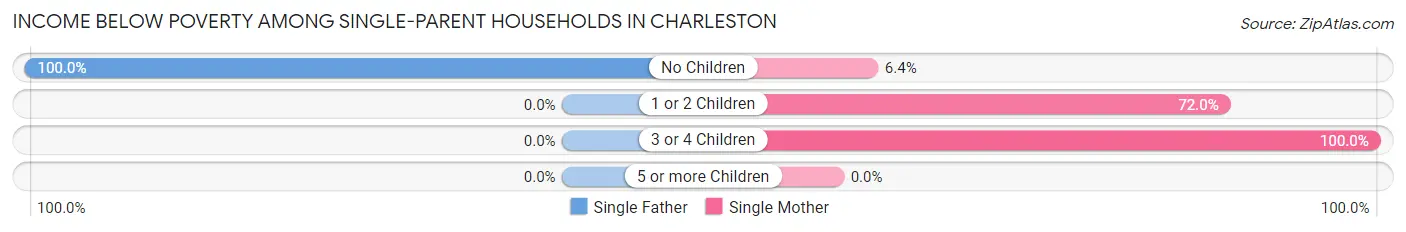
| Children | Single Father | Single Mother |
| No Children | 33 (100.0%) | 6 (6.4%) |
| 1 or 2 Children | 0 (0.0%) | 134 (72.0%) |
| 3 or 4 Children | 0 (0.0%) | 17 (100.0%) |
| 5 or more Children | 0 (0.0%) | 0 (0.0%) |
| Total | 33 (76.7%) | 157 (52.9%) |
Income Below Poverty Among Married-Couple vs Single-Parent Households in Charleston
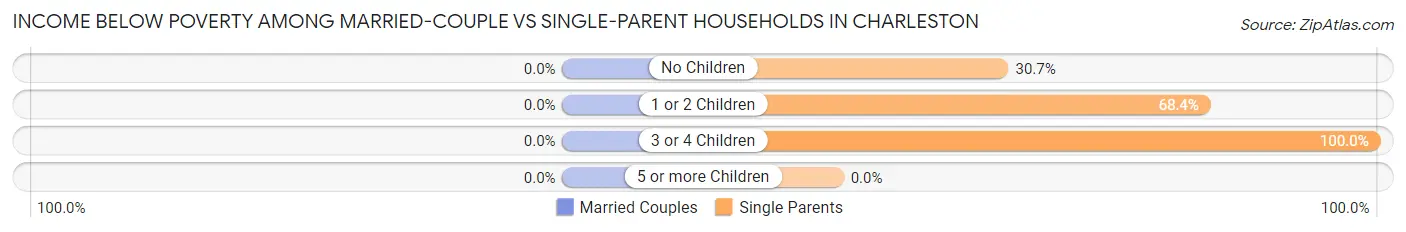
| Children | Married-Couple Families | Single-Parent Households |
| No Children | 0 (0.0%) | 39 (30.7%) |
| 1 or 2 Children | 0 (0.0%) | 134 (68.4%) |
| 3 or 4 Children | 0 (0.0%) | 17 (100.0%) |
| 5 or more Children | 0 (0.0%) | 0 (0.0%) |
| Total | 0 (0.0%) | 190 (55.9%) |
Race in Charleston
The most populous races in Charleston are Black / African American (2,716 | 58.0%), White / Caucasian (1,758 | 37.5%), and Two or more Races (208 | 4.4%).
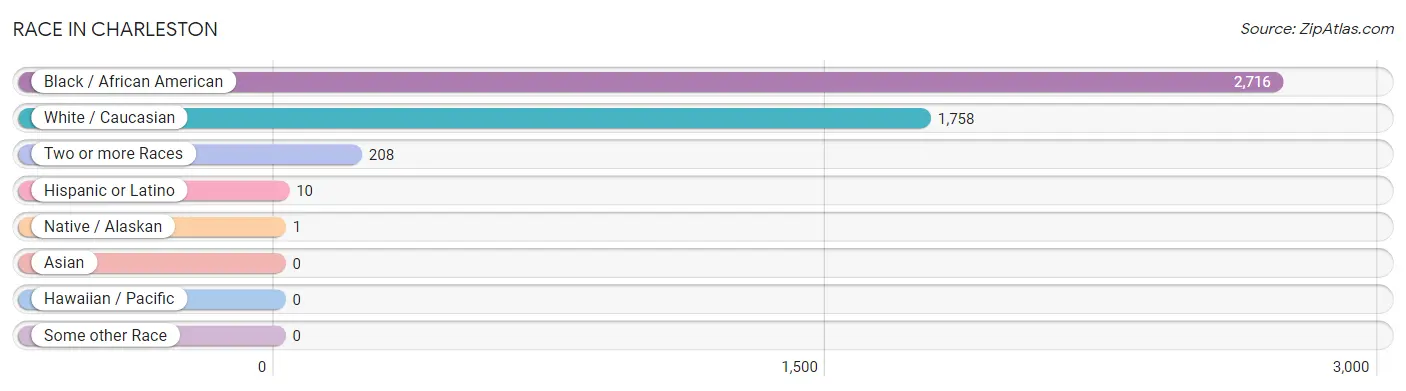
| Race | # Population | % Population |
| Asian | 0 | 0.0% |
| Black / African American | 2,716 | 58.0% |
| Hawaiian / Pacific | 0 | 0.0% |
| Hispanic or Latino | 10 | 0.2% |
| Native / Alaskan | 1 | 0.0% |
| White / Caucasian | 1,758 | 37.5% |
| Two or more Races | 208 | 4.4% |
| Some other Race | 0 | 0.0% |
| Total | 4,683 | 100.0% |
Ancestry in Charleston
The most populous ancestries reported in Charleston are American (356 | 7.6%), German (250 | 5.3%), Irish (171 | 3.6%), French (142 | 3.0%), and English (137 | 2.9%), together accounting for 22.6% of all Charleston residents.
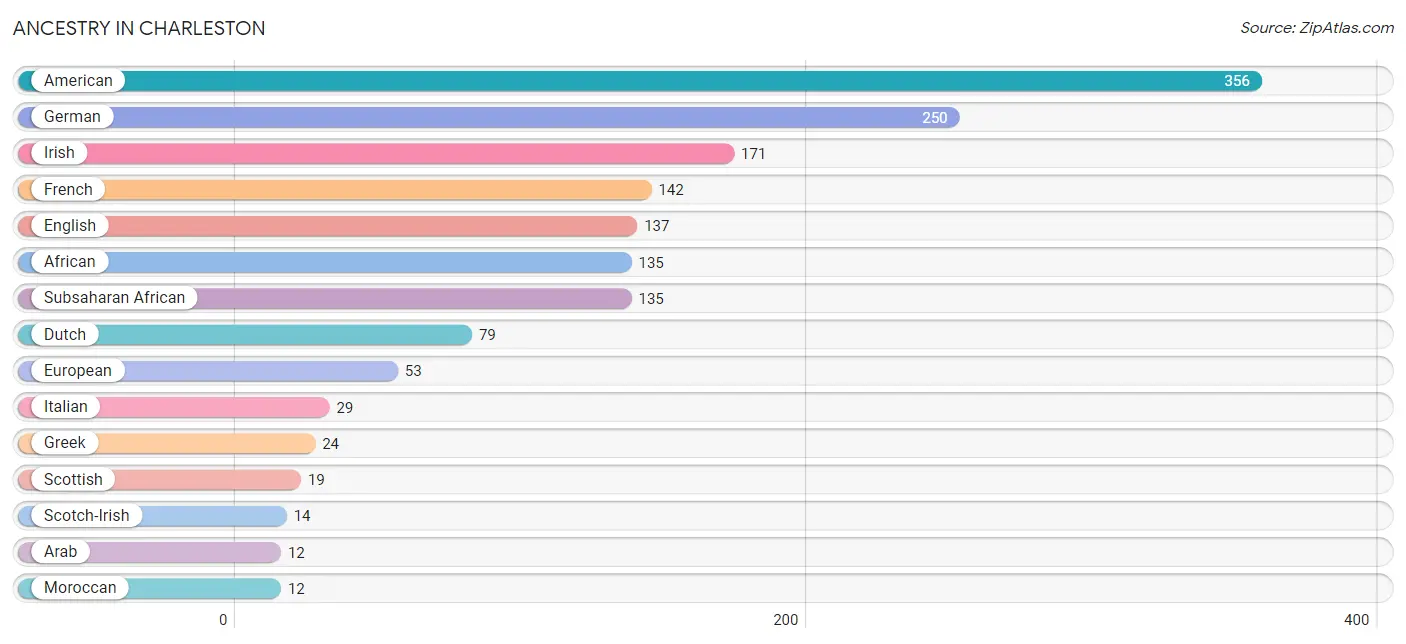
| Ancestry | # Population | % Population |
| African | 135 | 2.9% |
| American | 356 | 7.6% |
| Arab | 12 | 0.3% |
| Bulgarian | 4 | 0.1% |
| Canadian | 4 | 0.1% |
| Cherokee | 7 | 0.2% |
| Danish | 4 | 0.1% |
| Dutch | 79 | 1.7% |
| English | 137 | 2.9% |
| European | 53 | 1.1% |
| French | 142 | 3.0% |
| German | 250 | 5.3% |
| Greek | 24 | 0.5% |
| Iranian | 7 | 0.2% |
| Irish | 171 | 3.6% |
| Italian | 29 | 0.6% |
| Mexican | 10 | 0.2% |
| Moroccan | 12 | 0.3% |
| Scotch-Irish | 14 | 0.3% |
| Scottish | 19 | 0.4% |
| Subsaharan African | 135 | 2.9% |
| Swiss | 4 | 0.1% |
| Welsh | 7 | 0.2% | View All 23 Rows |
Immigrants in Charleston
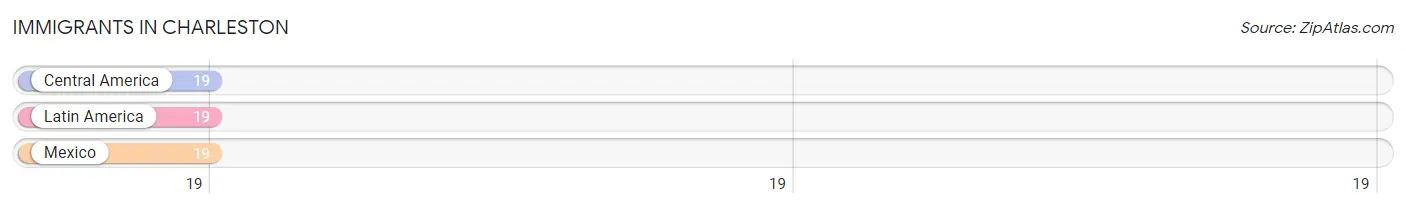
The most numerous immigrant groups reported in Charleston came from Central America (19 | 0.4%), Latin America (19 | 0.4%), and Mexico (19 | 0.4%), together accounting for 1.2% of all Charleston residents.
| Immigration Origin | # Population | % Population |
| Central America | 19 | 0.4% |
| Latin America | 19 | 0.4% |
| Mexico | 19 | 0.4% | View All 3 Rows |
Sex and Age in Charleston
Sex and Age in Charleston
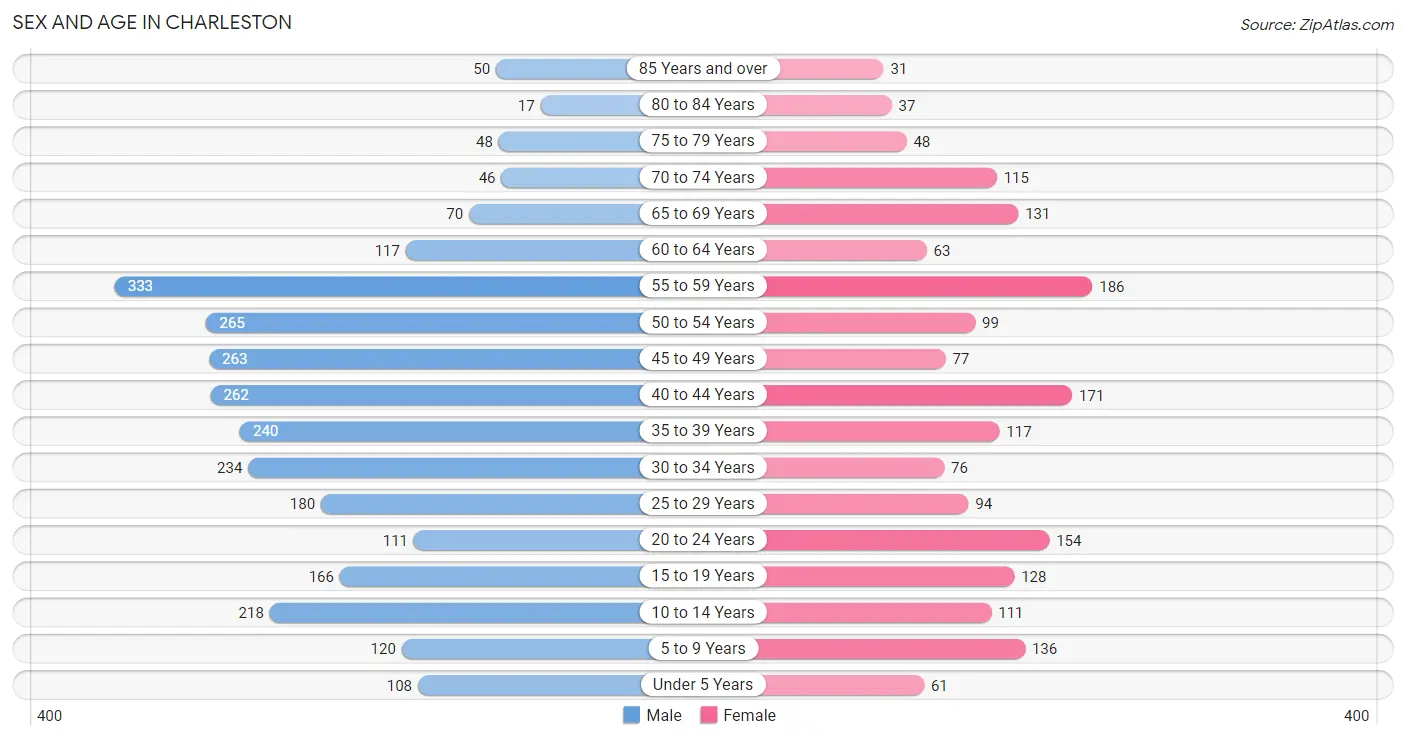
The most populous age groups in Charleston are 55 to 59 Years (333 | 11.7%) for men and 55 to 59 Years (186 | 10.1%) for women.
| Age Bracket | Male | Female |
| Under 5 Years | 108 (3.8%) | 61 (3.3%) |
| 5 to 9 Years | 120 (4.2%) | 136 (7.4%) |
| 10 to 14 Years | 218 (7.6%) | 111 (6.0%) |
| 15 to 19 Years | 166 (5.8%) | 128 (7.0%) |
| 20 to 24 Years | 111 (3.9%) | 154 (8.4%) |
| 25 to 29 Years | 180 (6.3%) | 94 (5.1%) |
| 30 to 34 Years | 234 (8.2%) | 76 (4.1%) |
| 35 to 39 Years | 240 (8.4%) | 117 (6.4%) |
| 40 to 44 Years | 262 (9.2%) | 171 (9.3%) |
| 45 to 49 Years | 263 (9.2%) | 77 (4.2%) |
| 50 to 54 Years | 265 (9.3%) | 99 (5.4%) |
| 55 to 59 Years | 333 (11.7%) | 186 (10.1%) |
| 60 to 64 Years | 117 (4.1%) | 63 (3.4%) |
| 65 to 69 Years | 70 (2.5%) | 131 (7.1%) |
| 70 to 74 Years | 46 (1.6%) | 115 (6.3%) |
| 75 to 79 Years | 48 (1.7%) | 48 (2.6%) |
| 80 to 84 Years | 17 (0.6%) | 37 (2.0%) |
| 85 Years and over | 50 (1.8%) | 31 (1.7%) |
| Total | 2,848 (100.0%) | 1,835 (100.0%) |
Families and Households in Charleston
Median Family Size in Charleston
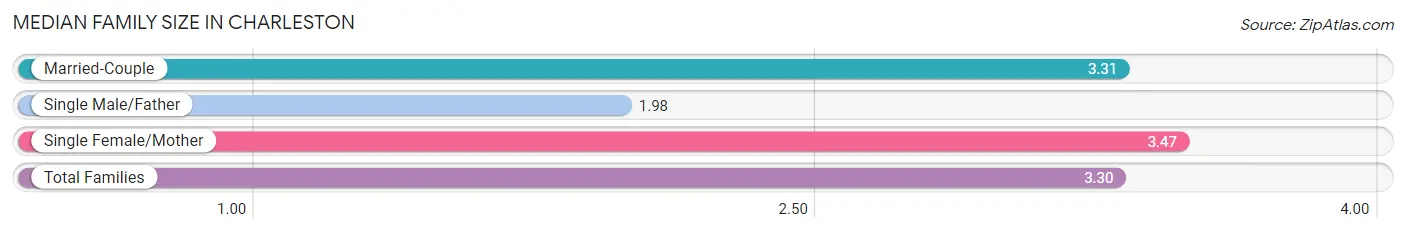
The median family size in Charleston is 3.30 persons per family, with single female/mother families (297 | 37.7%) accounting for the largest median family size of 3.47 persons per family. On the other hand, single male/father families (43 | 5.5%) represent the smallest median family size with 1.98 persons per family.
| Family Type | # Families | Family Size |
| Married-Couple | 448 (56.9%) | 3.31 |
| Single Male/Father | 43 (5.5%) | 1.98 |
| Single Female/Mother | 297 (37.7%) | 3.47 |
| Total Families | 788 (100.0%) | 3.30 |
Median Household Size in Charleston
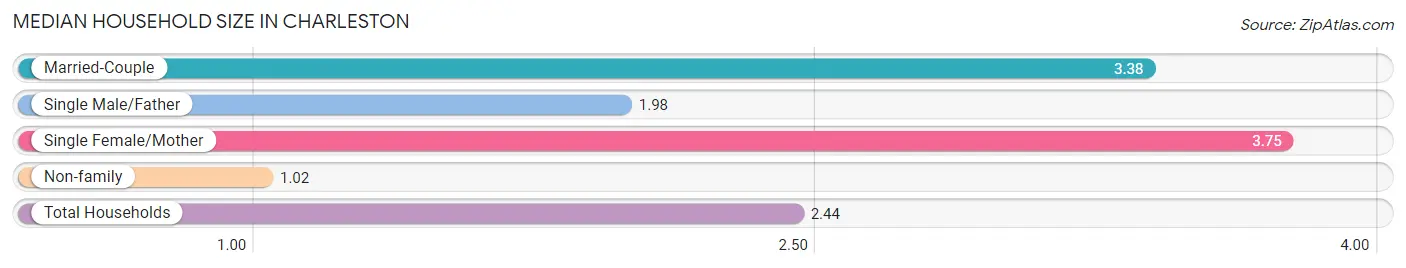
The median household size in Charleston is 2.44 persons per household, with single female/mother households (297 | 22.2%) accounting for the largest median household size of 3.75 persons per household. non-family households (552 | 41.2%) represent the smallest median household size with 1.02 persons per household.
| Household Type | # Households | Household Size |
| Married-Couple | 448 (33.4%) | 3.38 |
| Single Male/Father | 43 (3.2%) | 1.98 |
| Single Female/Mother | 297 (22.2%) | 3.75 |
| Non-family | 552 (41.2%) | 1.02 |
| Total Households | 1,340 (100.0%) | 2.44 |
Household Size by Marriage Status in Charleston
Out of a total of 1,340 households in Charleston, 788 (58.8%) are family households, while 552 (41.2%) are nonfamily households. The most numerous type of family households are 2-person households, comprising 424, and the most common type of nonfamily households are 1-person households, comprising 539.
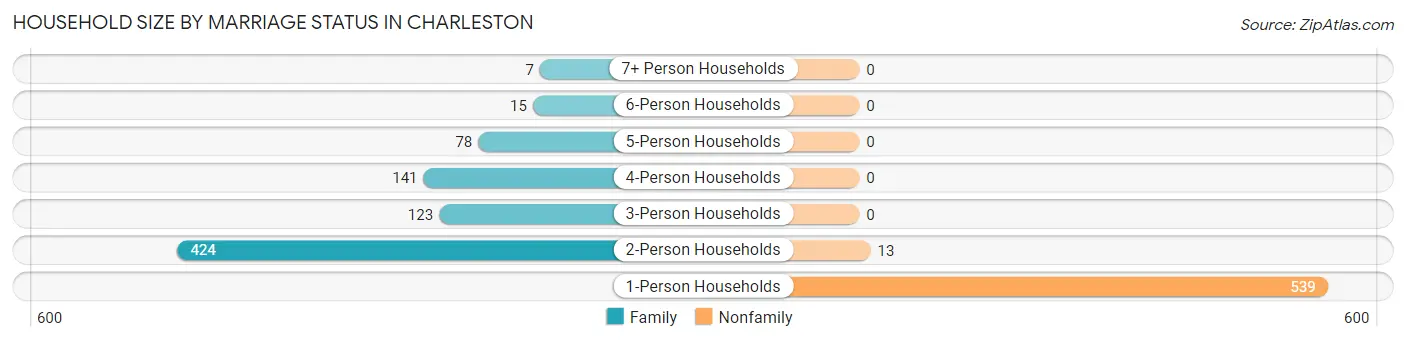
| Household Size | Family Households | Nonfamily Households |
| 1-Person Households | - | 539 (40.2%) |
| 2-Person Households | 424 (31.6%) | 13 (1.0%) |
| 3-Person Households | 123 (9.2%) | 0 (0.0%) |
| 4-Person Households | 141 (10.5%) | 0 (0.0%) |
| 5-Person Households | 78 (5.8%) | 0 (0.0%) |
| 6-Person Households | 15 (1.1%) | 0 (0.0%) |
| 7+ Person Households | 7 (0.5%) | 0 (0.0%) |
| Total | 788 (58.8%) | 552 (41.2%) |
Female Fertility in Charleston
Fertility by Age in Charleston
Average fertility rate in Charleston is 103.0 births per 1,000 women. Women in the age bracket of 20 to 34 years have the highest fertility rate with 269.0 births per 1,000 women. Women in the age bracket of 20 to 34 years acount for 100.0% of all women with births.
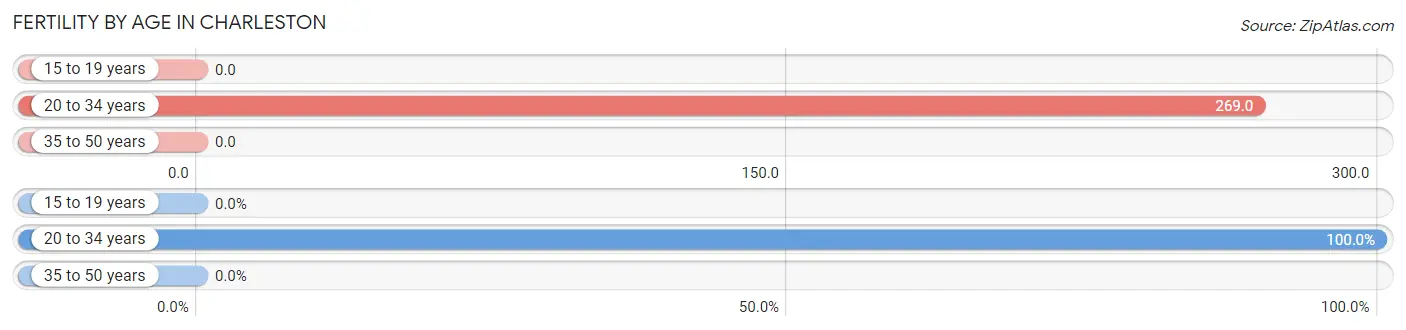
| Age Bracket | Women with Births | Births / 1,000 Women |
| 15 to 19 years | 0 (0.0%) | 0.0 |
| 20 to 34 years | 87 (100.0%) | 269.0 |
| 35 to 50 years | 0 (0.0%) | 0.0 |
| Total | 87 (100.0%) | 103.0 |
Fertility by Age by Marriage Status in Charleston
17.2% of women with births (87) in Charleston are married. The highest percentage of unmarried women with births falls into 20 to 34 years age bracket with 82.8% of them unmarried at the time of birth, while the lowest percentage of unmarried women with births belong to 20 to 34 years age bracket with 82.8% of them unmarried.
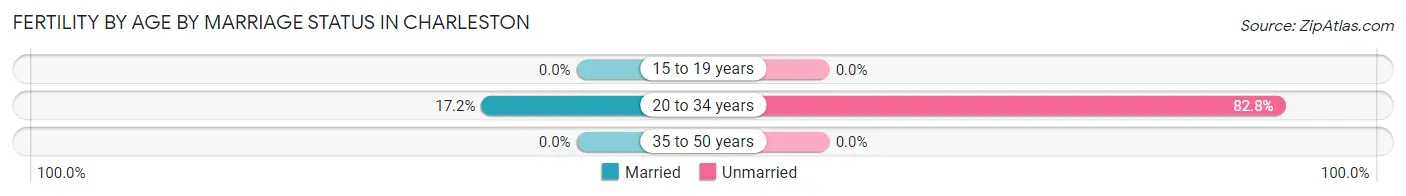
| Age Bracket | Married | Unmarried |
| 15 to 19 years | 0 (0.0%) | 0 (0.0%) |
| 20 to 34 years | 15 (17.2%) | 72 (82.8%) |
| 35 to 50 years | 0 (0.0%) | 0 (0.0%) |
| Total | 15 (17.2%) | 72 (82.8%) |
Fertility by Education in Charleston
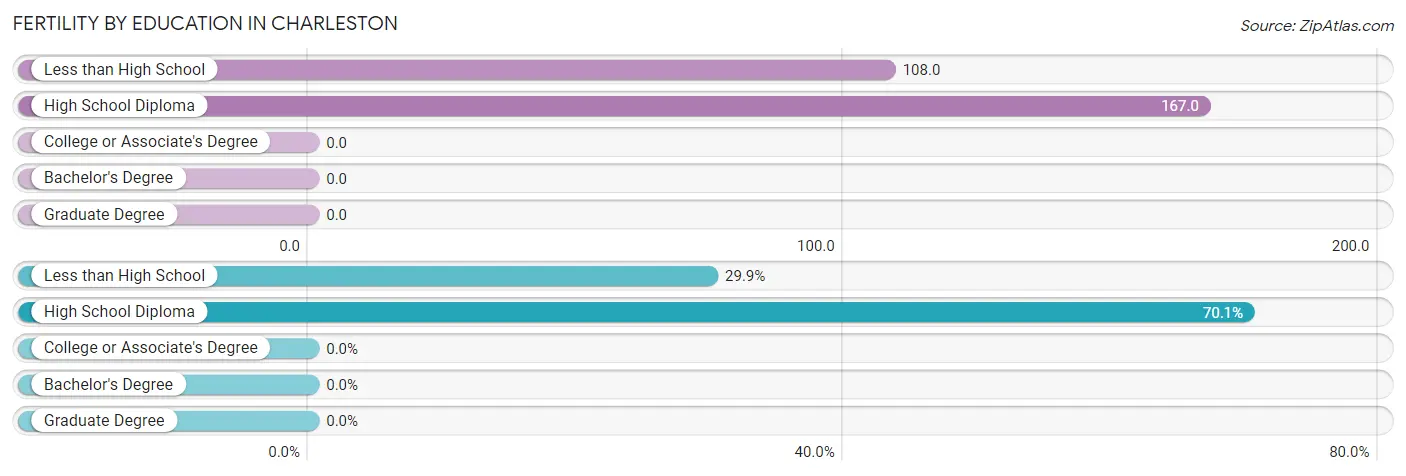
| Educational Attainment | Women with Births | Births / 1,000 Women |
| Less than High School | 26 (29.9%) | 108.0 |
| High School Diploma | 61 (70.1%) | 167.0 |
| College or Associate's Degree | 0 (0.0%) | 0.0 |
| Bachelor's Degree | 0 (0.0%) | 0.0 |
| Graduate Degree | 0 (0.0%) | 0.0 |
| Total | 87 (100.0%) | 103.0 |
Fertility by Education by Marriage Status in Charleston
82.8% of women with births in Charleston are unmarried. Women with the educational attainment of less than high school are most likely to be married with 57.7% of them married at childbirth, while women with the educational attainment of high school diploma are least likely to be married with 100.0% of them unmarried at childbirth.
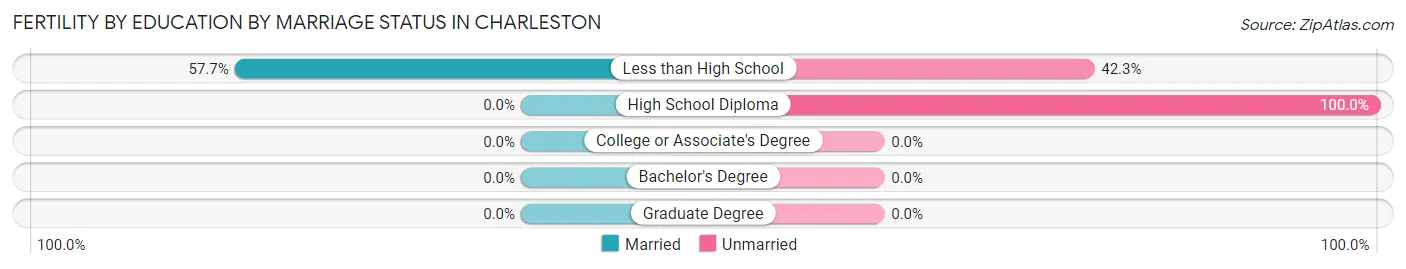
| Educational Attainment | Married | Unmarried |
| Less than High School | 15 (57.7%) | 11 (42.3%) |
| High School Diploma | 0 (0.0%) | 61 (100.0%) |
| College or Associate's Degree | 0 (0.0%) | 0 (0.0%) |
| Bachelor's Degree | 0 (0.0%) | 0 (0.0%) |
| Graduate Degree | 0 (0.0%) | 0 (0.0%) |
| Total | 15 (17.2%) | 72 (82.8%) |
Employment Characteristics in Charleston
Employment by Class of Employer in Charleston
Among the 1,211 employed individuals in Charleston, private company employees (742 | 61.3%), local government employees (137 | 11.3%), and state government employees (124 | 10.2%) make up the most common classes of employment.
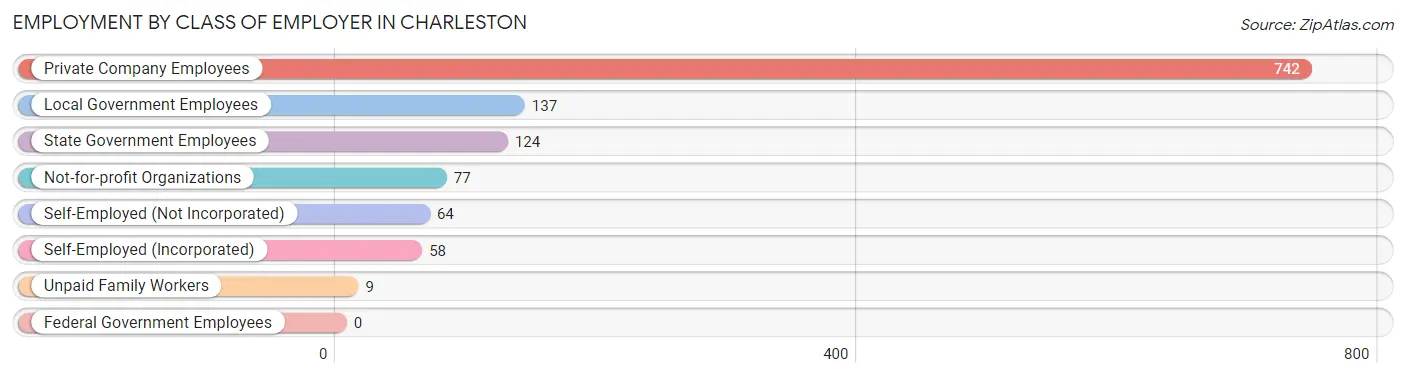
| Employer Class | # Employees | % Employees |
| Private Company Employees | 742 | 61.3% |
| Self-Employed (Incorporated) | 58 | 4.8% |
| Self-Employed (Not Incorporated) | 64 | 5.3% |
| Not-for-profit Organizations | 77 | 6.4% |
| Local Government Employees | 137 | 11.3% |
| State Government Employees | 124 | 10.2% |
| Federal Government Employees | 0 | 0.0% |
| Unpaid Family Workers | 9 | 0.7% |
| Total | 1,211 | 100.0% |
Employment Status by Age in Charleston
According to the labor force statistics for Charleston, out of the total population over 16 years of age (3,913), 33.8% or 1,323 individuals are in the labor force, with 7.9% or 105 of them unemployed. The age group with the highest labor force participation rate is 20 to 24 years, with 60.4% or 160 individuals in the labor force. Within the labor force, the 20 to 24 years age range has the highest percentage of unemployed individuals, with 18.1% or 29 of them being unemployed.
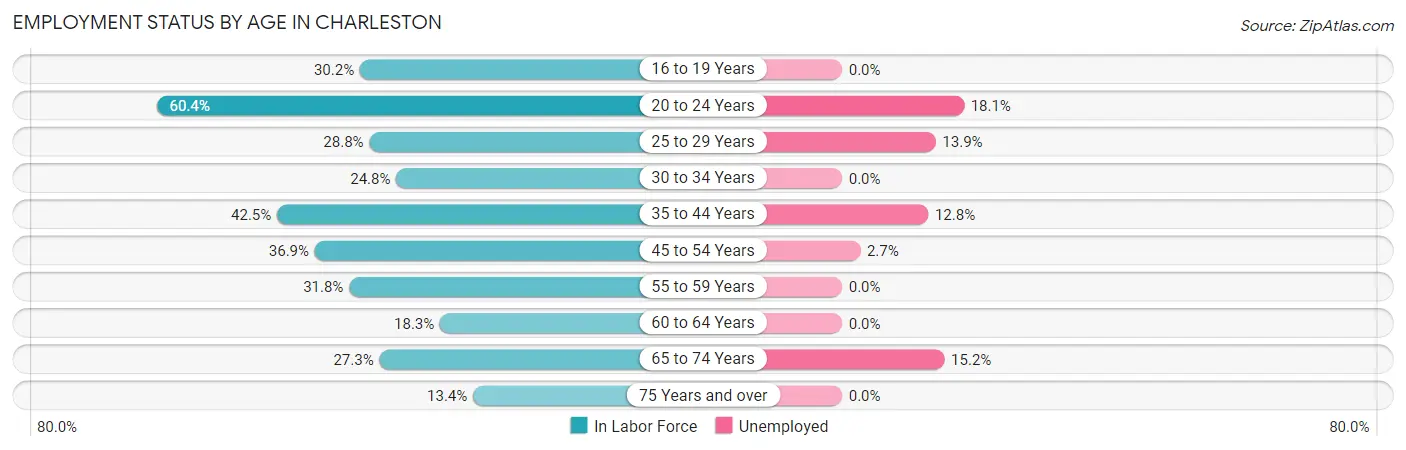
| Age Bracket | In Labor Force | Unemployed |
| 16 to 19 Years | 84 (30.2%) | 0 (0.0%) |
| 20 to 24 Years | 160 (60.4%) | 29 (18.1%) |
| 25 to 29 Years | 79 (28.8%) | 11 (13.9%) |
| 30 to 34 Years | 77 (24.8%) | 0 (0.0%) |
| 35 to 44 Years | 336 (42.5%) | 43 (12.8%) |
| 45 to 54 Years | 260 (36.9%) | 7 (2.7%) |
| 55 to 59 Years | 165 (31.8%) | 0 (0.0%) |
| 60 to 64 Years | 33 (18.3%) | 0 (0.0%) |
| 65 to 74 Years | 99 (27.3%) | 15 (15.2%) |
| 75 Years and over | 31 (13.4%) | 0 (0.0%) |
| Total | 1,323 (33.8%) | 105 (7.9%) |
Employment Status by Educational Attainment in Charleston
According to labor force statistics for Charleston, 34.2% of individuals (950) out of the total population between 25 and 64 years of age (2,777) are in the labor force, with 6.4% or 61 of them being unemployed. The group with the highest labor force participation rate are those with the educational attainment of bachelor's degree or higher, with 80.6% or 166 individuals in the labor force. Within the labor force, individuals with less than high school education have the highest percentage of unemployment, with 36.7% or 33 of them being unemployed.
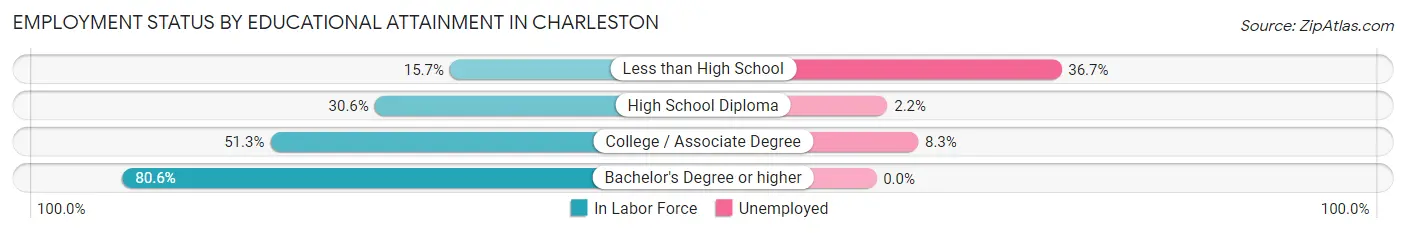
| Educational Attainment | In Labor Force | Unemployed |
| Less than High School | 90 (15.7%) | 211 (36.7%) |
| High School Diploma | 489 (30.6%) | 35 (2.2%) |
| College / Associate Degree | 204 (51.3%) | 33 (8.3%) |
| Bachelor's Degree or higher | 166 (80.6%) | 0 (0.0%) |
| Total | 950 (34.2%) | 178 (6.4%) |
Employment Occupations by Sex in Charleston
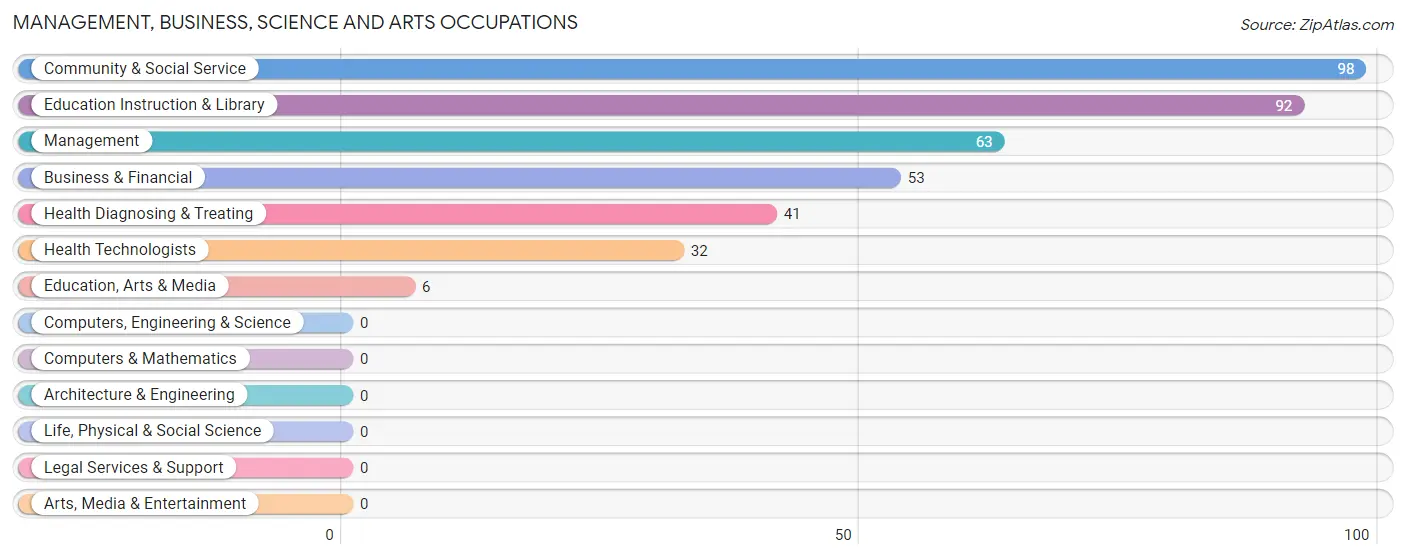
Management, Business, Science and Arts Occupations
The most common Management, Business, Science and Arts occupations in Charleston are Community & Social Service (98 | 8.0%), Education Instruction & Library (92 | 7.5%), Management (63 | 5.2%), Business & Financial (53 | 4.3%), and Health Diagnosing & Treating (41 | 3.4%).
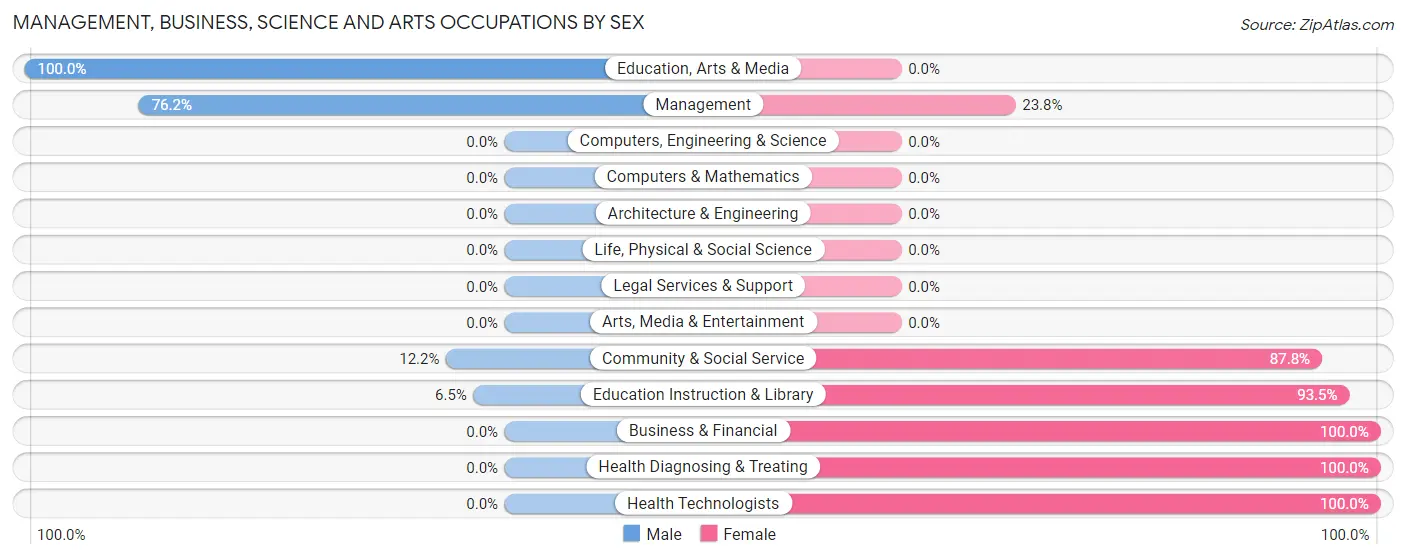
Management, Business, Science and Arts Occupations by Sex
Within the Management, Business, Science and Arts occupations in Charleston, the most male-oriented occupations are Education, Arts & Media (100.0%), Management (76.2%), and Community & Social Service (12.2%), while the most female-oriented occupations are Business & Financial (100.0%), Health Diagnosing & Treating (100.0%), and Health Technologists (100.0%).
| Occupation | Male | Female |
| Management | 48 (76.2%) | 15 (23.8%) |
| Business & Financial | 0 (0.0%) | 53 (100.0%) |
| Computers, Engineering & Science | 0 (0.0%) | 0 (0.0%) |
| Computers & Mathematics | 0 (0.0%) | 0 (0.0%) |
| Architecture & Engineering | 0 (0.0%) | 0 (0.0%) |
| Life, Physical & Social Science | 0 (0.0%) | 0 (0.0%) |
| Community & Social Service | 12 (12.2%) | 86 (87.8%) |
| Education, Arts & Media | 6 (100.0%) | 0 (0.0%) |
| Legal Services & Support | 0 (0.0%) | 0 (0.0%) |
| Education Instruction & Library | 6 (6.5%) | 86 (93.5%) |
| Arts, Media & Entertainment | 0 (0.0%) | 0 (0.0%) |
| Health Diagnosing & Treating | 0 (0.0%) | 41 (100.0%) |
| Health Technologists | 0 (0.0%) | 32 (100.0%) |
| Total (Category) | 60 (23.5%) | 195 (76.5%) |
| Total (Overall) | 576 (47.2%) | 643 (52.7%) |
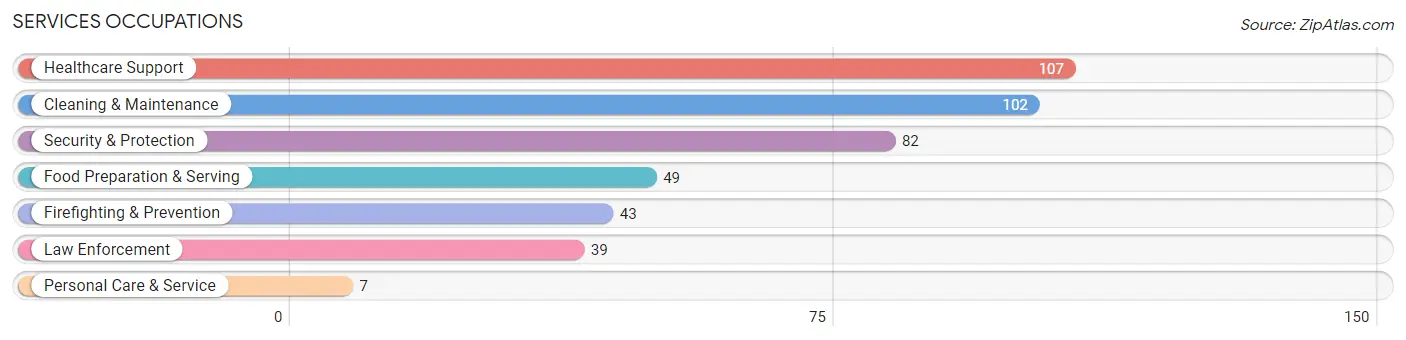
Services Occupations
The most common Services occupations in Charleston are Healthcare Support (107 | 8.8%), Cleaning & Maintenance (102 | 8.4%), Security & Protection (82 | 6.7%), Food Preparation & Serving (49 | 4.0%), and Firefighting & Prevention (43 | 3.5%).
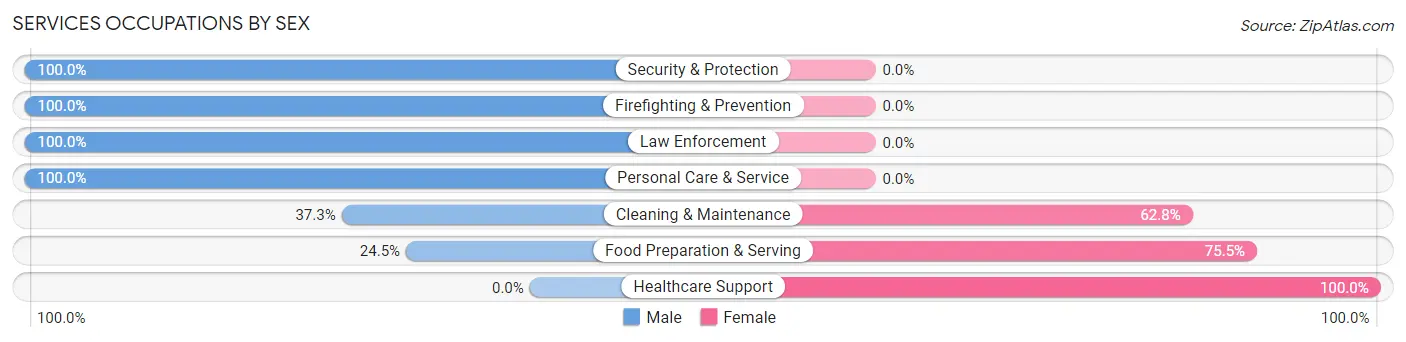
Services Occupations by Sex
Within the Services occupations in Charleston, the most male-oriented occupations are Security & Protection (100.0%), Firefighting & Prevention (100.0%), and Law Enforcement (100.0%), while the most female-oriented occupations are Healthcare Support (100.0%), Food Preparation & Serving (75.5%), and Cleaning & Maintenance (62.7%).
| Occupation | Male | Female |
| Healthcare Support | 0 (0.0%) | 107 (100.0%) |
| Security & Protection | 82 (100.0%) | 0 (0.0%) |
| Firefighting & Prevention | 43 (100.0%) | 0 (0.0%) |
| Law Enforcement | 39 (100.0%) | 0 (0.0%) |
| Food Preparation & Serving | 12 (24.5%) | 37 (75.5%) |
| Cleaning & Maintenance | 38 (37.2%) | 64 (62.7%) |
| Personal Care & Service | 7 (100.0%) | 0 (0.0%) |
| Total (Category) | 139 (40.1%) | 208 (59.9%) |
| Total (Overall) | 576 (47.2%) | 643 (52.7%) |
Sales and Office Occupations
The most common Sales and Office occupations in Charleston are Sales & Related (140 | 11.5%), and Office & Administration (137 | 11.2%).
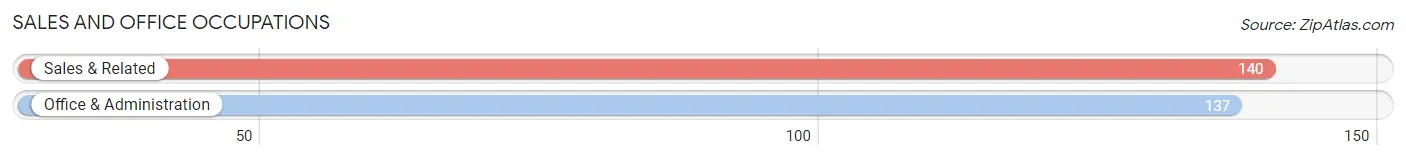
Sales and Office Occupations by Sex
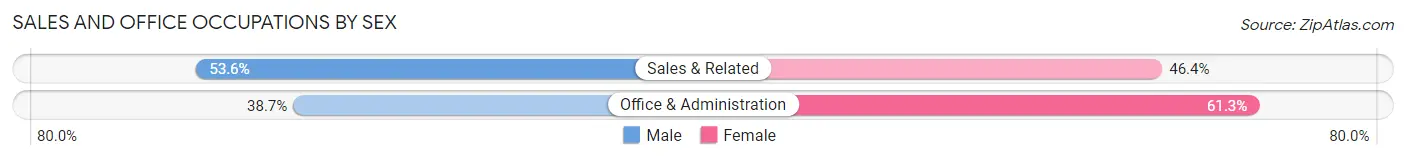
| Occupation | Male | Female |
| Sales & Related | 75 (53.6%) | 65 (46.4%) |
| Office & Administration | 53 (38.7%) | 84 (61.3%) |
| Total (Category) | 128 (46.2%) | 149 (53.8%) |
| Total (Overall) | 576 (47.2%) | 643 (52.7%) |
Natural Resources, Construction and Maintenance Occupations
The most common Natural Resources, Construction and Maintenance occupations in Charleston are Construction & Extraction (91 | 7.5%), Farming, Fishing & Forestry (52 | 4.3%), and Installation, Maintenance & Repair (31 | 2.5%).
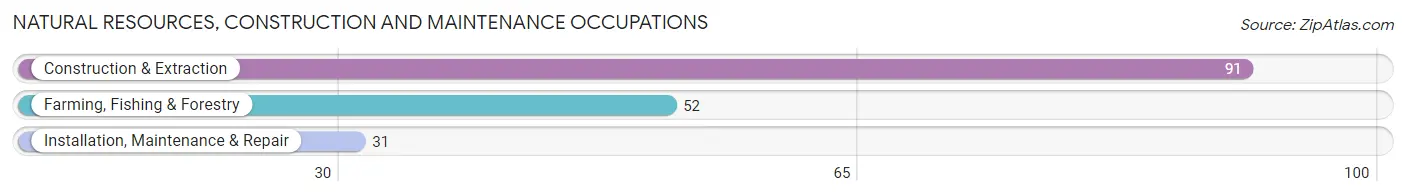
Natural Resources, Construction and Maintenance Occupations by Sex
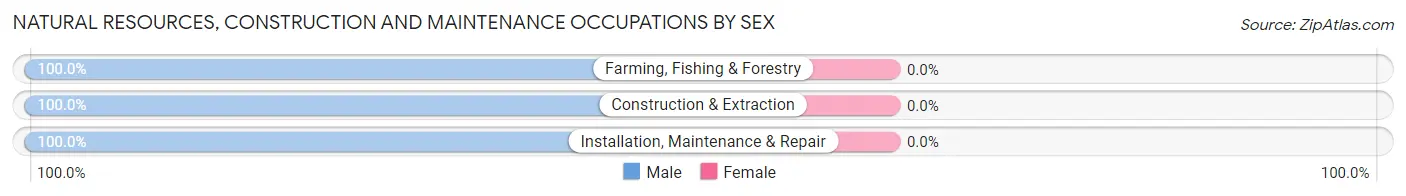
| Occupation | Male | Female |
| Farming, Fishing & Forestry | 52 (100.0%) | 0 (0.0%) |
| Construction & Extraction | 91 (100.0%) | 0 (0.0%) |
| Installation, Maintenance & Repair | 31 (100.0%) | 0 (0.0%) |
| Total (Category) | 174 (100.0%) | 0 (0.0%) |
| Total (Overall) | 576 (47.2%) | 643 (52.7%) |
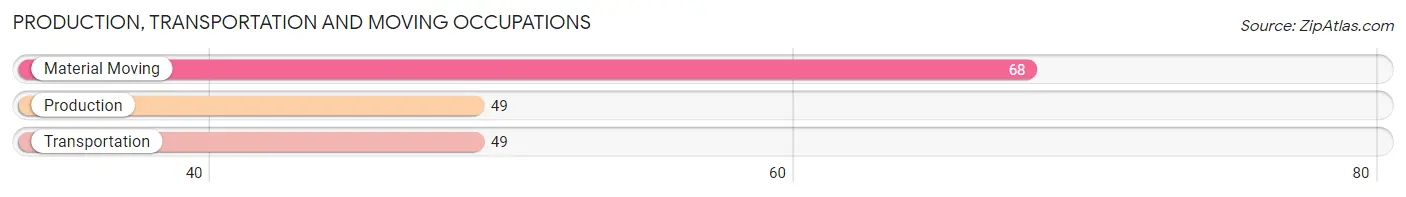
Production, Transportation and Moving Occupations
The most common Production, Transportation and Moving occupations in Charleston are Material Moving (68 | 5.6%), Production (49 | 4.0%), and Transportation (49 | 4.0%).
Production, Transportation and Moving Occupations by Sex
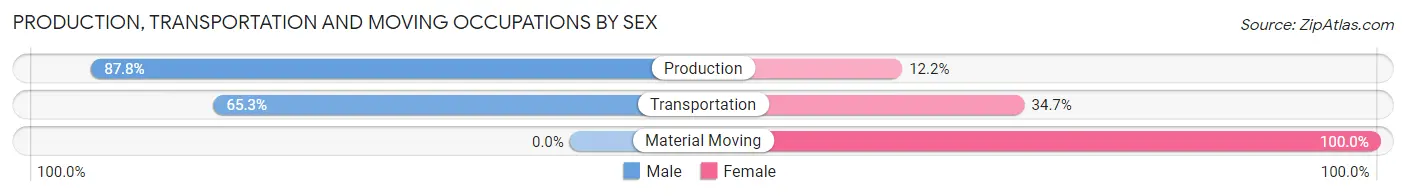
| Occupation | Male | Female |
| Production | 43 (87.8%) | 6 (12.2%) |
| Transportation | 32 (65.3%) | 17 (34.7%) |
| Material Moving | 0 (0.0%) | 68 (100.0%) |
| Total (Category) | 75 (45.2%) | 91 (54.8%) |
| Total (Overall) | 576 (47.2%) | 643 (52.7%) |
Employment Industries by Sex in Charleston
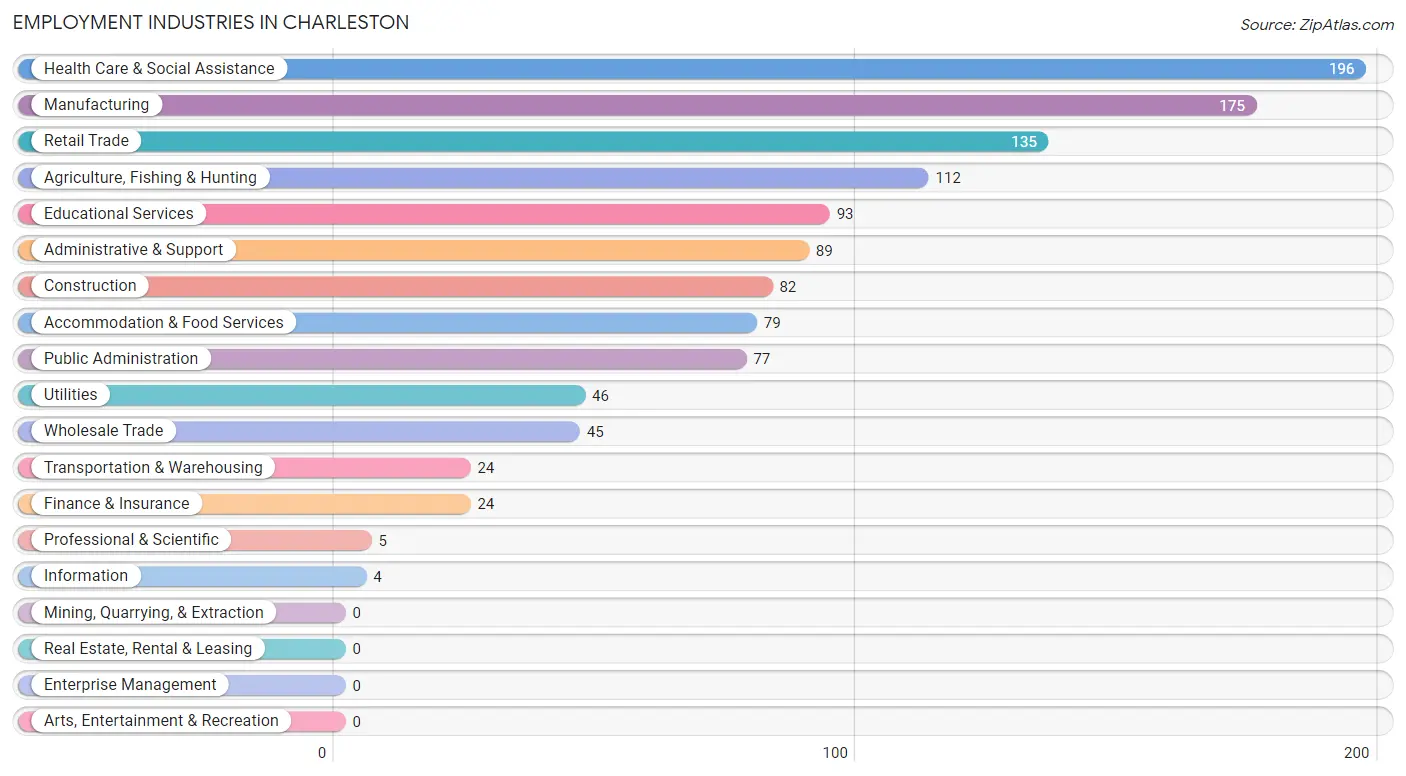
Employment Industries in Charleston
The major employment industries in Charleston include Health Care & Social Assistance (196 | 16.1%), Manufacturing (175 | 14.4%), Retail Trade (135 | 11.1%), Agriculture, Fishing & Hunting (112 | 9.2%), and Educational Services (93 | 7.6%).
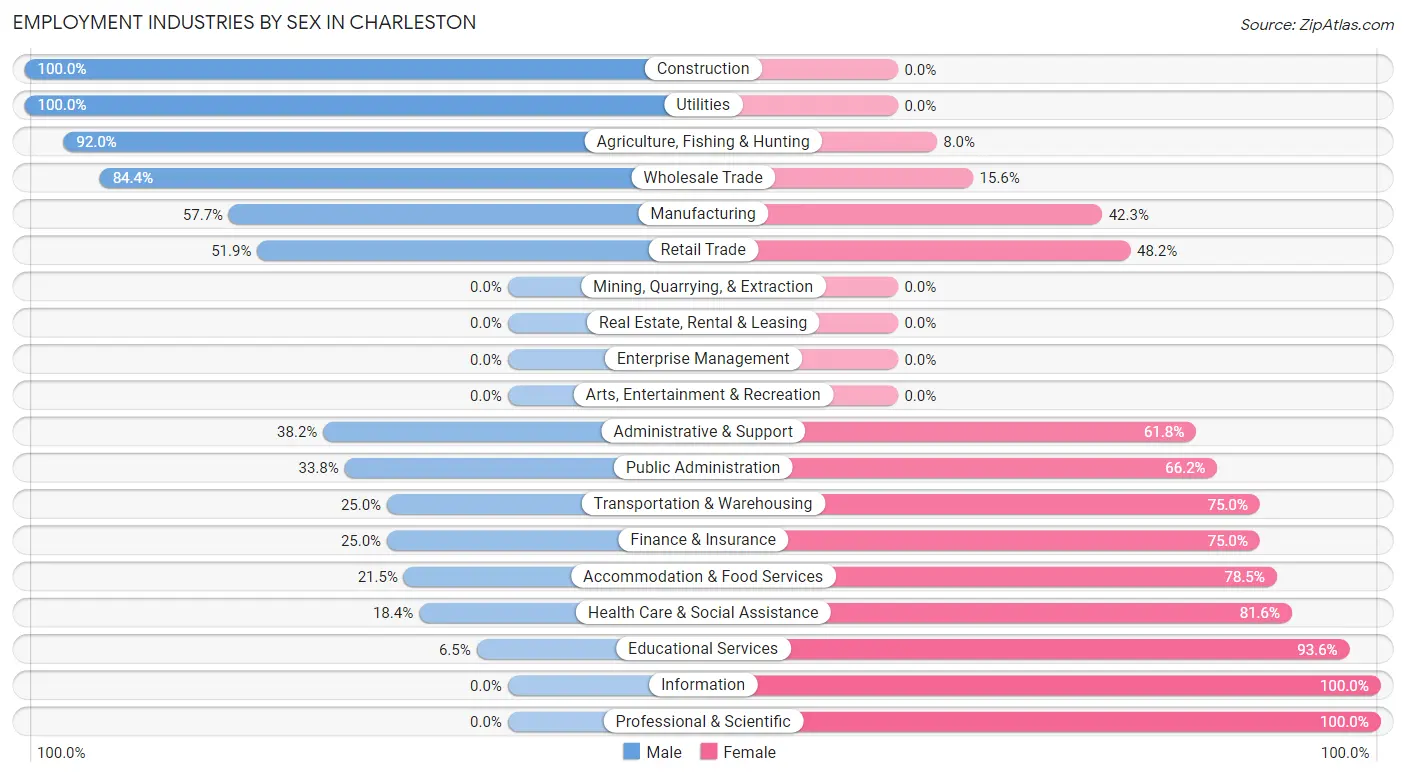
Employment Industries by Sex in Charleston
The Charleston industries that see more men than women are Construction (100.0%), Utilities (100.0%), and Agriculture, Fishing & Hunting (92.0%), whereas the industries that tend to have a higher number of women are Information (100.0%), Professional & Scientific (100.0%), and Educational Services (93.5%).
| Industry | Male | Female |
| Agriculture, Fishing & Hunting | 103 (92.0%) | 9 (8.0%) |
| Mining, Quarrying, & Extraction | 0 (0.0%) | 0 (0.0%) |
| Construction | 82 (100.0%) | 0 (0.0%) |
| Manufacturing | 101 (57.7%) | 74 (42.3%) |
| Wholesale Trade | 38 (84.4%) | 7 (15.6%) |
| Retail Trade | 70 (51.8%) | 65 (48.1%) |
| Transportation & Warehousing | 6 (25.0%) | 18 (75.0%) |
| Utilities | 46 (100.0%) | 0 (0.0%) |
| Information | 0 (0.0%) | 4 (100.0%) |
| Finance & Insurance | 6 (25.0%) | 18 (75.0%) |
| Real Estate, Rental & Leasing | 0 (0.0%) | 0 (0.0%) |
| Professional & Scientific | 0 (0.0%) | 5 (100.0%) |
| Enterprise Management | 0 (0.0%) | 0 (0.0%) |
| Administrative & Support | 34 (38.2%) | 55 (61.8%) |
| Educational Services | 6 (6.5%) | 87 (93.5%) |
| Health Care & Social Assistance | 36 (18.4%) | 160 (81.6%) |
| Arts, Entertainment & Recreation | 0 (0.0%) | 0 (0.0%) |
| Accommodation & Food Services | 17 (21.5%) | 62 (78.5%) |
| Public Administration | 26 (33.8%) | 51 (66.2%) |
| Total | 576 (47.2%) | 643 (52.7%) |
Education in Charleston
School Enrollment in Charleston
The most common levels of schooling among the 1,014 students in Charleston are middle school (324 | 32.0%), high school (321 | 31.7%), and elementary school (141 | 13.9%).
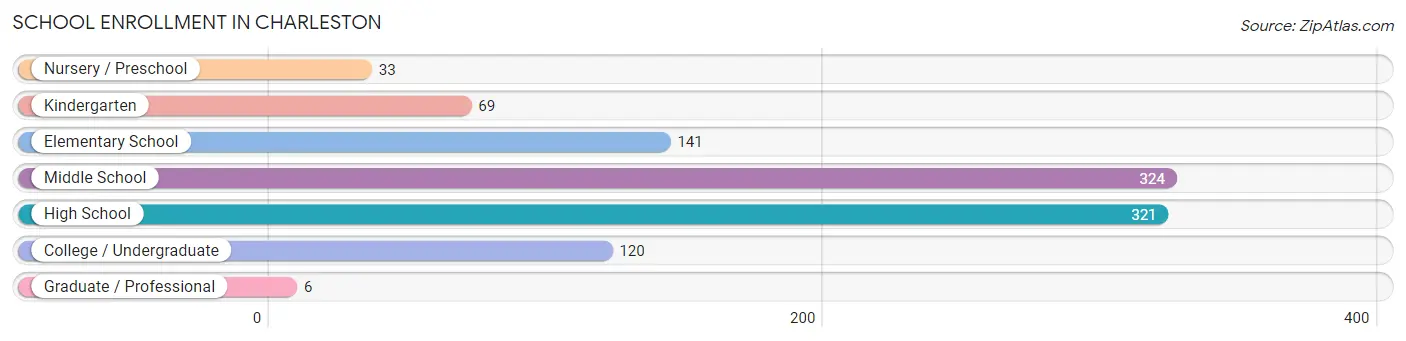
| School Level | # Students | % Students |
| Nursery / Preschool | 33 | 3.3% |
| Kindergarten | 69 | 6.8% |
| Elementary School | 141 | 13.9% |
| Middle School | 324 | 32.0% |
| High School | 321 | 31.7% |
| College / Undergraduate | 120 | 11.8% |
| Graduate / Professional | 6 | 0.6% |
| Total | 1,014 | 100.0% |
School Enrollment by Age by Funding Source in Charleston
Out of a total of 1,014 students who are enrolled in schools in Charleston, 39 (3.8%) attend a private institution, while the remaining 975 (96.2%) are enrolled in public schools. The age group of 35 years and over has the highest likelihood of being enrolled in private schools, with 30 (25.2% in the age bracket) enrolled. Conversely, the age group of 3 to 4 year olds has the lowest likelihood of being enrolled in a private school, with 24 (100.0% in the age bracket) attending a public institution.
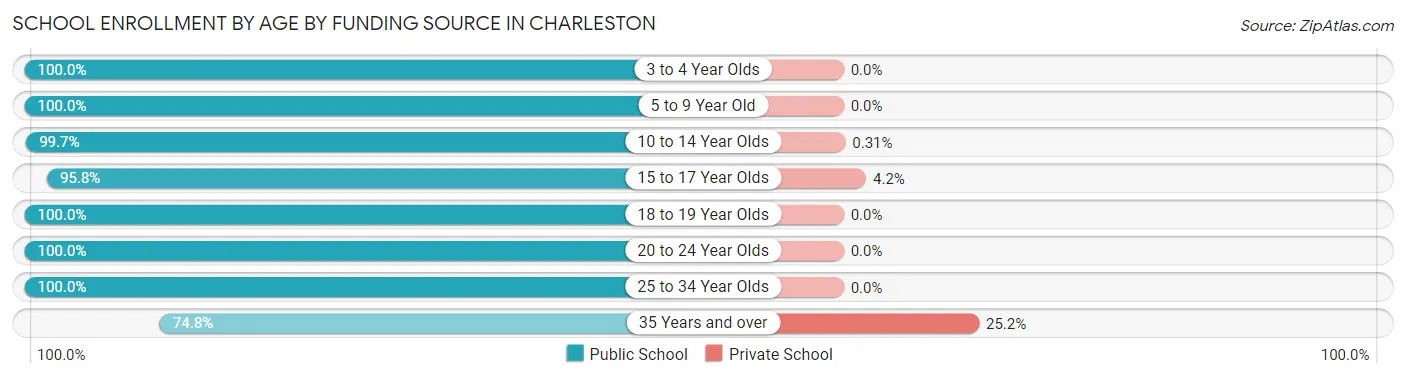
| Age Bracket | Public School | Private School |
| 3 to 4 Year Olds | 24 (100.0%) | 0 (0.0%) |
| 5 to 9 Year Old | 219 (100.0%) | 0 (0.0%) |
| 10 to 14 Year Olds | 324 (99.7%) | 1 (0.3%) |
| 15 to 17 Year Olds | 184 (95.8%) | 8 (4.2%) |
| 18 to 19 Year Olds | 64 (100.0%) | 0 (0.0%) |
| 20 to 24 Year Olds | 54 (100.0%) | 0 (0.0%) |
| 25 to 34 Year Olds | 17 (100.0%) | 0 (0.0%) |
| 35 Years and over | 89 (74.8%) | 30 (25.2%) |
| Total | 975 (96.2%) | 39 (3.8%) |
Educational Attainment by Field of Study in Charleston
Education (84 | 24.7%), science & technology (70 | 20.6%), arts & humanities (59 | 17.3%), business (31 | 9.1%), and bio, nature & agricultural (23 | 6.8%) are the most common fields of study among 340 individuals in Charleston who have obtained a bachelor's degree or higher.
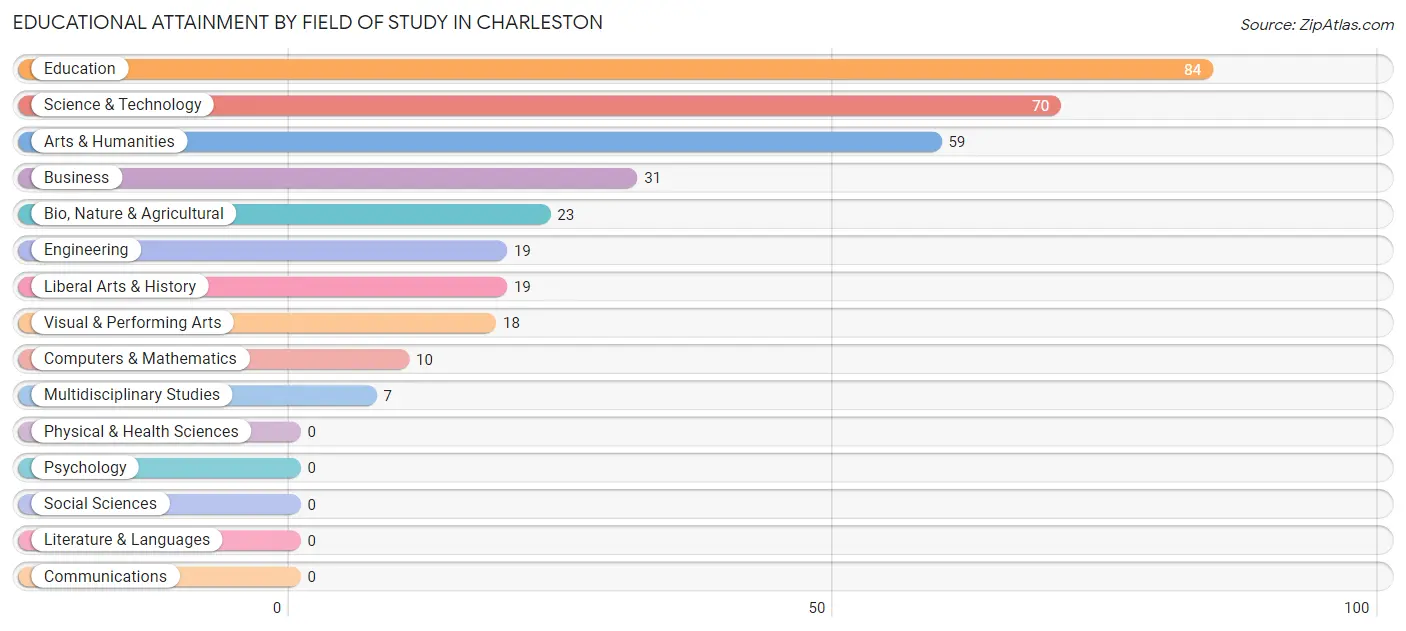
| Field of Study | # Graduates | % Graduates |
| Computers & Mathematics | 10 | 2.9% |
| Bio, Nature & Agricultural | 23 | 6.8% |
| Physical & Health Sciences | 0 | 0.0% |
| Psychology | 0 | 0.0% |
| Social Sciences | 0 | 0.0% |
| Engineering | 19 | 5.6% |
| Multidisciplinary Studies | 7 | 2.1% |
| Science & Technology | 70 | 20.6% |
| Business | 31 | 9.1% |
| Education | 84 | 24.7% |
| Literature & Languages | 0 | 0.0% |
| Liberal Arts & History | 19 | 5.6% |
| Visual & Performing Arts | 18 | 5.3% |
| Communications | 0 | 0.0% |
| Arts & Humanities | 59 | 17.3% |
| Total | 340 | 100.0% |
Transportation & Commute in Charleston
Vehicle Availability by Sex in Charleston
The most prevalent vehicle ownership categories in Charleston are males with 2 vehicles (216, accounting for 38.1%) and females with 2 vehicles (186, making up 33.6%).
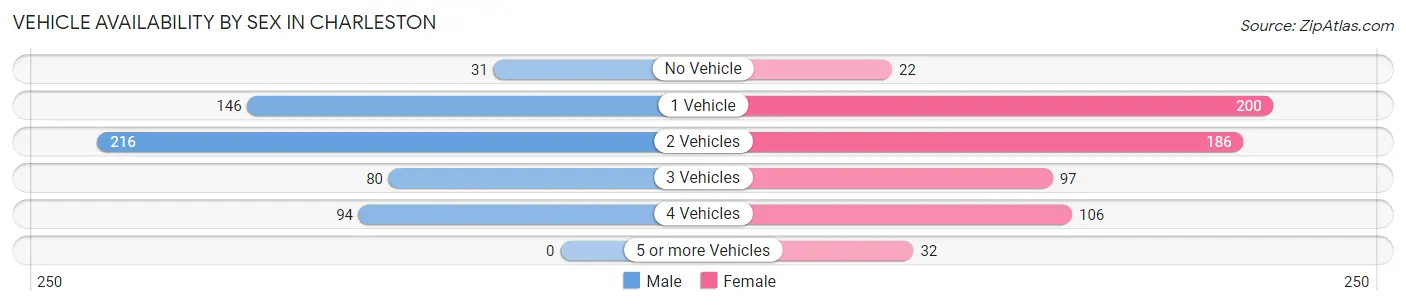
| Vehicles Available | Male | Female |
| No Vehicle | 31 (5.5%) | 22 (3.4%) |
| 1 Vehicle | 146 (25.8%) | 200 (31.1%) |
| 2 Vehicles | 216 (38.1%) | 186 (28.9%) |
| 3 Vehicles | 80 (14.1%) | 97 (15.1%) |
| 4 Vehicles | 94 (16.6%) | 106 (16.5%) |
| 5 or more Vehicles | 0 (0.0%) | 32 (5.0%) |
| Total | 567 (100.0%) | 643 (100.0%) |
Commute Time in Charleston
The most frequently occuring commute durations in Charleston are 15 to 19 minutes (213 commuters, 18.1%), 20 to 24 minutes (202 commuters, 17.1%), and less than 5 minutes (200 commuters, 17.0%).
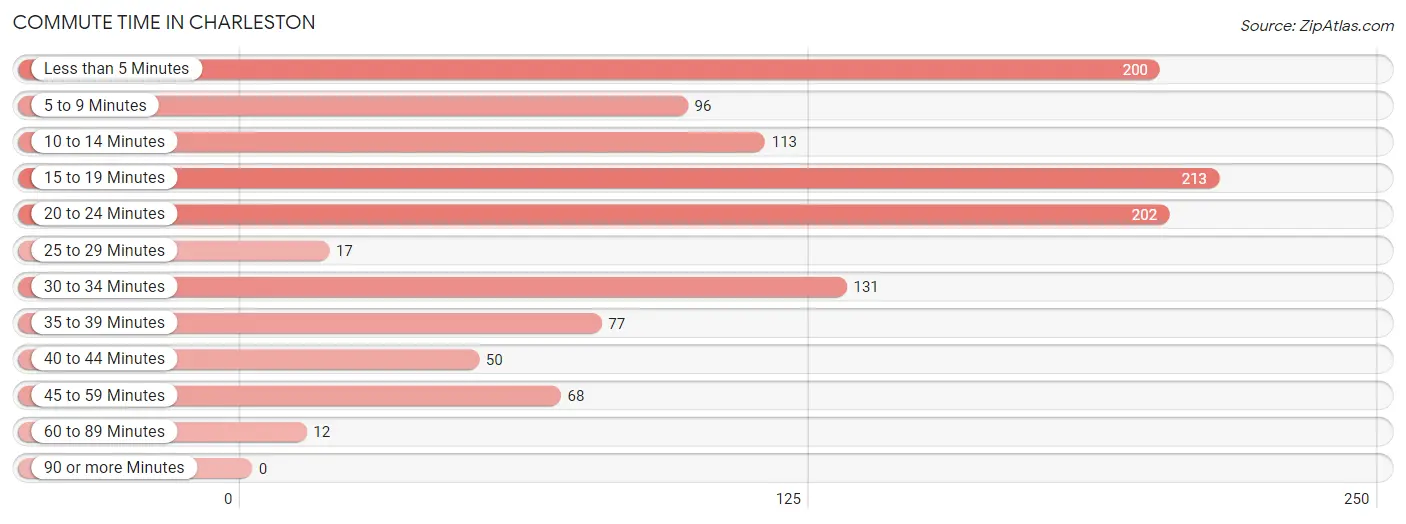
| Commute Time | # Commuters | % Commuters |
| Less than 5 Minutes | 200 | 17.0% |
| 5 to 9 Minutes | 96 | 8.1% |
| 10 to 14 Minutes | 113 | 9.6% |
| 15 to 19 Minutes | 213 | 18.1% |
| 20 to 24 Minutes | 202 | 17.1% |
| 25 to 29 Minutes | 17 | 1.4% |
| 30 to 34 Minutes | 131 | 11.1% |
| 35 to 39 Minutes | 77 | 6.5% |
| 40 to 44 Minutes | 50 | 4.2% |
| 45 to 59 Minutes | 68 | 5.8% |
| 60 to 89 Minutes | 12 | 1.0% |
| 90 or more Minutes | 0 | 0.0% |
Commute Time by Sex in Charleston
The most common commute times in Charleston are less than 5 minutes (159 commuters, 28.3%) for males and 15 to 19 minutes (191 commuters, 30.9%) for females.
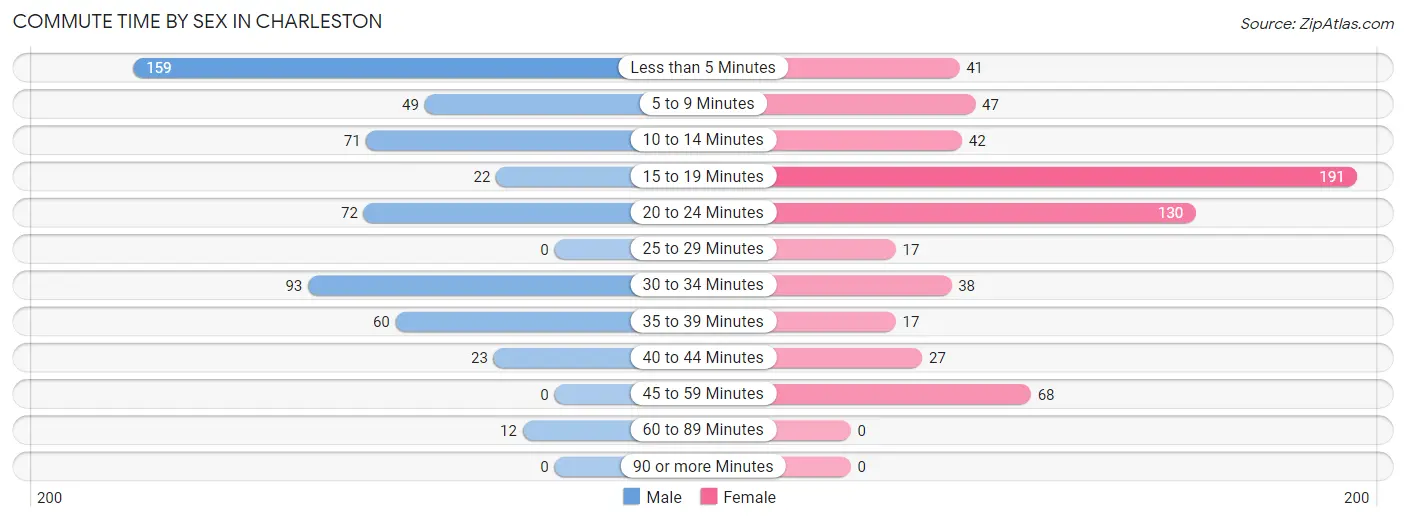
| Commute Time | Male | Female |
| Less than 5 Minutes | 159 (28.3%) | 41 (6.6%) |
| 5 to 9 Minutes | 49 (8.7%) | 47 (7.6%) |
| 10 to 14 Minutes | 71 (12.7%) | 42 (6.8%) |
| 15 to 19 Minutes | 22 (3.9%) | 191 (30.9%) |
| 20 to 24 Minutes | 72 (12.8%) | 130 (21.0%) |
| 25 to 29 Minutes | 0 (0.0%) | 17 (2.8%) |
| 30 to 34 Minutes | 93 (16.6%) | 38 (6.1%) |
| 35 to 39 Minutes | 60 (10.7%) | 17 (2.8%) |
| 40 to 44 Minutes | 23 (4.1%) | 27 (4.4%) |
| 45 to 59 Minutes | 0 (0.0%) | 68 (11.0%) |
| 60 to 89 Minutes | 12 (2.1%) | 0 (0.0%) |
| 90 or more Minutes | 0 (0.0%) | 0 (0.0%) |
Time of Departure to Work by Sex in Charleston
The most frequent times of departure to work in Charleston are 7:00 AM to 7:29 AM (175, 31.2%) for males and 7:00 AM to 7:29 AM (167, 27.0%) for females.
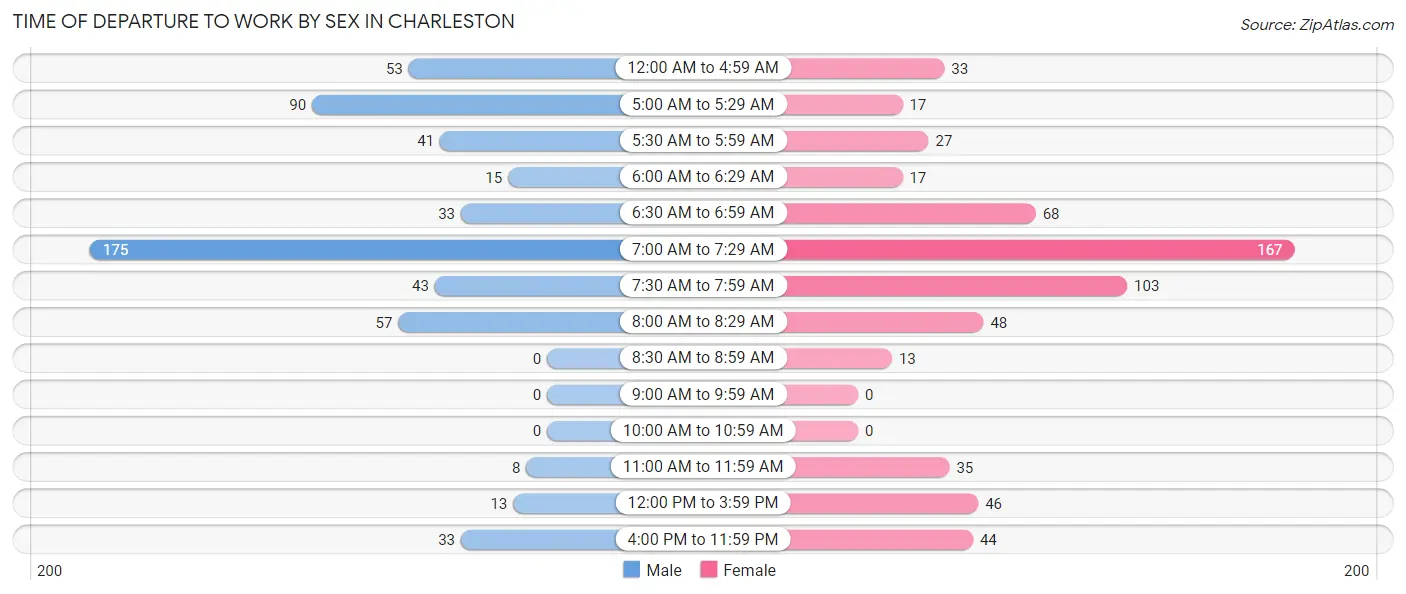
| Time of Departure | Male | Female |
| 12:00 AM to 4:59 AM | 53 (9.5%) | 33 (5.3%) |
| 5:00 AM to 5:29 AM | 90 (16.0%) | 17 (2.8%) |
| 5:30 AM to 5:59 AM | 41 (7.3%) | 27 (4.4%) |
| 6:00 AM to 6:29 AM | 15 (2.7%) | 17 (2.8%) |
| 6:30 AM to 6:59 AM | 33 (5.9%) | 68 (11.0%) |
| 7:00 AM to 7:29 AM | 175 (31.2%) | 167 (27.0%) |
| 7:30 AM to 7:59 AM | 43 (7.7%) | 103 (16.7%) |
| 8:00 AM to 8:29 AM | 57 (10.2%) | 48 (7.8%) |
| 8:30 AM to 8:59 AM | 0 (0.0%) | 13 (2.1%) |
| 9:00 AM to 9:59 AM | 0 (0.0%) | 0 (0.0%) |
| 10:00 AM to 10:59 AM | 0 (0.0%) | 0 (0.0%) |
| 11:00 AM to 11:59 AM | 8 (1.4%) | 35 (5.7%) |
| 12:00 PM to 3:59 PM | 13 (2.3%) | 46 (7.4%) |
| 4:00 PM to 11:59 PM | 33 (5.9%) | 44 (7.1%) |
| Total | 561 (100.0%) | 618 (100.0%) |
Housing Occupancy in Charleston
Occupancy by Ownership in Charleston
Of the total 1,340 dwellings in Charleston, owner-occupied units account for 660 (49.2%), while renter-occupied units make up 680 (50.7%).
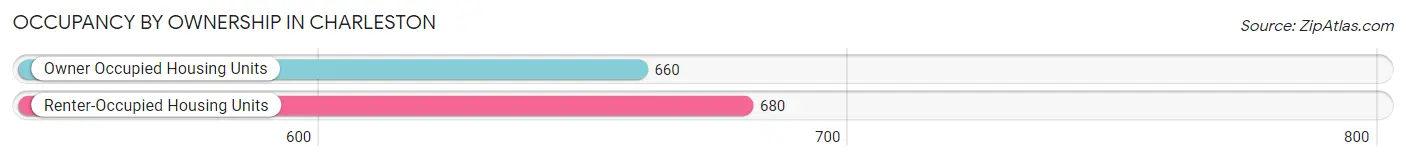
| Occupancy | # Housing Units | % Housing Units |
| Owner Occupied Housing Units | 660 | 49.2% |
| Renter-Occupied Housing Units | 680 | 50.7% |
| Total Occupied Housing Units | 1,340 | 100.0% |
Occupancy by Household Size in Charleston
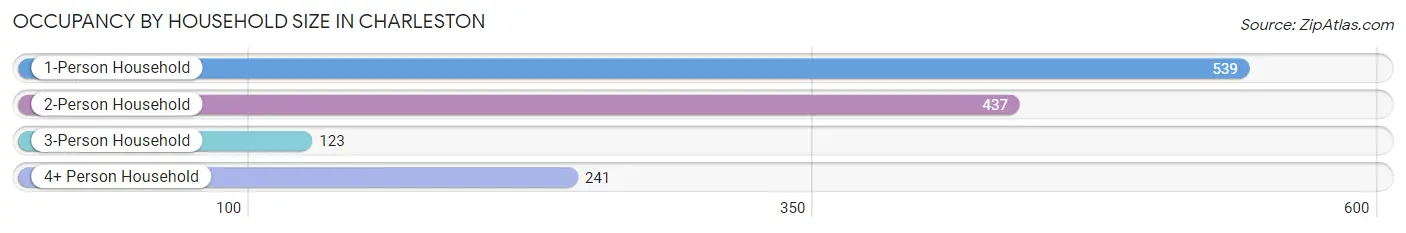
| Household Size | # Housing Units | % Housing Units |
| 1-Person Household | 539 | 40.2% |
| 2-Person Household | 437 | 32.6% |
| 3-Person Household | 123 | 9.2% |
| 4+ Person Household | 241 | 18.0% |
| Total Housing Units | 1,340 | 100.0% |
Occupancy by Ownership by Household Size in Charleston
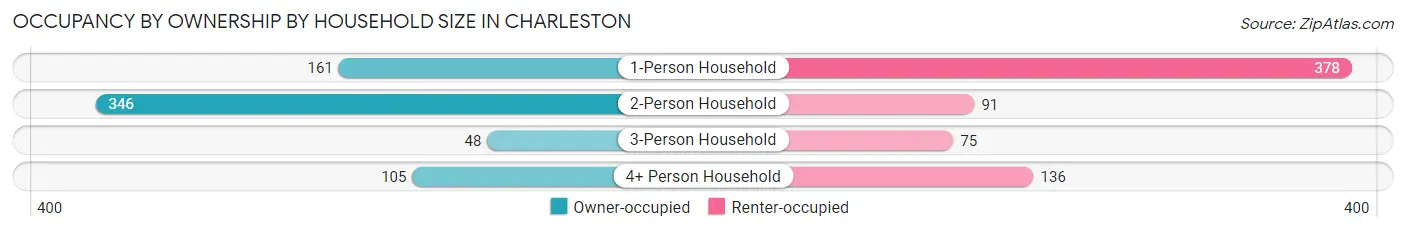
| Household Size | Owner-occupied | Renter-occupied |
| 1-Person Household | 161 (29.9%) | 378 (70.1%) |
| 2-Person Household | 346 (79.2%) | 91 (20.8%) |
| 3-Person Household | 48 (39.0%) | 75 (61.0%) |
| 4+ Person Household | 105 (43.6%) | 136 (56.4%) |
| Total Housing Units | 660 (49.2%) | 680 (50.7%) |
Occupancy by Educational Attainment in Charleston
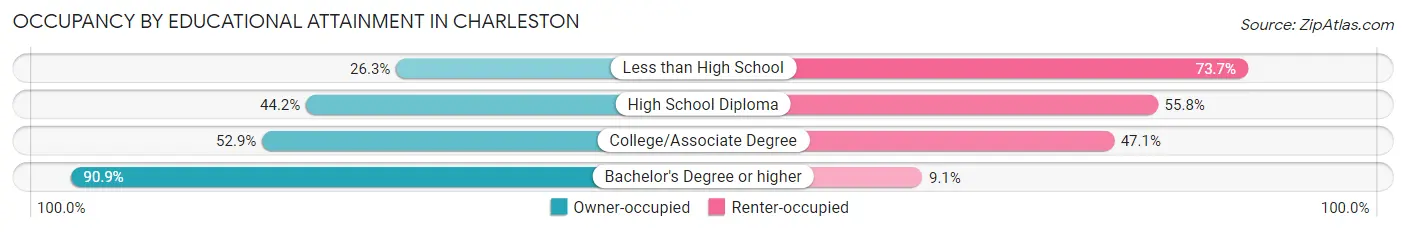
| Household Size | Owner-occupied | Renter-occupied |
| Less than High School | 74 (26.3%) | 207 (73.7%) |
| High School Diploma | 251 (44.2%) | 317 (55.8%) |
| College/Associate Degree | 155 (52.9%) | 138 (47.1%) |
| Bachelor's Degree or higher | 180 (90.9%) | 18 (9.1%) |
Occupancy by Age of Householder in Charleston
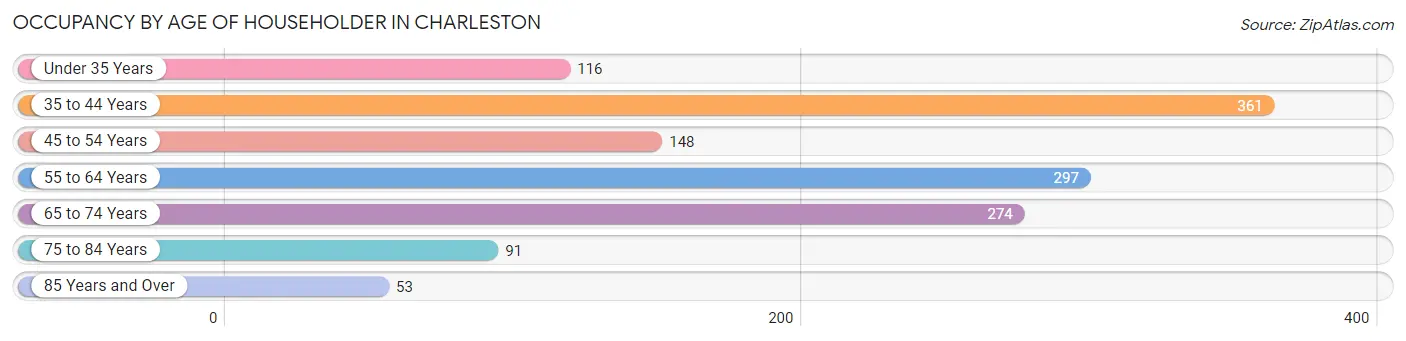
| Age Bracket | # Households | % Households |
| Under 35 Years | 116 | 8.7% |
| 35 to 44 Years | 361 | 26.9% |
| 45 to 54 Years | 148 | 11.0% |
| 55 to 64 Years | 297 | 22.2% |
| 65 to 74 Years | 274 | 20.4% |
| 75 to 84 Years | 91 | 6.8% |
| 85 Years and Over | 53 | 4.0% |
| Total | 1,340 | 100.0% |
Housing Finances in Charleston
Median Income by Occupancy in Charleston
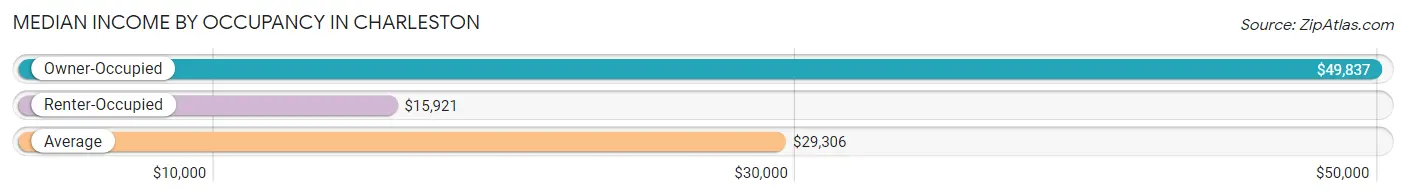
| Occupancy Type | # Households | Median Income |
| Owner-Occupied | 660 (49.2%) | $49,837 |
| Renter-Occupied | 680 (50.7%) | $15,921 |
| Average | 1,340 (100.0%) | $29,306 |
Occupancy by Householder Income Bracket in Charleston
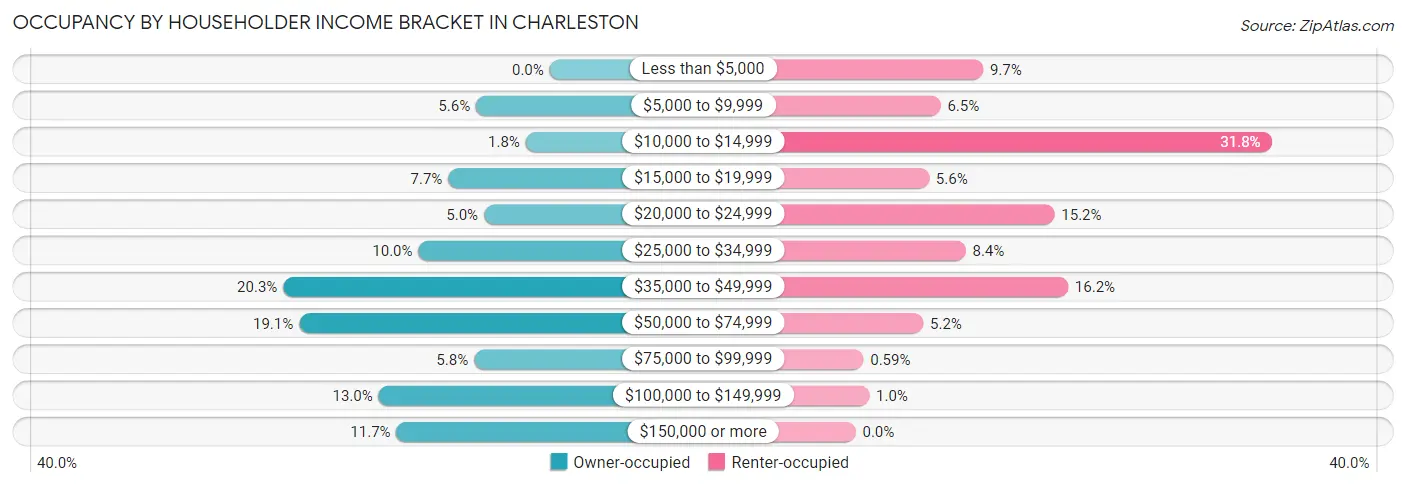
| Income Bracket | Owner-occupied | Renter-occupied |
| Less than $5,000 | 0 (0.0%) | 66 (9.7%) |
| $5,000 to $9,999 | 37 (5.6%) | 44 (6.5%) |
| $10,000 to $14,999 | 12 (1.8%) | 216 (31.8%) |
| $15,000 to $19,999 | 51 (7.7%) | 38 (5.6%) |
| $20,000 to $24,999 | 33 (5.0%) | 103 (15.1%) |
| $25,000 to $34,999 | 66 (10.0%) | 57 (8.4%) |
| $35,000 to $49,999 | 134 (20.3%) | 110 (16.2%) |
| $50,000 to $74,999 | 126 (19.1%) | 35 (5.1%) |
| $75,000 to $99,999 | 38 (5.8%) | 4 (0.6%) |
| $100,000 to $149,999 | 86 (13.0%) | 7 (1.0%) |
| $150,000 or more | 77 (11.7%) | 0 (0.0%) |
| Total | 660 (100.0%) | 680 (100.0%) |
Monthly Housing Cost Tiers in Charleston
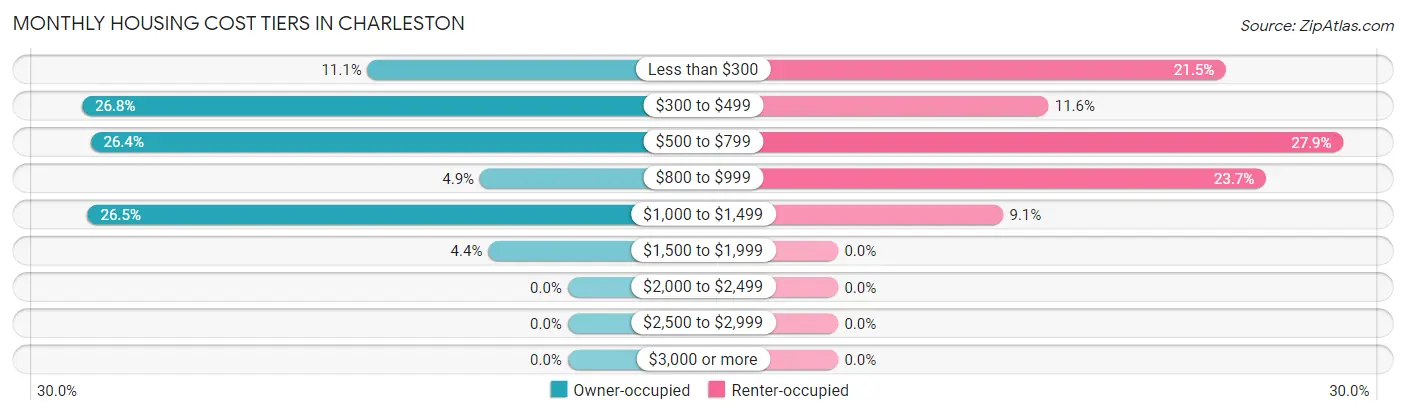
| Monthly Cost | Owner-occupied | Renter-occupied |
| Less than $300 | 73 (11.1%) | 146 (21.5%) |
| $300 to $499 | 177 (26.8%) | 79 (11.6%) |
| $500 to $799 | 174 (26.4%) | 190 (27.9%) |
| $800 to $999 | 32 (4.9%) | 161 (23.7%) |
| $1,000 to $1,499 | 175 (26.5%) | 62 (9.1%) |
| $1,500 to $1,999 | 29 (4.4%) | 0 (0.0%) |
| $2,000 to $2,499 | 0 (0.0%) | 0 (0.0%) |
| $2,500 to $2,999 | 0 (0.0%) | 0 (0.0%) |
| $3,000 or more | 0 (0.0%) | 0 (0.0%) |
| Total | 660 (100.0%) | 680 (100.0%) |
Physical Housing Characteristics in Charleston
Housing Structures in Charleston
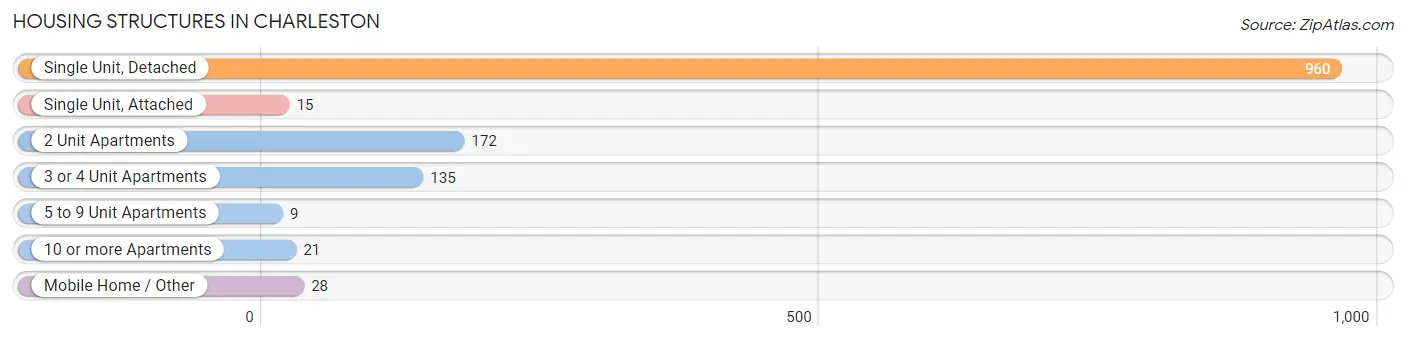
| Structure Type | # Housing Units | % Housing Units |
| Single Unit, Detached | 960 | 71.6% |
| Single Unit, Attached | 15 | 1.1% |
| 2 Unit Apartments | 172 | 12.8% |
| 3 or 4 Unit Apartments | 135 | 10.1% |
| 5 to 9 Unit Apartments | 9 | 0.7% |
| 10 or more Apartments | 21 | 1.6% |
| Mobile Home / Other | 28 | 2.1% |
| Total | 1,340 | 100.0% |
Housing Structures by Occupancy in Charleston
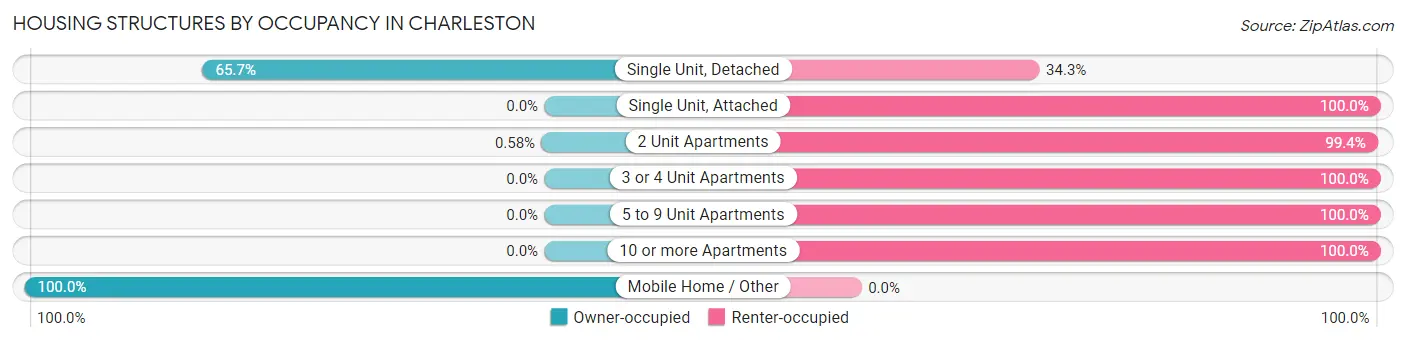
| Structure Type | Owner-occupied | Renter-occupied |
| Single Unit, Detached | 631 (65.7%) | 329 (34.3%) |
| Single Unit, Attached | 0 (0.0%) | 15 (100.0%) |
| 2 Unit Apartments | 1 (0.6%) | 171 (99.4%) |
| 3 or 4 Unit Apartments | 0 (0.0%) | 135 (100.0%) |
| 5 to 9 Unit Apartments | 0 (0.0%) | 9 (100.0%) |
| 10 or more Apartments | 0 (0.0%) | 21 (100.0%) |
| Mobile Home / Other | 28 (100.0%) | 0 (0.0%) |
| Total | 660 (49.2%) | 680 (50.7%) |
Housing Structures by Number of Rooms in Charleston
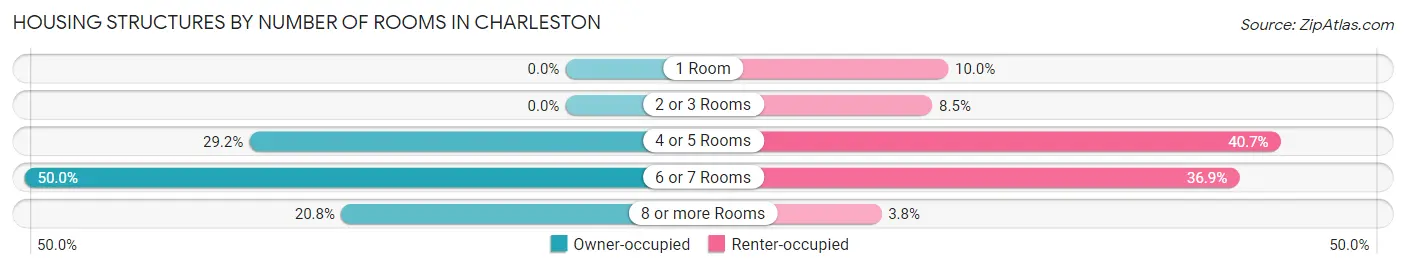
| Number of Rooms | Owner-occupied | Renter-occupied |
| 1 Room | 0 (0.0%) | 68 (10.0%) |
| 2 or 3 Rooms | 0 (0.0%) | 58 (8.5%) |
| 4 or 5 Rooms | 193 (29.2%) | 277 (40.7%) |
| 6 or 7 Rooms | 330 (50.0%) | 251 (36.9%) |
| 8 or more Rooms | 137 (20.8%) | 26 (3.8%) |
| Total | 660 (100.0%) | 680 (100.0%) |
Housing Structure by Heating Type in Charleston
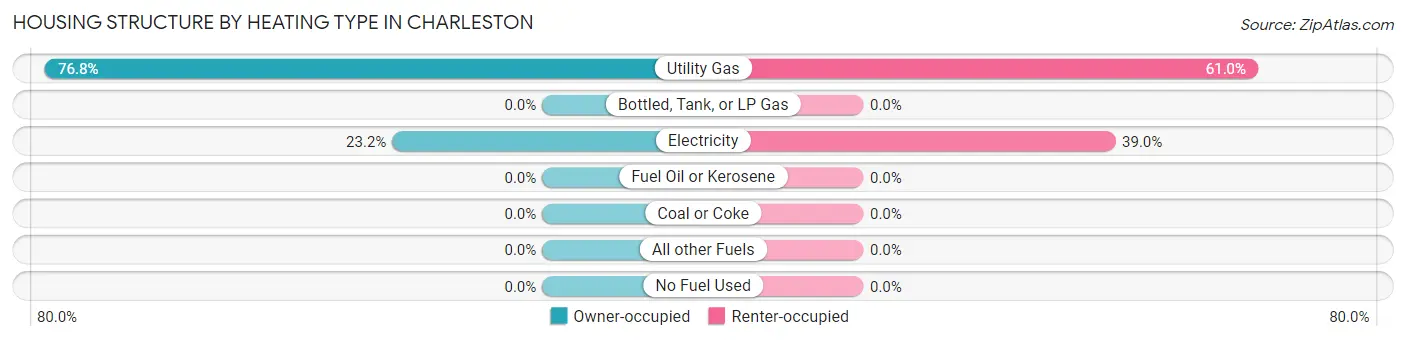
| Heating Type | Owner-occupied | Renter-occupied |
| Utility Gas | 507 (76.8%) | 415 (61.0%) |
| Bottled, Tank, or LP Gas | 0 (0.0%) | 0 (0.0%) |
| Electricity | 153 (23.2%) | 265 (39.0%) |
| Fuel Oil or Kerosene | 0 (0.0%) | 0 (0.0%) |
| Coal or Coke | 0 (0.0%) | 0 (0.0%) |
| All other Fuels | 0 (0.0%) | 0 (0.0%) |
| No Fuel Used | 0 (0.0%) | 0 (0.0%) |
| Total | 660 (100.0%) | 680 (100.0%) |
Household Vehicle Usage in Charleston
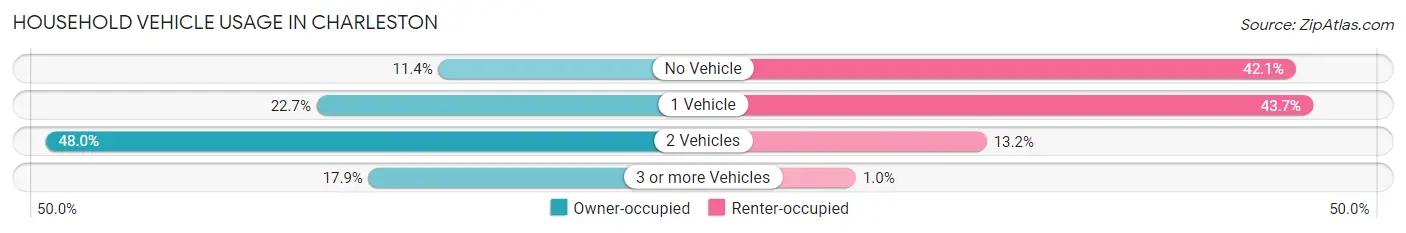
| Vehicles per Household | Owner-occupied | Renter-occupied |
| No Vehicle | 75 (11.4%) | 286 (42.1%) |
| 1 Vehicle | 150 (22.7%) | 297 (43.7%) |
| 2 Vehicles | 317 (48.0%) | 90 (13.2%) |
| 3 or more Vehicles | 118 (17.9%) | 7 (1.0%) |
| Total | 660 (100.0%) | 680 (100.0%) |
Real Estate & Mortgages in Charleston
Real Estate and Mortgage Overview in Charleston
| Characteristic | Without Mortgage | With Mortgage |
| Housing Units | 329 | 331 |
| Median Property Value | $86,000 | $100,400 |
| Median Household Income | $45,823 | $31 |
| Monthly Housing Costs | $439 | $0 |
| Real Estate Taxes | $593 | $0 |
Property Value by Mortgage Status in Charleston
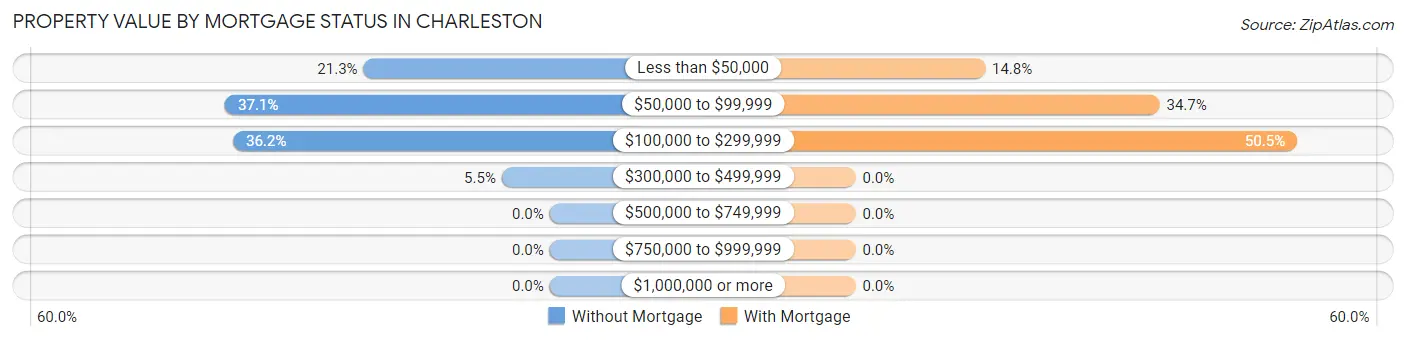
| Property Value | Without Mortgage | With Mortgage |
| Less than $50,000 | 70 (21.3%) | 49 (14.8%) |
| $50,000 to $99,999 | 122 (37.1%) | 115 (34.7%) |
| $100,000 to $299,999 | 119 (36.2%) | 167 (50.4%) |
| $300,000 to $499,999 | 18 (5.5%) | 0 (0.0%) |
| $500,000 to $749,999 | 0 (0.0%) | 0 (0.0%) |
| $750,000 to $999,999 | 0 (0.0%) | 0 (0.0%) |
| $1,000,000 or more | 0 (0.0%) | 0 (0.0%) |
| Total | 329 (100.0%) | 331 (100.0%) |
Household Income by Mortgage Status in Charleston
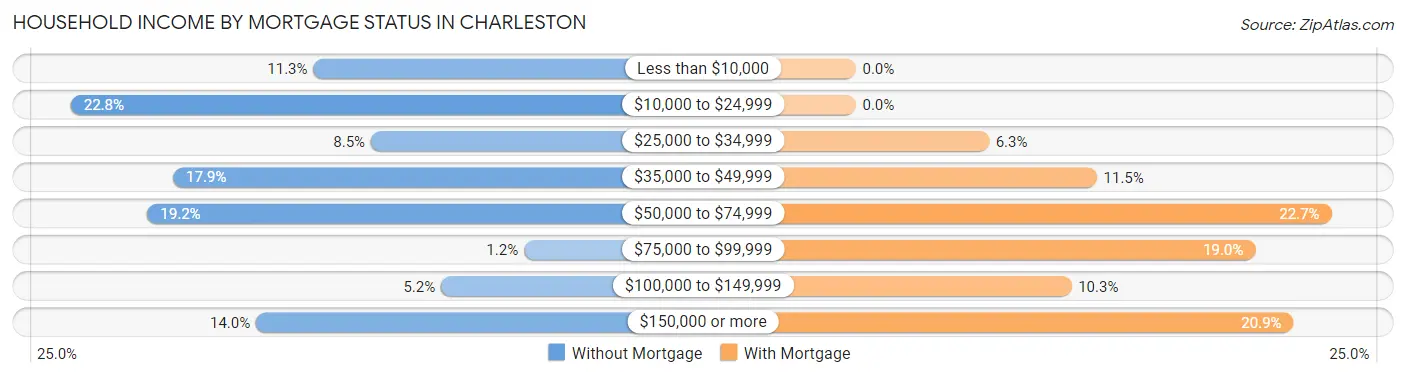
| Household Income | Without Mortgage | With Mortgage |
| Less than $10,000 | 37 (11.3%) | 0 (0.0%) |
| $10,000 to $24,999 | 75 (22.8%) | 0 (0.0%) |
| $25,000 to $34,999 | 28 (8.5%) | 21 (6.3%) |
| $35,000 to $49,999 | 59 (17.9%) | 38 (11.5%) |
| $50,000 to $74,999 | 63 (19.2%) | 75 (22.7%) |
| $75,000 to $99,999 | 4 (1.2%) | 63 (19.0%) |
| $100,000 to $149,999 | 17 (5.2%) | 34 (10.3%) |
| $150,000 or more | 46 (14.0%) | 69 (20.8%) |
| Total | 329 (100.0%) | 331 (100.0%) |
Property Value to Household Income Ratio in Charleston
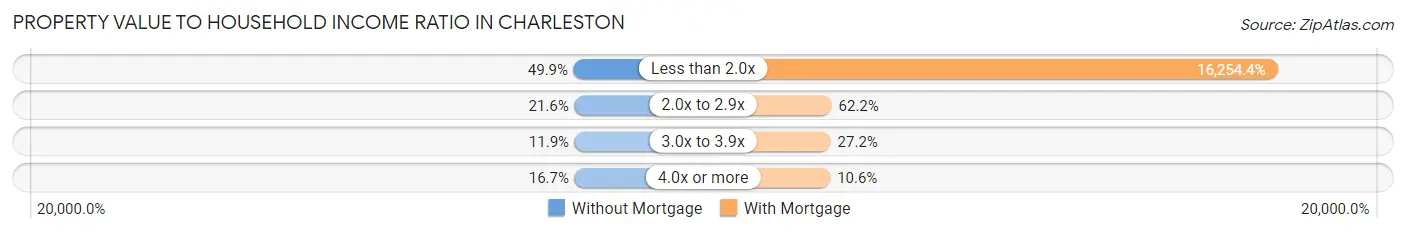
| Value-to-Income Ratio | Without Mortgage | With Mortgage |
| Less than 2.0x | 164 (49.8%) | 53,802 (16,254.4%) |
| 2.0x to 2.9x | 71 (21.6%) | 206 (62.2%) |
| 3.0x to 3.9x | 39 (11.8%) | 90 (27.2%) |
| 4.0x or more | 55 (16.7%) | 35 (10.6%) |
| Total | 329 (100.0%) | 331 (100.0%) |
Real Estate Taxes by Mortgage Status in Charleston
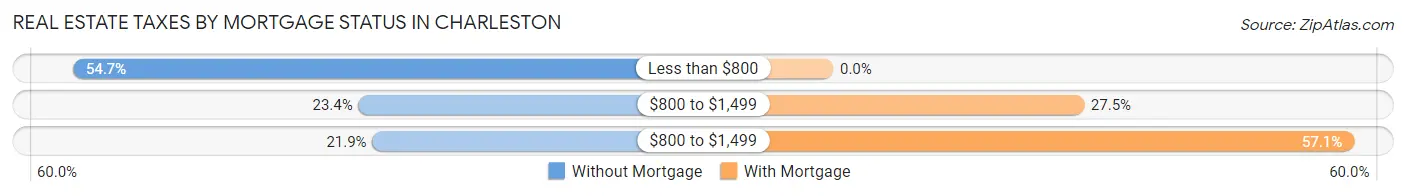
| Property Taxes | Without Mortgage | With Mortgage |
| Less than $800 | 180 (54.7%) | 0 (0.0%) |
| $800 to $1,499 | 77 (23.4%) | 91 (27.5%) |
| $800 to $1,499 | 72 (21.9%) | 189 (57.1%) |
| Total | 329 (100.0%) | 331 (100.0%) |
Health & Disability in Charleston
Health Insurance Coverage by Age in Charleston
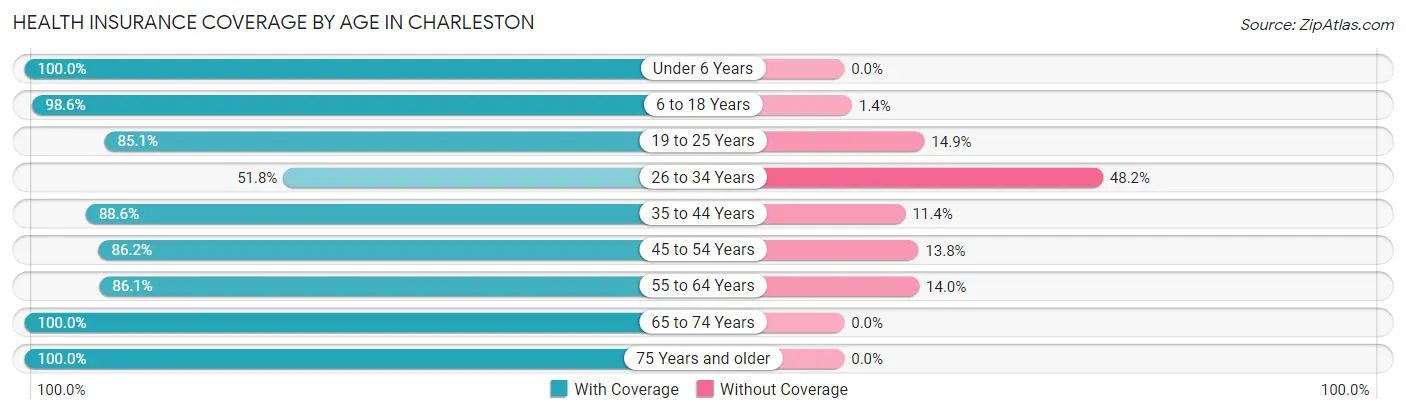
| Age Bracket | With Coverage | Without Coverage |
| Under 6 Years | 236 (100.0%) | 0 (0.0%) |
| 6 to 18 Years | 754 (98.6%) | 11 (1.4%) |
| 19 to 25 Years | 222 (85.1%) | 39 (14.9%) |
| 26 to 34 Years | 131 (51.8%) | 122 (48.2%) |
| 35 to 44 Years | 427 (88.6%) | 55 (11.4%) |
| 45 to 54 Years | 293 (86.2%) | 47 (13.8%) |
| 55 to 64 Years | 370 (86.1%) | 60 (14.0%) |
| 65 to 74 Years | 330 (100.0%) | 0 (0.0%) |
| 75 Years and older | 183 (100.0%) | 0 (0.0%) |
| Total | 2,946 (89.8%) | 334 (10.2%) |
Health Insurance Coverage by Citizenship Status in Charleston
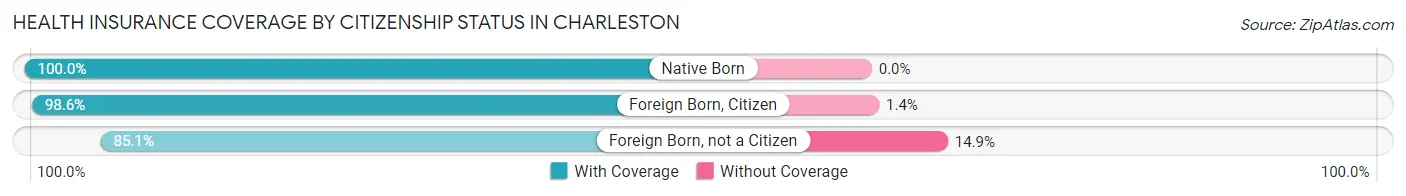
| Citizenship Status | With Coverage | Without Coverage |
| Native Born | 236 (100.0%) | 0 (0.0%) |
| Foreign Born, Citizen | 754 (98.6%) | 11 (1.4%) |
| Foreign Born, not a Citizen | 222 (85.1%) | 39 (14.9%) |
Health Insurance Coverage by Household Income in Charleston
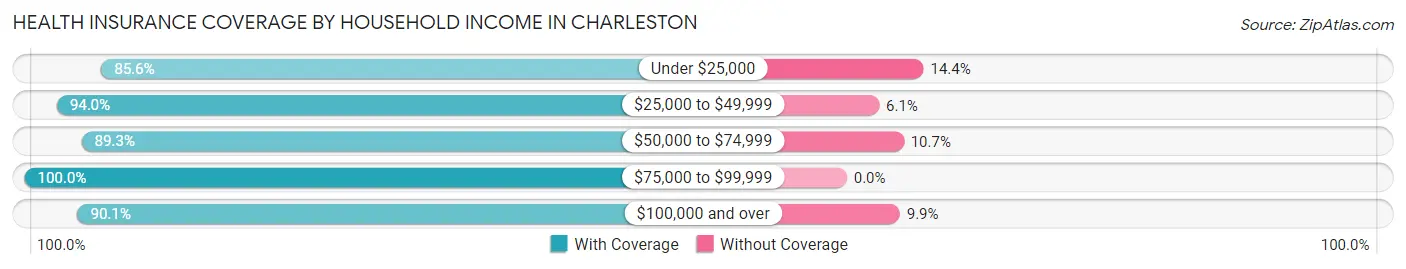
| Household Income | With Coverage | Without Coverage |
| Under $25,000 | 988 (85.6%) | 166 (14.4%) |
| $25,000 to $49,999 | 885 (94.0%) | 57 (6.0%) |
| $50,000 to $74,999 | 335 (89.3%) | 40 (10.7%) |
| $75,000 to $99,999 | 89 (100.0%) | 0 (0.0%) |
| $100,000 and over | 644 (90.1%) | 71 (9.9%) |
Public vs Private Health Insurance Coverage by Age in Charleston
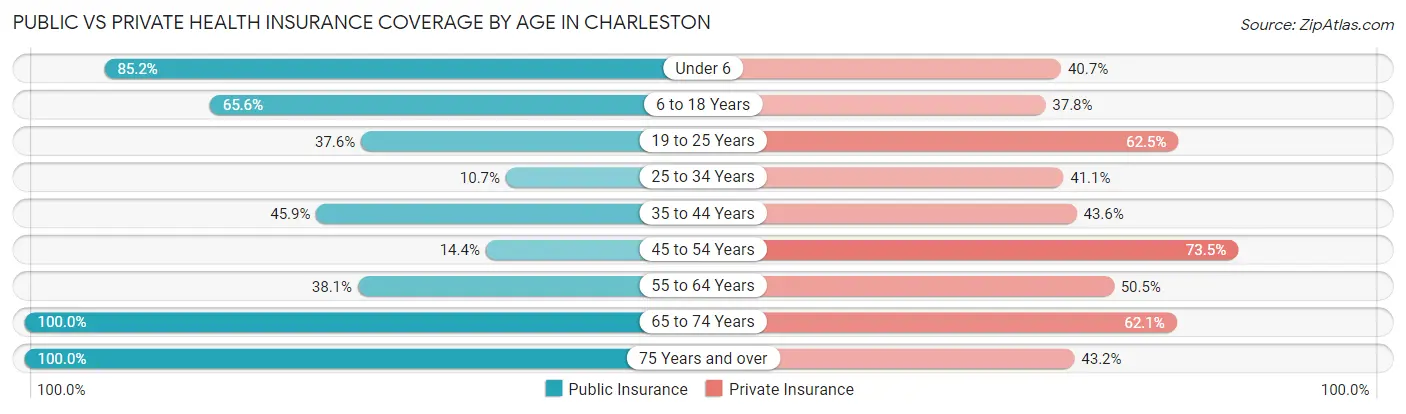
| Age Bracket | Public Insurance | Private Insurance |
| Under 6 | 201 (85.2%) | 96 (40.7%) |
| 6 to 18 Years | 502 (65.6%) | 289 (37.8%) |
| 19 to 25 Years | 98 (37.6%) | 163 (62.5%) |
| 25 to 34 Years | 27 (10.7%) | 104 (41.1%) |
| 35 to 44 Years | 221 (45.9%) | 210 (43.6%) |
| 45 to 54 Years | 49 (14.4%) | 250 (73.5%) |
| 55 to 64 Years | 164 (38.1%) | 217 (50.5%) |
| 65 to 74 Years | 330 (100.0%) | 205 (62.1%) |
| 75 Years and over | 183 (100.0%) | 79 (43.2%) |
| Total | 1,775 (54.1%) | 1,613 (49.2%) |
Disability Status by Sex by Age in Charleston
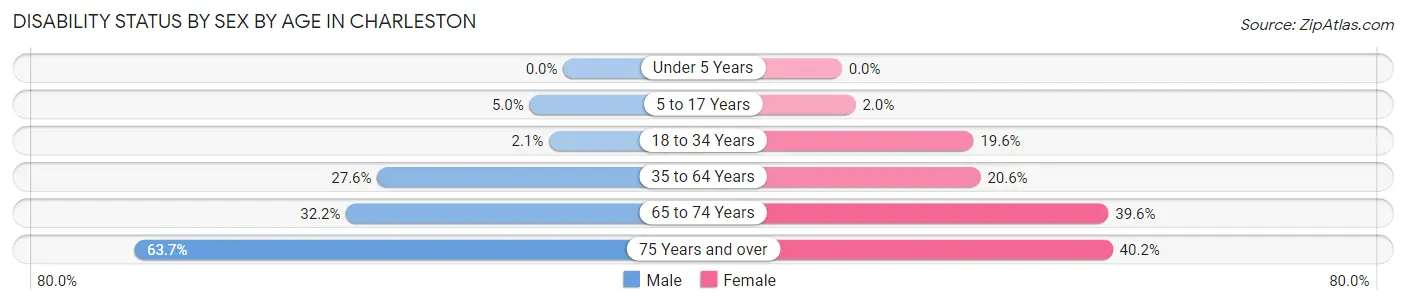
| Age Bracket | Male | Female |
| Under 5 Years | 0 (0.0%) | 0 (0.0%) |
| 5 to 17 Years | 23 (5.0%) | 7 (2.0%) |
| 18 to 34 Years | 4 (2.1%) | 69 (19.6%) |
| 35 to 64 Years | 150 (27.6%) | 146 (20.6%) |
| 65 to 74 Years | 29 (32.2%) | 95 (39.6%) |
| 75 Years and over | 58 (63.7%) | 37 (40.2%) |
Disability Class by Sex by Age in Charleston
Disability Class: Hearing Difficulty
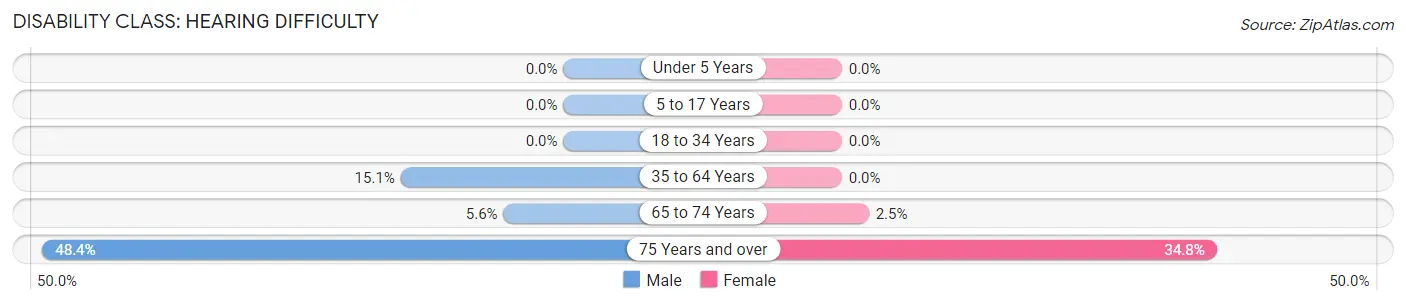
| Age Bracket | Male | Female |
| Under 5 Years | 0 (0.0%) | 0 (0.0%) |
| 5 to 17 Years | 0 (0.0%) | 0 (0.0%) |
| 18 to 34 Years | 0 (0.0%) | 0 (0.0%) |
| 35 to 64 Years | 82 (15.1%) | 0 (0.0%) |
| 65 to 74 Years | 5 (5.6%) | 6 (2.5%) |
| 75 Years and over | 44 (48.3%) | 32 (34.8%) |
Disability Class: Vision Difficulty
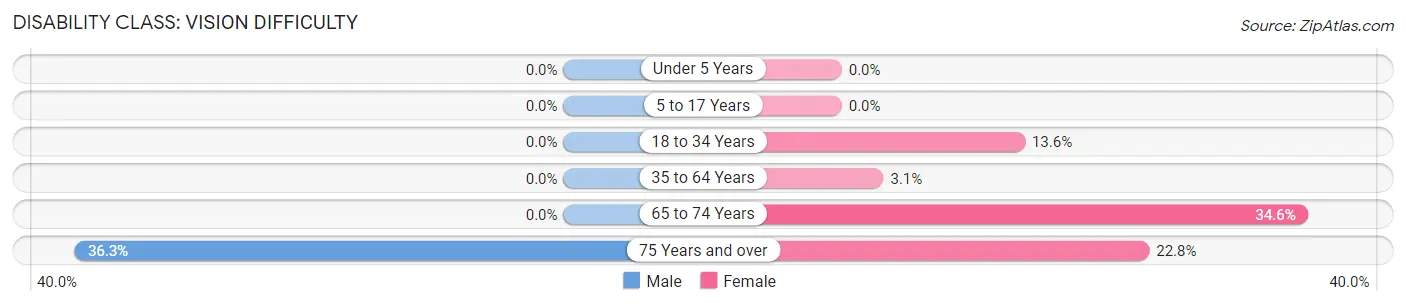
| Age Bracket | Male | Female |
| Under 5 Years | 0 (0.0%) | 0 (0.0%) |
| 5 to 17 Years | 0 (0.0%) | 0 (0.0%) |
| 18 to 34 Years | 0 (0.0%) | 48 (13.6%) |
| 35 to 64 Years | 0 (0.0%) | 22 (3.1%) |
| 65 to 74 Years | 0 (0.0%) | 83 (34.6%) |
| 75 Years and over | 33 (36.3%) | 21 (22.8%) |
Disability Class: Cognitive Difficulty
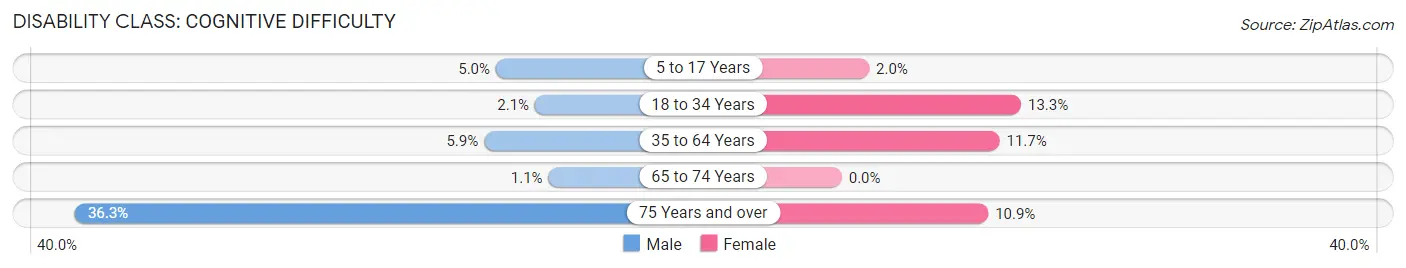
| Age Bracket | Male | Female |
| 5 to 17 Years | 23 (5.0%) | 7 (2.0%) |
| 18 to 34 Years | 4 (2.1%) | 47 (13.3%) |
| 35 to 64 Years | 32 (5.9%) | 83 (11.7%) |
| 65 to 74 Years | 1 (1.1%) | 0 (0.0%) |
| 75 Years and over | 33 (36.3%) | 10 (10.9%) |
Disability Class: Ambulatory Difficulty
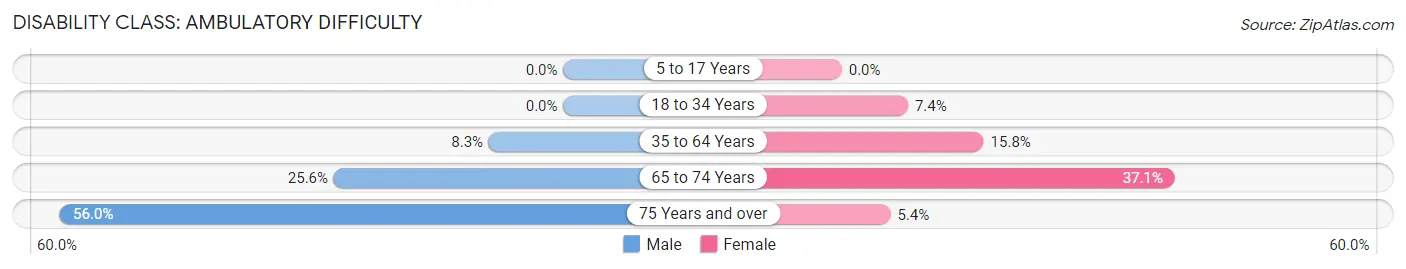
| Age Bracket | Male | Female |
| 5 to 17 Years | 0 (0.0%) | 0 (0.0%) |
| 18 to 34 Years | 0 (0.0%) | 26 (7.4%) |
| 35 to 64 Years | 45 (8.3%) | 112 (15.8%) |
| 65 to 74 Years | 23 (25.6%) | 89 (37.1%) |
| 75 Years and over | 51 (56.0%) | 5 (5.4%) |
Disability Class: Self-Care Difficulty
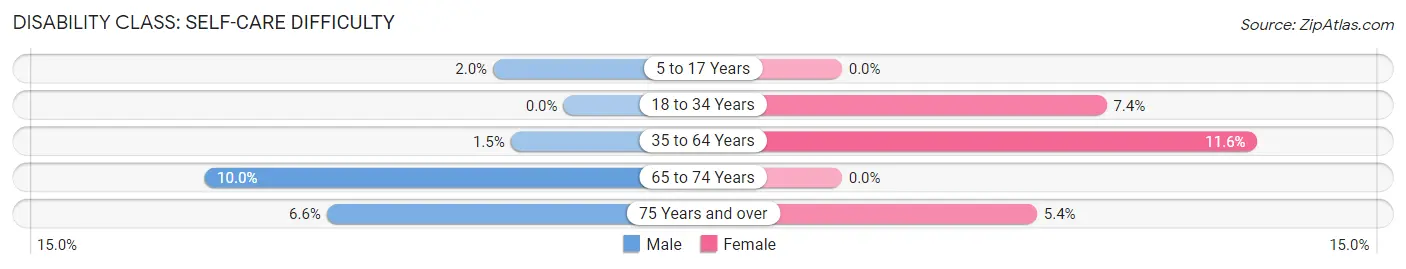
| Age Bracket | Male | Female |
| 5 to 17 Years | 9 (2.0%) | 0 (0.0%) |
| 18 to 34 Years | 0 (0.0%) | 26 (7.4%) |
| 35 to 64 Years | 8 (1.5%) | 82 (11.6%) |
| 65 to 74 Years | 9 (10.0%) | 0 (0.0%) |
| 75 Years and over | 6 (6.6%) | 5 (5.4%) |
Technology Access in Charleston
Computing Device Access in Charleston
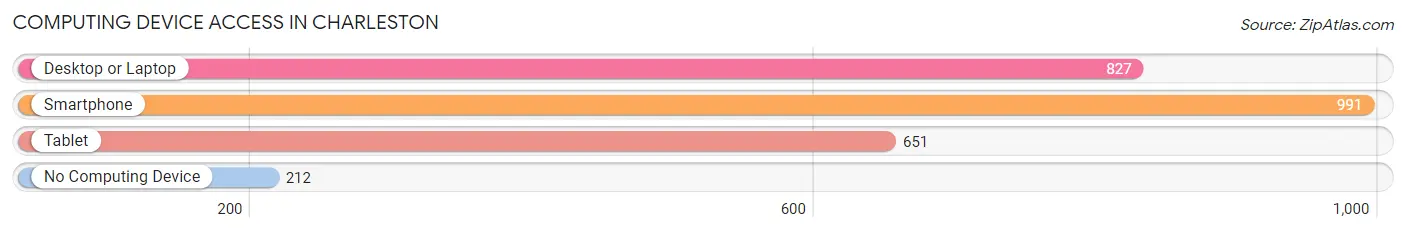
| Device Type | # Households | % Households |
| Desktop or Laptop | 827 | 61.7% |
| Smartphone | 991 | 74.0% |
| Tablet | 651 | 48.6% |
| No Computing Device | 212 | 15.8% |
| Total | 1,340 | 100.0% |
Internet Access in Charleston
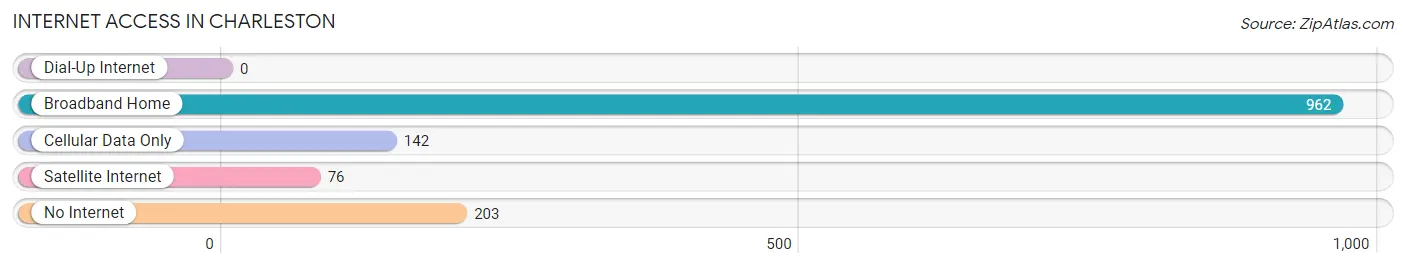
| Internet Type | # Households | % Households |
| Dial-Up Internet | 0 | 0.0% |
| Broadband Home | 962 | 71.8% |
| Cellular Data Only | 142 | 10.6% |
| Satellite Internet | 76 | 5.7% |
| No Internet | 203 | 15.1% |
| Total | 1,340 | 100.0% |
Charleston Summary
Charleston, Missouri is a small city located in Mississippi County, in the southeastern corner of the state. It is situated on the banks of the Mississippi River, and is the county seat of Mississippi County. The city has a population of approximately 2,500 people, and is part of the Sikeston-Perryville-Charleston Metropolitan Statistical Area.
History
Charleston was founded in 1819 by a group of settlers from Kentucky and Tennessee. The city was named after Charles S. Todd, a prominent local landowner. The city was incorporated in 1837, and was the first city in Mississippi County.
In the early years, Charleston was a bustling river port, and was a major center for the cotton trade. The city was also a major stop on the Cairo and Fulton Railroad, which connected the city to St. Louis and other major cities in the Midwest.
In the late 19th century, the city experienced a period of growth and prosperity. The city was home to several large businesses, including a cotton mill, a brick factory, and a lumber mill. The city also had a thriving agricultural industry, and was home to several large farms.
Geography
Charleston is located in the southeastern corner of Missouri, on the banks of the Mississippi River. The city is situated in the Mississippi Lowlands, and is surrounded by rolling hills and wooded areas. The city is located approximately 30 miles south of Cape Girardeau, and is about 90 miles north of Memphis, Tennessee.
The climate in Charleston is humid subtropical, with hot, humid summers and mild winters. The average annual temperature is around 60 degrees Fahrenheit, and the average annual precipitation is around 40 inches.
Economy
The economy of Charleston is largely based on agriculture and manufacturing. The city is home to several large farms, and is a major producer of cotton, soybeans, and corn. The city is also home to several manufacturing companies, including a paper mill, a furniture factory, and a plastics factory.
The city is also home to several retail stores, restaurants, and other businesses. The city is served by the Charleston Municipal Airport, and is connected to the rest of the state by several major highways.
Demographics
As of the 2010 census, the population of Charleston was 2,500. The racial makeup of the city was 95.2% White, 2.2% African American, 0.4% Native American, 0.4% Asian, 0.2% from other races, and 1.6% from two or more races. Hispanic or Latino of any race were 1.2% of the population.
The median household income in Charleston was $31,250, and the median family income was $37,500. The per capita income in the city was $17,845. About 17.2% of the population was below the poverty line.
Common Questions
What is Per Capita Income in Charleston?
Per Capita income in Charleston is $14,991.
What is the Median Family Income in Charleston?
Median Family Income in Charleston is $45,385.
What is the Median Household income in Charleston?
Median Household Income in Charleston is $29,306.
What is Income or Wage Gap in Charleston?
Income or Wage Gap in Charleston is 37.7%.
Women in Charleston earn 62.3 cents for every dollar earned by a man.
What is Inequality or Gini Index in Charleston?
Inequality or Gini Index in Charleston is 0.50.
What is the Total Population of Charleston?
Total Population of Charleston is 4,683.
What is the Total Male Population of Charleston?
Total Male Population of Charleston is 2,848.
What is the Total Female Population of Charleston?
Total Female Population of Charleston is 1,835.
What is the Ratio of Males per 100 Females in Charleston?
There are 155.20 Males per 100 Females in Charleston.
What is the Ratio of Females per 100 Males in Charleston?
There are 64.43 Females per 100 Males in Charleston.
What is the Median Population Age in Charleston?
Median Population Age in Charleston is 42.2 Years.
What is the Average Family Size in Charleston
Average Family Size in Charleston is 3.3 People.
What is the Average Household Size in Charleston
Average Household Size in Charleston is 2.4 People.
How Large is the Labor Force in Charleston?
There are 1,323 People in the Labor Forcein in Charleston.
What is the Percentage of People in the Labor Force in Charleston?
33.8% of People are in the Labor Force in Charleston.
What is the Unemployment Rate in Charleston?
Unemployment Rate in Charleston is 7.9%.