Perry, MO Map & Demographics
Perry Map
Perry Overview
$22,613
PER CAPITA INCOME
$57,989
AVG FAMILY INCOME
$47,981
AVG HOUSEHOLD INCOME
18.4%
WAGE / INCOME GAP [ % ]
81.6¢/ $1
WAGE / INCOME GAP [ $ ]
0.36
INEQUALITY / GINI INDEX
707
TOTAL POPULATION
342
MALE POPULATION
365
FEMALE POPULATION
93.70
MALES / 100 FEMALES
106.73
FEMALES / 100 MALES
45.5
MEDIAN AGE
3.3
AVG FAMILY SIZE
2.4
AVG HOUSEHOLD SIZE
255
LABOR FORCE [ PEOPLE ]
42.7%
PERCENT IN LABOR FORCE
1.2%
UNEMPLOYMENT RATE
Perry Zip Codes
Perry Area Codes
Income in Perry
Income Overview in Perry
Per Capita Income in Perry is $22,613, while median incomes of families and households are $57,989 and $47,981 respectively.
| Characteristic | Number | Measure |
| Per Capita Income | 707 | $22,613 |
| Median Family Income | 175 | $57,989 |
| Mean Family Income | 175 | $67,220 |
| Median Household Income | 291 | $47,981 |
| Mean Household Income | 291 | $52,603 |
| Income Deficit | 175 | $0 |
| Wage / Income Gap (%) | 707 | 18.40% |
| Wage / Income Gap ($) | 707 | 81.60¢ per $1 |
| Gini / Inequality Index | 707 | 0.36 |
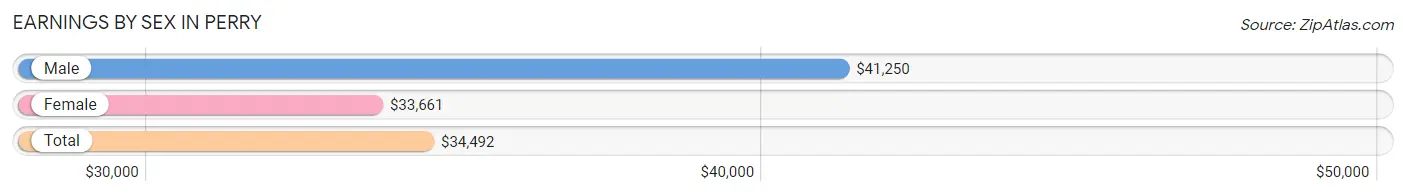
Earnings by Sex in Perry
Average Earnings in Perry are $34,492, $41,250 for men and $33,661 for women, a difference of 18.4%.
| Sex | Number | Average Earnings |
| Male | 105 (39.6%) | $41,250 |
| Female | 160 (60.4%) | $33,661 |
| Total | 265 (100.0%) | $34,492 |
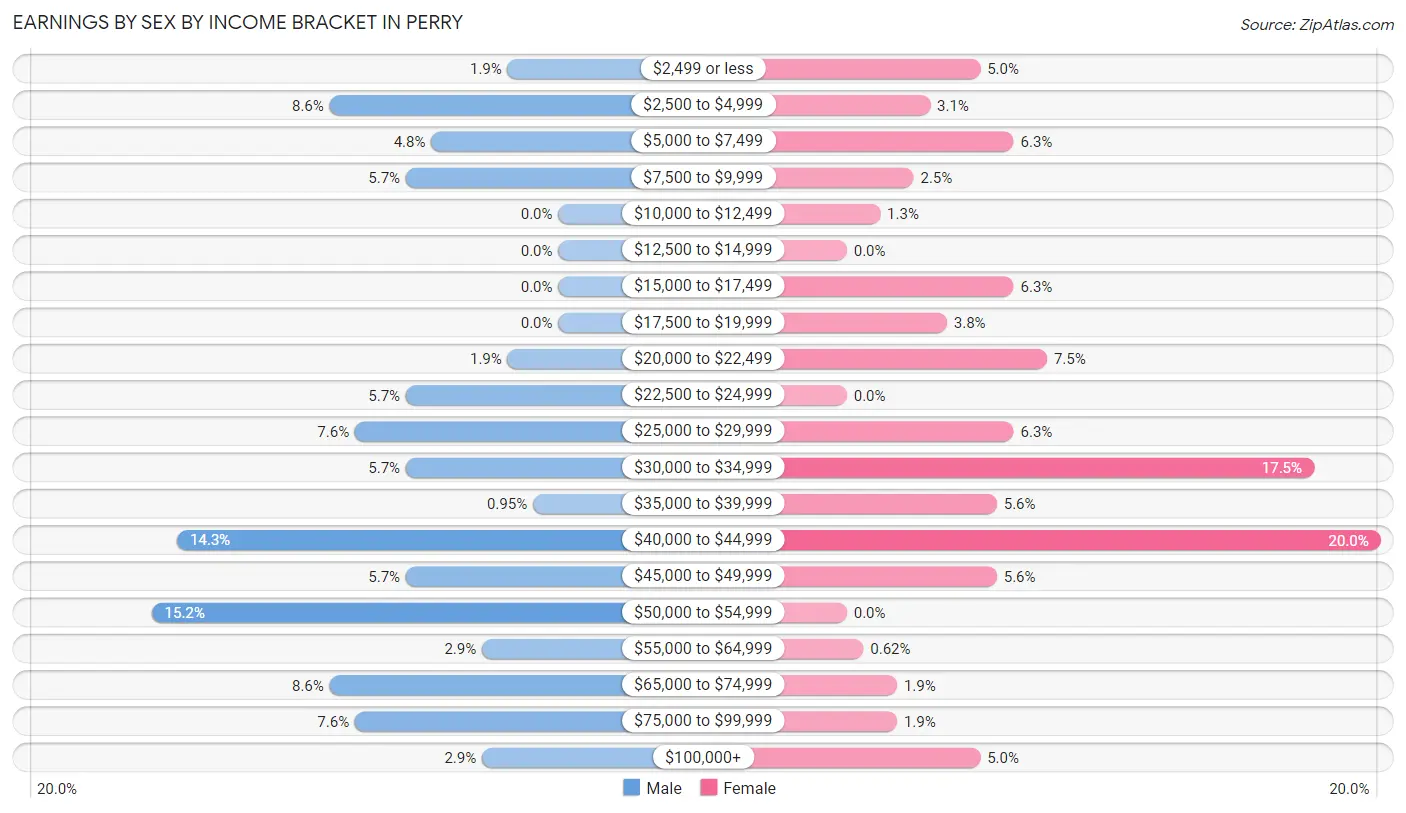
Earnings by Sex by Income Bracket in Perry
The most common earnings brackets in Perry are $50,000 to $54,999 for men (16 | 15.2%) and $40,000 to $44,999 for women (32 | 20.0%).
| Income | Male | Female |
| $2,499 or less | 2 (1.9%) | 8 (5.0%) |
| $2,500 to $4,999 | 9 (8.6%) | 5 (3.1%) |
| $5,000 to $7,499 | 5 (4.8%) | 10 (6.2%) |
| $7,500 to $9,999 | 6 (5.7%) | 4 (2.5%) |
| $10,000 to $12,499 | 0 (0.0%) | 2 (1.3%) |
| $12,500 to $14,999 | 0 (0.0%) | 0 (0.0%) |
| $15,000 to $17,499 | 0 (0.0%) | 10 (6.2%) |
| $17,500 to $19,999 | 0 (0.0%) | 6 (3.7%) |
| $20,000 to $22,499 | 2 (1.9%) | 12 (7.5%) |
| $22,500 to $24,999 | 6 (5.7%) | 0 (0.0%) |
| $25,000 to $29,999 | 8 (7.6%) | 10 (6.2%) |
| $30,000 to $34,999 | 6 (5.7%) | 28 (17.5%) |
| $35,000 to $39,999 | 1 (0.9%) | 9 (5.6%) |
| $40,000 to $44,999 | 15 (14.3%) | 32 (20.0%) |
| $45,000 to $49,999 | 6 (5.7%) | 9 (5.6%) |
| $50,000 to $54,999 | 16 (15.2%) | 0 (0.0%) |
| $55,000 to $64,999 | 3 (2.9%) | 1 (0.6%) |
| $65,000 to $74,999 | 9 (8.6%) | 3 (1.9%) |
| $75,000 to $99,999 | 8 (7.6%) | 3 (1.9%) |
| $100,000+ | 3 (2.9%) | 8 (5.0%) |
| Total | 105 (100.0%) | 160 (100.0%) |
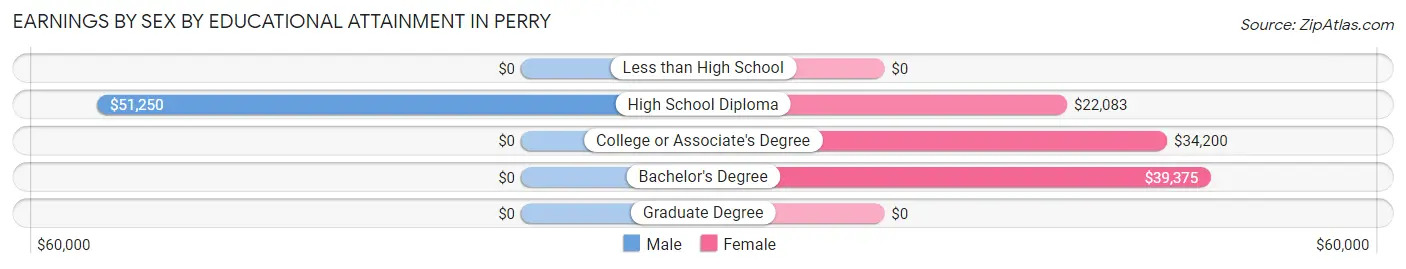
Earnings by Sex by Educational Attainment in Perry
Average earnings in Perry are $41,923 for men and $33,929 for women, a difference of 19.1%. Men with an educational attainment of high school diploma enjoy the highest average annual earnings of $51,250, while those with high school diploma education earn the least with $51,250. Women with an educational attainment of bachelor's degree earn the most with the average annual earnings of $39,375, while those with high school diploma education have the smallest earnings of $22,083.
| Educational Attainment | Male Income | Female Income |
| Less than High School | - | - |
| High School Diploma | $51,250 | $22,083 |
| College or Associate's Degree | - | - |
| Bachelor's Degree | - | - |
| Graduate Degree | - | - |
| Total | $41,923 | $33,929 |
Family Income in Perry
Family Income Brackets in Perry
According to the Perry family income data, there are 72 families falling into the $50,000 to $74,999 income range, which is the most common income bracket and makes up 41.1% of all families.
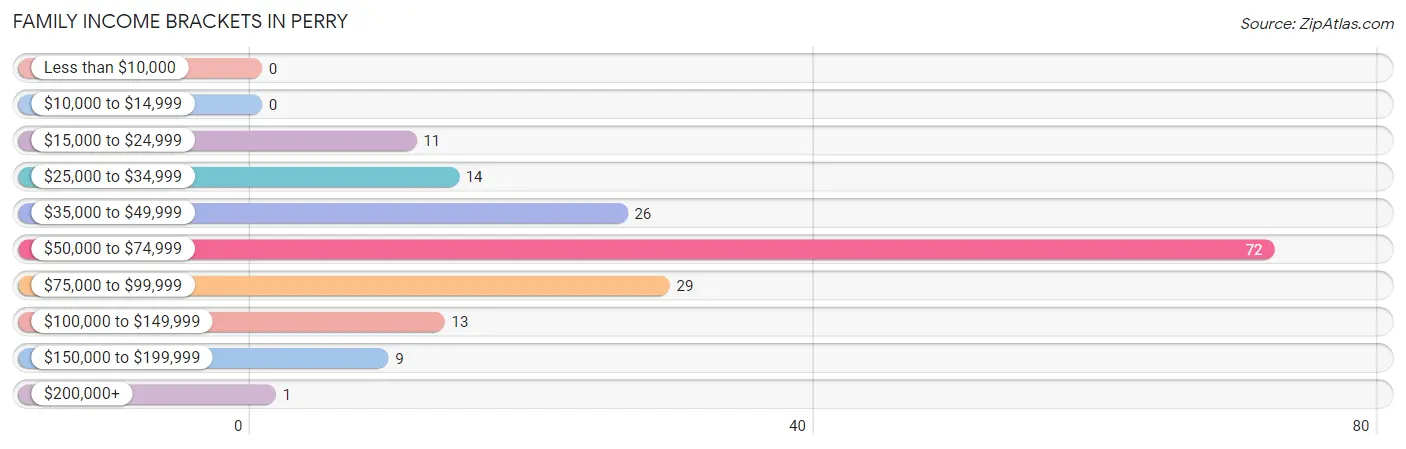
| Income Bracket | # Families | % Families |
| Less than $10,000 | 0 | 0.0% |
| $10,000 to $14,999 | 0 | 0.0% |
| $15,000 to $24,999 | 11 | 6.3% |
| $25,000 to $34,999 | 14 | 8.0% |
| $35,000 to $49,999 | 26 | 14.9% |
| $50,000 to $74,999 | 72 | 41.1% |
| $75,000 to $99,999 | 29 | 16.6% |
| $100,000 to $149,999 | 13 | 7.4% |
| $150,000 to $199,999 | 9 | 5.1% |
| $200,000+ | 1 | 0.6% |
Family Income by Famaliy Size in Perry
3-person families (54 | 30.9%) account for the highest median family income in Perry with $57,826 per family, while 2-person families (101 | 57.7%) have the highest median income of $27,812 per family member.
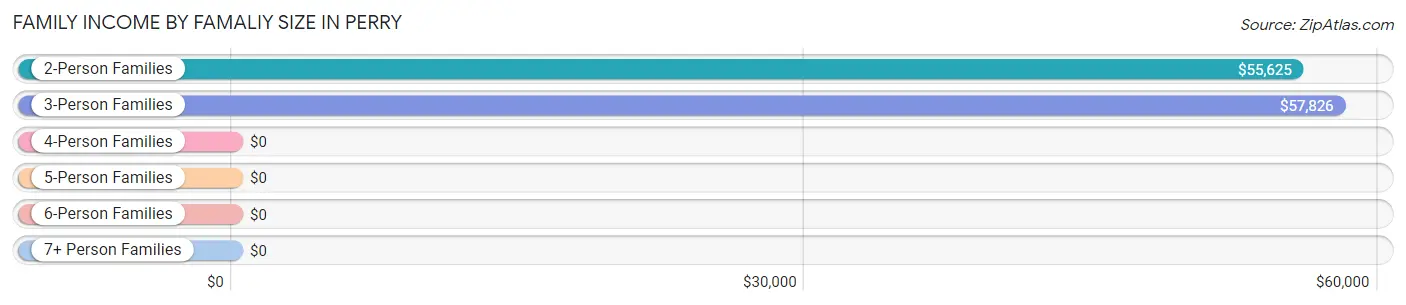
| Income Bracket | # Families | Median Income |
| 2-Person Families | 101 (57.7%) | $55,625 |
| 3-Person Families | 54 (30.9%) | $57,826 |
| 4-Person Families | 7 (4.0%) | $0 |
| 5-Person Families | 1 (0.6%) | $0 |
| 6-Person Families | 0 (0.0%) | $0 |
| 7+ Person Families | 12 (6.9%) | $0 |
| Total | 175 (100.0%) | $57,989 |
Family Income by Number of Earners in Perry
The median family income in Perry is $57,989, with families comprising 3+ earners (8) having the highest median family income of $111,667, while families with no earners (48) have the lowest median family income of $49,500, accounting for 4.6% and 27.4% of families, respectively.
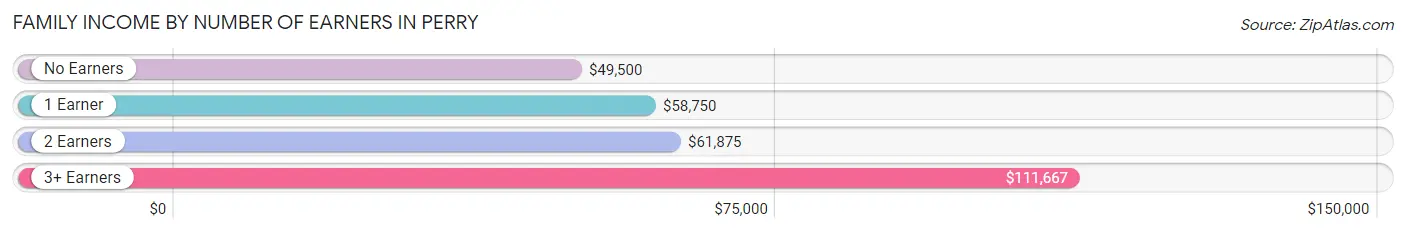
| Number of Earners | # Families | Median Income |
| No Earners | 48 (27.4%) | $49,500 |
| 1 Earner | 73 (41.7%) | $58,750 |
| 2 Earners | 46 (26.3%) | $61,875 |
| 3+ Earners | 8 (4.6%) | $111,667 |
| Total | 175 (100.0%) | $57,989 |
Household Income in Perry
Household Income Brackets in Perry
With 74 households falling in the category, the $50,000 to $74,999 income range is the most frequent in Perry, accounting for 25.4% of all households. In contrast, only 1 households (0.3%) fall into the $200,000+ income bracket, making it the least populous group.

| Income Bracket | # Households | % Households |
| Less than $10,000 | 14 | 4.8% |
| $10,000 to $14,999 | 17 | 5.8% |
| $15,000 to $24,999 | 32 | 11.0% |
| $25,000 to $34,999 | 32 | 11.0% |
| $35,000 to $49,999 | 61 | 21.0% |
| $50,000 to $74,999 | 74 | 25.4% |
| $75,000 to $99,999 | 38 | 13.1% |
| $100,000 to $149,999 | 13 | 4.5% |
| $150,000 to $199,999 | 9 | 3.1% |
| $200,000+ | 1 | 0.3% |
Household Income by Householder Age in Perry
The median household income in Perry is $47,981, with the highest median household income of $49,688 found in the 45 to 64 years age bracket for the primary householder. A total of 157 households (53.9%) fall into this category. Meanwhile, the 15 to 24 years age bracket for the primary householder has the lowest median household income of $0, with 5 households (1.7%) in this group.
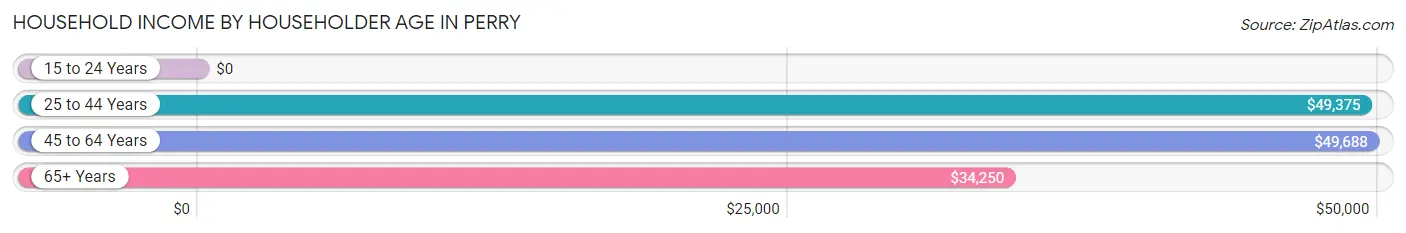
| Income Bracket | # Households | Median Income |
| 15 to 24 Years | 5 (1.7%) | $0 |
| 25 to 44 Years | 38 (13.1%) | $49,375 |
| 45 to 64 Years | 157 (53.9%) | $49,688 |
| 65+ Years | 91 (31.3%) | $34,250 |
| Total | 291 (100.0%) | $47,981 |
Poverty in Perry
Income Below Poverty by Sex and Age in Perry
With 12.9% poverty level for males and 16.4% for females among the residents of Perry, 55 to 64 year old males and 25 to 34 year old females are the most vulnerable to poverty, with 13 males (26.5%) and 35 females (59.3%) in their respective age groups living below the poverty level.
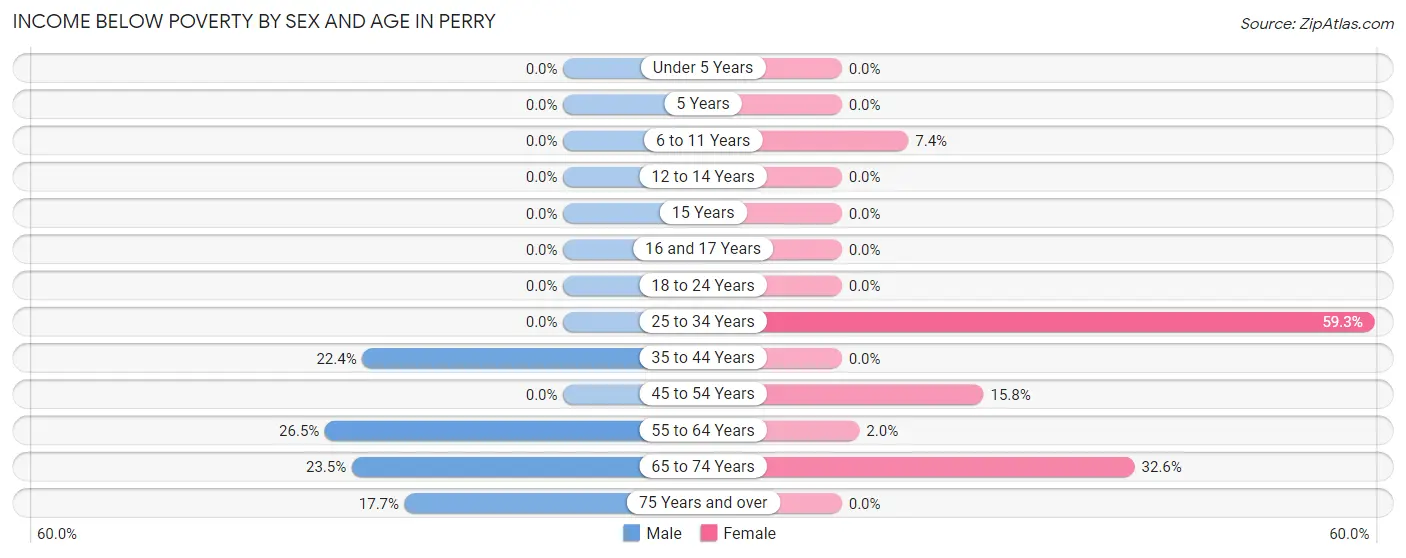
| Age Bracket | Male | Female |
| Under 5 Years | 0 (0.0%) | 0 (0.0%) |
| 5 Years | 0 (0.0%) | 0 (0.0%) |
| 6 to 11 Years | 0 (0.0%) | 2 (7.4%) |
| 12 to 14 Years | 0 (0.0%) | 0 (0.0%) |
| 15 Years | 0 (0.0%) | 0 (0.0%) |
| 16 and 17 Years | 0 (0.0%) | 0 (0.0%) |
| 18 to 24 Years | 0 (0.0%) | 0 (0.0%) |
| 25 to 34 Years | 0 (0.0%) | 35 (59.3%) |
| 35 to 44 Years | 17 (22.4%) | 0 (0.0%) |
| 45 to 54 Years | 0 (0.0%) | 6 (15.8%) |
| 55 to 64 Years | 13 (26.5%) | 2 (2.0%) |
| 65 to 74 Years | 8 (23.5%) | 15 (32.6%) |
| 75 Years and over | 6 (17.6%) | 0 (0.0%) |
| Total | 44 (12.9%) | 60 (16.4%) |
Income Above Poverty by Sex and Age in Perry
According to the poverty statistics in Perry, males aged under 5 years and females aged under 5 years are the age groups that are most secure financially, with 100.0% of males and 100.0% of females in these age groups living above the poverty line.
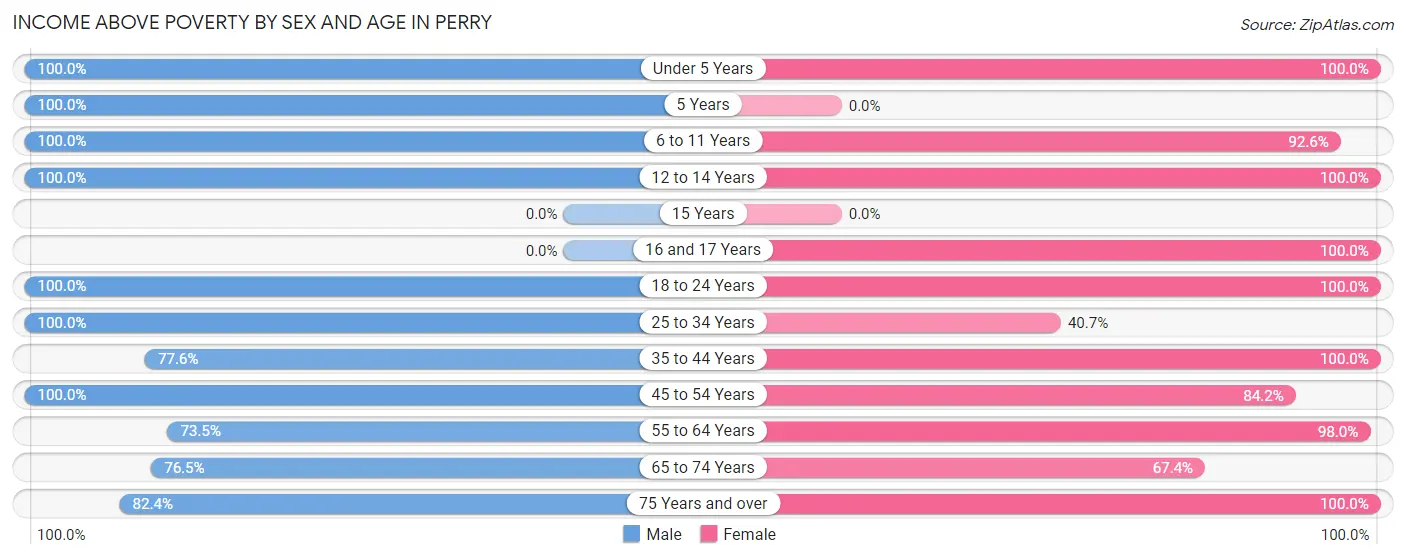
| Age Bracket | Male | Female |
| Under 5 Years | 23 (100.0%) | 23 (100.0%) |
| 5 Years | 7 (100.0%) | 0 (0.0%) |
| 6 to 11 Years | 16 (100.0%) | 25 (92.6%) |
| 12 to 14 Years | 2 (100.0%) | 10 (100.0%) |
| 15 Years | 0 (0.0%) | 0 (0.0%) |
| 16 and 17 Years | 0 (0.0%) | 2 (100.0%) |
| 18 to 24 Years | 9 (100.0%) | 16 (100.0%) |
| 25 to 34 Years | 61 (100.0%) | 24 (40.7%) |
| 35 to 44 Years | 59 (77.6%) | 13 (100.0%) |
| 45 to 54 Years | 29 (100.0%) | 32 (84.2%) |
| 55 to 64 Years | 36 (73.5%) | 100 (98.0%) |
| 65 to 74 Years | 26 (76.5%) | 31 (67.4%) |
| 75 Years and over | 28 (82.4%) | 29 (100.0%) |
| Total | 296 (87.1%) | 305 (83.6%) |
Income Below Poverty Among Married-Couple Families in Perry
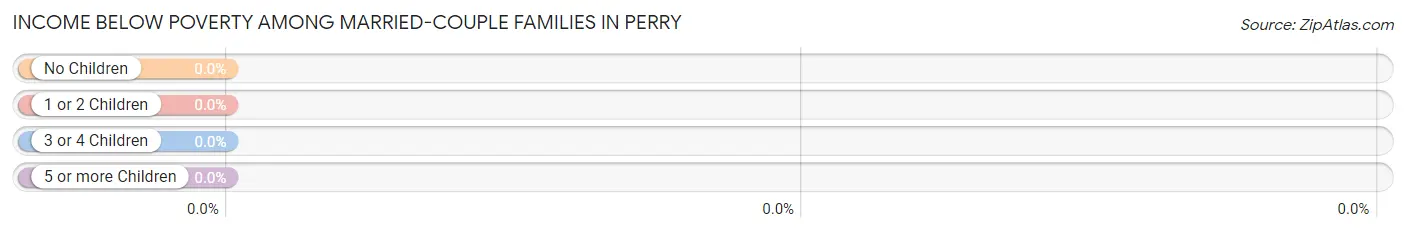
| Children | Above Poverty | Below Poverty |
| No Children | 92 (100.0%) | 0 (0.0%) |
| 1 or 2 Children | 12 (100.0%) | 0 (0.0%) |
| 3 or 4 Children | 1 (100.0%) | 0 (0.0%) |
| 5 or more Children | 12 (100.0%) | 0 (0.0%) |
| Total | 117 (100.0%) | 0 (0.0%) |
Income Below Poverty Among Single-Parent Households in Perry
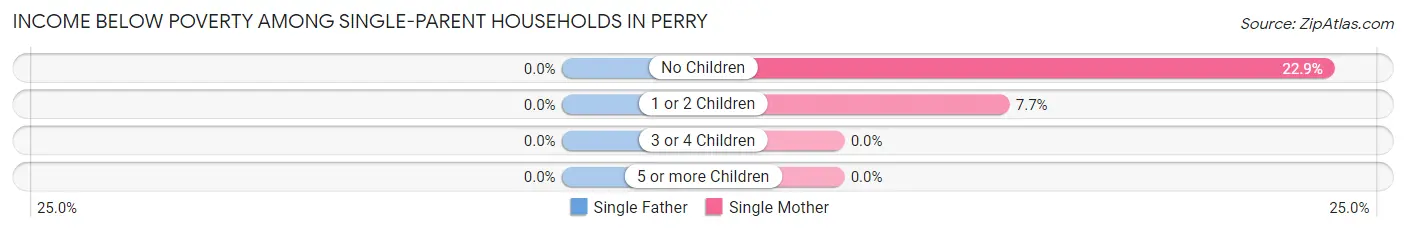
| Children | Single Father | Single Mother |
| No Children | 0 (0.0%) | 8 (22.9%) |
| 1 or 2 Children | 0 (0.0%) | 1 (7.7%) |
| 3 or 4 Children | 0 (0.0%) | 0 (0.0%) |
| 5 or more Children | 0 (0.0%) | 0 (0.0%) |
| Total | 0 (0.0%) | 9 (18.8%) |
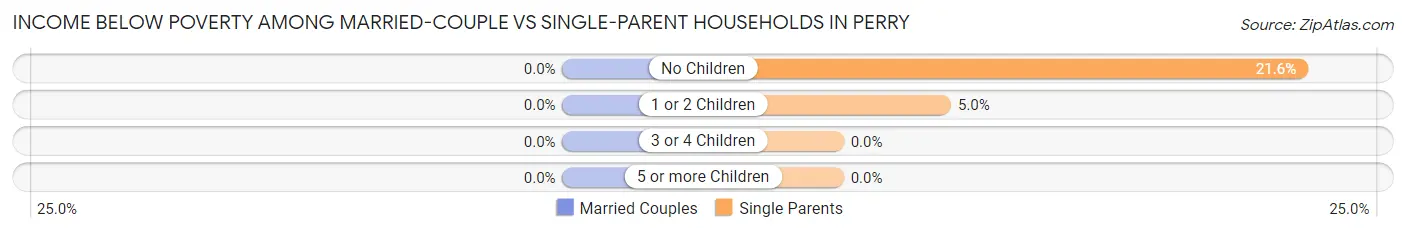
Income Below Poverty Among Married-Couple vs Single-Parent Households in Perry
| Children | Married-Couple Families | Single-Parent Households |
| No Children | 0 (0.0%) | 8 (21.6%) |
| 1 or 2 Children | 0 (0.0%) | 1 (5.0%) |
| 3 or 4 Children | 0 (0.0%) | 0 (0.0%) |
| 5 or more Children | 0 (0.0%) | 0 (0.0%) |
| Total | 0 (0.0%) | 9 (15.5%) |
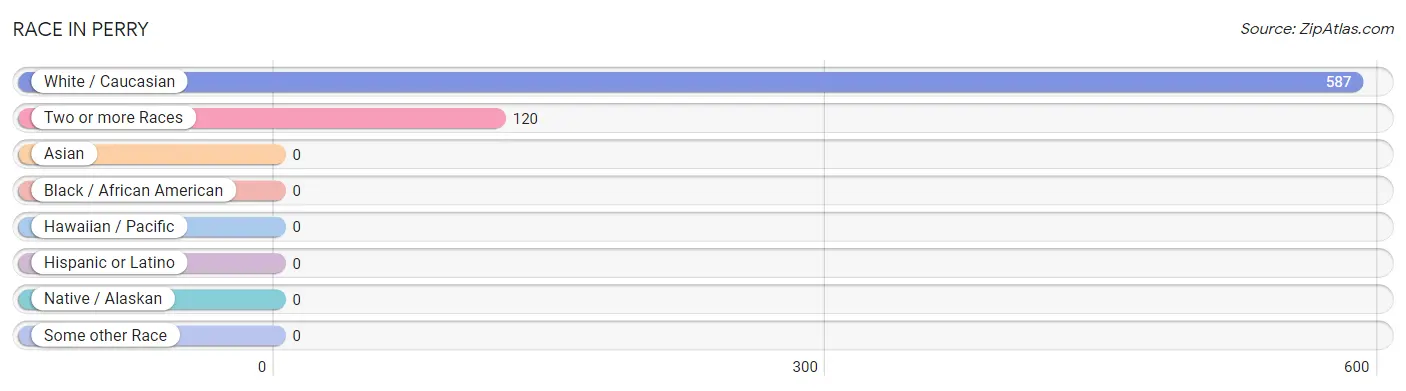
Race in Perry
The most populous races in Perry are White / Caucasian (587 | 83.0%), and Two or more Races (120 | 17.0%).
| Race | # Population | % Population |
| Asian | 0 | 0.0% |
| Black / African American | 0 | 0.0% |
| Hawaiian / Pacific | 0 | 0.0% |
| Hispanic or Latino | 0 | 0.0% |
| Native / Alaskan | 0 | 0.0% |
| White / Caucasian | 587 | 83.0% |
| Two or more Races | 120 | 17.0% |
| Some other Race | 0 | 0.0% |
| Total | 707 | 100.0% |
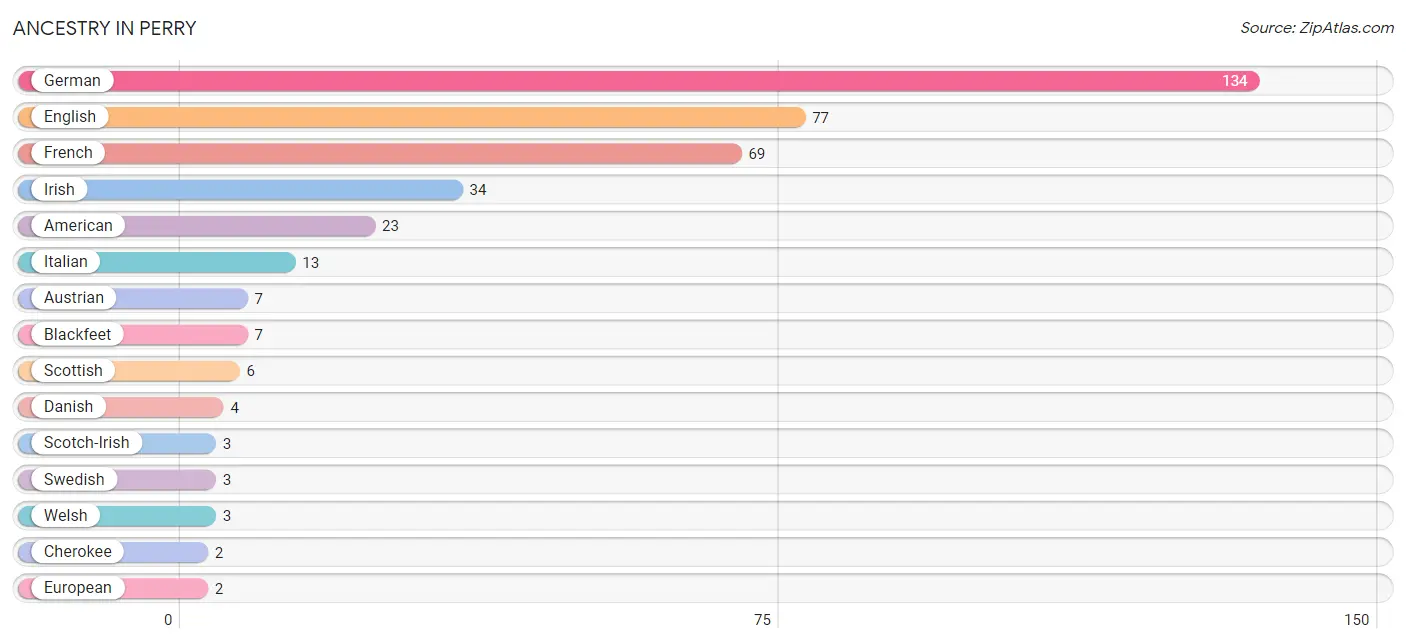
Ancestry in Perry
The most populous ancestries reported in Perry are German (134 | 19.0%), English (77 | 10.9%), French (69 | 9.8%), Irish (34 | 4.8%), and American (23 | 3.3%), together accounting for 47.7% of all Perry residents.
| Ancestry | # Population | % Population |
| American | 23 | 3.3% |
| Austrian | 7 | 1.0% |
| Blackfeet | 7 | 1.0% |
| Cherokee | 2 | 0.3% |
| Danish | 4 | 0.6% |
| English | 77 | 10.9% |
| European | 2 | 0.3% |
| French | 69 | 9.8% |
| German | 134 | 19.0% |
| Irish | 34 | 4.8% |
| Italian | 13 | 1.8% |
| Norwegian | 1 | 0.1% |
| Scotch-Irish | 3 | 0.4% |
| Scottish | 6 | 0.9% |
| Swedish | 3 | 0.4% |
| Welsh | 3 | 0.4% | View All 16 Rows |
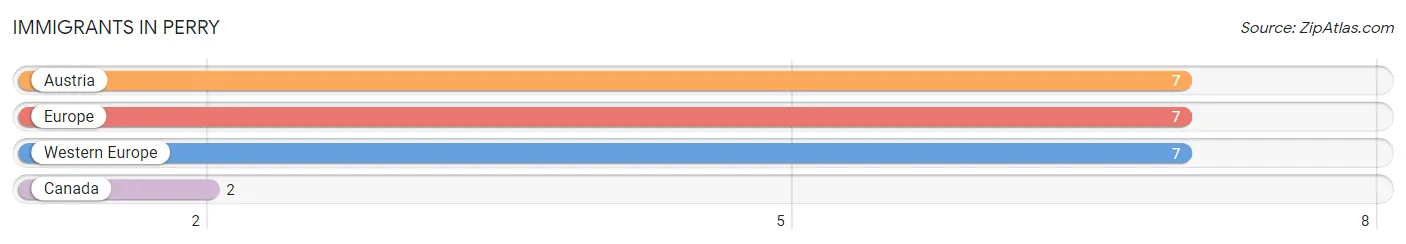
Immigrants in Perry
The most numerous immigrant groups reported in Perry came from Austria (7 | 1.0%), Europe (7 | 1.0%), Western Europe (7 | 1.0%), and Canada (2 | 0.3%), together accounting for 3.3% of all Perry residents.
| Immigration Origin | # Population | % Population |
| Austria | 7 | 1.0% |
| Canada | 2 | 0.3% |
| Europe | 7 | 1.0% |
| Western Europe | 7 | 1.0% | View All 4 Rows |
Sex and Age in Perry
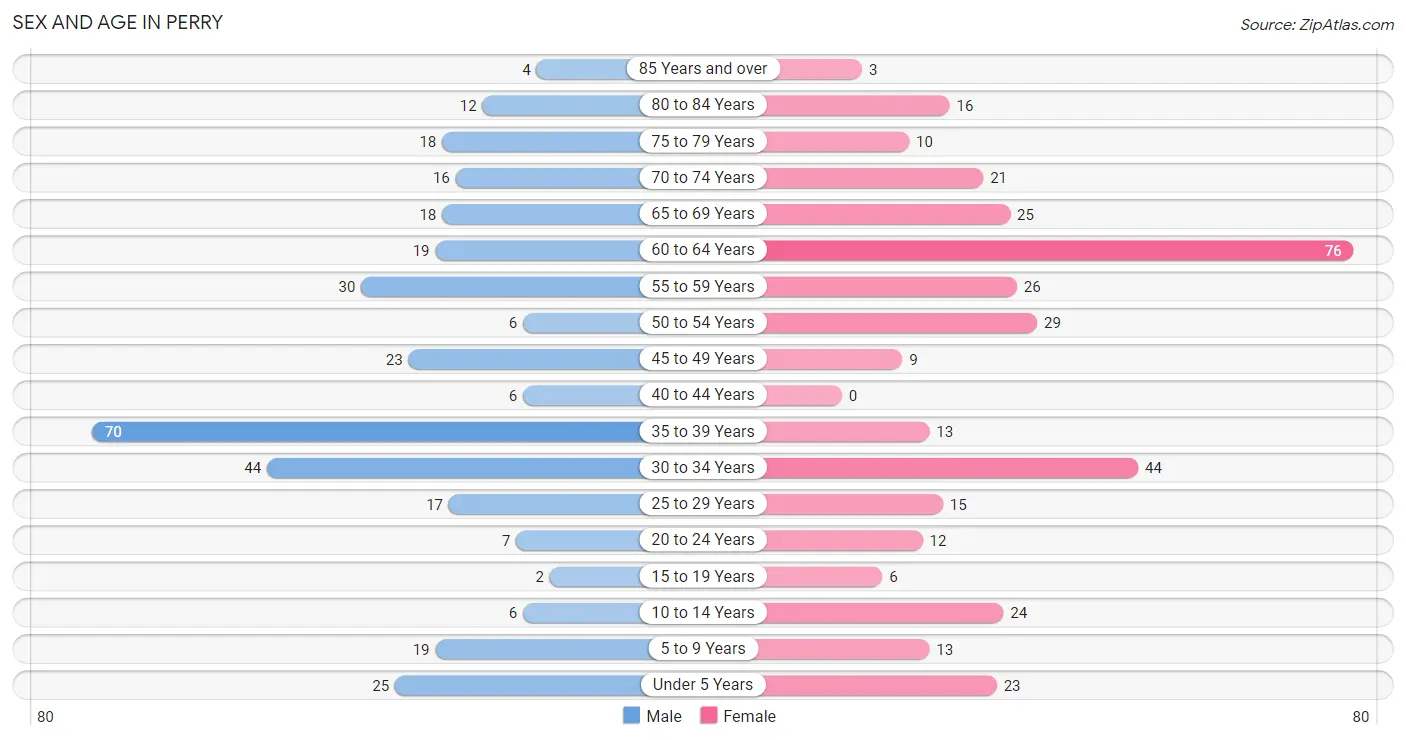
Sex and Age in Perry
The most populous age groups in Perry are 35 to 39 Years (70 | 20.5%) for men and 60 to 64 Years (76 | 20.8%) for women.
| Age Bracket | Male | Female |
| Under 5 Years | 25 (7.3%) | 23 (6.3%) |
| 5 to 9 Years | 19 (5.6%) | 13 (3.6%) |
| 10 to 14 Years | 6 (1.8%) | 24 (6.6%) |
| 15 to 19 Years | 2 (0.6%) | 6 (1.6%) |
| 20 to 24 Years | 7 (2.1%) | 12 (3.3%) |
| 25 to 29 Years | 17 (5.0%) | 15 (4.1%) |
| 30 to 34 Years | 44 (12.9%) | 44 (12.0%) |
| 35 to 39 Years | 70 (20.5%) | 13 (3.6%) |
| 40 to 44 Years | 6 (1.8%) | 0 (0.0%) |
| 45 to 49 Years | 23 (6.7%) | 9 (2.5%) |
| 50 to 54 Years | 6 (1.8%) | 29 (8.0%) |
| 55 to 59 Years | 30 (8.8%) | 26 (7.1%) |
| 60 to 64 Years | 19 (5.6%) | 76 (20.8%) |
| 65 to 69 Years | 18 (5.3%) | 25 (6.9%) |
| 70 to 74 Years | 16 (4.7%) | 21 (5.8%) |
| 75 to 79 Years | 18 (5.3%) | 10 (2.7%) |
| 80 to 84 Years | 12 (3.5%) | 16 (4.4%) |
| 85 Years and over | 4 (1.2%) | 3 (0.8%) |
| Total | 342 (100.0%) | 365 (100.0%) |
Families and Households in Perry
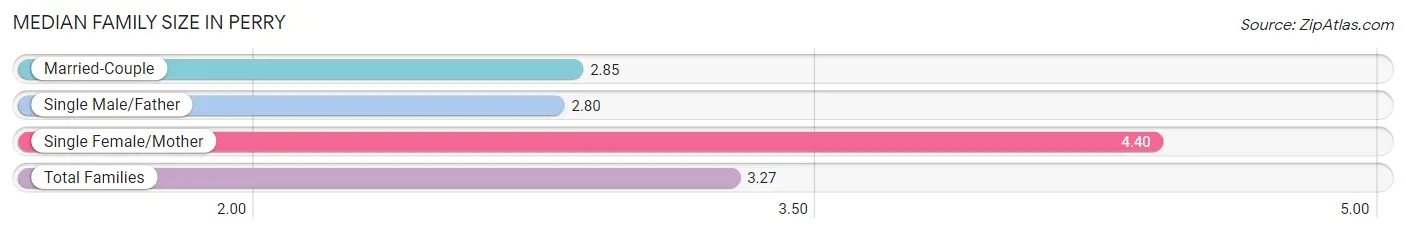
Median Family Size in Perry
The median family size in Perry is 3.27 persons per family, with single female/mother families (48 | 27.4%) accounting for the largest median family size of 4.4 persons per family. On the other hand, single male/father families (10 | 5.7%) represent the smallest median family size with 2.80 persons per family.
| Family Type | # Families | Family Size |
| Married-Couple | 117 (66.9%) | 2.85 |
| Single Male/Father | 10 (5.7%) | 2.80 |
| Single Female/Mother | 48 (27.4%) | 4.40 |
| Total Families | 175 (100.0%) | 3.27 |
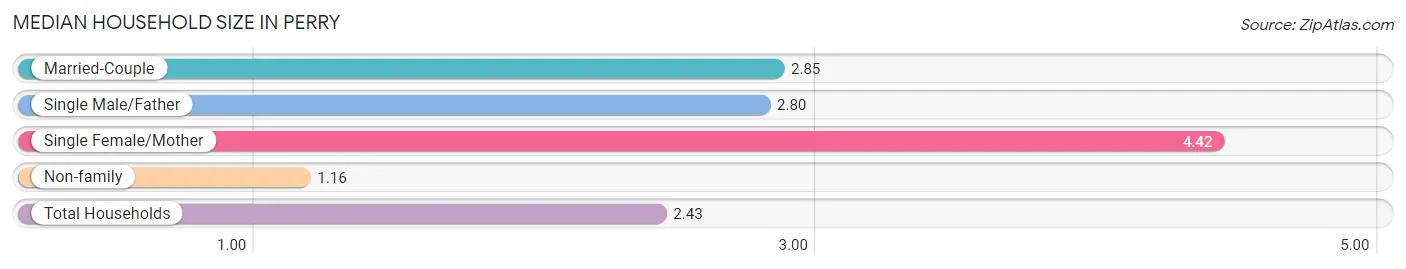
Median Household Size in Perry
The median household size in Perry is 2.43 persons per household, with single female/mother households (48 | 16.5%) accounting for the largest median household size of 4.42 persons per household. non-family households (116 | 39.9%) represent the smallest median household size with 1.16 persons per household.
| Household Type | # Households | Household Size |
| Married-Couple | 117 (40.2%) | 2.85 |
| Single Male/Father | 10 (3.4%) | 2.80 |
| Single Female/Mother | 48 (16.5%) | 4.42 |
| Non-family | 116 (39.9%) | 1.16 |
| Total Households | 291 (100.0%) | 2.43 |
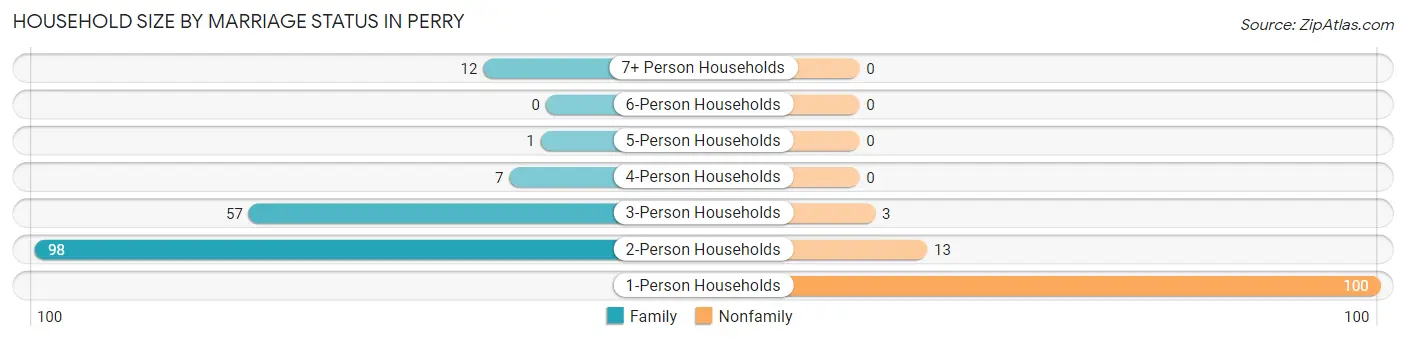
Household Size by Marriage Status in Perry
Out of a total of 291 households in Perry, 175 (60.1%) are family households, while 116 (39.9%) are nonfamily households. The most numerous type of family households are 2-person households, comprising 98, and the most common type of nonfamily households are 1-person households, comprising 100.
| Household Size | Family Households | Nonfamily Households |
| 1-Person Households | - | 100 (34.4%) |
| 2-Person Households | 98 (33.7%) | 13 (4.5%) |
| 3-Person Households | 57 (19.6%) | 3 (1.0%) |
| 4-Person Households | 7 (2.4%) | 0 (0.0%) |
| 5-Person Households | 1 (0.3%) | 0 (0.0%) |
| 6-Person Households | 0 (0.0%) | 0 (0.0%) |
| 7+ Person Households | 12 (4.1%) | 0 (0.0%) |
| Total | 175 (60.1%) | 116 (39.9%) |
Female Fertility in Perry
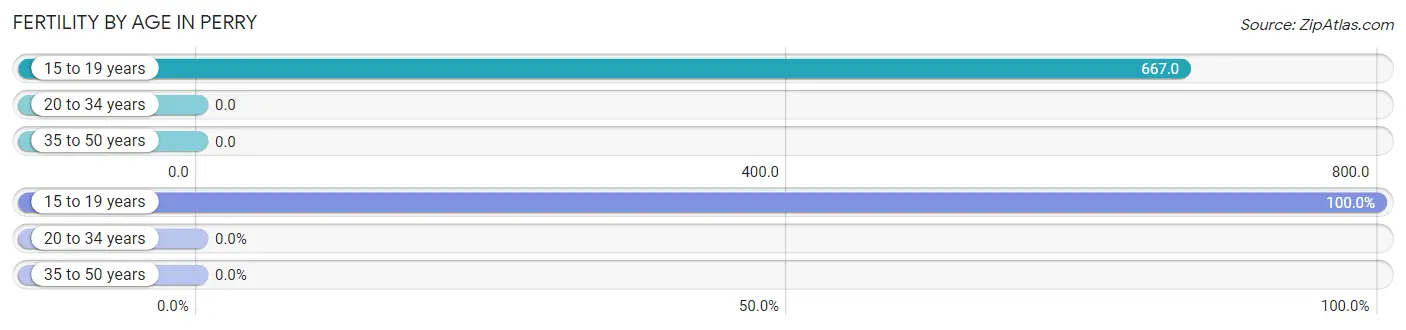
Fertility by Age in Perry
Average fertility rate in Perry is 36.0 births per 1,000 women. Women in the age bracket of 15 to 19 years have the highest fertility rate with 667.0 births per 1,000 women. Women in the age bracket of 15 to 19 years acount for 100.0% of all women with births.
| Age Bracket | Women with Births | Births / 1,000 Women |
| 15 to 19 years | 4 (100.0%) | 667.0 |
| 20 to 34 years | 0 (0.0%) | 0.0 |
| 35 to 50 years | 0 (0.0%) | 0.0 |
| Total | 4 (100.0%) | 36.0 |
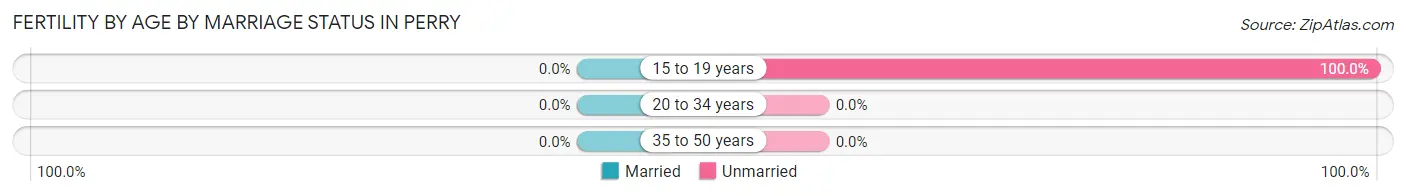
Fertility by Age by Marriage Status in Perry
| Age Bracket | Married | Unmarried |
| 15 to 19 years | 0 (0.0%) | 4 (100.0%) |
| 20 to 34 years | 0 (0.0%) | 0 (0.0%) |
| 35 to 50 years | 0 (0.0%) | 0 (0.0%) |
| Total | 0 (0.0%) | 4 (100.0%) |
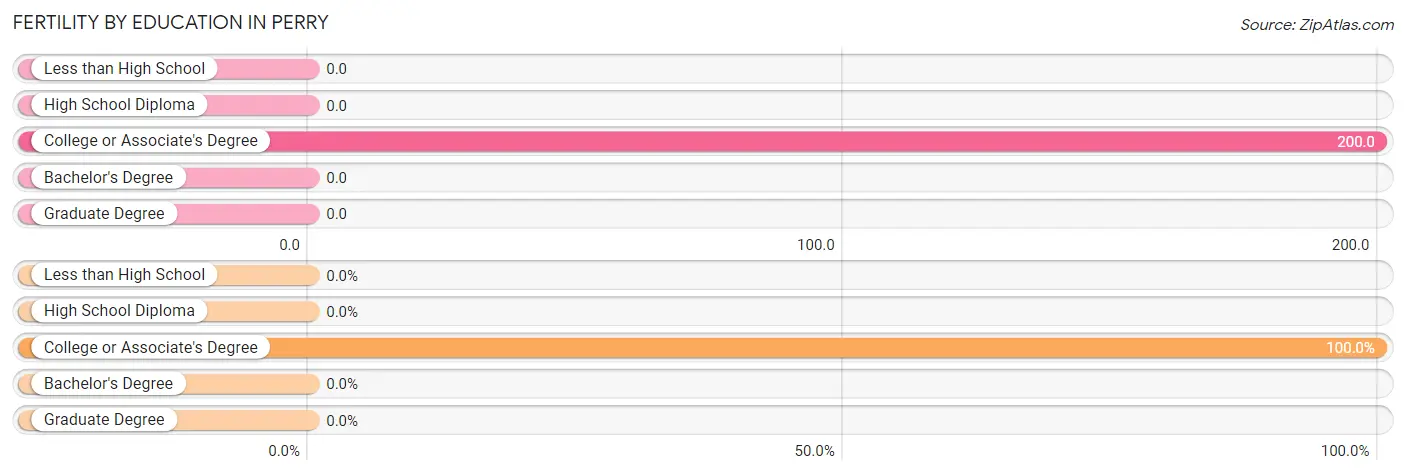
Fertility by Education in Perry
| Educational Attainment | Women with Births | Births / 1,000 Women |
| Less than High School | 0 (0.0%) | 0.0 |
| High School Diploma | 0 (0.0%) | 0.0 |
| College or Associate's Degree | 4 (100.0%) | 200.0 |
| Bachelor's Degree | 0 (0.0%) | 0.0 |
| Graduate Degree | 0 (0.0%) | 0.0 |
| Total | 4 (100.0%) | 36.0 |
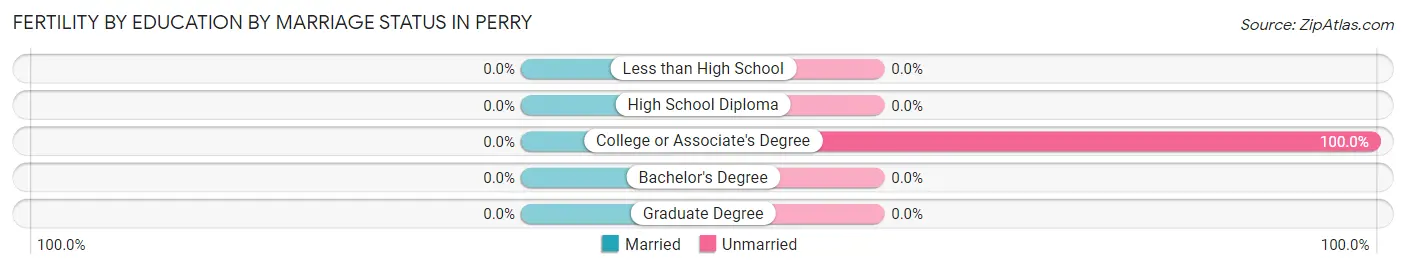
Fertility by Education by Marriage Status in Perry
| Educational Attainment | Married | Unmarried |
| Less than High School | 0 (0.0%) | 0 (0.0%) |
| High School Diploma | 0 (0.0%) | 0 (0.0%) |
| College or Associate's Degree | 0 (0.0%) | 4 (100.0%) |
| Bachelor's Degree | 0 (0.0%) | 0 (0.0%) |
| Graduate Degree | 0 (0.0%) | 0 (0.0%) |
| Total | 0 (0.0%) | 4 (100.0%) |
Employment Characteristics in Perry
Employment by Class of Employer in Perry
Among the 241 employed individuals in Perry, private company employees (152 | 63.1%), not-for-profit organizations (28 | 11.6%), and self-employed (not incorporated) (22 | 9.1%) make up the most common classes of employment.
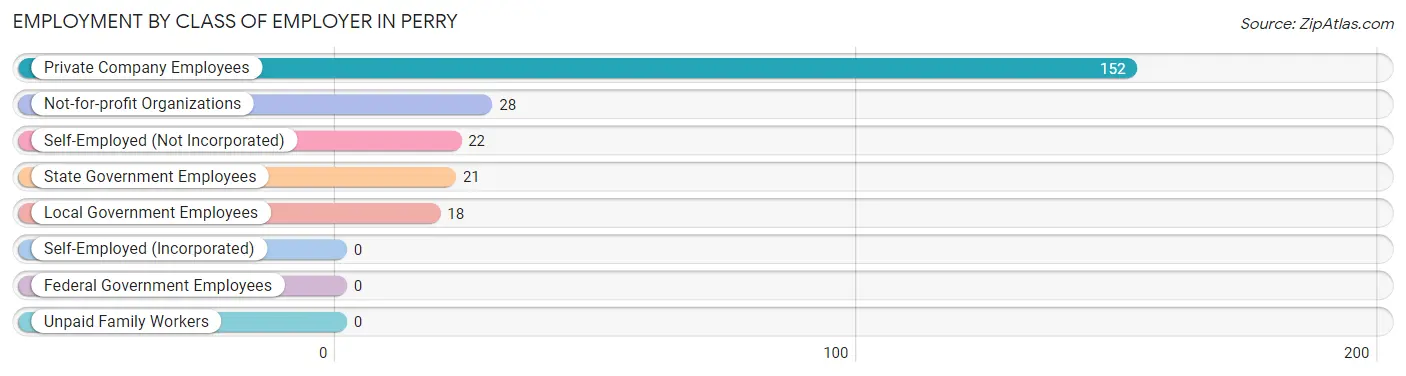
| Employer Class | # Employees | % Employees |
| Private Company Employees | 152 | 63.1% |
| Self-Employed (Incorporated) | 0 | 0.0% |
| Self-Employed (Not Incorporated) | 22 | 9.1% |
| Not-for-profit Organizations | 28 | 11.6% |
| Local Government Employees | 18 | 7.5% |
| State Government Employees | 21 | 8.7% |
| Federal Government Employees | 0 | 0.0% |
| Unpaid Family Workers | 0 | 0.0% |
| Total | 241 | 100.0% |
Employment Status by Age in Perry
According to the labor force statistics for Perry, out of the total population over 16 years of age (597), 42.7% or 255 individuals are in the labor force, with 1.2% or 3 of them unemployed. The age group with the highest labor force participation rate is 16 to 19 years, with 100.0% or 8 individuals in the labor force. Within the labor force, the 25 to 29 years age range has the highest percentage of unemployed individuals, with 10.3% or 3 of them being unemployed.
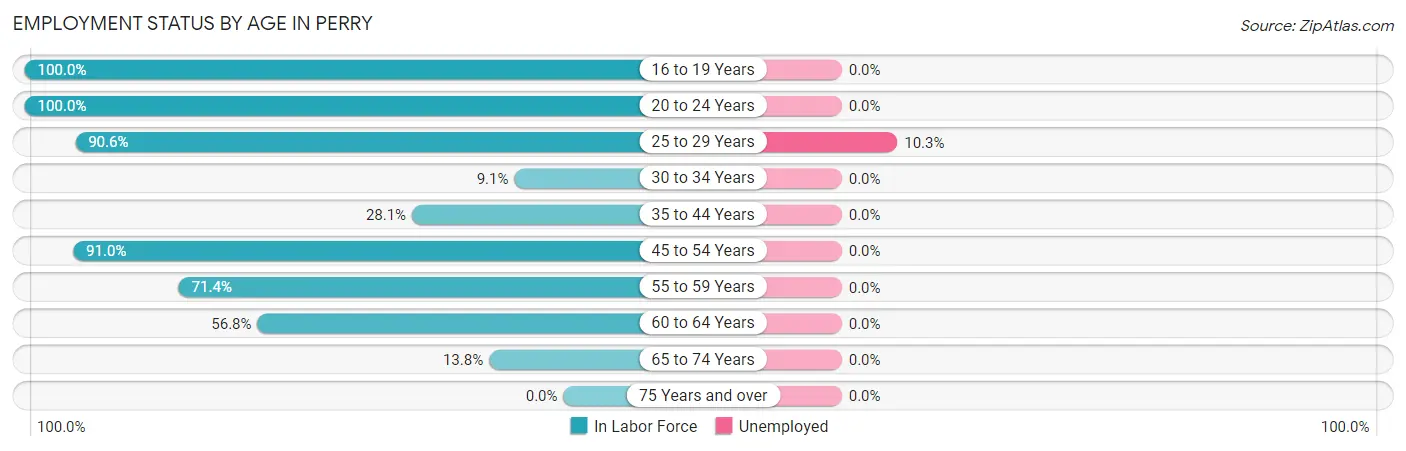
| Age Bracket | In Labor Force | Unemployed |
| 16 to 19 Years | 8 (100.0%) | 0 (0.0%) |
| 20 to 24 Years | 19 (100.0%) | 0 (0.0%) |
| 25 to 29 Years | 29 (90.6%) | 3 (10.3%) |
| 30 to 34 Years | 8 (9.1%) | 0 (0.0%) |
| 35 to 44 Years | 25 (28.1%) | 0 (0.0%) |
| 45 to 54 Years | 61 (91.0%) | 0 (0.0%) |
| 55 to 59 Years | 40 (71.4%) | 0 (0.0%) |
| 60 to 64 Years | 54 (56.8%) | 0 (0.0%) |
| 65 to 74 Years | 11 (13.8%) | 0 (0.0%) |
| 75 Years and over | 0 (0.0%) | 0 (0.0%) |
| Total | 255 (42.7%) | 3 (1.2%) |
Employment Status by Educational Attainment in Perry
According to labor force statistics for Perry, 50.8% of individuals (217) out of the total population between 25 and 64 years of age (427) are in the labor force, with 1.4% or 3 of them being unemployed. The group with the highest labor force participation rate are those with the educational attainment of college / associate degree, with 64.2% or 68 individuals in the labor force. Within the labor force, individuals with high school diploma education have the highest percentage of unemployment, with 2.7% or 3 of them being unemployed.
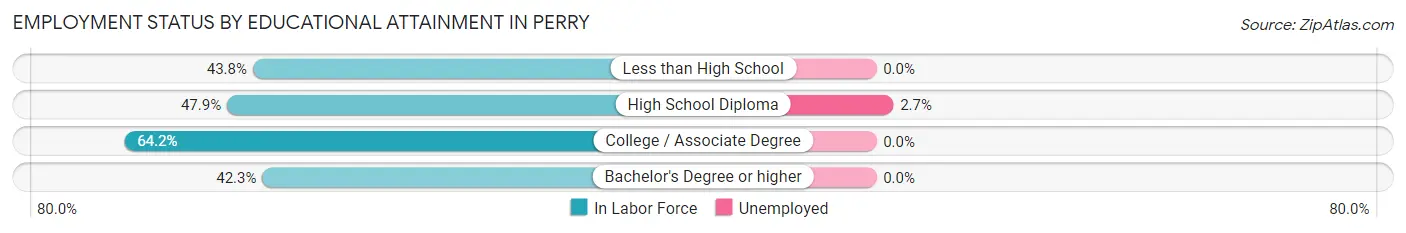
| Educational Attainment | In Labor Force | Unemployed |
| Less than High School | 7 (43.8%) | 0 (0.0%) |
| High School Diploma | 112 (47.9%) | 6 (2.7%) |
| College / Associate Degree | 68 (64.2%) | 0 (0.0%) |
| Bachelor's Degree or higher | 30 (42.3%) | 0 (0.0%) |
| Total | 217 (50.8%) | 6 (1.4%) |
Employment Occupations by Sex in Perry
Management, Business, Science and Arts Occupations
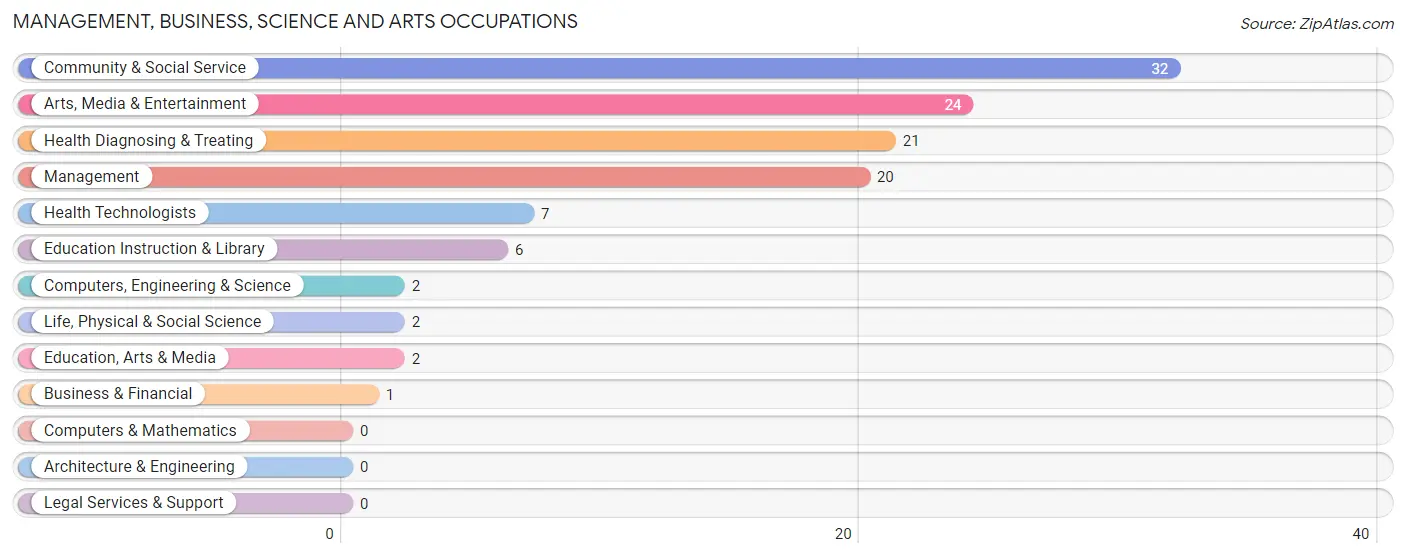
The most common Management, Business, Science and Arts occupations in Perry are Community & Social Service (32 | 12.7%), Arts, Media & Entertainment (24 | 9.5%), Health Diagnosing & Treating (21 | 8.3%), Management (20 | 7.9%), and Health Technologists (7 | 2.8%).
Management, Business, Science and Arts Occupations by Sex
Within the Management, Business, Science and Arts occupations in Perry, the most male-oriented occupations are Business & Financial (100.0%), Computers, Engineering & Science (100.0%), and Life, Physical & Social Science (100.0%), while the most female-oriented occupations are Education, Arts & Media (100.0%), Education Instruction & Library (100.0%), and Health Technologists (100.0%).
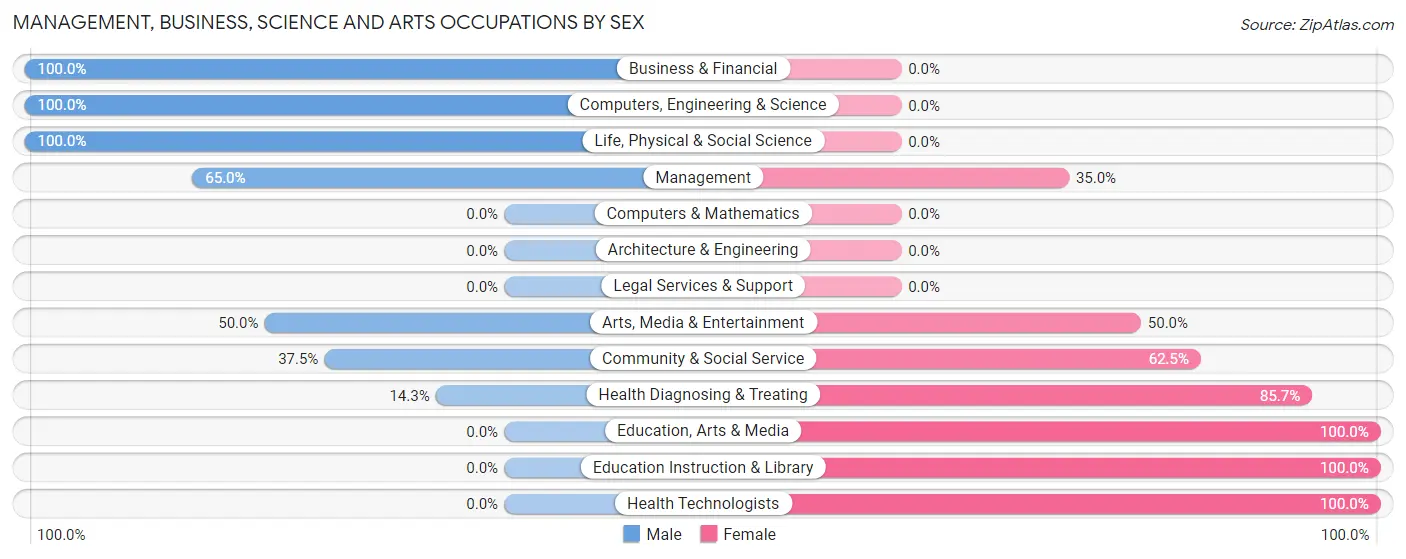
| Occupation | Male | Female |
| Management | 13 (65.0%) | 7 (35.0%) |
| Business & Financial | 1 (100.0%) | 0 (0.0%) |
| Computers, Engineering & Science | 2 (100.0%) | 0 (0.0%) |
| Computers & Mathematics | 0 (0.0%) | 0 (0.0%) |
| Architecture & Engineering | 0 (0.0%) | 0 (0.0%) |
| Life, Physical & Social Science | 2 (100.0%) | 0 (0.0%) |
| Community & Social Service | 12 (37.5%) | 20 (62.5%) |
| Education, Arts & Media | 0 (0.0%) | 2 (100.0%) |
| Legal Services & Support | 0 (0.0%) | 0 (0.0%) |
| Education Instruction & Library | 0 (0.0%) | 6 (100.0%) |
| Arts, Media & Entertainment | 12 (50.0%) | 12 (50.0%) |
| Health Diagnosing & Treating | 3 (14.3%) | 18 (85.7%) |
| Health Technologists | 0 (0.0%) | 7 (100.0%) |
| Total (Category) | 31 (40.8%) | 45 (59.2%) |
| Total (Overall) | 102 (40.5%) | 150 (59.5%) |
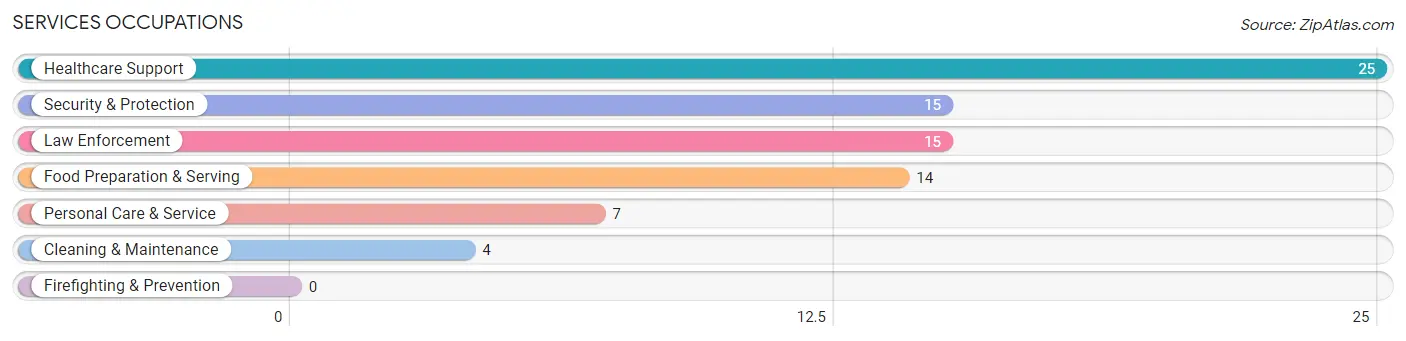
Services Occupations
The most common Services occupations in Perry are Healthcare Support (25 | 9.9%), Security & Protection (15 | 5.9%), Law Enforcement (15 | 5.9%), Food Preparation & Serving (14 | 5.6%), and Personal Care & Service (7 | 2.8%).
Services Occupations by Sex
Within the Services occupations in Perry, the most male-oriented occupations are Personal Care & Service (57.1%), Security & Protection (20.0%), and Law Enforcement (20.0%), while the most female-oriented occupations are Healthcare Support (100.0%), Food Preparation & Serving (100.0%), and Cleaning & Maintenance (100.0%).
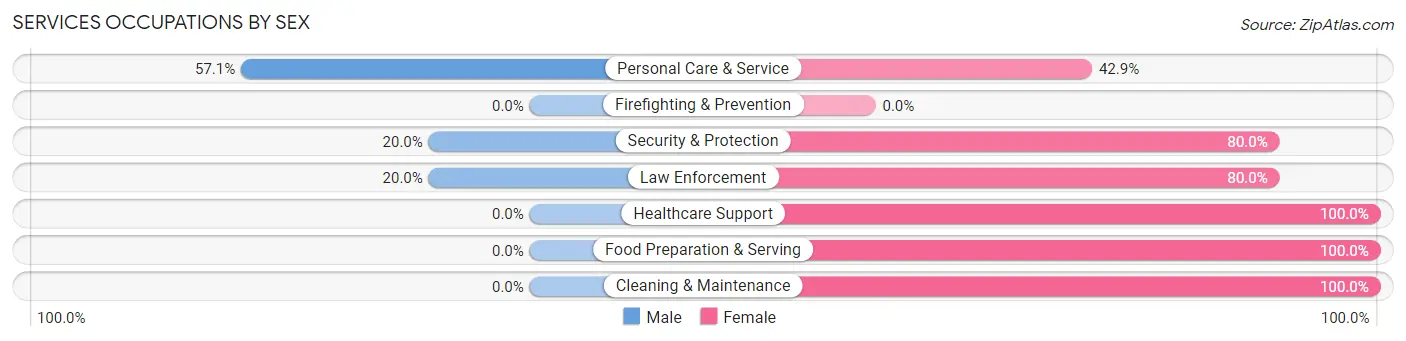
| Occupation | Male | Female |
| Healthcare Support | 0 (0.0%) | 25 (100.0%) |
| Security & Protection | 3 (20.0%) | 12 (80.0%) |
| Firefighting & Prevention | 0 (0.0%) | 0 (0.0%) |
| Law Enforcement | 3 (20.0%) | 12 (80.0%) |
| Food Preparation & Serving | 0 (0.0%) | 14 (100.0%) |
| Cleaning & Maintenance | 0 (0.0%) | 4 (100.0%) |
| Personal Care & Service | 4 (57.1%) | 3 (42.9%) |
| Total (Category) | 7 (10.8%) | 58 (89.2%) |
| Total (Overall) | 102 (40.5%) | 150 (59.5%) |
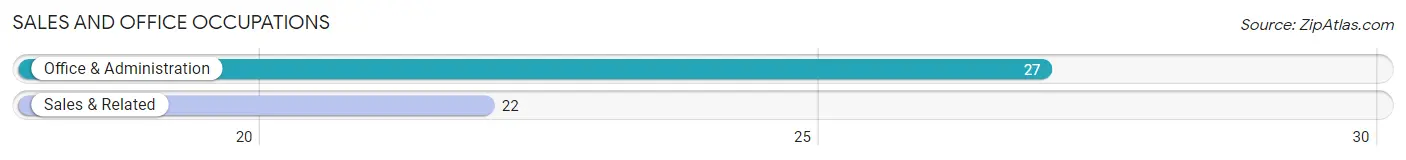
Sales and Office Occupations
The most common Sales and Office occupations in Perry are Office & Administration (27 | 10.7%), and Sales & Related (22 | 8.7%).
Sales and Office Occupations by Sex
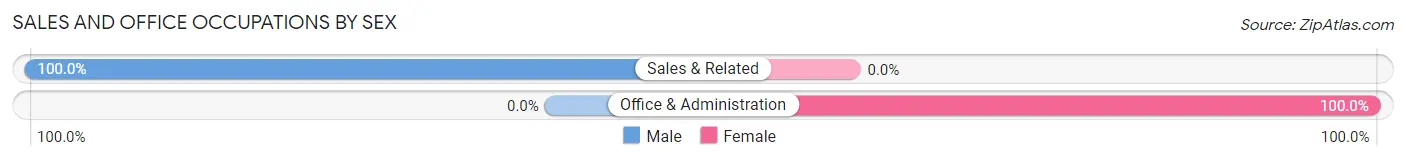
| Occupation | Male | Female |
| Sales & Related | 22 (100.0%) | 0 (0.0%) |
| Office & Administration | 0 (0.0%) | 27 (100.0%) |
| Total (Category) | 22 (44.9%) | 27 (55.1%) |
| Total (Overall) | 102 (40.5%) | 150 (59.5%) |
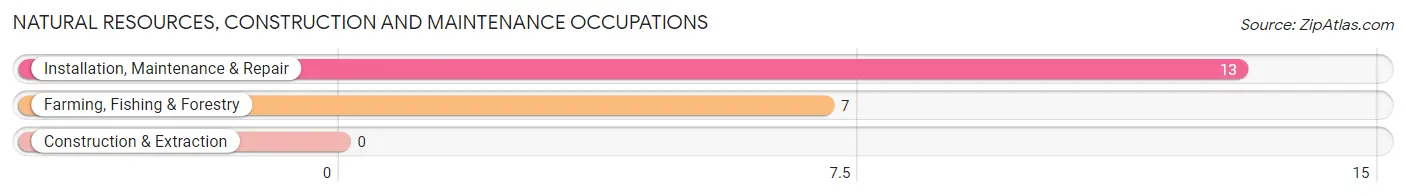
Natural Resources, Construction and Maintenance Occupations
The most common Natural Resources, Construction and Maintenance occupations in Perry are Installation, Maintenance & Repair (13 | 5.2%), and Farming, Fishing & Forestry (7 | 2.8%).
Natural Resources, Construction and Maintenance Occupations by Sex
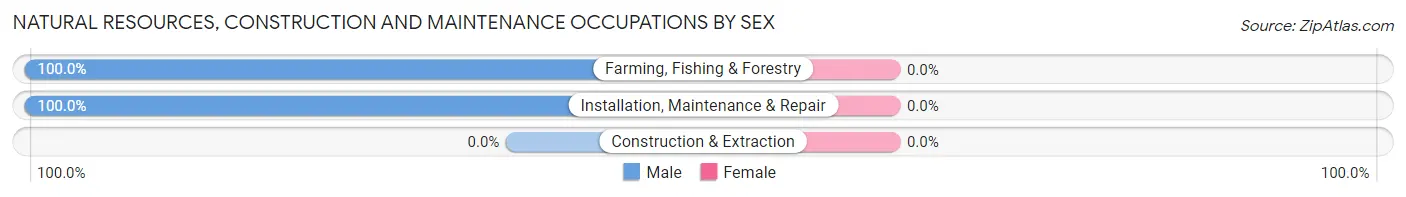
| Occupation | Male | Female |
| Farming, Fishing & Forestry | 7 (100.0%) | 0 (0.0%) |
| Construction & Extraction | 0 (0.0%) | 0 (0.0%) |
| Installation, Maintenance & Repair | 13 (100.0%) | 0 (0.0%) |
| Total (Category) | 20 (100.0%) | 0 (0.0%) |
| Total (Overall) | 102 (40.5%) | 150 (59.5%) |
Production, Transportation and Moving Occupations
The most common Production, Transportation and Moving occupations in Perry are Production (20 | 7.9%), Material Moving (18 | 7.1%), and Transportation (4 | 1.6%).
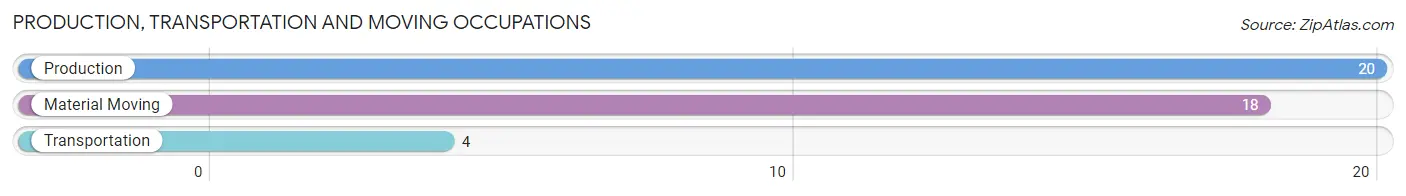
Production, Transportation and Moving Occupations by Sex
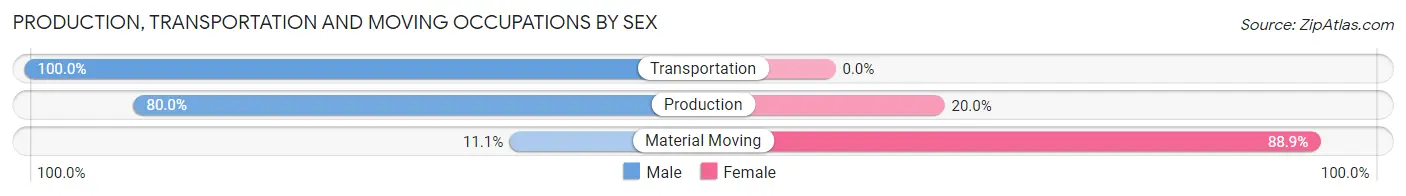
| Occupation | Male | Female |
| Production | 16 (80.0%) | 4 (20.0%) |
| Transportation | 4 (100.0%) | 0 (0.0%) |
| Material Moving | 2 (11.1%) | 16 (88.9%) |
| Total (Category) | 22 (52.4%) | 20 (47.6%) |
| Total (Overall) | 102 (40.5%) | 150 (59.5%) |
Employment Industries by Sex in Perry
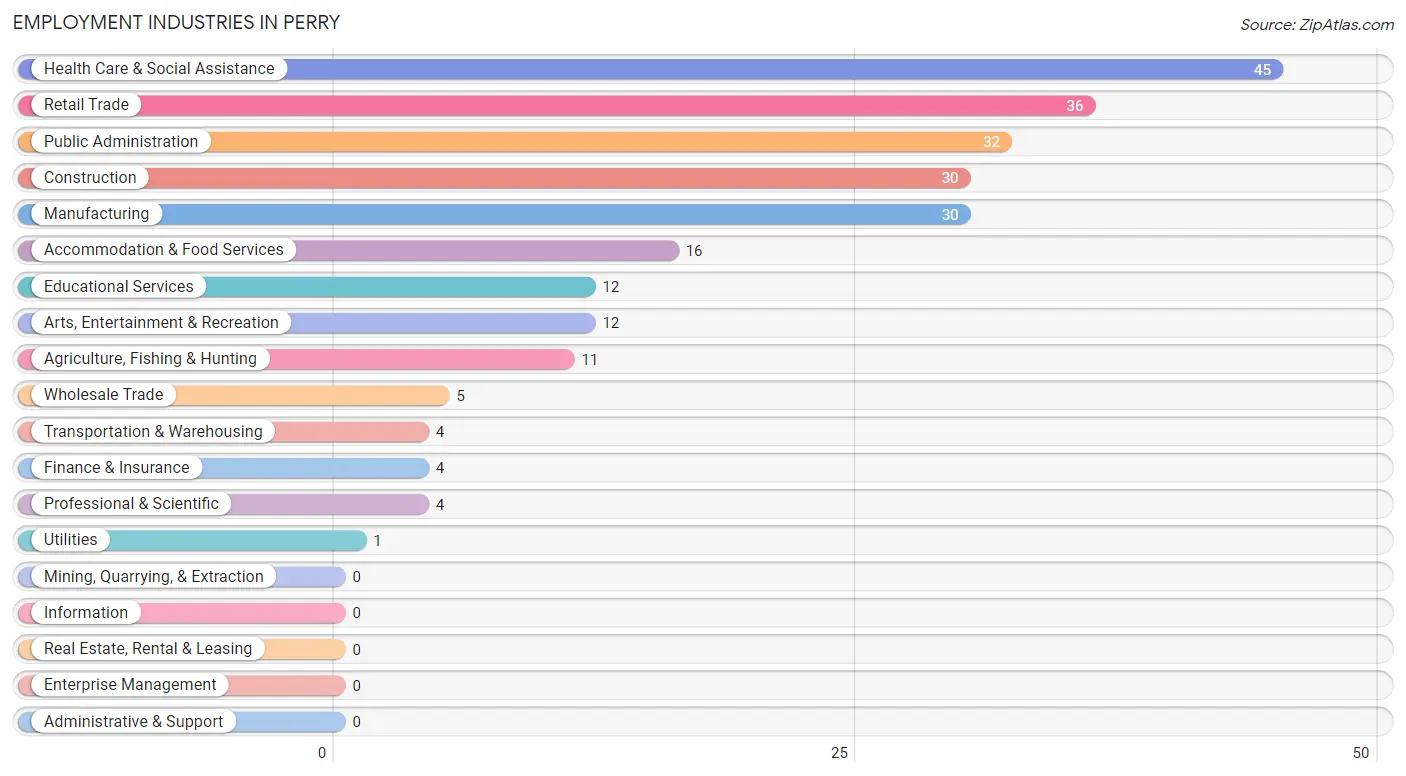
Employment Industries in Perry
The major employment industries in Perry include Health Care & Social Assistance (45 | 17.9%), Retail Trade (36 | 14.3%), Public Administration (32 | 12.7%), Construction (30 | 11.9%), and Manufacturing (30 | 11.9%).
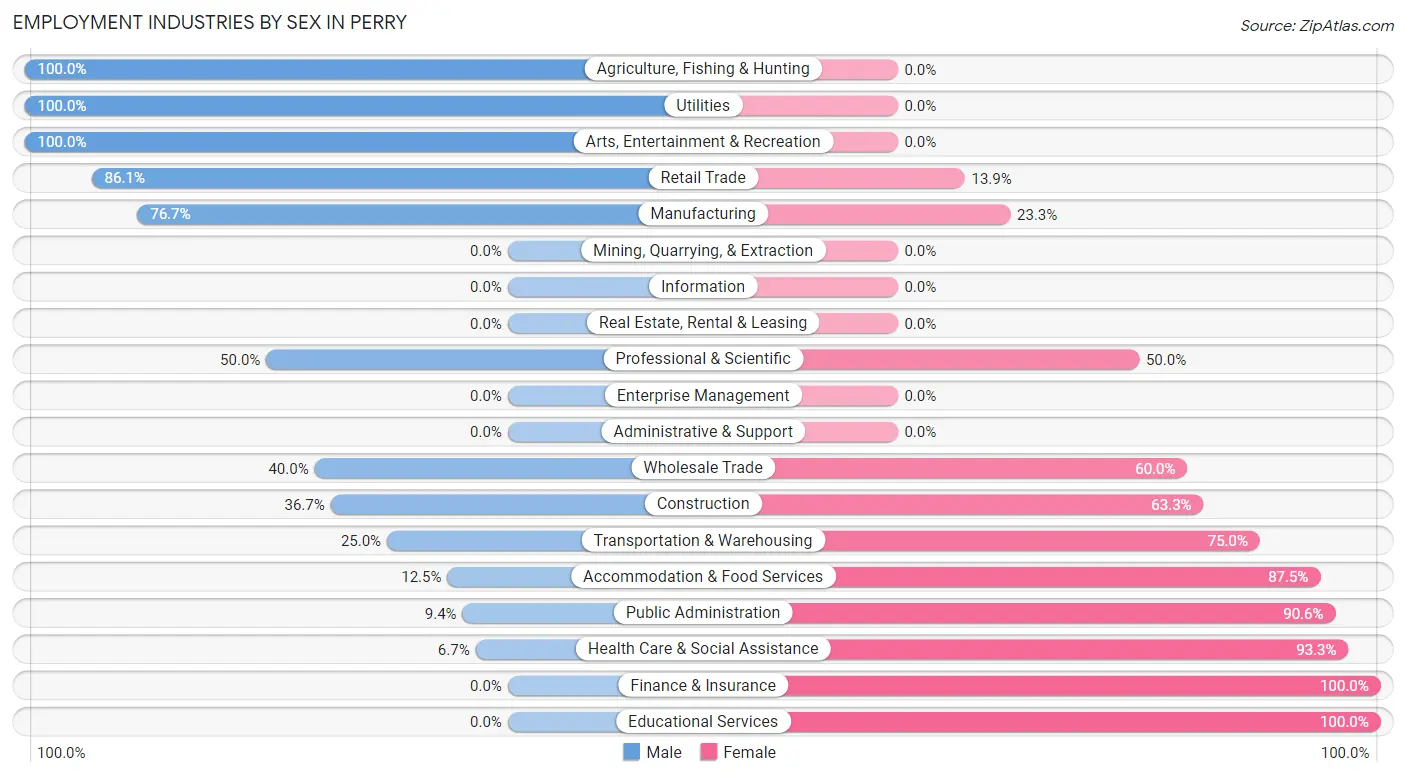
Employment Industries by Sex in Perry
The Perry industries that see more men than women are Agriculture, Fishing & Hunting (100.0%), Utilities (100.0%), and Arts, Entertainment & Recreation (100.0%), whereas the industries that tend to have a higher number of women are Finance & Insurance (100.0%), Educational Services (100.0%), and Health Care & Social Assistance (93.3%).
| Industry | Male | Female |
| Agriculture, Fishing & Hunting | 11 (100.0%) | 0 (0.0%) |
| Mining, Quarrying, & Extraction | 0 (0.0%) | 0 (0.0%) |
| Construction | 11 (36.7%) | 19 (63.3%) |
| Manufacturing | 23 (76.7%) | 7 (23.3%) |
| Wholesale Trade | 2 (40.0%) | 3 (60.0%) |
| Retail Trade | 31 (86.1%) | 5 (13.9%) |
| Transportation & Warehousing | 1 (25.0%) | 3 (75.0%) |
| Utilities | 1 (100.0%) | 0 (0.0%) |
| Information | 0 (0.0%) | 0 (0.0%) |
| Finance & Insurance | 0 (0.0%) | 4 (100.0%) |
| Real Estate, Rental & Leasing | 0 (0.0%) | 0 (0.0%) |
| Professional & Scientific | 2 (50.0%) | 2 (50.0%) |
| Enterprise Management | 0 (0.0%) | 0 (0.0%) |
| Administrative & Support | 0 (0.0%) | 0 (0.0%) |
| Educational Services | 0 (0.0%) | 12 (100.0%) |
| Health Care & Social Assistance | 3 (6.7%) | 42 (93.3%) |
| Arts, Entertainment & Recreation | 12 (100.0%) | 0 (0.0%) |
| Accommodation & Food Services | 2 (12.5%) | 14 (87.5%) |
| Public Administration | 3 (9.4%) | 29 (90.6%) |
| Total | 102 (40.5%) | 150 (59.5%) |
Education in Perry
School Enrollment in Perry
The most common levels of schooling among the 96 students in Perry are elementary school (33 | 34.4%), college / undergraduate (25 | 26.0%), and middle school (18 | 18.8%).
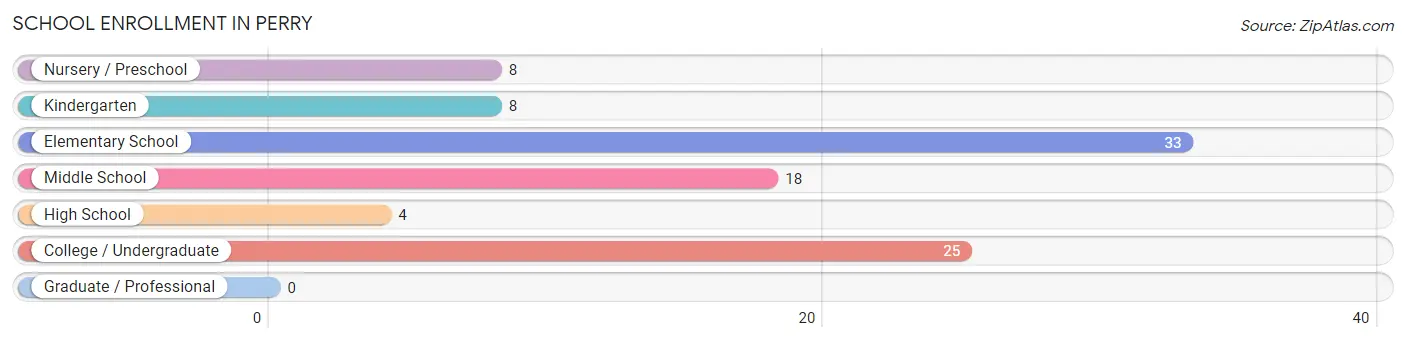
| School Level | # Students | % Students |
| Nursery / Preschool | 8 | 8.3% |
| Kindergarten | 8 | 8.3% |
| Elementary School | 33 | 34.4% |
| Middle School | 18 | 18.8% |
| High School | 4 | 4.2% |
| College / Undergraduate | 25 | 26.0% |
| Graduate / Professional | 0 | 0.0% |
| Total | 96 | 100.0% |
School Enrollment by Age by Funding Source in Perry
Out of a total of 96 students who are enrolled in schools in Perry, 40 (41.7%) attend a private institution, while the remaining 56 (58.3%) are enrolled in public schools. The age group of 10 to 14 year olds has the highest likelihood of being enrolled in private schools, with 20 (66.7% in the age bracket) enrolled. Conversely, the age group of 15 to 17 year olds has the lowest likelihood of being enrolled in a private school, with 2 (100.0% in the age bracket) attending a public institution.
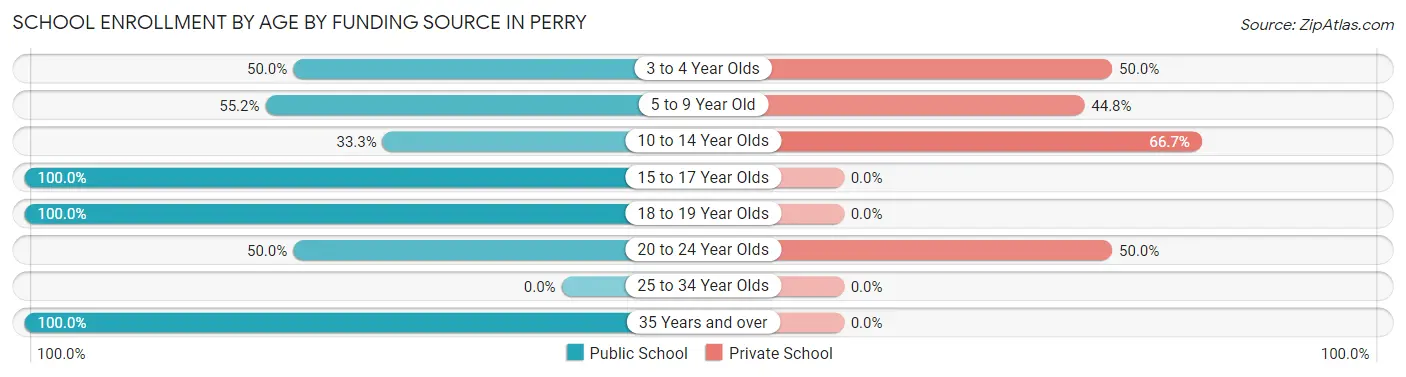
| Age Bracket | Public School | Private School |
| 3 to 4 Year Olds | 4 (50.0%) | 4 (50.0%) |
| 5 to 9 Year Old | 16 (55.2%) | 13 (44.8%) |
| 10 to 14 Year Olds | 10 (33.3%) | 20 (66.7%) |
| 15 to 17 Year Olds | 2 (100.0%) | 0 (0.0%) |
| 18 to 19 Year Olds | 2 (100.0%) | 0 (0.0%) |
| 20 to 24 Year Olds | 3 (50.0%) | 3 (50.0%) |
| 25 to 34 Year Olds | 0 (0.0%) | 0 (0.0%) |
| 35 Years and over | 19 (100.0%) | 0 (0.0%) |
| Total | 56 (58.3%) | 40 (41.7%) |
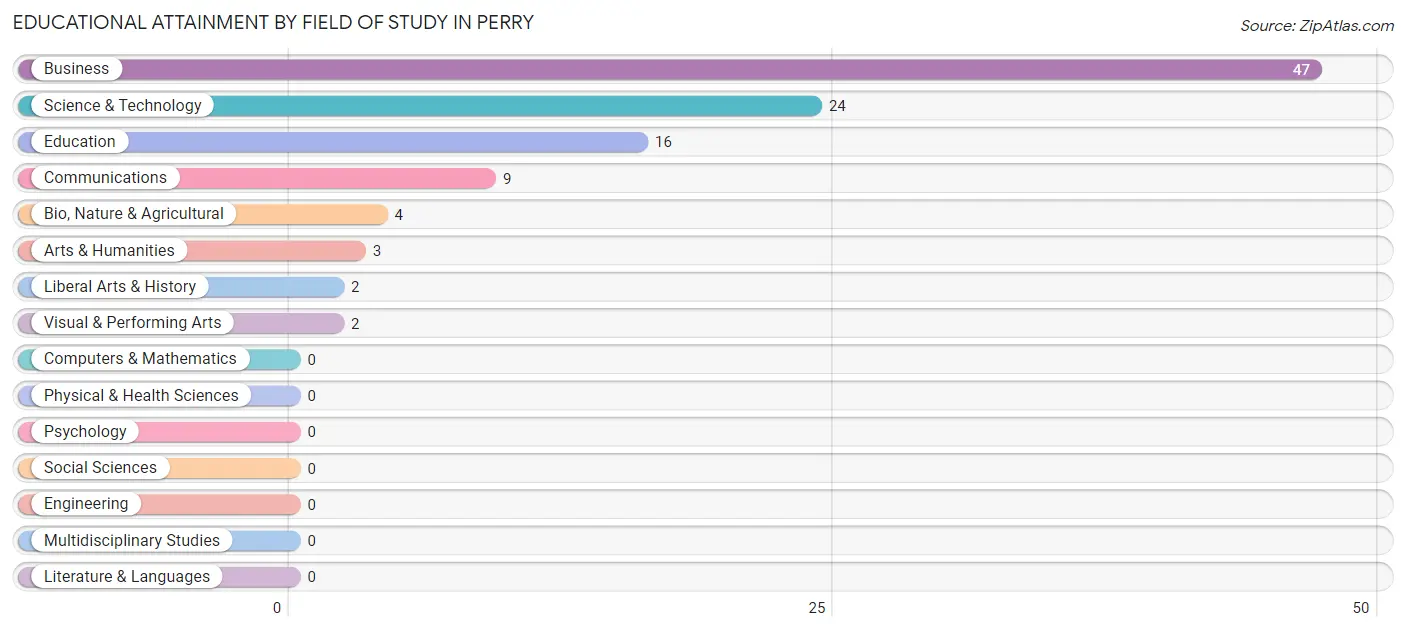
Educational Attainment by Field of Study in Perry
Business (47 | 43.9%), science & technology (24 | 22.4%), education (16 | 14.9%), communications (9 | 8.4%), and bio, nature & agricultural (4 | 3.7%) are the most common fields of study among 107 individuals in Perry who have obtained a bachelor's degree or higher.
| Field of Study | # Graduates | % Graduates |
| Computers & Mathematics | 0 | 0.0% |
| Bio, Nature & Agricultural | 4 | 3.7% |
| Physical & Health Sciences | 0 | 0.0% |
| Psychology | 0 | 0.0% |
| Social Sciences | 0 | 0.0% |
| Engineering | 0 | 0.0% |
| Multidisciplinary Studies | 0 | 0.0% |
| Science & Technology | 24 | 22.4% |
| Business | 47 | 43.9% |
| Education | 16 | 14.9% |
| Literature & Languages | 0 | 0.0% |
| Liberal Arts & History | 2 | 1.9% |
| Visual & Performing Arts | 2 | 1.9% |
| Communications | 9 | 8.4% |
| Arts & Humanities | 3 | 2.8% |
| Total | 107 | 100.0% |
Transportation & Commute in Perry
Vehicle Availability by Sex in Perry
The most prevalent vehicle ownership categories in Perry are males with 2 vehicles (41, accounting for 45.1%) and females with 2 vehicles (62, making up 27.3%).
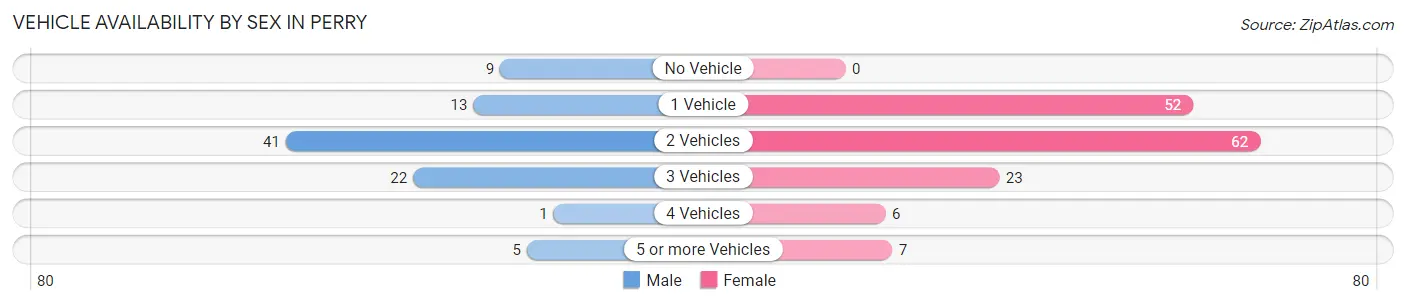
| Vehicles Available | Male | Female |
| No Vehicle | 9 (9.9%) | 0 (0.0%) |
| 1 Vehicle | 13 (14.3%) | 52 (34.7%) |
| 2 Vehicles | 41 (45.1%) | 62 (41.3%) |
| 3 Vehicles | 22 (24.2%) | 23 (15.3%) |
| 4 Vehicles | 1 (1.1%) | 6 (4.0%) |
| 5 or more Vehicles | 5 (5.5%) | 7 (4.7%) |
| Total | 91 (100.0%) | 150 (100.0%) |
Commute Time in Perry
The most frequently occuring commute durations in Perry are 20 to 24 minutes (63 commuters, 28.6%), 10 to 14 minutes (36 commuters, 16.4%), and 15 to 19 minutes (31 commuters, 14.1%).
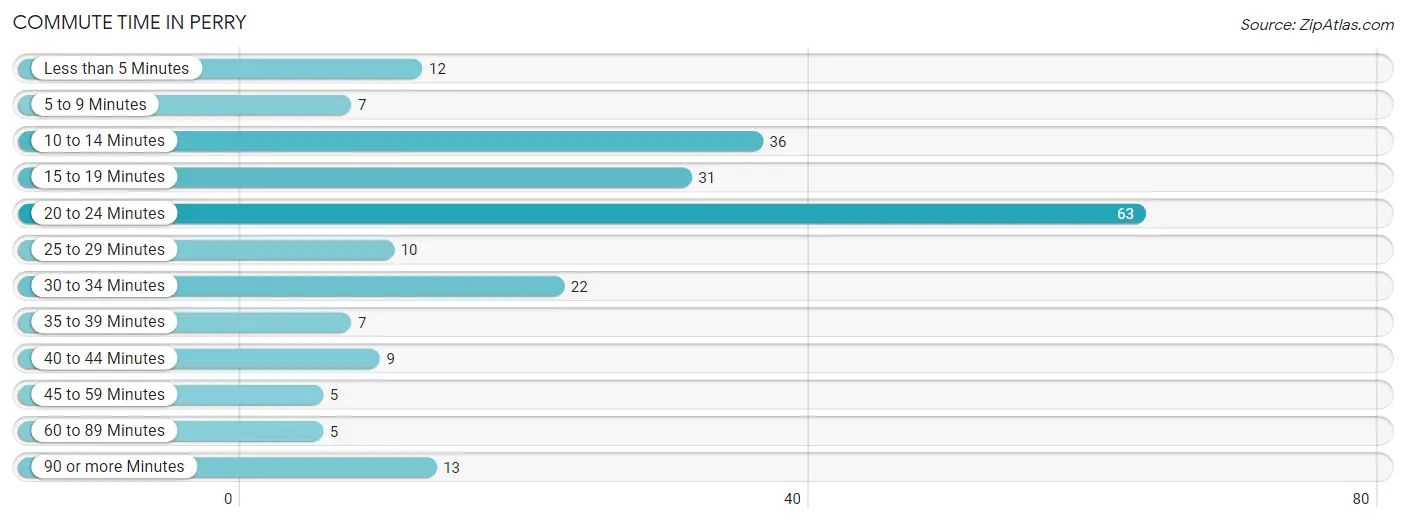
| Commute Time | # Commuters | % Commuters |
| Less than 5 Minutes | 12 | 5.4% |
| 5 to 9 Minutes | 7 | 3.2% |
| 10 to 14 Minutes | 36 | 16.4% |
| 15 to 19 Minutes | 31 | 14.1% |
| 20 to 24 Minutes | 63 | 28.6% |
| 25 to 29 Minutes | 10 | 4.5% |
| 30 to 34 Minutes | 22 | 10.0% |
| 35 to 39 Minutes | 7 | 3.2% |
| 40 to 44 Minutes | 9 | 4.1% |
| 45 to 59 Minutes | 5 | 2.3% |
| 60 to 89 Minutes | 5 | 2.3% |
| 90 or more Minutes | 13 | 5.9% |
Commute Time by Sex in Perry
The most common commute times in Perry are 20 to 24 minutes (16 commuters, 21.0%) for males and 20 to 24 minutes (47 commuters, 32.6%) for females.
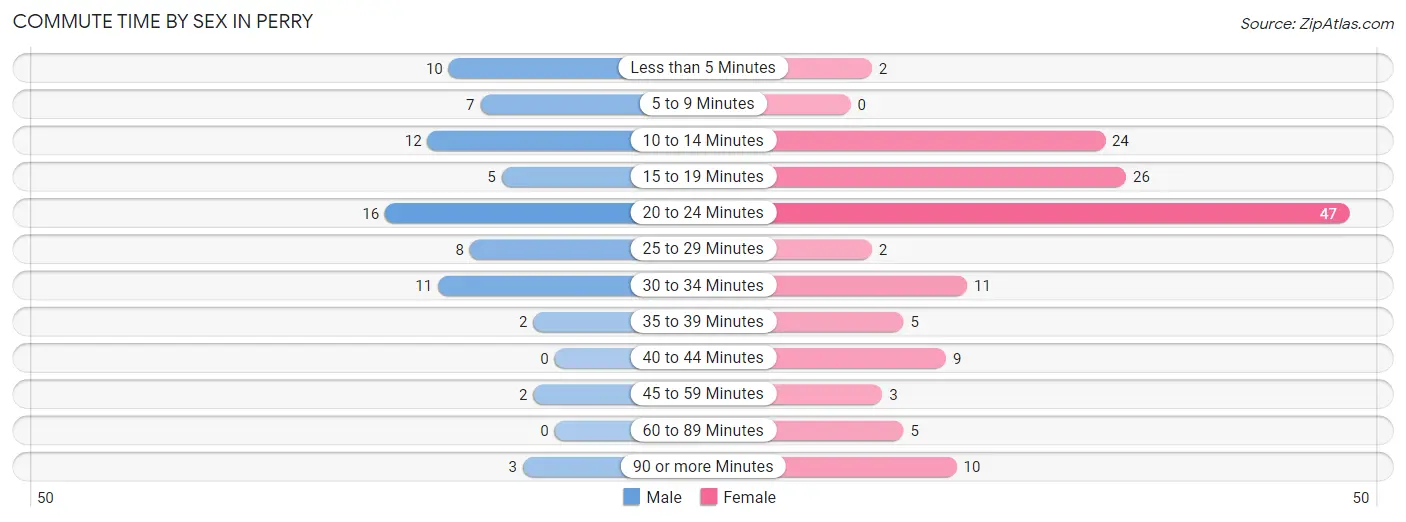
| Commute Time | Male | Female |
| Less than 5 Minutes | 10 (13.2%) | 2 (1.4%) |
| 5 to 9 Minutes | 7 (9.2%) | 0 (0.0%) |
| 10 to 14 Minutes | 12 (15.8%) | 24 (16.7%) |
| 15 to 19 Minutes | 5 (6.6%) | 26 (18.1%) |
| 20 to 24 Minutes | 16 (21.0%) | 47 (32.6%) |
| 25 to 29 Minutes | 8 (10.5%) | 2 (1.4%) |
| 30 to 34 Minutes | 11 (14.5%) | 11 (7.6%) |
| 35 to 39 Minutes | 2 (2.6%) | 5 (3.5%) |
| 40 to 44 Minutes | 0 (0.0%) | 9 (6.2%) |
| 45 to 59 Minutes | 2 (2.6%) | 3 (2.1%) |
| 60 to 89 Minutes | 0 (0.0%) | 5 (3.5%) |
| 90 or more Minutes | 3 (4.0%) | 10 (6.9%) |
Time of Departure to Work by Sex in Perry
The most frequent times of departure to work in Perry are 7:30 AM to 7:59 AM (21, 27.6%) for males and 7:30 AM to 7:59 AM (41, 28.5%) for females.
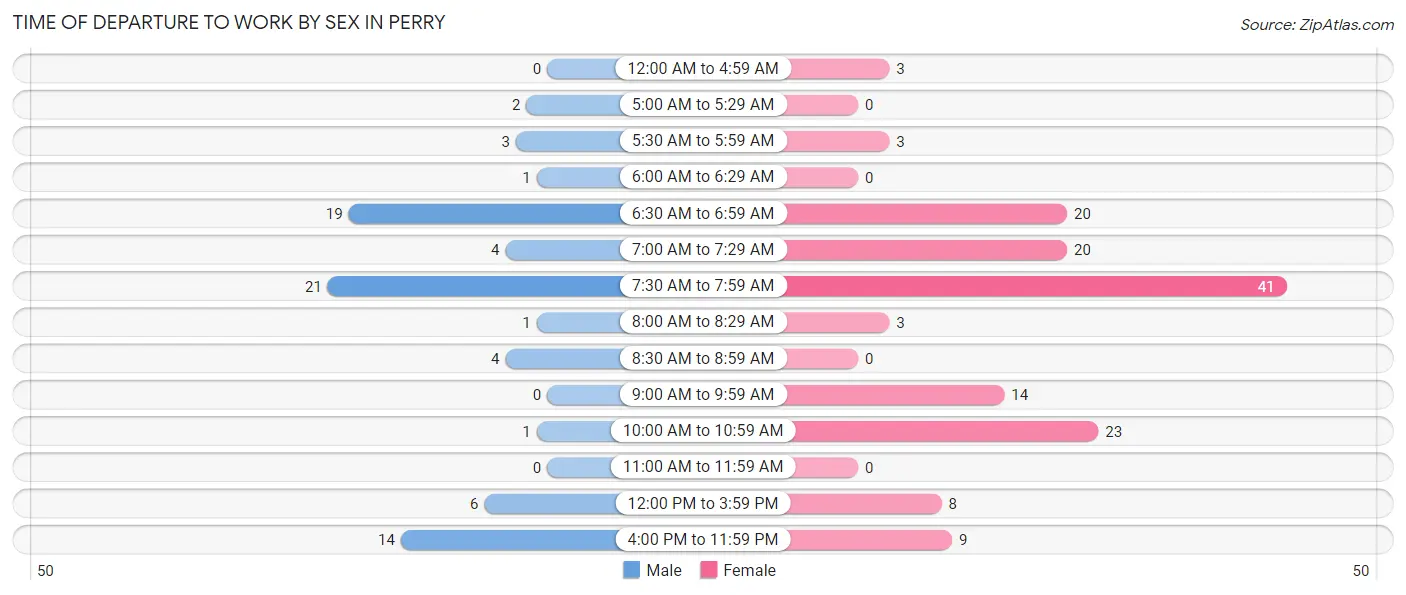
| Time of Departure | Male | Female |
| 12:00 AM to 4:59 AM | 0 (0.0%) | 3 (2.1%) |
| 5:00 AM to 5:29 AM | 2 (2.6%) | 0 (0.0%) |
| 5:30 AM to 5:59 AM | 3 (4.0%) | 3 (2.1%) |
| 6:00 AM to 6:29 AM | 1 (1.3%) | 0 (0.0%) |
| 6:30 AM to 6:59 AM | 19 (25.0%) | 20 (13.9%) |
| 7:00 AM to 7:29 AM | 4 (5.3%) | 20 (13.9%) |
| 7:30 AM to 7:59 AM | 21 (27.6%) | 41 (28.5%) |
| 8:00 AM to 8:29 AM | 1 (1.3%) | 3 (2.1%) |
| 8:30 AM to 8:59 AM | 4 (5.3%) | 0 (0.0%) |
| 9:00 AM to 9:59 AM | 0 (0.0%) | 14 (9.7%) |
| 10:00 AM to 10:59 AM | 1 (1.3%) | 23 (16.0%) |
| 11:00 AM to 11:59 AM | 0 (0.0%) | 0 (0.0%) |
| 12:00 PM to 3:59 PM | 6 (7.9%) | 8 (5.6%) |
| 4:00 PM to 11:59 PM | 14 (18.4%) | 9 (6.2%) |
| Total | 76 (100.0%) | 144 (100.0%) |
Housing Occupancy in Perry
Occupancy by Ownership in Perry
Of the total 291 dwellings in Perry, owner-occupied units account for 235 (80.8%), while renter-occupied units make up 56 (19.2%).
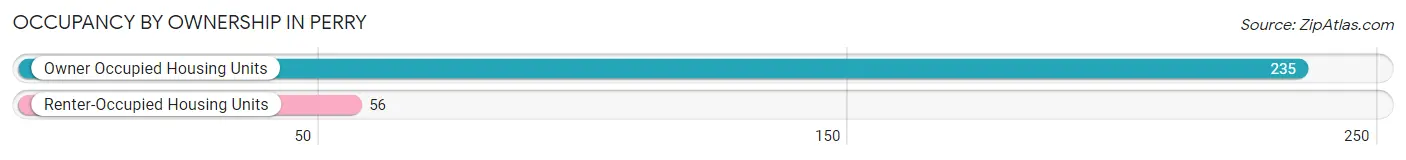
| Occupancy | # Housing Units | % Housing Units |
| Owner Occupied Housing Units | 235 | 80.8% |
| Renter-Occupied Housing Units | 56 | 19.2% |
| Total Occupied Housing Units | 291 | 100.0% |
Occupancy by Household Size in Perry
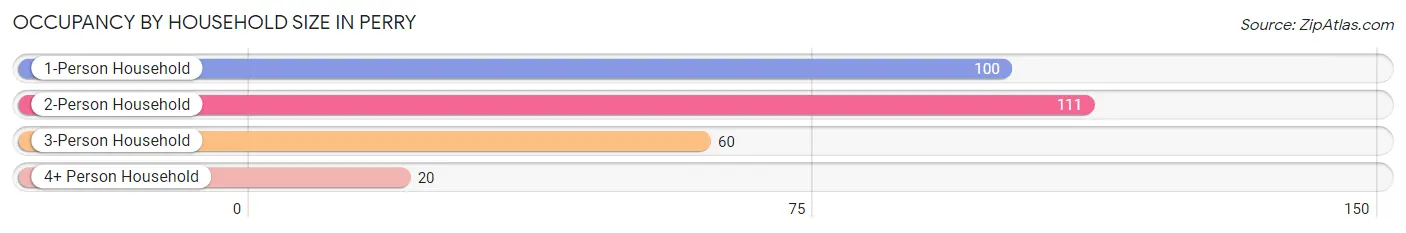
| Household Size | # Housing Units | % Housing Units |
| 1-Person Household | 100 | 34.4% |
| 2-Person Household | 111 | 38.1% |
| 3-Person Household | 60 | 20.6% |
| 4+ Person Household | 20 | 6.9% |
| Total Housing Units | 291 | 100.0% |
Occupancy by Ownership by Household Size in Perry
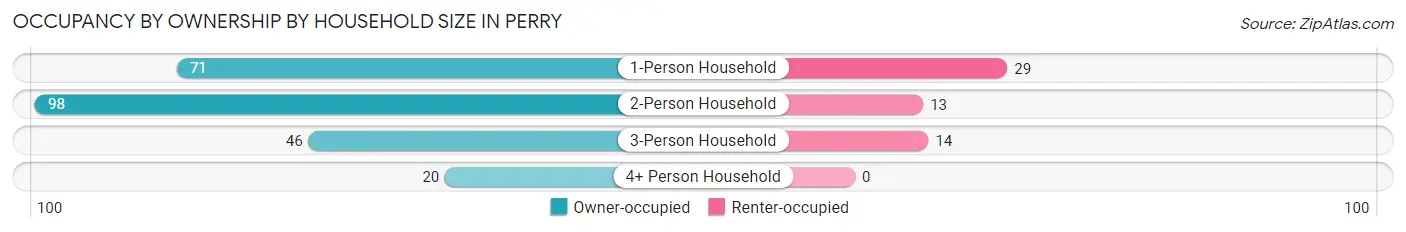
| Household Size | Owner-occupied | Renter-occupied |
| 1-Person Household | 71 (71.0%) | 29 (29.0%) |
| 2-Person Household | 98 (88.3%) | 13 (11.7%) |
| 3-Person Household | 46 (76.7%) | 14 (23.3%) |
| 4+ Person Household | 20 (100.0%) | 0 (0.0%) |
| Total Housing Units | 235 (80.8%) | 56 (19.2%) |
Occupancy by Educational Attainment in Perry
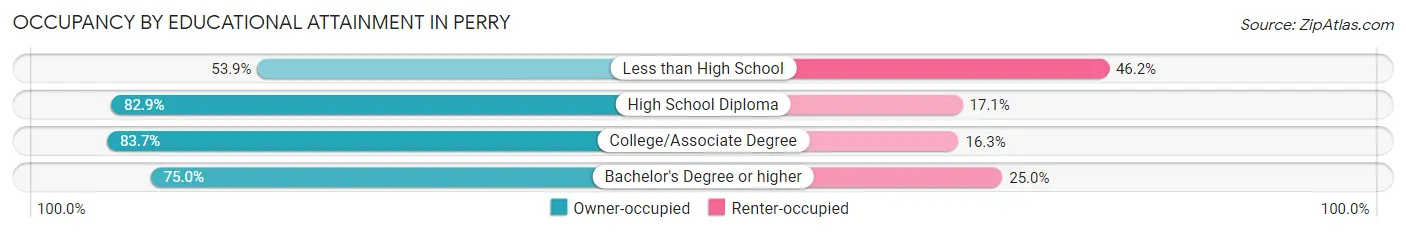
| Household Size | Owner-occupied | Renter-occupied |
| Less than High School | 7 (53.8%) | 6 (46.2%) |
| High School Diploma | 116 (82.9%) | 24 (17.1%) |
| College/Associate Degree | 82 (83.7%) | 16 (16.3%) |
| Bachelor's Degree or higher | 30 (75.0%) | 10 (25.0%) |
Occupancy by Age of Householder in Perry
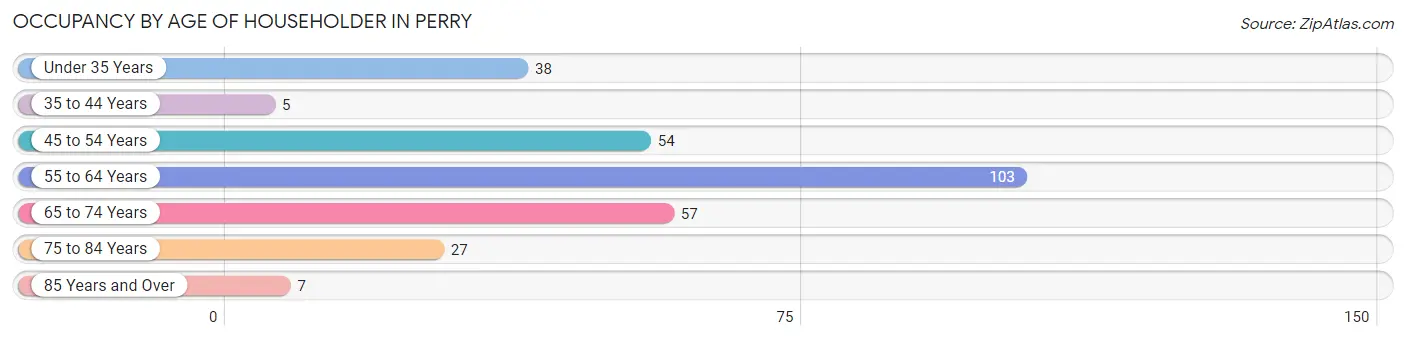
| Age Bracket | # Households | % Households |
| Under 35 Years | 38 | 13.1% |
| 35 to 44 Years | 5 | 1.7% |
| 45 to 54 Years | 54 | 18.6% |
| 55 to 64 Years | 103 | 35.4% |
| 65 to 74 Years | 57 | 19.6% |
| 75 to 84 Years | 27 | 9.3% |
| 85 Years and Over | 7 | 2.4% |
| Total | 291 | 100.0% |
Housing Finances in Perry
Median Income by Occupancy in Perry
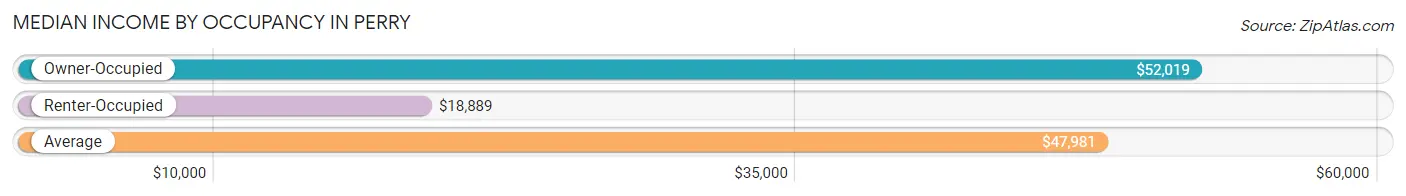
| Occupancy Type | # Households | Median Income |
| Owner-Occupied | 235 (80.8%) | $52,019 |
| Renter-Occupied | 56 (19.2%) | $18,889 |
| Average | 291 (100.0%) | $47,981 |
Occupancy by Householder Income Bracket in Perry
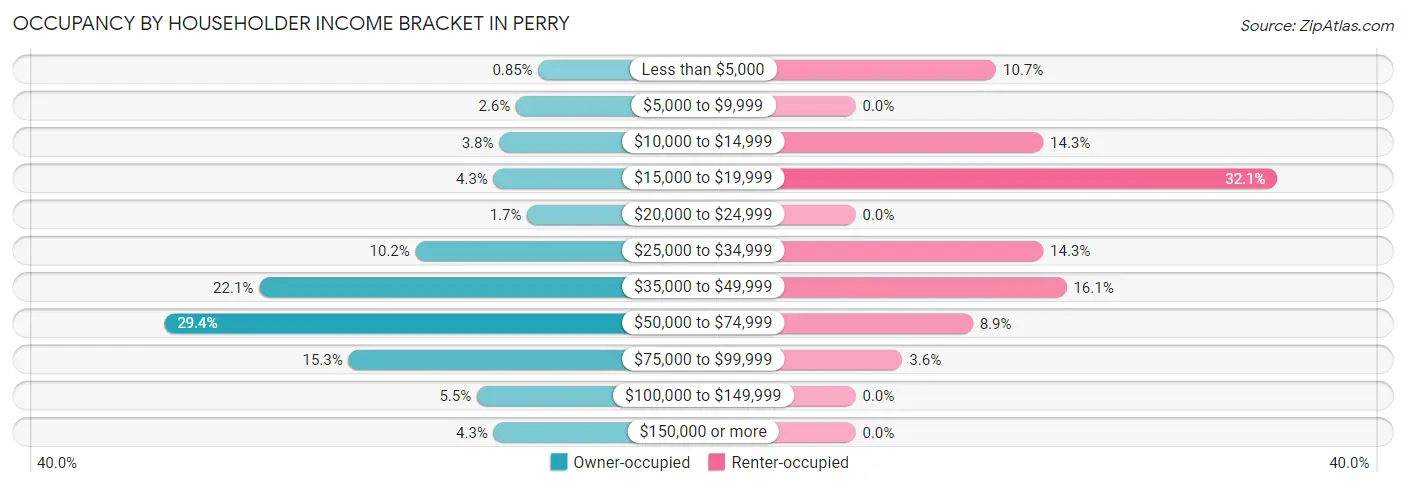
| Income Bracket | Owner-occupied | Renter-occupied |
| Less than $5,000 | 2 (0.9%) | 6 (10.7%) |
| $5,000 to $9,999 | 6 (2.5%) | 0 (0.0%) |
| $10,000 to $14,999 | 9 (3.8%) | 8 (14.3%) |
| $15,000 to $19,999 | 10 (4.3%) | 18 (32.1%) |
| $20,000 to $24,999 | 4 (1.7%) | 0 (0.0%) |
| $25,000 to $34,999 | 24 (10.2%) | 8 (14.3%) |
| $35,000 to $49,999 | 52 (22.1%) | 9 (16.1%) |
| $50,000 to $74,999 | 69 (29.4%) | 5 (8.9%) |
| $75,000 to $99,999 | 36 (15.3%) | 2 (3.6%) |
| $100,000 to $149,999 | 13 (5.5%) | 0 (0.0%) |
| $150,000 or more | 10 (4.3%) | 0 (0.0%) |
| Total | 235 (100.0%) | 56 (100.0%) |
Monthly Housing Cost Tiers in Perry
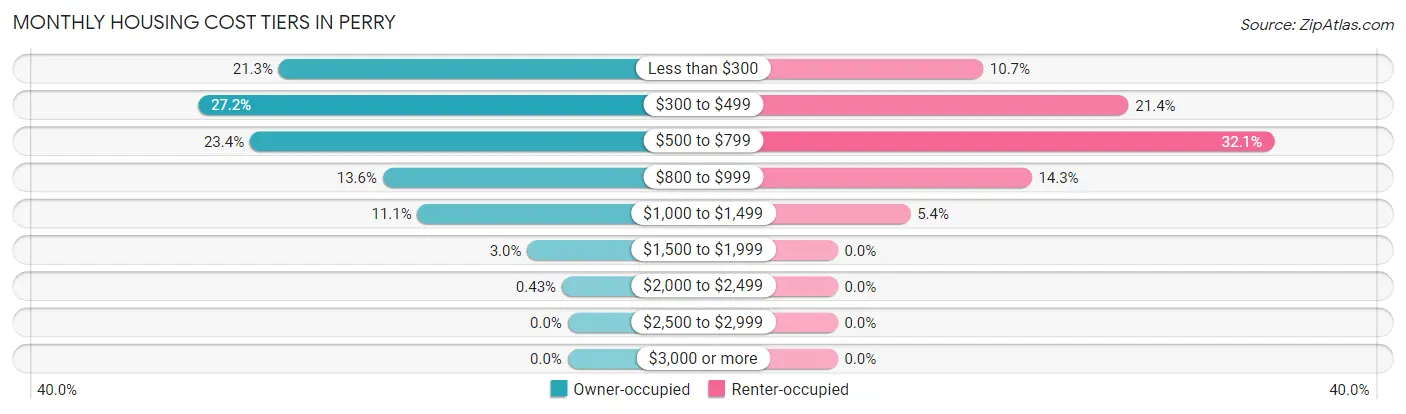
| Monthly Cost | Owner-occupied | Renter-occupied |
| Less than $300 | 50 (21.3%) | 6 (10.7%) |
| $300 to $499 | 64 (27.2%) | 12 (21.4%) |
| $500 to $799 | 55 (23.4%) | 18 (32.1%) |
| $800 to $999 | 32 (13.6%) | 8 (14.3%) |
| $1,000 to $1,499 | 26 (11.1%) | 3 (5.4%) |
| $1,500 to $1,999 | 7 (3.0%) | 0 (0.0%) |
| $2,000 to $2,499 | 1 (0.4%) | 0 (0.0%) |
| $2,500 to $2,999 | 0 (0.0%) | 0 (0.0%) |
| $3,000 or more | 0 (0.0%) | 0 (0.0%) |
| Total | 235 (100.0%) | 56 (100.0%) |
Physical Housing Characteristics in Perry
Housing Structures in Perry
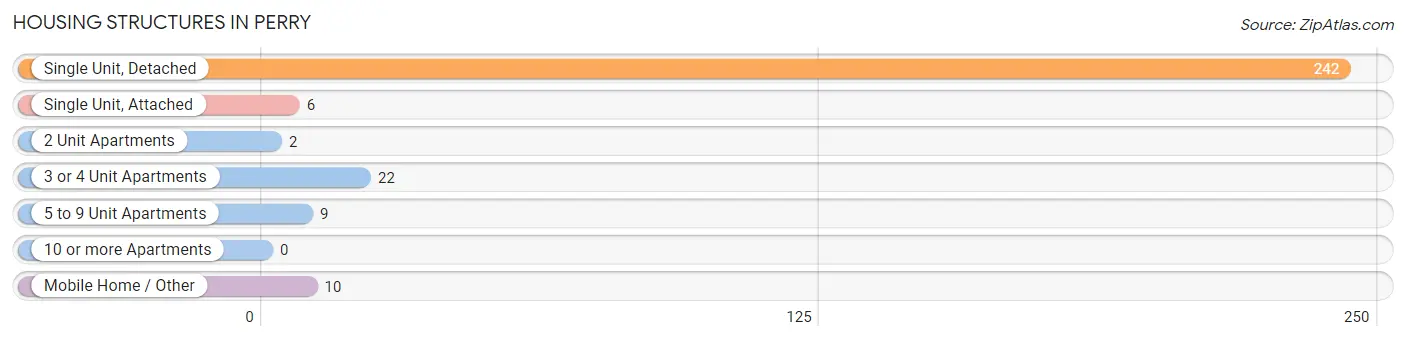
| Structure Type | # Housing Units | % Housing Units |
| Single Unit, Detached | 242 | 83.2% |
| Single Unit, Attached | 6 | 2.1% |
| 2 Unit Apartments | 2 | 0.7% |
| 3 or 4 Unit Apartments | 22 | 7.6% |
| 5 to 9 Unit Apartments | 9 | 3.1% |
| 10 or more Apartments | 0 | 0.0% |
| Mobile Home / Other | 10 | 3.4% |
| Total | 291 | 100.0% |
Housing Structures by Occupancy in Perry
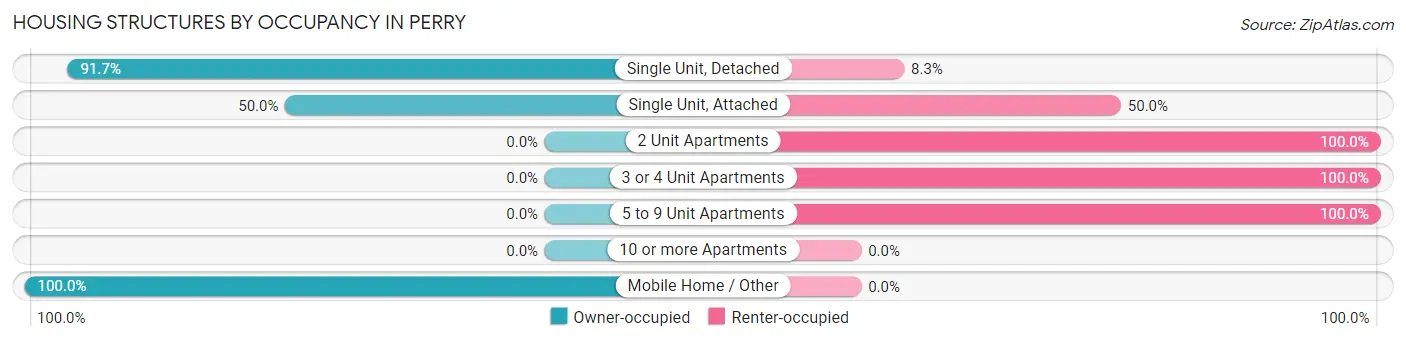
| Structure Type | Owner-occupied | Renter-occupied |
| Single Unit, Detached | 222 (91.7%) | 20 (8.3%) |
| Single Unit, Attached | 3 (50.0%) | 3 (50.0%) |
| 2 Unit Apartments | 0 (0.0%) | 2 (100.0%) |
| 3 or 4 Unit Apartments | 0 (0.0%) | 22 (100.0%) |
| 5 to 9 Unit Apartments | 0 (0.0%) | 9 (100.0%) |
| 10 or more Apartments | 0 (0.0%) | 0 (0.0%) |
| Mobile Home / Other | 10 (100.0%) | 0 (0.0%) |
| Total | 235 (80.8%) | 56 (19.2%) |
Housing Structures by Number of Rooms in Perry
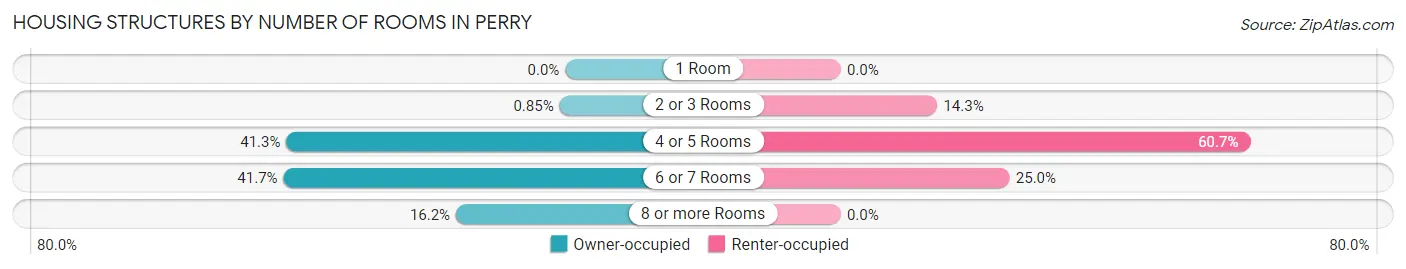
| Number of Rooms | Owner-occupied | Renter-occupied |
| 1 Room | 0 (0.0%) | 0 (0.0%) |
| 2 or 3 Rooms | 2 (0.9%) | 8 (14.3%) |
| 4 or 5 Rooms | 97 (41.3%) | 34 (60.7%) |
| 6 or 7 Rooms | 98 (41.7%) | 14 (25.0%) |
| 8 or more Rooms | 38 (16.2%) | 0 (0.0%) |
| Total | 235 (100.0%) | 56 (100.0%) |
Housing Structure by Heating Type in Perry
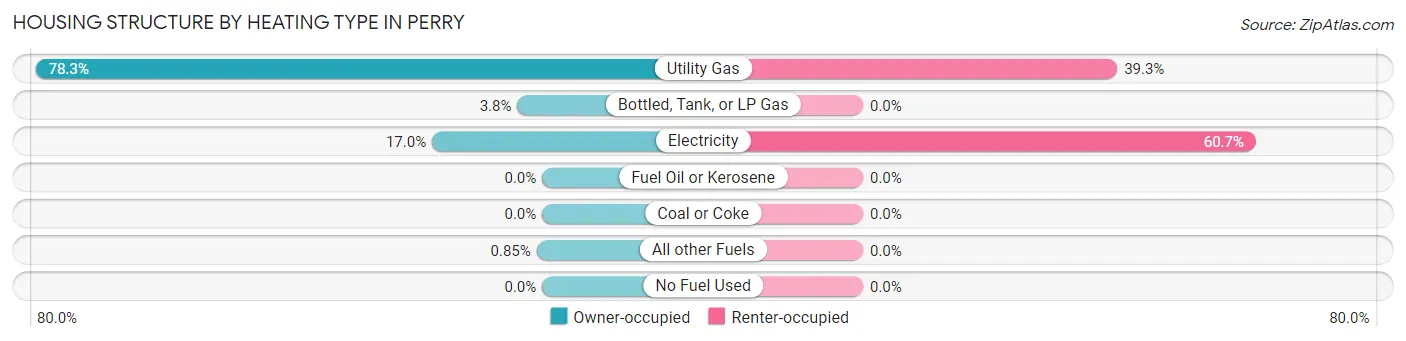
| Heating Type | Owner-occupied | Renter-occupied |
| Utility Gas | 184 (78.3%) | 22 (39.3%) |
| Bottled, Tank, or LP Gas | 9 (3.8%) | 0 (0.0%) |
| Electricity | 40 (17.0%) | 34 (60.7%) |
| Fuel Oil or Kerosene | 0 (0.0%) | 0 (0.0%) |
| Coal or Coke | 0 (0.0%) | 0 (0.0%) |
| All other Fuels | 2 (0.9%) | 0 (0.0%) |
| No Fuel Used | 0 (0.0%) | 0 (0.0%) |
| Total | 235 (100.0%) | 56 (100.0%) |
Household Vehicle Usage in Perry
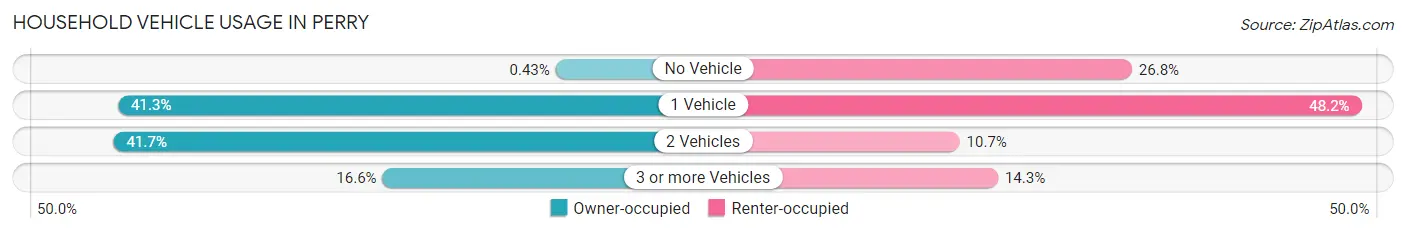
| Vehicles per Household | Owner-occupied | Renter-occupied |
| No Vehicle | 1 (0.4%) | 15 (26.8%) |
| 1 Vehicle | 97 (41.3%) | 27 (48.2%) |
| 2 Vehicles | 98 (41.7%) | 6 (10.7%) |
| 3 or more Vehicles | 39 (16.6%) | 8 (14.3%) |
| Total | 235 (100.0%) | 56 (100.0%) |
Real Estate & Mortgages in Perry
Real Estate and Mortgage Overview in Perry
| Characteristic | Without Mortgage | With Mortgage |
| Housing Units | 152 | 83 |
| Median Property Value | $97,200 | $114,900 |
| Median Household Income | $42,833 | $7 |
| Monthly Housing Costs | $354 | $0 |
| Real Estate Taxes | $677 | $1 |
Property Value by Mortgage Status in Perry
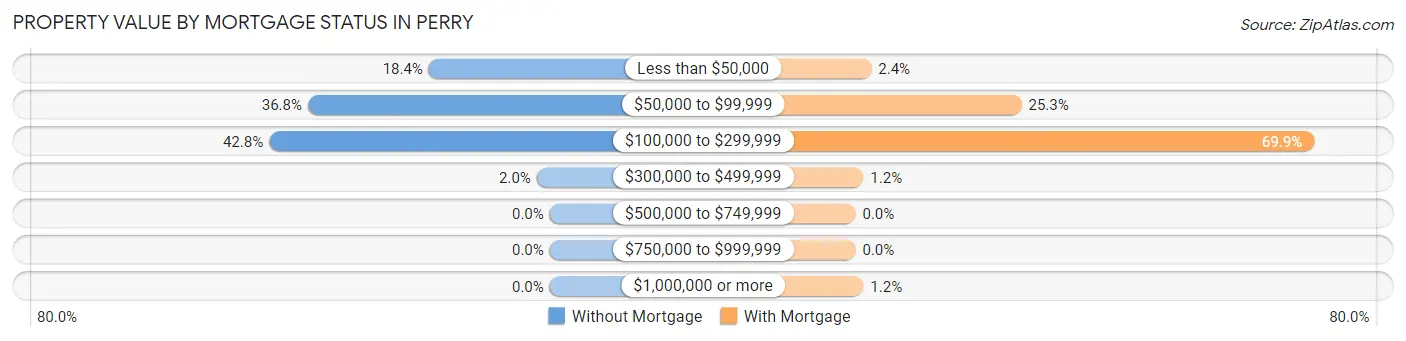
| Property Value | Without Mortgage | With Mortgage |
| Less than $50,000 | 28 (18.4%) | 2 (2.4%) |
| $50,000 to $99,999 | 56 (36.8%) | 21 (25.3%) |
| $100,000 to $299,999 | 65 (42.8%) | 58 (69.9%) |
| $300,000 to $499,999 | 3 (2.0%) | 1 (1.2%) |
| $500,000 to $749,999 | 0 (0.0%) | 0 (0.0%) |
| $750,000 to $999,999 | 0 (0.0%) | 0 (0.0%) |
| $1,000,000 or more | 0 (0.0%) | 1 (1.2%) |
| Total | 152 (100.0%) | 83 (100.0%) |
Household Income by Mortgage Status in Perry
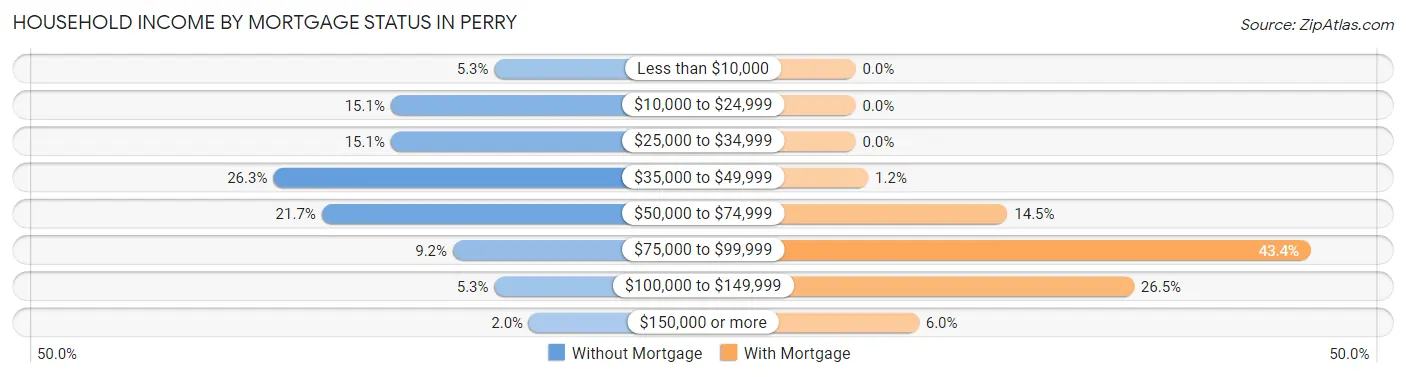
| Household Income | Without Mortgage | With Mortgage |
| Less than $10,000 | 8 (5.3%) | 0 (0.0%) |
| $10,000 to $24,999 | 23 (15.1%) | 0 (0.0%) |
| $25,000 to $34,999 | 23 (15.1%) | 0 (0.0%) |
| $35,000 to $49,999 | 40 (26.3%) | 1 (1.2%) |
| $50,000 to $74,999 | 33 (21.7%) | 12 (14.5%) |
| $75,000 to $99,999 | 14 (9.2%) | 36 (43.4%) |
| $100,000 to $149,999 | 8 (5.3%) | 22 (26.5%) |
| $150,000 or more | 3 (2.0%) | 5 (6.0%) |
| Total | 152 (100.0%) | 83 (100.0%) |
Property Value to Household Income Ratio in Perry
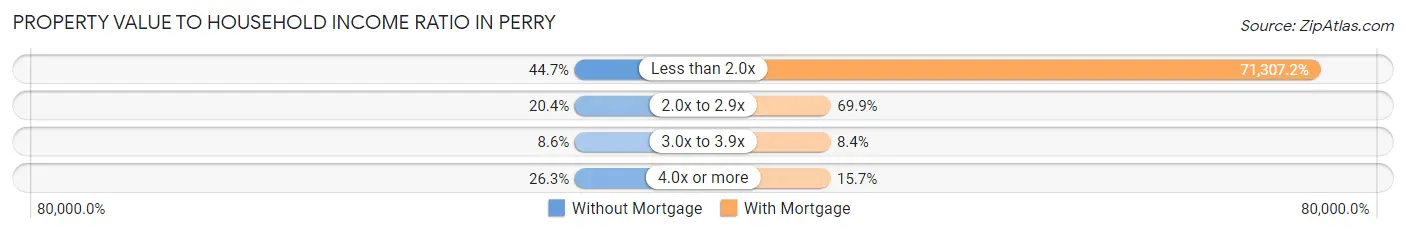
| Value-to-Income Ratio | Without Mortgage | With Mortgage |
| Less than 2.0x | 68 (44.7%) | 59,185 (71,307.2%) |
| 2.0x to 2.9x | 31 (20.4%) | 58 (69.9%) |
| 3.0x to 3.9x | 13 (8.6%) | 7 (8.4%) |
| 4.0x or more | 40 (26.3%) | 13 (15.7%) |
| Total | 152 (100.0%) | 83 (100.0%) |
Real Estate Taxes by Mortgage Status in Perry
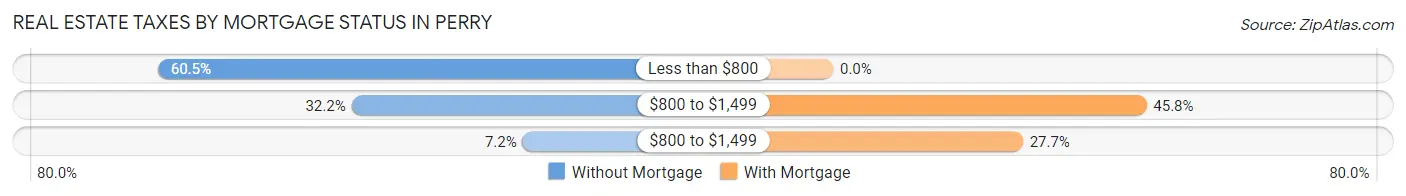
| Property Taxes | Without Mortgage | With Mortgage |
| Less than $800 | 92 (60.5%) | 0 (0.0%) |
| $800 to $1,499 | 49 (32.2%) | 38 (45.8%) |
| $800 to $1,499 | 11 (7.2%) | 23 (27.7%) |
| Total | 152 (100.0%) | 83 (100.0%) |
Health & Disability in Perry
Health Insurance Coverage by Age in Perry
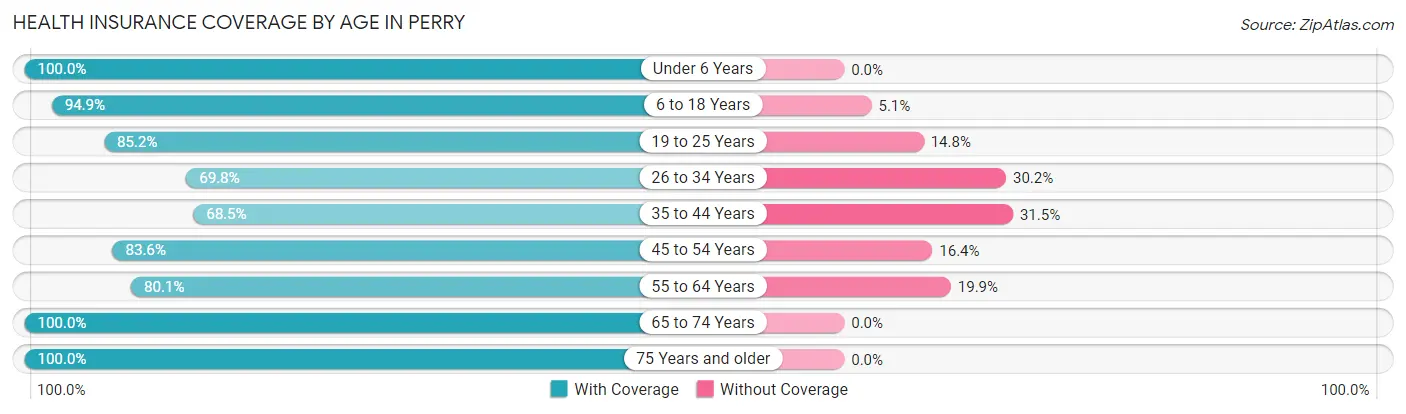
| Age Bracket | With Coverage | Without Coverage |
| Under 6 Years | 55 (100.0%) | 0 (0.0%) |
| 6 to 18 Years | 56 (94.9%) | 3 (5.1%) |
| 19 to 25 Years | 23 (85.2%) | 4 (14.8%) |
| 26 to 34 Years | 81 (69.8%) | 35 (30.2%) |
| 35 to 44 Years | 61 (68.5%) | 28 (31.5%) |
| 45 to 54 Years | 56 (83.6%) | 11 (16.4%) |
| 55 to 64 Years | 121 (80.1%) | 30 (19.9%) |
| 65 to 74 Years | 80 (100.0%) | 0 (0.0%) |
| 75 Years and older | 63 (100.0%) | 0 (0.0%) |
| Total | 596 (84.3%) | 111 (15.7%) |
Health Insurance Coverage by Citizenship Status in Perry
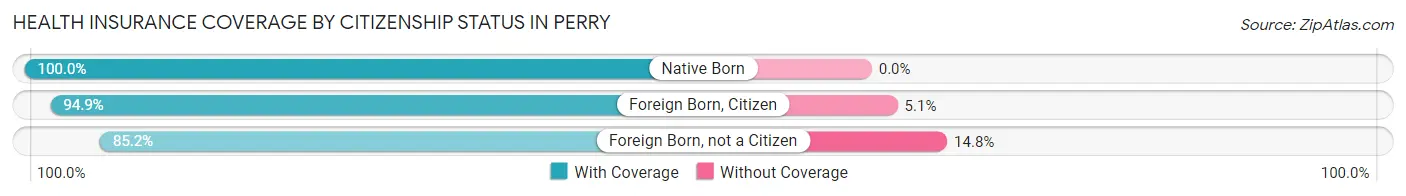
| Citizenship Status | With Coverage | Without Coverage |
| Native Born | 55 (100.0%) | 0 (0.0%) |
| Foreign Born, Citizen | 56 (94.9%) | 3 (5.1%) |
| Foreign Born, not a Citizen | 23 (85.2%) | 4 (14.8%) |
Health Insurance Coverage by Household Income in Perry
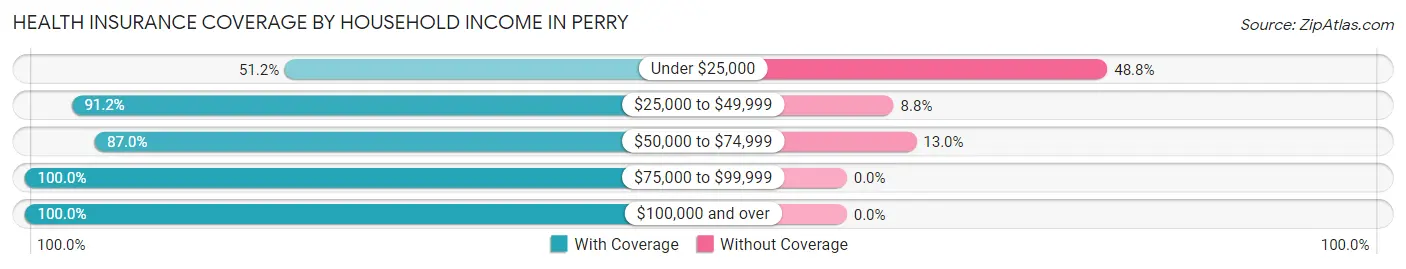
| Household Income | With Coverage | Without Coverage |
| Under $25,000 | 64 (51.2%) | 61 (48.8%) |
| $25,000 to $49,999 | 135 (91.2%) | 13 (8.8%) |
| $50,000 to $74,999 | 247 (87.0%) | 37 (13.0%) |
| $75,000 to $99,999 | 89 (100.0%) | 0 (0.0%) |
| $100,000 and over | 61 (100.0%) | 0 (0.0%) |
Public vs Private Health Insurance Coverage by Age in Perry
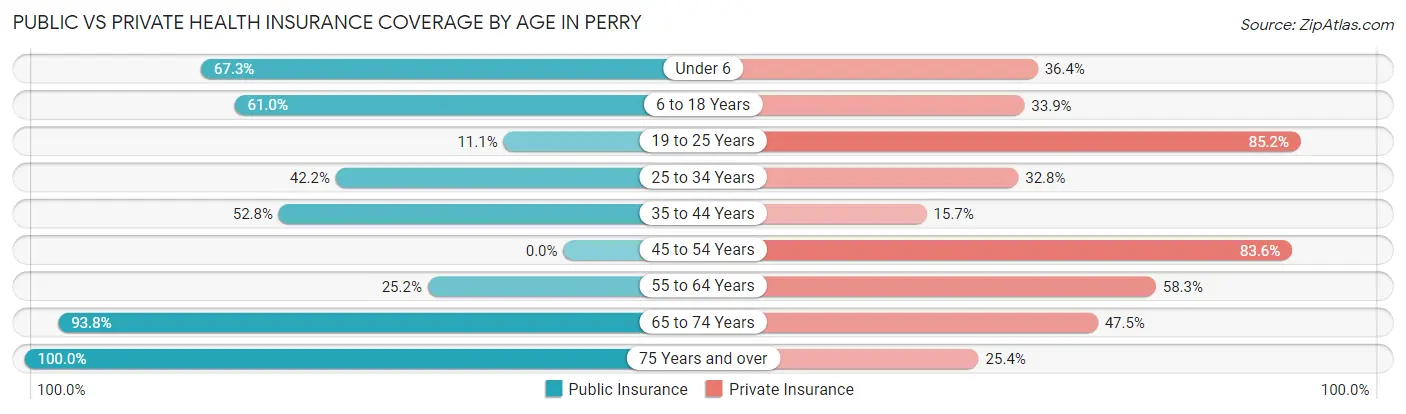
| Age Bracket | Public Insurance | Private Insurance |
| Under 6 | 37 (67.3%) | 20 (36.4%) |
| 6 to 18 Years | 36 (61.0%) | 20 (33.9%) |
| 19 to 25 Years | 3 (11.1%) | 23 (85.2%) |
| 25 to 34 Years | 49 (42.2%) | 38 (32.8%) |
| 35 to 44 Years | 47 (52.8%) | 14 (15.7%) |
| 45 to 54 Years | 0 (0.0%) | 56 (83.6%) |
| 55 to 64 Years | 38 (25.2%) | 88 (58.3%) |
| 65 to 74 Years | 75 (93.8%) | 38 (47.5%) |
| 75 Years and over | 63 (100.0%) | 16 (25.4%) |
| Total | 348 (49.2%) | 313 (44.3%) |
Disability Status by Sex by Age in Perry
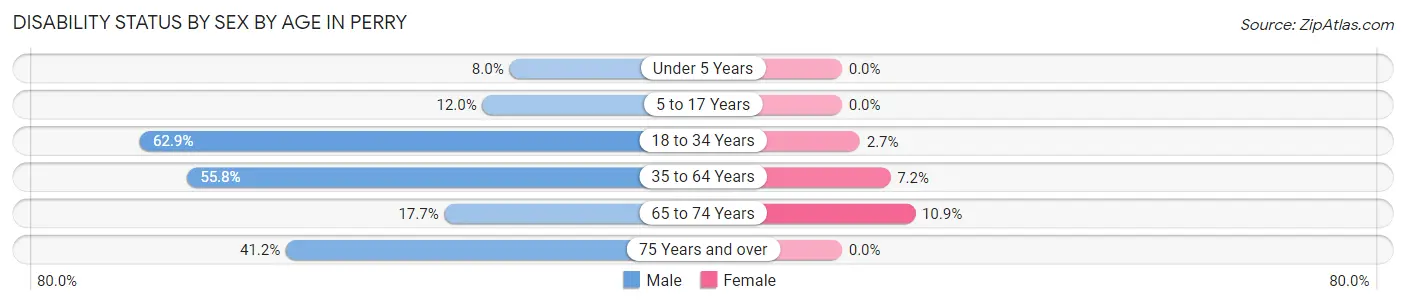
| Age Bracket | Male | Female |
| Under 5 Years | 2 (8.0%) | 0 (0.0%) |
| 5 to 17 Years | 3 (12.0%) | 0 (0.0%) |
| 18 to 34 Years | 44 (62.9%) | 2 (2.7%) |
| 35 to 64 Years | 86 (55.8%) | 11 (7.2%) |
| 65 to 74 Years | 6 (17.6%) | 5 (10.9%) |
| 75 Years and over | 14 (41.2%) | 0 (0.0%) |
Disability Class by Sex by Age in Perry
Disability Class: Hearing Difficulty
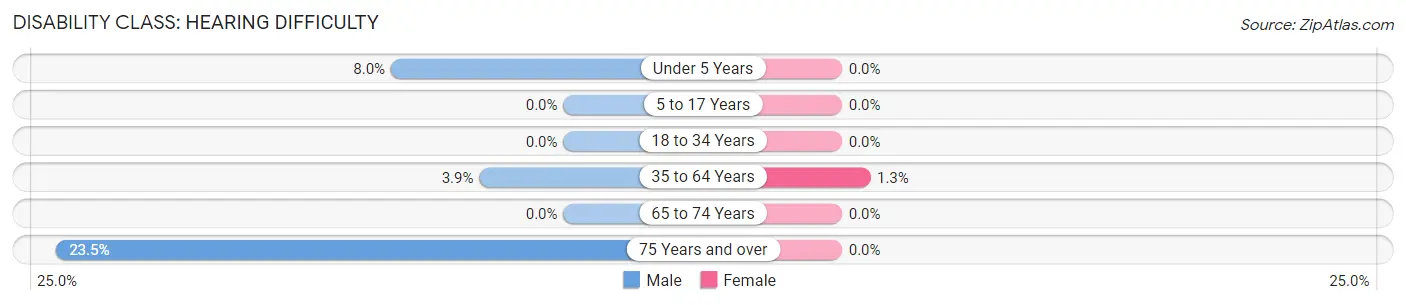
| Age Bracket | Male | Female |
| Under 5 Years | 2 (8.0%) | 0 (0.0%) |
| 5 to 17 Years | 0 (0.0%) | 0 (0.0%) |
| 18 to 34 Years | 0 (0.0%) | 0 (0.0%) |
| 35 to 64 Years | 6 (3.9%) | 2 (1.3%) |
| 65 to 74 Years | 0 (0.0%) | 0 (0.0%) |
| 75 Years and over | 8 (23.5%) | 0 (0.0%) |
Disability Class: Vision Difficulty
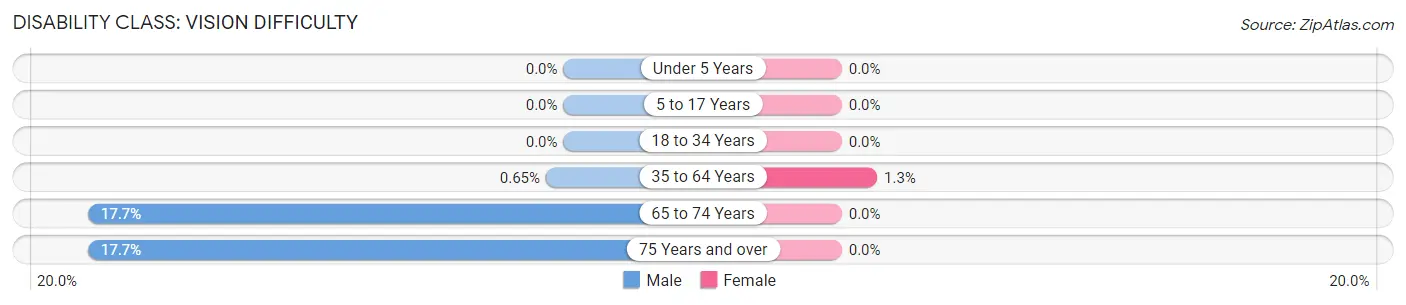
| Age Bracket | Male | Female |
| Under 5 Years | 0 (0.0%) | 0 (0.0%) |
| 5 to 17 Years | 0 (0.0%) | 0 (0.0%) |
| 18 to 34 Years | 0 (0.0%) | 0 (0.0%) |
| 35 to 64 Years | 1 (0.6%) | 2 (1.3%) |
| 65 to 74 Years | 6 (17.6%) | 0 (0.0%) |
| 75 Years and over | 6 (17.6%) | 0 (0.0%) |
Disability Class: Cognitive Difficulty
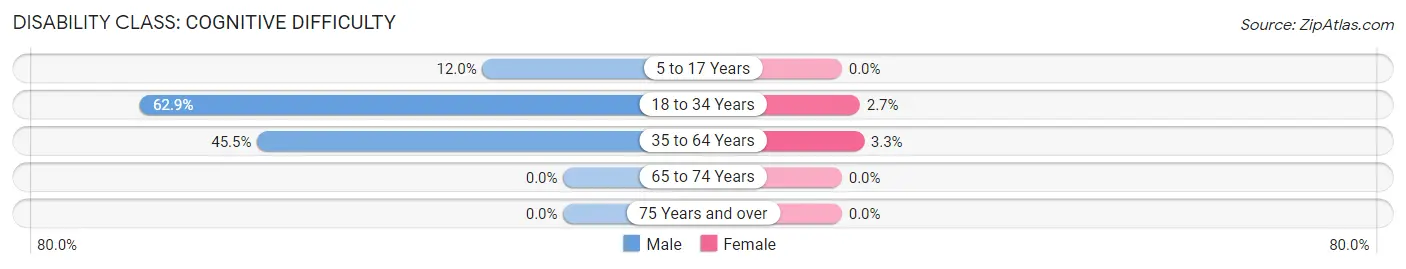
| Age Bracket | Male | Female |
| 5 to 17 Years | 3 (12.0%) | 0 (0.0%) |
| 18 to 34 Years | 44 (62.9%) | 2 (2.7%) |
| 35 to 64 Years | 70 (45.5%) | 5 (3.3%) |
| 65 to 74 Years | 0 (0.0%) | 0 (0.0%) |
| 75 Years and over | 0 (0.0%) | 0 (0.0%) |
Disability Class: Ambulatory Difficulty
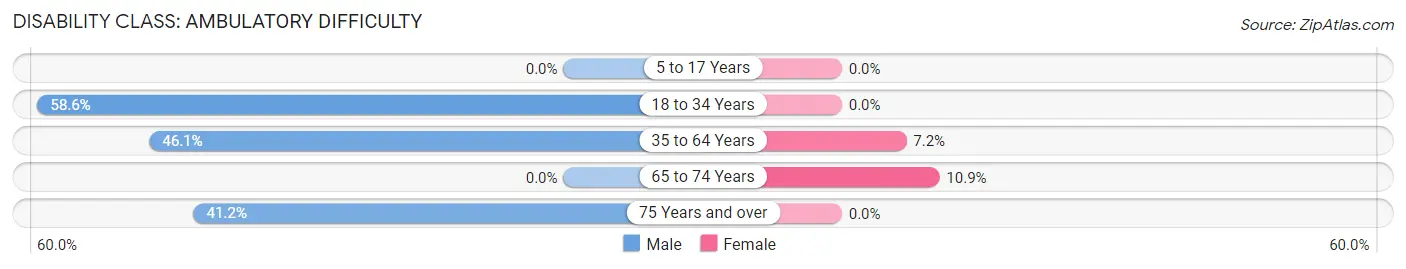
| Age Bracket | Male | Female |
| 5 to 17 Years | 0 (0.0%) | 0 (0.0%) |
| 18 to 34 Years | 41 (58.6%) | 0 (0.0%) |
| 35 to 64 Years | 71 (46.1%) | 11 (7.2%) |
| 65 to 74 Years | 0 (0.0%) | 5 (10.9%) |
| 75 Years and over | 14 (41.2%) | 0 (0.0%) |
Disability Class: Self-Care Difficulty
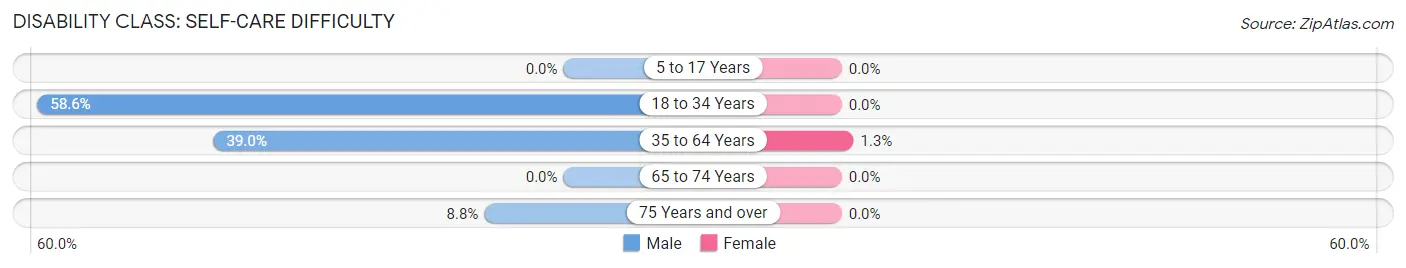
| Age Bracket | Male | Female |
| 5 to 17 Years | 0 (0.0%) | 0 (0.0%) |
| 18 to 34 Years | 41 (58.6%) | 0 (0.0%) |
| 35 to 64 Years | 60 (39.0%) | 2 (1.3%) |
| 65 to 74 Years | 0 (0.0%) | 0 (0.0%) |
| 75 Years and over | 3 (8.8%) | 0 (0.0%) |
Technology Access in Perry
Computing Device Access in Perry
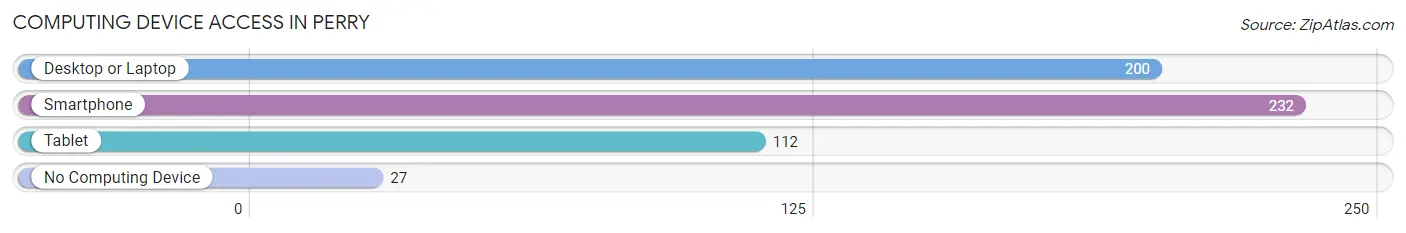
| Device Type | # Households | % Households |
| Desktop or Laptop | 200 | 68.7% |
| Smartphone | 232 | 79.7% |
| Tablet | 112 | 38.5% |
| No Computing Device | 27 | 9.3% |
| Total | 291 | 100.0% |
Internet Access in Perry
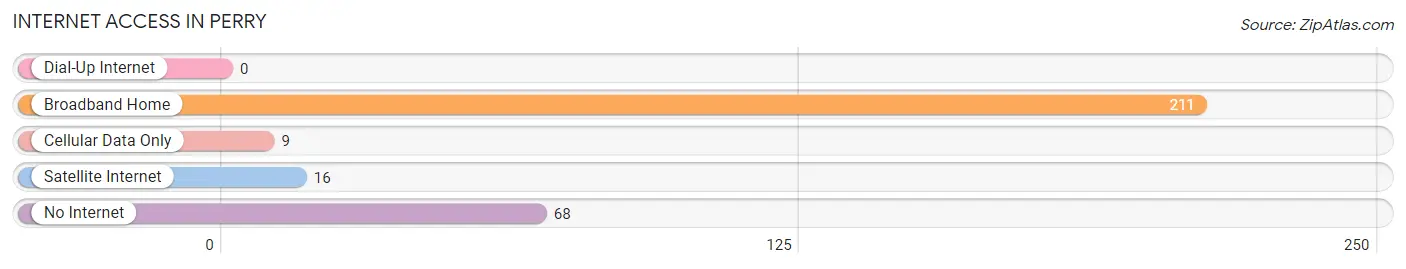
| Internet Type | # Households | % Households |
| Dial-Up Internet | 0 | 0.0% |
| Broadband Home | 211 | 72.5% |
| Cellular Data Only | 9 | 3.1% |
| Satellite Internet | 16 | 5.5% |
| No Internet | 68 | 23.4% |
| Total | 291 | 100.0% |
Perry Summary
Perry, Missouri is a small town located in the northeast corner of the state, in Ralls County. It is situated on the banks of the Mississippi River, and is part of the Hannibal-LaGrange metropolitan area. The town has a population of approximately 1,500 people, and is known for its rural charm and friendly atmosphere.
History
Perry was founded in 1819 by a group of settlers from Kentucky. The town was named after Commodore Oliver Hazard Perry, a hero of the War of 1812. The town was originally a trading post, and the first post office was established in 1820.
In the early days, Perry was a bustling river port, and the town was a major stop on the Hannibal and St. Joseph Railroad. The railroad brought many new settlers to the area, and the town grew rapidly. By the late 1800s, Perry had become a major agricultural center, and the town was home to several large farms.
In the early 1900s, Perry was a popular tourist destination, and the town was home to several resorts and hotels. The town also had a thriving business district, with several stores and restaurants.
Geography
Perry is located in the northeast corner of Missouri, in Ralls County. The town is situated on the banks of the Mississippi River, and is part of the Hannibal-LaGrange metropolitan area. The town is located approximately 50 miles north of St. Louis, and is accessible via Interstate 70.
The town is located in a rural area, and is surrounded by rolling hills and farmland. The town is located in a temperate climate, and the average temperature in the summer is around 80 degrees Fahrenheit.
Economy
Perry’s economy is largely based on agriculture. The town is home to several large farms, and the surrounding area is known for its production of corn, soybeans, and wheat. The town is also home to several small businesses, including restaurants, stores, and service providers.
The town is also home to several manufacturing companies, including a furniture factory and a plastics factory. The town is also home to a large trucking company, which provides transportation services to the surrounding area.
Demographics
As of the 2010 census, Perry had a population of 1,500 people. The town is predominantly white, with approximately 95% of the population being Caucasian. The town is also home to a small Hispanic population, with approximately 4% of the population being of Hispanic or Latino origin.
The median household income in Perry is approximately $35,000, and the median home value is approximately $90,000. The town has a low unemployment rate, and the poverty rate is below the national average.
Perry is a small town with a rich history and a friendly atmosphere. The town is home to several large farms, and the surrounding area is known for its production of corn, soybeans, and wheat. The town is also home to several small businesses, and the town is accessible via Interstate 70. The town has a population of approximately 1,500 people, and is predominantly white. The median household income in Perry is approximately $35,000, and the median home value is approximately $90,000. The town has a low unemployment rate, and the poverty rate is below the national average.
Common Questions
What is Per Capita Income in Perry?
Per Capita income in Perry is $22,613.
What is the Median Family Income in Perry?
Median Family Income in Perry is $57,989.
What is the Median Household income in Perry?
Median Household Income in Perry is $47,981.
What is Income or Wage Gap in Perry?
Income or Wage Gap in Perry is 18.4%.
Women in Perry earn 81.6 cents for every dollar earned by a man.
What is Inequality or Gini Index in Perry?
Inequality or Gini Index in Perry is 0.36.
What is the Total Population of Perry?
Total Population of Perry is 707.
What is the Total Male Population of Perry?
Total Male Population of Perry is 342.
What is the Total Female Population of Perry?
Total Female Population of Perry is 365.
What is the Ratio of Males per 100 Females in Perry?
There are 93.70 Males per 100 Females in Perry.
What is the Ratio of Females per 100 Males in Perry?
There are 106.73 Females per 100 Males in Perry.
What is the Median Population Age in Perry?
Median Population Age in Perry is 45.5 Years.
What is the Average Family Size in Perry
Average Family Size in Perry is 3.3 People.
What is the Average Household Size in Perry
Average Household Size in Perry is 2.4 People.
How Large is the Labor Force in Perry?
There are 255 People in the Labor Forcein in Perry.
What is the Percentage of People in the Labor Force in Perry?
42.7% of People are in the Labor Force in Perry.
What is the Unemployment Rate in Perry?
Unemployment Rate in Perry is 1.2%.