De Kalb, MO Map & Demographics
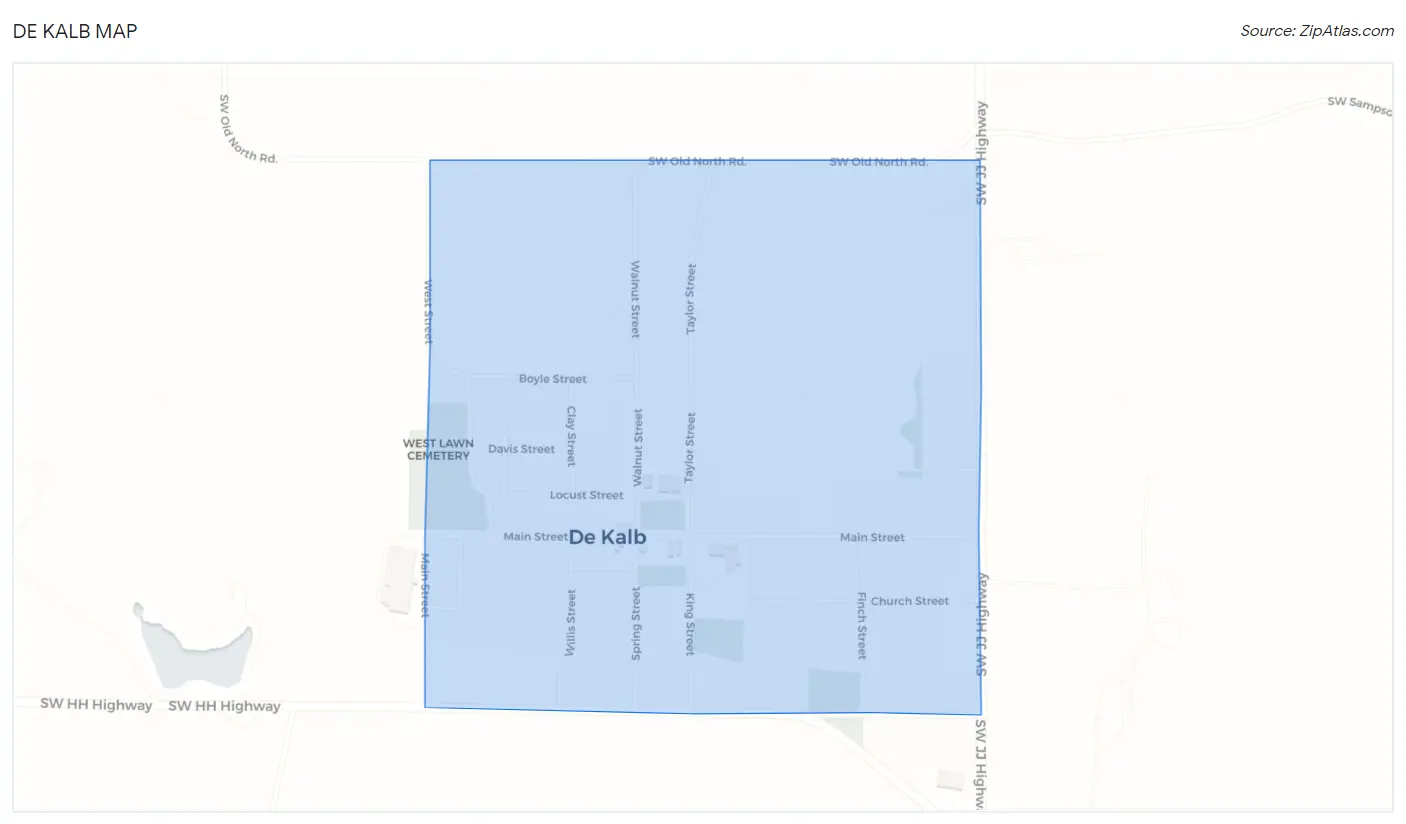
De Kalb Map
De Kalb Overview
$25,250
PER CAPITA INCOME
$85,625
AVG FAMILY INCOME
$80,625
AVG HOUSEHOLD INCOME
25.2%
WAGE / INCOME GAP [ % ]
74.8¢/ $1
WAGE / INCOME GAP [ $ ]
0.36
INEQUALITY / GINI INDEX
528
TOTAL POPULATION
242
MALE POPULATION
286
FEMALE POPULATION
84.62
MALES / 100 FEMALES
118.18
FEMALES / 100 MALES
27.3
MEDIAN AGE
3.6
AVG FAMILY SIZE
3.3
AVG HOUSEHOLD SIZE
241
LABOR FORCE [ PEOPLE ]
69.1%
PERCENT IN LABOR FORCE
De Kalb Zip Codes
De Kalb Area Codes
Income in De Kalb
Income Overview in De Kalb
Per Capita Income in De Kalb is $25,250, while median incomes of families and households are $85,625 and $80,625 respectively.
| Characteristic | Number | Measure |
| Per Capita Income | 528 | $25,250 |
| Median Family Income | 135 | $85,625 |
| Mean Family Income | 135 | $83,400 |
| Median Household Income | 161 | $80,625 |
| Mean Household Income | 161 | $78,871 |
| Income Deficit | 135 | $0 |
| Wage / Income Gap (%) | 528 | 25.16% |
| Wage / Income Gap ($) | 528 | 74.84¢ per $1 |
| Gini / Inequality Index | 528 | 0.36 |
Earnings by Sex in De Kalb
Average Earnings in De Kalb are $51,422, $52,054 for men and $38,958 for women, a difference of 25.2%.
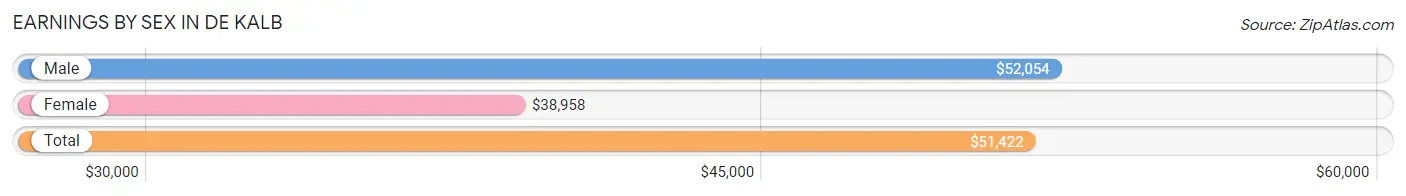
| Sex | Number | Average Earnings |
| Male | 110 (44.5%) | $52,054 |
| Female | 137 (55.5%) | $38,958 |
| Total | 247 (100.0%) | $51,422 |
Earnings by Sex by Income Bracket in De Kalb
The most common earnings brackets in De Kalb are $50,000 to $54,999 for men (28 | 25.5%) and $55,000 to $64,999 for women (48 | 35.0%).
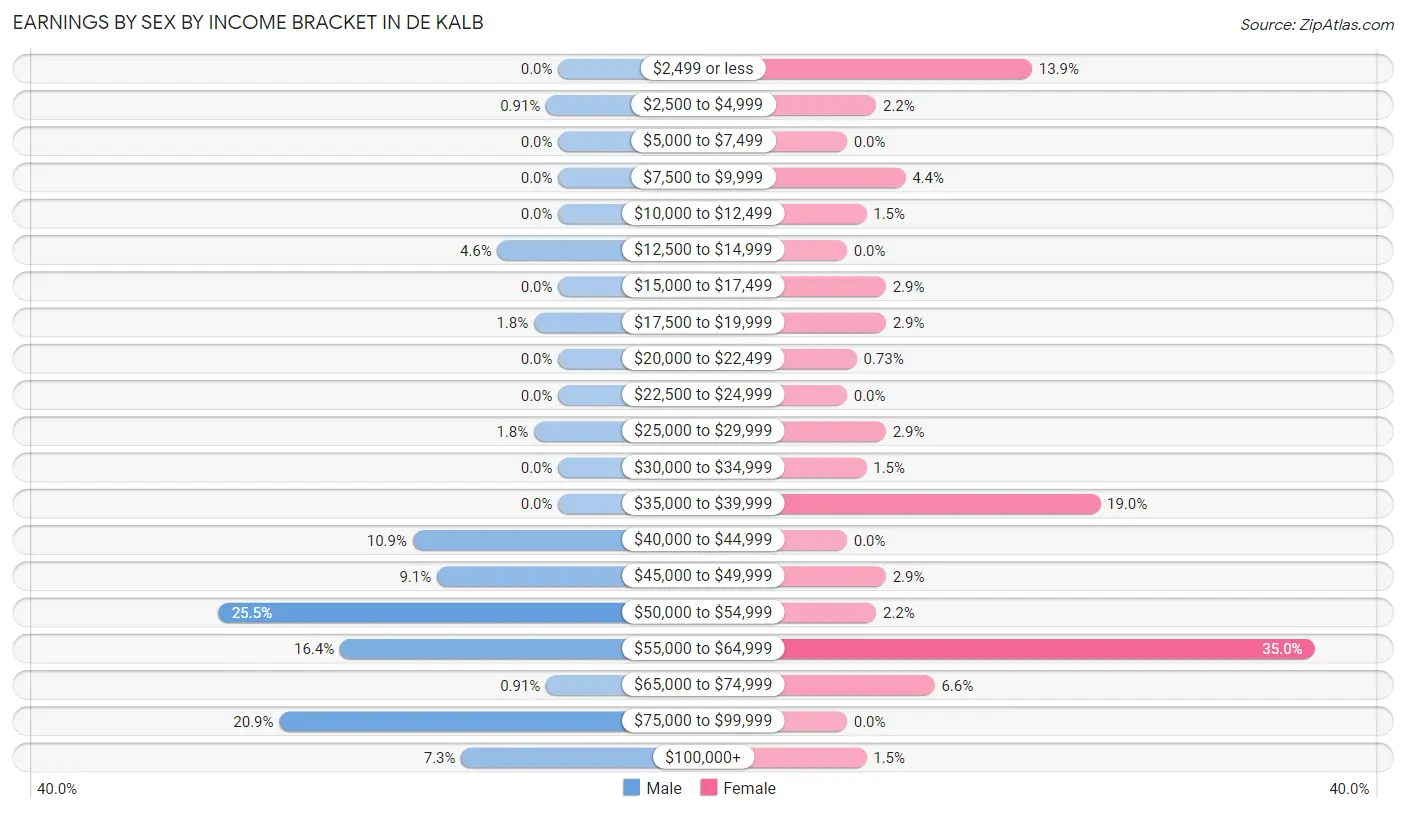
| Income | Male | Female |
| $2,499 or less | 0 (0.0%) | 19 (13.9%) |
| $2,500 to $4,999 | 1 (0.9%) | 3 (2.2%) |
| $5,000 to $7,499 | 0 (0.0%) | 0 (0.0%) |
| $7,500 to $9,999 | 0 (0.0%) | 6 (4.4%) |
| $10,000 to $12,499 | 0 (0.0%) | 2 (1.5%) |
| $12,500 to $14,999 | 5 (4.5%) | 0 (0.0%) |
| $15,000 to $17,499 | 0 (0.0%) | 4 (2.9%) |
| $17,500 to $19,999 | 2 (1.8%) | 4 (2.9%) |
| $20,000 to $22,499 | 0 (0.0%) | 1 (0.7%) |
| $22,500 to $24,999 | 0 (0.0%) | 0 (0.0%) |
| $25,000 to $29,999 | 2 (1.8%) | 4 (2.9%) |
| $30,000 to $34,999 | 0 (0.0%) | 2 (1.5%) |
| $35,000 to $39,999 | 0 (0.0%) | 26 (19.0%) |
| $40,000 to $44,999 | 12 (10.9%) | 0 (0.0%) |
| $45,000 to $49,999 | 10 (9.1%) | 4 (2.9%) |
| $50,000 to $54,999 | 28 (25.5%) | 3 (2.2%) |
| $55,000 to $64,999 | 18 (16.4%) | 48 (35.0%) |
| $65,000 to $74,999 | 1 (0.9%) | 9 (6.6%) |
| $75,000 to $99,999 | 23 (20.9%) | 0 (0.0%) |
| $100,000+ | 8 (7.3%) | 2 (1.5%) |
| Total | 110 (100.0%) | 137 (100.0%) |
Earnings by Sex by Educational Attainment in De Kalb
Average earnings in De Kalb are $52,054 for men and $47,188 for women, a difference of 9.3%. Men with an educational attainment of bachelor's degree enjoy the highest average annual earnings of $81,250, while those with college or associate's degree education earn the least with $48,958. Women with an educational attainment of high school diploma earn the most with the average annual earnings of $55,878, while those with college or associate's degree education have the smallest earnings of $36,375.
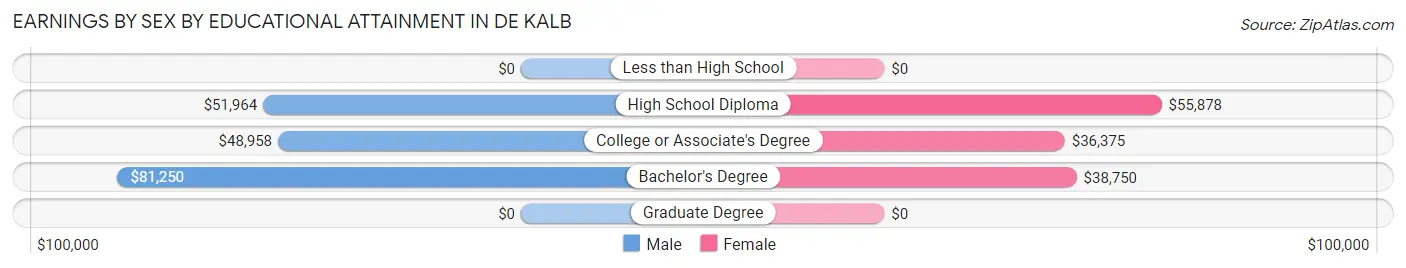
| Educational Attainment | Male Income | Female Income |
| Less than High School | - | - |
| High School Diploma | $51,964 | $55,878 |
| College or Associate's Degree | $48,958 | $36,375 |
| Bachelor's Degree | $81,250 | $38,750 |
| Graduate Degree | - | - |
| Total | $52,054 | $47,188 |
Family Income in De Kalb
Family Income Brackets in De Kalb
According to the De Kalb family income data, there are 35 families falling into the $75,000 to $99,999 income range, which is the most common income bracket and makes up 25.9% of all families.
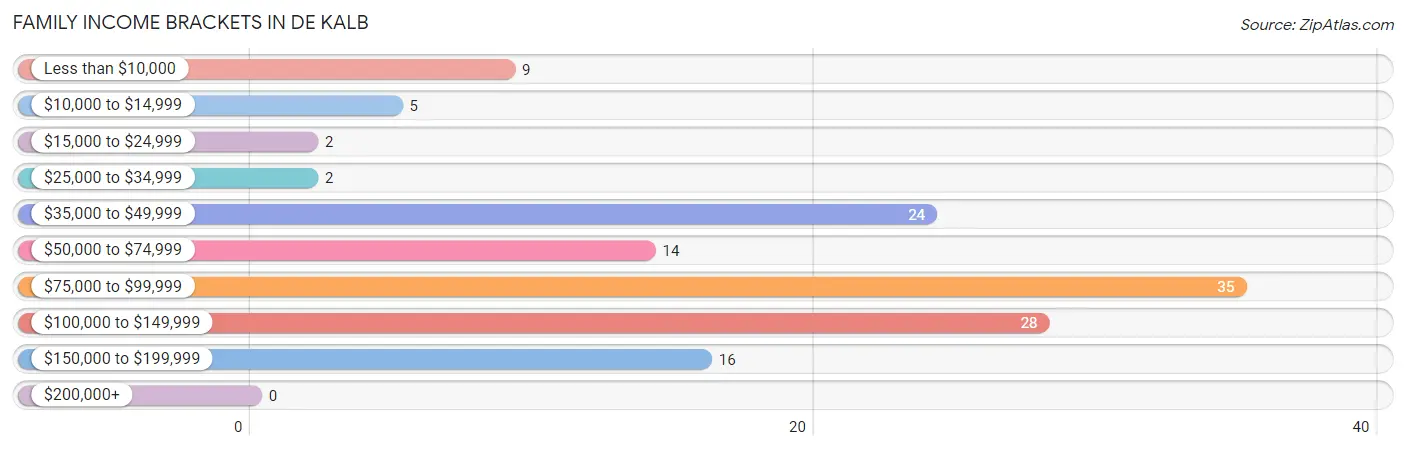
| Income Bracket | # Families | % Families |
| Less than $10,000 | 9 | 6.7% |
| $10,000 to $14,999 | 5 | 3.7% |
| $15,000 to $24,999 | 2 | 1.5% |
| $25,000 to $34,999 | 2 | 1.5% |
| $35,000 to $49,999 | 24 | 17.8% |
| $50,000 to $74,999 | 14 | 10.4% |
| $75,000 to $99,999 | 35 | 25.9% |
| $100,000 to $149,999 | 28 | 20.7% |
| $150,000 to $199,999 | 16 | 11.9% |
| $200,000+ | 0 | 0.0% |
Family Income by Famaliy Size in De Kalb
4-person families (64 | 47.4%) account for the highest median family income in De Kalb with $83,750 per family, while 2-person families (38 | 28.1%) have the highest median income of $33,334 per family member.
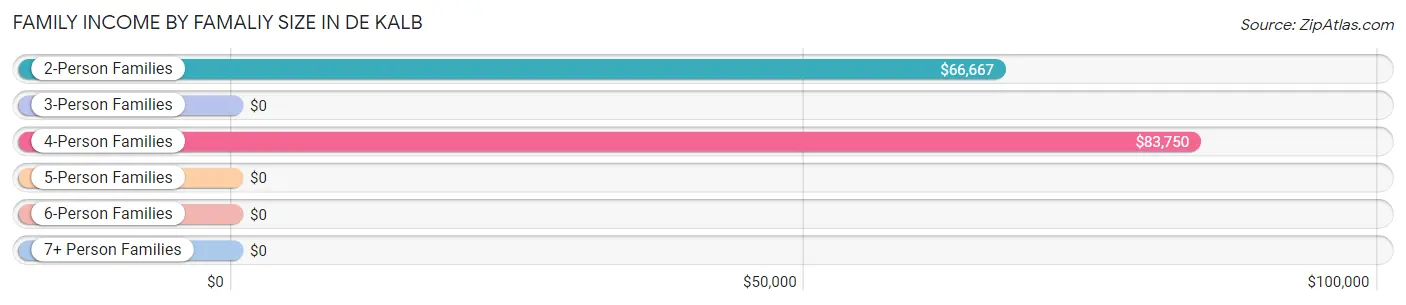
| Income Bracket | # Families | Median Income |
| 2-Person Families | 38 (28.1%) | $66,667 |
| 3-Person Families | 23 (17.0%) | $0 |
| 4-Person Families | 64 (47.4%) | $83,750 |
| 5-Person Families | 1 (0.7%) | $0 |
| 6-Person Families | 9 (6.7%) | $0 |
| 7+ Person Families | 0 (0.0%) | $0 |
| Total | 135 (100.0%) | $85,625 |
Family Income by Number of Earners in De Kalb
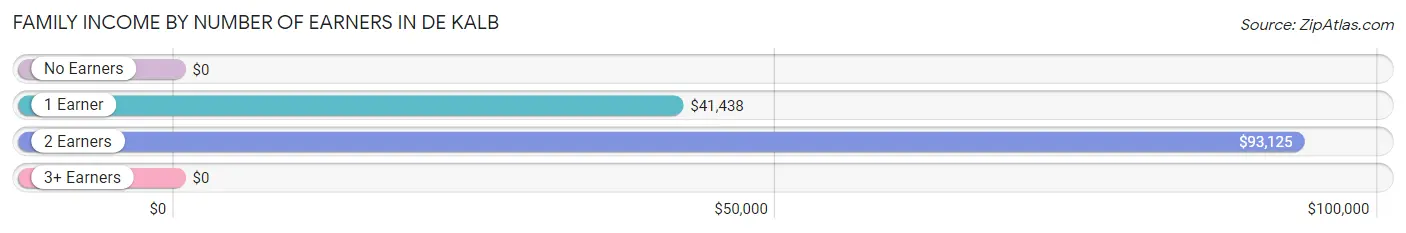
| Number of Earners | # Families | Median Income |
| No Earners | 10 (7.4%) | $0 |
| 1 Earner | 35 (25.9%) | $41,438 |
| 2 Earners | 89 (65.9%) | $93,125 |
| 3+ Earners | 1 (0.7%) | $0 |
| Total | 135 (100.0%) | $85,625 |
Household Income in De Kalb
Household Income Brackets in De Kalb
With 36 households falling in the category, the $100,000 to $149,999 income range is the most frequent in De Kalb, accounting for 22.4% of all households.
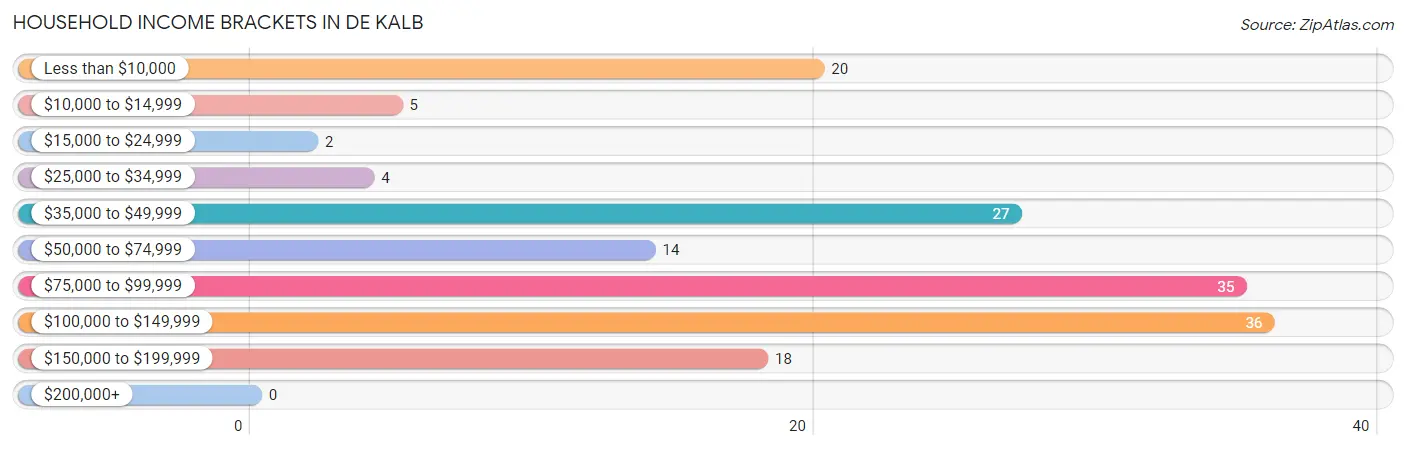
| Income Bracket | # Households | % Households |
| Less than $10,000 | 20 | 12.4% |
| $10,000 to $14,999 | 5 | 3.1% |
| $15,000 to $24,999 | 2 | 1.2% |
| $25,000 to $34,999 | 4 | 2.5% |
| $35,000 to $49,999 | 27 | 16.8% |
| $50,000 to $74,999 | 14 | 8.7% |
| $75,000 to $99,999 | 35 | 21.7% |
| $100,000 to $149,999 | 36 | 22.4% |
| $150,000 to $199,999 | 18 | 11.2% |
| $200,000+ | 0 | 0.0% |
Household Income by Householder Age in De Kalb
The median household income in De Kalb is $80,625, with the highest median household income of $86,667 found in the 25 to 44 years age bracket for the primary householder. A total of 100 households (62.1%) fall into this category.
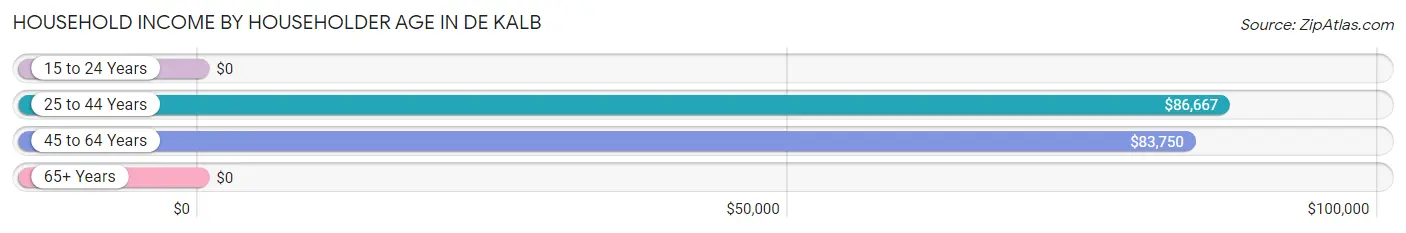
| Income Bracket | # Households | Median Income |
| 15 to 24 Years | 0 (0.0%) | $0 |
| 25 to 44 Years | 100 (62.1%) | $86,667 |
| 45 to 64 Years | 46 (28.6%) | $83,750 |
| 65+ Years | 15 (9.3%) | $0 |
| Total | 161 (100.0%) | $80,625 |
Poverty in De Kalb
Income Below Poverty by Sex and Age in De Kalb
With 7.9% poverty level for males and 12.6% for females among the residents of De Kalb, 6 to 11 year old males and 75 year old and over females are the most vulnerable to poverty, with 8 males (47.1%) and 6 females (75.0%) in their respective age groups living below the poverty level.
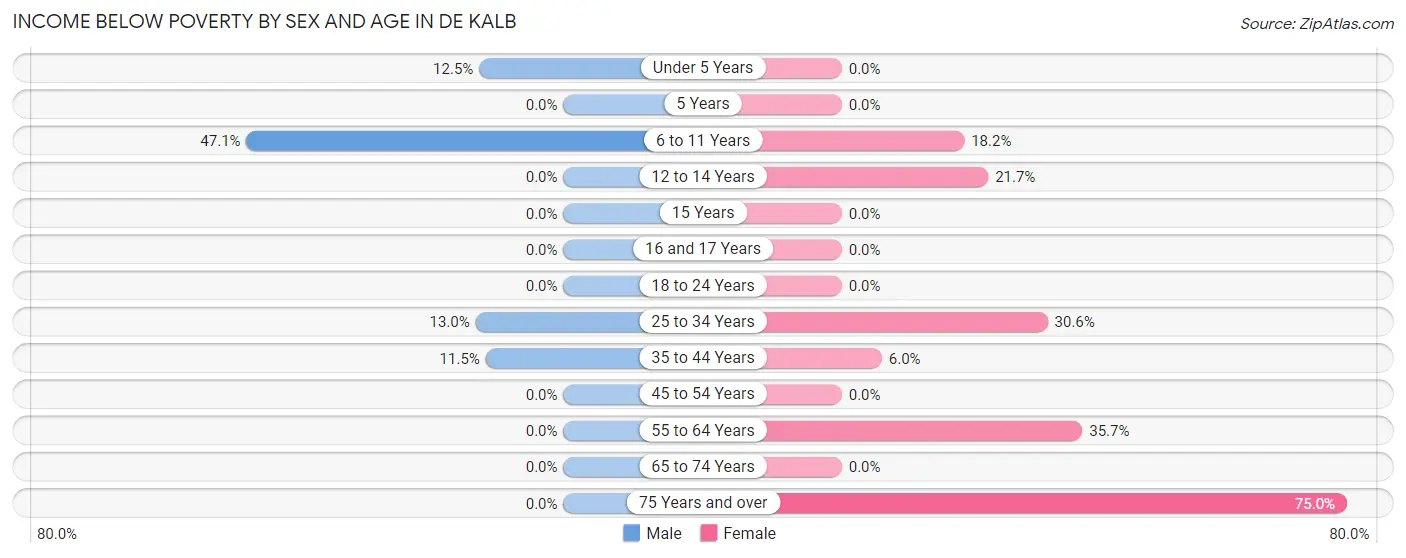
| Age Bracket | Male | Female |
| Under 5 Years | 2 (12.5%) | 0 (0.0%) |
| 5 Years | 0 (0.0%) | 0 (0.0%) |
| 6 to 11 Years | 8 (47.1%) | 4 (18.2%) |
| 12 to 14 Years | 0 (0.0%) | 5 (21.7%) |
| 15 Years | 0 (0.0%) | 0 (0.0%) |
| 16 and 17 Years | 0 (0.0%) | 0 (0.0%) |
| 18 to 24 Years | 0 (0.0%) | 0 (0.0%) |
| 25 to 34 Years | 3 (13.0%) | 11 (30.6%) |
| 35 to 44 Years | 6 (11.5%) | 5 (5.9%) |
| 45 to 54 Years | 0 (0.0%) | 0 (0.0%) |
| 55 to 64 Years | 0 (0.0%) | 5 (35.7%) |
| 65 to 74 Years | 0 (0.0%) | 0 (0.0%) |
| 75 Years and over | 0 (0.0%) | 6 (75.0%) |
| Total | 19 (7.9%) | 36 (12.6%) |
Income Above Poverty by Sex and Age in De Kalb
According to the poverty statistics in De Kalb, males aged 5 years and females aged under 5 years are the age groups that are most secure financially, with 100.0% of males and 100.0% of females in these age groups living above the poverty line.
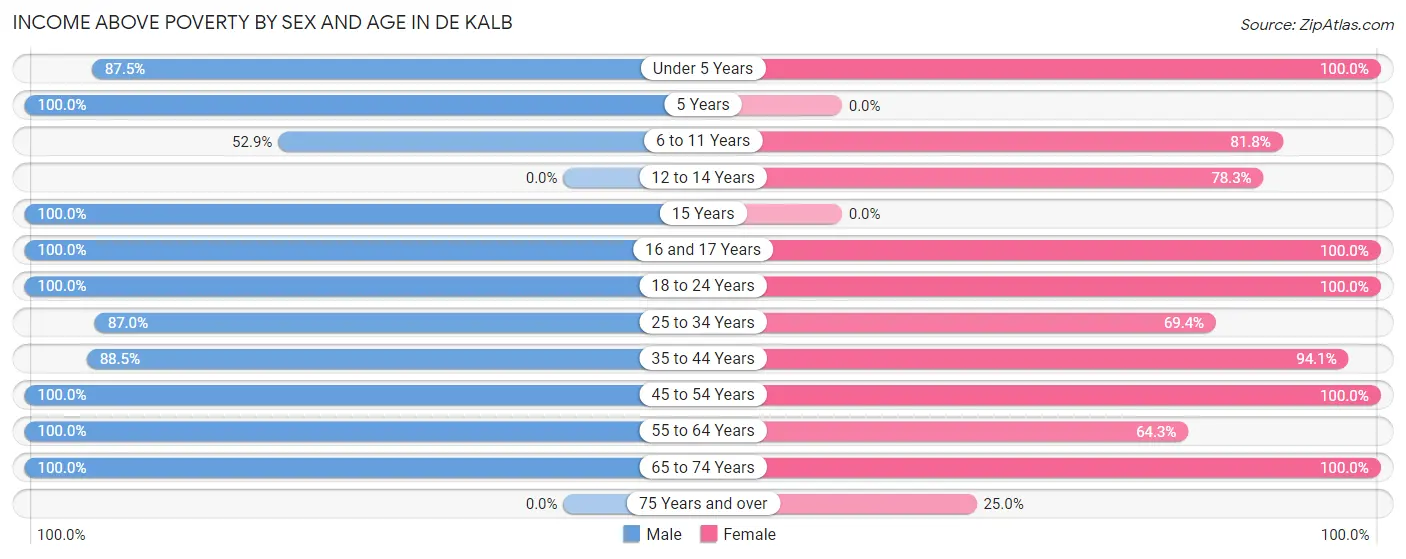
| Age Bracket | Male | Female |
| Under 5 Years | 14 (87.5%) | 53 (100.0%) |
| 5 Years | 13 (100.0%) | 0 (0.0%) |
| 6 to 11 Years | 9 (52.9%) | 18 (81.8%) |
| 12 to 14 Years | 0 (0.0%) | 18 (78.3%) |
| 15 Years | 35 (100.0%) | 0 (0.0%) |
| 16 and 17 Years | 21 (100.0%) | 7 (100.0%) |
| 18 to 24 Years | 21 (100.0%) | 12 (100.0%) |
| 25 to 34 Years | 20 (87.0%) | 25 (69.4%) |
| 35 to 44 Years | 46 (88.5%) | 79 (94.1%) |
| 45 to 54 Years | 28 (100.0%) | 21 (100.0%) |
| 55 to 64 Years | 11 (100.0%) | 9 (64.3%) |
| 65 to 74 Years | 5 (100.0%) | 6 (100.0%) |
| 75 Years and over | 0 (0.0%) | 2 (25.0%) |
| Total | 223 (92.1%) | 250 (87.4%) |
Income Below Poverty Among Married-Couple Families in De Kalb
The poverty statistics for married-couple families in De Kalb show that 2.1% or 2 of the total 93 families live below the poverty line. Families with 1 or 2 children have the highest poverty rate of 4.1%, comprising of 2 families. On the other hand, families with no children have the lowest poverty rate of 0.0%, which includes 0 families.
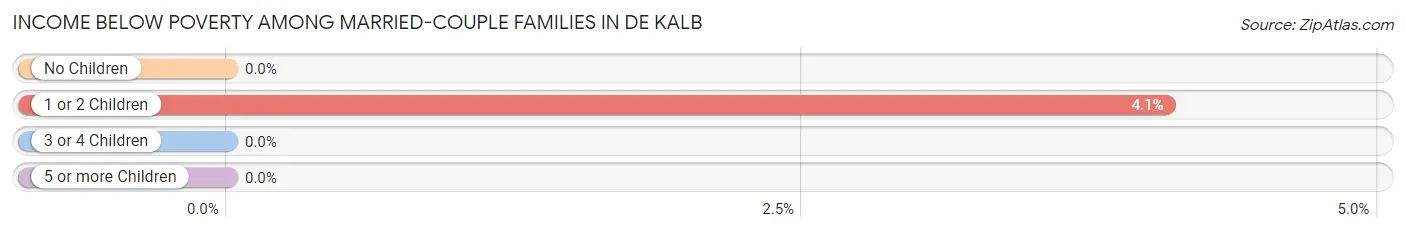
| Children | Above Poverty | Below Poverty |
| No Children | 35 (100.0%) | 0 (0.0%) |
| 1 or 2 Children | 47 (95.9%) | 2 (4.1%) |
| 3 or 4 Children | 9 (100.0%) | 0 (0.0%) |
| 5 or more Children | 0 (0.0%) | 0 (0.0%) |
| Total | 91 (97.9%) | 2 (2.1%) |
Income Below Poverty Among Single-Parent Households in De Kalb
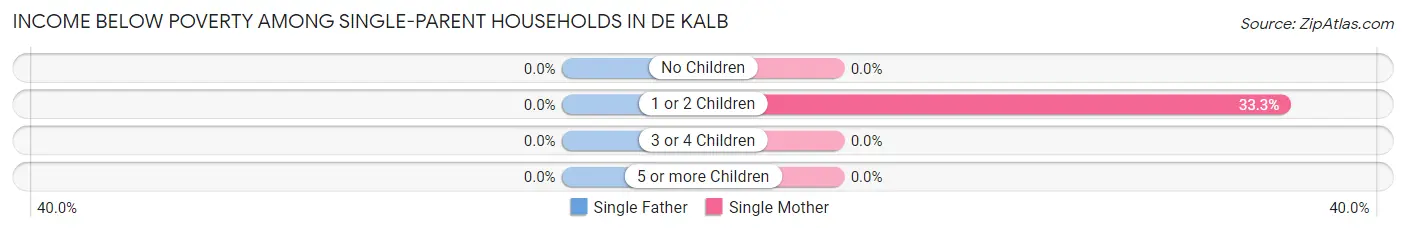
| Children | Single Father | Single Mother |
| No Children | 0 (0.0%) | 0 (0.0%) |
| 1 or 2 Children | 0 (0.0%) | 14 (33.3%) |
| 3 or 4 Children | 0 (0.0%) | 0 (0.0%) |
| 5 or more Children | 0 (0.0%) | 0 (0.0%) |
| Total | 0 (0.0%) | 14 (33.3%) |
Income Below Poverty Among Married-Couple vs Single-Parent Households in De Kalb
The poverty data for De Kalb shows that 2 of the married-couple family households (2.1%) and 14 of the single-parent households (33.3%) are living below the poverty level. Within the married-couple family households, those with 1 or 2 children have the highest poverty rate, with 2 households (4.1%) falling below the poverty line. Among the single-parent households, those with 1 or 2 children have the highest poverty rate, with 14 household (33.3%) living below poverty.
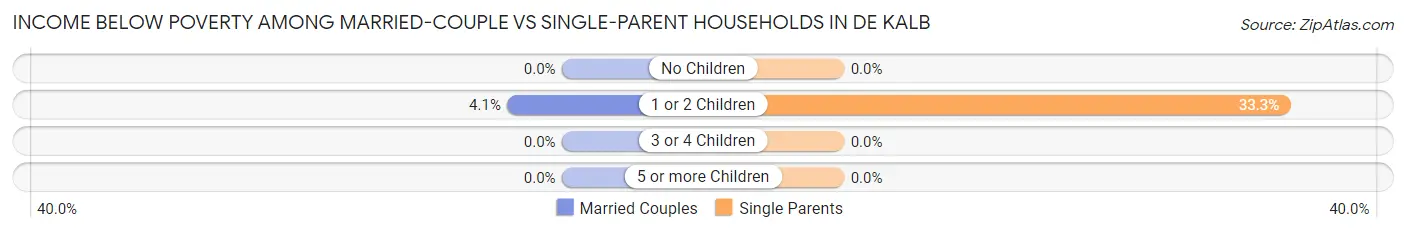
| Children | Married-Couple Families | Single-Parent Households |
| No Children | 0 (0.0%) | 0 (0.0%) |
| 1 or 2 Children | 2 (4.1%) | 14 (33.3%) |
| 3 or 4 Children | 0 (0.0%) | 0 (0.0%) |
| 5 or more Children | 0 (0.0%) | 0 (0.0%) |
| Total | 2 (2.1%) | 14 (33.3%) |
Race in De Kalb
The most populous races in De Kalb are White / Caucasian (521 | 98.7%), and Two or more Races (7 | 1.3%).
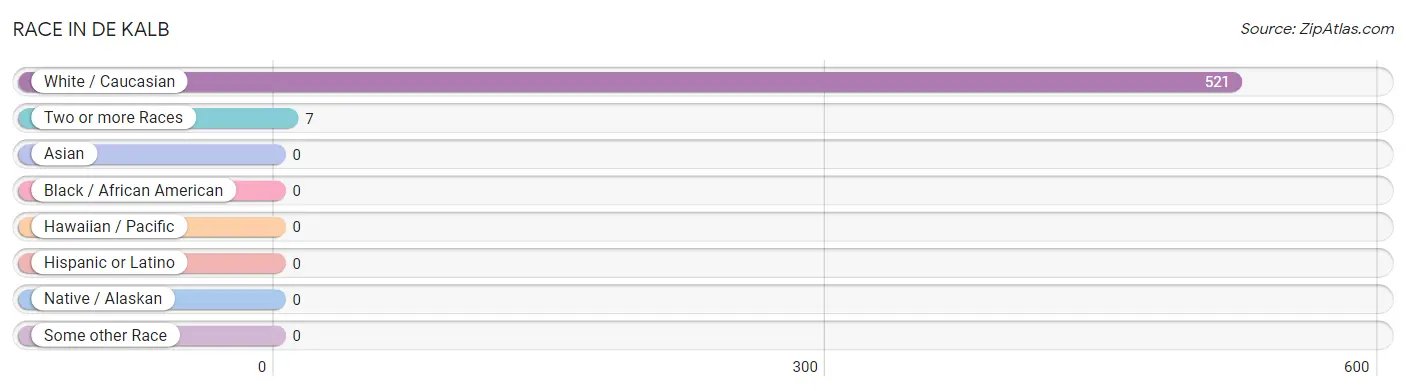
| Race | # Population | % Population |
| Asian | 0 | 0.0% |
| Black / African American | 0 | 0.0% |
| Hawaiian / Pacific | 0 | 0.0% |
| Hispanic or Latino | 0 | 0.0% |
| Native / Alaskan | 0 | 0.0% |
| White / Caucasian | 521 | 98.7% |
| Two or more Races | 7 | 1.3% |
| Some other Race | 0 | 0.0% |
| Total | 528 | 100.0% |
Ancestry in De Kalb
The most populous ancestries reported in De Kalb are American (162 | 30.7%), Irish (140 | 26.5%), German (102 | 19.3%), English (25 | 4.7%), and Italian (13 | 2.5%), together accounting for 83.7% of all De Kalb residents.
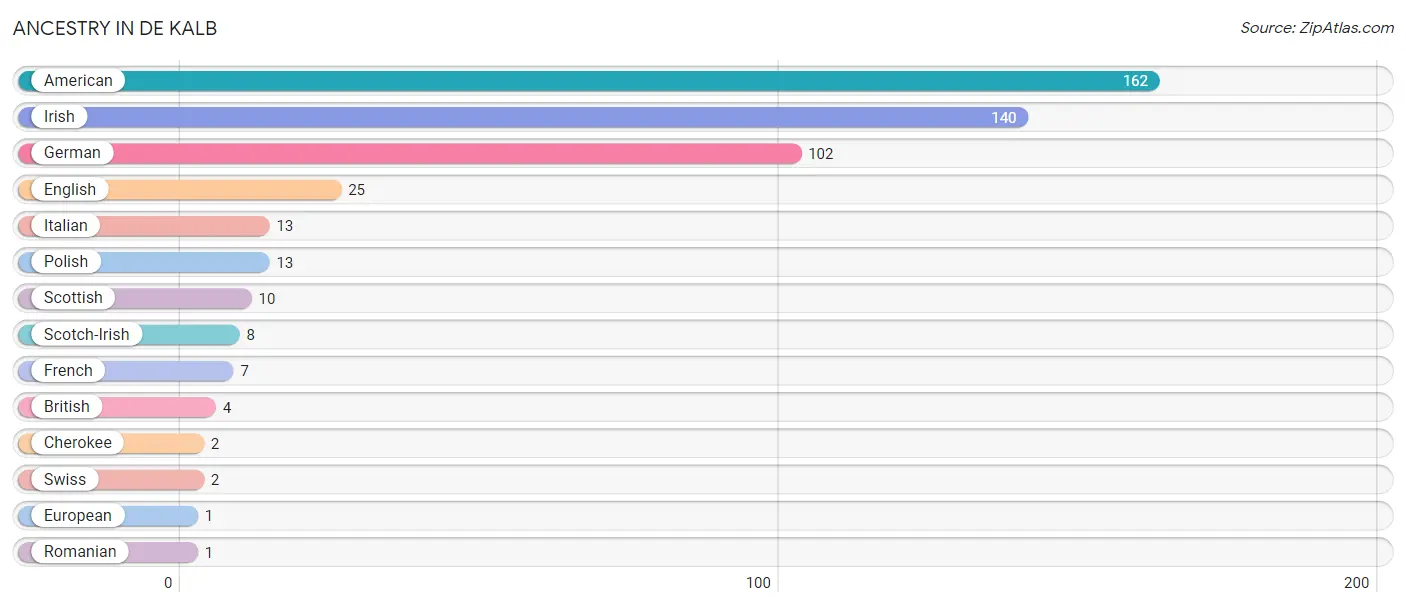
| Ancestry | # Population | % Population |
| American | 162 | 30.7% |
| British | 4 | 0.8% |
| Cherokee | 2 | 0.4% |
| English | 25 | 4.7% |
| European | 1 | 0.2% |
| French | 7 | 1.3% |
| German | 102 | 19.3% |
| Irish | 140 | 26.5% |
| Italian | 13 | 2.5% |
| Polish | 13 | 2.5% |
| Romanian | 1 | 0.2% |
| Scotch-Irish | 8 | 1.5% |
| Scottish | 10 | 1.9% |
| Swiss | 2 | 0.4% | View All 14 Rows |
Immigrants in De Kalb

| Immigration Origin | # Population | % Population | View All 0 Rows |
Sex and Age in De Kalb
Sex and Age in De Kalb
The most populous age groups in De Kalb are 15 to 19 Years (77 | 31.8%) for men and 35 to 39 Years (65 | 22.7%) for women.
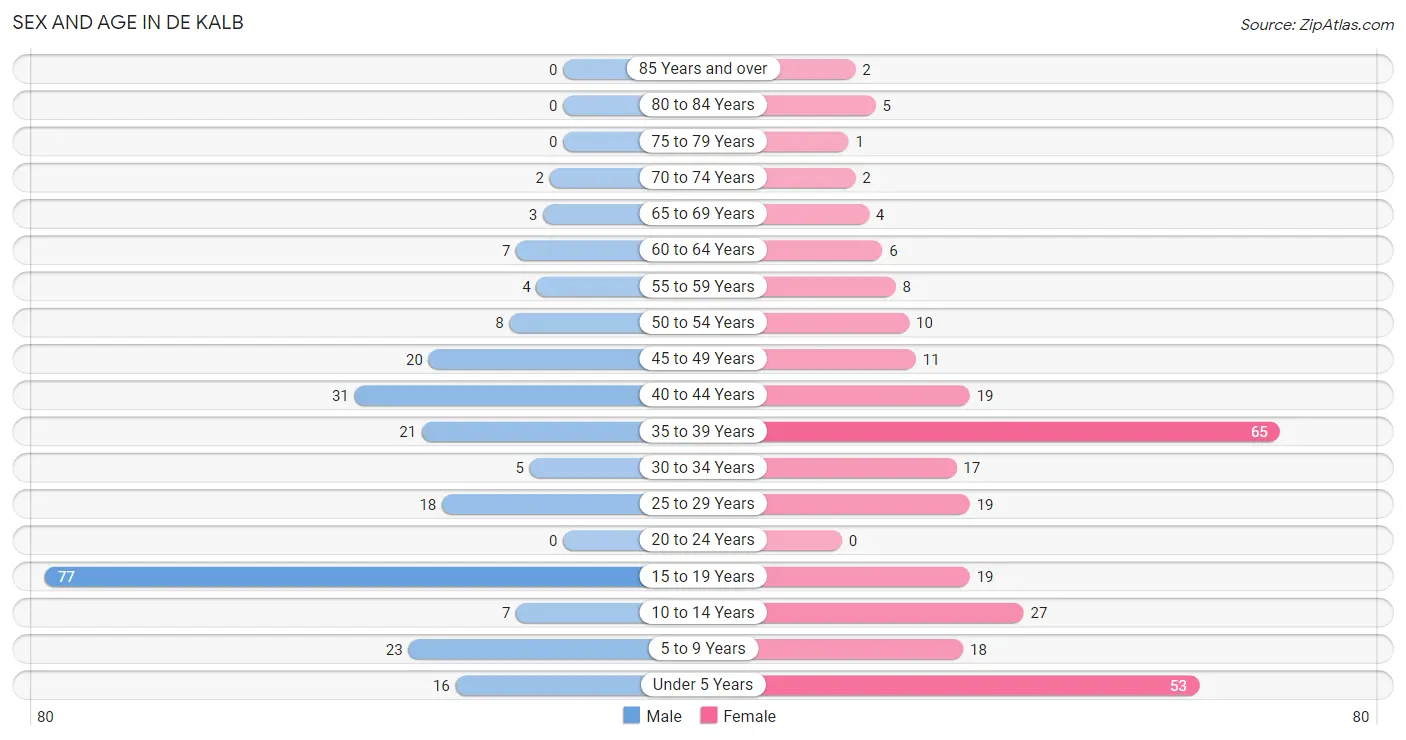
| Age Bracket | Male | Female |
| Under 5 Years | 16 (6.6%) | 53 (18.5%) |
| 5 to 9 Years | 23 (9.5%) | 18 (6.3%) |
| 10 to 14 Years | 7 (2.9%) | 27 (9.4%) |
| 15 to 19 Years | 77 (31.8%) | 19 (6.6%) |
| 20 to 24 Years | 0 (0.0%) | 0 (0.0%) |
| 25 to 29 Years | 18 (7.4%) | 19 (6.6%) |
| 30 to 34 Years | 5 (2.1%) | 17 (5.9%) |
| 35 to 39 Years | 21 (8.7%) | 65 (22.7%) |
| 40 to 44 Years | 31 (12.8%) | 19 (6.6%) |
| 45 to 49 Years | 20 (8.3%) | 11 (3.8%) |
| 50 to 54 Years | 8 (3.3%) | 10 (3.5%) |
| 55 to 59 Years | 4 (1.7%) | 8 (2.8%) |
| 60 to 64 Years | 7 (2.9%) | 6 (2.1%) |
| 65 to 69 Years | 3 (1.2%) | 4 (1.4%) |
| 70 to 74 Years | 2 (0.8%) | 2 (0.7%) |
| 75 to 79 Years | 0 (0.0%) | 1 (0.4%) |
| 80 to 84 Years | 0 (0.0%) | 5 (1.8%) |
| 85 Years and over | 0 (0.0%) | 2 (0.7%) |
| Total | 242 (100.0%) | 286 (100.0%) |
Families and Households in De Kalb
Median Family Size in De Kalb
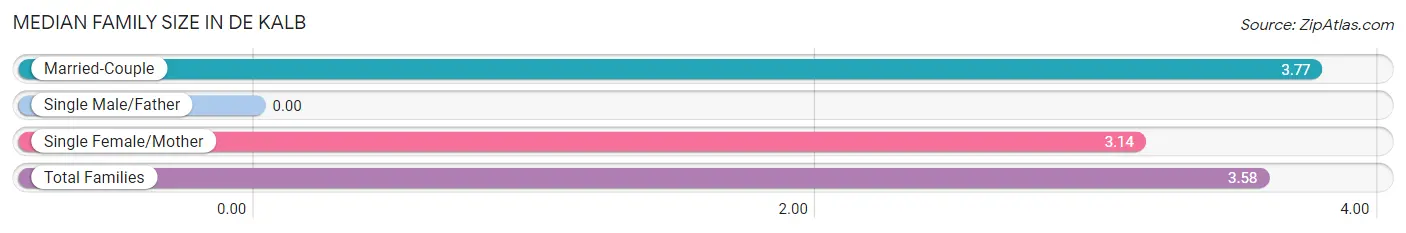
| Family Type | # Families | Family Size |
| Married-Couple | 93 (68.9%) | 3.77 |
| Single Male/Father | 0 (0.0%) | - |
| Single Female/Mother | 42 (31.1%) | 3.14 |
| Total Families | 135 (100.0%) | 3.58 |
Median Household Size in De Kalb
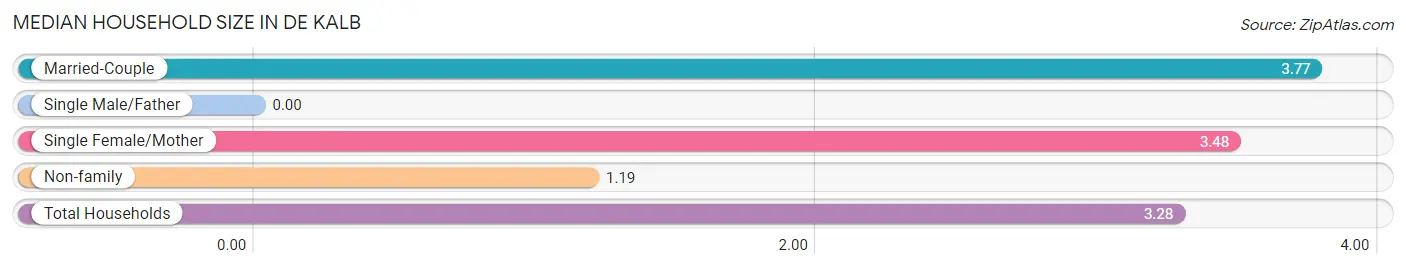
| Household Type | # Households | Household Size |
| Married-Couple | 93 (57.8%) | 3.77 |
| Single Male/Father | 0 (0.0%) | - |
| Single Female/Mother | 42 (26.1%) | 3.48 |
| Non-family | 26 (16.2%) | 1.19 |
| Total Households | 161 (100.0%) | 3.28 |
Household Size by Marriage Status in De Kalb
Out of a total of 161 households in De Kalb, 135 (83.9%) are family households, while 26 (16.2%) are nonfamily households. The most numerous type of family households are 4-person households, comprising 56, and the most common type of nonfamily households are 1-person households, comprising 20.
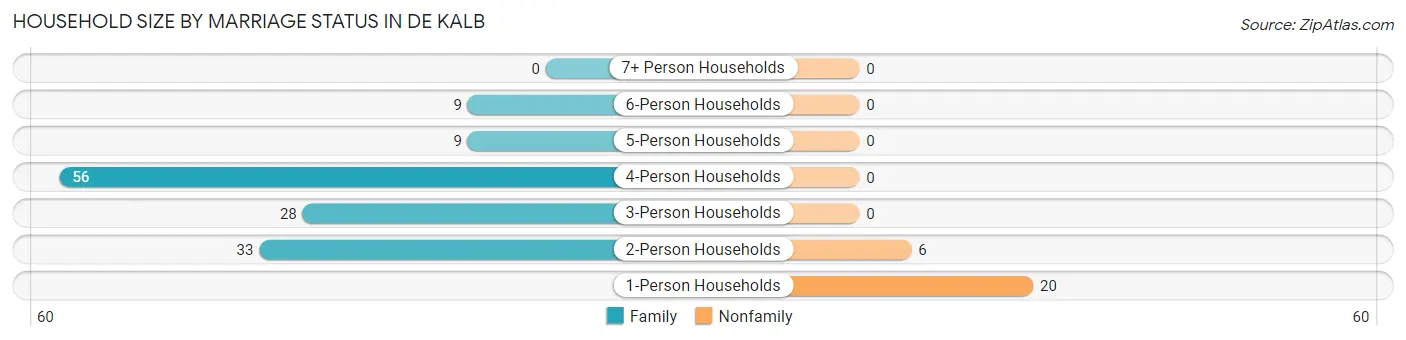
| Household Size | Family Households | Nonfamily Households |
| 1-Person Households | - | 20 (12.4%) |
| 2-Person Households | 33 (20.5%) | 6 (3.7%) |
| 3-Person Households | 28 (17.4%) | 0 (0.0%) |
| 4-Person Households | 56 (34.8%) | 0 (0.0%) |
| 5-Person Households | 9 (5.6%) | 0 (0.0%) |
| 6-Person Households | 9 (5.6%) | 0 (0.0%) |
| 7+ Person Households | 0 (0.0%) | 0 (0.0%) |
| Total | 135 (83.9%) | 26 (16.2%) |
Female Fertility in De Kalb
Fertility by Age in De Kalb
Average fertility rate in De Kalb is 40.0 births per 1,000 women. Women in the age bracket of 20 to 34 years have the highest fertility rate with 167.0 births per 1,000 women. Women in the age bracket of 20 to 34 years acount for 100.0% of all women with births.
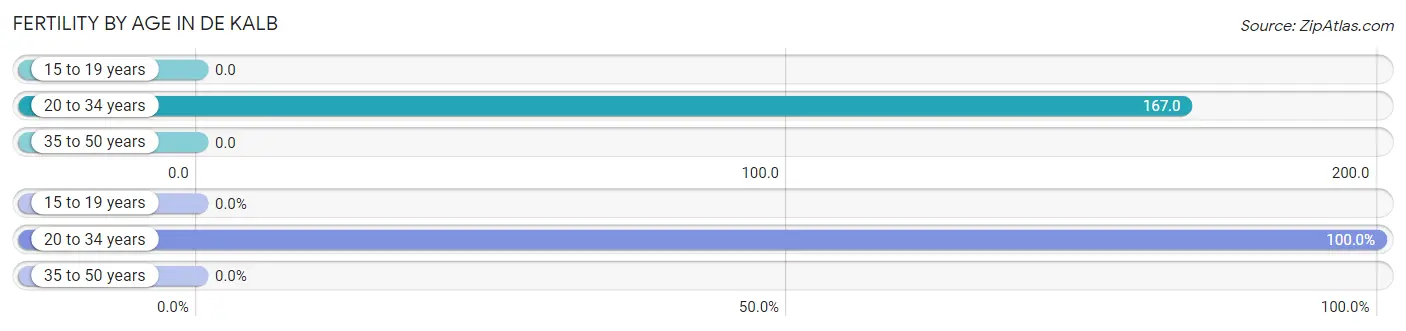
| Age Bracket | Women with Births | Births / 1,000 Women |
| 15 to 19 years | 0 (0.0%) | 0.0 |
| 20 to 34 years | 6 (100.0%) | 167.0 |
| 35 to 50 years | 0 (0.0%) | 0.0 |
| Total | 6 (100.0%) | 40.0 |
Fertility by Age by Marriage Status in De Kalb
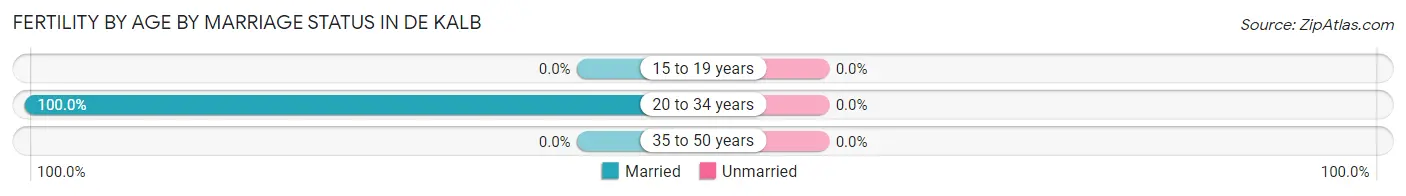
| Age Bracket | Married | Unmarried |
| 15 to 19 years | 0 (0.0%) | 0 (0.0%) |
| 20 to 34 years | 6 (100.0%) | 0 (0.0%) |
| 35 to 50 years | 0 (0.0%) | 0 (0.0%) |
| Total | 6 (100.0%) | 0 (0.0%) |
Fertility by Education in De Kalb
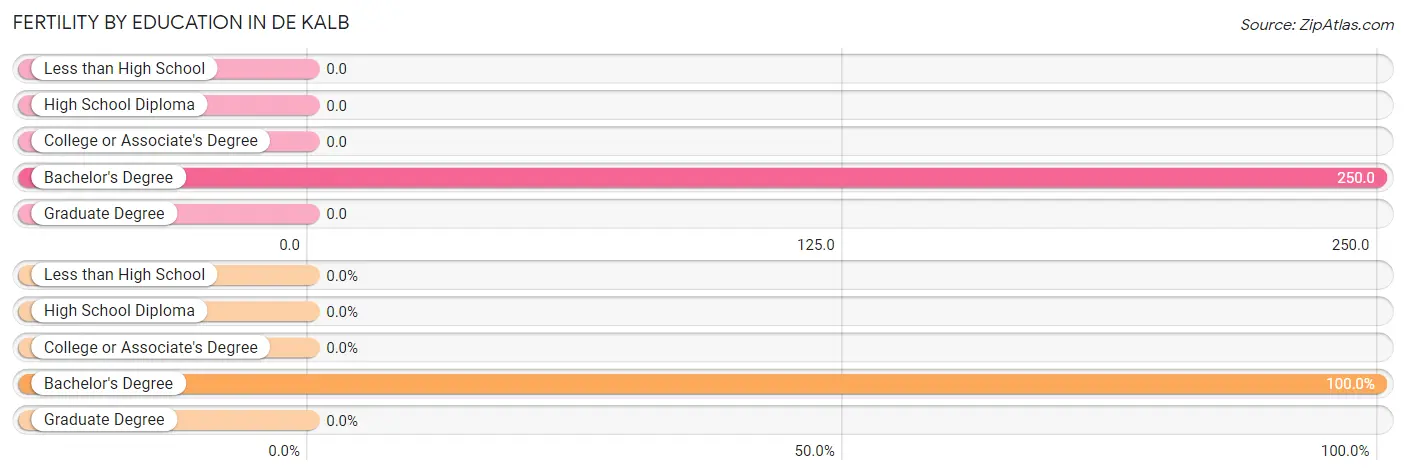
| Educational Attainment | Women with Births | Births / 1,000 Women |
| Less than High School | 0 (0.0%) | 0.0 |
| High School Diploma | 0 (0.0%) | 0.0 |
| College or Associate's Degree | 0 (0.0%) | 0.0 |
| Bachelor's Degree | 6 (100.0%) | 250.0 |
| Graduate Degree | 0 (0.0%) | 0.0 |
| Total | 6 (100.0%) | 40.0 |
Fertility by Education by Marriage Status in De Kalb
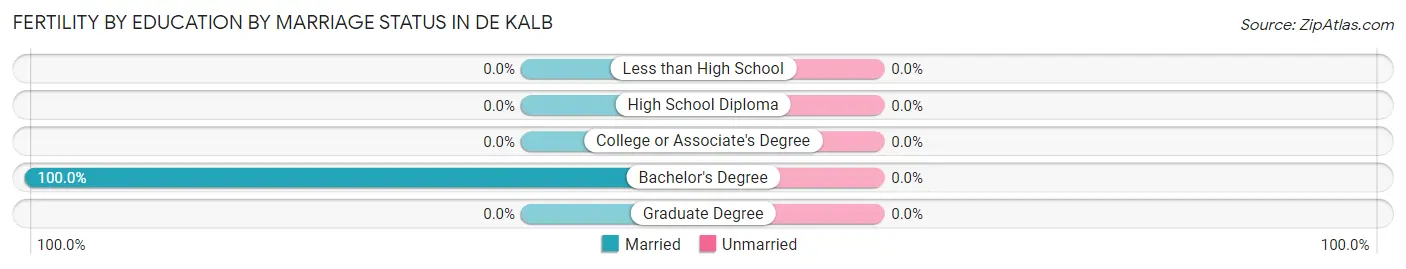
| Educational Attainment | Married | Unmarried |
| Less than High School | 0 (0.0%) | 0 (0.0%) |
| High School Diploma | 0 (0.0%) | 0 (0.0%) |
| College or Associate's Degree | 0 (0.0%) | 0 (0.0%) |
| Bachelor's Degree | 6 (100.0%) | 0 (0.0%) |
| Graduate Degree | 0 (0.0%) | 0 (0.0%) |
| Total | 6 (100.0%) | 0 (0.0%) |
Employment Characteristics in De Kalb
Employment by Class of Employer in De Kalb
Among the 241 employed individuals in De Kalb, private company employees (174 | 72.2%), self-employed (not incorporated) (20 | 8.3%), and local government employees (19 | 7.9%) make up the most common classes of employment.
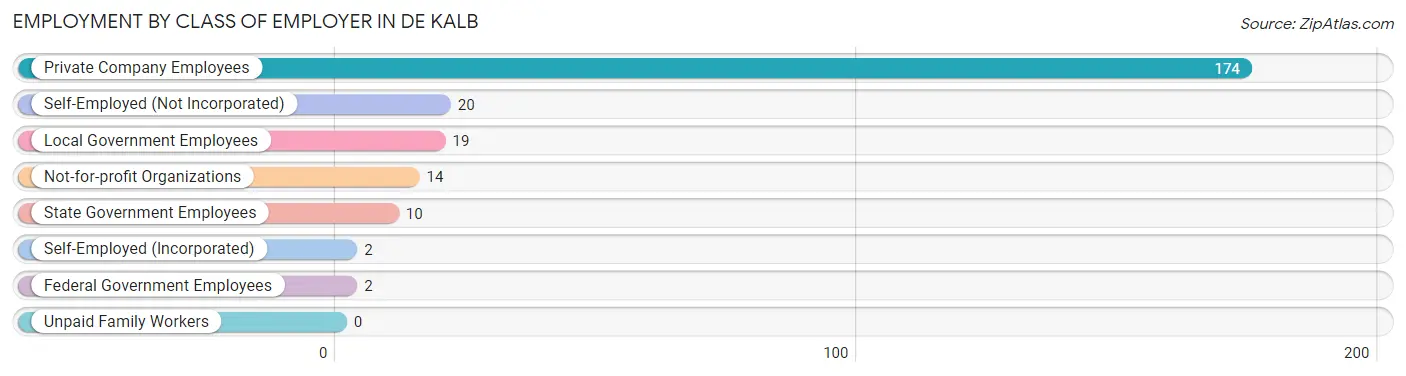
| Employer Class | # Employees | % Employees |
| Private Company Employees | 174 | 72.2% |
| Self-Employed (Incorporated) | 2 | 0.8% |
| Self-Employed (Not Incorporated) | 20 | 8.3% |
| Not-for-profit Organizations | 14 | 5.8% |
| Local Government Employees | 19 | 7.9% |
| State Government Employees | 10 | 4.2% |
| Federal Government Employees | 2 | 0.8% |
| Unpaid Family Workers | 0 | 0.0% |
| Total | 241 | 100.0% |
Employment Status by Age in De Kalb
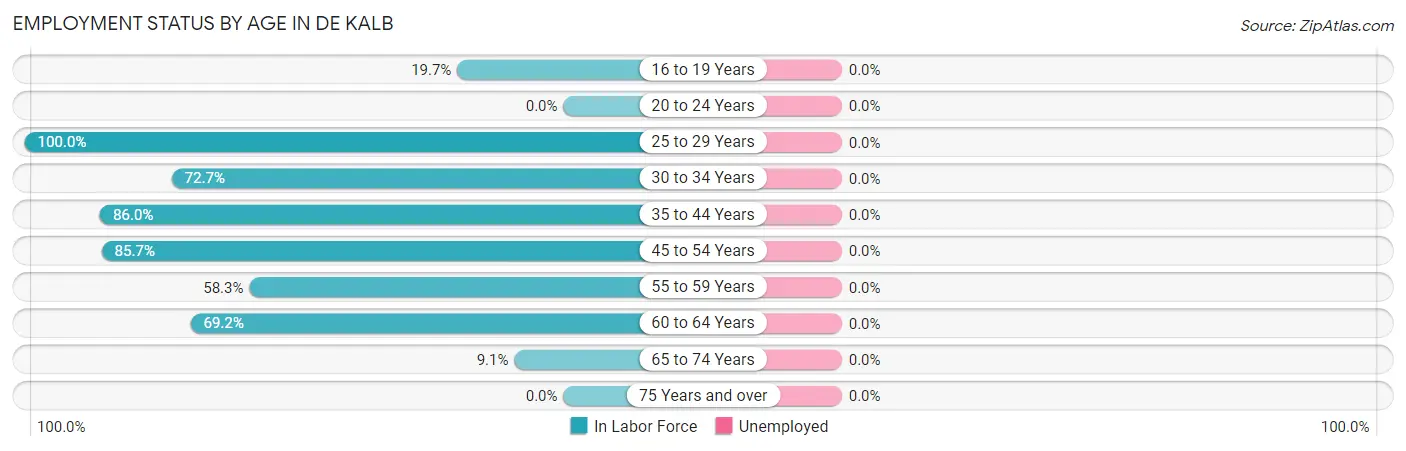
| Age Bracket | In Labor Force | Unemployed |
| 16 to 19 Years | 12 (19.7%) | 0 (0.0%) |
| 20 to 24 Years | 0 (0.0%) | 0 (0.0%) |
| 25 to 29 Years | 37 (100.0%) | 0 (0.0%) |
| 30 to 34 Years | 16 (72.7%) | 0 (0.0%) |
| 35 to 44 Years | 117 (86.0%) | 0 (0.0%) |
| 45 to 54 Years | 42 (85.7%) | 0 (0.0%) |
| 55 to 59 Years | 7 (58.3%) | 0 (0.0%) |
| 60 to 64 Years | 9 (69.2%) | 0 (0.0%) |
| 65 to 74 Years | 1 (9.1%) | 0 (0.0%) |
| 75 Years and over | 0 (0.0%) | 0 (0.0%) |
| Total | 241 (69.1%) | 0 (0.0%) |
Employment Status by Educational Attainment in De Kalb
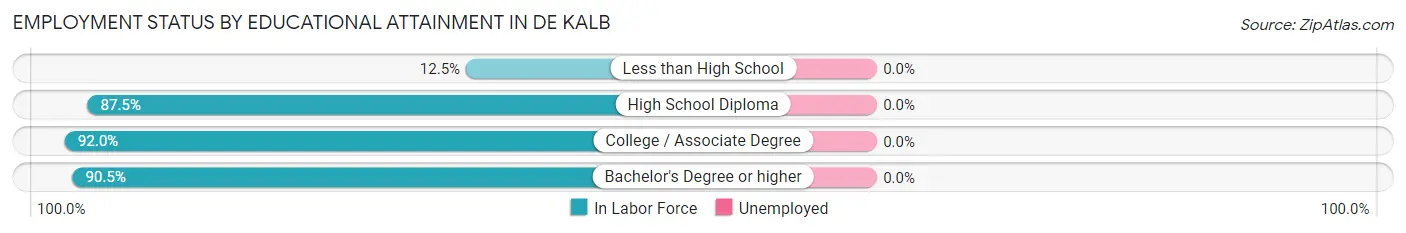
| Educational Attainment | In Labor Force | Unemployed |
| Less than High School | 2 (12.5%) | 0 (0.0%) |
| High School Diploma | 119 (87.5%) | 0 (0.0%) |
| College / Associate Degree | 69 (92.0%) | 0 (0.0%) |
| Bachelor's Degree or higher | 38 (90.5%) | 0 (0.0%) |
| Total | 228 (84.8%) | 0 (0.0%) |
Employment Occupations by Sex in De Kalb
Management, Business, Science and Arts Occupations
The most common Management, Business, Science and Arts occupations in De Kalb are Business & Financial (26 | 10.8%), Community & Social Service (12 | 5.0%), Education Instruction & Library (10 | 4.2%), Health Diagnosing & Treating (6 | 2.5%), and Health Technologists (4 | 1.7%).
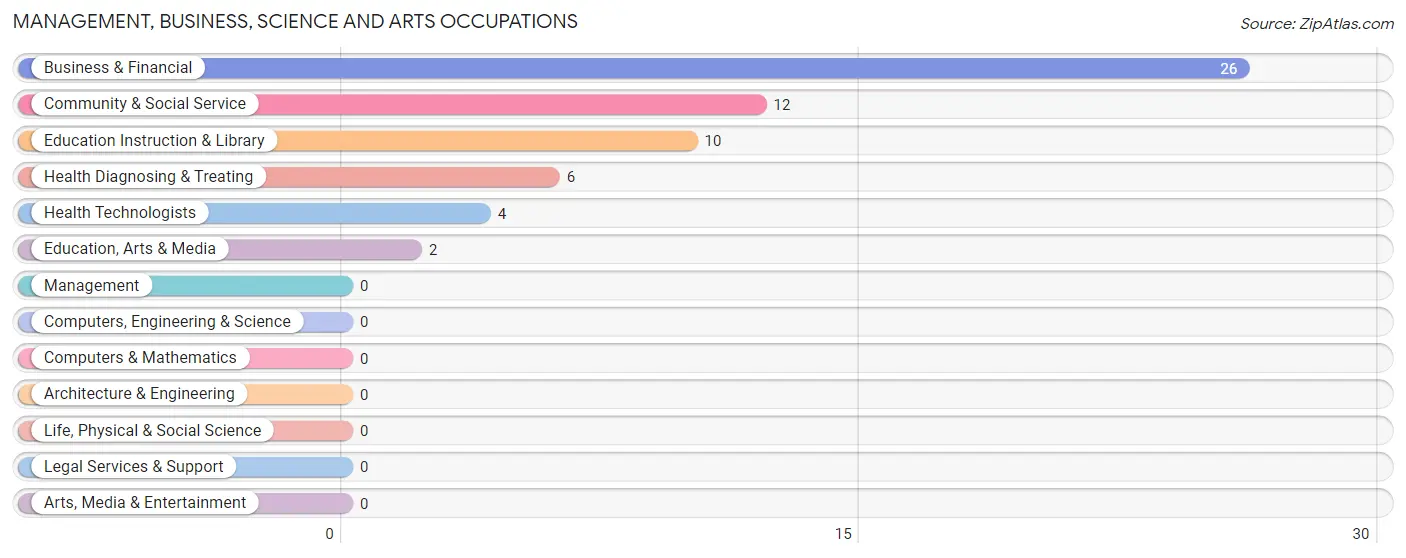
Management, Business, Science and Arts Occupations by Sex
Within the Management, Business, Science and Arts occupations in De Kalb, the most male-oriented occupations are Education, Arts & Media (100.0%), Business & Financial (92.3%), and Community & Social Service (33.3%), while the most female-oriented occupations are Health Diagnosing & Treating (100.0%), Health Technologists (100.0%), and Education Instruction & Library (80.0%).
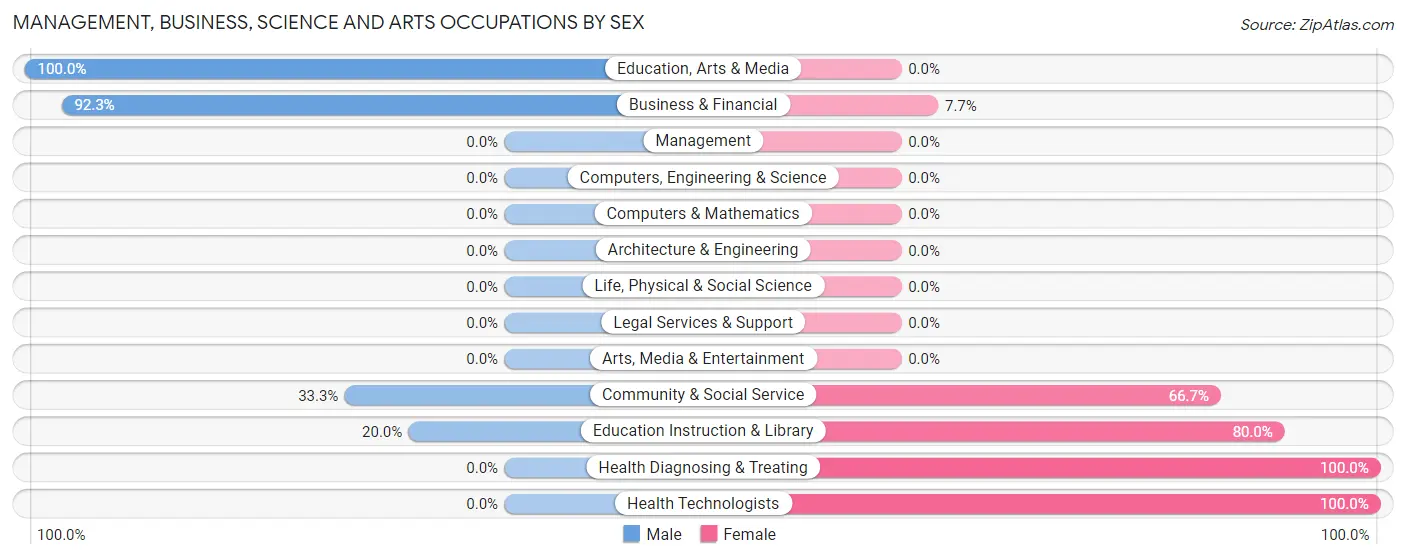
| Occupation | Male | Female |
| Management | 0 (0.0%) | 0 (0.0%) |
| Business & Financial | 24 (92.3%) | 2 (7.7%) |
| Computers, Engineering & Science | 0 (0.0%) | 0 (0.0%) |
| Computers & Mathematics | 0 (0.0%) | 0 (0.0%) |
| Architecture & Engineering | 0 (0.0%) | 0 (0.0%) |
| Life, Physical & Social Science | 0 (0.0%) | 0 (0.0%) |
| Community & Social Service | 4 (33.3%) | 8 (66.7%) |
| Education, Arts & Media | 2 (100.0%) | 0 (0.0%) |
| Legal Services & Support | 0 (0.0%) | 0 (0.0%) |
| Education Instruction & Library | 2 (20.0%) | 8 (80.0%) |
| Arts, Media & Entertainment | 0 (0.0%) | 0 (0.0%) |
| Health Diagnosing & Treating | 0 (0.0%) | 6 (100.0%) |
| Health Technologists | 0 (0.0%) | 4 (100.0%) |
| Total (Category) | 28 (63.6%) | 16 (36.4%) |
| Total (Overall) | 105 (43.6%) | 136 (56.4%) |
Services Occupations
The most common Services occupations in De Kalb are Food Preparation & Serving (16 | 6.6%), Security & Protection (15 | 6.2%), Law Enforcement (8 | 3.3%), Firefighting & Prevention (7 | 2.9%), and Cleaning & Maintenance (5 | 2.1%).
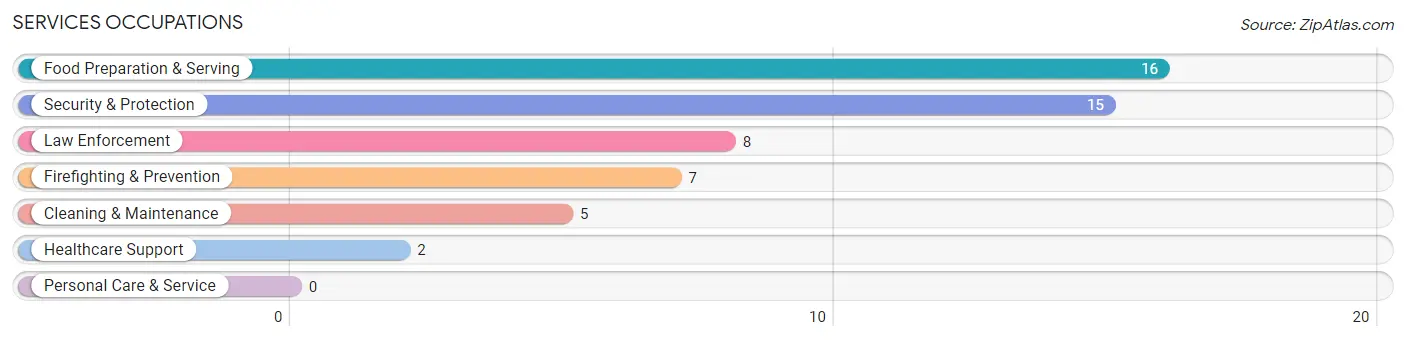
Services Occupations by Sex
Within the Services occupations in De Kalb, the most male-oriented occupations are Security & Protection (100.0%), Firefighting & Prevention (100.0%), and Law Enforcement (100.0%), while the most female-oriented occupations are Healthcare Support (100.0%), and Food Preparation & Serving (100.0%).
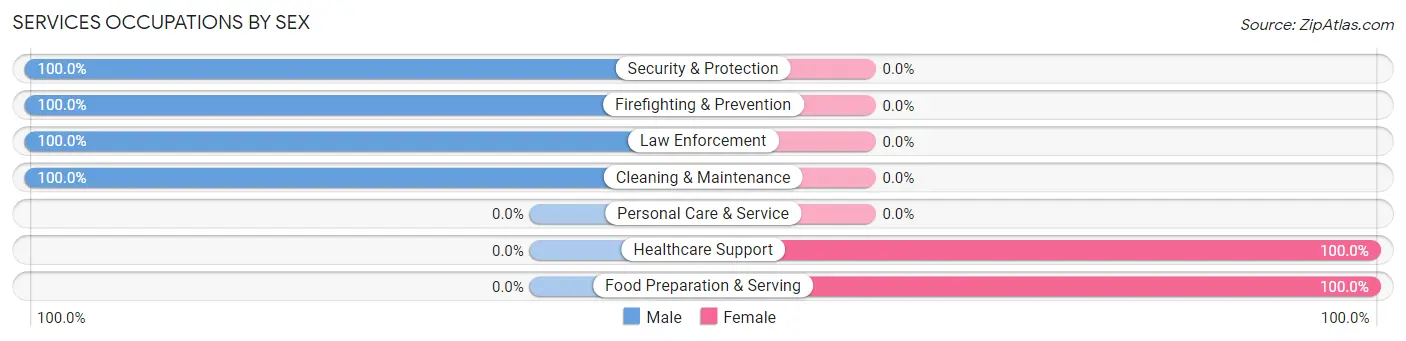
| Occupation | Male | Female |
| Healthcare Support | 0 (0.0%) | 2 (100.0%) |
| Security & Protection | 15 (100.0%) | 0 (0.0%) |
| Firefighting & Prevention | 7 (100.0%) | 0 (0.0%) |
| Law Enforcement | 8 (100.0%) | 0 (0.0%) |
| Food Preparation & Serving | 0 (0.0%) | 16 (100.0%) |
| Cleaning & Maintenance | 5 (100.0%) | 0 (0.0%) |
| Personal Care & Service | 0 (0.0%) | 0 (0.0%) |
| Total (Category) | 20 (52.6%) | 18 (47.4%) |
| Total (Overall) | 105 (43.6%) | 136 (56.4%) |
Sales and Office Occupations
The most common Sales and Office occupations in De Kalb are Office & Administration (15 | 6.2%), and Sales & Related (10 | 4.2%).
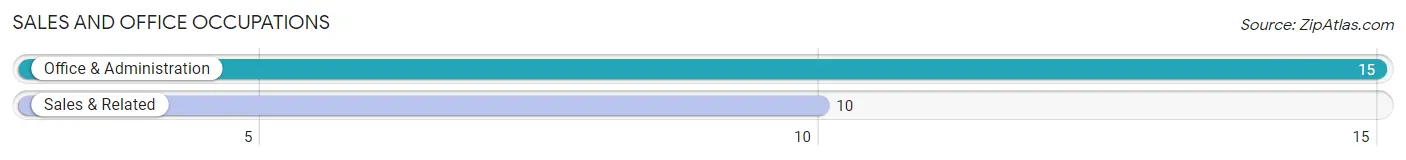
Sales and Office Occupations by Sex
| Occupation | Male | Female |
| Sales & Related | 0 (0.0%) | 10 (100.0%) |
| Office & Administration | 0 (0.0%) | 15 (100.0%) |
| Total (Category) | 0 (0.0%) | 25 (100.0%) |
| Total (Overall) | 105 (43.6%) | 136 (56.4%) |
Natural Resources, Construction and Maintenance Occupations
The most common Natural Resources, Construction and Maintenance occupations in De Kalb are Construction & Extraction (28 | 11.6%), Installation, Maintenance & Repair (11 | 4.6%), and Farming, Fishing & Forestry (2 | 0.8%).
Natural Resources, Construction and Maintenance Occupations by Sex
| Occupation | Male | Female |
| Farming, Fishing & Forestry | 2 (100.0%) | 0 (0.0%) |
| Construction & Extraction | 13 (46.4%) | 15 (53.6%) |
| Installation, Maintenance & Repair | 10 (90.9%) | 1 (9.1%) |
| Total (Category) | 25 (61.0%) | 16 (39.0%) |
| Total (Overall) | 105 (43.6%) | 136 (56.4%) |
Production, Transportation and Moving Occupations
The most common Production, Transportation and Moving occupations in De Kalb are Production (59 | 24.5%), Material Moving (27 | 11.2%), and Transportation (7 | 2.9%).
Production, Transportation and Moving Occupations by Sex
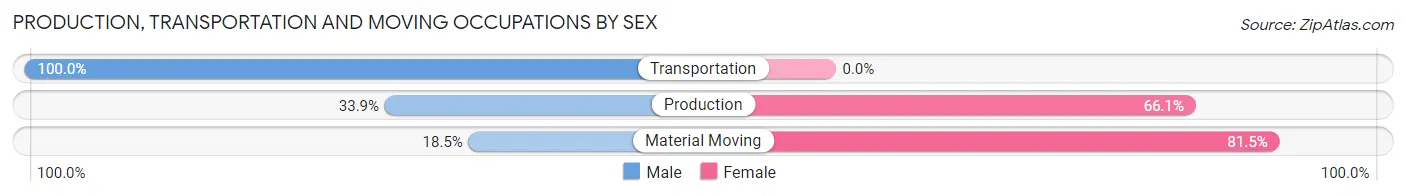
| Occupation | Male | Female |
| Production | 20 (33.9%) | 39 (66.1%) |
| Transportation | 7 (100.0%) | 0 (0.0%) |
| Material Moving | 5 (18.5%) | 22 (81.5%) |
| Total (Category) | 32 (34.4%) | 61 (65.6%) |
| Total (Overall) | 105 (43.6%) | 136 (56.4%) |
Employment Industries by Sex in De Kalb
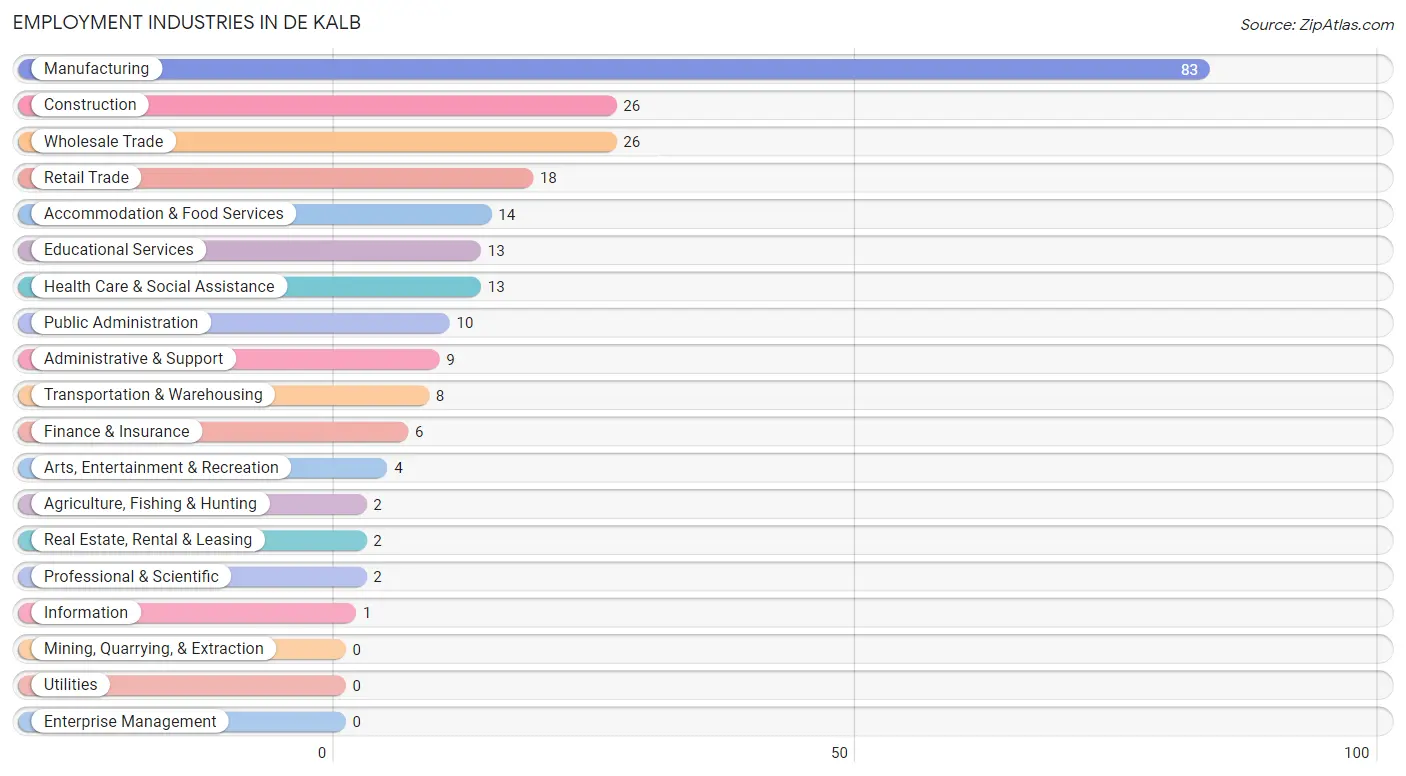
Employment Industries in De Kalb
The major employment industries in De Kalb include Manufacturing (83 | 34.4%), Construction (26 | 10.8%), Wholesale Trade (26 | 10.8%), Retail Trade (18 | 7.5%), and Accommodation & Food Services (14 | 5.8%).
Employment Industries by Sex in De Kalb
The De Kalb industries that see more men than women are Agriculture, Fishing & Hunting (100.0%), Wholesale Trade (100.0%), and Administrative & Support (100.0%), whereas the industries that tend to have a higher number of women are Information (100.0%), Real Estate, Rental & Leasing (100.0%), and Professional & Scientific (100.0%).
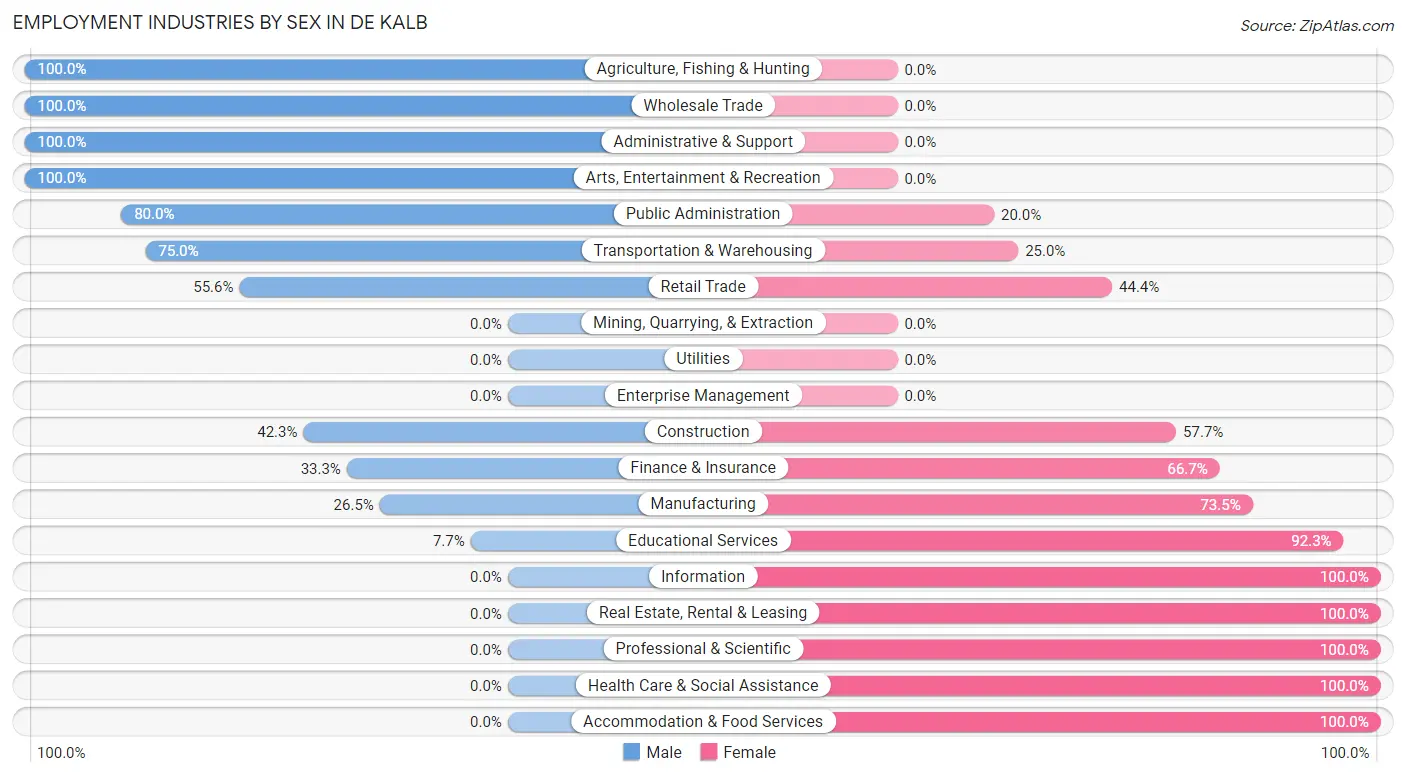
| Industry | Male | Female |
| Agriculture, Fishing & Hunting | 2 (100.0%) | 0 (0.0%) |
| Mining, Quarrying, & Extraction | 0 (0.0%) | 0 (0.0%) |
| Construction | 11 (42.3%) | 15 (57.7%) |
| Manufacturing | 22 (26.5%) | 61 (73.5%) |
| Wholesale Trade | 26 (100.0%) | 0 (0.0%) |
| Retail Trade | 10 (55.6%) | 8 (44.4%) |
| Transportation & Warehousing | 6 (75.0%) | 2 (25.0%) |
| Utilities | 0 (0.0%) | 0 (0.0%) |
| Information | 0 (0.0%) | 1 (100.0%) |
| Finance & Insurance | 2 (33.3%) | 4 (66.7%) |
| Real Estate, Rental & Leasing | 0 (0.0%) | 2 (100.0%) |
| Professional & Scientific | 0 (0.0%) | 2 (100.0%) |
| Enterprise Management | 0 (0.0%) | 0 (0.0%) |
| Administrative & Support | 9 (100.0%) | 0 (0.0%) |
| Educational Services | 1 (7.7%) | 12 (92.3%) |
| Health Care & Social Assistance | 0 (0.0%) | 13 (100.0%) |
| Arts, Entertainment & Recreation | 4 (100.0%) | 0 (0.0%) |
| Accommodation & Food Services | 0 (0.0%) | 14 (100.0%) |
| Public Administration | 8 (80.0%) | 2 (20.0%) |
| Total | 105 (43.6%) | 136 (56.4%) |
Education in De Kalb
School Enrollment in De Kalb
The most common levels of schooling among the 144 students in De Kalb are high school (70 | 48.6%), middle school (34 | 23.6%), and elementary school (26 | 18.1%).
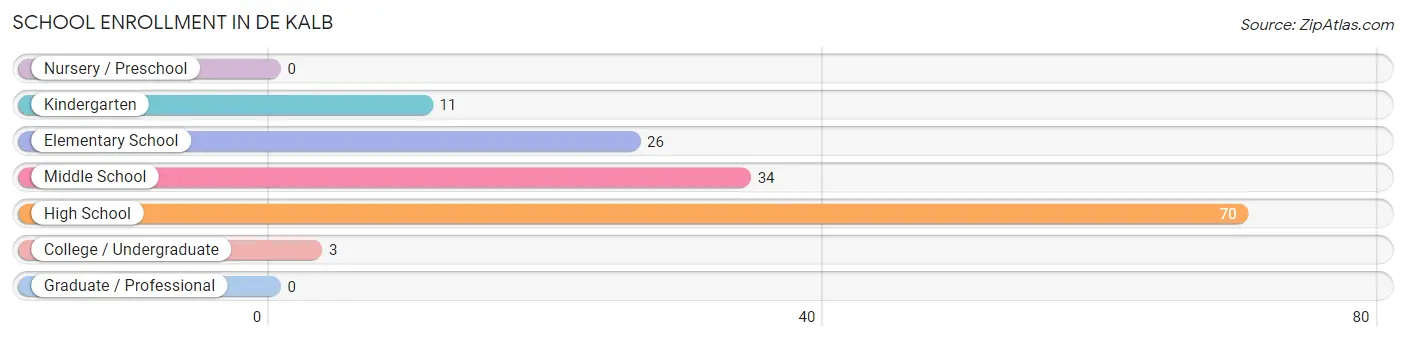
| School Level | # Students | % Students |
| Nursery / Preschool | 0 | 0.0% |
| Kindergarten | 11 | 7.6% |
| Elementary School | 26 | 18.1% |
| Middle School | 34 | 23.6% |
| High School | 70 | 48.6% |
| College / Undergraduate | 3 | 2.1% |
| Graduate / Professional | 0 | 0.0% |
| Total | 144 | 100.0% |
School Enrollment by Age by Funding Source in De Kalb
Out of a total of 144 students who are enrolled in schools in De Kalb, 1 (0.7%) attend a private institution, while the remaining 143 (99.3%) are enrolled in public schools. The age group of 35 years and over has the highest likelihood of being enrolled in private schools, with 1 (33.3% in the age bracket) enrolled. Conversely, the age group of 5 to 9 year old has the lowest likelihood of being enrolled in a private school, with 37 (100.0% in the age bracket) attending a public institution.
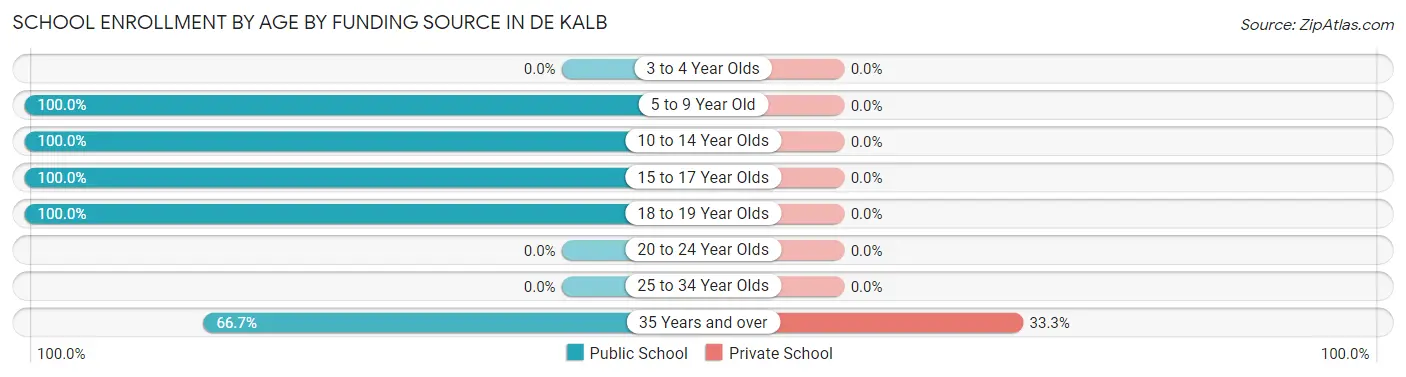
| Age Bracket | Public School | Private School |
| 3 to 4 Year Olds | 0 (0.0%) | 0 (0.0%) |
| 5 to 9 Year Old | 37 (100.0%) | 0 (0.0%) |
| 10 to 14 Year Olds | 34 (100.0%) | 0 (0.0%) |
| 15 to 17 Year Olds | 63 (100.0%) | 0 (0.0%) |
| 18 to 19 Year Olds | 7 (100.0%) | 0 (0.0%) |
| 20 to 24 Year Olds | 0 (0.0%) | 0 (0.0%) |
| 25 to 34 Year Olds | 0 (0.0%) | 0 (0.0%) |
| 35 Years and over | 2 (66.7%) | 1 (33.3%) |
| Total | 143 (99.3%) | 1 (0.7%) |
Educational Attainment by Field of Study in De Kalb
Arts & humanities (12 | 26.1%), psychology (11 | 23.9%), science & technology (11 | 23.9%), education (7 | 15.2%), and business (2 | 4.3%) are the most common fields of study among 46 individuals in De Kalb who have obtained a bachelor's degree or higher.
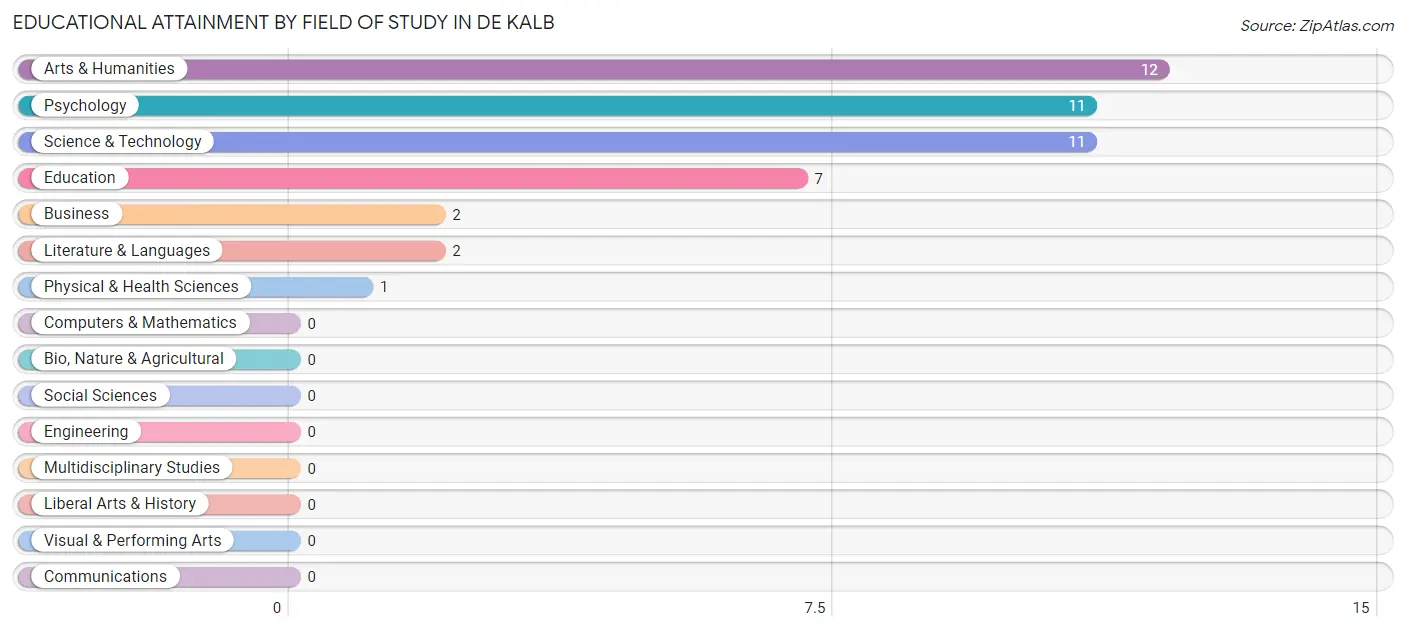
| Field of Study | # Graduates | % Graduates |
| Computers & Mathematics | 0 | 0.0% |
| Bio, Nature & Agricultural | 0 | 0.0% |
| Physical & Health Sciences | 1 | 2.2% |
| Psychology | 11 | 23.9% |
| Social Sciences | 0 | 0.0% |
| Engineering | 0 | 0.0% |
| Multidisciplinary Studies | 0 | 0.0% |
| Science & Technology | 11 | 23.9% |
| Business | 2 | 4.3% |
| Education | 7 | 15.2% |
| Literature & Languages | 2 | 4.3% |
| Liberal Arts & History | 0 | 0.0% |
| Visual & Performing Arts | 0 | 0.0% |
| Communications | 0 | 0.0% |
| Arts & Humanities | 12 | 26.1% |
| Total | 46 | 100.0% |
Transportation & Commute in De Kalb
Vehicle Availability by Sex in De Kalb
The most prevalent vehicle ownership categories in De Kalb are males with 2 vehicles (54, accounting for 51.4%) and females with 2 vehicles (84, making up 39.7%).
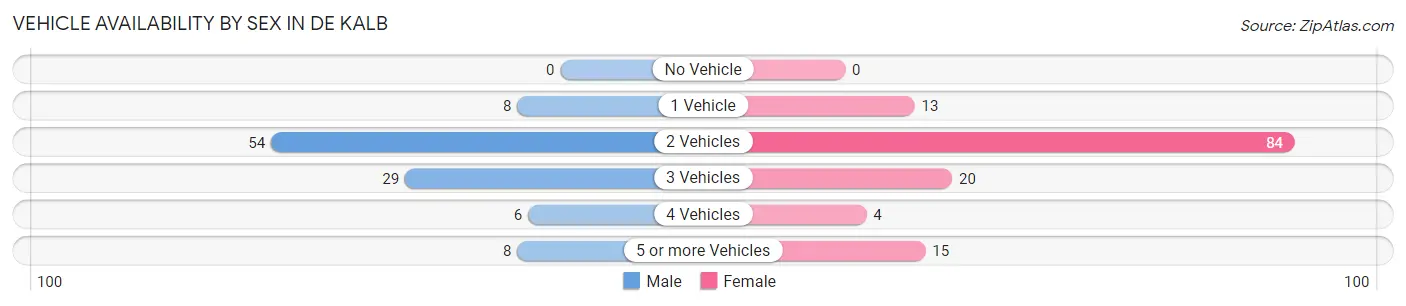
| Vehicles Available | Male | Female |
| No Vehicle | 0 (0.0%) | 0 (0.0%) |
| 1 Vehicle | 8 (7.6%) | 13 (9.6%) |
| 2 Vehicles | 54 (51.4%) | 84 (61.8%) |
| 3 Vehicles | 29 (27.6%) | 20 (14.7%) |
| 4 Vehicles | 6 (5.7%) | 4 (2.9%) |
| 5 or more Vehicles | 8 (7.6%) | 15 (11.0%) |
| Total | 105 (100.0%) | 136 (100.0%) |
Commute Time in De Kalb
The most frequently occuring commute durations in De Kalb are 35 to 39 minutes (40 commuters, 17.9%), 20 to 24 minutes (38 commuters, 17.0%), and 25 to 29 minutes (34 commuters, 15.2%).
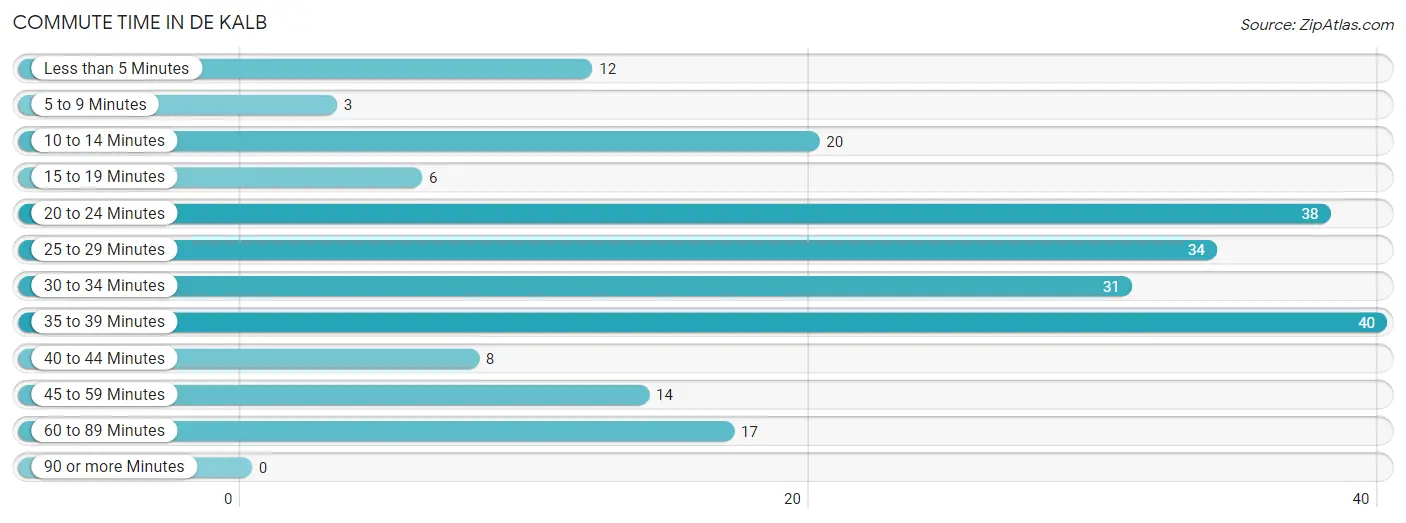
| Commute Time | # Commuters | % Commuters |
| Less than 5 Minutes | 12 | 5.4% |
| 5 to 9 Minutes | 3 | 1.3% |
| 10 to 14 Minutes | 20 | 9.0% |
| 15 to 19 Minutes | 6 | 2.7% |
| 20 to 24 Minutes | 38 | 17.0% |
| 25 to 29 Minutes | 34 | 15.2% |
| 30 to 34 Minutes | 31 | 13.9% |
| 35 to 39 Minutes | 40 | 17.9% |
| 40 to 44 Minutes | 8 | 3.6% |
| 45 to 59 Minutes | 14 | 6.3% |
| 60 to 89 Minutes | 17 | 7.6% |
| 90 or more Minutes | 0 | 0.0% |
Commute Time by Sex in De Kalb
The most common commute times in De Kalb are 25 to 29 minutes (30 commuters, 30.9%) for males and 35 to 39 minutes (40 commuters, 31.8%) for females.
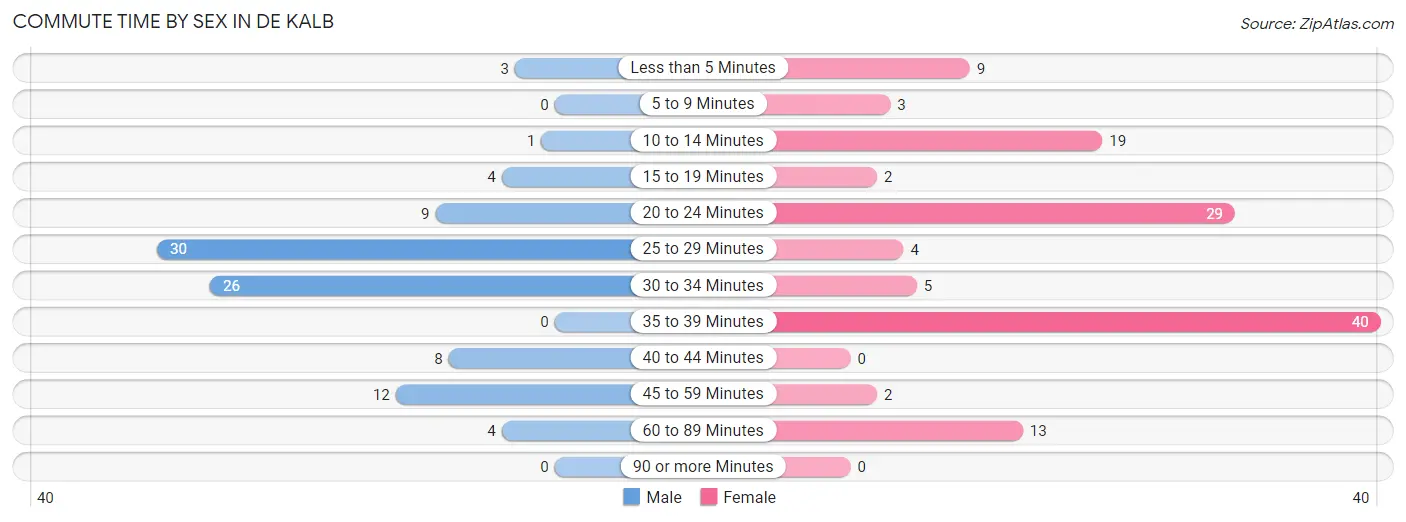
| Commute Time | Male | Female |
| Less than 5 Minutes | 3 (3.1%) | 9 (7.1%) |
| 5 to 9 Minutes | 0 (0.0%) | 3 (2.4%) |
| 10 to 14 Minutes | 1 (1.0%) | 19 (15.1%) |
| 15 to 19 Minutes | 4 (4.1%) | 2 (1.6%) |
| 20 to 24 Minutes | 9 (9.3%) | 29 (23.0%) |
| 25 to 29 Minutes | 30 (30.9%) | 4 (3.2%) |
| 30 to 34 Minutes | 26 (26.8%) | 5 (4.0%) |
| 35 to 39 Minutes | 0 (0.0%) | 40 (31.8%) |
| 40 to 44 Minutes | 8 (8.3%) | 0 (0.0%) |
| 45 to 59 Minutes | 12 (12.4%) | 2 (1.6%) |
| 60 to 89 Minutes | 4 (4.1%) | 13 (10.3%) |
| 90 or more Minutes | 0 (0.0%) | 0 (0.0%) |
Time of Departure to Work by Sex in De Kalb
The most frequent times of departure to work in De Kalb are 12:00 AM to 4:59 AM (35, 36.1%) for males and 6:30 AM to 6:59 AM (40, 31.8%) for females.
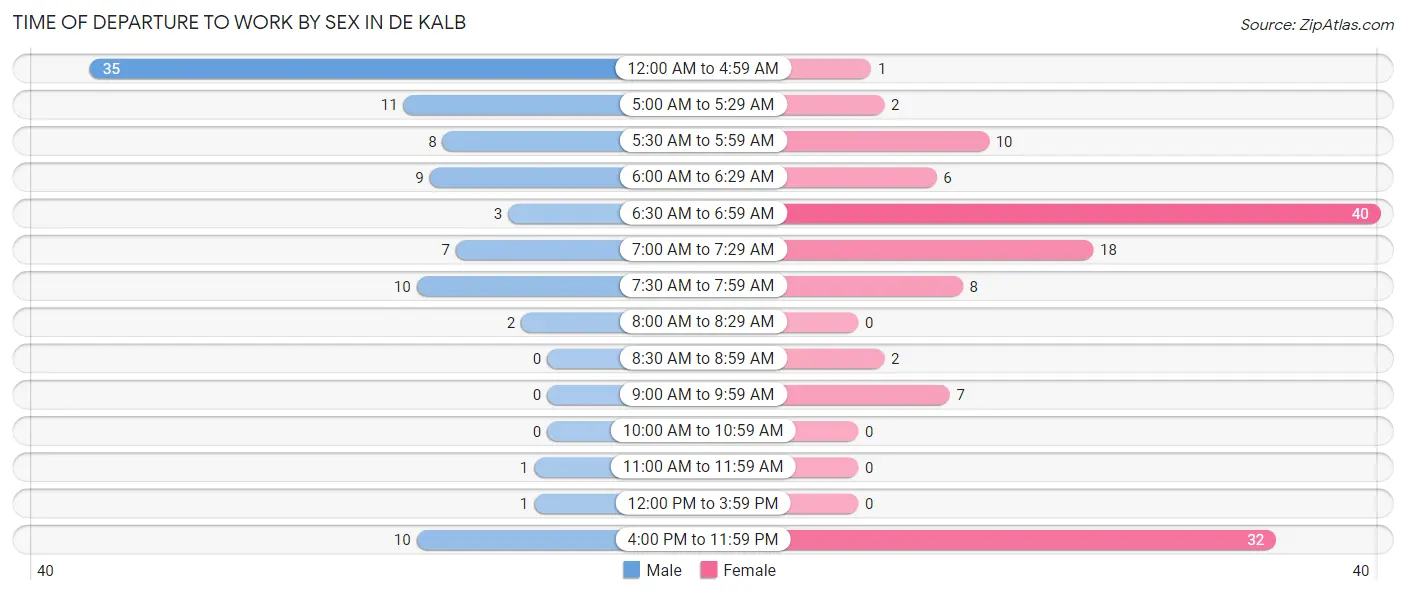
| Time of Departure | Male | Female |
| 12:00 AM to 4:59 AM | 35 (36.1%) | 1 (0.8%) |
| 5:00 AM to 5:29 AM | 11 (11.3%) | 2 (1.6%) |
| 5:30 AM to 5:59 AM | 8 (8.3%) | 10 (7.9%) |
| 6:00 AM to 6:29 AM | 9 (9.3%) | 6 (4.8%) |
| 6:30 AM to 6:59 AM | 3 (3.1%) | 40 (31.8%) |
| 7:00 AM to 7:29 AM | 7 (7.2%) | 18 (14.3%) |
| 7:30 AM to 7:59 AM | 10 (10.3%) | 8 (6.4%) |
| 8:00 AM to 8:29 AM | 2 (2.1%) | 0 (0.0%) |
| 8:30 AM to 8:59 AM | 0 (0.0%) | 2 (1.6%) |
| 9:00 AM to 9:59 AM | 0 (0.0%) | 7 (5.6%) |
| 10:00 AM to 10:59 AM | 0 (0.0%) | 0 (0.0%) |
| 11:00 AM to 11:59 AM | 1 (1.0%) | 0 (0.0%) |
| 12:00 PM to 3:59 PM | 1 (1.0%) | 0 (0.0%) |
| 4:00 PM to 11:59 PM | 10 (10.3%) | 32 (25.4%) |
| Total | 97 (100.0%) | 126 (100.0%) |
Housing Occupancy in De Kalb
Occupancy by Ownership in De Kalb
Of the total 161 dwellings in De Kalb, owner-occupied units account for 113 (70.2%), while renter-occupied units make up 48 (29.8%).
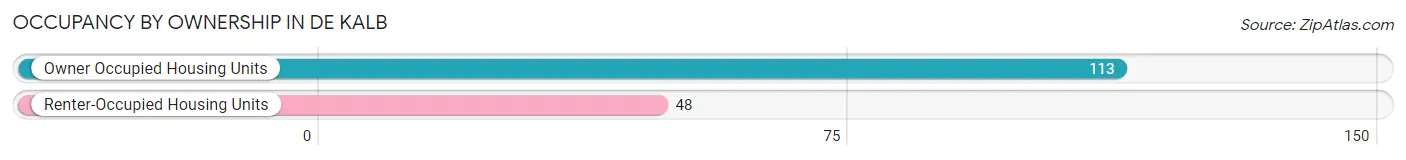
| Occupancy | # Housing Units | % Housing Units |
| Owner Occupied Housing Units | 113 | 70.2% |
| Renter-Occupied Housing Units | 48 | 29.8% |
| Total Occupied Housing Units | 161 | 100.0% |
Occupancy by Household Size in De Kalb
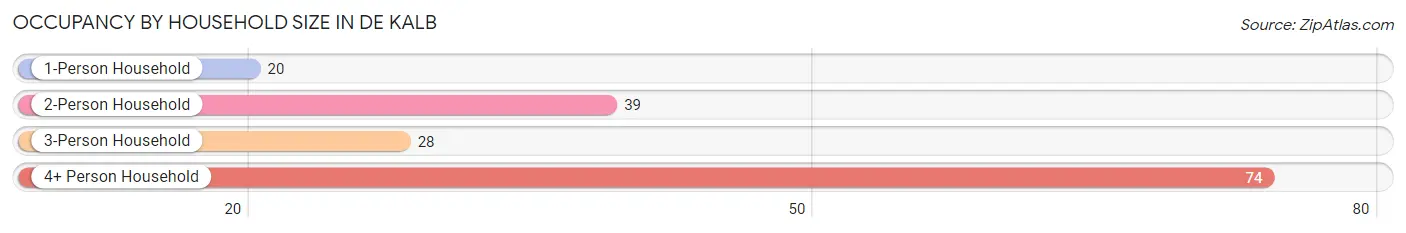
| Household Size | # Housing Units | % Housing Units |
| 1-Person Household | 20 | 12.4% |
| 2-Person Household | 39 | 24.2% |
| 3-Person Household | 28 | 17.4% |
| 4+ Person Household | 74 | 46.0% |
| Total Housing Units | 161 | 100.0% |
Occupancy by Ownership by Household Size in De Kalb
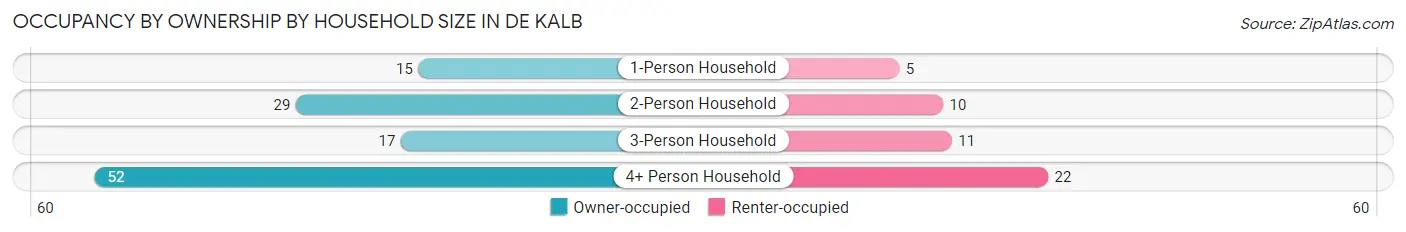
| Household Size | Owner-occupied | Renter-occupied |
| 1-Person Household | 15 (75.0%) | 5 (25.0%) |
| 2-Person Household | 29 (74.4%) | 10 (25.6%) |
| 3-Person Household | 17 (60.7%) | 11 (39.3%) |
| 4+ Person Household | 52 (70.3%) | 22 (29.7%) |
| Total Housing Units | 113 (70.2%) | 48 (29.8%) |
Occupancy by Educational Attainment in De Kalb
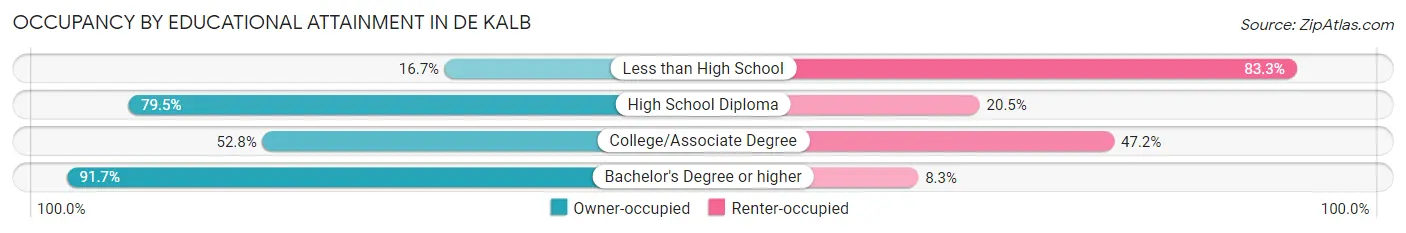
| Household Size | Owner-occupied | Renter-occupied |
| Less than High School | 1 (16.7%) | 5 (83.3%) |
| High School Diploma | 62 (79.5%) | 16 (20.5%) |
| College/Associate Degree | 28 (52.8%) | 25 (47.2%) |
| Bachelor's Degree or higher | 22 (91.7%) | 2 (8.3%) |
Occupancy by Age of Householder in De Kalb
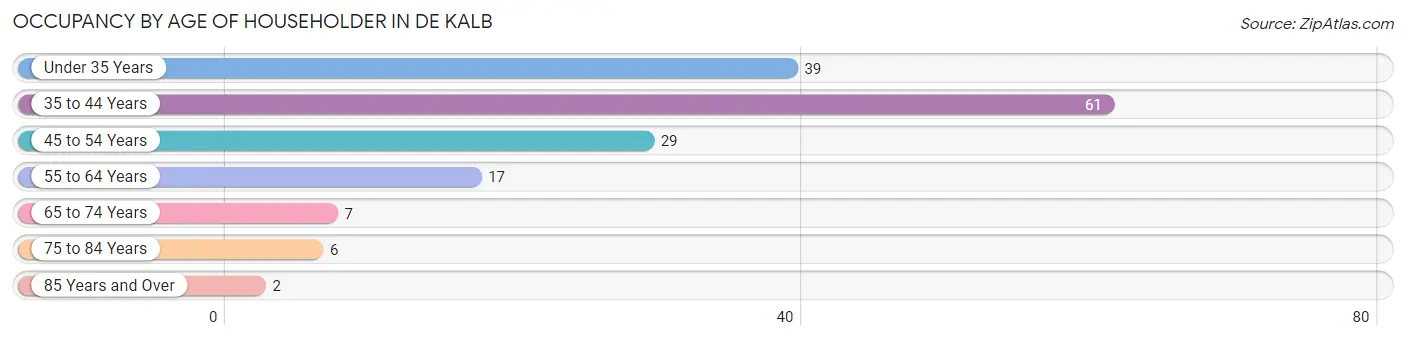
| Age Bracket | # Households | % Households |
| Under 35 Years | 39 | 24.2% |
| 35 to 44 Years | 61 | 37.9% |
| 45 to 54 Years | 29 | 18.0% |
| 55 to 64 Years | 17 | 10.6% |
| 65 to 74 Years | 7 | 4.3% |
| 75 to 84 Years | 6 | 3.7% |
| 85 Years and Over | 2 | 1.2% |
| Total | 161 | 100.0% |
Housing Finances in De Kalb
Median Income by Occupancy in De Kalb
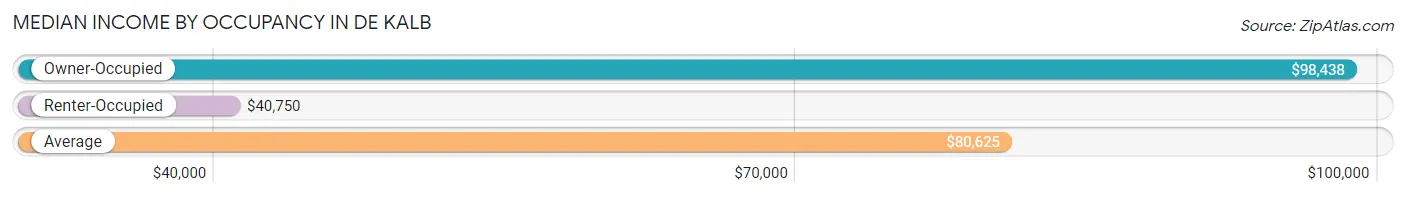
| Occupancy Type | # Households | Median Income |
| Owner-Occupied | 113 (70.2%) | $98,438 |
| Renter-Occupied | 48 (29.8%) | $40,750 |
| Average | 161 (100.0%) | $80,625 |
Occupancy by Householder Income Bracket in De Kalb
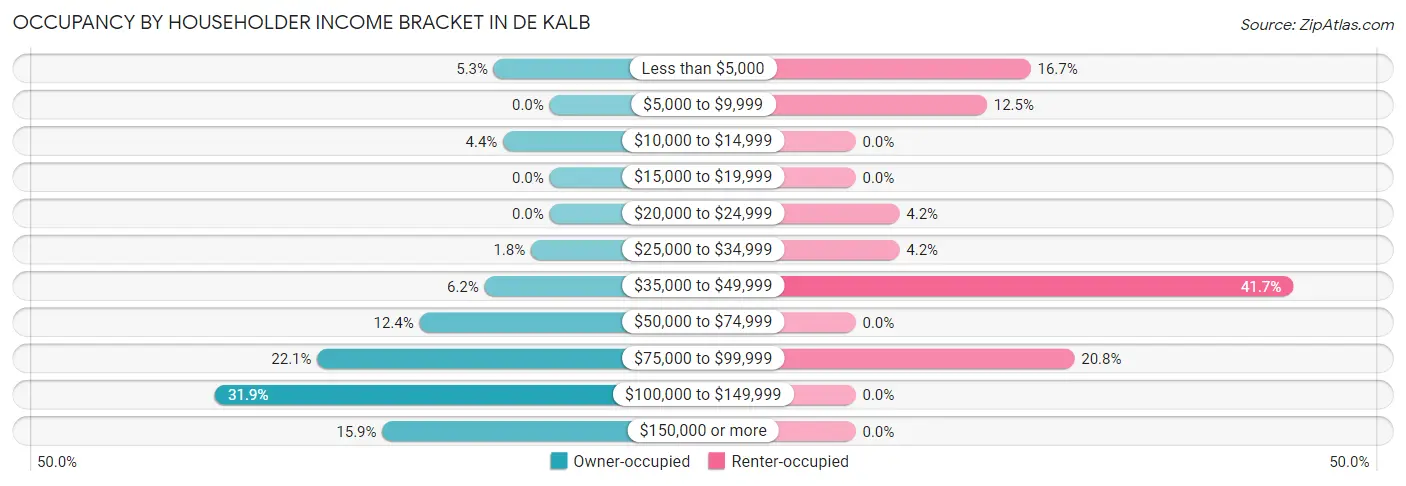
| Income Bracket | Owner-occupied | Renter-occupied |
| Less than $5,000 | 6 (5.3%) | 8 (16.7%) |
| $5,000 to $9,999 | 0 (0.0%) | 6 (12.5%) |
| $10,000 to $14,999 | 5 (4.4%) | 0 (0.0%) |
| $15,000 to $19,999 | 0 (0.0%) | 0 (0.0%) |
| $20,000 to $24,999 | 0 (0.0%) | 2 (4.2%) |
| $25,000 to $34,999 | 2 (1.8%) | 2 (4.2%) |
| $35,000 to $49,999 | 7 (6.2%) | 20 (41.7%) |
| $50,000 to $74,999 | 14 (12.4%) | 0 (0.0%) |
| $75,000 to $99,999 | 25 (22.1%) | 10 (20.8%) |
| $100,000 to $149,999 | 36 (31.9%) | 0 (0.0%) |
| $150,000 or more | 18 (15.9%) | 0 (0.0%) |
| Total | 113 (100.0%) | 48 (100.0%) |
Monthly Housing Cost Tiers in De Kalb
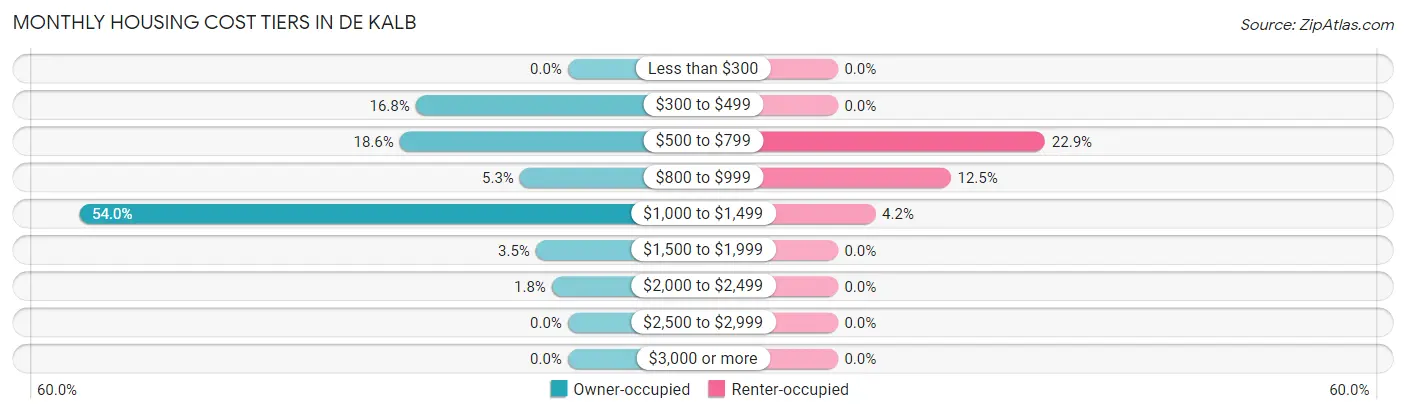
| Monthly Cost | Owner-occupied | Renter-occupied |
| Less than $300 | 0 (0.0%) | 0 (0.0%) |
| $300 to $499 | 19 (16.8%) | 0 (0.0%) |
| $500 to $799 | 21 (18.6%) | 11 (22.9%) |
| $800 to $999 | 6 (5.3%) | 6 (12.5%) |
| $1,000 to $1,499 | 61 (54.0%) | 2 (4.2%) |
| $1,500 to $1,999 | 4 (3.5%) | 0 (0.0%) |
| $2,000 to $2,499 | 2 (1.8%) | 0 (0.0%) |
| $2,500 to $2,999 | 0 (0.0%) | 0 (0.0%) |
| $3,000 or more | 0 (0.0%) | 0 (0.0%) |
| Total | 113 (100.0%) | 48 (100.0%) |
Physical Housing Characteristics in De Kalb
Housing Structures in De Kalb
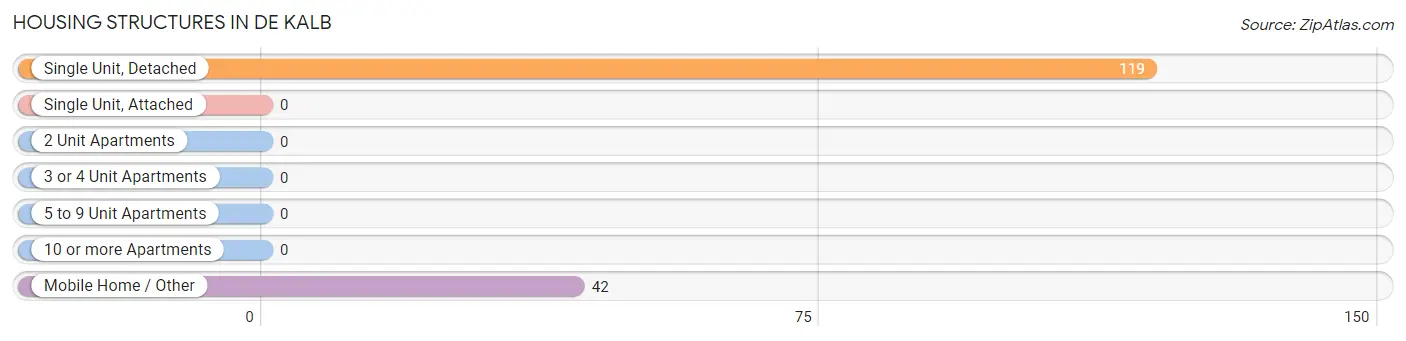
| Structure Type | # Housing Units | % Housing Units |
| Single Unit, Detached | 119 | 73.9% |
| Single Unit, Attached | 0 | 0.0% |
| 2 Unit Apartments | 0 | 0.0% |
| 3 or 4 Unit Apartments | 0 | 0.0% |
| 5 to 9 Unit Apartments | 0 | 0.0% |
| 10 or more Apartments | 0 | 0.0% |
| Mobile Home / Other | 42 | 26.1% |
| Total | 161 | 100.0% |
Housing Structures by Occupancy in De Kalb
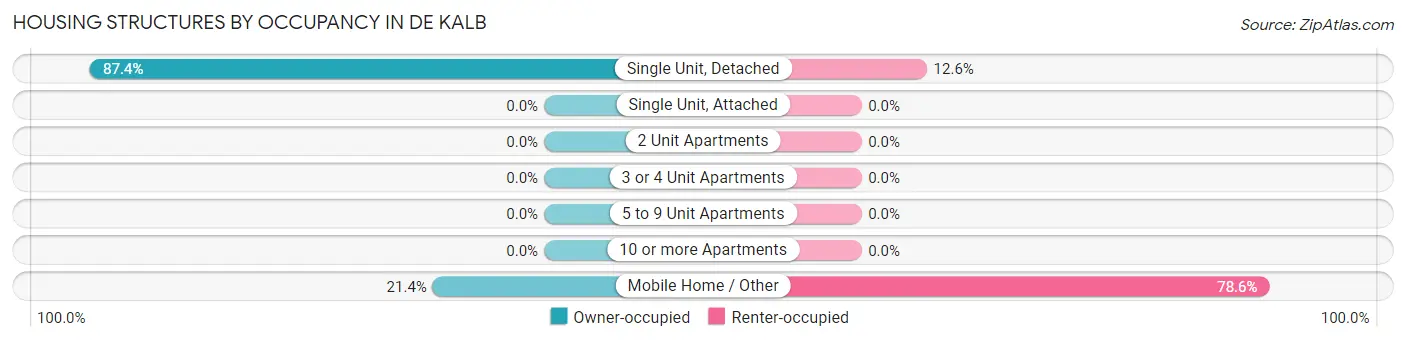
| Structure Type | Owner-occupied | Renter-occupied |
| Single Unit, Detached | 104 (87.4%) | 15 (12.6%) |
| Single Unit, Attached | 0 (0.0%) | 0 (0.0%) |
| 2 Unit Apartments | 0 (0.0%) | 0 (0.0%) |
| 3 or 4 Unit Apartments | 0 (0.0%) | 0 (0.0%) |
| 5 to 9 Unit Apartments | 0 (0.0%) | 0 (0.0%) |
| 10 or more Apartments | 0 (0.0%) | 0 (0.0%) |
| Mobile Home / Other | 9 (21.4%) | 33 (78.6%) |
| Total | 113 (70.2%) | 48 (29.8%) |
Housing Structures by Number of Rooms in De Kalb
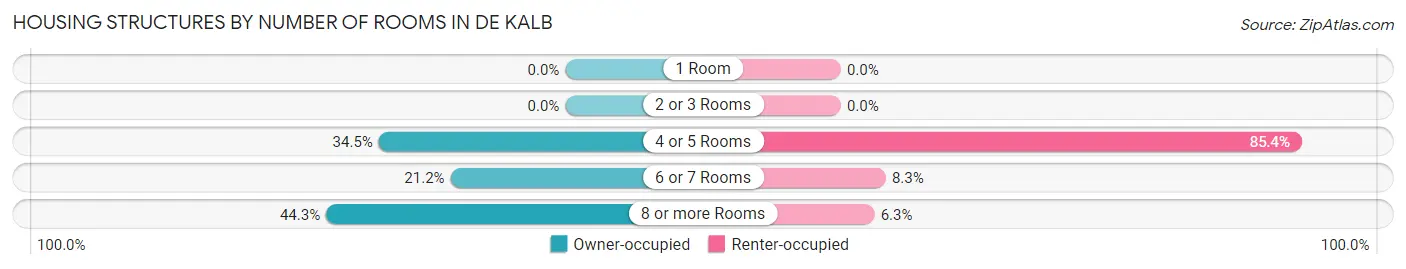
| Number of Rooms | Owner-occupied | Renter-occupied |
| 1 Room | 0 (0.0%) | 0 (0.0%) |
| 2 or 3 Rooms | 0 (0.0%) | 0 (0.0%) |
| 4 or 5 Rooms | 39 (34.5%) | 41 (85.4%) |
| 6 or 7 Rooms | 24 (21.2%) | 4 (8.3%) |
| 8 or more Rooms | 50 (44.3%) | 3 (6.2%) |
| Total | 113 (100.0%) | 48 (100.0%) |
Housing Structure by Heating Type in De Kalb
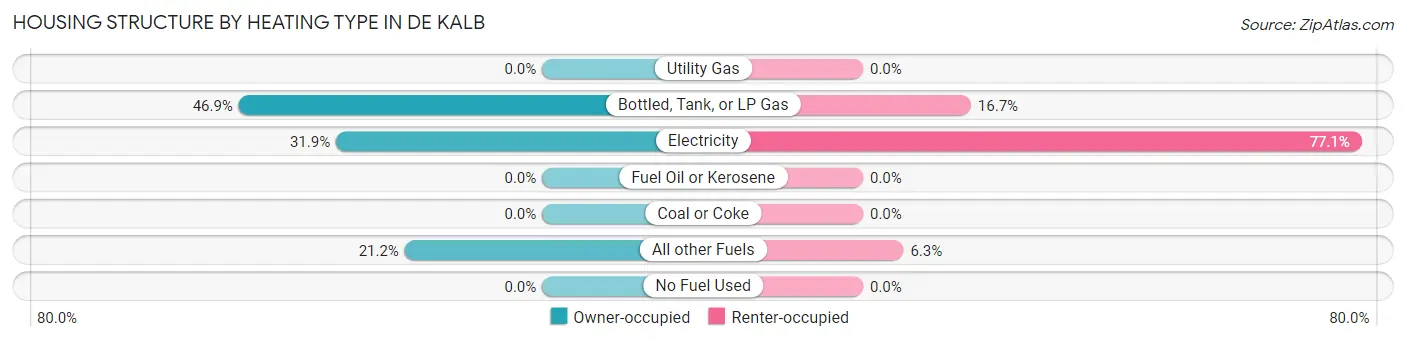
| Heating Type | Owner-occupied | Renter-occupied |
| Utility Gas | 0 (0.0%) | 0 (0.0%) |
| Bottled, Tank, or LP Gas | 53 (46.9%) | 8 (16.7%) |
| Electricity | 36 (31.9%) | 37 (77.1%) |
| Fuel Oil or Kerosene | 0 (0.0%) | 0 (0.0%) |
| Coal or Coke | 0 (0.0%) | 0 (0.0%) |
| All other Fuels | 24 (21.2%) | 3 (6.2%) |
| No Fuel Used | 0 (0.0%) | 0 (0.0%) |
| Total | 113 (100.0%) | 48 (100.0%) |
Household Vehicle Usage in De Kalb
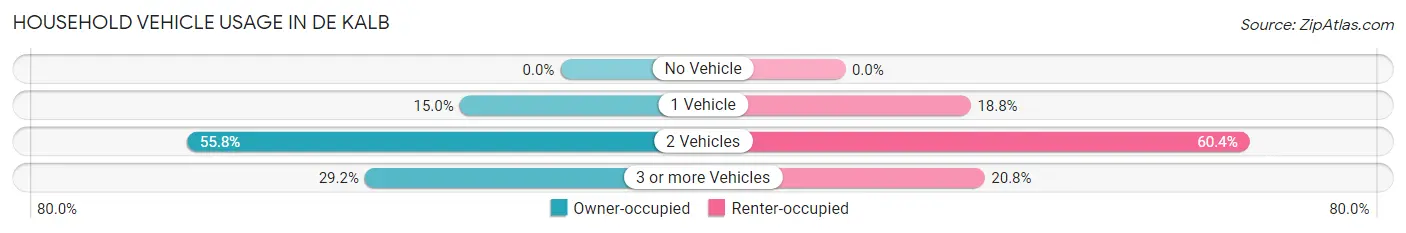
| Vehicles per Household | Owner-occupied | Renter-occupied |
| No Vehicle | 0 (0.0%) | 0 (0.0%) |
| 1 Vehicle | 17 (15.0%) | 9 (18.8%) |
| 2 Vehicles | 63 (55.7%) | 29 (60.4%) |
| 3 or more Vehicles | 33 (29.2%) | 10 (20.8%) |
| Total | 113 (100.0%) | 48 (100.0%) |
Real Estate & Mortgages in De Kalb
Real Estate and Mortgage Overview in De Kalb
| Characteristic | Without Mortgage | With Mortgage |
| Housing Units | 35 | 78 |
| Median Property Value | $158,900 | $143,800 |
| Median Household Income | - | - |
| Monthly Housing Costs | $504 | $0 |
| Real Estate Taxes | $789 | $0 |
Property Value by Mortgage Status in De Kalb
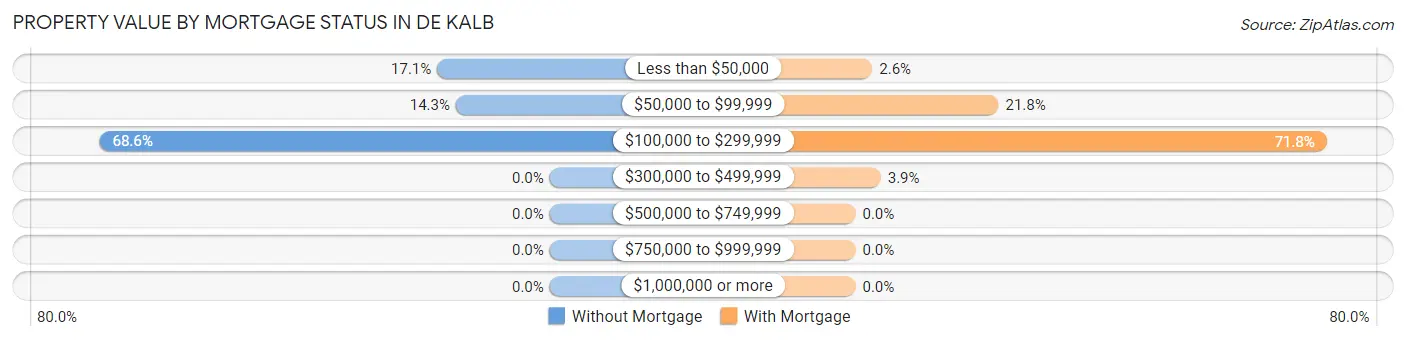
| Property Value | Without Mortgage | With Mortgage |
| Less than $50,000 | 6 (17.1%) | 2 (2.6%) |
| $50,000 to $99,999 | 5 (14.3%) | 17 (21.8%) |
| $100,000 to $299,999 | 24 (68.6%) | 56 (71.8%) |
| $300,000 to $499,999 | 0 (0.0%) | 3 (3.8%) |
| $500,000 to $749,999 | 0 (0.0%) | 0 (0.0%) |
| $750,000 to $999,999 | 0 (0.0%) | 0 (0.0%) |
| $1,000,000 or more | 0 (0.0%) | 0 (0.0%) |
| Total | 35 (100.0%) | 78 (100.0%) |
Household Income by Mortgage Status in De Kalb
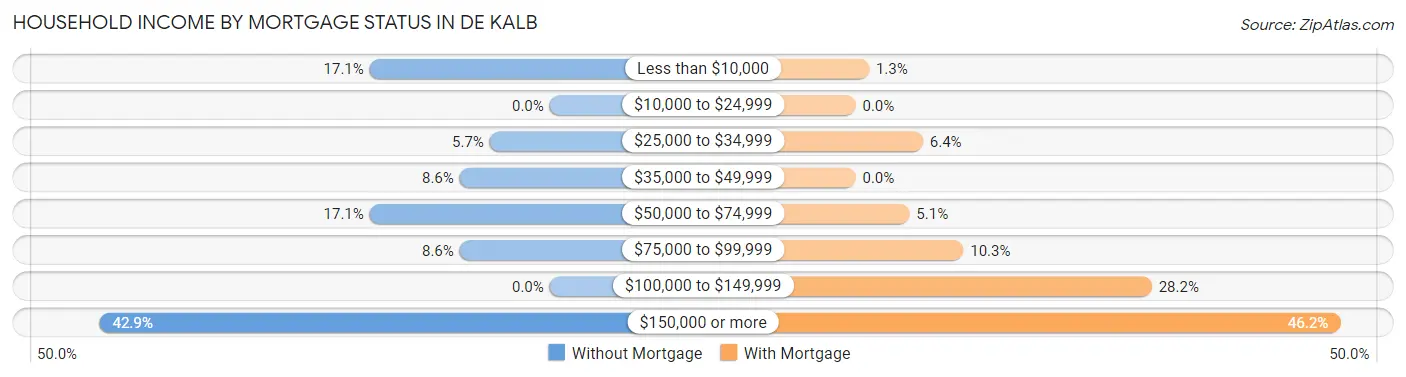
| Household Income | Without Mortgage | With Mortgage |
| Less than $10,000 | 6 (17.1%) | 1 (1.3%) |
| $10,000 to $24,999 | 0 (0.0%) | 0 (0.0%) |
| $25,000 to $34,999 | 2 (5.7%) | 5 (6.4%) |
| $35,000 to $49,999 | 3 (8.6%) | 0 (0.0%) |
| $50,000 to $74,999 | 6 (17.1%) | 4 (5.1%) |
| $75,000 to $99,999 | 3 (8.6%) | 8 (10.3%) |
| $100,000 to $149,999 | 0 (0.0%) | 22 (28.2%) |
| $150,000 or more | 15 (42.9%) | 36 (46.2%) |
| Total | 35 (100.0%) | 78 (100.0%) |
Property Value to Household Income Ratio in De Kalb
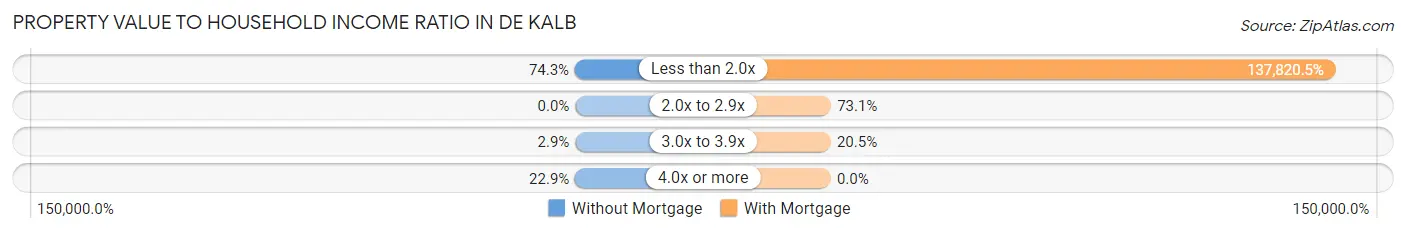
| Value-to-Income Ratio | Without Mortgage | With Mortgage |
| Less than 2.0x | 26 (74.3%) | 107,500 (137,820.5%) |
| 2.0x to 2.9x | 0 (0.0%) | 57 (73.1%) |
| 3.0x to 3.9x | 1 (2.9%) | 16 (20.5%) |
| 4.0x or more | 8 (22.9%) | 0 (0.0%) |
| Total | 35 (100.0%) | 78 (100.0%) |
Real Estate Taxes by Mortgage Status in De Kalb
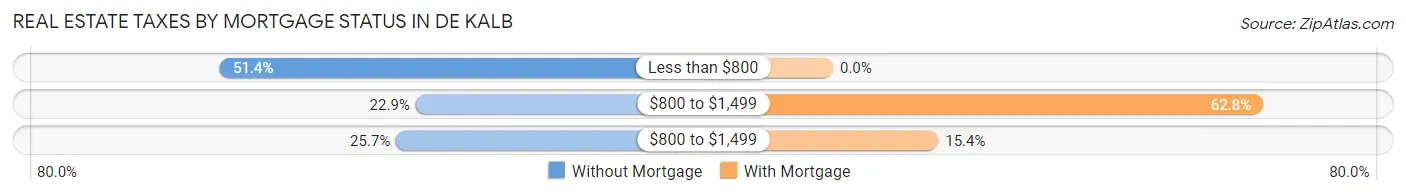
| Property Taxes | Without Mortgage | With Mortgage |
| Less than $800 | 18 (51.4%) | 0 (0.0%) |
| $800 to $1,499 | 8 (22.9%) | 49 (62.8%) |
| $800 to $1,499 | 9 (25.7%) | 12 (15.4%) |
| Total | 35 (100.0%) | 78 (100.0%) |
Health & Disability in De Kalb
Health Insurance Coverage by Age in De Kalb
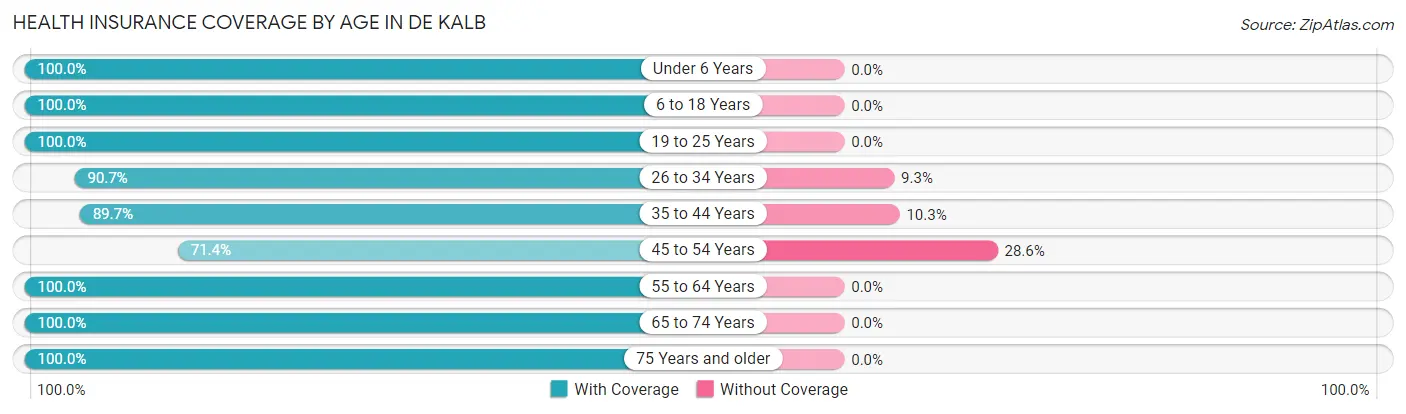
| Age Bracket | With Coverage | Without Coverage |
| Under 6 Years | 82 (100.0%) | 0 (0.0%) |
| 6 to 18 Years | 158 (100.0%) | 0 (0.0%) |
| 19 to 25 Years | 16 (100.0%) | 0 (0.0%) |
| 26 to 34 Years | 39 (90.7%) | 4 (9.3%) |
| 35 to 44 Years | 122 (89.7%) | 14 (10.3%) |
| 45 to 54 Years | 35 (71.4%) | 14 (28.6%) |
| 55 to 64 Years | 25 (100.0%) | 0 (0.0%) |
| 65 to 74 Years | 11 (100.0%) | 0 (0.0%) |
| 75 Years and older | 8 (100.0%) | 0 (0.0%) |
| Total | 496 (93.9%) | 32 (6.1%) |
Health Insurance Coverage by Citizenship Status in De Kalb
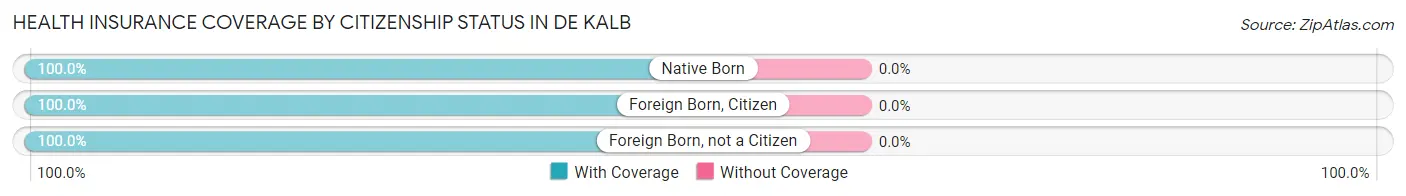
| Citizenship Status | With Coverage | Without Coverage |
| Native Born | 82 (100.0%) | 0 (0.0%) |
| Foreign Born, Citizen | 158 (100.0%) | 0 (0.0%) |
| Foreign Born, not a Citizen | 16 (100.0%) | 0 (0.0%) |
Health Insurance Coverage by Household Income in De Kalb
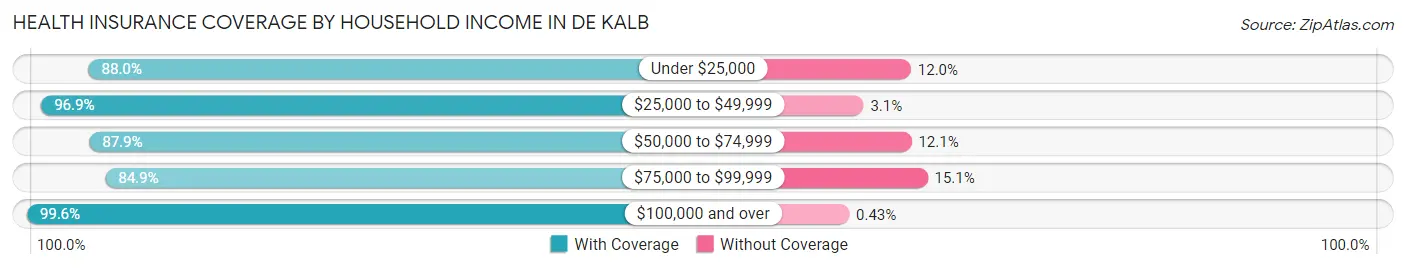
| Household Income | With Coverage | Without Coverage |
| Under $25,000 | 44 (88.0%) | 6 (12.0%) |
| $25,000 to $49,999 | 93 (96.9%) | 3 (3.1%) |
| $50,000 to $74,999 | 29 (87.9%) | 4 (12.1%) |
| $75,000 to $99,999 | 101 (84.9%) | 18 (15.1%) |
| $100,000 and over | 229 (99.6%) | 1 (0.4%) |
Public vs Private Health Insurance Coverage by Age in De Kalb
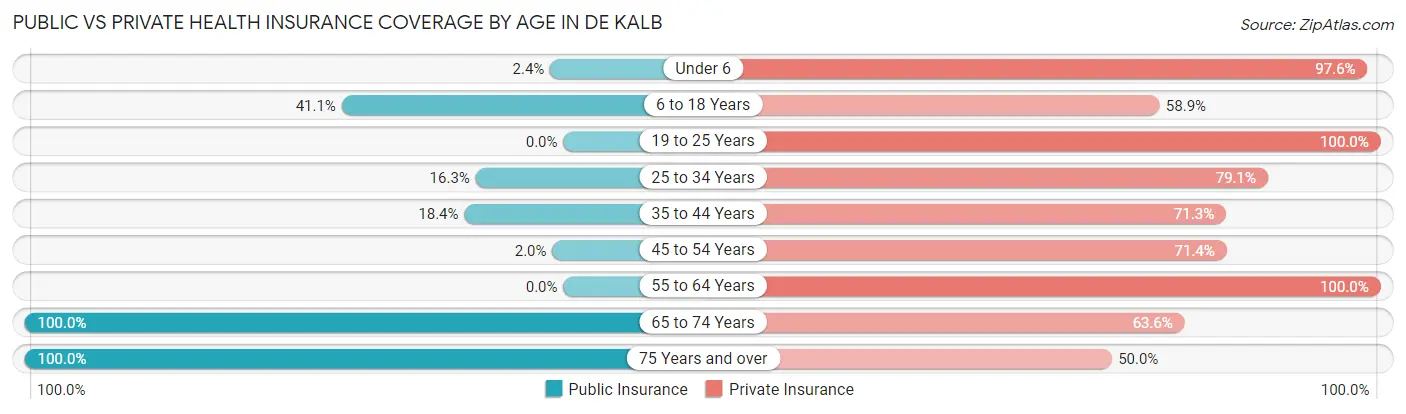
| Age Bracket | Public Insurance | Private Insurance |
| Under 6 | 2 (2.4%) | 80 (97.6%) |
| 6 to 18 Years | 65 (41.1%) | 93 (58.9%) |
| 19 to 25 Years | 0 (0.0%) | 16 (100.0%) |
| 25 to 34 Years | 7 (16.3%) | 34 (79.1%) |
| 35 to 44 Years | 25 (18.4%) | 97 (71.3%) |
| 45 to 54 Years | 1 (2.0%) | 35 (71.4%) |
| 55 to 64 Years | 0 (0.0%) | 25 (100.0%) |
| 65 to 74 Years | 11 (100.0%) | 7 (63.6%) |
| 75 Years and over | 8 (100.0%) | 4 (50.0%) |
| Total | 119 (22.5%) | 391 (74.1%) |
Disability Status by Sex by Age in De Kalb
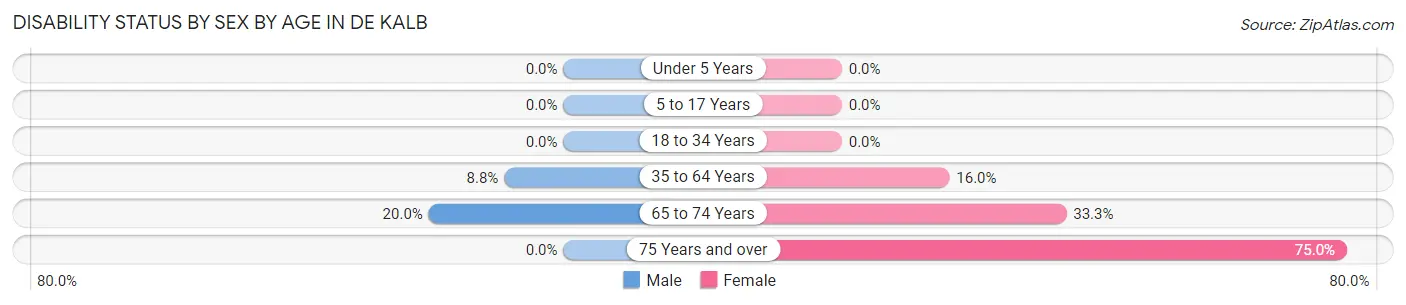
| Age Bracket | Male | Female |
| Under 5 Years | 0 (0.0%) | 0 (0.0%) |
| 5 to 17 Years | 0 (0.0%) | 0 (0.0%) |
| 18 to 34 Years | 0 (0.0%) | 0 (0.0%) |
| 35 to 64 Years | 8 (8.8%) | 19 (16.0%) |
| 65 to 74 Years | 1 (20.0%) | 2 (33.3%) |
| 75 Years and over | 0 (0.0%) | 6 (75.0%) |
Disability Class by Sex by Age in De Kalb
Disability Class: Hearing Difficulty
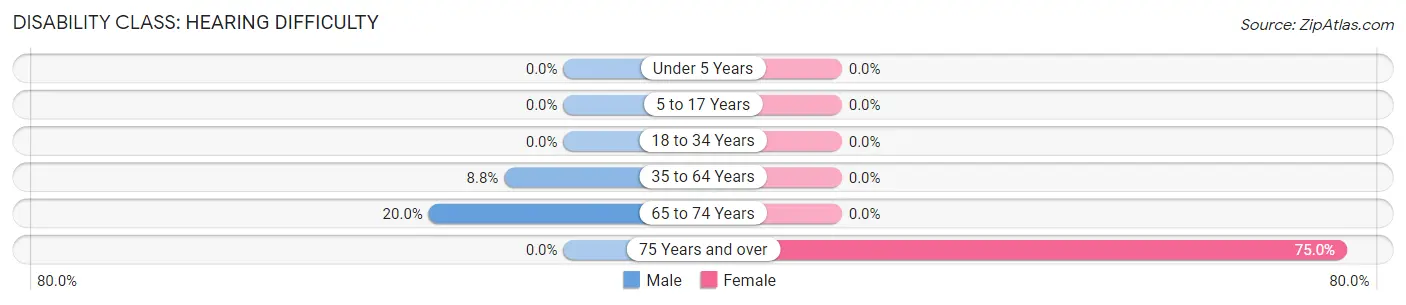
| Age Bracket | Male | Female |
| Under 5 Years | 0 (0.0%) | 0 (0.0%) |
| 5 to 17 Years | 0 (0.0%) | 0 (0.0%) |
| 18 to 34 Years | 0 (0.0%) | 0 (0.0%) |
| 35 to 64 Years | 8 (8.8%) | 0 (0.0%) |
| 65 to 74 Years | 1 (20.0%) | 0 (0.0%) |
| 75 Years and over | 0 (0.0%) | 6 (75.0%) |
Disability Class: Vision Difficulty
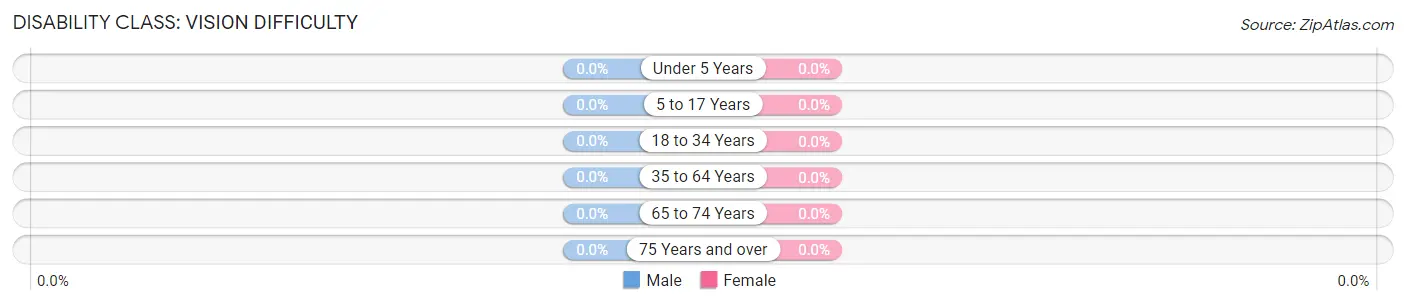
| Age Bracket | Male | Female |
| Under 5 Years | 0 (0.0%) | 0 (0.0%) |
| 5 to 17 Years | 0 (0.0%) | 0 (0.0%) |
| 18 to 34 Years | 0 (0.0%) | 0 (0.0%) |
| 35 to 64 Years | 0 (0.0%) | 0 (0.0%) |
| 65 to 74 Years | 0 (0.0%) | 0 (0.0%) |
| 75 Years and over | 0 (0.0%) | 0 (0.0%) |
Disability Class: Cognitive Difficulty
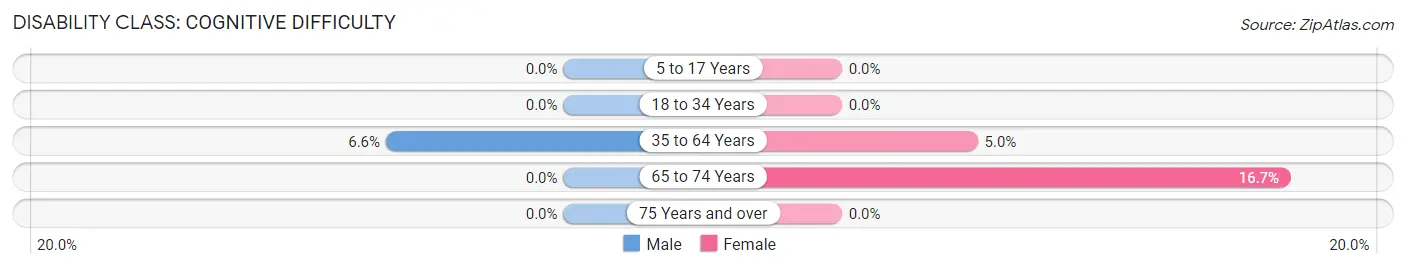
| Age Bracket | Male | Female |
| 5 to 17 Years | 0 (0.0%) | 0 (0.0%) |
| 18 to 34 Years | 0 (0.0%) | 0 (0.0%) |
| 35 to 64 Years | 6 (6.6%) | 6 (5.0%) |
| 65 to 74 Years | 0 (0.0%) | 1 (16.7%) |
| 75 Years and over | 0 (0.0%) | 0 (0.0%) |
Disability Class: Ambulatory Difficulty
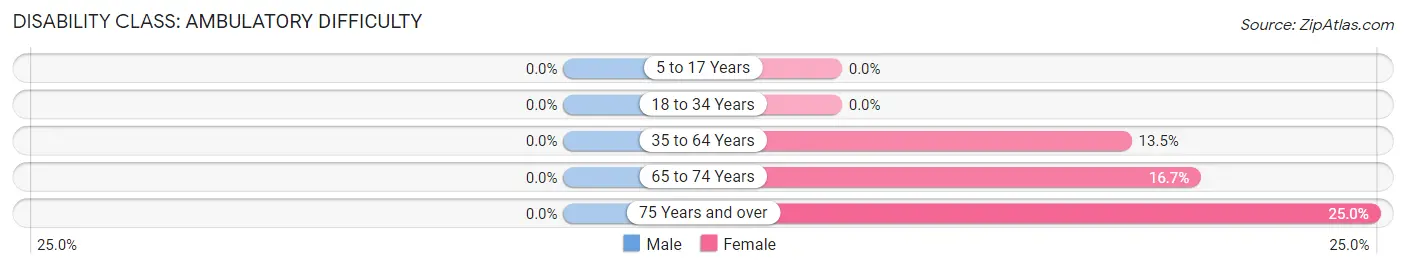
| Age Bracket | Male | Female |
| 5 to 17 Years | 0 (0.0%) | 0 (0.0%) |
| 18 to 34 Years | 0 (0.0%) | 0 (0.0%) |
| 35 to 64 Years | 0 (0.0%) | 16 (13.5%) |
| 65 to 74 Years | 0 (0.0%) | 1 (16.7%) |
| 75 Years and over | 0 (0.0%) | 2 (25.0%) |
Disability Class: Self-Care Difficulty
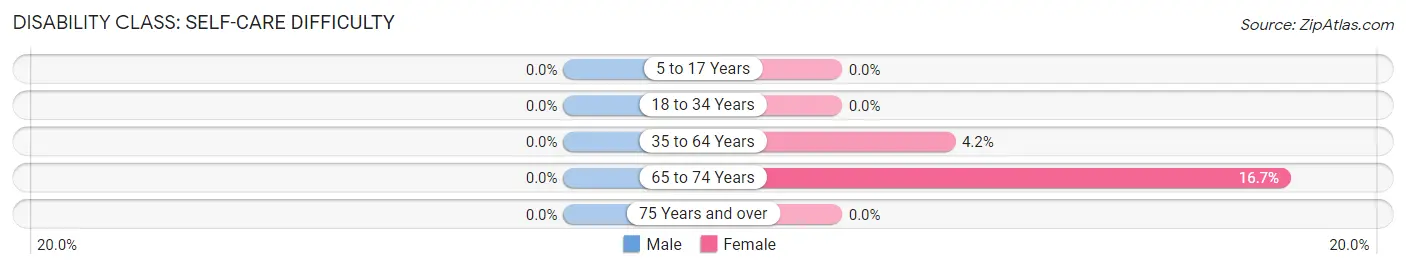
| Age Bracket | Male | Female |
| 5 to 17 Years | 0 (0.0%) | 0 (0.0%) |
| 18 to 34 Years | 0 (0.0%) | 0 (0.0%) |
| 35 to 64 Years | 0 (0.0%) | 5 (4.2%) |
| 65 to 74 Years | 0 (0.0%) | 1 (16.7%) |
| 75 Years and over | 0 (0.0%) | 0 (0.0%) |
Technology Access in De Kalb
Computing Device Access in De Kalb
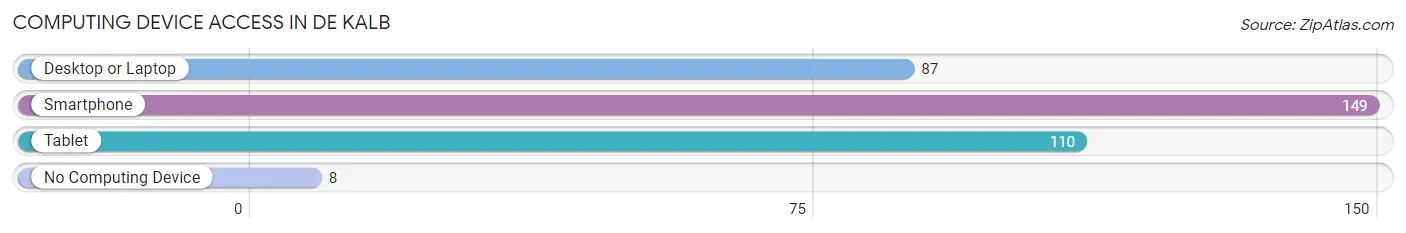
| Device Type | # Households | % Households |
| Desktop or Laptop | 87 | 54.0% |
| Smartphone | 149 | 92.5% |
| Tablet | 110 | 68.3% |
| No Computing Device | 8 | 5.0% |
| Total | 161 | 100.0% |
Internet Access in De Kalb
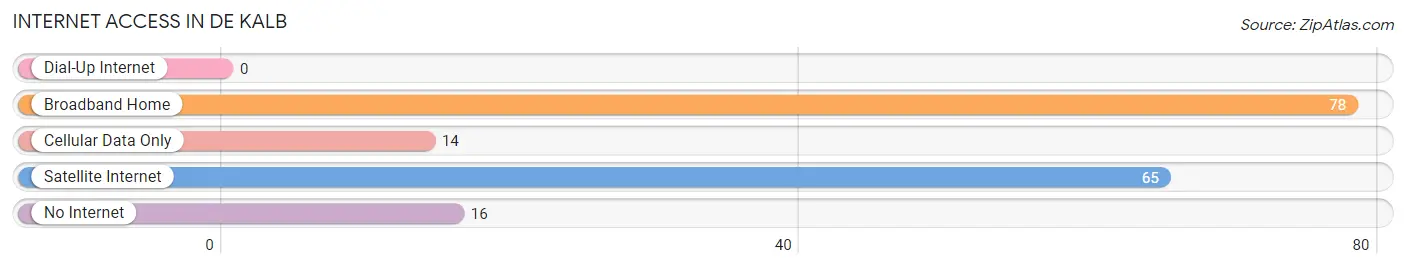
| Internet Type | # Households | % Households |
| Dial-Up Internet | 0 | 0.0% |
| Broadband Home | 78 | 48.4% |
| Cellular Data Only | 14 | 8.7% |
| Satellite Internet | 65 | 40.4% |
| No Internet | 16 | 9.9% |
| Total | 161 | 100.0% |
De Kalb Summary
De Kalb, Missouri is a small town located in the northwest corner of Missouri, in the United States. It is situated in the northwest corner of Buchanan County, and is part of the St. Joseph Metropolitan Statistical Area. The town was founded in 1845 and was named after Baron Johann de Kalb, a German-born French and American Revolutionary War hero.
History
De Kalb was founded in 1845 by a group of settlers from Ohio, led by William and Mary Ann (Henderson) De Kalb. The town was named after Baron Johann de Kalb, a German-born French and American Revolutionary War hero. The town was originally located in the northwest corner of Buchanan County, and was part of the St. Joseph Metropolitan Statistical Area.
The town was incorporated in 1871, and the first mayor was William De Kalb. The town grew slowly, but steadily, and by the early 1900s, it had become a thriving agricultural community. The town was home to several businesses, including a flour mill, a sawmill, a blacksmith shop, a general store, and a hotel.
In the early 1900s, the town was also home to a number of churches, including the Methodist Episcopal Church, the Presbyterian Church, and the Christian Church. The town also had a school, which was built in 1876.
Geography
De Kalb is located in the northwest corner of Buchanan County, Missouri. It is situated at the intersection of U.S. Route 36 and Missouri Route 6. The town is located approximately 25 miles northwest of St. Joseph, Missouri, and approximately 50 miles north of Kansas City, Missouri.
The town is situated in a rural area, and is surrounded by rolling hills and farmland. The town is located in the Missouri River Valley, and is part of the Missouri River watershed. The town is located at an elevation of 890 feet above sea level.
Economy
De Kalb’s economy is largely based on agriculture. The town is home to several farms, which produce a variety of crops, including corn, soybeans, wheat, and hay. The town is also home to several businesses, including a grocery store, a hardware store, a restaurant, and a bank.
Demographics
As of the 2010 census, the population of De Kalb was 1,093. The racial makeup of the town was 97.2% White, 0.7% African American, 0.2% Native American, 0.2% Asian, 0.2% from other races, and 1.7% from two or more races. Hispanic or Latino of any race were 1.2% of the population.
The median household income in De Kalb was $41,250, and the median family income was $48,750. The per capita income for the town was $19,945. About 11.2% of families and 13.2% of the population were below the poverty line, including 17.2% of those under age 18 and 8.3% of those age 65 or over.
Conclusion
De Kalb, Missouri is a small town located in the northwest corner of Missouri, in the United States. It was founded in 1845 and was named after Baron Johann de Kalb, a German-born French and American Revolutionary War hero. The town is situated in a rural area, and is surrounded by rolling hills and farmland. The town’s economy is largely based on agriculture, and it is home to several businesses. As of the 2010 census, the population of De Kalb was 1,093. The median household income in De Kalb was $41,250, and the median family income was $48,750.
Common Questions
What is Per Capita Income in De Kalb?
Per Capita income in De Kalb is $25,250.
What is the Median Family Income in De Kalb?
Median Family Income in De Kalb is $85,625.
What is the Median Household income in De Kalb?
Median Household Income in De Kalb is $80,625.
What is Income or Wage Gap in De Kalb?
Income or Wage Gap in De Kalb is 25.2%.
Women in De Kalb earn 74.8 cents for every dollar earned by a man.
What is Inequality or Gini Index in De Kalb?
Inequality or Gini Index in De Kalb is 0.36.
What is the Total Population of De Kalb?
Total Population of De Kalb is 528.
What is the Total Male Population of De Kalb?
Total Male Population of De Kalb is 242.
What is the Total Female Population of De Kalb?
Total Female Population of De Kalb is 286.
What is the Ratio of Males per 100 Females in De Kalb?
There are 84.62 Males per 100 Females in De Kalb.
What is the Ratio of Females per 100 Males in De Kalb?
There are 118.18 Females per 100 Males in De Kalb.
What is the Median Population Age in De Kalb?
Median Population Age in De Kalb is 27.3 Years.
What is the Average Family Size in De Kalb
Average Family Size in De Kalb is 3.6 People.
What is the Average Household Size in De Kalb
Average Household Size in De Kalb is 3.3 People.
How Large is the Labor Force in De Kalb?
There are 241 People in the Labor Forcein in De Kalb.
What is the Percentage of People in the Labor Force in De Kalb?
69.1% of People are in the Labor Force in De Kalb.