Russellville, MO Map & Demographics
Russellville Map
Russellville Overview
$26,843
PER CAPITA INCOME
$61,458
AVG FAMILY INCOME
$52,946
AVG HOUSEHOLD INCOME
8.8%
WAGE / INCOME GAP [ % ]
91.2¢/ $1
WAGE / INCOME GAP [ $ ]
0.40
INEQUALITY / GINI INDEX
876
TOTAL POPULATION
399
MALE POPULATION
477
FEMALE POPULATION
83.65
MALES / 100 FEMALES
119.55
FEMALES / 100 MALES
27.4
MEDIAN AGE
3.1
AVG FAMILY SIZE
2.4
AVG HOUSEHOLD SIZE
505
LABOR FORCE [ PEOPLE ]
73.5%
PERCENT IN LABOR FORCE
2.0%
UNEMPLOYMENT RATE
Russellville Zip Codes
Russellville Area Codes
Income in Russellville
Income Overview in Russellville
Per Capita Income in Russellville is $26,843, while median incomes of families and households are $61,458 and $52,946 respectively.
| Characteristic | Number | Measure |
| Per Capita Income | 876 | $26,843 |
| Median Family Income | 219 | $61,458 |
| Mean Family Income | 219 | $78,258 |
| Median Household Income | 363 | $52,946 |
| Mean Household Income | 363 | $64,448 |
| Income Deficit | 219 | $0 |
| Wage / Income Gap (%) | 876 | 8.78% |
| Wage / Income Gap ($) | 876 | 91.22¢ per $1 |
| Gini / Inequality Index | 876 | 0.40 |
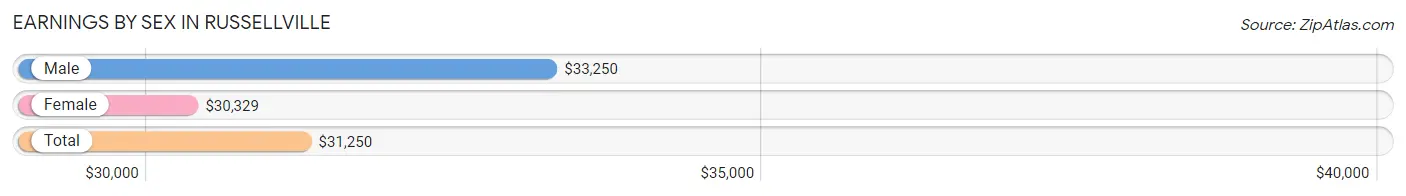
Earnings by Sex in Russellville
Average Earnings in Russellville are $31,250, $33,250 for men and $30,329 for women, a difference of 8.8%.
| Sex | Number | Average Earnings |
| Male | 239 (45.3%) | $33,250 |
| Female | 289 (54.7%) | $30,329 |
| Total | 528 (100.0%) | $31,250 |
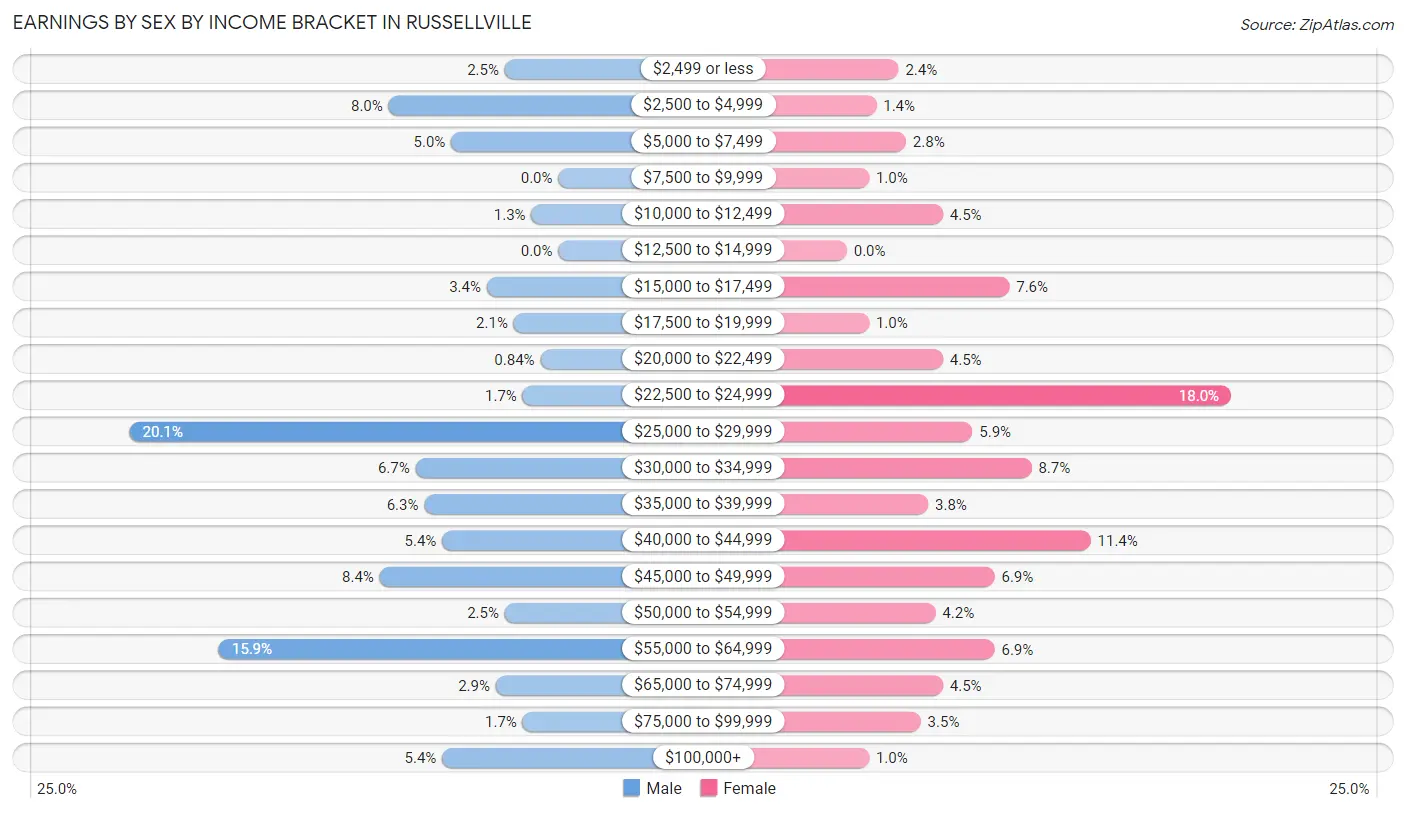
Earnings by Sex by Income Bracket in Russellville
The most common earnings brackets in Russellville are $25,000 to $29,999 for men (48 | 20.1%) and $22,500 to $24,999 for women (52 | 18.0%).
| Income | Male | Female |
| $2,499 or less | 6 (2.5%) | 7 (2.4%) |
| $2,500 to $4,999 | 19 (8.0%) | 4 (1.4%) |
| $5,000 to $7,499 | 12 (5.0%) | 8 (2.8%) |
| $7,500 to $9,999 | 0 (0.0%) | 3 (1.0%) |
| $10,000 to $12,499 | 3 (1.3%) | 13 (4.5%) |
| $12,500 to $14,999 | 0 (0.0%) | 0 (0.0%) |
| $15,000 to $17,499 | 8 (3.4%) | 22 (7.6%) |
| $17,500 to $19,999 | 5 (2.1%) | 3 (1.0%) |
| $20,000 to $22,499 | 2 (0.8%) | 13 (4.5%) |
| $22,500 to $24,999 | 4 (1.7%) | 52 (18.0%) |
| $25,000 to $29,999 | 48 (20.1%) | 17 (5.9%) |
| $30,000 to $34,999 | 16 (6.7%) | 25 (8.6%) |
| $35,000 to $39,999 | 15 (6.3%) | 11 (3.8%) |
| $40,000 to $44,999 | 13 (5.4%) | 33 (11.4%) |
| $45,000 to $49,999 | 20 (8.4%) | 20 (6.9%) |
| $50,000 to $54,999 | 6 (2.5%) | 12 (4.2%) |
| $55,000 to $64,999 | 38 (15.9%) | 20 (6.9%) |
| $65,000 to $74,999 | 7 (2.9%) | 13 (4.5%) |
| $75,000 to $99,999 | 4 (1.7%) | 10 (3.5%) |
| $100,000+ | 13 (5.4%) | 3 (1.0%) |
| Total | 239 (100.0%) | 289 (100.0%) |
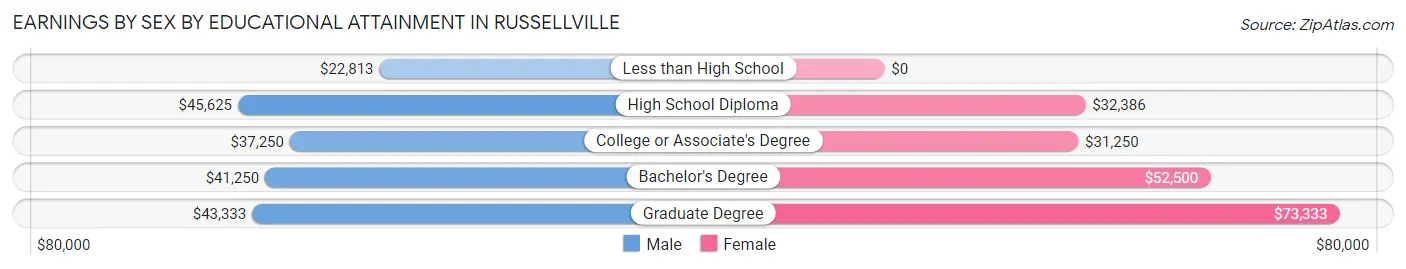
Earnings by Sex by Educational Attainment in Russellville
Average earnings in Russellville are $40,972 for men and $41,406 for women, a difference of 1.1%. Men with an educational attainment of high school diploma enjoy the highest average annual earnings of $45,625, while those with less than high school education earn the least with $22,813. Women with an educational attainment of graduate degree earn the most with the average annual earnings of $73,333, while those with college or associate's degree education have the smallest earnings of $31,250.
| Educational Attainment | Male Income | Female Income |
| Less than High School | $22,813 | $0 |
| High School Diploma | $45,625 | $32,386 |
| College or Associate's Degree | $37,250 | $31,250 |
| Bachelor's Degree | $41,250 | $52,500 |
| Graduate Degree | $43,333 | $73,333 |
| Total | $40,972 | $41,406 |
Family Income in Russellville
Family Income Brackets in Russellville
According to the Russellville family income data, there are 48 families falling into the $100,000 to $149,999 income range, which is the most common income bracket and makes up 21.9% of all families. Conversely, the $10,000 to $14,999 income bracket is the least frequent group with only 1 families (0.5%) belonging to this category.
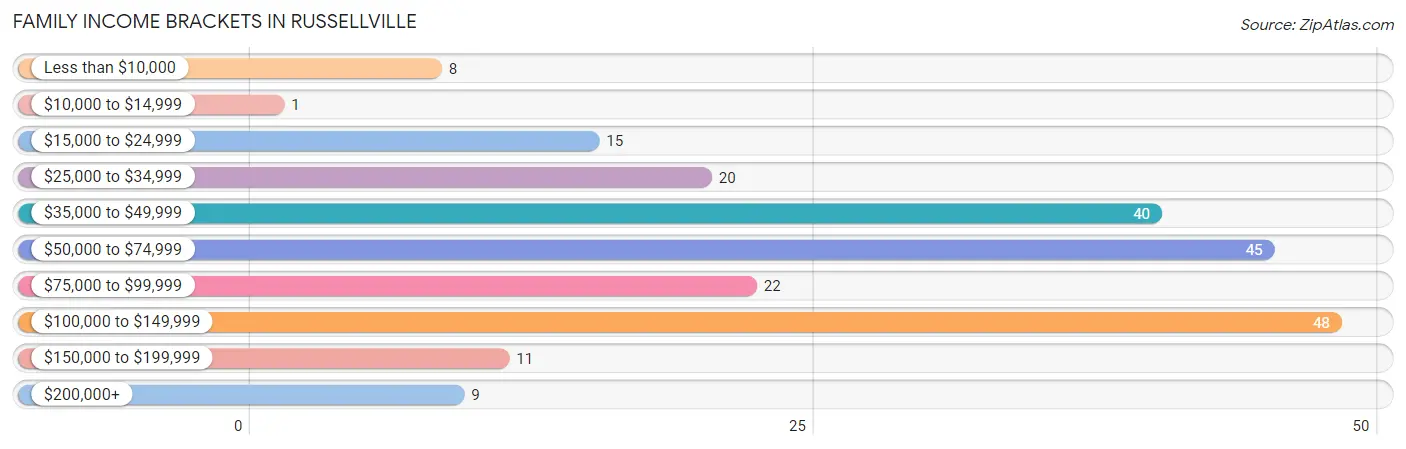
| Income Bracket | # Families | % Families |
| Less than $10,000 | 8 | 3.7% |
| $10,000 to $14,999 | 1 | 0.5% |
| $15,000 to $24,999 | 15 | 6.8% |
| $25,000 to $34,999 | 20 | 9.1% |
| $35,000 to $49,999 | 40 | 18.3% |
| $50,000 to $74,999 | 45 | 20.5% |
| $75,000 to $99,999 | 22 | 10.0% |
| $100,000 to $149,999 | 48 | 21.9% |
| $150,000 to $199,999 | 11 | 5.0% |
| $200,000+ | 9 | 4.1% |
Family Income by Famaliy Size in Russellville
5-person families (10 | 4.6%) account for the highest median family income in Russellville with $96,250 per family, while 3-person families (64 | 29.2%) have the highest median income of $29,583 per family member.
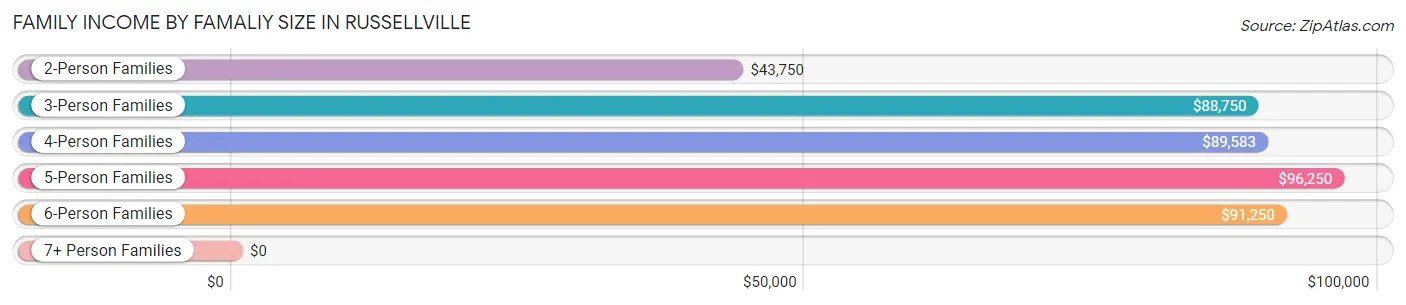
| Income Bracket | # Families | Median Income |
| 2-Person Families | 109 (49.8%) | $43,750 |
| 3-Person Families | 64 (29.2%) | $88,750 |
| 4-Person Families | 25 (11.4%) | $89,583 |
| 5-Person Families | 10 (4.6%) | $96,250 |
| 6-Person Families | 6 (2.7%) | $91,250 |
| 7+ Person Families | 5 (2.3%) | $0 |
| Total | 219 (100.0%) | $61,458 |
Family Income by Number of Earners in Russellville
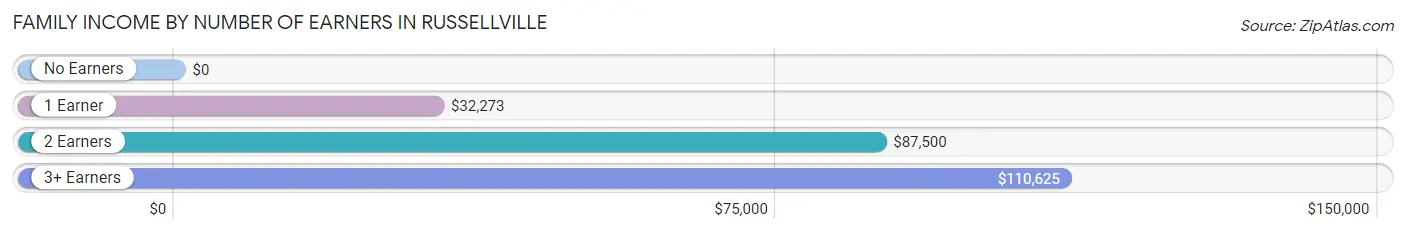
| Number of Earners | # Families | Median Income |
| No Earners | 6 (2.7%) | $0 |
| 1 Earner | 80 (36.5%) | $32,273 |
| 2 Earners | 114 (52.0%) | $87,500 |
| 3+ Earners | 19 (8.7%) | $110,625 |
| Total | 219 (100.0%) | $61,458 |
Household Income in Russellville
Household Income Brackets in Russellville
With 75 households falling in the category, the $50,000 to $74,999 income range is the most frequent in Russellville, accounting for 20.7% of all households. In contrast, only 7 households (1.9%) fall into the $10,000 to $14,999 income bracket, making it the least populous group.
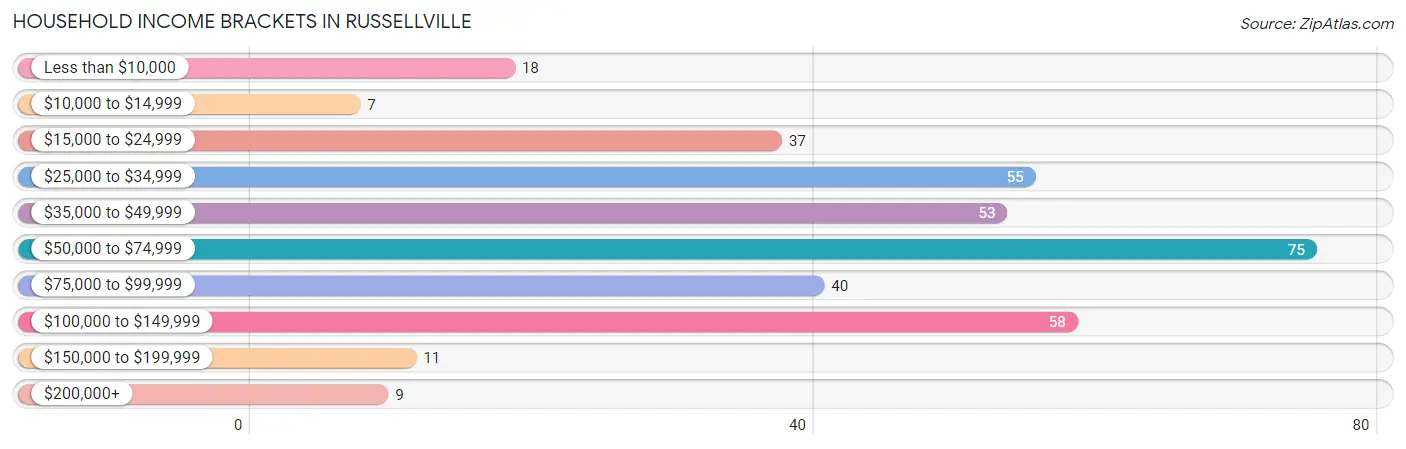
| Income Bracket | # Households | % Households |
| Less than $10,000 | 18 | 5.0% |
| $10,000 to $14,999 | 7 | 1.9% |
| $15,000 to $24,999 | 37 | 10.2% |
| $25,000 to $34,999 | 55 | 15.2% |
| $35,000 to $49,999 | 53 | 14.6% |
| $50,000 to $74,999 | 75 | 20.7% |
| $75,000 to $99,999 | 40 | 11.0% |
| $100,000 to $149,999 | 58 | 16.0% |
| $150,000 to $199,999 | 11 | 3.0% |
| $200,000+ | 9 | 2.5% |
Household Income by Householder Age in Russellville
The median household income in Russellville is $52,946, with the highest median household income of $66,250 found in the 25 to 44 years age bracket for the primary householder. A total of 107 households (29.5%) fall into this category. Meanwhile, the 15 to 24 years age bracket for the primary householder has the lowest median household income of $0, with 82 households (22.6%) in this group.
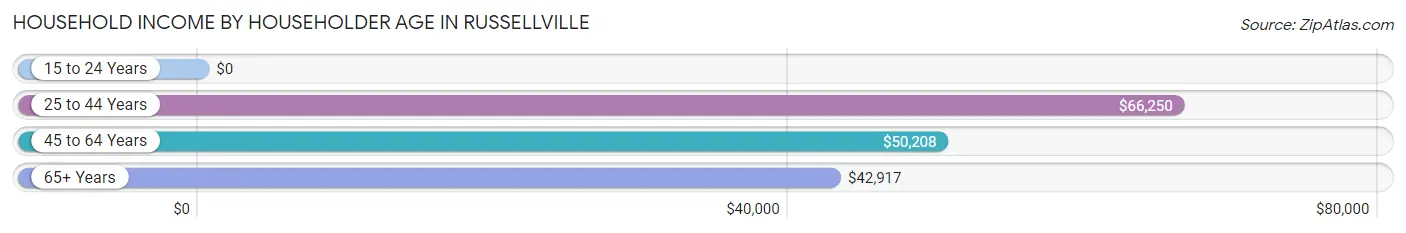
| Income Bracket | # Households | Median Income |
| 15 to 24 Years | 82 (22.6%) | $0 |
| 25 to 44 Years | 107 (29.5%) | $66,250 |
| 45 to 64 Years | 117 (32.2%) | $50,208 |
| 65+ Years | 57 (15.7%) | $42,917 |
| Total | 363 (100.0%) | $52,946 |
Poverty in Russellville
Income Below Poverty by Sex and Age in Russellville
With 6.8% poverty level for males and 7.2% for females among the residents of Russellville, under 5 year old males and 75 year old and over females are the most vulnerable to poverty, with 5 males (17.9%) and 6 females (35.3%) in their respective age groups living below the poverty level.
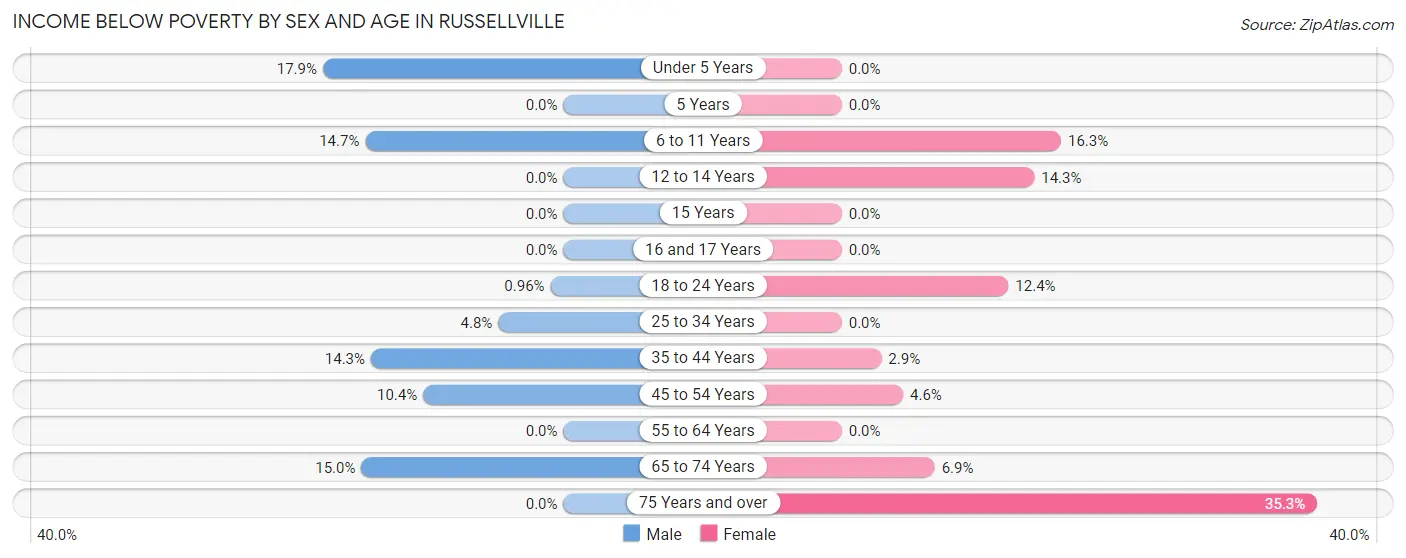
| Age Bracket | Male | Female |
| Under 5 Years | 5 (17.9%) | 0 (0.0%) |
| 5 Years | 0 (0.0%) | 0 (0.0%) |
| 6 to 11 Years | 5 (14.7%) | 7 (16.3%) |
| 12 to 14 Years | 0 (0.0%) | 3 (14.3%) |
| 15 Years | 0 (0.0%) | 0 (0.0%) |
| 16 and 17 Years | 0 (0.0%) | 0 (0.0%) |
| 18 to 24 Years | 1 (1.0%) | 12 (12.4%) |
| 25 to 34 Years | 3 (4.8%) | 0 (0.0%) |
| 35 to 44 Years | 5 (14.3%) | 1 (2.9%) |
| 45 to 54 Years | 5 (10.4%) | 3 (4.5%) |
| 55 to 64 Years | 0 (0.0%) | 0 (0.0%) |
| 65 to 74 Years | 3 (15.0%) | 2 (6.9%) |
| 75 Years and over | 0 (0.0%) | 6 (35.3%) |
| Total | 27 (6.8%) | 34 (7.2%) |
Income Above Poverty by Sex and Age in Russellville
According to the poverty statistics in Russellville, males aged 5 years and females aged under 5 years are the age groups that are most secure financially, with 100.0% of males and 100.0% of females in these age groups living above the poverty line.
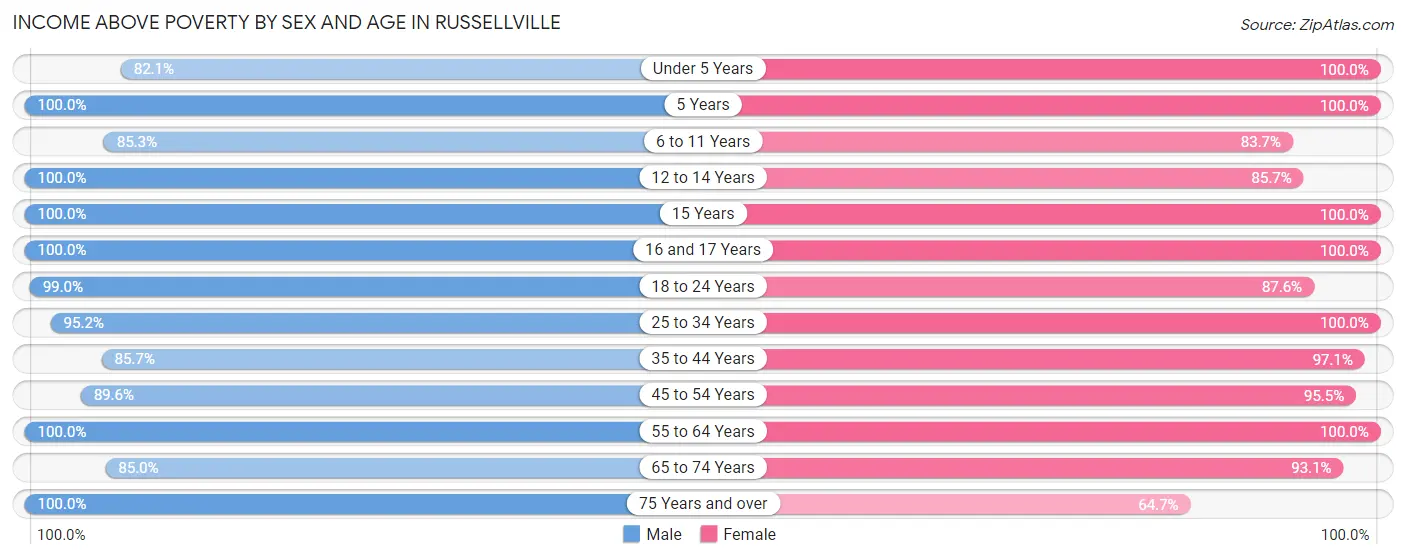
| Age Bracket | Male | Female |
| Under 5 Years | 23 (82.1%) | 39 (100.0%) |
| 5 Years | 2 (100.0%) | 4 (100.0%) |
| 6 to 11 Years | 29 (85.3%) | 36 (83.7%) |
| 12 to 14 Years | 5 (100.0%) | 18 (85.7%) |
| 15 Years | 9 (100.0%) | 1 (100.0%) |
| 16 and 17 Years | 8 (100.0%) | 13 (100.0%) |
| 18 to 24 Years | 103 (99.0%) | 85 (87.6%) |
| 25 to 34 Years | 59 (95.2%) | 53 (100.0%) |
| 35 to 44 Years | 30 (85.7%) | 33 (97.1%) |
| 45 to 54 Years | 43 (89.6%) | 63 (95.5%) |
| 55 to 64 Years | 27 (100.0%) | 58 (100.0%) |
| 65 to 74 Years | 17 (85.0%) | 27 (93.1%) |
| 75 Years and over | 16 (100.0%) | 11 (64.7%) |
| Total | 371 (93.2%) | 441 (92.8%) |
Income Below Poverty Among Married-Couple Families in Russellville
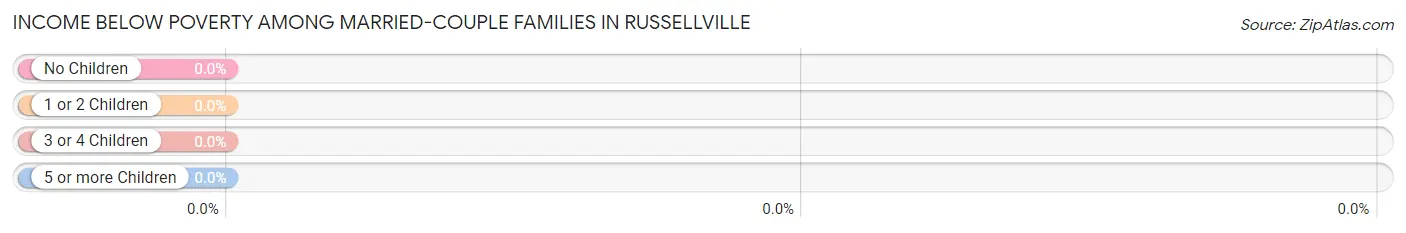
| Children | Above Poverty | Below Poverty |
| No Children | 71 (100.0%) | 0 (0.0%) |
| 1 or 2 Children | 57 (100.0%) | 0 (0.0%) |
| 3 or 4 Children | 13 (100.0%) | 0 (0.0%) |
| 5 or more Children | 5 (100.0%) | 0 (0.0%) |
| Total | 146 (100.0%) | 0 (0.0%) |
Income Below Poverty Among Single-Parent Households in Russellville
According to the poverty data in Russellville, 55.6% or 5 single-father households and 6.2% or 4 single-mother households are living below the poverty line. Among single-father households, those with 3 or 4 children have the highest poverty rate, with 5 households (83.3%) experiencing poverty. Likewise, among single-mother households, those with 1 or 2 children have the highest poverty rate, with 4 households (8.9%) falling below the poverty line.
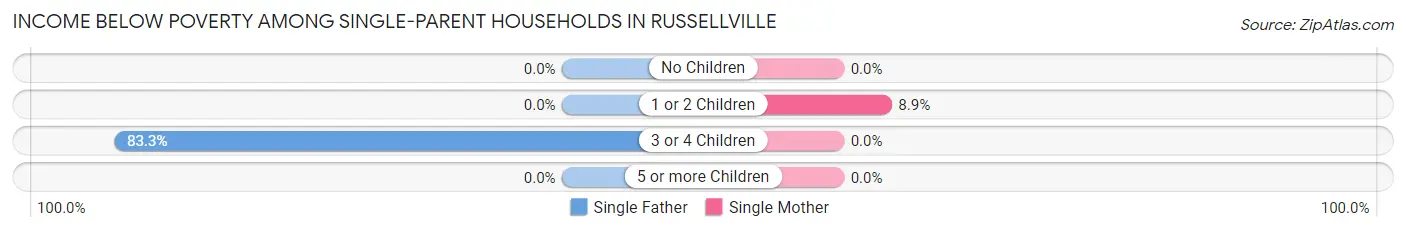
| Children | Single Father | Single Mother |
| No Children | 0 (0.0%) | 0 (0.0%) |
| 1 or 2 Children | 0 (0.0%) | 4 (8.9%) |
| 3 or 4 Children | 5 (83.3%) | 0 (0.0%) |
| 5 or more Children | 0 (0.0%) | 0 (0.0%) |
| Total | 5 (55.6%) | 4 (6.2%) |
Income Below Poverty Among Married-Couple vs Single-Parent Households in Russellville
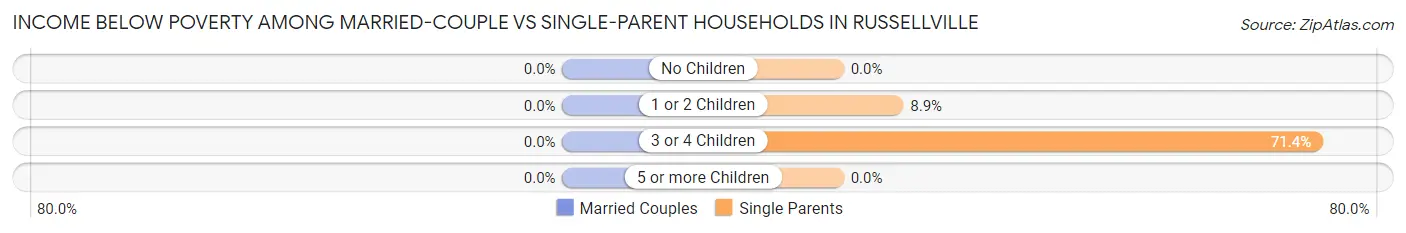
| Children | Married-Couple Families | Single-Parent Households |
| No Children | 0 (0.0%) | 0 (0.0%) |
| 1 or 2 Children | 0 (0.0%) | 4 (8.9%) |
| 3 or 4 Children | 0 (0.0%) | 5 (71.4%) |
| 5 or more Children | 0 (0.0%) | 0 (0.0%) |
| Total | 0 (0.0%) | 9 (12.3%) |
Race in Russellville
The most populous races in Russellville are White / Caucasian (807 | 92.1%), Two or more Races (33 | 3.8%), and Asian (18 | 2.1%).
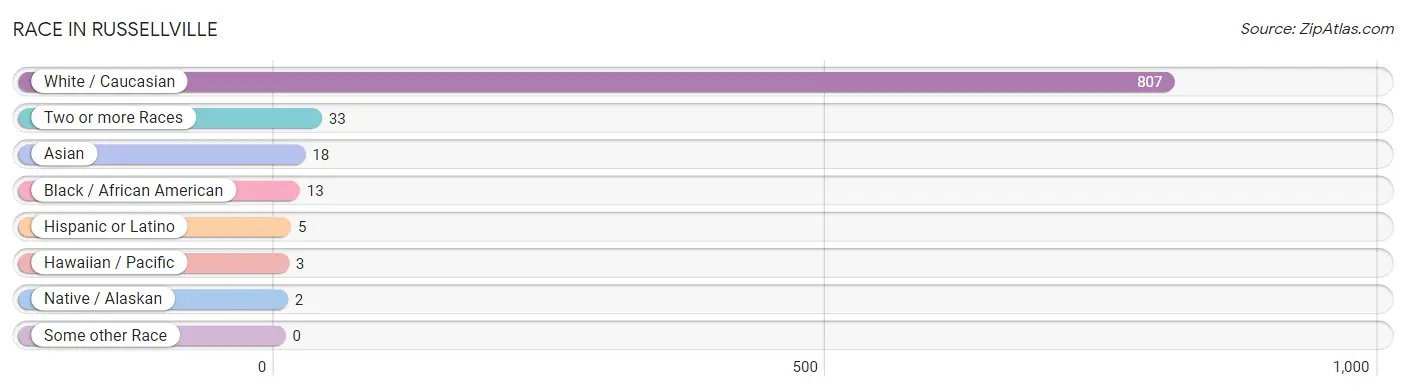
| Race | # Population | % Population |
| Asian | 18 | 2.1% |
| Black / African American | 13 | 1.5% |
| Hawaiian / Pacific | 3 | 0.3% |
| Hispanic or Latino | 5 | 0.6% |
| Native / Alaskan | 2 | 0.2% |
| White / Caucasian | 807 | 92.1% |
| Two or more Races | 33 | 3.8% |
| Some other Race | 0 | 0.0% |
| Total | 876 | 100.0% |
Ancestry in Russellville
The most populous ancestries reported in Russellville are German (317 | 36.2%), Irish (126 | 14.4%), American (115 | 13.1%), English (84 | 9.6%), and French (49 | 5.6%), together accounting for 78.9% of all Russellville residents.
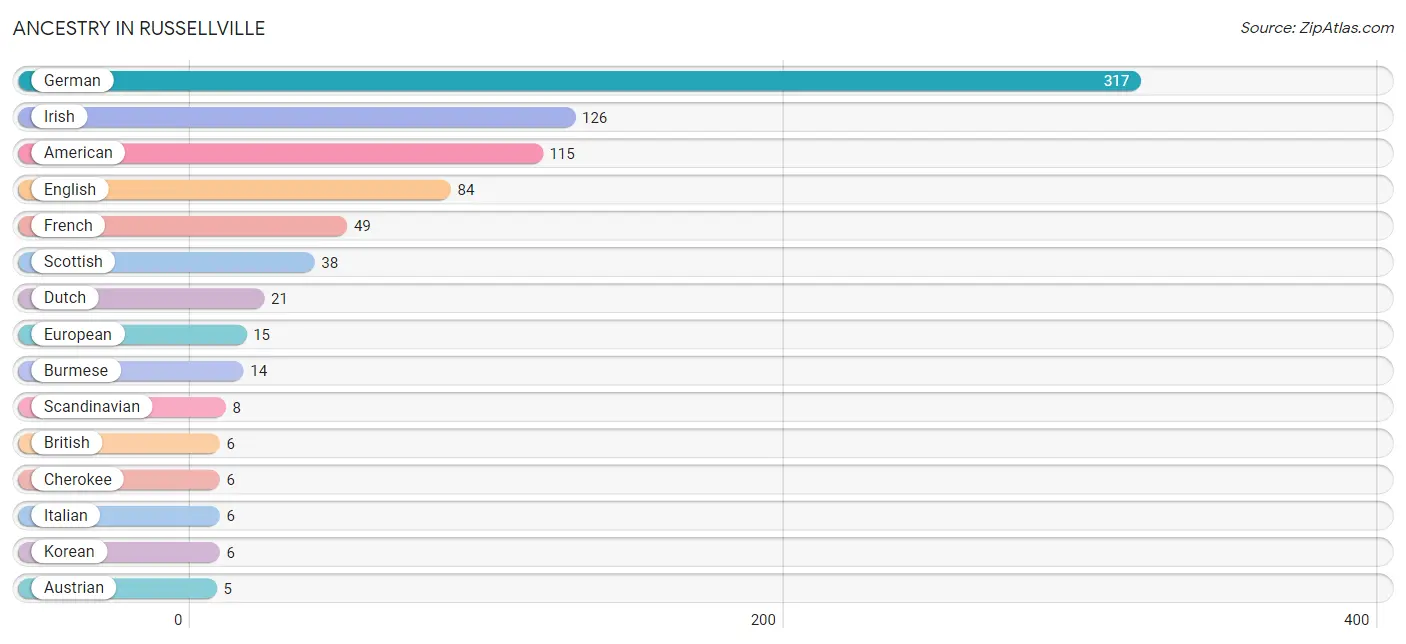
| Ancestry | # Population | % Population |
| American | 115 | 13.1% |
| Austrian | 5 | 0.6% |
| Bhutanese | 5 | 0.6% |
| British | 6 | 0.7% |
| Burmese | 14 | 1.6% |
| Cherokee | 6 | 0.7% |
| Dutch | 21 | 2.4% |
| English | 84 | 9.6% |
| European | 15 | 1.7% |
| French | 49 | 5.6% |
| German | 317 | 36.2% |
| Irish | 126 | 14.4% |
| Italian | 6 | 0.7% |
| Korean | 6 | 0.7% |
| Pakistani | 1 | 0.1% |
| Polish | 3 | 0.3% |
| Puerto Rican | 5 | 0.6% |
| Samoan | 3 | 0.3% |
| Scandinavian | 8 | 0.9% |
| Scotch-Irish | 2 | 0.2% |
| Scottish | 38 | 4.3% |
| Swedish | 4 | 0.5% | View All 22 Rows |
Immigrants in Russellville
The most numerous immigrant groups reported in Russellville came from Asia (3 | 0.3%), India (2 | 0.2%), South Central Asia (2 | 0.2%), South Eastern Asia (1 | 0.1%), and Thailand (1 | 0.1%), together accounting for 1.0% of all Russellville residents.
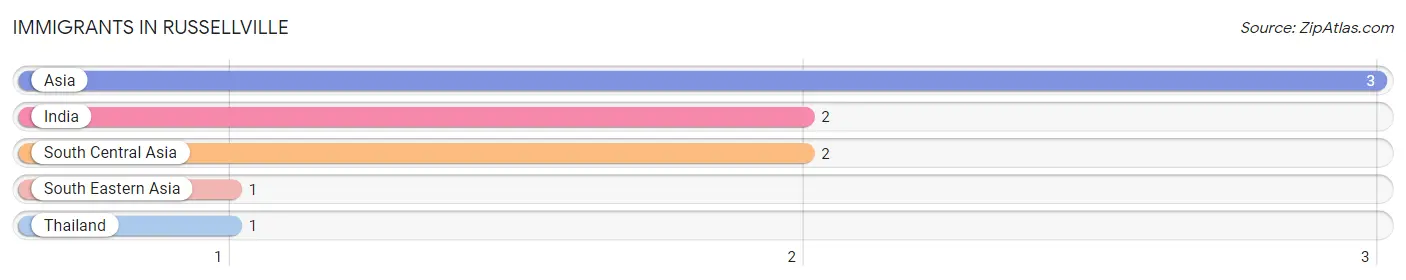
| Immigration Origin | # Population | % Population |
| Asia | 3 | 0.3% |
| India | 2 | 0.2% |
| South Central Asia | 2 | 0.2% |
| South Eastern Asia | 1 | 0.1% |
| Thailand | 1 | 0.1% | View All 5 Rows |
Sex and Age in Russellville
Sex and Age in Russellville
The most populous age groups in Russellville are 20 to 24 Years (87 | 21.8%) for men and 20 to 24 Years (96 | 20.1%) for women.
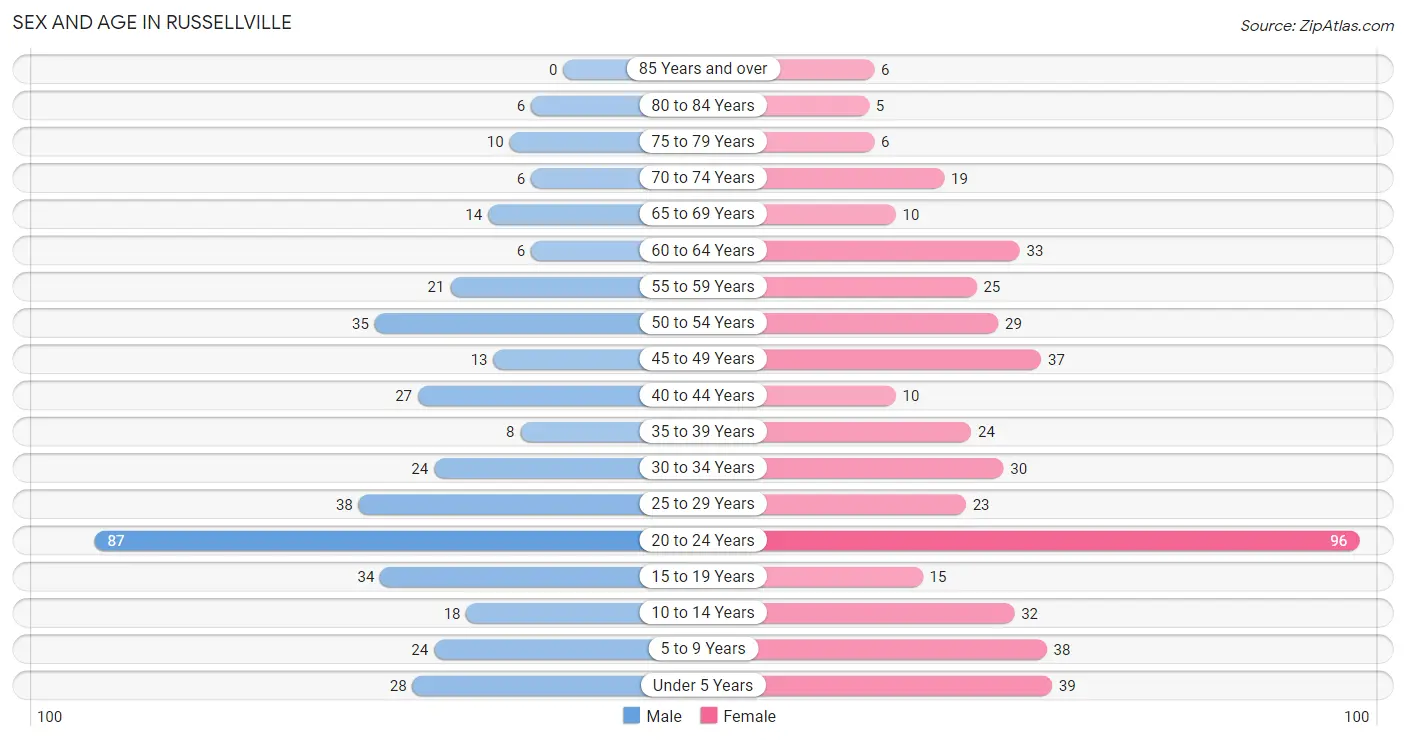
| Age Bracket | Male | Female |
| Under 5 Years | 28 (7.0%) | 39 (8.2%) |
| 5 to 9 Years | 24 (6.0%) | 38 (8.0%) |
| 10 to 14 Years | 18 (4.5%) | 32 (6.7%) |
| 15 to 19 Years | 34 (8.5%) | 15 (3.1%) |
| 20 to 24 Years | 87 (21.8%) | 96 (20.1%) |
| 25 to 29 Years | 38 (9.5%) | 23 (4.8%) |
| 30 to 34 Years | 24 (6.0%) | 30 (6.3%) |
| 35 to 39 Years | 8 (2.0%) | 24 (5.0%) |
| 40 to 44 Years | 27 (6.8%) | 10 (2.1%) |
| 45 to 49 Years | 13 (3.3%) | 37 (7.8%) |
| 50 to 54 Years | 35 (8.8%) | 29 (6.1%) |
| 55 to 59 Years | 21 (5.3%) | 25 (5.2%) |
| 60 to 64 Years | 6 (1.5%) | 33 (6.9%) |
| 65 to 69 Years | 14 (3.5%) | 10 (2.1%) |
| 70 to 74 Years | 6 (1.5%) | 19 (4.0%) |
| 75 to 79 Years | 10 (2.5%) | 6 (1.3%) |
| 80 to 84 Years | 6 (1.5%) | 5 (1.1%) |
| 85 Years and over | 0 (0.0%) | 6 (1.3%) |
| Total | 399 (100.0%) | 477 (100.0%) |
Families and Households in Russellville
Median Family Size in Russellville
The median family size in Russellville is 3.09 persons per family, with single male/father families (9 | 4.1%) accounting for the largest median family size of 4.11 persons per family. On the other hand, single female/mother families (64 | 29.2%) represent the smallest median family size with 2.70 persons per family.
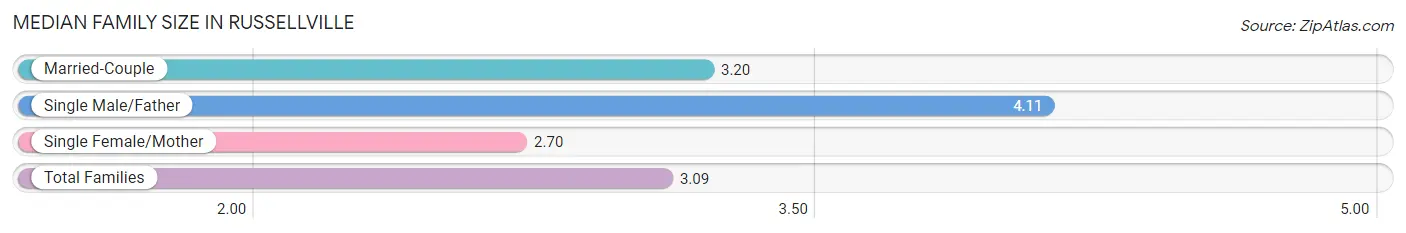
| Family Type | # Families | Family Size |
| Married-Couple | 146 (66.7%) | 3.20 |
| Single Male/Father | 9 (4.1%) | 4.11 |
| Single Female/Mother | 64 (29.2%) | 2.70 |
| Total Families | 219 (100.0%) | 3.09 |
Median Household Size in Russellville
The median household size in Russellville is 2.41 persons per household, with single male/father households (9 | 2.5%) accounting for the largest median household size of 4.67 persons per household. non-family households (144 | 39.7%) represent the smallest median household size with 1.18 persons per household.
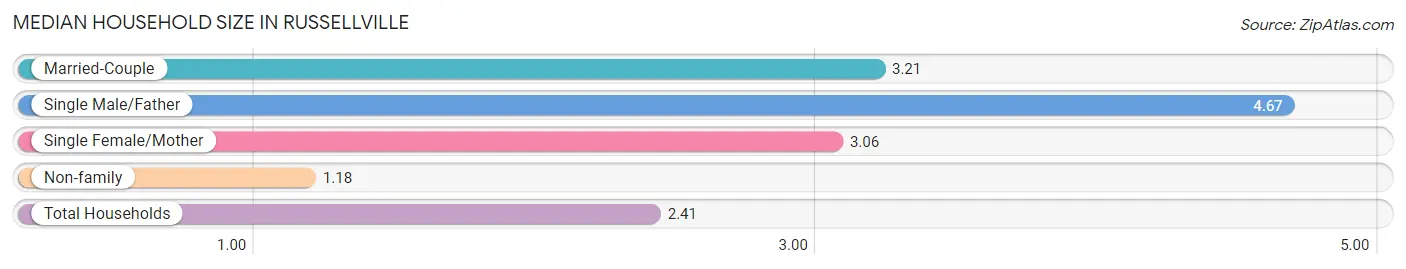
| Household Type | # Households | Household Size |
| Married-Couple | 146 (40.2%) | 3.21 |
| Single Male/Father | 9 (2.5%) | 4.67 |
| Single Female/Mother | 64 (17.6%) | 3.06 |
| Non-family | 144 (39.7%) | 1.18 |
| Total Households | 363 (100.0%) | 2.41 |
Household Size by Marriage Status in Russellville
Out of a total of 363 households in Russellville, 219 (60.3%) are family households, while 144 (39.7%) are nonfamily households. The most numerous type of family households are 2-person households, comprising 95, and the most common type of nonfamily households are 1-person households, comprising 124.
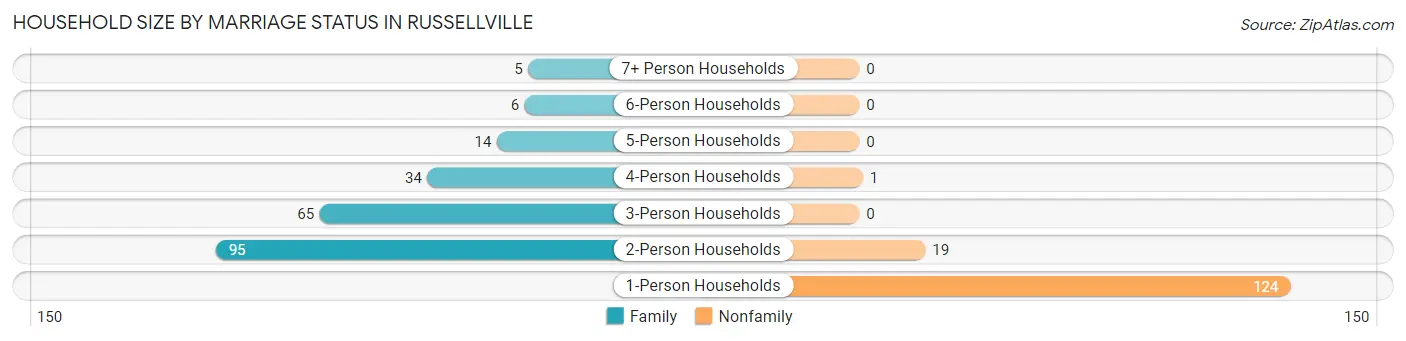
| Household Size | Family Households | Nonfamily Households |
| 1-Person Households | - | 124 (34.2%) |
| 2-Person Households | 95 (26.2%) | 19 (5.2%) |
| 3-Person Households | 65 (17.9%) | 0 (0.0%) |
| 4-Person Households | 34 (9.4%) | 1 (0.3%) |
| 5-Person Households | 14 (3.9%) | 0 (0.0%) |
| 6-Person Households | 6 (1.7%) | 0 (0.0%) |
| 7+ Person Households | 5 (1.4%) | 0 (0.0%) |
| Total | 219 (60.3%) | 144 (39.7%) |
Female Fertility in Russellville
Fertility by Age in Russellville
Average fertility rate in Russellville is 46.0 births per 1,000 women. Women in the age bracket of 20 to 34 years have the highest fertility rate with 74.0 births per 1,000 women. Women in the age bracket of 20 to 34 years acount for 100.0% of all women with births.
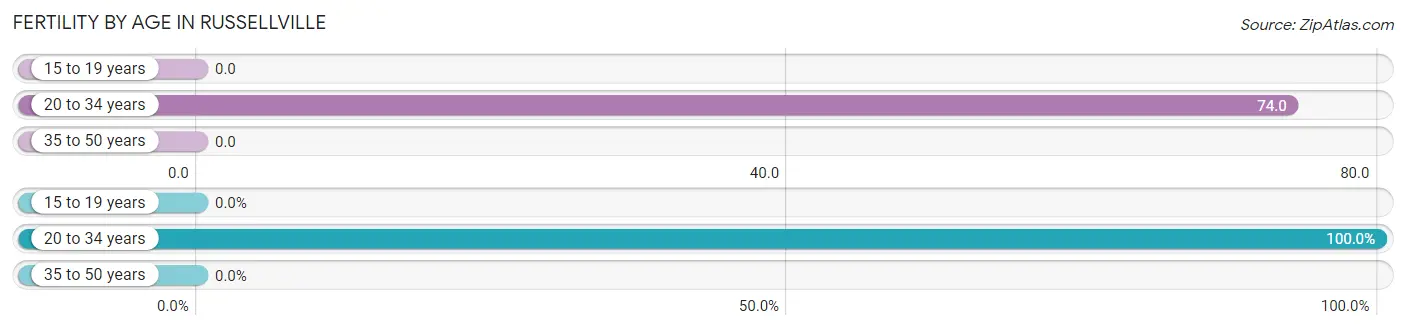
| Age Bracket | Women with Births | Births / 1,000 Women |
| 15 to 19 years | 0 (0.0%) | 0.0 |
| 20 to 34 years | 11 (100.0%) | 74.0 |
| 35 to 50 years | 0 (0.0%) | 0.0 |
| Total | 11 (100.0%) | 46.0 |
Fertility by Age by Marriage Status in Russellville
63.6% of women with births (11) in Russellville are married. The highest percentage of unmarried women with births falls into 20 to 34 years age bracket with 36.4% of them unmarried at the time of birth, while the lowest percentage of unmarried women with births belong to 20 to 34 years age bracket with 36.4% of them unmarried.
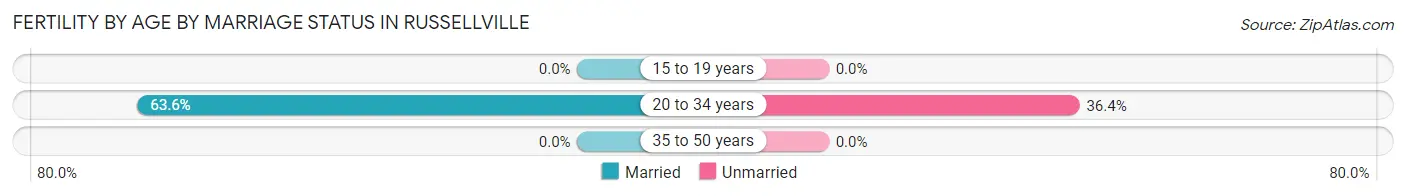
| Age Bracket | Married | Unmarried |
| 15 to 19 years | 0 (0.0%) | 0 (0.0%) |
| 20 to 34 years | 7 (63.6%) | 4 (36.4%) |
| 35 to 50 years | 0 (0.0%) | 0 (0.0%) |
| Total | 7 (63.6%) | 4 (36.4%) |
Fertility by Education in Russellville
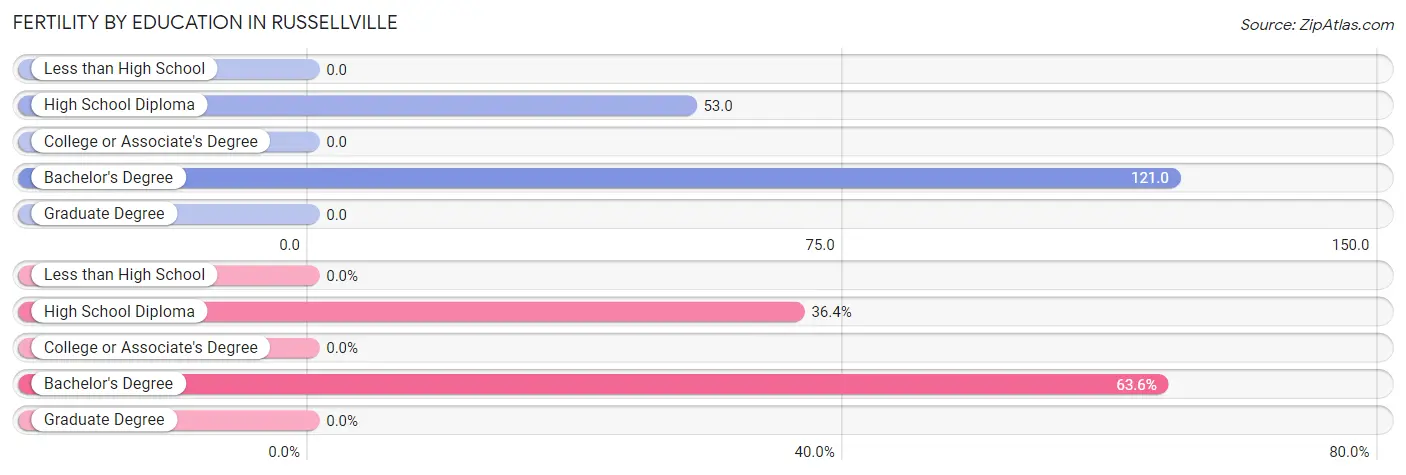
| Educational Attainment | Women with Births | Births / 1,000 Women |
| Less than High School | 0 (0.0%) | 0.0 |
| High School Diploma | 4 (36.4%) | 53.0 |
| College or Associate's Degree | 0 (0.0%) | 0.0 |
| Bachelor's Degree | 7 (63.6%) | 121.0 |
| Graduate Degree | 0 (0.0%) | 0.0 |
| Total | 11 (100.0%) | 46.0 |
Fertility by Education by Marriage Status in Russellville
36.4% of women with births in Russellville are unmarried. Women with the educational attainment of bachelor's degree are most likely to be married with 100.0% of them married at childbirth, while women with the educational attainment of high school diploma are least likely to be married with 100.0% of them unmarried at childbirth.
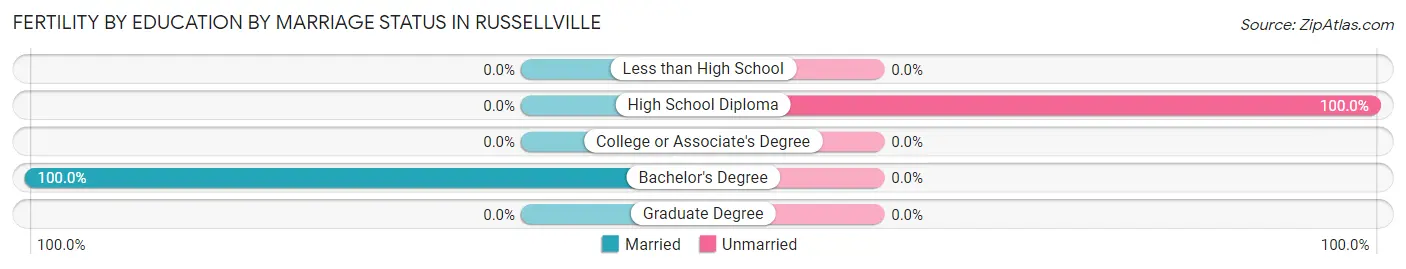
| Educational Attainment | Married | Unmarried |
| Less than High School | 0 (0.0%) | 0 (0.0%) |
| High School Diploma | 0 (0.0%) | 4 (100.0%) |
| College or Associate's Degree | 0 (0.0%) | 0 (0.0%) |
| Bachelor's Degree | 7 (100.0%) | 0 (0.0%) |
| Graduate Degree | 0 (0.0%) | 0 (0.0%) |
| Total | 7 (63.6%) | 4 (36.4%) |
Employment Characteristics in Russellville
Employment by Class of Employer in Russellville
Among the 490 employed individuals in Russellville, private company employees (280 | 57.1%), state government employees (86 | 17.5%), and self-employed (not incorporated) (42 | 8.6%) make up the most common classes of employment.
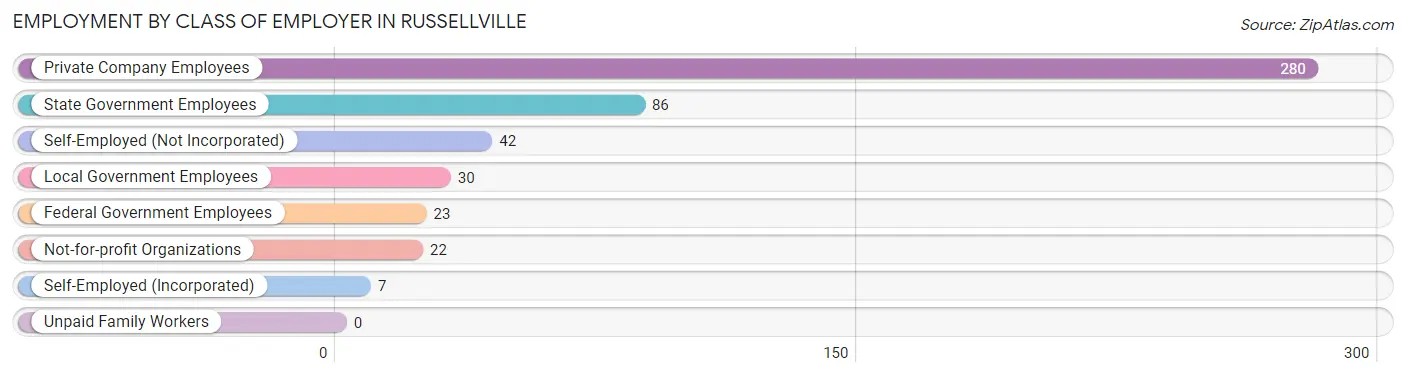
| Employer Class | # Employees | % Employees |
| Private Company Employees | 280 | 57.1% |
| Self-Employed (Incorporated) | 7 | 1.4% |
| Self-Employed (Not Incorporated) | 42 | 8.6% |
| Not-for-profit Organizations | 22 | 4.5% |
| Local Government Employees | 30 | 6.1% |
| State Government Employees | 86 | 17.5% |
| Federal Government Employees | 23 | 4.7% |
| Unpaid Family Workers | 0 | 0.0% |
| Total | 490 | 100.0% |
Employment Status by Age in Russellville
According to the labor force statistics for Russellville, out of the total population over 16 years of age (687), 73.5% or 505 individuals are in the labor force, with 2.0% or 10 of them unemployed. The age group with the highest labor force participation rate is 35 to 44 years, with 100.0% or 69 individuals in the labor force. Within the labor force, the 55 to 59 years age range has the highest percentage of unemployed individuals, with 10.7% or 3 of them being unemployed.
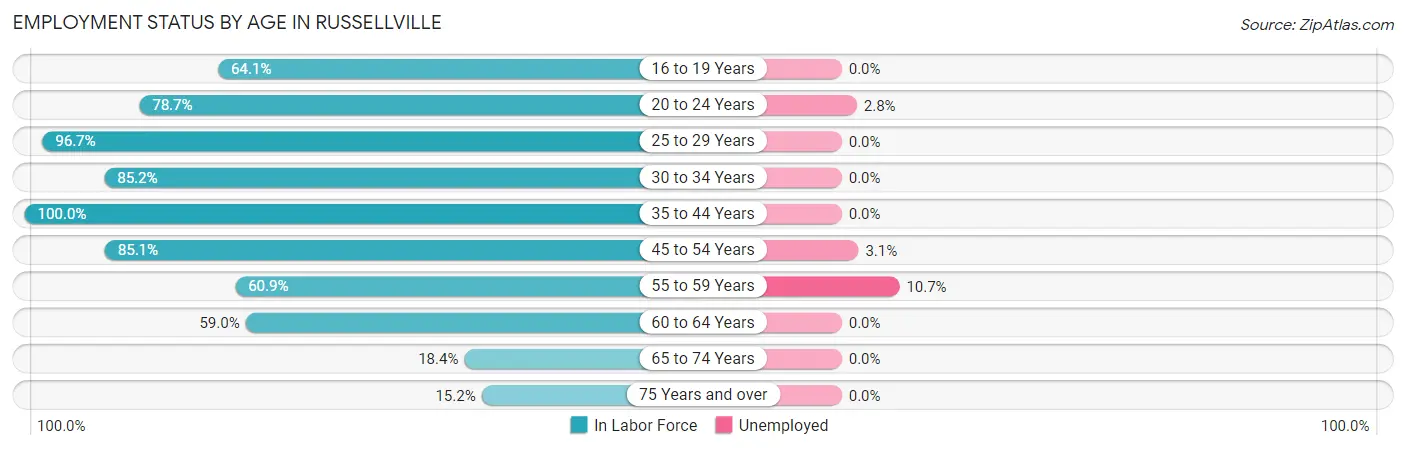
| Age Bracket | In Labor Force | Unemployed |
| 16 to 19 Years | 25 (64.1%) | 0 (0.0%) |
| 20 to 24 Years | 144 (78.7%) | 4 (2.8%) |
| 25 to 29 Years | 59 (96.7%) | 0 (0.0%) |
| 30 to 34 Years | 46 (85.2%) | 0 (0.0%) |
| 35 to 44 Years | 69 (100.0%) | 0 (0.0%) |
| 45 to 54 Years | 97 (85.1%) | 3 (3.1%) |
| 55 to 59 Years | 28 (60.9%) | 3 (10.7%) |
| 60 to 64 Years | 23 (59.0%) | 0 (0.0%) |
| 65 to 74 Years | 9 (18.4%) | 0 (0.0%) |
| 75 Years and over | 5 (15.2%) | 0 (0.0%) |
| Total | 505 (73.5%) | 10 (2.0%) |
Employment Status by Educational Attainment in Russellville
According to labor force statistics for Russellville, 84.1% of individuals (322) out of the total population between 25 and 64 years of age (383) are in the labor force, with 1.9% or 6 of them being unemployed. The group with the highest labor force participation rate are those with the educational attainment of bachelor's degree or higher, with 97.8% or 90 individuals in the labor force. Within the labor force, individuals with college / associate degree education have the highest percentage of unemployment, with 3.0% or 3 of them being unemployed.
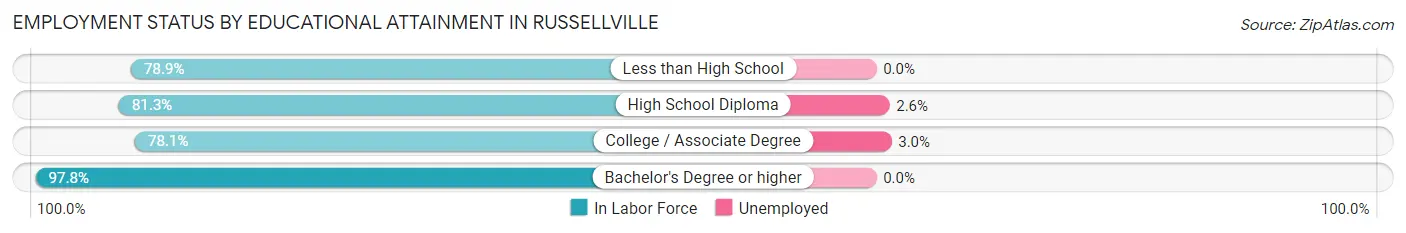
| Educational Attainment | In Labor Force | Unemployed |
| Less than High School | 15 (78.9%) | 0 (0.0%) |
| High School Diploma | 117 (81.3%) | 4 (2.6%) |
| College / Associate Degree | 100 (78.1%) | 4 (3.0%) |
| Bachelor's Degree or higher | 90 (97.8%) | 0 (0.0%) |
| Total | 322 (84.1%) | 7 (1.9%) |
Employment Occupations by Sex in Russellville
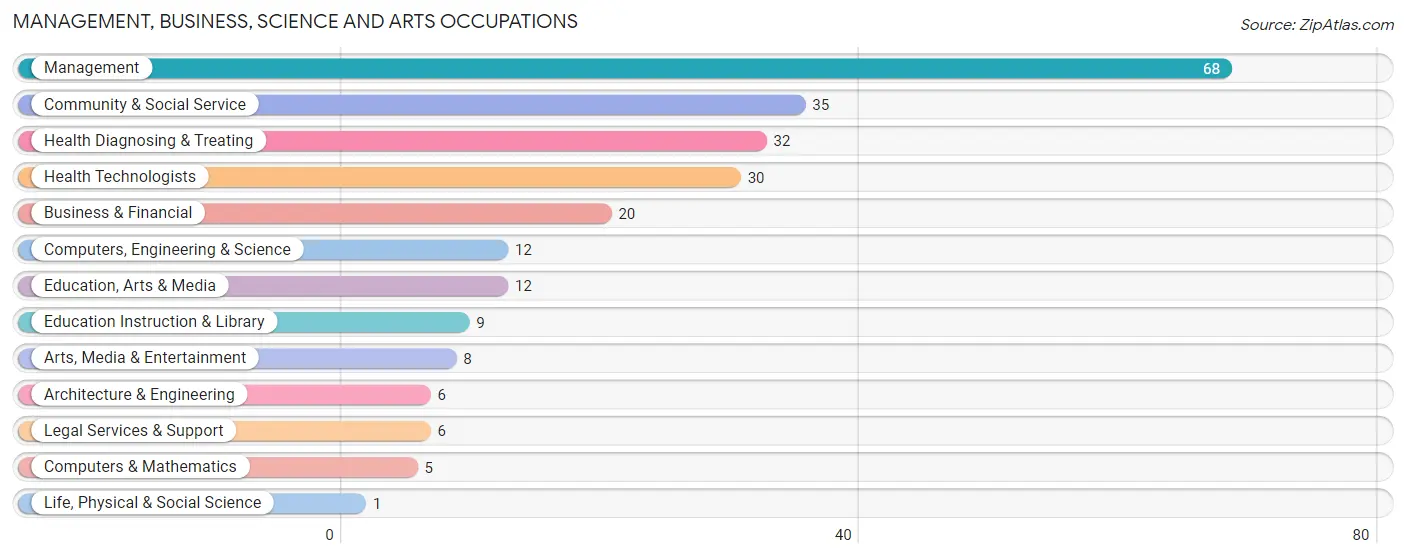
Management, Business, Science and Arts Occupations
The most common Management, Business, Science and Arts occupations in Russellville are Management (68 | 13.7%), Community & Social Service (35 | 7.1%), Health Diagnosing & Treating (32 | 6.5%), Health Technologists (30 | 6.1%), and Business & Financial (20 | 4.0%).
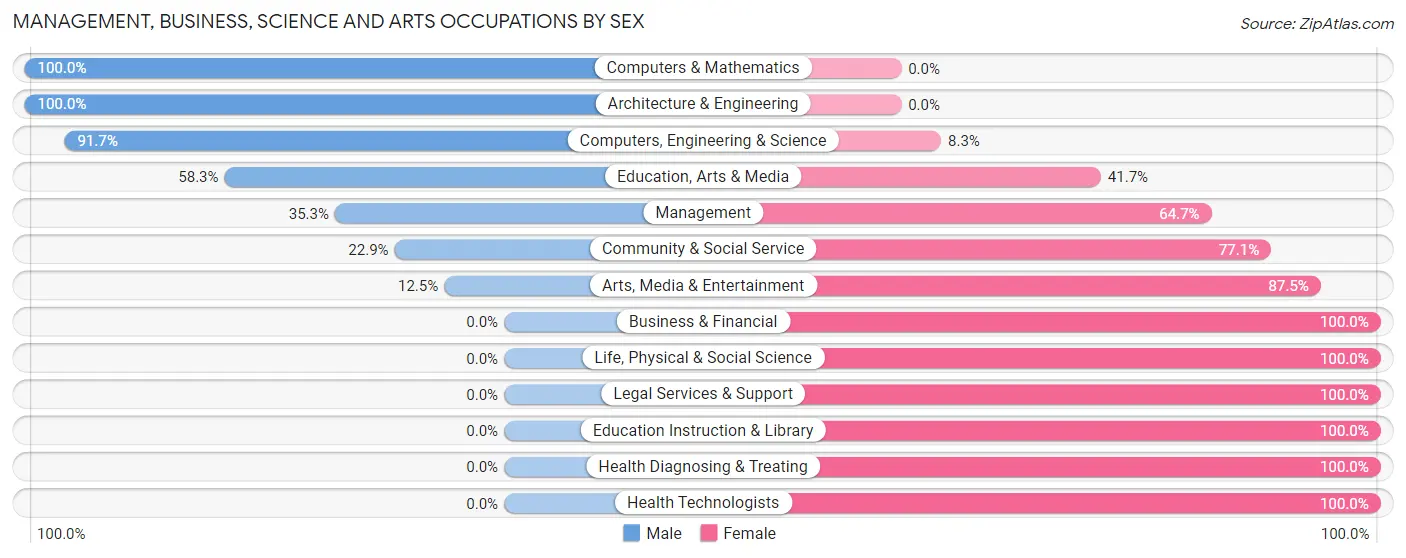
Management, Business, Science and Arts Occupations by Sex
Within the Management, Business, Science and Arts occupations in Russellville, the most male-oriented occupations are Computers & Mathematics (100.0%), Architecture & Engineering (100.0%), and Computers, Engineering & Science (91.7%), while the most female-oriented occupations are Business & Financial (100.0%), Life, Physical & Social Science (100.0%), and Legal Services & Support (100.0%).
| Occupation | Male | Female |
| Management | 24 (35.3%) | 44 (64.7%) |
| Business & Financial | 0 (0.0%) | 20 (100.0%) |
| Computers, Engineering & Science | 11 (91.7%) | 1 (8.3%) |
| Computers & Mathematics | 5 (100.0%) | 0 (0.0%) |
| Architecture & Engineering | 6 (100.0%) | 0 (0.0%) |
| Life, Physical & Social Science | 0 (0.0%) | 1 (100.0%) |
| Community & Social Service | 8 (22.9%) | 27 (77.1%) |
| Education, Arts & Media | 7 (58.3%) | 5 (41.7%) |
| Legal Services & Support | 0 (0.0%) | 6 (100.0%) |
| Education Instruction & Library | 0 (0.0%) | 9 (100.0%) |
| Arts, Media & Entertainment | 1 (12.5%) | 7 (87.5%) |
| Health Diagnosing & Treating | 0 (0.0%) | 32 (100.0%) |
| Health Technologists | 0 (0.0%) | 30 (100.0%) |
| Total (Category) | 43 (25.8%) | 124 (74.3%) |
| Total (Overall) | 222 (44.9%) | 273 (55.1%) |
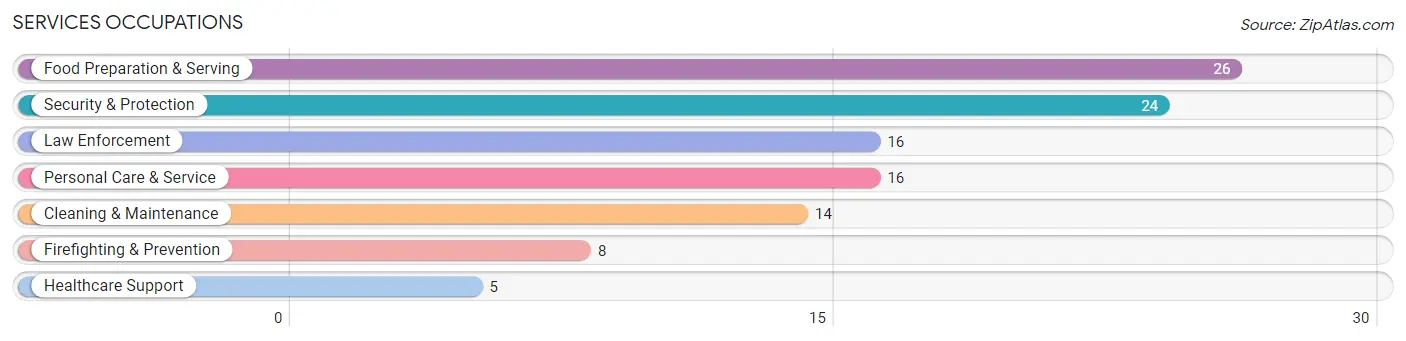
Services Occupations
The most common Services occupations in Russellville are Food Preparation & Serving (26 | 5.2%), Security & Protection (24 | 4.9%), Law Enforcement (16 | 3.2%), Personal Care & Service (16 | 3.2%), and Cleaning & Maintenance (14 | 2.8%).
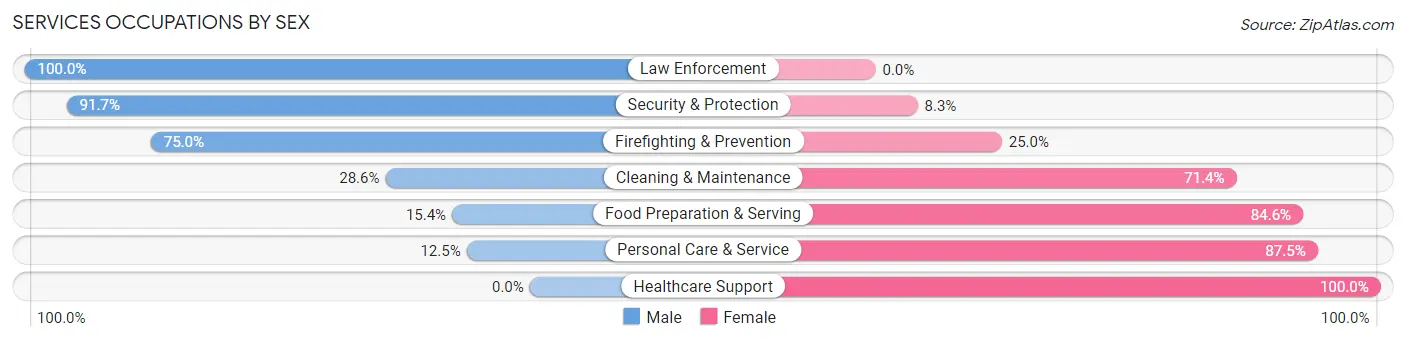
Services Occupations by Sex
Within the Services occupations in Russellville, the most male-oriented occupations are Law Enforcement (100.0%), Security & Protection (91.7%), and Firefighting & Prevention (75.0%), while the most female-oriented occupations are Healthcare Support (100.0%), Personal Care & Service (87.5%), and Food Preparation & Serving (84.6%).
| Occupation | Male | Female |
| Healthcare Support | 0 (0.0%) | 5 (100.0%) |
| Security & Protection | 22 (91.7%) | 2 (8.3%) |
| Firefighting & Prevention | 6 (75.0%) | 2 (25.0%) |
| Law Enforcement | 16 (100.0%) | 0 (0.0%) |
| Food Preparation & Serving | 4 (15.4%) | 22 (84.6%) |
| Cleaning & Maintenance | 4 (28.6%) | 10 (71.4%) |
| Personal Care & Service | 2 (12.5%) | 14 (87.5%) |
| Total (Category) | 32 (37.7%) | 53 (62.4%) |
| Total (Overall) | 222 (44.9%) | 273 (55.1%) |
Sales and Office Occupations
The most common Sales and Office occupations in Russellville are Office & Administration (65 | 13.1%), and Sales & Related (61 | 12.3%).
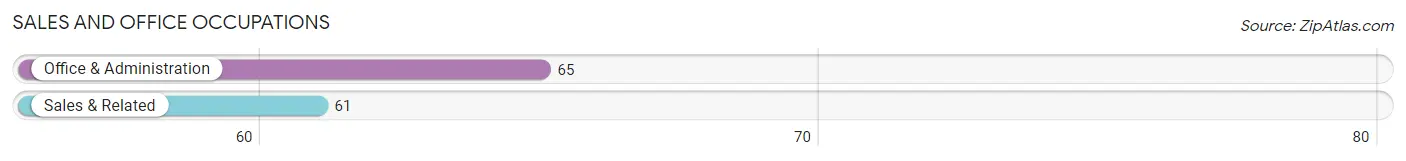
Sales and Office Occupations by Sex

| Occupation | Male | Female |
| Sales & Related | 29 (47.5%) | 32 (52.5%) |
| Office & Administration | 9 (13.9%) | 56 (86.2%) |
| Total (Category) | 38 (30.2%) | 88 (69.8%) |
| Total (Overall) | 222 (44.9%) | 273 (55.1%) |
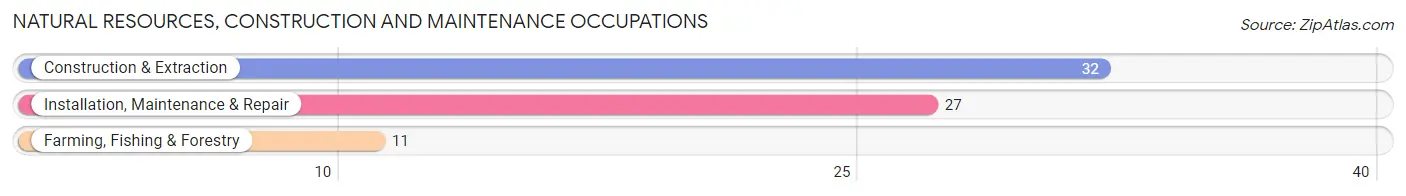
Natural Resources, Construction and Maintenance Occupations
The most common Natural Resources, Construction and Maintenance occupations in Russellville are Construction & Extraction (32 | 6.5%), Installation, Maintenance & Repair (27 | 5.4%), and Farming, Fishing & Forestry (11 | 2.2%).
Natural Resources, Construction and Maintenance Occupations by Sex
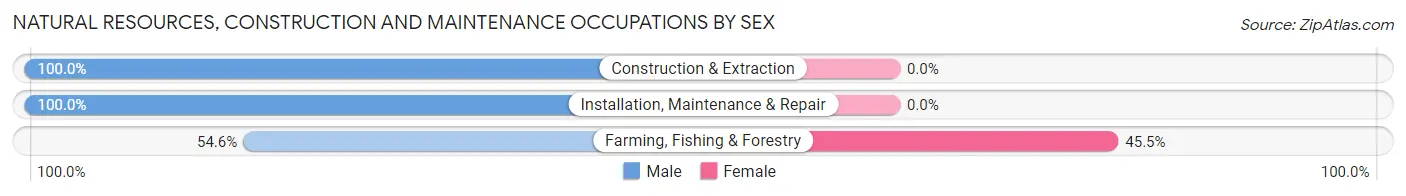
| Occupation | Male | Female |
| Farming, Fishing & Forestry | 6 (54.5%) | 5 (45.5%) |
| Construction & Extraction | 32 (100.0%) | 0 (0.0%) |
| Installation, Maintenance & Repair | 27 (100.0%) | 0 (0.0%) |
| Total (Category) | 65 (92.9%) | 5 (7.1%) |
| Total (Overall) | 222 (44.9%) | 273 (55.1%) |
Production, Transportation and Moving Occupations
The most common Production, Transportation and Moving occupations in Russellville are Production (21 | 4.2%), Transportation (13 | 2.6%), and Material Moving (13 | 2.6%).
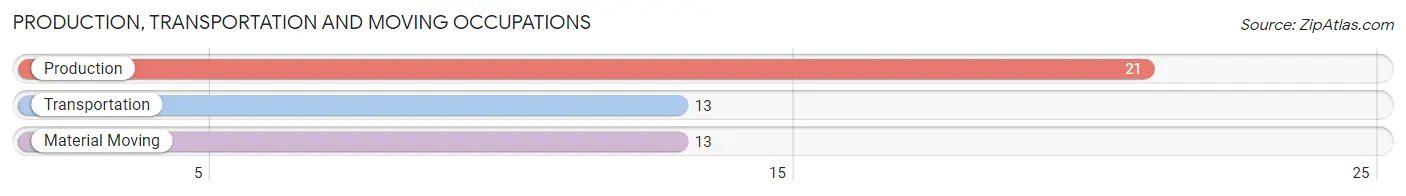
Production, Transportation and Moving Occupations by Sex
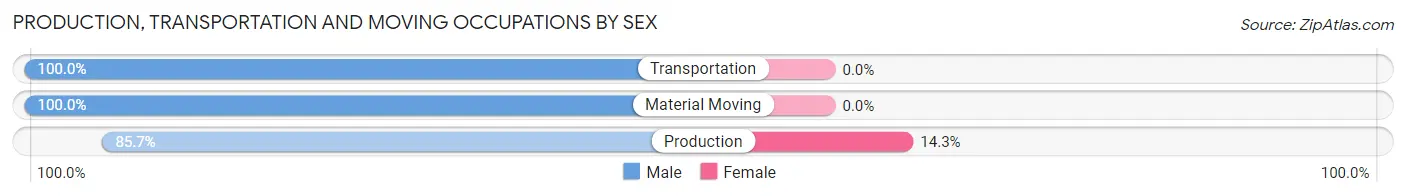
| Occupation | Male | Female |
| Production | 18 (85.7%) | 3 (14.3%) |
| Transportation | 13 (100.0%) | 0 (0.0%) |
| Material Moving | 13 (100.0%) | 0 (0.0%) |
| Total (Category) | 44 (93.6%) | 3 (6.4%) |
| Total (Overall) | 222 (44.9%) | 273 (55.1%) |
Employment Industries by Sex in Russellville
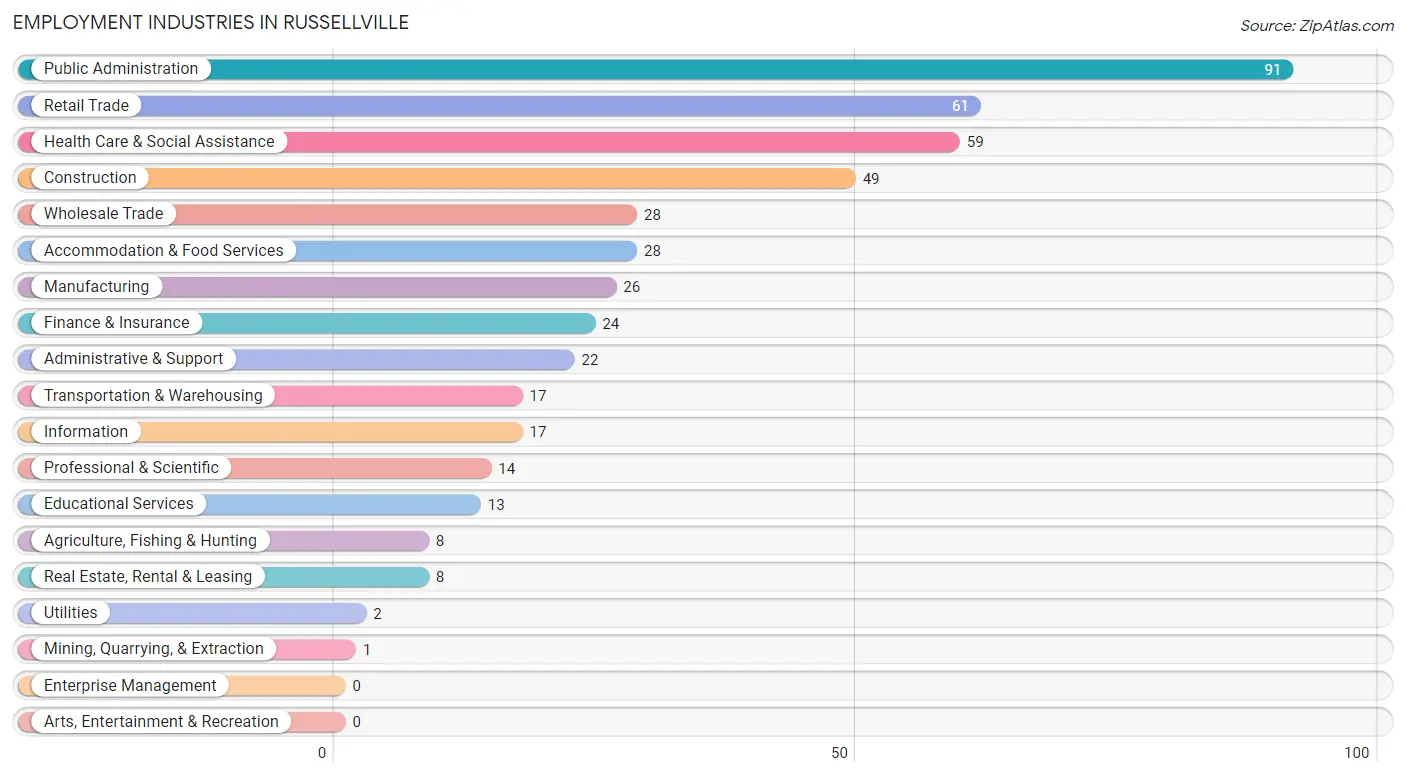
Employment Industries in Russellville
The major employment industries in Russellville include Public Administration (91 | 18.4%), Retail Trade (61 | 12.3%), Health Care & Social Assistance (59 | 11.9%), Construction (49 | 9.9%), and Wholesale Trade (28 | 5.7%).
Employment Industries by Sex in Russellville
The Russellville industries that see more men than women are Mining, Quarrying, & Extraction (100.0%), Construction (100.0%), and Transportation & Warehousing (100.0%), whereas the industries that tend to have a higher number of women are Educational Services (100.0%), Health Care & Social Assistance (93.2%), and Finance & Insurance (91.7%).
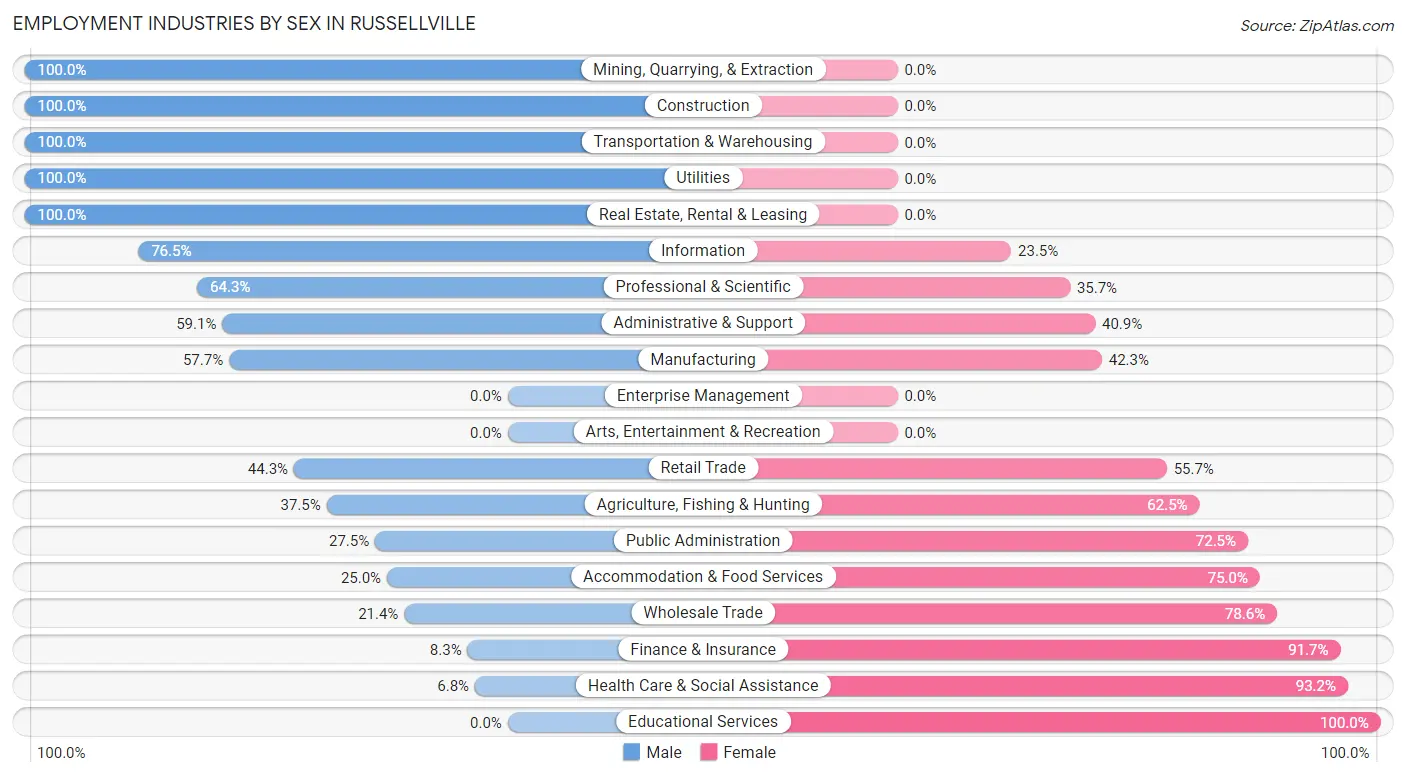
| Industry | Male | Female |
| Agriculture, Fishing & Hunting | 3 (37.5%) | 5 (62.5%) |
| Mining, Quarrying, & Extraction | 1 (100.0%) | 0 (0.0%) |
| Construction | 49 (100.0%) | 0 (0.0%) |
| Manufacturing | 15 (57.7%) | 11 (42.3%) |
| Wholesale Trade | 6 (21.4%) | 22 (78.6%) |
| Retail Trade | 27 (44.3%) | 34 (55.7%) |
| Transportation & Warehousing | 17 (100.0%) | 0 (0.0%) |
| Utilities | 2 (100.0%) | 0 (0.0%) |
| Information | 13 (76.5%) | 4 (23.5%) |
| Finance & Insurance | 2 (8.3%) | 22 (91.7%) |
| Real Estate, Rental & Leasing | 8 (100.0%) | 0 (0.0%) |
| Professional & Scientific | 9 (64.3%) | 5 (35.7%) |
| Enterprise Management | 0 (0.0%) | 0 (0.0%) |
| Administrative & Support | 13 (59.1%) | 9 (40.9%) |
| Educational Services | 0 (0.0%) | 13 (100.0%) |
| Health Care & Social Assistance | 4 (6.8%) | 55 (93.2%) |
| Arts, Entertainment & Recreation | 0 (0.0%) | 0 (0.0%) |
| Accommodation & Food Services | 7 (25.0%) | 21 (75.0%) |
| Public Administration | 25 (27.5%) | 66 (72.5%) |
| Total | 222 (44.9%) | 273 (55.1%) |
Education in Russellville
School Enrollment in Russellville
The most common levels of schooling among the 182 students in Russellville are elementary school (53 | 29.1%), high school (42 | 23.1%), and middle school (41 | 22.5%).
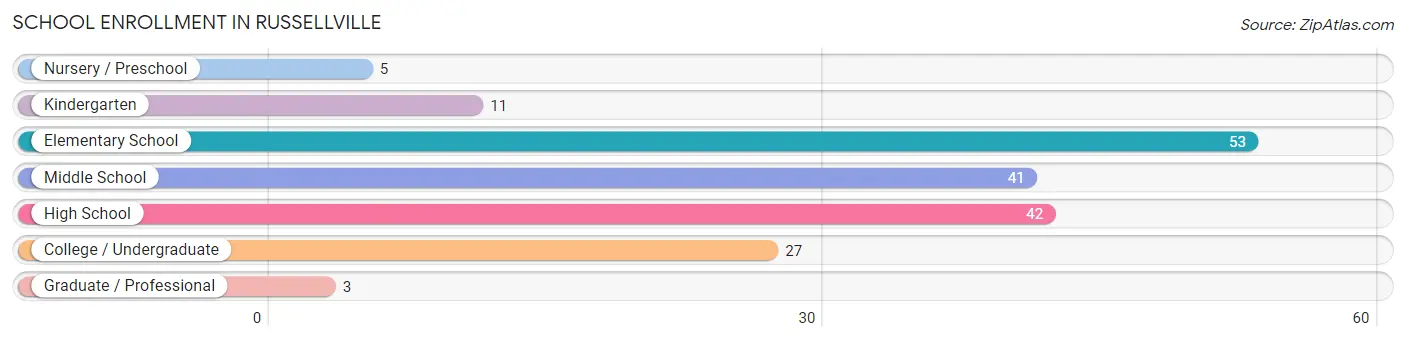
| School Level | # Students | % Students |
| Nursery / Preschool | 5 | 2.8% |
| Kindergarten | 11 | 6.0% |
| Elementary School | 53 | 29.1% |
| Middle School | 41 | 22.5% |
| High School | 42 | 23.1% |
| College / Undergraduate | 27 | 14.8% |
| Graduate / Professional | 3 | 1.7% |
| Total | 182 | 100.0% |
School Enrollment by Age by Funding Source in Russellville
Out of a total of 182 students who are enrolled in schools in Russellville, 25 (13.7%) attend a private institution, while the remaining 157 (86.3%) are enrolled in public schools. The age group of 18 to 19 year olds has the highest likelihood of being enrolled in private schools, with 4 (40.0% in the age bracket) enrolled. Conversely, the age group of 3 to 4 year olds has the lowest likelihood of being enrolled in a private school, with 5 (100.0% in the age bracket) attending a public institution.
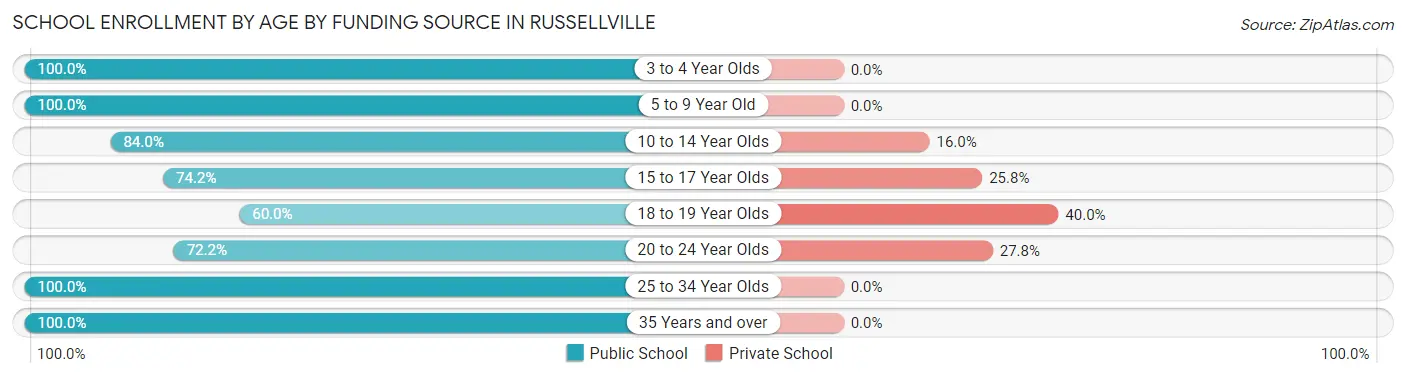
| Age Bracket | Public School | Private School |
| 3 to 4 Year Olds | 5 (100.0%) | 0 (0.0%) |
| 5 to 9 Year Old | 60 (100.0%) | 0 (0.0%) |
| 10 to 14 Year Olds | 42 (84.0%) | 8 (16.0%) |
| 15 to 17 Year Olds | 23 (74.2%) | 8 (25.8%) |
| 18 to 19 Year Olds | 6 (60.0%) | 4 (40.0%) |
| 20 to 24 Year Olds | 13 (72.2%) | 5 (27.8%) |
| 25 to 34 Year Olds | 2 (100.0%) | 0 (0.0%) |
| 35 Years and over | 6 (100.0%) | 0 (0.0%) |
| Total | 157 (86.3%) | 25 (13.7%) |
Educational Attainment by Field of Study in Russellville
Business (31 | 27.0%), science & technology (21 | 18.3%), arts & humanities (13 | 11.3%), education (12 | 10.4%), and social sciences (9 | 7.8%) are the most common fields of study among 115 individuals in Russellville who have obtained a bachelor's degree or higher.
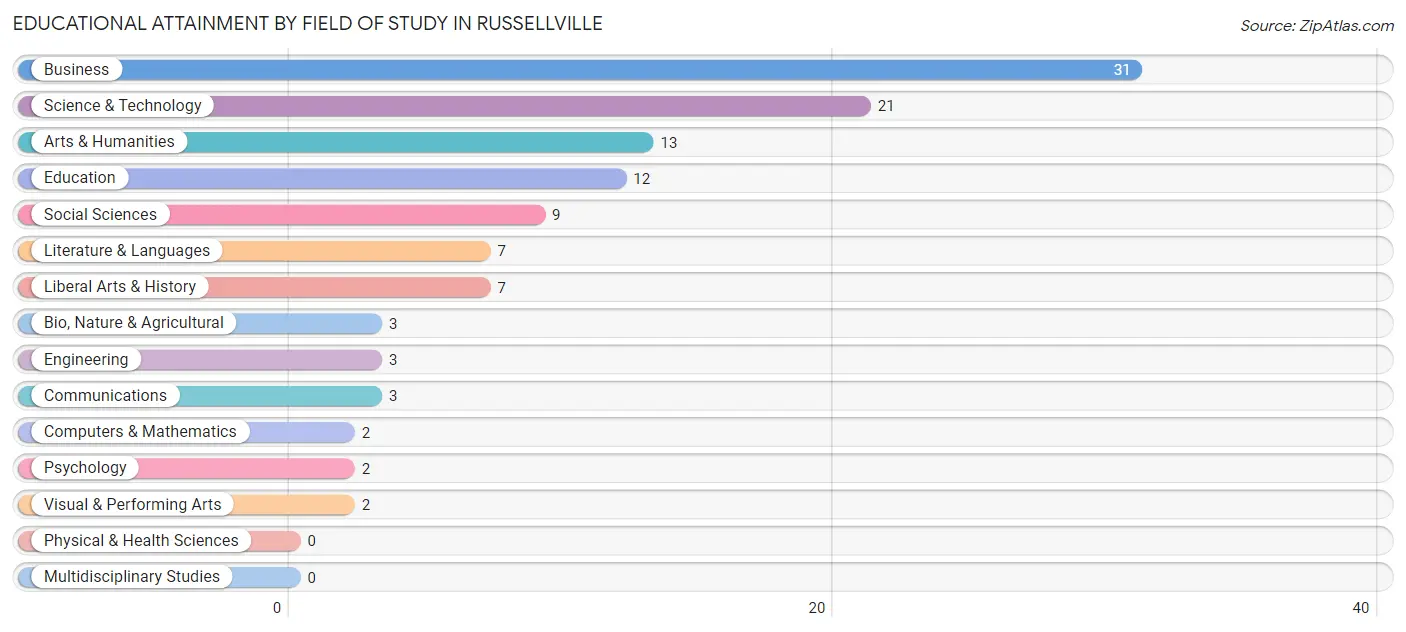
| Field of Study | # Graduates | % Graduates |
| Computers & Mathematics | 2 | 1.7% |
| Bio, Nature & Agricultural | 3 | 2.6% |
| Physical & Health Sciences | 0 | 0.0% |
| Psychology | 2 | 1.7% |
| Social Sciences | 9 | 7.8% |
| Engineering | 3 | 2.6% |
| Multidisciplinary Studies | 0 | 0.0% |
| Science & Technology | 21 | 18.3% |
| Business | 31 | 27.0% |
| Education | 12 | 10.4% |
| Literature & Languages | 7 | 6.1% |
| Liberal Arts & History | 7 | 6.1% |
| Visual & Performing Arts | 2 | 1.7% |
| Communications | 3 | 2.6% |
| Arts & Humanities | 13 | 11.3% |
| Total | 115 | 100.0% |
Transportation & Commute in Russellville
Vehicle Availability by Sex in Russellville
The most prevalent vehicle ownership categories in Russellville are males with 3 vehicles (86, accounting for 39.6%) and females with 3 vehicles (67, making up 31.5%).
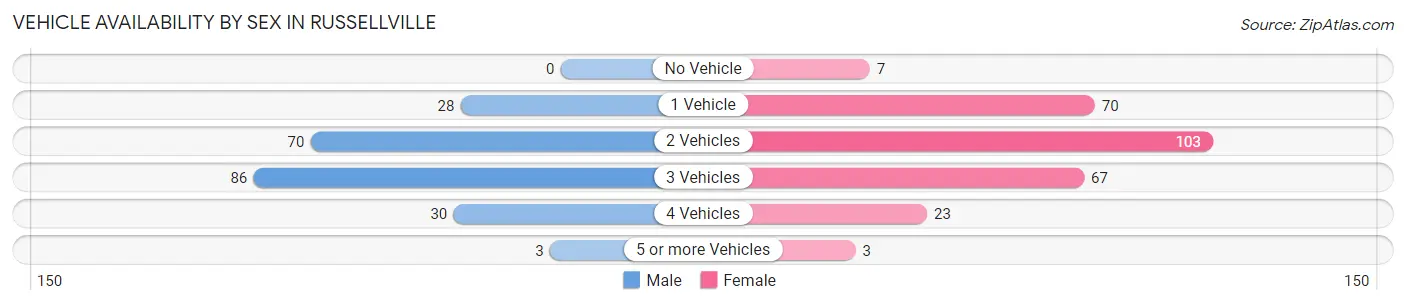
| Vehicles Available | Male | Female |
| No Vehicle | 0 (0.0%) | 7 (2.6%) |
| 1 Vehicle | 28 (12.9%) | 70 (25.6%) |
| 2 Vehicles | 70 (32.3%) | 103 (37.7%) |
| 3 Vehicles | 86 (39.6%) | 67 (24.5%) |
| 4 Vehicles | 30 (13.8%) | 23 (8.4%) |
| 5 or more Vehicles | 3 (1.4%) | 3 (1.1%) |
| Total | 217 (100.0%) | 273 (100.0%) |
Commute Time in Russellville
The most frequently occuring commute durations in Russellville are 20 to 24 minutes (120 commuters, 25.6%), 30 to 34 minutes (110 commuters, 23.5%), and 15 to 19 minutes (79 commuters, 16.9%).
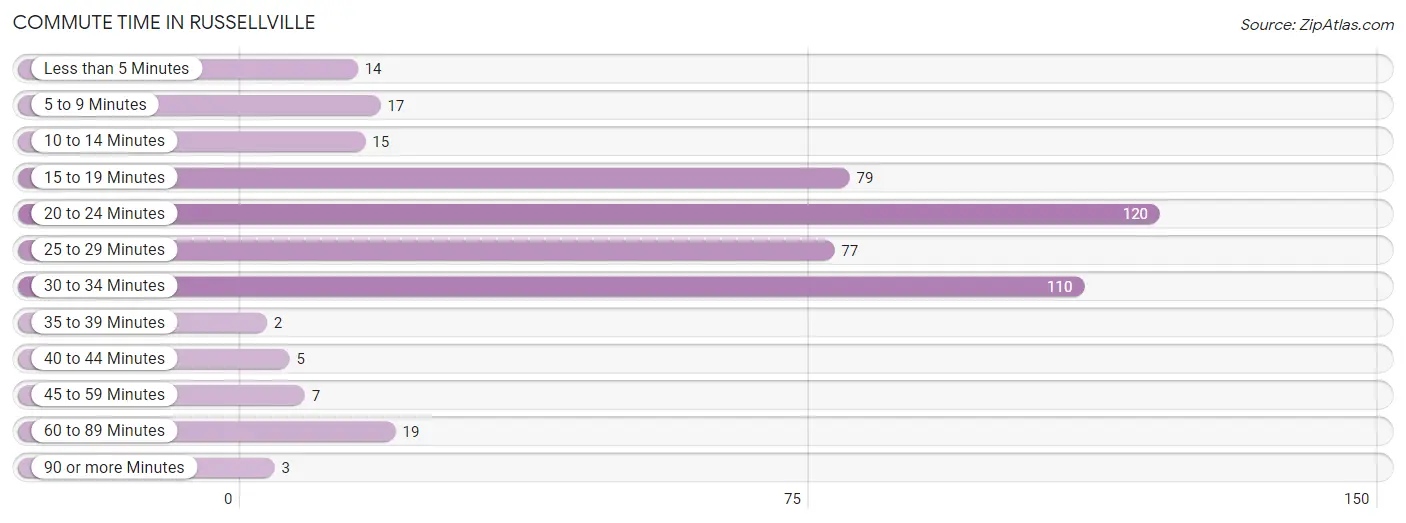
| Commute Time | # Commuters | % Commuters |
| Less than 5 Minutes | 14 | 3.0% |
| 5 to 9 Minutes | 17 | 3.6% |
| 10 to 14 Minutes | 15 | 3.2% |
| 15 to 19 Minutes | 79 | 16.9% |
| 20 to 24 Minutes | 120 | 25.6% |
| 25 to 29 Minutes | 77 | 16.5% |
| 30 to 34 Minutes | 110 | 23.5% |
| 35 to 39 Minutes | 2 | 0.4% |
| 40 to 44 Minutes | 5 | 1.1% |
| 45 to 59 Minutes | 7 | 1.5% |
| 60 to 89 Minutes | 19 | 4.1% |
| 90 or more Minutes | 3 | 0.6% |
Commute Time by Sex in Russellville
The most common commute times in Russellville are 30 to 34 minutes (74 commuters, 34.3%) for males and 15 to 19 minutes (60 commuters, 23.8%) for females.
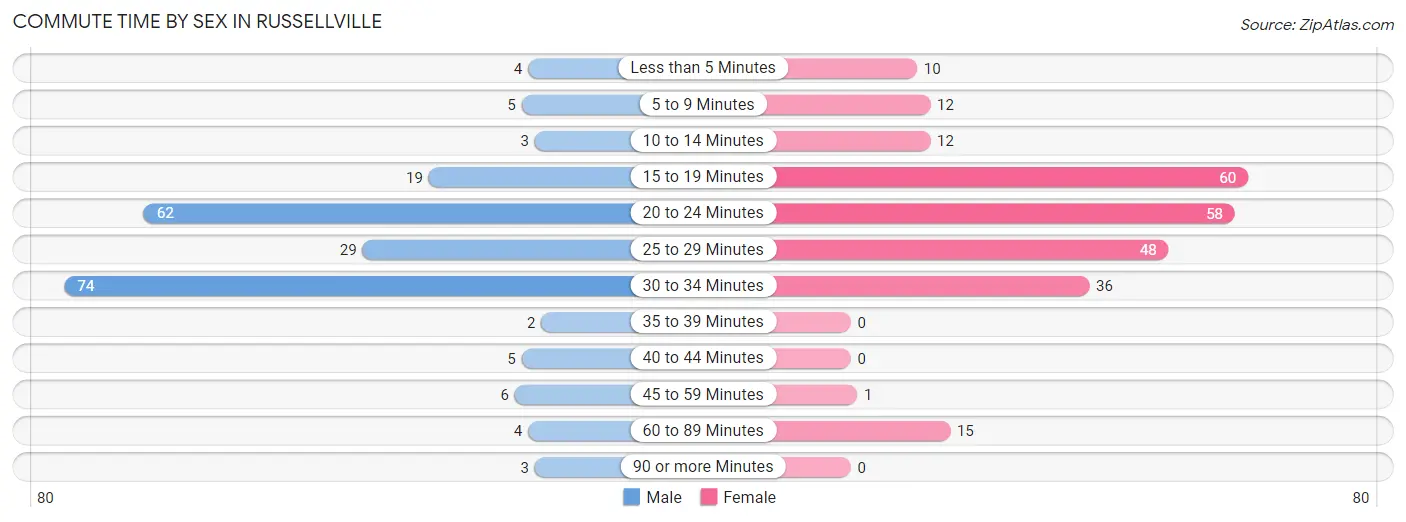
| Commute Time | Male | Female |
| Less than 5 Minutes | 4 (1.8%) | 10 (4.0%) |
| 5 to 9 Minutes | 5 (2.3%) | 12 (4.8%) |
| 10 to 14 Minutes | 3 (1.4%) | 12 (4.8%) |
| 15 to 19 Minutes | 19 (8.8%) | 60 (23.8%) |
| 20 to 24 Minutes | 62 (28.7%) | 58 (23.0%) |
| 25 to 29 Minutes | 29 (13.4%) | 48 (19.1%) |
| 30 to 34 Minutes | 74 (34.3%) | 36 (14.3%) |
| 35 to 39 Minutes | 2 (0.9%) | 0 (0.0%) |
| 40 to 44 Minutes | 5 (2.3%) | 0 (0.0%) |
| 45 to 59 Minutes | 6 (2.8%) | 1 (0.4%) |
| 60 to 89 Minutes | 4 (1.8%) | 15 (5.9%) |
| 90 or more Minutes | 3 (1.4%) | 0 (0.0%) |
Time of Departure to Work by Sex in Russellville
The most frequent times of departure to work in Russellville are 7:00 AM to 7:29 AM (68, 31.5%) for males and 7:00 AM to 7:29 AM (72, 28.6%) for females.
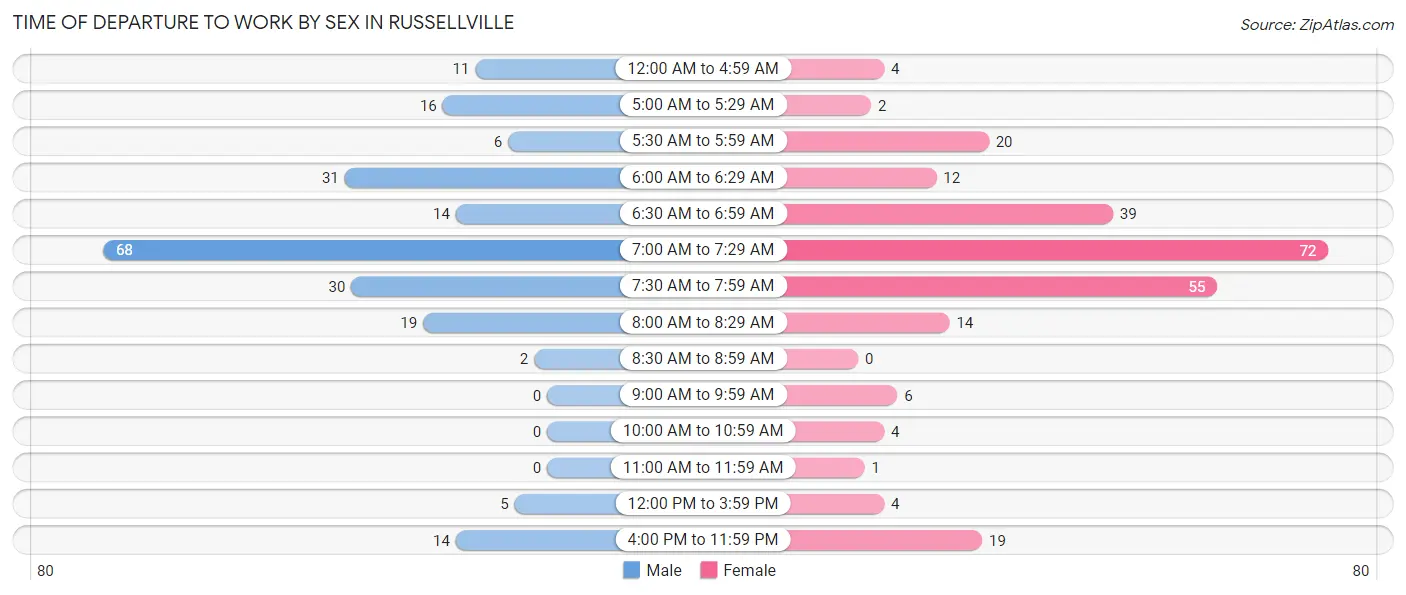
| Time of Departure | Male | Female |
| 12:00 AM to 4:59 AM | 11 (5.1%) | 4 (1.6%) |
| 5:00 AM to 5:29 AM | 16 (7.4%) | 2 (0.8%) |
| 5:30 AM to 5:59 AM | 6 (2.8%) | 20 (7.9%) |
| 6:00 AM to 6:29 AM | 31 (14.3%) | 12 (4.8%) |
| 6:30 AM to 6:59 AM | 14 (6.5%) | 39 (15.5%) |
| 7:00 AM to 7:29 AM | 68 (31.5%) | 72 (28.6%) |
| 7:30 AM to 7:59 AM | 30 (13.9%) | 55 (21.8%) |
| 8:00 AM to 8:29 AM | 19 (8.8%) | 14 (5.6%) |
| 8:30 AM to 8:59 AM | 2 (0.9%) | 0 (0.0%) |
| 9:00 AM to 9:59 AM | 0 (0.0%) | 6 (2.4%) |
| 10:00 AM to 10:59 AM | 0 (0.0%) | 4 (1.6%) |
| 11:00 AM to 11:59 AM | 0 (0.0%) | 1 (0.4%) |
| 12:00 PM to 3:59 PM | 5 (2.3%) | 4 (1.6%) |
| 4:00 PM to 11:59 PM | 14 (6.5%) | 19 (7.5%) |
| Total | 216 (100.0%) | 252 (100.0%) |
Housing Occupancy in Russellville
Occupancy by Ownership in Russellville
Of the total 363 dwellings in Russellville, owner-occupied units account for 261 (71.9%), while renter-occupied units make up 102 (28.1%).
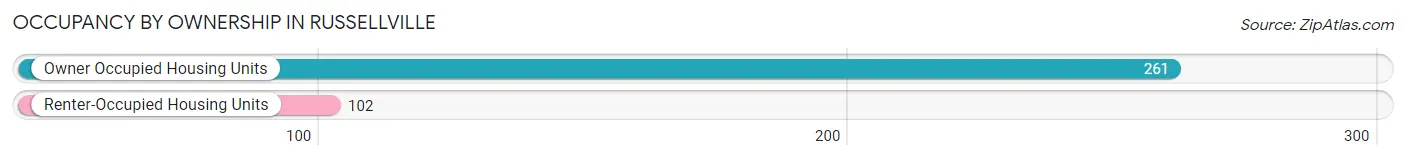
| Occupancy | # Housing Units | % Housing Units |
| Owner Occupied Housing Units | 261 | 71.9% |
| Renter-Occupied Housing Units | 102 | 28.1% |
| Total Occupied Housing Units | 363 | 100.0% |
Occupancy by Household Size in Russellville
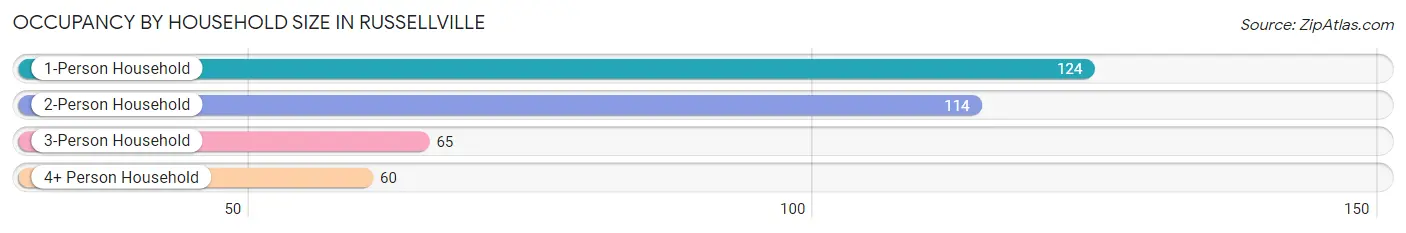
| Household Size | # Housing Units | % Housing Units |
| 1-Person Household | 124 | 34.2% |
| 2-Person Household | 114 | 31.4% |
| 3-Person Household | 65 | 17.9% |
| 4+ Person Household | 60 | 16.5% |
| Total Housing Units | 363 | 100.0% |
Occupancy by Ownership by Household Size in Russellville
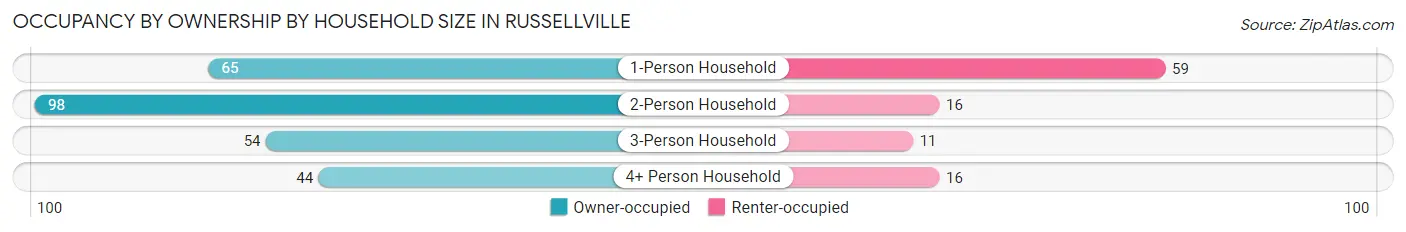
| Household Size | Owner-occupied | Renter-occupied |
| 1-Person Household | 65 (52.4%) | 59 (47.6%) |
| 2-Person Household | 98 (86.0%) | 16 (14.0%) |
| 3-Person Household | 54 (83.1%) | 11 (16.9%) |
| 4+ Person Household | 44 (73.3%) | 16 (26.7%) |
| Total Housing Units | 261 (71.9%) | 102 (28.1%) |
Occupancy by Educational Attainment in Russellville
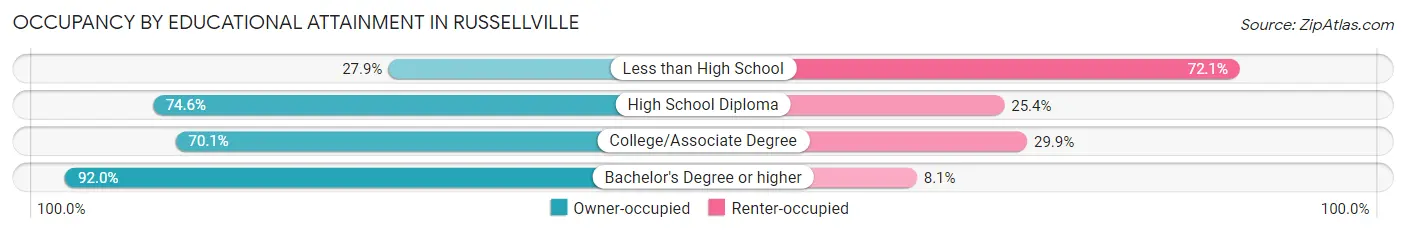
| Household Size | Owner-occupied | Renter-occupied |
| Less than High School | 12 (27.9%) | 31 (72.1%) |
| High School Diploma | 94 (74.6%) | 32 (25.4%) |
| College/Associate Degree | 75 (70.1%) | 32 (29.9%) |
| Bachelor's Degree or higher | 80 (91.9%) | 7 (8.1%) |
Occupancy by Age of Householder in Russellville
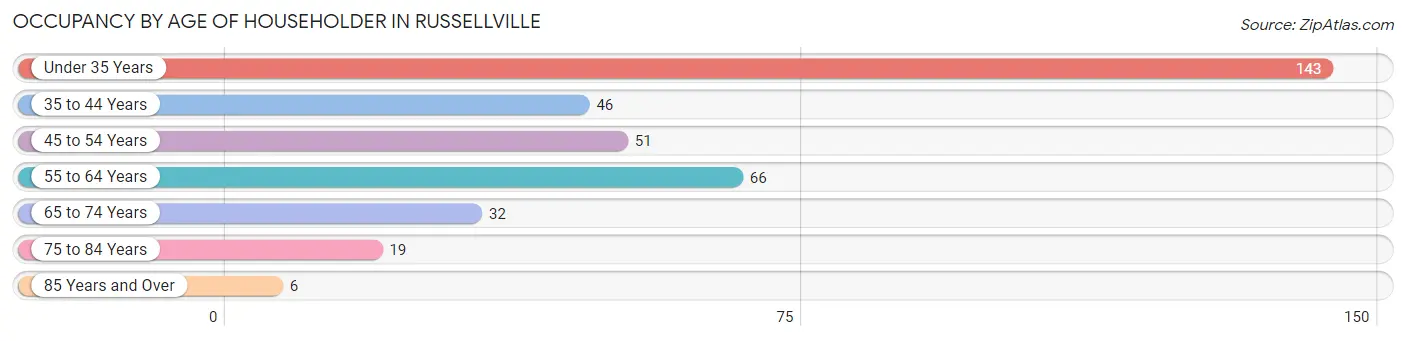
| Age Bracket | # Households | % Households |
| Under 35 Years | 143 | 39.4% |
| 35 to 44 Years | 46 | 12.7% |
| 45 to 54 Years | 51 | 14.1% |
| 55 to 64 Years | 66 | 18.2% |
| 65 to 74 Years | 32 | 8.8% |
| 75 to 84 Years | 19 | 5.2% |
| 85 Years and Over | 6 | 1.7% |
| Total | 363 | 100.0% |
Housing Finances in Russellville
Median Income by Occupancy in Russellville
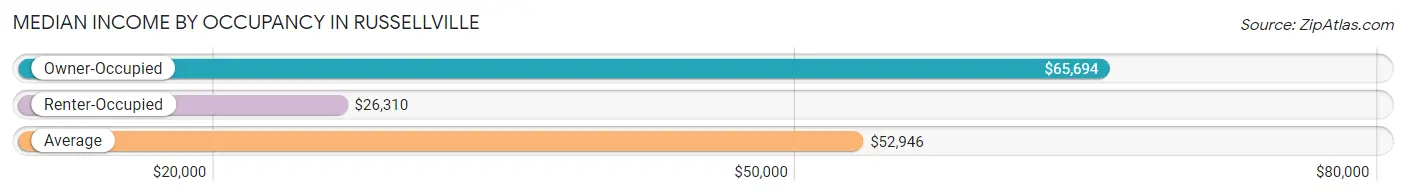
| Occupancy Type | # Households | Median Income |
| Owner-Occupied | 261 (71.9%) | $65,694 |
| Renter-Occupied | 102 (28.1%) | $26,310 |
| Average | 363 (100.0%) | $52,946 |
Occupancy by Householder Income Bracket in Russellville
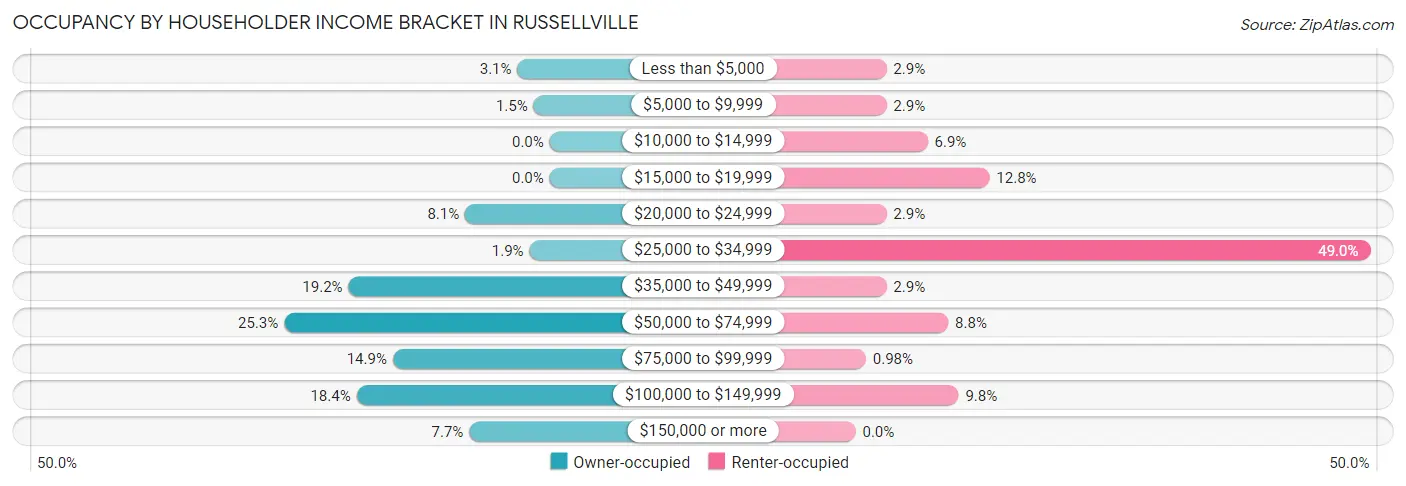
| Income Bracket | Owner-occupied | Renter-occupied |
| Less than $5,000 | 8 (3.1%) | 3 (2.9%) |
| $5,000 to $9,999 | 4 (1.5%) | 3 (2.9%) |
| $10,000 to $14,999 | 0 (0.0%) | 7 (6.9%) |
| $15,000 to $19,999 | 0 (0.0%) | 13 (12.8%) |
| $20,000 to $24,999 | 21 (8.1%) | 3 (2.9%) |
| $25,000 to $34,999 | 5 (1.9%) | 50 (49.0%) |
| $35,000 to $49,999 | 50 (19.2%) | 3 (2.9%) |
| $50,000 to $74,999 | 66 (25.3%) | 9 (8.8%) |
| $75,000 to $99,999 | 39 (14.9%) | 1 (1.0%) |
| $100,000 to $149,999 | 48 (18.4%) | 10 (9.8%) |
| $150,000 or more | 20 (7.7%) | 0 (0.0%) |
| Total | 261 (100.0%) | 102 (100.0%) |
Monthly Housing Cost Tiers in Russellville
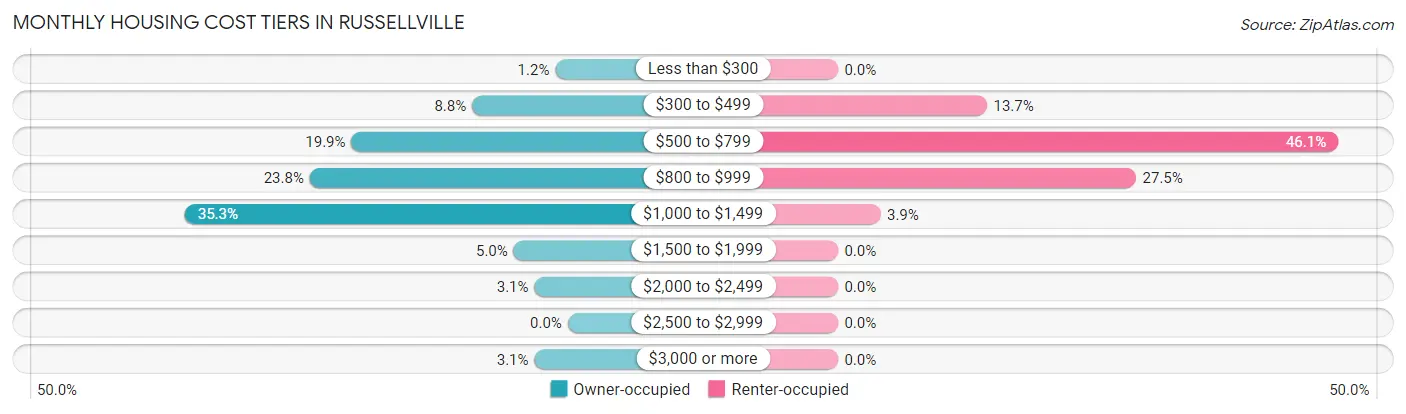
| Monthly Cost | Owner-occupied | Renter-occupied |
| Less than $300 | 3 (1.1%) | 0 (0.0%) |
| $300 to $499 | 23 (8.8%) | 14 (13.7%) |
| $500 to $799 | 52 (19.9%) | 47 (46.1%) |
| $800 to $999 | 62 (23.7%) | 28 (27.5%) |
| $1,000 to $1,499 | 92 (35.2%) | 4 (3.9%) |
| $1,500 to $1,999 | 13 (5.0%) | 0 (0.0%) |
| $2,000 to $2,499 | 8 (3.1%) | 0 (0.0%) |
| $2,500 to $2,999 | 0 (0.0%) | 0 (0.0%) |
| $3,000 or more | 8 (3.1%) | 0 (0.0%) |
| Total | 261 (100.0%) | 102 (100.0%) |
Physical Housing Characteristics in Russellville
Housing Structures in Russellville
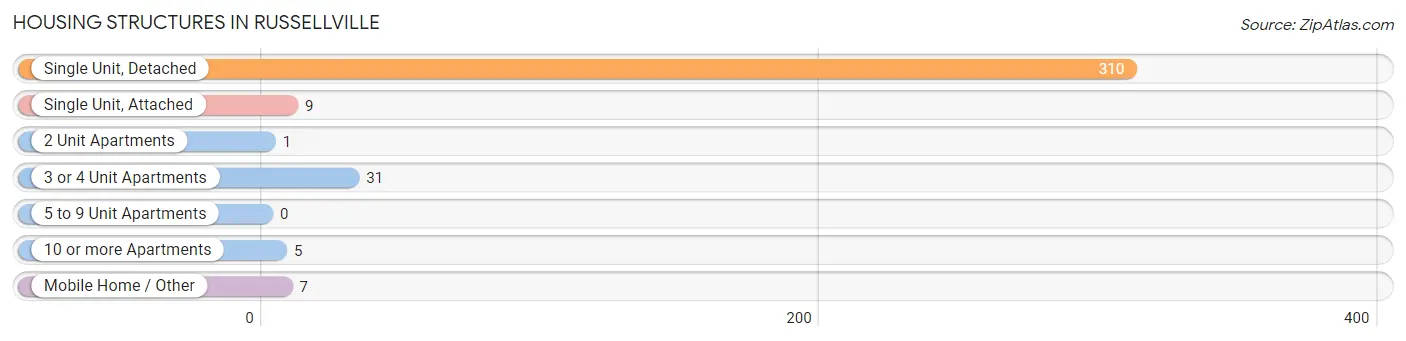
| Structure Type | # Housing Units | % Housing Units |
| Single Unit, Detached | 310 | 85.4% |
| Single Unit, Attached | 9 | 2.5% |
| 2 Unit Apartments | 1 | 0.3% |
| 3 or 4 Unit Apartments | 31 | 8.5% |
| 5 to 9 Unit Apartments | 0 | 0.0% |
| 10 or more Apartments | 5 | 1.4% |
| Mobile Home / Other | 7 | 1.9% |
| Total | 363 | 100.0% |
Housing Structures by Occupancy in Russellville
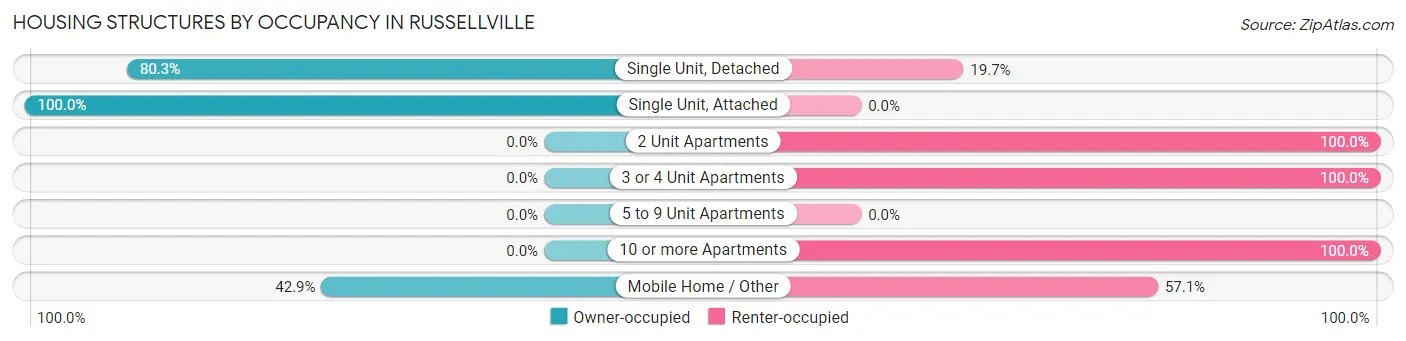
| Structure Type | Owner-occupied | Renter-occupied |
| Single Unit, Detached | 249 (80.3%) | 61 (19.7%) |
| Single Unit, Attached | 9 (100.0%) | 0 (0.0%) |
| 2 Unit Apartments | 0 (0.0%) | 1 (100.0%) |
| 3 or 4 Unit Apartments | 0 (0.0%) | 31 (100.0%) |
| 5 to 9 Unit Apartments | 0 (0.0%) | 0 (0.0%) |
| 10 or more Apartments | 0 (0.0%) | 5 (100.0%) |
| Mobile Home / Other | 3 (42.9%) | 4 (57.1%) |
| Total | 261 (71.9%) | 102 (28.1%) |
Housing Structures by Number of Rooms in Russellville
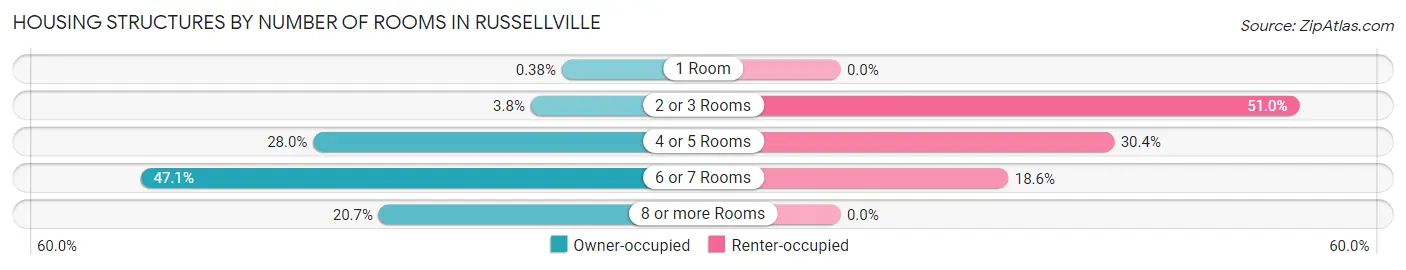
| Number of Rooms | Owner-occupied | Renter-occupied |
| 1 Room | 1 (0.4%) | 0 (0.0%) |
| 2 or 3 Rooms | 10 (3.8%) | 52 (51.0%) |
| 4 or 5 Rooms | 73 (28.0%) | 31 (30.4%) |
| 6 or 7 Rooms | 123 (47.1%) | 19 (18.6%) |
| 8 or more Rooms | 54 (20.7%) | 0 (0.0%) |
| Total | 261 (100.0%) | 102 (100.0%) |
Housing Structure by Heating Type in Russellville
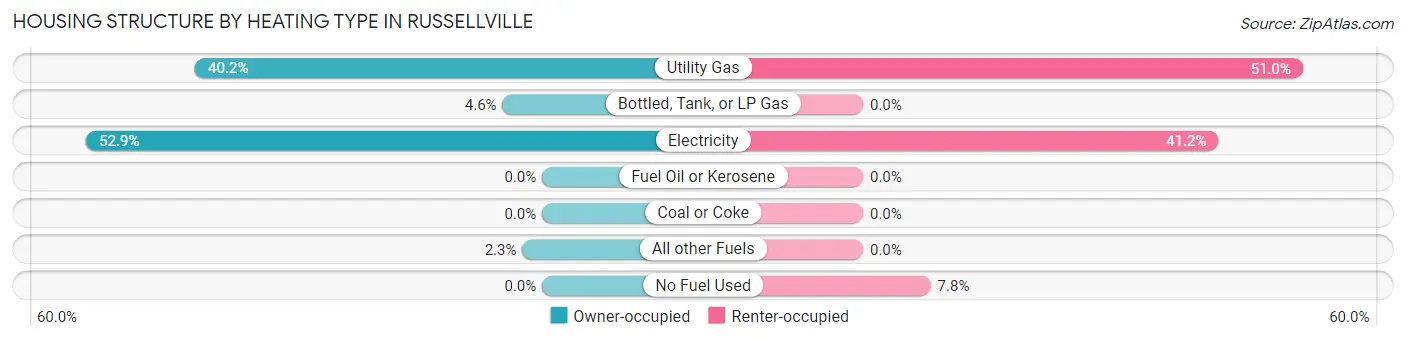
| Heating Type | Owner-occupied | Renter-occupied |
| Utility Gas | 105 (40.2%) | 52 (51.0%) |
| Bottled, Tank, or LP Gas | 12 (4.6%) | 0 (0.0%) |
| Electricity | 138 (52.9%) | 42 (41.2%) |
| Fuel Oil or Kerosene | 0 (0.0%) | 0 (0.0%) |
| Coal or Coke | 0 (0.0%) | 0 (0.0%) |
| All other Fuels | 6 (2.3%) | 0 (0.0%) |
| No Fuel Used | 0 (0.0%) | 8 (7.8%) |
| Total | 261 (100.0%) | 102 (100.0%) |
Household Vehicle Usage in Russellville
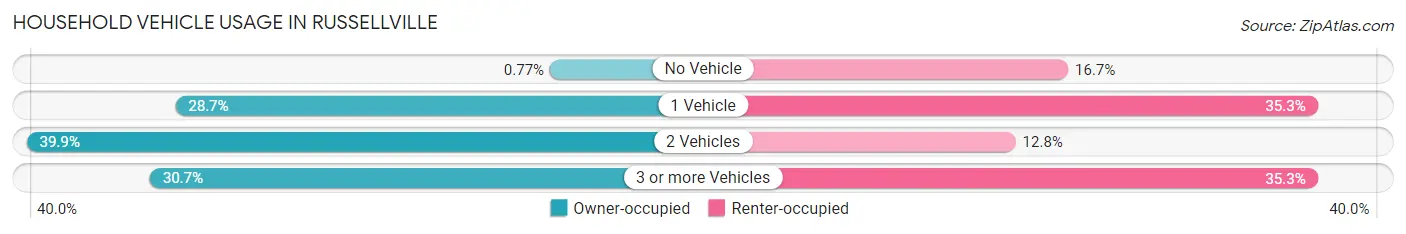
| Vehicles per Household | Owner-occupied | Renter-occupied |
| No Vehicle | 2 (0.8%) | 17 (16.7%) |
| 1 Vehicle | 75 (28.7%) | 36 (35.3%) |
| 2 Vehicles | 104 (39.9%) | 13 (12.8%) |
| 3 or more Vehicles | 80 (30.6%) | 36 (35.3%) |
| Total | 261 (100.0%) | 102 (100.0%) |
Real Estate & Mortgages in Russellville
Real Estate and Mortgage Overview in Russellville
| Characteristic | Without Mortgage | With Mortgage |
| Housing Units | 50 | 211 |
| Median Property Value | $118,800 | $145,500 |
| Median Household Income | $61,667 | $16 |
| Monthly Housing Costs | $521 | $8 |
| Real Estate Taxes | $1,404 | $0 |
Property Value by Mortgage Status in Russellville
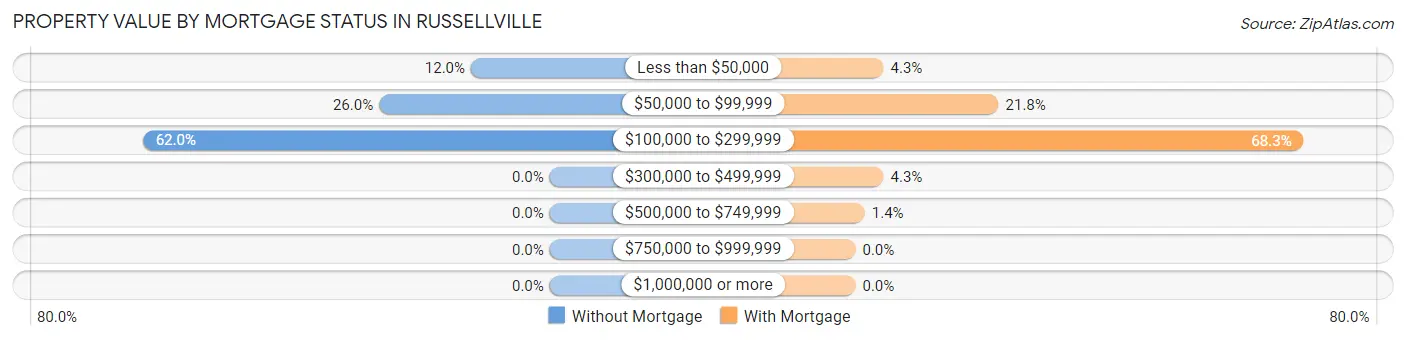
| Property Value | Without Mortgage | With Mortgage |
| Less than $50,000 | 6 (12.0%) | 9 (4.3%) |
| $50,000 to $99,999 | 13 (26.0%) | 46 (21.8%) |
| $100,000 to $299,999 | 31 (62.0%) | 144 (68.2%) |
| $300,000 to $499,999 | 0 (0.0%) | 9 (4.3%) |
| $500,000 to $749,999 | 0 (0.0%) | 3 (1.4%) |
| $750,000 to $999,999 | 0 (0.0%) | 0 (0.0%) |
| $1,000,000 or more | 0 (0.0%) | 0 (0.0%) |
| Total | 50 (100.0%) | 211 (100.0%) |
Household Income by Mortgage Status in Russellville
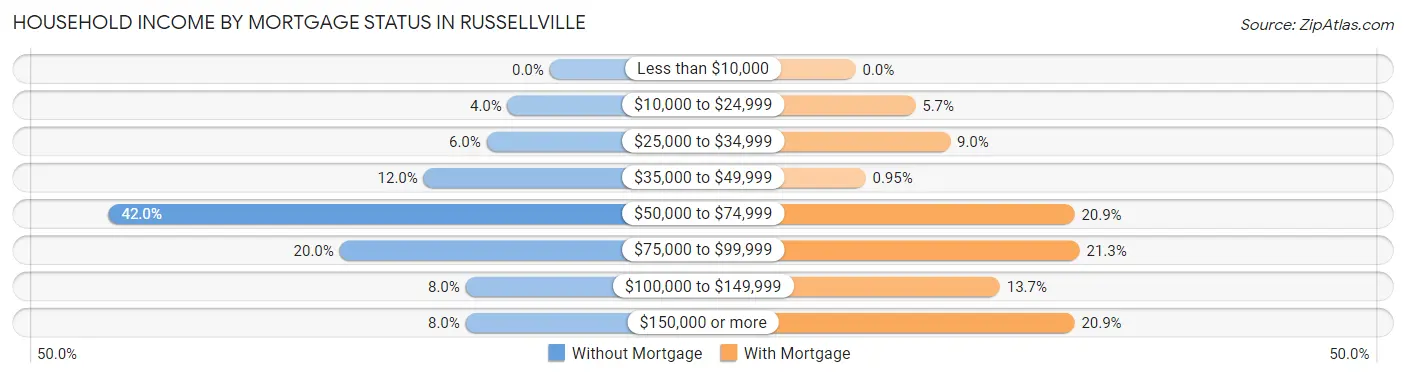
| Household Income | Without Mortgage | With Mortgage |
| Less than $10,000 | 0 (0.0%) | 0 (0.0%) |
| $10,000 to $24,999 | 2 (4.0%) | 12 (5.7%) |
| $25,000 to $34,999 | 3 (6.0%) | 19 (9.0%) |
| $35,000 to $49,999 | 6 (12.0%) | 2 (0.9%) |
| $50,000 to $74,999 | 21 (42.0%) | 44 (20.8%) |
| $75,000 to $99,999 | 10 (20.0%) | 45 (21.3%) |
| $100,000 to $149,999 | 4 (8.0%) | 29 (13.7%) |
| $150,000 or more | 4 (8.0%) | 44 (20.8%) |
| Total | 50 (100.0%) | 211 (100.0%) |
Property Value to Household Income Ratio in Russellville
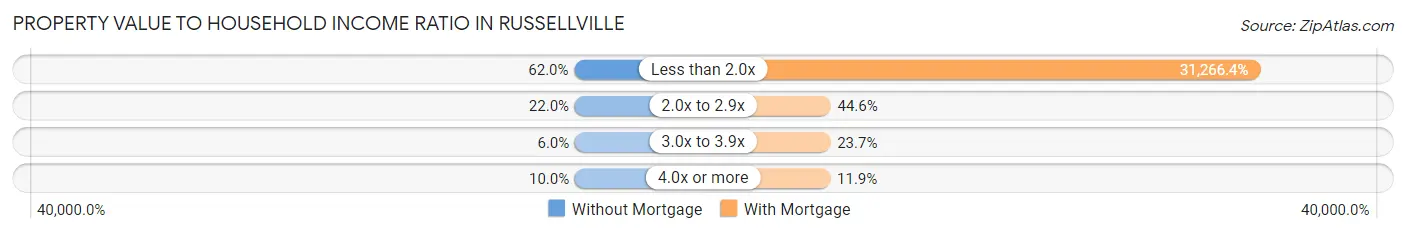
| Value-to-Income Ratio | Without Mortgage | With Mortgage |
| Less than 2.0x | 31 (62.0%) | 65,972 (31,266.3%) |
| 2.0x to 2.9x | 11 (22.0%) | 94 (44.6%) |
| 3.0x to 3.9x | 3 (6.0%) | 50 (23.7%) |
| 4.0x or more | 5 (10.0%) | 25 (11.8%) |
| Total | 50 (100.0%) | 211 (100.0%) |
Real Estate Taxes by Mortgage Status in Russellville
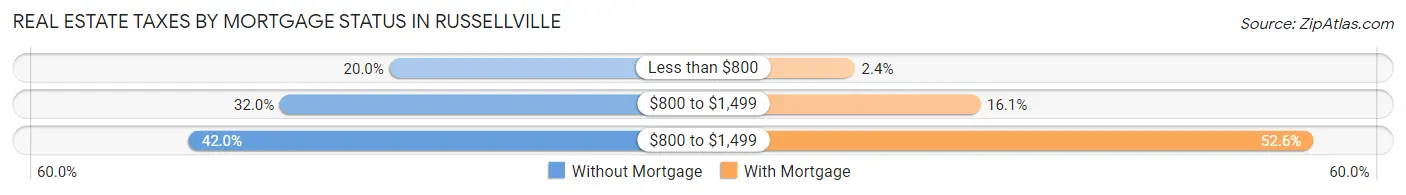
| Property Taxes | Without Mortgage | With Mortgage |
| Less than $800 | 10 (20.0%) | 5 (2.4%) |
| $800 to $1,499 | 16 (32.0%) | 34 (16.1%) |
| $800 to $1,499 | 21 (42.0%) | 111 (52.6%) |
| Total | 50 (100.0%) | 211 (100.0%) |
Health & Disability in Russellville
Health Insurance Coverage by Age in Russellville
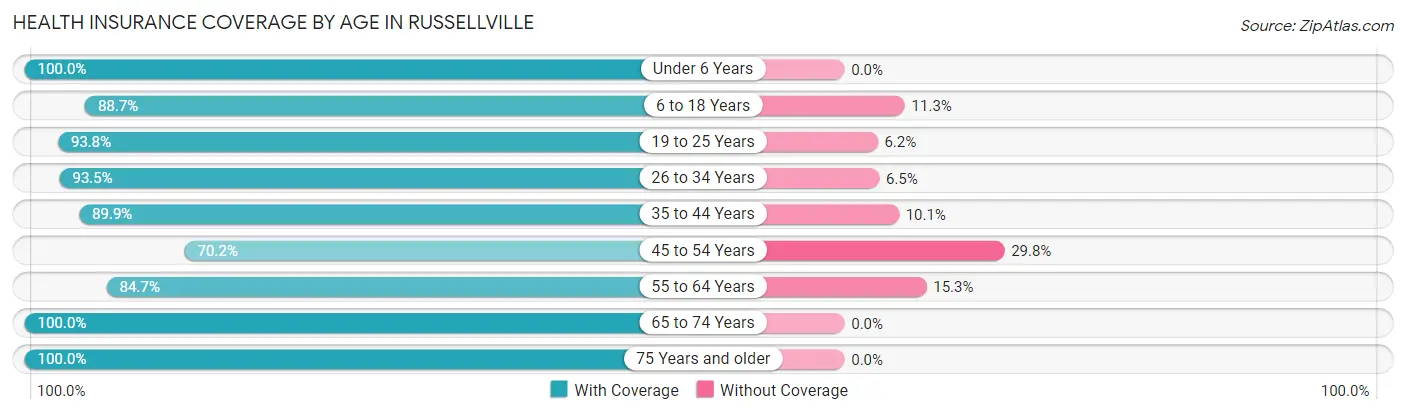
| Age Bracket | With Coverage | Without Coverage |
| Under 6 Years | 73 (100.0%) | 0 (0.0%) |
| 6 to 18 Years | 134 (88.7%) | 17 (11.3%) |
| 19 to 25 Years | 182 (93.8%) | 12 (6.2%) |
| 26 to 34 Years | 101 (93.5%) | 7 (6.5%) |
| 35 to 44 Years | 62 (89.9%) | 7 (10.1%) |
| 45 to 54 Years | 80 (70.2%) | 34 (29.8%) |
| 55 to 64 Years | 72 (84.7%) | 13 (15.3%) |
| 65 to 74 Years | 49 (100.0%) | 0 (0.0%) |
| 75 Years and older | 33 (100.0%) | 0 (0.0%) |
| Total | 786 (89.7%) | 90 (10.3%) |
Health Insurance Coverage by Citizenship Status in Russellville
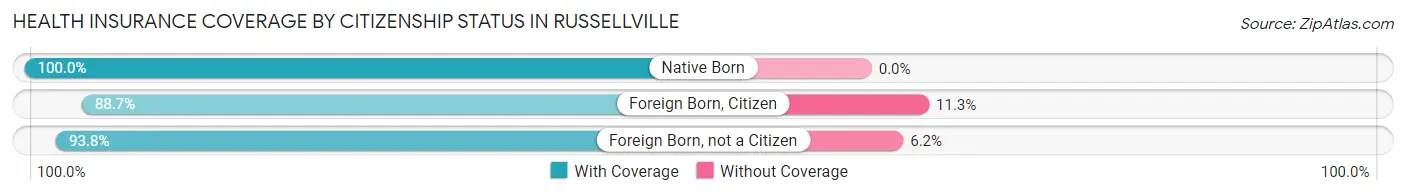
| Citizenship Status | With Coverage | Without Coverage |
| Native Born | 73 (100.0%) | 0 (0.0%) |
| Foreign Born, Citizen | 134 (88.7%) | 17 (11.3%) |
| Foreign Born, not a Citizen | 182 (93.8%) | 12 (6.2%) |
Health Insurance Coverage by Household Income in Russellville
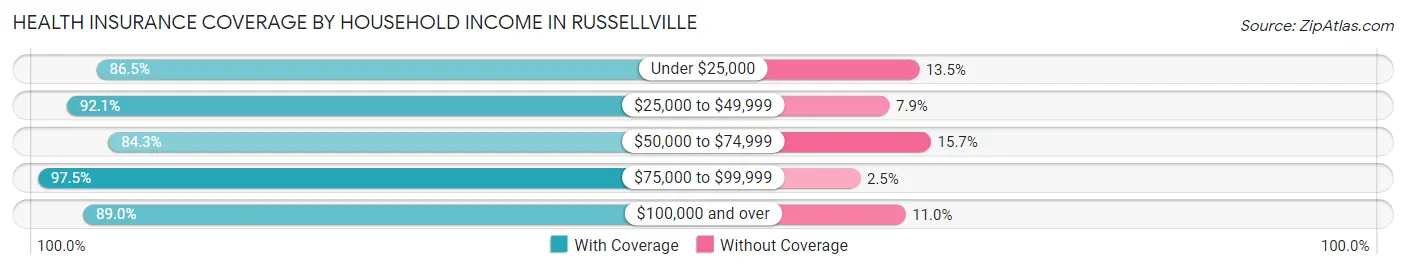
| Household Income | With Coverage | Without Coverage |
| Under $25,000 | 77 (86.5%) | 12 (13.5%) |
| $25,000 to $49,999 | 186 (92.1%) | 16 (7.9%) |
| $50,000 to $74,999 | 145 (84.3%) | 27 (15.7%) |
| $75,000 to $99,999 | 118 (97.5%) | 3 (2.5%) |
| $100,000 and over | 260 (89.0%) | 32 (11.0%) |
Public vs Private Health Insurance Coverage by Age in Russellville
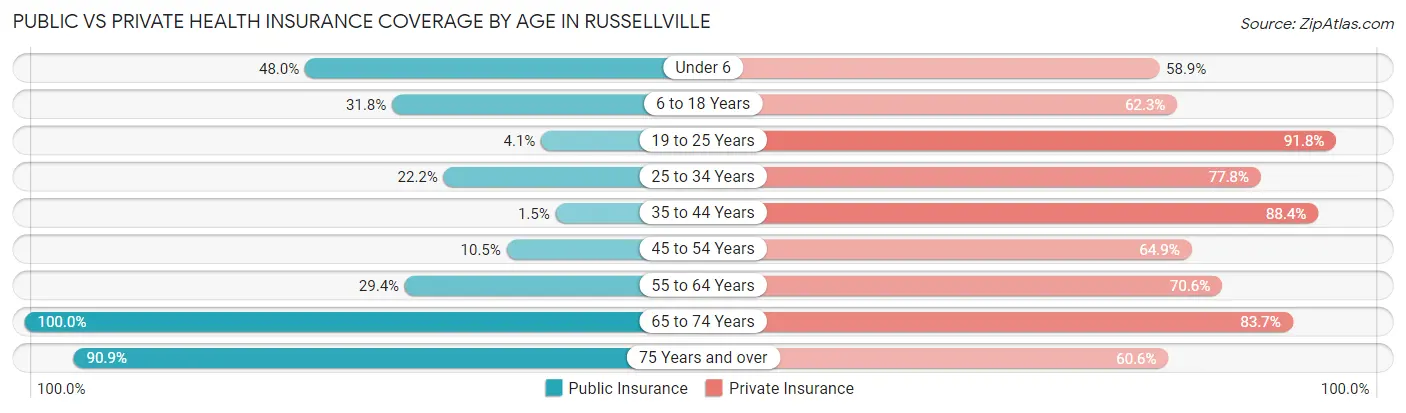
| Age Bracket | Public Insurance | Private Insurance |
| Under 6 | 35 (47.9%) | 43 (58.9%) |
| 6 to 18 Years | 48 (31.8%) | 94 (62.3%) |
| 19 to 25 Years | 8 (4.1%) | 178 (91.7%) |
| 25 to 34 Years | 24 (22.2%) | 84 (77.8%) |
| 35 to 44 Years | 1 (1.5%) | 61 (88.4%) |
| 45 to 54 Years | 12 (10.5%) | 74 (64.9%) |
| 55 to 64 Years | 25 (29.4%) | 60 (70.6%) |
| 65 to 74 Years | 49 (100.0%) | 41 (83.7%) |
| 75 Years and over | 30 (90.9%) | 20 (60.6%) |
| Total | 232 (26.5%) | 655 (74.8%) |
Disability Status by Sex by Age in Russellville
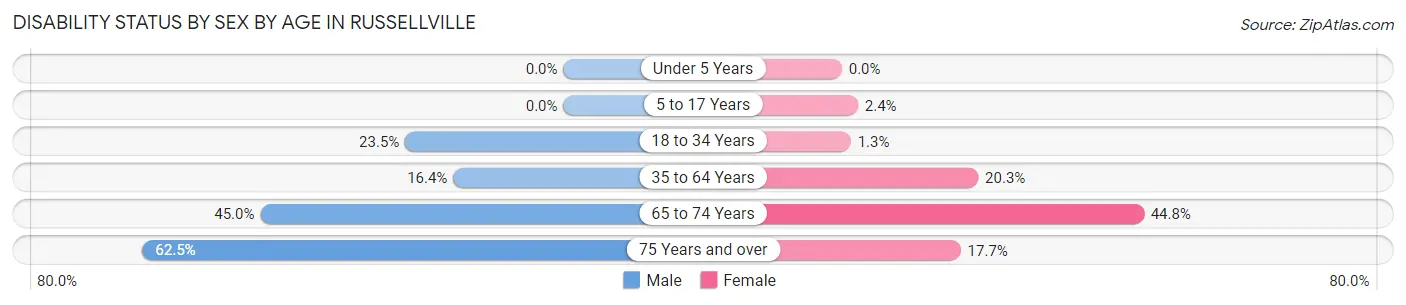
| Age Bracket | Male | Female |
| Under 5 Years | 0 (0.0%) | 0 (0.0%) |
| 5 to 17 Years | 0 (0.0%) | 2 (2.4%) |
| 18 to 34 Years | 39 (23.5%) | 2 (1.3%) |
| 35 to 64 Years | 18 (16.4%) | 32 (20.3%) |
| 65 to 74 Years | 9 (45.0%) | 13 (44.8%) |
| 75 Years and over | 10 (62.5%) | 3 (17.6%) |
Disability Class by Sex by Age in Russellville
Disability Class: Hearing Difficulty
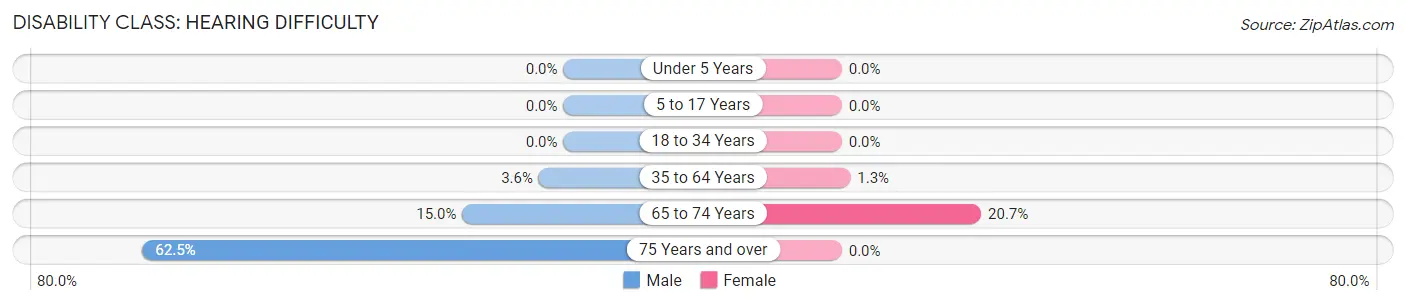
| Age Bracket | Male | Female |
| Under 5 Years | 0 (0.0%) | 0 (0.0%) |
| 5 to 17 Years | 0 (0.0%) | 0 (0.0%) |
| 18 to 34 Years | 0 (0.0%) | 0 (0.0%) |
| 35 to 64 Years | 4 (3.6%) | 2 (1.3%) |
| 65 to 74 Years | 3 (15.0%) | 6 (20.7%) |
| 75 Years and over | 10 (62.5%) | 0 (0.0%) |
Disability Class: Vision Difficulty
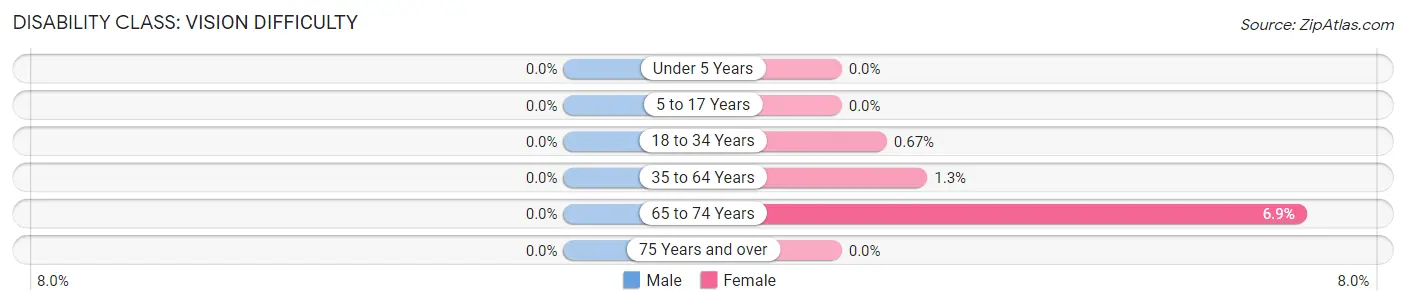
| Age Bracket | Male | Female |
| Under 5 Years | 0 (0.0%) | 0 (0.0%) |
| 5 to 17 Years | 0 (0.0%) | 0 (0.0%) |
| 18 to 34 Years | 0 (0.0%) | 1 (0.7%) |
| 35 to 64 Years | 0 (0.0%) | 2 (1.3%) |
| 65 to 74 Years | 0 (0.0%) | 2 (6.9%) |
| 75 Years and over | 0 (0.0%) | 0 (0.0%) |
Disability Class: Cognitive Difficulty
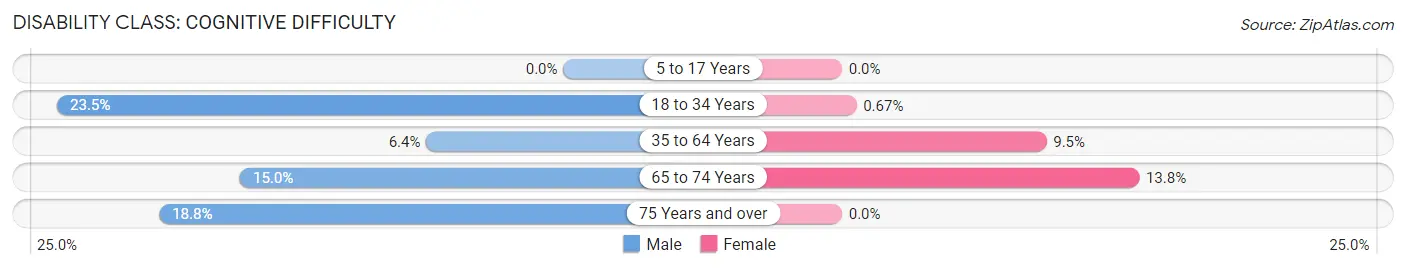
| Age Bracket | Male | Female |
| 5 to 17 Years | 0 (0.0%) | 0 (0.0%) |
| 18 to 34 Years | 39 (23.5%) | 1 (0.7%) |
| 35 to 64 Years | 7 (6.4%) | 15 (9.5%) |
| 65 to 74 Years | 3 (15.0%) | 4 (13.8%) |
| 75 Years and over | 3 (18.8%) | 0 (0.0%) |
Disability Class: Ambulatory Difficulty
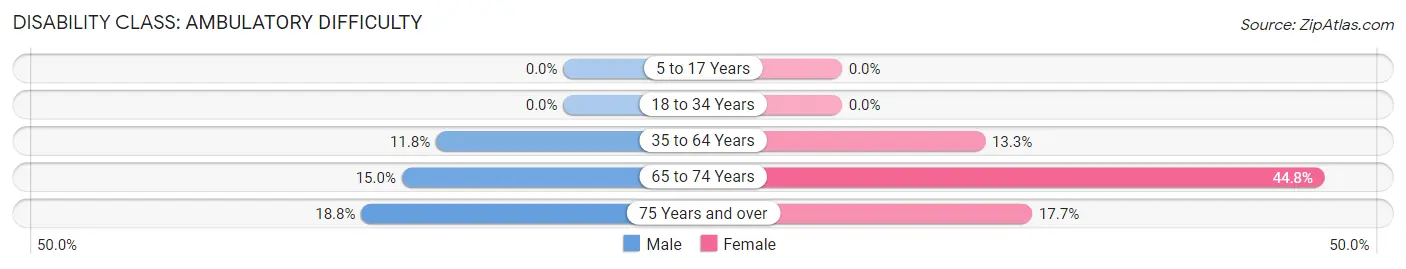
| Age Bracket | Male | Female |
| 5 to 17 Years | 0 (0.0%) | 0 (0.0%) |
| 18 to 34 Years | 0 (0.0%) | 0 (0.0%) |
| 35 to 64 Years | 13 (11.8%) | 21 (13.3%) |
| 65 to 74 Years | 3 (15.0%) | 13 (44.8%) |
| 75 Years and over | 3 (18.8%) | 3 (17.6%) |
Disability Class: Self-Care Difficulty
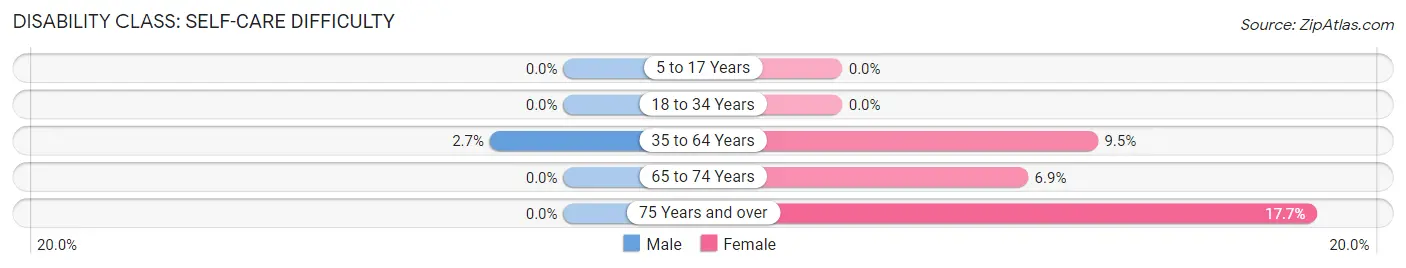
| Age Bracket | Male | Female |
| 5 to 17 Years | 0 (0.0%) | 0 (0.0%) |
| 18 to 34 Years | 0 (0.0%) | 0 (0.0%) |
| 35 to 64 Years | 3 (2.7%) | 15 (9.5%) |
| 65 to 74 Years | 0 (0.0%) | 2 (6.9%) |
| 75 Years and over | 0 (0.0%) | 3 (17.6%) |
Technology Access in Russellville
Computing Device Access in Russellville
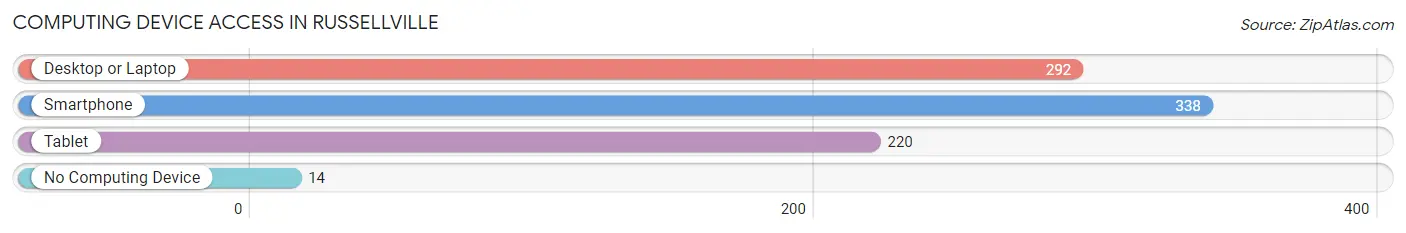
| Device Type | # Households | % Households |
| Desktop or Laptop | 292 | 80.4% |
| Smartphone | 338 | 93.1% |
| Tablet | 220 | 60.6% |
| No Computing Device | 14 | 3.9% |
| Total | 363 | 100.0% |
Internet Access in Russellville
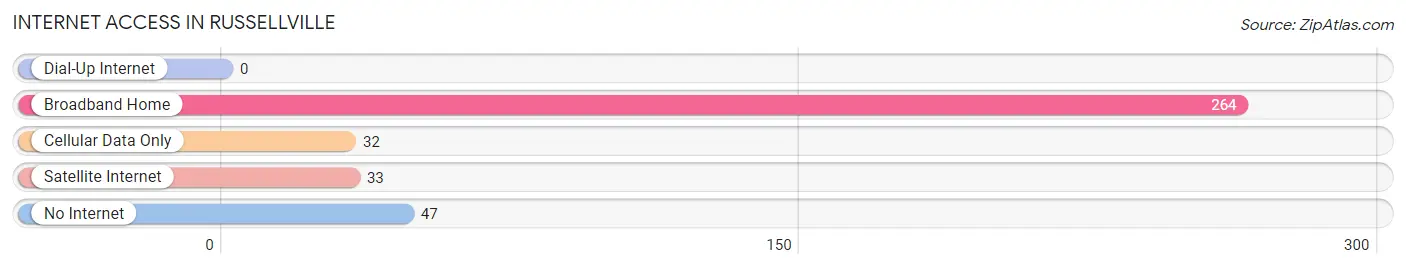
| Internet Type | # Households | % Households |
| Dial-Up Internet | 0 | 0.0% |
| Broadband Home | 264 | 72.7% |
| Cellular Data Only | 32 | 8.8% |
| Satellite Internet | 33 | 9.1% |
| No Internet | 47 | 13.0% |
| Total | 363 | 100.0% |
Russellville Summary
Introduction
Russellville, Missouri is a small town located in the Ozark Mountains of south-central Missouri. It is situated in the foothills of the Ozarks, and is surrounded by rolling hills and lush forests. The town is home to a population of just over 1,000 people, and is known for its rural charm and friendly atmosphere. The town is located in the heart of the Ozarks, and is a popular destination for outdoor recreation, such as fishing, hunting, and camping.
History
The town of Russellville was founded in 1845 by a group of settlers from Kentucky. The town was named after the Russell family, who were among the first settlers in the area. The town was originally a small farming community, and the main crops grown were corn, wheat, and oats. The town grew slowly over the years, and by the early 1900s, it had become a popular tourist destination.
In the early 1900s, the town was home to a number of businesses, including a general store, a blacksmith shop, and a hotel. The town also had a post office, a bank, and a school. The town was also home to a number of churches, including the First Baptist Church, which was founded in 1845.
Geography
Russellville is located in the Ozark Mountains of south-central Missouri. The town is situated in the foothills of the Ozarks, and is surrounded by rolling hills and lush forests. The town is located in the heart of the Ozarks, and is a popular destination for outdoor recreation, such as fishing, hunting, and camping.
The town is located in the Ozark Plateau, which is a region of rugged hills and valleys. The town is located in the Mark Twain National Forest, which is a popular destination for outdoor recreation. The town is also located near the Big Piney River, which is a popular destination for fishing and canoeing.
Economy
The economy of Russellville is largely based on tourism and agriculture. The town is home to a number of tourist attractions, including the Ozark National Scenic Riverways, which is a popular destination for canoeing and fishing. The town is also home to a number of farms, which produce a variety of crops, including corn, wheat, and oats.
The town is also home to a number of small businesses, including restaurants, shops, and other services. The town is also home to a number of manufacturing companies, which produce a variety of products, including furniture, clothing, and other items.
Demographics
As of the 2010 census, the population of Russellville was 1,072. The town is predominantly white, with 92.3% of the population being white. The town is also home to a small Hispanic population, with 4.2% of the population being Hispanic. The town is also home to a small African American population, with 1.7% of the population being African American.
Conclusion
Russellville, Missouri is a small town located in the Ozark Mountains of south-central Missouri. The town is known for its rural charm and friendly atmosphere, and is a popular destination for outdoor recreation. The town is home to a population of just over 1,000 people, and is predominantly white. The town is also home to a number of small businesses, and is a popular destination for tourists.
Common Questions
What is Per Capita Income in Russellville?
Per Capita income in Russellville is $26,843.
What is the Median Family Income in Russellville?
Median Family Income in Russellville is $61,458.
What is the Median Household income in Russellville?
Median Household Income in Russellville is $52,946.
What is Income or Wage Gap in Russellville?
Income or Wage Gap in Russellville is 8.8%.
Women in Russellville earn 91.2 cents for every dollar earned by a man.
What is Inequality or Gini Index in Russellville?
Inequality or Gini Index in Russellville is 0.40.
What is the Total Population of Russellville?
Total Population of Russellville is 876.
What is the Total Male Population of Russellville?
Total Male Population of Russellville is 399.
What is the Total Female Population of Russellville?
Total Female Population of Russellville is 477.
What is the Ratio of Males per 100 Females in Russellville?
There are 83.65 Males per 100 Females in Russellville.
What is the Ratio of Females per 100 Males in Russellville?
There are 119.55 Females per 100 Males in Russellville.
What is the Median Population Age in Russellville?
Median Population Age in Russellville is 27.4 Years.
What is the Average Family Size in Russellville
Average Family Size in Russellville is 3.1 People.
What is the Average Household Size in Russellville
Average Household Size in Russellville is 2.4 People.
How Large is the Labor Force in Russellville?
There are 505 People in the Labor Forcein in Russellville.
What is the Percentage of People in the Labor Force in Russellville?
73.5% of People are in the Labor Force in Russellville.
What is the Unemployment Rate in Russellville?
Unemployment Rate in Russellville is 2.0%.