Bunker, MO Map & Demographics
Bunker Map
Bunker Overview
$18,461
PER CAPITA INCOME
$33,750
AVG FAMILY INCOME
33.2%
WAGE / INCOME GAP [ % ]
66.8¢/ $1
WAGE / INCOME GAP [ $ ]
0.48
INEQUALITY / GINI INDEX
344
TOTAL POPULATION
189
MALE POPULATION
155
FEMALE POPULATION
121.94
MALES / 100 FEMALES
82.01
FEMALES / 100 MALES
44.2
MEDIAN AGE
4.8
AVG FAMILY SIZE
2.8
AVG HOUSEHOLD SIZE
136
LABOR FORCE [ PEOPLE ]
46.1%
PERCENT IN LABOR FORCE
11.0%
UNEMPLOYMENT RATE
Bunker Zip Codes
Bunker Area Codes
Income in Bunker
Income Overview in Bunker
| Characteristic | Number | Measure |
| Per Capita Income | 344 | $18,461 |
| Median Family Income | 48 | $33,750 |
| Mean Family Income | 48 | $45,438 |
| Median Household Income | 116 | $0 |
| Mean Household Income | 116 | $36,309 |
| Income Deficit | 48 | $0 |
| Wage / Income Gap (%) | 344 | 33.23% |
| Wage / Income Gap ($) | 344 | 66.77¢ per $1 |
| Gini / Inequality Index | 344 | 0.48 |
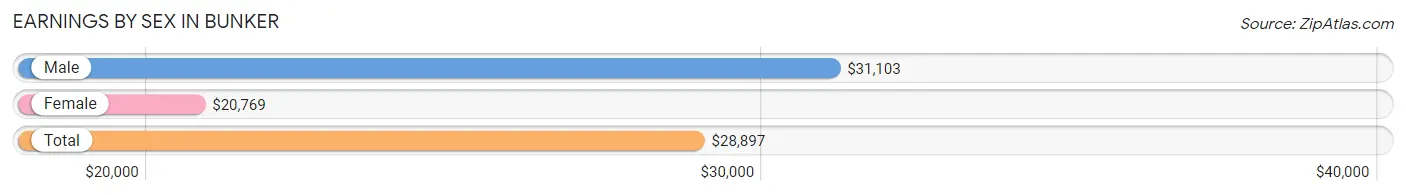
Earnings by Sex in Bunker
Average Earnings in Bunker are $28,897, $31,103 for men and $20,769 for women, a difference of 33.2%.
| Sex | Number | Average Earnings |
| Male | 73 (55.7%) | $31,103 |
| Female | 58 (44.3%) | $20,769 |
| Total | 131 (100.0%) | $28,897 |
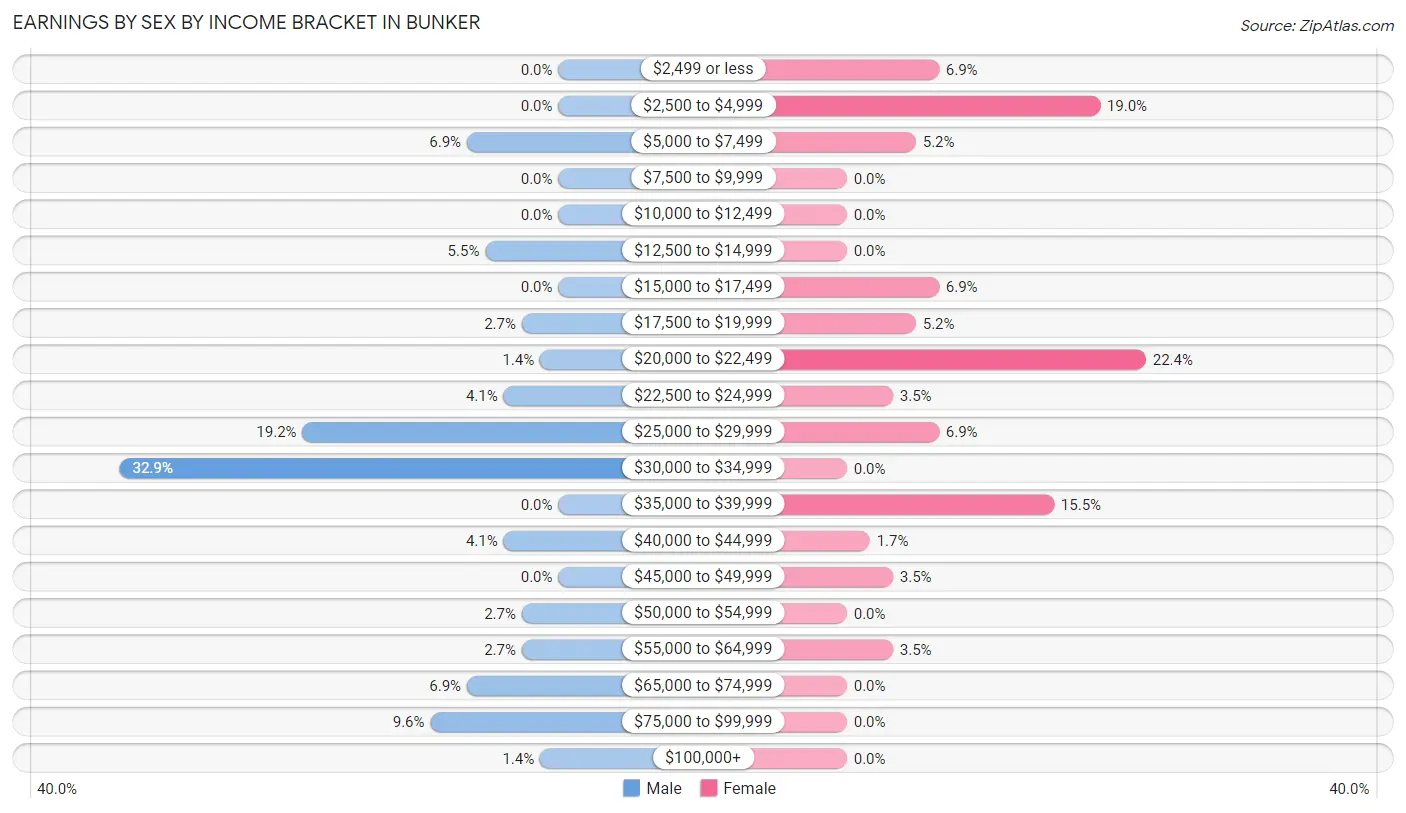
Earnings by Sex by Income Bracket in Bunker
The most common earnings brackets in Bunker are $30,000 to $34,999 for men (24 | 32.9%) and $20,000 to $22,499 for women (13 | 22.4%).
| Income | Male | Female |
| $2,499 or less | 0 (0.0%) | 4 (6.9%) |
| $2,500 to $4,999 | 0 (0.0%) | 11 (19.0%) |
| $5,000 to $7,499 | 5 (6.9%) | 3 (5.2%) |
| $7,500 to $9,999 | 0 (0.0%) | 0 (0.0%) |
| $10,000 to $12,499 | 0 (0.0%) | 0 (0.0%) |
| $12,500 to $14,999 | 4 (5.5%) | 0 (0.0%) |
| $15,000 to $17,499 | 0 (0.0%) | 4 (6.9%) |
| $17,500 to $19,999 | 2 (2.7%) | 3 (5.2%) |
| $20,000 to $22,499 | 1 (1.4%) | 13 (22.4%) |
| $22,500 to $24,999 | 3 (4.1%) | 2 (3.5%) |
| $25,000 to $29,999 | 14 (19.2%) | 4 (6.9%) |
| $30,000 to $34,999 | 24 (32.9%) | 0 (0.0%) |
| $35,000 to $39,999 | 0 (0.0%) | 9 (15.5%) |
| $40,000 to $44,999 | 3 (4.1%) | 1 (1.7%) |
| $45,000 to $49,999 | 0 (0.0%) | 2 (3.5%) |
| $50,000 to $54,999 | 2 (2.7%) | 0 (0.0%) |
| $55,000 to $64,999 | 2 (2.7%) | 2 (3.5%) |
| $65,000 to $74,999 | 5 (6.9%) | 0 (0.0%) |
| $75,000 to $99,999 | 7 (9.6%) | 0 (0.0%) |
| $100,000+ | 1 (1.4%) | 0 (0.0%) |
| Total | 73 (100.0%) | 58 (100.0%) |
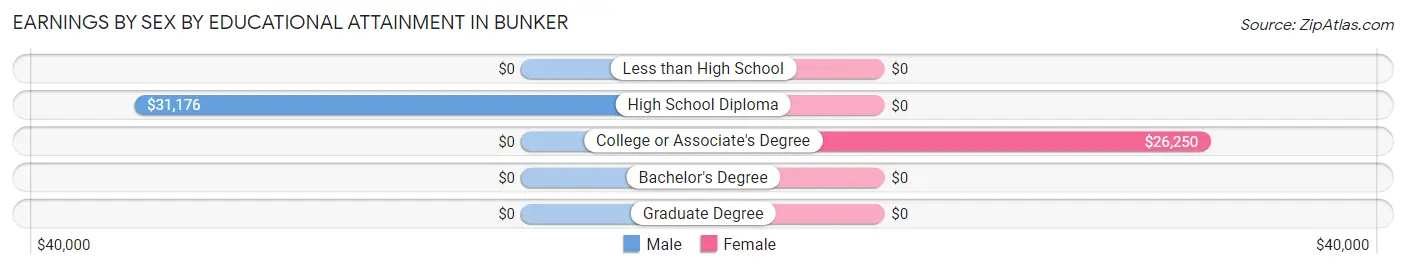
Earnings by Sex by Educational Attainment in Bunker
Average earnings in Bunker are $31,103 for men and $21,154 for women, a difference of 32.0%. Men with an educational attainment of high school diploma enjoy the highest average annual earnings of $31,176, while those with high school diploma education earn the least with $31,176. Women with an educational attainment of college or associate's degree earn the most with the average annual earnings of $26,250, while those with college or associate's degree education have the smallest earnings of $26,250.
| Educational Attainment | Male Income | Female Income |
| Less than High School | - | - |
| High School Diploma | $31,176 | $0 |
| College or Associate's Degree | - | - |
| Bachelor's Degree | - | - |
| Graduate Degree | - | - |
| Total | $31,103 | $21,154 |
Family Income in Bunker
Family Income Brackets in Bunker
According to the Bunker family income data, there are 13 families falling into the $25,000 to $34,999 income range, which is the most common income bracket and makes up 27.1% of all families.
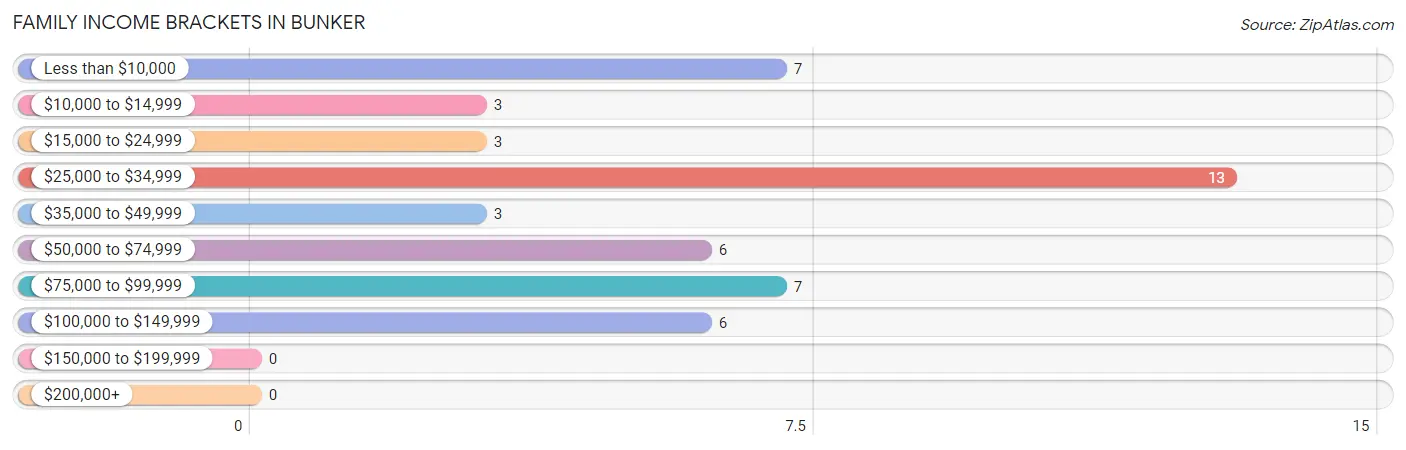
| Income Bracket | # Families | % Families |
| Less than $10,000 | 7 | 14.6% |
| $10,000 to $14,999 | 3 | 6.3% |
| $15,000 to $24,999 | 3 | 6.3% |
| $25,000 to $34,999 | 13 | 27.1% |
| $35,000 to $49,999 | 3 | 6.3% |
| $50,000 to $74,999 | 6 | 12.5% |
| $75,000 to $99,999 | 7 | 14.6% |
| $100,000 to $149,999 | 6 | 12.5% |
| $150,000 to $199,999 | 0 | 0.0% |
| $200,000+ | 0 | 0.0% |
Family Income by Famaliy Size in Bunker
2-person families (30 | 62.5%) account for the highest median family income in Bunker with $45,000 per family, while 2-person families (30 | 62.5%) have the highest median income of $22,500 per family member.
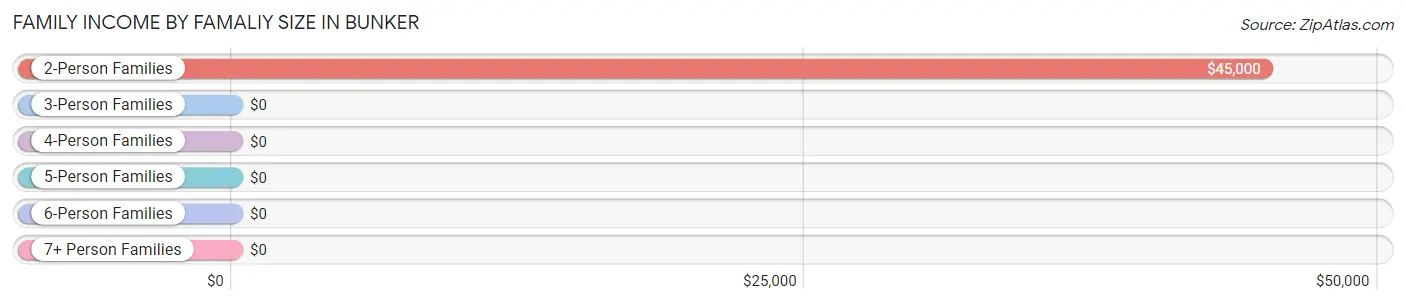
| Income Bracket | # Families | Median Income |
| 2-Person Families | 30 (62.5%) | $45,000 |
| 3-Person Families | 11 (22.9%) | $0 |
| 4-Person Families | 4 (8.3%) | $0 |
| 5-Person Families | 3 (6.2%) | $0 |
| 6-Person Families | 0 (0.0%) | $0 |
| 7+ Person Families | 0 (0.0%) | $0 |
| Total | 48 (100.0%) | $33,750 |
Family Income by Number of Earners in Bunker
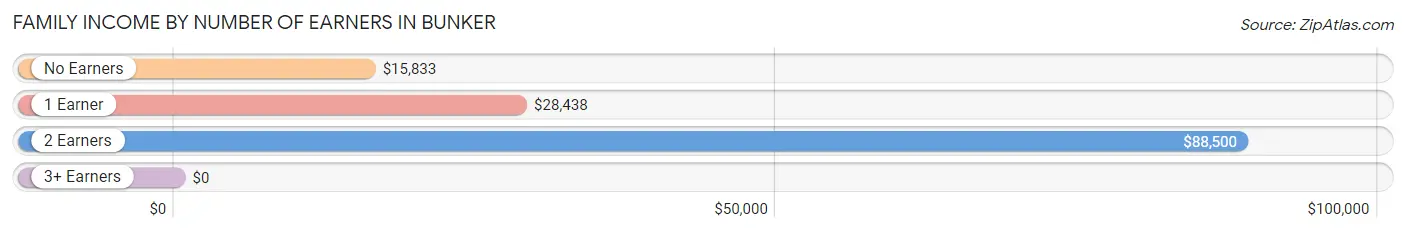
| Number of Earners | # Families | Median Income |
| No Earners | 14 (29.2%) | $15,833 |
| 1 Earner | 16 (33.3%) | $28,438 |
| 2 Earners | 18 (37.5%) | $88,500 |
| 3+ Earners | 0 (0.0%) | $0 |
| Total | 48 (100.0%) | $33,750 |
Household Income in Bunker
Household Income Brackets in Bunker
With 54 households falling in the category, the $10,000 to $14,999 income range is the most frequent in Bunker, accounting for 46.6% of all households.
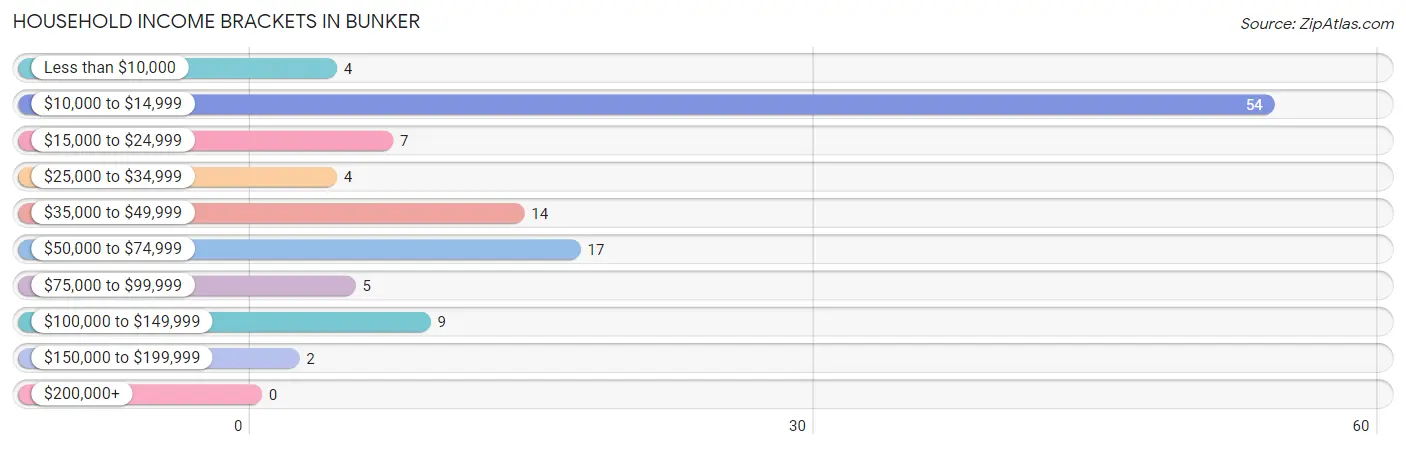
| Income Bracket | # Households | % Households |
| Less than $10,000 | 4 | 3.4% |
| $10,000 to $14,999 | 54 | 46.6% |
| $15,000 to $24,999 | 7 | 6.0% |
| $25,000 to $34,999 | 4 | 3.4% |
| $35,000 to $49,999 | 14 | 12.1% |
| $50,000 to $74,999 | 17 | 14.7% |
| $75,000 to $99,999 | 5 | 4.3% |
| $100,000 to $149,999 | 9 | 7.8% |
| $150,000 to $199,999 | 2 | 1.7% |
| $200,000+ | 0 | 0.0% |
Household Income by Householder Age in Bunker
The median household income in Bunker is $0, with the highest median household income of $14,125 found in the 45 to 64 years age bracket for the primary householder. A total of 51 households (44.0%) fall into this category. Meanwhile, the 15 to 24 years age bracket for the primary householder has the lowest median household income of $0, with 4 households (3.5%) in this group.
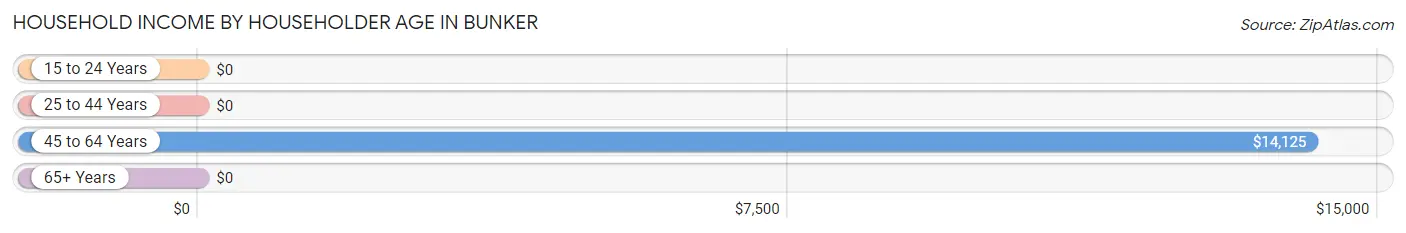
| Income Bracket | # Households | Median Income |
| 15 to 24 Years | 4 (3.5%) | $0 |
| 25 to 44 Years | 21 (18.1%) | $0 |
| 45 to 64 Years | 51 (44.0%) | $14,125 |
| 65+ Years | 40 (34.5%) | $0 |
| Total | 116 (100.0%) | $0 |
Poverty in Bunker
Income Below Poverty by Sex and Age in Bunker
With 18.9% poverty level for males and 60.7% for females among the residents of Bunker, 75 year old and over males and under 5 year old females are the most vulnerable to poverty, with 6 males (75.0%) and 5 females (100.0%) in their respective age groups living below the poverty level.
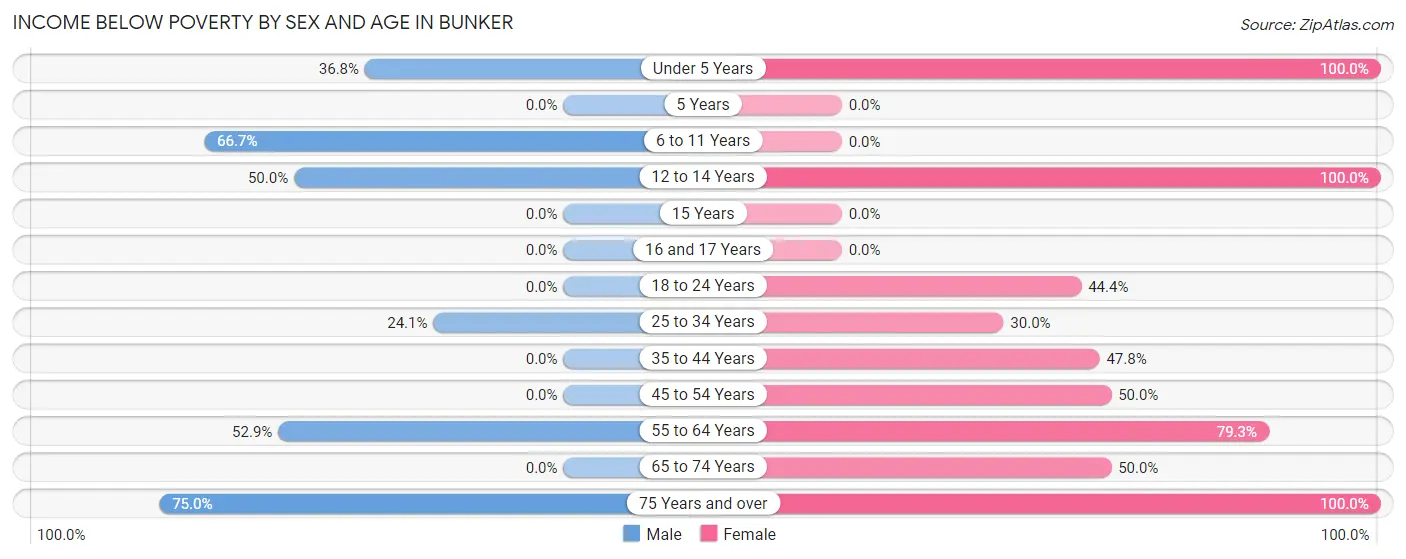
| Age Bracket | Male | Female |
| Under 5 Years | 7 (36.8%) | 5 (100.0%) |
| 5 Years | 0 (0.0%) | 0 (0.0%) |
| 6 to 11 Years | 4 (66.7%) | 0 (0.0%) |
| 12 to 14 Years | 2 (50.0%) | 3 (100.0%) |
| 15 Years | 0 (0.0%) | 0 (0.0%) |
| 16 and 17 Years | 0 (0.0%) | 0 (0.0%) |
| 18 to 24 Years | 0 (0.0%) | 4 (44.4%) |
| 25 to 34 Years | 7 (24.1%) | 6 (30.0%) |
| 35 to 44 Years | 0 (0.0%) | 11 (47.8%) |
| 45 to 54 Years | 0 (0.0%) | 3 (50.0%) |
| 55 to 64 Years | 9 (52.9%) | 42 (79.2%) |
| 65 to 74 Years | 0 (0.0%) | 8 (50.0%) |
| 75 Years and over | 6 (75.0%) | 12 (100.0%) |
| Total | 35 (18.9%) | 94 (60.7%) |
Income Above Poverty by Sex and Age in Bunker
According to the poverty statistics in Bunker, males aged 18 to 24 years and females aged 5 years are the age groups that are most secure financially, with 100.0% of males and 100.0% of females in these age groups living above the poverty line.
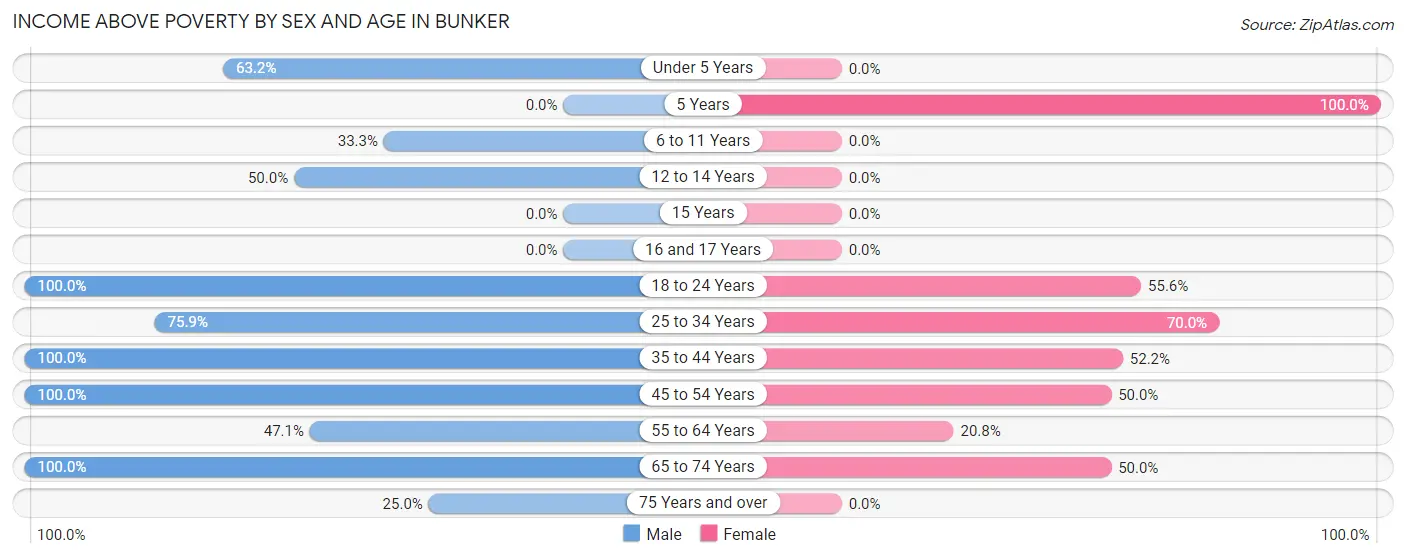
| Age Bracket | Male | Female |
| Under 5 Years | 12 (63.2%) | 0 (0.0%) |
| 5 Years | 0 (0.0%) | 8 (100.0%) |
| 6 to 11 Years | 2 (33.3%) | 0 (0.0%) |
| 12 to 14 Years | 2 (50.0%) | 0 (0.0%) |
| 15 Years | 0 (0.0%) | 0 (0.0%) |
| 16 and 17 Years | 0 (0.0%) | 0 (0.0%) |
| 18 to 24 Years | 41 (100.0%) | 5 (55.6%) |
| 25 to 34 Years | 22 (75.9%) | 14 (70.0%) |
| 35 to 44 Years | 18 (100.0%) | 12 (52.2%) |
| 45 to 54 Years | 27 (100.0%) | 3 (50.0%) |
| 55 to 64 Years | 8 (47.1%) | 11 (20.7%) |
| 65 to 74 Years | 16 (100.0%) | 8 (50.0%) |
| 75 Years and over | 2 (25.0%) | 0 (0.0%) |
| Total | 150 (81.1%) | 61 (39.4%) |
Income Below Poverty Among Married-Couple Families in Bunker
The poverty statistics for married-couple families in Bunker show that 18.5% or 5 of the total 27 families live below the poverty line. Families with no children have the highest poverty rate of 21.7%, comprising of 5 families. On the other hand, families with 1 or 2 children have the lowest poverty rate of 0.0%, which includes 0 families.
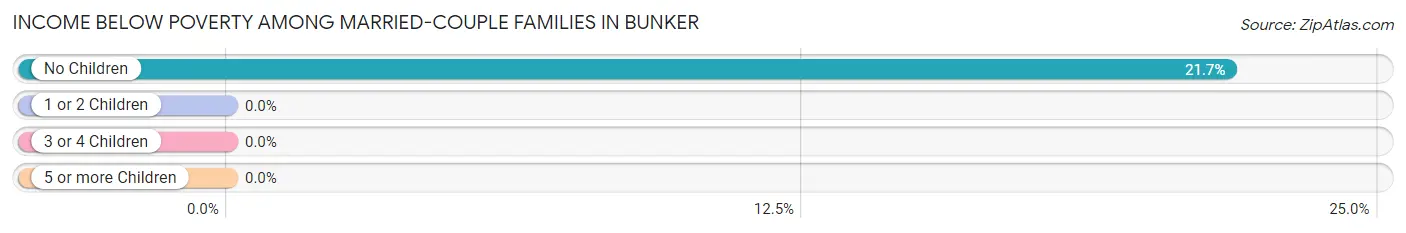
| Children | Above Poverty | Below Poverty |
| No Children | 18 (78.3%) | 5 (21.7%) |
| 1 or 2 Children | 4 (100.0%) | 0 (0.0%) |
| 3 or 4 Children | 0 (0.0%) | 0 (0.0%) |
| 5 or more Children | 0 (0.0%) | 0 (0.0%) |
| Total | 22 (81.5%) | 5 (18.5%) |
Income Below Poverty Among Single-Parent Households in Bunker
According to the poverty data in Bunker, 20.0% or 1 single-father households and 62.5% or 10 single-mother households are living below the poverty line. Among single-father households, those with no children have the highest poverty rate, with 1 households (20.0%) experiencing poverty. Likewise, among single-mother households, those with 3 or 4 children have the highest poverty rate, with 3 households (100.0%) falling below the poverty line.
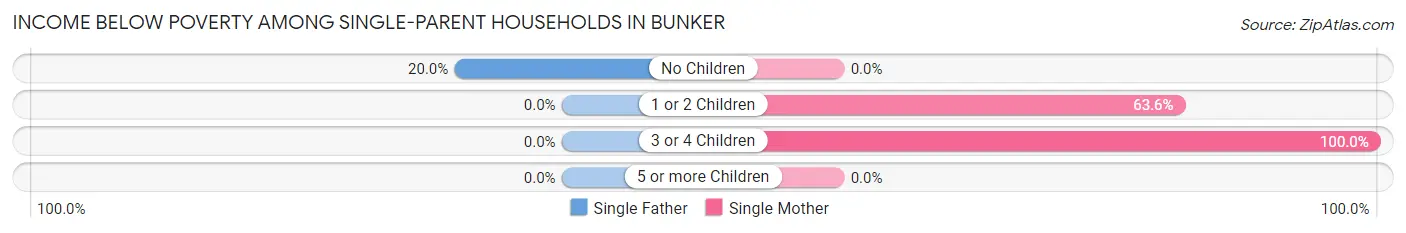
| Children | Single Father | Single Mother |
| No Children | 1 (20.0%) | 0 (0.0%) |
| 1 or 2 Children | 0 (0.0%) | 7 (63.6%) |
| 3 or 4 Children | 0 (0.0%) | 3 (100.0%) |
| 5 or more Children | 0 (0.0%) | 0 (0.0%) |
| Total | 1 (20.0%) | 10 (62.5%) |
Income Below Poverty Among Married-Couple vs Single-Parent Households in Bunker
The poverty data for Bunker shows that 5 of the married-couple family households (18.5%) and 11 of the single-parent households (52.4%) are living below the poverty level. Within the married-couple family households, those with no children have the highest poverty rate, with 5 households (21.7%) falling below the poverty line. Among the single-parent households, those with 3 or 4 children have the highest poverty rate, with 3 household (100.0%) living below poverty.
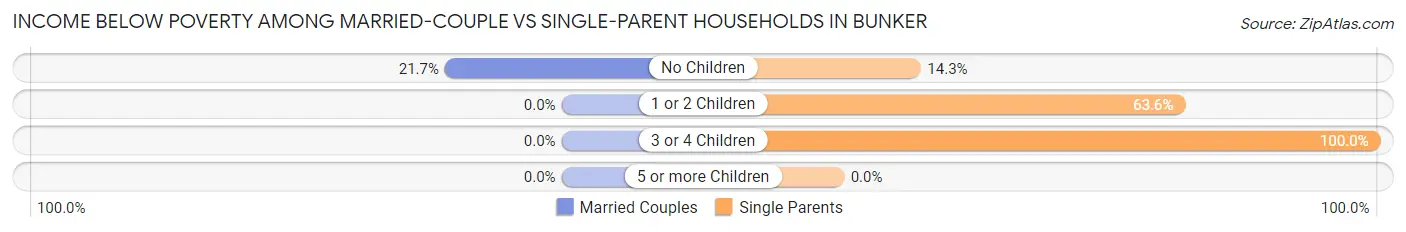
| Children | Married-Couple Families | Single-Parent Households |
| No Children | 5 (21.7%) | 1 (14.3%) |
| 1 or 2 Children | 0 (0.0%) | 7 (63.6%) |
| 3 or 4 Children | 0 (0.0%) | 3 (100.0%) |
| 5 or more Children | 0 (0.0%) | 0 (0.0%) |
| Total | 5 (18.5%) | 11 (52.4%) |
Race in Bunker
The most populous races in Bunker are White / Caucasian (322 | 93.6%), Two or more Races (15 | 4.4%), and Black / African American (7 | 2.0%).
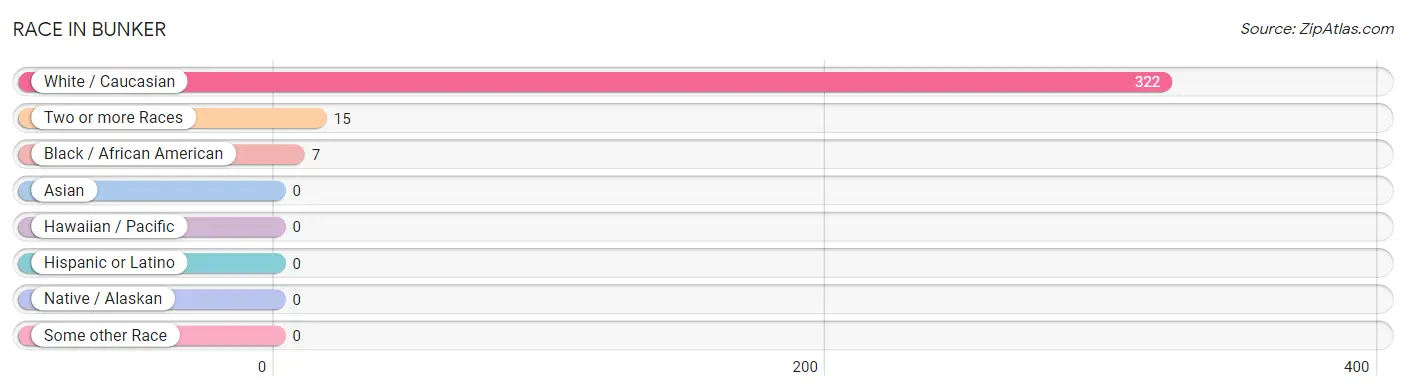
| Race | # Population | % Population |
| Asian | 0 | 0.0% |
| Black / African American | 7 | 2.0% |
| Hawaiian / Pacific | 0 | 0.0% |
| Hispanic or Latino | 0 | 0.0% |
| Native / Alaskan | 0 | 0.0% |
| White / Caucasian | 322 | 93.6% |
| Two or more Races | 15 | 4.4% |
| Some other Race | 0 | 0.0% |
| Total | 344 | 100.0% |
Ancestry in Bunker
The most populous ancestries reported in Bunker are Irish (127 | 36.9%), German (55 | 16.0%), Cherokee (5 | 1.5%), American (3 | 0.9%), and English (3 | 0.9%), together accounting for 56.1% of all Bunker residents.
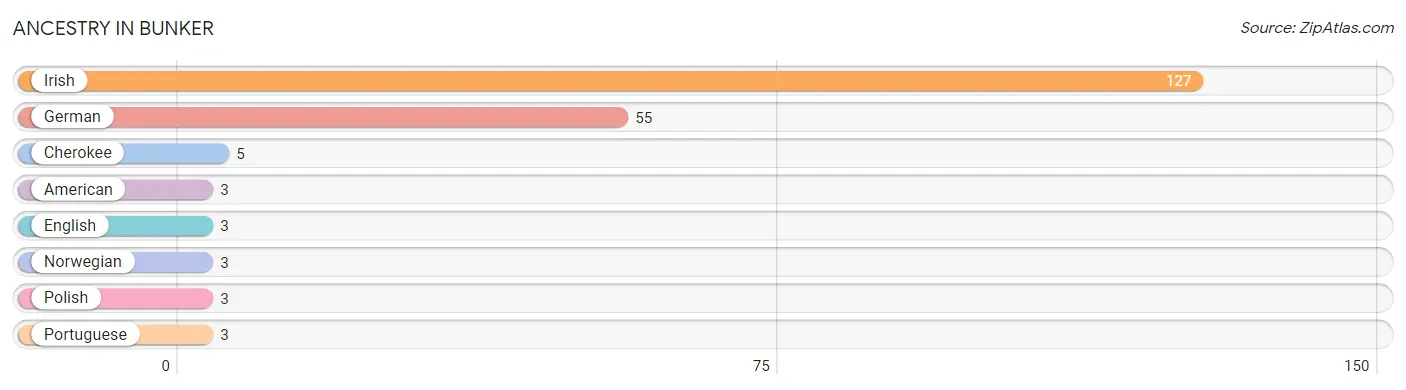
| Ancestry | # Population | % Population |
| American | 3 | 0.9% |
| Cherokee | 5 | 1.5% |
| English | 3 | 0.9% |
| German | 55 | 16.0% |
| Irish | 127 | 36.9% |
| Norwegian | 3 | 0.9% |
| Polish | 3 | 0.9% |
| Portuguese | 3 | 0.9% | View All 8 Rows |
Immigrants in Bunker

| Immigration Origin | # Population | % Population | View All 0 Rows |
Sex and Age in Bunker
Sex and Age in Bunker
The most populous age groups in Bunker are 20 to 24 Years (41 | 21.7%) for men and 55 to 59 Years (30 | 19.4%) for women.
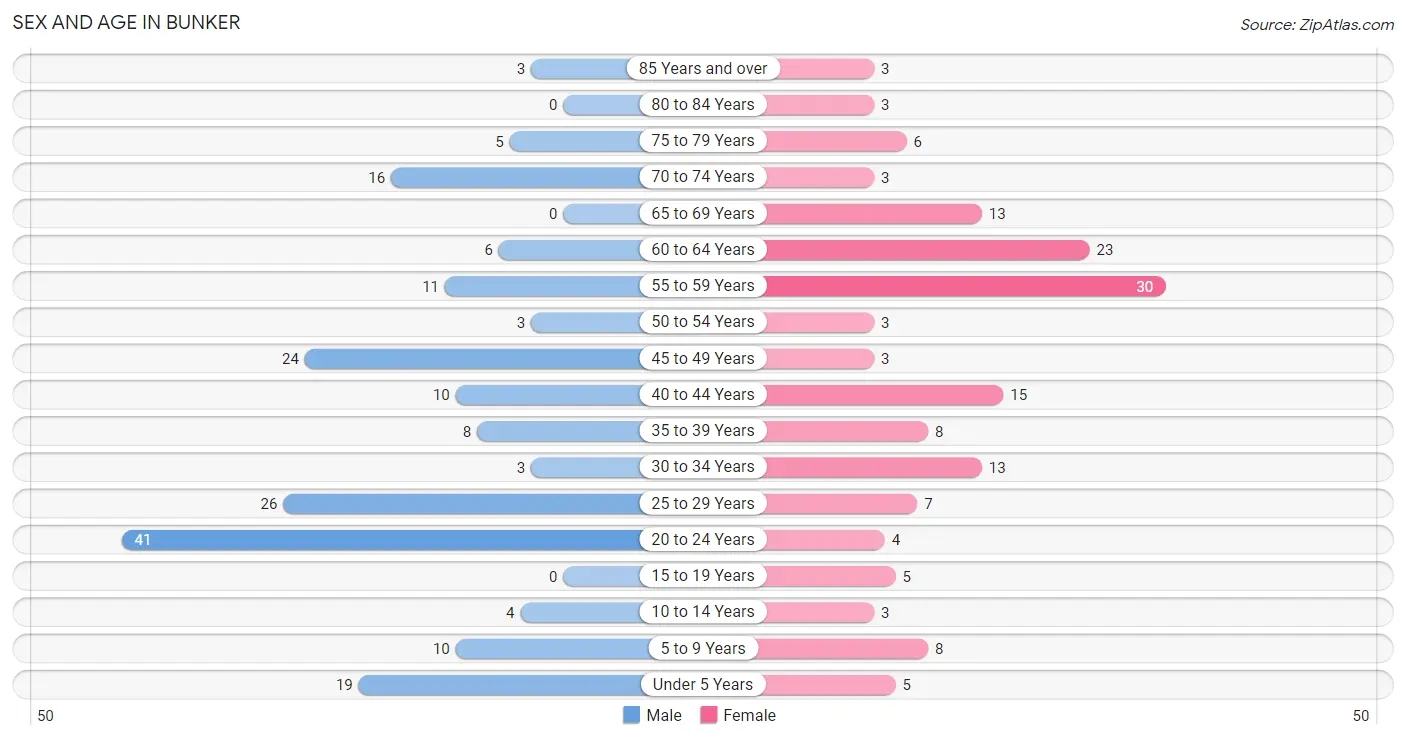
| Age Bracket | Male | Female |
| Under 5 Years | 19 (10.1%) | 5 (3.2%) |
| 5 to 9 Years | 10 (5.3%) | 8 (5.2%) |
| 10 to 14 Years | 4 (2.1%) | 3 (1.9%) |
| 15 to 19 Years | 0 (0.0%) | 5 (3.2%) |
| 20 to 24 Years | 41 (21.7%) | 4 (2.6%) |
| 25 to 29 Years | 26 (13.8%) | 7 (4.5%) |
| 30 to 34 Years | 3 (1.6%) | 13 (8.4%) |
| 35 to 39 Years | 8 (4.2%) | 8 (5.2%) |
| 40 to 44 Years | 10 (5.3%) | 15 (9.7%) |
| 45 to 49 Years | 24 (12.7%) | 3 (1.9%) |
| 50 to 54 Years | 3 (1.6%) | 3 (1.9%) |
| 55 to 59 Years | 11 (5.8%) | 30 (19.4%) |
| 60 to 64 Years | 6 (3.2%) | 23 (14.8%) |
| 65 to 69 Years | 0 (0.0%) | 13 (8.4%) |
| 70 to 74 Years | 16 (8.5%) | 3 (1.9%) |
| 75 to 79 Years | 5 (2.6%) | 6 (3.9%) |
| 80 to 84 Years | 0 (0.0%) | 3 (1.9%) |
| 85 Years and over | 3 (1.6%) | 3 (1.9%) |
| Total | 189 (100.0%) | 155 (100.0%) |
Families and Households in Bunker
Median Family Size in Bunker
The median family size in Bunker is 4.75 persons per family, with married-couple families (27 | 56.2%) accounting for the largest median family size of 5.15 persons per family. On the other hand, single male/father families (5 | 10.4%) represent the smallest median family size with 4.20 persons per family.
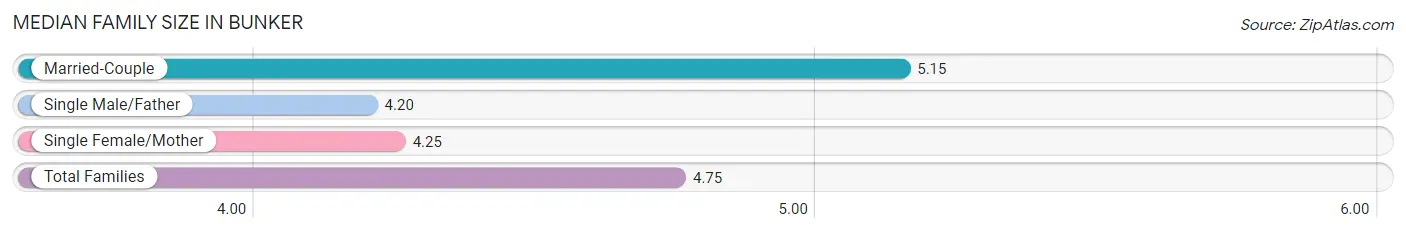
| Family Type | # Families | Family Size |
| Married-Couple | 27 (56.2%) | 5.15 |
| Single Male/Father | 5 (10.4%) | 4.20 |
| Single Female/Mother | 16 (33.3%) | 4.25 |
| Total Families | 48 (100.0%) | 4.75 |
Median Household Size in Bunker
The median household size in Bunker is 2.84 persons per household, with single female/mother households (16 | 13.8%) accounting for the largest median household size of 5.94 persons per household. non-family households (68 | 58.6%) represent the smallest median household size with 1.04 persons per household.
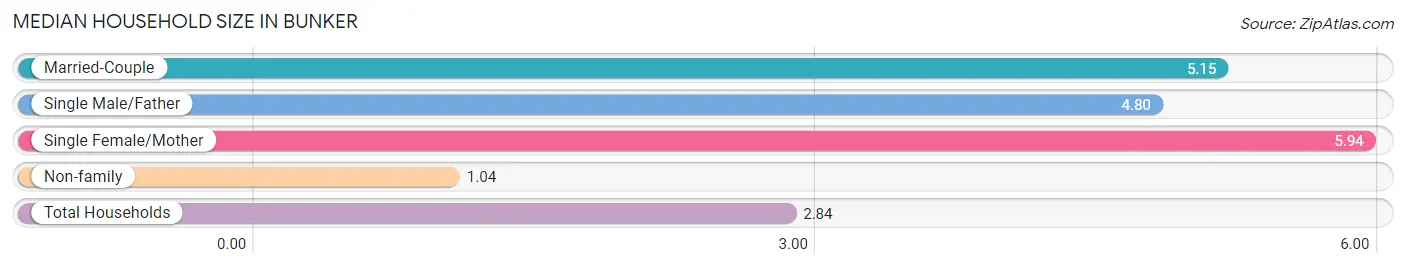
| Household Type | # Households | Household Size |
| Married-Couple | 27 (23.3%) | 5.15 |
| Single Male/Father | 5 (4.3%) | 4.80 |
| Single Female/Mother | 16 (13.8%) | 5.94 |
| Non-family | 68 (58.6%) | 1.04 |
| Total Households | 116 (100.0%) | 2.84 |
Household Size by Marriage Status in Bunker
Out of a total of 116 households in Bunker, 48 (41.4%) are family households, while 68 (58.6%) are nonfamily households. The most numerous type of family households are 2-person households, comprising 22, and the most common type of nonfamily households are 1-person households, comprising 66.
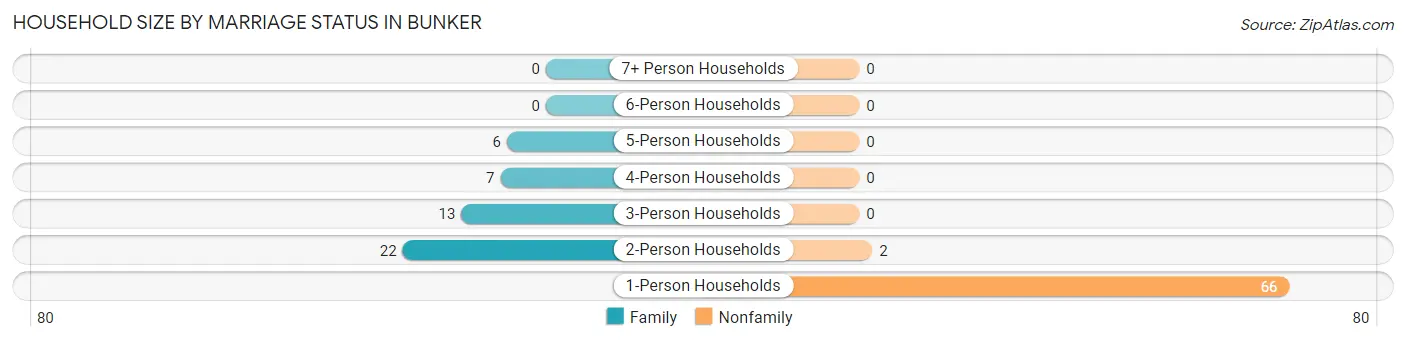
| Household Size | Family Households | Nonfamily Households |
| 1-Person Households | - | 66 (56.9%) |
| 2-Person Households | 22 (19.0%) | 2 (1.7%) |
| 3-Person Households | 13 (11.2%) | 0 (0.0%) |
| 4-Person Households | 7 (6.0%) | 0 (0.0%) |
| 5-Person Households | 6 (5.2%) | 0 (0.0%) |
| 6-Person Households | 0 (0.0%) | 0 (0.0%) |
| 7+ Person Households | 0 (0.0%) | 0 (0.0%) |
| Total | 48 (41.4%) | 68 (58.6%) |
Female Fertility in Bunker
Fertility by Age in Bunker
| Age Bracket | Women with Births | Births / 1,000 Women |
| 15 to 19 years | 0 (0.0%) | 0.0 |
| 20 to 34 years | 0 (0.0%) | 0.0 |
| 35 to 50 years | 0 (0.0%) | 0.0 |
| Total | 0 (0.0%) | 0.0 |
Fertility by Age by Marriage Status in Bunker
| Age Bracket | Married | Unmarried |
| 15 to 19 years | 0 (0.0%) | 0 (0.0%) |
| 20 to 34 years | 0 (0.0%) | 0 (0.0%) |
| 35 to 50 years | 0 (0.0%) | 0 (0.0%) |
| Total | 0 (0.0%) | 0 (0.0%) |
Fertility by Education in Bunker
| Educational Attainment | Women with Births | Births / 1,000 Women |
| Less than High School | 0 (0.0%) | 0.0 |
| High School Diploma | 0 (0.0%) | 0.0 |
| College or Associate's Degree | 0 (0.0%) | 0.0 |
| Bachelor's Degree | 0 (0.0%) | 0.0 |
| Graduate Degree | 0 (0.0%) | 0.0 |
| Total | 0 (0.0%) | 0.0 |
Fertility by Education by Marriage Status in Bunker
| Educational Attainment | Married | Unmarried |
| Less than High School | 0 (0.0%) | 0 (0.0%) |
| High School Diploma | 0 (0.0%) | 0 (0.0%) |
| College or Associate's Degree | 0 (0.0%) | 0 (0.0%) |
| Bachelor's Degree | 0 (0.0%) | 0 (0.0%) |
| Graduate Degree | 0 (0.0%) | 0 (0.0%) |
| Total | 0 (0.0%) | 0 (0.0%) |
Employment Characteristics in Bunker
Employment by Class of Employer in Bunker
Among the 121 employed individuals in Bunker, private company employees (74 | 61.2%), local government employees (26 | 21.5%), and self-employed (not incorporated) (12 | 9.9%) make up the most common classes of employment.
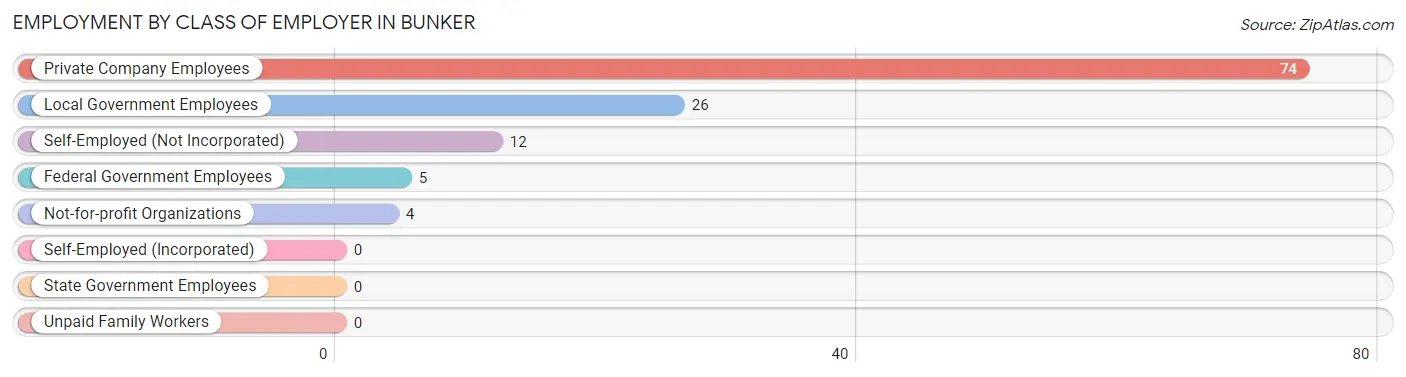
| Employer Class | # Employees | % Employees |
| Private Company Employees | 74 | 61.2% |
| Self-Employed (Incorporated) | 0 | 0.0% |
| Self-Employed (Not Incorporated) | 12 | 9.9% |
| Not-for-profit Organizations | 4 | 3.3% |
| Local Government Employees | 26 | 21.5% |
| State Government Employees | 0 | 0.0% |
| Federal Government Employees | 5 | 4.1% |
| Unpaid Family Workers | 0 | 0.0% |
| Total | 121 | 100.0% |
Employment Status by Age in Bunker
According to the labor force statistics for Bunker, out of the total population over 16 years of age (295), 46.1% or 136 individuals are in the labor force, with 11.0% or 15 of them unemployed. The age group with the highest labor force participation rate is 16 to 19 years, with 100.0% or 5 individuals in the labor force. Within the labor force, the 16 to 19 years age range has the highest percentage of unemployed individuals, with 100.0% or 5 of them being unemployed.
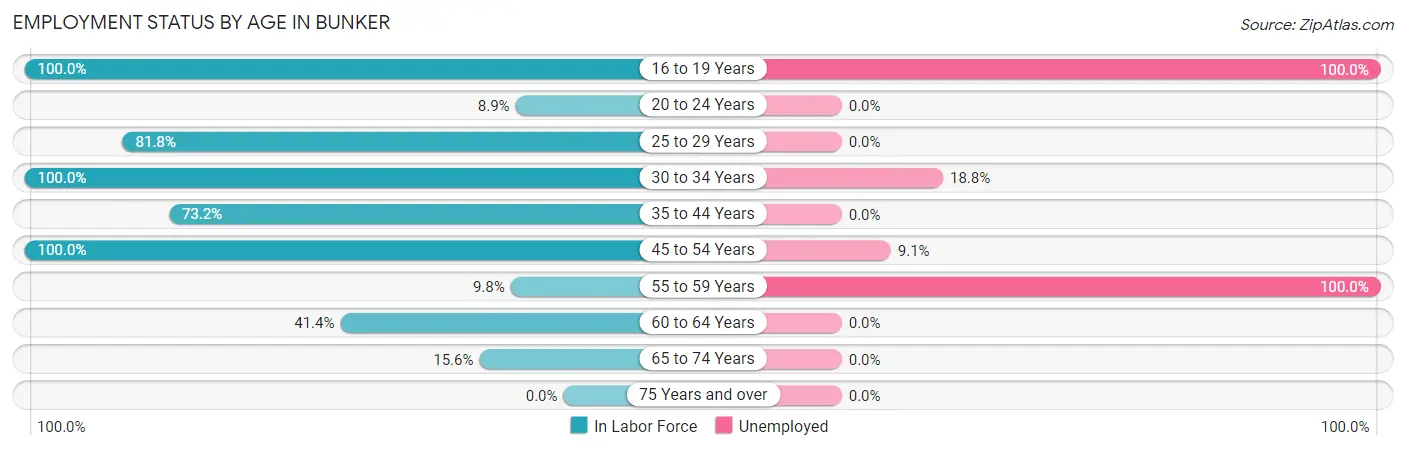
| Age Bracket | In Labor Force | Unemployed |
| 16 to 19 Years | 5 (100.0%) | 5 (100.0%) |
| 20 to 24 Years | 4 (8.9%) | 0 (0.0%) |
| 25 to 29 Years | 27 (81.8%) | 0 (0.0%) |
| 30 to 34 Years | 16 (100.0%) | 3 (18.8%) |
| 35 to 44 Years | 30 (73.2%) | 0 (0.0%) |
| 45 to 54 Years | 33 (100.0%) | 3 (9.1%) |
| 55 to 59 Years | 4 (9.8%) | 4 (100.0%) |
| 60 to 64 Years | 12 (41.4%) | 0 (0.0%) |
| 65 to 74 Years | 5 (15.6%) | 0 (0.0%) |
| 75 Years and over | 0 (0.0%) | 0 (0.0%) |
| Total | 136 (46.1%) | 15 (11.0%) |
Employment Status by Educational Attainment in Bunker
According to labor force statistics for Bunker, 63.2% of individuals (122) out of the total population between 25 and 64 years of age (193) are in the labor force, with 8.2% or 10 of them being unemployed. The group with the highest labor force participation rate are those with the educational attainment of high school diploma, with 75.2% or 88 individuals in the labor force. Within the labor force, individuals with high school diploma education have the highest percentage of unemployment, with 11.4% or 10 of them being unemployed.
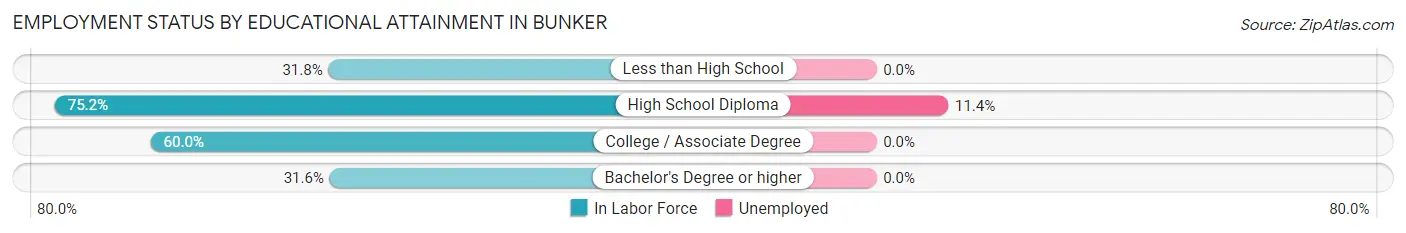
| Educational Attainment | In Labor Force | Unemployed |
| Less than High School | 7 (31.8%) | 0 (0.0%) |
| High School Diploma | 88 (75.2%) | 13 (11.4%) |
| College / Associate Degree | 21 (60.0%) | 0 (0.0%) |
| Bachelor's Degree or higher | 6 (31.6%) | 0 (0.0%) |
| Total | 122 (63.2%) | 16 (8.2%) |
Employment Occupations by Sex in Bunker
Management, Business, Science and Arts Occupations
The most common Management, Business, Science and Arts occupations in Bunker are , and Management (1 | 0.8%).
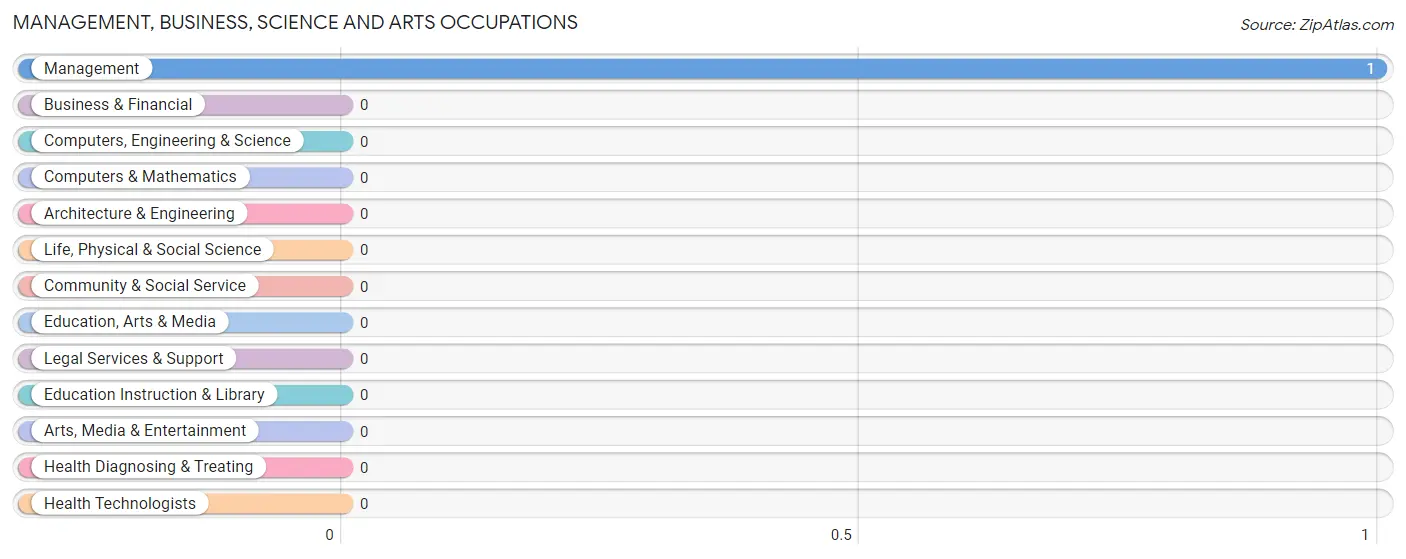
Management, Business, Science and Arts Occupations by Sex
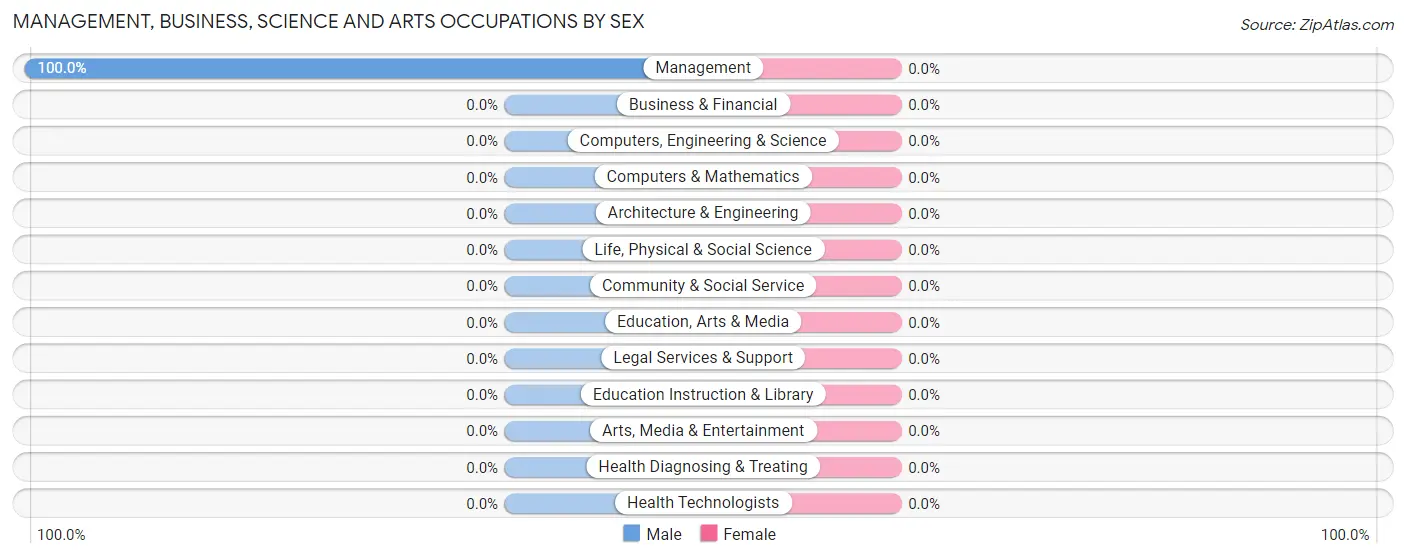
| Occupation | Male | Female |
| Management | 1 (100.0%) | 0 (0.0%) |
| Business & Financial | 0 (0.0%) | 0 (0.0%) |
| Computers, Engineering & Science | 0 (0.0%) | 0 (0.0%) |
| Computers & Mathematics | 0 (0.0%) | 0 (0.0%) |
| Architecture & Engineering | 0 (0.0%) | 0 (0.0%) |
| Life, Physical & Social Science | 0 (0.0%) | 0 (0.0%) |
| Community & Social Service | 0 (0.0%) | 0 (0.0%) |
| Education, Arts & Media | 0 (0.0%) | 0 (0.0%) |
| Legal Services & Support | 0 (0.0%) | 0 (0.0%) |
| Education Instruction & Library | 0 (0.0%) | 0 (0.0%) |
| Arts, Media & Entertainment | 0 (0.0%) | 0 (0.0%) |
| Health Diagnosing & Treating | 0 (0.0%) | 0 (0.0%) |
| Health Technologists | 0 (0.0%) | 0 (0.0%) |
| Total (Category) | 1 (100.0%) | 0 (0.0%) |
| Total (Overall) | 70 (57.9%) | 51 (42.1%) |
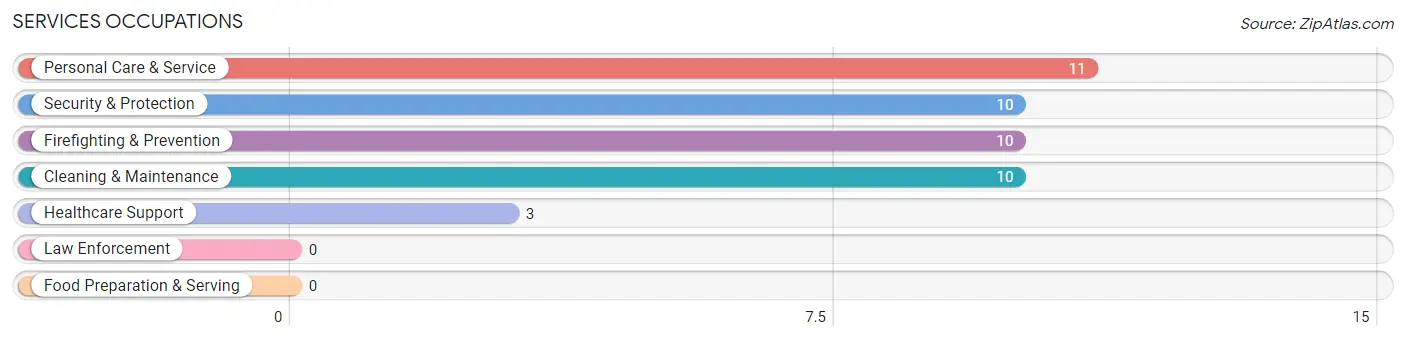
Services Occupations
The most common Services occupations in Bunker are Personal Care & Service (11 | 9.1%), Security & Protection (10 | 8.3%), Firefighting & Prevention (10 | 8.3%), Cleaning & Maintenance (10 | 8.3%), and Healthcare Support (3 | 2.5%).
Services Occupations by Sex
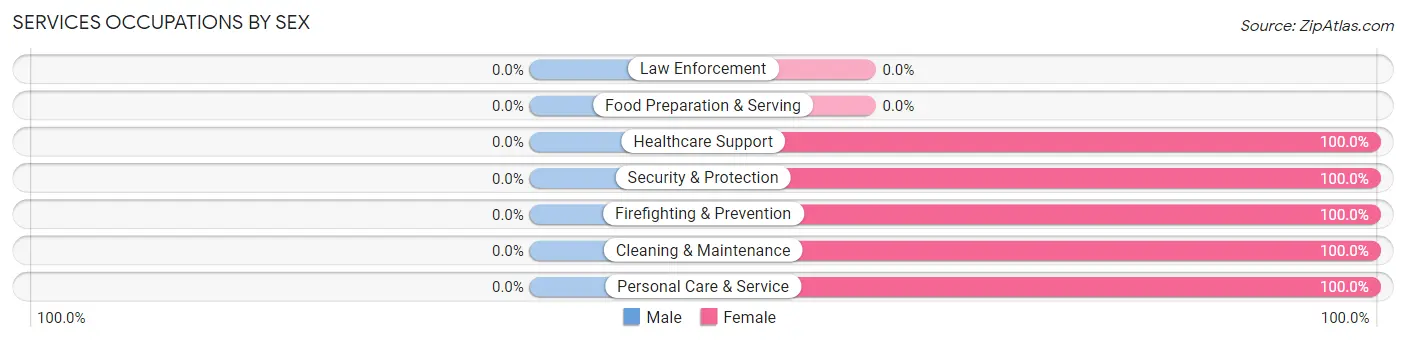
| Occupation | Male | Female |
| Healthcare Support | 0 (0.0%) | 3 (100.0%) |
| Security & Protection | 0 (0.0%) | 10 (100.0%) |
| Firefighting & Prevention | 0 (0.0%) | 10 (100.0%) |
| Law Enforcement | 0 (0.0%) | 0 (0.0%) |
| Food Preparation & Serving | 0 (0.0%) | 0 (0.0%) |
| Cleaning & Maintenance | 0 (0.0%) | 10 (100.0%) |
| Personal Care & Service | 0 (0.0%) | 11 (100.0%) |
| Total (Category) | 0 (0.0%) | 34 (100.0%) |
| Total (Overall) | 70 (57.9%) | 51 (42.1%) |
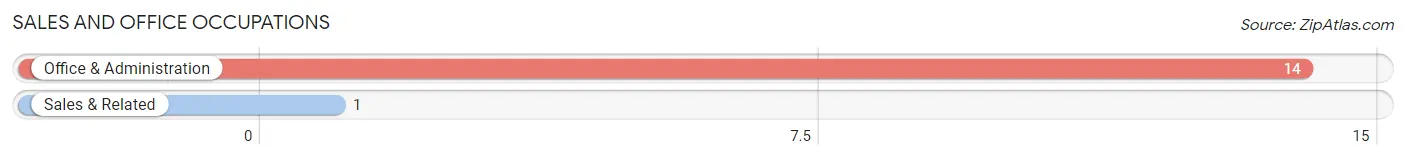
Sales and Office Occupations
The most common Sales and Office occupations in Bunker are Office & Administration (14 | 11.6%), and Sales & Related (1 | 0.8%).
Sales and Office Occupations by Sex
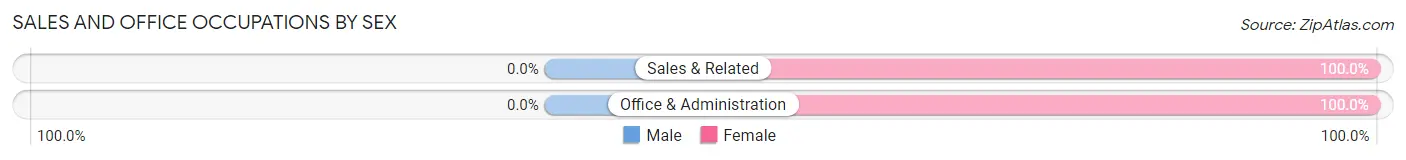
| Occupation | Male | Female |
| Sales & Related | 0 (0.0%) | 1 (100.0%) |
| Office & Administration | 0 (0.0%) | 14 (100.0%) |
| Total (Category) | 0 (0.0%) | 15 (100.0%) |
| Total (Overall) | 70 (57.9%) | 51 (42.1%) |
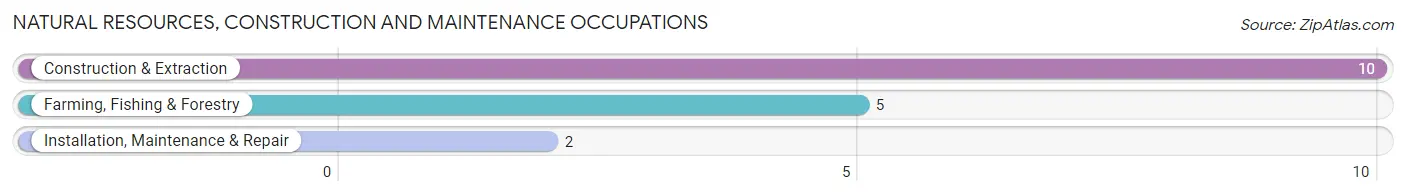
Natural Resources, Construction and Maintenance Occupations
The most common Natural Resources, Construction and Maintenance occupations in Bunker are Construction & Extraction (10 | 8.3%), Farming, Fishing & Forestry (5 | 4.1%), and Installation, Maintenance & Repair (2 | 1.7%).
Natural Resources, Construction and Maintenance Occupations by Sex
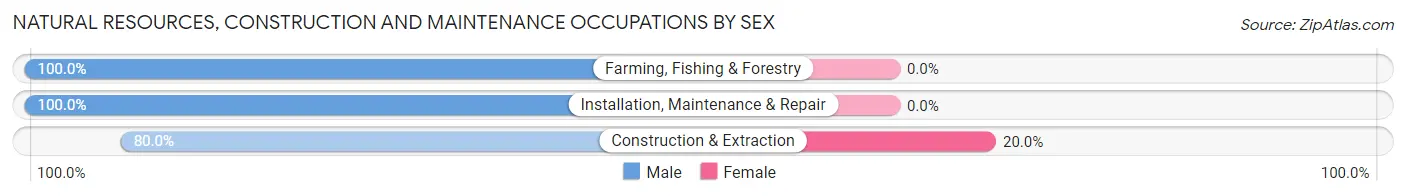
| Occupation | Male | Female |
| Farming, Fishing & Forestry | 5 (100.0%) | 0 (0.0%) |
| Construction & Extraction | 8 (80.0%) | 2 (20.0%) |
| Installation, Maintenance & Repair | 2 (100.0%) | 0 (0.0%) |
| Total (Category) | 15 (88.2%) | 2 (11.8%) |
| Total (Overall) | 70 (57.9%) | 51 (42.1%) |
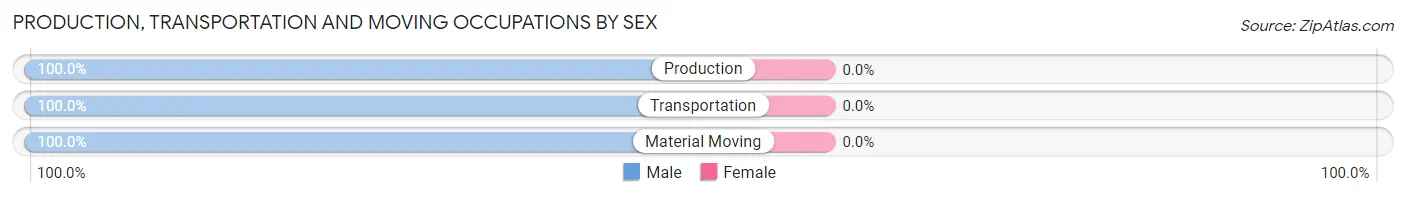
Production, Transportation and Moving Occupations
The most common Production, Transportation and Moving occupations in Bunker are Material Moving (42 | 34.7%), Production (7 | 5.8%), and Transportation (5 | 4.1%).
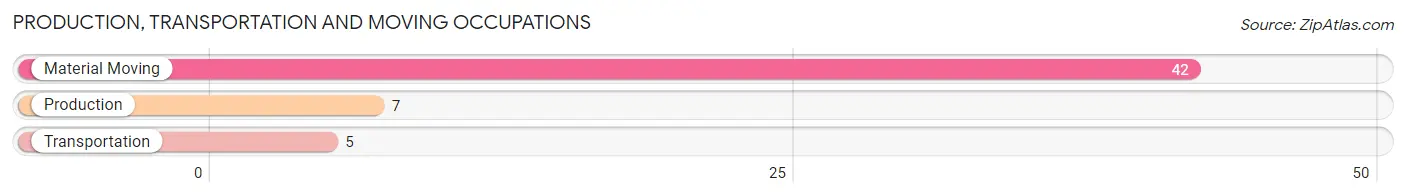
Production, Transportation and Moving Occupations by Sex
| Occupation | Male | Female |
| Production | 7 (100.0%) | 0 (0.0%) |
| Transportation | 5 (100.0%) | 0 (0.0%) |
| Material Moving | 42 (100.0%) | 0 (0.0%) |
| Total (Category) | 54 (100.0%) | 0 (0.0%) |
| Total (Overall) | 70 (57.9%) | 51 (42.1%) |
Employment Industries by Sex in Bunker
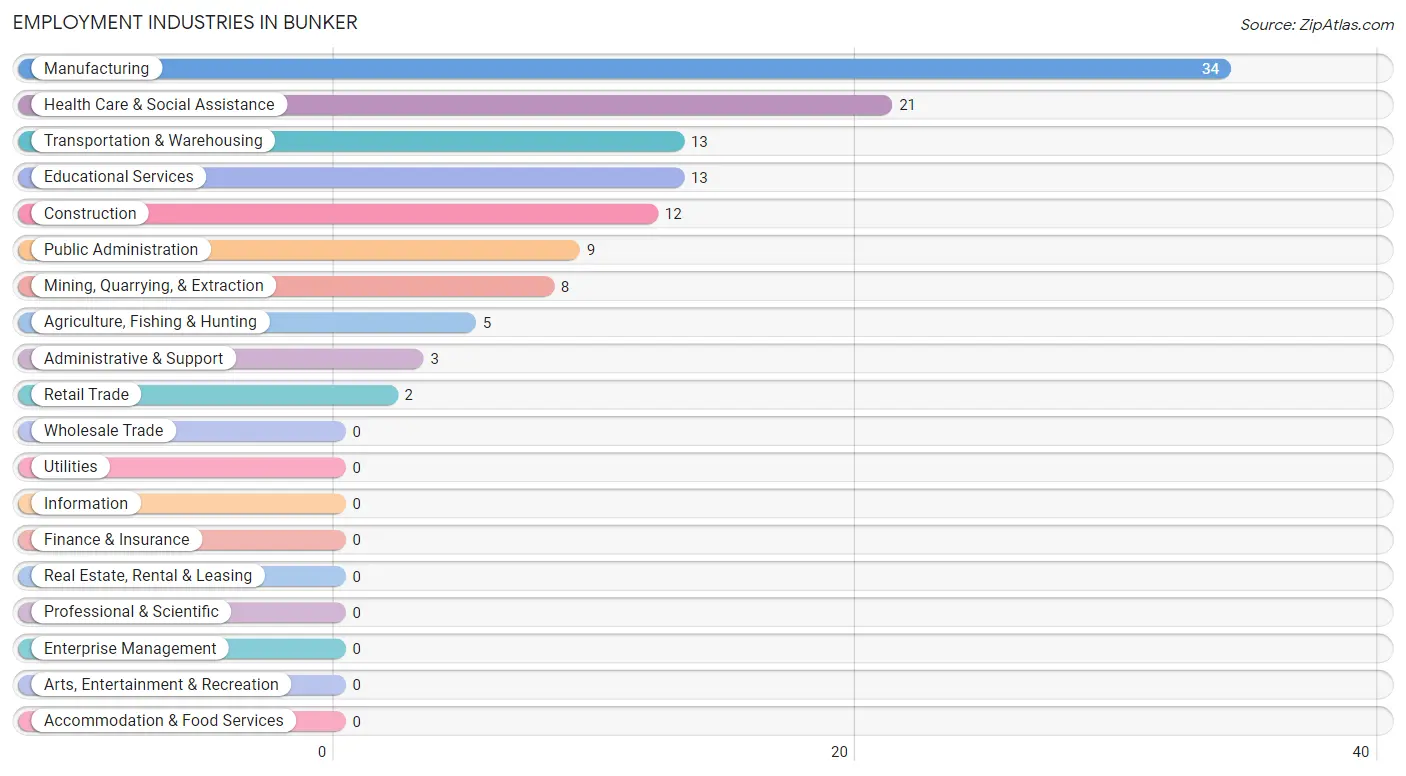
Employment Industries in Bunker
The major employment industries in Bunker include Manufacturing (34 | 28.1%), Health Care & Social Assistance (21 | 17.4%), Transportation & Warehousing (13 | 10.7%), Educational Services (13 | 10.7%), and Construction (12 | 9.9%).
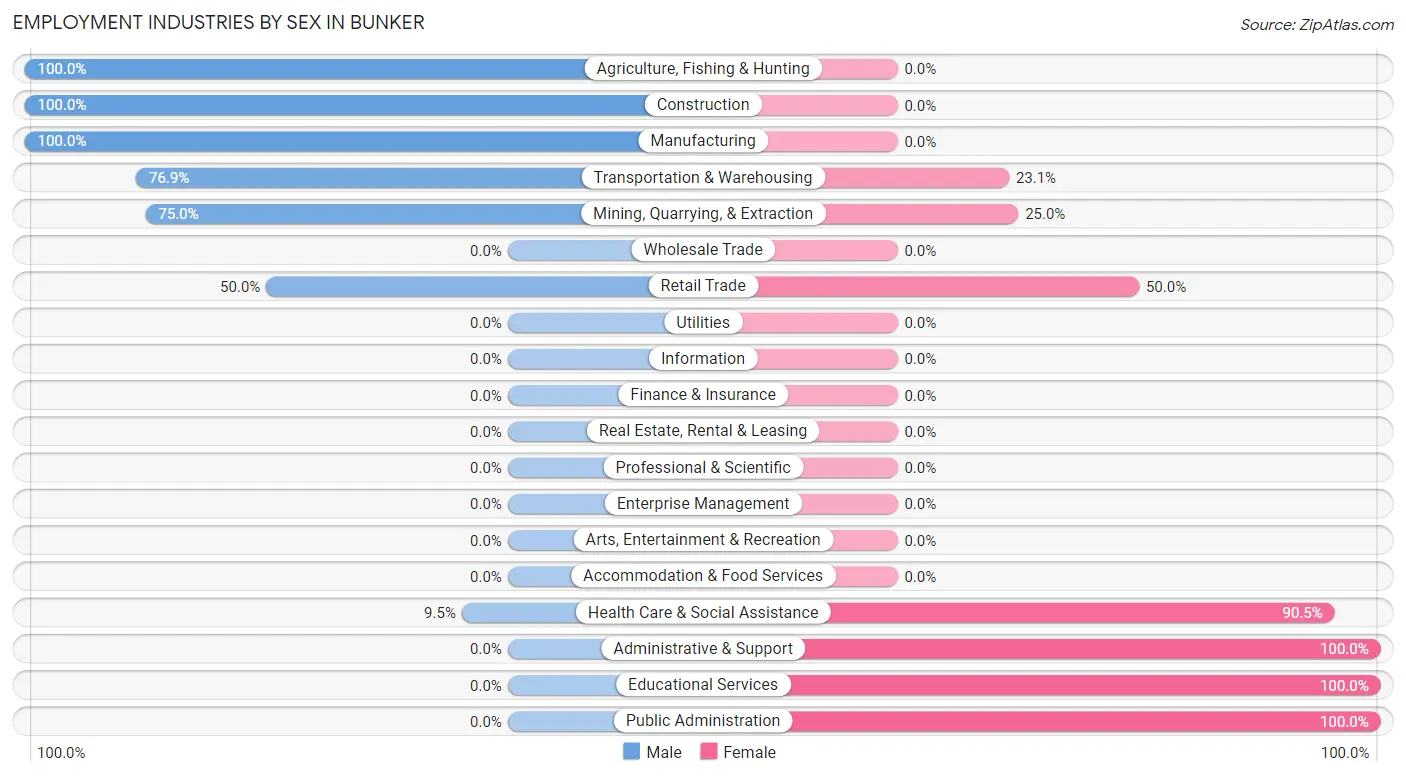
Employment Industries by Sex in Bunker
The Bunker industries that see more men than women are Agriculture, Fishing & Hunting (100.0%), Construction (100.0%), and Manufacturing (100.0%), whereas the industries that tend to have a higher number of women are Administrative & Support (100.0%), Educational Services (100.0%), and Public Administration (100.0%).
| Industry | Male | Female |
| Agriculture, Fishing & Hunting | 5 (100.0%) | 0 (0.0%) |
| Mining, Quarrying, & Extraction | 6 (75.0%) | 2 (25.0%) |
| Construction | 12 (100.0%) | 0 (0.0%) |
| Manufacturing | 34 (100.0%) | 0 (0.0%) |
| Wholesale Trade | 0 (0.0%) | 0 (0.0%) |
| Retail Trade | 1 (50.0%) | 1 (50.0%) |
| Transportation & Warehousing | 10 (76.9%) | 3 (23.1%) |
| Utilities | 0 (0.0%) | 0 (0.0%) |
| Information | 0 (0.0%) | 0 (0.0%) |
| Finance & Insurance | 0 (0.0%) | 0 (0.0%) |
| Real Estate, Rental & Leasing | 0 (0.0%) | 0 (0.0%) |
| Professional & Scientific | 0 (0.0%) | 0 (0.0%) |
| Enterprise Management | 0 (0.0%) | 0 (0.0%) |
| Administrative & Support | 0 (0.0%) | 3 (100.0%) |
| Educational Services | 0 (0.0%) | 13 (100.0%) |
| Health Care & Social Assistance | 2 (9.5%) | 19 (90.5%) |
| Arts, Entertainment & Recreation | 0 (0.0%) | 0 (0.0%) |
| Accommodation & Food Services | 0 (0.0%) | 0 (0.0%) |
| Public Administration | 0 (0.0%) | 9 (100.0%) |
| Total | 70 (57.9%) | 51 (42.1%) |
Education in Bunker
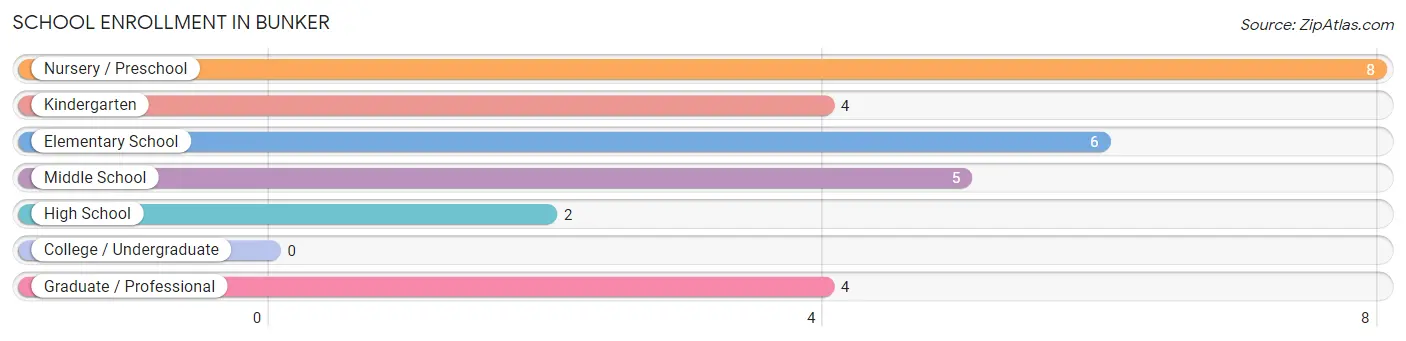
School Enrollment in Bunker
The most common levels of schooling among the 29 students in Bunker are nursery / preschool (8 | 27.6%), elementary school (6 | 20.7%), and middle school (5 | 17.2%).
| School Level | # Students | % Students |
| Nursery / Preschool | 8 | 27.6% |
| Kindergarten | 4 | 13.8% |
| Elementary School | 6 | 20.7% |
| Middle School | 5 | 17.2% |
| High School | 2 | 6.9% |
| College / Undergraduate | 0 | 0.0% |
| Graduate / Professional | 4 | 13.8% |
| Total | 29 | 100.0% |
School Enrollment by Age by Funding Source in Bunker
Out of a total of 29 students who are enrolled in schools in Bunker, 4 (13.8%) attend a private institution, while the remaining 25 (86.2%) are enrolled in public schools. The age group of 25 to 34 year olds has the highest likelihood of being enrolled in private schools, with 4 (100.0% in the age bracket) enrolled. Conversely, the age group of 3 to 4 year olds has the lowest likelihood of being enrolled in a private school, with 2 (100.0% in the age bracket) attending a public institution.
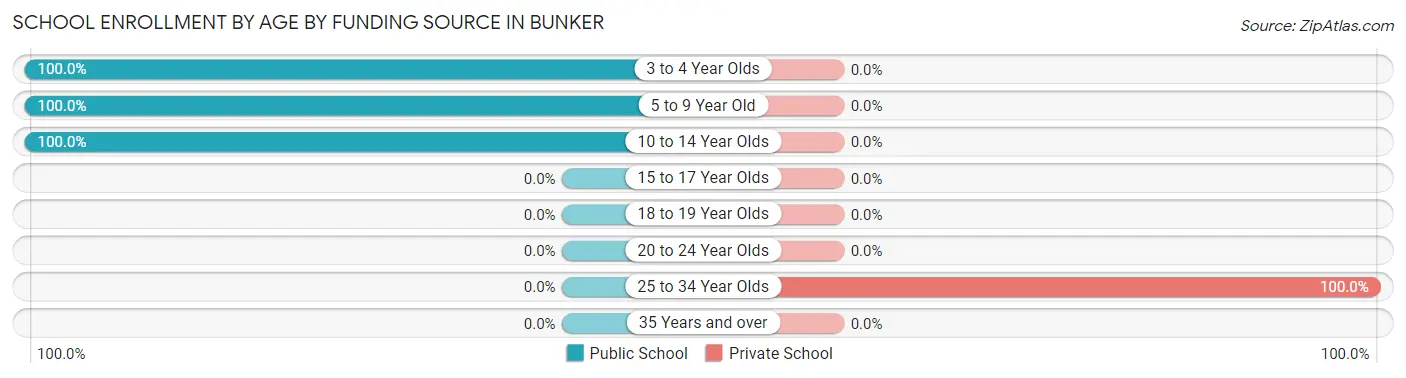
| Age Bracket | Public School | Private School |
| 3 to 4 Year Olds | 2 (100.0%) | 0 (0.0%) |
| 5 to 9 Year Old | 16 (100.0%) | 0 (0.0%) |
| 10 to 14 Year Olds | 7 (100.0%) | 0 (0.0%) |
| 15 to 17 Year Olds | 0 (0.0%) | 0 (0.0%) |
| 18 to 19 Year Olds | 0 (0.0%) | 0 (0.0%) |
| 20 to 24 Year Olds | 0 (0.0%) | 0 (0.0%) |
| 25 to 34 Year Olds | 0 (0.0%) | 4 (100.0%) |
| 35 Years and over | 0 (0.0%) | 0 (0.0%) |
| Total | 25 (86.2%) | 4 (13.8%) |
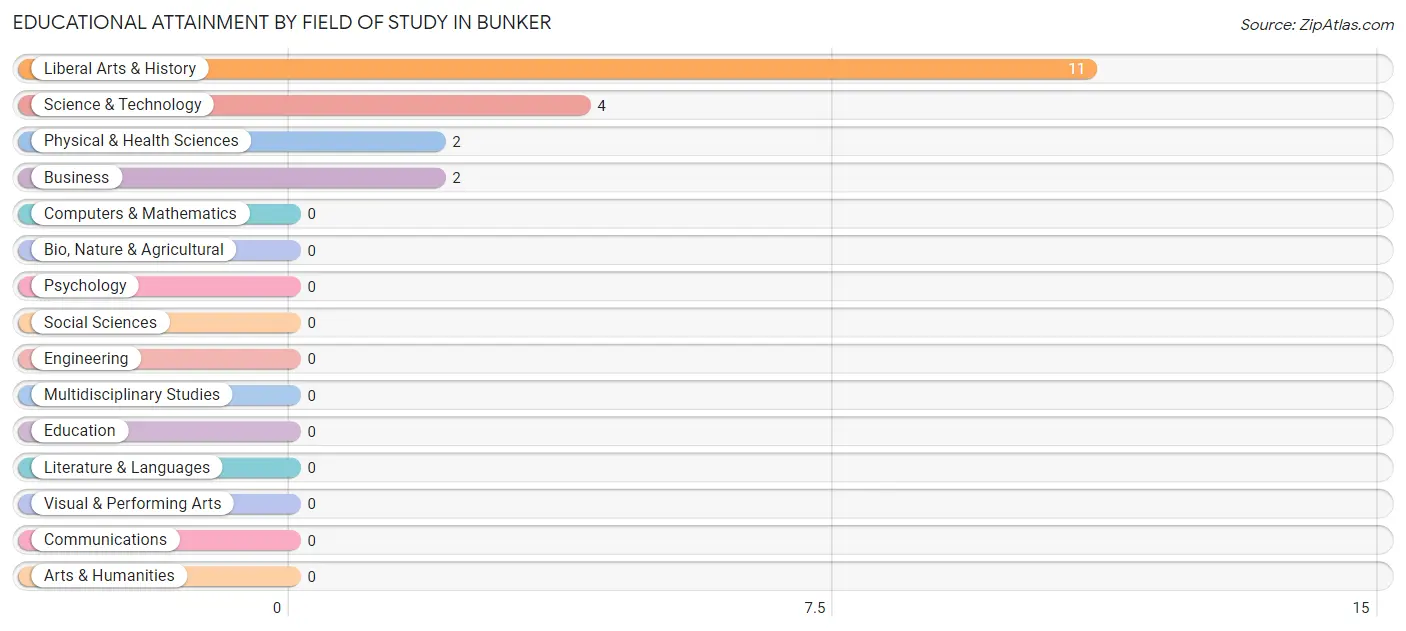
Educational Attainment by Field of Study in Bunker
Liberal arts & history (11 | 57.9%), science & technology (4 | 21.0%), physical & health sciences (2 | 10.5%), and business (2 | 10.5%) are the most common fields of study among 19 individuals in Bunker who have obtained a bachelor's degree or higher.
| Field of Study | # Graduates | % Graduates |
| Computers & Mathematics | 0 | 0.0% |
| Bio, Nature & Agricultural | 0 | 0.0% |
| Physical & Health Sciences | 2 | 10.5% |
| Psychology | 0 | 0.0% |
| Social Sciences | 0 | 0.0% |
| Engineering | 0 | 0.0% |
| Multidisciplinary Studies | 0 | 0.0% |
| Science & Technology | 4 | 21.0% |
| Business | 2 | 10.5% |
| Education | 0 | 0.0% |
| Literature & Languages | 0 | 0.0% |
| Liberal Arts & History | 11 | 57.9% |
| Visual & Performing Arts | 0 | 0.0% |
| Communications | 0 | 0.0% |
| Arts & Humanities | 0 | 0.0% |
| Total | 19 | 100.0% |
Transportation & Commute in Bunker
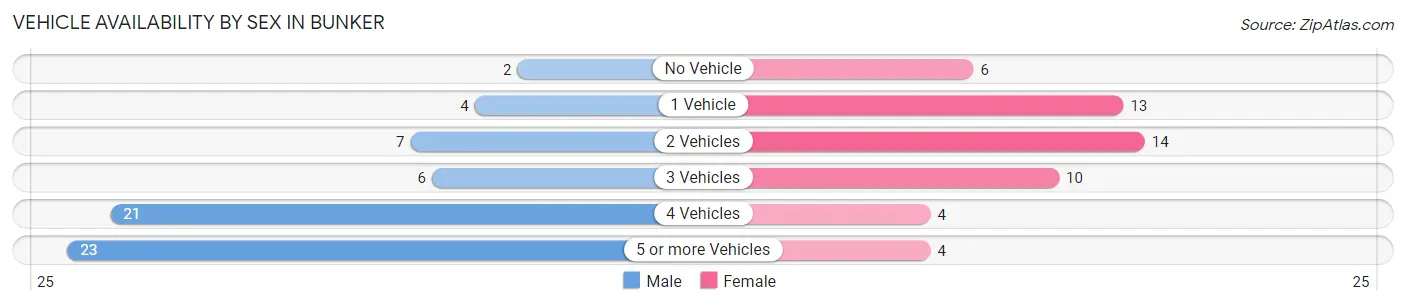
Vehicle Availability by Sex in Bunker
The most prevalent vehicle ownership categories in Bunker are males with 5 or more vehicles (23, accounting for 36.5%) and females with 5 or more vehicles (4, making up 45.1%).
| Vehicles Available | Male | Female |
| No Vehicle | 2 (3.2%) | 6 (11.8%) |
| 1 Vehicle | 4 (6.4%) | 13 (25.5%) |
| 2 Vehicles | 7 (11.1%) | 14 (27.5%) |
| 3 Vehicles | 6 (9.5%) | 10 (19.6%) |
| 4 Vehicles | 21 (33.3%) | 4 (7.8%) |
| 5 or more Vehicles | 23 (36.5%) | 4 (7.8%) |
| Total | 63 (100.0%) | 51 (100.0%) |
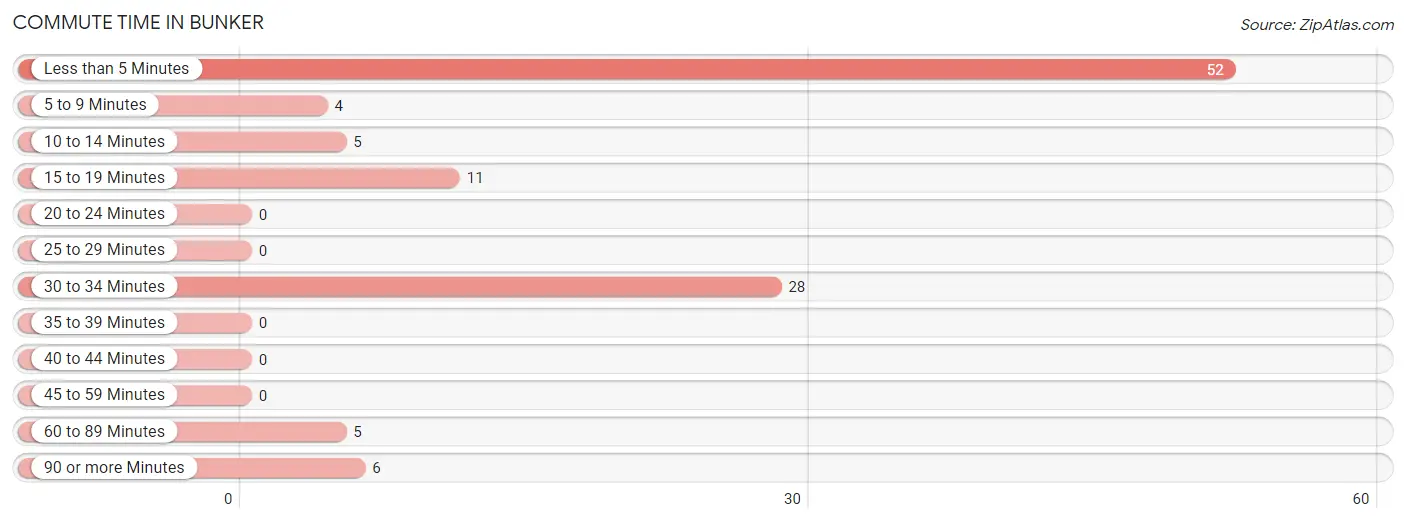
Commute Time in Bunker
The most frequently occuring commute durations in Bunker are less than 5 minutes (52 commuters, 46.9%), 30 to 34 minutes (28 commuters, 25.2%), and 15 to 19 minutes (11 commuters, 9.9%).
| Commute Time | # Commuters | % Commuters |
| Less than 5 Minutes | 52 | 46.9% |
| 5 to 9 Minutes | 4 | 3.6% |
| 10 to 14 Minutes | 5 | 4.5% |
| 15 to 19 Minutes | 11 | 9.9% |
| 20 to 24 Minutes | 0 | 0.0% |
| 25 to 29 Minutes | 0 | 0.0% |
| 30 to 34 Minutes | 28 | 25.2% |
| 35 to 39 Minutes | 0 | 0.0% |
| 40 to 44 Minutes | 0 | 0.0% |
| 45 to 59 Minutes | 0 | 0.0% |
| 60 to 89 Minutes | 5 | 4.5% |
| 90 or more Minutes | 6 | 5.4% |
Commute Time by Sex in Bunker
The most common commute times in Bunker are less than 5 minutes (36 commuters, 51.4%) for males and less than 5 minutes (16 commuters, 39.0%) for females.
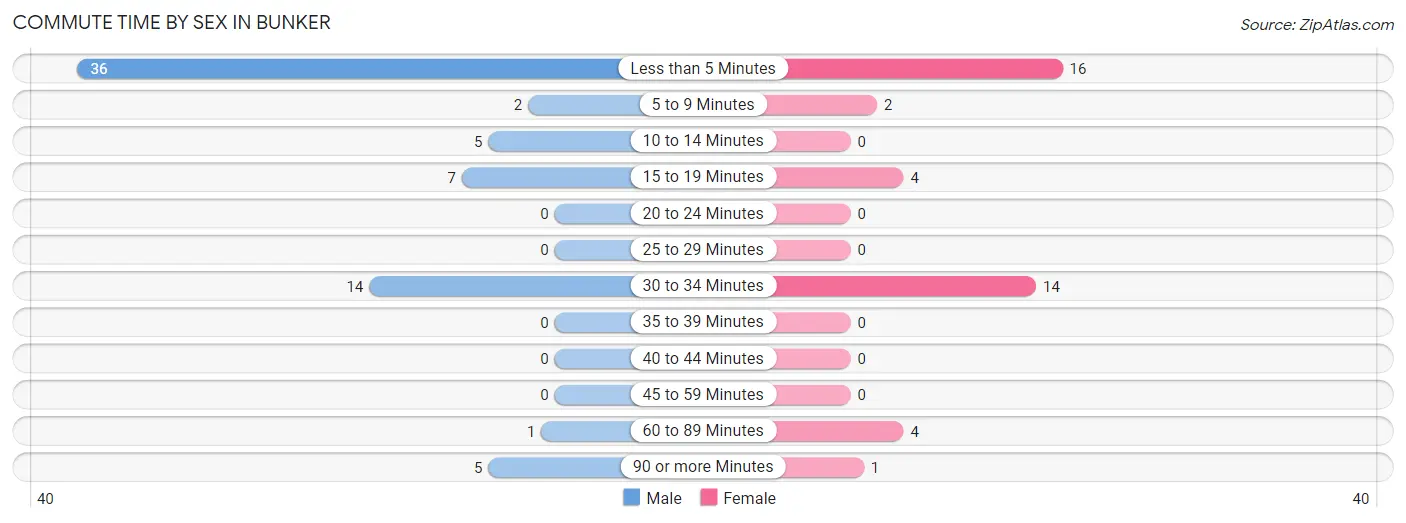
| Commute Time | Male | Female |
| Less than 5 Minutes | 36 (51.4%) | 16 (39.0%) |
| 5 to 9 Minutes | 2 (2.9%) | 2 (4.9%) |
| 10 to 14 Minutes | 5 (7.1%) | 0 (0.0%) |
| 15 to 19 Minutes | 7 (10.0%) | 4 (9.8%) |
| 20 to 24 Minutes | 0 (0.0%) | 0 (0.0%) |
| 25 to 29 Minutes | 0 (0.0%) | 0 (0.0%) |
| 30 to 34 Minutes | 14 (20.0%) | 14 (34.2%) |
| 35 to 39 Minutes | 0 (0.0%) | 0 (0.0%) |
| 40 to 44 Minutes | 0 (0.0%) | 0 (0.0%) |
| 45 to 59 Minutes | 0 (0.0%) | 0 (0.0%) |
| 60 to 89 Minutes | 1 (1.4%) | 4 (9.8%) |
| 90 or more Minutes | 5 (7.1%) | 1 (2.4%) |
Time of Departure to Work by Sex in Bunker
The most frequent times of departure to work in Bunker are 5:30 AM to 5:59 AM (17, 24.3%) for males and 12:00 PM to 3:59 PM (20, 48.8%) for females.
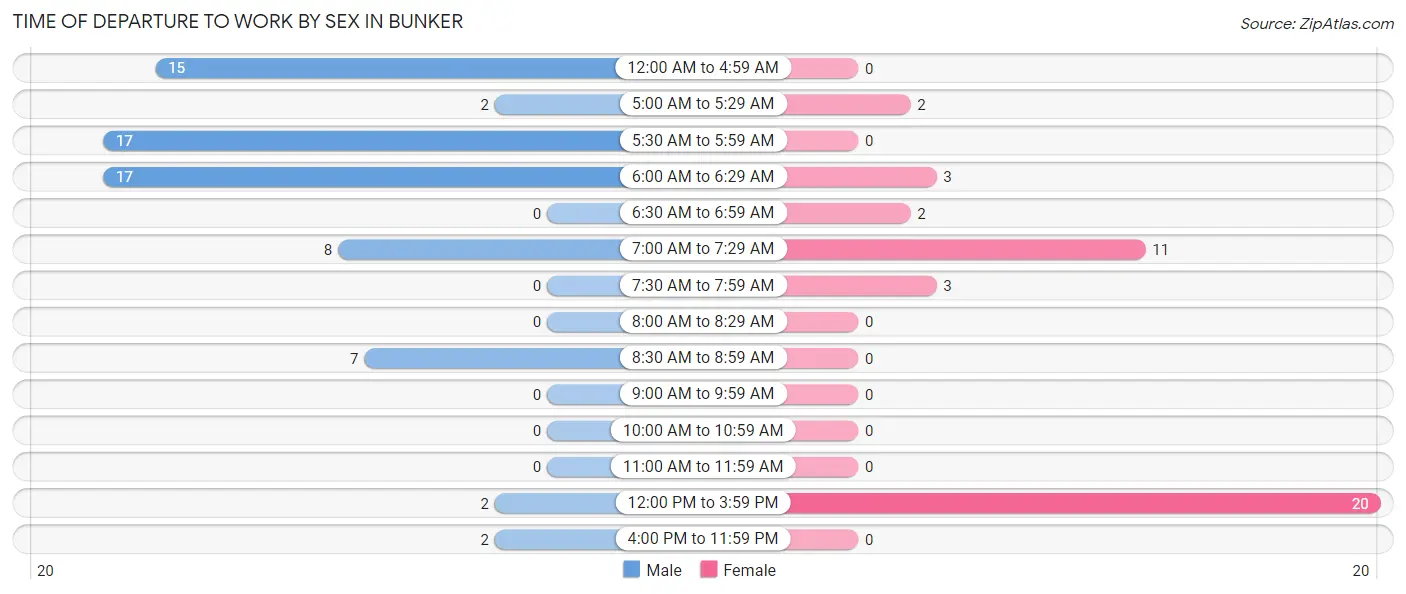
| Time of Departure | Male | Female |
| 12:00 AM to 4:59 AM | 15 (21.4%) | 0 (0.0%) |
| 5:00 AM to 5:29 AM | 2 (2.9%) | 2 (4.9%) |
| 5:30 AM to 5:59 AM | 17 (24.3%) | 0 (0.0%) |
| 6:00 AM to 6:29 AM | 17 (24.3%) | 3 (7.3%) |
| 6:30 AM to 6:59 AM | 0 (0.0%) | 2 (4.9%) |
| 7:00 AM to 7:29 AM | 8 (11.4%) | 11 (26.8%) |
| 7:30 AM to 7:59 AM | 0 (0.0%) | 3 (7.3%) |
| 8:00 AM to 8:29 AM | 0 (0.0%) | 0 (0.0%) |
| 8:30 AM to 8:59 AM | 7 (10.0%) | 0 (0.0%) |
| 9:00 AM to 9:59 AM | 0 (0.0%) | 0 (0.0%) |
| 10:00 AM to 10:59 AM | 0 (0.0%) | 0 (0.0%) |
| 11:00 AM to 11:59 AM | 0 (0.0%) | 0 (0.0%) |
| 12:00 PM to 3:59 PM | 2 (2.9%) | 20 (48.8%) |
| 4:00 PM to 11:59 PM | 2 (2.9%) | 0 (0.0%) |
| Total | 70 (100.0%) | 41 (100.0%) |
Housing Occupancy in Bunker
Occupancy by Ownership in Bunker
Of the total 116 dwellings in Bunker, owner-occupied units account for 52 (44.8%), while renter-occupied units make up 64 (55.2%).
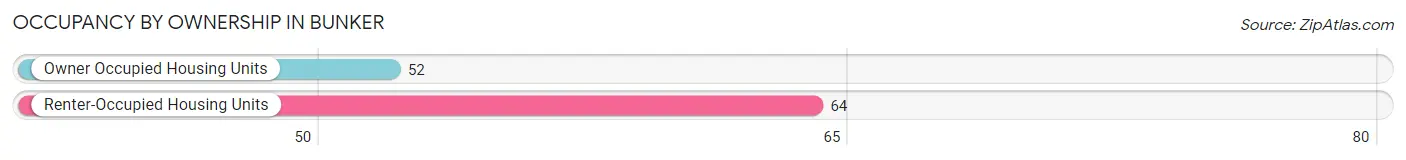
| Occupancy | # Housing Units | % Housing Units |
| Owner Occupied Housing Units | 52 | 44.8% |
| Renter-Occupied Housing Units | 64 | 55.2% |
| Total Occupied Housing Units | 116 | 100.0% |
Occupancy by Household Size in Bunker
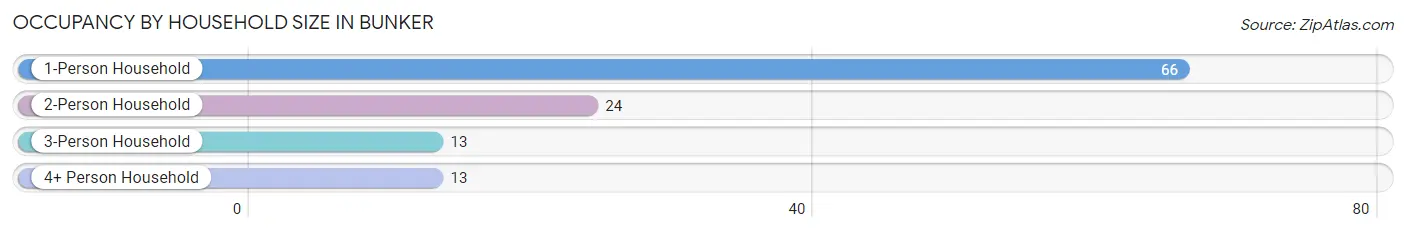
| Household Size | # Housing Units | % Housing Units |
| 1-Person Household | 66 | 56.9% |
| 2-Person Household | 24 | 20.7% |
| 3-Person Household | 13 | 11.2% |
| 4+ Person Household | 13 | 11.2% |
| Total Housing Units | 116 | 100.0% |
Occupancy by Ownership by Household Size in Bunker
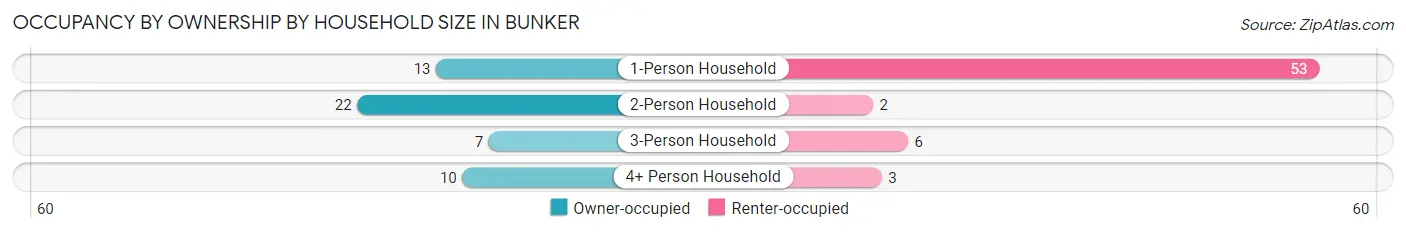
| Household Size | Owner-occupied | Renter-occupied |
| 1-Person Household | 13 (19.7%) | 53 (80.3%) |
| 2-Person Household | 22 (91.7%) | 2 (8.3%) |
| 3-Person Household | 7 (53.8%) | 6 (46.2%) |
| 4+ Person Household | 10 (76.9%) | 3 (23.1%) |
| Total Housing Units | 52 (44.8%) | 64 (55.2%) |
Occupancy by Educational Attainment in Bunker
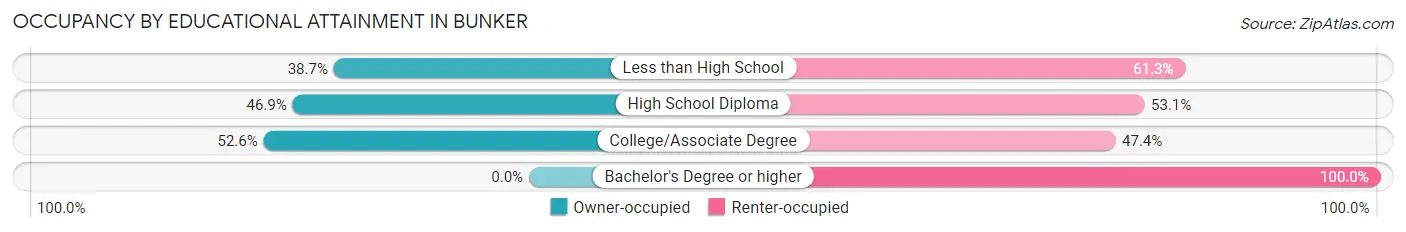
| Household Size | Owner-occupied | Renter-occupied |
| Less than High School | 12 (38.7%) | 19 (61.3%) |
| High School Diploma | 30 (46.9%) | 34 (53.1%) |
| College/Associate Degree | 10 (52.6%) | 9 (47.4%) |
| Bachelor's Degree or higher | 0 (0.0%) | 2 (100.0%) |
Occupancy by Age of Householder in Bunker
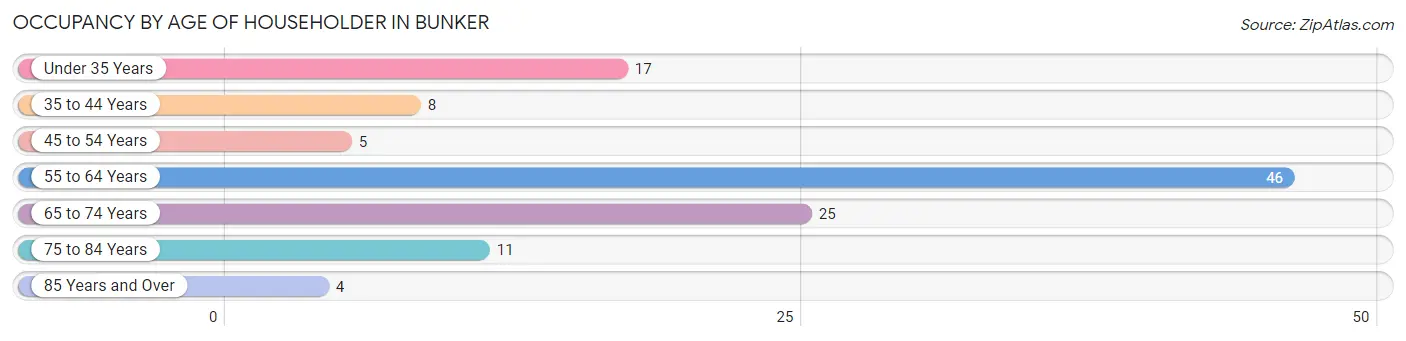
| Age Bracket | # Households | % Households |
| Under 35 Years | 17 | 14.7% |
| 35 to 44 Years | 8 | 6.9% |
| 45 to 54 Years | 5 | 4.3% |
| 55 to 64 Years | 46 | 39.7% |
| 65 to 74 Years | 25 | 21.5% |
| 75 to 84 Years | 11 | 9.5% |
| 85 Years and Over | 4 | 3.5% |
| Total | 116 | 100.0% |
Housing Finances in Bunker
Median Income by Occupancy in Bunker
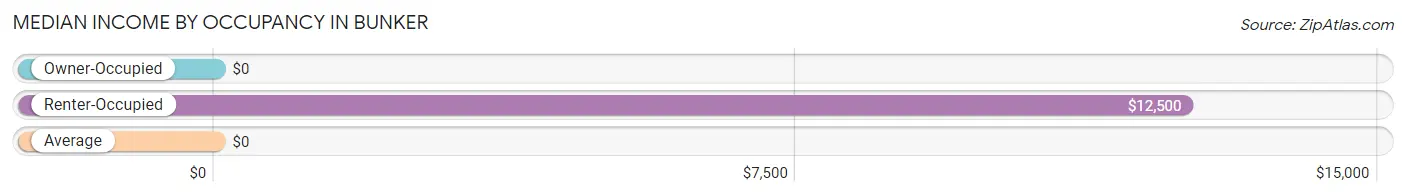
| Occupancy Type | # Households | Median Income |
| Owner-Occupied | 52 (44.8%) | $0 |
| Renter-Occupied | 64 (55.2%) | $12,500 |
| Average | 116 (100.0%) | $0 |
Occupancy by Householder Income Bracket in Bunker
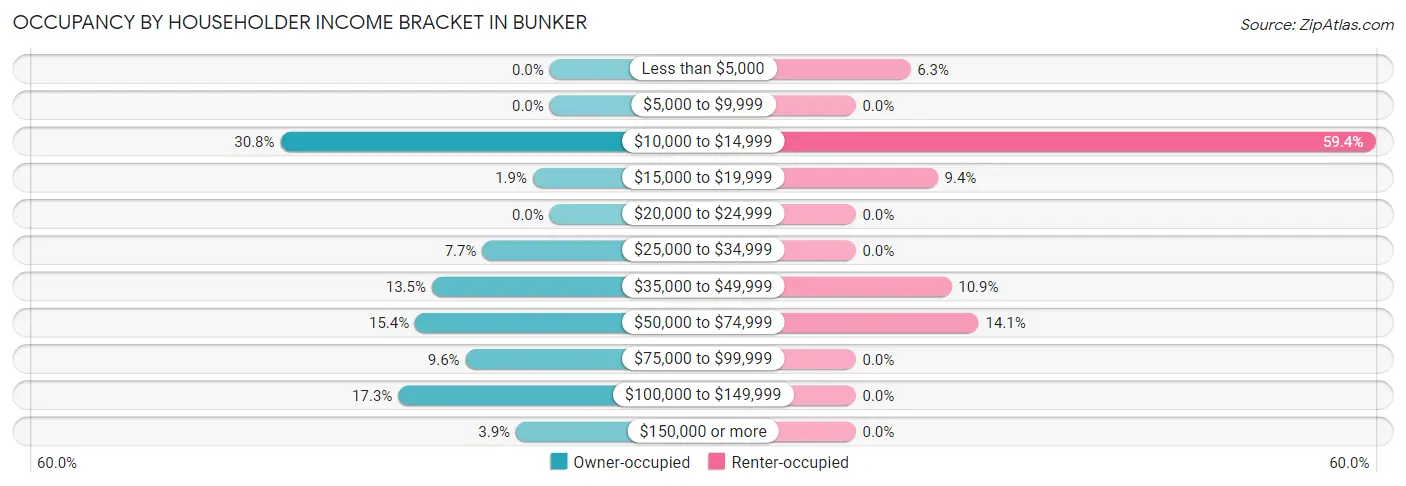
| Income Bracket | Owner-occupied | Renter-occupied |
| Less than $5,000 | 0 (0.0%) | 4 (6.2%) |
| $5,000 to $9,999 | 0 (0.0%) | 0 (0.0%) |
| $10,000 to $14,999 | 16 (30.8%) | 38 (59.4%) |
| $15,000 to $19,999 | 1 (1.9%) | 6 (9.4%) |
| $20,000 to $24,999 | 0 (0.0%) | 0 (0.0%) |
| $25,000 to $34,999 | 4 (7.7%) | 0 (0.0%) |
| $35,000 to $49,999 | 7 (13.5%) | 7 (10.9%) |
| $50,000 to $74,999 | 8 (15.4%) | 9 (14.1%) |
| $75,000 to $99,999 | 5 (9.6%) | 0 (0.0%) |
| $100,000 to $149,999 | 9 (17.3%) | 0 (0.0%) |
| $150,000 or more | 2 (3.8%) | 0 (0.0%) |
| Total | 52 (100.0%) | 64 (100.0%) |
Monthly Housing Cost Tiers in Bunker
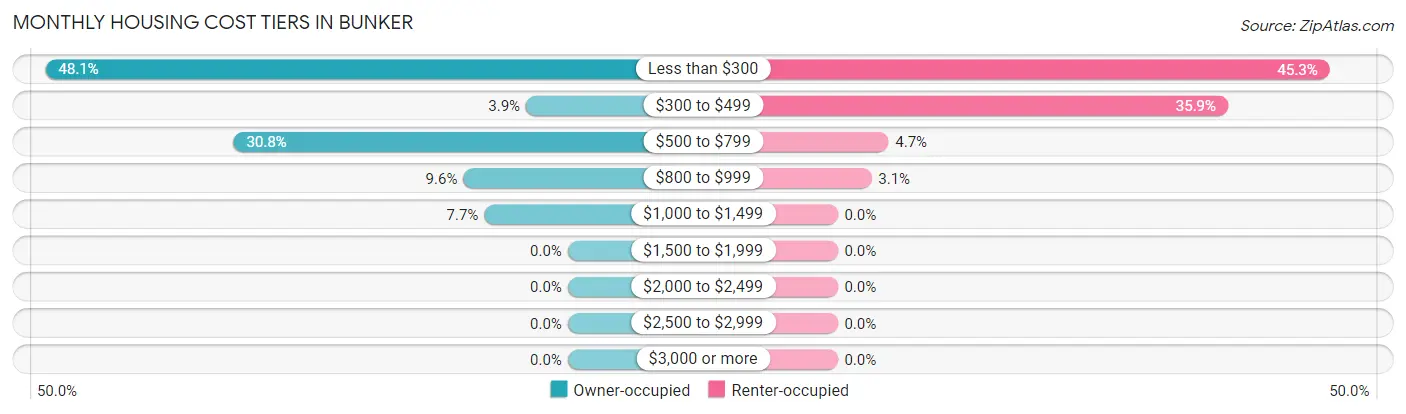
| Monthly Cost | Owner-occupied | Renter-occupied |
| Less than $300 | 25 (48.1%) | 29 (45.3%) |
| $300 to $499 | 2 (3.8%) | 23 (35.9%) |
| $500 to $799 | 16 (30.8%) | 3 (4.7%) |
| $800 to $999 | 5 (9.6%) | 2 (3.1%) |
| $1,000 to $1,499 | 4 (7.7%) | 0 (0.0%) |
| $1,500 to $1,999 | 0 (0.0%) | 0 (0.0%) |
| $2,000 to $2,499 | 0 (0.0%) | 0 (0.0%) |
| $2,500 to $2,999 | 0 (0.0%) | 0 (0.0%) |
| $3,000 or more | 0 (0.0%) | 0 (0.0%) |
| Total | 52 (100.0%) | 64 (100.0%) |
Physical Housing Characteristics in Bunker
Housing Structures in Bunker
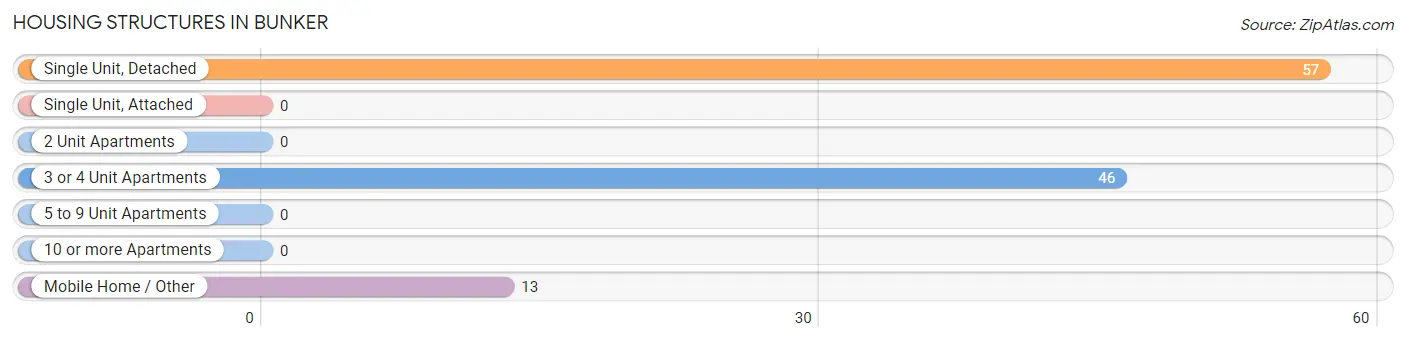
| Structure Type | # Housing Units | % Housing Units |
| Single Unit, Detached | 57 | 49.1% |
| Single Unit, Attached | 0 | 0.0% |
| 2 Unit Apartments | 0 | 0.0% |
| 3 or 4 Unit Apartments | 46 | 39.7% |
| 5 to 9 Unit Apartments | 0 | 0.0% |
| 10 or more Apartments | 0 | 0.0% |
| Mobile Home / Other | 13 | 11.2% |
| Total | 116 | 100.0% |
Housing Structures by Occupancy in Bunker
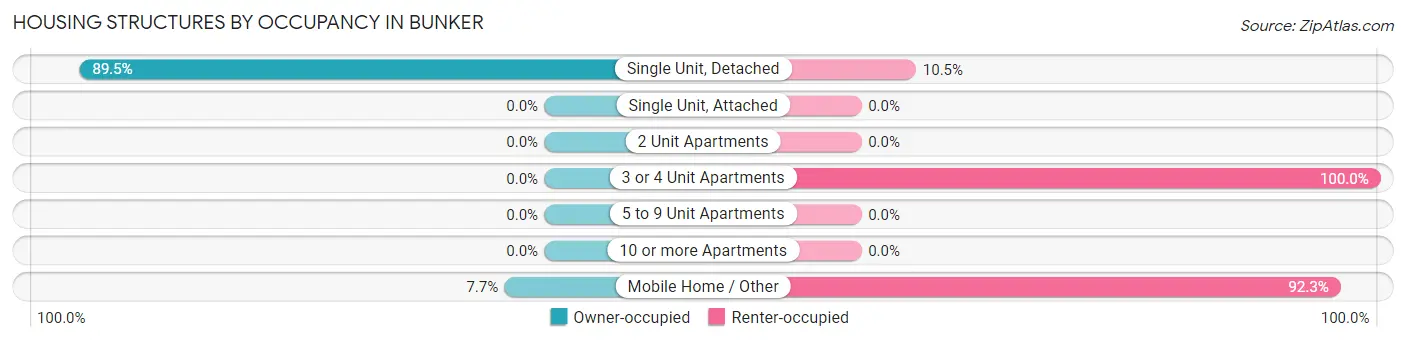
| Structure Type | Owner-occupied | Renter-occupied |
| Single Unit, Detached | 51 (89.5%) | 6 (10.5%) |
| Single Unit, Attached | 0 (0.0%) | 0 (0.0%) |
| 2 Unit Apartments | 0 (0.0%) | 0 (0.0%) |
| 3 or 4 Unit Apartments | 0 (0.0%) | 46 (100.0%) |
| 5 to 9 Unit Apartments | 0 (0.0%) | 0 (0.0%) |
| 10 or more Apartments | 0 (0.0%) | 0 (0.0%) |
| Mobile Home / Other | 1 (7.7%) | 12 (92.3%) |
| Total | 52 (44.8%) | 64 (55.2%) |
Housing Structures by Number of Rooms in Bunker
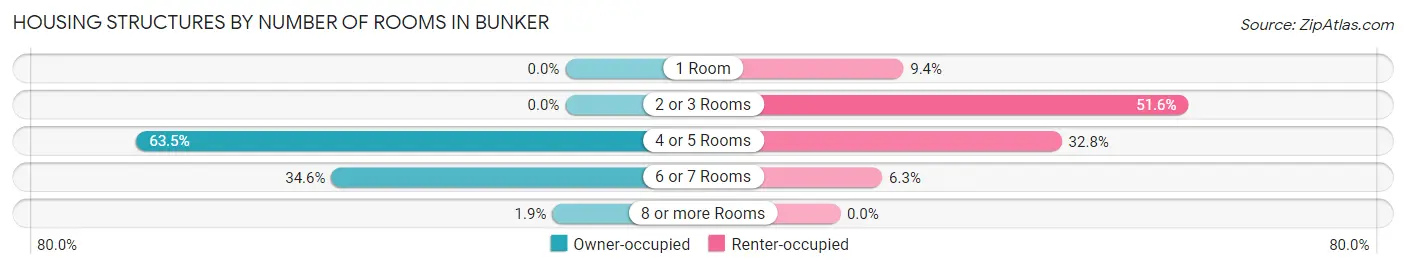
| Number of Rooms | Owner-occupied | Renter-occupied |
| 1 Room | 0 (0.0%) | 6 (9.4%) |
| 2 or 3 Rooms | 0 (0.0%) | 33 (51.6%) |
| 4 or 5 Rooms | 33 (63.5%) | 21 (32.8%) |
| 6 or 7 Rooms | 18 (34.6%) | 4 (6.2%) |
| 8 or more Rooms | 1 (1.9%) | 0 (0.0%) |
| Total | 52 (100.0%) | 64 (100.0%) |
Housing Structure by Heating Type in Bunker
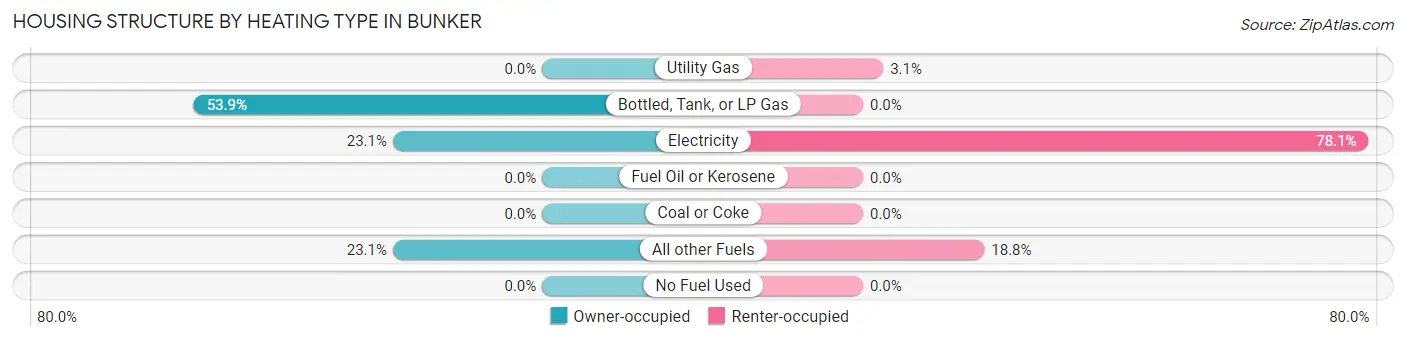
| Heating Type | Owner-occupied | Renter-occupied |
| Utility Gas | 0 (0.0%) | 2 (3.1%) |
| Bottled, Tank, or LP Gas | 28 (53.8%) | 0 (0.0%) |
| Electricity | 12 (23.1%) | 50 (78.1%) |
| Fuel Oil or Kerosene | 0 (0.0%) | 0 (0.0%) |
| Coal or Coke | 0 (0.0%) | 0 (0.0%) |
| All other Fuels | 12 (23.1%) | 12 (18.8%) |
| No Fuel Used | 0 (0.0%) | 0 (0.0%) |
| Total | 52 (100.0%) | 64 (100.0%) |
Household Vehicle Usage in Bunker
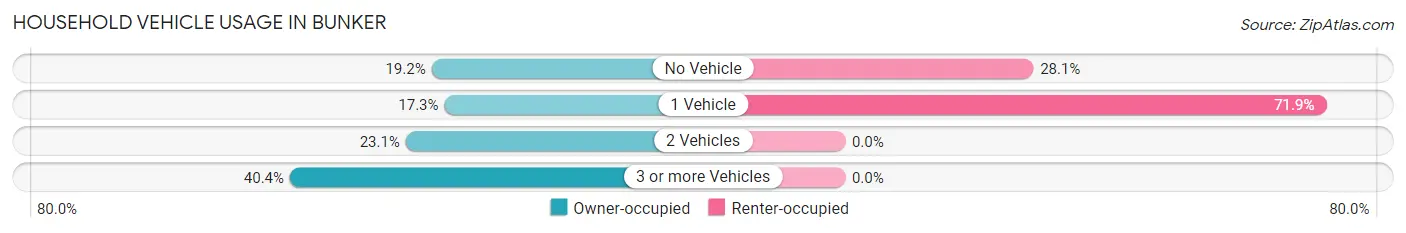
| Vehicles per Household | Owner-occupied | Renter-occupied |
| No Vehicle | 10 (19.2%) | 18 (28.1%) |
| 1 Vehicle | 9 (17.3%) | 46 (71.9%) |
| 2 Vehicles | 12 (23.1%) | 0 (0.0%) |
| 3 or more Vehicles | 21 (40.4%) | 0 (0.0%) |
| Total | 52 (100.0%) | 64 (100.0%) |
Real Estate & Mortgages in Bunker
Real Estate and Mortgage Overview in Bunker
| Characteristic | Without Mortgage | With Mortgage |
| Housing Units | 30 | 22 |
| Median Property Value | - | - |
| Median Household Income | $45,000 | $2 |
| Monthly Housing Costs | $233 | $0 |
| Real Estate Taxes | - | - |
Property Value by Mortgage Status in Bunker
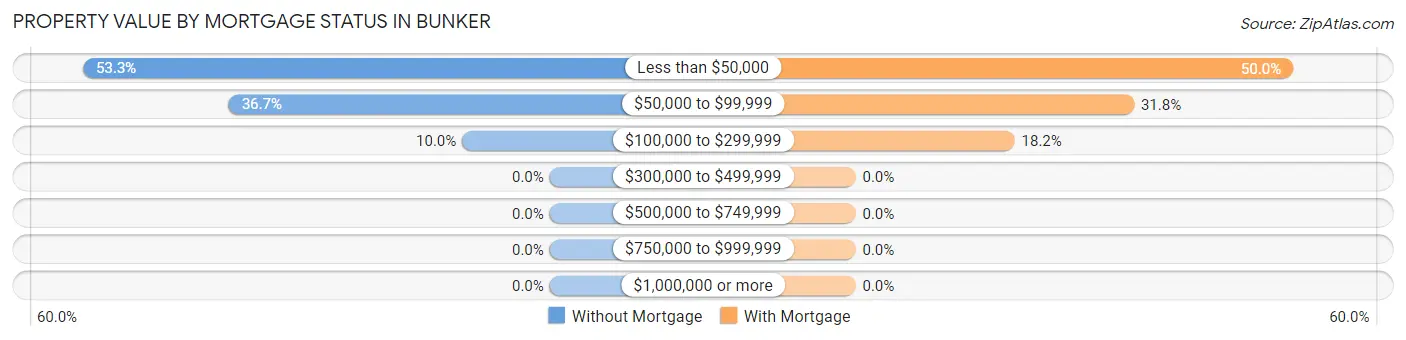
| Property Value | Without Mortgage | With Mortgage |
| Less than $50,000 | 16 (53.3%) | 11 (50.0%) |
| $50,000 to $99,999 | 11 (36.7%) | 7 (31.8%) |
| $100,000 to $299,999 | 3 (10.0%) | 4 (18.2%) |
| $300,000 to $499,999 | 0 (0.0%) | 0 (0.0%) |
| $500,000 to $749,999 | 0 (0.0%) | 0 (0.0%) |
| $750,000 to $999,999 | 0 (0.0%) | 0 (0.0%) |
| $1,000,000 or more | 0 (0.0%) | 0 (0.0%) |
| Total | 30 (100.0%) | 22 (100.0%) |
Household Income by Mortgage Status in Bunker
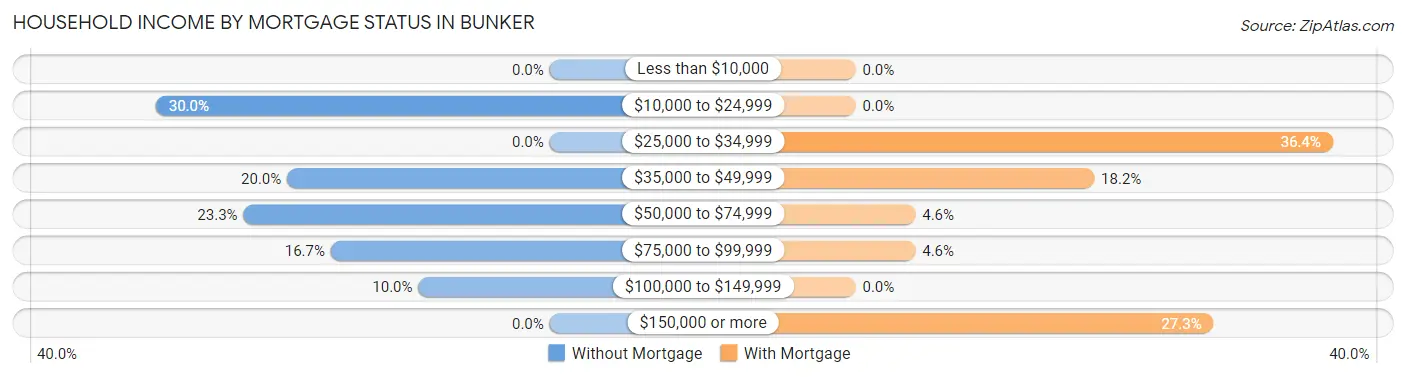
| Household Income | Without Mortgage | With Mortgage |
| Less than $10,000 | 0 (0.0%) | 0 (0.0%) |
| $10,000 to $24,999 | 9 (30.0%) | 0 (0.0%) |
| $25,000 to $34,999 | 0 (0.0%) | 8 (36.4%) |
| $35,000 to $49,999 | 6 (20.0%) | 4 (18.2%) |
| $50,000 to $74,999 | 7 (23.3%) | 1 (4.5%) |
| $75,000 to $99,999 | 5 (16.7%) | 1 (4.5%) |
| $100,000 to $149,999 | 3 (10.0%) | 0 (0.0%) |
| $150,000 or more | 0 (0.0%) | 6 (27.3%) |
| Total | 30 (100.0%) | 22 (100.0%) |
Property Value to Household Income Ratio in Bunker
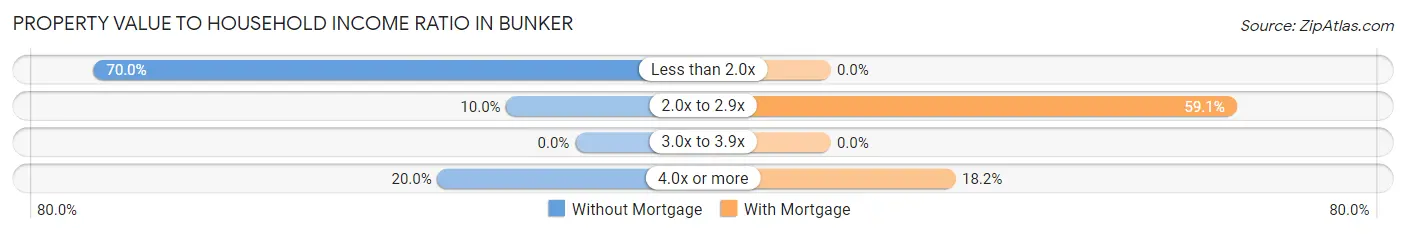
| Value-to-Income Ratio | Without Mortgage | With Mortgage |
| Less than 2.0x | 21 (70.0%) | 0 (0.0%) |
| 2.0x to 2.9x | 3 (10.0%) | 13 (59.1%) |
| 3.0x to 3.9x | 0 (0.0%) | 0 (0.0%) |
| 4.0x or more | 6 (20.0%) | 4 (18.2%) |
| Total | 30 (100.0%) | 22 (100.0%) |
Real Estate Taxes by Mortgage Status in Bunker
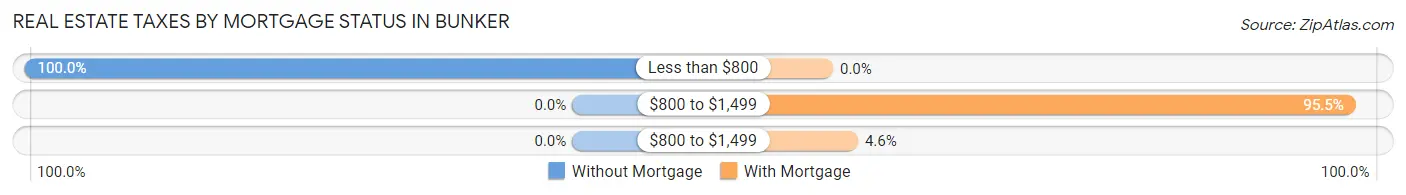
| Property Taxes | Without Mortgage | With Mortgage |
| Less than $800 | 30 (100.0%) | 0 (0.0%) |
| $800 to $1,499 | 0 (0.0%) | 21 (95.5%) |
| $800 to $1,499 | 0 (0.0%) | 1 (4.5%) |
| Total | 30 (100.0%) | 22 (100.0%) |
Health & Disability in Bunker
Health Insurance Coverage by Age in Bunker
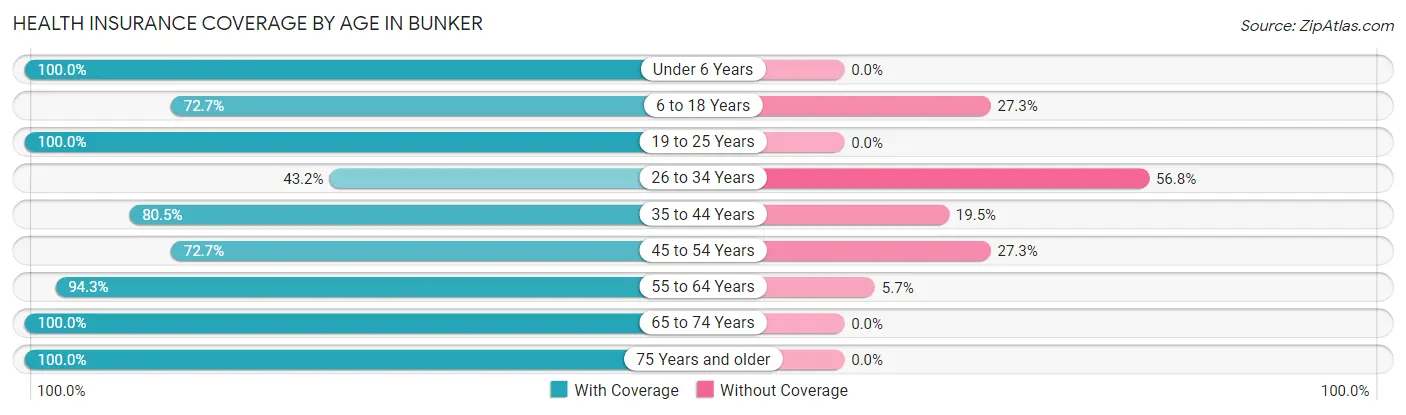
| Age Bracket | With Coverage | Without Coverage |
| Under 6 Years | 32 (100.0%) | 0 (0.0%) |
| 6 to 18 Years | 16 (72.7%) | 6 (27.3%) |
| 19 to 25 Years | 50 (100.0%) | 0 (0.0%) |
| 26 to 34 Years | 19 (43.2%) | 25 (56.8%) |
| 35 to 44 Years | 33 (80.5%) | 8 (19.5%) |
| 45 to 54 Years | 24 (72.7%) | 9 (27.3%) |
| 55 to 64 Years | 66 (94.3%) | 4 (5.7%) |
| 65 to 74 Years | 32 (100.0%) | 0 (0.0%) |
| 75 Years and older | 20 (100.0%) | 0 (0.0%) |
| Total | 292 (84.9%) | 52 (15.1%) |
Health Insurance Coverage by Citizenship Status in Bunker
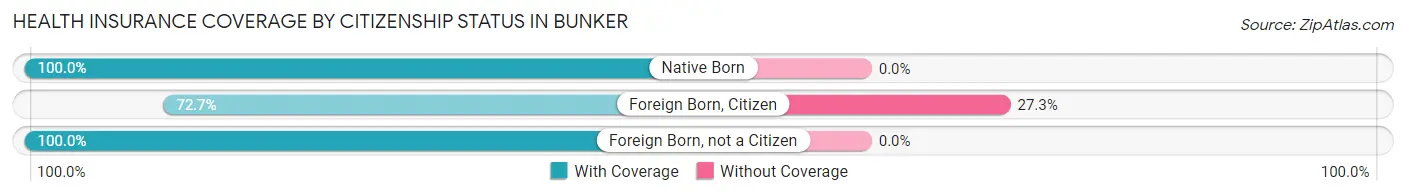
| Citizenship Status | With Coverage | Without Coverage |
| Native Born | 32 (100.0%) | 0 (0.0%) |
| Foreign Born, Citizen | 16 (72.7%) | 6 (27.3%) |
| Foreign Born, not a Citizen | 50 (100.0%) | 0 (0.0%) |
Health Insurance Coverage by Household Income in Bunker
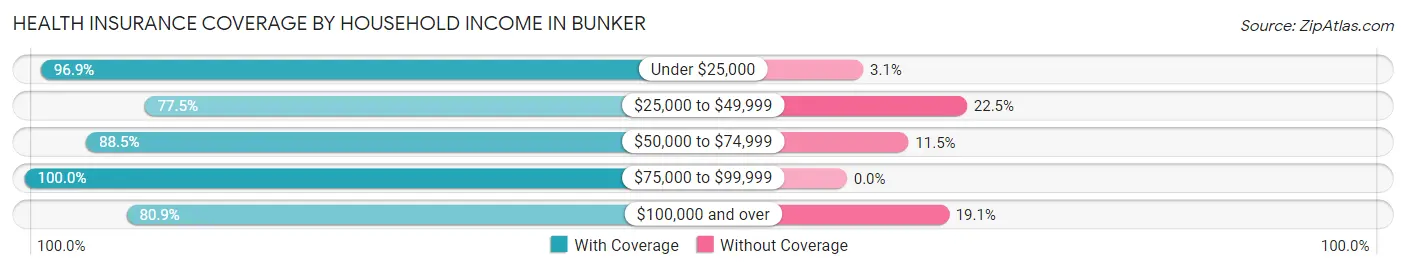
| Household Income | With Coverage | Without Coverage |
| Under $25,000 | 95 (96.9%) | 3 (3.1%) |
| $25,000 to $49,999 | 62 (77.5%) | 18 (22.5%) |
| $50,000 to $74,999 | 23 (88.5%) | 3 (11.5%) |
| $75,000 to $99,999 | 15 (100.0%) | 0 (0.0%) |
| $100,000 and over | 89 (80.9%) | 21 (19.1%) |
Public vs Private Health Insurance Coverage by Age in Bunker
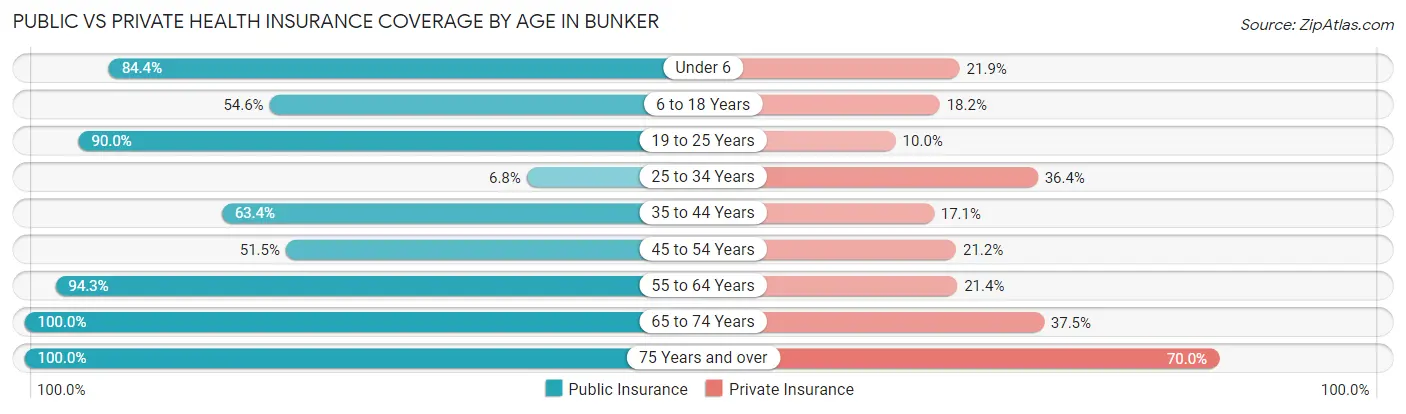
| Age Bracket | Public Insurance | Private Insurance |
| Under 6 | 27 (84.4%) | 7 (21.9%) |
| 6 to 18 Years | 12 (54.5%) | 4 (18.2%) |
| 19 to 25 Years | 45 (90.0%) | 5 (10.0%) |
| 25 to 34 Years | 3 (6.8%) | 16 (36.4%) |
| 35 to 44 Years | 26 (63.4%) | 7 (17.1%) |
| 45 to 54 Years | 17 (51.5%) | 7 (21.2%) |
| 55 to 64 Years | 66 (94.3%) | 15 (21.4%) |
| 65 to 74 Years | 32 (100.0%) | 12 (37.5%) |
| 75 Years and over | 20 (100.0%) | 14 (70.0%) |
| Total | 248 (72.1%) | 87 (25.3%) |
Disability Status by Sex by Age in Bunker
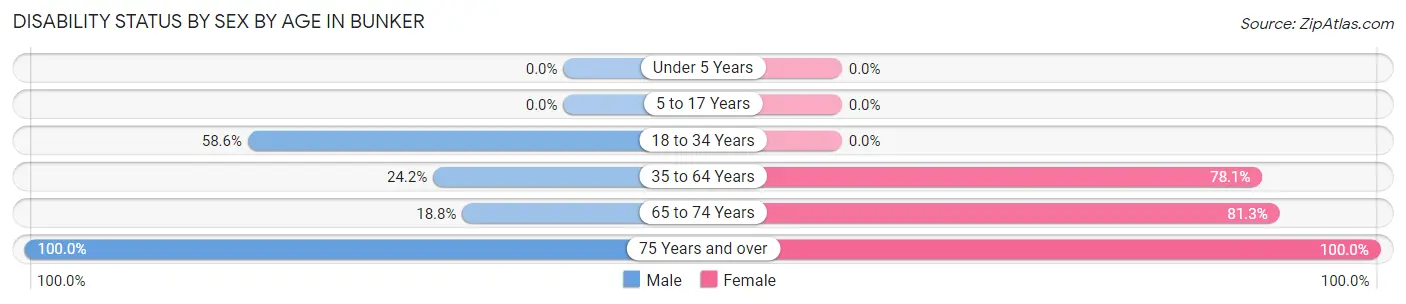
| Age Bracket | Male | Female |
| Under 5 Years | 0 (0.0%) | 0 (0.0%) |
| 5 to 17 Years | 0 (0.0%) | 0 (0.0%) |
| 18 to 34 Years | 41 (58.6%) | 0 (0.0%) |
| 35 to 64 Years | 15 (24.2%) | 64 (78.0%) |
| 65 to 74 Years | 3 (18.8%) | 13 (81.2%) |
| 75 Years and over | 8 (100.0%) | 12 (100.0%) |
Disability Class by Sex by Age in Bunker
Disability Class: Hearing Difficulty
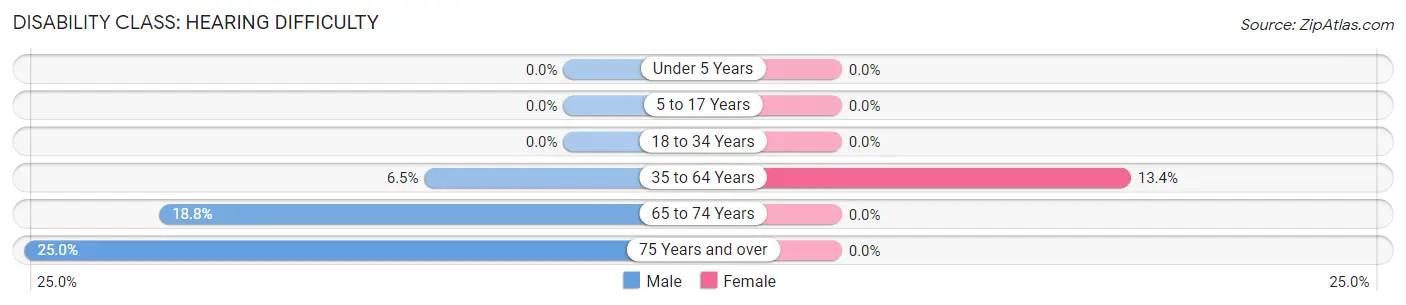
| Age Bracket | Male | Female |
| Under 5 Years | 0 (0.0%) | 0 (0.0%) |
| 5 to 17 Years | 0 (0.0%) | 0 (0.0%) |
| 18 to 34 Years | 0 (0.0%) | 0 (0.0%) |
| 35 to 64 Years | 4 (6.5%) | 11 (13.4%) |
| 65 to 74 Years | 3 (18.8%) | 0 (0.0%) |
| 75 Years and over | 2 (25.0%) | 0 (0.0%) |
Disability Class: Vision Difficulty
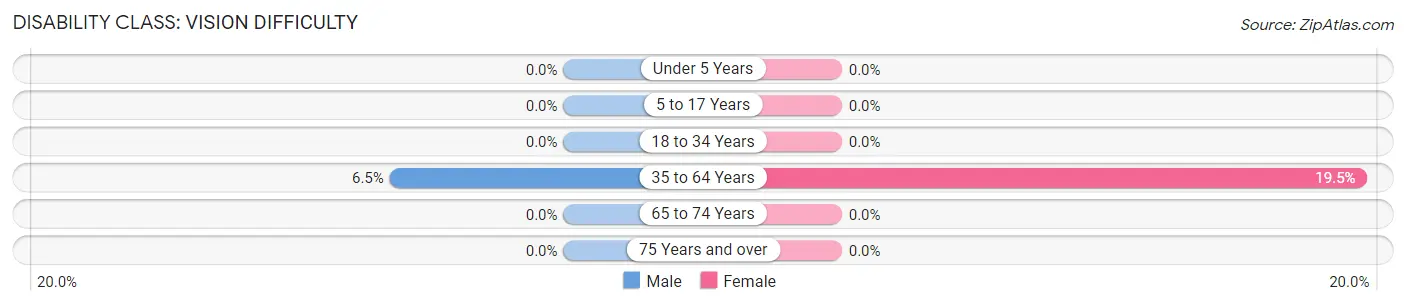
| Age Bracket | Male | Female |
| Under 5 Years | 0 (0.0%) | 0 (0.0%) |
| 5 to 17 Years | 0 (0.0%) | 0 (0.0%) |
| 18 to 34 Years | 0 (0.0%) | 0 (0.0%) |
| 35 to 64 Years | 4 (6.5%) | 16 (19.5%) |
| 65 to 74 Years | 0 (0.0%) | 0 (0.0%) |
| 75 Years and over | 0 (0.0%) | 0 (0.0%) |
Disability Class: Cognitive Difficulty
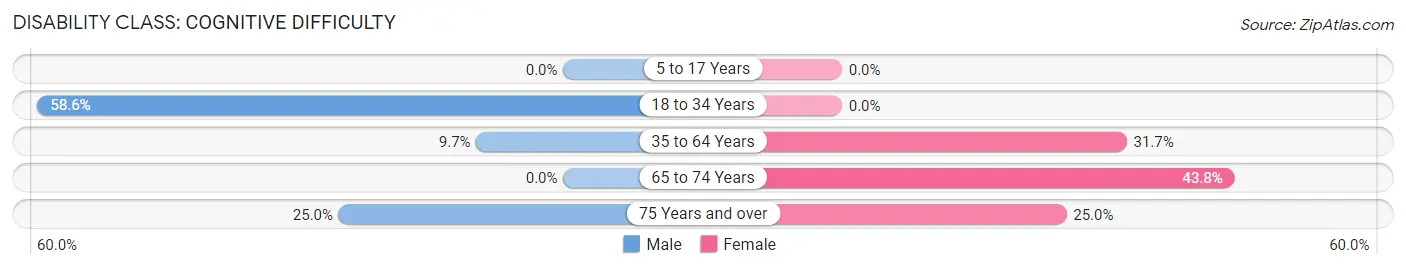
| Age Bracket | Male | Female |
| 5 to 17 Years | 0 (0.0%) | 0 (0.0%) |
| 18 to 34 Years | 41 (58.6%) | 0 (0.0%) |
| 35 to 64 Years | 6 (9.7%) | 26 (31.7%) |
| 65 to 74 Years | 0 (0.0%) | 7 (43.8%) |
| 75 Years and over | 2 (25.0%) | 3 (25.0%) |
Disability Class: Ambulatory Difficulty
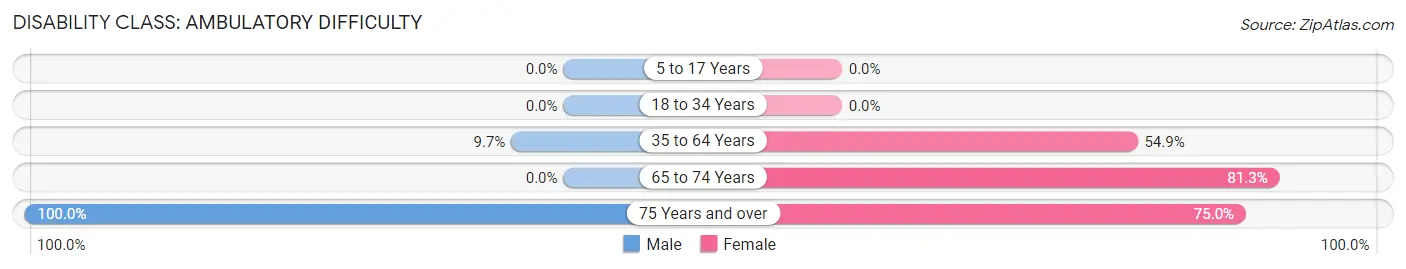
| Age Bracket | Male | Female |
| 5 to 17 Years | 0 (0.0%) | 0 (0.0%) |
| 18 to 34 Years | 0 (0.0%) | 0 (0.0%) |
| 35 to 64 Years | 6 (9.7%) | 45 (54.9%) |
| 65 to 74 Years | 0 (0.0%) | 13 (81.2%) |
| 75 Years and over | 8 (100.0%) | 9 (75.0%) |
Disability Class: Self-Care Difficulty
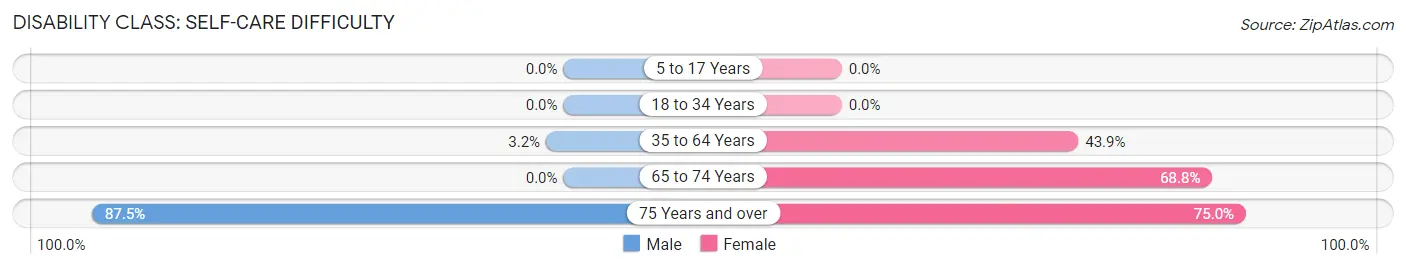
| Age Bracket | Male | Female |
| 5 to 17 Years | 0 (0.0%) | 0 (0.0%) |
| 18 to 34 Years | 0 (0.0%) | 0 (0.0%) |
| 35 to 64 Years | 2 (3.2%) | 36 (43.9%) |
| 65 to 74 Years | 0 (0.0%) | 11 (68.8%) |
| 75 Years and over | 7 (87.5%) | 9 (75.0%) |
Technology Access in Bunker
Computing Device Access in Bunker
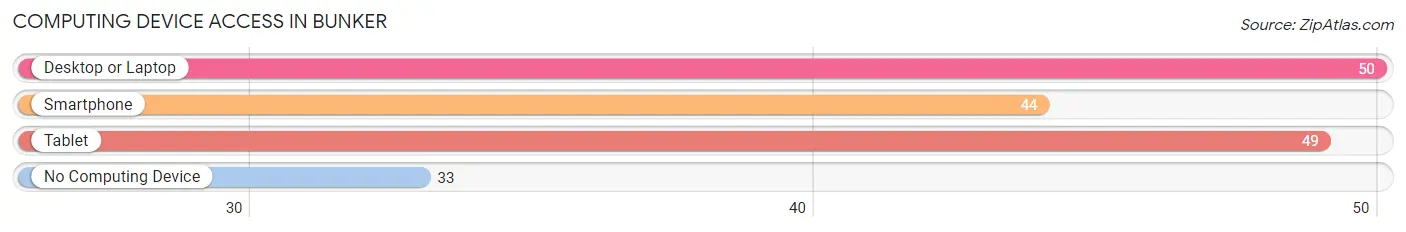
| Device Type | # Households | % Households |
| Desktop or Laptop | 50 | 43.1% |
| Smartphone | 44 | 37.9% |
| Tablet | 49 | 42.2% |
| No Computing Device | 33 | 28.4% |
| Total | 116 | 100.0% |
Internet Access in Bunker
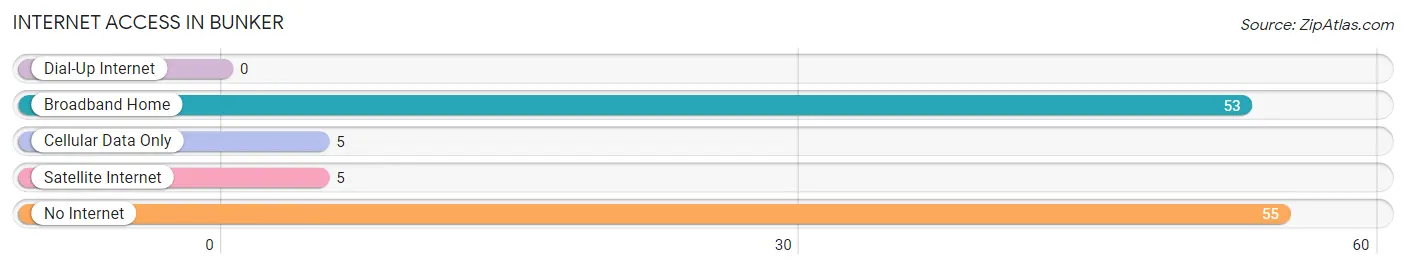
| Internet Type | # Households | % Households |
| Dial-Up Internet | 0 | 0.0% |
| Broadband Home | 53 | 45.7% |
| Cellular Data Only | 5 | 4.3% |
| Satellite Internet | 5 | 4.3% |
| No Internet | 55 | 47.4% |
| Total | 116 | 100.0% |
Bunker Summary
Bunker is a small town located in the Ozark Mountains of Missouri. It is situated in the southeastern corner of the state, near the Arkansas border. The town has a population of just over 500 people, and is part of the Ozark County. Bunker is a rural community, with a strong agricultural base.
Geography
Bunker is located in the Ozark Mountains of Missouri, in the southeastern corner of the state. The town is situated in the Ozark Plateau, which is characterized by rolling hills and valleys. The town is located in the Mark Twain National Forest, and is surrounded by forests and woodlands. The town is located near the Arkansas border, and is about an hour and a half drive from Springfield, Missouri.
The town is situated on the banks of the North Fork River, which is a tributary of the White River. The river is a popular destination for fishing, canoeing, and kayaking. The town is also located near several state parks, including the Ozark National Scenic Riverways, which is a popular destination for camping, hiking, and other outdoor activities.
Economy
Bunker is a rural community, with a strong agricultural base. The town is home to several farms, which produce a variety of crops, including corn, soybeans, wheat, and hay. The town is also home to several small businesses, including a grocery store, a hardware store, and a few restaurants.
The town is also home to a few manufacturing companies, which produce a variety of products, including furniture, clothing, and automotive parts. The town is also home to a few small service businesses, including a gas station, a post office, and a few auto repair shops.
Demographics
As of the 2010 census, Bunker had a population of 514 people. The town is predominantly white, with a small African American population. The median household income in the town is $30,000, and the median age is 44. The town has a high rate of poverty, with nearly 30% of the population living below the poverty line.
Conclusion
Bunker is a small town located in the Ozark Mountains of Missouri. It is a rural community, with a strong agricultural base. The town is home to several farms, small businesses, and manufacturing companies. The town has a population of just over 500 people, and is predominantly white, with a small African American population. The town has a high rate of poverty, with nearly 30% of the population living below the poverty line.
Common Questions
What is Per Capita Income in Bunker?
Per Capita income in Bunker is $18,461.
What is the Median Family Income in Bunker?
Median Family Income in Bunker is $33,750.
What is Income or Wage Gap in Bunker?
Income or Wage Gap in Bunker is 33.2%.
Women in Bunker earn 66.8 cents for every dollar earned by a man.
What is Inequality or Gini Index in Bunker?
Inequality or Gini Index in Bunker is 0.48.
What is the Total Population of Bunker?
Total Population of Bunker is 344.
What is the Total Male Population of Bunker?
Total Male Population of Bunker is 189.
What is the Total Female Population of Bunker?
Total Female Population of Bunker is 155.
What is the Ratio of Males per 100 Females in Bunker?
There are 121.94 Males per 100 Females in Bunker.
What is the Ratio of Females per 100 Males in Bunker?
There are 82.01 Females per 100 Males in Bunker.
What is the Median Population Age in Bunker?
Median Population Age in Bunker is 44.2 Years.
What is the Average Family Size in Bunker
Average Family Size in Bunker is 4.8 People.
What is the Average Household Size in Bunker
Average Household Size in Bunker is 2.8 People.
How Large is the Labor Force in Bunker?
There are 136 People in the Labor Forcein in Bunker.
What is the Percentage of People in the Labor Force in Bunker?
46.1% of People are in the Labor Force in Bunker.
What is the Unemployment Rate in Bunker?
Unemployment Rate in Bunker is 11.0%.