La Russell, MO Map & Demographics
La Russell Map
La Russell Overview
$15,260
PER CAPITA INCOME
$50,938
AVG FAMILY INCOME
$49,750
AVG HOUSEHOLD INCOME
0.32
INEQUALITY / GINI INDEX
149
TOTAL POPULATION
60
MALE POPULATION
89
FEMALE POPULATION
67.42
MALES / 100 FEMALES
148.33
FEMALES / 100 MALES
34.2
MEDIAN AGE
3.8
AVG FAMILY SIZE
3.6
AVG HOUSEHOLD SIZE
57
LABOR FORCE [ PEOPLE ]
52.3%
PERCENT IN LABOR FORCE
1.8%
UNEMPLOYMENT RATE
La Russell Zip Codes
La Russell Area Codes
Income in La Russell
Income Overview in La Russell
Per Capita Income in La Russell is $15,260, while median incomes of families and households are $50,938 and $49,750 respectively.
| Characteristic | Number | Measure |
| Per Capita Income | 149 | $15,260 |
| Median Family Income | 33 | $50,938 |
| Mean Family Income | 33 | $59,161 |
| Median Household Income | 41 | $49,750 |
| Mean Household Income | 41 | $55,371 |
| Income Deficit | 33 | $0 |
| Wage / Income Gap (%) | 149 | 0.00% |
| Wage / Income Gap ($) | 149 | 100.00¢ per $1 |
| Gini / Inequality Index | 149 | 0.32 |
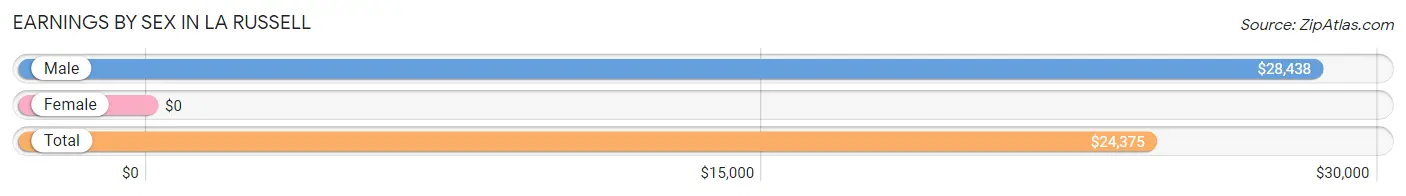
Earnings by Sex in La Russell
| Sex | Number | Average Earnings |
| Male | 33 (49.2%) | $28,438 |
| Female | 34 (50.7%) | $0 |
| Total | 67 (100.0%) | $24,375 |
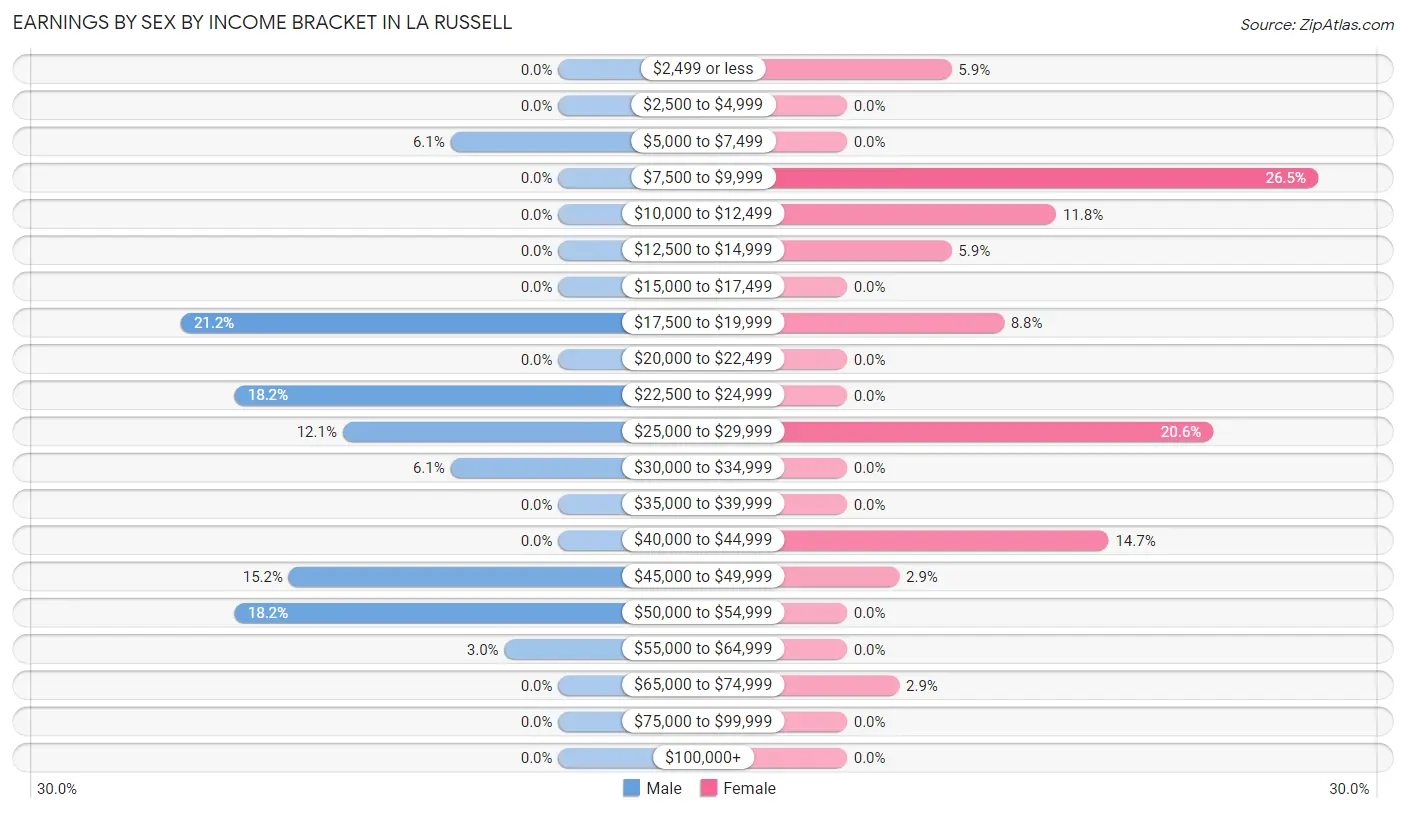
Earnings by Sex by Income Bracket in La Russell
The most common earnings brackets in La Russell are $17,500 to $19,999 for men (7 | 21.2%) and $7,500 to $9,999 for women (9 | 26.5%).
| Income | Male | Female |
| $2,499 or less | 0 (0.0%) | 2 (5.9%) |
| $2,500 to $4,999 | 0 (0.0%) | 0 (0.0%) |
| $5,000 to $7,499 | 2 (6.1%) | 0 (0.0%) |
| $7,500 to $9,999 | 0 (0.0%) | 9 (26.5%) |
| $10,000 to $12,499 | 0 (0.0%) | 4 (11.8%) |
| $12,500 to $14,999 | 0 (0.0%) | 2 (5.9%) |
| $15,000 to $17,499 | 0 (0.0%) | 0 (0.0%) |
| $17,500 to $19,999 | 7 (21.2%) | 3 (8.8%) |
| $20,000 to $22,499 | 0 (0.0%) | 0 (0.0%) |
| $22,500 to $24,999 | 6 (18.2%) | 0 (0.0%) |
| $25,000 to $29,999 | 4 (12.1%) | 7 (20.6%) |
| $30,000 to $34,999 | 2 (6.1%) | 0 (0.0%) |
| $35,000 to $39,999 | 0 (0.0%) | 0 (0.0%) |
| $40,000 to $44,999 | 0 (0.0%) | 5 (14.7%) |
| $45,000 to $49,999 | 5 (15.1%) | 1 (2.9%) |
| $50,000 to $54,999 | 6 (18.2%) | 0 (0.0%) |
| $55,000 to $64,999 | 1 (3.0%) | 0 (0.0%) |
| $65,000 to $74,999 | 0 (0.0%) | 1 (2.9%) |
| $75,000 to $99,999 | 0 (0.0%) | 0 (0.0%) |
| $100,000+ | 0 (0.0%) | 0 (0.0%) |
| Total | 33 (100.0%) | 34 (100.0%) |
Earnings by Sex by Educational Attainment in La Russell
| Educational Attainment | Male Income | Female Income |
| Less than High School | - | - |
| High School Diploma | - | - |
| College or Associate's Degree | - | - |
| Bachelor's Degree | - | - |
| Graduate Degree | - | - |
| Total | $41,250 | $25,250 |
Family Income in La Russell
Family Income Brackets in La Russell
According to the La Russell family income data, there are 7 families falling into the $25,000 to $34,999 income range, which is the most common income bracket and makes up 21.2% of all families.
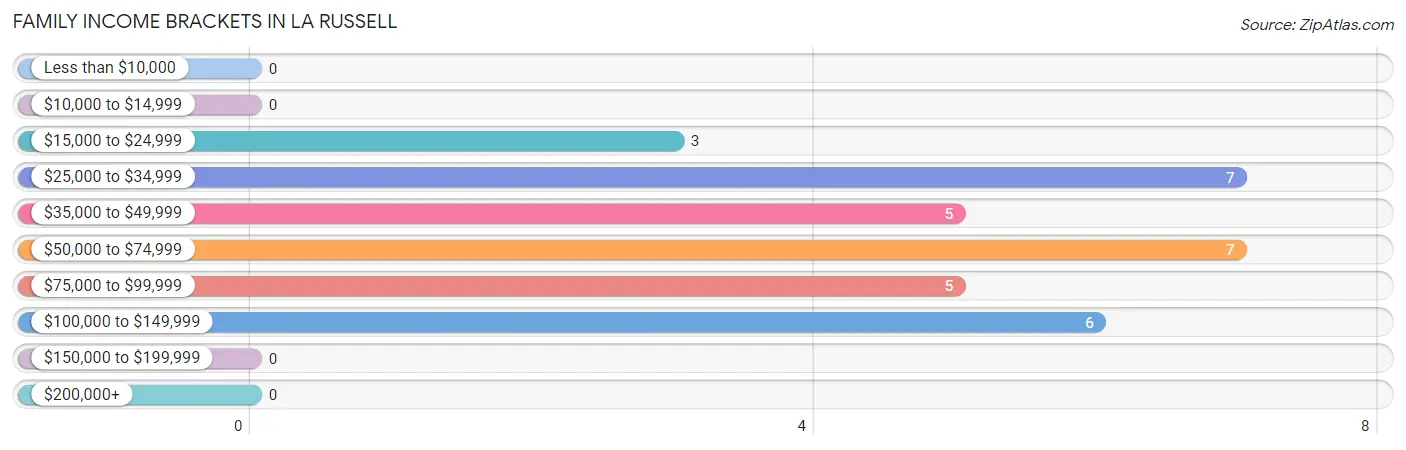
| Income Bracket | # Families | % Families |
| Less than $10,000 | 0 | 0.0% |
| $10,000 to $14,999 | 0 | 0.0% |
| $15,000 to $24,999 | 3 | 9.1% |
| $25,000 to $34,999 | 7 | 21.2% |
| $35,000 to $49,999 | 5 | 15.2% |
| $50,000 to $74,999 | 7 | 21.2% |
| $75,000 to $99,999 | 5 | 15.2% |
| $100,000 to $149,999 | 6 | 18.2% |
| $150,000 to $199,999 | 0 | 0.0% |
| $200,000+ | 0 | 0.0% |
Family Income by Famaliy Size in La Russell
4-person families (12 | 36.4%) account for the highest median family income in La Russell with $100,000 per family, while 4-person families (12 | 36.4%) have the highest median income of $25,000 per family member.
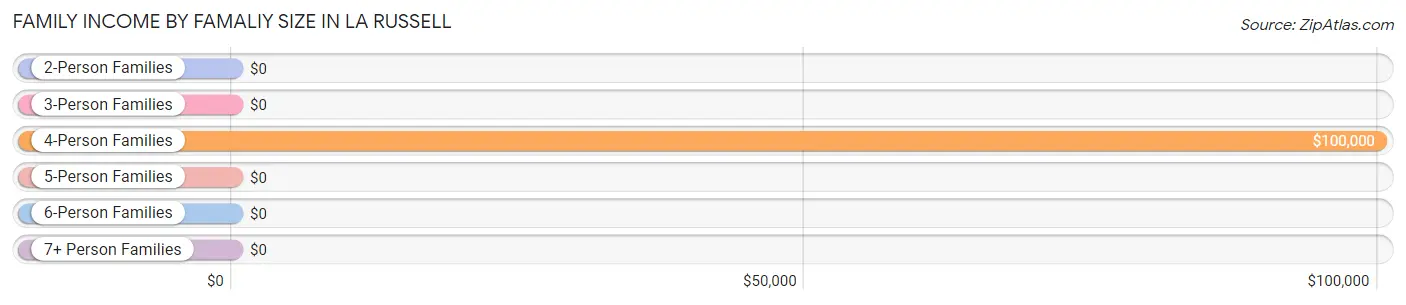
| Income Bracket | # Families | Median Income |
| 2-Person Families | 9 (27.3%) | $0 |
| 3-Person Families | 8 (24.2%) | $0 |
| 4-Person Families | 12 (36.4%) | $100,000 |
| 5-Person Families | 1 (3.0%) | $0 |
| 6-Person Families | 0 (0.0%) | $0 |
| 7+ Person Families | 3 (9.1%) | $0 |
| Total | 33 (100.0%) | $50,938 |
Family Income by Number of Earners in La Russell
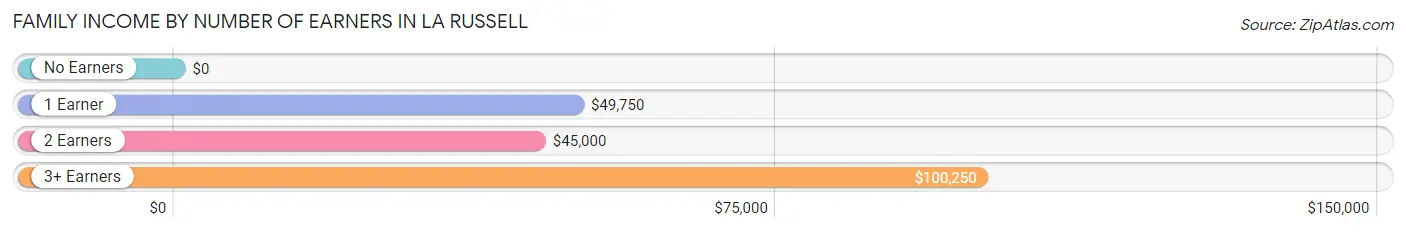
| Number of Earners | # Families | Median Income |
| No Earners | 5 (15.1%) | $0 |
| 1 Earner | 11 (33.3%) | $49,750 |
| 2 Earners | 8 (24.2%) | $45,000 |
| 3+ Earners | 9 (27.3%) | $100,250 |
| Total | 33 (100.0%) | $50,938 |
Household Income in La Russell
Household Income Brackets in La Russell
With 9 households falling in the category, the $25,000 to $34,999 income range is the most frequent in La Russell, accounting for 22.0% of all households.
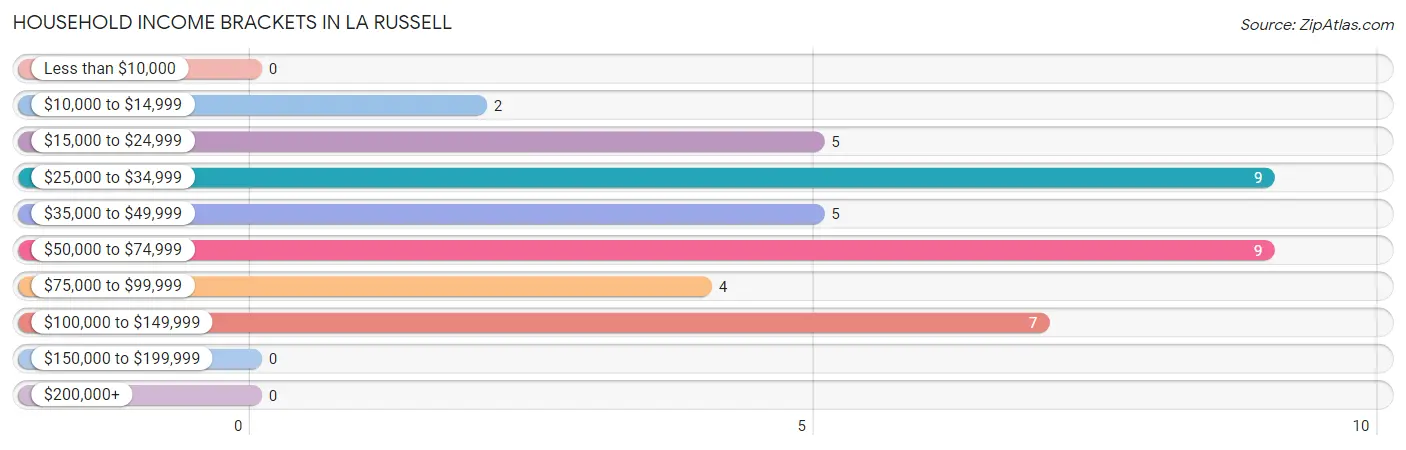
| Income Bracket | # Households | % Households |
| Less than $10,000 | 0 | 0.0% |
| $10,000 to $14,999 | 2 | 4.9% |
| $15,000 to $24,999 | 5 | 12.2% |
| $25,000 to $34,999 | 9 | 22.0% |
| $35,000 to $49,999 | 5 | 12.2% |
| $50,000 to $74,999 | 9 | 22.0% |
| $75,000 to $99,999 | 4 | 9.8% |
| $100,000 to $149,999 | 7 | 17.1% |
| $150,000 to $199,999 | 0 | 0.0% |
| $200,000+ | 0 | 0.0% |
Household Income by Householder Age in La Russell
The median household income in La Russell is $49,750, with the highest median household income of $61,563 found in the 25 to 44 years age bracket for the primary householder. A total of 23 households (56.1%) fall into this category. Meanwhile, the 15 to 24 years age bracket for the primary householder has the lowest median household income of $0, with 1 households (2.4%) in this group.
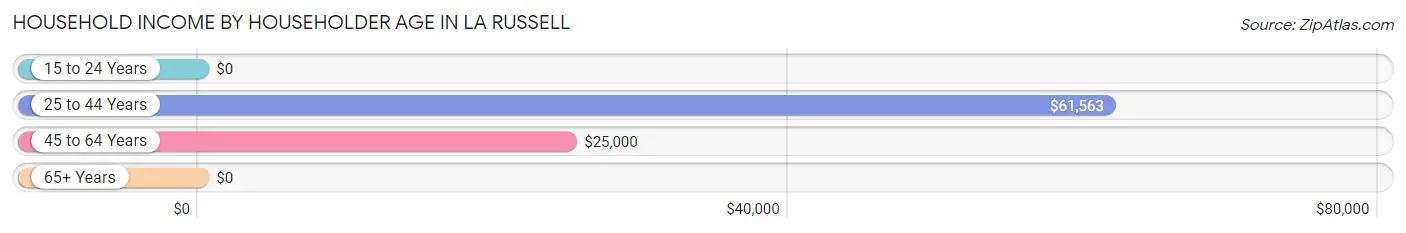
| Income Bracket | # Households | Median Income |
| 15 to 24 Years | 1 (2.4%) | $0 |
| 25 to 44 Years | 23 (56.1%) | $61,563 |
| 45 to 64 Years | 10 (24.4%) | $25,000 |
| 65+ Years | 7 (17.1%) | $0 |
| Total | 41 (100.0%) | $49,750 |
Poverty in La Russell
Income Below Poverty by Sex and Age in La Russell
With 20.0% poverty level for males and 14.0% for females among the residents of La Russell, 5 year old males and 65 to 74 year old females are the most vulnerable to poverty, with 1 males (100.0%) and 1 females (50.0%) in their respective age groups living below the poverty level.
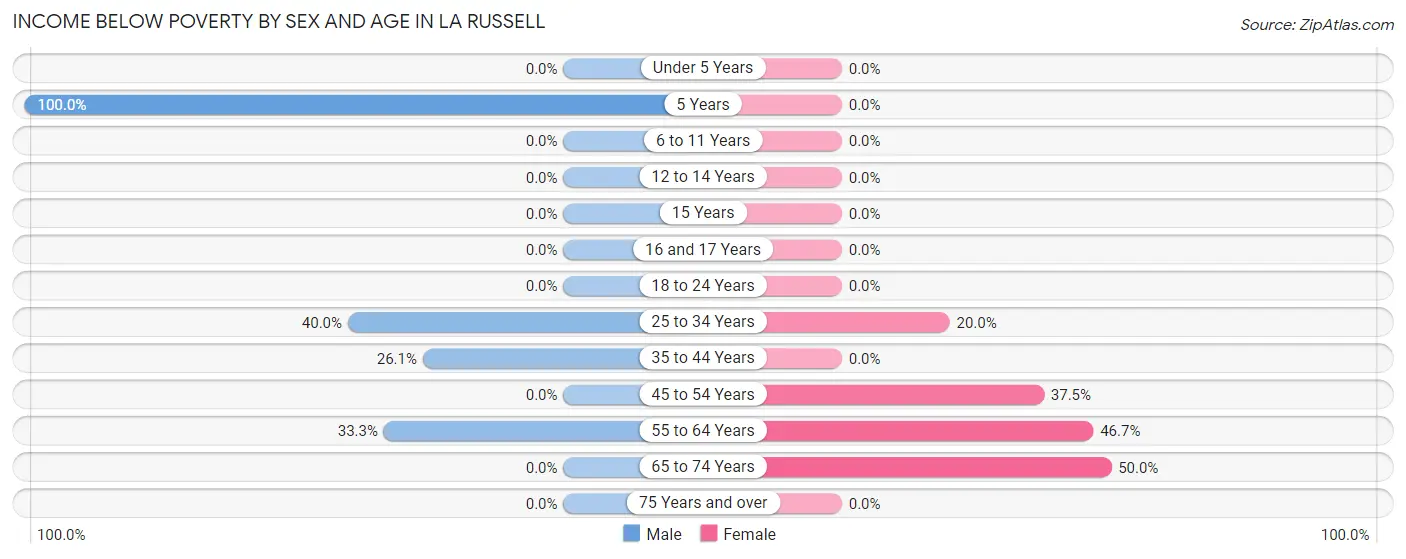
| Age Bracket | Male | Female |
| Under 5 Years | 0 (0.0%) | 0 (0.0%) |
| 5 Years | 1 (100.0%) | 0 (0.0%) |
| 6 to 11 Years | 0 (0.0%) | 0 (0.0%) |
| 12 to 14 Years | 0 (0.0%) | 0 (0.0%) |
| 15 Years | 0 (0.0%) | 0 (0.0%) |
| 16 and 17 Years | 0 (0.0%) | 0 (0.0%) |
| 18 to 24 Years | 0 (0.0%) | 0 (0.0%) |
| 25 to 34 Years | 2 (40.0%) | 1 (20.0%) |
| 35 to 44 Years | 6 (26.1%) | 0 (0.0%) |
| 45 to 54 Years | 0 (0.0%) | 3 (37.5%) |
| 55 to 64 Years | 3 (33.3%) | 7 (46.7%) |
| 65 to 74 Years | 0 (0.0%) | 1 (50.0%) |
| 75 Years and over | 0 (0.0%) | 0 (0.0%) |
| Total | 12 (20.0%) | 12 (14.0%) |
Income Above Poverty by Sex and Age in La Russell
According to the poverty statistics in La Russell, males aged 6 to 11 years and females aged under 5 years are the age groups that are most secure financially, with 100.0% of males and 100.0% of females in these age groups living above the poverty line.
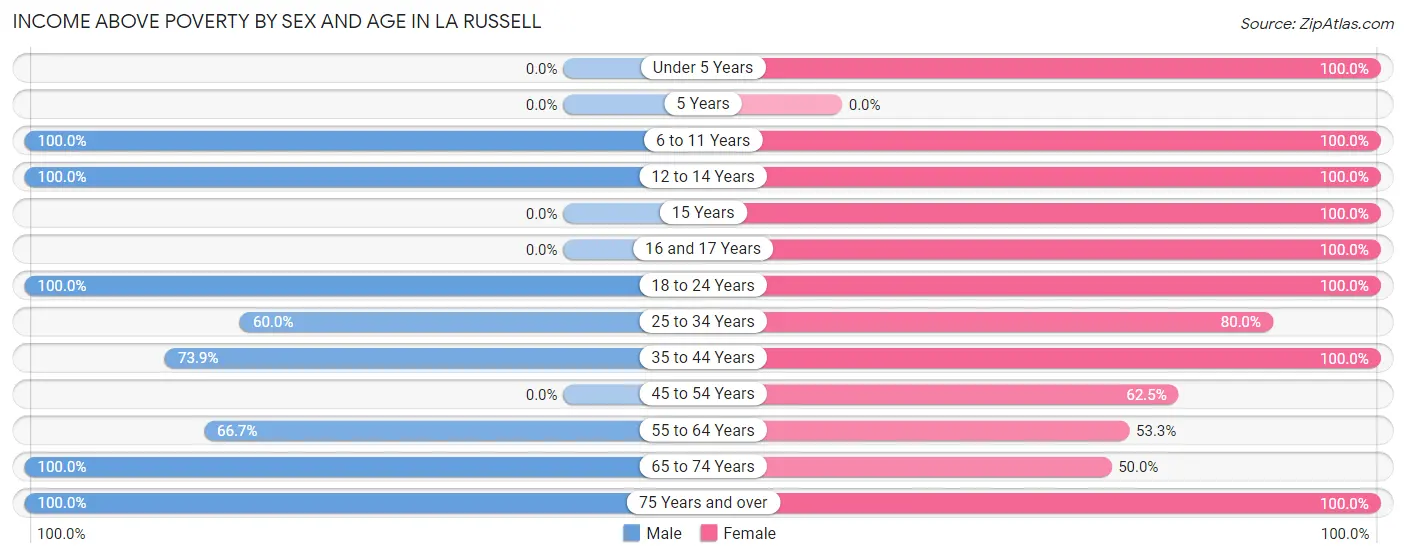
| Age Bracket | Male | Female |
| Under 5 Years | 0 (0.0%) | 4 (100.0%) |
| 5 Years | 0 (0.0%) | 0 (0.0%) |
| 6 to 11 Years | 9 (100.0%) | 7 (100.0%) |
| 12 to 14 Years | 1 (100.0%) | 9 (100.0%) |
| 15 Years | 0 (0.0%) | 6 (100.0%) |
| 16 and 17 Years | 0 (0.0%) | 6 (100.0%) |
| 18 to 24 Years | 9 (100.0%) | 12 (100.0%) |
| 25 to 34 Years | 3 (60.0%) | 4 (80.0%) |
| 35 to 44 Years | 17 (73.9%) | 10 (100.0%) |
| 45 to 54 Years | 0 (0.0%) | 5 (62.5%) |
| 55 to 64 Years | 6 (66.7%) | 8 (53.3%) |
| 65 to 74 Years | 1 (100.0%) | 1 (50.0%) |
| 75 Years and over | 2 (100.0%) | 2 (100.0%) |
| Total | 48 (80.0%) | 74 (86.1%) |
Income Below Poverty Among Married-Couple Families in La Russell
The poverty statistics for married-couple families in La Russell show that 13.0% or 3 of the total 23 families live below the poverty line. Families with no children have the highest poverty rate of 15.4%, comprising of 2 families. On the other hand, families with 5 or more children have the lowest poverty rate of 0.0%, which includes 0 families.
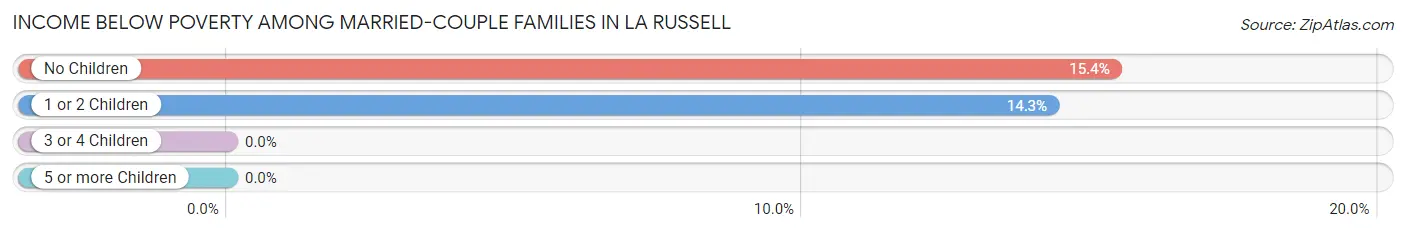
| Children | Above Poverty | Below Poverty |
| No Children | 11 (84.6%) | 2 (15.4%) |
| 1 or 2 Children | 6 (85.7%) | 1 (14.3%) |
| 3 or 4 Children | 0 (0.0%) | 0 (0.0%) |
| 5 or more Children | 3 (100.0%) | 0 (0.0%) |
| Total | 20 (87.0%) | 3 (13.0%) |
Income Below Poverty Among Single-Parent Households in La Russell
| Children | Single Father | Single Mother |
| No Children | 0 (0.0%) | 0 (0.0%) |
| 1 or 2 Children | 0 (0.0%) | 0 (0.0%) |
| 3 or 4 Children | 0 (0.0%) | 0 (0.0%) |
| 5 or more Children | 0 (0.0%) | 0 (0.0%) |
| Total | 0 (0.0%) | 0 (0.0%) |
Income Below Poverty Among Married-Couple vs Single-Parent Households in La Russell
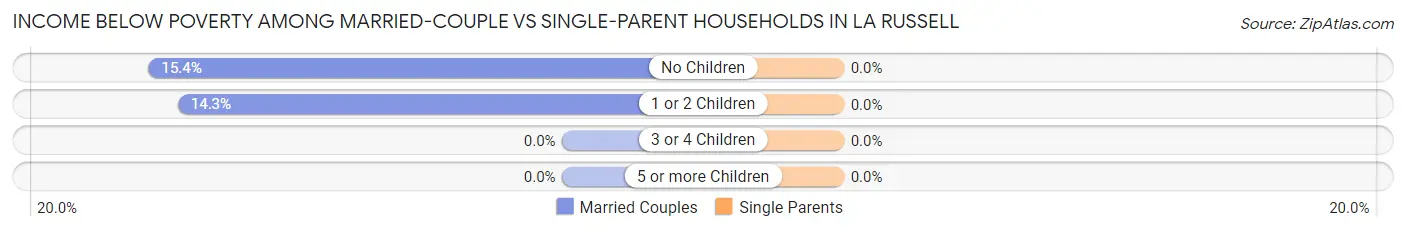
| Children | Married-Couple Families | Single-Parent Households |
| No Children | 2 (15.4%) | 0 (0.0%) |
| 1 or 2 Children | 1 (14.3%) | 0 (0.0%) |
| 3 or 4 Children | 0 (0.0%) | 0 (0.0%) |
| 5 or more Children | 0 (0.0%) | 0 (0.0%) |
| Total | 3 (13.0%) | 0 (0.0%) |
Race in La Russell
The most populous races in La Russell are , and White / Caucasian (149 | 100.0%).
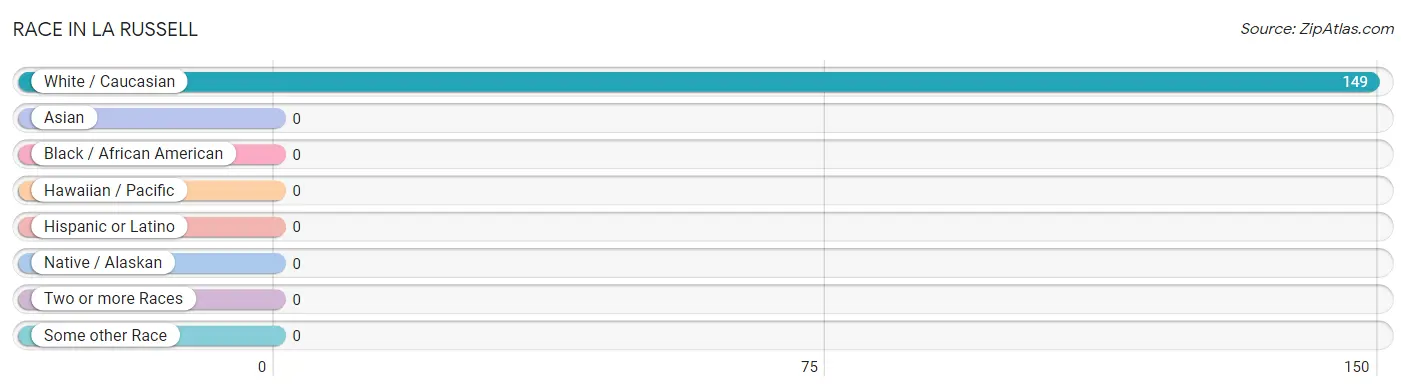
| Race | # Population | % Population |
| Asian | 0 | 0.0% |
| Black / African American | 0 | 0.0% |
| Hawaiian / Pacific | 0 | 0.0% |
| Hispanic or Latino | 0 | 0.0% |
| Native / Alaskan | 0 | 0.0% |
| White / Caucasian | 149 | 100.0% |
| Two or more Races | 0 | 0.0% |
| Some other Race | 0 | 0.0% |
| Total | 149 | 100.0% |
Ancestry in La Russell
The most populous ancestries reported in La Russell are Irish (27 | 18.1%), German (15 | 10.1%), American (14 | 9.4%), English (12 | 8.1%), and French (5 | 3.4%), together accounting for 49.0% of all La Russell residents.
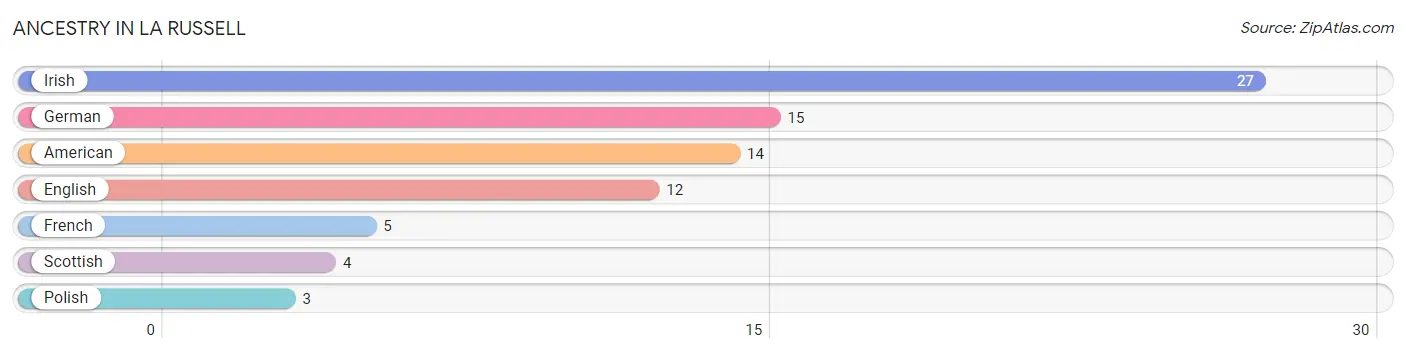
| Ancestry | # Population | % Population |
| American | 14 | 9.4% |
| English | 12 | 8.1% |
| French | 5 | 3.4% |
| German | 15 | 10.1% |
| Irish | 27 | 18.1% |
| Polish | 3 | 2.0% |
| Scottish | 4 | 2.7% | View All 7 Rows |
Immigrants in La Russell

| Immigration Origin | # Population | % Population | View All 0 Rows |
Sex and Age in La Russell
Sex and Age in La Russell
The most populous age groups in La Russell are 35 to 39 Years (12 | 20.0%) for men and 15 to 19 Years (23 | 25.8%) for women.
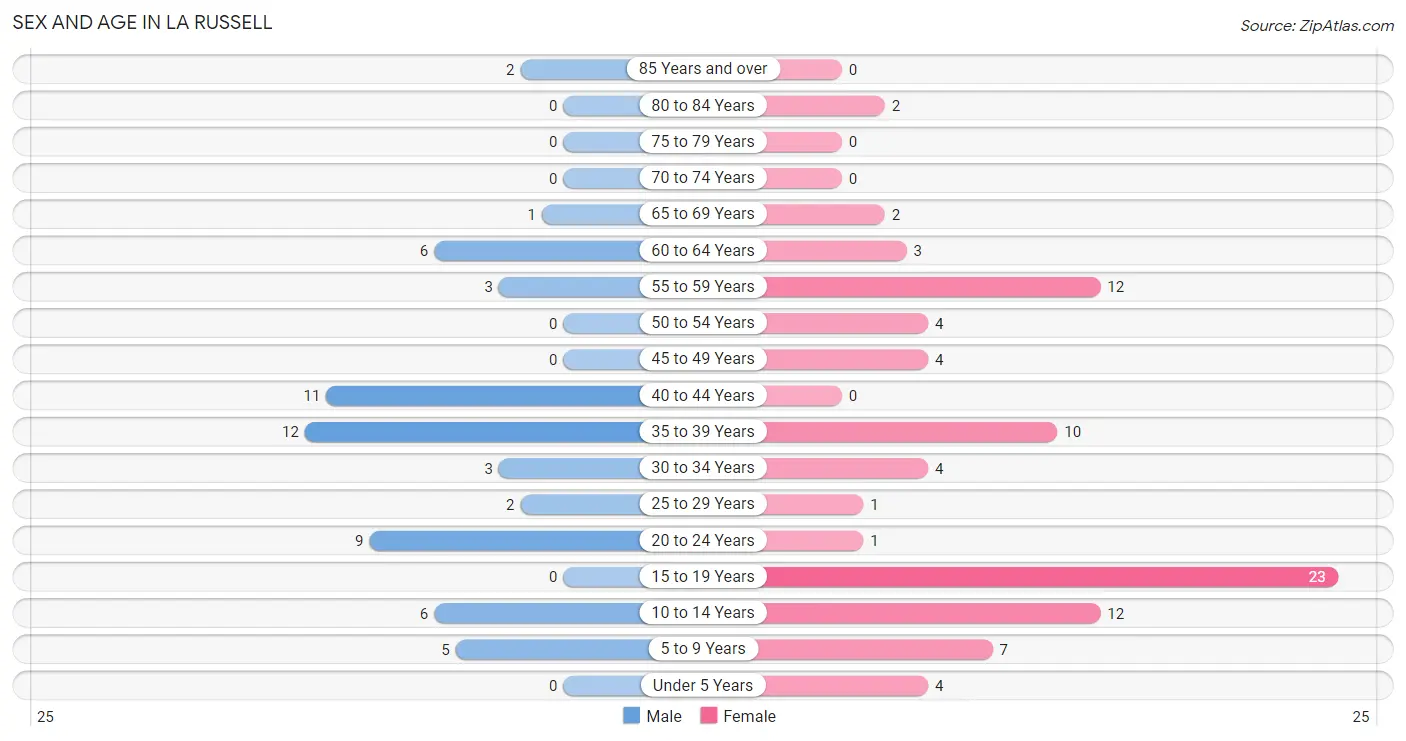
| Age Bracket | Male | Female |
| Under 5 Years | 0 (0.0%) | 4 (4.5%) |
| 5 to 9 Years | 5 (8.3%) | 7 (7.9%) |
| 10 to 14 Years | 6 (10.0%) | 12 (13.5%) |
| 15 to 19 Years | 0 (0.0%) | 23 (25.8%) |
| 20 to 24 Years | 9 (15.0%) | 1 (1.1%) |
| 25 to 29 Years | 2 (3.3%) | 1 (1.1%) |
| 30 to 34 Years | 3 (5.0%) | 4 (4.5%) |
| 35 to 39 Years | 12 (20.0%) | 10 (11.2%) |
| 40 to 44 Years | 11 (18.3%) | 0 (0.0%) |
| 45 to 49 Years | 0 (0.0%) | 4 (4.5%) |
| 50 to 54 Years | 0 (0.0%) | 4 (4.5%) |
| 55 to 59 Years | 3 (5.0%) | 12 (13.5%) |
| 60 to 64 Years | 6 (10.0%) | 3 (3.4%) |
| 65 to 69 Years | 1 (1.7%) | 2 (2.2%) |
| 70 to 74 Years | 0 (0.0%) | 0 (0.0%) |
| 75 to 79 Years | 0 (0.0%) | 0 (0.0%) |
| 80 to 84 Years | 0 (0.0%) | 2 (2.2%) |
| 85 Years and over | 2 (3.3%) | 0 (0.0%) |
| Total | 60 (100.0%) | 89 (100.0%) |
Families and Households in La Russell
Median Family Size in La Russell
The median family size in La Russell is 3.79 persons per family, with single female/mother families (5 | 15.1%) accounting for the largest median family size of 4.2 persons per family. On the other hand, single male/father families (5 | 15.1%) represent the smallest median family size with 3.00 persons per family.
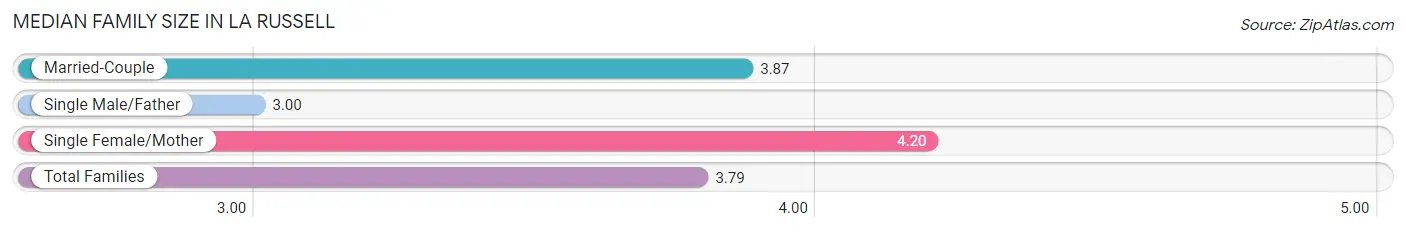
| Family Type | # Families | Family Size |
| Married-Couple | 23 (69.7%) | 3.87 |
| Single Male/Father | 5 (15.1%) | 3.00 |
| Single Female/Mother | 5 (15.1%) | 4.20 |
| Total Families | 33 (100.0%) | 3.79 |
Median Household Size in La Russell
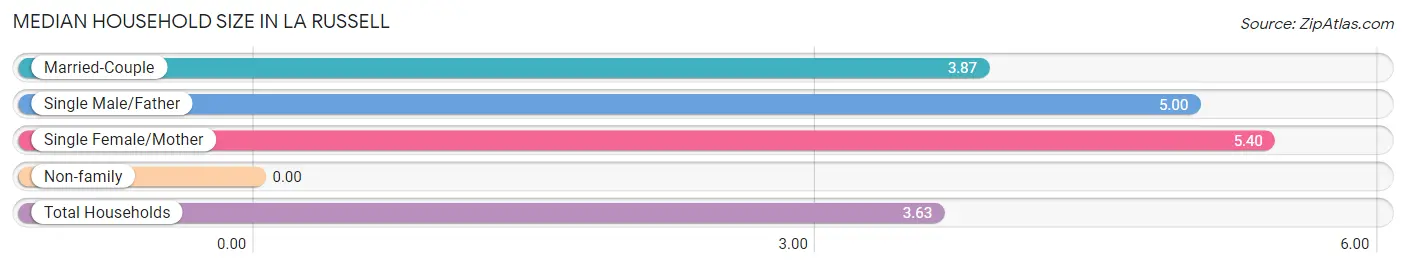
| Household Type | # Households | Household Size |
| Married-Couple | 23 (56.1%) | 3.87 |
| Single Male/Father | 5 (12.2%) | 5.00 |
| Single Female/Mother | 5 (12.2%) | 5.40 |
| Non-family | 8 (19.5%) | - |
| Total Households | 41 (100.0%) | 3.63 |
Household Size by Marriage Status in La Russell
Out of a total of 41 households in La Russell, 33 (80.5%) are family households, while 8 (19.5%) are nonfamily households. The most numerous type of family households are 5-person households, comprising 10, and the most common type of nonfamily households are 1-person households, comprising 8.
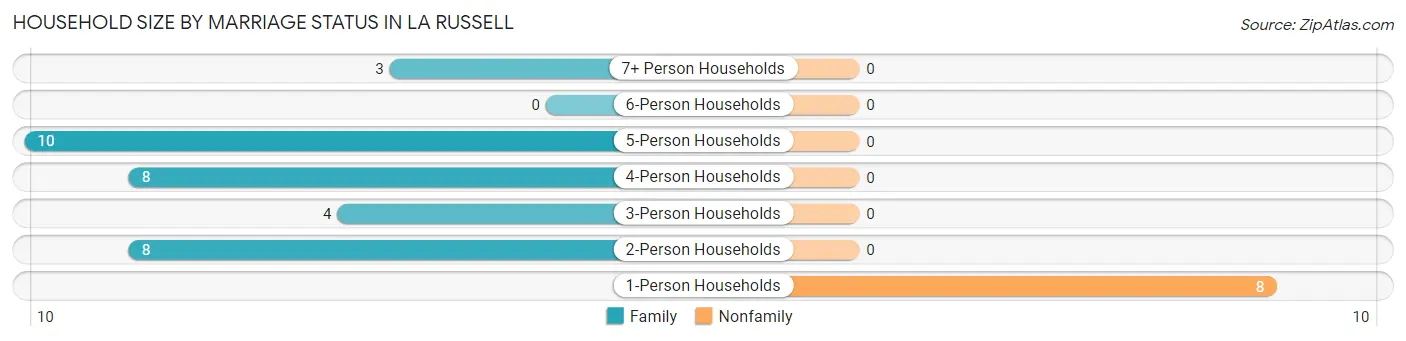
| Household Size | Family Households | Nonfamily Households |
| 1-Person Households | - | 8 (19.5%) |
| 2-Person Households | 8 (19.5%) | 0 (0.0%) |
| 3-Person Households | 4 (9.8%) | 0 (0.0%) |
| 4-Person Households | 8 (19.5%) | 0 (0.0%) |
| 5-Person Households | 10 (24.4%) | 0 (0.0%) |
| 6-Person Households | 0 (0.0%) | 0 (0.0%) |
| 7+ Person Households | 3 (7.3%) | 0 (0.0%) |
| Total | 33 (80.5%) | 8 (19.5%) |
Female Fertility in La Russell
Fertility by Age in La Russell
| Age Bracket | Women with Births | Births / 1,000 Women |
| 15 to 19 years | 0 (0.0%) | 0.0 |
| 20 to 34 years | 0 (0.0%) | 0.0 |
| 35 to 50 years | 0 (0.0%) | 0.0 |
| Total | 0 (0.0%) | 0.0 |
Fertility by Age by Marriage Status in La Russell
| Age Bracket | Married | Unmarried |
| 15 to 19 years | 0 (0.0%) | 0 (0.0%) |
| 20 to 34 years | 0 (0.0%) | 0 (0.0%) |
| 35 to 50 years | 0 (0.0%) | 0 (0.0%) |
| Total | 0 (0.0%) | 0 (0.0%) |
Fertility by Education in La Russell
| Educational Attainment | Women with Births | Births / 1,000 Women |
| Less than High School | 0 (0.0%) | 0.0 |
| High School Diploma | 0 (0.0%) | 0.0 |
| College or Associate's Degree | 0 (0.0%) | 0.0 |
| Bachelor's Degree | 0 (0.0%) | 0.0 |
| Graduate Degree | 0 (0.0%) | 0.0 |
| Total | 0 (0.0%) | 0.0 |
Fertility by Education by Marriage Status in La Russell
| Educational Attainment | Married | Unmarried |
| Less than High School | 0 (0.0%) | 0 (0.0%) |
| High School Diploma | 0 (0.0%) | 0 (0.0%) |
| College or Associate's Degree | 0 (0.0%) | 0 (0.0%) |
| Bachelor's Degree | 0 (0.0%) | 0 (0.0%) |
| Graduate Degree | 0 (0.0%) | 0 (0.0%) |
| Total | 0 (0.0%) | 0 (0.0%) |
Employment Characteristics in La Russell
Employment by Class of Employer in La Russell
Among the 56 employed individuals in La Russell, private company employees (37 | 66.1%), self-employed (not incorporated) (10 | 17.9%), and local government employees (5 | 8.9%) make up the most common classes of employment.
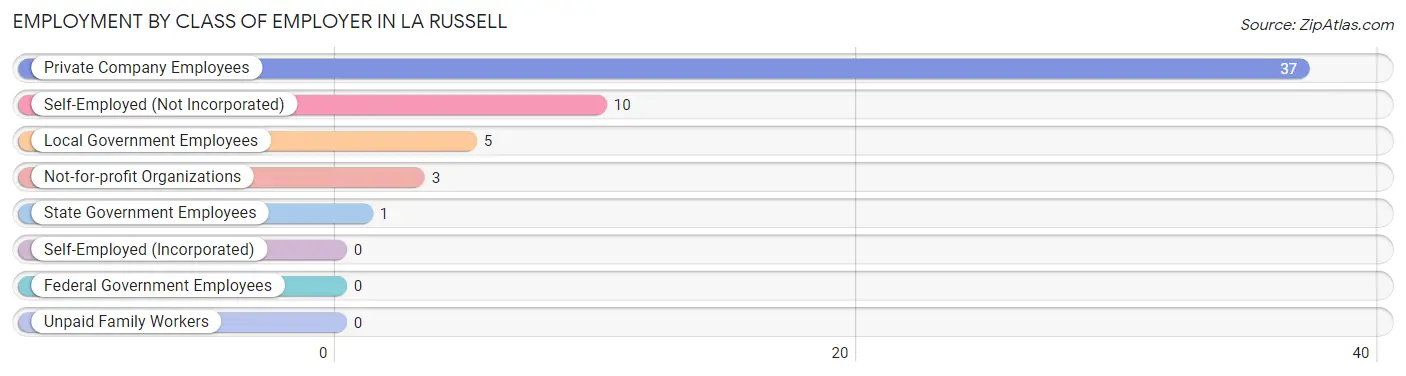
| Employer Class | # Employees | % Employees |
| Private Company Employees | 37 | 66.1% |
| Self-Employed (Incorporated) | 0 | 0.0% |
| Self-Employed (Not Incorporated) | 10 | 17.9% |
| Not-for-profit Organizations | 3 | 5.4% |
| Local Government Employees | 5 | 8.9% |
| State Government Employees | 1 | 1.8% |
| Federal Government Employees | 0 | 0.0% |
| Unpaid Family Workers | 0 | 0.0% |
| Total | 56 | 100.0% |
Employment Status by Age in La Russell
According to the labor force statistics for La Russell, out of the total population over 16 years of age (109), 52.3% or 57 individuals are in the labor force, with 1.8% or 1 of them unemployed. The age group with the highest labor force participation rate is 20 to 24 years, with 100.0% or 10 individuals in the labor force. Within the labor force, the 65 to 74 years age range has the highest percentage of unemployed individuals, with 100.0% or 1 of them being unemployed.
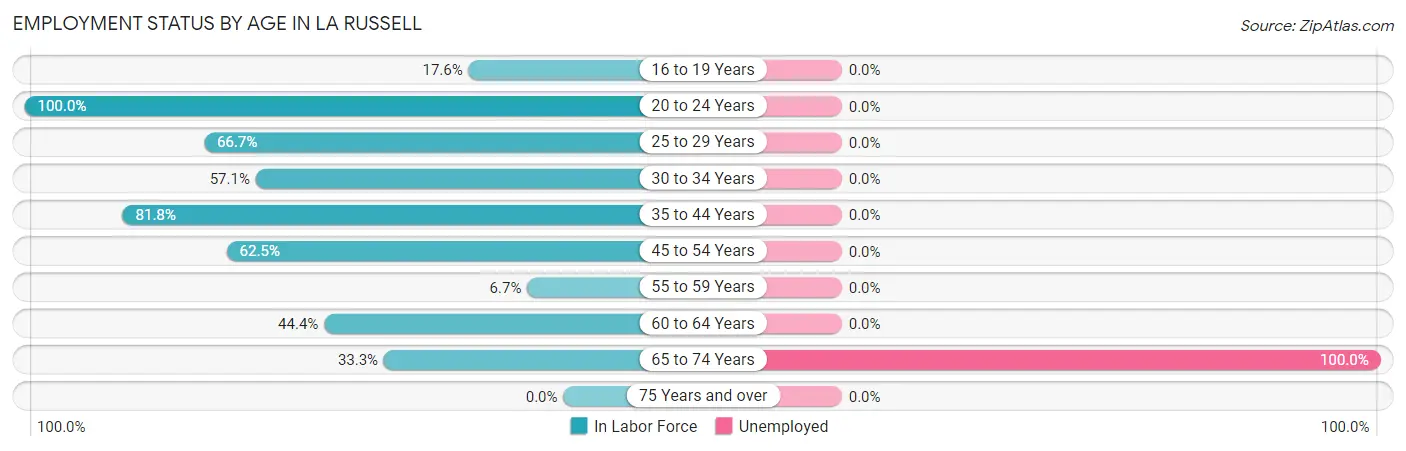
| Age Bracket | In Labor Force | Unemployed |
| 16 to 19 Years | 3 (17.6%) | 0 (0.0%) |
| 20 to 24 Years | 10 (100.0%) | 0 (0.0%) |
| 25 to 29 Years | 2 (66.7%) | 0 (0.0%) |
| 30 to 34 Years | 4 (57.1%) | 0 (0.0%) |
| 35 to 44 Years | 27 (81.8%) | 0 (0.0%) |
| 45 to 54 Years | 5 (62.5%) | 0 (0.0%) |
| 55 to 59 Years | 1 (6.7%) | 0 (0.0%) |
| 60 to 64 Years | 4 (44.4%) | 0 (0.0%) |
| 65 to 74 Years | 1 (33.3%) | 1 (100.0%) |
| 75 Years and over | 0 (0.0%) | 0 (0.0%) |
| Total | 57 (52.3%) | 1 (1.8%) |
Employment Status by Educational Attainment in La Russell
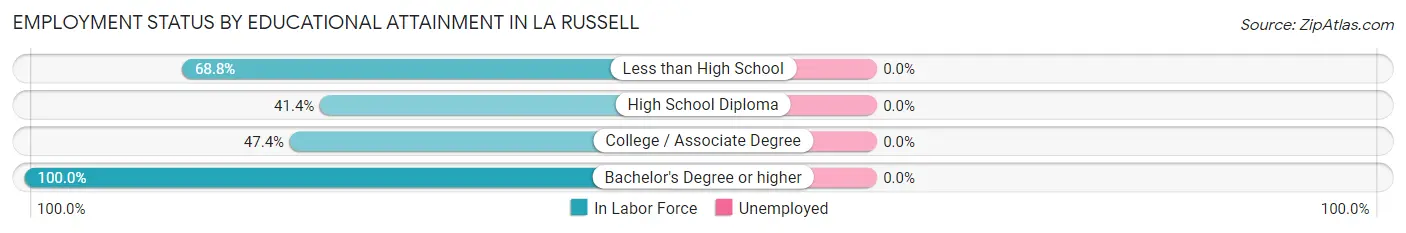
| Educational Attainment | In Labor Force | Unemployed |
| Less than High School | 11 (68.8%) | 0 (0.0%) |
| High School Diploma | 12 (41.4%) | 0 (0.0%) |
| College / Associate Degree | 9 (47.4%) | 0 (0.0%) |
| Bachelor's Degree or higher | 11 (100.0%) | 0 (0.0%) |
| Total | 43 (57.3%) | 0 (0.0%) |
Employment Occupations by Sex in La Russell
Management, Business, Science and Arts Occupations
The most common Management, Business, Science and Arts occupations in La Russell are Community & Social Service (1 | 1.8%), Education, Arts & Media (1 | 1.8%), Health Diagnosing & Treating (1 | 1.8%), and Health Technologists (1 | 1.8%).
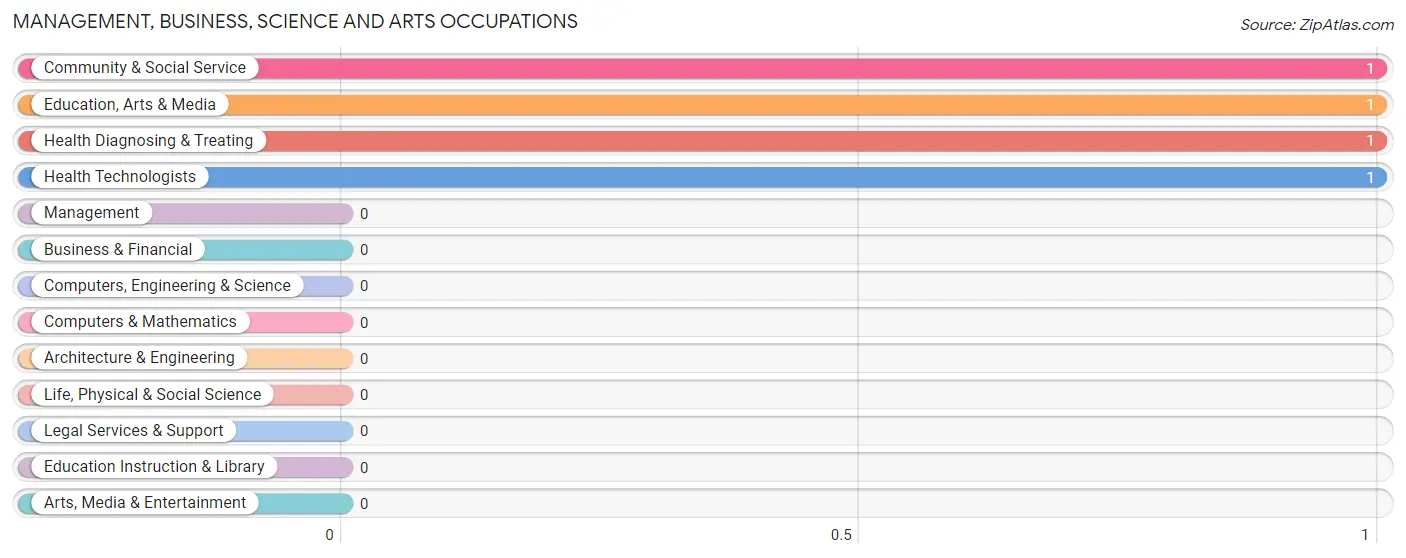
Management, Business, Science and Arts Occupations by Sex
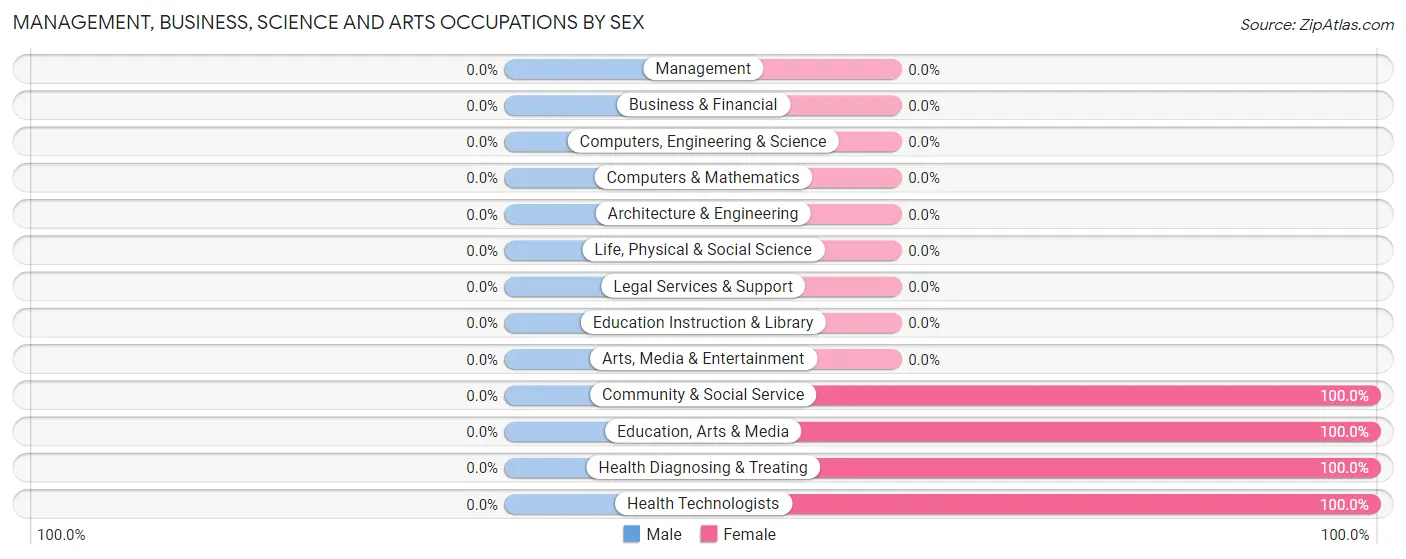
| Occupation | Male | Female |
| Management | 0 (0.0%) | 0 (0.0%) |
| Business & Financial | 0 (0.0%) | 0 (0.0%) |
| Computers, Engineering & Science | 0 (0.0%) | 0 (0.0%) |
| Computers & Mathematics | 0 (0.0%) | 0 (0.0%) |
| Architecture & Engineering | 0 (0.0%) | 0 (0.0%) |
| Life, Physical & Social Science | 0 (0.0%) | 0 (0.0%) |
| Community & Social Service | 0 (0.0%) | 1 (100.0%) |
| Education, Arts & Media | 0 (0.0%) | 1 (100.0%) |
| Legal Services & Support | 0 (0.0%) | 0 (0.0%) |
| Education Instruction & Library | 0 (0.0%) | 0 (0.0%) |
| Arts, Media & Entertainment | 0 (0.0%) | 0 (0.0%) |
| Health Diagnosing & Treating | 0 (0.0%) | 1 (100.0%) |
| Health Technologists | 0 (0.0%) | 1 (100.0%) |
| Total (Category) | 0 (0.0%) | 2 (100.0%) |
| Total (Overall) | 33 (58.9%) | 23 (41.1%) |
Services Occupations
The most common Services occupations in La Russell are Food Preparation & Serving (10 | 17.9%), Healthcare Support (7 | 12.5%), Security & Protection (5 | 8.9%), Law Enforcement (5 | 8.9%), and Cleaning & Maintenance (1 | 1.8%).
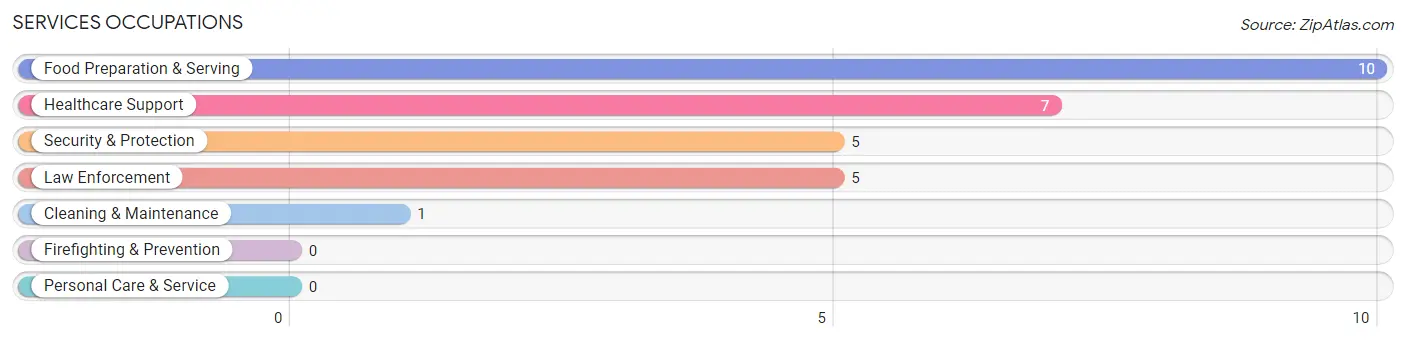
Services Occupations by Sex
Within the Services occupations in La Russell, the most male-oriented occupations are Security & Protection (100.0%), Law Enforcement (100.0%), and Cleaning & Maintenance (100.0%), while the most female-oriented occupations are Healthcare Support (100.0%), and Food Preparation & Serving (80.0%).
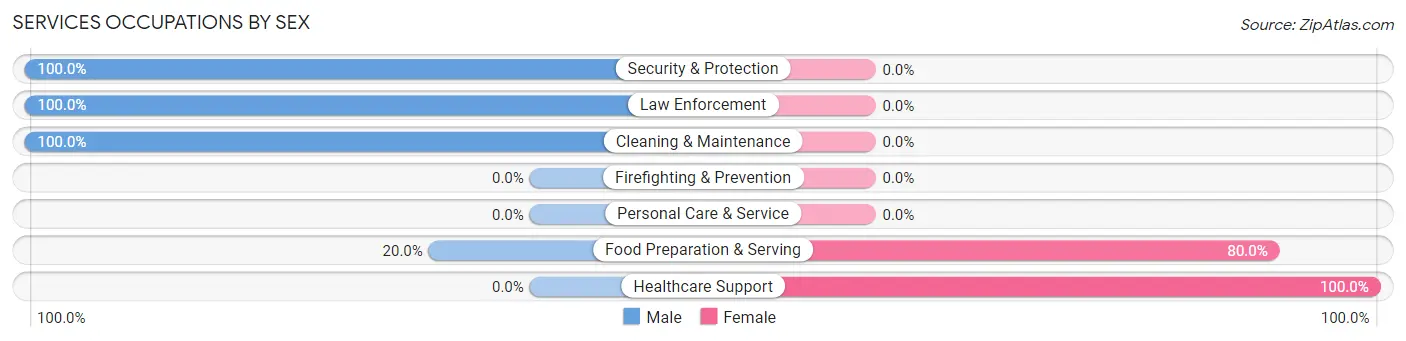
| Occupation | Male | Female |
| Healthcare Support | 0 (0.0%) | 7 (100.0%) |
| Security & Protection | 5 (100.0%) | 0 (0.0%) |
| Firefighting & Prevention | 0 (0.0%) | 0 (0.0%) |
| Law Enforcement | 5 (100.0%) | 0 (0.0%) |
| Food Preparation & Serving | 2 (20.0%) | 8 (80.0%) |
| Cleaning & Maintenance | 1 (100.0%) | 0 (0.0%) |
| Personal Care & Service | 0 (0.0%) | 0 (0.0%) |
| Total (Category) | 8 (34.8%) | 15 (65.2%) |
| Total (Overall) | 33 (58.9%) | 23 (41.1%) |
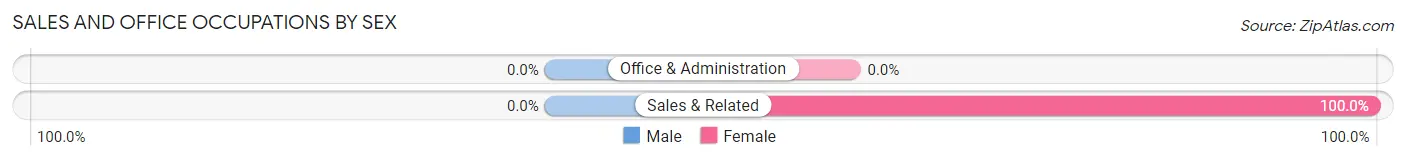
Sales and Office Occupations
The most common Sales and Office occupations in La Russell are , and Sales & Related (1 | 1.8%).
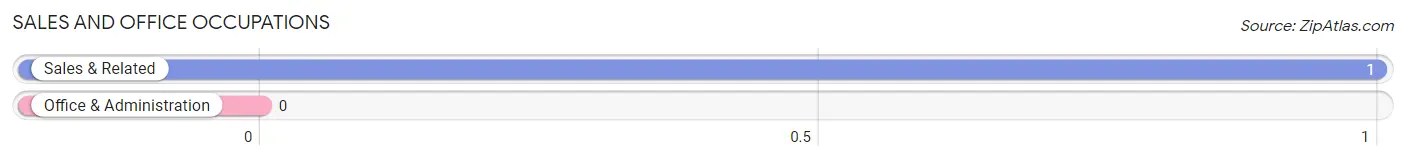
Sales and Office Occupations by Sex
| Occupation | Male | Female |
| Sales & Related | 0 (0.0%) | 1 (100.0%) |
| Office & Administration | 0 (0.0%) | 0 (0.0%) |
| Total (Category) | 0 (0.0%) | 1 (100.0%) |
| Total (Overall) | 33 (58.9%) | 23 (41.1%) |
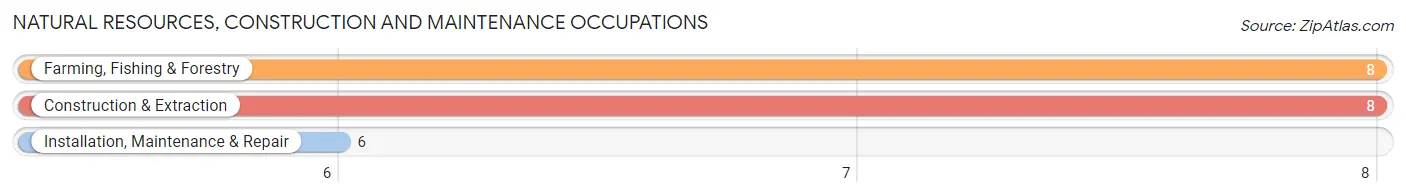
Natural Resources, Construction and Maintenance Occupations
The most common Natural Resources, Construction and Maintenance occupations in La Russell are Farming, Fishing & Forestry (8 | 14.3%), Construction & Extraction (8 | 14.3%), and Installation, Maintenance & Repair (6 | 10.7%).
Natural Resources, Construction and Maintenance Occupations by Sex
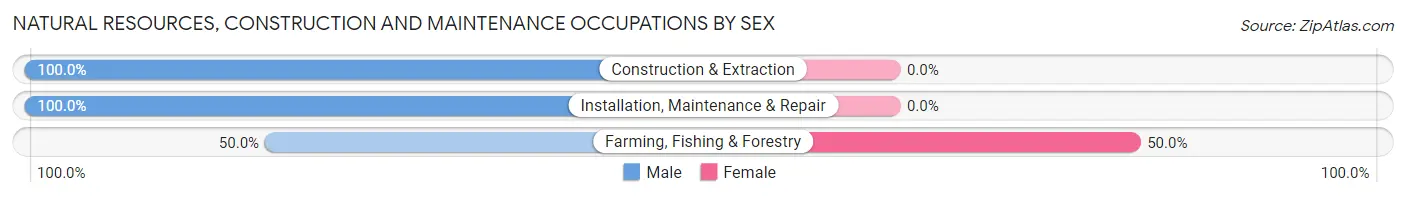
| Occupation | Male | Female |
| Farming, Fishing & Forestry | 4 (50.0%) | 4 (50.0%) |
| Construction & Extraction | 8 (100.0%) | 0 (0.0%) |
| Installation, Maintenance & Repair | 6 (100.0%) | 0 (0.0%) |
| Total (Category) | 18 (81.8%) | 4 (18.2%) |
| Total (Overall) | 33 (58.9%) | 23 (41.1%) |
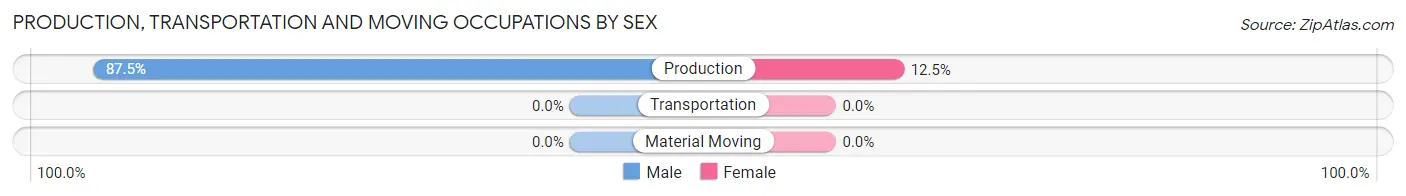
Production, Transportation and Moving Occupations
The most common Production, Transportation and Moving occupations in La Russell are , and Production (8 | 14.3%).
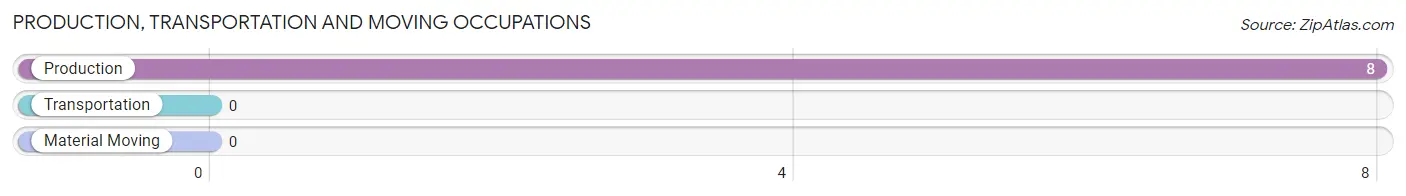
Production, Transportation and Moving Occupations by Sex
| Occupation | Male | Female |
| Production | 7 (87.5%) | 1 (12.5%) |
| Transportation | 0 (0.0%) | 0 (0.0%) |
| Material Moving | 0 (0.0%) | 0 (0.0%) |
| Total (Category) | 7 (87.5%) | 1 (12.5%) |
| Total (Overall) | 33 (58.9%) | 23 (41.1%) |
Employment Industries by Sex in La Russell
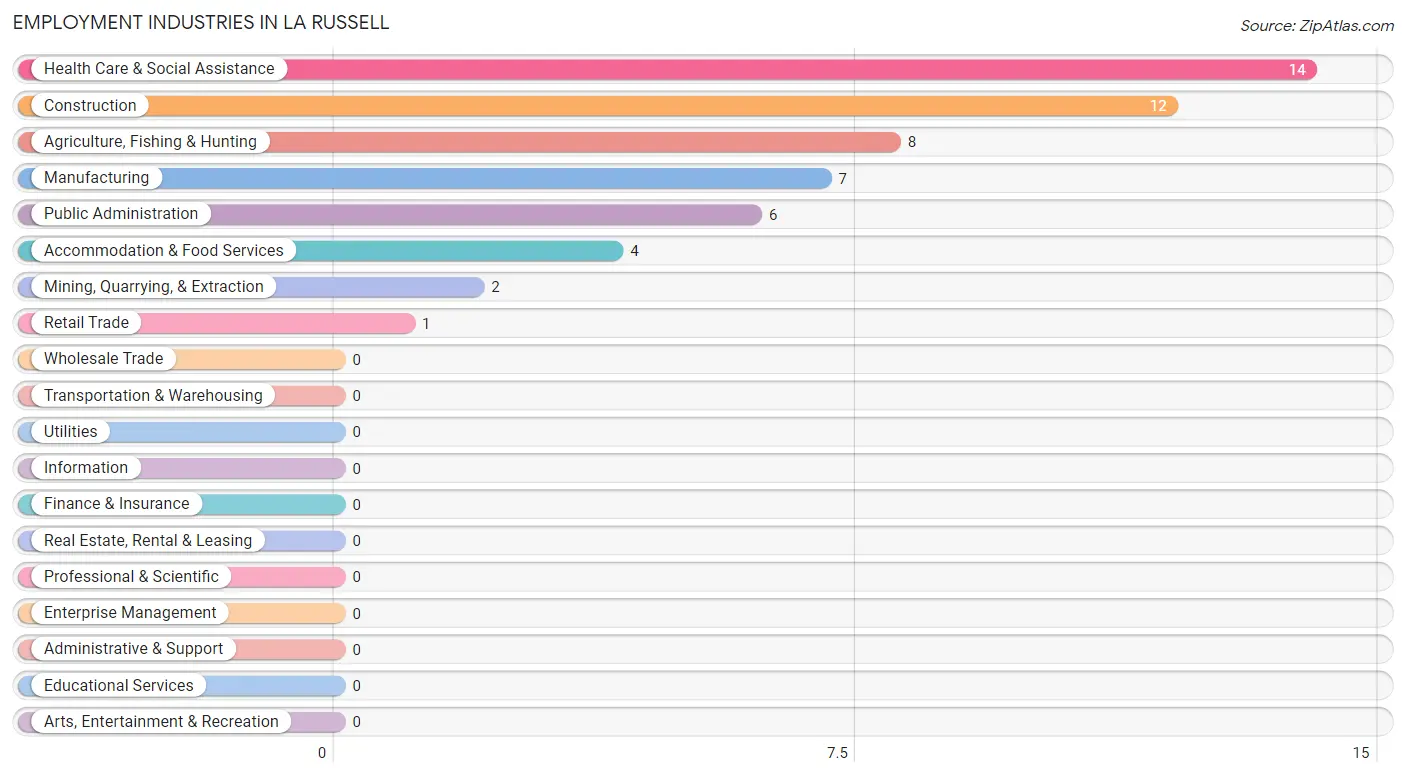
Employment Industries in La Russell
The major employment industries in La Russell include Health Care & Social Assistance (14 | 25.0%), Construction (12 | 21.4%), Agriculture, Fishing & Hunting (8 | 14.3%), Manufacturing (7 | 12.5%), and Public Administration (6 | 10.7%).
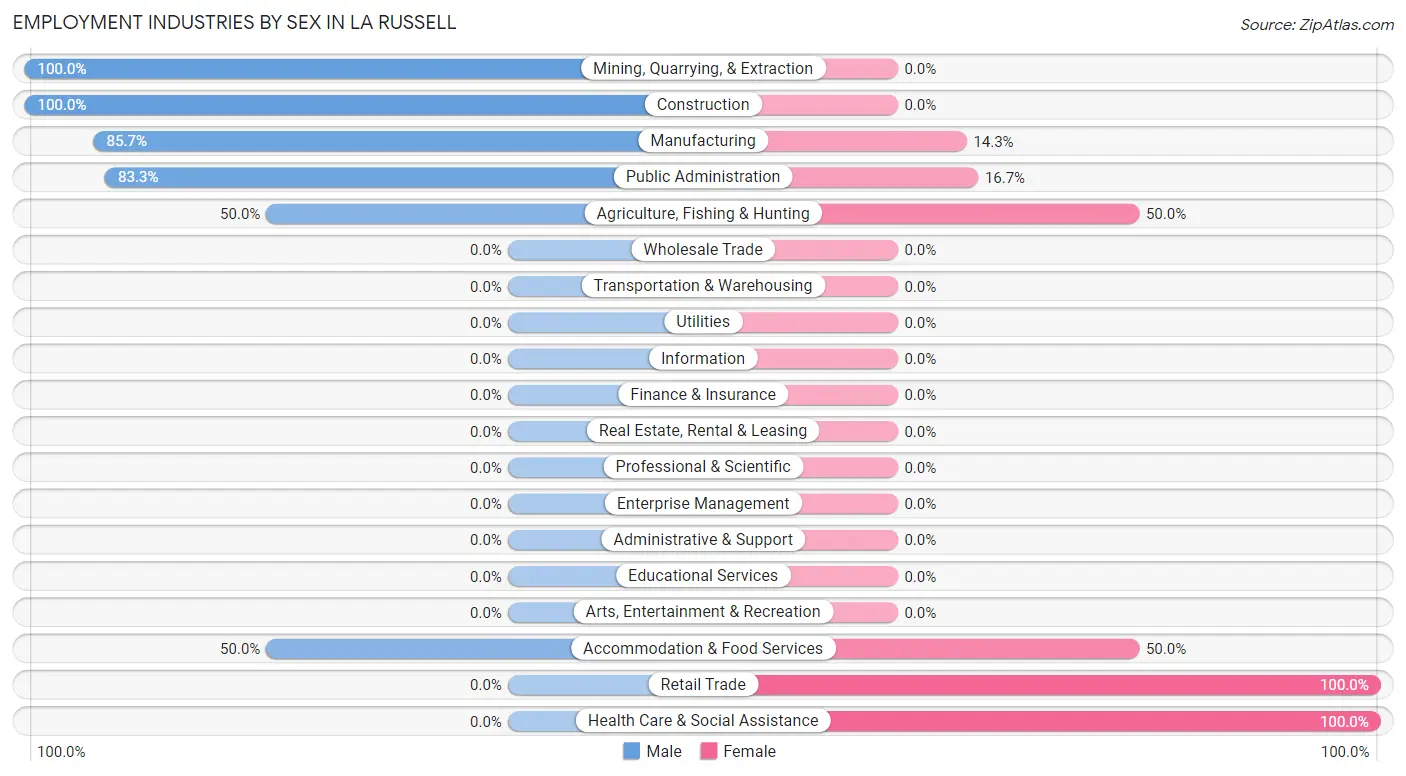
Employment Industries by Sex in La Russell
The La Russell industries that see more men than women are Mining, Quarrying, & Extraction (100.0%), Construction (100.0%), and Manufacturing (85.7%), whereas the industries that tend to have a higher number of women are Retail Trade (100.0%), Health Care & Social Assistance (100.0%), and Agriculture, Fishing & Hunting (50.0%).
| Industry | Male | Female |
| Agriculture, Fishing & Hunting | 4 (50.0%) | 4 (50.0%) |
| Mining, Quarrying, & Extraction | 2 (100.0%) | 0 (0.0%) |
| Construction | 12 (100.0%) | 0 (0.0%) |
| Manufacturing | 6 (85.7%) | 1 (14.3%) |
| Wholesale Trade | 0 (0.0%) | 0 (0.0%) |
| Retail Trade | 0 (0.0%) | 1 (100.0%) |
| Transportation & Warehousing | 0 (0.0%) | 0 (0.0%) |
| Utilities | 0 (0.0%) | 0 (0.0%) |
| Information | 0 (0.0%) | 0 (0.0%) |
| Finance & Insurance | 0 (0.0%) | 0 (0.0%) |
| Real Estate, Rental & Leasing | 0 (0.0%) | 0 (0.0%) |
| Professional & Scientific | 0 (0.0%) | 0 (0.0%) |
| Enterprise Management | 0 (0.0%) | 0 (0.0%) |
| Administrative & Support | 0 (0.0%) | 0 (0.0%) |
| Educational Services | 0 (0.0%) | 0 (0.0%) |
| Health Care & Social Assistance | 0 (0.0%) | 14 (100.0%) |
| Arts, Entertainment & Recreation | 0 (0.0%) | 0 (0.0%) |
| Accommodation & Food Services | 2 (50.0%) | 2 (50.0%) |
| Public Administration | 5 (83.3%) | 1 (16.7%) |
| Total | 33 (58.9%) | 23 (41.1%) |
Education in La Russell
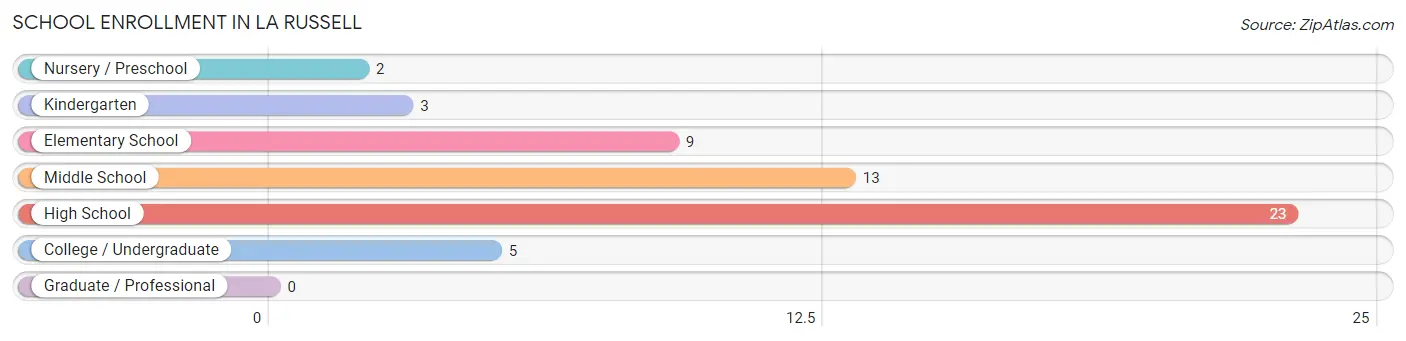
School Enrollment in La Russell
The most common levels of schooling among the 55 students in La Russell are high school (23 | 41.8%), middle school (13 | 23.6%), and elementary school (9 | 16.4%).
| School Level | # Students | % Students |
| Nursery / Preschool | 2 | 3.6% |
| Kindergarten | 3 | 5.4% |
| Elementary School | 9 | 16.4% |
| Middle School | 13 | 23.6% |
| High School | 23 | 41.8% |
| College / Undergraduate | 5 | 9.1% |
| Graduate / Professional | 0 | 0.0% |
| Total | 55 | 100.0% |
School Enrollment by Age by Funding Source in La Russell
Out of a total of 55 students who are enrolled in schools in La Russell, 11 (20.0%) attend a private institution, while the remaining 44 (80.0%) are enrolled in public schools. The age group of 5 to 9 year old has the highest likelihood of being enrolled in private schools, with 11 (91.7% in the age bracket) enrolled. Conversely, the age group of 3 to 4 year olds has the lowest likelihood of being enrolled in a private school, with 2 (100.0% in the age bracket) attending a public institution.
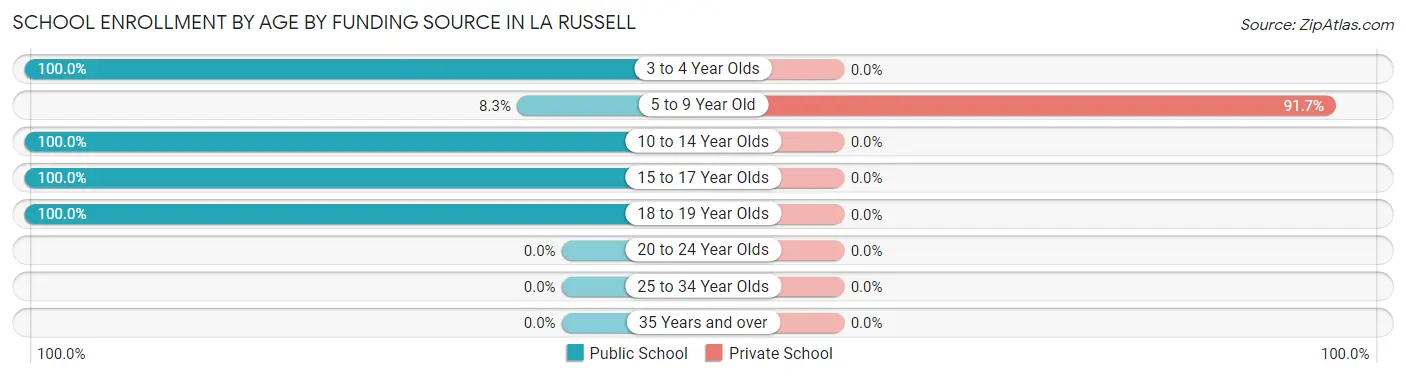
| Age Bracket | Public School | Private School |
| 3 to 4 Year Olds | 2 (100.0%) | 0 (0.0%) |
| 5 to 9 Year Old | 1 (8.3%) | 11 (91.7%) |
| 10 to 14 Year Olds | 18 (100.0%) | 0 (0.0%) |
| 15 to 17 Year Olds | 12 (100.0%) | 0 (0.0%) |
| 18 to 19 Year Olds | 11 (100.0%) | 0 (0.0%) |
| 20 to 24 Year Olds | 0 (0.0%) | 0 (0.0%) |
| 25 to 34 Year Olds | 0 (0.0%) | 0 (0.0%) |
| 35 Years and over | 0 (0.0%) | 0 (0.0%) |
| Total | 44 (80.0%) | 11 (20.0%) |
Educational Attainment by Field of Study in La Russell
Arts & humanities (10 | 83.3%), science & technology (1 | 8.3%), and communications (1 | 8.3%) are the most common fields of study among 12 individuals in La Russell who have obtained a bachelor's degree or higher.
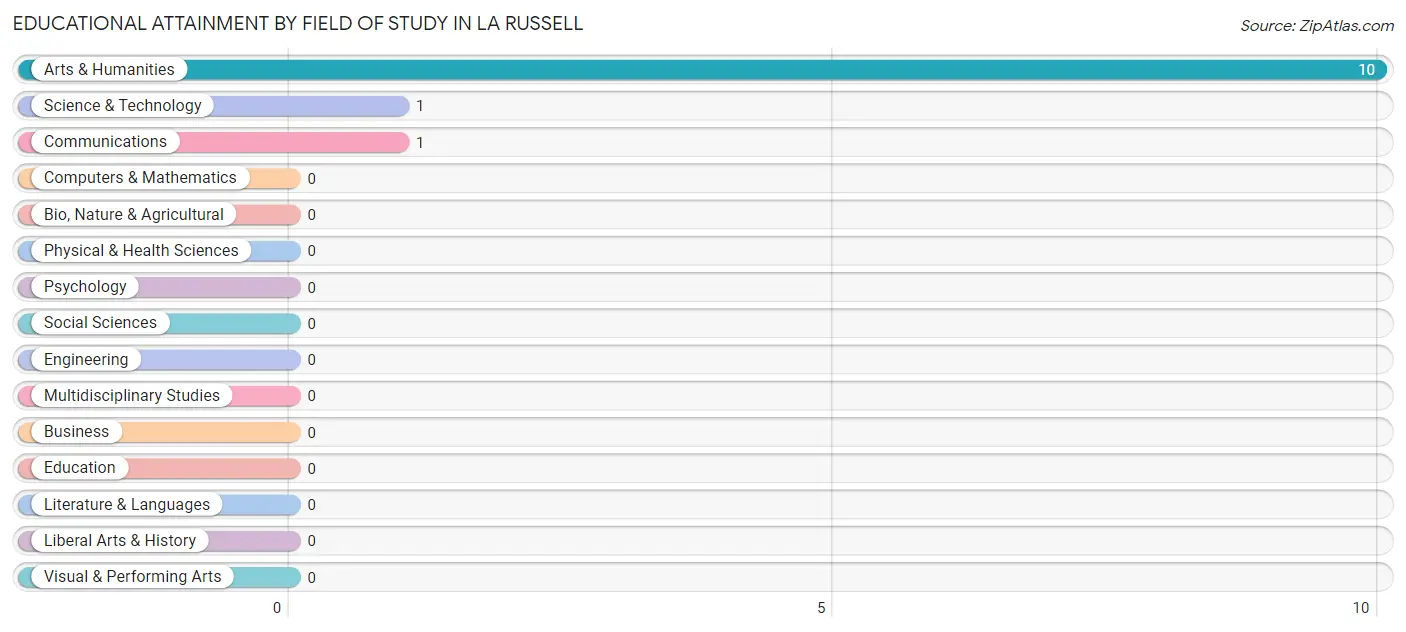
| Field of Study | # Graduates | % Graduates |
| Computers & Mathematics | 0 | 0.0% |
| Bio, Nature & Agricultural | 0 | 0.0% |
| Physical & Health Sciences | 0 | 0.0% |
| Psychology | 0 | 0.0% |
| Social Sciences | 0 | 0.0% |
| Engineering | 0 | 0.0% |
| Multidisciplinary Studies | 0 | 0.0% |
| Science & Technology | 1 | 8.3% |
| Business | 0 | 0.0% |
| Education | 0 | 0.0% |
| Literature & Languages | 0 | 0.0% |
| Liberal Arts & History | 0 | 0.0% |
| Visual & Performing Arts | 0 | 0.0% |
| Communications | 1 | 8.3% |
| Arts & Humanities | 10 | 83.3% |
| Total | 12 | 100.0% |
Transportation & Commute in La Russell
Vehicle Availability by Sex in La Russell
The most prevalent vehicle ownership categories in La Russell are males with 2 vehicles (16, accounting for 48.5%) and females with 2 vehicles (12, making up 69.6%).
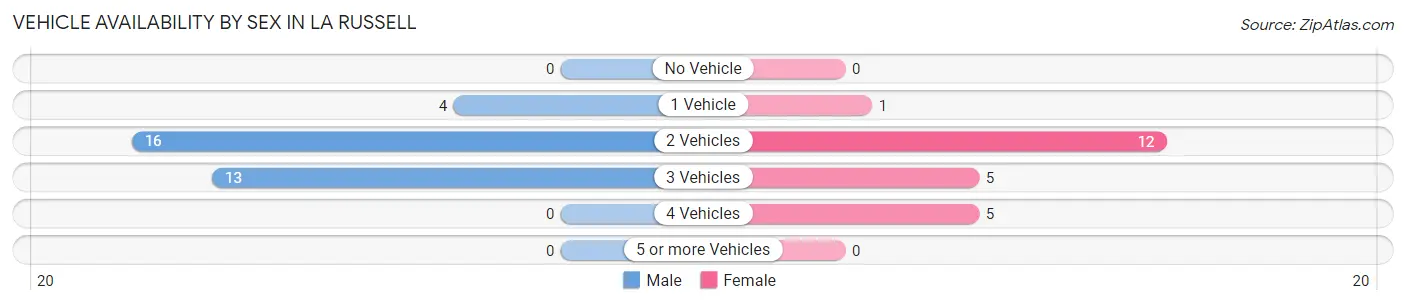
| Vehicles Available | Male | Female |
| No Vehicle | 0 (0.0%) | 0 (0.0%) |
| 1 Vehicle | 4 (12.1%) | 1 (4.3%) |
| 2 Vehicles | 16 (48.5%) | 12 (52.2%) |
| 3 Vehicles | 13 (39.4%) | 5 (21.7%) |
| 4 Vehicles | 0 (0.0%) | 5 (21.7%) |
| 5 or more Vehicles | 0 (0.0%) | 0 (0.0%) |
| Total | 33 (100.0%) | 23 (100.0%) |
Commute Time in La Russell
The most frequently occuring commute durations in La Russell are 40 to 44 minutes (15 commuters, 31.2%), 20 to 24 minutes (8 commuters, 16.7%), and 25 to 29 minutes (5 commuters, 10.4%).
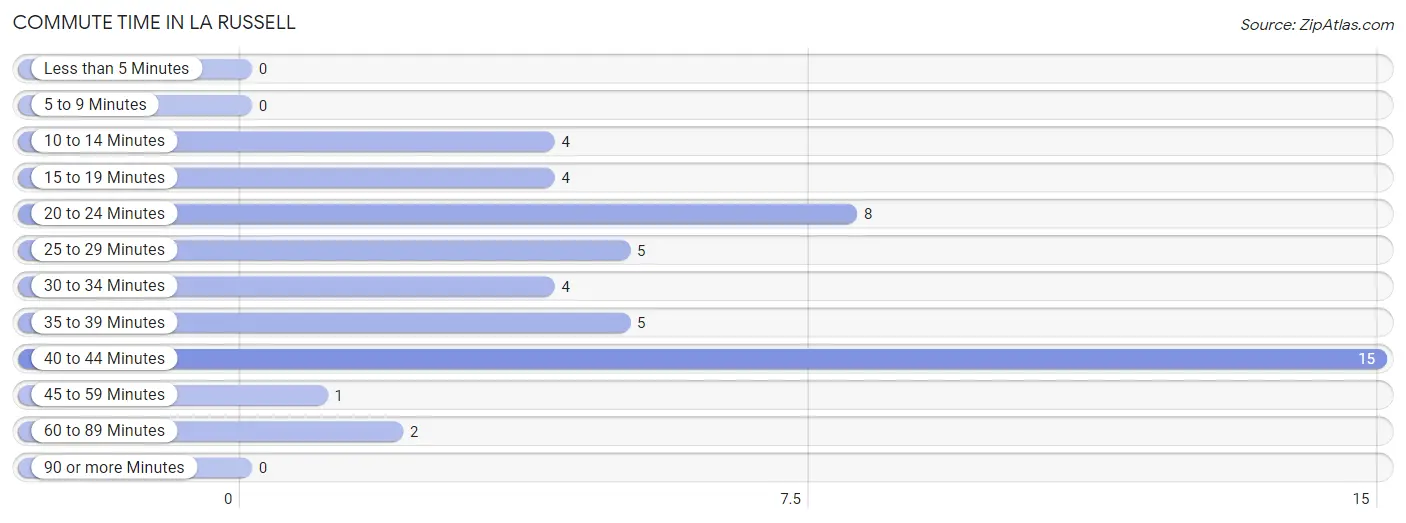
| Commute Time | # Commuters | % Commuters |
| Less than 5 Minutes | 0 | 0.0% |
| 5 to 9 Minutes | 0 | 0.0% |
| 10 to 14 Minutes | 4 | 8.3% |
| 15 to 19 Minutes | 4 | 8.3% |
| 20 to 24 Minutes | 8 | 16.7% |
| 25 to 29 Minutes | 5 | 10.4% |
| 30 to 34 Minutes | 4 | 8.3% |
| 35 to 39 Minutes | 5 | 10.4% |
| 40 to 44 Minutes | 15 | 31.2% |
| 45 to 59 Minutes | 1 | 2.1% |
| 60 to 89 Minutes | 2 | 4.2% |
| 90 or more Minutes | 0 | 0.0% |
Commute Time by Sex in La Russell
The most common commute times in La Russell are 40 to 44 minutes (10 commuters, 34.5%) for males and 25 to 29 minutes (5 commuters, 26.3%) for females.
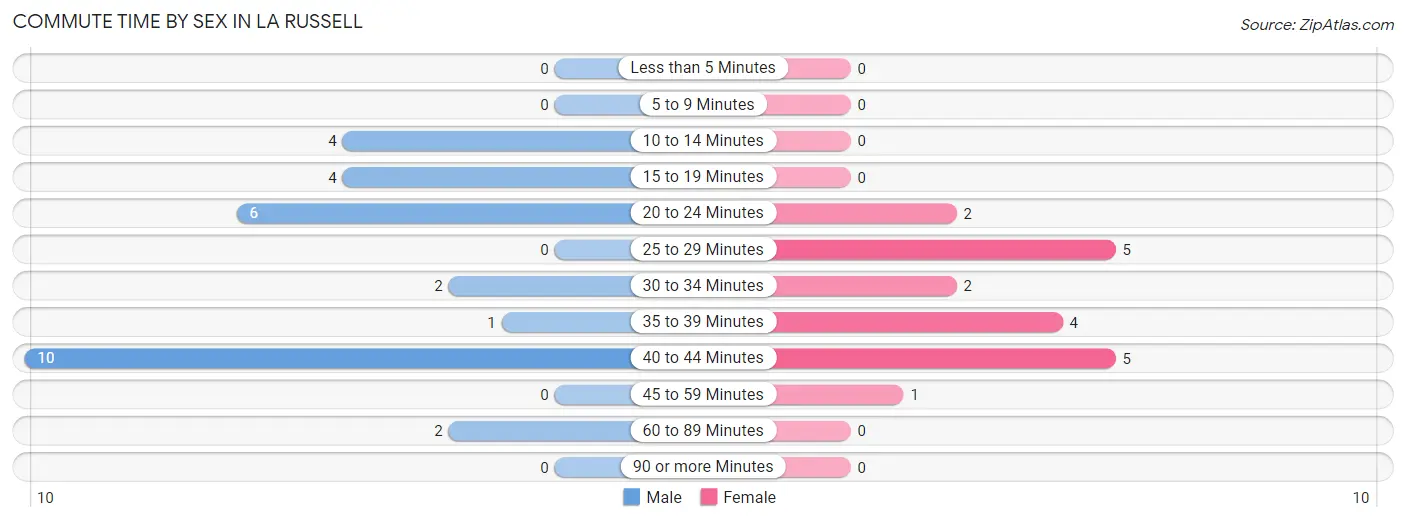
| Commute Time | Male | Female |
| Less than 5 Minutes | 0 (0.0%) | 0 (0.0%) |
| 5 to 9 Minutes | 0 (0.0%) | 0 (0.0%) |
| 10 to 14 Minutes | 4 (13.8%) | 0 (0.0%) |
| 15 to 19 Minutes | 4 (13.8%) | 0 (0.0%) |
| 20 to 24 Minutes | 6 (20.7%) | 2 (10.5%) |
| 25 to 29 Minutes | 0 (0.0%) | 5 (26.3%) |
| 30 to 34 Minutes | 2 (6.9%) | 2 (10.5%) |
| 35 to 39 Minutes | 1 (3.5%) | 4 (21.0%) |
| 40 to 44 Minutes | 10 (34.5%) | 5 (26.3%) |
| 45 to 59 Minutes | 0 (0.0%) | 1 (5.3%) |
| 60 to 89 Minutes | 2 (6.9%) | 0 (0.0%) |
| 90 or more Minutes | 0 (0.0%) | 0 (0.0%) |
Time of Departure to Work by Sex in La Russell
The most frequent times of departure to work in La Russell are 4:00 PM to 11:59 PM (15, 51.7%) for males and 7:00 AM to 7:29 AM (6, 31.6%) for females.
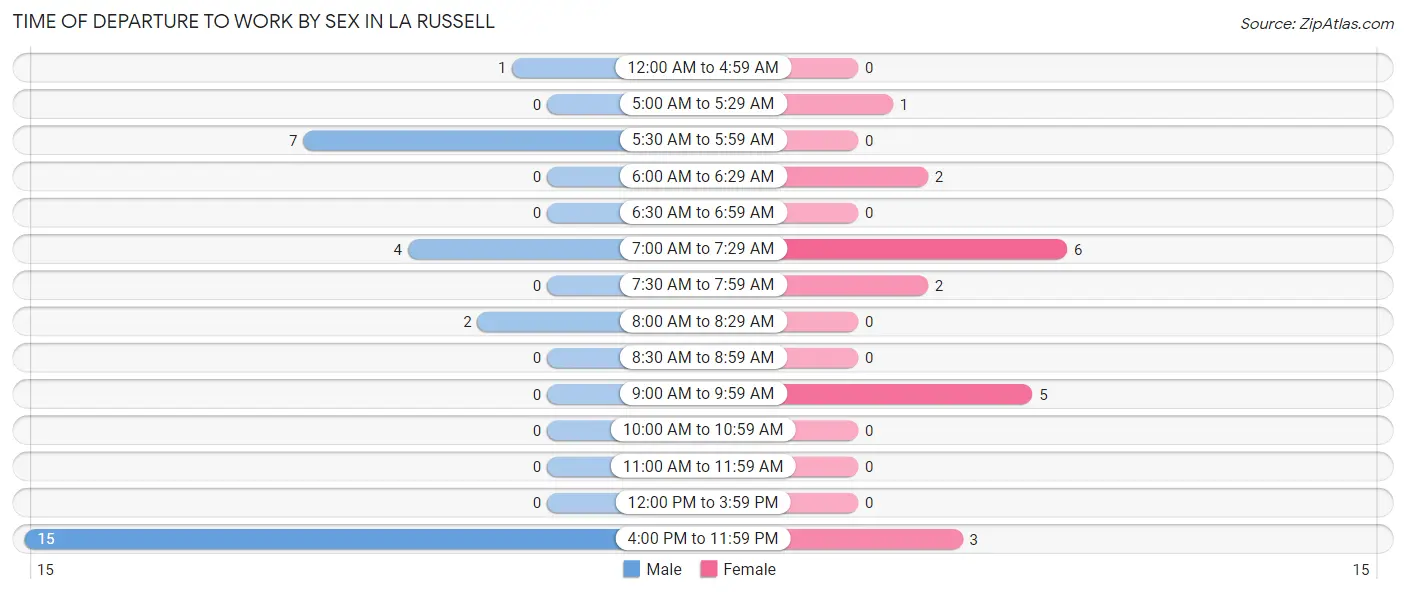
| Time of Departure | Male | Female |
| 12:00 AM to 4:59 AM | 1 (3.5%) | 0 (0.0%) |
| 5:00 AM to 5:29 AM | 0 (0.0%) | 1 (5.3%) |
| 5:30 AM to 5:59 AM | 7 (24.1%) | 0 (0.0%) |
| 6:00 AM to 6:29 AM | 0 (0.0%) | 2 (10.5%) |
| 6:30 AM to 6:59 AM | 0 (0.0%) | 0 (0.0%) |
| 7:00 AM to 7:29 AM | 4 (13.8%) | 6 (31.6%) |
| 7:30 AM to 7:59 AM | 0 (0.0%) | 2 (10.5%) |
| 8:00 AM to 8:29 AM | 2 (6.9%) | 0 (0.0%) |
| 8:30 AM to 8:59 AM | 0 (0.0%) | 0 (0.0%) |
| 9:00 AM to 9:59 AM | 0 (0.0%) | 5 (26.3%) |
| 10:00 AM to 10:59 AM | 0 (0.0%) | 0 (0.0%) |
| 11:00 AM to 11:59 AM | 0 (0.0%) | 0 (0.0%) |
| 12:00 PM to 3:59 PM | 0 (0.0%) | 0 (0.0%) |
| 4:00 PM to 11:59 PM | 15 (51.7%) | 3 (15.8%) |
| Total | 29 (100.0%) | 19 (100.0%) |
Housing Occupancy in La Russell
Occupancy by Ownership in La Russell
Of the total 41 dwellings in La Russell, owner-occupied units account for 39 (95.1%), while renter-occupied units make up 2 (4.9%).
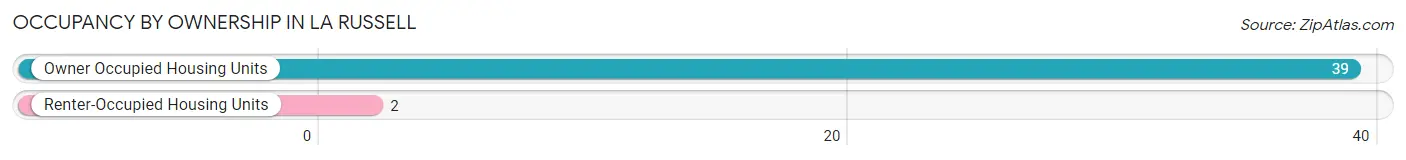
| Occupancy | # Housing Units | % Housing Units |
| Owner Occupied Housing Units | 39 | 95.1% |
| Renter-Occupied Housing Units | 2 | 4.9% |
| Total Occupied Housing Units | 41 | 100.0% |
Occupancy by Household Size in La Russell
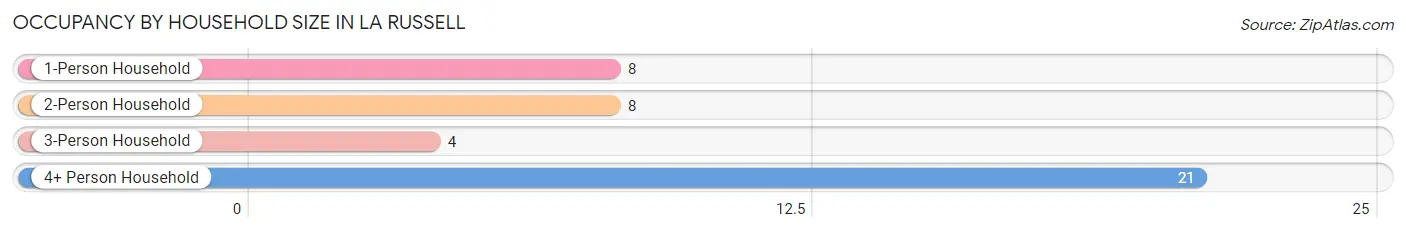
| Household Size | # Housing Units | % Housing Units |
| 1-Person Household | 8 | 19.5% |
| 2-Person Household | 8 | 19.5% |
| 3-Person Household | 4 | 9.8% |
| 4+ Person Household | 21 | 51.2% |
| Total Housing Units | 41 | 100.0% |
Occupancy by Ownership by Household Size in La Russell
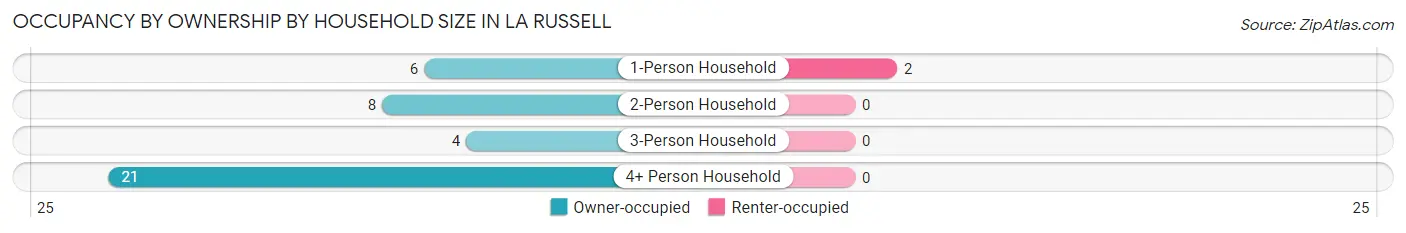
| Household Size | Owner-occupied | Renter-occupied |
| 1-Person Household | 6 (75.0%) | 2 (25.0%) |
| 2-Person Household | 8 (100.0%) | 0 (0.0%) |
| 3-Person Household | 4 (100.0%) | 0 (0.0%) |
| 4+ Person Household | 21 (100.0%) | 0 (0.0%) |
| Total Housing Units | 39 (95.1%) | 2 (4.9%) |
Occupancy by Educational Attainment in La Russell
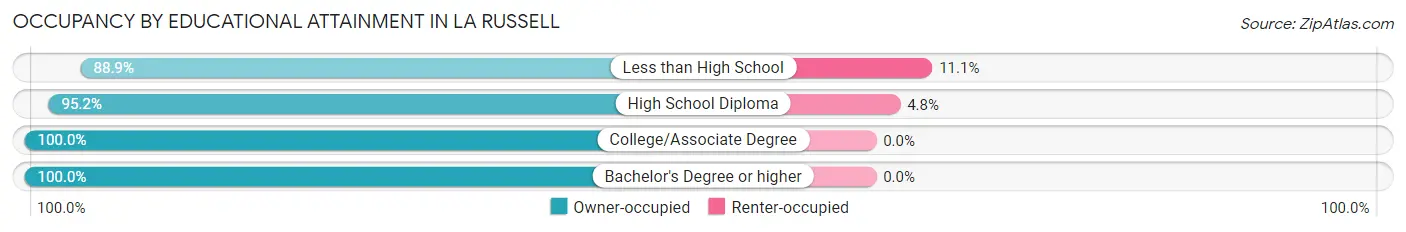
| Household Size | Owner-occupied | Renter-occupied |
| Less than High School | 8 (88.9%) | 1 (11.1%) |
| High School Diploma | 20 (95.2%) | 1 (4.8%) |
| College/Associate Degree | 4 (100.0%) | 0 (0.0%) |
| Bachelor's Degree or higher | 7 (100.0%) | 0 (0.0%) |
Occupancy by Age of Householder in La Russell
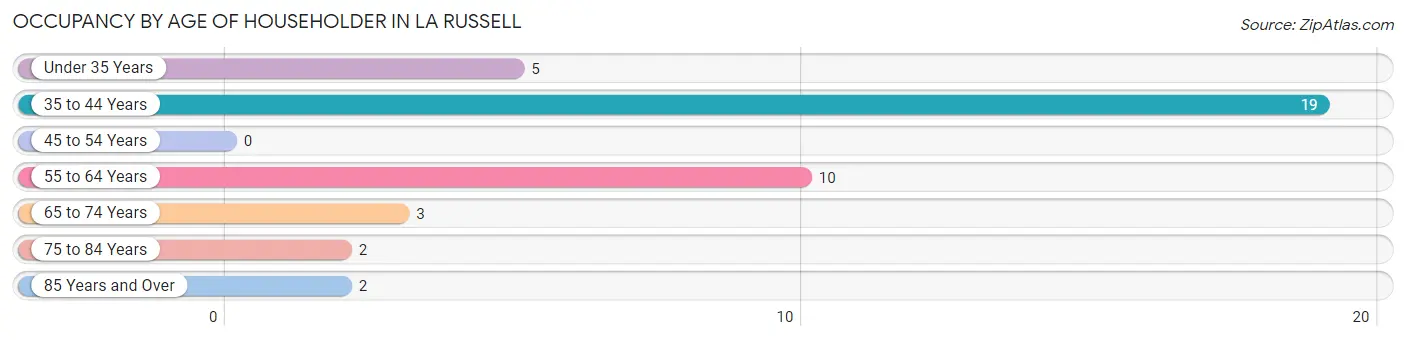
| Age Bracket | # Households | % Households |
| Under 35 Years | 5 | 12.2% |
| 35 to 44 Years | 19 | 46.3% |
| 45 to 54 Years | 0 | 0.0% |
| 55 to 64 Years | 10 | 24.4% |
| 65 to 74 Years | 3 | 7.3% |
| 75 to 84 Years | 2 | 4.9% |
| 85 Years and Over | 2 | 4.9% |
| Total | 41 | 100.0% |
Housing Finances in La Russell
Median Income by Occupancy in La Russell
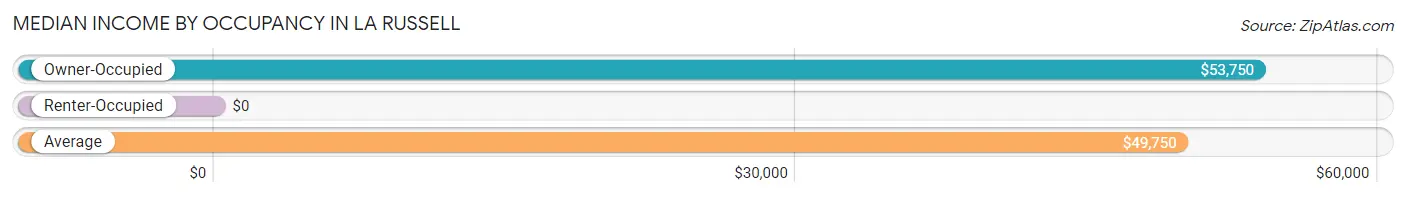
| Occupancy Type | # Households | Median Income |
| Owner-Occupied | 39 (95.1%) | $53,750 |
| Renter-Occupied | 2 (4.9%) | $0 |
| Average | 41 (100.0%) | $49,750 |
Occupancy by Householder Income Bracket in La Russell
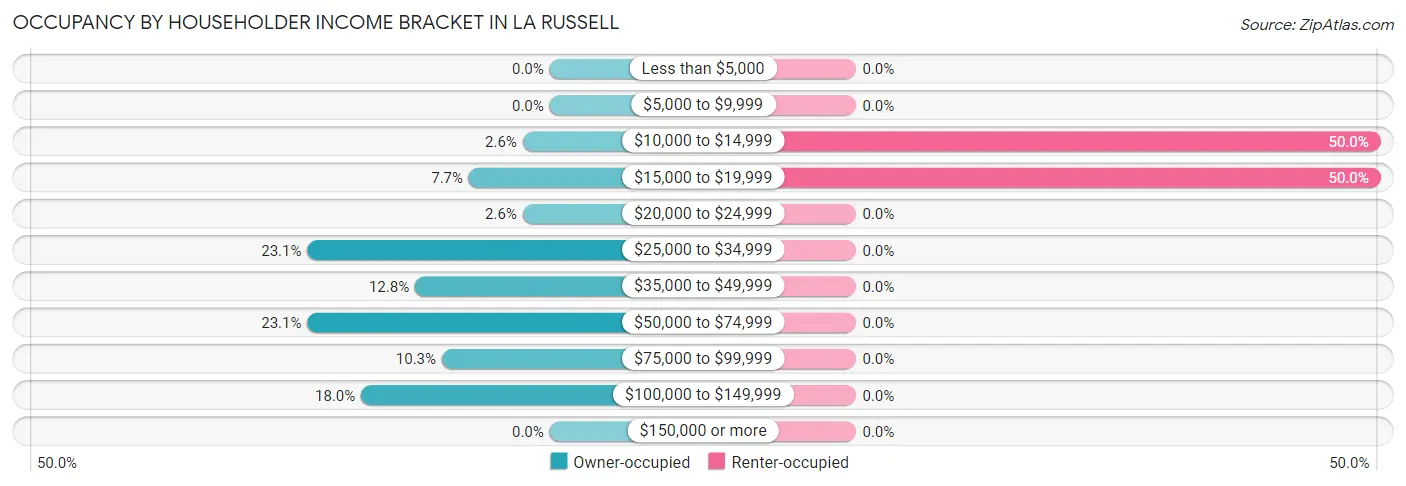
| Income Bracket | Owner-occupied | Renter-occupied |
| Less than $5,000 | 0 (0.0%) | 0 (0.0%) |
| $5,000 to $9,999 | 0 (0.0%) | 0 (0.0%) |
| $10,000 to $14,999 | 1 (2.6%) | 1 (50.0%) |
| $15,000 to $19,999 | 3 (7.7%) | 1 (50.0%) |
| $20,000 to $24,999 | 1 (2.6%) | 0 (0.0%) |
| $25,000 to $34,999 | 9 (23.1%) | 0 (0.0%) |
| $35,000 to $49,999 | 5 (12.8%) | 0 (0.0%) |
| $50,000 to $74,999 | 9 (23.1%) | 0 (0.0%) |
| $75,000 to $99,999 | 4 (10.3%) | 0 (0.0%) |
| $100,000 to $149,999 | 7 (17.9%) | 0 (0.0%) |
| $150,000 or more | 0 (0.0%) | 0 (0.0%) |
| Total | 39 (100.0%) | 2 (100.0%) |
Monthly Housing Cost Tiers in La Russell
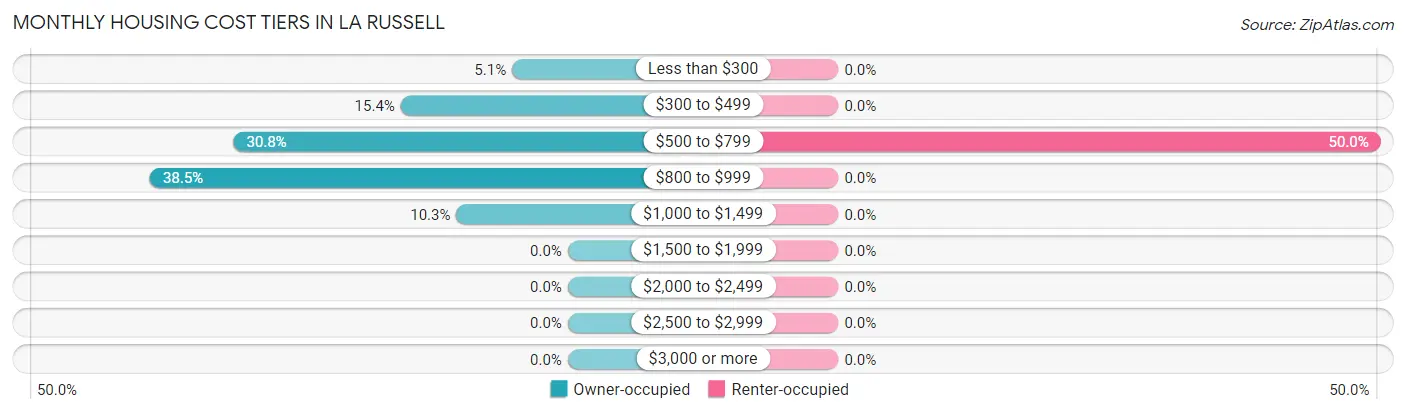
| Monthly Cost | Owner-occupied | Renter-occupied |
| Less than $300 | 2 (5.1%) | 0 (0.0%) |
| $300 to $499 | 6 (15.4%) | 0 (0.0%) |
| $500 to $799 | 12 (30.8%) | 1 (50.0%) |
| $800 to $999 | 15 (38.5%) | 0 (0.0%) |
| $1,000 to $1,499 | 4 (10.3%) | 0 (0.0%) |
| $1,500 to $1,999 | 0 (0.0%) | 0 (0.0%) |
| $2,000 to $2,499 | 0 (0.0%) | 0 (0.0%) |
| $2,500 to $2,999 | 0 (0.0%) | 0 (0.0%) |
| $3,000 or more | 0 (0.0%) | 0 (0.0%) |
| Total | 39 (100.0%) | 2 (100.0%) |
Physical Housing Characteristics in La Russell
Housing Structures in La Russell
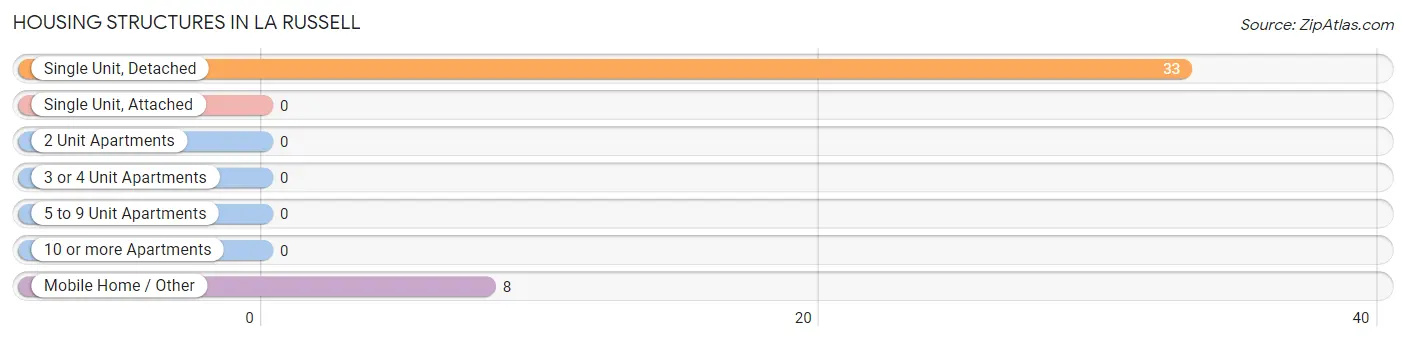
| Structure Type | # Housing Units | % Housing Units |
| Single Unit, Detached | 33 | 80.5% |
| Single Unit, Attached | 0 | 0.0% |
| 2 Unit Apartments | 0 | 0.0% |
| 3 or 4 Unit Apartments | 0 | 0.0% |
| 5 to 9 Unit Apartments | 0 | 0.0% |
| 10 or more Apartments | 0 | 0.0% |
| Mobile Home / Other | 8 | 19.5% |
| Total | 41 | 100.0% |
Housing Structures by Occupancy in La Russell
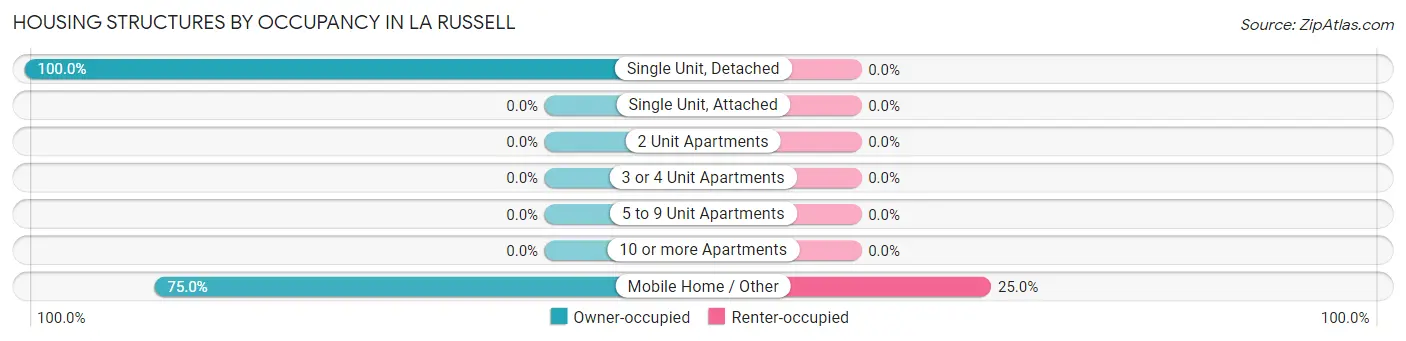
| Structure Type | Owner-occupied | Renter-occupied |
| Single Unit, Detached | 33 (100.0%) | 0 (0.0%) |
| Single Unit, Attached | 0 (0.0%) | 0 (0.0%) |
| 2 Unit Apartments | 0 (0.0%) | 0 (0.0%) |
| 3 or 4 Unit Apartments | 0 (0.0%) | 0 (0.0%) |
| 5 to 9 Unit Apartments | 0 (0.0%) | 0 (0.0%) |
| 10 or more Apartments | 0 (0.0%) | 0 (0.0%) |
| Mobile Home / Other | 6 (75.0%) | 2 (25.0%) |
| Total | 39 (95.1%) | 2 (4.9%) |
Housing Structures by Number of Rooms in La Russell
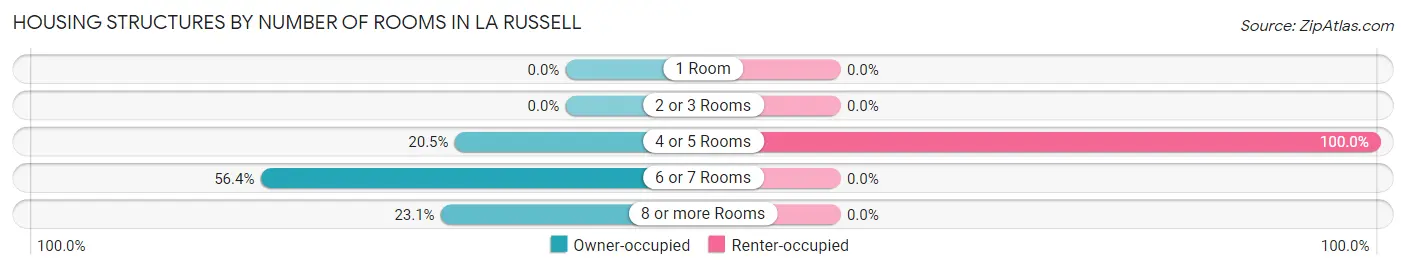
| Number of Rooms | Owner-occupied | Renter-occupied |
| 1 Room | 0 (0.0%) | 0 (0.0%) |
| 2 or 3 Rooms | 0 (0.0%) | 0 (0.0%) |
| 4 or 5 Rooms | 8 (20.5%) | 2 (100.0%) |
| 6 or 7 Rooms | 22 (56.4%) | 0 (0.0%) |
| 8 or more Rooms | 9 (23.1%) | 0 (0.0%) |
| Total | 39 (100.0%) | 2 (100.0%) |
Housing Structure by Heating Type in La Russell
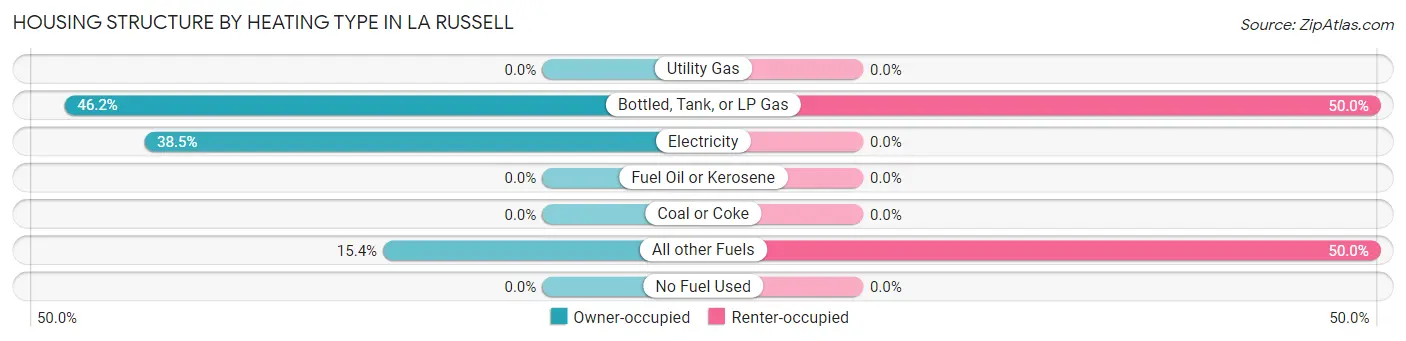
| Heating Type | Owner-occupied | Renter-occupied |
| Utility Gas | 0 (0.0%) | 0 (0.0%) |
| Bottled, Tank, or LP Gas | 18 (46.2%) | 1 (50.0%) |
| Electricity | 15 (38.5%) | 0 (0.0%) |
| Fuel Oil or Kerosene | 0 (0.0%) | 0 (0.0%) |
| Coal or Coke | 0 (0.0%) | 0 (0.0%) |
| All other Fuels | 6 (15.4%) | 1 (50.0%) |
| No Fuel Used | 0 (0.0%) | 0 (0.0%) |
| Total | 39 (100.0%) | 2 (100.0%) |
Household Vehicle Usage in La Russell
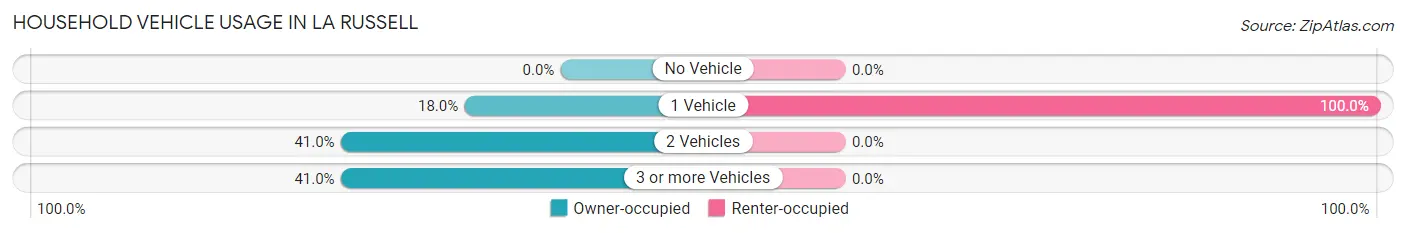
| Vehicles per Household | Owner-occupied | Renter-occupied |
| No Vehicle | 0 (0.0%) | 0 (0.0%) |
| 1 Vehicle | 7 (17.9%) | 2 (100.0%) |
| 2 Vehicles | 16 (41.0%) | 0 (0.0%) |
| 3 or more Vehicles | 16 (41.0%) | 0 (0.0%) |
| Total | 39 (100.0%) | 2 (100.0%) |
Real Estate & Mortgages in La Russell
Real Estate and Mortgage Overview in La Russell
| Characteristic | Without Mortgage | With Mortgage |
| Housing Units | 17 | 22 |
| Median Property Value | - | - |
| Median Household Income | $34,688 | $0 |
| Monthly Housing Costs | $506 | $0 |
| Real Estate Taxes | $557 | $0 |
Property Value by Mortgage Status in La Russell
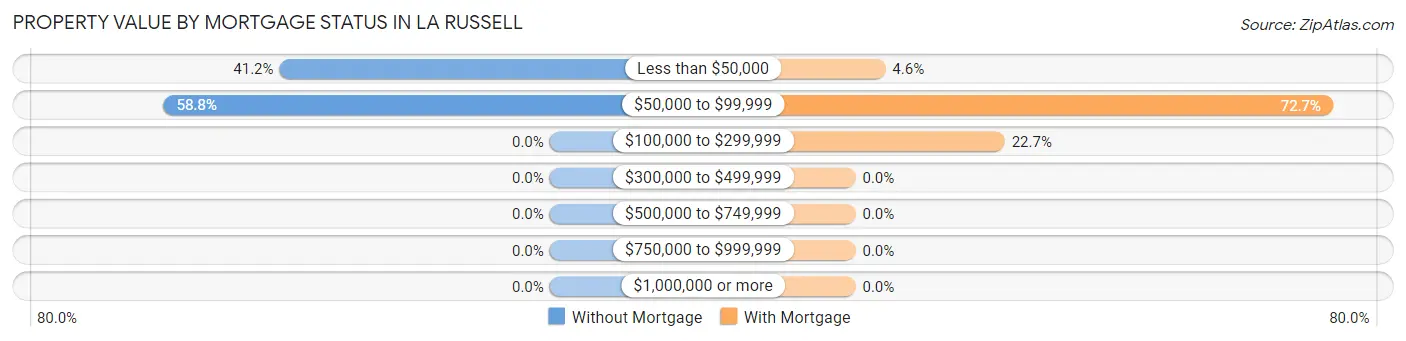
| Property Value | Without Mortgage | With Mortgage |
| Less than $50,000 | 7 (41.2%) | 1 (4.5%) |
| $50,000 to $99,999 | 10 (58.8%) | 16 (72.7%) |
| $100,000 to $299,999 | 0 (0.0%) | 5 (22.7%) |
| $300,000 to $499,999 | 0 (0.0%) | 0 (0.0%) |
| $500,000 to $749,999 | 0 (0.0%) | 0 (0.0%) |
| $750,000 to $999,999 | 0 (0.0%) | 0 (0.0%) |
| $1,000,000 or more | 0 (0.0%) | 0 (0.0%) |
| Total | 17 (100.0%) | 22 (100.0%) |
Household Income by Mortgage Status in La Russell
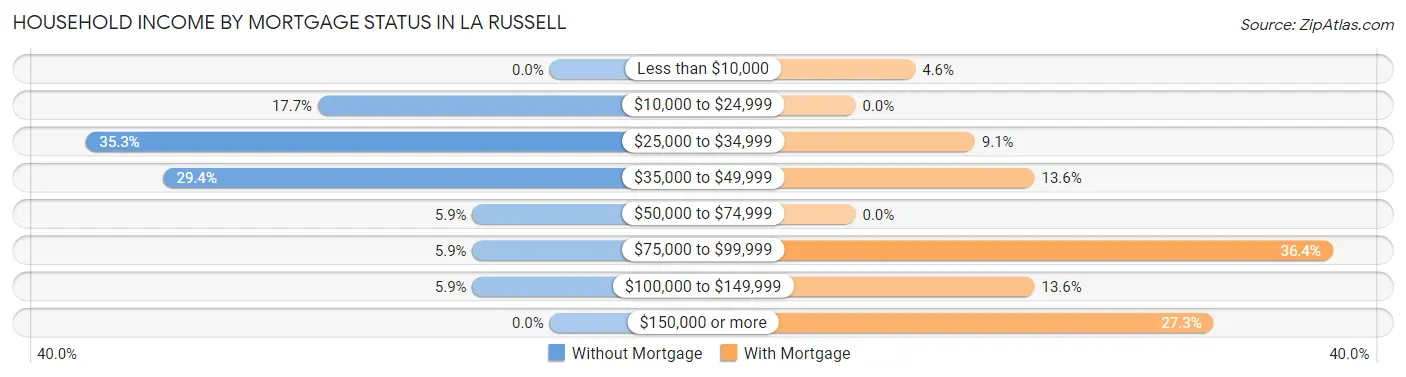
| Household Income | Without Mortgage | With Mortgage |
| Less than $10,000 | 0 (0.0%) | 1 (4.5%) |
| $10,000 to $24,999 | 3 (17.6%) | 0 (0.0%) |
| $25,000 to $34,999 | 6 (35.3%) | 2 (9.1%) |
| $35,000 to $49,999 | 5 (29.4%) | 3 (13.6%) |
| $50,000 to $74,999 | 1 (5.9%) | 0 (0.0%) |
| $75,000 to $99,999 | 1 (5.9%) | 8 (36.4%) |
| $100,000 to $149,999 | 1 (5.9%) | 3 (13.6%) |
| $150,000 or more | 0 (0.0%) | 6 (27.3%) |
| Total | 17 (100.0%) | 22 (100.0%) |
Property Value to Household Income Ratio in La Russell
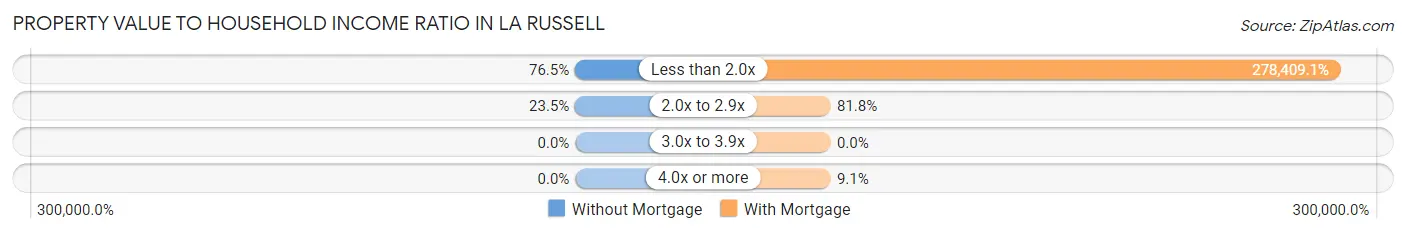
| Value-to-Income Ratio | Without Mortgage | With Mortgage |
| Less than 2.0x | 13 (76.5%) | 61,250 (278,409.1%) |
| 2.0x to 2.9x | 4 (23.5%) | 18 (81.8%) |
| 3.0x to 3.9x | 0 (0.0%) | 0 (0.0%) |
| 4.0x or more | 0 (0.0%) | 2 (9.1%) |
| Total | 17 (100.0%) | 22 (100.0%) |
Real Estate Taxes by Mortgage Status in La Russell
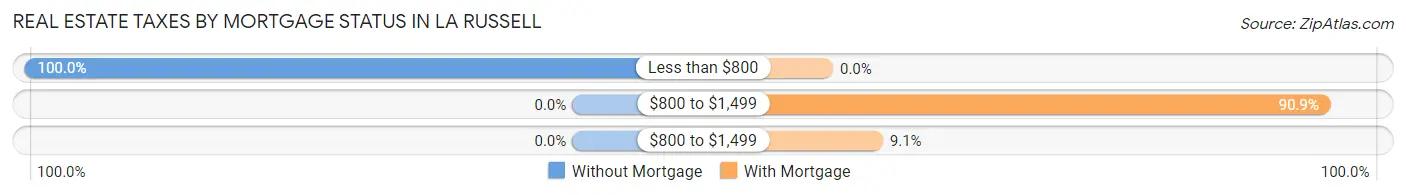
| Property Taxes | Without Mortgage | With Mortgage |
| Less than $800 | 17 (100.0%) | 0 (0.0%) |
| $800 to $1,499 | 0 (0.0%) | 20 (90.9%) |
| $800 to $1,499 | 0 (0.0%) | 2 (9.1%) |
| Total | 17 (100.0%) | 22 (100.0%) |
Health & Disability in La Russell
Health Insurance Coverage by Age in La Russell
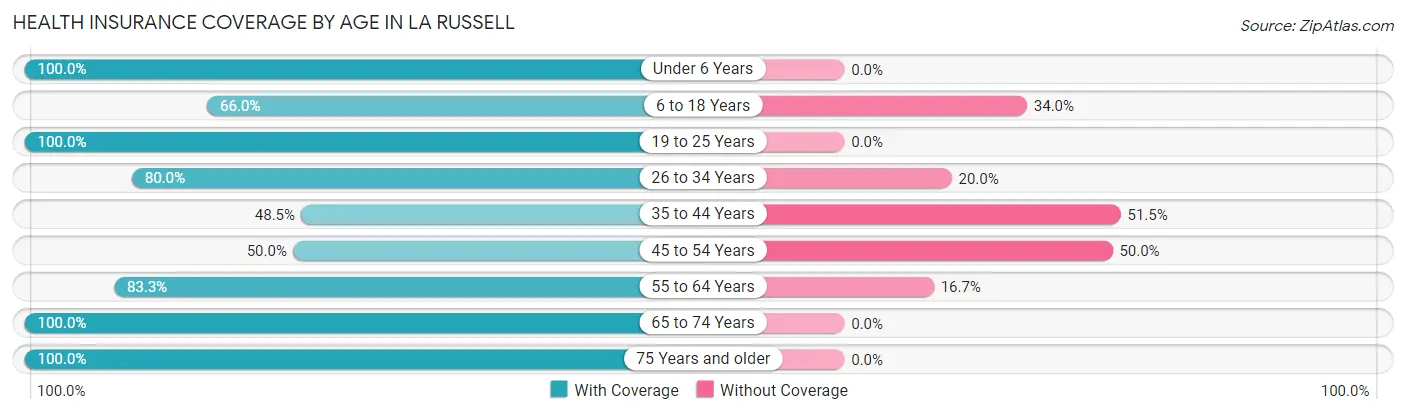
| Age Bracket | With Coverage | Without Coverage |
| Under 6 Years | 5 (100.0%) | 0 (0.0%) |
| 6 to 18 Years | 31 (66.0%) | 16 (34.0%) |
| 19 to 25 Years | 15 (100.0%) | 0 (0.0%) |
| 26 to 34 Years | 8 (80.0%) | 2 (20.0%) |
| 35 to 44 Years | 16 (48.5%) | 17 (51.5%) |
| 45 to 54 Years | 4 (50.0%) | 4 (50.0%) |
| 55 to 64 Years | 20 (83.3%) | 4 (16.7%) |
| 65 to 74 Years | 3 (100.0%) | 0 (0.0%) |
| 75 Years and older | 4 (100.0%) | 0 (0.0%) |
| Total | 106 (71.1%) | 43 (28.9%) |
Health Insurance Coverage by Citizenship Status in La Russell
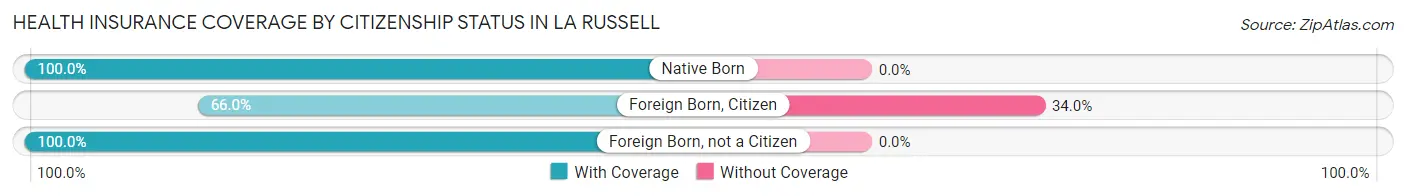
| Citizenship Status | With Coverage | Without Coverage |
| Native Born | 5 (100.0%) | 0 (0.0%) |
| Foreign Born, Citizen | 31 (66.0%) | 16 (34.0%) |
| Foreign Born, not a Citizen | 15 (100.0%) | 0 (0.0%) |
Health Insurance Coverage by Household Income in La Russell
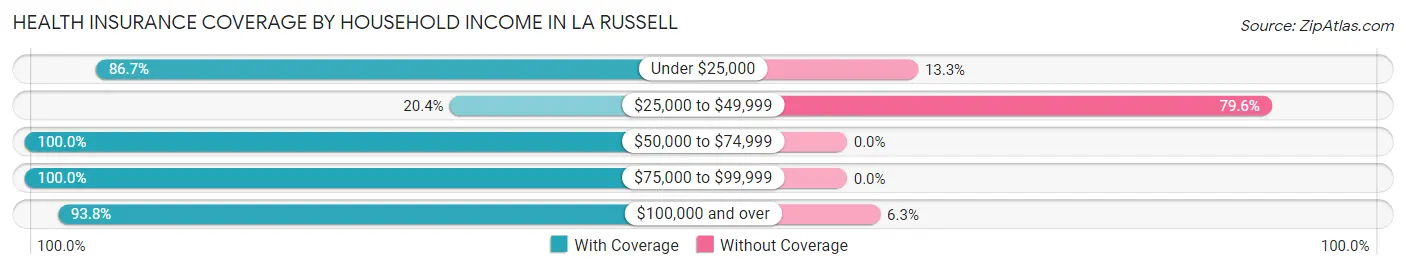
| Household Income | With Coverage | Without Coverage |
| Under $25,000 | 13 (86.7%) | 2 (13.3%) |
| $25,000 to $49,999 | 10 (20.4%) | 39 (79.6%) |
| $50,000 to $74,999 | 28 (100.0%) | 0 (0.0%) |
| $75,000 to $99,999 | 25 (100.0%) | 0 (0.0%) |
| $100,000 and over | 30 (93.8%) | 2 (6.2%) |
Public vs Private Health Insurance Coverage by Age in La Russell
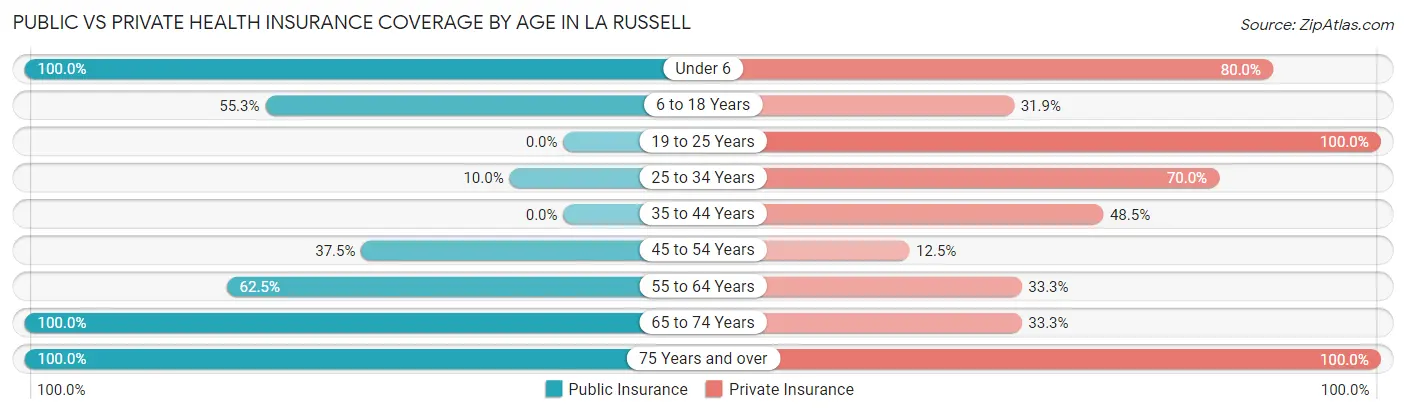
| Age Bracket | Public Insurance | Private Insurance |
| Under 6 | 5 (100.0%) | 4 (80.0%) |
| 6 to 18 Years | 26 (55.3%) | 15 (31.9%) |
| 19 to 25 Years | 0 (0.0%) | 15 (100.0%) |
| 25 to 34 Years | 1 (10.0%) | 7 (70.0%) |
| 35 to 44 Years | 0 (0.0%) | 16 (48.5%) |
| 45 to 54 Years | 3 (37.5%) | 1 (12.5%) |
| 55 to 64 Years | 15 (62.5%) | 8 (33.3%) |
| 65 to 74 Years | 3 (100.0%) | 1 (33.3%) |
| 75 Years and over | 4 (100.0%) | 4 (100.0%) |
| Total | 57 (38.3%) | 71 (47.6%) |
Disability Status by Sex by Age in La Russell
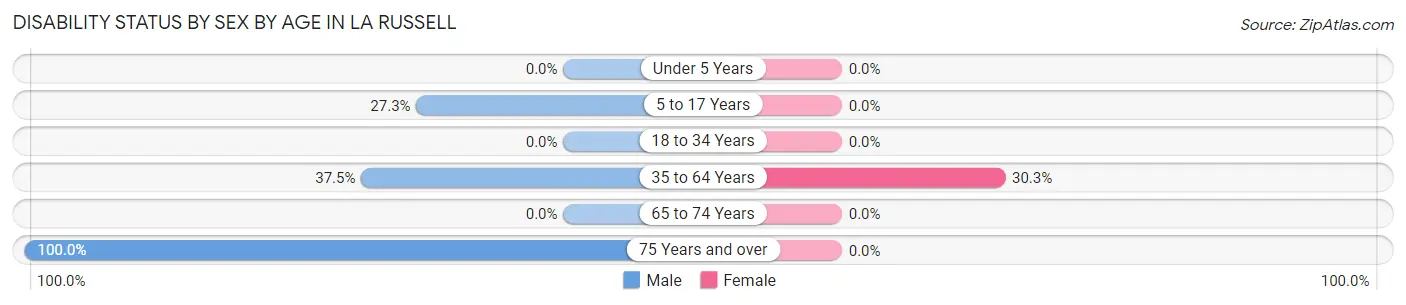
| Age Bracket | Male | Female |
| Under 5 Years | 0 (0.0%) | 0 (0.0%) |
| 5 to 17 Years | 3 (27.3%) | 0 (0.0%) |
| 18 to 34 Years | 0 (0.0%) | 0 (0.0%) |
| 35 to 64 Years | 12 (37.5%) | 10 (30.3%) |
| 65 to 74 Years | 0 (0.0%) | 0 (0.0%) |
| 75 Years and over | 2 (100.0%) | 0 (0.0%) |
Disability Class by Sex by Age in La Russell
Disability Class: Hearing Difficulty
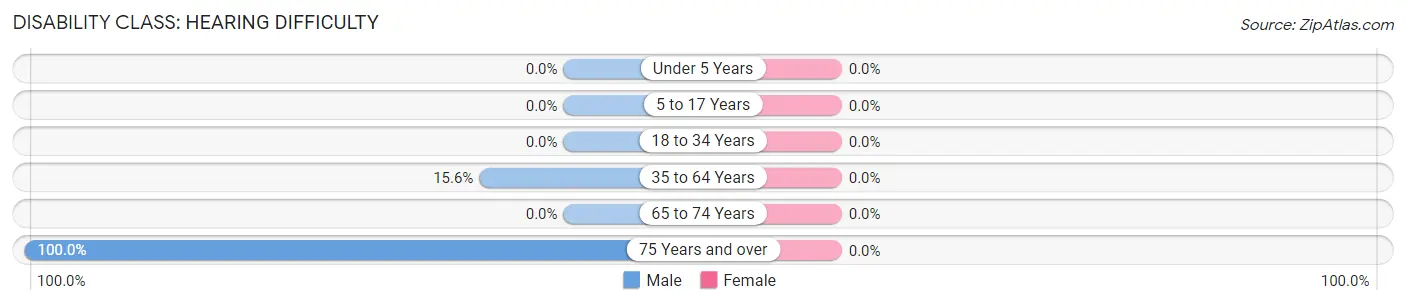
| Age Bracket | Male | Female |
| Under 5 Years | 0 (0.0%) | 0 (0.0%) |
| 5 to 17 Years | 0 (0.0%) | 0 (0.0%) |
| 18 to 34 Years | 0 (0.0%) | 0 (0.0%) |
| 35 to 64 Years | 5 (15.6%) | 0 (0.0%) |
| 65 to 74 Years | 0 (0.0%) | 0 (0.0%) |
| 75 Years and over | 2 (100.0%) | 0 (0.0%) |
Disability Class: Vision Difficulty
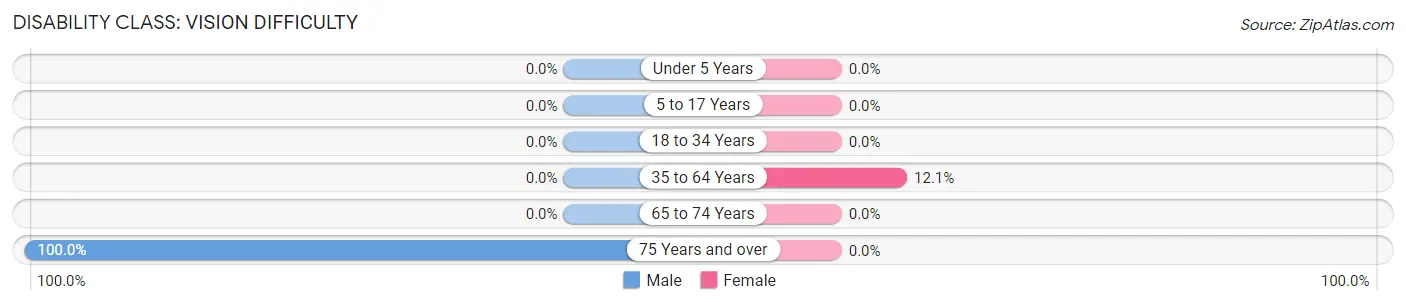
| Age Bracket | Male | Female |
| Under 5 Years | 0 (0.0%) | 0 (0.0%) |
| 5 to 17 Years | 0 (0.0%) | 0 (0.0%) |
| 18 to 34 Years | 0 (0.0%) | 0 (0.0%) |
| 35 to 64 Years | 0 (0.0%) | 4 (12.1%) |
| 65 to 74 Years | 0 (0.0%) | 0 (0.0%) |
| 75 Years and over | 2 (100.0%) | 0 (0.0%) |
Disability Class: Cognitive Difficulty
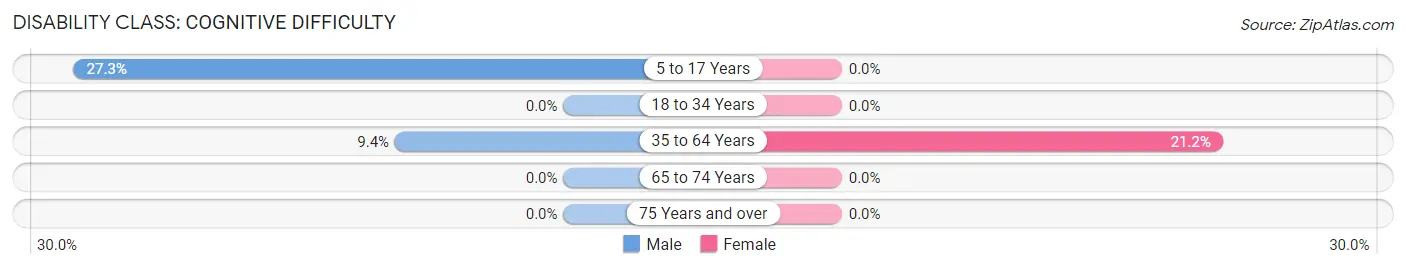
| Age Bracket | Male | Female |
| 5 to 17 Years | 3 (27.3%) | 0 (0.0%) |
| 18 to 34 Years | 0 (0.0%) | 0 (0.0%) |
| 35 to 64 Years | 3 (9.4%) | 7 (21.2%) |
| 65 to 74 Years | 0 (0.0%) | 0 (0.0%) |
| 75 Years and over | 0 (0.0%) | 0 (0.0%) |
Disability Class: Ambulatory Difficulty
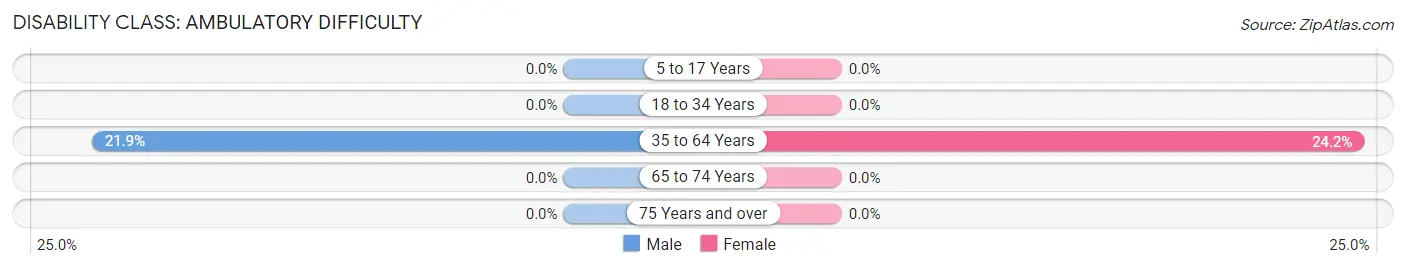
| Age Bracket | Male | Female |
| 5 to 17 Years | 0 (0.0%) | 0 (0.0%) |
| 18 to 34 Years | 0 (0.0%) | 0 (0.0%) |
| 35 to 64 Years | 7 (21.9%) | 8 (24.2%) |
| 65 to 74 Years | 0 (0.0%) | 0 (0.0%) |
| 75 Years and over | 0 (0.0%) | 0 (0.0%) |
Disability Class: Self-Care Difficulty
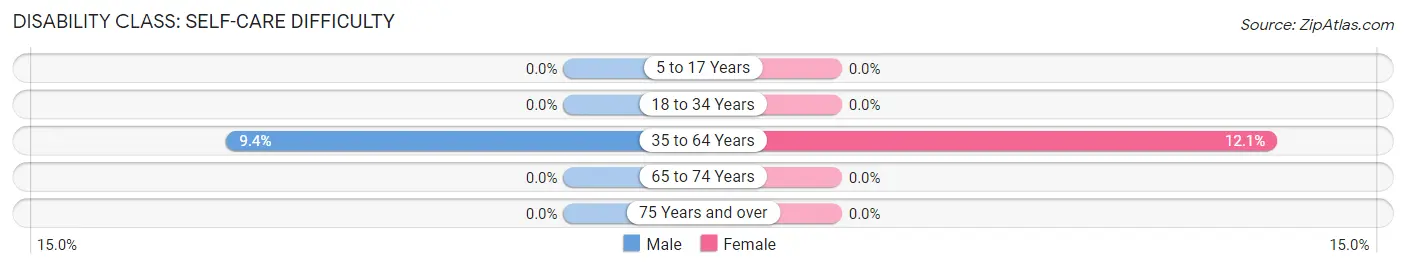
| Age Bracket | Male | Female |
| 5 to 17 Years | 0 (0.0%) | 0 (0.0%) |
| 18 to 34 Years | 0 (0.0%) | 0 (0.0%) |
| 35 to 64 Years | 3 (9.4%) | 4 (12.1%) |
| 65 to 74 Years | 0 (0.0%) | 0 (0.0%) |
| 75 Years and over | 0 (0.0%) | 0 (0.0%) |
Technology Access in La Russell
Computing Device Access in La Russell
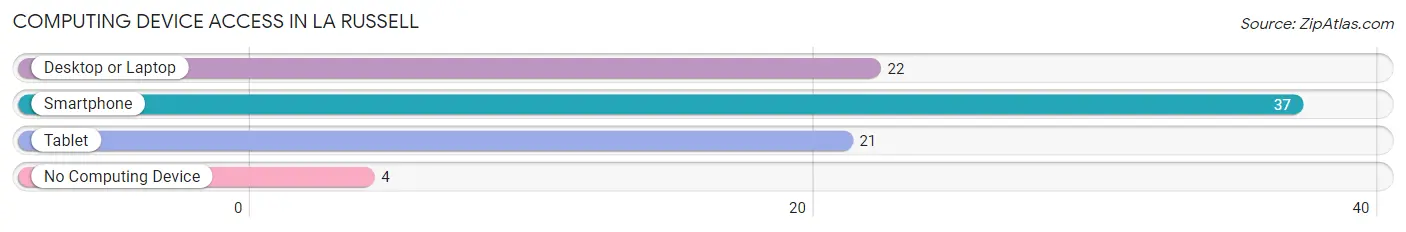
| Device Type | # Households | % Households |
| Desktop or Laptop | 22 | 53.7% |
| Smartphone | 37 | 90.2% |
| Tablet | 21 | 51.2% |
| No Computing Device | 4 | 9.8% |
| Total | 41 | 100.0% |
Internet Access in La Russell
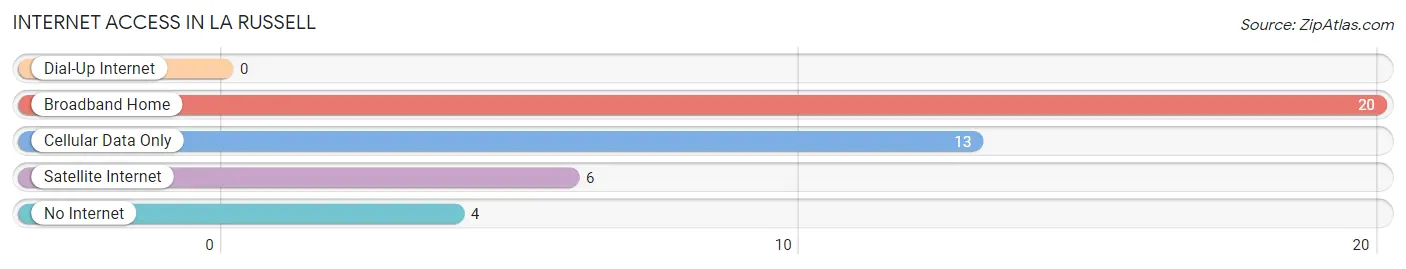
| Internet Type | # Households | % Households |
| Dial-Up Internet | 0 | 0.0% |
| Broadband Home | 20 | 48.8% |
| Cellular Data Only | 13 | 31.7% |
| Satellite Internet | 6 | 14.6% |
| No Internet | 4 | 9.8% |
| Total | 41 | 100.0% |
La Russell Summary
Russell, Missouri is a small town located in the southeastern corner of the state, in the Ozark Mountains. It is situated in the heart of the Ozark National Scenic Riverways, a protected area of the Ozark Mountains. The town is located in the county of Shannon, and is part of the Thayer Micropolitan Statistical Area. The population of Russell, Missouri was estimated to be around 1,000 people in 2020.
History
The town of Russell, Missouri was founded in 1883 by a group of settlers from the nearby town of Thayer. The settlers were looking for a place to settle and start a new life, and they chose the area around Russell because of its natural beauty and abundance of resources. The town was named after the Russell family, who were among the first settlers.
The town quickly grew and prospered, and by the early 1900s, it had become a thriving community. The town was home to several businesses, including a general store, a blacksmith shop, a sawmill, and a gristmill. The town also had a school, a post office, and a church.
In the early 1900s, the town was also home to a number of coal mines, which provided employment for many of the town's residents. The coal mines were eventually closed, but the town continued to thrive.
Geography
Russell, Missouri is located in the southeastern corner of the state, in the Ozark Mountains. The town is situated in the heart of the Ozark National Scenic Riverways, a protected area of the Ozark Mountains. The town is located in the county of Shannon, and is part of the Thayer Micropolitan Statistical Area.
The town is situated on the banks of the Current River, which is a popular destination for fishing, canoeing, and other outdoor activities. The town is also located near several state parks, including the Mark Twain National Forest, the Ozark National Scenic Riverways, and the Big Spring State Park.
Economy
The economy of Russell, Missouri is largely based on tourism and agriculture. The town is home to several tourist attractions, including the Ozark National Scenic Riverways, the Mark Twain National Forest, and the Big Spring State Park. The town is also home to several wineries, which attract visitors from all over the country.
Agriculture is also an important part of the local economy. The town is home to several farms, which produce a variety of crops, including corn, soybeans, wheat, and hay. The town is also home to several livestock farms, which produce beef, pork, and poultry.
Demographics
The population of Russell, Missouri was estimated to be around 1,000 people in 2020. The town is predominantly white, with around 95% of the population identifying as white. The remaining 5% of the population is made up of African Americans, Hispanics, and other ethnicities.
The median household income in Russell, Missouri is around $35,000, which is slightly lower than the national average. The town has a poverty rate of around 15%, which is slightly higher than the national average. The town also has a high rate of unemployment, with around 10% of the population being unemployed.
Common Questions
What is Per Capita Income in La Russell?
Per Capita income in La Russell is $15,260.
What is the Median Family Income in La Russell?
Median Family Income in La Russell is $50,938.
What is the Median Household income in La Russell?
Median Household Income in La Russell is $49,750.
What is Inequality or Gini Index in La Russell?
Inequality or Gini Index in La Russell is 0.32.
What is the Total Population of La Russell?
Total Population of La Russell is 149.
What is the Total Male Population of La Russell?
Total Male Population of La Russell is 60.
What is the Total Female Population of La Russell?
Total Female Population of La Russell is 89.
What is the Ratio of Males per 100 Females in La Russell?
There are 67.42 Males per 100 Females in La Russell.
What is the Ratio of Females per 100 Males in La Russell?
There are 148.33 Females per 100 Males in La Russell.
What is the Median Population Age in La Russell?
Median Population Age in La Russell is 34.2 Years.
What is the Average Family Size in La Russell
Average Family Size in La Russell is 3.8 People.
What is the Average Household Size in La Russell
Average Household Size in La Russell is 3.6 People.
How Large is the Labor Force in La Russell?
There are 57 People in the Labor Forcein in La Russell.
What is the Percentage of People in the Labor Force in La Russell?
52.3% of People are in the Labor Force in La Russell.
What is the Unemployment Rate in La Russell?
Unemployment Rate in La Russell is 1.8%.