Clarksburg, MO Map & Demographics
Clarksburg Map
Clarksburg Overview
$15,719
PER CAPITA INCOME
$24,286
AVG FAMILY INCOME
$26,250
AVG HOUSEHOLD INCOME
29.5%
WAGE / INCOME GAP [ % ]
70.5¢/ $1
WAGE / INCOME GAP [ $ ]
0.42
INEQUALITY / GINI INDEX
293
TOTAL POPULATION
128
MALE POPULATION
165
FEMALE POPULATION
77.58
MALES / 100 FEMALES
128.91
FEMALES / 100 MALES
35.1
MEDIAN AGE
2.6
AVG FAMILY SIZE
2.4
AVG HOUSEHOLD SIZE
112
LABOR FORCE [ PEOPLE ]
51.1%
PERCENT IN LABOR FORCE
32.1%
UNEMPLOYMENT RATE
Clarksburg Zip Codes
Clarksburg Area Codes
Income in Clarksburg
Income Overview in Clarksburg
Per Capita Income in Clarksburg is $15,719, while median incomes of families and households are $24,286 and $26,250 respectively.
| Characteristic | Number | Measure |
| Per Capita Income | 293 | $15,719 |
| Median Family Income | 80 | $24,286 |
| Mean Family Income | 80 | $40,640 |
| Median Household Income | 124 | $26,250 |
| Mean Household Income | 124 | $38,323 |
| Income Deficit | 80 | $0 |
| Wage / Income Gap (%) | 293 | 29.48% |
| Wage / Income Gap ($) | 293 | 70.52¢ per $1 |
| Gini / Inequality Index | 293 | 0.42 |
Earnings by Sex in Clarksburg
Average Earnings in Clarksburg are $18,750, $23,929 for men and $16,875 for women, a difference of 29.5%.
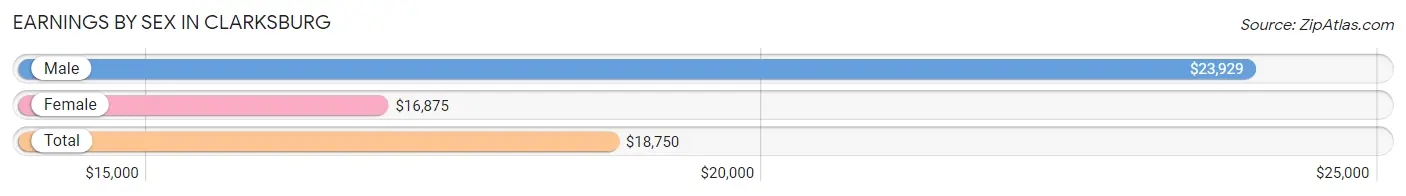
| Sex | Number | Average Earnings |
| Male | 38 (35.8%) | $23,929 |
| Female | 68 (64.1%) | $16,875 |
| Total | 106 (100.0%) | $18,750 |
Earnings by Sex by Income Bracket in Clarksburg
The most common earnings brackets in Clarksburg are $22,500 to $24,999 for men (7 | 18.4%) and $15,000 to $17,499 for women (24 | 35.3%).
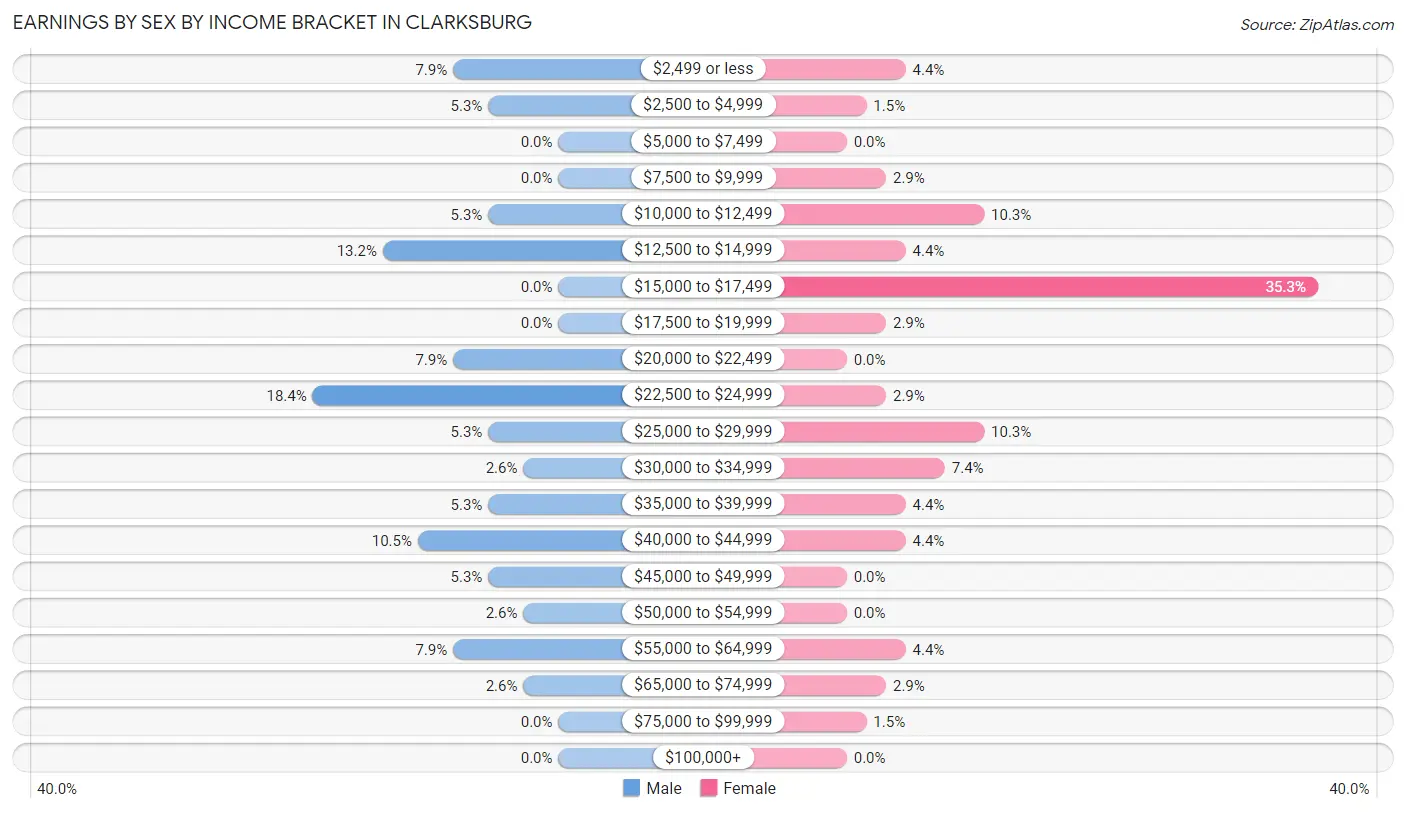
| Income | Male | Female |
| $2,499 or less | 3 (7.9%) | 3 (4.4%) |
| $2,500 to $4,999 | 2 (5.3%) | 1 (1.5%) |
| $5,000 to $7,499 | 0 (0.0%) | 0 (0.0%) |
| $7,500 to $9,999 | 0 (0.0%) | 2 (2.9%) |
| $10,000 to $12,499 | 2 (5.3%) | 7 (10.3%) |
| $12,500 to $14,999 | 5 (13.2%) | 3 (4.4%) |
| $15,000 to $17,499 | 0 (0.0%) | 24 (35.3%) |
| $17,500 to $19,999 | 0 (0.0%) | 2 (2.9%) |
| $20,000 to $22,499 | 3 (7.9%) | 0 (0.0%) |
| $22,500 to $24,999 | 7 (18.4%) | 2 (2.9%) |
| $25,000 to $29,999 | 2 (5.3%) | 7 (10.3%) |
| $30,000 to $34,999 | 1 (2.6%) | 5 (7.3%) |
| $35,000 to $39,999 | 2 (5.3%) | 3 (4.4%) |
| $40,000 to $44,999 | 4 (10.5%) | 3 (4.4%) |
| $45,000 to $49,999 | 2 (5.3%) | 0 (0.0%) |
| $50,000 to $54,999 | 1 (2.6%) | 0 (0.0%) |
| $55,000 to $64,999 | 3 (7.9%) | 3 (4.4%) |
| $65,000 to $74,999 | 1 (2.6%) | 2 (2.9%) |
| $75,000 to $99,999 | 0 (0.0%) | 1 (1.5%) |
| $100,000+ | 0 (0.0%) | 0 (0.0%) |
| Total | 38 (100.0%) | 68 (100.0%) |
Earnings by Sex by Educational Attainment in Clarksburg
Average earnings in Clarksburg are $24,821 for men and $16,902 for women, a difference of 31.9%. Men with an educational attainment of college or associate's degree enjoy the highest average annual earnings of $40,000, while those with high school diploma education earn the least with $23,750. Women with an educational attainment of college or associate's degree earn the most with the average annual earnings of $28,125, while those with high school diploma education have the smallest earnings of $16,739.
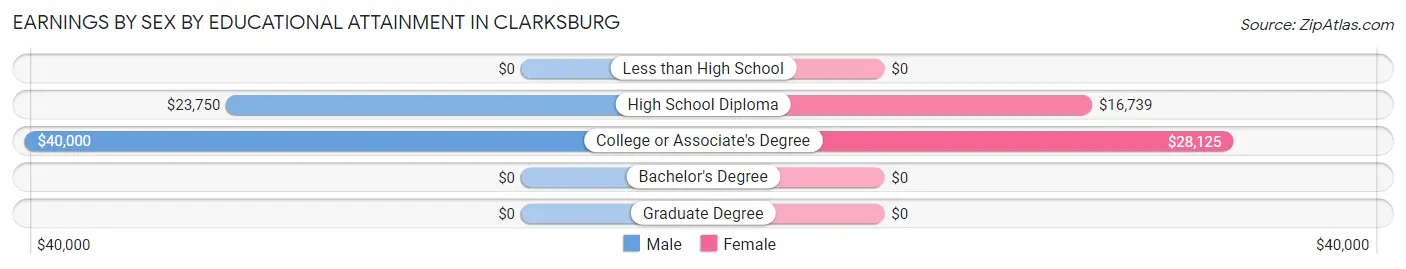
| Educational Attainment | Male Income | Female Income |
| Less than High School | - | - |
| High School Diploma | $23,750 | $16,739 |
| College or Associate's Degree | $40,000 | $28,125 |
| Bachelor's Degree | - | - |
| Graduate Degree | - | - |
| Total | $24,821 | $16,902 |
Family Income in Clarksburg
Family Income Brackets in Clarksburg
According to the Clarksburg family income data, there are 26 families falling into the $15,000 to $24,999 income range, which is the most common income bracket and makes up 32.5% of all families.
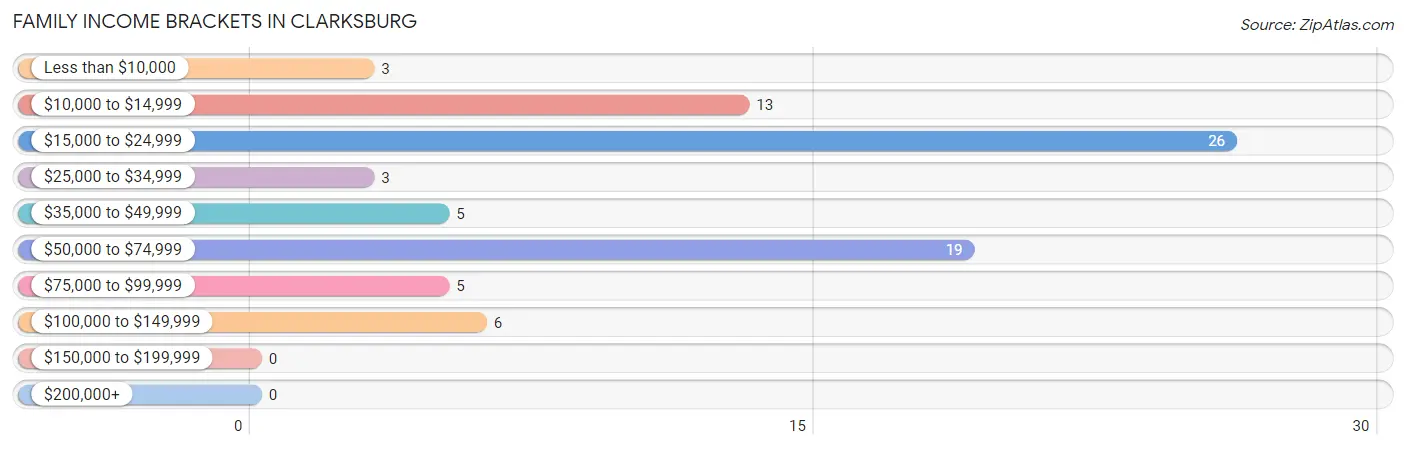
| Income Bracket | # Families | % Families |
| Less than $10,000 | 3 | 3.8% |
| $10,000 to $14,999 | 13 | 16.3% |
| $15,000 to $24,999 | 26 | 32.5% |
| $25,000 to $34,999 | 3 | 3.8% |
| $35,000 to $49,999 | 5 | 6.3% |
| $50,000 to $74,999 | 19 | 23.8% |
| $75,000 to $99,999 | 5 | 6.3% |
| $100,000 to $149,999 | 6 | 7.5% |
| $150,000 to $199,999 | 0 | 0.0% |
| $200,000+ | 0 | 0.0% |
Family Income by Famaliy Size in Clarksburg
3-person families (11 | 13.8%) account for the highest median family income in Clarksburg with $87,917 per family, while 3-person families (11 | 13.8%) have the highest median income of $29,306 per family member.
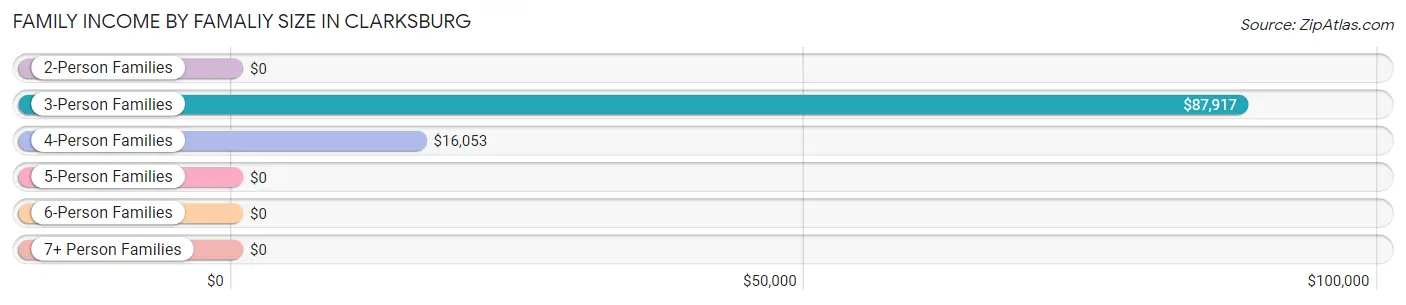
| Income Bracket | # Families | Median Income |
| 2-Person Families | 35 (43.8%) | $0 |
| 3-Person Families | 11 (13.8%) | $87,917 |
| 4-Person Families | 32 (40.0%) | $16,053 |
| 5-Person Families | 2 (2.5%) | $0 |
| 6-Person Families | 0 (0.0%) | $0 |
| 7+ Person Families | 0 (0.0%) | $0 |
| Total | 80 (100.0%) | $24,286 |
Family Income by Number of Earners in Clarksburg
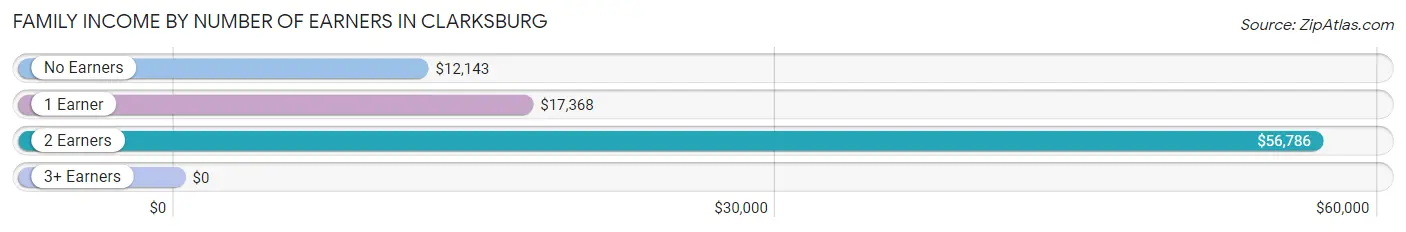
| Number of Earners | # Families | Median Income |
| No Earners | 18 (22.5%) | $12,143 |
| 1 Earner | 46 (57.5%) | $17,368 |
| 2 Earners | 14 (17.5%) | $56,786 |
| 3+ Earners | 2 (2.5%) | $0 |
| Total | 80 (100.0%) | $24,286 |
Household Income in Clarksburg
Household Income Brackets in Clarksburg
With 37 households falling in the category, the $15,000 to $24,999 income range is the most frequent in Clarksburg, accounting for 29.8% of all households.
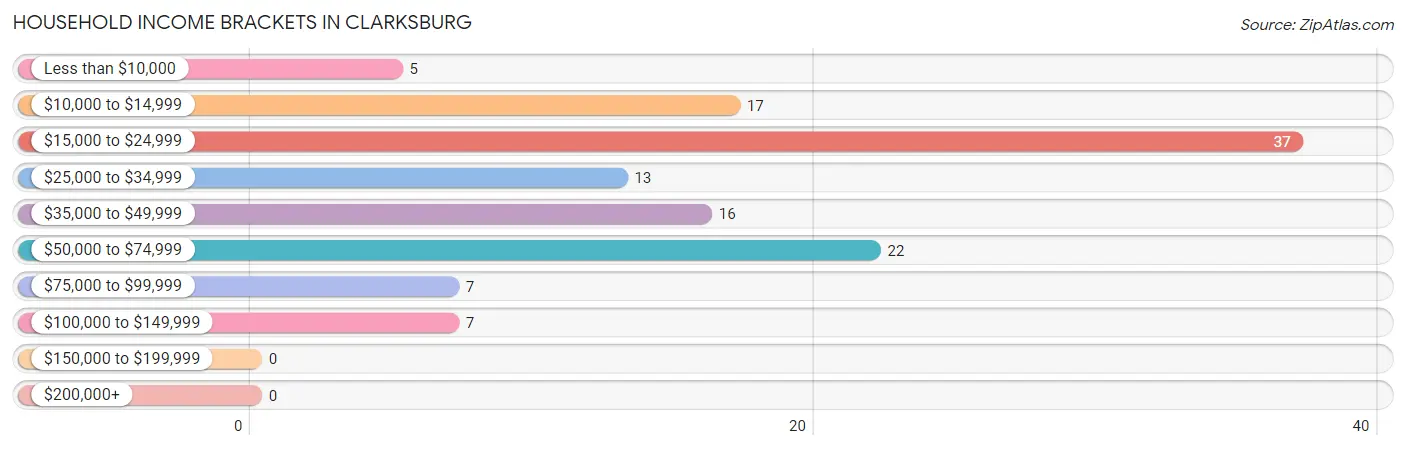
| Income Bracket | # Households | % Households |
| Less than $10,000 | 5 | 4.0% |
| $10,000 to $14,999 | 17 | 13.7% |
| $15,000 to $24,999 | 37 | 29.8% |
| $25,000 to $34,999 | 13 | 10.5% |
| $35,000 to $49,999 | 16 | 12.9% |
| $50,000 to $74,999 | 22 | 17.7% |
| $75,000 to $99,999 | 7 | 5.6% |
| $100,000 to $149,999 | 7 | 5.6% |
| $150,000 to $199,999 | 0 | 0.0% |
| $200,000+ | 0 | 0.0% |
Household Income by Householder Age in Clarksburg
The median household income in Clarksburg is $26,250, with the highest median household income of $47,500 found in the 65+ years age bracket for the primary householder. A total of 26 households (21.0%) fall into this category. Meanwhile, the 15 to 24 years age bracket for the primary householder has the lowest median household income of $0, with 11 households (8.9%) in this group.
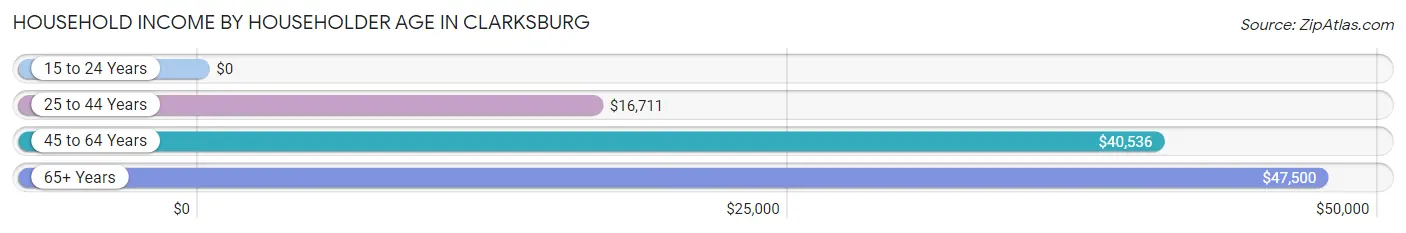
| Income Bracket | # Households | Median Income |
| 15 to 24 Years | 11 (8.9%) | $0 |
| 25 to 44 Years | 50 (40.3%) | $16,711 |
| 45 to 64 Years | 37 (29.8%) | $40,536 |
| 65+ Years | 26 (21.0%) | $47,500 |
| Total | 124 (100.0%) | $26,250 |
Poverty in Clarksburg
Income Below Poverty by Sex and Age in Clarksburg
With 47.7% poverty level for males and 55.1% for females among the residents of Clarksburg, 6 to 11 year old males and under 5 year old females are the most vulnerable to poverty, with 16 males (88.9%) and 16 females (84.2%) in their respective age groups living below the poverty level.
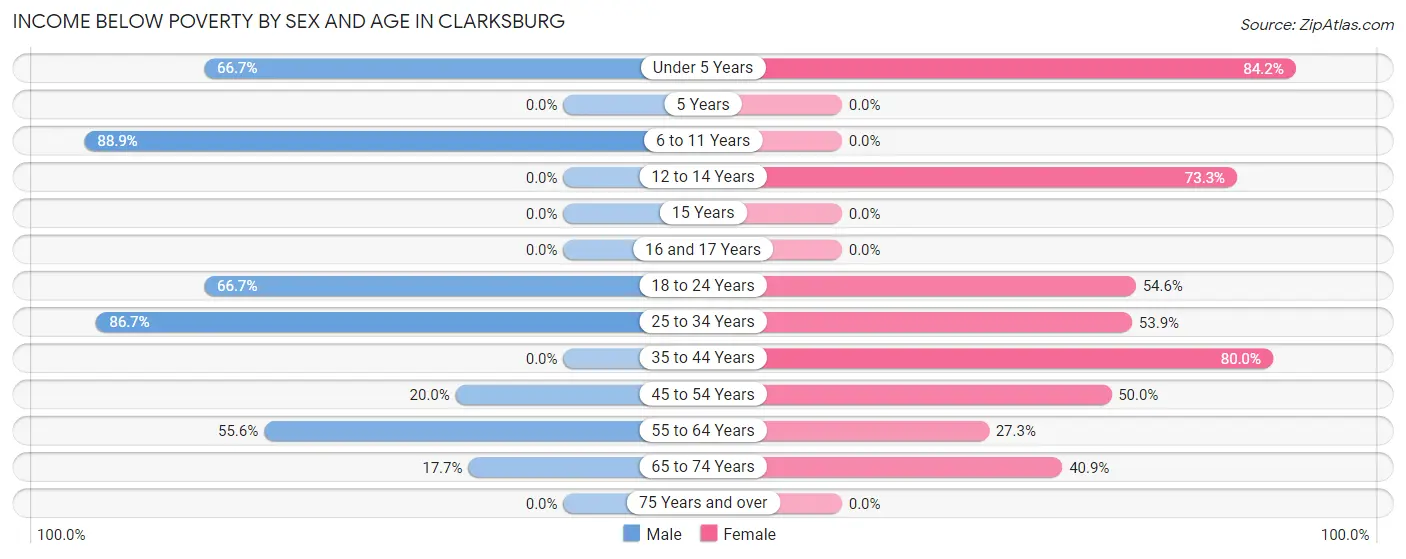
| Age Bracket | Male | Female |
| Under 5 Years | 8 (66.7%) | 16 (84.2%) |
| 5 Years | 0 (0.0%) | 0 (0.0%) |
| 6 to 11 Years | 16 (88.9%) | 0 (0.0%) |
| 12 to 14 Years | 0 (0.0%) | 11 (73.3%) |
| 15 Years | 0 (0.0%) | 0 (0.0%) |
| 16 and 17 Years | 0 (0.0%) | 0 (0.0%) |
| 18 to 24 Years | 10 (66.7%) | 12 (54.5%) |
| 25 to 34 Years | 13 (86.7%) | 7 (53.8%) |
| 35 to 44 Years | 0 (0.0%) | 20 (80.0%) |
| 45 to 54 Years | 1 (20.0%) | 13 (50.0%) |
| 55 to 64 Years | 10 (55.6%) | 3 (27.3%) |
| 65 to 74 Years | 3 (17.6%) | 9 (40.9%) |
| 75 Years and over | 0 (0.0%) | 0 (0.0%) |
| Total | 61 (47.7%) | 91 (55.1%) |
Income Above Poverty by Sex and Age in Clarksburg
According to the poverty statistics in Clarksburg, males aged 15 years and females aged 6 to 11 years are the age groups that are most secure financially, with 100.0% of males and 100.0% of females in these age groups living above the poverty line.
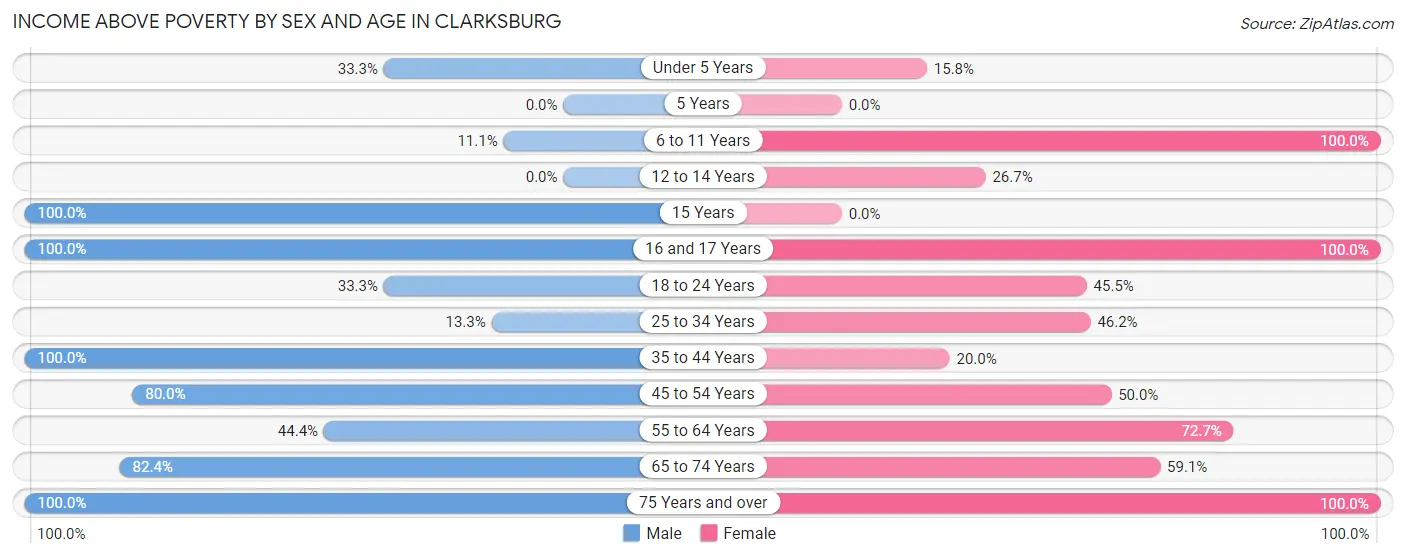
| Age Bracket | Male | Female |
| Under 5 Years | 4 (33.3%) | 3 (15.8%) |
| 5 Years | 0 (0.0%) | 0 (0.0%) |
| 6 to 11 Years | 2 (11.1%) | 4 (100.0%) |
| 12 to 14 Years | 0 (0.0%) | 4 (26.7%) |
| 15 Years | 6 (100.0%) | 0 (0.0%) |
| 16 and 17 Years | 3 (100.0%) | 4 (100.0%) |
| 18 to 24 Years | 5 (33.3%) | 10 (45.5%) |
| 25 to 34 Years | 2 (13.3%) | 6 (46.2%) |
| 35 to 44 Years | 15 (100.0%) | 5 (20.0%) |
| 45 to 54 Years | 4 (80.0%) | 13 (50.0%) |
| 55 to 64 Years | 8 (44.4%) | 8 (72.7%) |
| 65 to 74 Years | 14 (82.4%) | 13 (59.1%) |
| 75 Years and over | 4 (100.0%) | 4 (100.0%) |
| Total | 67 (52.3%) | 74 (44.9%) |
Income Below Poverty Among Married-Couple Families in Clarksburg
The poverty statistics for married-couple families in Clarksburg show that 6.9% or 2 of the total 29 families live below the poverty line. Families with no children have the highest poverty rate of 8.0%, comprising of 2 families. On the other hand, families with 1 or 2 children have the lowest poverty rate of 0.0%, which includes 0 families.
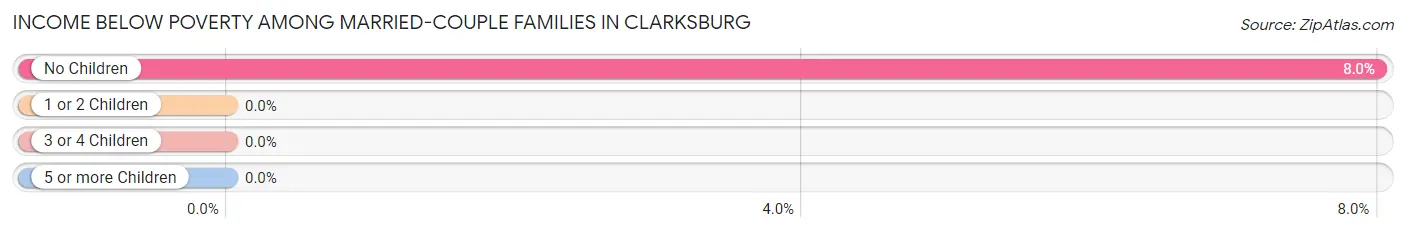
| Children | Above Poverty | Below Poverty |
| No Children | 23 (92.0%) | 2 (8.0%) |
| 1 or 2 Children | 4 (100.0%) | 0 (0.0%) |
| 3 or 4 Children | 0 (0.0%) | 0 (0.0%) |
| 5 or more Children | 0 (0.0%) | 0 (0.0%) |
| Total | 27 (93.1%) | 2 (6.9%) |
Income Below Poverty Among Single-Parent Households in Clarksburg
According to the poverty data in Clarksburg, 26.3% or 5 single-father households and 87.5% or 28 single-mother households are living below the poverty line. Among single-father households, those with 3 or 4 children have the highest poverty rate, with 5 households (71.4%) experiencing poverty. Likewise, among single-mother households, those with 3 or 4 children have the highest poverty rate, with 3 households (100.0%) falling below the poverty line.
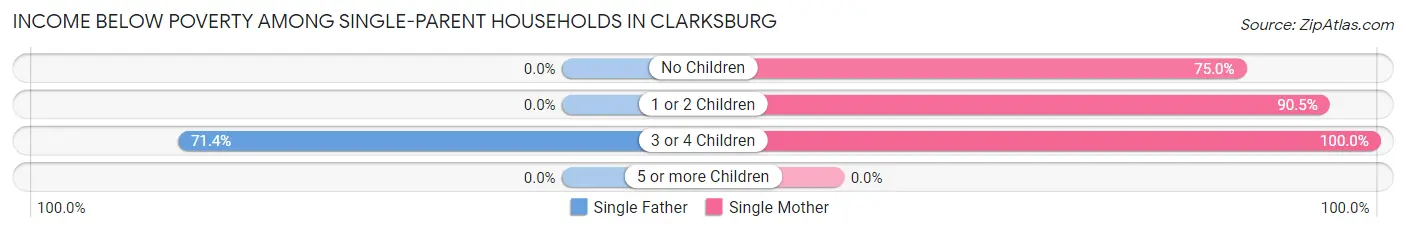
| Children | Single Father | Single Mother |
| No Children | 0 (0.0%) | 6 (75.0%) |
| 1 or 2 Children | 0 (0.0%) | 19 (90.5%) |
| 3 or 4 Children | 5 (71.4%) | 3 (100.0%) |
| 5 or more Children | 0 (0.0%) | 0 (0.0%) |
| Total | 5 (26.3%) | 28 (87.5%) |
Income Below Poverty Among Married-Couple vs Single-Parent Households in Clarksburg
The poverty data for Clarksburg shows that 2 of the married-couple family households (6.9%) and 33 of the single-parent households (64.7%) are living below the poverty level. Within the married-couple family households, those with no children have the highest poverty rate, with 2 households (8.0%) falling below the poverty line. Among the single-parent households, those with 3 or 4 children have the highest poverty rate, with 8 household (80.0%) living below poverty.
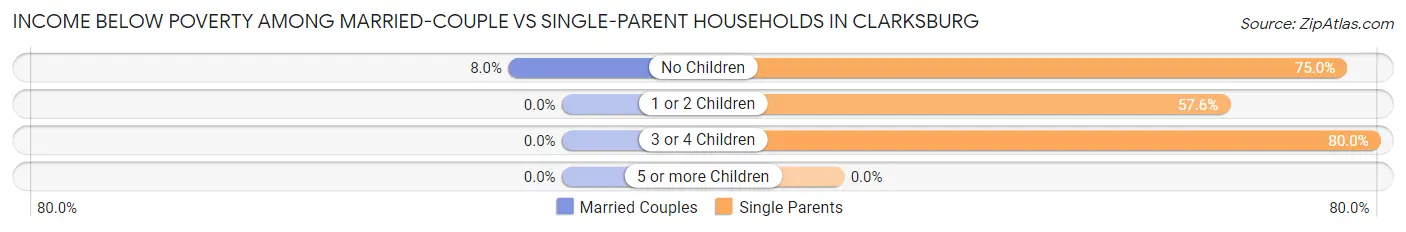
| Children | Married-Couple Families | Single-Parent Households |
| No Children | 2 (8.0%) | 6 (75.0%) |
| 1 or 2 Children | 0 (0.0%) | 19 (57.6%) |
| 3 or 4 Children | 0 (0.0%) | 8 (80.0%) |
| 5 or more Children | 0 (0.0%) | 0 (0.0%) |
| Total | 2 (6.9%) | 33 (64.7%) |
Race in Clarksburg
The most populous races in Clarksburg are White / Caucasian (278 | 94.9%), Two or more Races (13 | 4.4%), and Hispanic or Latino (11 | 3.7%).
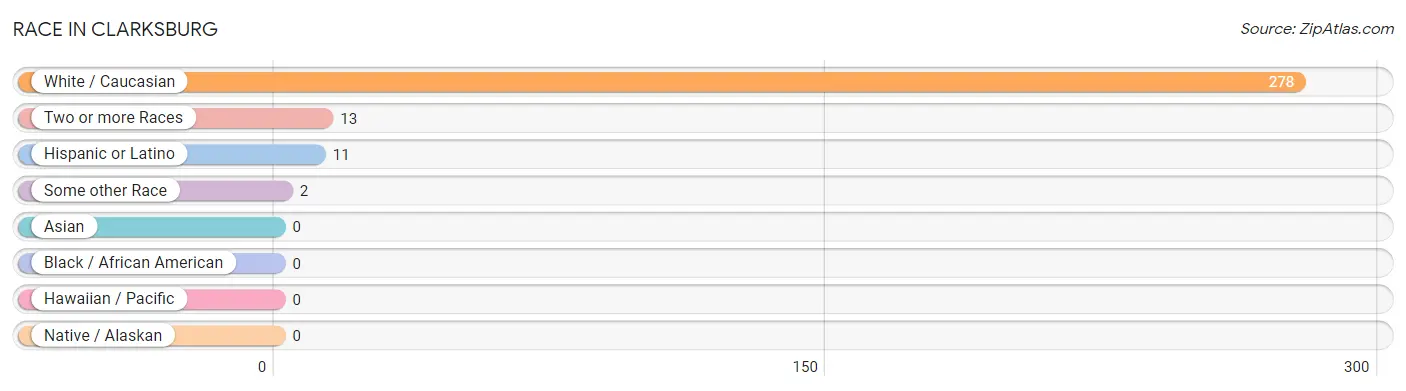
| Race | # Population | % Population |
| Asian | 0 | 0.0% |
| Black / African American | 0 | 0.0% |
| Hawaiian / Pacific | 0 | 0.0% |
| Hispanic or Latino | 11 | 3.7% |
| Native / Alaskan | 0 | 0.0% |
| White / Caucasian | 278 | 94.9% |
| Two or more Races | 13 | 4.4% |
| Some other Race | 2 | 0.7% |
| Total | 293 | 100.0% |
Ancestry in Clarksburg
The most populous ancestries reported in Clarksburg are Irish (60 | 20.5%), American (58 | 19.8%), German (43 | 14.7%), English (21 | 7.2%), and Mexican (8 | 2.7%), together accounting for 64.9% of all Clarksburg residents.
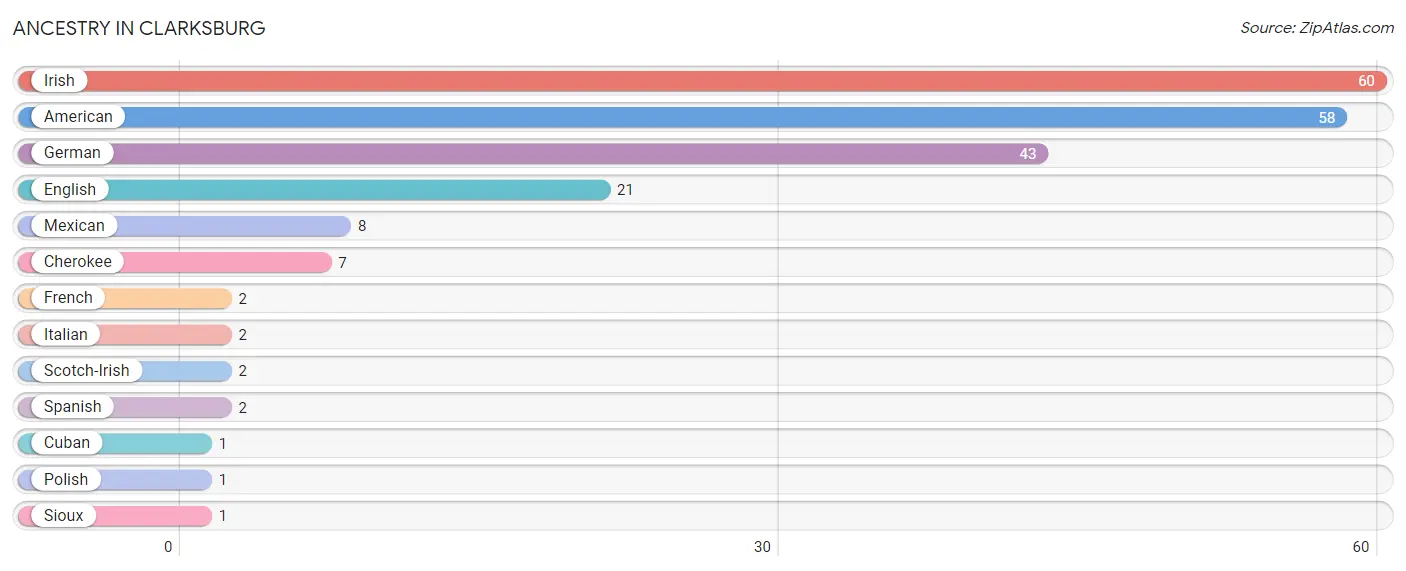
| Ancestry | # Population | % Population |
| American | 58 | 19.8% |
| Cherokee | 7 | 2.4% |
| Cuban | 1 | 0.3% |
| English | 21 | 7.2% |
| French | 2 | 0.7% |
| German | 43 | 14.7% |
| Irish | 60 | 20.5% |
| Italian | 2 | 0.7% |
| Mexican | 8 | 2.7% |
| Polish | 1 | 0.3% |
| Scotch-Irish | 2 | 0.7% |
| Sioux | 1 | 0.3% |
| Spanish | 2 | 0.7% | View All 13 Rows |
Immigrants in Clarksburg
The most numerous immigrant groups reported in Clarksburg came from Central America (4 | 1.4%), Latin America (4 | 1.4%), and Mexico (4 | 1.4%), together accounting for 4.1% of all Clarksburg residents.
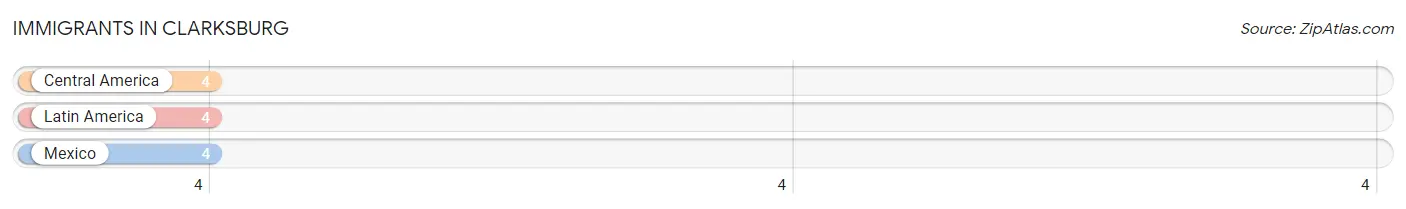
| Immigration Origin | # Population | % Population |
| Central America | 4 | 1.4% |
| Latin America | 4 | 1.4% |
| Mexico | 4 | 1.4% | View All 3 Rows |
Sex and Age in Clarksburg
Sex and Age in Clarksburg
The most populous age groups in Clarksburg are 15 to 19 Years (19 | 14.8%) for men and 40 to 44 Years (24 | 14.5%) for women.
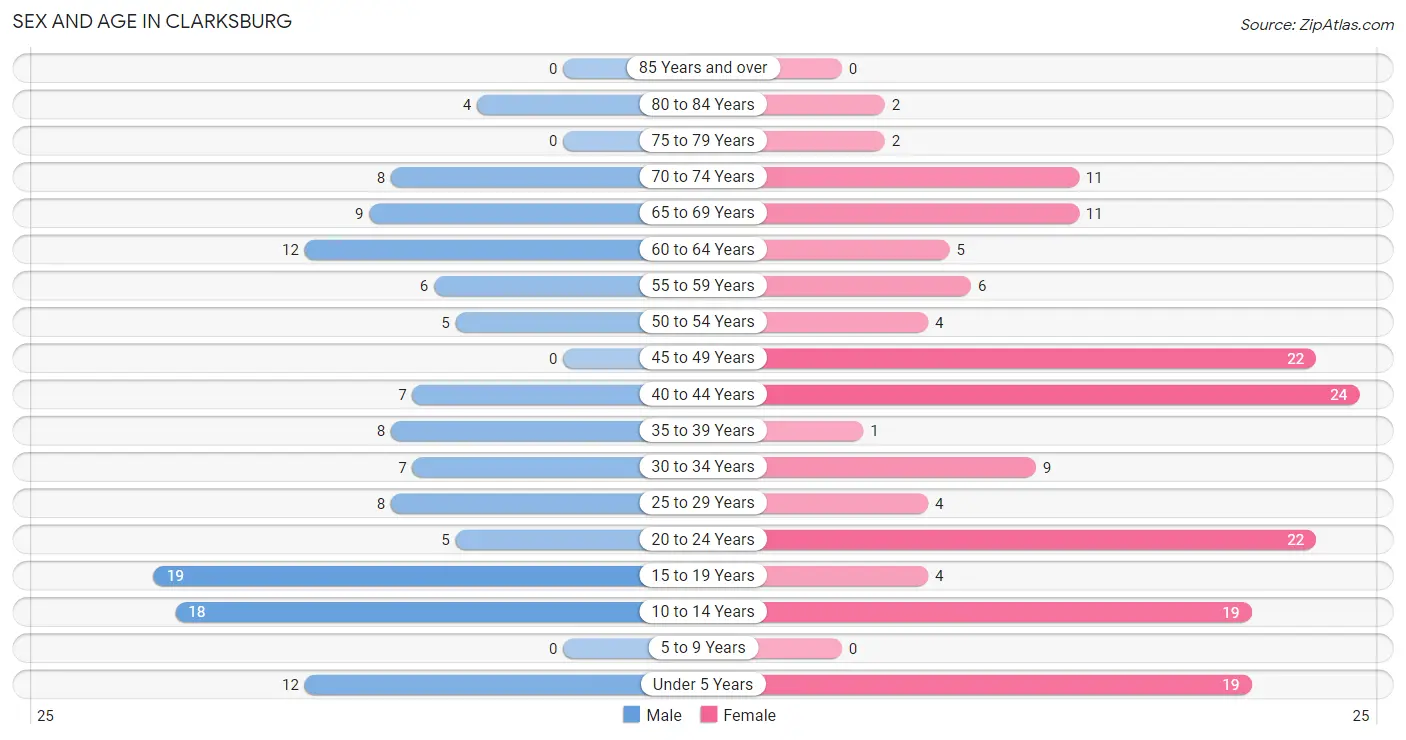
| Age Bracket | Male | Female |
| Under 5 Years | 12 (9.4%) | 19 (11.5%) |
| 5 to 9 Years | 0 (0.0%) | 0 (0.0%) |
| 10 to 14 Years | 18 (14.1%) | 19 (11.5%) |
| 15 to 19 Years | 19 (14.8%) | 4 (2.4%) |
| 20 to 24 Years | 5 (3.9%) | 22 (13.3%) |
| 25 to 29 Years | 8 (6.2%) | 4 (2.4%) |
| 30 to 34 Years | 7 (5.5%) | 9 (5.4%) |
| 35 to 39 Years | 8 (6.2%) | 1 (0.6%) |
| 40 to 44 Years | 7 (5.5%) | 24 (14.5%) |
| 45 to 49 Years | 0 (0.0%) | 22 (13.3%) |
| 50 to 54 Years | 5 (3.9%) | 4 (2.4%) |
| 55 to 59 Years | 6 (4.7%) | 6 (3.6%) |
| 60 to 64 Years | 12 (9.4%) | 5 (3.0%) |
| 65 to 69 Years | 9 (7.0%) | 11 (6.7%) |
| 70 to 74 Years | 8 (6.2%) | 11 (6.7%) |
| 75 to 79 Years | 0 (0.0%) | 2 (1.2%) |
| 80 to 84 Years | 4 (3.1%) | 2 (1.2%) |
| 85 Years and over | 0 (0.0%) | 0 (0.0%) |
| Total | 128 (100.0%) | 165 (100.0%) |
Families and Households in Clarksburg
Median Family Size in Clarksburg
The median family size in Clarksburg is 2.58 persons per family, with single male/father families (19 | 23.7%) accounting for the largest median family size of 3.21 persons per family. On the other hand, married-couple families (29 | 36.2%) represent the smallest median family size with 2.14 persons per family.
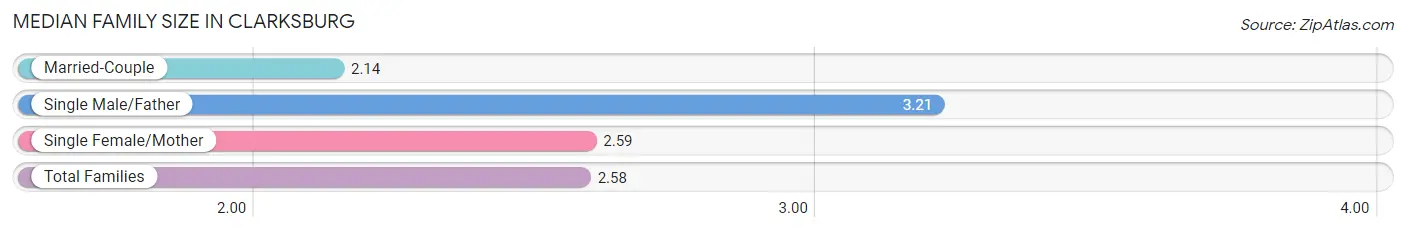
| Family Type | # Families | Family Size |
| Married-Couple | 29 (36.2%) | 2.14 |
| Single Male/Father | 19 (23.7%) | 3.21 |
| Single Female/Mother | 32 (40.0%) | 2.59 |
| Total Families | 80 (100.0%) | 2.58 |
Median Household Size in Clarksburg
The median household size in Clarksburg is 2.36 persons per household, with single male/father households (19 | 15.3%) accounting for the largest median household size of 3.79 persons per household. non-family households (44 | 35.5%) represent the smallest median household size with 1.73 persons per household.
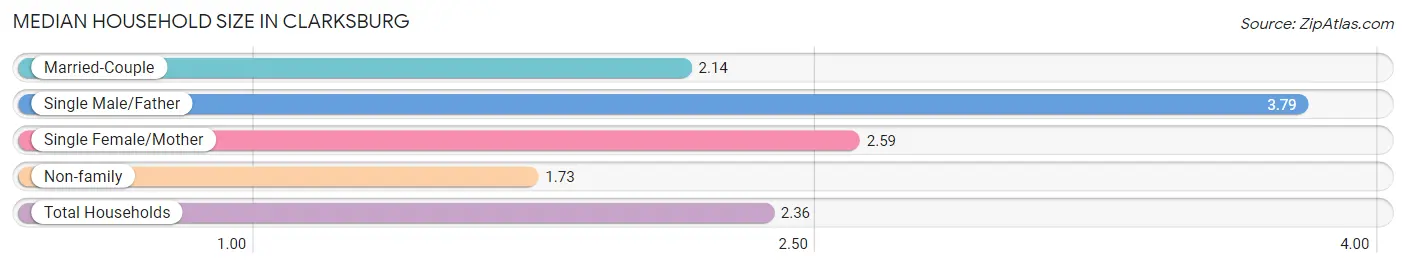
| Household Type | # Households | Household Size |
| Married-Couple | 29 (23.4%) | 2.14 |
| Single Male/Father | 19 (15.3%) | 3.79 |
| Single Female/Mother | 32 (25.8%) | 2.59 |
| Non-family | 44 (35.5%) | 1.73 |
| Total Households | 124 (100.0%) | 2.36 |
Household Size by Marriage Status in Clarksburg
Out of a total of 124 households in Clarksburg, 80 (64.5%) are family households, while 44 (35.5%) are nonfamily households. The most numerous type of family households are 2-person households, comprising 33, and the most common type of nonfamily households are 1-person households, comprising 28.
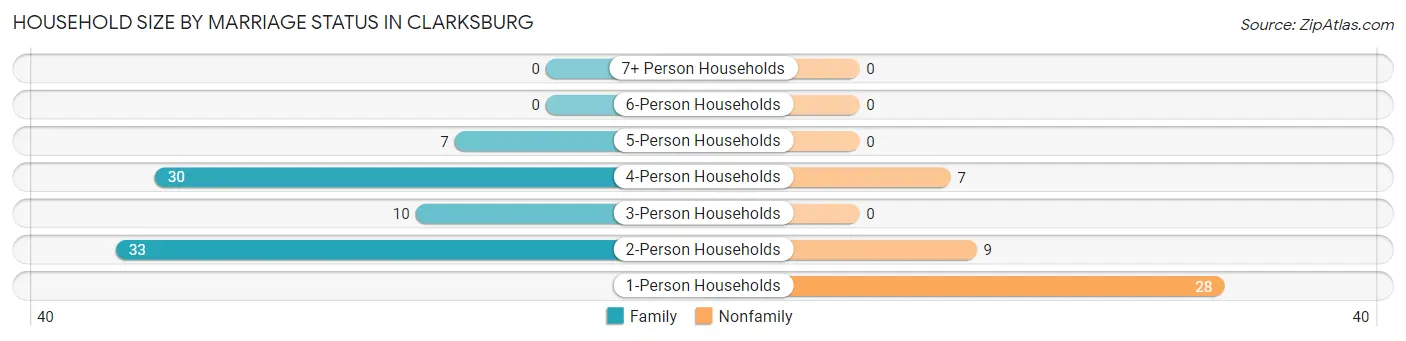
| Household Size | Family Households | Nonfamily Households |
| 1-Person Households | - | 28 (22.6%) |
| 2-Person Households | 33 (26.6%) | 9 (7.3%) |
| 3-Person Households | 10 (8.1%) | 0 (0.0%) |
| 4-Person Households | 30 (24.2%) | 7 (5.7%) |
| 5-Person Households | 7 (5.7%) | 0 (0.0%) |
| 6-Person Households | 0 (0.0%) | 0 (0.0%) |
| 7+ Person Households | 0 (0.0%) | 0 (0.0%) |
| Total | 80 (64.5%) | 44 (35.5%) |
Female Fertility in Clarksburg
Fertility by Age in Clarksburg
Average fertility rate in Clarksburg is 159.0 births per 1,000 women. Women in the age bracket of 20 to 34 years have the highest fertility rate with 400.0 births per 1,000 women. Women in the age bracket of 20 to 34 years acount for 100.0% of all women with births.
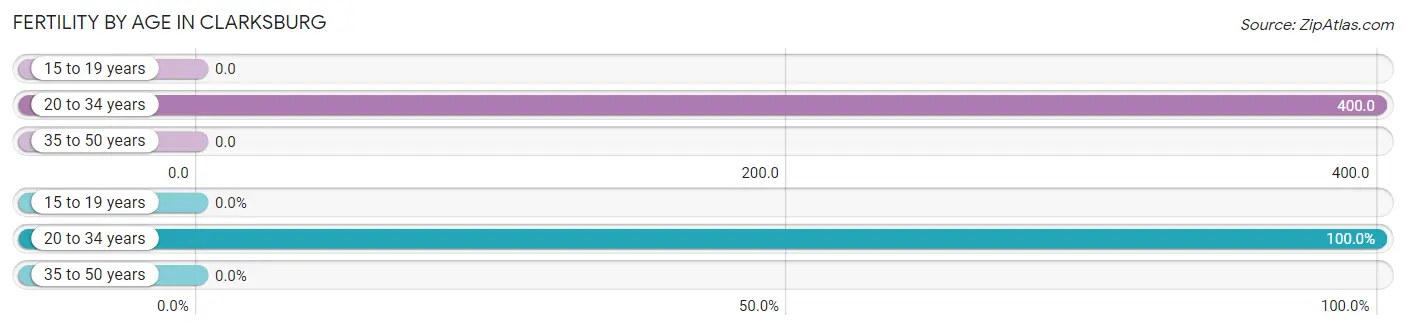
| Age Bracket | Women with Births | Births / 1,000 Women |
| 15 to 19 years | 0 (0.0%) | 0.0 |
| 20 to 34 years | 14 (100.0%) | 400.0 |
| 35 to 50 years | 0 (0.0%) | 0.0 |
| Total | 14 (100.0%) | 159.0 |
Fertility by Age by Marriage Status in Clarksburg
21.4% of women with births (14) in Clarksburg are married. The highest percentage of unmarried women with births falls into 20 to 34 years age bracket with 78.6% of them unmarried at the time of birth, while the lowest percentage of unmarried women with births belong to 20 to 34 years age bracket with 78.6% of them unmarried.
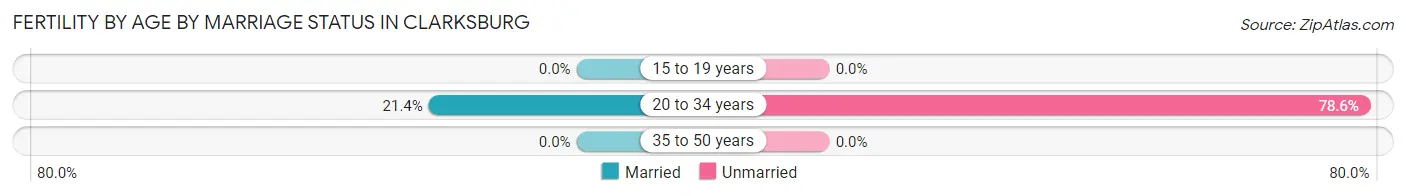
| Age Bracket | Married | Unmarried |
| 15 to 19 years | 0 (0.0%) | 0 (0.0%) |
| 20 to 34 years | 3 (21.4%) | 11 (78.6%) |
| 35 to 50 years | 0 (0.0%) | 0 (0.0%) |
| Total | 3 (21.4%) | 11 (78.6%) |
Fertility by Education in Clarksburg
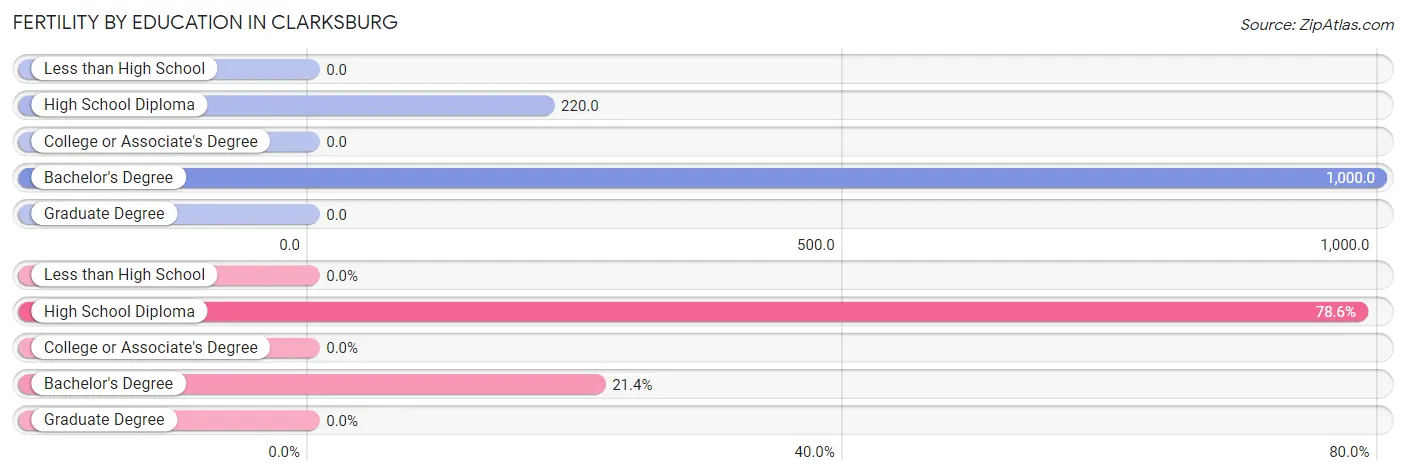
| Educational Attainment | Women with Births | Births / 1,000 Women |
| Less than High School | 0 (0.0%) | 0.0 |
| High School Diploma | 11 (78.6%) | 220.0 |
| College or Associate's Degree | 0 (0.0%) | 0.0 |
| Bachelor's Degree | 3 (21.4%) | 1,000.0 |
| Graduate Degree | 0 (0.0%) | 0.0 |
| Total | 14 (100.0%) | 159.0 |
Fertility by Education by Marriage Status in Clarksburg
78.6% of women with births in Clarksburg are unmarried. Women with the educational attainment of bachelor's degree are most likely to be married with 100.0% of them married at childbirth, while women with the educational attainment of high school diploma are least likely to be married with 100.0% of them unmarried at childbirth.
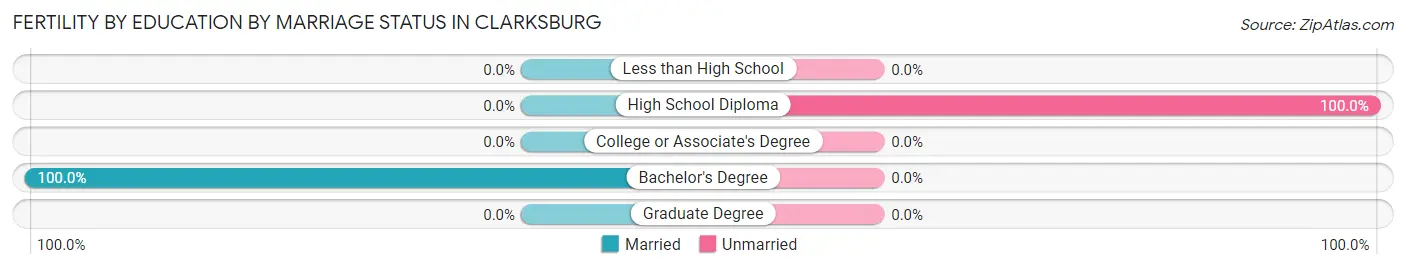
| Educational Attainment | Married | Unmarried |
| Less than High School | 0 (0.0%) | 0 (0.0%) |
| High School Diploma | 0 (0.0%) | 11 (100.0%) |
| College or Associate's Degree | 0 (0.0%) | 0 (0.0%) |
| Bachelor's Degree | 3 (100.0%) | 0 (0.0%) |
| Graduate Degree | 0 (0.0%) | 0 (0.0%) |
| Total | 3 (21.4%) | 11 (78.6%) |
Employment Characteristics in Clarksburg
Employment by Class of Employer in Clarksburg
Among the 76 employed individuals in Clarksburg, private company employees (59 | 77.6%), state government employees (6 | 7.9%), and self-employed (incorporated) (5 | 6.6%) make up the most common classes of employment.
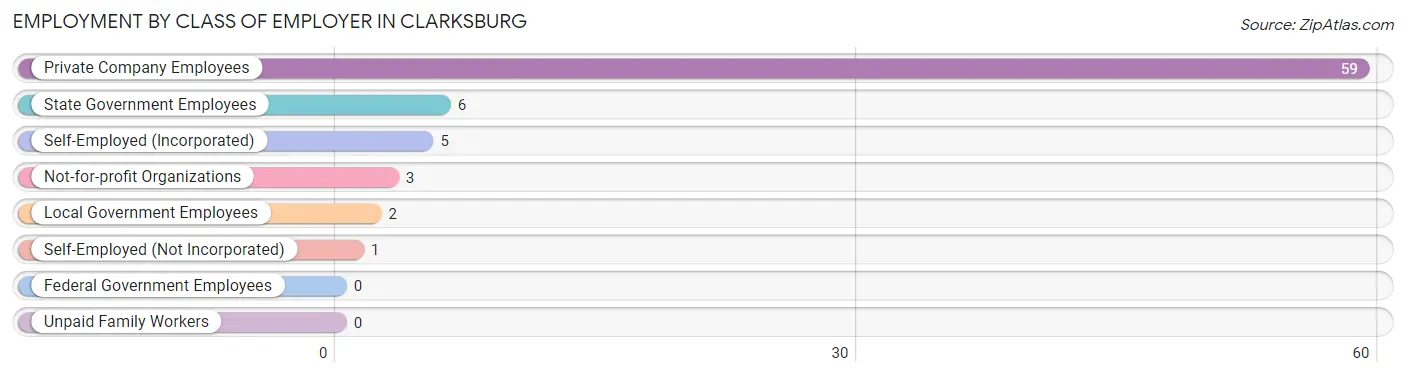
| Employer Class | # Employees | % Employees |
| Private Company Employees | 59 | 77.6% |
| Self-Employed (Incorporated) | 5 | 6.6% |
| Self-Employed (Not Incorporated) | 1 | 1.3% |
| Not-for-profit Organizations | 3 | 4.0% |
| Local Government Employees | 2 | 2.6% |
| State Government Employees | 6 | 7.9% |
| Federal Government Employees | 0 | 0.0% |
| Unpaid Family Workers | 0 | 0.0% |
| Total | 76 | 100.0% |
Employment Status by Age in Clarksburg
According to the labor force statistics for Clarksburg, out of the total population over 16 years of age (219), 51.1% or 112 individuals are in the labor force, with 32.1% or 36 of them unemployed. The age group with the highest labor force participation rate is 35 to 44 years, with 90.0% or 36 individuals in the labor force. Within the labor force, the 35 to 44 years age range has the highest percentage of unemployed individuals, with 58.3% or 21 of them being unemployed.
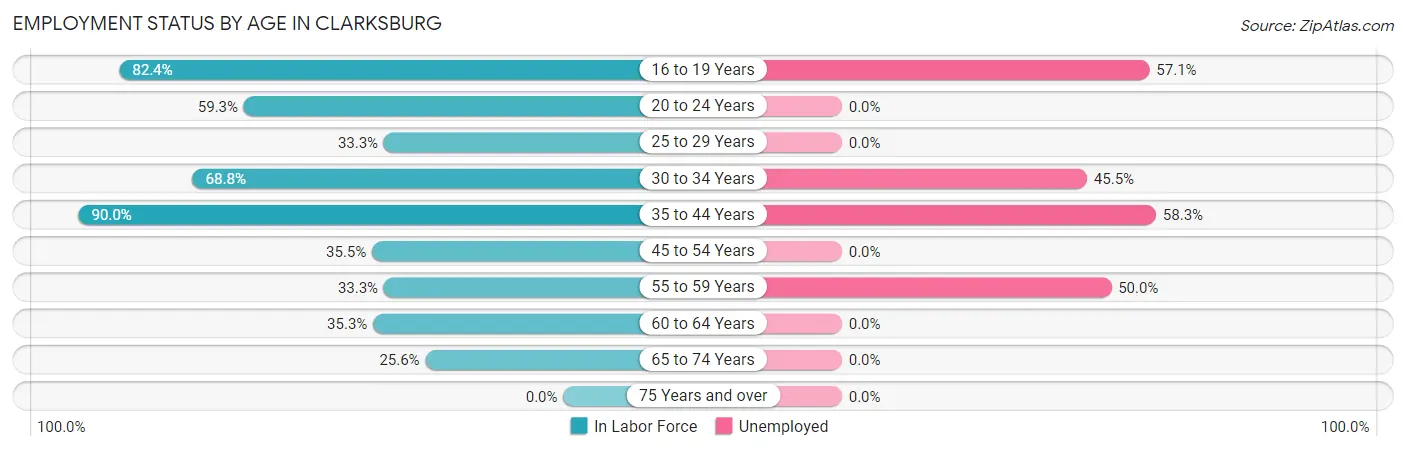
| Age Bracket | In Labor Force | Unemployed |
| 16 to 19 Years | 14 (82.4%) | 8 (57.1%) |
| 20 to 24 Years | 16 (59.3%) | 0 (0.0%) |
| 25 to 29 Years | 4 (33.3%) | 0 (0.0%) |
| 30 to 34 Years | 11 (68.8%) | 5 (45.5%) |
| 35 to 44 Years | 36 (90.0%) | 21 (58.3%) |
| 45 to 54 Years | 11 (35.5%) | 0 (0.0%) |
| 55 to 59 Years | 4 (33.3%) | 2 (50.0%) |
| 60 to 64 Years | 6 (35.3%) | 0 (0.0%) |
| 65 to 74 Years | 10 (25.6%) | 0 (0.0%) |
| 75 Years and over | 0 (0.0%) | 0 (0.0%) |
| Total | 112 (51.1%) | 36 (32.1%) |
Employment Status by Educational Attainment in Clarksburg
According to labor force statistics for Clarksburg, 56.3% of individuals (72) out of the total population between 25 and 64 years of age (128) are in the labor force, with 38.9% or 28 of them being unemployed. The group with the highest labor force participation rate are those with the educational attainment of bachelor's degree or higher, with 100.0% or 1 individuals in the labor force. Within the labor force, individuals with high school diploma education have the highest percentage of unemployment, with 49.0% or 24 of them being unemployed.
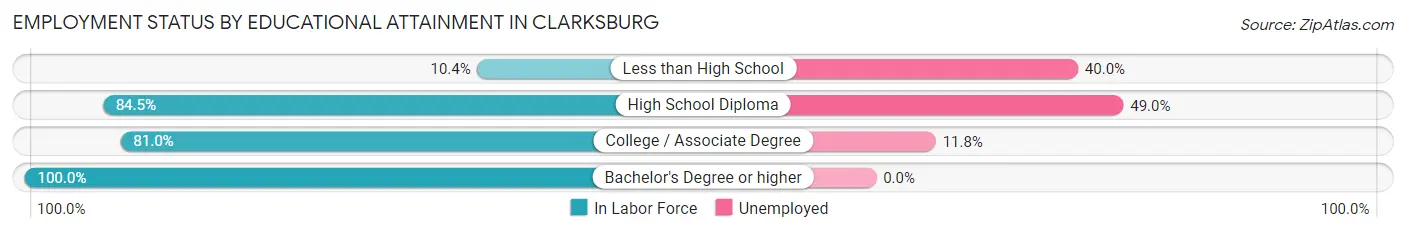
| Educational Attainment | In Labor Force | Unemployed |
| Less than High School | 5 (10.4%) | 19 (40.0%) |
| High School Diploma | 49 (84.5%) | 28 (49.0%) |
| College / Associate Degree | 17 (81.0%) | 2 (11.8%) |
| Bachelor's Degree or higher | 1 (100.0%) | 0 (0.0%) |
| Total | 72 (56.3%) | 50 (38.9%) |
Employment Occupations by Sex in Clarksburg
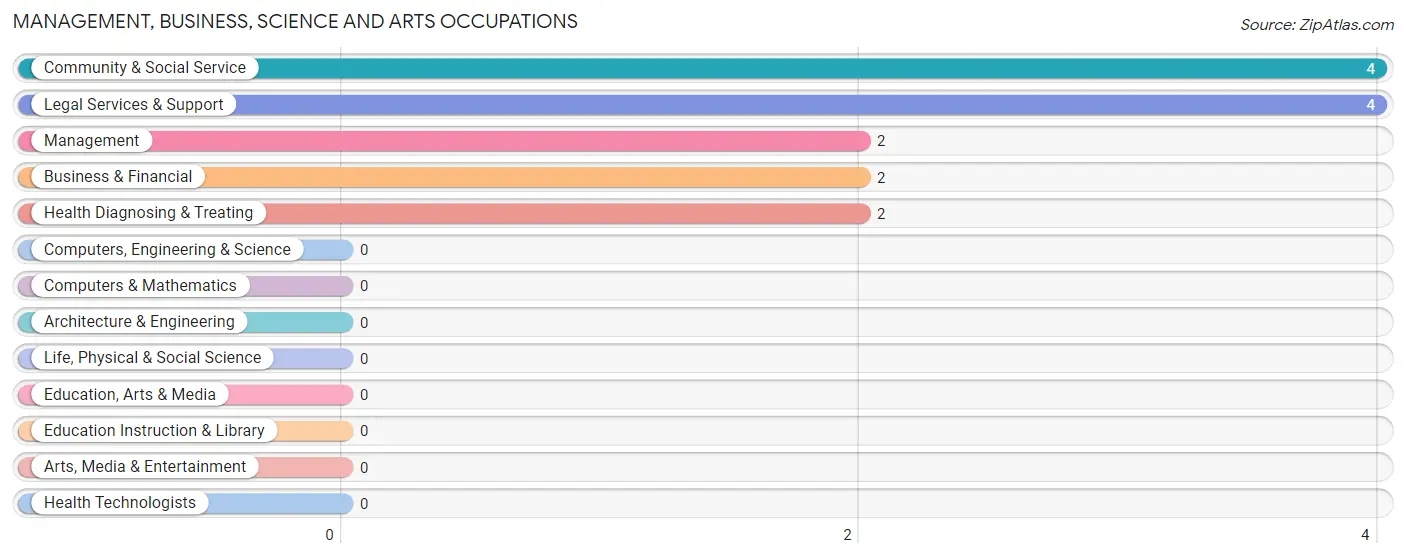
Management, Business, Science and Arts Occupations
The most common Management, Business, Science and Arts occupations in Clarksburg are Community & Social Service (4 | 5.3%), Legal Services & Support (4 | 5.3%), Management (2 | 2.6%), Business & Financial (2 | 2.6%), and Health Diagnosing & Treating (2 | 2.6%).
Management, Business, Science and Arts Occupations by Sex
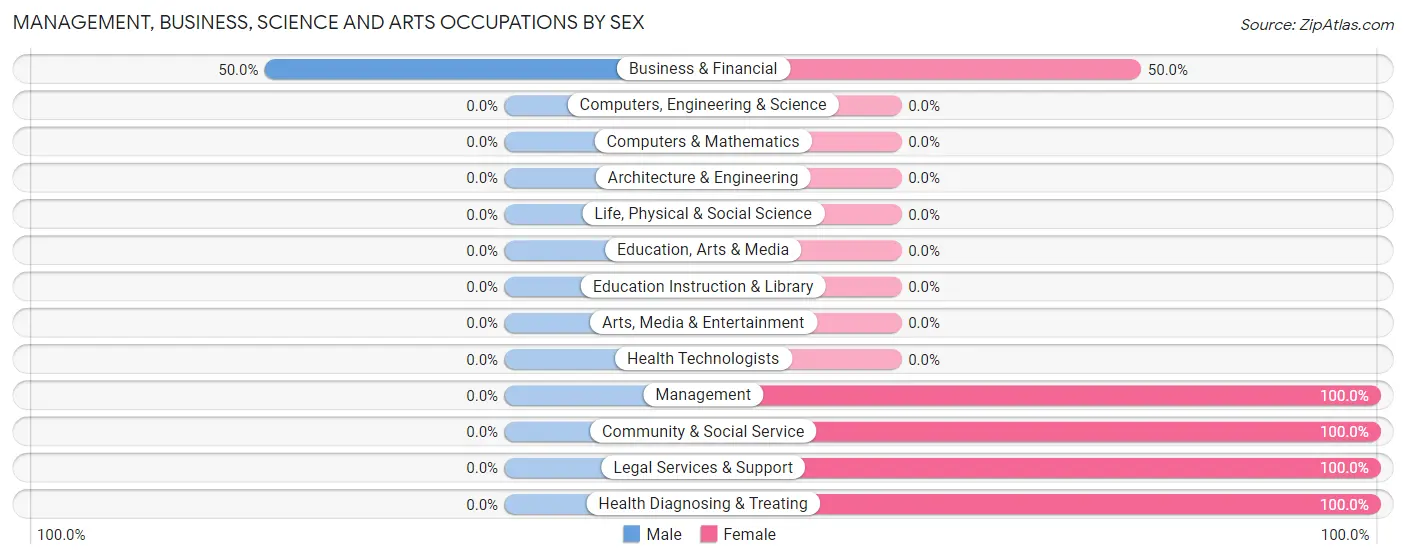
| Occupation | Male | Female |
| Management | 0 (0.0%) | 2 (100.0%) |
| Business & Financial | 1 (50.0%) | 1 (50.0%) |
| Computers, Engineering & Science | 0 (0.0%) | 0 (0.0%) |
| Computers & Mathematics | 0 (0.0%) | 0 (0.0%) |
| Architecture & Engineering | 0 (0.0%) | 0 (0.0%) |
| Life, Physical & Social Science | 0 (0.0%) | 0 (0.0%) |
| Community & Social Service | 0 (0.0%) | 4 (100.0%) |
| Education, Arts & Media | 0 (0.0%) | 0 (0.0%) |
| Legal Services & Support | 0 (0.0%) | 4 (100.0%) |
| Education Instruction & Library | 0 (0.0%) | 0 (0.0%) |
| Arts, Media & Entertainment | 0 (0.0%) | 0 (0.0%) |
| Health Diagnosing & Treating | 0 (0.0%) | 2 (100.0%) |
| Health Technologists | 0 (0.0%) | 0 (0.0%) |
| Total (Category) | 1 (10.0%) | 9 (90.0%) |
| Total (Overall) | 29 (38.2%) | 47 (61.8%) |
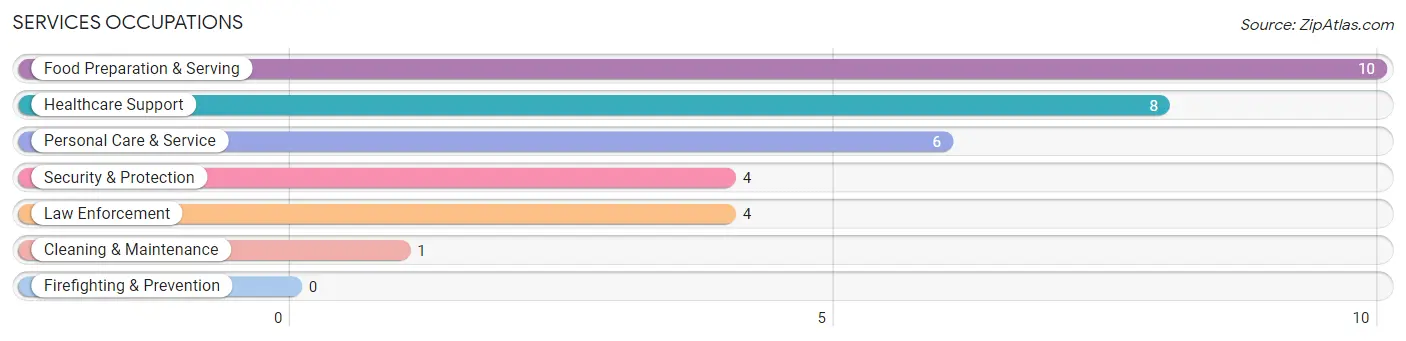
Services Occupations
The most common Services occupations in Clarksburg are Food Preparation & Serving (10 | 13.2%), Healthcare Support (8 | 10.5%), Personal Care & Service (6 | 7.9%), Security & Protection (4 | 5.3%), and Law Enforcement (4 | 5.3%).
Services Occupations by Sex
Within the Services occupations in Clarksburg, the most male-oriented occupations are Security & Protection (100.0%), Law Enforcement (100.0%), and Cleaning & Maintenance (100.0%), while the most female-oriented occupations are Healthcare Support (100.0%), Personal Care & Service (100.0%), and Food Preparation & Serving (50.0%).
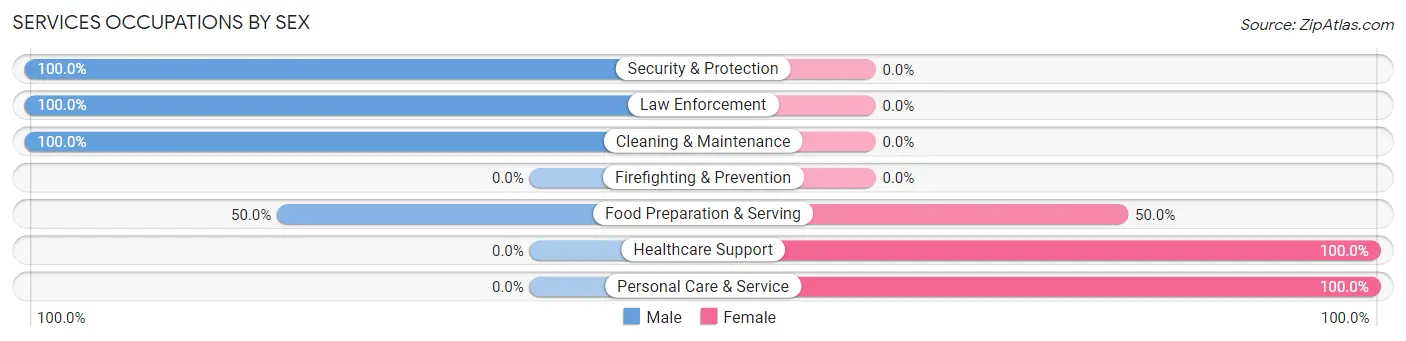
| Occupation | Male | Female |
| Healthcare Support | 0 (0.0%) | 8 (100.0%) |
| Security & Protection | 4 (100.0%) | 0 (0.0%) |
| Firefighting & Prevention | 0 (0.0%) | 0 (0.0%) |
| Law Enforcement | 4 (100.0%) | 0 (0.0%) |
| Food Preparation & Serving | 5 (50.0%) | 5 (50.0%) |
| Cleaning & Maintenance | 1 (100.0%) | 0 (0.0%) |
| Personal Care & Service | 0 (0.0%) | 6 (100.0%) |
| Total (Category) | 10 (34.5%) | 19 (65.5%) |
| Total (Overall) | 29 (38.2%) | 47 (61.8%) |
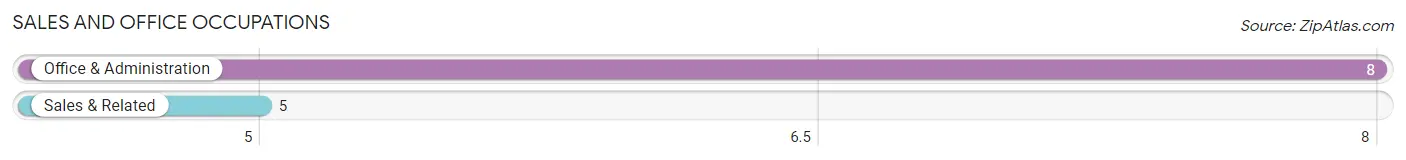
Sales and Office Occupations
The most common Sales and Office occupations in Clarksburg are Office & Administration (8 | 10.5%), and Sales & Related (5 | 6.6%).
Sales and Office Occupations by Sex
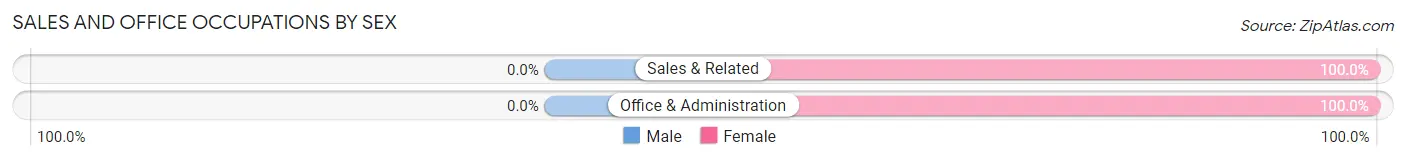
| Occupation | Male | Female |
| Sales & Related | 0 (0.0%) | 5 (100.0%) |
| Office & Administration | 0 (0.0%) | 8 (100.0%) |
| Total (Category) | 0 (0.0%) | 13 (100.0%) |
| Total (Overall) | 29 (38.2%) | 47 (61.8%) |
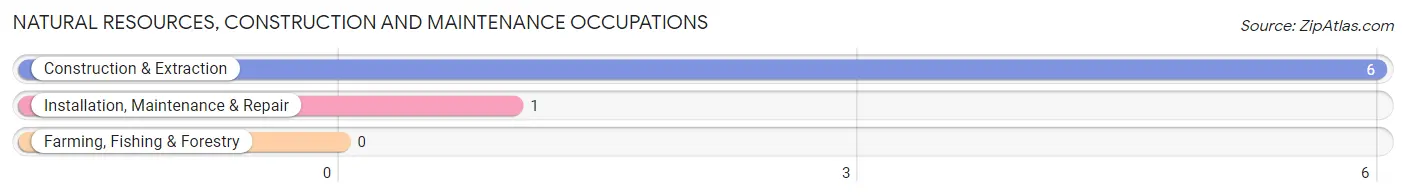
Natural Resources, Construction and Maintenance Occupations
The most common Natural Resources, Construction and Maintenance occupations in Clarksburg are Construction & Extraction (6 | 7.9%), and Installation, Maintenance & Repair (1 | 1.3%).
Natural Resources, Construction and Maintenance Occupations by Sex
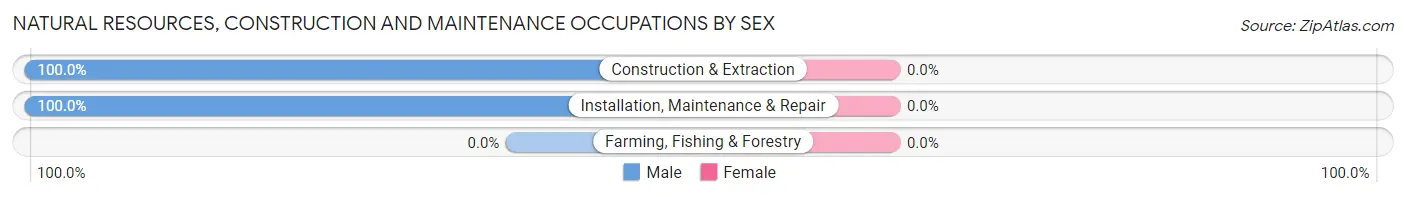
| Occupation | Male | Female |
| Farming, Fishing & Forestry | 0 (0.0%) | 0 (0.0%) |
| Construction & Extraction | 6 (100.0%) | 0 (0.0%) |
| Installation, Maintenance & Repair | 1 (100.0%) | 0 (0.0%) |
| Total (Category) | 7 (100.0%) | 0 (0.0%) |
| Total (Overall) | 29 (38.2%) | 47 (61.8%) |
Production, Transportation and Moving Occupations
The most common Production, Transportation and Moving occupations in Clarksburg are Material Moving (7 | 9.2%), Production (6 | 7.9%), and Transportation (4 | 5.3%).
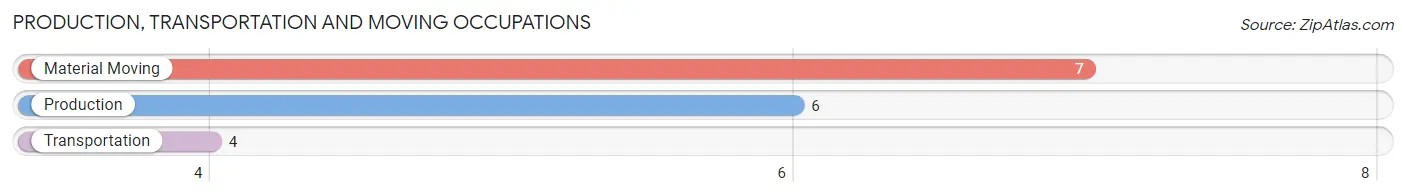
Production, Transportation and Moving Occupations by Sex
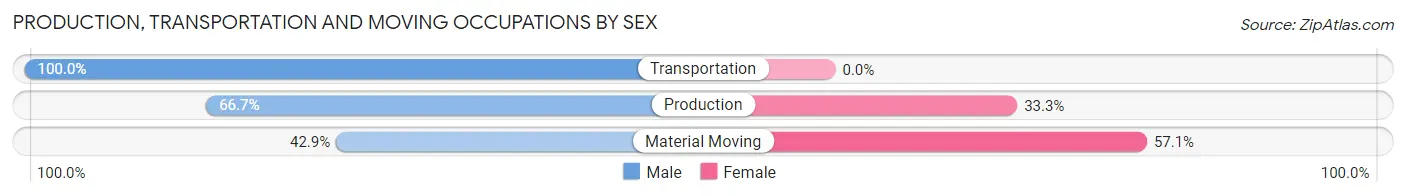
| Occupation | Male | Female |
| Production | 4 (66.7%) | 2 (33.3%) |
| Transportation | 4 (100.0%) | 0 (0.0%) |
| Material Moving | 3 (42.9%) | 4 (57.1%) |
| Total (Category) | 11 (64.7%) | 6 (35.3%) |
| Total (Overall) | 29 (38.2%) | 47 (61.8%) |
Employment Industries by Sex in Clarksburg
Employment Industries in Clarksburg
The major employment industries in Clarksburg include Health Care & Social Assistance (13 | 17.1%), Construction (12 | 15.8%), Retail Trade (11 | 14.5%), Manufacturing (7 | 9.2%), and Transportation & Warehousing (6 | 7.9%).
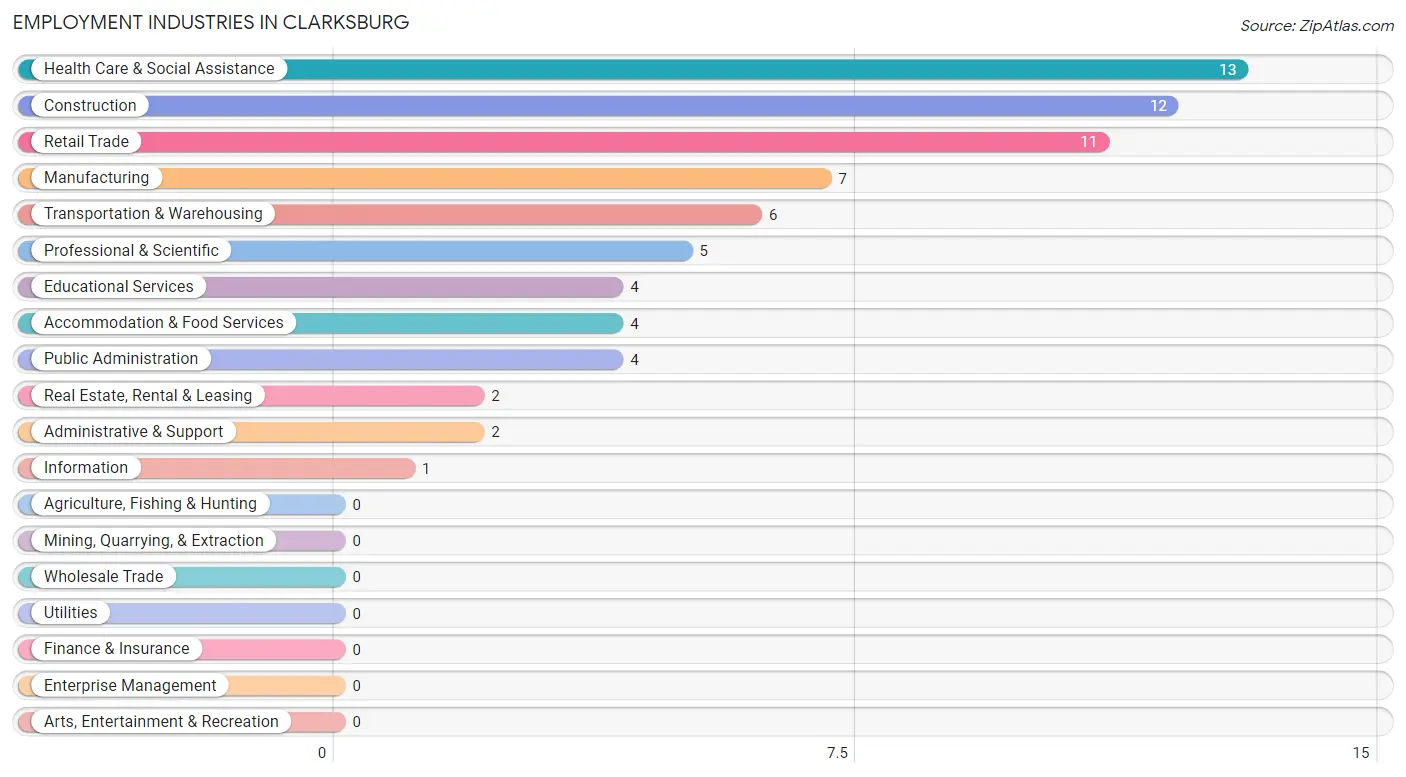
Employment Industries by Sex in Clarksburg
The Clarksburg industries that see more men than women are Administrative & Support (100.0%), Public Administration (100.0%), and Construction (66.7%), whereas the industries that tend to have a higher number of women are Information (100.0%), Real Estate, Rental & Leasing (100.0%), and Educational Services (100.0%).
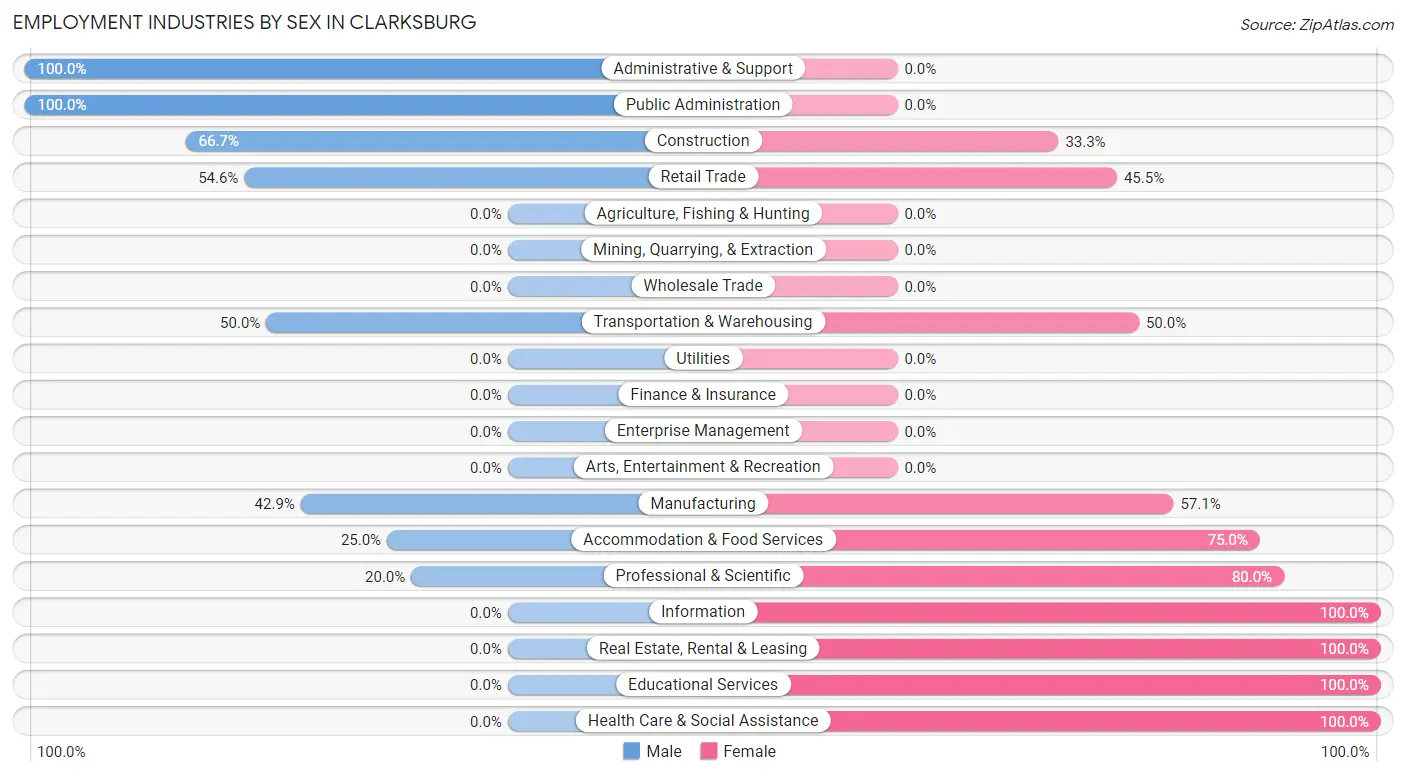
| Industry | Male | Female |
| Agriculture, Fishing & Hunting | 0 (0.0%) | 0 (0.0%) |
| Mining, Quarrying, & Extraction | 0 (0.0%) | 0 (0.0%) |
| Construction | 8 (66.7%) | 4 (33.3%) |
| Manufacturing | 3 (42.9%) | 4 (57.1%) |
| Wholesale Trade | 0 (0.0%) | 0 (0.0%) |
| Retail Trade | 6 (54.5%) | 5 (45.5%) |
| Transportation & Warehousing | 3 (50.0%) | 3 (50.0%) |
| Utilities | 0 (0.0%) | 0 (0.0%) |
| Information | 0 (0.0%) | 1 (100.0%) |
| Finance & Insurance | 0 (0.0%) | 0 (0.0%) |
| Real Estate, Rental & Leasing | 0 (0.0%) | 2 (100.0%) |
| Professional & Scientific | 1 (20.0%) | 4 (80.0%) |
| Enterprise Management | 0 (0.0%) | 0 (0.0%) |
| Administrative & Support | 2 (100.0%) | 0 (0.0%) |
| Educational Services | 0 (0.0%) | 4 (100.0%) |
| Health Care & Social Assistance | 0 (0.0%) | 13 (100.0%) |
| Arts, Entertainment & Recreation | 0 (0.0%) | 0 (0.0%) |
| Accommodation & Food Services | 1 (25.0%) | 3 (75.0%) |
| Public Administration | 4 (100.0%) | 0 (0.0%) |
| Total | 29 (38.2%) | 47 (61.8%) |
Education in Clarksburg
School Enrollment in Clarksburg
The most common levels of schooling among the 41 students in Clarksburg are high school (14 | 34.2%), college / undergraduate (14 | 34.2%), and middle school (6 | 14.6%).
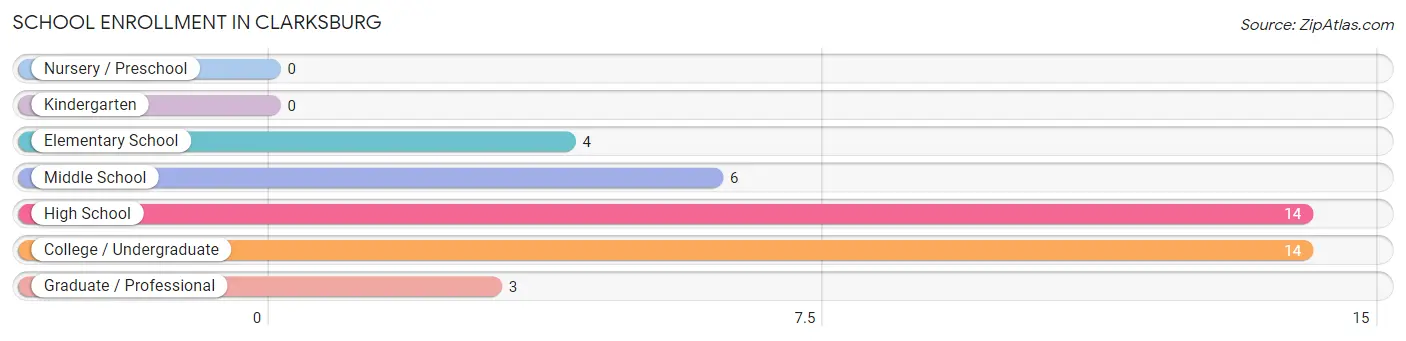
| School Level | # Students | % Students |
| Nursery / Preschool | 0 | 0.0% |
| Kindergarten | 0 | 0.0% |
| Elementary School | 4 | 9.8% |
| Middle School | 6 | 14.6% |
| High School | 14 | 34.2% |
| College / Undergraduate | 14 | 34.2% |
| Graduate / Professional | 3 | 7.3% |
| Total | 41 | 100.0% |
School Enrollment by Age by Funding Source in Clarksburg
Out of a total of 41 students who are enrolled in schools in Clarksburg, 2 (4.9%) attend a private institution, while the remaining 39 (95.1%) are enrolled in public schools. The age group of 35 years and over has the highest likelihood of being enrolled in private schools, with 2 (100.0% in the age bracket) enrolled. Conversely, the age group of 10 to 14 year olds has the lowest likelihood of being enrolled in a private school, with 10 (100.0% in the age bracket) attending a public institution.
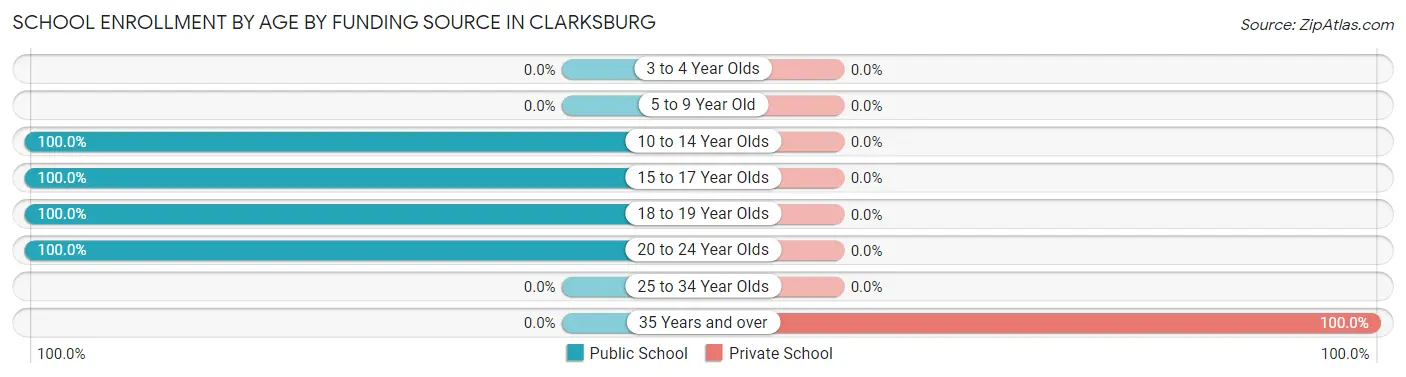
| Age Bracket | Public School | Private School |
| 3 to 4 Year Olds | 0 (0.0%) | 0 (0.0%) |
| 5 to 9 Year Old | 0 (0.0%) | 0 (0.0%) |
| 10 to 14 Year Olds | 10 (100.0%) | 0 (0.0%) |
| 15 to 17 Year Olds | 13 (100.0%) | 0 (0.0%) |
| 18 to 19 Year Olds | 1 (100.0%) | 0 (0.0%) |
| 20 to 24 Year Olds | 15 (100.0%) | 0 (0.0%) |
| 25 to 34 Year Olds | 0 (0.0%) | 0 (0.0%) |
| 35 Years and over | 0 (0.0%) | 2 (100.0%) |
| Total | 39 (95.1%) | 2 (4.9%) |
Educational Attainment by Field of Study in Clarksburg
, and business (3 | 100.0%) are the most common fields of study among 3 individuals in Clarksburg who have obtained a bachelor's degree or higher.
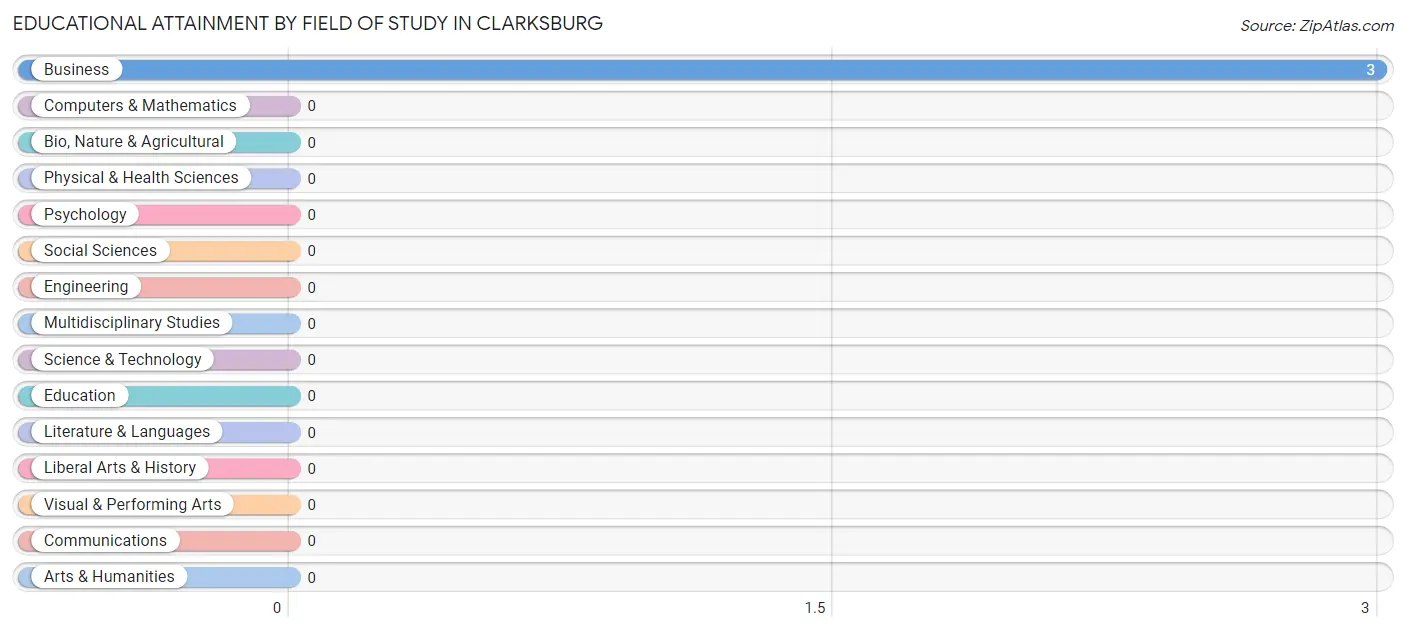
| Field of Study | # Graduates | % Graduates |
| Computers & Mathematics | 0 | 0.0% |
| Bio, Nature & Agricultural | 0 | 0.0% |
| Physical & Health Sciences | 0 | 0.0% |
| Psychology | 0 | 0.0% |
| Social Sciences | 0 | 0.0% |
| Engineering | 0 | 0.0% |
| Multidisciplinary Studies | 0 | 0.0% |
| Science & Technology | 0 | 0.0% |
| Business | 3 | 100.0% |
| Education | 0 | 0.0% |
| Literature & Languages | 0 | 0.0% |
| Liberal Arts & History | 0 | 0.0% |
| Visual & Performing Arts | 0 | 0.0% |
| Communications | 0 | 0.0% |
| Arts & Humanities | 0 | 0.0% |
| Total | 3 | 100.0% |
Transportation & Commute in Clarksburg
Vehicle Availability by Sex in Clarksburg
The most prevalent vehicle ownership categories in Clarksburg are males with 1 vehicle (12, accounting for 41.4%) and females with 1 vehicle (17, making up 25.5%).
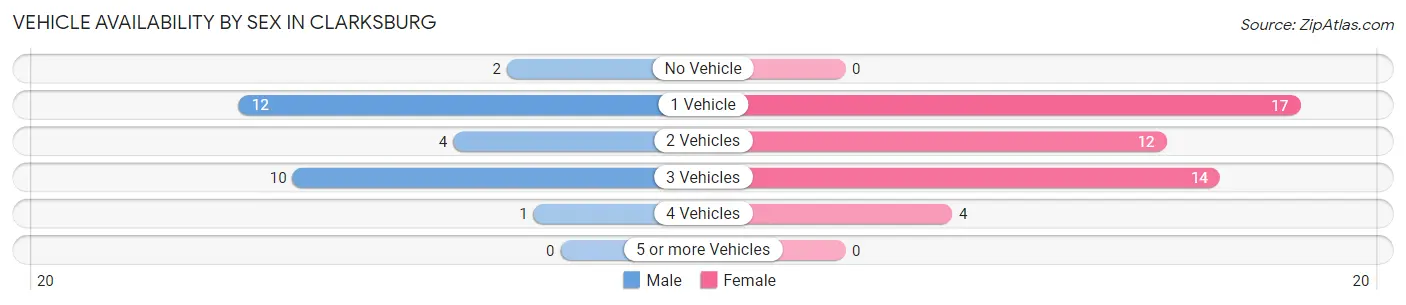
| Vehicles Available | Male | Female |
| No Vehicle | 2 (6.9%) | 0 (0.0%) |
| 1 Vehicle | 12 (41.4%) | 17 (36.2%) |
| 2 Vehicles | 4 (13.8%) | 12 (25.5%) |
| 3 Vehicles | 10 (34.5%) | 14 (29.8%) |
| 4 Vehicles | 1 (3.5%) | 4 (8.5%) |
| 5 or more Vehicles | 0 (0.0%) | 0 (0.0%) |
| Total | 29 (100.0%) | 47 (100.0%) |
Commute Time in Clarksburg
The most frequently occuring commute durations in Clarksburg are 10 to 14 minutes (21 commuters, 28.8%), 20 to 24 minutes (10 commuters, 13.7%), and 15 to 19 minutes (9 commuters, 12.3%).
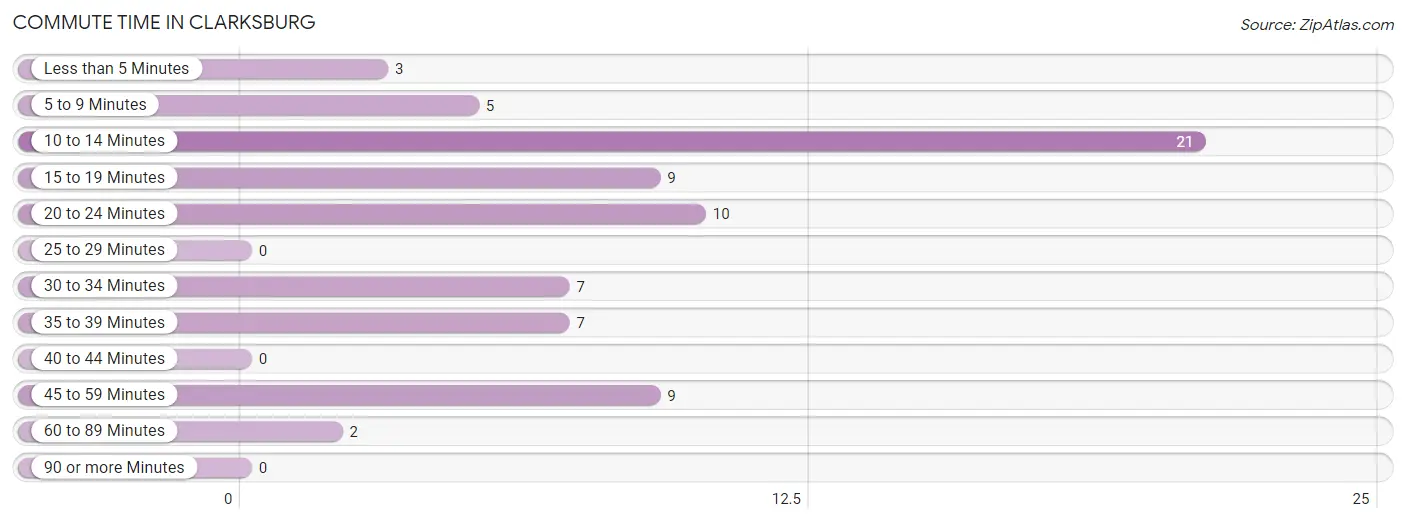
| Commute Time | # Commuters | % Commuters |
| Less than 5 Minutes | 3 | 4.1% |
| 5 to 9 Minutes | 5 | 6.9% |
| 10 to 14 Minutes | 21 | 28.8% |
| 15 to 19 Minutes | 9 | 12.3% |
| 20 to 24 Minutes | 10 | 13.7% |
| 25 to 29 Minutes | 0 | 0.0% |
| 30 to 34 Minutes | 7 | 9.6% |
| 35 to 39 Minutes | 7 | 9.6% |
| 40 to 44 Minutes | 0 | 0.0% |
| 45 to 59 Minutes | 9 | 12.3% |
| 60 to 89 Minutes | 2 | 2.7% |
| 90 or more Minutes | 0 | 0.0% |
Commute Time by Sex in Clarksburg
The most common commute times in Clarksburg are 10 to 14 minutes (12 commuters, 46.2%) for males and 10 to 14 minutes (9 commuters, 19.2%) for females.
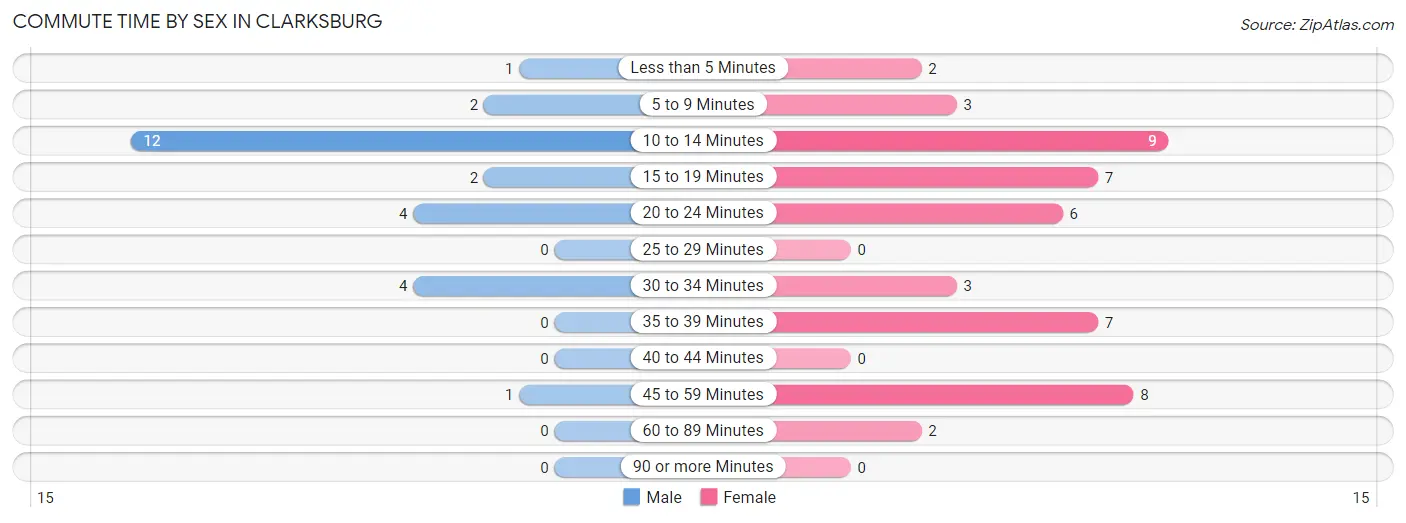
| Commute Time | Male | Female |
| Less than 5 Minutes | 1 (3.8%) | 2 (4.3%) |
| 5 to 9 Minutes | 2 (7.7%) | 3 (6.4%) |
| 10 to 14 Minutes | 12 (46.2%) | 9 (19.2%) |
| 15 to 19 Minutes | 2 (7.7%) | 7 (14.9%) |
| 20 to 24 Minutes | 4 (15.4%) | 6 (12.8%) |
| 25 to 29 Minutes | 0 (0.0%) | 0 (0.0%) |
| 30 to 34 Minutes | 4 (15.4%) | 3 (6.4%) |
| 35 to 39 Minutes | 0 (0.0%) | 7 (14.9%) |
| 40 to 44 Minutes | 0 (0.0%) | 0 (0.0%) |
| 45 to 59 Minutes | 1 (3.8%) | 8 (17.0%) |
| 60 to 89 Minutes | 0 (0.0%) | 2 (4.3%) |
| 90 or more Minutes | 0 (0.0%) | 0 (0.0%) |
Time of Departure to Work by Sex in Clarksburg
The most frequent times of departure to work in Clarksburg are 12:00 AM to 4:59 AM (6, 23.1%) for males and 6:30 AM to 6:59 AM (17, 36.2%) for females.
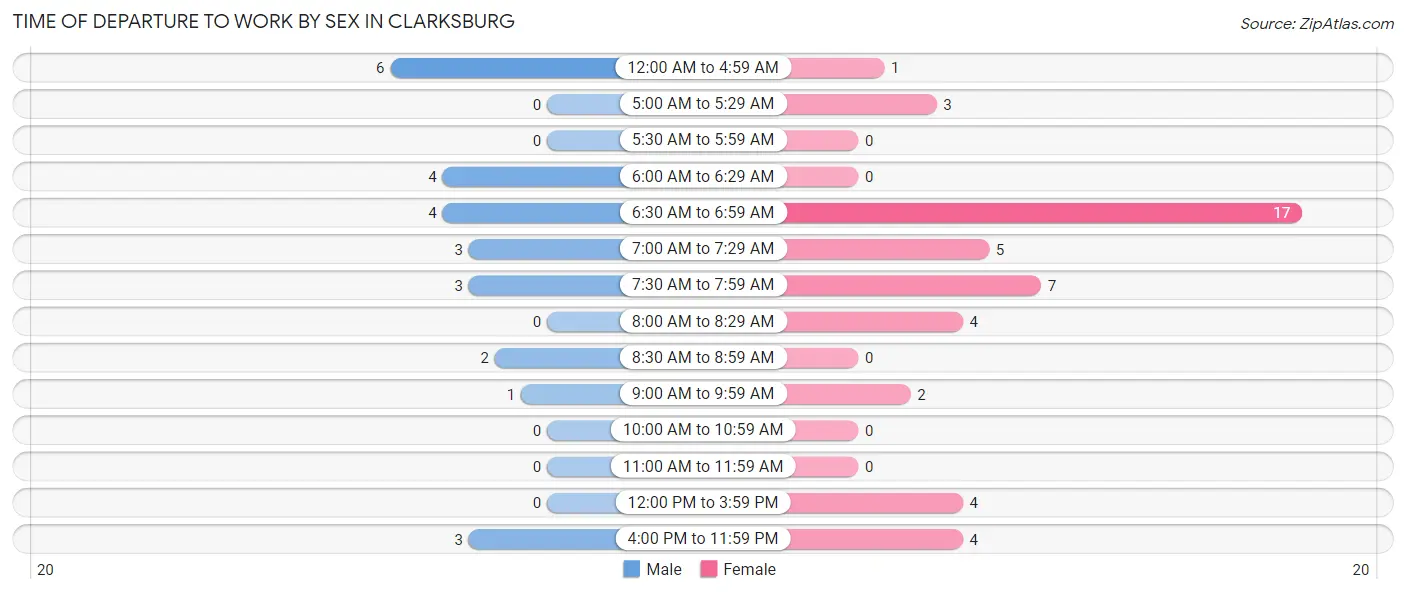
| Time of Departure | Male | Female |
| 12:00 AM to 4:59 AM | 6 (23.1%) | 1 (2.1%) |
| 5:00 AM to 5:29 AM | 0 (0.0%) | 3 (6.4%) |
| 5:30 AM to 5:59 AM | 0 (0.0%) | 0 (0.0%) |
| 6:00 AM to 6:29 AM | 4 (15.4%) | 0 (0.0%) |
| 6:30 AM to 6:59 AM | 4 (15.4%) | 17 (36.2%) |
| 7:00 AM to 7:29 AM | 3 (11.5%) | 5 (10.6%) |
| 7:30 AM to 7:59 AM | 3 (11.5%) | 7 (14.9%) |
| 8:00 AM to 8:29 AM | 0 (0.0%) | 4 (8.5%) |
| 8:30 AM to 8:59 AM | 2 (7.7%) | 0 (0.0%) |
| 9:00 AM to 9:59 AM | 1 (3.8%) | 2 (4.3%) |
| 10:00 AM to 10:59 AM | 0 (0.0%) | 0 (0.0%) |
| 11:00 AM to 11:59 AM | 0 (0.0%) | 0 (0.0%) |
| 12:00 PM to 3:59 PM | 0 (0.0%) | 4 (8.5%) |
| 4:00 PM to 11:59 PM | 3 (11.5%) | 4 (8.5%) |
| Total | 26 (100.0%) | 47 (100.0%) |
Housing Occupancy in Clarksburg
Occupancy by Ownership in Clarksburg
Of the total 124 dwellings in Clarksburg, owner-occupied units account for 58 (46.8%), while renter-occupied units make up 66 (53.2%).
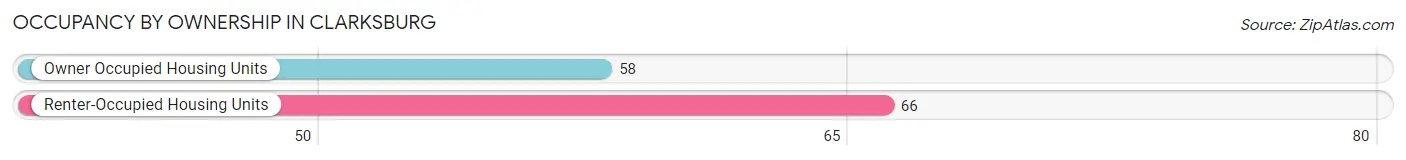
| Occupancy | # Housing Units | % Housing Units |
| Owner Occupied Housing Units | 58 | 46.8% |
| Renter-Occupied Housing Units | 66 | 53.2% |
| Total Occupied Housing Units | 124 | 100.0% |
Occupancy by Household Size in Clarksburg
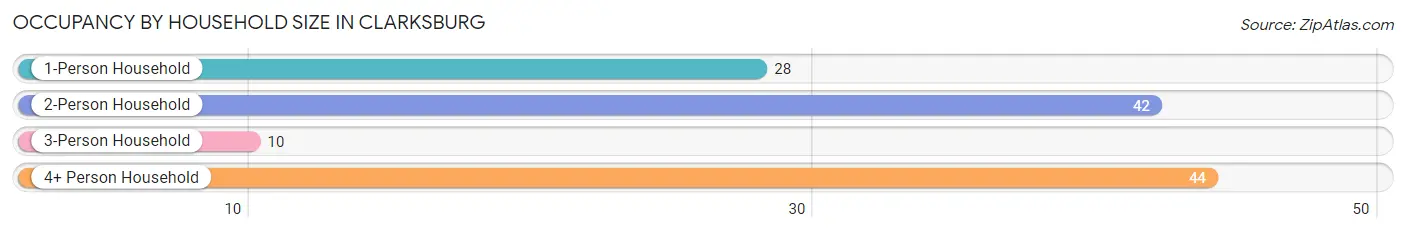
| Household Size | # Housing Units | % Housing Units |
| 1-Person Household | 28 | 22.6% |
| 2-Person Household | 42 | 33.9% |
| 3-Person Household | 10 | 8.1% |
| 4+ Person Household | 44 | 35.5% |
| Total Housing Units | 124 | 100.0% |
Occupancy by Ownership by Household Size in Clarksburg
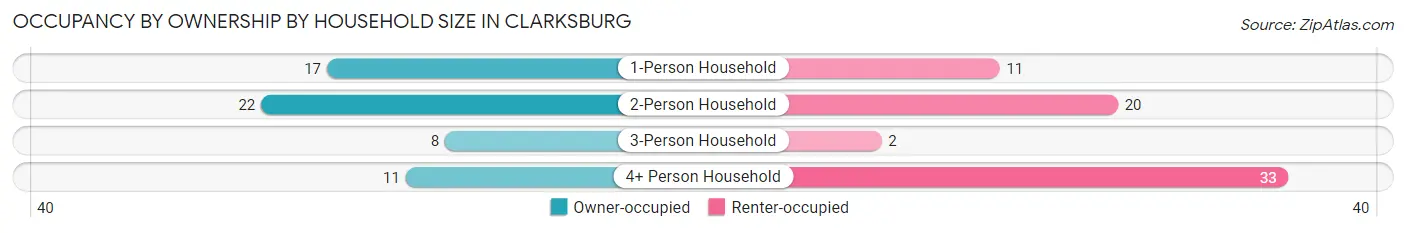
| Household Size | Owner-occupied | Renter-occupied |
| 1-Person Household | 17 (60.7%) | 11 (39.3%) |
| 2-Person Household | 22 (52.4%) | 20 (47.6%) |
| 3-Person Household | 8 (80.0%) | 2 (20.0%) |
| 4+ Person Household | 11 (25.0%) | 33 (75.0%) |
| Total Housing Units | 58 (46.8%) | 66 (53.2%) |
Occupancy by Educational Attainment in Clarksburg
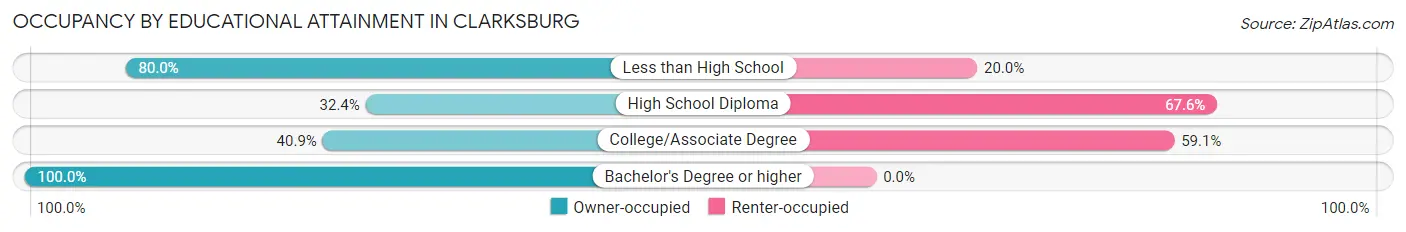
| Household Size | Owner-occupied | Renter-occupied |
| Less than High School | 20 (80.0%) | 5 (20.0%) |
| High School Diploma | 23 (32.4%) | 48 (67.6%) |
| College/Associate Degree | 9 (40.9%) | 13 (59.1%) |
| Bachelor's Degree or higher | 6 (100.0%) | 0 (0.0%) |
Occupancy by Age of Householder in Clarksburg
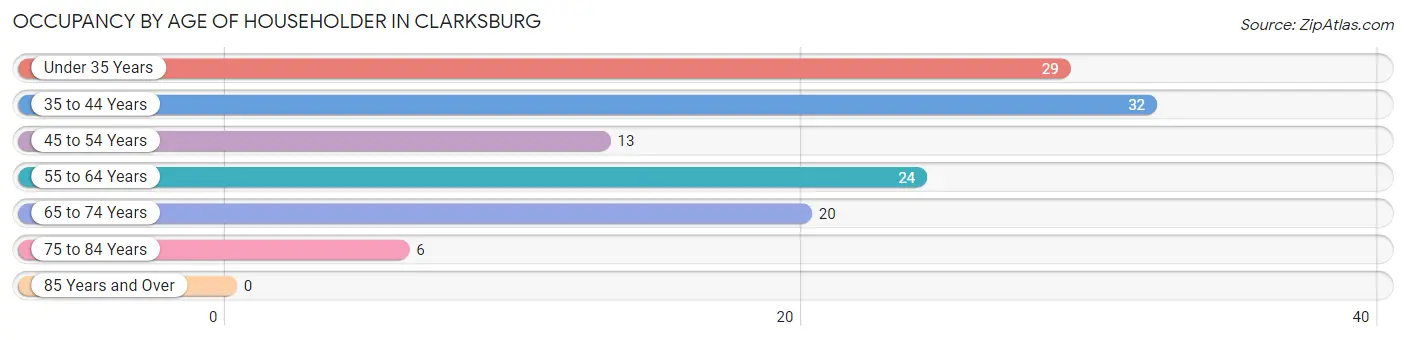
| Age Bracket | # Households | % Households |
| Under 35 Years | 29 | 23.4% |
| 35 to 44 Years | 32 | 25.8% |
| 45 to 54 Years | 13 | 10.5% |
| 55 to 64 Years | 24 | 19.4% |
| 65 to 74 Years | 20 | 16.1% |
| 75 to 84 Years | 6 | 4.8% |
| 85 Years and Over | 0 | 0.0% |
| Total | 124 | 100.0% |
Housing Finances in Clarksburg
Median Income by Occupancy in Clarksburg
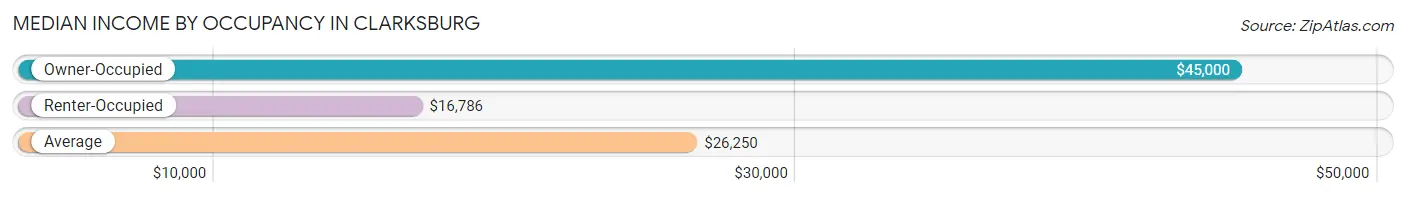
| Occupancy Type | # Households | Median Income |
| Owner-Occupied | 58 (46.8%) | $45,000 |
| Renter-Occupied | 66 (53.2%) | $16,786 |
| Average | 124 (100.0%) | $26,250 |
Occupancy by Householder Income Bracket in Clarksburg
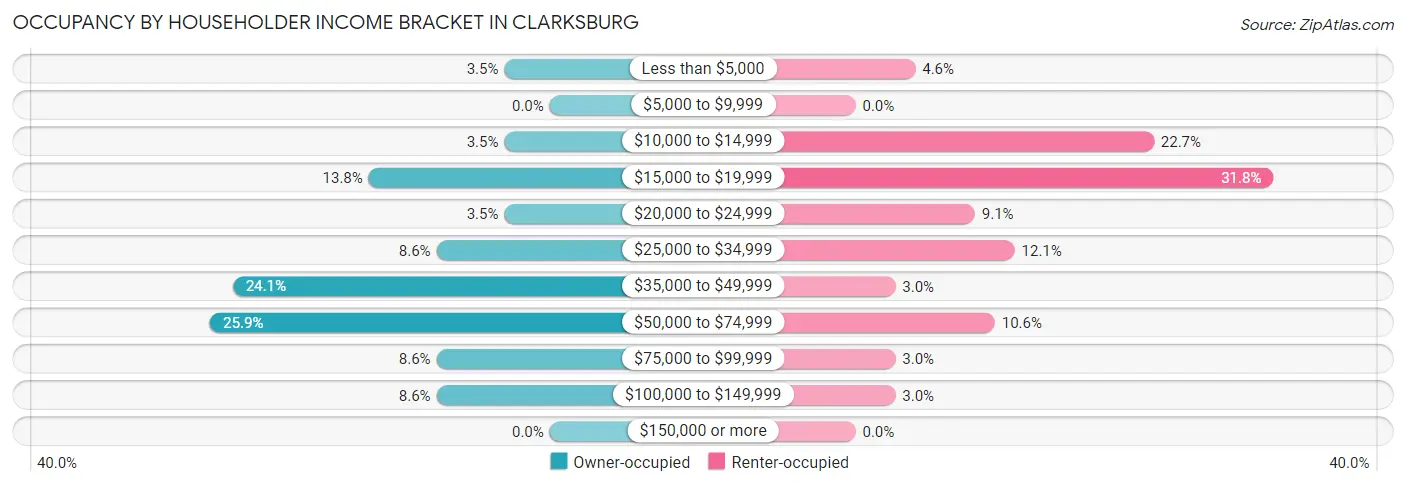
| Income Bracket | Owner-occupied | Renter-occupied |
| Less than $5,000 | 2 (3.5%) | 3 (4.5%) |
| $5,000 to $9,999 | 0 (0.0%) | 0 (0.0%) |
| $10,000 to $14,999 | 2 (3.5%) | 15 (22.7%) |
| $15,000 to $19,999 | 8 (13.8%) | 21 (31.8%) |
| $20,000 to $24,999 | 2 (3.5%) | 6 (9.1%) |
| $25,000 to $34,999 | 5 (8.6%) | 8 (12.1%) |
| $35,000 to $49,999 | 14 (24.1%) | 2 (3.0%) |
| $50,000 to $74,999 | 15 (25.9%) | 7 (10.6%) |
| $75,000 to $99,999 | 5 (8.6%) | 2 (3.0%) |
| $100,000 to $149,999 | 5 (8.6%) | 2 (3.0%) |
| $150,000 or more | 0 (0.0%) | 0 (0.0%) |
| Total | 58 (100.0%) | 66 (100.0%) |
Monthly Housing Cost Tiers in Clarksburg
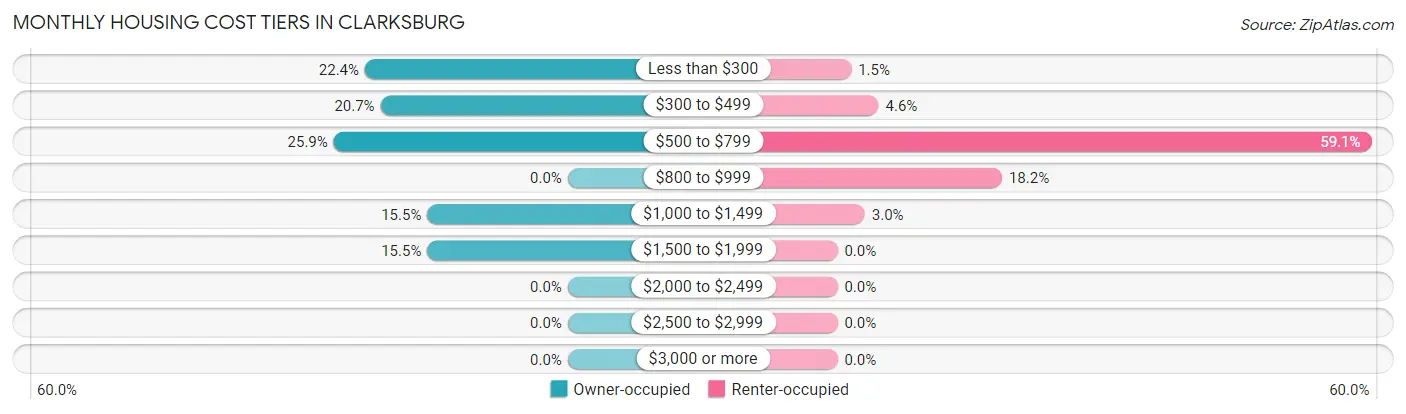
| Monthly Cost | Owner-occupied | Renter-occupied |
| Less than $300 | 13 (22.4%) | 1 (1.5%) |
| $300 to $499 | 12 (20.7%) | 3 (4.5%) |
| $500 to $799 | 15 (25.9%) | 39 (59.1%) |
| $800 to $999 | 0 (0.0%) | 12 (18.2%) |
| $1,000 to $1,499 | 9 (15.5%) | 2 (3.0%) |
| $1,500 to $1,999 | 9 (15.5%) | 0 (0.0%) |
| $2,000 to $2,499 | 0 (0.0%) | 0 (0.0%) |
| $2,500 to $2,999 | 0 (0.0%) | 0 (0.0%) |
| $3,000 or more | 0 (0.0%) | 0 (0.0%) |
| Total | 58 (100.0%) | 66 (100.0%) |
Physical Housing Characteristics in Clarksburg
Housing Structures in Clarksburg
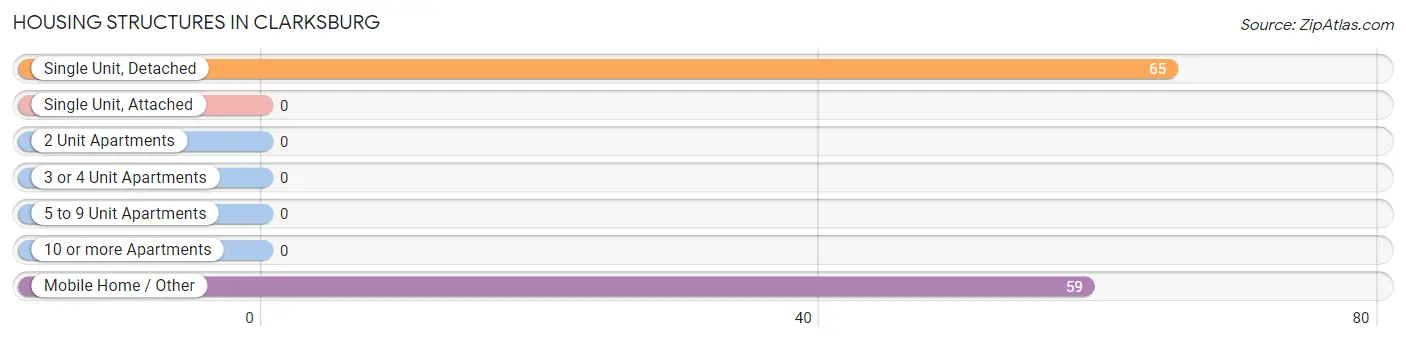
| Structure Type | # Housing Units | % Housing Units |
| Single Unit, Detached | 65 | 52.4% |
| Single Unit, Attached | 0 | 0.0% |
| 2 Unit Apartments | 0 | 0.0% |
| 3 or 4 Unit Apartments | 0 | 0.0% |
| 5 to 9 Unit Apartments | 0 | 0.0% |
| 10 or more Apartments | 0 | 0.0% |
| Mobile Home / Other | 59 | 47.6% |
| Total | 124 | 100.0% |
Housing Structures by Occupancy in Clarksburg
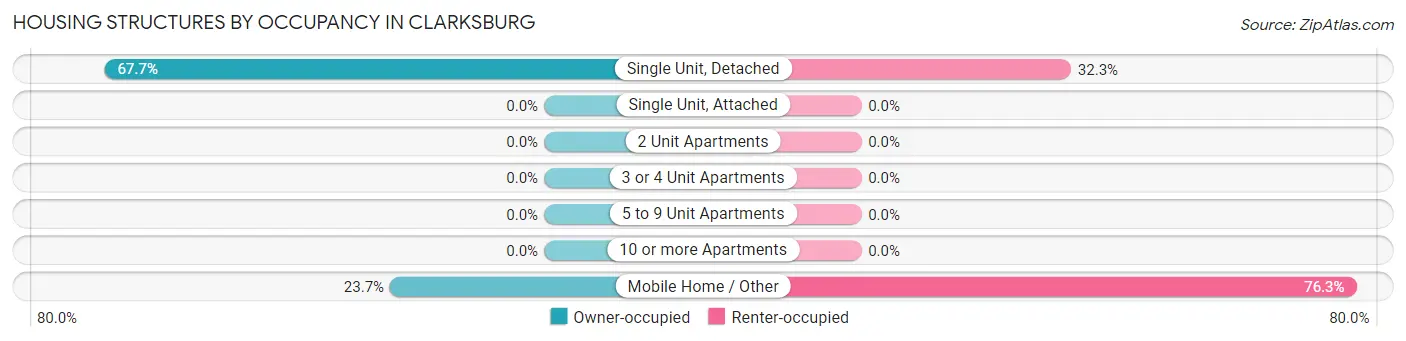
| Structure Type | Owner-occupied | Renter-occupied |
| Single Unit, Detached | 44 (67.7%) | 21 (32.3%) |
| Single Unit, Attached | 0 (0.0%) | 0 (0.0%) |
| 2 Unit Apartments | 0 (0.0%) | 0 (0.0%) |
| 3 or 4 Unit Apartments | 0 (0.0%) | 0 (0.0%) |
| 5 to 9 Unit Apartments | 0 (0.0%) | 0 (0.0%) |
| 10 or more Apartments | 0 (0.0%) | 0 (0.0%) |
| Mobile Home / Other | 14 (23.7%) | 45 (76.3%) |
| Total | 58 (46.8%) | 66 (53.2%) |
Housing Structures by Number of Rooms in Clarksburg
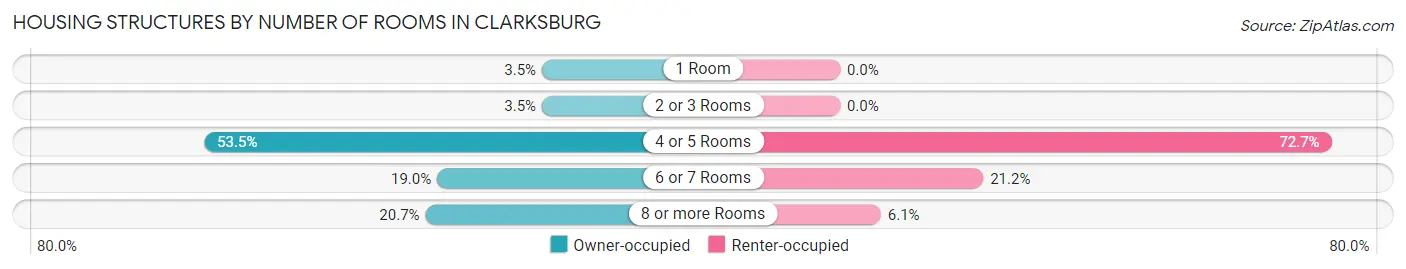
| Number of Rooms | Owner-occupied | Renter-occupied |
| 1 Room | 2 (3.5%) | 0 (0.0%) |
| 2 or 3 Rooms | 2 (3.5%) | 0 (0.0%) |
| 4 or 5 Rooms | 31 (53.4%) | 48 (72.7%) |
| 6 or 7 Rooms | 11 (19.0%) | 14 (21.2%) |
| 8 or more Rooms | 12 (20.7%) | 4 (6.1%) |
| Total | 58 (100.0%) | 66 (100.0%) |
Housing Structure by Heating Type in Clarksburg
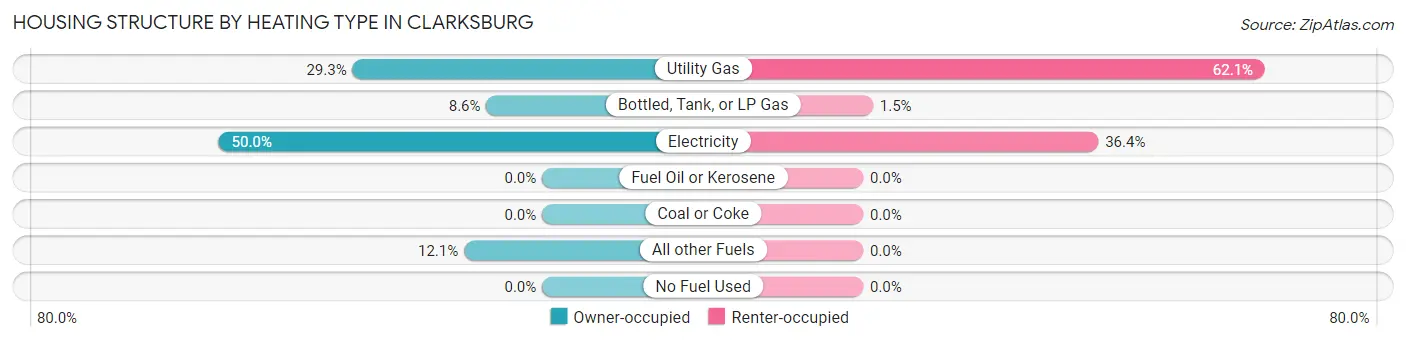
| Heating Type | Owner-occupied | Renter-occupied |
| Utility Gas | 17 (29.3%) | 41 (62.1%) |
| Bottled, Tank, or LP Gas | 5 (8.6%) | 1 (1.5%) |
| Electricity | 29 (50.0%) | 24 (36.4%) |
| Fuel Oil or Kerosene | 0 (0.0%) | 0 (0.0%) |
| Coal or Coke | 0 (0.0%) | 0 (0.0%) |
| All other Fuels | 7 (12.1%) | 0 (0.0%) |
| No Fuel Used | 0 (0.0%) | 0 (0.0%) |
| Total | 58 (100.0%) | 66 (100.0%) |
Household Vehicle Usage in Clarksburg
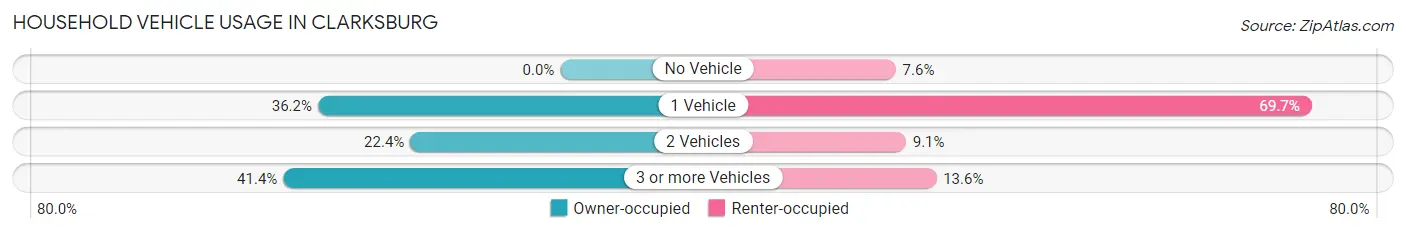
| Vehicles per Household | Owner-occupied | Renter-occupied |
| No Vehicle | 0 (0.0%) | 5 (7.6%) |
| 1 Vehicle | 21 (36.2%) | 46 (69.7%) |
| 2 Vehicles | 13 (22.4%) | 6 (9.1%) |
| 3 or more Vehicles | 24 (41.4%) | 9 (13.6%) |
| Total | 58 (100.0%) | 66 (100.0%) |
Real Estate & Mortgages in Clarksburg
Real Estate and Mortgage Overview in Clarksburg
| Characteristic | Without Mortgage | With Mortgage |
| Housing Units | 29 | 29 |
| Median Property Value | - | - |
| Median Household Income | - | - |
| Monthly Housing Costs | $338 | $0 |
| Real Estate Taxes | $400 | $2 |
Property Value by Mortgage Status in Clarksburg
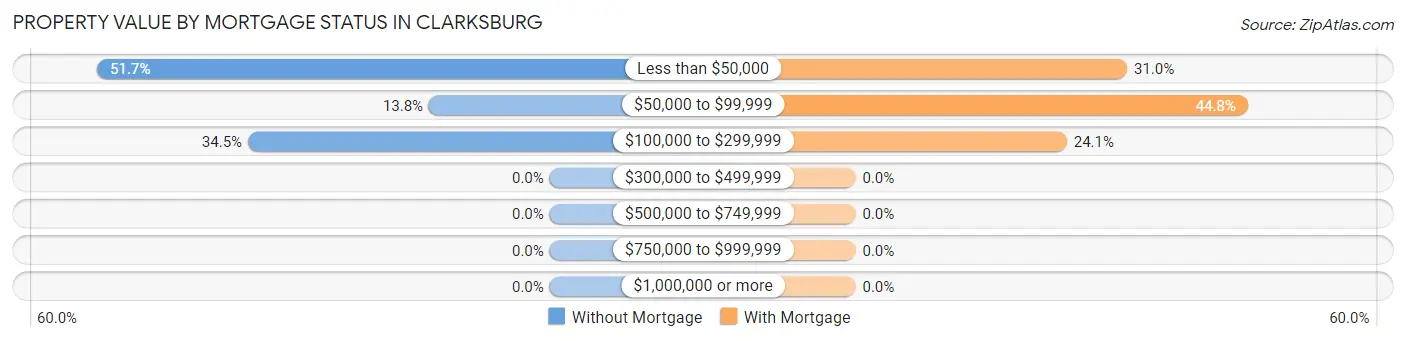
| Property Value | Without Mortgage | With Mortgage |
| Less than $50,000 | 15 (51.7%) | 9 (31.0%) |
| $50,000 to $99,999 | 4 (13.8%) | 13 (44.8%) |
| $100,000 to $299,999 | 10 (34.5%) | 7 (24.1%) |
| $300,000 to $499,999 | 0 (0.0%) | 0 (0.0%) |
| $500,000 to $749,999 | 0 (0.0%) | 0 (0.0%) |
| $750,000 to $999,999 | 0 (0.0%) | 0 (0.0%) |
| $1,000,000 or more | 0 (0.0%) | 0 (0.0%) |
| Total | 29 (100.0%) | 29 (100.0%) |
Household Income by Mortgage Status in Clarksburg
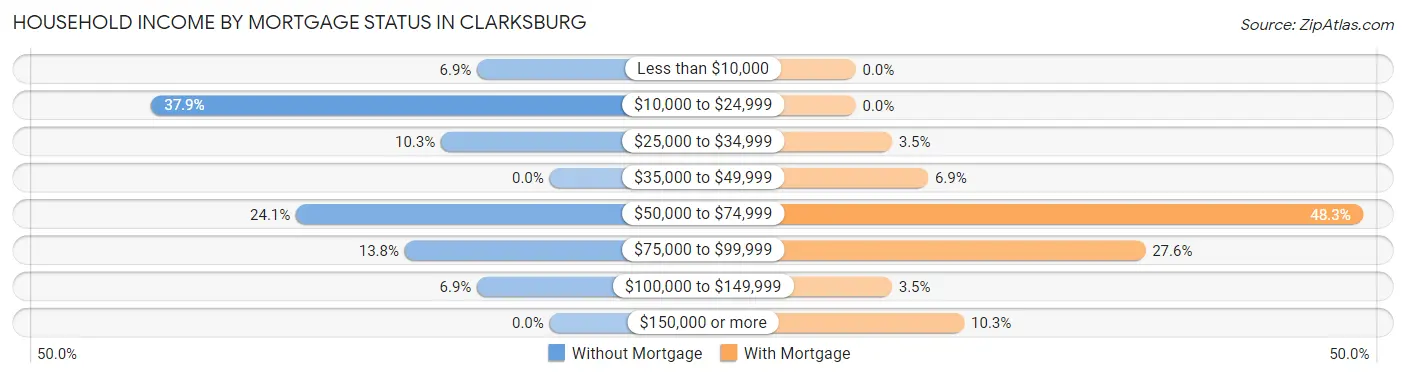
| Household Income | Without Mortgage | With Mortgage |
| Less than $10,000 | 2 (6.9%) | 0 (0.0%) |
| $10,000 to $24,999 | 11 (37.9%) | 0 (0.0%) |
| $25,000 to $34,999 | 3 (10.3%) | 1 (3.5%) |
| $35,000 to $49,999 | 0 (0.0%) | 2 (6.9%) |
| $50,000 to $74,999 | 7 (24.1%) | 14 (48.3%) |
| $75,000 to $99,999 | 4 (13.8%) | 8 (27.6%) |
| $100,000 to $149,999 | 2 (6.9%) | 1 (3.5%) |
| $150,000 or more | 0 (0.0%) | 3 (10.3%) |
| Total | 29 (100.0%) | 29 (100.0%) |
Property Value to Household Income Ratio in Clarksburg
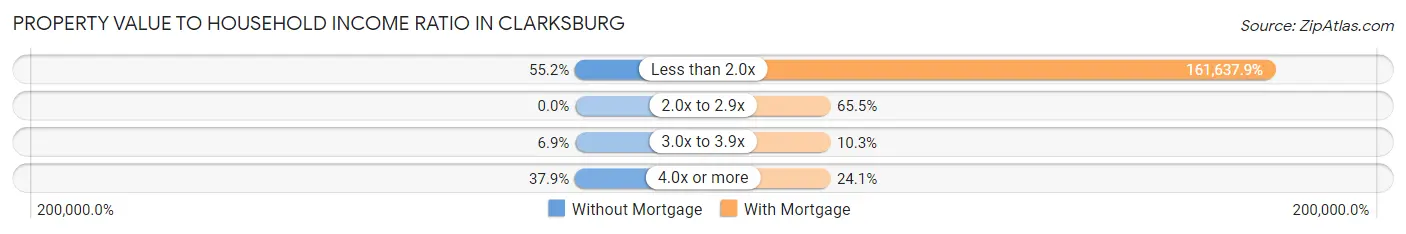
| Value-to-Income Ratio | Without Mortgage | With Mortgage |
| Less than 2.0x | 16 (55.2%) | 46,875 (161,637.9%) |
| 2.0x to 2.9x | 0 (0.0%) | 19 (65.5%) |
| 3.0x to 3.9x | 2 (6.9%) | 3 (10.3%) |
| 4.0x or more | 11 (37.9%) | 7 (24.1%) |
| Total | 29 (100.0%) | 29 (100.0%) |
Real Estate Taxes by Mortgage Status in Clarksburg
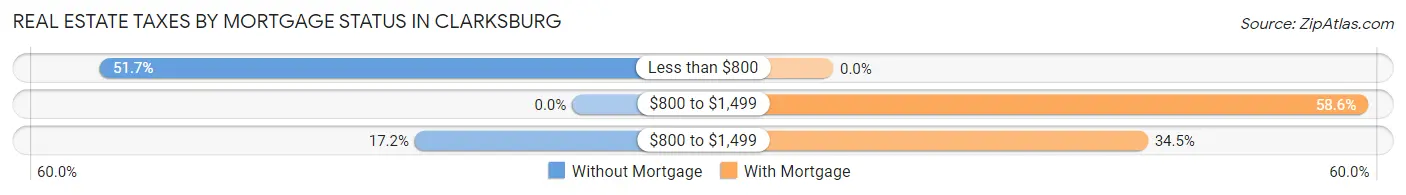
| Property Taxes | Without Mortgage | With Mortgage |
| Less than $800 | 15 (51.7%) | 0 (0.0%) |
| $800 to $1,499 | 0 (0.0%) | 17 (58.6%) |
| $800 to $1,499 | 5 (17.2%) | 10 (34.5%) |
| Total | 29 (100.0%) | 29 (100.0%) |
Health & Disability in Clarksburg
Health Insurance Coverage by Age in Clarksburg
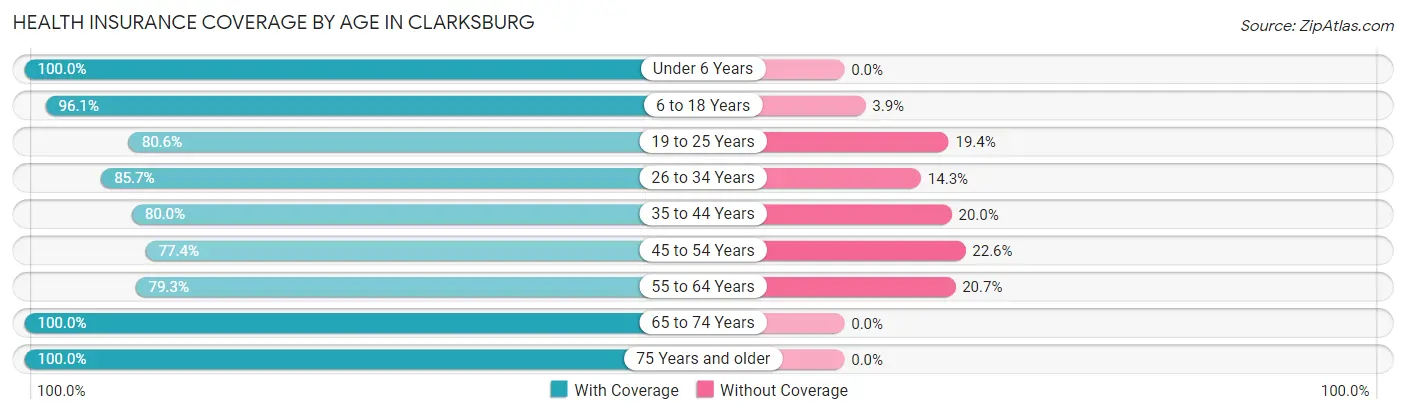
| Age Bracket | With Coverage | Without Coverage |
| Under 6 Years | 31 (100.0%) | 0 (0.0%) |
| 6 to 18 Years | 49 (96.1%) | 2 (3.9%) |
| 19 to 25 Years | 29 (80.6%) | 7 (19.4%) |
| 26 to 34 Years | 24 (85.7%) | 4 (14.3%) |
| 35 to 44 Years | 32 (80.0%) | 8 (20.0%) |
| 45 to 54 Years | 24 (77.4%) | 7 (22.6%) |
| 55 to 64 Years | 23 (79.3%) | 6 (20.7%) |
| 65 to 74 Years | 39 (100.0%) | 0 (0.0%) |
| 75 Years and older | 8 (100.0%) | 0 (0.0%) |
| Total | 259 (88.4%) | 34 (11.6%) |
Health Insurance Coverage by Citizenship Status in Clarksburg
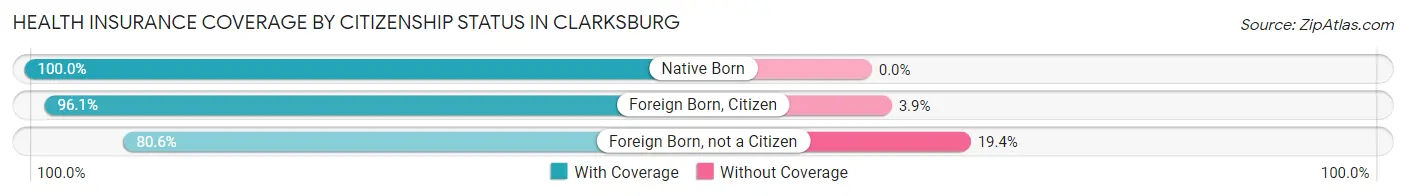
| Citizenship Status | With Coverage | Without Coverage |
| Native Born | 31 (100.0%) | 0 (0.0%) |
| Foreign Born, Citizen | 49 (96.1%) | 2 (3.9%) |
| Foreign Born, not a Citizen | 29 (80.6%) | 7 (19.4%) |
Health Insurance Coverage by Household Income in Clarksburg
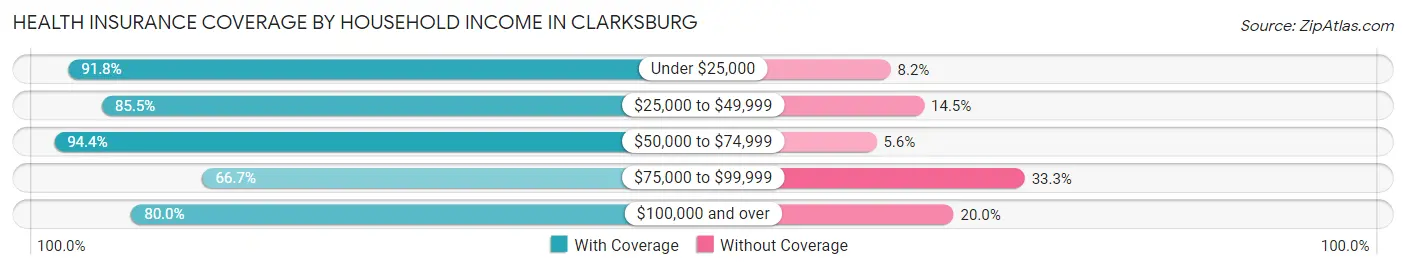
| Household Income | With Coverage | Without Coverage |
| Under $25,000 | 123 (91.8%) | 11 (8.2%) |
| $25,000 to $49,999 | 59 (85.5%) | 10 (14.5%) |
| $50,000 to $74,999 | 51 (94.4%) | 3 (5.6%) |
| $75,000 to $99,999 | 14 (66.7%) | 7 (33.3%) |
| $100,000 and over | 12 (80.0%) | 3 (20.0%) |
Public vs Private Health Insurance Coverage by Age in Clarksburg
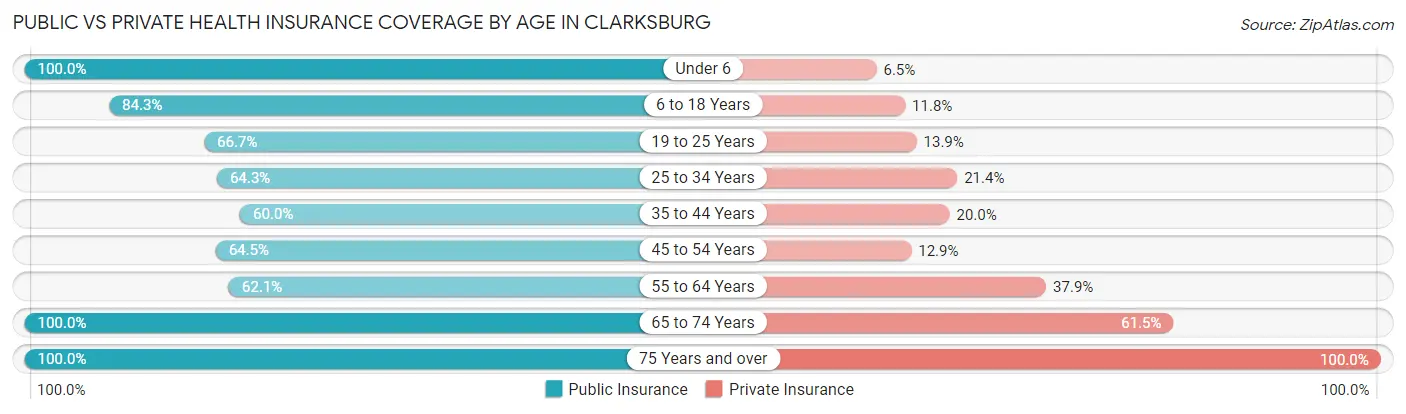
| Age Bracket | Public Insurance | Private Insurance |
| Under 6 | 31 (100.0%) | 2 (6.5%) |
| 6 to 18 Years | 43 (84.3%) | 6 (11.8%) |
| 19 to 25 Years | 24 (66.7%) | 5 (13.9%) |
| 25 to 34 Years | 18 (64.3%) | 6 (21.4%) |
| 35 to 44 Years | 24 (60.0%) | 8 (20.0%) |
| 45 to 54 Years | 20 (64.5%) | 4 (12.9%) |
| 55 to 64 Years | 18 (62.1%) | 11 (37.9%) |
| 65 to 74 Years | 39 (100.0%) | 24 (61.5%) |
| 75 Years and over | 8 (100.0%) | 8 (100.0%) |
| Total | 225 (76.8%) | 74 (25.3%) |
Disability Status by Sex by Age in Clarksburg
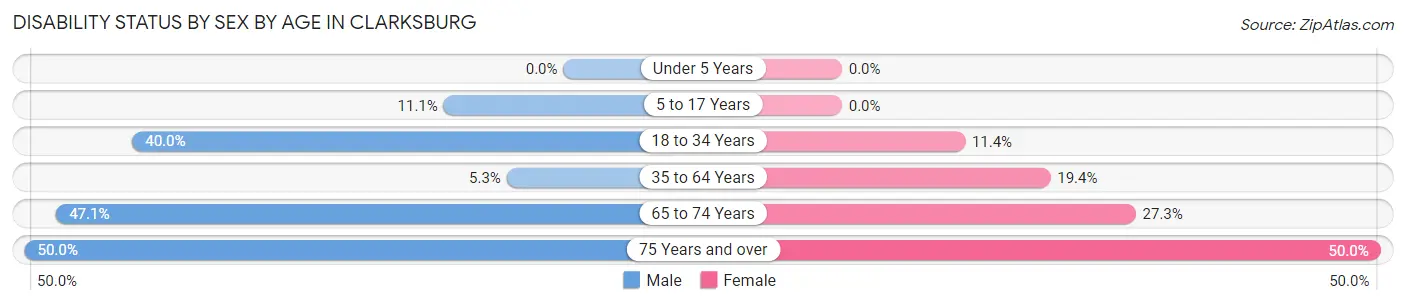
| Age Bracket | Male | Female |
| Under 5 Years | 0 (0.0%) | 0 (0.0%) |
| 5 to 17 Years | 3 (11.1%) | 0 (0.0%) |
| 18 to 34 Years | 12 (40.0%) | 4 (11.4%) |
| 35 to 64 Years | 2 (5.3%) | 12 (19.4%) |
| 65 to 74 Years | 8 (47.1%) | 6 (27.3%) |
| 75 Years and over | 2 (50.0%) | 2 (50.0%) |
Disability Class by Sex by Age in Clarksburg
Disability Class: Hearing Difficulty
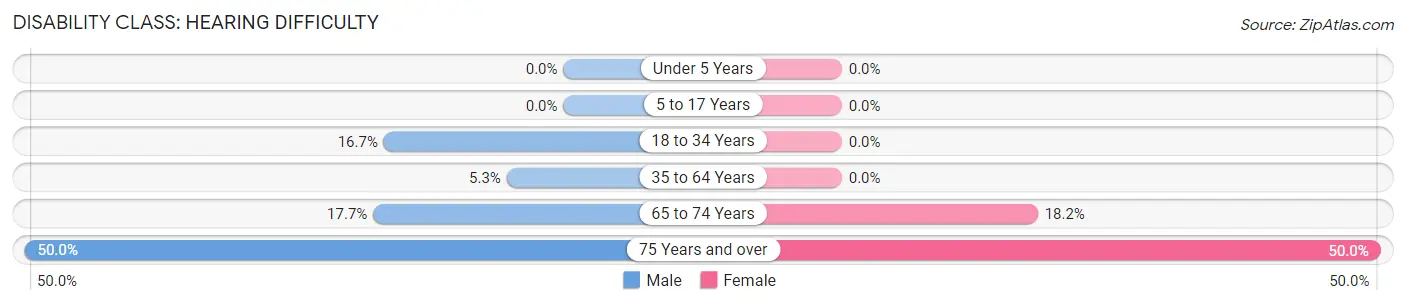
| Age Bracket | Male | Female |
| Under 5 Years | 0 (0.0%) | 0 (0.0%) |
| 5 to 17 Years | 0 (0.0%) | 0 (0.0%) |
| 18 to 34 Years | 5 (16.7%) | 0 (0.0%) |
| 35 to 64 Years | 2 (5.3%) | 0 (0.0%) |
| 65 to 74 Years | 3 (17.6%) | 4 (18.2%) |
| 75 Years and over | 2 (50.0%) | 2 (50.0%) |
Disability Class: Vision Difficulty
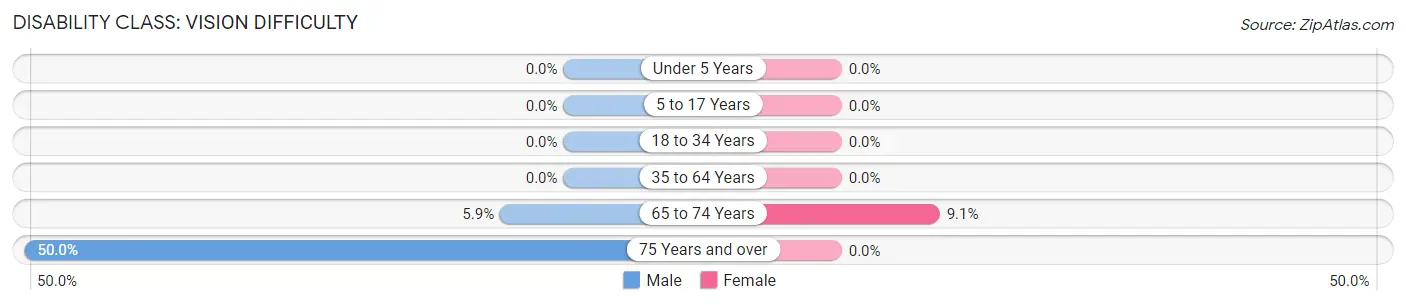
| Age Bracket | Male | Female |
| Under 5 Years | 0 (0.0%) | 0 (0.0%) |
| 5 to 17 Years | 0 (0.0%) | 0 (0.0%) |
| 18 to 34 Years | 0 (0.0%) | 0 (0.0%) |
| 35 to 64 Years | 0 (0.0%) | 0 (0.0%) |
| 65 to 74 Years | 1 (5.9%) | 2 (9.1%) |
| 75 Years and over | 2 (50.0%) | 0 (0.0%) |
Disability Class: Cognitive Difficulty
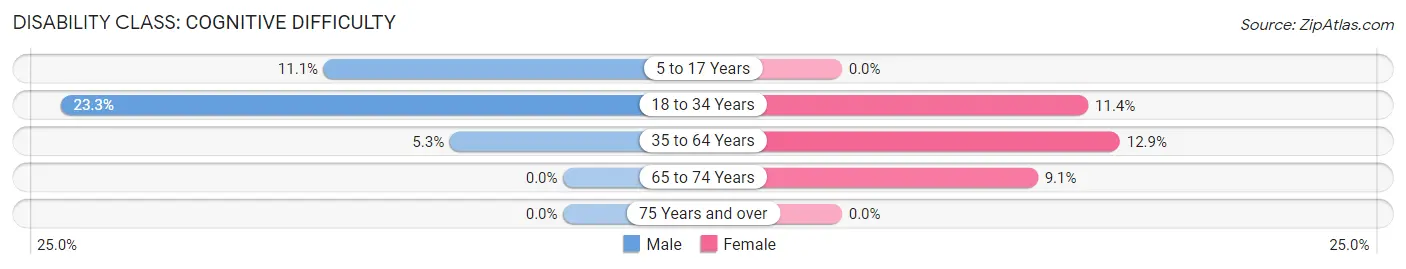
| Age Bracket | Male | Female |
| 5 to 17 Years | 3 (11.1%) | 0 (0.0%) |
| 18 to 34 Years | 7 (23.3%) | 4 (11.4%) |
| 35 to 64 Years | 2 (5.3%) | 8 (12.9%) |
| 65 to 74 Years | 0 (0.0%) | 2 (9.1%) |
| 75 Years and over | 0 (0.0%) | 0 (0.0%) |
Disability Class: Ambulatory Difficulty
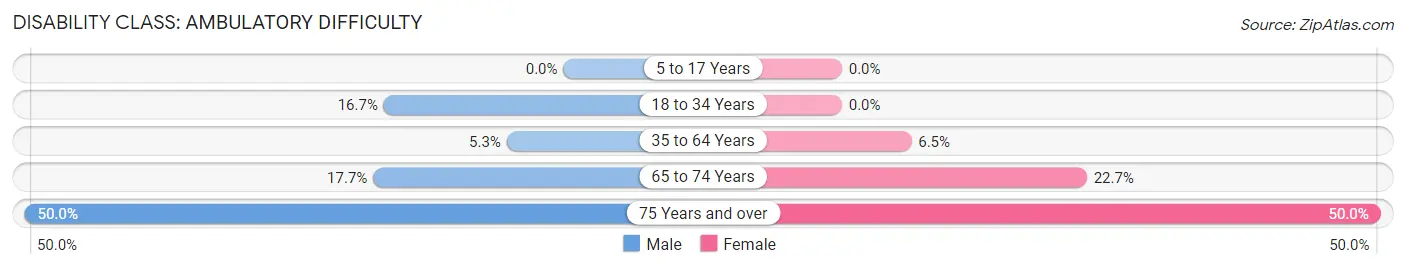
| Age Bracket | Male | Female |
| 5 to 17 Years | 0 (0.0%) | 0 (0.0%) |
| 18 to 34 Years | 5 (16.7%) | 0 (0.0%) |
| 35 to 64 Years | 2 (5.3%) | 4 (6.5%) |
| 65 to 74 Years | 3 (17.6%) | 5 (22.7%) |
| 75 Years and over | 2 (50.0%) | 2 (50.0%) |
Disability Class: Self-Care Difficulty
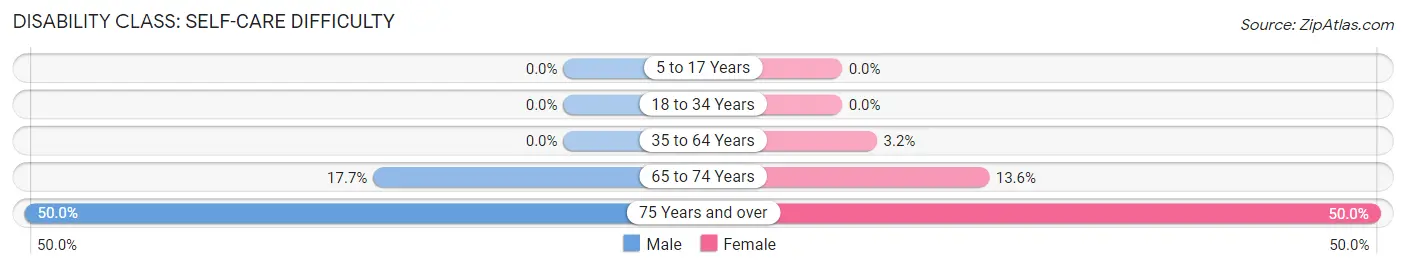
| Age Bracket | Male | Female |
| 5 to 17 Years | 0 (0.0%) | 0 (0.0%) |
| 18 to 34 Years | 0 (0.0%) | 0 (0.0%) |
| 35 to 64 Years | 0 (0.0%) | 2 (3.2%) |
| 65 to 74 Years | 3 (17.6%) | 3 (13.6%) |
| 75 Years and over | 2 (50.0%) | 2 (50.0%) |
Technology Access in Clarksburg
Computing Device Access in Clarksburg
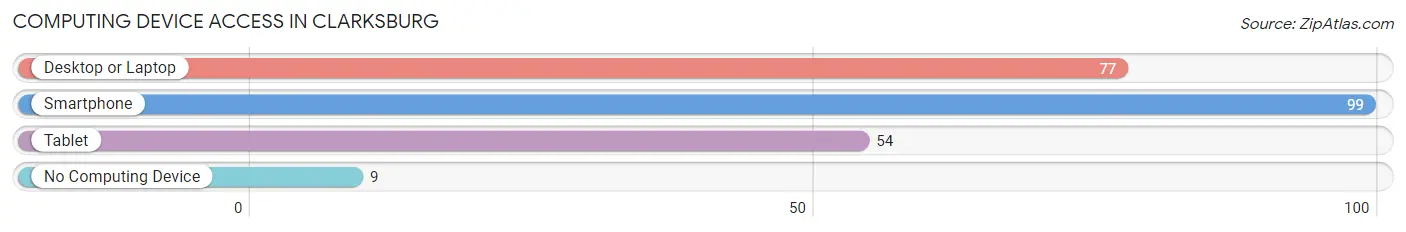
| Device Type | # Households | % Households |
| Desktop or Laptop | 77 | 62.1% |
| Smartphone | 99 | 79.8% |
| Tablet | 54 | 43.5% |
| No Computing Device | 9 | 7.3% |
| Total | 124 | 100.0% |
Internet Access in Clarksburg
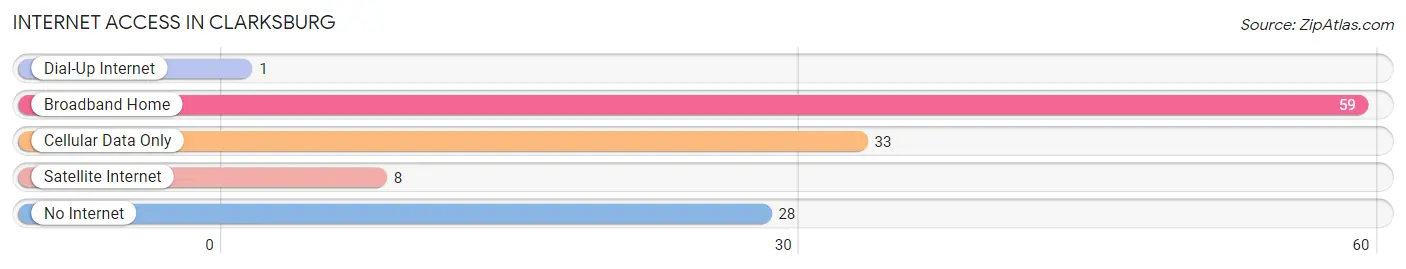
| Internet Type | # Households | % Households |
| Dial-Up Internet | 1 | 0.8% |
| Broadband Home | 59 | 47.6% |
| Cellular Data Only | 33 | 26.6% |
| Satellite Internet | 8 | 6.5% |
| No Internet | 28 | 22.6% |
| Total | 124 | 100.0% |
Clarksburg Summary
Clarksburg, Missouri is a small town located in the Ozark Mountains of southwestern Missouri. It is situated in the foothills of the Ozarks, approximately 20 miles south of Springfield and about 40 miles north of Branson. The town was founded in 1845 and is named after the Clark family, who were among the first settlers in the area. The population of Clarksburg was estimated to be around 500 in 2020.
History
Clarksburg was founded in 1845 by the Clark family, who were among the first settlers in the area. The town was originally known as Clarksville, but the name was changed to Clarksburg in 1851. The town was incorporated in 1872 and has remained relatively unchanged since then.
The town was a major stop on the Butterfield Overland Mail route, which ran from St. Louis to San Francisco. The route was established in 1858 and ran through Clarksburg until 1861, when the Civil War caused it to be discontinued.
The town was also a major stop on the Frisco Railroad, which ran from St. Louis to Springfield. The railroad was established in 1871 and ran through Clarksburg until it was discontinued in the late 1970s.
Geography
Clarksburg is located in the Ozark Mountains of southwestern Missouri. It is situated in the foothills of the Ozarks, approximately 20 miles south of Springfield and about 40 miles north of Branson. The town is located on the banks of the James River, which flows through the town and provides a scenic backdrop.
The town is surrounded by rolling hills and lush forests, making it a popular destination for outdoor activities such as hiking, camping, fishing, and hunting. The town is also home to several state parks, including the Mark Twain National Forest and the Ozark National Scenic Riverways.
Economy
The economy of Clarksburg is largely based on agriculture and tourism. The town is home to several farms, which produce a variety of crops such as corn, soybeans, wheat, and hay. The town is also home to several wineries, which produce a variety of wines.
Tourism is also an important part of the economy of Clarksburg. The town is home to several attractions, including the historic Butterfield Overland Mail route, the Frisco Railroad, and the Ozark National Scenic Riverways. The town is also home to several festivals and events, such as the Clarksburg Country Fair and the Clarksburg Music Festival.
Demographics
The population of Clarksburg was estimated to be around 500 in 2020. The town is predominantly white, with a small African American population. The median household income in Clarksburg is $37,000, and the median home value is $90,000. The town has a low unemployment rate and a high rate of homeownership.
Common Questions
What is Per Capita Income in Clarksburg?
Per Capita income in Clarksburg is $15,719.
What is the Median Family Income in Clarksburg?
Median Family Income in Clarksburg is $24,286.
What is the Median Household income in Clarksburg?
Median Household Income in Clarksburg is $26,250.
What is Income or Wage Gap in Clarksburg?
Income or Wage Gap in Clarksburg is 29.5%.
Women in Clarksburg earn 70.5 cents for every dollar earned by a man.
What is Inequality or Gini Index in Clarksburg?
Inequality or Gini Index in Clarksburg is 0.42.
What is the Total Population of Clarksburg?
Total Population of Clarksburg is 293.
What is the Total Male Population of Clarksburg?
Total Male Population of Clarksburg is 128.
What is the Total Female Population of Clarksburg?
Total Female Population of Clarksburg is 165.
What is the Ratio of Males per 100 Females in Clarksburg?
There are 77.58 Males per 100 Females in Clarksburg.
What is the Ratio of Females per 100 Males in Clarksburg?
There are 128.91 Females per 100 Males in Clarksburg.
What is the Median Population Age in Clarksburg?
Median Population Age in Clarksburg is 35.1 Years.
What is the Average Family Size in Clarksburg
Average Family Size in Clarksburg is 2.6 People.
What is the Average Household Size in Clarksburg
Average Household Size in Clarksburg is 2.4 People.
How Large is the Labor Force in Clarksburg?
There are 112 People in the Labor Forcein in Clarksburg.
What is the Percentage of People in the Labor Force in Clarksburg?
51.1% of People are in the Labor Force in Clarksburg.
What is the Unemployment Rate in Clarksburg?
Unemployment Rate in Clarksburg is 32.1%.