Queen City, MO Map & Demographics
Queen City Map
Queen City Overview
$19,021
PER CAPITA INCOME
$53,523
AVG FAMILY INCOME
$45,893
AVG HOUSEHOLD INCOME
13.9%
WAGE / INCOME GAP [ % ]
86.1¢/ $1
WAGE / INCOME GAP [ $ ]
$5,500
FAMILY INCOME DEFICIT
0.34
INEQUALITY / GINI INDEX
708
TOTAL POPULATION
385
MALE POPULATION
323
FEMALE POPULATION
119.20
MALES / 100 FEMALES
83.90
FEMALES / 100 MALES
38.7
MEDIAN AGE
4.4
AVG FAMILY SIZE
3.1
AVG HOUSEHOLD SIZE
214
LABOR FORCE [ PEOPLE ]
41.2%
PERCENT IN LABOR FORCE
2.8%
UNEMPLOYMENT RATE
Queen City Zip Codes
Queen City Area Codes
Income in Queen City
Income Overview in Queen City
Per Capita Income in Queen City is $19,021, while median incomes of families and households are $53,523 and $45,893 respectively.
| Characteristic | Number | Measure |
| Per Capita Income | 708 | $19,021 |
| Median Family Income | 127 | $53,523 |
| Mean Family Income | 127 | $59,230 |
| Median Household Income | 214 | $45,893 |
| Mean Household Income | 214 | $50,703 |
| Income Deficit | 127 | $5,500 |
| Wage / Income Gap (%) | 708 | 13.93% |
| Wage / Income Gap ($) | 708 | 86.07¢ per $1 |
| Gini / Inequality Index | 708 | 0.34 |
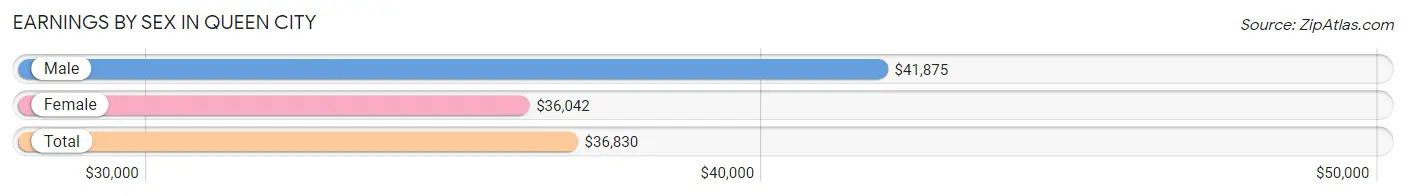
Earnings by Sex in Queen City
Average Earnings in Queen City are $36,830, $41,875 for men and $36,042 for women, a difference of 13.9%.
| Sex | Number | Average Earnings |
| Male | 93 (42.1%) | $41,875 |
| Female | 128 (57.9%) | $36,042 |
| Total | 221 (100.0%) | $36,830 |
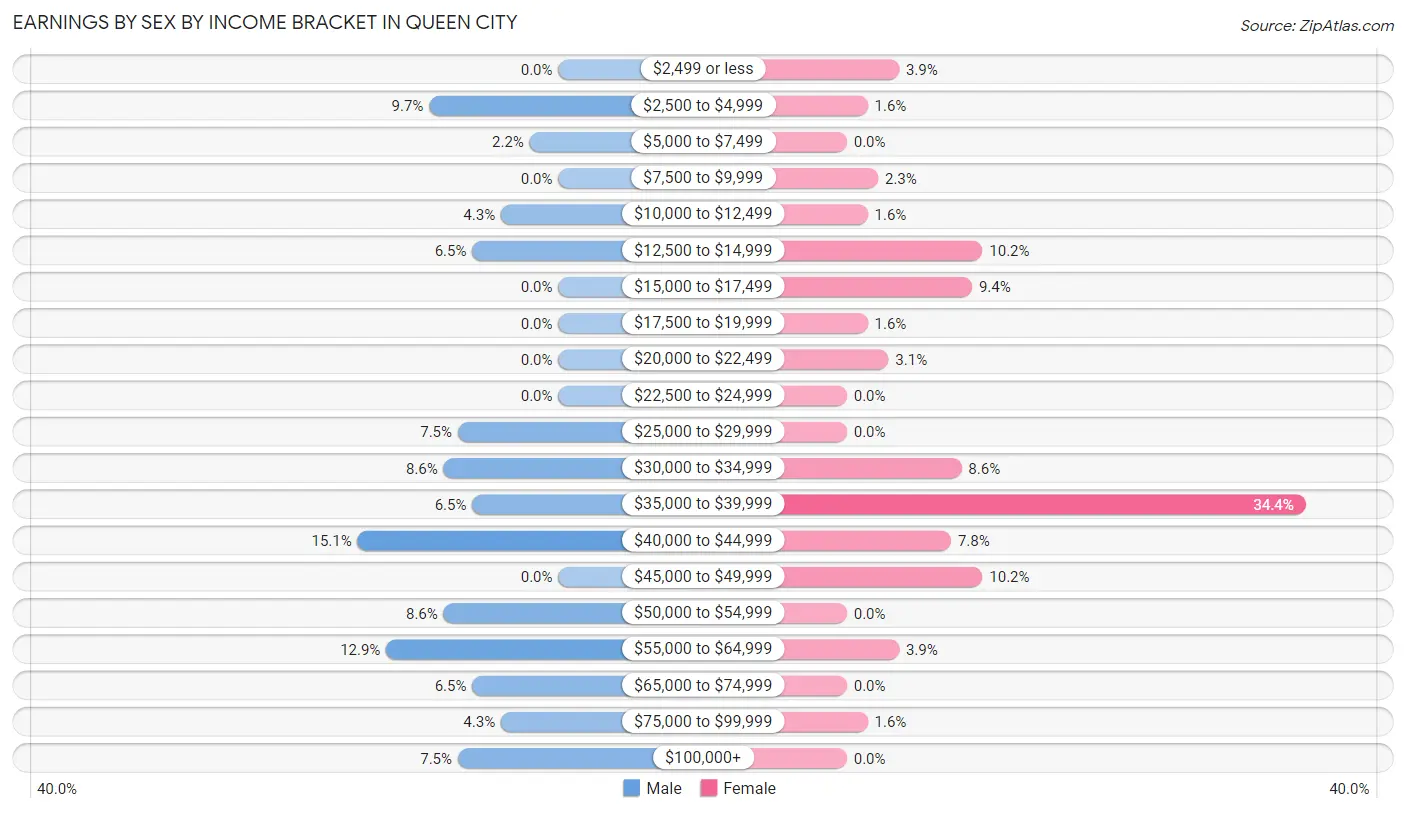
Earnings by Sex by Income Bracket in Queen City
The most common earnings brackets in Queen City are $40,000 to $44,999 for men (14 | 15.0%) and $35,000 to $39,999 for women (44 | 34.4%).
| Income | Male | Female |
| $2,499 or less | 0 (0.0%) | 5 (3.9%) |
| $2,500 to $4,999 | 9 (9.7%) | 2 (1.6%) |
| $5,000 to $7,499 | 2 (2.1%) | 0 (0.0%) |
| $7,500 to $9,999 | 0 (0.0%) | 3 (2.3%) |
| $10,000 to $12,499 | 4 (4.3%) | 2 (1.6%) |
| $12,500 to $14,999 | 6 (6.5%) | 13 (10.2%) |
| $15,000 to $17,499 | 0 (0.0%) | 12 (9.4%) |
| $17,500 to $19,999 | 0 (0.0%) | 2 (1.6%) |
| $20,000 to $22,499 | 0 (0.0%) | 4 (3.1%) |
| $22,500 to $24,999 | 0 (0.0%) | 0 (0.0%) |
| $25,000 to $29,999 | 7 (7.5%) | 0 (0.0%) |
| $30,000 to $34,999 | 8 (8.6%) | 11 (8.6%) |
| $35,000 to $39,999 | 6 (6.5%) | 44 (34.4%) |
| $40,000 to $44,999 | 14 (15.0%) | 10 (7.8%) |
| $45,000 to $49,999 | 0 (0.0%) | 13 (10.2%) |
| $50,000 to $54,999 | 8 (8.6%) | 0 (0.0%) |
| $55,000 to $64,999 | 12 (12.9%) | 5 (3.9%) |
| $65,000 to $74,999 | 6 (6.5%) | 0 (0.0%) |
| $75,000 to $99,999 | 4 (4.3%) | 2 (1.6%) |
| $100,000+ | 7 (7.5%) | 0 (0.0%) |
| Total | 93 (100.0%) | 128 (100.0%) |
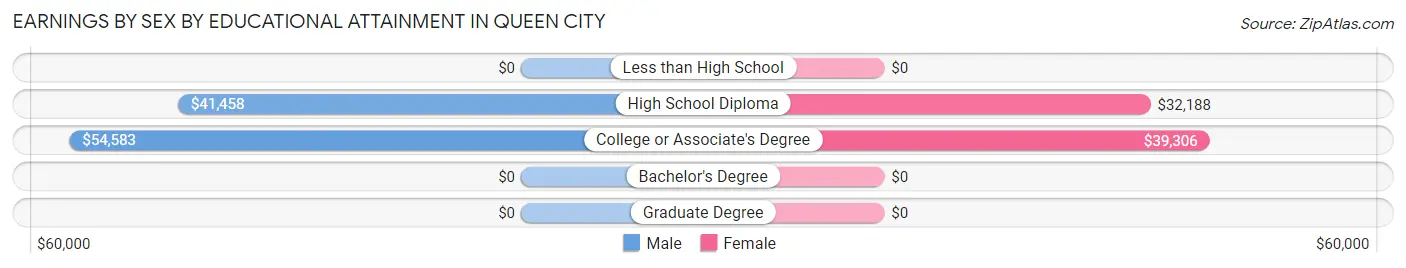
Earnings by Sex by Educational Attainment in Queen City
Average earnings in Queen City are $42,969 for men and $36,302 for women, a difference of 15.5%. Men with an educational attainment of college or associate's degree enjoy the highest average annual earnings of $54,583, while those with high school diploma education earn the least with $41,458. Women with an educational attainment of college or associate's degree earn the most with the average annual earnings of $39,306, while those with high school diploma education have the smallest earnings of $32,188.
| Educational Attainment | Male Income | Female Income |
| Less than High School | - | - |
| High School Diploma | $41,458 | $32,188 |
| College or Associate's Degree | $54,583 | $39,306 |
| Bachelor's Degree | - | - |
| Graduate Degree | - | - |
| Total | $42,969 | $36,302 |
Family Income in Queen City
Family Income Brackets in Queen City
According to the Queen City family income data, there are 45 families falling into the $35,000 to $49,999 income range, which is the most common income bracket and makes up 35.4% of all families.
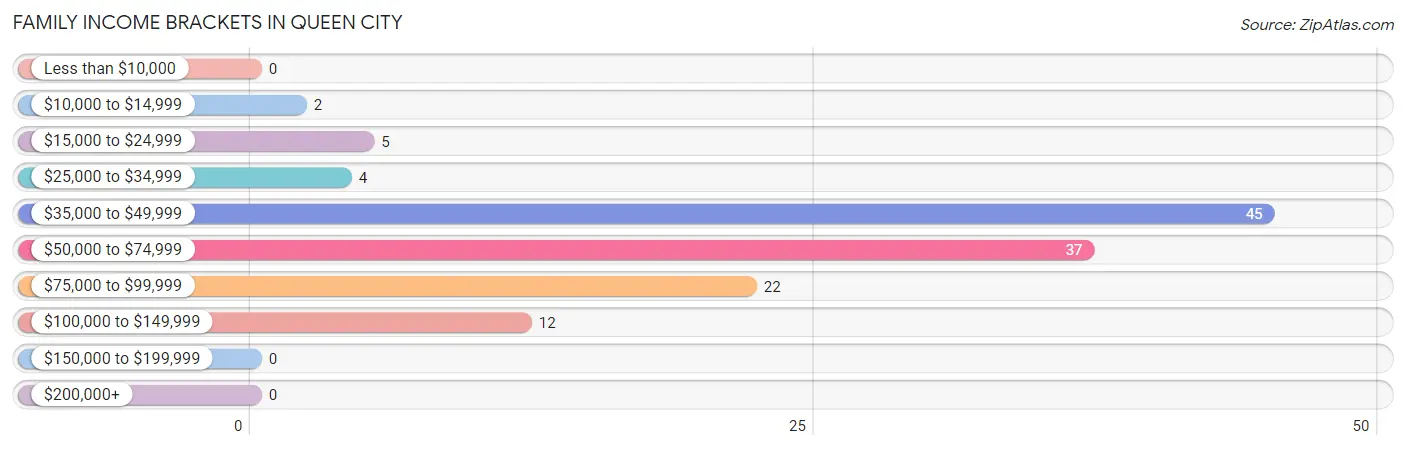
| Income Bracket | # Families | % Families |
| Less than $10,000 | 0 | 0.0% |
| $10,000 to $14,999 | 2 | 1.6% |
| $15,000 to $24,999 | 5 | 3.9% |
| $25,000 to $34,999 | 4 | 3.1% |
| $35,000 to $49,999 | 45 | 35.4% |
| $50,000 to $74,999 | 37 | 29.1% |
| $75,000 to $99,999 | 22 | 17.3% |
| $100,000 to $149,999 | 12 | 9.4% |
| $150,000 to $199,999 | 0 | 0.0% |
| $200,000+ | 0 | 0.0% |
Family Income by Famaliy Size in Queen City
6-person families (12 | 9.5%) account for the highest median family income in Queen City with $77,000 per family, while 2-person families (72 | 56.7%) have the highest median income of $22,708 per family member.
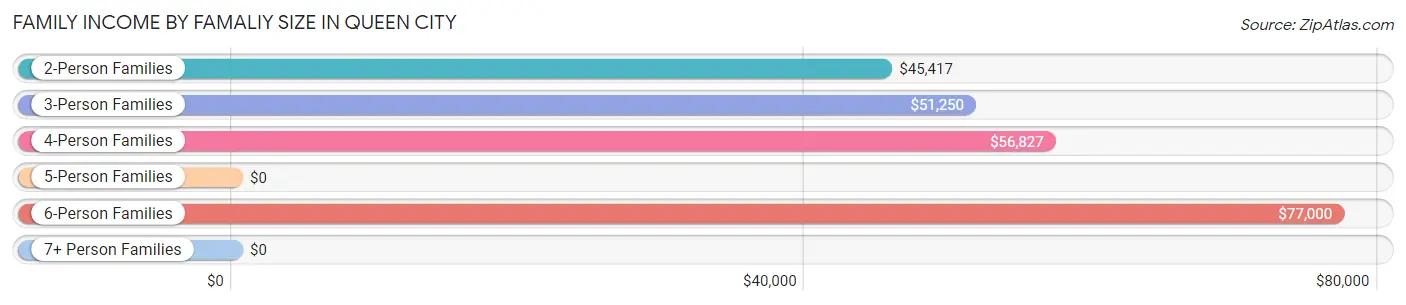
| Income Bracket | # Families | Median Income |
| 2-Person Families | 72 (56.7%) | $45,417 |
| 3-Person Families | 19 (15.0%) | $51,250 |
| 4-Person Families | 19 (15.0%) | $56,827 |
| 5-Person Families | 5 (3.9%) | $0 |
| 6-Person Families | 12 (9.5%) | $77,000 |
| 7+ Person Families | 0 (0.0%) | $0 |
| Total | 127 (100.0%) | $53,523 |
Family Income by Number of Earners in Queen City
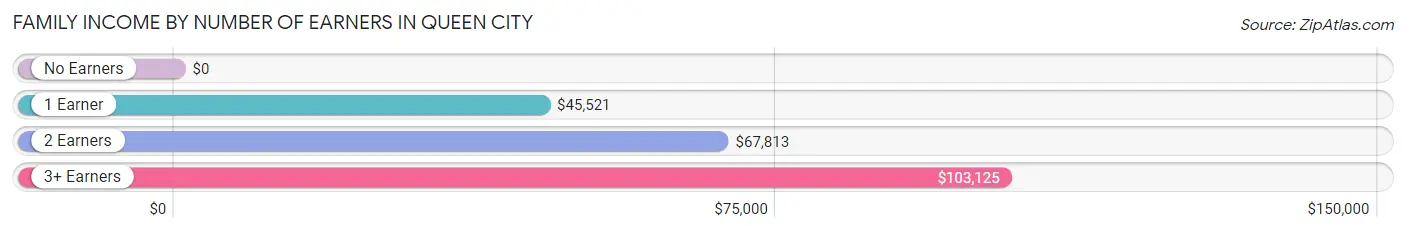
| Number of Earners | # Families | Median Income |
| No Earners | 22 (17.3%) | $0 |
| 1 Earner | 57 (44.9%) | $45,521 |
| 2 Earners | 41 (32.3%) | $67,813 |
| 3+ Earners | 7 (5.5%) | $103,125 |
| Total | 127 (100.0%) | $53,523 |
Household Income in Queen City
Household Income Brackets in Queen City
With 53 households falling in the category, the $35,000 to $49,999 income range is the most frequent in Queen City, accounting for 24.8% of all households.
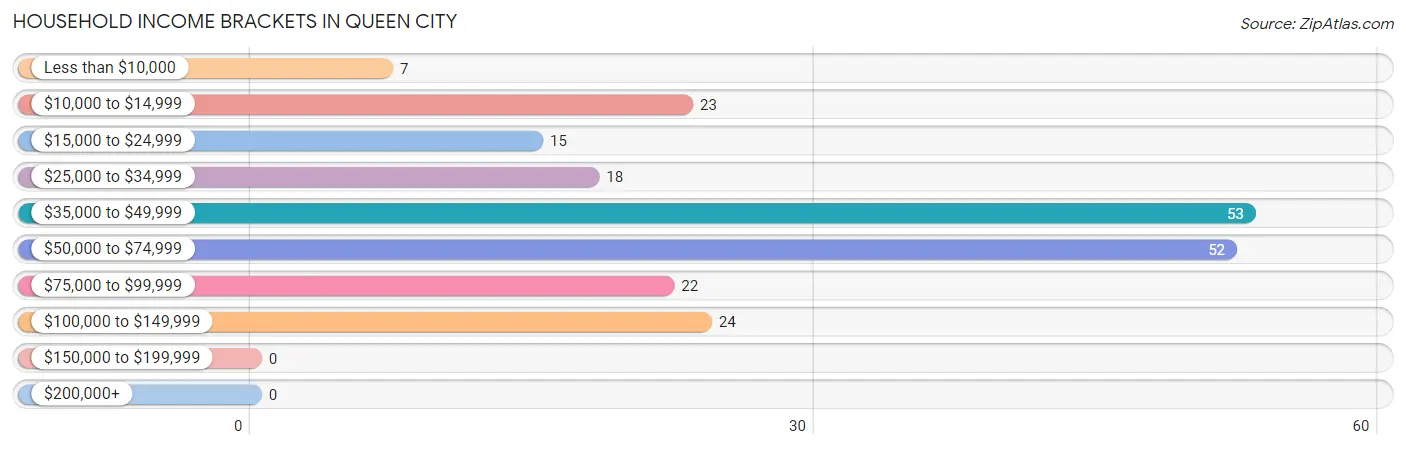
| Income Bracket | # Households | % Households |
| Less than $10,000 | 7 | 3.3% |
| $10,000 to $14,999 | 23 | 10.7% |
| $15,000 to $24,999 | 15 | 7.0% |
| $25,000 to $34,999 | 18 | 8.4% |
| $35,000 to $49,999 | 53 | 24.8% |
| $50,000 to $74,999 | 52 | 24.3% |
| $75,000 to $99,999 | 22 | 10.3% |
| $100,000 to $149,999 | 24 | 11.2% |
| $150,000 to $199,999 | 0 | 0.0% |
| $200,000+ | 0 | 0.0% |
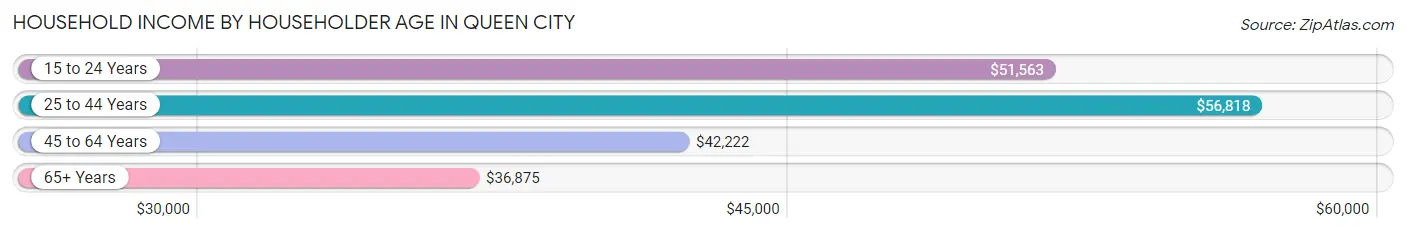
Household Income by Householder Age in Queen City
The median household income in Queen City is $45,893, with the highest median household income of $56,818 found in the 25 to 44 years age bracket for the primary householder. A total of 50 households (23.4%) fall into this category. Meanwhile, the 65+ years age bracket for the primary householder has the lowest median household income of $36,875, with 69 households (32.2%) in this group.
| Income Bracket | # Households | Median Income |
| 15 to 24 Years | 13 (6.1%) | $51,563 |
| 25 to 44 Years | 50 (23.4%) | $56,818 |
| 45 to 64 Years | 82 (38.3%) | $42,222 |
| 65+ Years | 69 (32.2%) | $36,875 |
| Total | 214 (100.0%) | $45,893 |
Poverty in Queen City
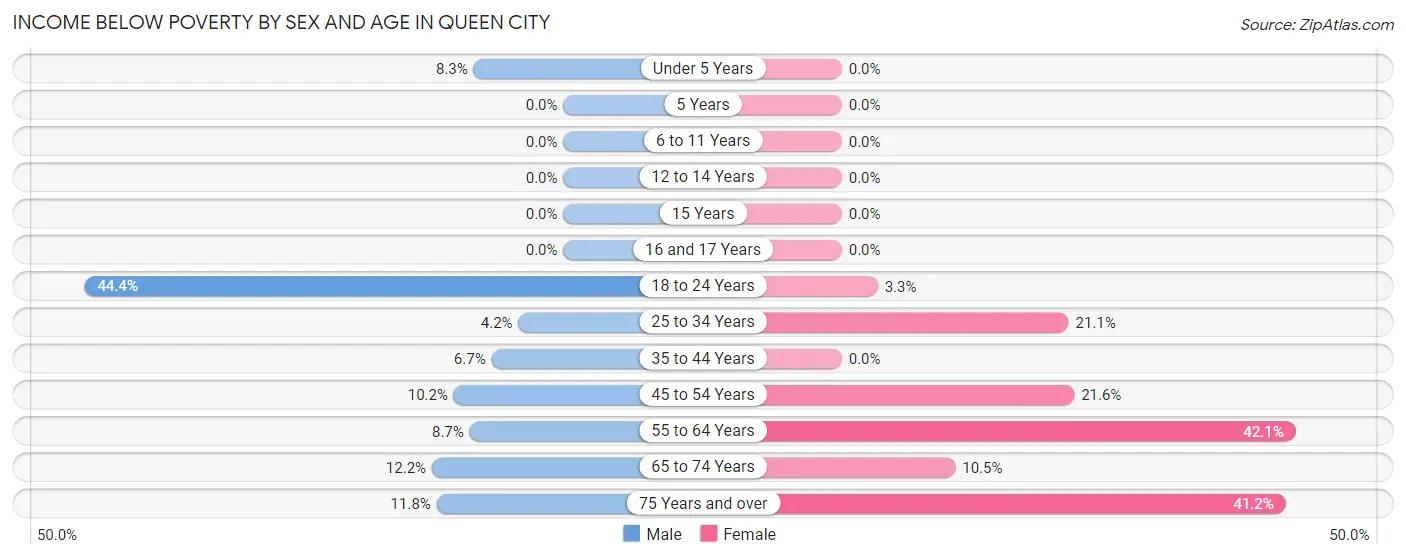
Income Below Poverty by Sex and Age in Queen City
With 8.6% poverty level for males and 13.0% for females among the residents of Queen City, 18 to 24 year old males and 55 to 64 year old females are the most vulnerable to poverty, with 4 males (44.4%) and 8 females (42.1%) in their respective age groups living below the poverty level.
| Age Bracket | Male | Female |
| Under 5 Years | 7 (8.3%) | 0 (0.0%) |
| 5 Years | 0 (0.0%) | 0 (0.0%) |
| 6 to 11 Years | 0 (0.0%) | 0 (0.0%) |
| 12 to 14 Years | 0 (0.0%) | 0 (0.0%) |
| 15 Years | 0 (0.0%) | 0 (0.0%) |
| 16 and 17 Years | 0 (0.0%) | 0 (0.0%) |
| 18 to 24 Years | 4 (44.4%) | 1 (3.3%) |
| 25 to 34 Years | 2 (4.2%) | 4 (21.0%) |
| 35 to 44 Years | 2 (6.7%) | 0 (0.0%) |
| 45 to 54 Years | 6 (10.2%) | 11 (21.6%) |
| 55 to 64 Years | 2 (8.7%) | 8 (42.1%) |
| 65 to 74 Years | 5 (12.2%) | 4 (10.5%) |
| 75 Years and over | 4 (11.8%) | 14 (41.2%) |
| Total | 32 (8.6%) | 42 (13.0%) |
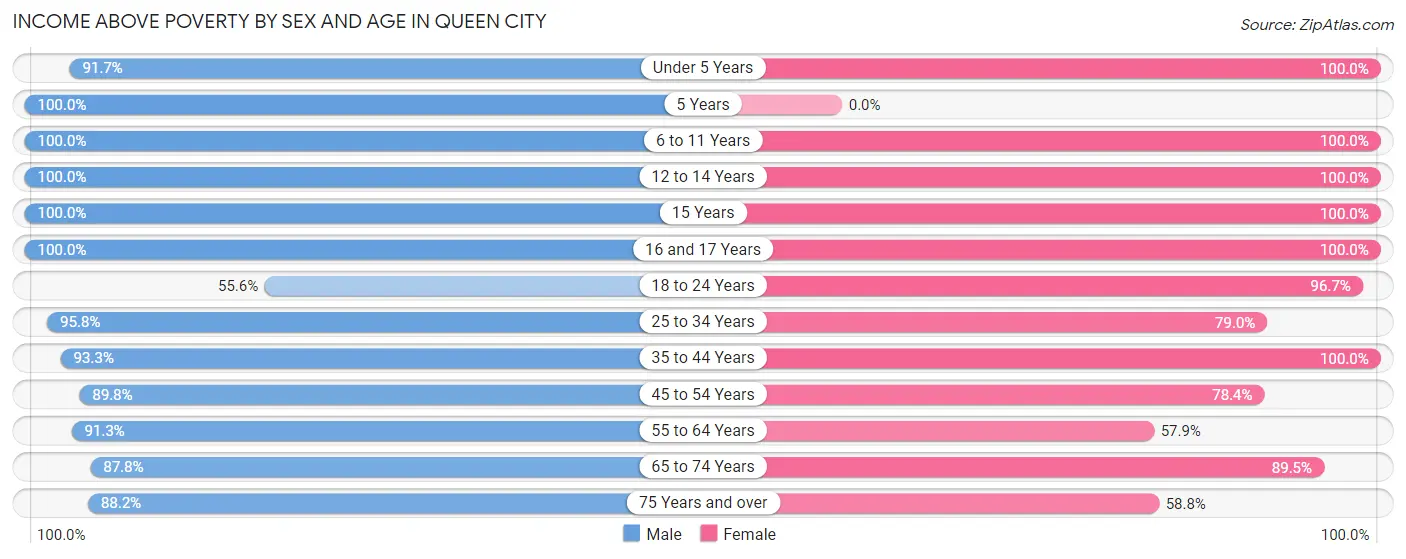
Income Above Poverty by Sex and Age in Queen City
According to the poverty statistics in Queen City, males aged 5 years and females aged under 5 years are the age groups that are most secure financially, with 100.0% of males and 100.0% of females in these age groups living above the poverty line.
| Age Bracket | Male | Female |
| Under 5 Years | 77 (91.7%) | 26 (100.0%) |
| 5 Years | 6 (100.0%) | 0 (0.0%) |
| 6 to 11 Years | 18 (100.0%) | 30 (100.0%) |
| 12 to 14 Years | 6 (100.0%) | 10 (100.0%) |
| 15 Years | 4 (100.0%) | 5 (100.0%) |
| 16 and 17 Years | 12 (100.0%) | 4 (100.0%) |
| 18 to 24 Years | 5 (55.6%) | 29 (96.7%) |
| 25 to 34 Years | 46 (95.8%) | 15 (78.9%) |
| 35 to 44 Years | 28 (93.3%) | 57 (100.0%) |
| 45 to 54 Years | 53 (89.8%) | 40 (78.4%) |
| 55 to 64 Years | 21 (91.3%) | 11 (57.9%) |
| 65 to 74 Years | 36 (87.8%) | 34 (89.5%) |
| 75 Years and over | 30 (88.2%) | 20 (58.8%) |
| Total | 342 (91.4%) | 281 (87.0%) |
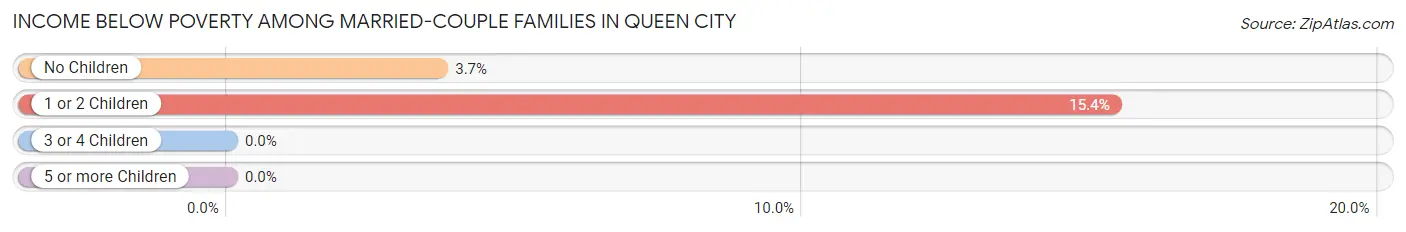
Income Below Poverty Among Married-Couple Families in Queen City
The poverty statistics for married-couple families in Queen City show that 5.6% or 7 of the total 125 families live below the poverty line. Families with 1 or 2 children have the highest poverty rate of 15.4%, comprising of 4 families. On the other hand, families with 3 or 4 children have the lowest poverty rate of 0.0%, which includes 0 families.
| Children | Above Poverty | Below Poverty |
| No Children | 79 (96.3%) | 3 (3.7%) |
| 1 or 2 Children | 22 (84.6%) | 4 (15.4%) |
| 3 or 4 Children | 17 (100.0%) | 0 (0.0%) |
| 5 or more Children | 0 (0.0%) | 0 (0.0%) |
| Total | 118 (94.4%) | 7 (5.6%) |
Income Below Poverty Among Single-Parent Households in Queen City
| Children | Single Father | Single Mother |
| No Children | 0 (0.0%) | 0 (0.0%) |
| 1 or 2 Children | 0 (0.0%) | 0 (0.0%) |
| 3 or 4 Children | 0 (0.0%) | 0 (0.0%) |
| 5 or more Children | 0 (0.0%) | 0 (0.0%) |
| Total | 0 (0.0%) | 0 (0.0%) |
Income Below Poverty Among Married-Couple vs Single-Parent Households in Queen City
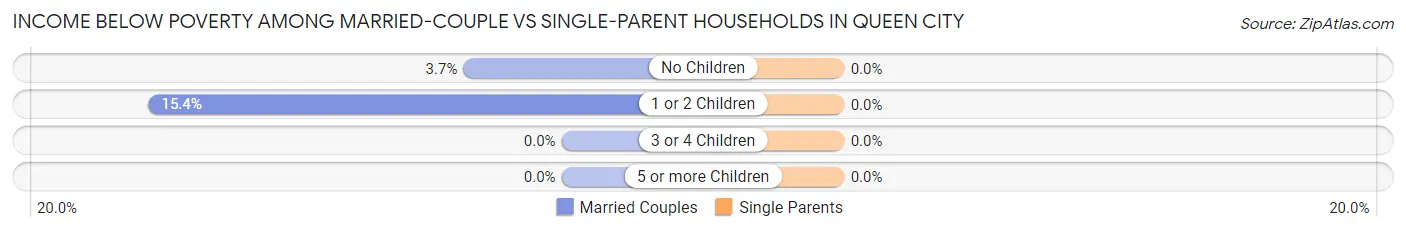
| Children | Married-Couple Families | Single-Parent Households |
| No Children | 3 (3.7%) | 0 (0.0%) |
| 1 or 2 Children | 4 (15.4%) | 0 (0.0%) |
| 3 or 4 Children | 0 (0.0%) | 0 (0.0%) |
| 5 or more Children | 0 (0.0%) | 0 (0.0%) |
| Total | 7 (5.6%) | 0 (0.0%) |
Race in Queen City
The most populous races in Queen City are White / Caucasian (685 | 96.8%), Black / African American (12 | 1.7%), and Asian (11 | 1.5%).
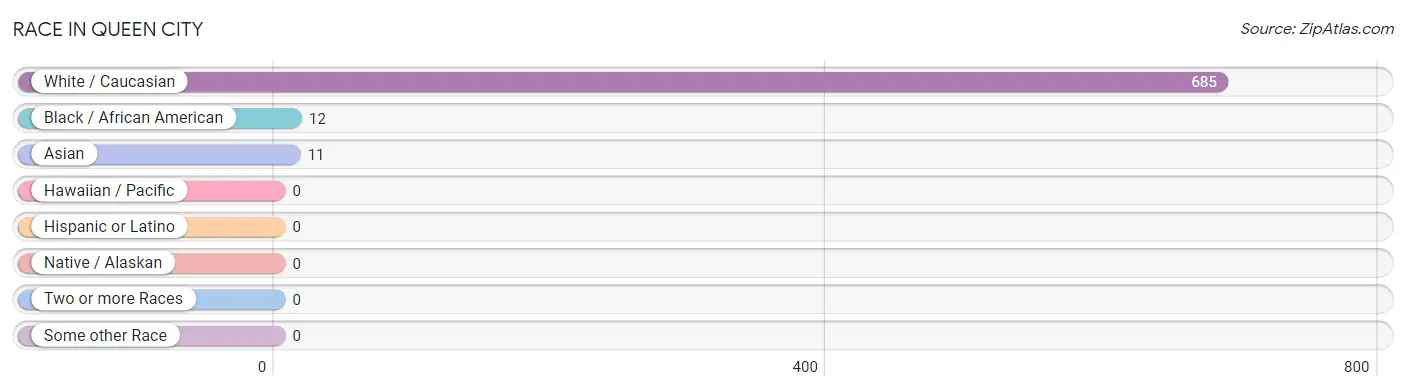
| Race | # Population | % Population |
| Asian | 11 | 1.5% |
| Black / African American | 12 | 1.7% |
| Hawaiian / Pacific | 0 | 0.0% |
| Hispanic or Latino | 0 | 0.0% |
| Native / Alaskan | 0 | 0.0% |
| White / Caucasian | 685 | 96.8% |
| Two or more Races | 0 | 0.0% |
| Some other Race | 0 | 0.0% |
| Total | 708 | 100.0% |
Ancestry in Queen City
The most populous ancestries reported in Queen City are German (225 | 31.8%), American (104 | 14.7%), Irish (50 | 7.1%), Italian (44 | 6.2%), and English (43 | 6.1%), together accounting for 65.8% of all Queen City residents.
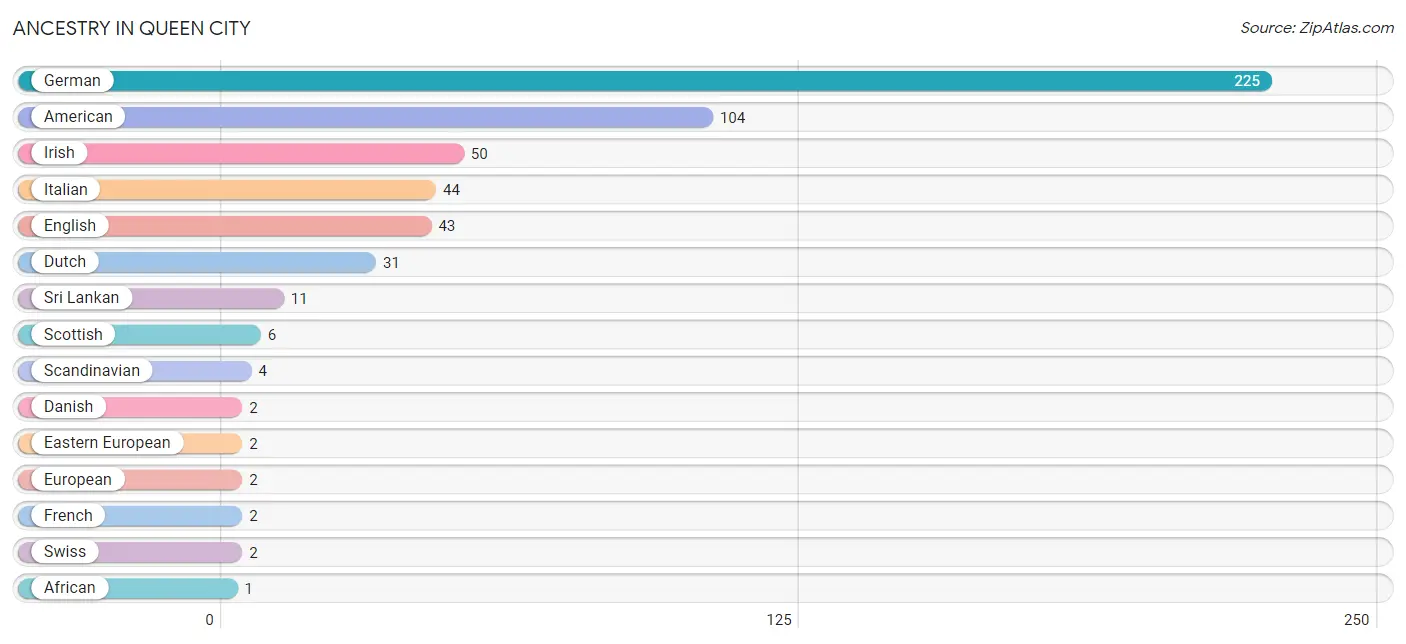
| Ancestry | # Population | % Population |
| African | 1 | 0.1% |
| American | 104 | 14.7% |
| Danish | 2 | 0.3% |
| Dutch | 31 | 4.4% |
| Eastern European | 2 | 0.3% |
| English | 43 | 6.1% |
| European | 2 | 0.3% |
| French | 2 | 0.3% |
| German | 225 | 31.8% |
| Irish | 50 | 7.1% |
| Italian | 44 | 6.2% |
| Scandinavian | 4 | 0.6% |
| Scottish | 6 | 0.9% |
| Sri Lankan | 11 | 1.5% |
| Subsaharan African | 1 | 0.1% |
| Swiss | 2 | 0.3% | View All 16 Rows |
Immigrants in Queen City
The most numerous immigrant groups reported in Queen City came from Asia (2 | 0.3%), South Eastern Asia (2 | 0.3%), Vietnam (2 | 0.3%), Europe (1 | 0.1%), and Italy (1 | 0.1%), together accounting for 1.1% of all Queen City residents.
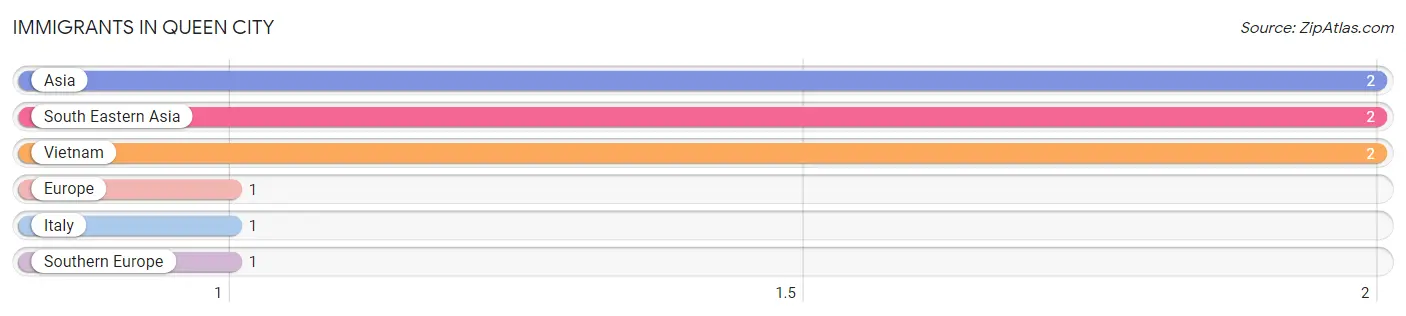
| Immigration Origin | # Population | % Population |
| Asia | 2 | 0.3% |
| Europe | 1 | 0.1% |
| Italy | 1 | 0.1% |
| South Eastern Asia | 2 | 0.3% |
| Southern Europe | 1 | 0.1% |
| Vietnam | 2 | 0.3% | View All 6 Rows |
Sex and Age in Queen City
Sex and Age in Queen City
The most populous age groups in Queen City are Under 5 Years (84 | 21.8%) for men and 35 to 39 Years (53 | 16.4%) for women.
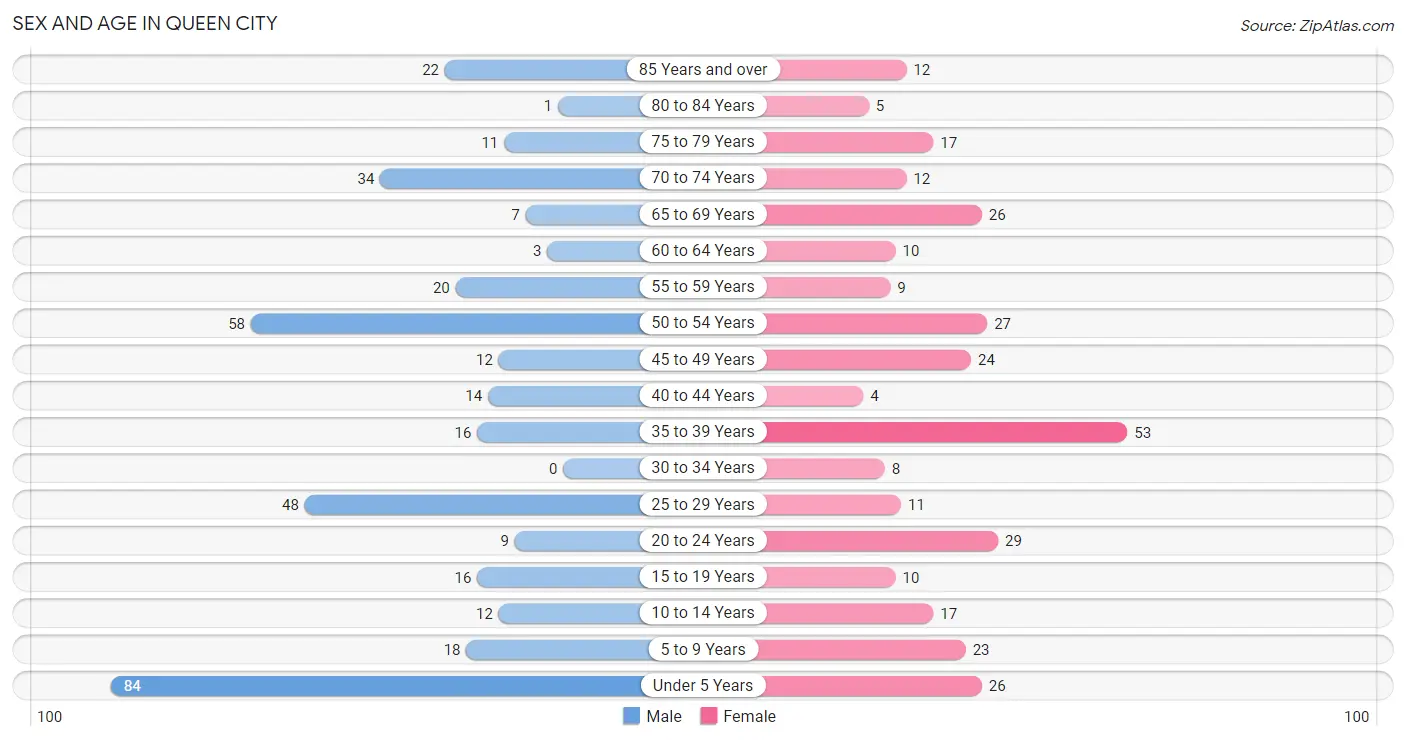
| Age Bracket | Male | Female |
| Under 5 Years | 84 (21.8%) | 26 (8.1%) |
| 5 to 9 Years | 18 (4.7%) | 23 (7.1%) |
| 10 to 14 Years | 12 (3.1%) | 17 (5.3%) |
| 15 to 19 Years | 16 (4.2%) | 10 (3.1%) |
| 20 to 24 Years | 9 (2.3%) | 29 (9.0%) |
| 25 to 29 Years | 48 (12.5%) | 11 (3.4%) |
| 30 to 34 Years | 0 (0.0%) | 8 (2.5%) |
| 35 to 39 Years | 16 (4.2%) | 53 (16.4%) |
| 40 to 44 Years | 14 (3.6%) | 4 (1.2%) |
| 45 to 49 Years | 12 (3.1%) | 24 (7.4%) |
| 50 to 54 Years | 58 (15.1%) | 27 (8.4%) |
| 55 to 59 Years | 20 (5.2%) | 9 (2.8%) |
| 60 to 64 Years | 3 (0.8%) | 10 (3.1%) |
| 65 to 69 Years | 7 (1.8%) | 26 (8.1%) |
| 70 to 74 Years | 34 (8.8%) | 12 (3.7%) |
| 75 to 79 Years | 11 (2.9%) | 17 (5.3%) |
| 80 to 84 Years | 1 (0.3%) | 5 (1.5%) |
| 85 Years and over | 22 (5.7%) | 12 (3.7%) |
| Total | 385 (100.0%) | 323 (100.0%) |
Families and Households in Queen City
Median Family Size in Queen City
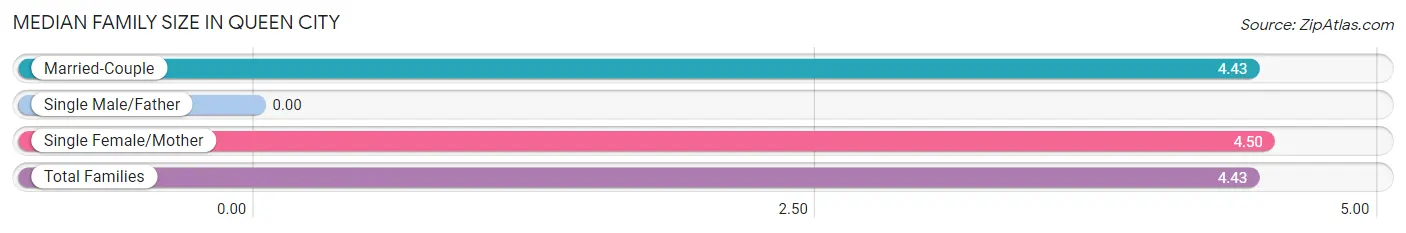
| Family Type | # Families | Family Size |
| Married-Couple | 125 (98.4%) | 4.43 |
| Single Male/Father | 0 (0.0%) | - |
| Single Female/Mother | 2 (1.6%) | 4.50 |
| Total Families | 127 (100.0%) | 4.43 |
Median Household Size in Queen City
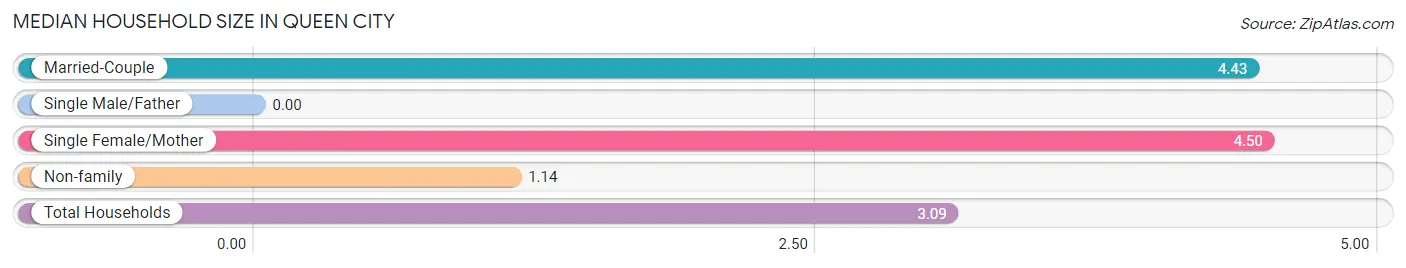
| Household Type | # Households | Household Size |
| Married-Couple | 125 (58.4%) | 4.43 |
| Single Male/Father | 0 (0.0%) | - |
| Single Female/Mother | 2 (0.9%) | 4.50 |
| Non-family | 87 (40.6%) | 1.14 |
| Total Households | 214 (100.0%) | 3.09 |
Household Size by Marriage Status in Queen City
Out of a total of 214 households in Queen City, 127 (59.4%) are family households, while 87 (40.6%) are nonfamily households. The most numerous type of family households are 2-person households, comprising 72, and the most common type of nonfamily households are 1-person households, comprising 69.
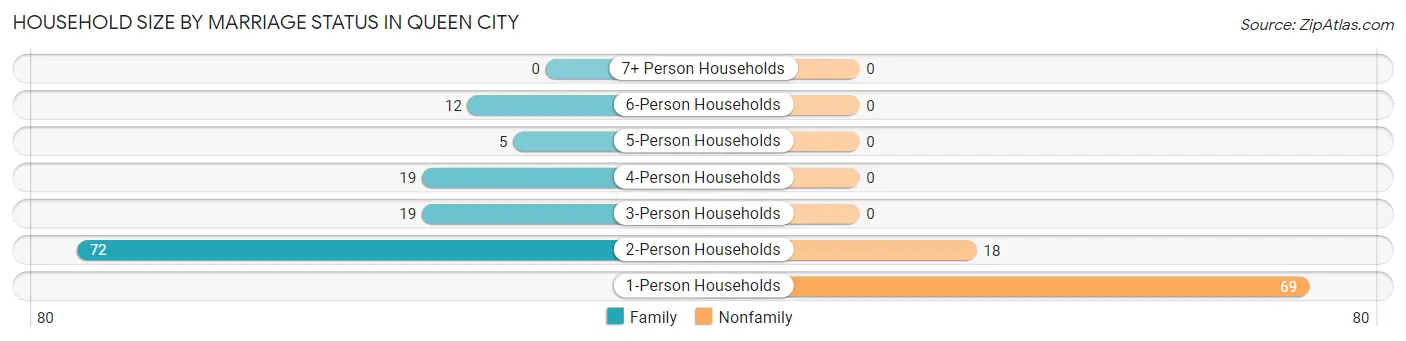
| Household Size | Family Households | Nonfamily Households |
| 1-Person Households | - | 69 (32.2%) |
| 2-Person Households | 72 (33.6%) | 18 (8.4%) |
| 3-Person Households | 19 (8.9%) | 0 (0.0%) |
| 4-Person Households | 19 (8.9%) | 0 (0.0%) |
| 5-Person Households | 5 (2.3%) | 0 (0.0%) |
| 6-Person Households | 12 (5.6%) | 0 (0.0%) |
| 7+ Person Households | 0 (0.0%) | 0 (0.0%) |
| Total | 127 (59.4%) | 87 (40.6%) |
Female Fertility in Queen City
Fertility by Age in Queen City
Average fertility rate in Queen City is 79.0 births per 1,000 women. Women in the age bracket of 20 to 34 years have the highest fertility rate with 167.0 births per 1,000 women. Women in the age bracket of 20 to 34 years acount for 72.7% of all women with births.
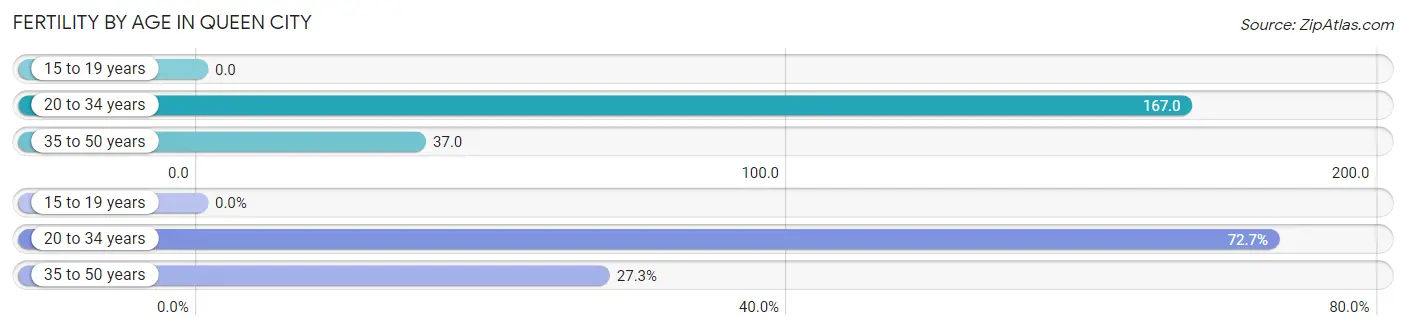
| Age Bracket | Women with Births | Births / 1,000 Women |
| 15 to 19 years | 0 (0.0%) | 0.0 |
| 20 to 34 years | 8 (72.7%) | 167.0 |
| 35 to 50 years | 3 (27.3%) | 37.0 |
| Total | 11 (100.0%) | 79.0 |
Fertility by Age by Marriage Status in Queen City
81.8% of women with births (11) in Queen City are married. The highest percentage of unmarried women with births falls into 20 to 34 years age bracket with 25.0% of them unmarried at the time of birth, while the lowest percentage of unmarried women with births belong to 35 to 50 years age bracket with 0.0% of them unmarried.
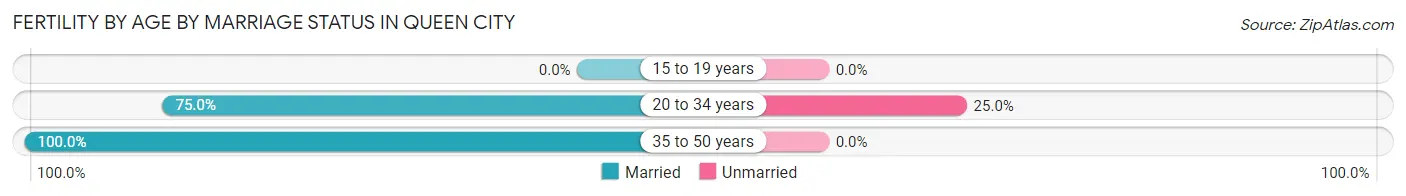
| Age Bracket | Married | Unmarried |
| 15 to 19 years | 0 (0.0%) | 0 (0.0%) |
| 20 to 34 years | 6 (75.0%) | 2 (25.0%) |
| 35 to 50 years | 3 (100.0%) | 0 (0.0%) |
| Total | 9 (81.8%) | 2 (18.2%) |
Fertility by Education in Queen City
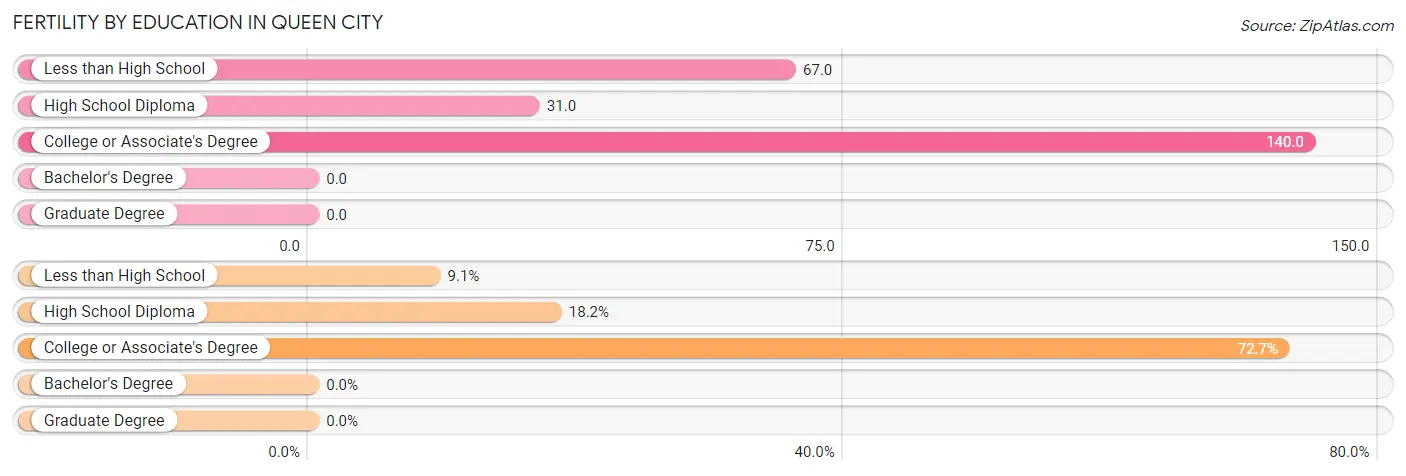
| Educational Attainment | Women with Births | Births / 1,000 Women |
| Less than High School | 1 (9.1%) | 67.0 |
| High School Diploma | 2 (18.2%) | 31.0 |
| College or Associate's Degree | 8 (72.7%) | 140.0 |
| Bachelor's Degree | 0 (0.0%) | 0.0 |
| Graduate Degree | 0 (0.0%) | 0.0 |
| Total | 11 (100.0%) | 79.0 |
Fertility by Education by Marriage Status in Queen City
18.2% of women with births in Queen City are unmarried. Women with the educational attainment of less than high school are most likely to be married with 100.0% of them married at childbirth, while women with the educational attainment of college or associate's degree are least likely to be married with 25.0% of them unmarried at childbirth.
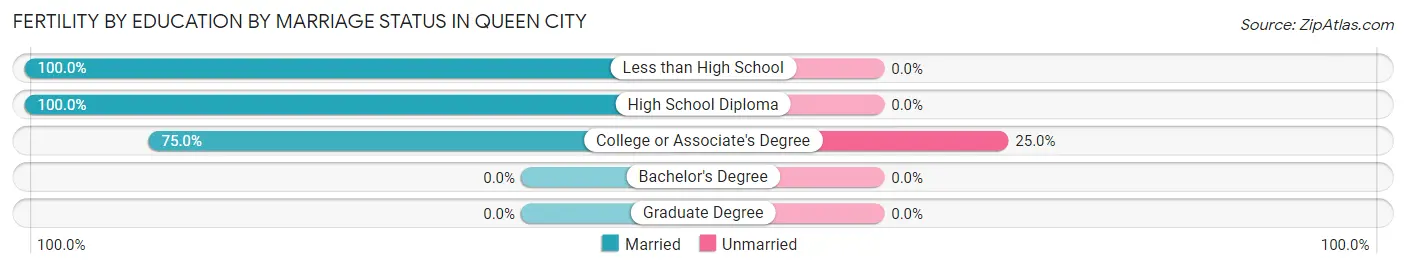
| Educational Attainment | Married | Unmarried |
| Less than High School | 1 (100.0%) | 0 (0.0%) |
| High School Diploma | 2 (100.0%) | 0 (0.0%) |
| College or Associate's Degree | 6 (75.0%) | 2 (25.0%) |
| Bachelor's Degree | 0 (0.0%) | 0 (0.0%) |
| Graduate Degree | 0 (0.0%) | 0 (0.0%) |
| Total | 9 (81.8%) | 2 (18.2%) |
Employment Characteristics in Queen City
Employment by Class of Employer in Queen City
Among the 208 employed individuals in Queen City, private company employees (67 | 32.2%), not-for-profit organizations (52 | 25.0%), and local government employees (34 | 16.4%) make up the most common classes of employment.
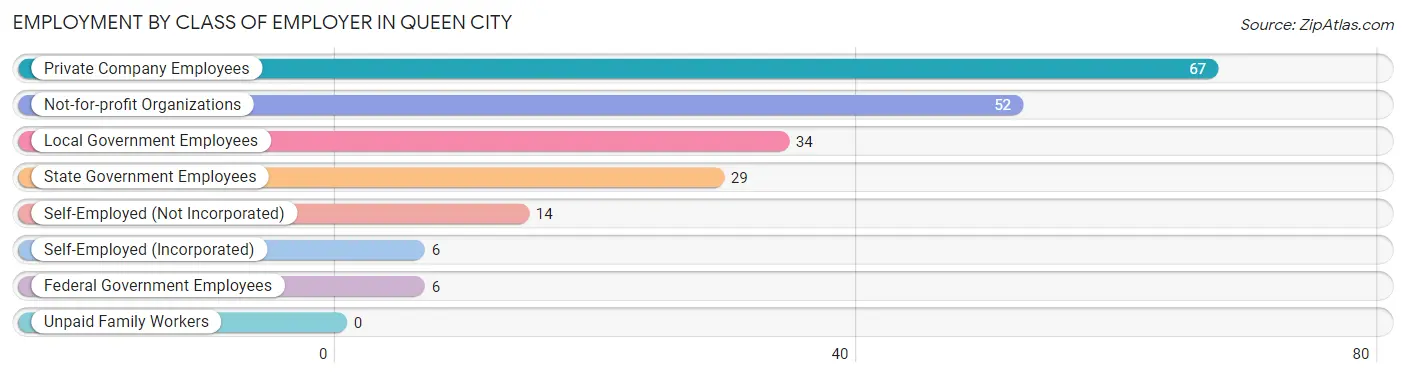
| Employer Class | # Employees | % Employees |
| Private Company Employees | 67 | 32.2% |
| Self-Employed (Incorporated) | 6 | 2.9% |
| Self-Employed (Not Incorporated) | 14 | 6.7% |
| Not-for-profit Organizations | 52 | 25.0% |
| Local Government Employees | 34 | 16.4% |
| State Government Employees | 29 | 13.9% |
| Federal Government Employees | 6 | 2.9% |
| Unpaid Family Workers | 0 | 0.0% |
| Total | 208 | 100.0% |
Employment Status by Age in Queen City
According to the labor force statistics for Queen City, out of the total population over 16 years of age (519), 41.2% or 214 individuals are in the labor force, with 2.8% or 6 of them unemployed. The age group with the highest labor force participation rate is 30 to 34 years, with 100.0% or 8 individuals in the labor force. Within the labor force, the 20 to 24 years age range has the highest percentage of unemployed individuals, with 28.6% or 4 of them being unemployed.
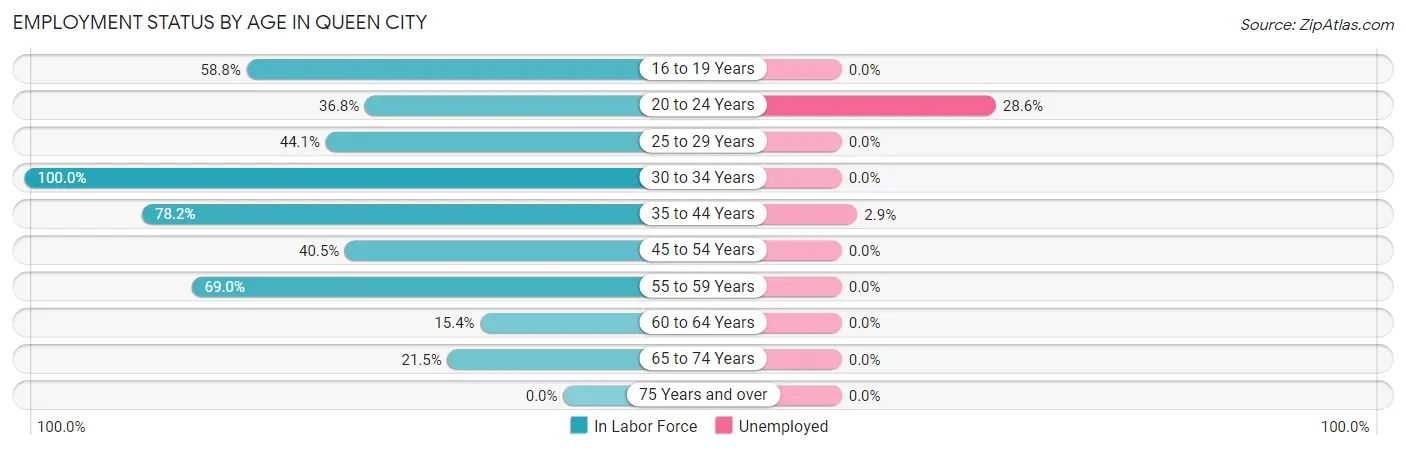
| Age Bracket | In Labor Force | Unemployed |
| 16 to 19 Years | 10 (58.8%) | 0 (0.0%) |
| 20 to 24 Years | 14 (36.8%) | 4 (28.6%) |
| 25 to 29 Years | 26 (44.1%) | 0 (0.0%) |
| 30 to 34 Years | 8 (100.0%) | 0 (0.0%) |
| 35 to 44 Years | 68 (78.2%) | 2 (2.9%) |
| 45 to 54 Years | 49 (40.5%) | 0 (0.0%) |
| 55 to 59 Years | 20 (69.0%) | 0 (0.0%) |
| 60 to 64 Years | 2 (15.4%) | 0 (0.0%) |
| 65 to 74 Years | 17 (21.5%) | 0 (0.0%) |
| 75 Years and over | 0 (0.0%) | 0 (0.0%) |
| Total | 214 (41.2%) | 6 (2.8%) |
Employment Status by Educational Attainment in Queen City
According to labor force statistics for Queen City, 54.6% of individuals (173) out of the total population between 25 and 64 years of age (317) are in the labor force, with 1.2% or 2 of them being unemployed. The group with the highest labor force participation rate are those with the educational attainment of bachelor's degree or higher, with 100.0% or 4 individuals in the labor force. Within the labor force, individuals with less than high school education have the highest percentage of unemployment, with 40.0% or 2 of them being unemployed.
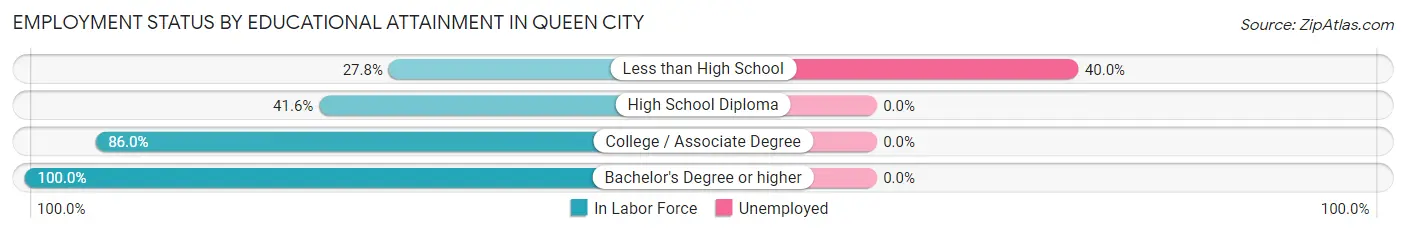
| Educational Attainment | In Labor Force | Unemployed |
| Less than High School | 5 (27.8%) | 7 (40.0%) |
| High School Diploma | 84 (41.6%) | 0 (0.0%) |
| College / Associate Degree | 80 (86.0%) | 0 (0.0%) |
| Bachelor's Degree or higher | 4 (100.0%) | 0 (0.0%) |
| Total | 173 (54.6%) | 4 (1.2%) |
Employment Occupations by Sex in Queen City
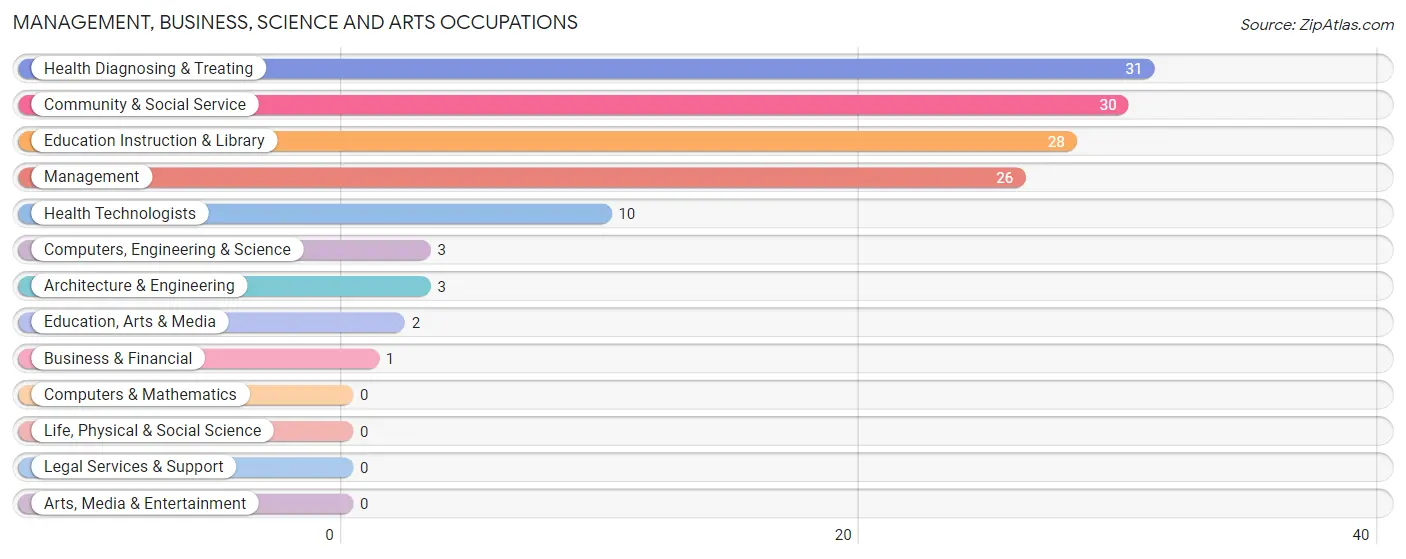
Management, Business, Science and Arts Occupations
The most common Management, Business, Science and Arts occupations in Queen City are Health Diagnosing & Treating (31 | 14.9%), Community & Social Service (30 | 14.4%), Education Instruction & Library (28 | 13.5%), Management (26 | 12.5%), and Health Technologists (10 | 4.8%).
Management, Business, Science and Arts Occupations by Sex
Within the Management, Business, Science and Arts occupations in Queen City, the most male-oriented occupations are Computers, Engineering & Science (100.0%), Architecture & Engineering (100.0%), and Education, Arts & Media (100.0%), while the most female-oriented occupations are Business & Financial (100.0%), Education Instruction & Library (100.0%), and Health Technologists (100.0%).

| Occupation | Male | Female |
| Management | 8 (30.8%) | 18 (69.2%) |
| Business & Financial | 0 (0.0%) | 1 (100.0%) |
| Computers, Engineering & Science | 3 (100.0%) | 0 (0.0%) |
| Computers & Mathematics | 0 (0.0%) | 0 (0.0%) |
| Architecture & Engineering | 3 (100.0%) | 0 (0.0%) |
| Life, Physical & Social Science | 0 (0.0%) | 0 (0.0%) |
| Community & Social Service | 2 (6.7%) | 28 (93.3%) |
| Education, Arts & Media | 2 (100.0%) | 0 (0.0%) |
| Legal Services & Support | 0 (0.0%) | 0 (0.0%) |
| Education Instruction & Library | 0 (0.0%) | 28 (100.0%) |
| Arts, Media & Entertainment | 0 (0.0%) | 0 (0.0%) |
| Health Diagnosing & Treating | 1 (3.2%) | 30 (96.8%) |
| Health Technologists | 0 (0.0%) | 10 (100.0%) |
| Total (Category) | 14 (15.4%) | 77 (84.6%) |
| Total (Overall) | 85 (40.9%) | 123 (59.1%) |
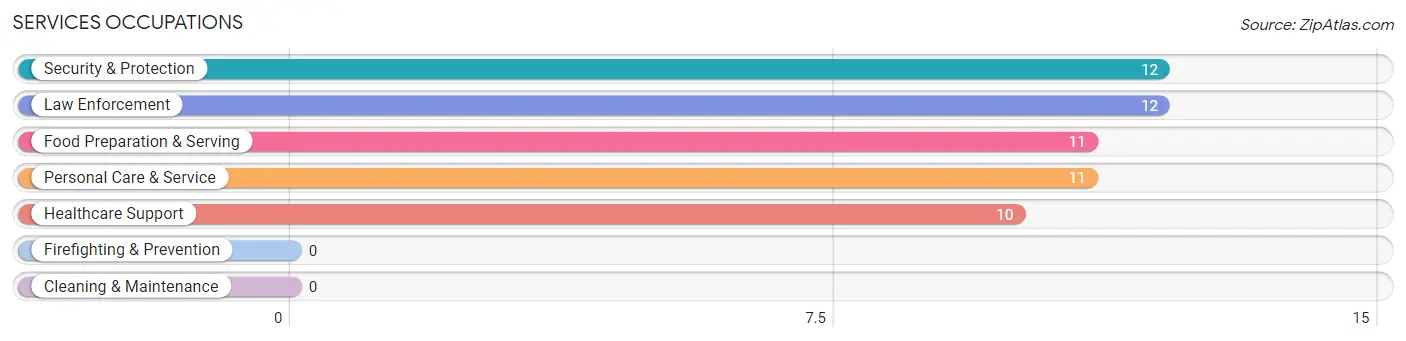
Services Occupations
The most common Services occupations in Queen City are Security & Protection (12 | 5.8%), Law Enforcement (12 | 5.8%), Food Preparation & Serving (11 | 5.3%), Personal Care & Service (11 | 5.3%), and Healthcare Support (10 | 4.8%).
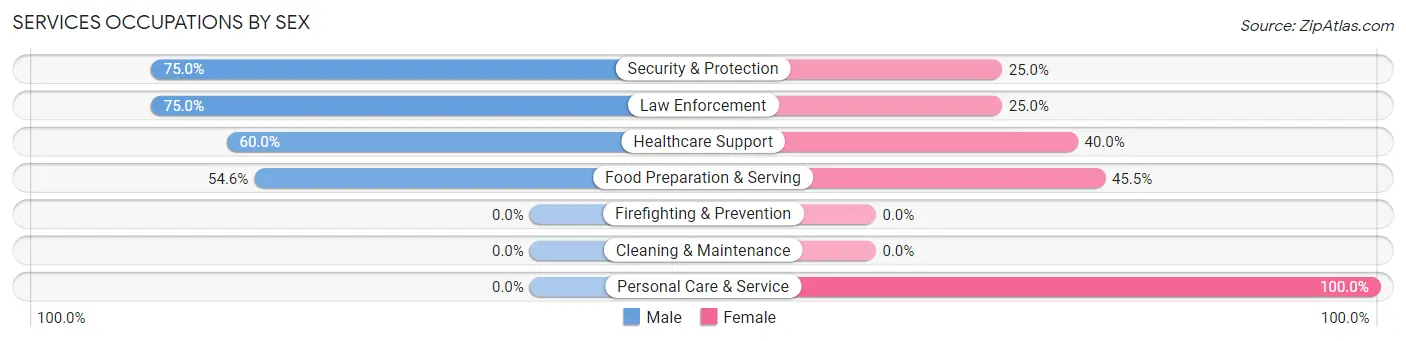
Services Occupations by Sex
Within the Services occupations in Queen City, the most male-oriented occupations are Security & Protection (75.0%), Law Enforcement (75.0%), and Healthcare Support (60.0%), while the most female-oriented occupations are Personal Care & Service (100.0%), Food Preparation & Serving (45.5%), and Healthcare Support (40.0%).
| Occupation | Male | Female |
| Healthcare Support | 6 (60.0%) | 4 (40.0%) |
| Security & Protection | 9 (75.0%) | 3 (25.0%) |
| Firefighting & Prevention | 0 (0.0%) | 0 (0.0%) |
| Law Enforcement | 9 (75.0%) | 3 (25.0%) |
| Food Preparation & Serving | 6 (54.5%) | 5 (45.5%) |
| Cleaning & Maintenance | 0 (0.0%) | 0 (0.0%) |
| Personal Care & Service | 0 (0.0%) | 11 (100.0%) |
| Total (Category) | 21 (47.7%) | 23 (52.3%) |
| Total (Overall) | 85 (40.9%) | 123 (59.1%) |
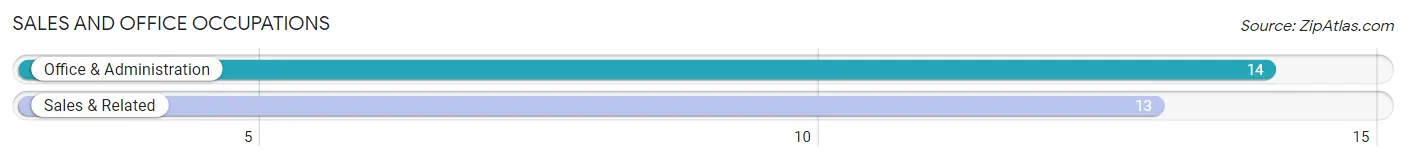
Sales and Office Occupations
The most common Sales and Office occupations in Queen City are Office & Administration (14 | 6.7%), and Sales & Related (13 | 6.2%).
Sales and Office Occupations by Sex
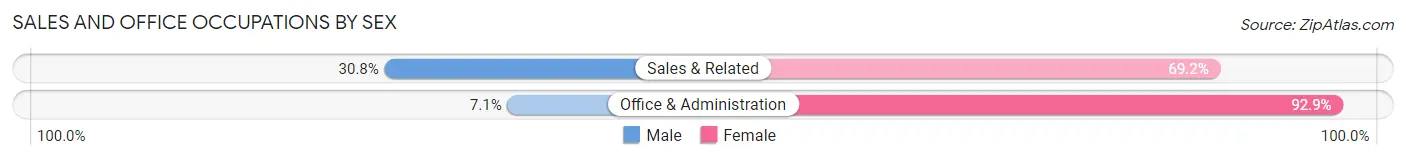
| Occupation | Male | Female |
| Sales & Related | 4 (30.8%) | 9 (69.2%) |
| Office & Administration | 1 (7.1%) | 13 (92.9%) |
| Total (Category) | 5 (18.5%) | 22 (81.5%) |
| Total (Overall) | 85 (40.9%) | 123 (59.1%) |
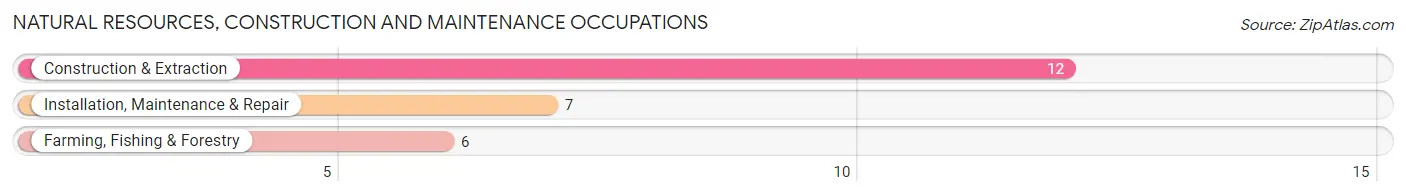
Natural Resources, Construction and Maintenance Occupations
The most common Natural Resources, Construction and Maintenance occupations in Queen City are Construction & Extraction (12 | 5.8%), Installation, Maintenance & Repair (7 | 3.4%), and Farming, Fishing & Forestry (6 | 2.9%).
Natural Resources, Construction and Maintenance Occupations by Sex
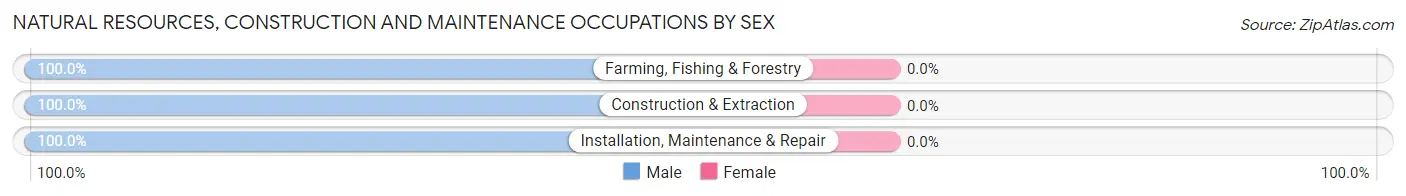
| Occupation | Male | Female |
| Farming, Fishing & Forestry | 6 (100.0%) | 0 (0.0%) |
| Construction & Extraction | 12 (100.0%) | 0 (0.0%) |
| Installation, Maintenance & Repair | 7 (100.0%) | 0 (0.0%) |
| Total (Category) | 25 (100.0%) | 0 (0.0%) |
| Total (Overall) | 85 (40.9%) | 123 (59.1%) |
Production, Transportation and Moving Occupations
The most common Production, Transportation and Moving occupations in Queen City are Transportation (11 | 5.3%), Production (8 | 3.8%), and Material Moving (2 | 1.0%).
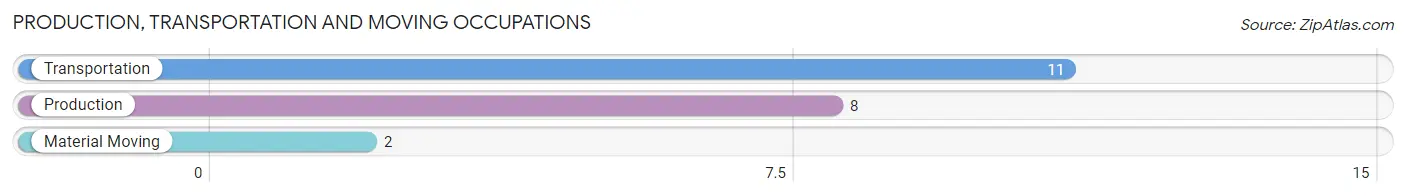
Production, Transportation and Moving Occupations by Sex
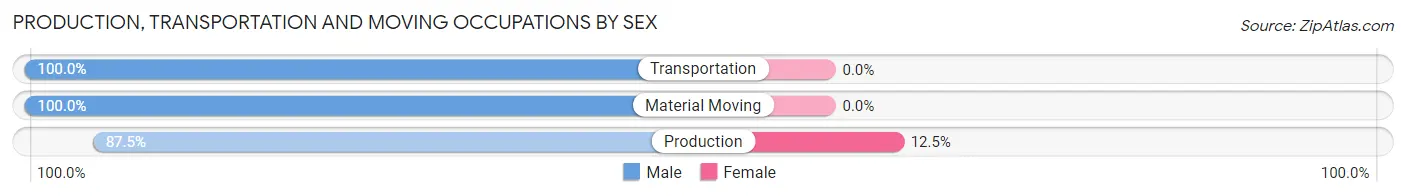
| Occupation | Male | Female |
| Production | 7 (87.5%) | 1 (12.5%) |
| Transportation | 11 (100.0%) | 0 (0.0%) |
| Material Moving | 2 (100.0%) | 0 (0.0%) |
| Total (Category) | 20 (95.2%) | 1 (4.8%) |
| Total (Overall) | 85 (40.9%) | 123 (59.1%) |
Employment Industries by Sex in Queen City
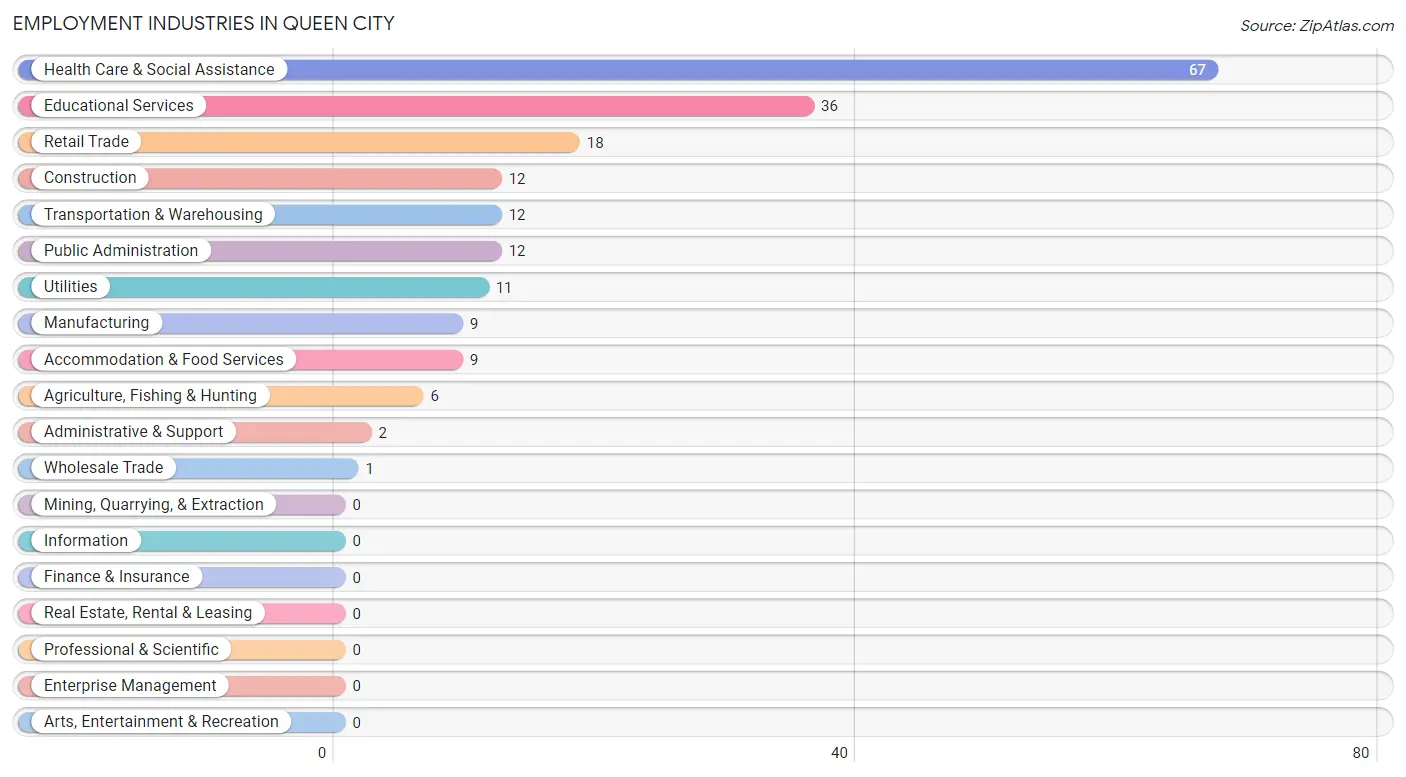
Employment Industries in Queen City
The major employment industries in Queen City include Health Care & Social Assistance (67 | 32.2%), Educational Services (36 | 17.3%), Retail Trade (18 | 8.6%), Construction (12 | 5.8%), and Transportation & Warehousing (12 | 5.8%).
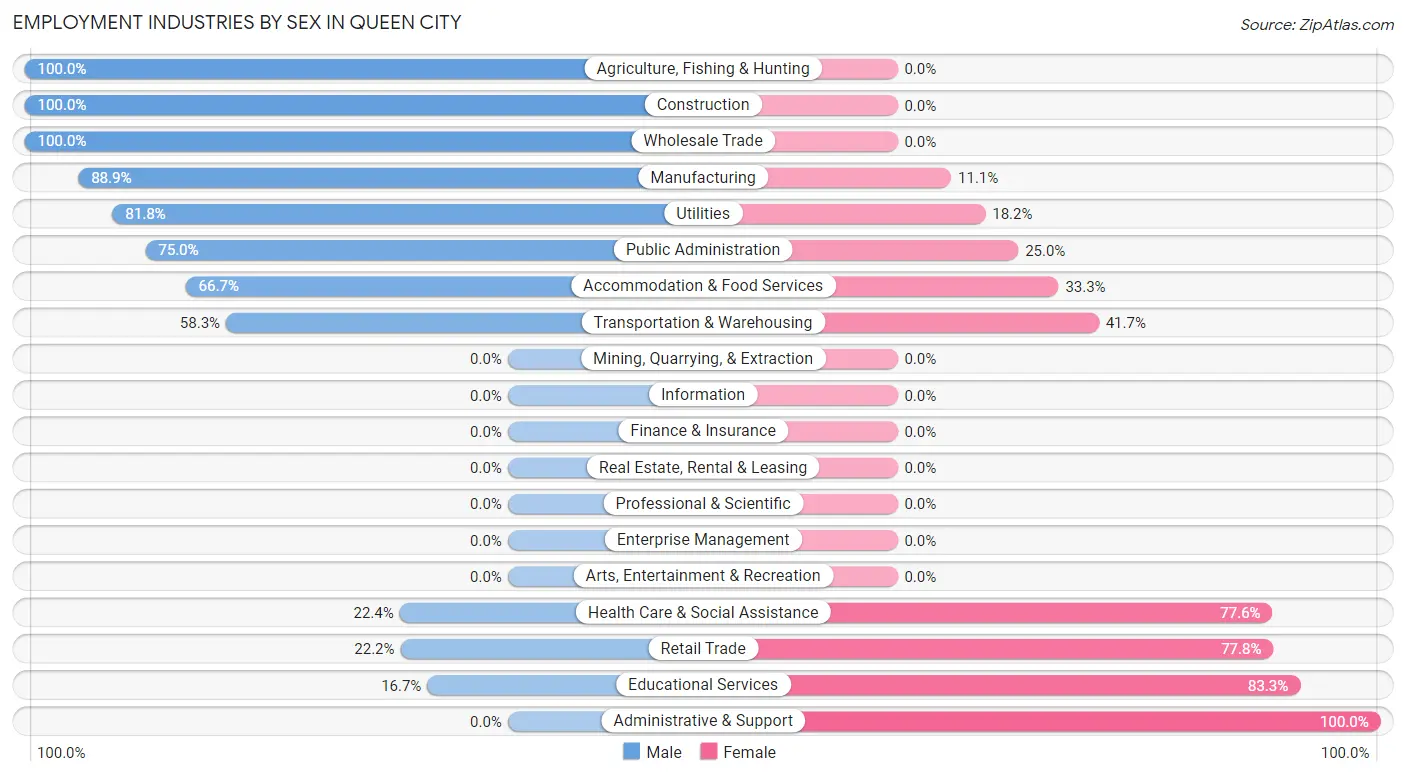
Employment Industries by Sex in Queen City
The Queen City industries that see more men than women are Agriculture, Fishing & Hunting (100.0%), Construction (100.0%), and Wholesale Trade (100.0%), whereas the industries that tend to have a higher number of women are Administrative & Support (100.0%), Educational Services (83.3%), and Retail Trade (77.8%).
| Industry | Male | Female |
| Agriculture, Fishing & Hunting | 6 (100.0%) | 0 (0.0%) |
| Mining, Quarrying, & Extraction | 0 (0.0%) | 0 (0.0%) |
| Construction | 12 (100.0%) | 0 (0.0%) |
| Manufacturing | 8 (88.9%) | 1 (11.1%) |
| Wholesale Trade | 1 (100.0%) | 0 (0.0%) |
| Retail Trade | 4 (22.2%) | 14 (77.8%) |
| Transportation & Warehousing | 7 (58.3%) | 5 (41.7%) |
| Utilities | 9 (81.8%) | 2 (18.2%) |
| Information | 0 (0.0%) | 0 (0.0%) |
| Finance & Insurance | 0 (0.0%) | 0 (0.0%) |
| Real Estate, Rental & Leasing | 0 (0.0%) | 0 (0.0%) |
| Professional & Scientific | 0 (0.0%) | 0 (0.0%) |
| Enterprise Management | 0 (0.0%) | 0 (0.0%) |
| Administrative & Support | 0 (0.0%) | 2 (100.0%) |
| Educational Services | 6 (16.7%) | 30 (83.3%) |
| Health Care & Social Assistance | 15 (22.4%) | 52 (77.6%) |
| Arts, Entertainment & Recreation | 0 (0.0%) | 0 (0.0%) |
| Accommodation & Food Services | 6 (66.7%) | 3 (33.3%) |
| Public Administration | 9 (75.0%) | 3 (25.0%) |
| Total | 85 (40.9%) | 123 (59.1%) |
Education in Queen City
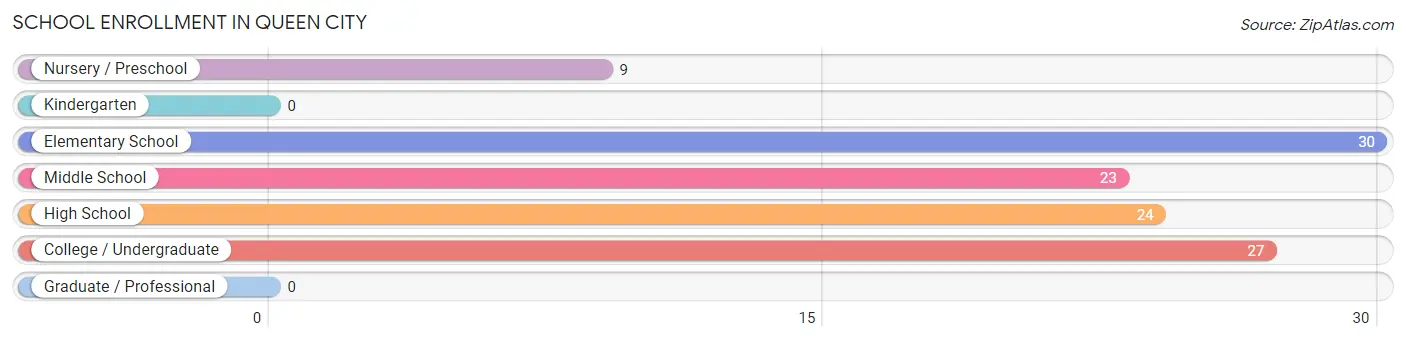
School Enrollment in Queen City
The most common levels of schooling among the 113 students in Queen City are elementary school (30 | 26.6%), college / undergraduate (27 | 23.9%), and high school (24 | 21.2%).
| School Level | # Students | % Students |
| Nursery / Preschool | 9 | 8.0% |
| Kindergarten | 0 | 0.0% |
| Elementary School | 30 | 26.6% |
| Middle School | 23 | 20.3% |
| High School | 24 | 21.2% |
| College / Undergraduate | 27 | 23.9% |
| Graduate / Professional | 0 | 0.0% |
| Total | 113 | 100.0% |
School Enrollment by Age by Funding Source in Queen City
Out of a total of 113 students who are enrolled in schools in Queen City, 1 (0.9%) attend a private institution, while the remaining 112 (99.1%) are enrolled in public schools. The age group of 15 to 17 year olds has the highest likelihood of being enrolled in private schools, with 1 (4.0% in the age bracket) enrolled. Conversely, the age group of 3 to 4 year olds has the lowest likelihood of being enrolled in a private school, with 3 (100.0% in the age bracket) attending a public institution.
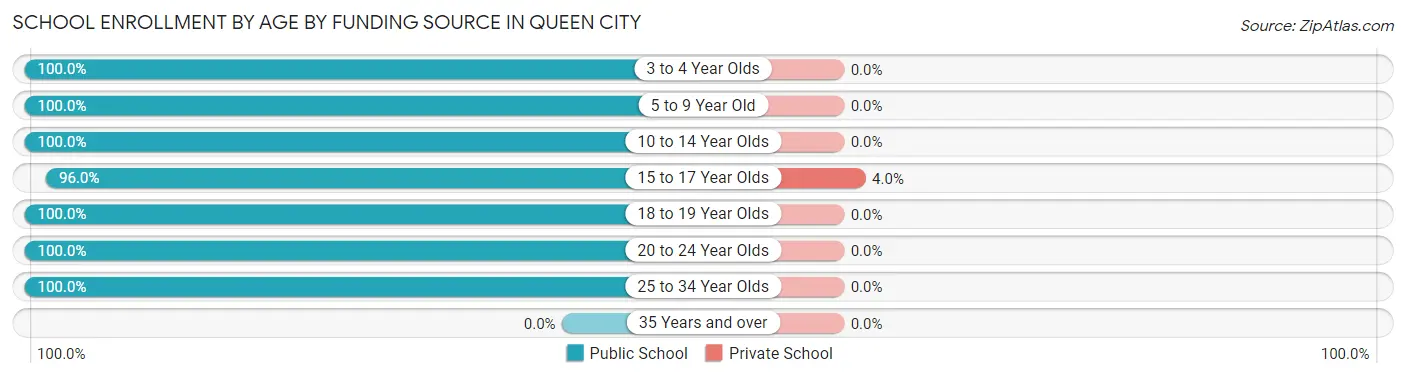
| Age Bracket | Public School | Private School |
| 3 to 4 Year Olds | 3 (100.0%) | 0 (0.0%) |
| 5 to 9 Year Old | 30 (100.0%) | 0 (0.0%) |
| 10 to 14 Year Olds | 29 (100.0%) | 0 (0.0%) |
| 15 to 17 Year Olds | 24 (96.0%) | 1 (4.0%) |
| 18 to 19 Year Olds | 1 (100.0%) | 0 (0.0%) |
| 20 to 24 Year Olds | 19 (100.0%) | 0 (0.0%) |
| 25 to 34 Year Olds | 6 (100.0%) | 0 (0.0%) |
| 35 Years and over | 0 (0.0%) | 0 (0.0%) |
| Total | 112 (99.1%) | 1 (0.9%) |
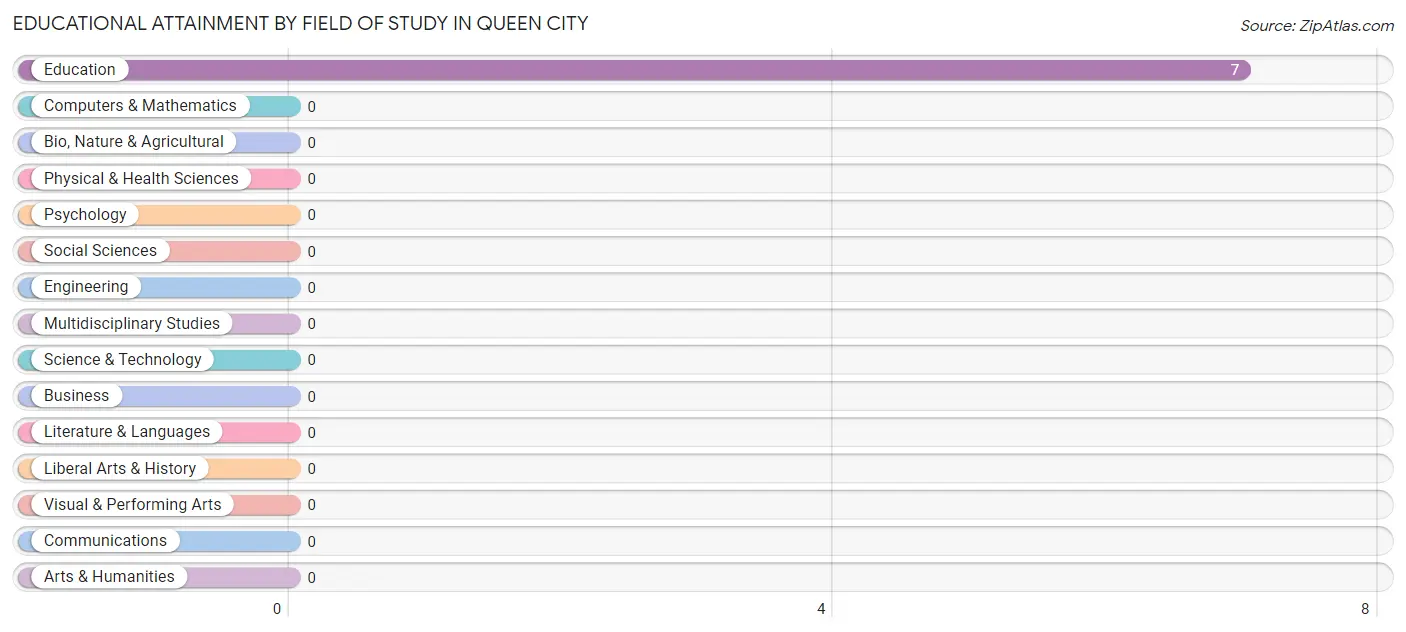
Educational Attainment by Field of Study in Queen City
, and education (7 | 100.0%) are the most common fields of study among 7 individuals in Queen City who have obtained a bachelor's degree or higher.
| Field of Study | # Graduates | % Graduates |
| Computers & Mathematics | 0 | 0.0% |
| Bio, Nature & Agricultural | 0 | 0.0% |
| Physical & Health Sciences | 0 | 0.0% |
| Psychology | 0 | 0.0% |
| Social Sciences | 0 | 0.0% |
| Engineering | 0 | 0.0% |
| Multidisciplinary Studies | 0 | 0.0% |
| Science & Technology | 0 | 0.0% |
| Business | 0 | 0.0% |
| Education | 7 | 100.0% |
| Literature & Languages | 0 | 0.0% |
| Liberal Arts & History | 0 | 0.0% |
| Visual & Performing Arts | 0 | 0.0% |
| Communications | 0 | 0.0% |
| Arts & Humanities | 0 | 0.0% |
| Total | 7 | 100.0% |
Transportation & Commute in Queen City
Vehicle Availability by Sex in Queen City
The most prevalent vehicle ownership categories in Queen City are males with 2 vehicles (39, accounting for 45.9%) and females with 2 vehicles (71, making up 31.7%).
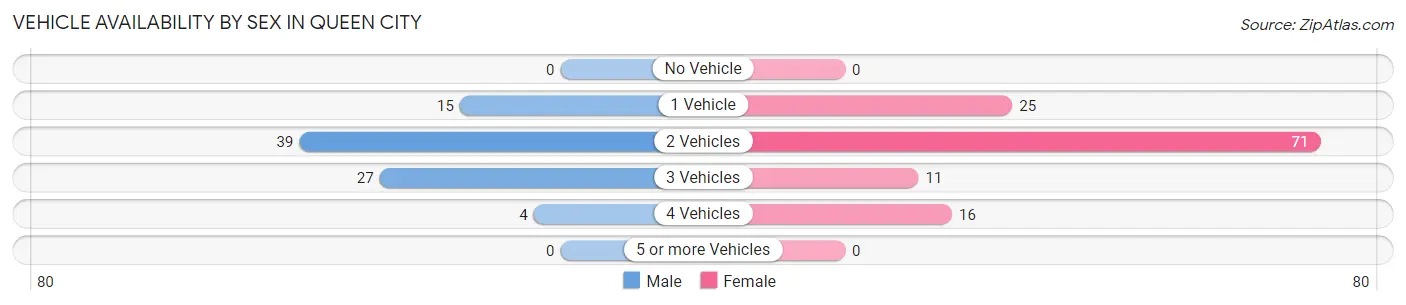
| Vehicles Available | Male | Female |
| No Vehicle | 0 (0.0%) | 0 (0.0%) |
| 1 Vehicle | 15 (17.6%) | 25 (20.3%) |
| 2 Vehicles | 39 (45.9%) | 71 (57.7%) |
| 3 Vehicles | 27 (31.8%) | 11 (8.9%) |
| 4 Vehicles | 4 (4.7%) | 16 (13.0%) |
| 5 or more Vehicles | 0 (0.0%) | 0 (0.0%) |
| Total | 85 (100.0%) | 123 (100.0%) |
Commute Time in Queen City
The most frequently occuring commute durations in Queen City are 30 to 34 minutes (49 commuters, 23.7%), 5 to 9 minutes (33 commuters, 15.9%), and 25 to 29 minutes (32 commuters, 15.5%).
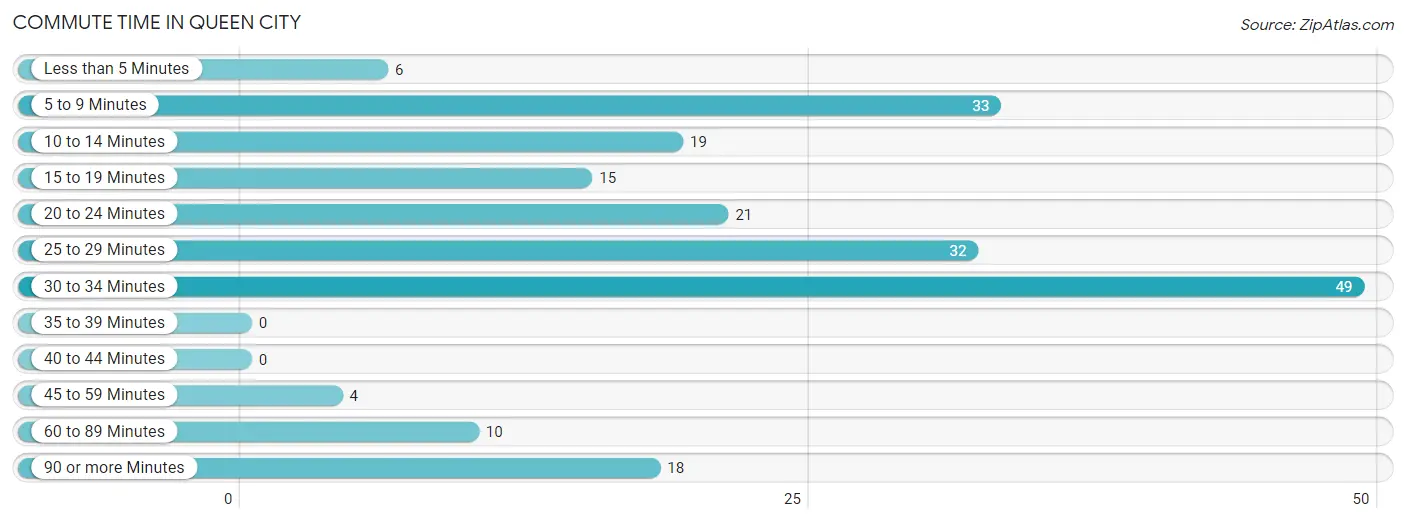
| Commute Time | # Commuters | % Commuters |
| Less than 5 Minutes | 6 | 2.9% |
| 5 to 9 Minutes | 33 | 15.9% |
| 10 to 14 Minutes | 19 | 9.2% |
| 15 to 19 Minutes | 15 | 7.2% |
| 20 to 24 Minutes | 21 | 10.1% |
| 25 to 29 Minutes | 32 | 15.5% |
| 30 to 34 Minutes | 49 | 23.7% |
| 35 to 39 Minutes | 0 | 0.0% |
| 40 to 44 Minutes | 0 | 0.0% |
| 45 to 59 Minutes | 4 | 1.9% |
| 60 to 89 Minutes | 10 | 4.8% |
| 90 or more Minutes | 18 | 8.7% |
Commute Time by Sex in Queen City
The most common commute times in Queen City are 30 to 34 minutes (18 commuters, 21.2%) for males and 30 to 34 minutes (31 commuters, 25.4%) for females.
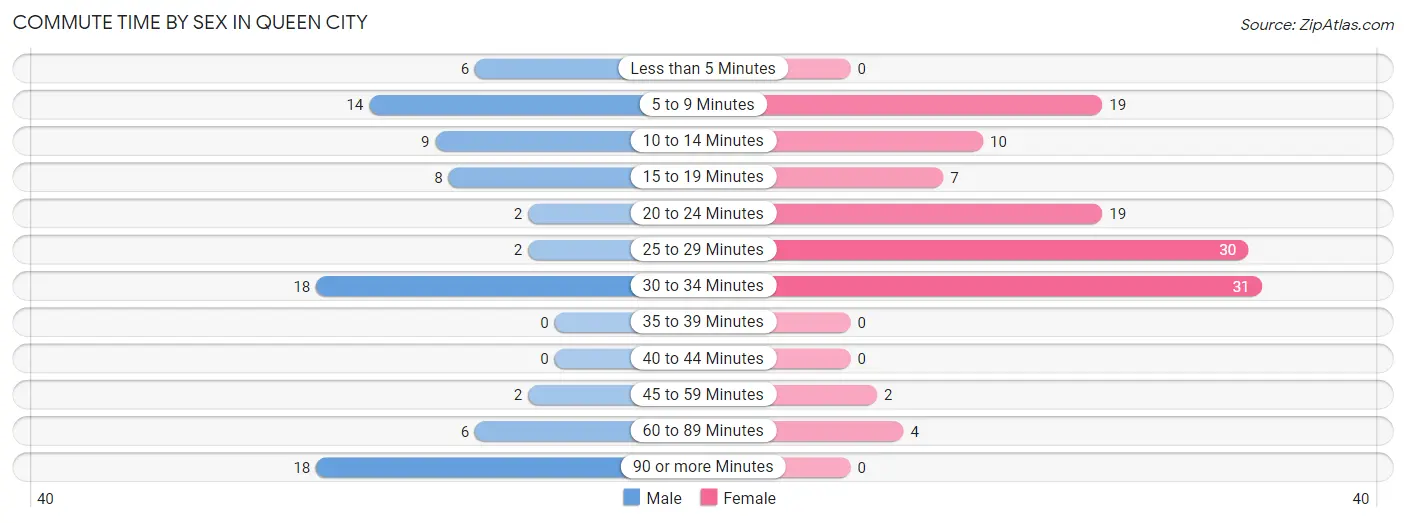
| Commute Time | Male | Female |
| Less than 5 Minutes | 6 (7.1%) | 0 (0.0%) |
| 5 to 9 Minutes | 14 (16.5%) | 19 (15.6%) |
| 10 to 14 Minutes | 9 (10.6%) | 10 (8.2%) |
| 15 to 19 Minutes | 8 (9.4%) | 7 (5.7%) |
| 20 to 24 Minutes | 2 (2.4%) | 19 (15.6%) |
| 25 to 29 Minutes | 2 (2.4%) | 30 (24.6%) |
| 30 to 34 Minutes | 18 (21.2%) | 31 (25.4%) |
| 35 to 39 Minutes | 0 (0.0%) | 0 (0.0%) |
| 40 to 44 Minutes | 0 (0.0%) | 0 (0.0%) |
| 45 to 59 Minutes | 2 (2.4%) | 2 (1.6%) |
| 60 to 89 Minutes | 6 (7.1%) | 4 (3.3%) |
| 90 or more Minutes | 18 (21.2%) | 0 (0.0%) |
Time of Departure to Work by Sex in Queen City
The most frequent times of departure to work in Queen City are 7:00 AM to 7:29 AM (22, 25.9%) for males and 6:00 AM to 6:29 AM (40, 32.8%) for females.
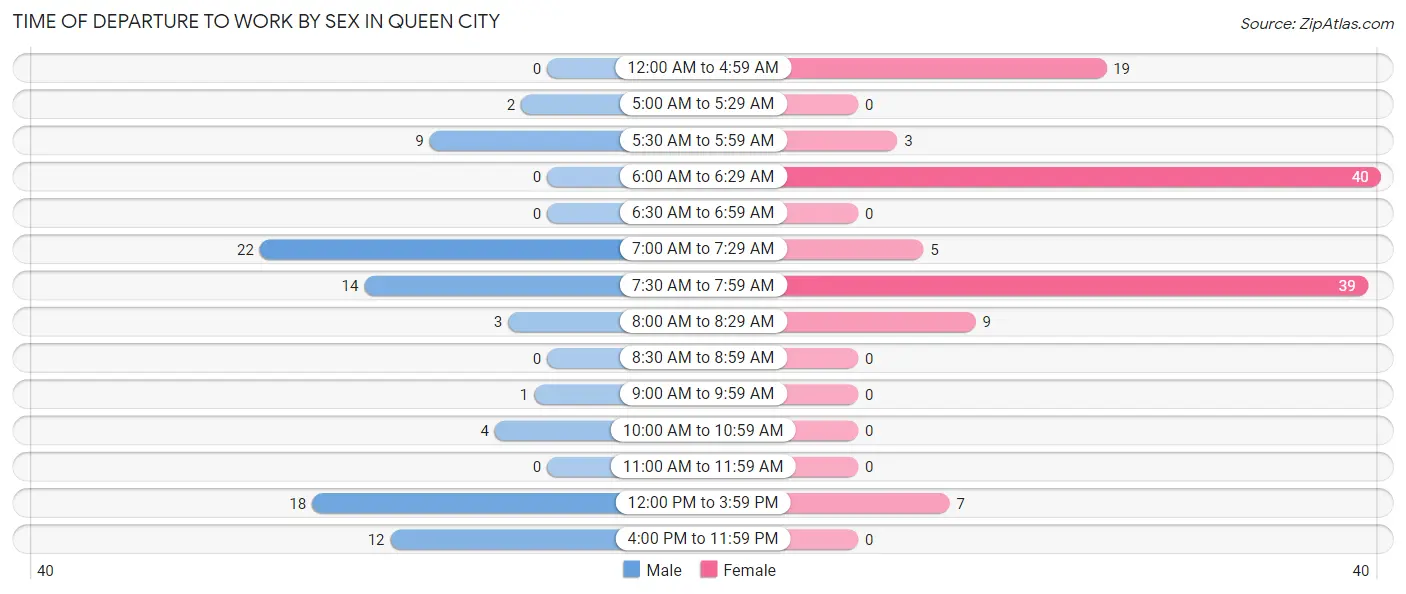
| Time of Departure | Male | Female |
| 12:00 AM to 4:59 AM | 0 (0.0%) | 19 (15.6%) |
| 5:00 AM to 5:29 AM | 2 (2.4%) | 0 (0.0%) |
| 5:30 AM to 5:59 AM | 9 (10.6%) | 3 (2.5%) |
| 6:00 AM to 6:29 AM | 0 (0.0%) | 40 (32.8%) |
| 6:30 AM to 6:59 AM | 0 (0.0%) | 0 (0.0%) |
| 7:00 AM to 7:29 AM | 22 (25.9%) | 5 (4.1%) |
| 7:30 AM to 7:59 AM | 14 (16.5%) | 39 (32.0%) |
| 8:00 AM to 8:29 AM | 3 (3.5%) | 9 (7.4%) |
| 8:30 AM to 8:59 AM | 0 (0.0%) | 0 (0.0%) |
| 9:00 AM to 9:59 AM | 1 (1.2%) | 0 (0.0%) |
| 10:00 AM to 10:59 AM | 4 (4.7%) | 0 (0.0%) |
| 11:00 AM to 11:59 AM | 0 (0.0%) | 0 (0.0%) |
| 12:00 PM to 3:59 PM | 18 (21.2%) | 7 (5.7%) |
| 4:00 PM to 11:59 PM | 12 (14.1%) | 0 (0.0%) |
| Total | 85 (100.0%) | 122 (100.0%) |
Housing Occupancy in Queen City
Occupancy by Ownership in Queen City
Of the total 214 dwellings in Queen City, owner-occupied units account for 113 (52.8%), while renter-occupied units make up 101 (47.2%).
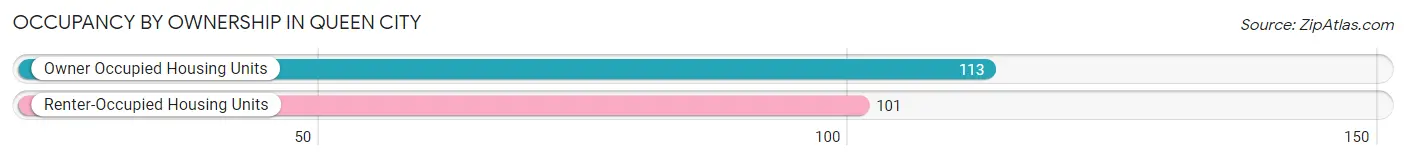
| Occupancy | # Housing Units | % Housing Units |
| Owner Occupied Housing Units | 113 | 52.8% |
| Renter-Occupied Housing Units | 101 | 47.2% |
| Total Occupied Housing Units | 214 | 100.0% |
Occupancy by Household Size in Queen City
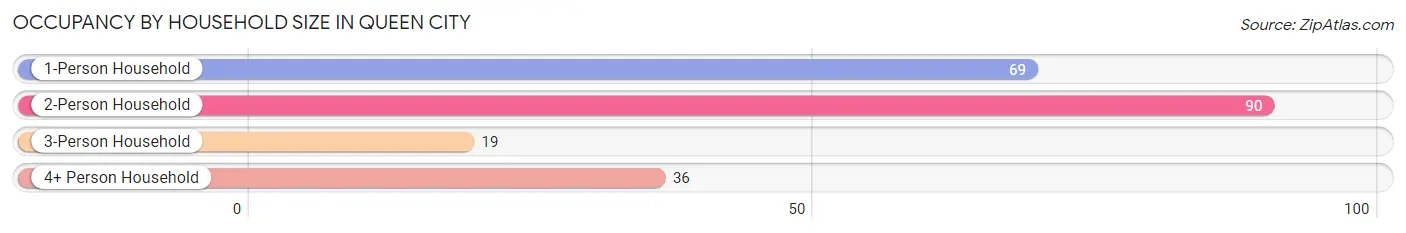
| Household Size | # Housing Units | % Housing Units |
| 1-Person Household | 69 | 32.2% |
| 2-Person Household | 90 | 42.1% |
| 3-Person Household | 19 | 8.9% |
| 4+ Person Household | 36 | 16.8% |
| Total Housing Units | 214 | 100.0% |
Occupancy by Ownership by Household Size in Queen City
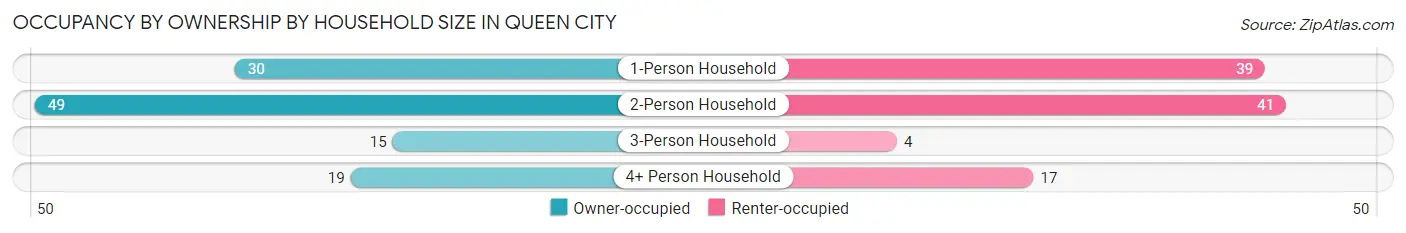
| Household Size | Owner-occupied | Renter-occupied |
| 1-Person Household | 30 (43.5%) | 39 (56.5%) |
| 2-Person Household | 49 (54.4%) | 41 (45.6%) |
| 3-Person Household | 15 (78.9%) | 4 (21.0%) |
| 4+ Person Household | 19 (52.8%) | 17 (47.2%) |
| Total Housing Units | 113 (52.8%) | 101 (47.2%) |
Occupancy by Educational Attainment in Queen City
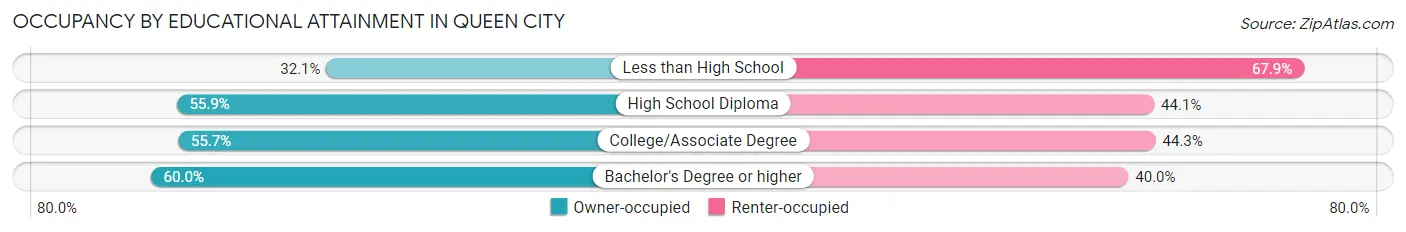
| Household Size | Owner-occupied | Renter-occupied |
| Less than High School | 9 (32.1%) | 19 (67.9%) |
| High School Diploma | 52 (55.9%) | 41 (44.1%) |
| College/Associate Degree | 49 (55.7%) | 39 (44.3%) |
| Bachelor's Degree or higher | 3 (60.0%) | 2 (40.0%) |
Occupancy by Age of Householder in Queen City
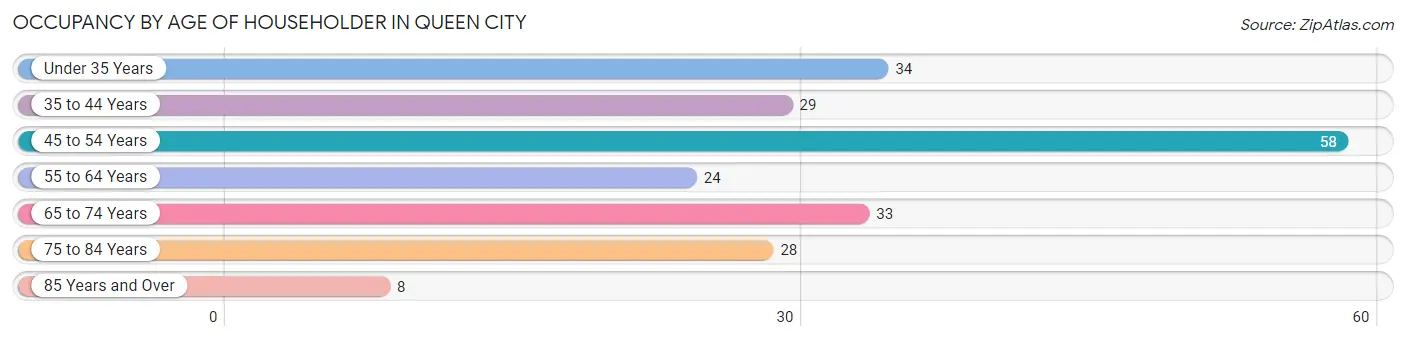
| Age Bracket | # Households | % Households |
| Under 35 Years | 34 | 15.9% |
| 35 to 44 Years | 29 | 13.6% |
| 45 to 54 Years | 58 | 27.1% |
| 55 to 64 Years | 24 | 11.2% |
| 65 to 74 Years | 33 | 15.4% |
| 75 to 84 Years | 28 | 13.1% |
| 85 Years and Over | 8 | 3.7% |
| Total | 214 | 100.0% |
Housing Finances in Queen City
Median Income by Occupancy in Queen City
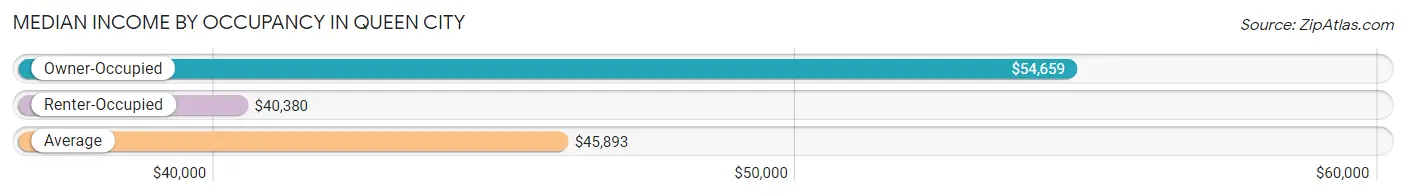
| Occupancy Type | # Households | Median Income |
| Owner-Occupied | 113 (52.8%) | $54,659 |
| Renter-Occupied | 101 (47.2%) | $40,380 |
| Average | 214 (100.0%) | $45,893 |
Occupancy by Householder Income Bracket in Queen City
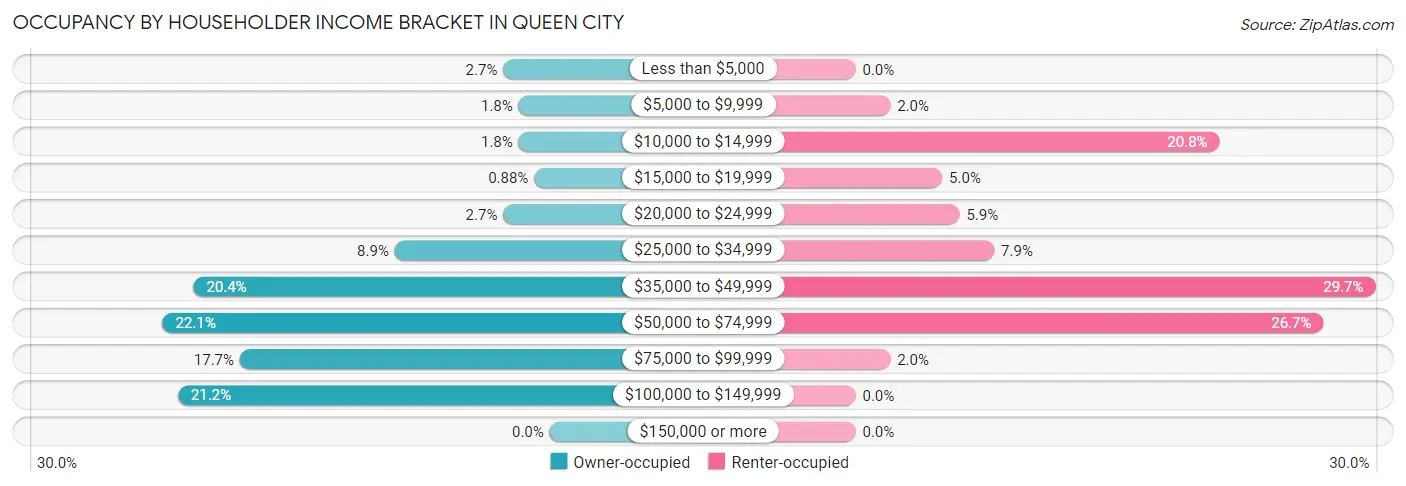
| Income Bracket | Owner-occupied | Renter-occupied |
| Less than $5,000 | 3 (2.6%) | 0 (0.0%) |
| $5,000 to $9,999 | 2 (1.8%) | 2 (2.0%) |
| $10,000 to $14,999 | 2 (1.8%) | 21 (20.8%) |
| $15,000 to $19,999 | 1 (0.9%) | 5 (5.0%) |
| $20,000 to $24,999 | 3 (2.6%) | 6 (5.9%) |
| $25,000 to $34,999 | 10 (8.8%) | 8 (7.9%) |
| $35,000 to $49,999 | 23 (20.3%) | 30 (29.7%) |
| $50,000 to $74,999 | 25 (22.1%) | 27 (26.7%) |
| $75,000 to $99,999 | 20 (17.7%) | 2 (2.0%) |
| $100,000 to $149,999 | 24 (21.2%) | 0 (0.0%) |
| $150,000 or more | 0 (0.0%) | 0 (0.0%) |
| Total | 113 (100.0%) | 101 (100.0%) |
Monthly Housing Cost Tiers in Queen City
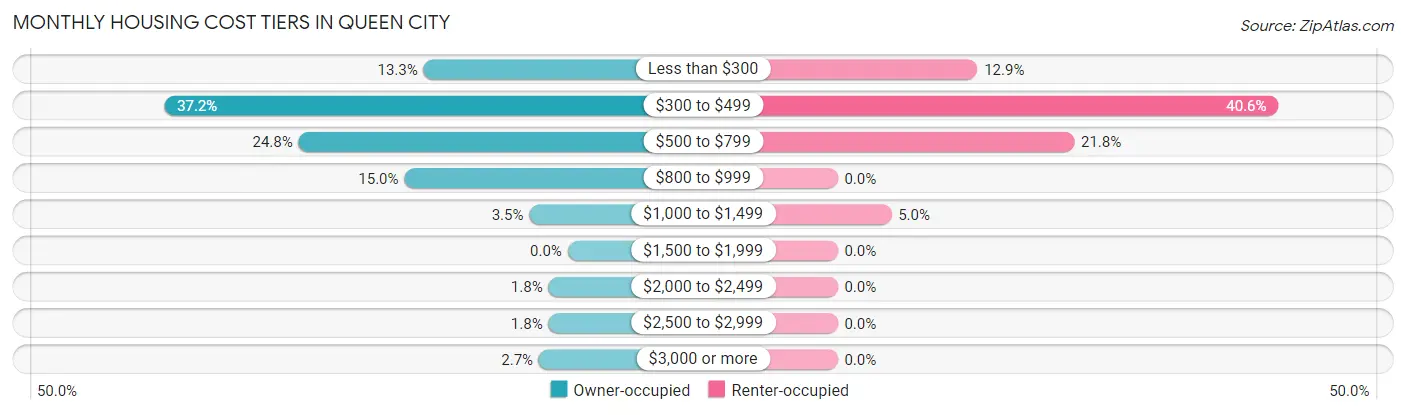
| Monthly Cost | Owner-occupied | Renter-occupied |
| Less than $300 | 15 (13.3%) | 13 (12.9%) |
| $300 to $499 | 42 (37.2%) | 41 (40.6%) |
| $500 to $799 | 28 (24.8%) | 22 (21.8%) |
| $800 to $999 | 17 (15.0%) | 0 (0.0%) |
| $1,000 to $1,499 | 4 (3.5%) | 5 (5.0%) |
| $1,500 to $1,999 | 0 (0.0%) | 0 (0.0%) |
| $2,000 to $2,499 | 2 (1.8%) | 0 (0.0%) |
| $2,500 to $2,999 | 2 (1.8%) | 0 (0.0%) |
| $3,000 or more | 3 (2.6%) | 0 (0.0%) |
| Total | 113 (100.0%) | 101 (100.0%) |
Physical Housing Characteristics in Queen City
Housing Structures in Queen City
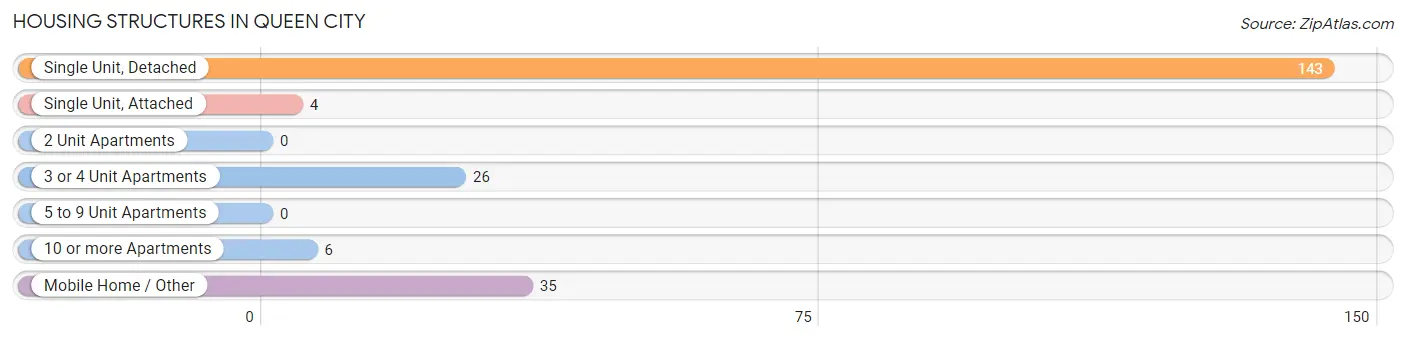
| Structure Type | # Housing Units | % Housing Units |
| Single Unit, Detached | 143 | 66.8% |
| Single Unit, Attached | 4 | 1.9% |
| 2 Unit Apartments | 0 | 0.0% |
| 3 or 4 Unit Apartments | 26 | 12.1% |
| 5 to 9 Unit Apartments | 0 | 0.0% |
| 10 or more Apartments | 6 | 2.8% |
| Mobile Home / Other | 35 | 16.4% |
| Total | 214 | 100.0% |
Housing Structures by Occupancy in Queen City
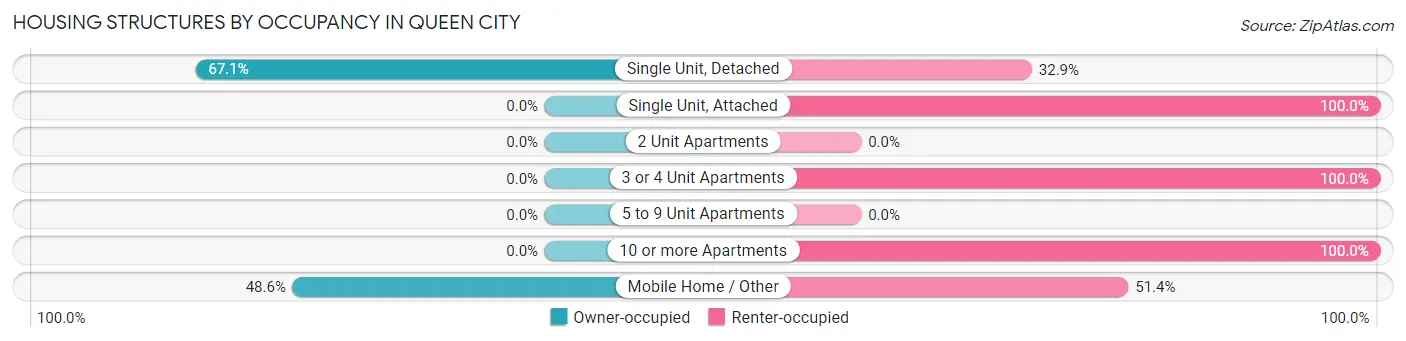
| Structure Type | Owner-occupied | Renter-occupied |
| Single Unit, Detached | 96 (67.1%) | 47 (32.9%) |
| Single Unit, Attached | 0 (0.0%) | 4 (100.0%) |
| 2 Unit Apartments | 0 (0.0%) | 0 (0.0%) |
| 3 or 4 Unit Apartments | 0 (0.0%) | 26 (100.0%) |
| 5 to 9 Unit Apartments | 0 (0.0%) | 0 (0.0%) |
| 10 or more Apartments | 0 (0.0%) | 6 (100.0%) |
| Mobile Home / Other | 17 (48.6%) | 18 (51.4%) |
| Total | 113 (52.8%) | 101 (47.2%) |
Housing Structures by Number of Rooms in Queen City
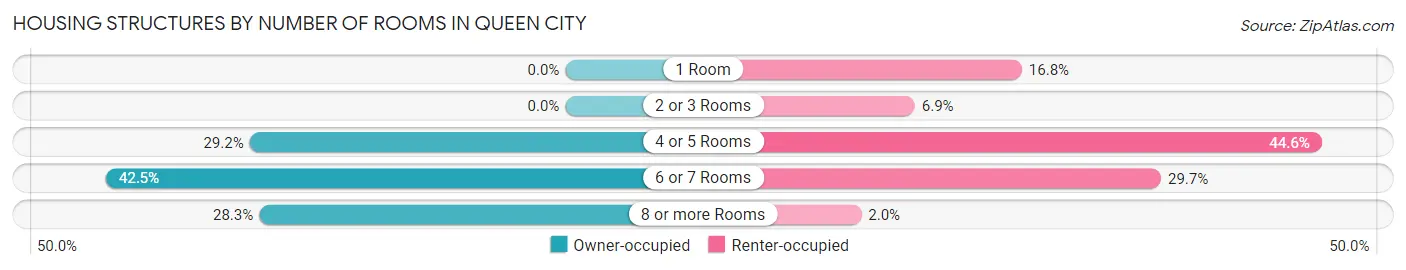
| Number of Rooms | Owner-occupied | Renter-occupied |
| 1 Room | 0 (0.0%) | 17 (16.8%) |
| 2 or 3 Rooms | 0 (0.0%) | 7 (6.9%) |
| 4 or 5 Rooms | 33 (29.2%) | 45 (44.6%) |
| 6 or 7 Rooms | 48 (42.5%) | 30 (29.7%) |
| 8 or more Rooms | 32 (28.3%) | 2 (2.0%) |
| Total | 113 (100.0%) | 101 (100.0%) |
Housing Structure by Heating Type in Queen City
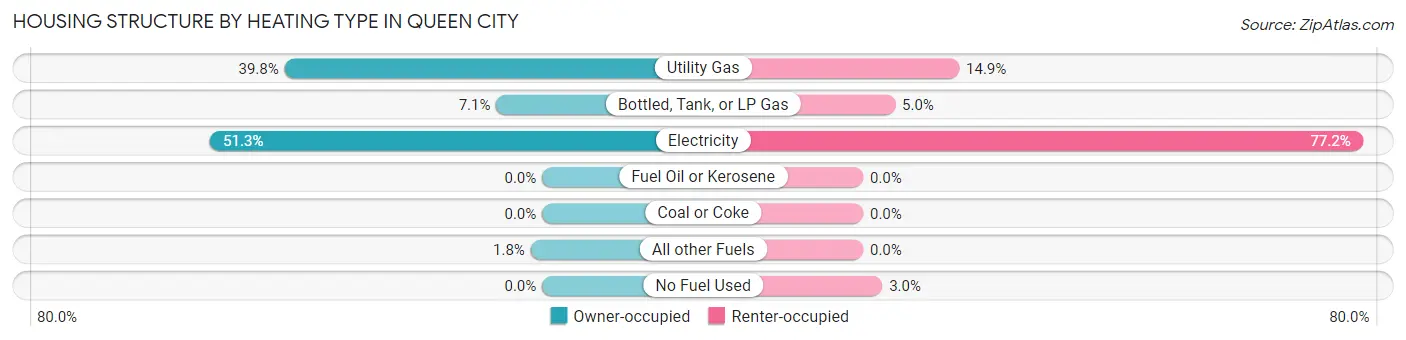
| Heating Type | Owner-occupied | Renter-occupied |
| Utility Gas | 45 (39.8%) | 15 (14.8%) |
| Bottled, Tank, or LP Gas | 8 (7.1%) | 5 (5.0%) |
| Electricity | 58 (51.3%) | 78 (77.2%) |
| Fuel Oil or Kerosene | 0 (0.0%) | 0 (0.0%) |
| Coal or Coke | 0 (0.0%) | 0 (0.0%) |
| All other Fuels | 2 (1.8%) | 0 (0.0%) |
| No Fuel Used | 0 (0.0%) | 3 (3.0%) |
| Total | 113 (100.0%) | 101 (100.0%) |
Household Vehicle Usage in Queen City
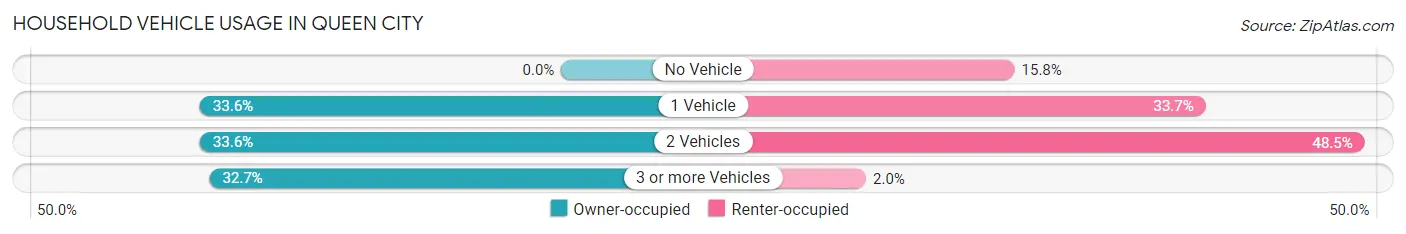
| Vehicles per Household | Owner-occupied | Renter-occupied |
| No Vehicle | 0 (0.0%) | 16 (15.8%) |
| 1 Vehicle | 38 (33.6%) | 34 (33.7%) |
| 2 Vehicles | 38 (33.6%) | 49 (48.5%) |
| 3 or more Vehicles | 37 (32.7%) | 2 (2.0%) |
| Total | 113 (100.0%) | 101 (100.0%) |
Real Estate & Mortgages in Queen City
Real Estate and Mortgage Overview in Queen City
| Characteristic | Without Mortgage | With Mortgage |
| Housing Units | 81 | 32 |
| Median Property Value | - | - |
| Median Household Income | $52,614 | $0 |
| Monthly Housing Costs | $440 | $0 |
| Real Estate Taxes | $479 | $0 |
Property Value by Mortgage Status in Queen City
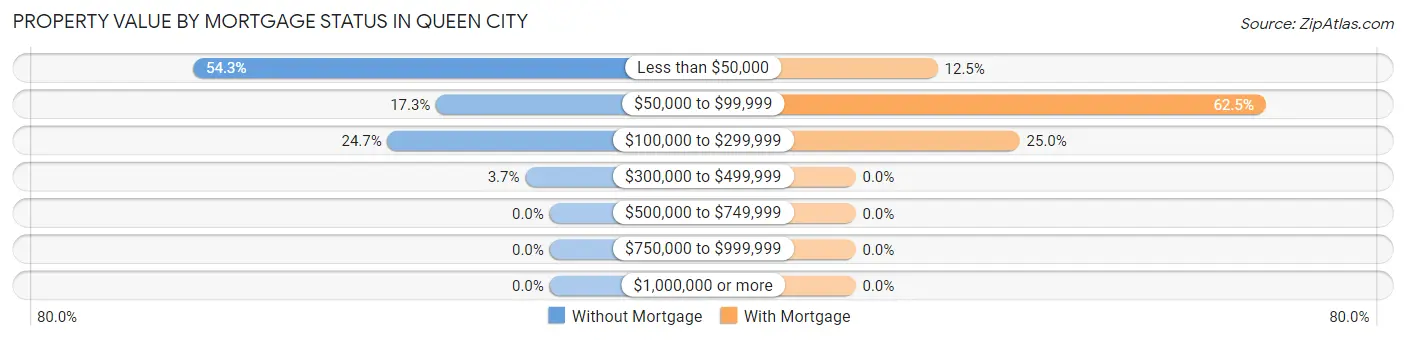
| Property Value | Without Mortgage | With Mortgage |
| Less than $50,000 | 44 (54.3%) | 4 (12.5%) |
| $50,000 to $99,999 | 14 (17.3%) | 20 (62.5%) |
| $100,000 to $299,999 | 20 (24.7%) | 8 (25.0%) |
| $300,000 to $499,999 | 3 (3.7%) | 0 (0.0%) |
| $500,000 to $749,999 | 0 (0.0%) | 0 (0.0%) |
| $750,000 to $999,999 | 0 (0.0%) | 0 (0.0%) |
| $1,000,000 or more | 0 (0.0%) | 0 (0.0%) |
| Total | 81 (100.0%) | 32 (100.0%) |
Household Income by Mortgage Status in Queen City
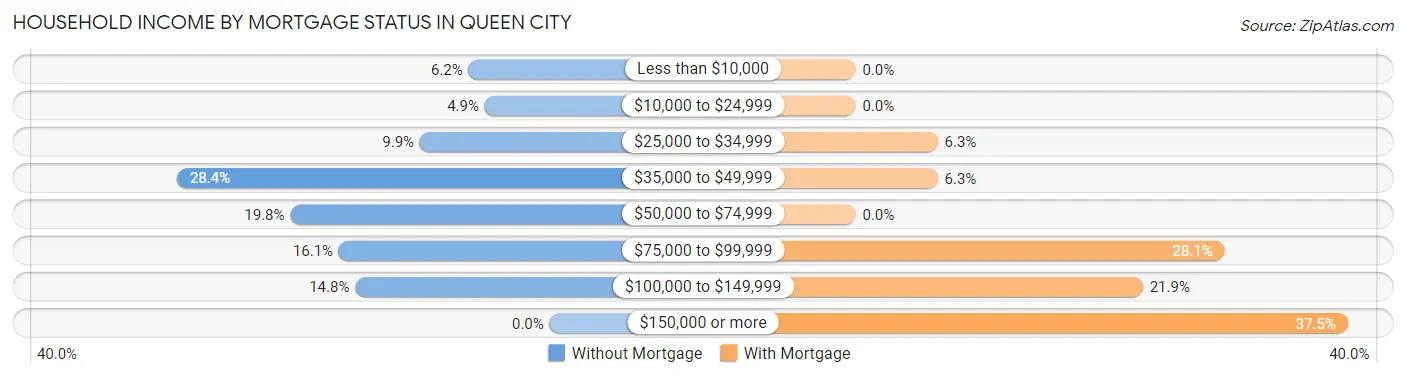
| Household Income | Without Mortgage | With Mortgage |
| Less than $10,000 | 5 (6.2%) | 0 (0.0%) |
| $10,000 to $24,999 | 4 (4.9%) | 0 (0.0%) |
| $25,000 to $34,999 | 8 (9.9%) | 2 (6.2%) |
| $35,000 to $49,999 | 23 (28.4%) | 2 (6.2%) |
| $50,000 to $74,999 | 16 (19.8%) | 0 (0.0%) |
| $75,000 to $99,999 | 13 (16.1%) | 9 (28.1%) |
| $100,000 to $149,999 | 12 (14.8%) | 7 (21.9%) |
| $150,000 or more | 0 (0.0%) | 12 (37.5%) |
| Total | 81 (100.0%) | 32 (100.0%) |
Property Value to Household Income Ratio in Queen City
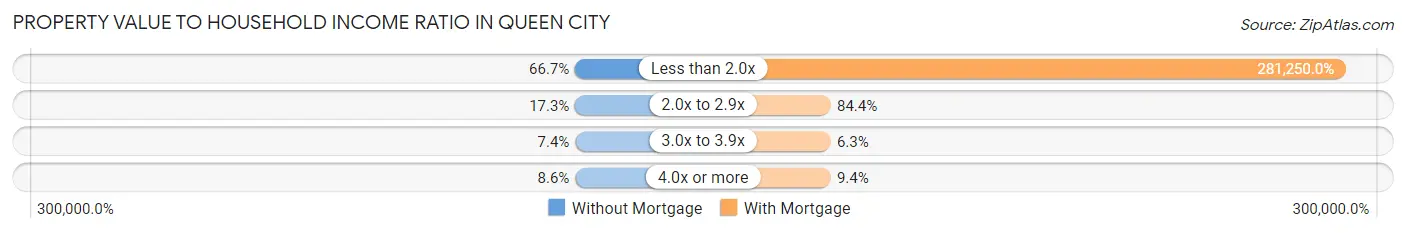
| Value-to-Income Ratio | Without Mortgage | With Mortgage |
| Less than 2.0x | 54 (66.7%) | 90,000 (281,250.0%) |
| 2.0x to 2.9x | 14 (17.3%) | 27 (84.4%) |
| 3.0x to 3.9x | 6 (7.4%) | 2 (6.2%) |
| 4.0x or more | 7 (8.6%) | 3 (9.4%) |
| Total | 81 (100.0%) | 32 (100.0%) |
Real Estate Taxes by Mortgage Status in Queen City
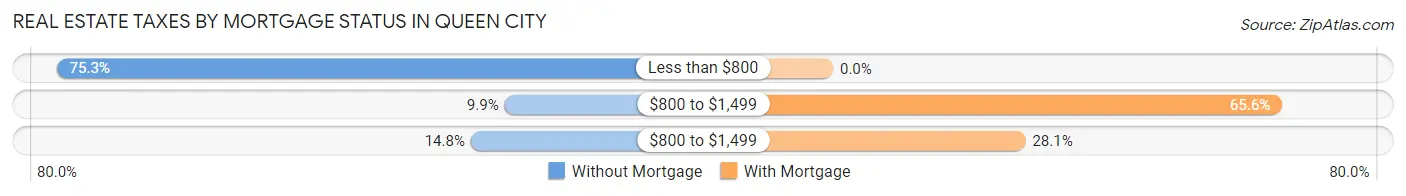
| Property Taxes | Without Mortgage | With Mortgage |
| Less than $800 | 61 (75.3%) | 0 (0.0%) |
| $800 to $1,499 | 8 (9.9%) | 21 (65.6%) |
| $800 to $1,499 | 12 (14.8%) | 9 (28.1%) |
| Total | 81 (100.0%) | 32 (100.0%) |
Health & Disability in Queen City
Health Insurance Coverage by Age in Queen City
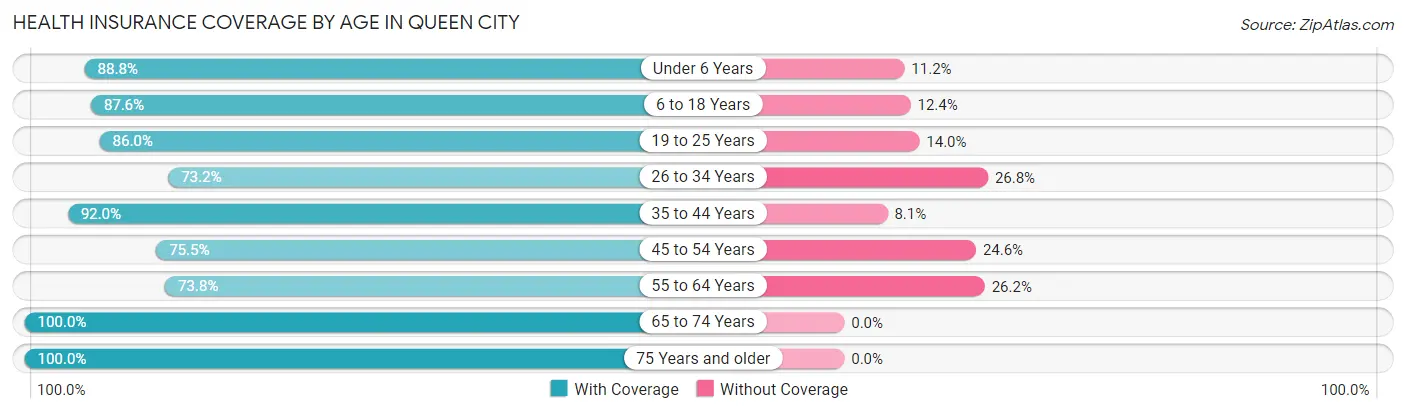
| Age Bracket | With Coverage | Without Coverage |
| Under 6 Years | 103 (88.8%) | 13 (11.2%) |
| 6 to 18 Years | 78 (87.6%) | 11 (12.4%) |
| 19 to 25 Years | 43 (86.0%) | 7 (14.0%) |
| 26 to 34 Years | 41 (73.2%) | 15 (26.8%) |
| 35 to 44 Years | 80 (91.9%) | 7 (8.1%) |
| 45 to 54 Years | 83 (75.4%) | 27 (24.5%) |
| 55 to 64 Years | 31 (73.8%) | 11 (26.2%) |
| 65 to 74 Years | 79 (100.0%) | 0 (0.0%) |
| 75 Years and older | 68 (100.0%) | 0 (0.0%) |
| Total | 606 (86.9%) | 91 (13.1%) |
Health Insurance Coverage by Citizenship Status in Queen City
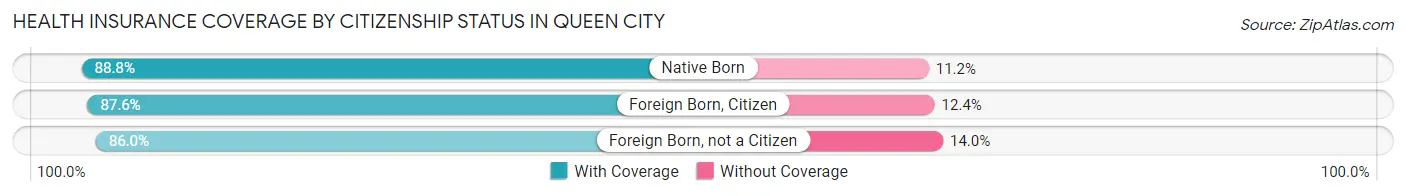
| Citizenship Status | With Coverage | Without Coverage |
| Native Born | 103 (88.8%) | 13 (11.2%) |
| Foreign Born, Citizen | 78 (87.6%) | 11 (12.4%) |
| Foreign Born, not a Citizen | 43 (86.0%) | 7 (14.0%) |
Health Insurance Coverage by Household Income in Queen City
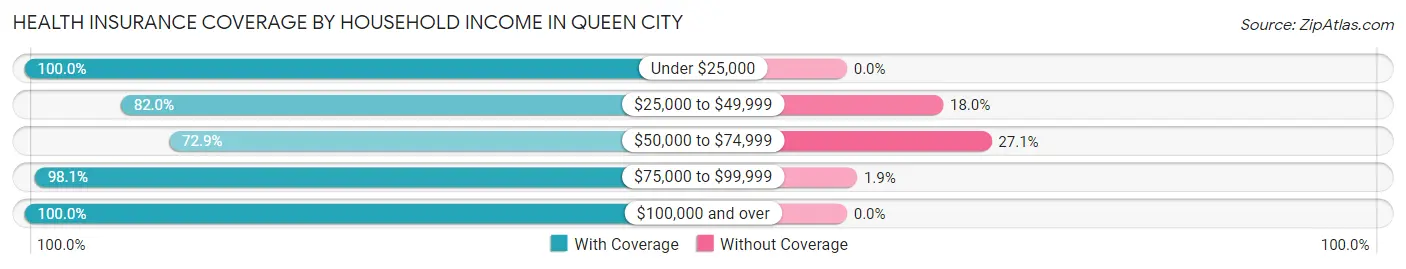
| Household Income | With Coverage | Without Coverage |
| Under $25,000 | 58 (100.0%) | 0 (0.0%) |
| $25,000 to $49,999 | 150 (82.0%) | 33 (18.0%) |
| $50,000 to $74,999 | 148 (72.9%) | 55 (27.1%) |
| $75,000 to $99,999 | 155 (98.1%) | 3 (1.9%) |
| $100,000 and over | 60 (100.0%) | 0 (0.0%) |
Public vs Private Health Insurance Coverage by Age in Queen City
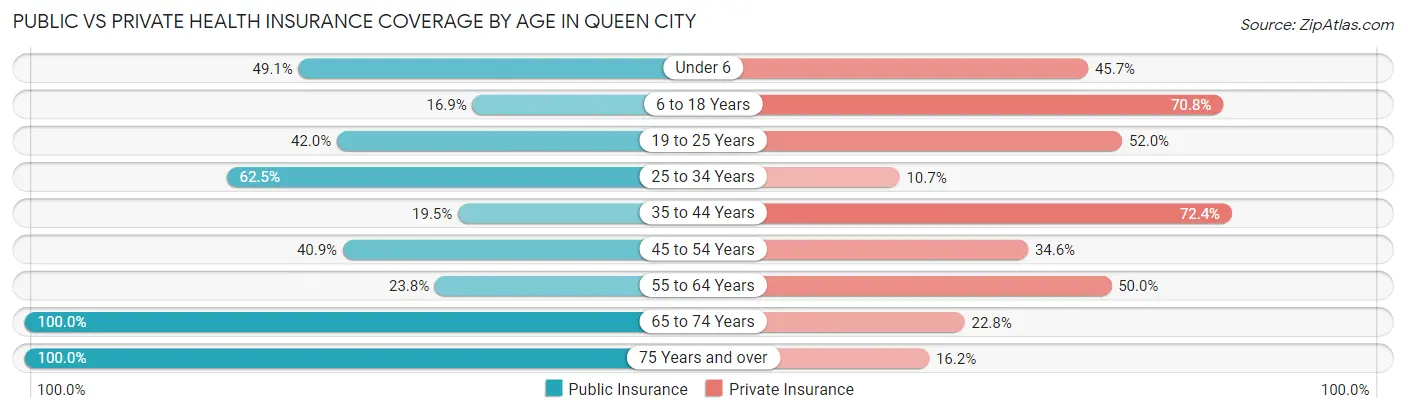
| Age Bracket | Public Insurance | Private Insurance |
| Under 6 | 57 (49.1%) | 53 (45.7%) |
| 6 to 18 Years | 15 (16.9%) | 63 (70.8%) |
| 19 to 25 Years | 21 (42.0%) | 26 (52.0%) |
| 25 to 34 Years | 35 (62.5%) | 6 (10.7%) |
| 35 to 44 Years | 17 (19.5%) | 63 (72.4%) |
| 45 to 54 Years | 45 (40.9%) | 38 (34.5%) |
| 55 to 64 Years | 10 (23.8%) | 21 (50.0%) |
| 65 to 74 Years | 79 (100.0%) | 18 (22.8%) |
| 75 Years and over | 68 (100.0%) | 11 (16.2%) |
| Total | 347 (49.8%) | 299 (42.9%) |
Disability Status by Sex by Age in Queen City
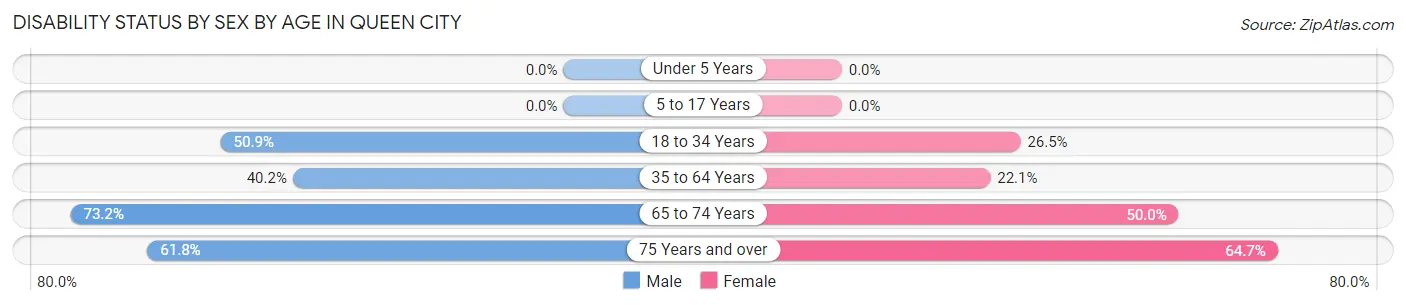
| Age Bracket | Male | Female |
| Under 5 Years | 0 (0.0%) | 0 (0.0%) |
| 5 to 17 Years | 0 (0.0%) | 0 (0.0%) |
| 18 to 34 Years | 29 (50.9%) | 13 (26.5%) |
| 35 to 64 Years | 45 (40.2%) | 28 (22.1%) |
| 65 to 74 Years | 30 (73.2%) | 19 (50.0%) |
| 75 Years and over | 21 (61.8%) | 22 (64.7%) |
Disability Class by Sex by Age in Queen City
Disability Class: Hearing Difficulty
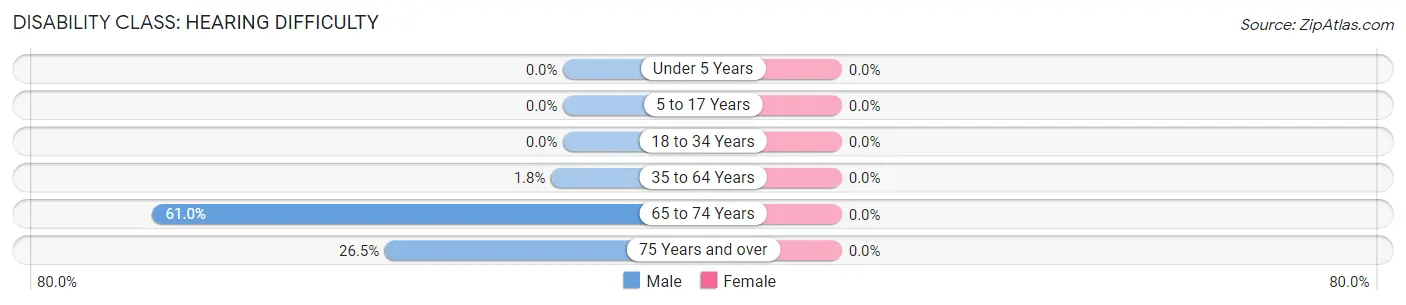
| Age Bracket | Male | Female |
| Under 5 Years | 0 (0.0%) | 0 (0.0%) |
| 5 to 17 Years | 0 (0.0%) | 0 (0.0%) |
| 18 to 34 Years | 0 (0.0%) | 0 (0.0%) |
| 35 to 64 Years | 2 (1.8%) | 0 (0.0%) |
| 65 to 74 Years | 25 (61.0%) | 0 (0.0%) |
| 75 Years and over | 9 (26.5%) | 0 (0.0%) |
Disability Class: Vision Difficulty
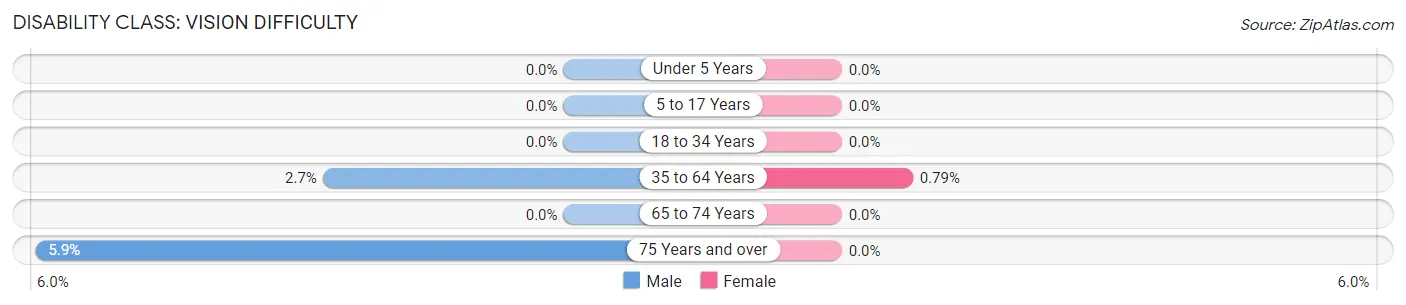
| Age Bracket | Male | Female |
| Under 5 Years | 0 (0.0%) | 0 (0.0%) |
| 5 to 17 Years | 0 (0.0%) | 0 (0.0%) |
| 18 to 34 Years | 0 (0.0%) | 0 (0.0%) |
| 35 to 64 Years | 3 (2.7%) | 1 (0.8%) |
| 65 to 74 Years | 0 (0.0%) | 0 (0.0%) |
| 75 Years and over | 2 (5.9%) | 0 (0.0%) |
Disability Class: Cognitive Difficulty
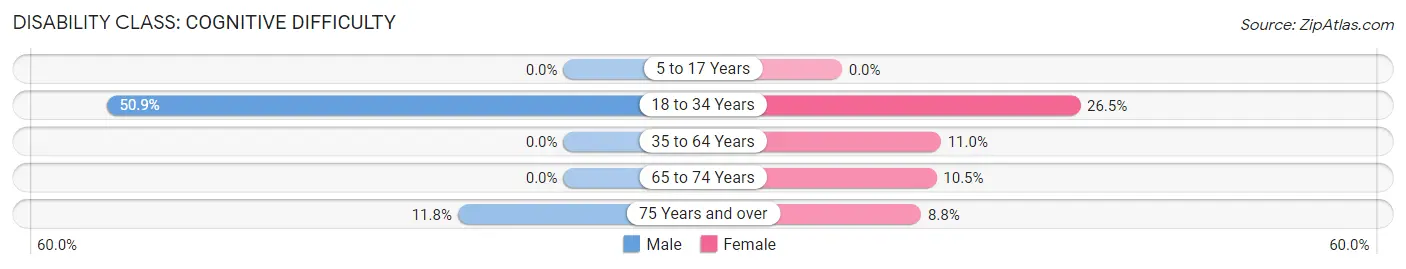
| Age Bracket | Male | Female |
| 5 to 17 Years | 0 (0.0%) | 0 (0.0%) |
| 18 to 34 Years | 29 (50.9%) | 13 (26.5%) |
| 35 to 64 Years | 0 (0.0%) | 14 (11.0%) |
| 65 to 74 Years | 0 (0.0%) | 4 (10.5%) |
| 75 Years and over | 4 (11.8%) | 3 (8.8%) |
Disability Class: Ambulatory Difficulty
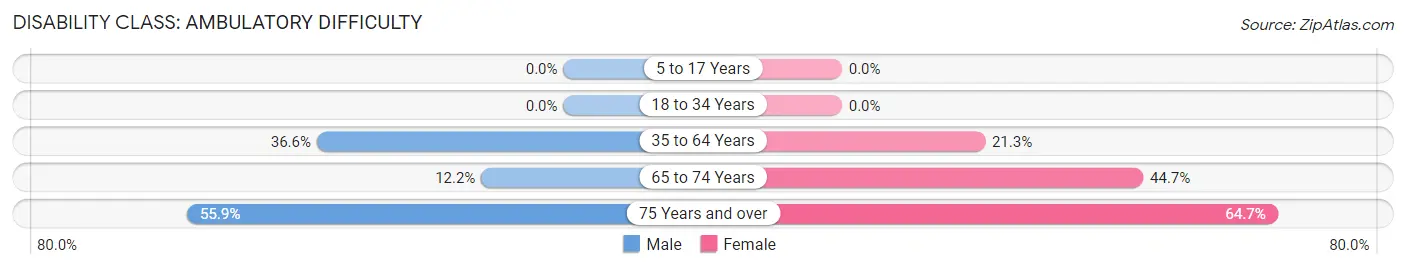
| Age Bracket | Male | Female |
| 5 to 17 Years | 0 (0.0%) | 0 (0.0%) |
| 18 to 34 Years | 0 (0.0%) | 0 (0.0%) |
| 35 to 64 Years | 41 (36.6%) | 27 (21.3%) |
| 65 to 74 Years | 5 (12.2%) | 17 (44.7%) |
| 75 Years and over | 19 (55.9%) | 22 (64.7%) |
Disability Class: Self-Care Difficulty
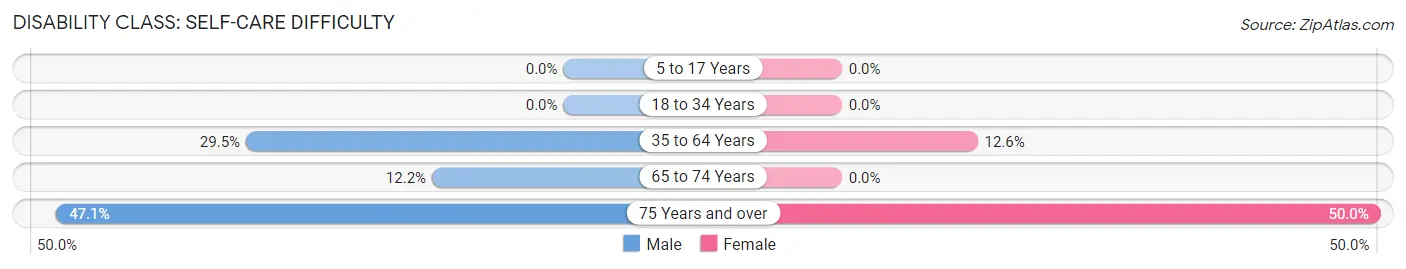
| Age Bracket | Male | Female |
| 5 to 17 Years | 0 (0.0%) | 0 (0.0%) |
| 18 to 34 Years | 0 (0.0%) | 0 (0.0%) |
| 35 to 64 Years | 33 (29.5%) | 16 (12.6%) |
| 65 to 74 Years | 5 (12.2%) | 0 (0.0%) |
| 75 Years and over | 16 (47.1%) | 17 (50.0%) |
Technology Access in Queen City
Computing Device Access in Queen City
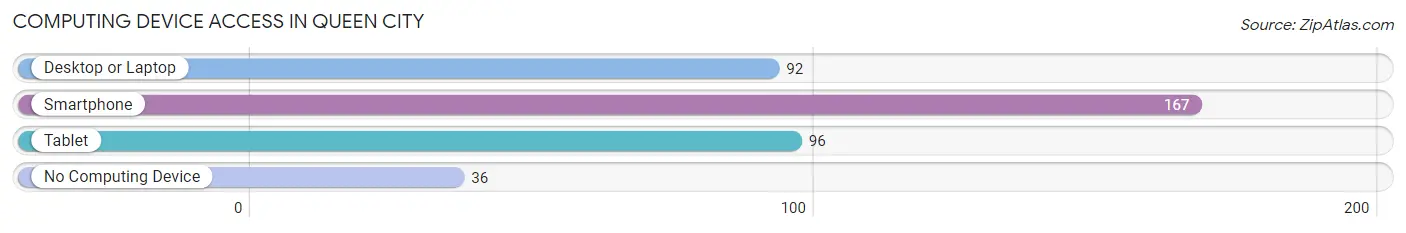
| Device Type | # Households | % Households |
| Desktop or Laptop | 92 | 43.0% |
| Smartphone | 167 | 78.0% |
| Tablet | 96 | 44.9% |
| No Computing Device | 36 | 16.8% |
| Total | 214 | 100.0% |
Internet Access in Queen City
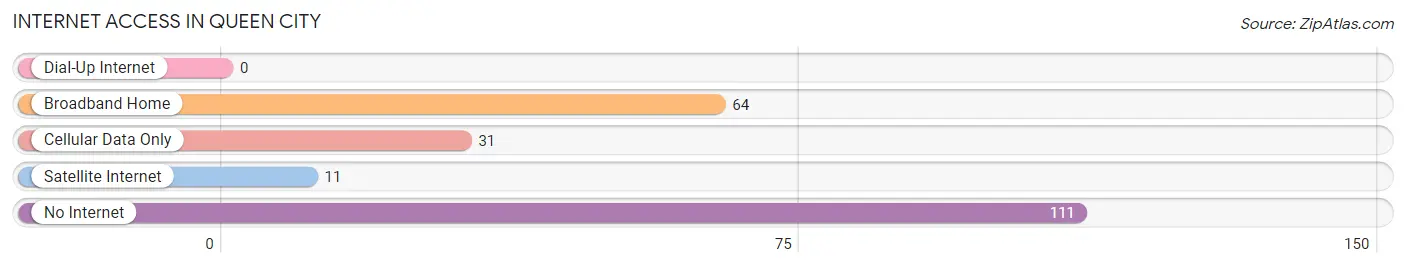
| Internet Type | # Households | % Households |
| Dial-Up Internet | 0 | 0.0% |
| Broadband Home | 64 | 29.9% |
| Cellular Data Only | 31 | 14.5% |
| Satellite Internet | 11 | 5.1% |
| No Internet | 111 | 51.9% |
| Total | 214 | 100.0% |
Queen City Summary
City of Queen City Missouri
Queen City, Missouri is a small city located in the northeast corner of the state, in Schuyler County. It is situated on the banks of the Chariton River, and is the county seat of Schuyler County. The city has a population of 1,845 people, according to the 2010 census.
History
Queen City was founded in 1837 by a group of settlers from Kentucky. The city was named after Queen Victoria, who was the reigning monarch of England at the time. The city was incorporated in 1841, and the first mayor was elected in 1842.
Queen City was a major stop on the Hannibal and St. Joseph Railroad, which was the first transcontinental railroad in the United States. The railroad brought many new settlers to the area, and the city grew rapidly.
In the late 19th century, Queen City was a major center for the timber industry. The city was home to several sawmills and lumber yards, and the timber industry provided many jobs for the citizens of Queen City.
Geography
Queen City is located in the northeast corner of Missouri, in Schuyler County. The city is situated on the banks of the Chariton River, and is surrounded by rolling hills and farmland. The city is located approximately 50 miles from the state capital of Jefferson City.
The climate in Queen City is humid continental, with hot summers and cold winters. The average annual temperature is around 54 degrees Fahrenheit, and the average annual precipitation is around 40 inches.
Economy
Queen City’s economy is largely based on agriculture and manufacturing. The city is home to several large farms, and the surrounding area is known for its production of corn, soybeans, and wheat.
The city is also home to several manufacturing companies, including a furniture factory, a plastics factory, and a metal fabrication plant. These companies provide many jobs for the citizens of Queen City.
Demographics
According to the 2010 census, Queen City has a population of 1,845 people. The racial makeup of the city is 95.3% White, 1.2% African American, 0.7% Native American, 0.3% Asian, and 2.5% from other races.
The median household income in Queen City is $35,000, and the median home value is $90,000. The city has a poverty rate of 17.3%, and the unemployment rate is 5.3%.
Queen City is served by the Schuyler County School District, which includes one elementary school, one middle school, and one high school. The city is also home to several churches, including the First Baptist Church, the First United Methodist Church, and the Church of the Nazarene.
Queen City is a small city with a rich history and a bright future. The city is home to many businesses and industries, and the citizens of Queen City are proud of their community.
Common Questions
What is Per Capita Income in Queen City?
Per Capita income in Queen City is $19,021.
What is the Median Family Income in Queen City?
Median Family Income in Queen City is $53,523.
What is the Median Household income in Queen City?
Median Household Income in Queen City is $45,893.
What is Income or Wage Gap in Queen City?
Income or Wage Gap in Queen City is 13.9%.
Women in Queen City earn 86.1 cents for every dollar earned by a man.
What is Family Income Deficit in Queen City?
Family Income Deficit in Queen City is $5,500.
Families that are below poverty line in Queen City earn $5,500 less on average than the poverty threshold level.
What is Inequality or Gini Index in Queen City?
Inequality or Gini Index in Queen City is 0.34.
What is the Total Population of Queen City?
Total Population of Queen City is 708.
What is the Total Male Population of Queen City?
Total Male Population of Queen City is 385.
What is the Total Female Population of Queen City?
Total Female Population of Queen City is 323.
What is the Ratio of Males per 100 Females in Queen City?
There are 119.20 Males per 100 Females in Queen City.
What is the Ratio of Females per 100 Males in Queen City?
There are 83.90 Females per 100 Males in Queen City.
What is the Median Population Age in Queen City?
Median Population Age in Queen City is 38.7 Years.
What is the Average Family Size in Queen City
Average Family Size in Queen City is 4.4 People.
What is the Average Household Size in Queen City
Average Household Size in Queen City is 3.1 People.
How Large is the Labor Force in Queen City?
There are 214 People in the Labor Forcein in Queen City.
What is the Percentage of People in the Labor Force in Queen City?
41.2% of People are in the Labor Force in Queen City.
What is the Unemployment Rate in Queen City?
Unemployment Rate in Queen City is 2.8%.