Houston, MO Map & Demographics
Houston Map
Houston Overview
$23,076
PER CAPITA INCOME
$55,804
AVG FAMILY INCOME
$40,893
AVG HOUSEHOLD INCOME
14.4%
WAGE / INCOME GAP [ % ]
85.6¢/ $1
WAGE / INCOME GAP [ $ ]
0.46
INEQUALITY / GINI INDEX
2,416
TOTAL POPULATION
1,050
MALE POPULATION
1,366
FEMALE POPULATION
76.87
MALES / 100 FEMALES
130.10
FEMALES / 100 MALES
33.9
MEDIAN AGE
2.9
AVG FAMILY SIZE
2.5
AVG HOUSEHOLD SIZE
1,199
LABOR FORCE [ PEOPLE ]
59.2%
PERCENT IN LABOR FORCE
9.2%
UNEMPLOYMENT RATE
Houston Zip Codes
Houston Area Codes
Income in Houston
Income Overview in Houston
Per Capita Income in Houston is $23,076, while median incomes of families and households are $55,804 and $40,893 respectively.
| Characteristic | Number | Measure |
| Per Capita Income | 2,416 | $23,076 |
| Median Family Income | 543 | $55,804 |
| Mean Family Income | 543 | $73,223 |
| Median Household Income | 931 | $40,893 |
| Mean Household Income | 931 | $57,660 |
| Income Deficit | 543 | $0 |
| Wage / Income Gap (%) | 2,416 | 14.39% |
| Wage / Income Gap ($) | 2,416 | 85.61¢ per $1 |
| Gini / Inequality Index | 2,416 | 0.46 |
Earnings by Sex in Houston
Average Earnings in Houston are $23,982, $27,250 for men and $23,329 for women, a difference of 14.4%.
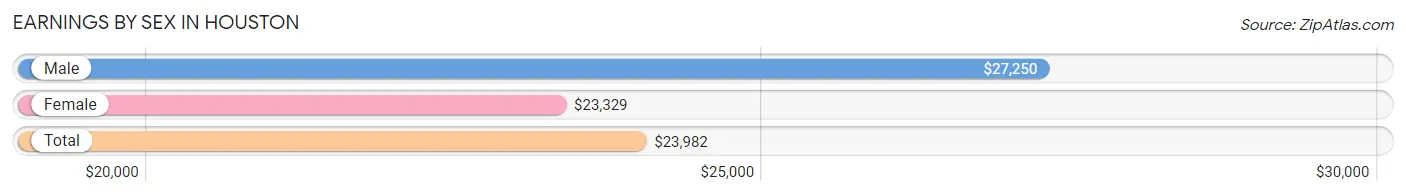
| Sex | Number | Average Earnings |
| Male | 637 (49.9%) | $27,250 |
| Female | 639 (50.1%) | $23,329 |
| Total | 1,276 (100.0%) | $23,982 |
Earnings by Sex by Income Bracket in Houston
The most common earnings brackets in Houston are $10,000 to $12,499 for men (93 | 14.6%) and $7,500 to $9,999 for women (110 | 17.2%).
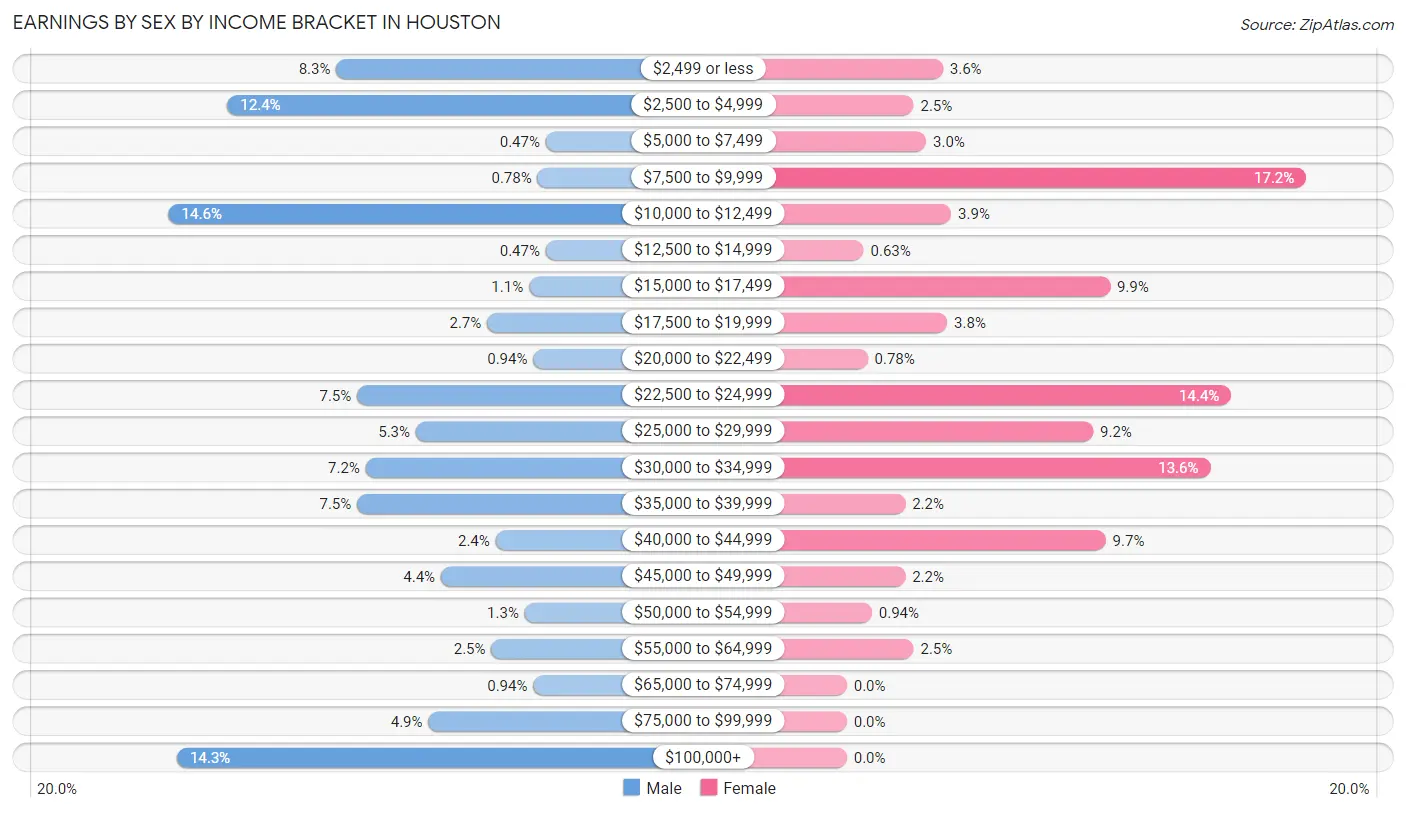
| Income | Male | Female |
| $2,499 or less | 53 (8.3%) | 23 (3.6%) |
| $2,500 to $4,999 | 79 (12.4%) | 16 (2.5%) |
| $5,000 to $7,499 | 3 (0.5%) | 19 (3.0%) |
| $7,500 to $9,999 | 5 (0.8%) | 110 (17.2%) |
| $10,000 to $12,499 | 93 (14.6%) | 25 (3.9%) |
| $12,500 to $14,999 | 3 (0.5%) | 4 (0.6%) |
| $15,000 to $17,499 | 7 (1.1%) | 63 (9.9%) |
| $17,500 to $19,999 | 17 (2.7%) | 24 (3.8%) |
| $20,000 to $22,499 | 6 (0.9%) | 5 (0.8%) |
| $22,500 to $24,999 | 48 (7.5%) | 92 (14.4%) |
| $25,000 to $29,999 | 34 (5.3%) | 59 (9.2%) |
| $30,000 to $34,999 | 46 (7.2%) | 87 (13.6%) |
| $35,000 to $39,999 | 48 (7.5%) | 14 (2.2%) |
| $40,000 to $44,999 | 15 (2.4%) | 62 (9.7%) |
| $45,000 to $49,999 | 28 (4.4%) | 14 (2.2%) |
| $50,000 to $54,999 | 8 (1.3%) | 6 (0.9%) |
| $55,000 to $64,999 | 16 (2.5%) | 16 (2.5%) |
| $65,000 to $74,999 | 6 (0.9%) | 0 (0.0%) |
| $75,000 to $99,999 | 31 (4.9%) | 0 (0.0%) |
| $100,000+ | 91 (14.3%) | 0 (0.0%) |
| Total | 637 (100.0%) | 639 (100.0%) |
Earnings by Sex by Educational Attainment in Houston
Average earnings in Houston are $38,398 for men and $25,222 for women, a difference of 34.3%. Men with an educational attainment of college or associate's degree enjoy the highest average annual earnings of $38,571, while those with college or associate's degree education earn the least with $38,571. Women with an educational attainment of bachelor's degree earn the most with the average annual earnings of $40,096, while those with high school diploma education have the smallest earnings of $23,041.
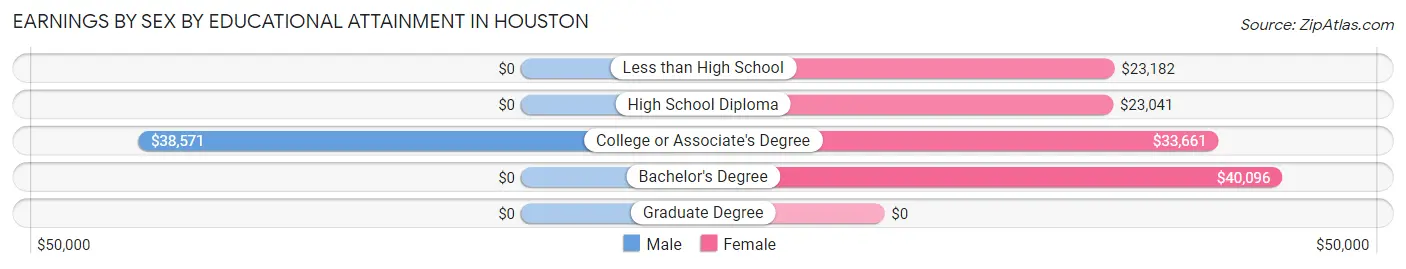
| Educational Attainment | Male Income | Female Income |
| Less than High School | - | - |
| High School Diploma | - | - |
| College or Associate's Degree | $38,571 | $33,661 |
| Bachelor's Degree | - | - |
| Graduate Degree | - | - |
| Total | $38,398 | $25,222 |
Family Income in Houston
Family Income Brackets in Houston
According to the Houston family income data, there are 101 families falling into the $50,000 to $74,999 income range, which is the most common income bracket and makes up 18.6% of all families.
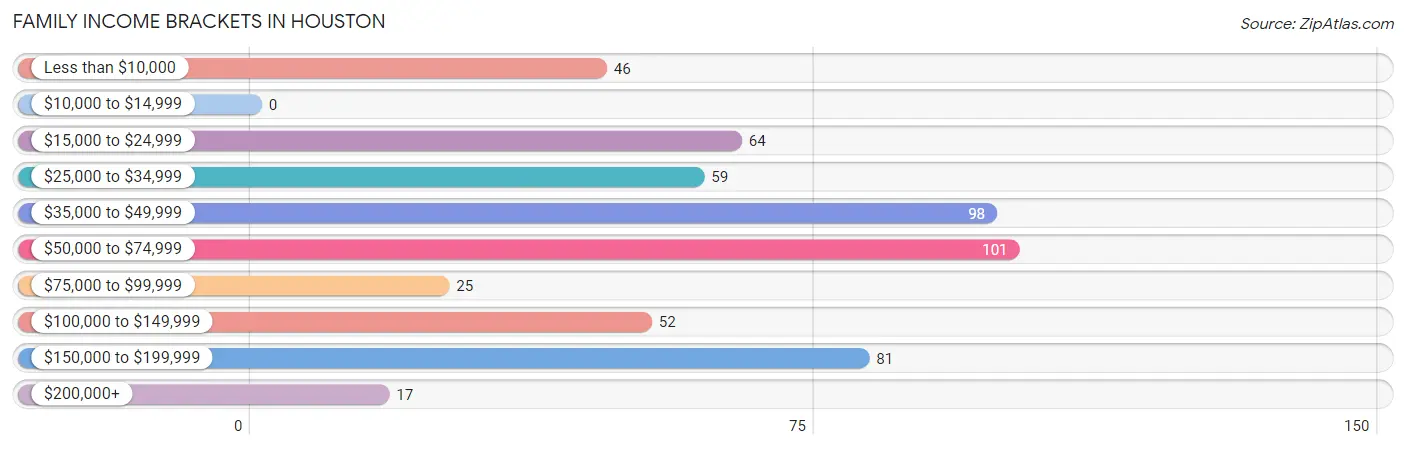
| Income Bracket | # Families | % Families |
| Less than $10,000 | 46 | 8.5% |
| $10,000 to $14,999 | 0 | 0.0% |
| $15,000 to $24,999 | 64 | 11.8% |
| $25,000 to $34,999 | 59 | 10.9% |
| $35,000 to $49,999 | 98 | 18.0% |
| $50,000 to $74,999 | 101 | 18.6% |
| $75,000 to $99,999 | 25 | 4.6% |
| $100,000 to $149,999 | 52 | 9.6% |
| $150,000 to $199,999 | 81 | 14.9% |
| $200,000+ | 17 | 3.1% |
Family Income by Famaliy Size in Houston
4-person families (102 | 18.8%) account for the highest median family income in Houston with $48,106 per family, while 2-person families (223 | 41.1%) have the highest median income of $23,282 per family member.
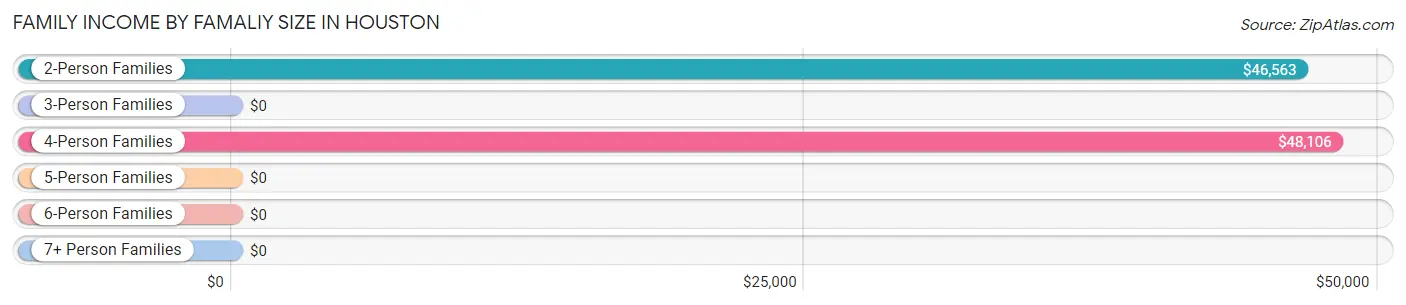
| Income Bracket | # Families | Median Income |
| 2-Person Families | 223 (41.1%) | $46,563 |
| 3-Person Families | 213 (39.2%) | $0 |
| 4-Person Families | 102 (18.8%) | $48,106 |
| 5-Person Families | 0 (0.0%) | $0 |
| 6-Person Families | 5 (0.9%) | $0 |
| 7+ Person Families | 0 (0.0%) | $0 |
| Total | 543 (100.0%) | $55,804 |
Family Income by Number of Earners in Houston
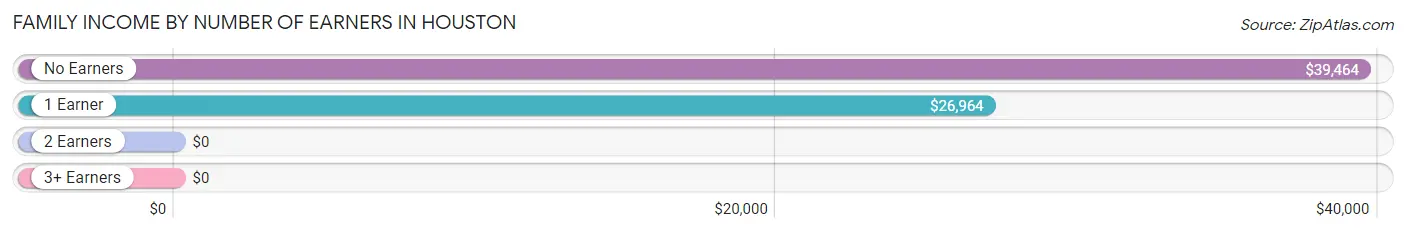
| Number of Earners | # Families | Median Income |
| No Earners | 104 (19.2%) | $39,464 |
| 1 Earner | 117 (21.5%) | $26,964 |
| 2 Earners | 261 (48.1%) | $0 |
| 3+ Earners | 61 (11.2%) | $0 |
| Total | 543 (100.0%) | $55,804 |
Household Income in Houston
Household Income Brackets in Houston
With 177 households falling in the category, the $35,000 to $49,999 income range is the most frequent in Houston, accounting for 19.0% of all households. In contrast, only 17 households (1.8%) fall into the $200,000+ income bracket, making it the least populous group.
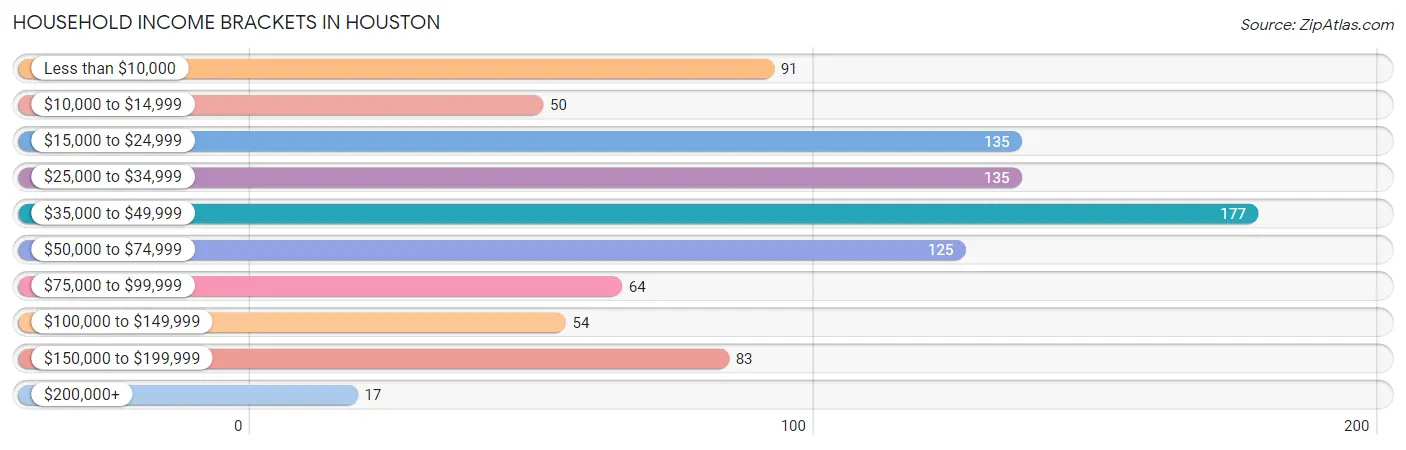
| Income Bracket | # Households | % Households |
| Less than $10,000 | 91 | 9.8% |
| $10,000 to $14,999 | 50 | 5.4% |
| $15,000 to $24,999 | 135 | 14.5% |
| $25,000 to $34,999 | 135 | 14.5% |
| $35,000 to $49,999 | 177 | 19.0% |
| $50,000 to $74,999 | 125 | 13.4% |
| $75,000 to $99,999 | 64 | 6.9% |
| $100,000 to $149,999 | 54 | 5.8% |
| $150,000 to $199,999 | 83 | 8.9% |
| $200,000+ | 17 | 1.8% |
Household Income by Householder Age in Houston
The median household income in Houston is $40,893, with the highest median household income of $49,697 found in the 45 to 64 years age bracket for the primary householder. A total of 386 households (41.5%) fall into this category. Meanwhile, the 15 to 24 years age bracket for the primary householder has the lowest median household income of $33,229, with 29 households (3.1%) in this group.
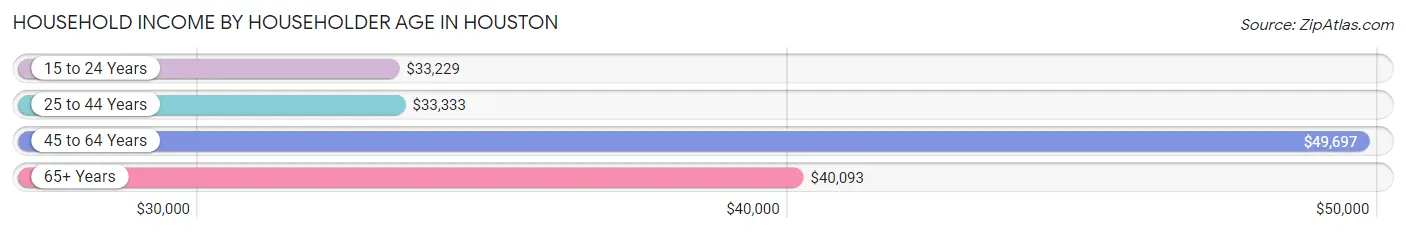
| Income Bracket | # Households | Median Income |
| 15 to 24 Years | 29 (3.1%) | $33,229 |
| 25 to 44 Years | 280 (30.1%) | $33,333 |
| 45 to 64 Years | 386 (41.5%) | $49,697 |
| 65+ Years | 236 (25.4%) | $40,093 |
| Total | 931 (100.0%) | $40,893 |
Poverty in Houston
Income Below Poverty by Sex and Age in Houston
With 22.7% poverty level for males and 32.3% for females among the residents of Houston, 16 and 17 year old males and 35 to 44 year old females are the most vulnerable to poverty, with 64 males (88.9%) and 112 females (64.0%) in their respective age groups living below the poverty level.
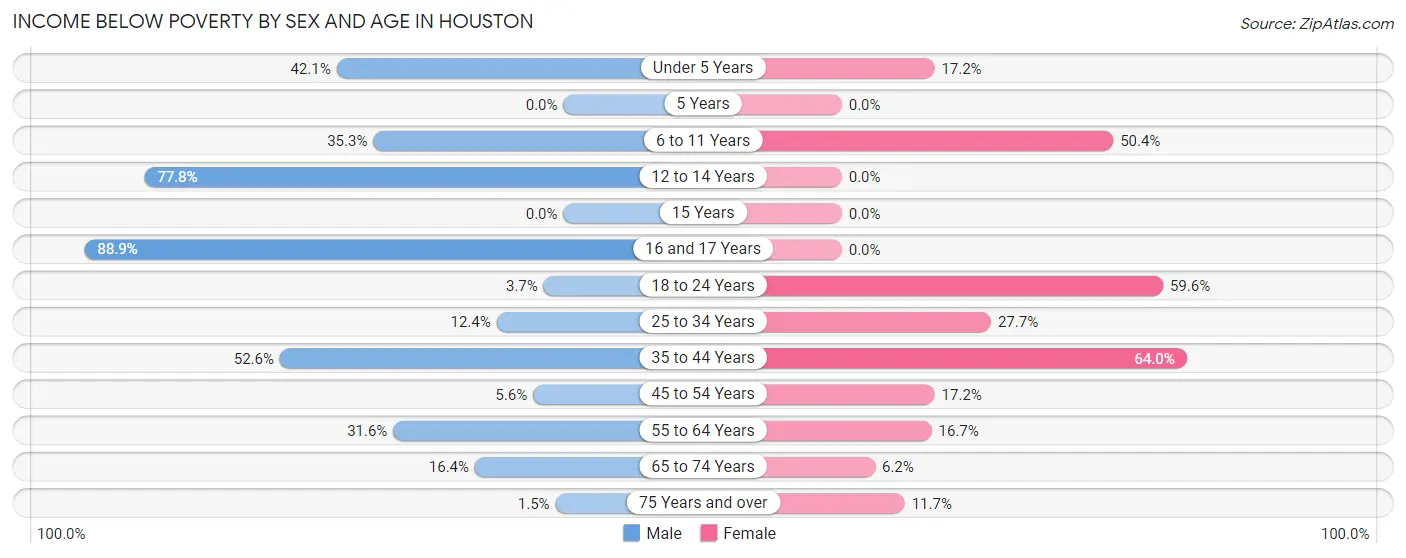
| Age Bracket | Male | Female |
| Under 5 Years | 16 (42.1%) | 16 (17.2%) |
| 5 Years | 0 (0.0%) | 0 (0.0%) |
| 6 to 11 Years | 18 (35.3%) | 66 (50.4%) |
| 12 to 14 Years | 28 (77.8%) | 0 (0.0%) |
| 15 Years | 0 (0.0%) | 0 (0.0%) |
| 16 and 17 Years | 64 (88.9%) | 0 (0.0%) |
| 18 to 24 Years | 7 (3.7%) | 93 (59.6%) |
| 25 to 34 Years | 15 (12.4%) | 72 (27.7%) |
| 35 to 44 Years | 20 (52.6%) | 112 (64.0%) |
| 45 to 54 Years | 11 (5.6%) | 20 (17.2%) |
| 55 to 64 Years | 30 (31.6%) | 23 (16.7%) |
| 65 to 74 Years | 11 (16.4%) | 5 (6.2%) |
| 75 Years and over | 1 (1.5%) | 16 (11.7%) |
| Total | 221 (22.7%) | 423 (32.3%) |
Income Above Poverty by Sex and Age in Houston
According to the poverty statistics in Houston, males aged 75 years and over and females aged 12 to 14 years are the age groups that are most secure financially, with 98.5% of males and 100.0% of females in these age groups living above the poverty line.
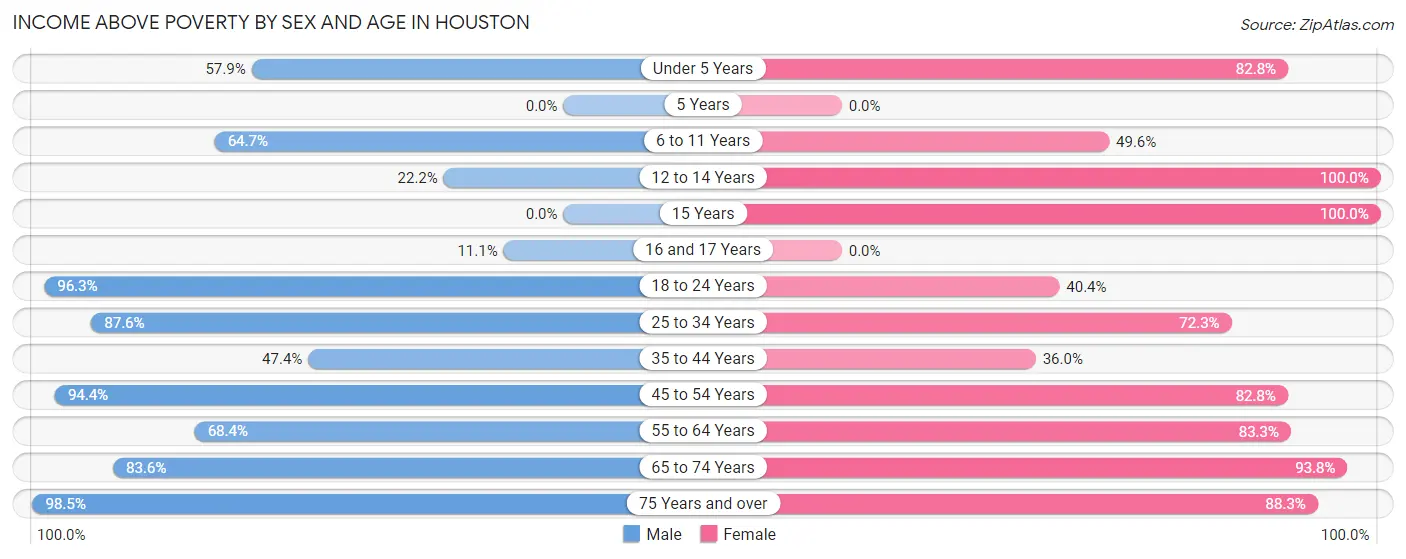
| Age Bracket | Male | Female |
| Under 5 Years | 22 (57.9%) | 77 (82.8%) |
| 5 Years | 0 (0.0%) | 0 (0.0%) |
| 6 to 11 Years | 33 (64.7%) | 65 (49.6%) |
| 12 to 14 Years | 8 (22.2%) | 11 (100.0%) |
| 15 Years | 0 (0.0%) | 10 (100.0%) |
| 16 and 17 Years | 8 (11.1%) | 0 (0.0%) |
| 18 to 24 Years | 184 (96.3%) | 63 (40.4%) |
| 25 to 34 Years | 106 (87.6%) | 188 (72.3%) |
| 35 to 44 Years | 18 (47.4%) | 63 (36.0%) |
| 45 to 54 Years | 184 (94.4%) | 96 (82.8%) |
| 55 to 64 Years | 65 (68.4%) | 115 (83.3%) |
| 65 to 74 Years | 56 (83.6%) | 76 (93.8%) |
| 75 Years and over | 67 (98.5%) | 121 (88.3%) |
| Total | 751 (77.3%) | 885 (67.7%) |
Income Below Poverty Among Married-Couple Families in Houston
The poverty statistics for married-couple families in Houston show that 1.0% or 3 of the total 304 families live below the poverty line. Families with 1 or 2 children have the highest poverty rate of 2.8%, comprising of 3 families. On the other hand, families with no children have the lowest poverty rate of 0.0%, which includes 0 families.
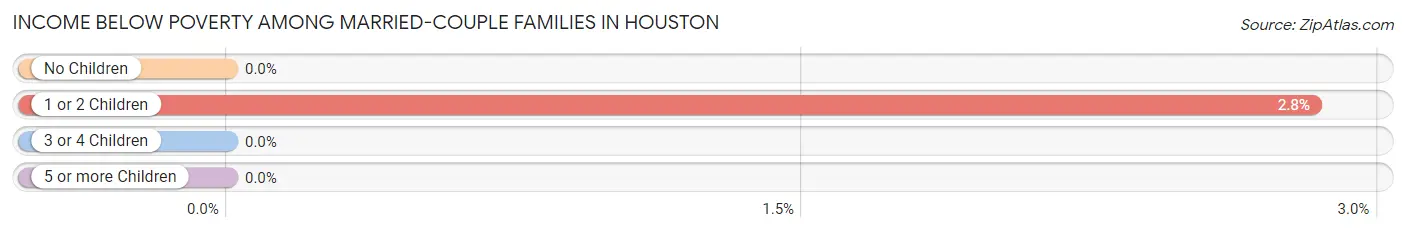
| Children | Above Poverty | Below Poverty |
| No Children | 193 (100.0%) | 0 (0.0%) |
| 1 or 2 Children | 103 (97.2%) | 3 (2.8%) |
| 3 or 4 Children | 5 (100.0%) | 0 (0.0%) |
| 5 or more Children | 0 (0.0%) | 0 (0.0%) |
| Total | 301 (99.0%) | 3 (1.0%) |
Income Below Poverty Among Single-Parent Households in Houston
According to the poverty data in Houston, 20.5% or 26 single-father households and 72.3% or 81 single-mother households are living below the poverty line. Among single-father households, those with 1 or 2 children have the highest poverty rate, with 26 households (86.7%) experiencing poverty. Likewise, among single-mother households, those with 1 or 2 children have the highest poverty rate, with 76 households (84.4%) falling below the poverty line.
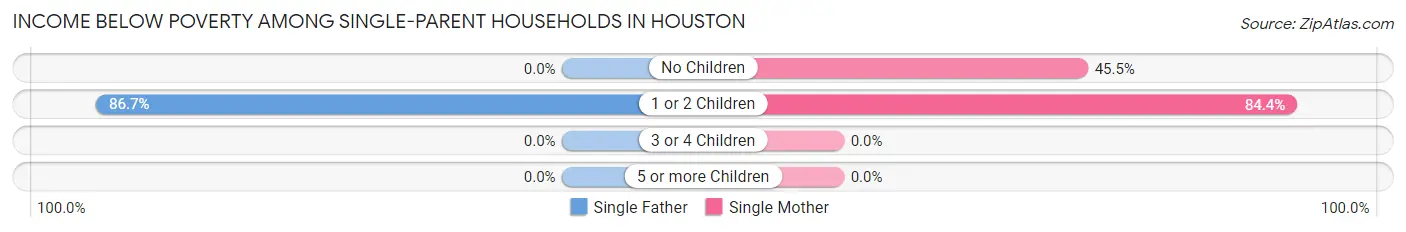
| Children | Single Father | Single Mother |
| No Children | 0 (0.0%) | 5 (45.5%) |
| 1 or 2 Children | 26 (86.7%) | 76 (84.4%) |
| 3 or 4 Children | 0 (0.0%) | 0 (0.0%) |
| 5 or more Children | 0 (0.0%) | 0 (0.0%) |
| Total | 26 (20.5%) | 81 (72.3%) |
Income Below Poverty Among Married-Couple vs Single-Parent Households in Houston
The poverty data for Houston shows that 3 of the married-couple family households (1.0%) and 107 of the single-parent households (44.8%) are living below the poverty level. Within the married-couple family households, those with 1 or 2 children have the highest poverty rate, with 3 households (2.8%) falling below the poverty line. Among the single-parent households, those with 1 or 2 children have the highest poverty rate, with 102 household (85.0%) living below poverty.
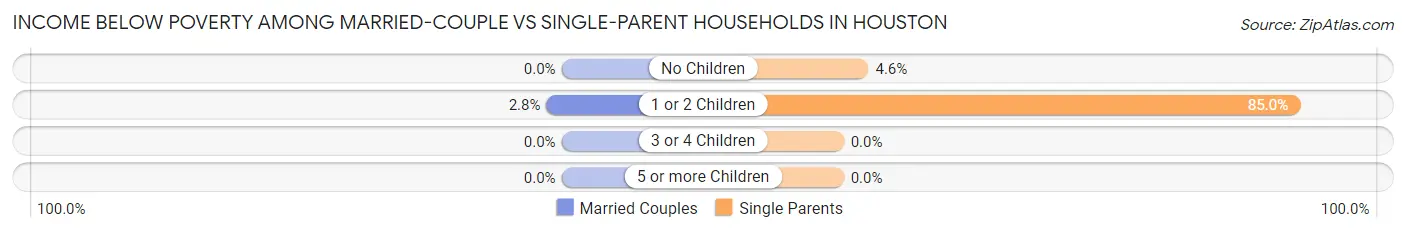
| Children | Married-Couple Families | Single-Parent Households |
| No Children | 0 (0.0%) | 5 (4.6%) |
| 1 or 2 Children | 3 (2.8%) | 102 (85.0%) |
| 3 or 4 Children | 0 (0.0%) | 0 (0.0%) |
| 5 or more Children | 0 (0.0%) | 0 (0.0%) |
| Total | 3 (1.0%) | 107 (44.8%) |
Race in Houston
The most populous races in Houston are White / Caucasian (2,132 | 88.2%), Two or more Races (155 | 6.4%), and Asian (86 | 3.6%).
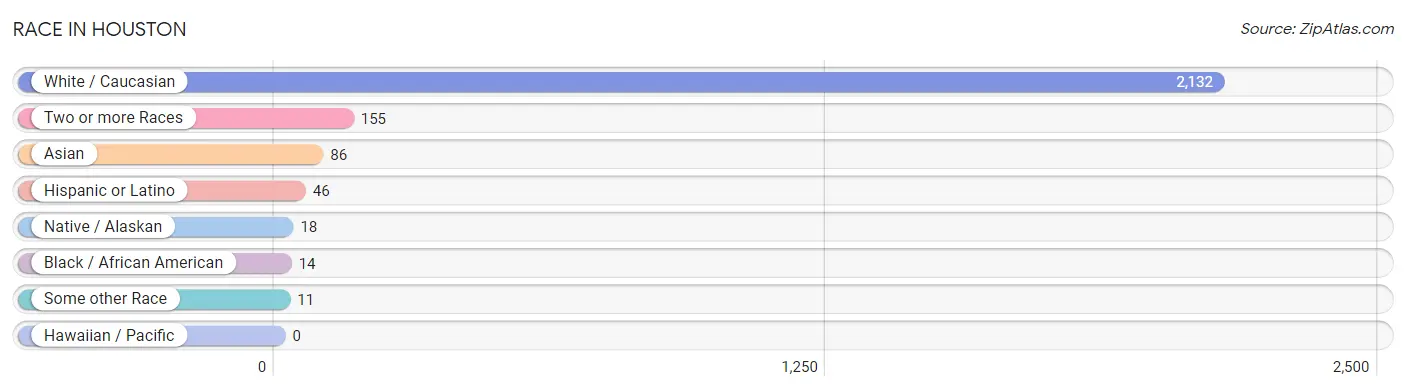
| Race | # Population | % Population |
| Asian | 86 | 3.6% |
| Black / African American | 14 | 0.6% |
| Hawaiian / Pacific | 0 | 0.0% |
| Hispanic or Latino | 46 | 1.9% |
| Native / Alaskan | 18 | 0.7% |
| White / Caucasian | 2,132 | 88.2% |
| Two or more Races | 155 | 6.4% |
| Some other Race | 11 | 0.5% |
| Total | 2,416 | 100.0% |
Ancestry in Houston
The most populous ancestries reported in Houston are German (450 | 18.6%), Irish (278 | 11.5%), English (233 | 9.6%), Austrian (150 | 6.2%), and American (93 | 3.8%), together accounting for 49.8% of all Houston residents.
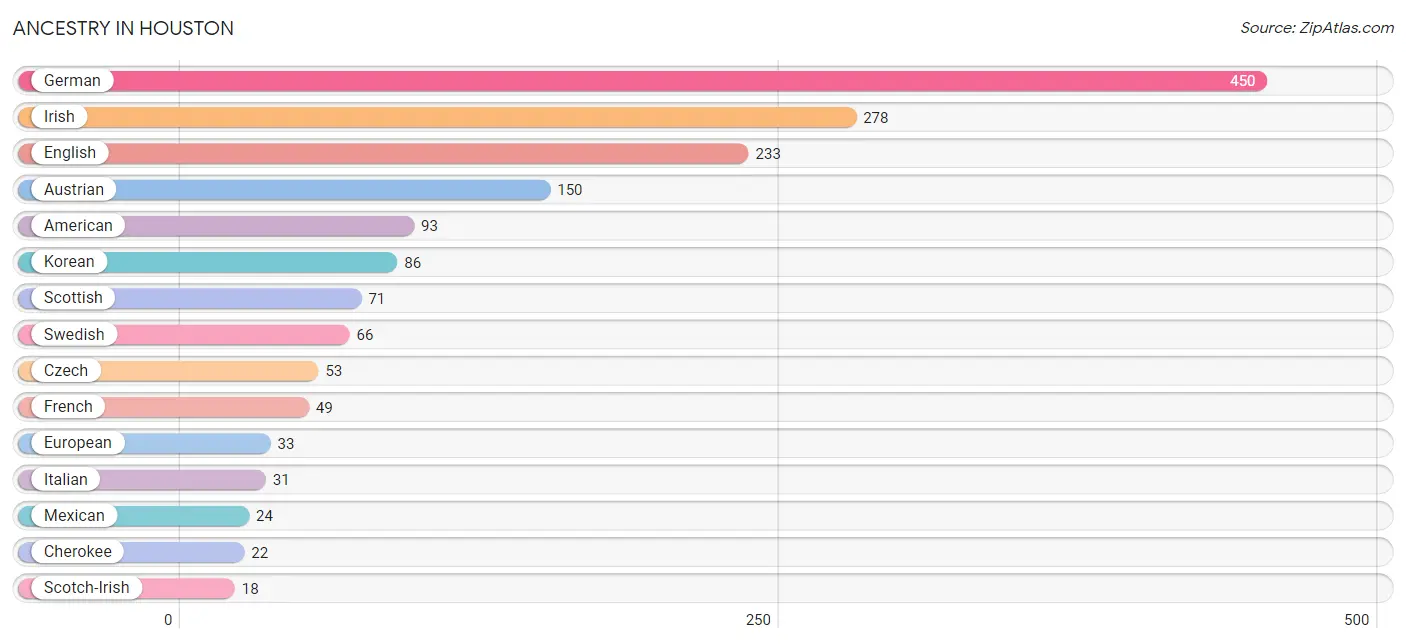
| Ancestry | # Population | % Population |
| American | 93 | 3.8% |
| Austrian | 150 | 6.2% |
| Blackfeet | 1 | 0.0% |
| Canadian | 5 | 0.2% |
| Cherokee | 22 | 0.9% |
| Cheyenne | 2 | 0.1% |
| Chippewa | 2 | 0.1% |
| Choctaw | 10 | 0.4% |
| Creek | 3 | 0.1% |
| Czech | 53 | 2.2% |
| Dutch | 11 | 0.5% |
| English | 233 | 9.6% |
| European | 33 | 1.4% |
| French | 49 | 2.0% |
| German | 450 | 18.6% |
| Greek | 3 | 0.1% |
| Irish | 278 | 11.5% |
| Italian | 31 | 1.3% |
| Kiowa | 14 | 0.6% |
| Korean | 86 | 3.6% |
| Lithuanian | 9 | 0.4% |
| Mexican | 24 | 1.0% |
| Norwegian | 4 | 0.2% |
| Polish | 15 | 0.6% |
| Puerto Rican | 10 | 0.4% |
| Scandinavian | 3 | 0.1% |
| Scotch-Irish | 18 | 0.7% |
| Scottish | 71 | 2.9% |
| Spanish | 12 | 0.5% |
| Swedish | 66 | 2.7% |
| Swiss | 5 | 0.2% |
| Ukrainian | 7 | 0.3% |
| Welsh | 8 | 0.3% | View All 33 Rows |
Immigrants in Houston
The most numerous immigrant groups reported in Houston came from Europe (6 | 0.3%), Canada (5 | 0.2%), England (3 | 0.1%), and Northern Europe (3 | 0.1%), together accounting for 0.7% of all Houston residents.
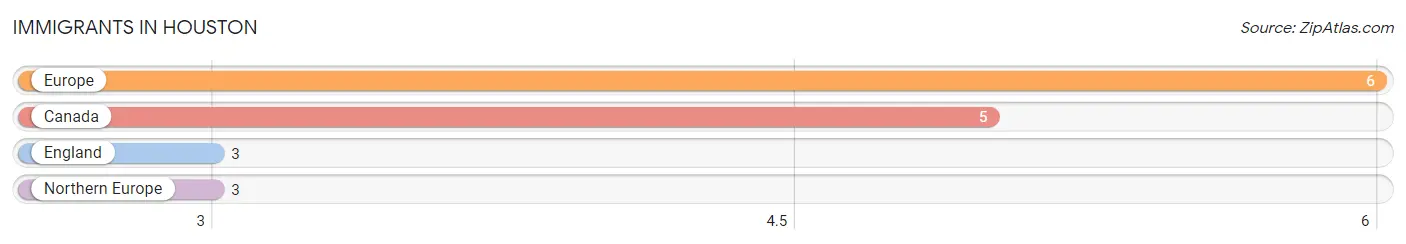
| Immigration Origin | # Population | % Population |
| Canada | 5 | 0.2% |
| England | 3 | 0.1% |
| Europe | 6 | 0.3% |
| Northern Europe | 3 | 0.1% | View All 4 Rows |
Sex and Age in Houston
Sex and Age in Houston
The most populous age groups in Houston are 20 to 24 Years (170 | 16.2%) for men and 30 to 34 Years (144 | 10.5%) for women.
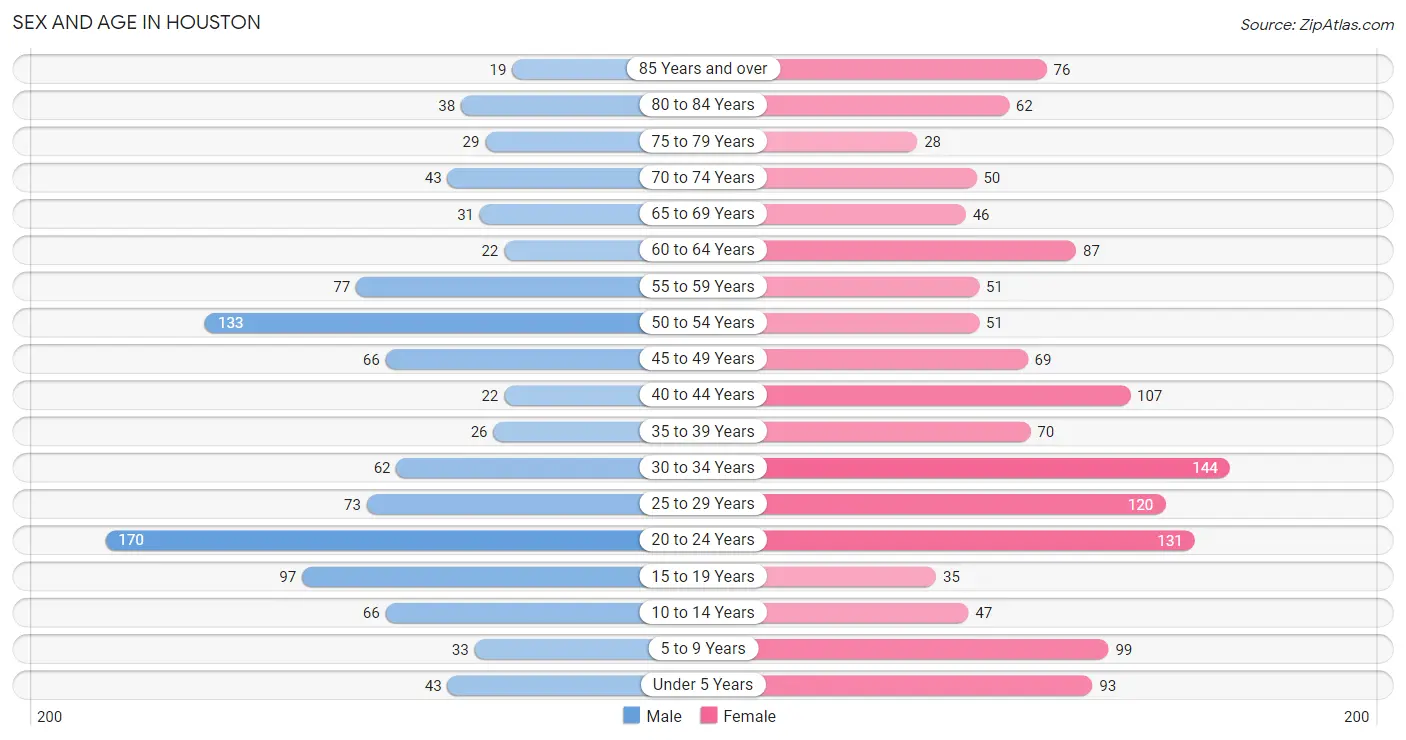
| Age Bracket | Male | Female |
| Under 5 Years | 43 (4.1%) | 93 (6.8%) |
| 5 to 9 Years | 33 (3.1%) | 99 (7.2%) |
| 10 to 14 Years | 66 (6.3%) | 47 (3.4%) |
| 15 to 19 Years | 97 (9.2%) | 35 (2.6%) |
| 20 to 24 Years | 170 (16.2%) | 131 (9.6%) |
| 25 to 29 Years | 73 (7.0%) | 120 (8.8%) |
| 30 to 34 Years | 62 (5.9%) | 144 (10.5%) |
| 35 to 39 Years | 26 (2.5%) | 70 (5.1%) |
| 40 to 44 Years | 22 (2.1%) | 107 (7.8%) |
| 45 to 49 Years | 66 (6.3%) | 69 (5.1%) |
| 50 to 54 Years | 133 (12.7%) | 51 (3.7%) |
| 55 to 59 Years | 77 (7.3%) | 51 (3.7%) |
| 60 to 64 Years | 22 (2.1%) | 87 (6.4%) |
| 65 to 69 Years | 31 (2.9%) | 46 (3.4%) |
| 70 to 74 Years | 43 (4.1%) | 50 (3.7%) |
| 75 to 79 Years | 29 (2.8%) | 28 (2.1%) |
| 80 to 84 Years | 38 (3.6%) | 62 (4.5%) |
| 85 Years and over | 19 (1.8%) | 76 (5.6%) |
| Total | 1,050 (100.0%) | 1,366 (100.0%) |
Families and Households in Houston
Median Family Size in Houston
The median family size in Houston is 2.92 persons per family, with single female/mother families (112 | 20.6%) accounting for the largest median family size of 3.72 persons per family. On the other hand, single male/father families (127 | 23.4%) represent the smallest median family size with 1.89 persons per family.
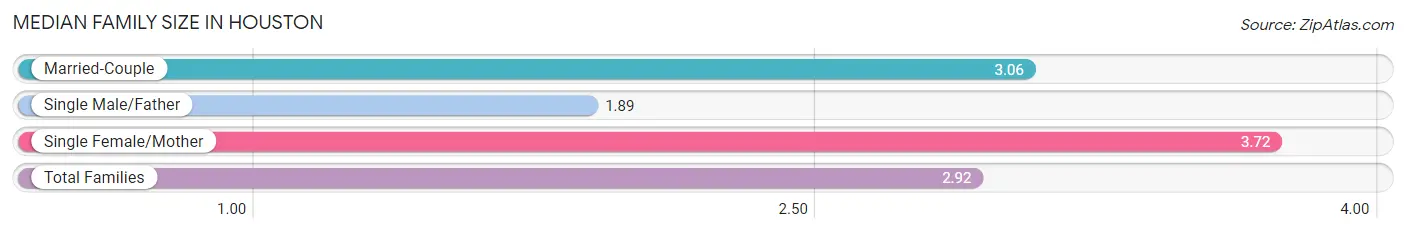
| Family Type | # Families | Family Size |
| Married-Couple | 304 (56.0%) | 3.06 |
| Single Male/Father | 127 (23.4%) | 1.89 |
| Single Female/Mother | 112 (20.6%) | 3.72 |
| Total Families | 543 (100.0%) | 2.92 |
Median Household Size in Houston
The median household size in Houston is 2.46 persons per household, with single female/mother households (112 | 12.0%) accounting for the largest median household size of 3.81 persons per household. non-family households (388 | 41.7%) represent the smallest median household size with 1.58 persons per household.
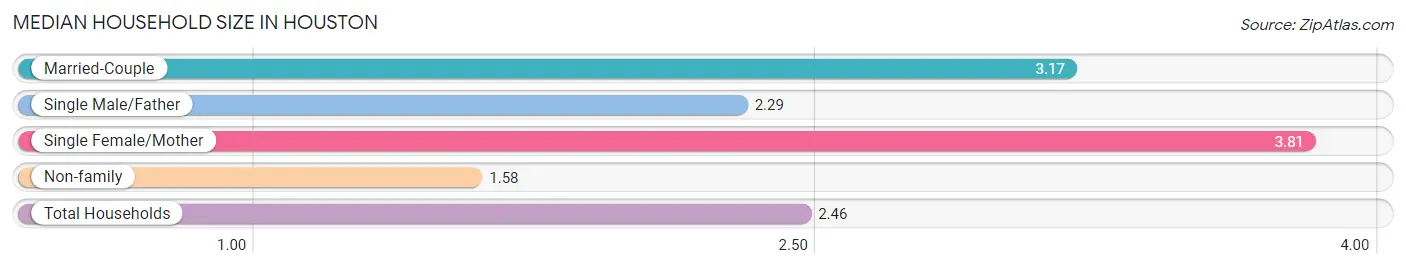
| Household Type | # Households | Household Size |
| Married-Couple | 304 (32.7%) | 3.17 |
| Single Male/Father | 127 (13.6%) | 2.29 |
| Single Female/Mother | 112 (12.0%) | 3.81 |
| Non-family | 388 (41.7%) | 1.58 |
| Total Households | 931 (100.0%) | 2.46 |
Household Size by Marriage Status in Houston
Out of a total of 931 households in Houston, 543 (58.3%) are family households, while 388 (41.7%) are nonfamily households. The most numerous type of family households are 3-person households, comprising 223, and the most common type of nonfamily households are 1-person households, comprising 311.
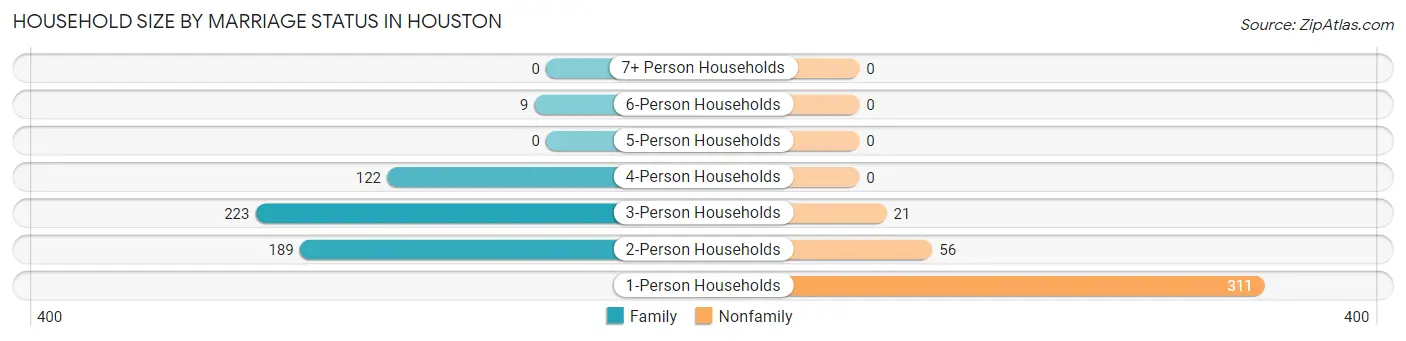
| Household Size | Family Households | Nonfamily Households |
| 1-Person Households | - | 311 (33.4%) |
| 2-Person Households | 189 (20.3%) | 56 (6.0%) |
| 3-Person Households | 223 (23.9%) | 21 (2.3%) |
| 4-Person Households | 122 (13.1%) | 0 (0.0%) |
| 5-Person Households | 0 (0.0%) | 0 (0.0%) |
| 6-Person Households | 9 (1.0%) | 0 (0.0%) |
| 7+ Person Households | 0 (0.0%) | 0 (0.0%) |
| Total | 543 (58.3%) | 388 (41.7%) |
Female Fertility in Houston
Fertility by Age in Houston
Average fertility rate in Houston is 62.0 births per 1,000 women. Women in the age bracket of 20 to 34 years have the highest fertility rate with 106.0 births per 1,000 women. Women in the age bracket of 20 to 34 years acount for 100.0% of all women with births.
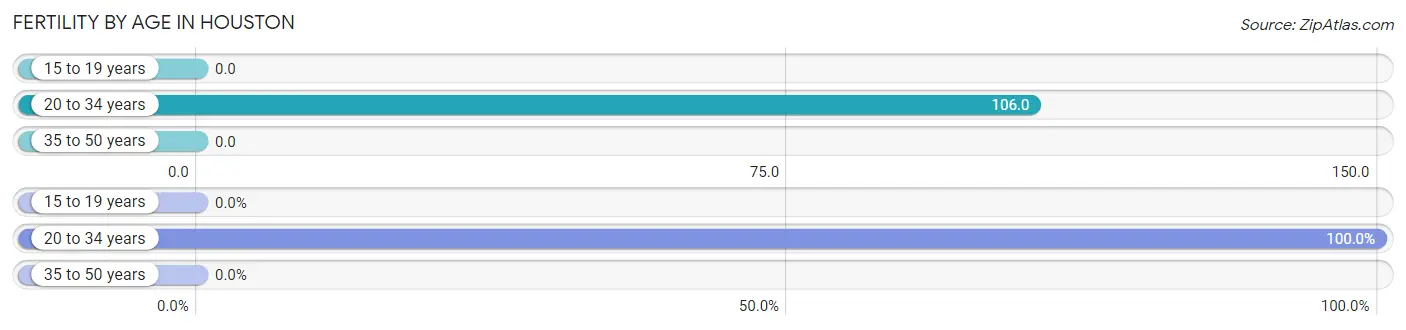
| Age Bracket | Women with Births | Births / 1,000 Women |
| 15 to 19 years | 0 (0.0%) | 0.0 |
| 20 to 34 years | 42 (100.0%) | 106.0 |
| 35 to 50 years | 0 (0.0%) | 0.0 |
| Total | 42 (100.0%) | 62.0 |
Fertility by Age by Marriage Status in Houston
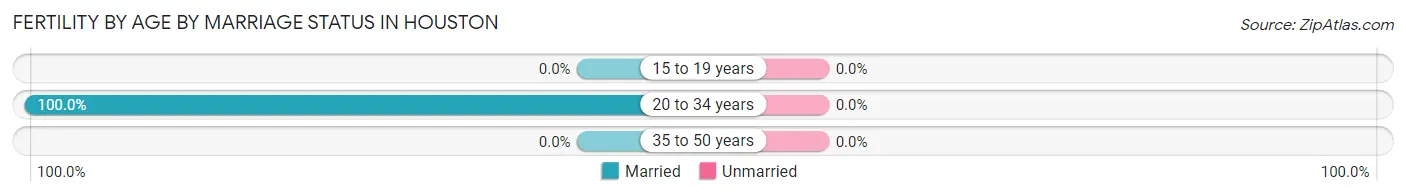
| Age Bracket | Married | Unmarried |
| 15 to 19 years | 0 (0.0%) | 0 (0.0%) |
| 20 to 34 years | 42 (100.0%) | 0 (0.0%) |
| 35 to 50 years | 0 (0.0%) | 0 (0.0%) |
| Total | 42 (100.0%) | 0 (0.0%) |
Fertility by Education in Houston
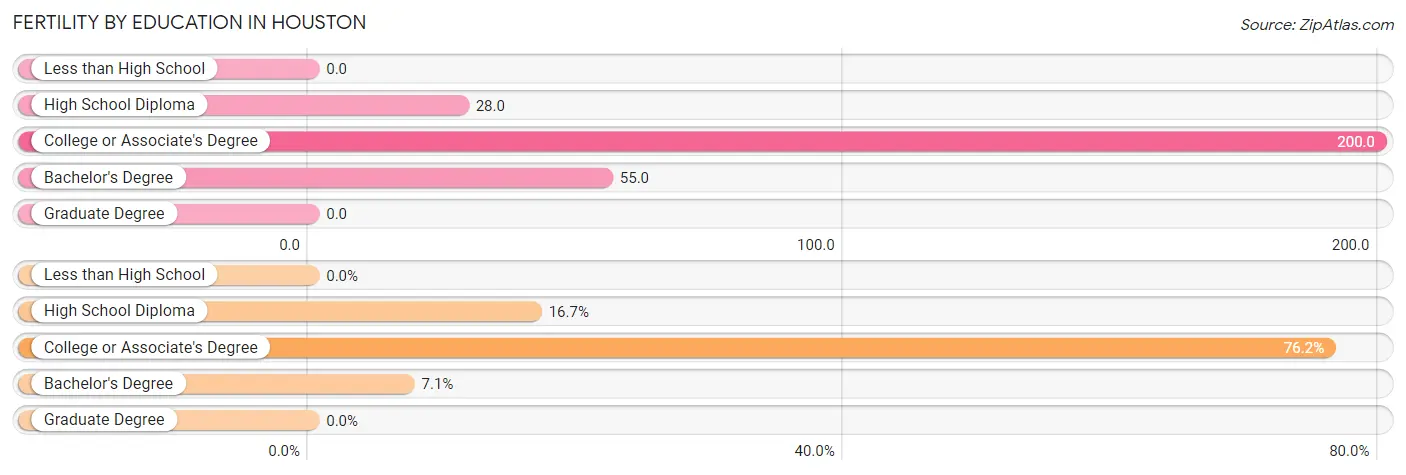
| Educational Attainment | Women with Births | Births / 1,000 Women |
| Less than High School | 0 (0.0%) | 0.0 |
| High School Diploma | 7 (16.7%) | 28.0 |
| College or Associate's Degree | 32 (76.2%) | 200.0 |
| Bachelor's Degree | 3 (7.1%) | 55.0 |
| Graduate Degree | 0 (0.0%) | 0.0 |
| Total | 42 (100.0%) | 62.0 |
Fertility by Education by Marriage Status in Houston
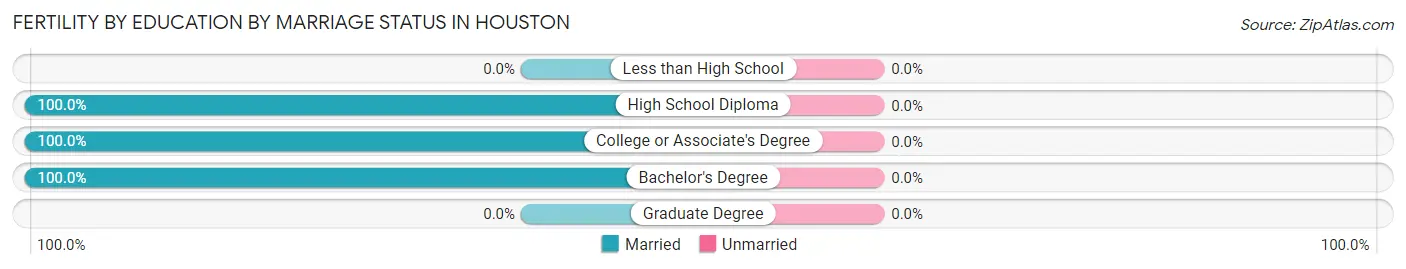
| Educational Attainment | Married | Unmarried |
| Less than High School | 0 (0.0%) | 0 (0.0%) |
| High School Diploma | 7 (100.0%) | 0 (0.0%) |
| College or Associate's Degree | 32 (100.0%) | 0 (0.0%) |
| Bachelor's Degree | 3 (100.0%) | 0 (0.0%) |
| Graduate Degree | 0 (0.0%) | 0 (0.0%) |
| Total | 42 (100.0%) | 0 (0.0%) |
Employment Characteristics in Houston
Employment by Class of Employer in Houston
Among the 1,067 employed individuals in Houston, private company employees (606 | 56.8%), local government employees (162 | 15.2%), and not-for-profit organizations (133 | 12.5%) make up the most common classes of employment.
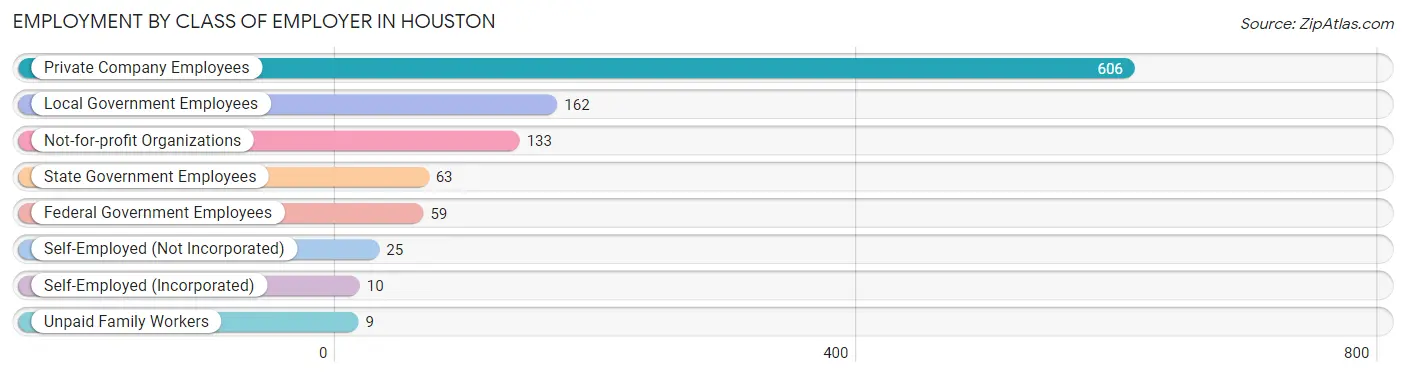
| Employer Class | # Employees | % Employees |
| Private Company Employees | 606 | 56.8% |
| Self-Employed (Incorporated) | 10 | 0.9% |
| Self-Employed (Not Incorporated) | 25 | 2.3% |
| Not-for-profit Organizations | 133 | 12.5% |
| Local Government Employees | 162 | 15.2% |
| State Government Employees | 63 | 5.9% |
| Federal Government Employees | 59 | 5.5% |
| Unpaid Family Workers | 9 | 0.8% |
| Total | 1,067 | 100.0% |
Employment Status by Age in Houston
According to the labor force statistics for Houston, out of the total population over 16 years of age (2,025), 59.2% or 1,199 individuals are in the labor force, with 9.2% or 110 of them unemployed. The age group with the highest labor force participation rate is 20 to 24 years, with 95.7% or 288 individuals in the labor force. Within the labor force, the 30 to 34 years age range has the highest percentage of unemployed individuals, with 31.1% or 55 of them being unemployed.
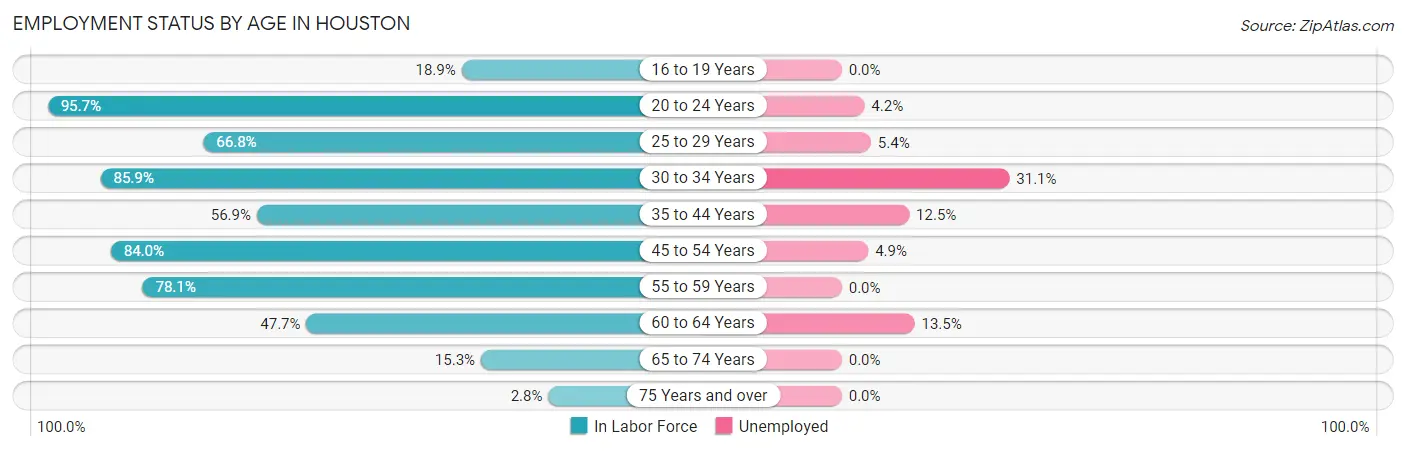
| Age Bracket | In Labor Force | Unemployed |
| 16 to 19 Years | 23 (18.9%) | 0 (0.0%) |
| 20 to 24 Years | 288 (95.7%) | 12 (4.2%) |
| 25 to 29 Years | 129 (66.8%) | 7 (5.4%) |
| 30 to 34 Years | 177 (85.9%) | 55 (31.1%) |
| 35 to 44 Years | 128 (56.9%) | 16 (12.5%) |
| 45 to 54 Years | 268 (84.0%) | 13 (4.9%) |
| 55 to 59 Years | 100 (78.1%) | 0 (0.0%) |
| 60 to 64 Years | 52 (47.7%) | 7 (13.5%) |
| 65 to 74 Years | 26 (15.3%) | 0 (0.0%) |
| 75 Years and over | 7 (2.8%) | 0 (0.0%) |
| Total | 1,199 (59.2%) | 110 (9.2%) |
Employment Status by Educational Attainment in Houston
According to labor force statistics for Houston, 72.4% of individuals (854) out of the total population between 25 and 64 years of age (1,180) are in the labor force, with 11.6% or 99 of them being unemployed. The group with the highest labor force participation rate are those with the educational attainment of bachelor's degree or higher, with 88.4% or 137 individuals in the labor force. Within the labor force, individuals with less than high school education have the highest percentage of unemployment, with 81.8% or 72 of them being unemployed.
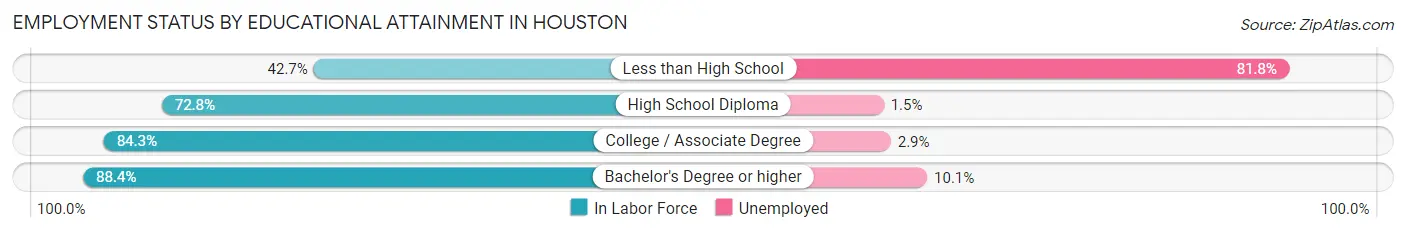
| Educational Attainment | In Labor Force | Unemployed |
| Less than High School | 88 (42.7%) | 169 (81.8%) |
| High School Diploma | 388 (72.8%) | 8 (1.5%) |
| College / Associate Degree | 241 (84.3%) | 8 (2.9%) |
| Bachelor's Degree or higher | 137 (88.4%) | 16 (10.1%) |
| Total | 854 (72.4%) | 137 (11.6%) |
Employment Occupations by Sex in Houston
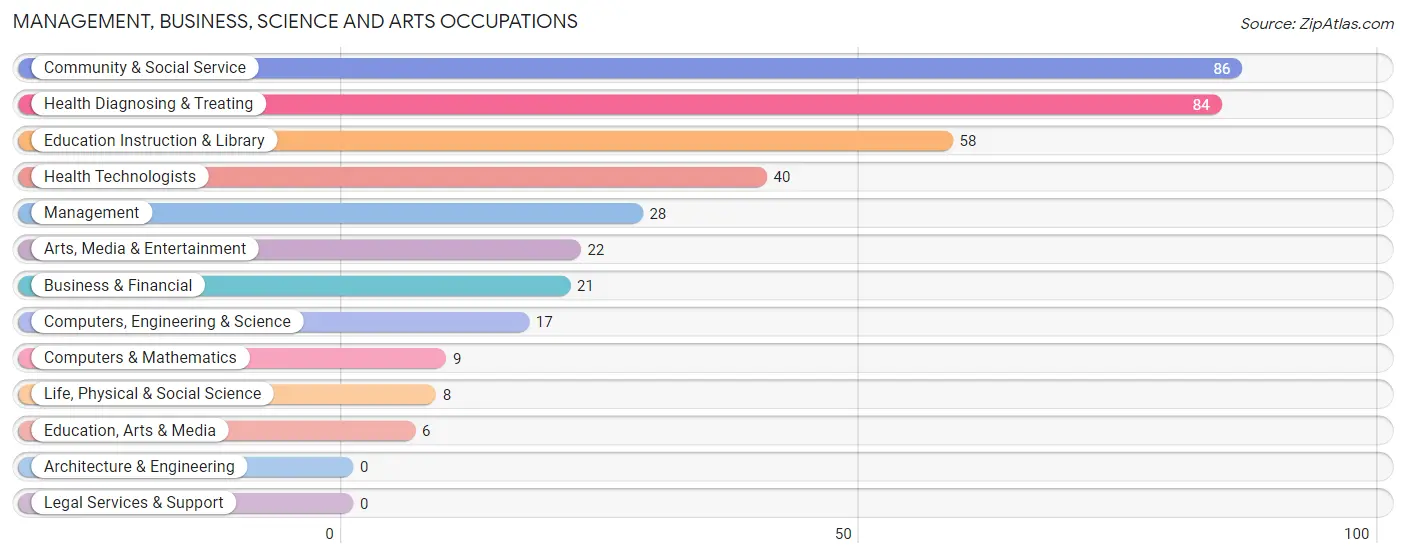
Management, Business, Science and Arts Occupations
The most common Management, Business, Science and Arts occupations in Houston are Community & Social Service (86 | 8.0%), Health Diagnosing & Treating (84 | 7.8%), Education Instruction & Library (58 | 5.4%), Health Technologists (40 | 3.7%), and Management (28 | 2.6%).
Management, Business, Science and Arts Occupations by Sex
Within the Management, Business, Science and Arts occupations in Houston, the most male-oriented occupations are Computers, Engineering & Science (100.0%), Computers & Mathematics (100.0%), and Life, Physical & Social Science (100.0%), while the most female-oriented occupations are Business & Financial (100.0%), Education, Arts & Media (100.0%), and Arts, Media & Entertainment (100.0%).
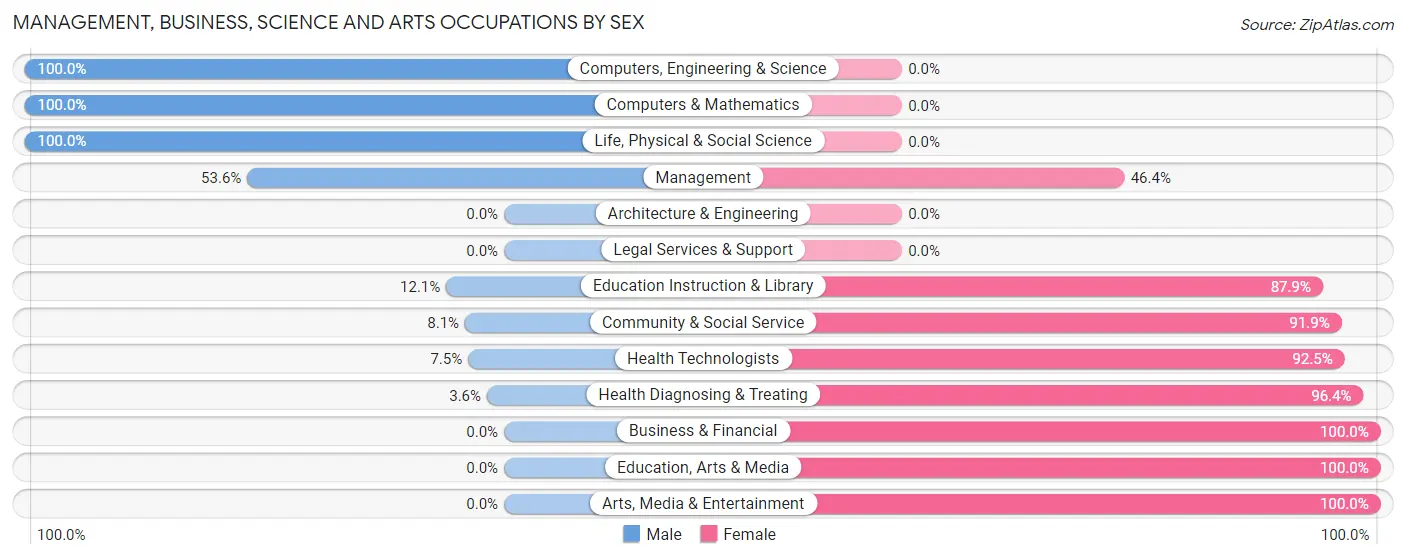
| Occupation | Male | Female |
| Management | 15 (53.6%) | 13 (46.4%) |
| Business & Financial | 0 (0.0%) | 21 (100.0%) |
| Computers, Engineering & Science | 17 (100.0%) | 0 (0.0%) |
| Computers & Mathematics | 9 (100.0%) | 0 (0.0%) |
| Architecture & Engineering | 0 (0.0%) | 0 (0.0%) |
| Life, Physical & Social Science | 8 (100.0%) | 0 (0.0%) |
| Community & Social Service | 7 (8.1%) | 79 (91.9%) |
| Education, Arts & Media | 0 (0.0%) | 6 (100.0%) |
| Legal Services & Support | 0 (0.0%) | 0 (0.0%) |
| Education Instruction & Library | 7 (12.1%) | 51 (87.9%) |
| Arts, Media & Entertainment | 0 (0.0%) | 22 (100.0%) |
| Health Diagnosing & Treating | 3 (3.6%) | 81 (96.4%) |
| Health Technologists | 3 (7.5%) | 37 (92.5%) |
| Total (Category) | 42 (17.8%) | 194 (82.2%) |
| Total (Overall) | 540 (50.0%) | 540 (50.0%) |
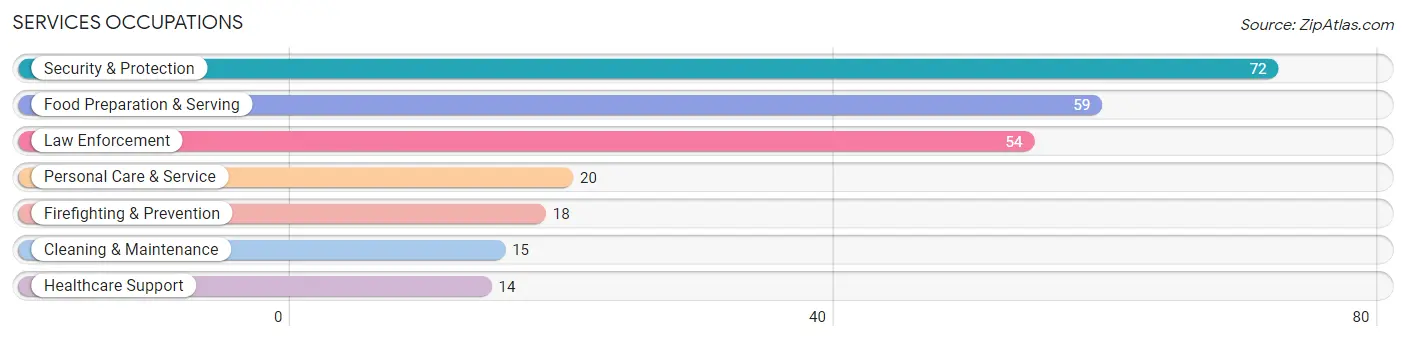
Services Occupations
The most common Services occupations in Houston are Security & Protection (72 | 6.7%), Food Preparation & Serving (59 | 5.5%), Law Enforcement (54 | 5.0%), Personal Care & Service (20 | 1.8%), and Firefighting & Prevention (18 | 1.7%).
Services Occupations by Sex
Within the Services occupations in Houston, the most male-oriented occupations are Security & Protection (100.0%), Firefighting & Prevention (100.0%), and Law Enforcement (100.0%), while the most female-oriented occupations are Healthcare Support (100.0%), Personal Care & Service (100.0%), and Food Preparation & Serving (88.1%).
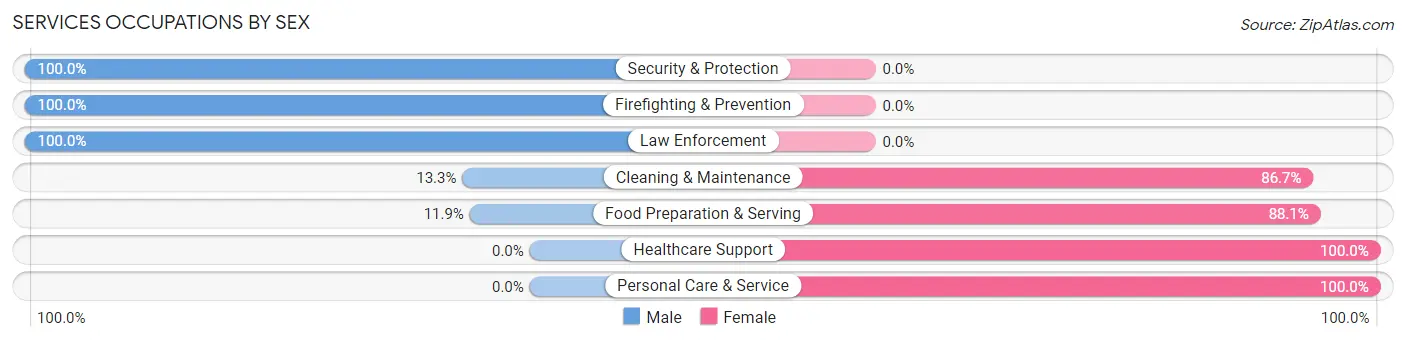
| Occupation | Male | Female |
| Healthcare Support | 0 (0.0%) | 14 (100.0%) |
| Security & Protection | 72 (100.0%) | 0 (0.0%) |
| Firefighting & Prevention | 18 (100.0%) | 0 (0.0%) |
| Law Enforcement | 54 (100.0%) | 0 (0.0%) |
| Food Preparation & Serving | 7 (11.9%) | 52 (88.1%) |
| Cleaning & Maintenance | 2 (13.3%) | 13 (86.7%) |
| Personal Care & Service | 0 (0.0%) | 20 (100.0%) |
| Total (Category) | 81 (45.0%) | 99 (55.0%) |
| Total (Overall) | 540 (50.0%) | 540 (50.0%) |
Sales and Office Occupations
The most common Sales and Office occupations in Houston are Sales & Related (125 | 11.6%), and Office & Administration (110 | 10.2%).

Sales and Office Occupations by Sex
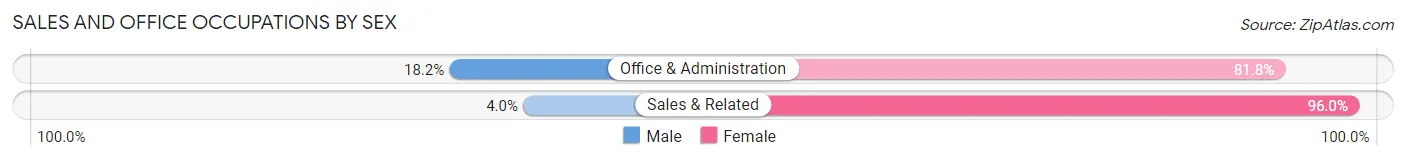
| Occupation | Male | Female |
| Sales & Related | 5 (4.0%) | 120 (96.0%) |
| Office & Administration | 20 (18.2%) | 90 (81.8%) |
| Total (Category) | 25 (10.6%) | 210 (89.4%) |
| Total (Overall) | 540 (50.0%) | 540 (50.0%) |
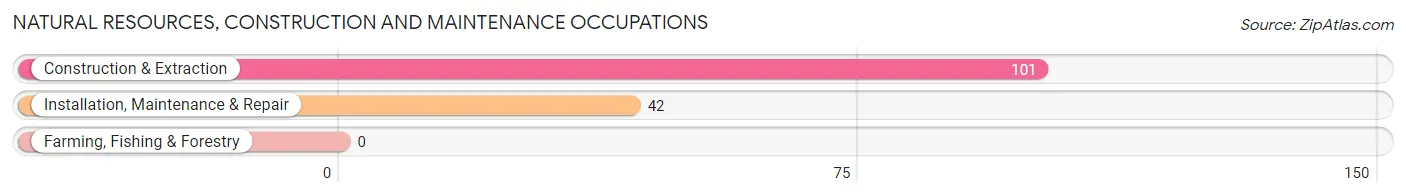
Natural Resources, Construction and Maintenance Occupations
The most common Natural Resources, Construction and Maintenance occupations in Houston are Construction & Extraction (101 | 9.3%), and Installation, Maintenance & Repair (42 | 3.9%).
Natural Resources, Construction and Maintenance Occupations by Sex
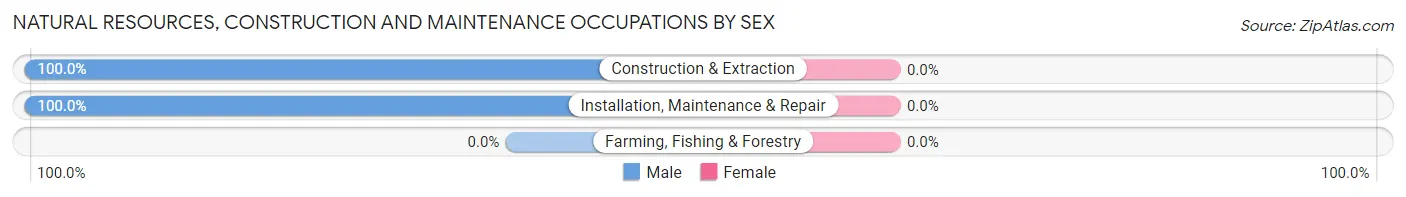
| Occupation | Male | Female |
| Farming, Fishing & Forestry | 0 (0.0%) | 0 (0.0%) |
| Construction & Extraction | 101 (100.0%) | 0 (0.0%) |
| Installation, Maintenance & Repair | 42 (100.0%) | 0 (0.0%) |
| Total (Category) | 143 (100.0%) | 0 (0.0%) |
| Total (Overall) | 540 (50.0%) | 540 (50.0%) |
Production, Transportation and Moving Occupations
The most common Production, Transportation and Moving occupations in Houston are Production (182 | 16.9%), Transportation (63 | 5.8%), and Material Moving (41 | 3.8%).
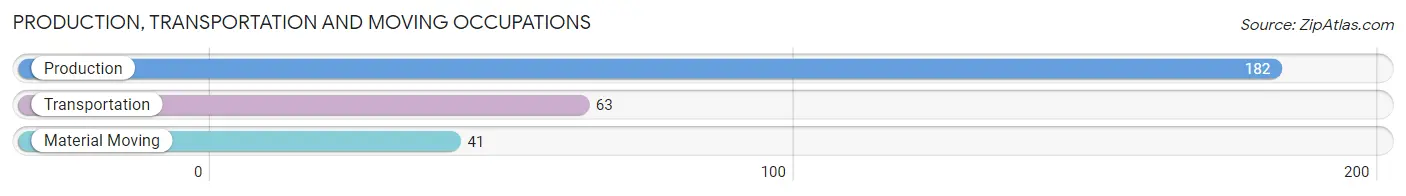
Production, Transportation and Moving Occupations by Sex
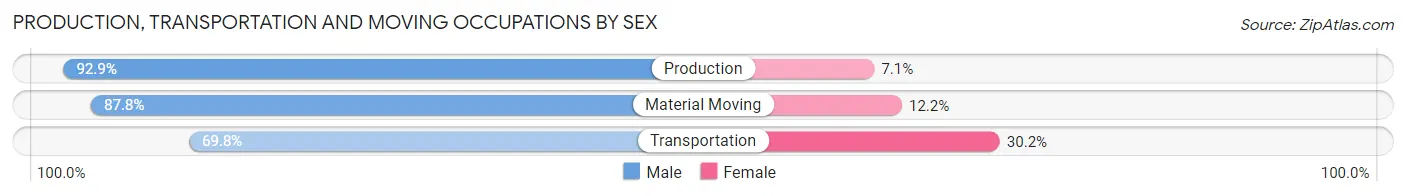
| Occupation | Male | Female |
| Production | 169 (92.9%) | 13 (7.1%) |
| Transportation | 44 (69.8%) | 19 (30.2%) |
| Material Moving | 36 (87.8%) | 5 (12.2%) |
| Total (Category) | 249 (87.1%) | 37 (12.9%) |
| Total (Overall) | 540 (50.0%) | 540 (50.0%) |
Employment Industries by Sex in Houston
Employment Industries in Houston
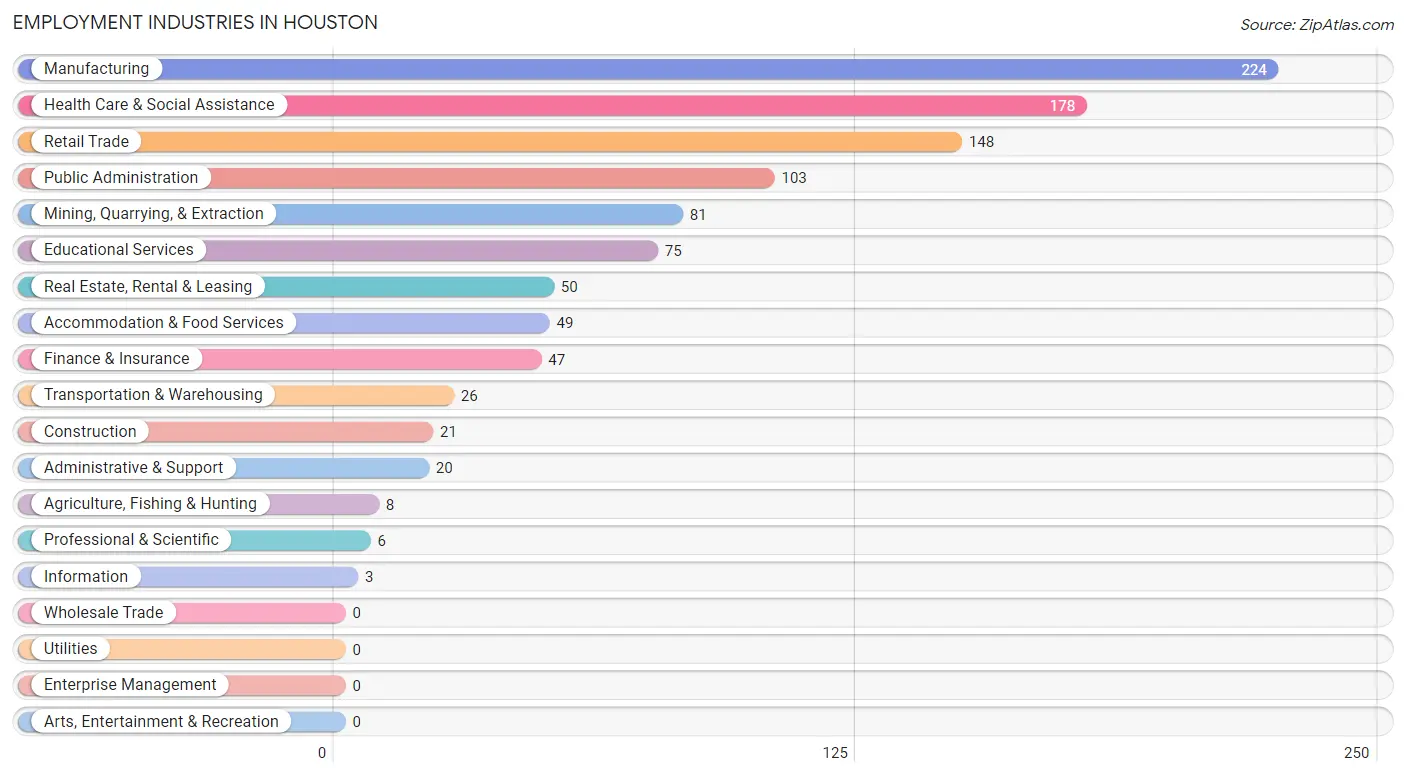
The major employment industries in Houston include Manufacturing (224 | 20.7%), Health Care & Social Assistance (178 | 16.5%), Retail Trade (148 | 13.7%), Public Administration (103 | 9.5%), and Mining, Quarrying, & Extraction (81 | 7.5%).
Employment Industries by Sex in Houston
The Houston industries that see more men than women are Agriculture, Fishing & Hunting (100.0%), Mining, Quarrying, & Extraction (100.0%), and Construction (100.0%), whereas the industries that tend to have a higher number of women are Information (100.0%), Professional & Scientific (100.0%), and Administrative & Support (100.0%).
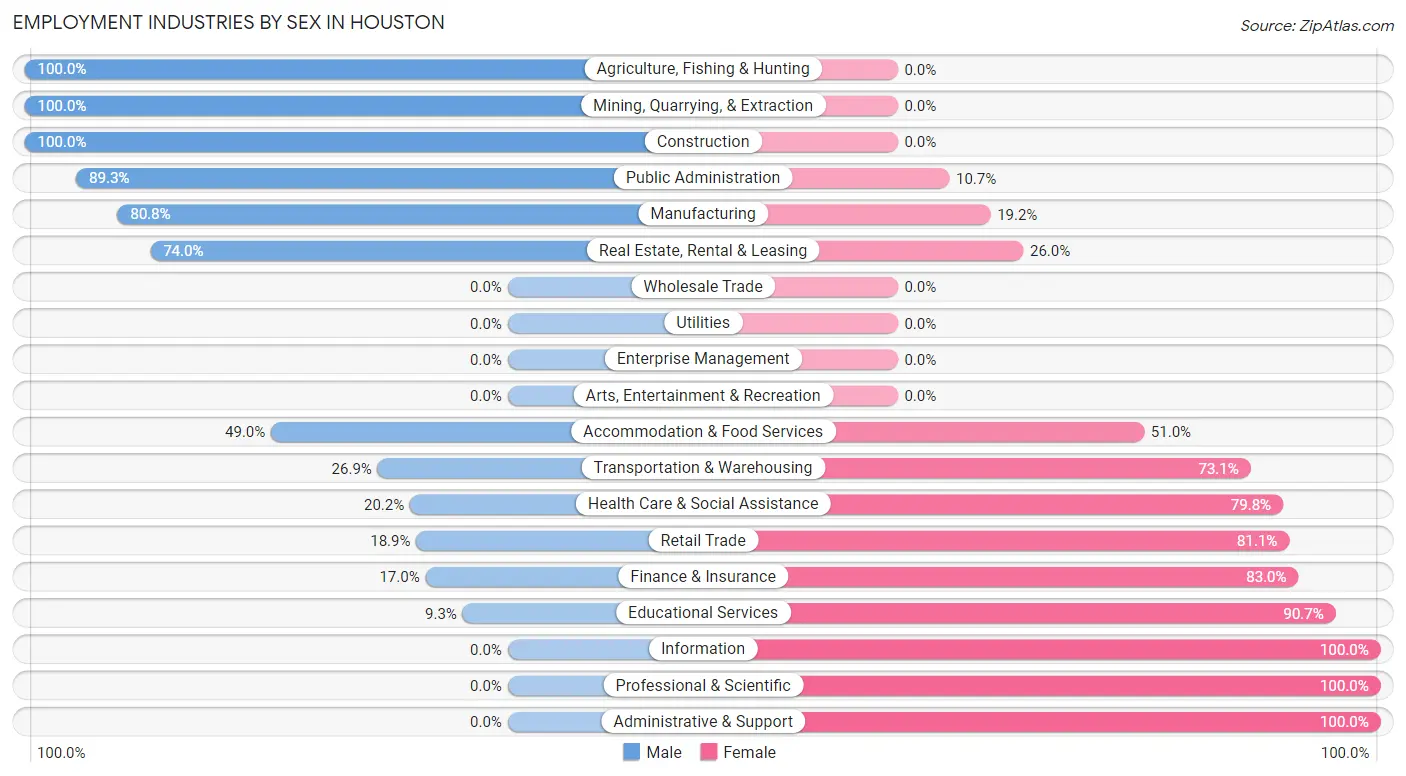
| Industry | Male | Female |
| Agriculture, Fishing & Hunting | 8 (100.0%) | 0 (0.0%) |
| Mining, Quarrying, & Extraction | 81 (100.0%) | 0 (0.0%) |
| Construction | 21 (100.0%) | 0 (0.0%) |
| Manufacturing | 181 (80.8%) | 43 (19.2%) |
| Wholesale Trade | 0 (0.0%) | 0 (0.0%) |
| Retail Trade | 28 (18.9%) | 120 (81.1%) |
| Transportation & Warehousing | 7 (26.9%) | 19 (73.1%) |
| Utilities | 0 (0.0%) | 0 (0.0%) |
| Information | 0 (0.0%) | 3 (100.0%) |
| Finance & Insurance | 8 (17.0%) | 39 (83.0%) |
| Real Estate, Rental & Leasing | 37 (74.0%) | 13 (26.0%) |
| Professional & Scientific | 0 (0.0%) | 6 (100.0%) |
| Enterprise Management | 0 (0.0%) | 0 (0.0%) |
| Administrative & Support | 0 (0.0%) | 20 (100.0%) |
| Educational Services | 7 (9.3%) | 68 (90.7%) |
| Health Care & Social Assistance | 36 (20.2%) | 142 (79.8%) |
| Arts, Entertainment & Recreation | 0 (0.0%) | 0 (0.0%) |
| Accommodation & Food Services | 24 (49.0%) | 25 (51.0%) |
| Public Administration | 92 (89.3%) | 11 (10.7%) |
| Total | 540 (50.0%) | 540 (50.0%) |
Education in Houston
School Enrollment in Houston
The most common levels of schooling among the 358 students in Houston are high school (143 | 39.9%), elementary school (118 | 33.0%), and middle school (31 | 8.7%).
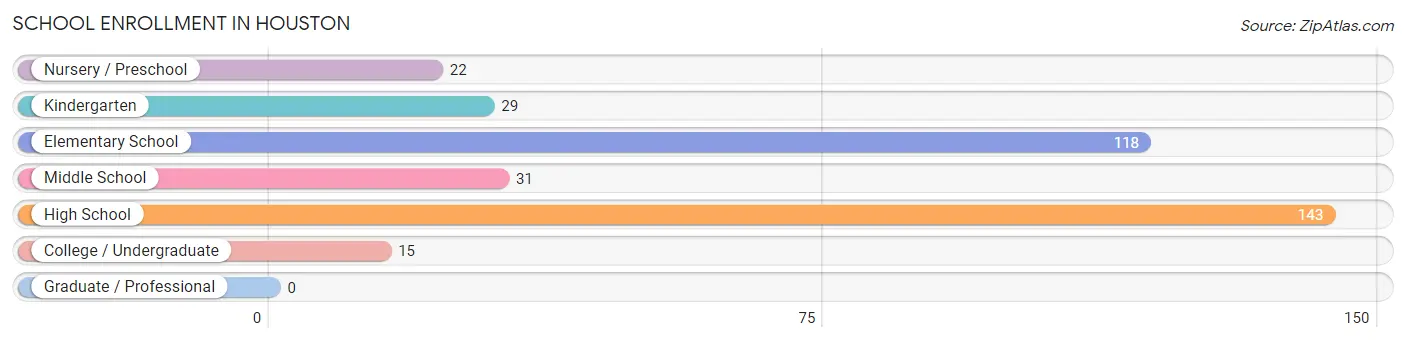
| School Level | # Students | % Students |
| Nursery / Preschool | 22 | 6.1% |
| Kindergarten | 29 | 8.1% |
| Elementary School | 118 | 33.0% |
| Middle School | 31 | 8.7% |
| High School | 143 | 39.9% |
| College / Undergraduate | 15 | 4.2% |
| Graduate / Professional | 0 | 0.0% |
| Total | 358 | 100.0% |
School Enrollment by Age by Funding Source in Houston
Out of a total of 358 students who are enrolled in schools in Houston, 13 (3.6%) attend a private institution, while the remaining 345 (96.4%) are enrolled in public schools. The age group of 35 years and over has the highest likelihood of being enrolled in private schools, with 6 (100.0% in the age bracket) enrolled. Conversely, the age group of 3 to 4 year olds has the lowest likelihood of being enrolled in a private school, with 22 (100.0% in the age bracket) attending a public institution.
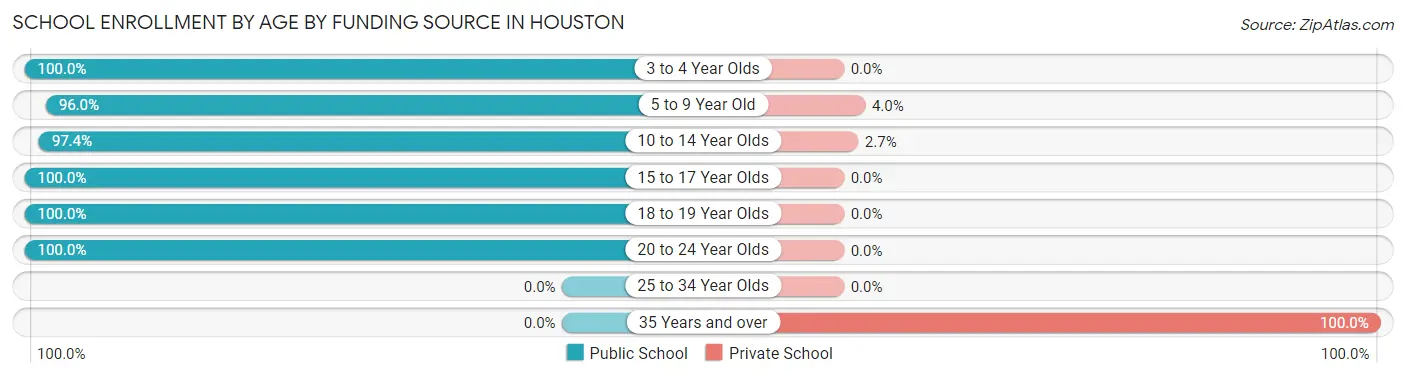
| Age Bracket | Public School | Private School |
| 3 to 4 Year Olds | 22 (100.0%) | 0 (0.0%) |
| 5 to 9 Year Old | 97 (96.0%) | 4 (4.0%) |
| 10 to 14 Year Olds | 110 (97.4%) | 3 (2.6%) |
| 15 to 17 Year Olds | 82 (100.0%) | 0 (0.0%) |
| 18 to 19 Year Olds | 25 (100.0%) | 0 (0.0%) |
| 20 to 24 Year Olds | 9 (100.0%) | 0 (0.0%) |
| 25 to 34 Year Olds | 0 (0.0%) | 0 (0.0%) |
| 35 Years and over | 0 (0.0%) | 6 (100.0%) |
| Total | 345 (96.4%) | 13 (3.6%) |
Educational Attainment by Field of Study in Houston
Education (57 | 19.2%), psychology (43 | 14.5%), bio, nature & agricultural (33 | 11.1%), social sciences (32 | 10.8%), and business (28 | 9.4%) are the most common fields of study among 297 individuals in Houston who have obtained a bachelor's degree or higher.
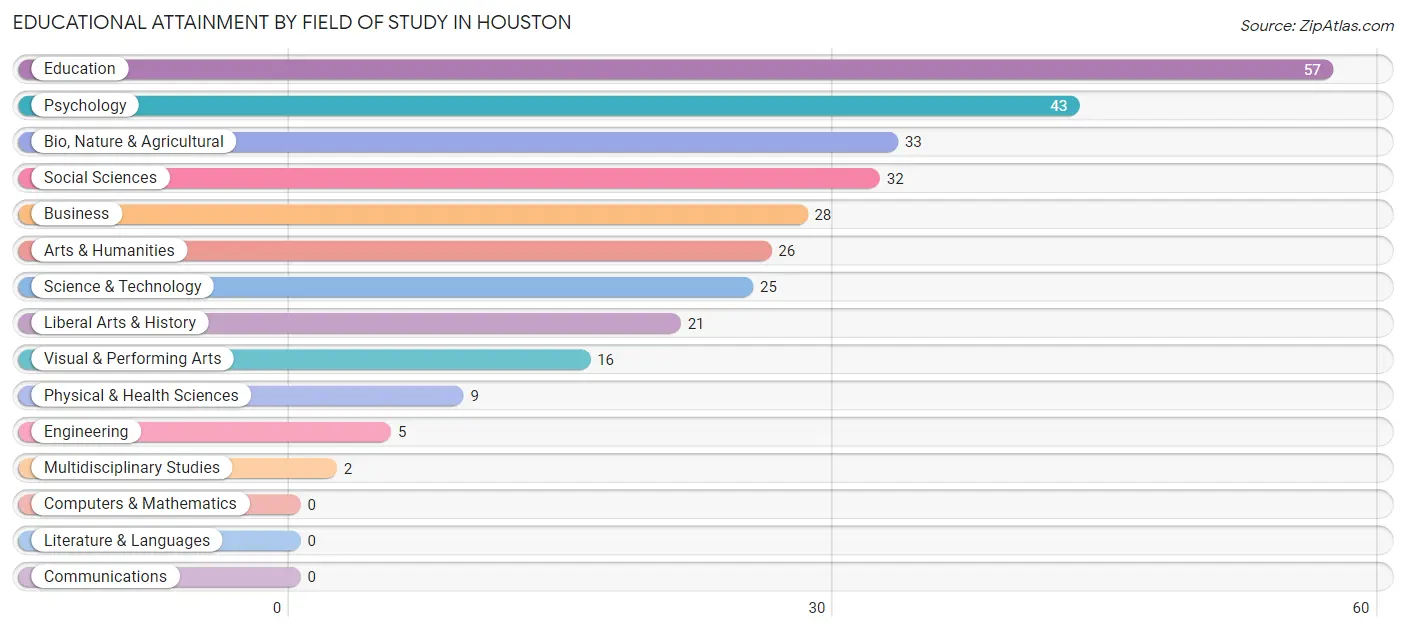
| Field of Study | # Graduates | % Graduates |
| Computers & Mathematics | 0 | 0.0% |
| Bio, Nature & Agricultural | 33 | 11.1% |
| Physical & Health Sciences | 9 | 3.0% |
| Psychology | 43 | 14.5% |
| Social Sciences | 32 | 10.8% |
| Engineering | 5 | 1.7% |
| Multidisciplinary Studies | 2 | 0.7% |
| Science & Technology | 25 | 8.4% |
| Business | 28 | 9.4% |
| Education | 57 | 19.2% |
| Literature & Languages | 0 | 0.0% |
| Liberal Arts & History | 21 | 7.1% |
| Visual & Performing Arts | 16 | 5.4% |
| Communications | 0 | 0.0% |
| Arts & Humanities | 26 | 8.7% |
| Total | 297 | 100.0% |
Transportation & Commute in Houston
Vehicle Availability by Sex in Houston
The most prevalent vehicle ownership categories in Houston are males with 2 vehicles (171, accounting for 32.5%) and females with 2 vehicles (178, making up 31.7%).
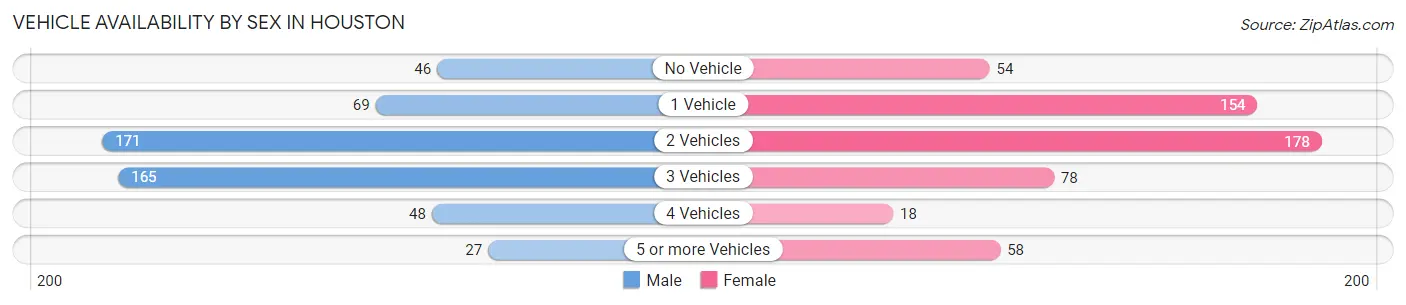
| Vehicles Available | Male | Female |
| No Vehicle | 46 (8.7%) | 54 (10.0%) |
| 1 Vehicle | 69 (13.1%) | 154 (28.5%) |
| 2 Vehicles | 171 (32.5%) | 178 (33.0%) |
| 3 Vehicles | 165 (31.4%) | 78 (14.4%) |
| 4 Vehicles | 48 (9.1%) | 18 (3.3%) |
| 5 or more Vehicles | 27 (5.1%) | 58 (10.7%) |
| Total | 526 (100.0%) | 540 (100.0%) |
Commute Time in Houston
The most frequently occuring commute durations in Houston are 5 to 9 minutes (245 commuters, 23.5%), 15 to 19 minutes (226 commuters, 21.6%), and less than 5 minutes (154 commuters, 14.7%).
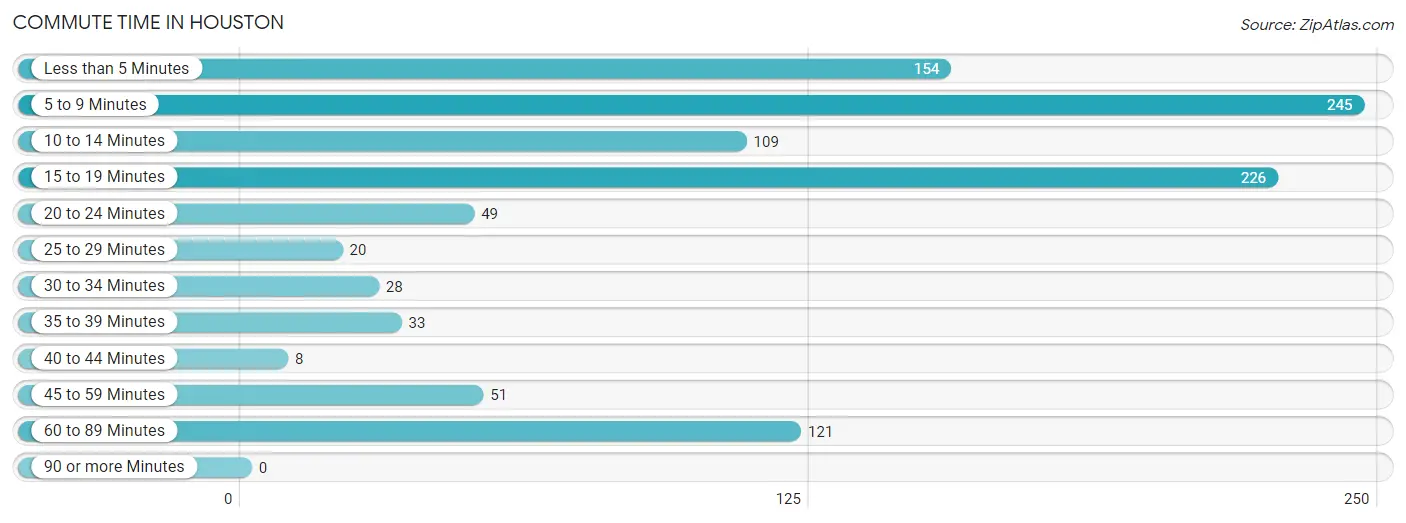
| Commute Time | # Commuters | % Commuters |
| Less than 5 Minutes | 154 | 14.7% |
| 5 to 9 Minutes | 245 | 23.5% |
| 10 to 14 Minutes | 109 | 10.4% |
| 15 to 19 Minutes | 226 | 21.6% |
| 20 to 24 Minutes | 49 | 4.7% |
| 25 to 29 Minutes | 20 | 1.9% |
| 30 to 34 Minutes | 28 | 2.7% |
| 35 to 39 Minutes | 33 | 3.2% |
| 40 to 44 Minutes | 8 | 0.8% |
| 45 to 59 Minutes | 51 | 4.9% |
| 60 to 89 Minutes | 121 | 11.6% |
| 90 or more Minutes | 0 | 0.0% |
Commute Time by Sex in Houston
The most common commute times in Houston are 15 to 19 minutes (120 commuters, 22.8%) for males and 5 to 9 minutes (140 commuters, 27.1%) for females.
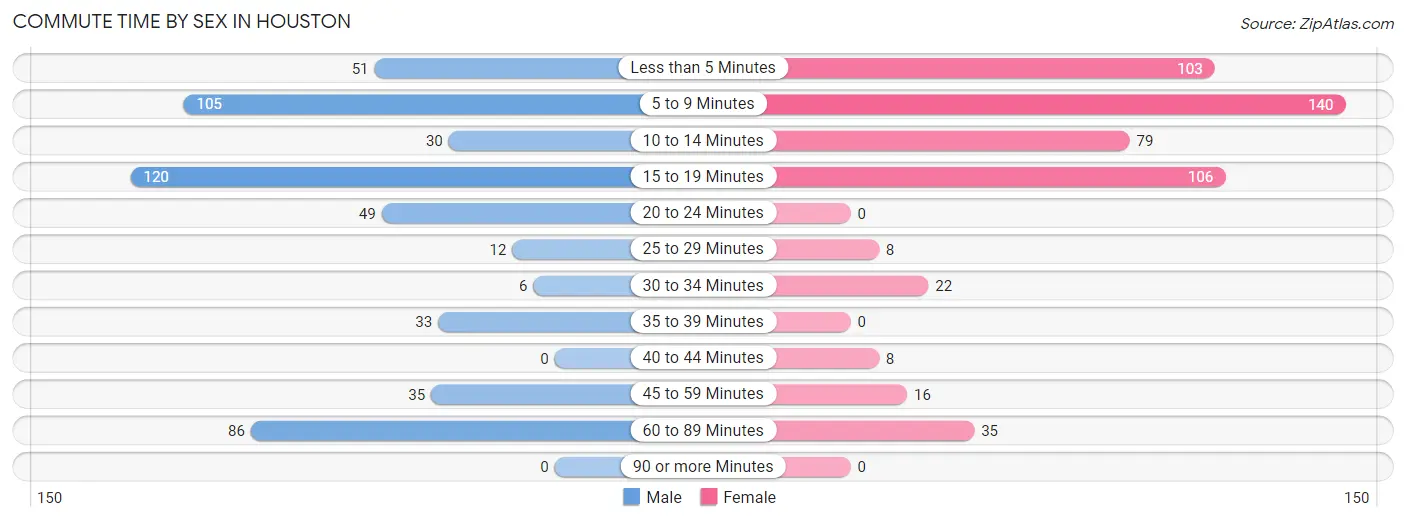
| Commute Time | Male | Female |
| Less than 5 Minutes | 51 (9.7%) | 103 (19.9%) |
| 5 to 9 Minutes | 105 (19.9%) | 140 (27.1%) |
| 10 to 14 Minutes | 30 (5.7%) | 79 (15.3%) |
| 15 to 19 Minutes | 120 (22.8%) | 106 (20.5%) |
| 20 to 24 Minutes | 49 (9.3%) | 0 (0.0%) |
| 25 to 29 Minutes | 12 (2.3%) | 8 (1.5%) |
| 30 to 34 Minutes | 6 (1.1%) | 22 (4.3%) |
| 35 to 39 Minutes | 33 (6.3%) | 0 (0.0%) |
| 40 to 44 Minutes | 0 (0.0%) | 8 (1.5%) |
| 45 to 59 Minutes | 35 (6.6%) | 16 (3.1%) |
| 60 to 89 Minutes | 86 (16.3%) | 35 (6.8%) |
| 90 or more Minutes | 0 (0.0%) | 0 (0.0%) |
Time of Departure to Work by Sex in Houston
The most frequent times of departure to work in Houston are 12:00 PM to 3:59 PM (144, 27.3%) for males and 7:30 AM to 7:59 AM (134, 25.9%) for females.
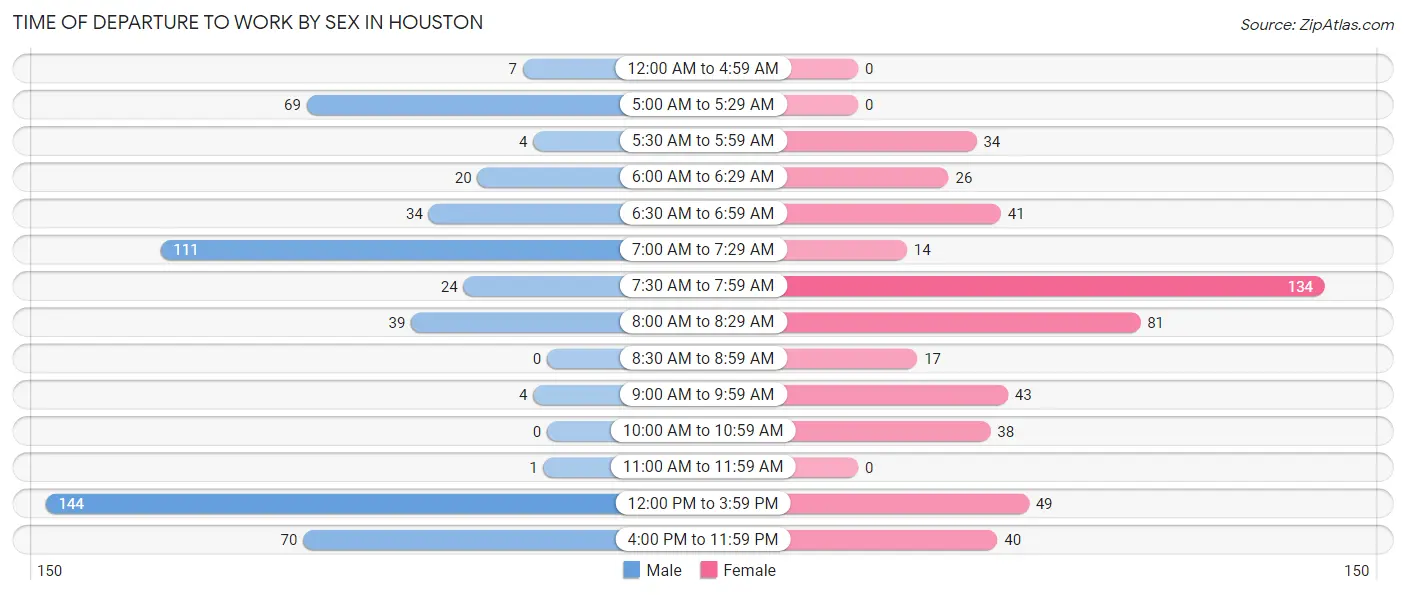
| Time of Departure | Male | Female |
| 12:00 AM to 4:59 AM | 7 (1.3%) | 0 (0.0%) |
| 5:00 AM to 5:29 AM | 69 (13.1%) | 0 (0.0%) |
| 5:30 AM to 5:59 AM | 4 (0.8%) | 34 (6.6%) |
| 6:00 AM to 6:29 AM | 20 (3.8%) | 26 (5.0%) |
| 6:30 AM to 6:59 AM | 34 (6.5%) | 41 (7.9%) |
| 7:00 AM to 7:29 AM | 111 (21.1%) | 14 (2.7%) |
| 7:30 AM to 7:59 AM | 24 (4.5%) | 134 (25.9%) |
| 8:00 AM to 8:29 AM | 39 (7.4%) | 81 (15.7%) |
| 8:30 AM to 8:59 AM | 0 (0.0%) | 17 (3.3%) |
| 9:00 AM to 9:59 AM | 4 (0.8%) | 43 (8.3%) |
| 10:00 AM to 10:59 AM | 0 (0.0%) | 38 (7.3%) |
| 11:00 AM to 11:59 AM | 1 (0.2%) | 0 (0.0%) |
| 12:00 PM to 3:59 PM | 144 (27.3%) | 49 (9.5%) |
| 4:00 PM to 11:59 PM | 70 (13.3%) | 40 (7.7%) |
| Total | 527 (100.0%) | 517 (100.0%) |
Housing Occupancy in Houston
Occupancy by Ownership in Houston
Of the total 931 dwellings in Houston, owner-occupied units account for 531 (57.0%), while renter-occupied units make up 400 (43.0%).
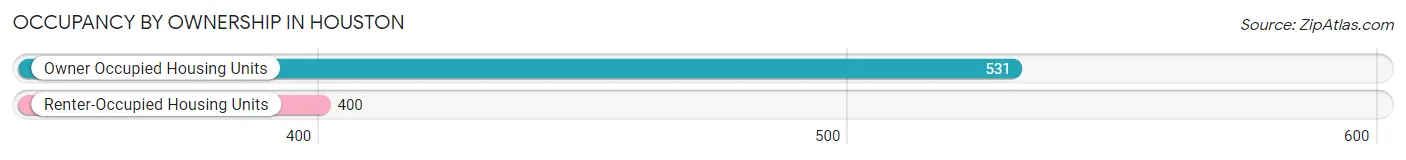
| Occupancy | # Housing Units | % Housing Units |
| Owner Occupied Housing Units | 531 | 57.0% |
| Renter-Occupied Housing Units | 400 | 43.0% |
| Total Occupied Housing Units | 931 | 100.0% |
Occupancy by Household Size in Houston
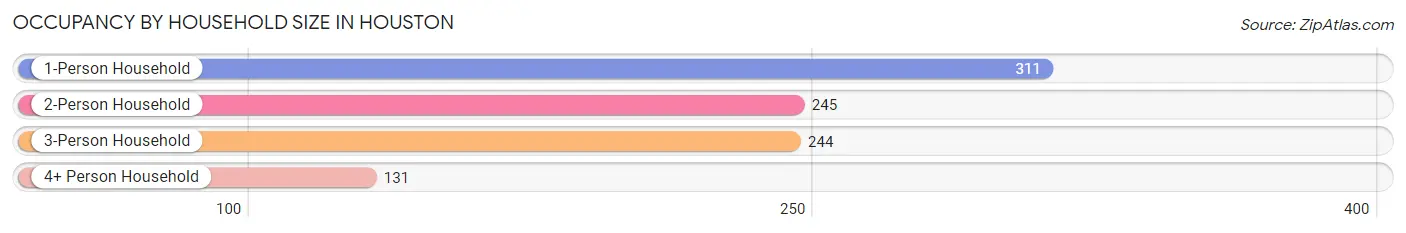
| Household Size | # Housing Units | % Housing Units |
| 1-Person Household | 311 | 33.4% |
| 2-Person Household | 245 | 26.3% |
| 3-Person Household | 244 | 26.2% |
| 4+ Person Household | 131 | 14.1% |
| Total Housing Units | 931 | 100.0% |
Occupancy by Ownership by Household Size in Houston
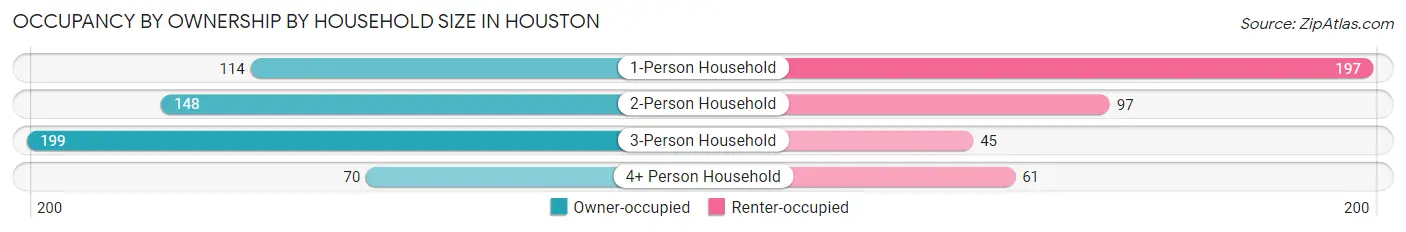
| Household Size | Owner-occupied | Renter-occupied |
| 1-Person Household | 114 (36.7%) | 197 (63.3%) |
| 2-Person Household | 148 (60.4%) | 97 (39.6%) |
| 3-Person Household | 199 (81.6%) | 45 (18.4%) |
| 4+ Person Household | 70 (53.4%) | 61 (46.6%) |
| Total Housing Units | 531 (57.0%) | 400 (43.0%) |
Occupancy by Educational Attainment in Houston
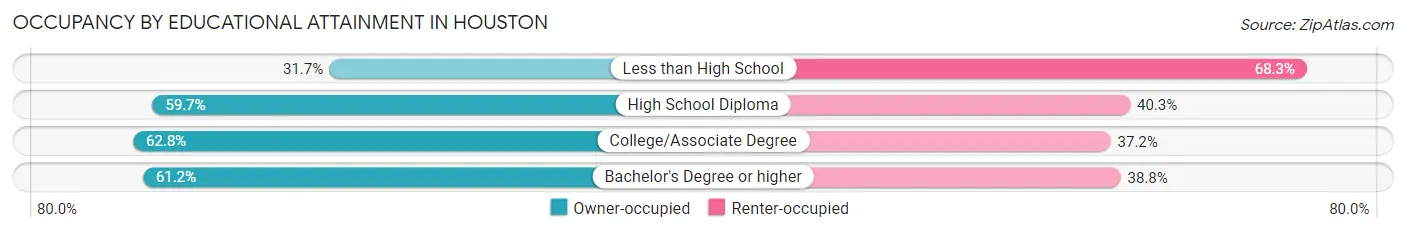
| Household Size | Owner-occupied | Renter-occupied |
| Less than High School | 39 (31.7%) | 84 (68.3%) |
| High School Diploma | 261 (59.7%) | 176 (40.3%) |
| College/Associate Degree | 152 (62.8%) | 90 (37.2%) |
| Bachelor's Degree or higher | 79 (61.2%) | 50 (38.8%) |
Occupancy by Age of Householder in Houston
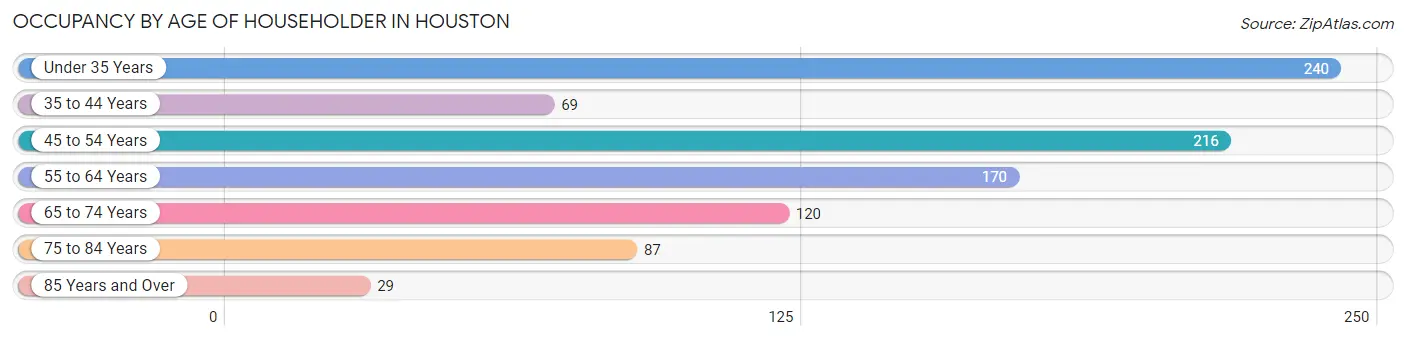
| Age Bracket | # Households | % Households |
| Under 35 Years | 240 | 25.8% |
| 35 to 44 Years | 69 | 7.4% |
| 45 to 54 Years | 216 | 23.2% |
| 55 to 64 Years | 170 | 18.3% |
| 65 to 74 Years | 120 | 12.9% |
| 75 to 84 Years | 87 | 9.3% |
| 85 Years and Over | 29 | 3.1% |
| Total | 931 | 100.0% |
Housing Finances in Houston
Median Income by Occupancy in Houston
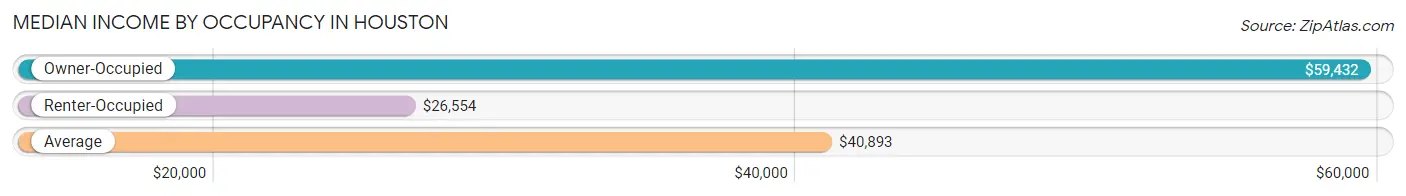
| Occupancy Type | # Households | Median Income |
| Owner-Occupied | 531 (57.0%) | $59,432 |
| Renter-Occupied | 400 (43.0%) | $26,554 |
| Average | 931 (100.0%) | $40,893 |
Occupancy by Householder Income Bracket in Houston
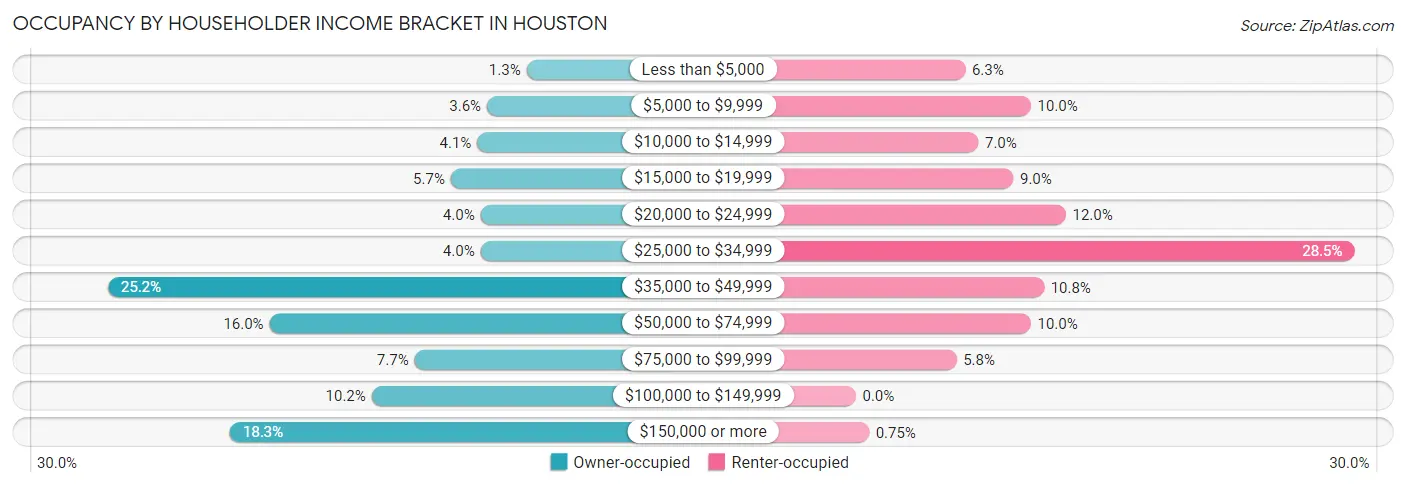
| Income Bracket | Owner-occupied | Renter-occupied |
| Less than $5,000 | 7 (1.3%) | 25 (6.2%) |
| $5,000 to $9,999 | 19 (3.6%) | 40 (10.0%) |
| $10,000 to $14,999 | 22 (4.1%) | 28 (7.0%) |
| $15,000 to $19,999 | 30 (5.7%) | 36 (9.0%) |
| $20,000 to $24,999 | 21 (4.0%) | 48 (12.0%) |
| $25,000 to $34,999 | 21 (4.0%) | 114 (28.5%) |
| $35,000 to $49,999 | 134 (25.2%) | 43 (10.7%) |
| $50,000 to $74,999 | 85 (16.0%) | 40 (10.0%) |
| $75,000 to $99,999 | 41 (7.7%) | 23 (5.8%) |
| $100,000 to $149,999 | 54 (10.2%) | 0 (0.0%) |
| $150,000 or more | 97 (18.3%) | 3 (0.7%) |
| Total | 531 (100.0%) | 400 (100.0%) |
Monthly Housing Cost Tiers in Houston
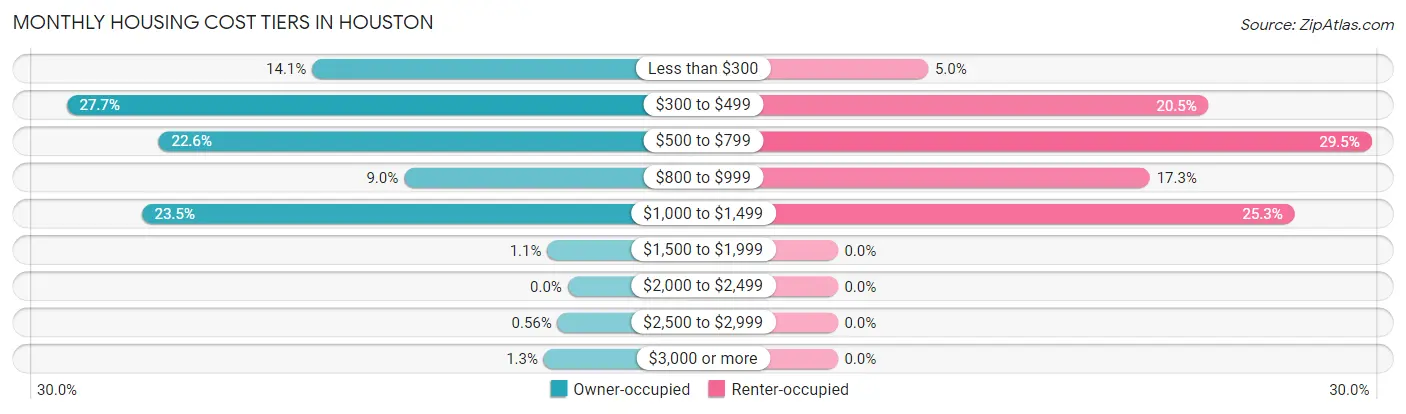
| Monthly Cost | Owner-occupied | Renter-occupied |
| Less than $300 | 75 (14.1%) | 20 (5.0%) |
| $300 to $499 | 147 (27.7%) | 82 (20.5%) |
| $500 to $799 | 120 (22.6%) | 118 (29.5%) |
| $800 to $999 | 48 (9.0%) | 69 (17.2%) |
| $1,000 to $1,499 | 125 (23.5%) | 101 (25.3%) |
| $1,500 to $1,999 | 6 (1.1%) | 0 (0.0%) |
| $2,000 to $2,499 | 0 (0.0%) | 0 (0.0%) |
| $2,500 to $2,999 | 3 (0.6%) | 0 (0.0%) |
| $3,000 or more | 7 (1.3%) | 0 (0.0%) |
| Total | 531 (100.0%) | 400 (100.0%) |
Physical Housing Characteristics in Houston
Housing Structures in Houston
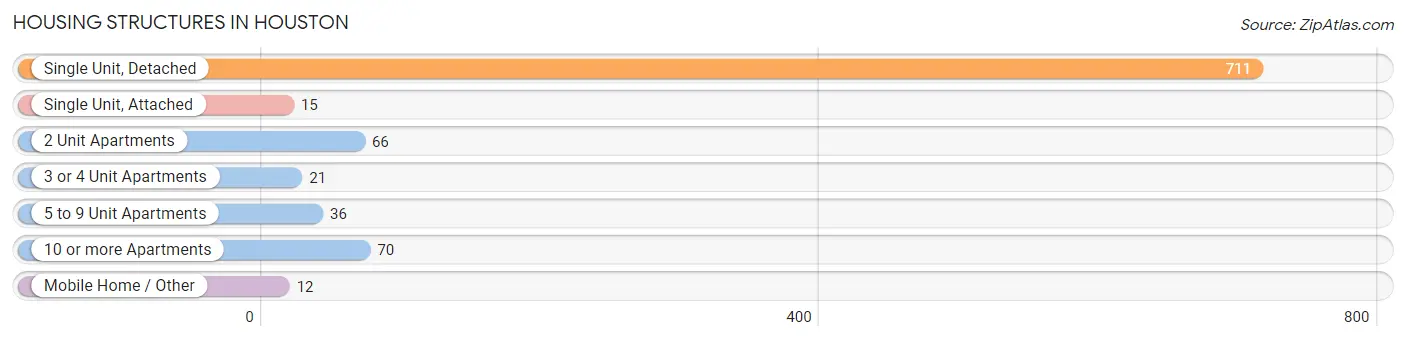
| Structure Type | # Housing Units | % Housing Units |
| Single Unit, Detached | 711 | 76.4% |
| Single Unit, Attached | 15 | 1.6% |
| 2 Unit Apartments | 66 | 7.1% |
| 3 or 4 Unit Apartments | 21 | 2.3% |
| 5 to 9 Unit Apartments | 36 | 3.9% |
| 10 or more Apartments | 70 | 7.5% |
| Mobile Home / Other | 12 | 1.3% |
| Total | 931 | 100.0% |
Housing Structures by Occupancy in Houston
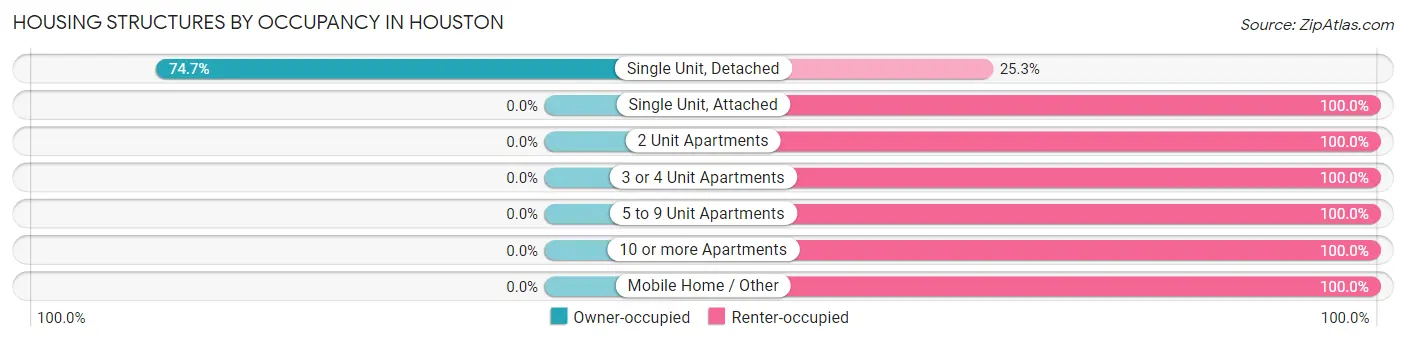
| Structure Type | Owner-occupied | Renter-occupied |
| Single Unit, Detached | 531 (74.7%) | 180 (25.3%) |
| Single Unit, Attached | 0 (0.0%) | 15 (100.0%) |
| 2 Unit Apartments | 0 (0.0%) | 66 (100.0%) |
| 3 or 4 Unit Apartments | 0 (0.0%) | 21 (100.0%) |
| 5 to 9 Unit Apartments | 0 (0.0%) | 36 (100.0%) |
| 10 or more Apartments | 0 (0.0%) | 70 (100.0%) |
| Mobile Home / Other | 0 (0.0%) | 12 (100.0%) |
| Total | 531 (57.0%) | 400 (43.0%) |
Housing Structures by Number of Rooms in Houston
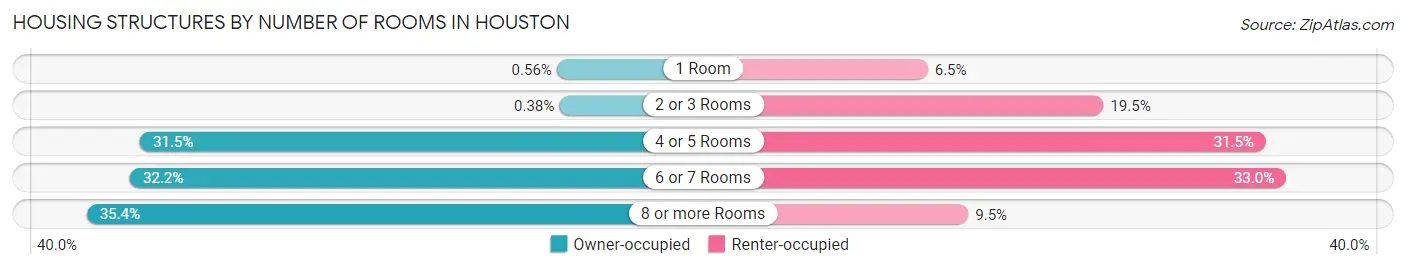
| Number of Rooms | Owner-occupied | Renter-occupied |
| 1 Room | 3 (0.6%) | 26 (6.5%) |
| 2 or 3 Rooms | 2 (0.4%) | 78 (19.5%) |
| 4 or 5 Rooms | 167 (31.5%) | 126 (31.5%) |
| 6 or 7 Rooms | 171 (32.2%) | 132 (33.0%) |
| 8 or more Rooms | 188 (35.4%) | 38 (9.5%) |
| Total | 531 (100.0%) | 400 (100.0%) |
Housing Structure by Heating Type in Houston
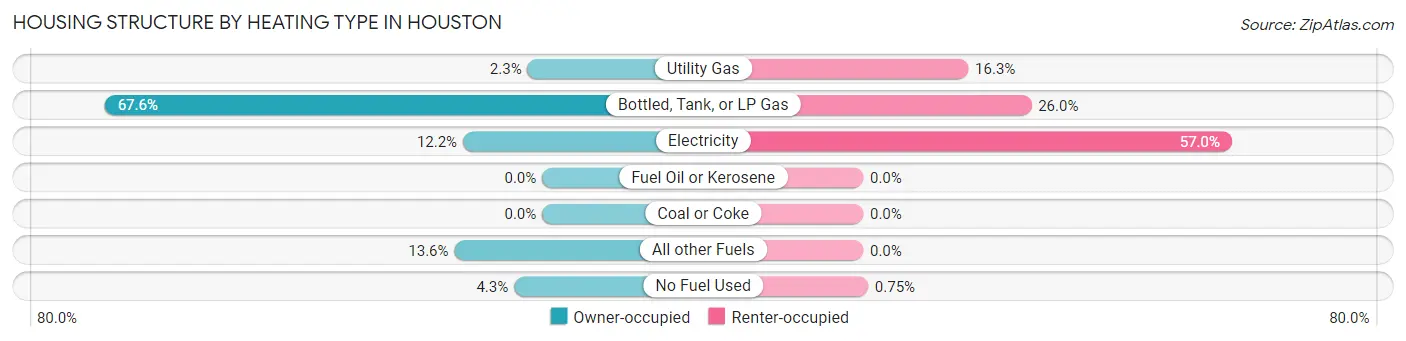
| Heating Type | Owner-occupied | Renter-occupied |
| Utility Gas | 12 (2.3%) | 65 (16.3%) |
| Bottled, Tank, or LP Gas | 359 (67.6%) | 104 (26.0%) |
| Electricity | 65 (12.2%) | 228 (57.0%) |
| Fuel Oil or Kerosene | 0 (0.0%) | 0 (0.0%) |
| Coal or Coke | 0 (0.0%) | 0 (0.0%) |
| All other Fuels | 72 (13.6%) | 0 (0.0%) |
| No Fuel Used | 23 (4.3%) | 3 (0.7%) |
| Total | 531 (100.0%) | 400 (100.0%) |
Household Vehicle Usage in Houston
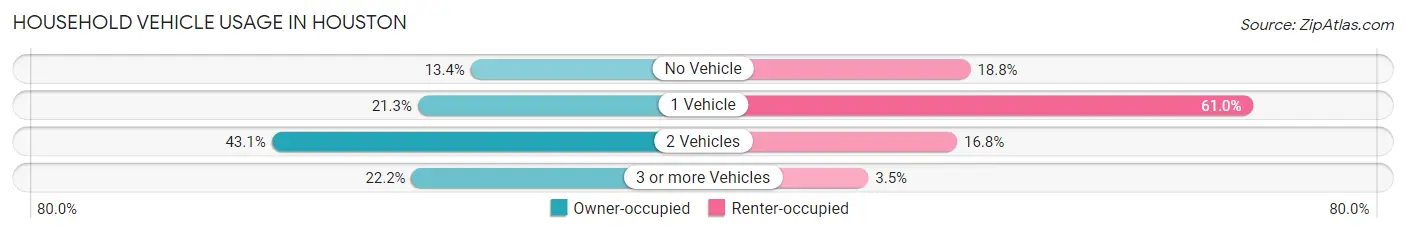
| Vehicles per Household | Owner-occupied | Renter-occupied |
| No Vehicle | 71 (13.4%) | 75 (18.8%) |
| 1 Vehicle | 113 (21.3%) | 244 (61.0%) |
| 2 Vehicles | 229 (43.1%) | 67 (16.8%) |
| 3 or more Vehicles | 118 (22.2%) | 14 (3.5%) |
| Total | 531 (100.0%) | 400 (100.0%) |
Real Estate & Mortgages in Houston
Real Estate and Mortgage Overview in Houston
| Characteristic | Without Mortgage | With Mortgage |
| Housing Units | 289 | 242 |
| Median Property Value | $85,800 | $129,700 |
| Median Household Income | - | - |
| Monthly Housing Costs | $433 | $7 |
| Real Estate Taxes | $470 | $32 |
Property Value by Mortgage Status in Houston
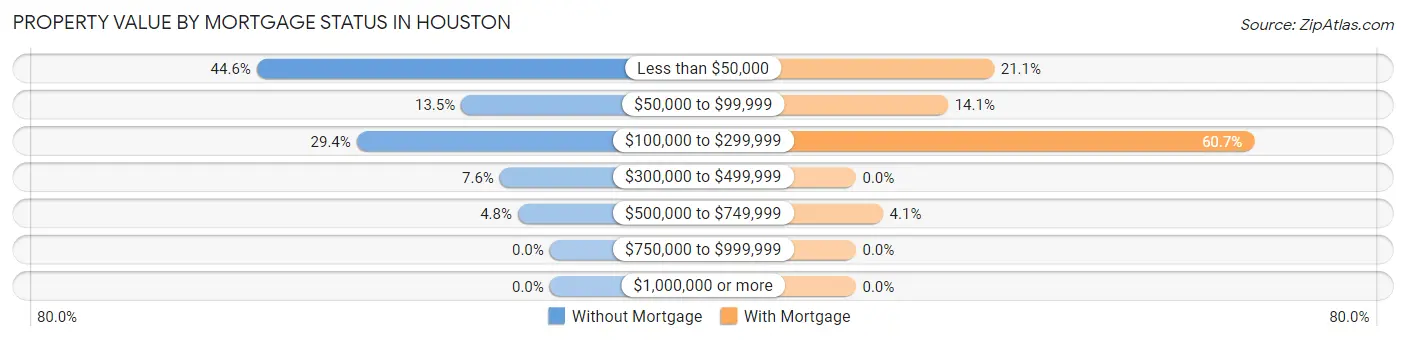
| Property Value | Without Mortgage | With Mortgage |
| Less than $50,000 | 129 (44.6%) | 51 (21.1%) |
| $50,000 to $99,999 | 39 (13.5%) | 34 (14.1%) |
| $100,000 to $299,999 | 85 (29.4%) | 147 (60.7%) |
| $300,000 to $499,999 | 22 (7.6%) | 0 (0.0%) |
| $500,000 to $749,999 | 14 (4.8%) | 10 (4.1%) |
| $750,000 to $999,999 | 0 (0.0%) | 0 (0.0%) |
| $1,000,000 or more | 0 (0.0%) | 0 (0.0%) |
| Total | 289 (100.0%) | 242 (100.0%) |
Household Income by Mortgage Status in Houston
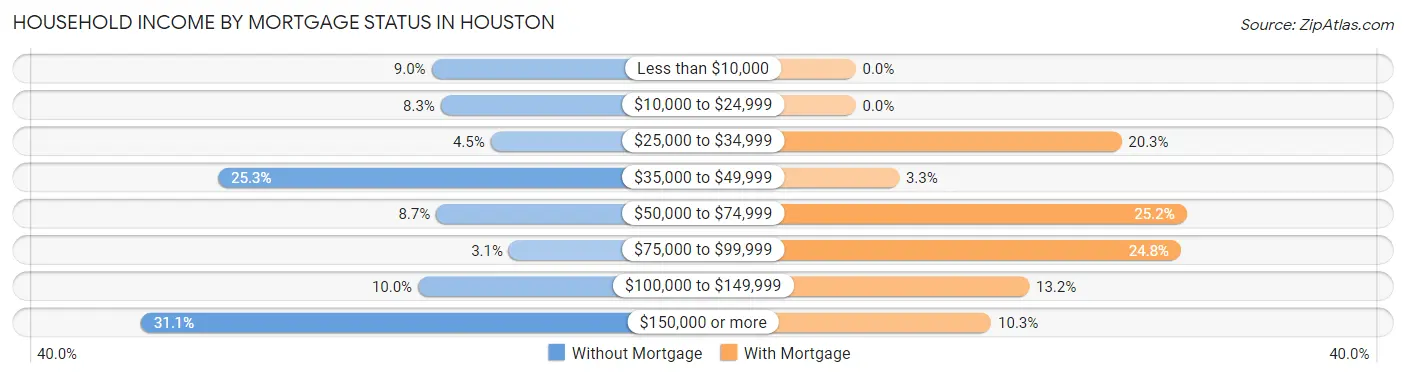
| Household Income | Without Mortgage | With Mortgage |
| Less than $10,000 | 26 (9.0%) | 0 (0.0%) |
| $10,000 to $24,999 | 24 (8.3%) | 0 (0.0%) |
| $25,000 to $34,999 | 13 (4.5%) | 49 (20.3%) |
| $35,000 to $49,999 | 73 (25.3%) | 8 (3.3%) |
| $50,000 to $74,999 | 25 (8.6%) | 61 (25.2%) |
| $75,000 to $99,999 | 9 (3.1%) | 60 (24.8%) |
| $100,000 to $149,999 | 29 (10.0%) | 32 (13.2%) |
| $150,000 or more | 90 (31.1%) | 25 (10.3%) |
| Total | 289 (100.0%) | 242 (100.0%) |
Property Value to Household Income Ratio in Houston
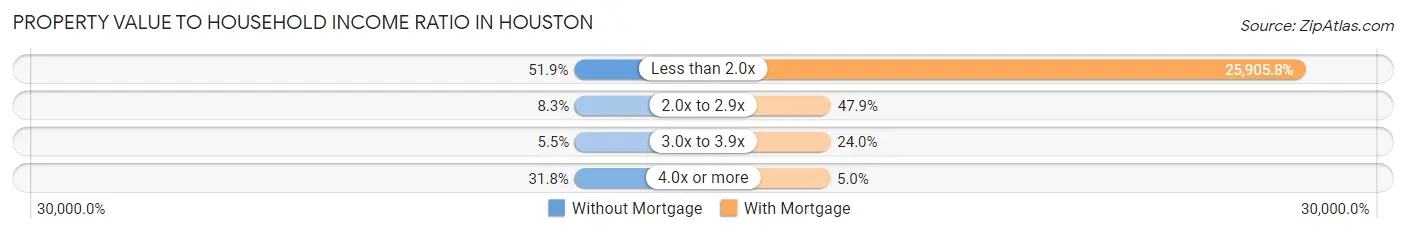
| Value-to-Income Ratio | Without Mortgage | With Mortgage |
| Less than 2.0x | 150 (51.9%) | 62,692 (25,905.8%) |
| 2.0x to 2.9x | 24 (8.3%) | 116 (47.9%) |
| 3.0x to 3.9x | 16 (5.5%) | 58 (24.0%) |
| 4.0x or more | 92 (31.8%) | 12 (5.0%) |
| Total | 289 (100.0%) | 242 (100.0%) |
Real Estate Taxes by Mortgage Status in Houston
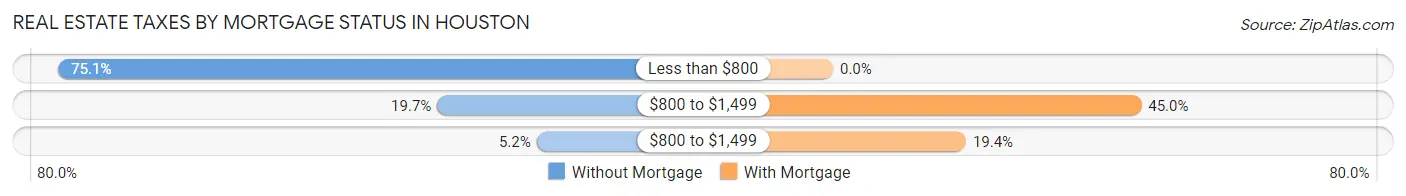
| Property Taxes | Without Mortgage | With Mortgage |
| Less than $800 | 217 (75.1%) | 0 (0.0%) |
| $800 to $1,499 | 57 (19.7%) | 109 (45.0%) |
| $800 to $1,499 | 15 (5.2%) | 47 (19.4%) |
| Total | 289 (100.0%) | 242 (100.0%) |
Health & Disability in Houston
Health Insurance Coverage by Age in Houston
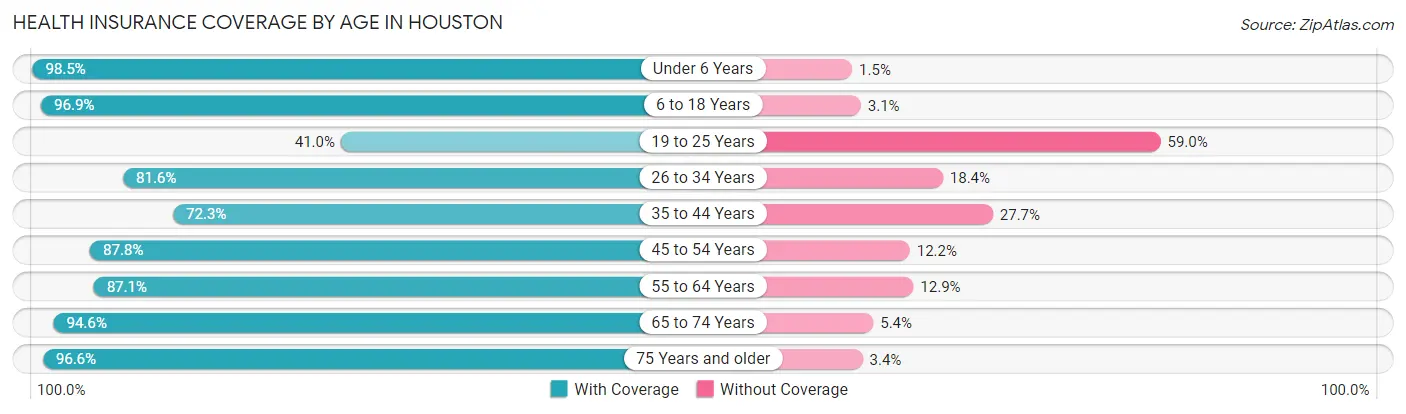
| Age Bracket | With Coverage | Without Coverage |
| Under 6 Years | 134 (98.5%) | 2 (1.5%) |
| 6 to 18 Years | 345 (96.9%) | 11 (3.1%) |
| 19 to 25 Years | 135 (41.0%) | 194 (59.0%) |
| 26 to 34 Years | 302 (81.6%) | 68 (18.4%) |
| 35 to 44 Years | 154 (72.3%) | 59 (27.7%) |
| 45 to 54 Years | 273 (87.8%) | 38 (12.2%) |
| 55 to 64 Years | 196 (87.1%) | 29 (12.9%) |
| 65 to 74 Years | 140 (94.6%) | 8 (5.4%) |
| 75 Years and older | 198 (96.6%) | 7 (3.4%) |
| Total | 1,877 (81.9%) | 416 (18.1%) |
Health Insurance Coverage by Citizenship Status in Houston
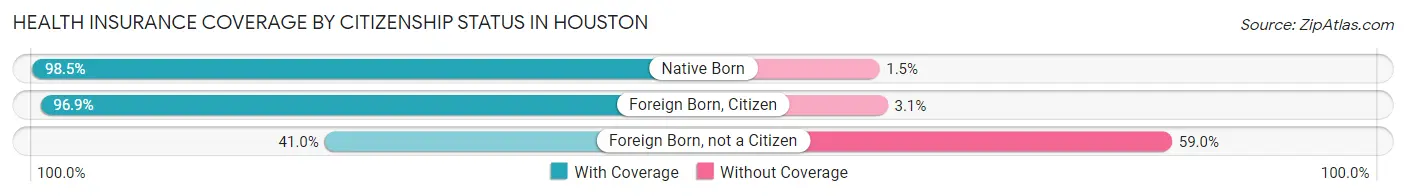
| Citizenship Status | With Coverage | Without Coverage |
| Native Born | 134 (98.5%) | 2 (1.5%) |
| Foreign Born, Citizen | 345 (96.9%) | 11 (3.1%) |
| Foreign Born, not a Citizen | 135 (41.0%) | 194 (59.0%) |
Health Insurance Coverage by Household Income in Houston
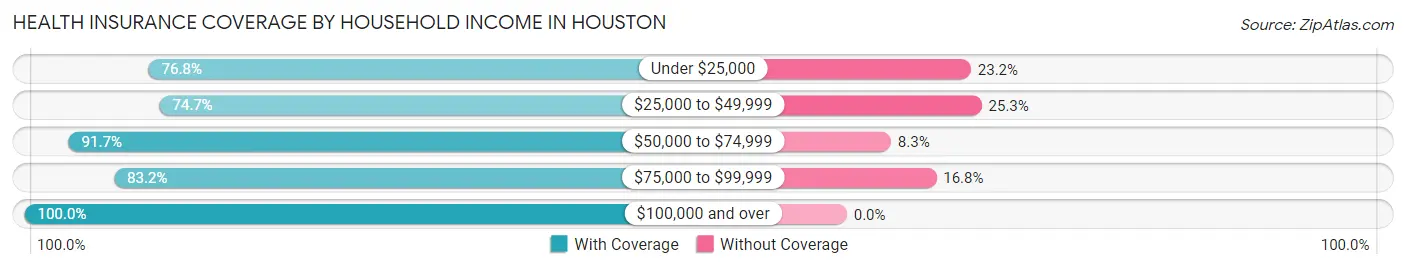
| Household Income | With Coverage | Without Coverage |
| Under $25,000 | 393 (76.8%) | 119 (23.2%) |
| $25,000 to $49,999 | 713 (74.7%) | 241 (25.3%) |
| $50,000 to $74,999 | 300 (91.7%) | 27 (8.3%) |
| $75,000 to $99,999 | 144 (83.2%) | 29 (16.8%) |
| $100,000 and over | 319 (100.0%) | 0 (0.0%) |
Public vs Private Health Insurance Coverage by Age in Houston
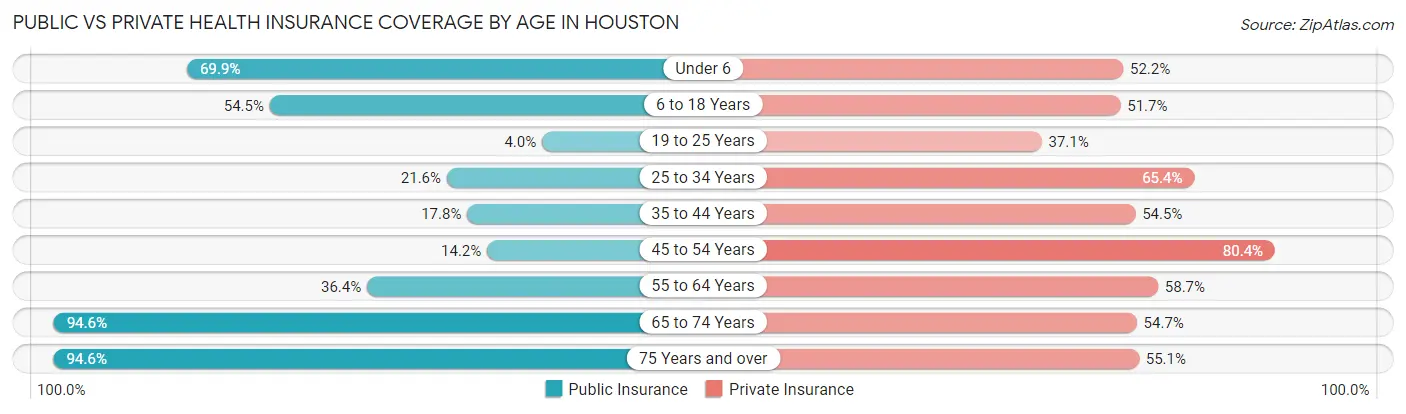
| Age Bracket | Public Insurance | Private Insurance |
| Under 6 | 95 (69.9%) | 71 (52.2%) |
| 6 to 18 Years | 194 (54.5%) | 184 (51.7%) |
| 19 to 25 Years | 13 (4.0%) | 122 (37.1%) |
| 25 to 34 Years | 80 (21.6%) | 242 (65.4%) |
| 35 to 44 Years | 38 (17.8%) | 116 (54.5%) |
| 45 to 54 Years | 44 (14.1%) | 250 (80.4%) |
| 55 to 64 Years | 82 (36.4%) | 132 (58.7%) |
| 65 to 74 Years | 140 (94.6%) | 81 (54.7%) |
| 75 Years and over | 194 (94.6%) | 113 (55.1%) |
| Total | 880 (38.4%) | 1,311 (57.2%) |
Disability Status by Sex by Age in Houston
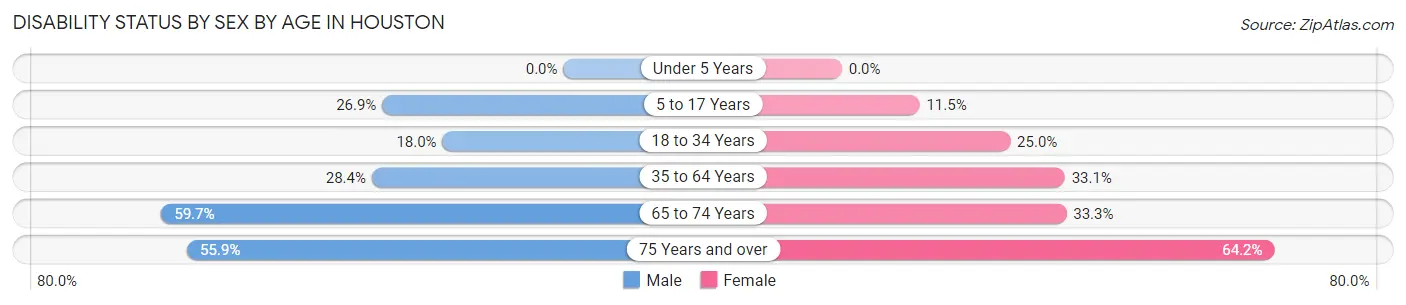
| Age Bracket | Male | Female |
| Under 5 Years | 0 (0.0%) | 0 (0.0%) |
| 5 to 17 Years | 46 (26.9%) | 18 (11.5%) |
| 18 to 34 Years | 56 (17.9%) | 104 (25.0%) |
| 35 to 64 Years | 91 (28.4%) | 142 (33.1%) |
| 65 to 74 Years | 40 (59.7%) | 27 (33.3%) |
| 75 Years and over | 38 (55.9%) | 88 (64.2%) |
Disability Class by Sex by Age in Houston
Disability Class: Hearing Difficulty
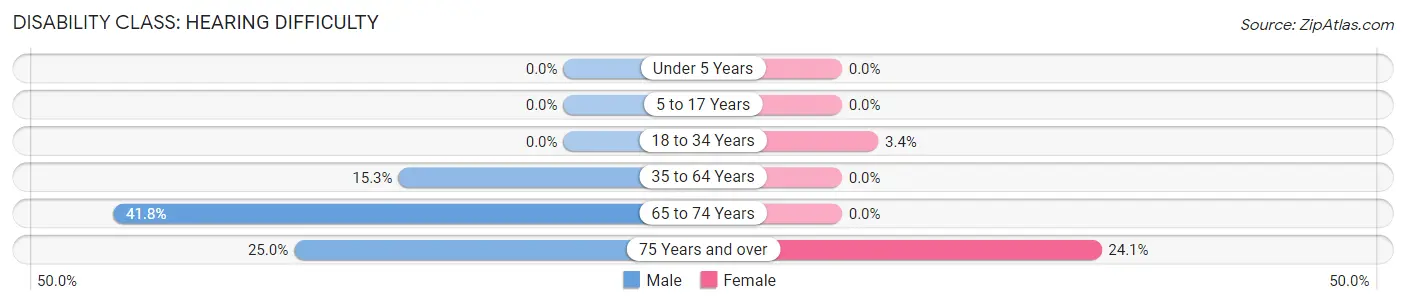
| Age Bracket | Male | Female |
| Under 5 Years | 0 (0.0%) | 0 (0.0%) |
| 5 to 17 Years | 0 (0.0%) | 0 (0.0%) |
| 18 to 34 Years | 0 (0.0%) | 14 (3.4%) |
| 35 to 64 Years | 49 (15.3%) | 0 (0.0%) |
| 65 to 74 Years | 28 (41.8%) | 0 (0.0%) |
| 75 Years and over | 17 (25.0%) | 33 (24.1%) |
Disability Class: Vision Difficulty
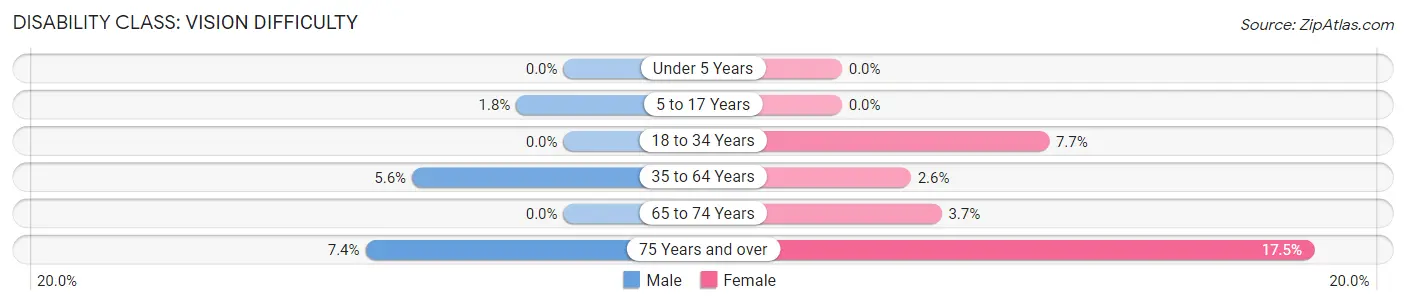
| Age Bracket | Male | Female |
| Under 5 Years | 0 (0.0%) | 0 (0.0%) |
| 5 to 17 Years | 3 (1.8%) | 0 (0.0%) |
| 18 to 34 Years | 0 (0.0%) | 32 (7.7%) |
| 35 to 64 Years | 18 (5.6%) | 11 (2.6%) |
| 65 to 74 Years | 0 (0.0%) | 3 (3.7%) |
| 75 Years and over | 5 (7.3%) | 24 (17.5%) |
Disability Class: Cognitive Difficulty
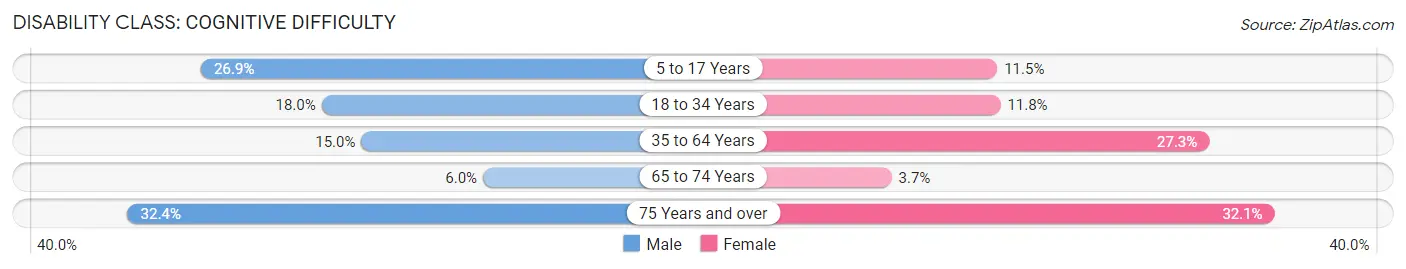
| Age Bracket | Male | Female |
| 5 to 17 Years | 46 (26.9%) | 18 (11.5%) |
| 18 to 34 Years | 56 (17.9%) | 49 (11.8%) |
| 35 to 64 Years | 48 (15.0%) | 117 (27.3%) |
| 65 to 74 Years | 4 (6.0%) | 3 (3.7%) |
| 75 Years and over | 22 (32.4%) | 44 (32.1%) |
Disability Class: Ambulatory Difficulty
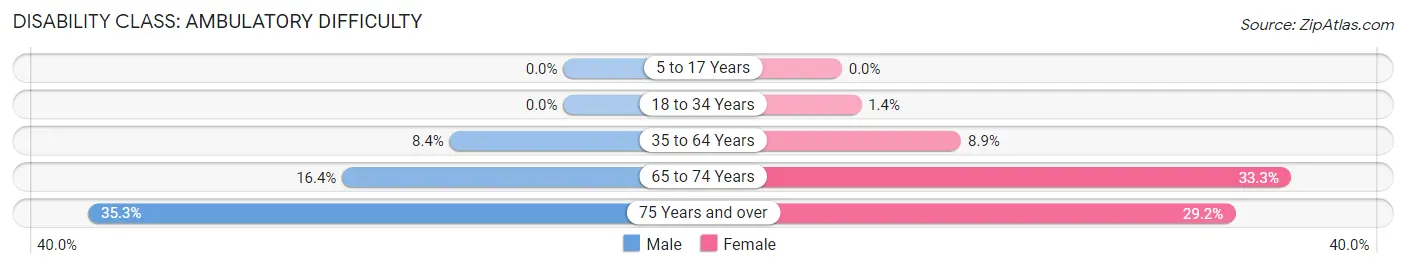
| Age Bracket | Male | Female |
| 5 to 17 Years | 0 (0.0%) | 0 (0.0%) |
| 18 to 34 Years | 0 (0.0%) | 6 (1.4%) |
| 35 to 64 Years | 27 (8.4%) | 38 (8.9%) |
| 65 to 74 Years | 11 (16.4%) | 27 (33.3%) |
| 75 Years and over | 24 (35.3%) | 40 (29.2%) |
Disability Class: Self-Care Difficulty
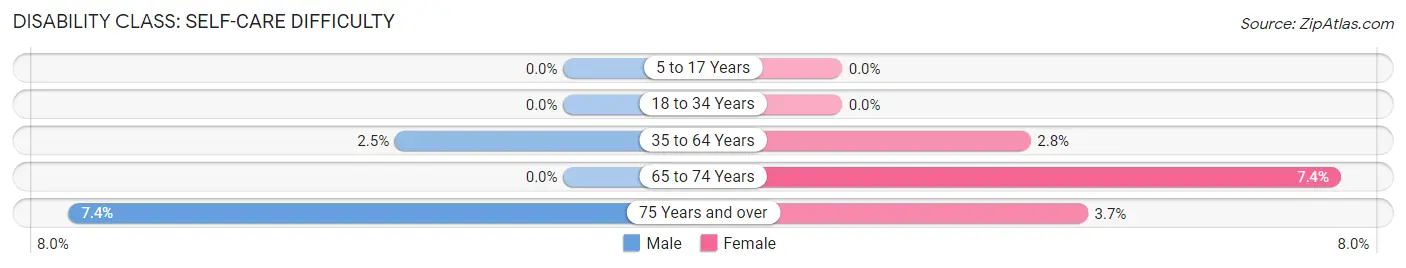
| Age Bracket | Male | Female |
| 5 to 17 Years | 0 (0.0%) | 0 (0.0%) |
| 18 to 34 Years | 0 (0.0%) | 0 (0.0%) |
| 35 to 64 Years | 8 (2.5%) | 12 (2.8%) |
| 65 to 74 Years | 0 (0.0%) | 6 (7.4%) |
| 75 Years and over | 5 (7.3%) | 5 (3.6%) |
Technology Access in Houston
Computing Device Access in Houston
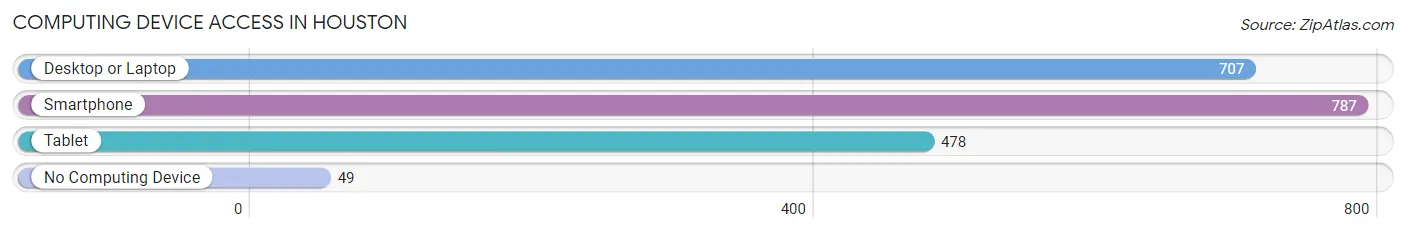
| Device Type | # Households | % Households |
| Desktop or Laptop | 707 | 75.9% |
| Smartphone | 787 | 84.5% |
| Tablet | 478 | 51.3% |
| No Computing Device | 49 | 5.3% |
| Total | 931 | 100.0% |
Internet Access in Houston
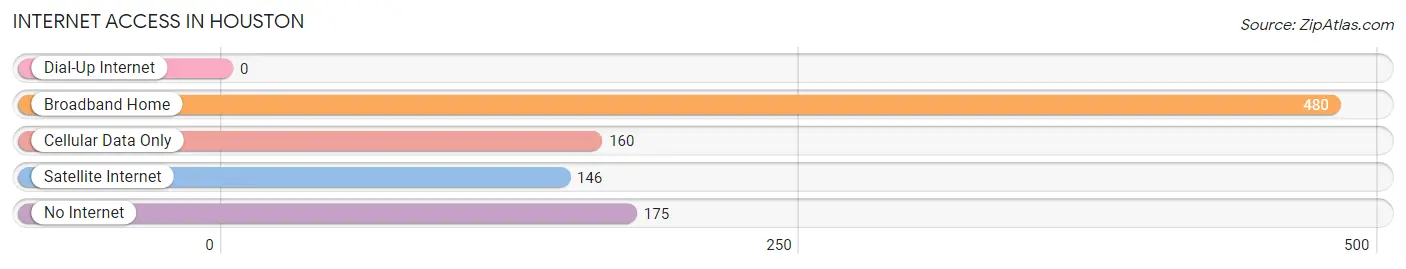
| Internet Type | # Households | % Households |
| Dial-Up Internet | 0 | 0.0% |
| Broadband Home | 480 | 51.6% |
| Cellular Data Only | 160 | 17.2% |
| Satellite Internet | 146 | 15.7% |
| No Internet | 175 | 18.8% |
| Total | 931 | 100.0% |
Houston Summary
Houston, Missouri is a small town located in Texas County, Missouri. It is situated in the Ozark Mountains and is part of the Ozark Plateau. The town was founded in 1845 and is named after Sam Houston, the first president of the Republic of Texas. The population of Houston, Missouri was 1,845 in the 2010 census.
Geography
Houston, Missouri is located in the Ozark Mountains in the southeastern corner of Texas County. It is situated at the intersection of U.S. Route 63 and Missouri Route 17. The town is located on the banks of the Eleven Point River, which is a tributary of the White River. The town is surrounded by rolling hills and is part of the Ozark Plateau. The climate in Houston is humid subtropical, with hot summers and mild winters.
Economy
Houston, Missouri is a small town with a population of just over 1,800 people. The town’s economy is largely based on agriculture and tourism. The town is home to several small businesses, including a grocery store, a hardware store, a restaurant, and a few other small shops. The town also has a few manufacturing plants, including a furniture factory and a plastics factory.
Demographics
According to the 2010 census, the population of Houston, Missouri was 1,845. The racial makeup of the town was 97.2% White, 0.7% African American, 0.3% Native American, 0.2% Asian, 0.1% Pacific Islander, 0.3% from other races, and 1.2% from two or more races. Hispanic or Latino of any race were 1.2% of the population.
The median income for a household in Houston, Missouri was $30,938, and the median income for a family was $37,917. The per capita income for the town was $15,945. About 16.2% of families and 19.2% of the population were below the poverty line, including 25.2% of those under age 18 and 11.2% of those age 65 or over.
Education
Houston, Missouri is served by the Houston R-I School District. The district has one elementary school, one middle school, and one high school. The district also has a vocational-technical school. The town is also home to a branch of Ozarks Technical Community College.
Conclusion
Houston, Missouri is a small town located in the Ozark Mountains in the southeastern corner of Texas County. The town was founded in 1845 and is named after Sam Houston, the first president of the Republic of Texas. The population of Houston, Missouri was 1,845 in the 2010 census. The town’s economy is largely based on agriculture and tourism, and the town is home to several small businesses. The racial makeup of the town was 97.2% White, 0.7% African American, 0.3% Native American, 0.2% Asian, 0.1% Pacific Islander, 0.3% from other races, and 1.2% from two or more races. The town is served by the Houston R-I School District, which has one elementary school, one middle school, one high school, and a vocational-technical school.
Common Questions
What is Per Capita Income in Houston?
Per Capita income in Houston is $23,076.
What is the Median Family Income in Houston?
Median Family Income in Houston is $55,804.
What is the Median Household income in Houston?
Median Household Income in Houston is $40,893.
What is Income or Wage Gap in Houston?
Income or Wage Gap in Houston is 14.4%.
Women in Houston earn 85.6 cents for every dollar earned by a man.
What is Inequality or Gini Index in Houston?
Inequality or Gini Index in Houston is 0.46.
What is the Total Population of Houston?
Total Population of Houston is 2,416.
What is the Total Male Population of Houston?
Total Male Population of Houston is 1,050.
What is the Total Female Population of Houston?
Total Female Population of Houston is 1,366.
What is the Ratio of Males per 100 Females in Houston?
There are 76.87 Males per 100 Females in Houston.
What is the Ratio of Females per 100 Males in Houston?
There are 130.10 Females per 100 Males in Houston.
What is the Median Population Age in Houston?
Median Population Age in Houston is 33.9 Years.
What is the Average Family Size in Houston
Average Family Size in Houston is 2.9 People.
What is the Average Household Size in Houston
Average Household Size in Houston is 2.5 People.
How Large is the Labor Force in Houston?
There are 1,199 People in the Labor Forcein in Houston.
What is the Percentage of People in the Labor Force in Houston?
59.2% of People are in the Labor Force in Houston.
What is the Unemployment Rate in Houston?
Unemployment Rate in Houston is 9.2%.