Sibley, MO Map & Demographics
Sibley Map
Sibley Overview
$35,337
PER CAPITA INCOME
$94,375
AVG FAMILY INCOME
$64,091
AVG HOUSEHOLD INCOME
24.9%
WAGE / INCOME GAP [ % ]
75.1¢/ $1
WAGE / INCOME GAP [ $ ]
0.38
INEQUALITY / GINI INDEX
356
TOTAL POPULATION
185
MALE POPULATION
171
FEMALE POPULATION
108.19
MALES / 100 FEMALES
92.43
FEMALES / 100 MALES
39.1
MEDIAN AGE
3.3
AVG FAMILY SIZE
2.7
AVG HOUSEHOLD SIZE
175
LABOR FORCE [ PEOPLE ]
59.7%
PERCENT IN LABOR FORCE
1.1%
UNEMPLOYMENT RATE
Sibley Zip Codes
Sibley Area Codes
Income in Sibley
Income Overview in Sibley
Per Capita Income in Sibley is $35,337, while median incomes of families and households are $94,375 and $64,091 respectively.
| Characteristic | Number | Measure |
| Per Capita Income | 356 | $35,337 |
| Median Family Income | 88 | $94,375 |
| Mean Family Income | 88 | $106,740 |
| Median Household Income | 130 | $64,091 |
| Mean Household Income | 130 | $92,141 |
| Income Deficit | 88 | $0 |
| Wage / Income Gap (%) | 356 | 24.89% |
| Wage / Income Gap ($) | 356 | 75.11¢ per $1 |
| Gini / Inequality Index | 356 | 0.38 |
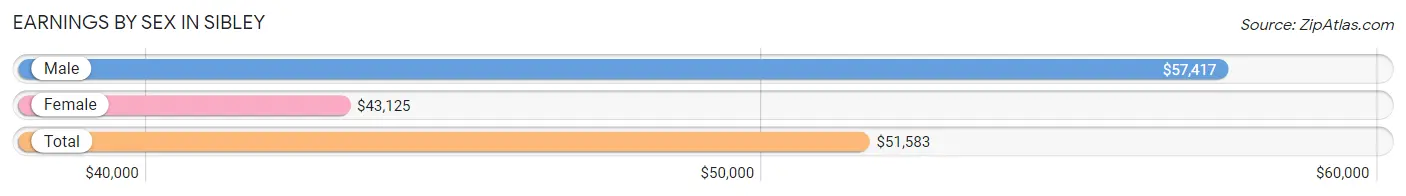
Earnings by Sex in Sibley
Average Earnings in Sibley are $51,583, $57,417 for men and $43,125 for women, a difference of 24.9%.
| Sex | Number | Average Earnings |
| Male | 95 (52.5%) | $57,417 |
| Female | 86 (47.5%) | $43,125 |
| Total | 181 (100.0%) | $51,583 |
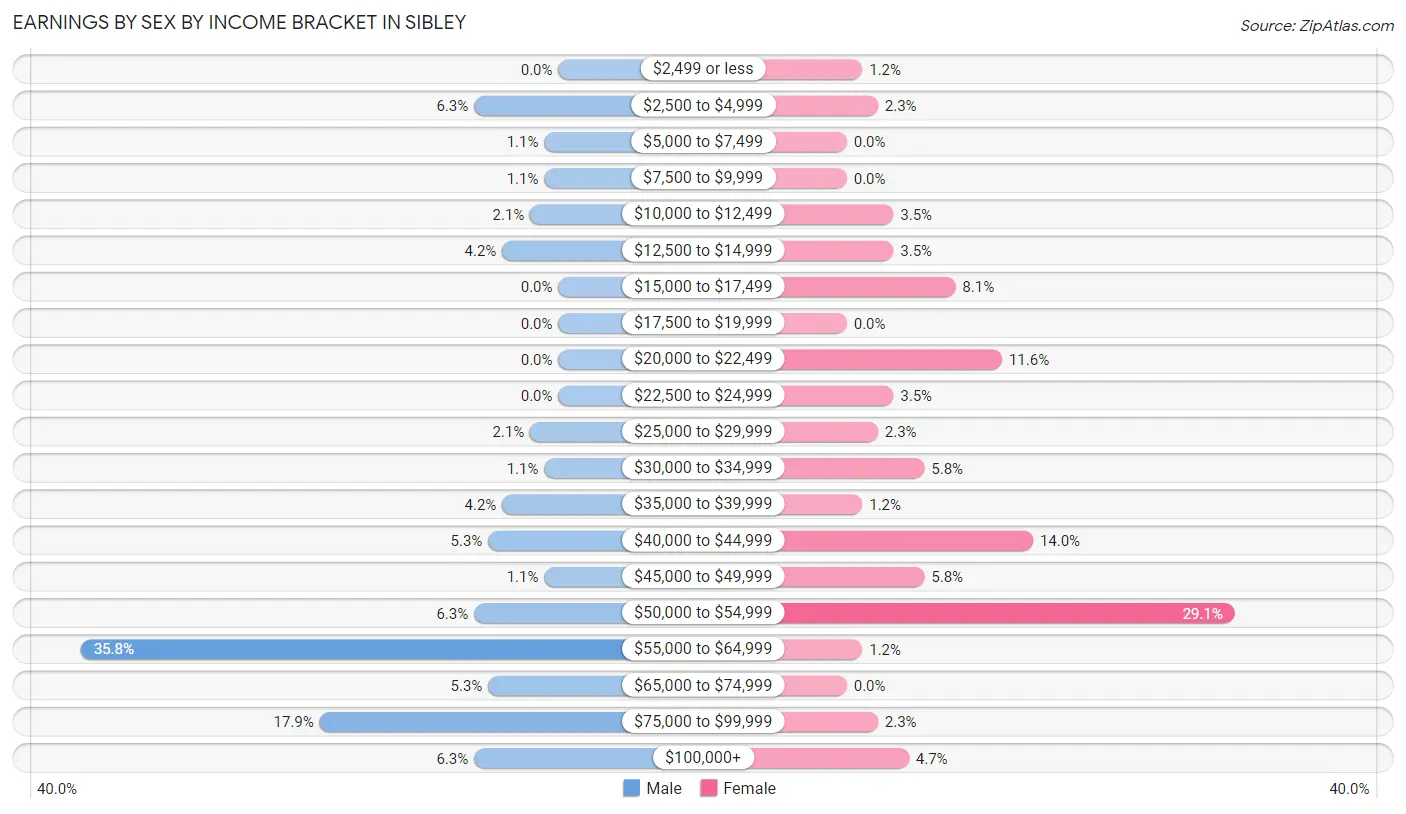
Earnings by Sex by Income Bracket in Sibley
The most common earnings brackets in Sibley are $55,000 to $64,999 for men (34 | 35.8%) and $50,000 to $54,999 for women (25 | 29.1%).
| Income | Male | Female |
| $2,499 or less | 0 (0.0%) | 1 (1.2%) |
| $2,500 to $4,999 | 6 (6.3%) | 2 (2.3%) |
| $5,000 to $7,499 | 1 (1.1%) | 0 (0.0%) |
| $7,500 to $9,999 | 1 (1.1%) | 0 (0.0%) |
| $10,000 to $12,499 | 2 (2.1%) | 3 (3.5%) |
| $12,500 to $14,999 | 4 (4.2%) | 3 (3.5%) |
| $15,000 to $17,499 | 0 (0.0%) | 7 (8.1%) |
| $17,500 to $19,999 | 0 (0.0%) | 0 (0.0%) |
| $20,000 to $22,499 | 0 (0.0%) | 10 (11.6%) |
| $22,500 to $24,999 | 0 (0.0%) | 3 (3.5%) |
| $25,000 to $29,999 | 2 (2.1%) | 2 (2.3%) |
| $30,000 to $34,999 | 1 (1.1%) | 5 (5.8%) |
| $35,000 to $39,999 | 4 (4.2%) | 1 (1.2%) |
| $40,000 to $44,999 | 5 (5.3%) | 12 (14.0%) |
| $45,000 to $49,999 | 1 (1.1%) | 5 (5.8%) |
| $50,000 to $54,999 | 6 (6.3%) | 25 (29.1%) |
| $55,000 to $64,999 | 34 (35.8%) | 1 (1.2%) |
| $65,000 to $74,999 | 5 (5.3%) | 0 (0.0%) |
| $75,000 to $99,999 | 17 (17.9%) | 2 (2.3%) |
| $100,000+ | 6 (6.3%) | 4 (4.6%) |
| Total | 95 (100.0%) | 86 (100.0%) |
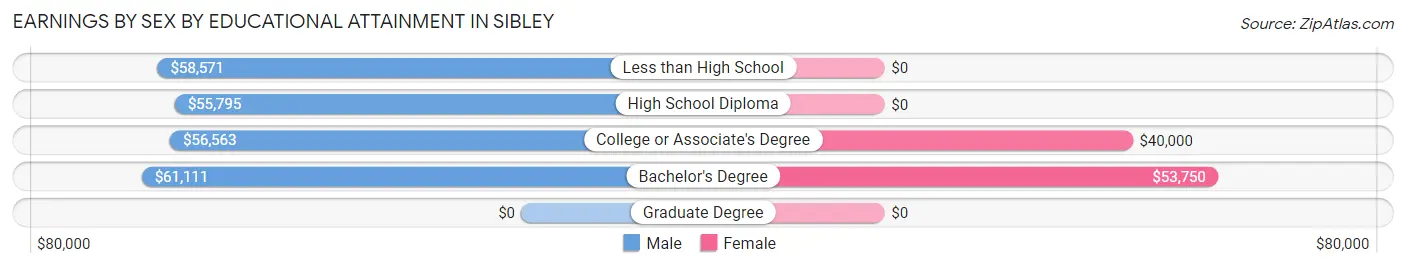
Earnings by Sex by Educational Attainment in Sibley
Average earnings in Sibley are $57,500 for men and $43,438 for women, a difference of 24.5%. Men with an educational attainment of bachelor's degree enjoy the highest average annual earnings of $61,111, while those with high school diploma education earn the least with $55,795. Women with an educational attainment of bachelor's degree earn the most with the average annual earnings of $53,750, while those with college or associate's degree education have the smallest earnings of $40,000.
| Educational Attainment | Male Income | Female Income |
| Less than High School | $58,571 | $0 |
| High School Diploma | $55,795 | $0 |
| College or Associate's Degree | $56,563 | $40,000 |
| Bachelor's Degree | $61,111 | $53,750 |
| Graduate Degree | - | - |
| Total | $57,500 | $43,438 |
Family Income in Sibley
Family Income Brackets in Sibley
According to the Sibley family income data, there are 34 families falling into the $100,000 to $149,999 income range, which is the most common income bracket and makes up 38.6% of all families.
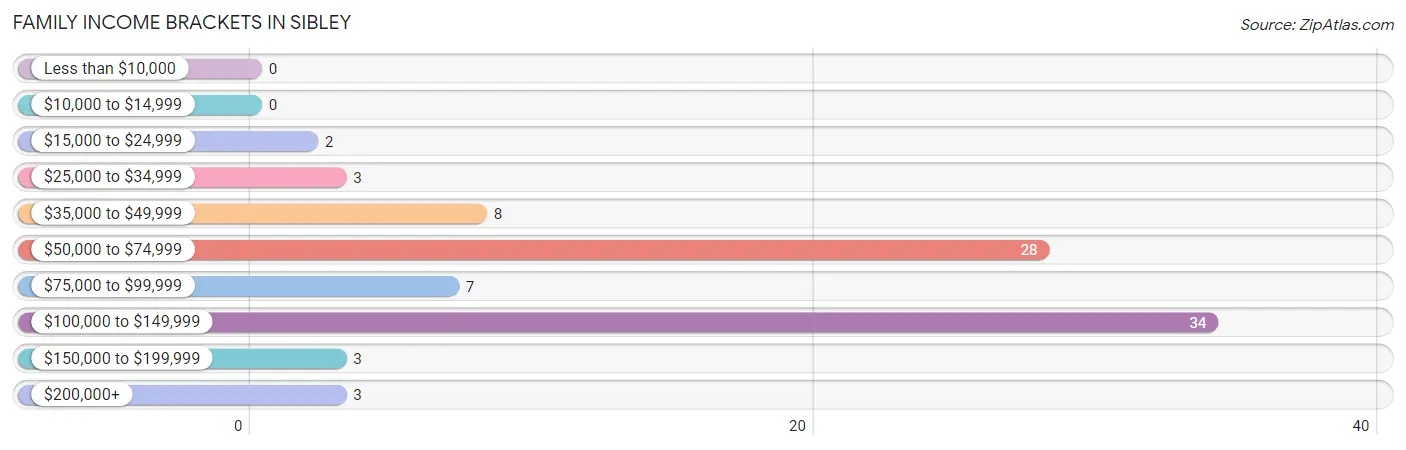
| Income Bracket | # Families | % Families |
| Less than $10,000 | 0 | 0.0% |
| $10,000 to $14,999 | 0 | 0.0% |
| $15,000 to $24,999 | 2 | 2.3% |
| $25,000 to $34,999 | 3 | 3.4% |
| $35,000 to $49,999 | 8 | 9.1% |
| $50,000 to $74,999 | 28 | 31.8% |
| $75,000 to $99,999 | 7 | 8.0% |
| $100,000 to $149,999 | 34 | 38.6% |
| $150,000 to $199,999 | 3 | 3.4% |
| $200,000+ | 3 | 3.4% |
Family Income by Famaliy Size in Sibley
3-person families (36 | 40.9%) account for the highest median family income in Sibley with $111,250 per family, while 3-person families (36 | 40.9%) have the highest median income of $37,083 per family member.
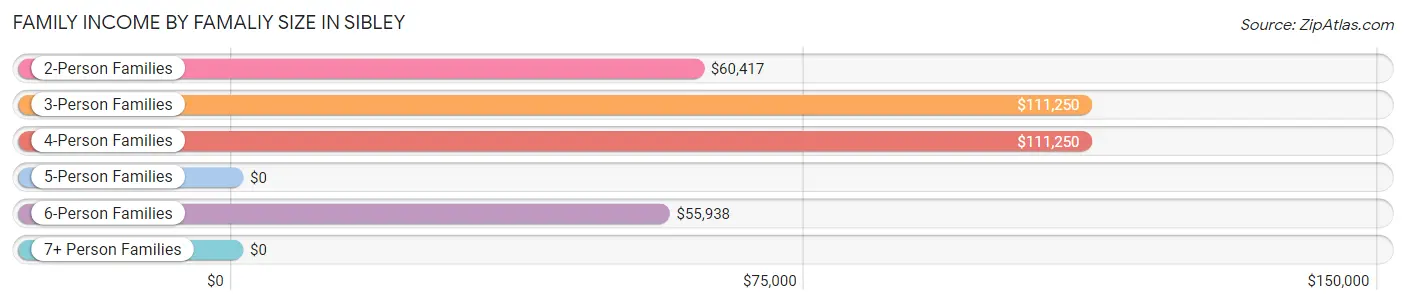
| Income Bracket | # Families | Median Income |
| 2-Person Families | 29 (33.0%) | $60,417 |
| 3-Person Families | 36 (40.9%) | $111,250 |
| 4-Person Families | 9 (10.2%) | $111,250 |
| 5-Person Families | 5 (5.7%) | $0 |
| 6-Person Families | 7 (8.0%) | $55,938 |
| 7+ Person Families | 2 (2.3%) | $0 |
| Total | 88 (100.0%) | $94,375 |
Family Income by Number of Earners in Sibley
The median family income in Sibley is $94,375, with families comprising 3+ earners (13) having the highest median family income of $136,528, while families with no earners (14) have the lowest median family income of $56,250, accounting for 14.8% and 15.9% of families, respectively.
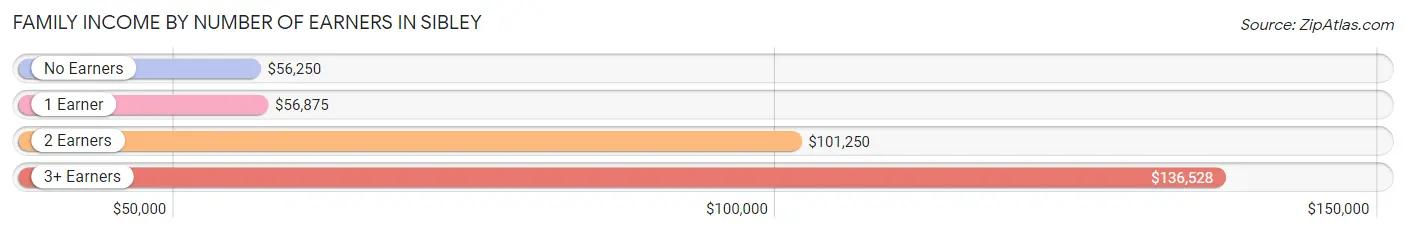
| Number of Earners | # Families | Median Income |
| No Earners | 14 (15.9%) | $56,250 |
| 1 Earner | 26 (29.5%) | $56,875 |
| 2 Earners | 35 (39.8%) | $101,250 |
| 3+ Earners | 13 (14.8%) | $136,528 |
| Total | 88 (100.0%) | $94,375 |
Household Income in Sibley
Household Income Brackets in Sibley
With 41 households falling in the category, the $100,000 to $149,999 income range is the most frequent in Sibley, accounting for 31.5% of all households.
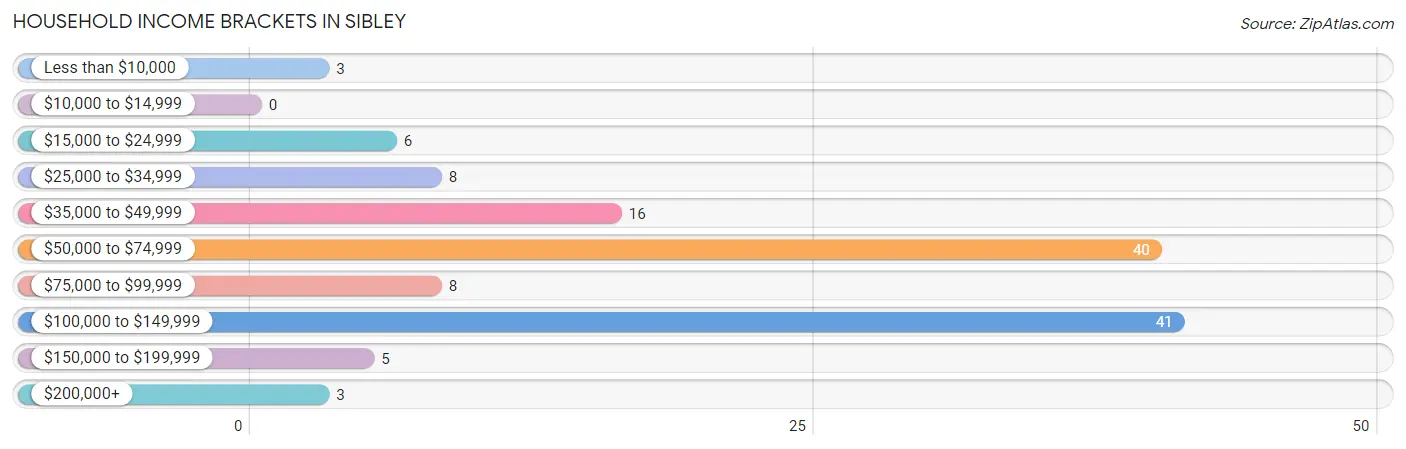
| Income Bracket | # Households | % Households |
| Less than $10,000 | 3 | 2.3% |
| $10,000 to $14,999 | 0 | 0.0% |
| $15,000 to $24,999 | 6 | 4.6% |
| $25,000 to $34,999 | 8 | 6.2% |
| $35,000 to $49,999 | 16 | 12.3% |
| $50,000 to $74,999 | 40 | 30.8% |
| $75,000 to $99,999 | 8 | 6.2% |
| $100,000 to $149,999 | 41 | 31.5% |
| $150,000 to $199,999 | 5 | 3.8% |
| $200,000+ | 3 | 2.3% |
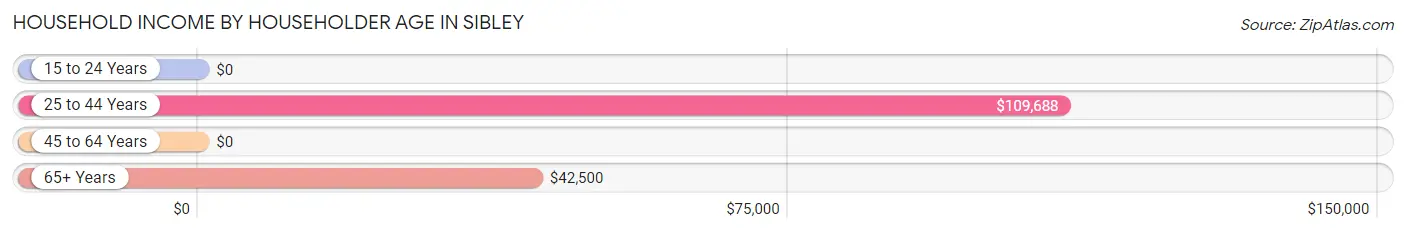
Household Income by Householder Age in Sibley
The median household income in Sibley is $64,091, with the highest median household income of $109,688 found in the 25 to 44 years age bracket for the primary householder. A total of 41 households (31.5%) fall into this category.
| Income Bracket | # Households | Median Income |
| 15 to 24 Years | 0 (0.0%) | $0 |
| 25 to 44 Years | 41 (31.5%) | $109,688 |
| 45 to 64 Years | 51 (39.2%) | $0 |
| 65+ Years | 38 (29.2%) | $42,500 |
| Total | 130 (100.0%) | $64,091 |
Poverty in Sibley
Income Below Poverty by Sex and Age in Sibley
With 7.0% poverty level for males and 9.4% for females among the residents of Sibley, 12 to 14 year old males and 25 to 34 year old females are the most vulnerable to poverty, with 2 males (100.0%) and 6 females (30.0%) in their respective age groups living below the poverty level.
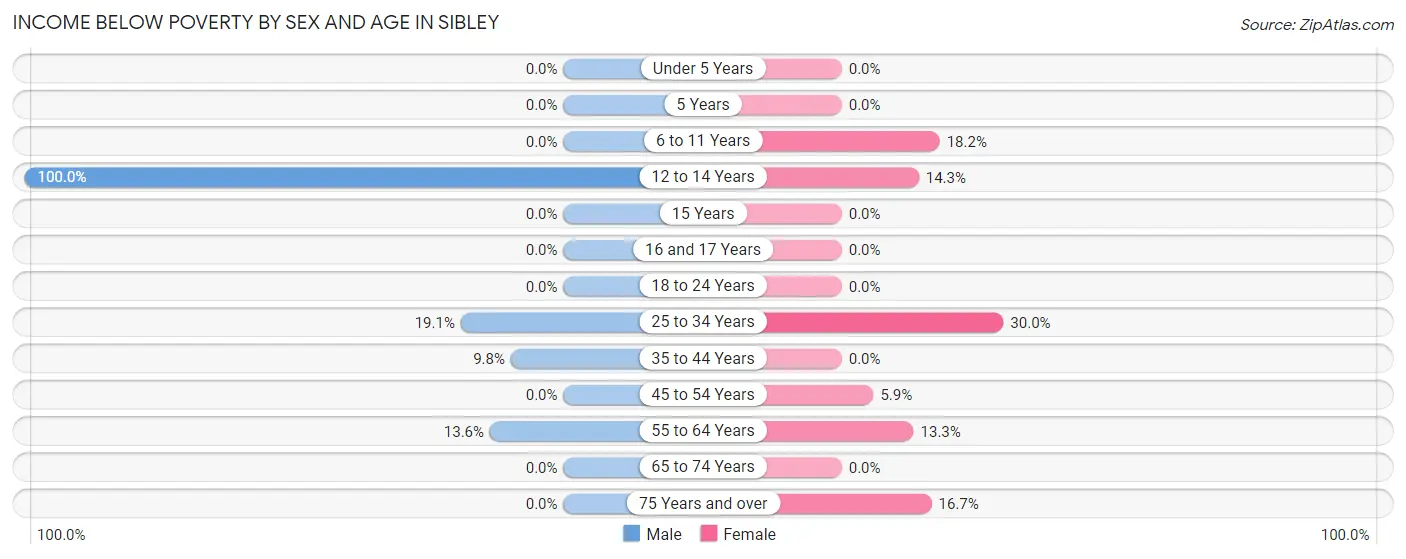
| Age Bracket | Male | Female |
| Under 5 Years | 0 (0.0%) | 0 (0.0%) |
| 5 Years | 0 (0.0%) | 0 (0.0%) |
| 6 to 11 Years | 0 (0.0%) | 2 (18.2%) |
| 12 to 14 Years | 2 (100.0%) | 2 (14.3%) |
| 15 Years | 0 (0.0%) | 0 (0.0%) |
| 16 and 17 Years | 0 (0.0%) | 0 (0.0%) |
| 18 to 24 Years | 0 (0.0%) | 0 (0.0%) |
| 25 to 34 Years | 4 (19.1%) | 6 (30.0%) |
| 35 to 44 Years | 4 (9.8%) | 0 (0.0%) |
| 45 to 54 Years | 0 (0.0%) | 2 (5.9%) |
| 55 to 64 Years | 3 (13.6%) | 2 (13.3%) |
| 65 to 74 Years | 0 (0.0%) | 0 (0.0%) |
| 75 Years and over | 0 (0.0%) | 2 (16.7%) |
| Total | 13 (7.0%) | 16 (9.4%) |
Income Above Poverty by Sex and Age in Sibley
According to the poverty statistics in Sibley, males aged under 5 years and females aged under 5 years are the age groups that are most secure financially, with 100.0% of males and 100.0% of females in these age groups living above the poverty line.
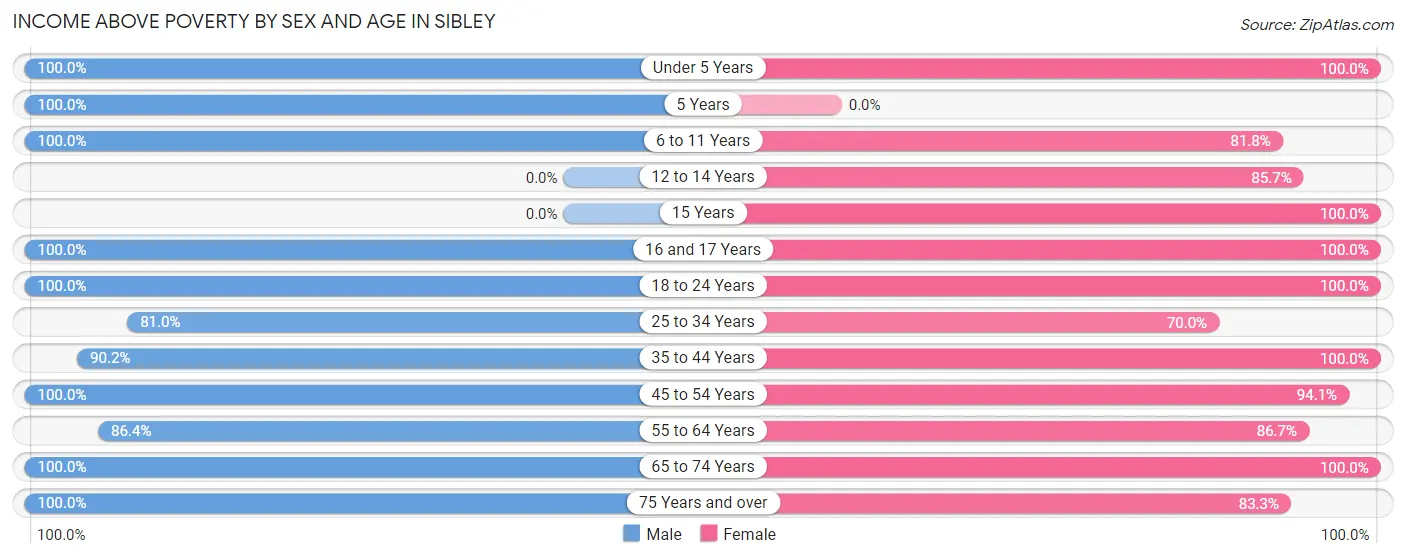
| Age Bracket | Male | Female |
| Under 5 Years | 15 (100.0%) | 2 (100.0%) |
| 5 Years | 6 (100.0%) | 0 (0.0%) |
| 6 to 11 Years | 8 (100.0%) | 9 (81.8%) |
| 12 to 14 Years | 0 (0.0%) | 12 (85.7%) |
| 15 Years | 0 (0.0%) | 5 (100.0%) |
| 16 and 17 Years | 9 (100.0%) | 7 (100.0%) |
| 18 to 24 Years | 8 (100.0%) | 22 (100.0%) |
| 25 to 34 Years | 17 (80.9%) | 14 (70.0%) |
| 35 to 44 Years | 37 (90.2%) | 17 (100.0%) |
| 45 to 54 Years | 19 (100.0%) | 32 (94.1%) |
| 55 to 64 Years | 19 (86.4%) | 13 (86.7%) |
| 65 to 74 Years | 22 (100.0%) | 12 (100.0%) |
| 75 Years and over | 12 (100.0%) | 10 (83.3%) |
| Total | 172 (93.0%) | 155 (90.6%) |
Income Below Poverty Among Married-Couple Families in Sibley
The poverty statistics for married-couple families in Sibley show that 3.0% or 2 of the total 67 families live below the poverty line. Families with 3 or 4 children have the highest poverty rate of 18.2%, comprising of 2 families. On the other hand, families with no children have the lowest poverty rate of 0.0%, which includes 0 families.
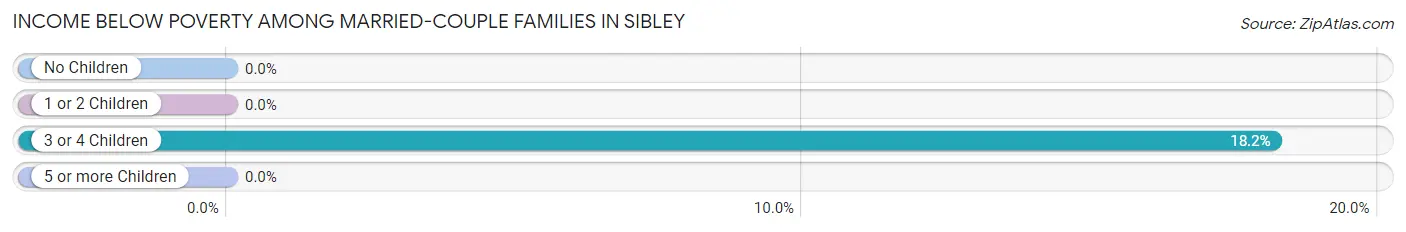
| Children | Above Poverty | Below Poverty |
| No Children | 41 (100.0%) | 0 (0.0%) |
| 1 or 2 Children | 15 (100.0%) | 0 (0.0%) |
| 3 or 4 Children | 9 (81.8%) | 2 (18.2%) |
| 5 or more Children | 0 (0.0%) | 0 (0.0%) |
| Total | 65 (97.0%) | 2 (3.0%) |
Income Below Poverty Among Single-Parent Households in Sibley
| Children | Single Father | Single Mother |
| No Children | 0 (0.0%) | 0 (0.0%) |
| 1 or 2 Children | 0 (0.0%) | 0 (0.0%) |
| 3 or 4 Children | 0 (0.0%) | 0 (0.0%) |
| 5 or more Children | 0 (0.0%) | 0 (0.0%) |
| Total | 0 (0.0%) | 0 (0.0%) |
Income Below Poverty Among Married-Couple vs Single-Parent Households in Sibley
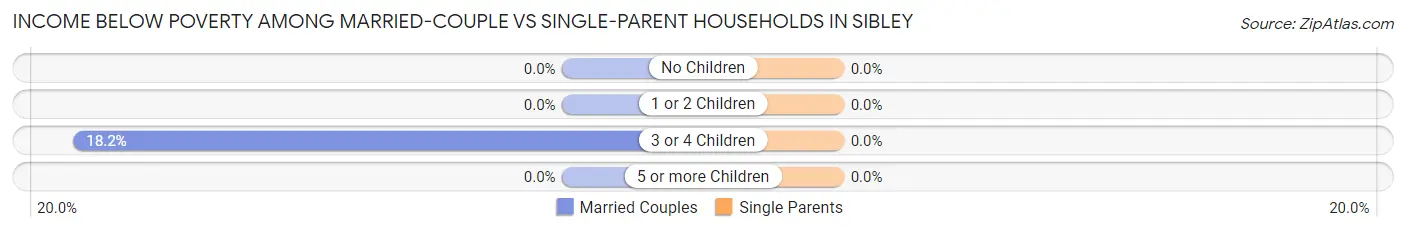
| Children | Married-Couple Families | Single-Parent Households |
| No Children | 0 (0.0%) | 0 (0.0%) |
| 1 or 2 Children | 0 (0.0%) | 0 (0.0%) |
| 3 or 4 Children | 2 (18.2%) | 0 (0.0%) |
| 5 or more Children | 0 (0.0%) | 0 (0.0%) |
| Total | 2 (3.0%) | 0 (0.0%) |
Race in Sibley
The most populous races in Sibley are White / Caucasian (335 | 94.1%), Two or more Races (17 | 4.8%), and Hispanic or Latino (14 | 3.9%).
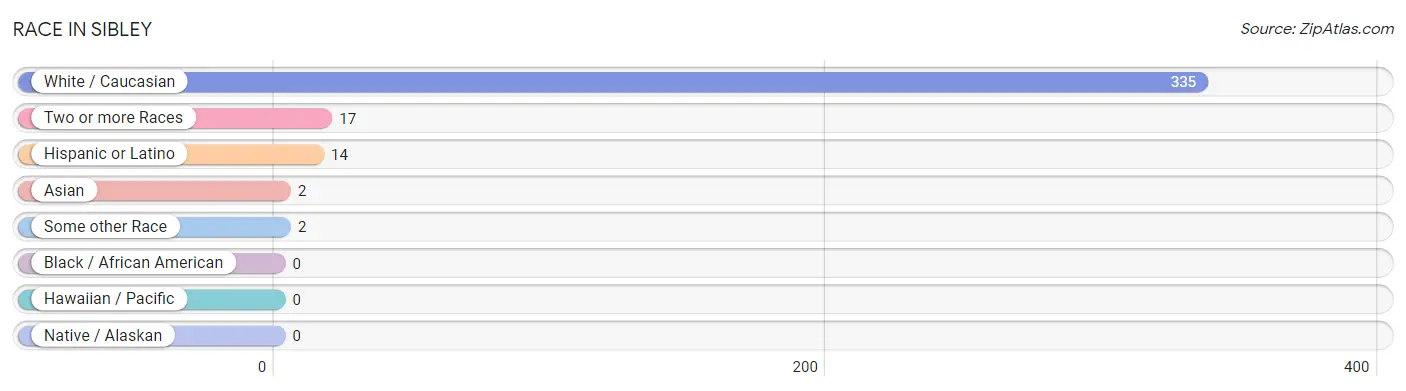
| Race | # Population | % Population |
| Asian | 2 | 0.6% |
| Black / African American | 0 | 0.0% |
| Hawaiian / Pacific | 0 | 0.0% |
| Hispanic or Latino | 14 | 3.9% |
| Native / Alaskan | 0 | 0.0% |
| White / Caucasian | 335 | 94.1% |
| Two or more Races | 17 | 4.8% |
| Some other Race | 2 | 0.6% |
| Total | 356 | 100.0% |
Ancestry in Sibley
The most populous ancestries reported in Sibley are European (70 | 19.7%), German (46 | 12.9%), Irish (36 | 10.1%), Swedish (27 | 7.6%), and English (26 | 7.3%), together accounting for 57.6% of all Sibley residents.
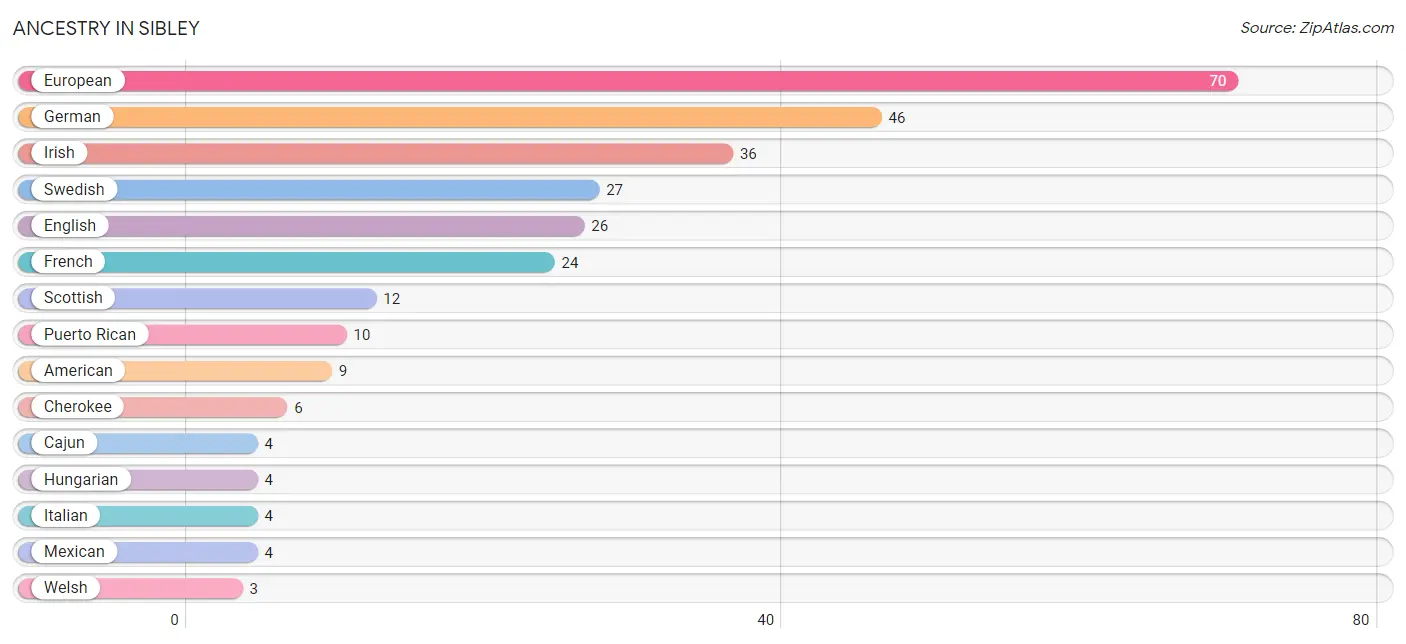
| Ancestry | # Population | % Population |
| American | 9 | 2.5% |
| British | 1 | 0.3% |
| Cajun | 4 | 1.1% |
| Cherokee | 6 | 1.7% |
| Dutch | 1 | 0.3% |
| English | 26 | 7.3% |
| European | 70 | 19.7% |
| French | 24 | 6.7% |
| German | 46 | 12.9% |
| Hungarian | 4 | 1.1% |
| Irish | 36 | 10.1% |
| Italian | 4 | 1.1% |
| Mexican | 4 | 1.1% |
| Pakistani | 2 | 0.6% |
| Puerto Rican | 10 | 2.8% |
| Scotch-Irish | 2 | 0.6% |
| Scottish | 12 | 3.4% |
| Swedish | 27 | 7.6% |
| Swiss | 1 | 0.3% |
| Welsh | 3 | 0.8% | View All 20 Rows |
Immigrants in Sibley
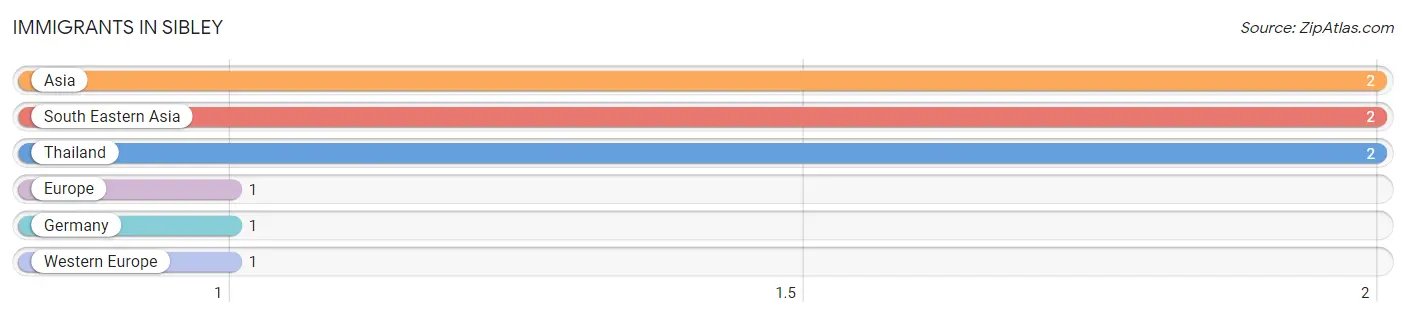
The most numerous immigrant groups reported in Sibley came from Asia (2 | 0.6%), South Eastern Asia (2 | 0.6%), Thailand (2 | 0.6%), Europe (1 | 0.3%), and Germany (1 | 0.3%), together accounting for 2.2% of all Sibley residents.
| Immigration Origin | # Population | % Population |
| Asia | 2 | 0.6% |
| Europe | 1 | 0.3% |
| Germany | 1 | 0.3% |
| South Eastern Asia | 2 | 0.6% |
| Thailand | 2 | 0.6% |
| Western Europe | 1 | 0.3% | View All 6 Rows |
Sex and Age in Sibley
Sex and Age in Sibley
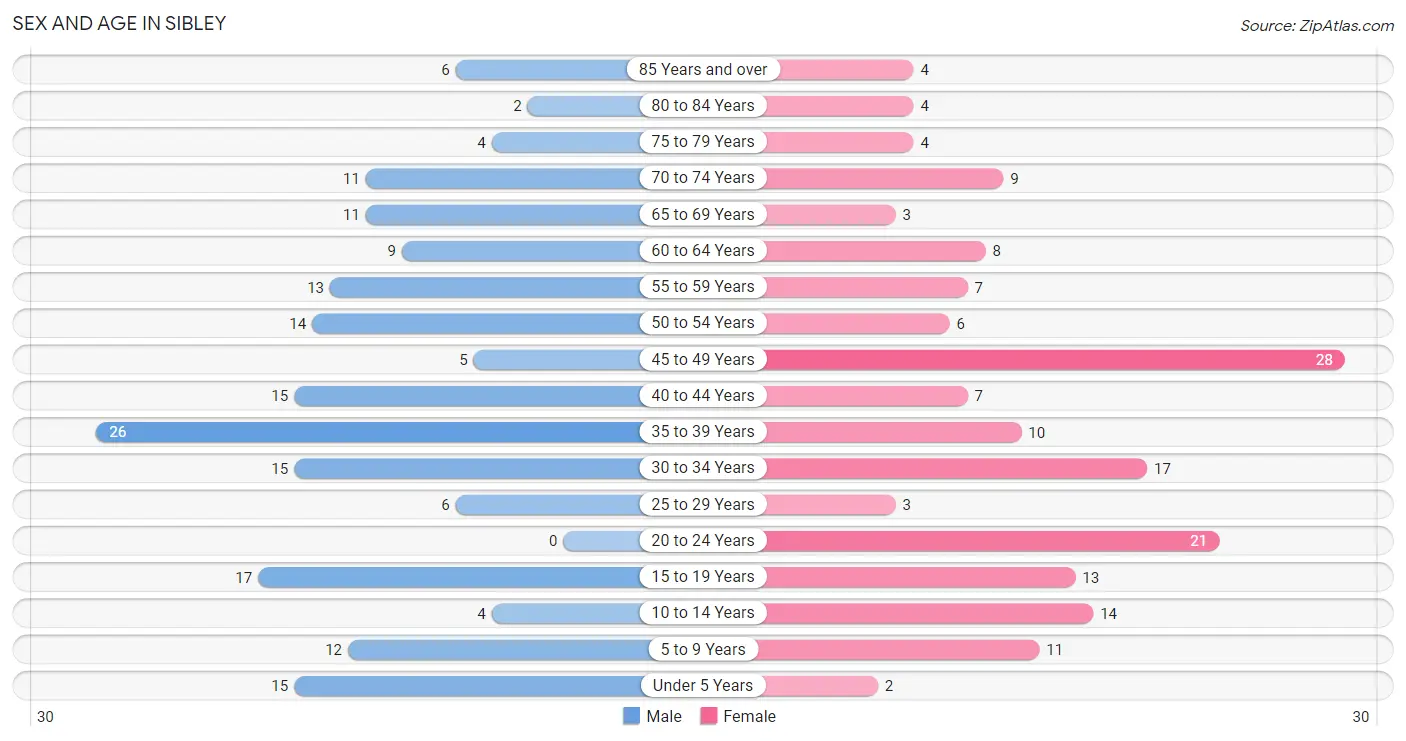
The most populous age groups in Sibley are 35 to 39 Years (26 | 14.1%) for men and 45 to 49 Years (28 | 16.4%) for women.
| Age Bracket | Male | Female |
| Under 5 Years | 15 (8.1%) | 2 (1.2%) |
| 5 to 9 Years | 12 (6.5%) | 11 (6.4%) |
| 10 to 14 Years | 4 (2.2%) | 14 (8.2%) |
| 15 to 19 Years | 17 (9.2%) | 13 (7.6%) |
| 20 to 24 Years | 0 (0.0%) | 21 (12.3%) |
| 25 to 29 Years | 6 (3.2%) | 3 (1.8%) |
| 30 to 34 Years | 15 (8.1%) | 17 (9.9%) |
| 35 to 39 Years | 26 (14.1%) | 10 (5.9%) |
| 40 to 44 Years | 15 (8.1%) | 7 (4.1%) |
| 45 to 49 Years | 5 (2.7%) | 28 (16.4%) |
| 50 to 54 Years | 14 (7.6%) | 6 (3.5%) |
| 55 to 59 Years | 13 (7.0%) | 7 (4.1%) |
| 60 to 64 Years | 9 (4.9%) | 8 (4.7%) |
| 65 to 69 Years | 11 (5.9%) | 3 (1.8%) |
| 70 to 74 Years | 11 (5.9%) | 9 (5.3%) |
| 75 to 79 Years | 4 (2.2%) | 4 (2.3%) |
| 80 to 84 Years | 2 (1.1%) | 4 (2.3%) |
| 85 Years and over | 6 (3.2%) | 4 (2.3%) |
| Total | 185 (100.0%) | 171 (100.0%) |
Families and Households in Sibley
Median Family Size in Sibley
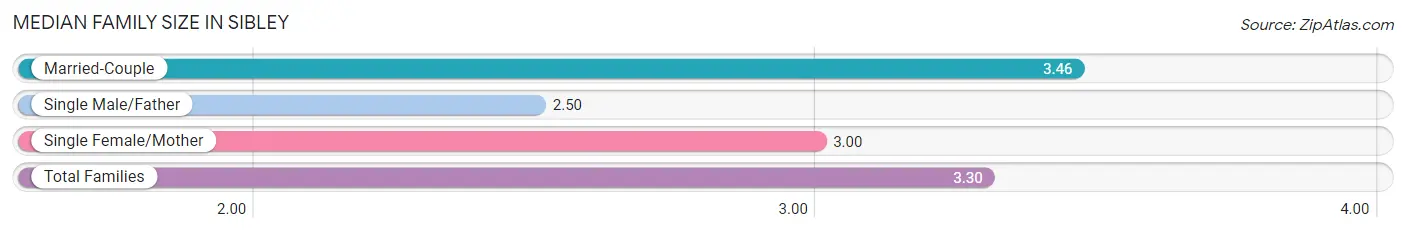
The median family size in Sibley is 3.30 persons per family, with married-couple families (67 | 76.1%) accounting for the largest median family size of 3.46 persons per family. On the other hand, single male/father families (10 | 11.4%) represent the smallest median family size with 2.50 persons per family.
| Family Type | # Families | Family Size |
| Married-Couple | 67 (76.1%) | 3.46 |
| Single Male/Father | 10 (11.4%) | 2.50 |
| Single Female/Mother | 11 (12.5%) | 3.00 |
| Total Families | 88 (100.0%) | 3.30 |
Median Household Size in Sibley
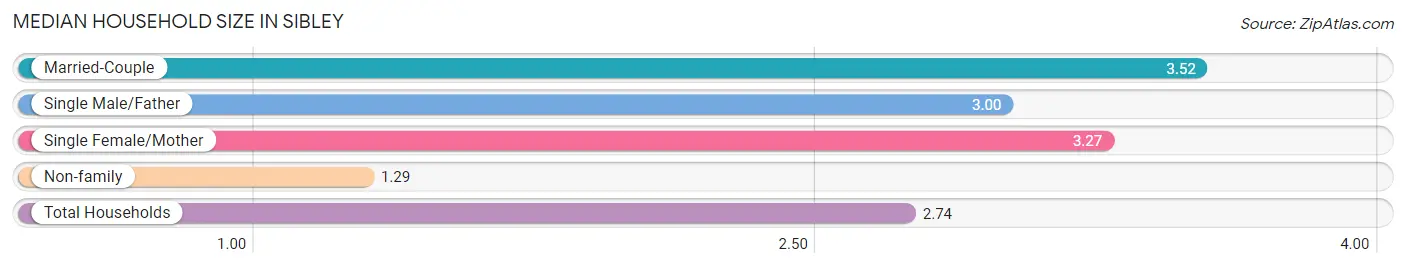
The median household size in Sibley is 2.74 persons per household, with married-couple households (67 | 51.5%) accounting for the largest median household size of 3.52 persons per household. non-family households (42 | 32.3%) represent the smallest median household size with 1.29 persons per household.
| Household Type | # Households | Household Size |
| Married-Couple | 67 (51.5%) | 3.52 |
| Single Male/Father | 10 (7.7%) | 3.00 |
| Single Female/Mother | 11 (8.5%) | 3.27 |
| Non-family | 42 (32.3%) | 1.29 |
| Total Households | 130 (100.0%) | 2.74 |
Household Size by Marriage Status in Sibley
Out of a total of 130 households in Sibley, 88 (67.7%) are family households, while 42 (32.3%) are nonfamily households. The most numerous type of family households are 3-person households, comprising 31, and the most common type of nonfamily households are 1-person households, comprising 34.
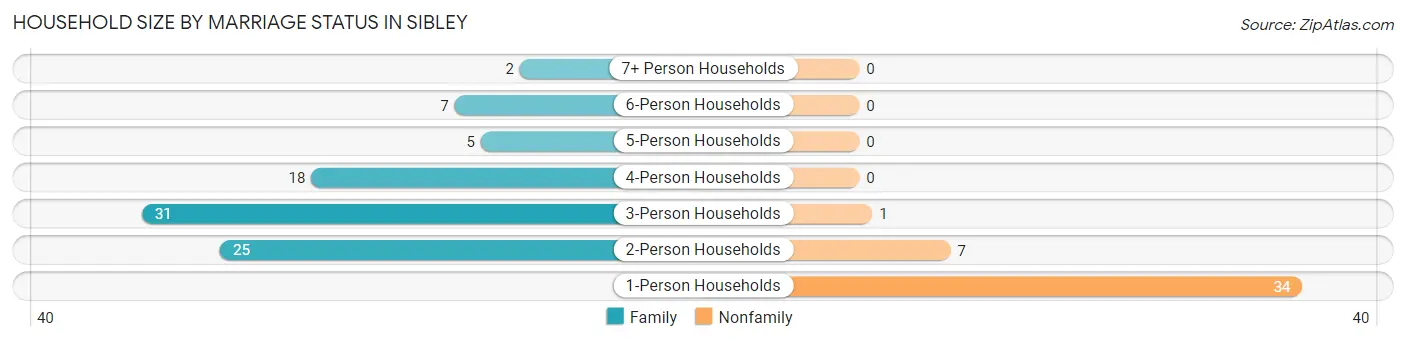
| Household Size | Family Households | Nonfamily Households |
| 1-Person Households | - | 34 (26.2%) |
| 2-Person Households | 25 (19.2%) | 7 (5.4%) |
| 3-Person Households | 31 (23.8%) | 1 (0.8%) |
| 4-Person Households | 18 (13.9%) | 0 (0.0%) |
| 5-Person Households | 5 (3.8%) | 0 (0.0%) |
| 6-Person Households | 7 (5.4%) | 0 (0.0%) |
| 7+ Person Households | 2 (1.5%) | 0 (0.0%) |
| Total | 88 (67.7%) | 42 (32.3%) |
Female Fertility in Sibley
Fertility by Age in Sibley
Average fertility rate in Sibley is 101.0 births per 1,000 women. Women in the age bracket of 35 to 50 years have the highest fertility rate with 222.0 births per 1,000 women. Women in the age bracket of 35 to 50 years acount for 100.0% of all women with births.
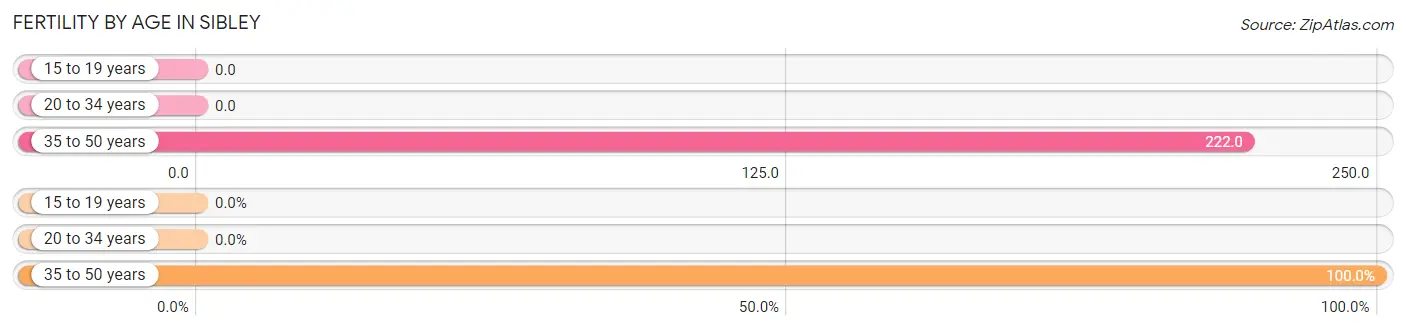
| Age Bracket | Women with Births | Births / 1,000 Women |
| 15 to 19 years | 0 (0.0%) | 0.0 |
| 20 to 34 years | 0 (0.0%) | 0.0 |
| 35 to 50 years | 10 (100.0%) | 222.0 |
| Total | 10 (100.0%) | 101.0 |
Fertility by Age by Marriage Status in Sibley
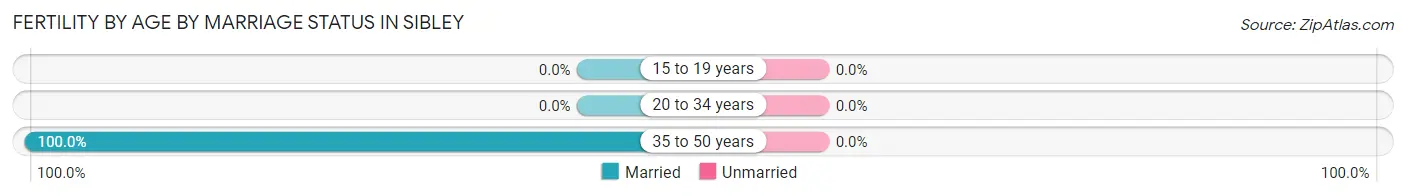
| Age Bracket | Married | Unmarried |
| 15 to 19 years | 0 (0.0%) | 0 (0.0%) |
| 20 to 34 years | 0 (0.0%) | 0 (0.0%) |
| 35 to 50 years | 10 (100.0%) | 0 (0.0%) |
| Total | 10 (100.0%) | 0 (0.0%) |
Fertility by Education in Sibley
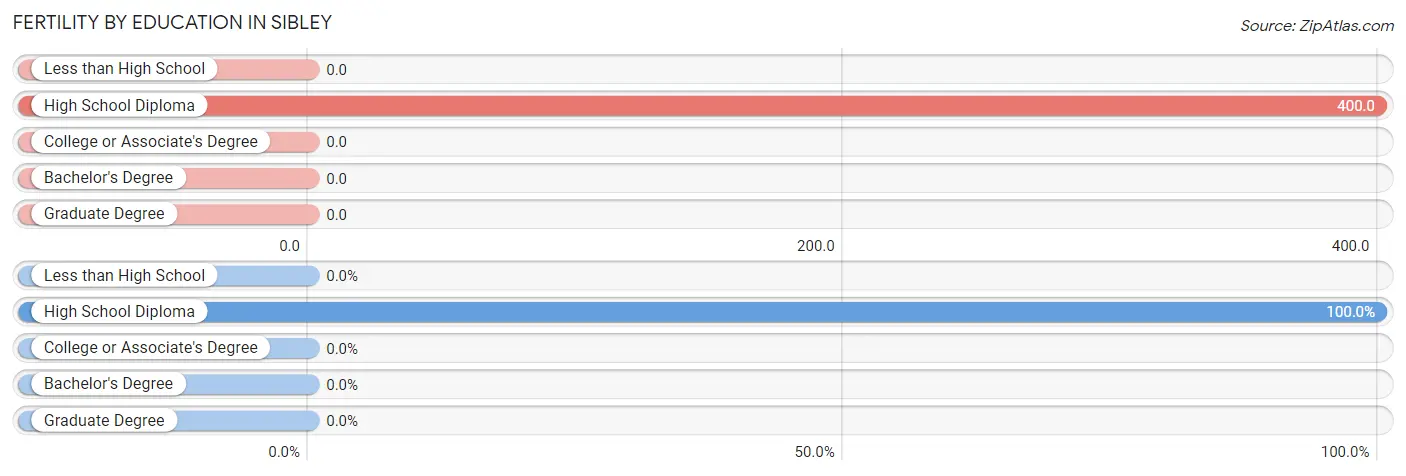
| Educational Attainment | Women with Births | Births / 1,000 Women |
| Less than High School | 0 (0.0%) | 0.0 |
| High School Diploma | 10 (100.0%) | 400.0 |
| College or Associate's Degree | 0 (0.0%) | 0.0 |
| Bachelor's Degree | 0 (0.0%) | 0.0 |
| Graduate Degree | 0 (0.0%) | 0.0 |
| Total | 10 (100.0%) | 101.0 |
Fertility by Education by Marriage Status in Sibley
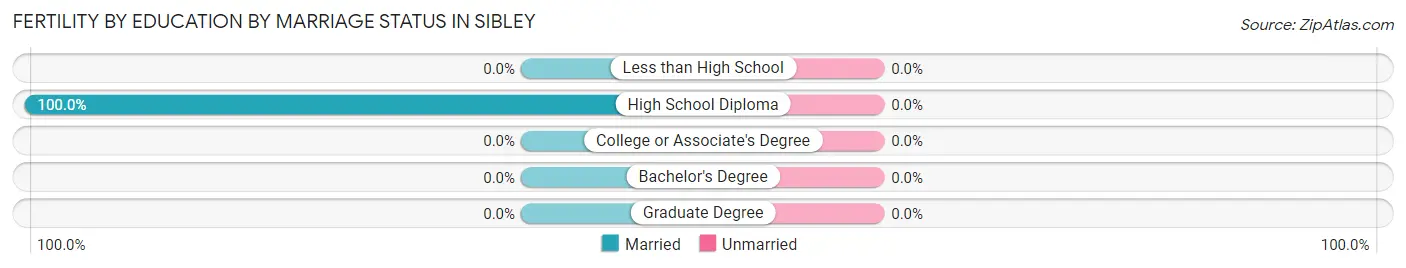
| Educational Attainment | Married | Unmarried |
| Less than High School | 0 (0.0%) | 0 (0.0%) |
| High School Diploma | 10 (100.0%) | 0 (0.0%) |
| College or Associate's Degree | 0 (0.0%) | 0 (0.0%) |
| Bachelor's Degree | 0 (0.0%) | 0 (0.0%) |
| Graduate Degree | 0 (0.0%) | 0 (0.0%) |
| Total | 10 (100.0%) | 0 (0.0%) |
Employment Characteristics in Sibley
Employment by Class of Employer in Sibley
Among the 165 employed individuals in Sibley, private company employees (118 | 71.5%), federal government employees (16 | 9.7%), and not-for-profit organizations (14 | 8.5%) make up the most common classes of employment.
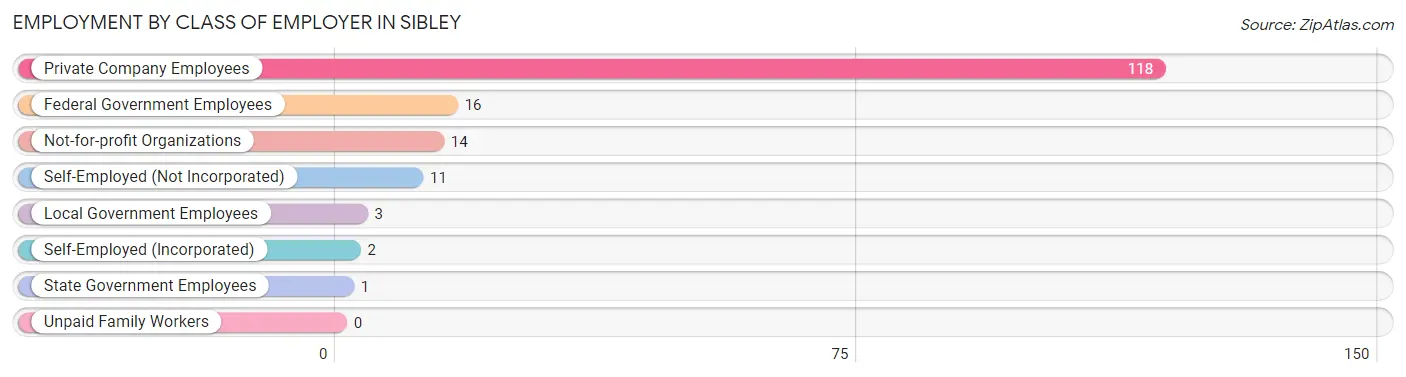
| Employer Class | # Employees | % Employees |
| Private Company Employees | 118 | 71.5% |
| Self-Employed (Incorporated) | 2 | 1.2% |
| Self-Employed (Not Incorporated) | 11 | 6.7% |
| Not-for-profit Organizations | 14 | 8.5% |
| Local Government Employees | 3 | 1.8% |
| State Government Employees | 1 | 0.6% |
| Federal Government Employees | 16 | 9.7% |
| Unpaid Family Workers | 0 | 0.0% |
| Total | 165 | 100.0% |
Employment Status by Age in Sibley
According to the labor force statistics for Sibley, out of the total population over 16 years of age (293), 59.7% or 175 individuals are in the labor force, with 1.1% or 2 of them unemployed. The age group with the highest labor force participation rate is 20 to 24 years, with 100.0% or 21 individuals in the labor force. Within the labor force, the 20 to 24 years age range has the highest percentage of unemployed individuals, with 9.5% or 2 of them being unemployed.
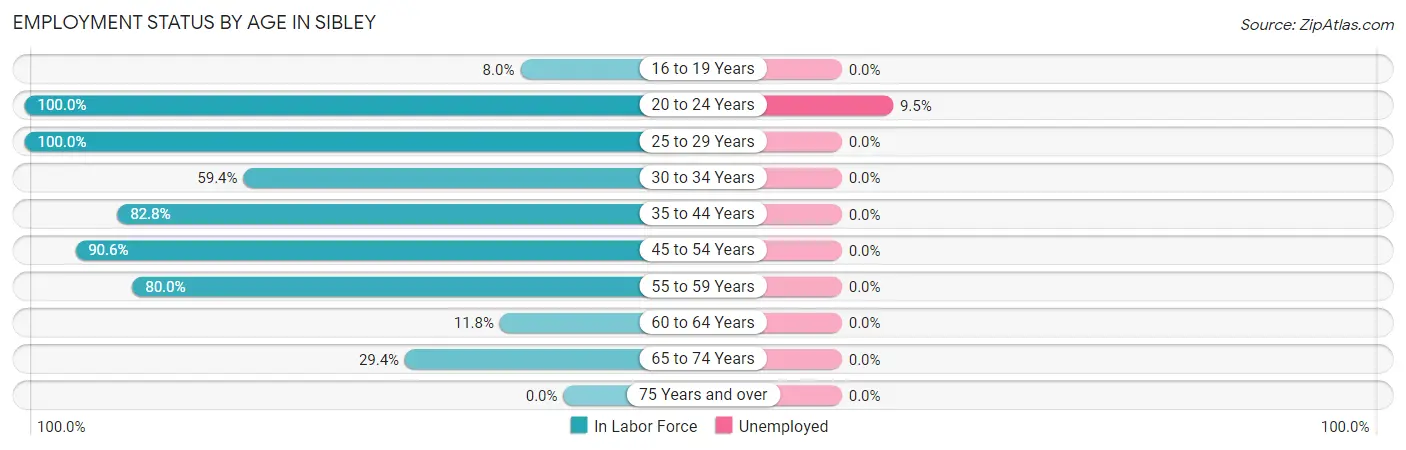
| Age Bracket | In Labor Force | Unemployed |
| 16 to 19 Years | 2 (8.0%) | 0 (0.0%) |
| 20 to 24 Years | 21 (100.0%) | 2 (9.5%) |
| 25 to 29 Years | 9 (100.0%) | 0 (0.0%) |
| 30 to 34 Years | 19 (59.4%) | 0 (0.0%) |
| 35 to 44 Years | 48 (82.8%) | 0 (0.0%) |
| 45 to 54 Years | 48 (90.6%) | 0 (0.0%) |
| 55 to 59 Years | 16 (80.0%) | 0 (0.0%) |
| 60 to 64 Years | 2 (11.8%) | 0 (0.0%) |
| 65 to 74 Years | 10 (29.4%) | 0 (0.0%) |
| 75 Years and over | 0 (0.0%) | 0 (0.0%) |
| Total | 175 (59.7%) | 2 (1.1%) |
Employment Status by Educational Attainment in Sibley
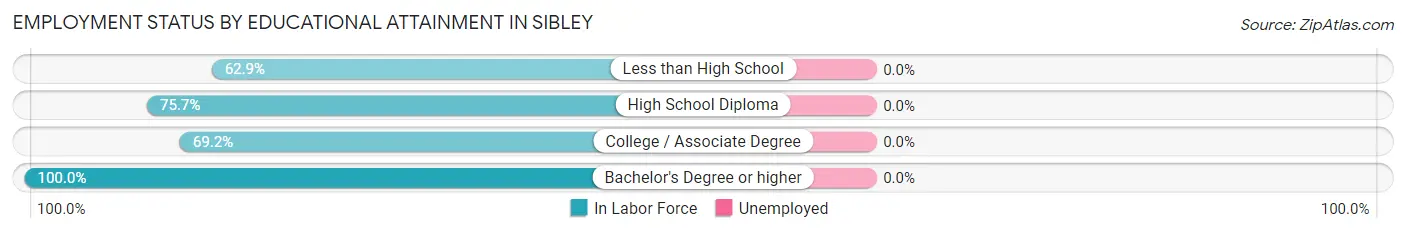
| Educational Attainment | In Labor Force | Unemployed |
| Less than High School | 22 (62.9%) | 0 (0.0%) |
| High School Diploma | 56 (75.7%) | 0 (0.0%) |
| College / Associate Degree | 36 (69.2%) | 0 (0.0%) |
| Bachelor's Degree or higher | 28 (100.0%) | 0 (0.0%) |
| Total | 142 (75.1%) | 0 (0.0%) |
Employment Occupations by Sex in Sibley
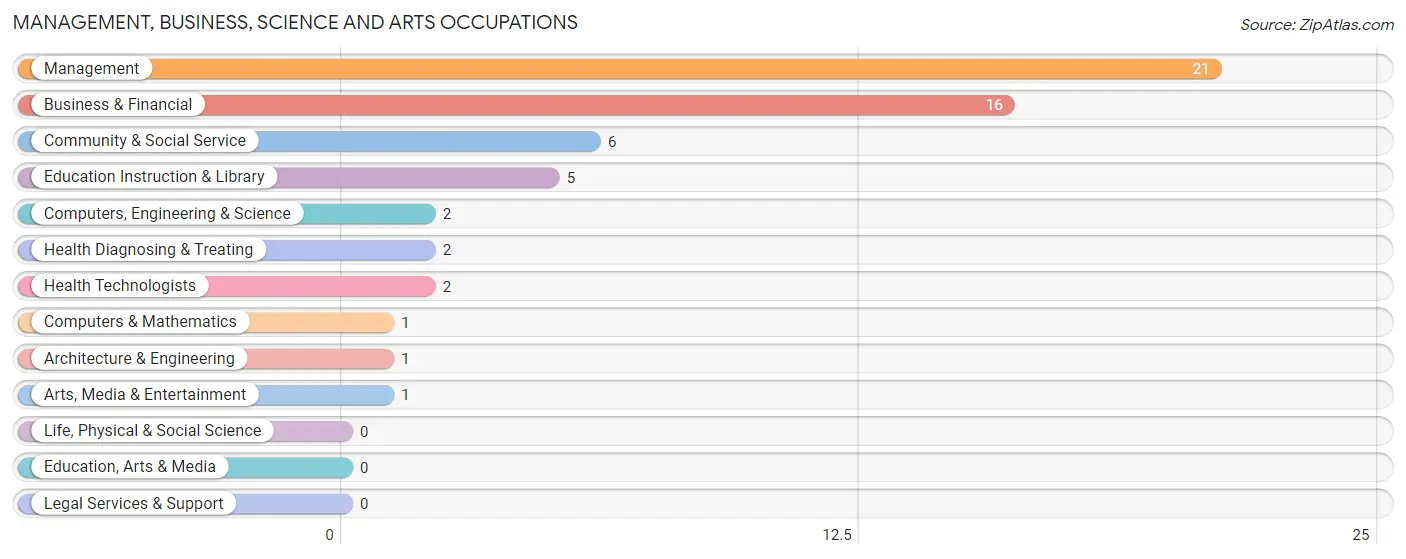
Management, Business, Science and Arts Occupations
The most common Management, Business, Science and Arts occupations in Sibley are Management (21 | 12.1%), Business & Financial (16 | 9.2%), Community & Social Service (6 | 3.5%), Education Instruction & Library (5 | 2.9%), and Computers, Engineering & Science (2 | 1.2%).
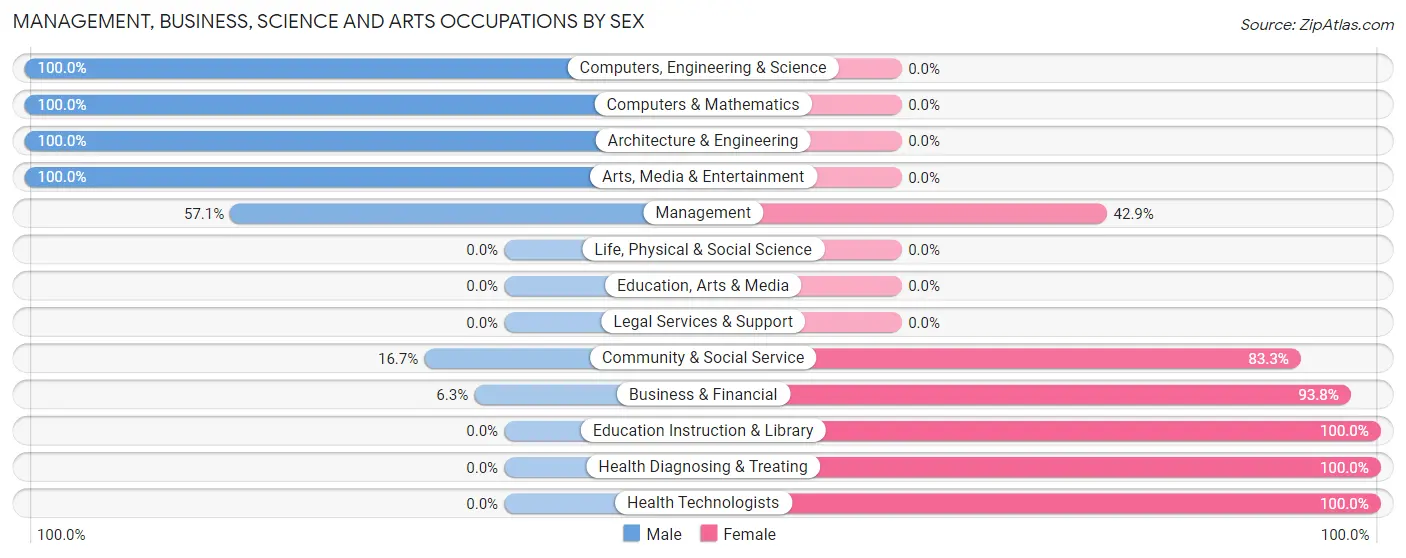
Management, Business, Science and Arts Occupations by Sex
Within the Management, Business, Science and Arts occupations in Sibley, the most male-oriented occupations are Computers, Engineering & Science (100.0%), Computers & Mathematics (100.0%), and Architecture & Engineering (100.0%), while the most female-oriented occupations are Education Instruction & Library (100.0%), Health Diagnosing & Treating (100.0%), and Health Technologists (100.0%).
| Occupation | Male | Female |
| Management | 12 (57.1%) | 9 (42.9%) |
| Business & Financial | 1 (6.2%) | 15 (93.8%) |
| Computers, Engineering & Science | 2 (100.0%) | 0 (0.0%) |
| Computers & Mathematics | 1 (100.0%) | 0 (0.0%) |
| Architecture & Engineering | 1 (100.0%) | 0 (0.0%) |
| Life, Physical & Social Science | 0 (0.0%) | 0 (0.0%) |
| Community & Social Service | 1 (16.7%) | 5 (83.3%) |
| Education, Arts & Media | 0 (0.0%) | 0 (0.0%) |
| Legal Services & Support | 0 (0.0%) | 0 (0.0%) |
| Education Instruction & Library | 0 (0.0%) | 5 (100.0%) |
| Arts, Media & Entertainment | 1 (100.0%) | 0 (0.0%) |
| Health Diagnosing & Treating | 0 (0.0%) | 2 (100.0%) |
| Health Technologists | 0 (0.0%) | 2 (100.0%) |
| Total (Category) | 16 (34.0%) | 31 (66.0%) |
| Total (Overall) | 92 (53.2%) | 81 (46.8%) |
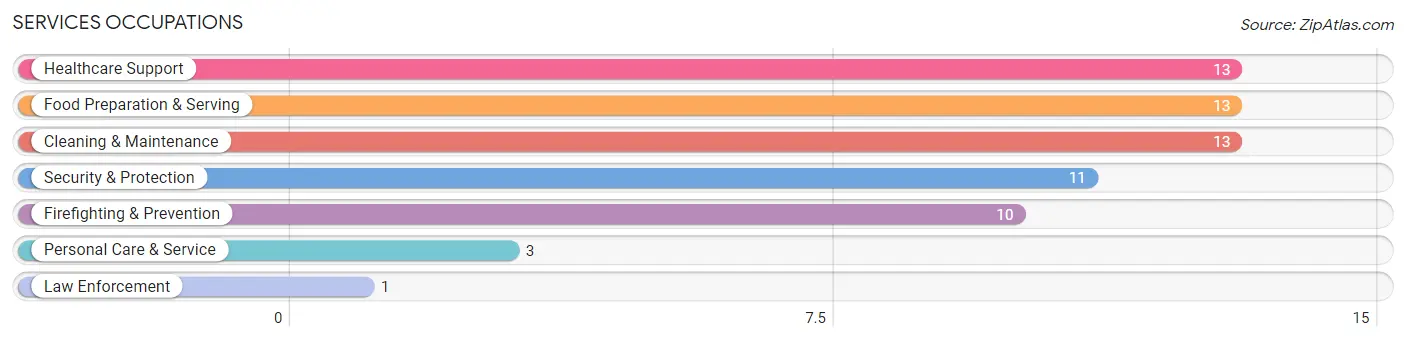
Services Occupations
The most common Services occupations in Sibley are Healthcare Support (13 | 7.5%), Food Preparation & Serving (13 | 7.5%), Cleaning & Maintenance (13 | 7.5%), Security & Protection (11 | 6.4%), and Firefighting & Prevention (10 | 5.8%).
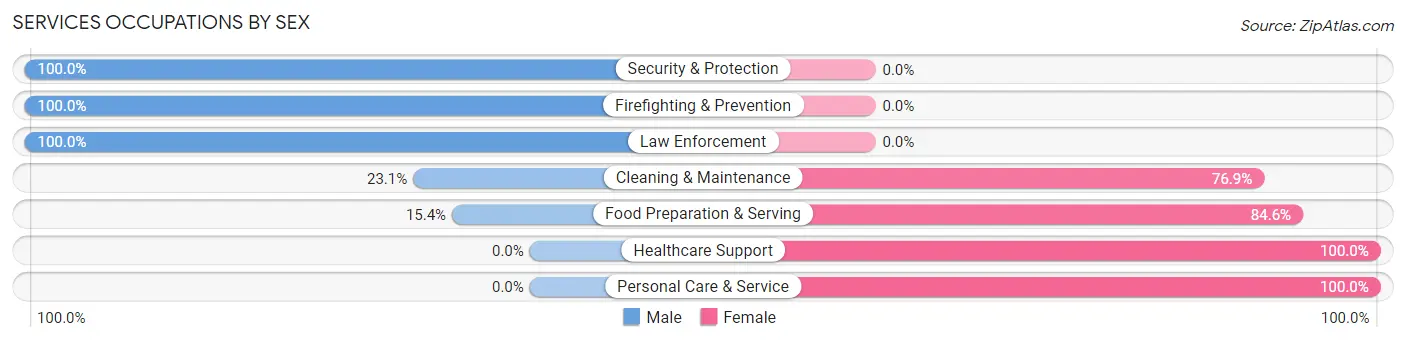
Services Occupations by Sex
Within the Services occupations in Sibley, the most male-oriented occupations are Security & Protection (100.0%), Firefighting & Prevention (100.0%), and Law Enforcement (100.0%), while the most female-oriented occupations are Healthcare Support (100.0%), Personal Care & Service (100.0%), and Food Preparation & Serving (84.6%).
| Occupation | Male | Female |
| Healthcare Support | 0 (0.0%) | 13 (100.0%) |
| Security & Protection | 11 (100.0%) | 0 (0.0%) |
| Firefighting & Prevention | 10 (100.0%) | 0 (0.0%) |
| Law Enforcement | 1 (100.0%) | 0 (0.0%) |
| Food Preparation & Serving | 2 (15.4%) | 11 (84.6%) |
| Cleaning & Maintenance | 3 (23.1%) | 10 (76.9%) |
| Personal Care & Service | 0 (0.0%) | 3 (100.0%) |
| Total (Category) | 16 (30.2%) | 37 (69.8%) |
| Total (Overall) | 92 (53.2%) | 81 (46.8%) |
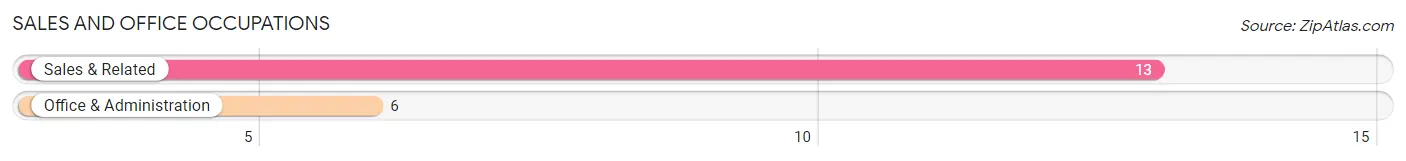
Sales and Office Occupations
The most common Sales and Office occupations in Sibley are Sales & Related (13 | 7.5%), and Office & Administration (6 | 3.5%).
Sales and Office Occupations by Sex
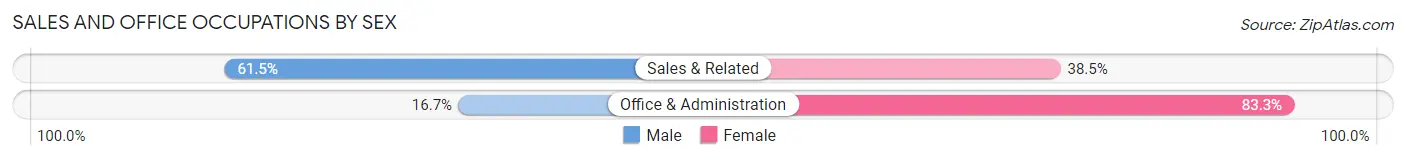
| Occupation | Male | Female |
| Sales & Related | 8 (61.5%) | 5 (38.5%) |
| Office & Administration | 1 (16.7%) | 5 (83.3%) |
| Total (Category) | 9 (47.4%) | 10 (52.6%) |
| Total (Overall) | 92 (53.2%) | 81 (46.8%) |
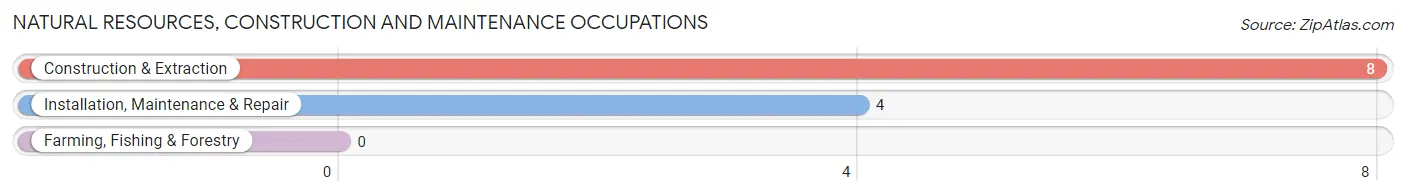
Natural Resources, Construction and Maintenance Occupations
The most common Natural Resources, Construction and Maintenance occupations in Sibley are Construction & Extraction (8 | 4.6%), and Installation, Maintenance & Repair (4 | 2.3%).
Natural Resources, Construction and Maintenance Occupations by Sex
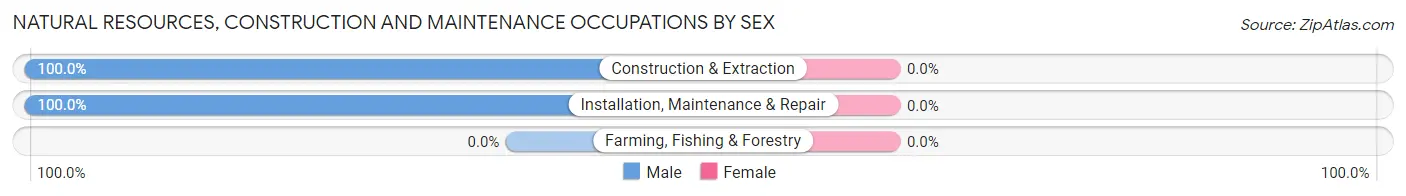
| Occupation | Male | Female |
| Farming, Fishing & Forestry | 0 (0.0%) | 0 (0.0%) |
| Construction & Extraction | 8 (100.0%) | 0 (0.0%) |
| Installation, Maintenance & Repair | 4 (100.0%) | 0 (0.0%) |
| Total (Category) | 12 (100.0%) | 0 (0.0%) |
| Total (Overall) | 92 (53.2%) | 81 (46.8%) |
Production, Transportation and Moving Occupations
The most common Production, Transportation and Moving occupations in Sibley are Production (21 | 12.1%), Transportation (18 | 10.4%), and Material Moving (3 | 1.7%).
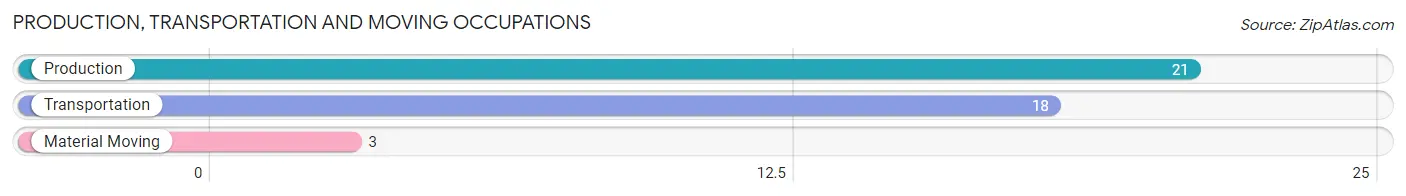
Production, Transportation and Moving Occupations by Sex
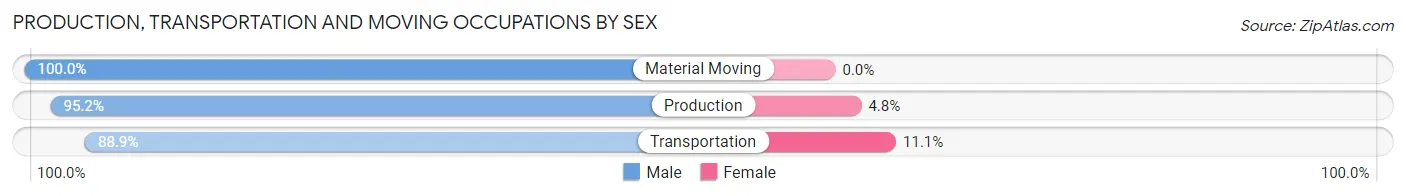
| Occupation | Male | Female |
| Production | 20 (95.2%) | 1 (4.8%) |
| Transportation | 16 (88.9%) | 2 (11.1%) |
| Material Moving | 3 (100.0%) | 0 (0.0%) |
| Total (Category) | 39 (92.9%) | 3 (7.1%) |
| Total (Overall) | 92 (53.2%) | 81 (46.8%) |
Employment Industries by Sex in Sibley
Employment Industries in Sibley
The major employment industries in Sibley include Manufacturing (33 | 19.1%), Health Care & Social Assistance (22 | 12.7%), Accommodation & Food Services (17 | 9.8%), Transportation & Warehousing (16 | 9.2%), and Professional & Scientific (14 | 8.1%).

Employment Industries by Sex in Sibley
The Sibley industries that see more men than women are Transportation & Warehousing (100.0%), Administrative & Support (100.0%), and Public Administration (100.0%), whereas the industries that tend to have a higher number of women are Mining, Quarrying, & Extraction (100.0%), Retail Trade (100.0%), and Real Estate, Rental & Leasing (100.0%).
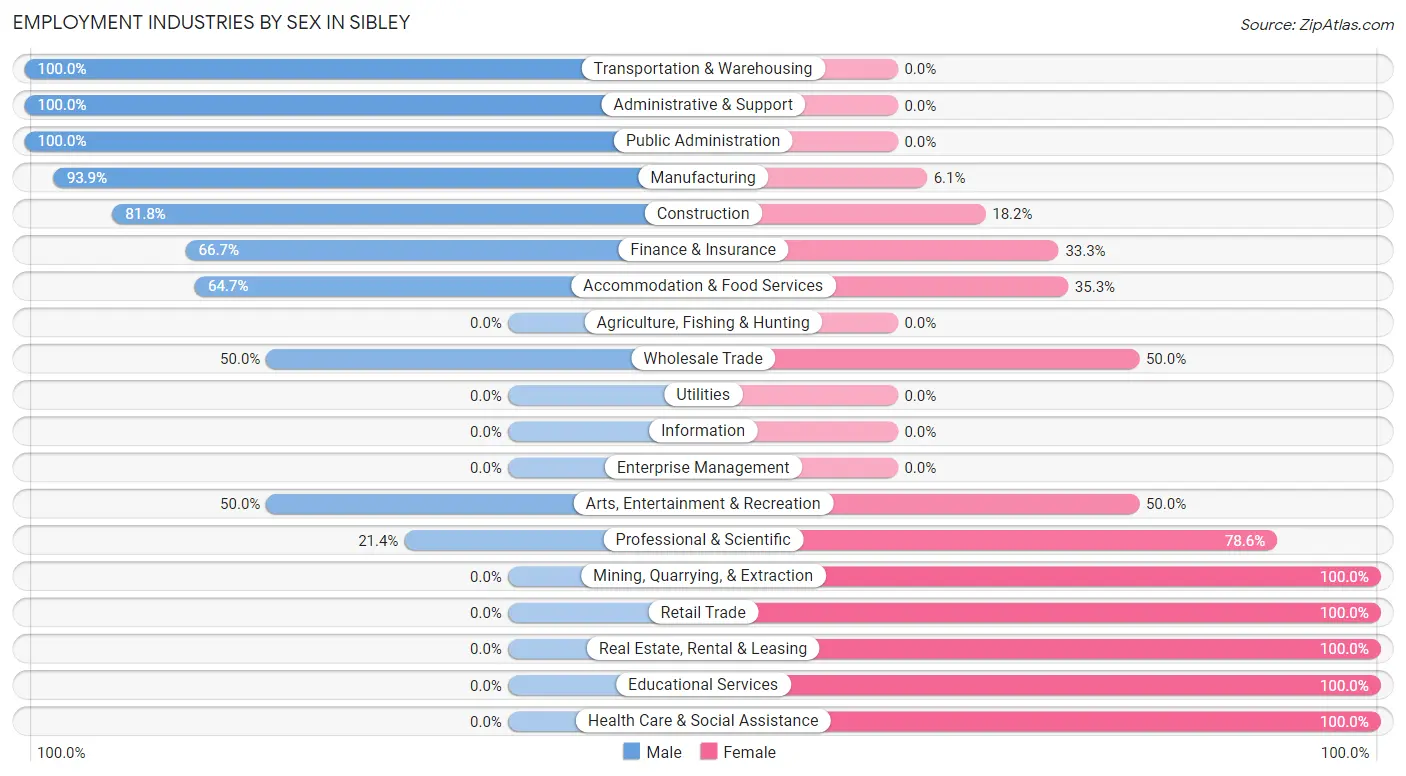
| Industry | Male | Female |
| Agriculture, Fishing & Hunting | 0 (0.0%) | 0 (0.0%) |
| Mining, Quarrying, & Extraction | 0 (0.0%) | 2 (100.0%) |
| Construction | 9 (81.8%) | 2 (18.2%) |
| Manufacturing | 31 (93.9%) | 2 (6.1%) |
| Wholesale Trade | 1 (50.0%) | 1 (50.0%) |
| Retail Trade | 0 (0.0%) | 6 (100.0%) |
| Transportation & Warehousing | 16 (100.0%) | 0 (0.0%) |
| Utilities | 0 (0.0%) | 0 (0.0%) |
| Information | 0 (0.0%) | 0 (0.0%) |
| Finance & Insurance | 8 (66.7%) | 4 (33.3%) |
| Real Estate, Rental & Leasing | 0 (0.0%) | 1 (100.0%) |
| Professional & Scientific | 3 (21.4%) | 11 (78.6%) |
| Enterprise Management | 0 (0.0%) | 0 (0.0%) |
| Administrative & Support | 9 (100.0%) | 0 (0.0%) |
| Educational Services | 0 (0.0%) | 7 (100.0%) |
| Health Care & Social Assistance | 0 (0.0%) | 22 (100.0%) |
| Arts, Entertainment & Recreation | 1 (50.0%) | 1 (50.0%) |
| Accommodation & Food Services | 11 (64.7%) | 6 (35.3%) |
| Public Administration | 1 (100.0%) | 0 (0.0%) |
| Total | 92 (53.2%) | 81 (46.8%) |
Education in Sibley
School Enrollment in Sibley
The most common levels of schooling among the 80 students in Sibley are high school (24 | 30.0%), elementary school (18 | 22.5%), and middle school (14 | 17.5%).
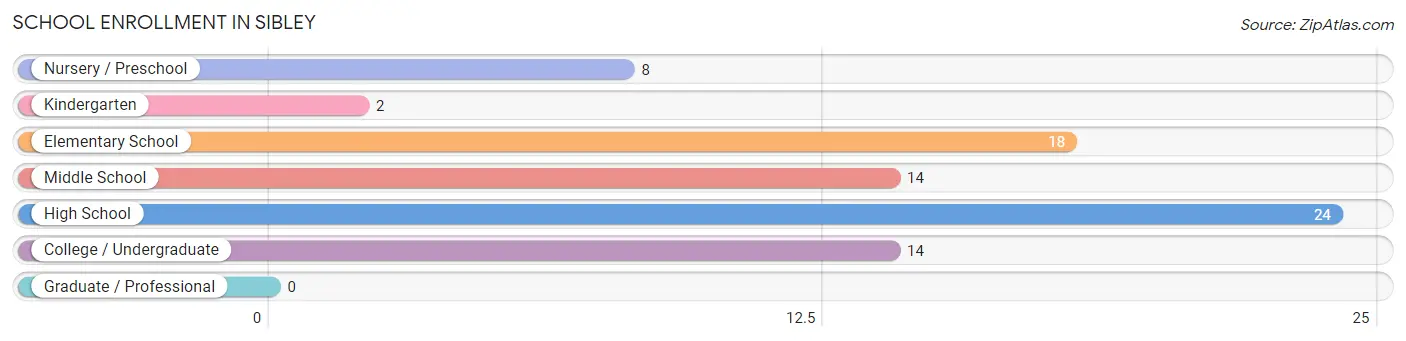
| School Level | # Students | % Students |
| Nursery / Preschool | 8 | 10.0% |
| Kindergarten | 2 | 2.5% |
| Elementary School | 18 | 22.5% |
| Middle School | 14 | 17.5% |
| High School | 24 | 30.0% |
| College / Undergraduate | 14 | 17.5% |
| Graduate / Professional | 0 | 0.0% |
| Total | 80 | 100.0% |
School Enrollment by Age by Funding Source in Sibley
Out of a total of 80 students who are enrolled in schools in Sibley, 2 (2.5%) attend a private institution, while the remaining 78 (97.5%) are enrolled in public schools. The age group of 3 to 4 year olds has the highest likelihood of being enrolled in private schools, with 2 (50.0% in the age bracket) enrolled. Conversely, the age group of 5 to 9 year old has the lowest likelihood of being enrolled in a private school, with 23 (100.0% in the age bracket) attending a public institution.
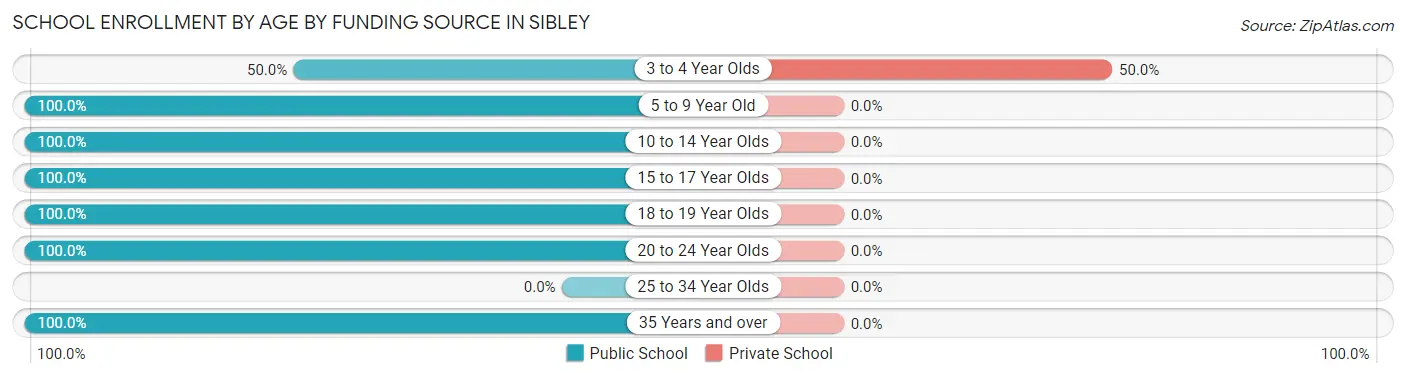
| Age Bracket | Public School | Private School |
| 3 to 4 Year Olds | 2 (50.0%) | 2 (50.0%) |
| 5 to 9 Year Old | 23 (100.0%) | 0 (0.0%) |
| 10 to 14 Year Olds | 18 (100.0%) | 0 (0.0%) |
| 15 to 17 Year Olds | 21 (100.0%) | 0 (0.0%) |
| 18 to 19 Year Olds | 1 (100.0%) | 0 (0.0%) |
| 20 to 24 Year Olds | 6 (100.0%) | 0 (0.0%) |
| 25 to 34 Year Olds | 0 (0.0%) | 0 (0.0%) |
| 35 Years and over | 7 (100.0%) | 0 (0.0%) |
| Total | 78 (97.5%) | 2 (2.5%) |
Educational Attainment by Field of Study in Sibley
Business (12 | 30.8%), bio, nature & agricultural (9 | 23.1%), science & technology (8 | 20.5%), computers & mathematics (3 | 7.7%), and psychology (2 | 5.1%) are the most common fields of study among 39 individuals in Sibley who have obtained a bachelor's degree or higher.
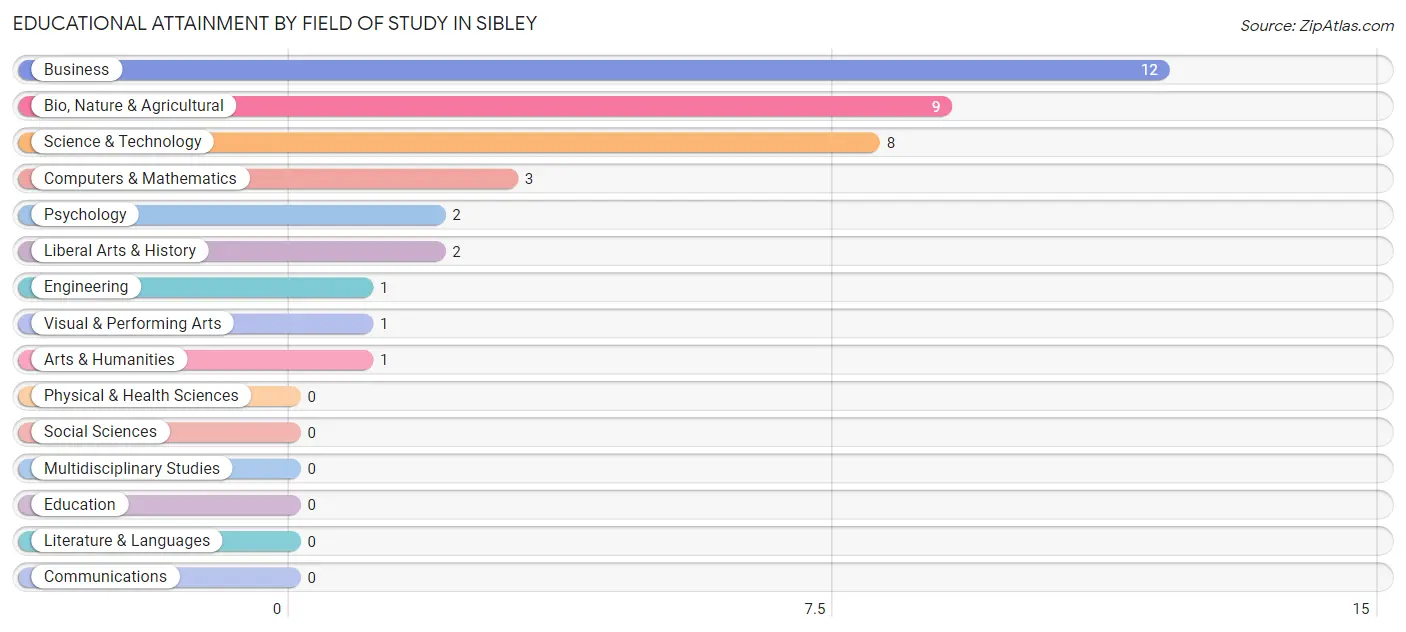
| Field of Study | # Graduates | % Graduates |
| Computers & Mathematics | 3 | 7.7% |
| Bio, Nature & Agricultural | 9 | 23.1% |
| Physical & Health Sciences | 0 | 0.0% |
| Psychology | 2 | 5.1% |
| Social Sciences | 0 | 0.0% |
| Engineering | 1 | 2.6% |
| Multidisciplinary Studies | 0 | 0.0% |
| Science & Technology | 8 | 20.5% |
| Business | 12 | 30.8% |
| Education | 0 | 0.0% |
| Literature & Languages | 0 | 0.0% |
| Liberal Arts & History | 2 | 5.1% |
| Visual & Performing Arts | 1 | 2.6% |
| Communications | 0 | 0.0% |
| Arts & Humanities | 1 | 2.6% |
| Total | 39 | 100.0% |
Transportation & Commute in Sibley
Vehicle Availability by Sex in Sibley
The most prevalent vehicle ownership categories in Sibley are males with 4 vehicles (32, accounting for 36.4%) and females with 4 vehicles (36, making up 41.6%).
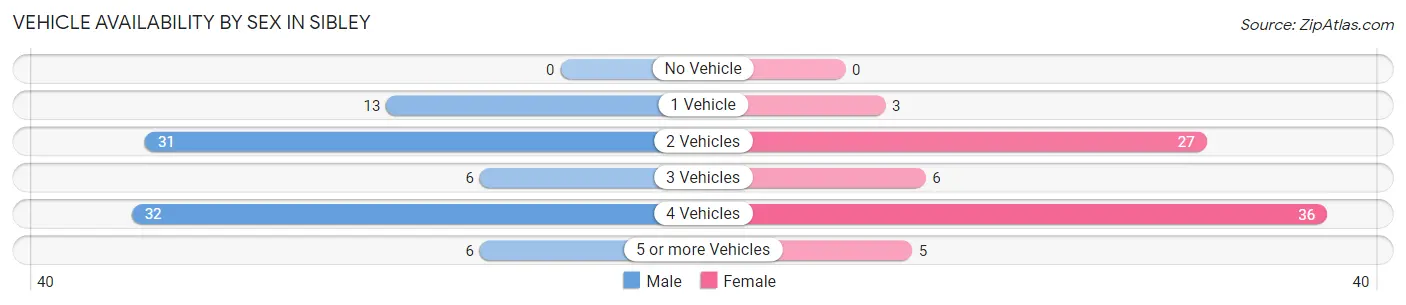
| Vehicles Available | Male | Female |
| No Vehicle | 0 (0.0%) | 0 (0.0%) |
| 1 Vehicle | 13 (14.8%) | 3 (3.9%) |
| 2 Vehicles | 31 (35.2%) | 27 (35.1%) |
| 3 Vehicles | 6 (6.8%) | 6 (7.8%) |
| 4 Vehicles | 32 (36.4%) | 36 (46.8%) |
| 5 or more Vehicles | 6 (6.8%) | 5 (6.5%) |
| Total | 88 (100.0%) | 77 (100.0%) |
Commute Time in Sibley
The most frequently occuring commute durations in Sibley are 45 to 59 minutes (40 commuters, 25.6%), 5 to 9 minutes (24 commuters, 15.4%), and 20 to 24 minutes (19 commuters, 12.2%).
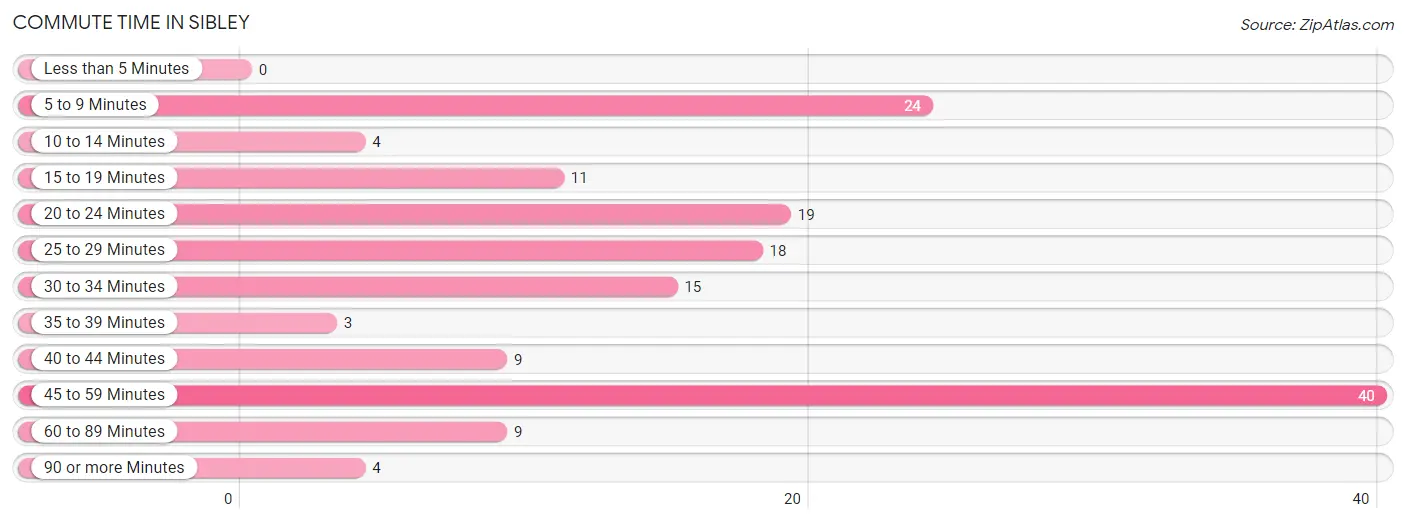
| Commute Time | # Commuters | % Commuters |
| Less than 5 Minutes | 0 | 0.0% |
| 5 to 9 Minutes | 24 | 15.4% |
| 10 to 14 Minutes | 4 | 2.6% |
| 15 to 19 Minutes | 11 | 7.0% |
| 20 to 24 Minutes | 19 | 12.2% |
| 25 to 29 Minutes | 18 | 11.5% |
| 30 to 34 Minutes | 15 | 9.6% |
| 35 to 39 Minutes | 3 | 1.9% |
| 40 to 44 Minutes | 9 | 5.8% |
| 45 to 59 Minutes | 40 | 25.6% |
| 60 to 89 Minutes | 9 | 5.8% |
| 90 or more Minutes | 4 | 2.6% |
Commute Time by Sex in Sibley
The most common commute times in Sibley are 45 to 59 minutes (14 commuters, 16.5%) for males and 45 to 59 minutes (26 commuters, 36.6%) for females.
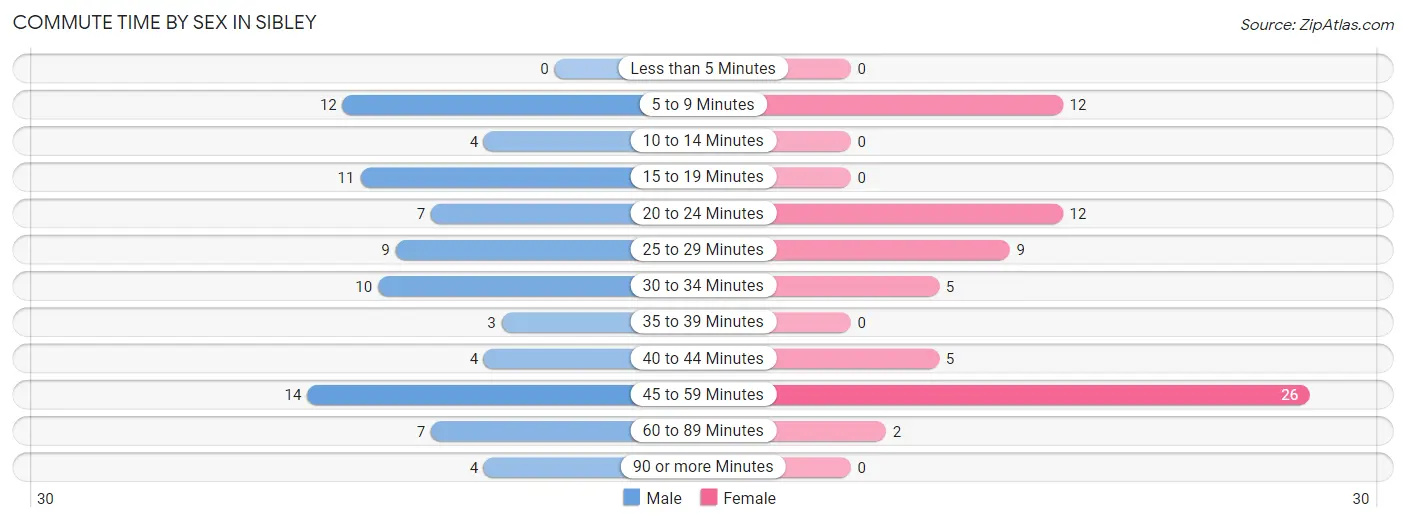
| Commute Time | Male | Female |
| Less than 5 Minutes | 0 (0.0%) | 0 (0.0%) |
| 5 to 9 Minutes | 12 (14.1%) | 12 (16.9%) |
| 10 to 14 Minutes | 4 (4.7%) | 0 (0.0%) |
| 15 to 19 Minutes | 11 (12.9%) | 0 (0.0%) |
| 20 to 24 Minutes | 7 (8.2%) | 12 (16.9%) |
| 25 to 29 Minutes | 9 (10.6%) | 9 (12.7%) |
| 30 to 34 Minutes | 10 (11.8%) | 5 (7.0%) |
| 35 to 39 Minutes | 3 (3.5%) | 0 (0.0%) |
| 40 to 44 Minutes | 4 (4.7%) | 5 (7.0%) |
| 45 to 59 Minutes | 14 (16.5%) | 26 (36.6%) |
| 60 to 89 Minutes | 7 (8.2%) | 2 (2.8%) |
| 90 or more Minutes | 4 (4.7%) | 0 (0.0%) |
Time of Departure to Work by Sex in Sibley
The most frequent times of departure to work in Sibley are 12:00 AM to 4:59 AM (22, 25.9%) for males and 7:00 AM to 7:29 AM (15, 21.1%) for females.
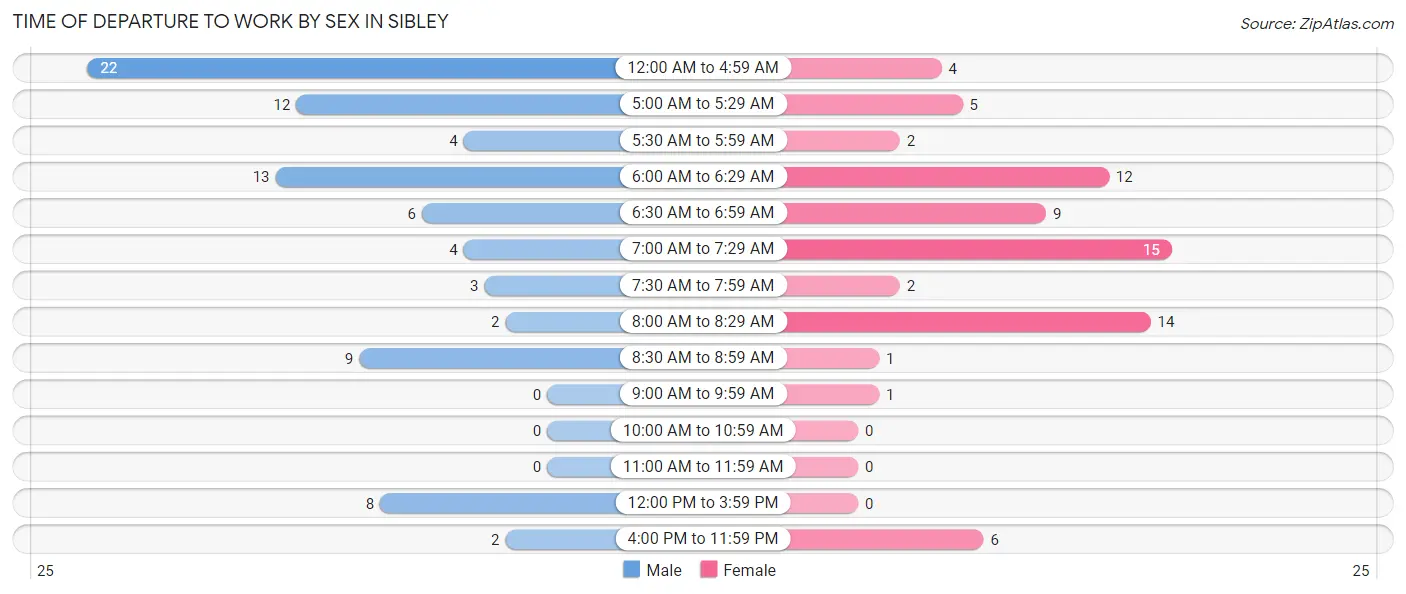
| Time of Departure | Male | Female |
| 12:00 AM to 4:59 AM | 22 (25.9%) | 4 (5.6%) |
| 5:00 AM to 5:29 AM | 12 (14.1%) | 5 (7.0%) |
| 5:30 AM to 5:59 AM | 4 (4.7%) | 2 (2.8%) |
| 6:00 AM to 6:29 AM | 13 (15.3%) | 12 (16.9%) |
| 6:30 AM to 6:59 AM | 6 (7.1%) | 9 (12.7%) |
| 7:00 AM to 7:29 AM | 4 (4.7%) | 15 (21.1%) |
| 7:30 AM to 7:59 AM | 3 (3.5%) | 2 (2.8%) |
| 8:00 AM to 8:29 AM | 2 (2.4%) | 14 (19.7%) |
| 8:30 AM to 8:59 AM | 9 (10.6%) | 1 (1.4%) |
| 9:00 AM to 9:59 AM | 0 (0.0%) | 1 (1.4%) |
| 10:00 AM to 10:59 AM | 0 (0.0%) | 0 (0.0%) |
| 11:00 AM to 11:59 AM | 0 (0.0%) | 0 (0.0%) |
| 12:00 PM to 3:59 PM | 8 (9.4%) | 0 (0.0%) |
| 4:00 PM to 11:59 PM | 2 (2.4%) | 6 (8.5%) |
| Total | 85 (100.0%) | 71 (100.0%) |
Housing Occupancy in Sibley
Occupancy by Ownership in Sibley
Of the total 130 dwellings in Sibley, owner-occupied units account for 110 (84.6%), while renter-occupied units make up 20 (15.4%).
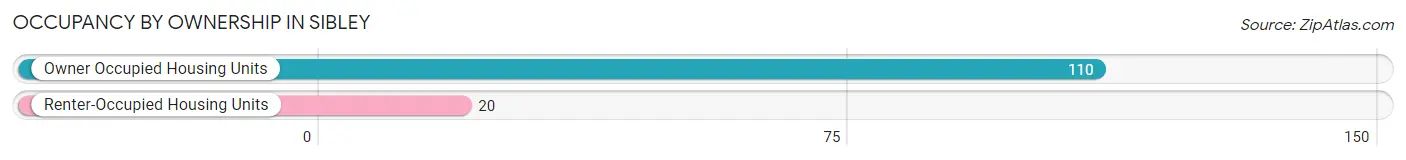
| Occupancy | # Housing Units | % Housing Units |
| Owner Occupied Housing Units | 110 | 84.6% |
| Renter-Occupied Housing Units | 20 | 15.4% |
| Total Occupied Housing Units | 130 | 100.0% |
Occupancy by Household Size in Sibley
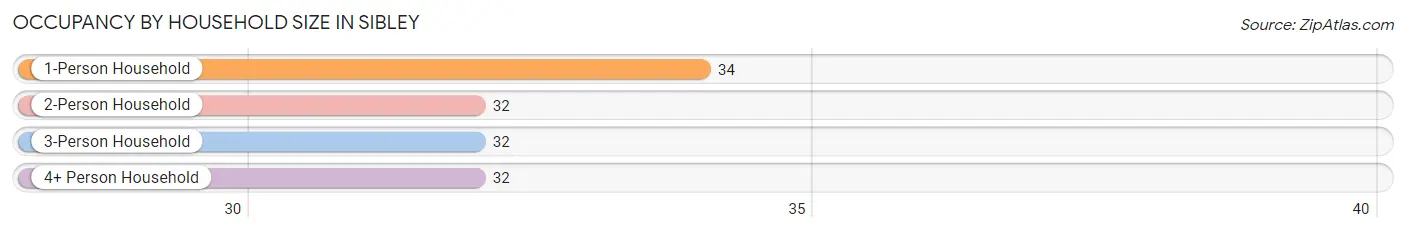
| Household Size | # Housing Units | % Housing Units |
| 1-Person Household | 34 | 26.2% |
| 2-Person Household | 32 | 24.6% |
| 3-Person Household | 32 | 24.6% |
| 4+ Person Household | 32 | 24.6% |
| Total Housing Units | 130 | 100.0% |
Occupancy by Ownership by Household Size in Sibley
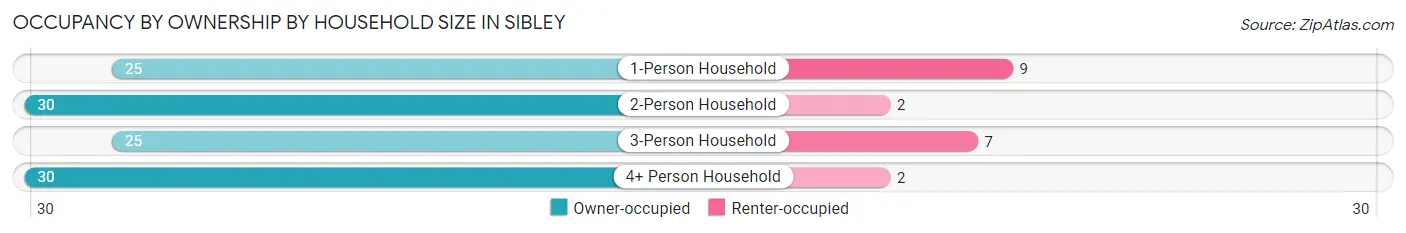
| Household Size | Owner-occupied | Renter-occupied |
| 1-Person Household | 25 (73.5%) | 9 (26.5%) |
| 2-Person Household | 30 (93.8%) | 2 (6.2%) |
| 3-Person Household | 25 (78.1%) | 7 (21.9%) |
| 4+ Person Household | 30 (93.8%) | 2 (6.2%) |
| Total Housing Units | 110 (84.6%) | 20 (15.4%) |
Occupancy by Educational Attainment in Sibley
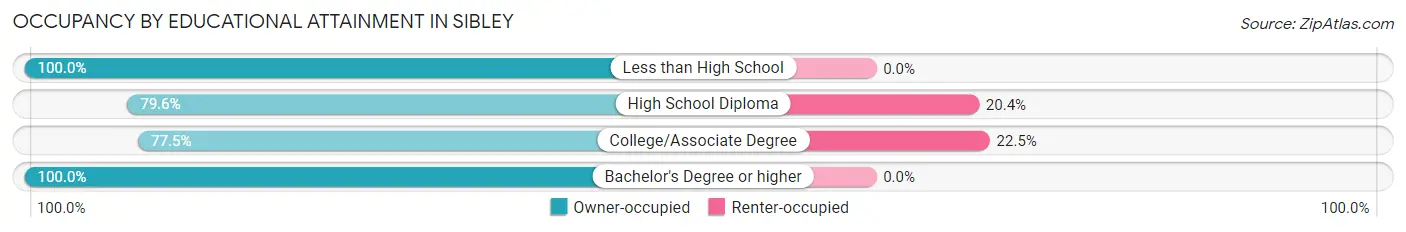
| Household Size | Owner-occupied | Renter-occupied |
| Less than High School | 16 (100.0%) | 0 (0.0%) |
| High School Diploma | 43 (79.6%) | 11 (20.4%) |
| College/Associate Degree | 31 (77.5%) | 9 (22.5%) |
| Bachelor's Degree or higher | 20 (100.0%) | 0 (0.0%) |
Occupancy by Age of Householder in Sibley
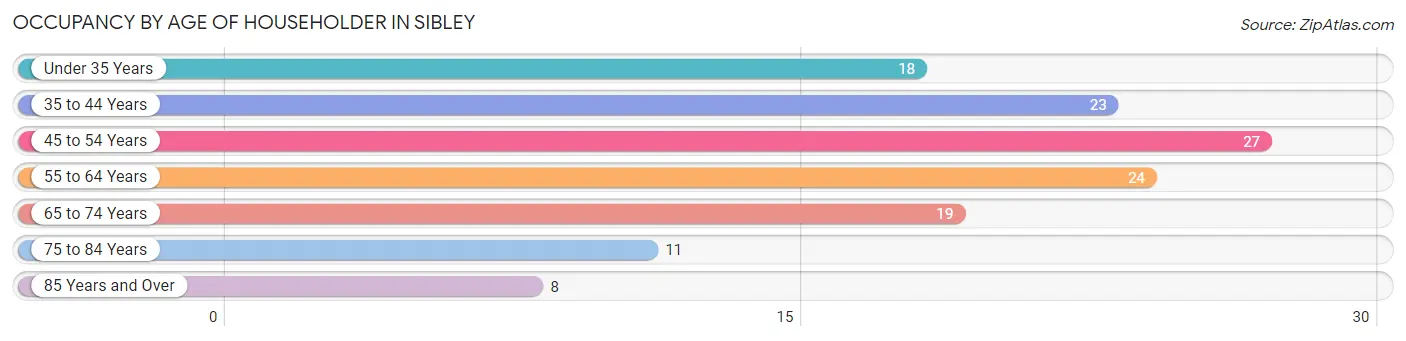
| Age Bracket | # Households | % Households |
| Under 35 Years | 18 | 13.9% |
| 35 to 44 Years | 23 | 17.7% |
| 45 to 54 Years | 27 | 20.8% |
| 55 to 64 Years | 24 | 18.5% |
| 65 to 74 Years | 19 | 14.6% |
| 75 to 84 Years | 11 | 8.5% |
| 85 Years and Over | 8 | 6.1% |
| Total | 130 | 100.0% |
Housing Finances in Sibley
Median Income by Occupancy in Sibley
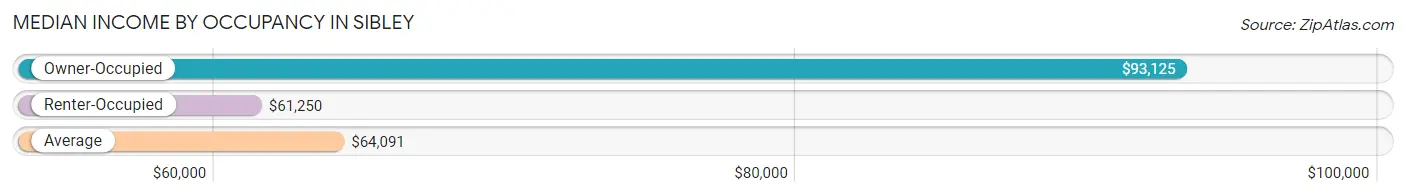
| Occupancy Type | # Households | Median Income |
| Owner-Occupied | 110 (84.6%) | $93,125 |
| Renter-Occupied | 20 (15.4%) | $61,250 |
| Average | 130 (100.0%) | $64,091 |
Occupancy by Householder Income Bracket in Sibley
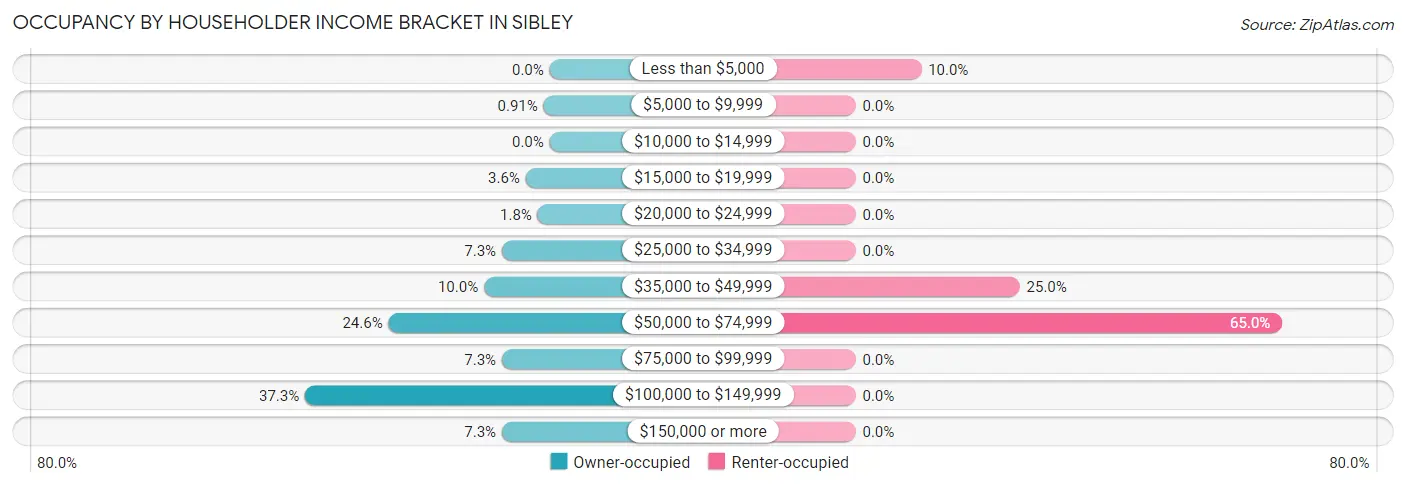
| Income Bracket | Owner-occupied | Renter-occupied |
| Less than $5,000 | 0 (0.0%) | 2 (10.0%) |
| $5,000 to $9,999 | 1 (0.9%) | 0 (0.0%) |
| $10,000 to $14,999 | 0 (0.0%) | 0 (0.0%) |
| $15,000 to $19,999 | 4 (3.6%) | 0 (0.0%) |
| $20,000 to $24,999 | 2 (1.8%) | 0 (0.0%) |
| $25,000 to $34,999 | 8 (7.3%) | 0 (0.0%) |
| $35,000 to $49,999 | 11 (10.0%) | 5 (25.0%) |
| $50,000 to $74,999 | 27 (24.5%) | 13 (65.0%) |
| $75,000 to $99,999 | 8 (7.3%) | 0 (0.0%) |
| $100,000 to $149,999 | 41 (37.3%) | 0 (0.0%) |
| $150,000 or more | 8 (7.3%) | 0 (0.0%) |
| Total | 110 (100.0%) | 20 (100.0%) |
Monthly Housing Cost Tiers in Sibley
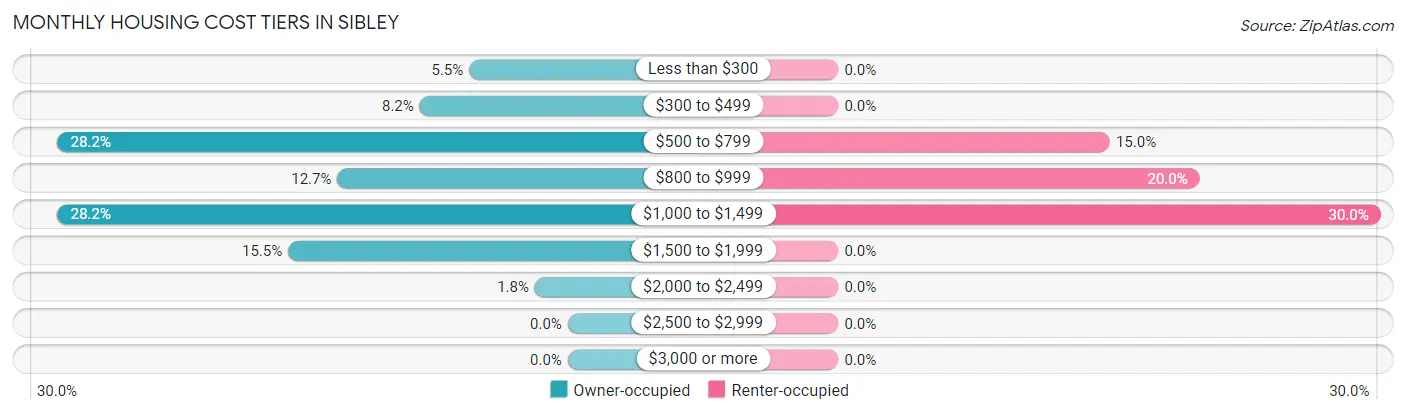
| Monthly Cost | Owner-occupied | Renter-occupied |
| Less than $300 | 6 (5.4%) | 0 (0.0%) |
| $300 to $499 | 9 (8.2%) | 0 (0.0%) |
| $500 to $799 | 31 (28.2%) | 3 (15.0%) |
| $800 to $999 | 14 (12.7%) | 4 (20.0%) |
| $1,000 to $1,499 | 31 (28.2%) | 6 (30.0%) |
| $1,500 to $1,999 | 17 (15.4%) | 0 (0.0%) |
| $2,000 to $2,499 | 2 (1.8%) | 0 (0.0%) |
| $2,500 to $2,999 | 0 (0.0%) | 0 (0.0%) |
| $3,000 or more | 0 (0.0%) | 0 (0.0%) |
| Total | 110 (100.0%) | 20 (100.0%) |
Physical Housing Characteristics in Sibley
Housing Structures in Sibley
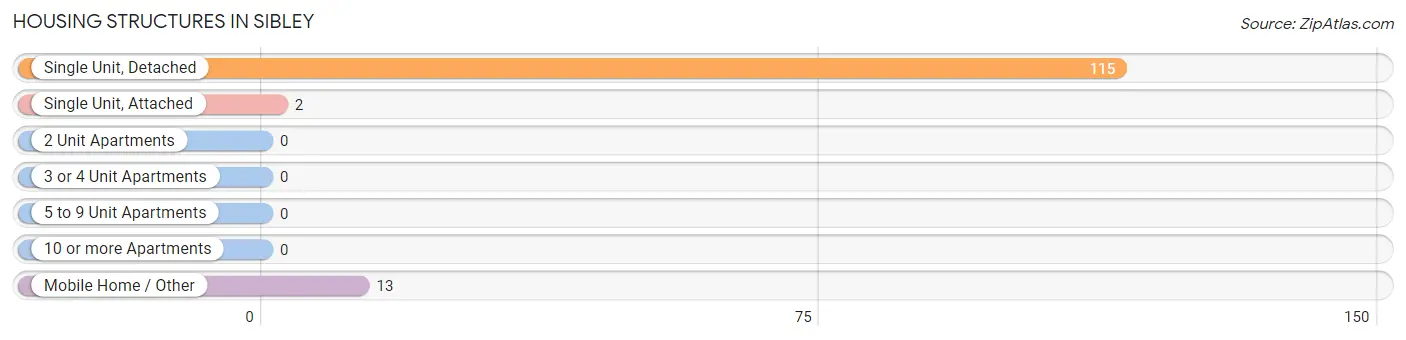
| Structure Type | # Housing Units | % Housing Units |
| Single Unit, Detached | 115 | 88.5% |
| Single Unit, Attached | 2 | 1.5% |
| 2 Unit Apartments | 0 | 0.0% |
| 3 or 4 Unit Apartments | 0 | 0.0% |
| 5 to 9 Unit Apartments | 0 | 0.0% |
| 10 or more Apartments | 0 | 0.0% |
| Mobile Home / Other | 13 | 10.0% |
| Total | 130 | 100.0% |
Housing Structures by Occupancy in Sibley
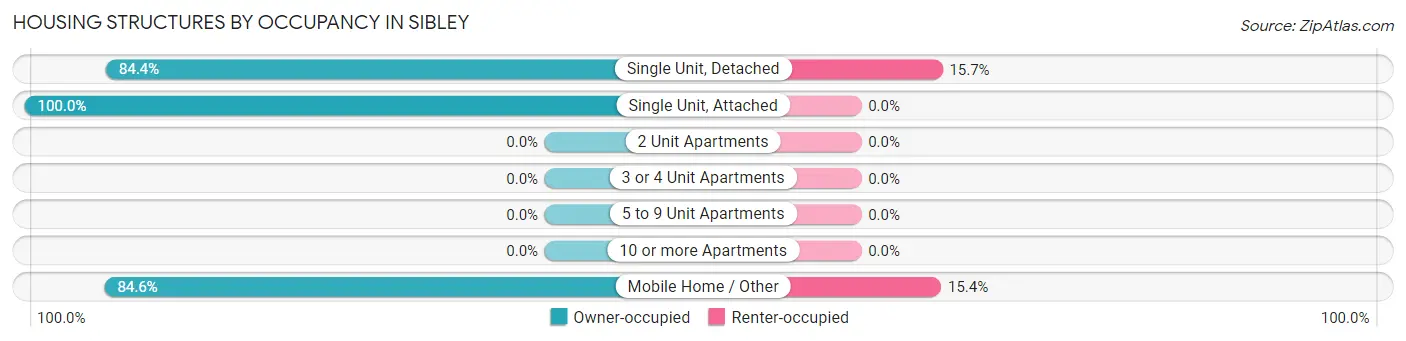
| Structure Type | Owner-occupied | Renter-occupied |
| Single Unit, Detached | 97 (84.4%) | 18 (15.7%) |
| Single Unit, Attached | 2 (100.0%) | 0 (0.0%) |
| 2 Unit Apartments | 0 (0.0%) | 0 (0.0%) |
| 3 or 4 Unit Apartments | 0 (0.0%) | 0 (0.0%) |
| 5 to 9 Unit Apartments | 0 (0.0%) | 0 (0.0%) |
| 10 or more Apartments | 0 (0.0%) | 0 (0.0%) |
| Mobile Home / Other | 11 (84.6%) | 2 (15.4%) |
| Total | 110 (84.6%) | 20 (15.4%) |
Housing Structures by Number of Rooms in Sibley
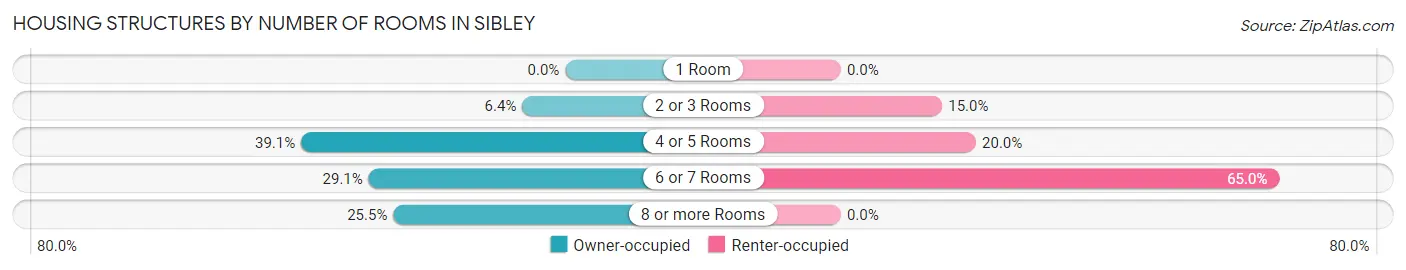
| Number of Rooms | Owner-occupied | Renter-occupied |
| 1 Room | 0 (0.0%) | 0 (0.0%) |
| 2 or 3 Rooms | 7 (6.4%) | 3 (15.0%) |
| 4 or 5 Rooms | 43 (39.1%) | 4 (20.0%) |
| 6 or 7 Rooms | 32 (29.1%) | 13 (65.0%) |
| 8 or more Rooms | 28 (25.5%) | 0 (0.0%) |
| Total | 110 (100.0%) | 20 (100.0%) |
Housing Structure by Heating Type in Sibley
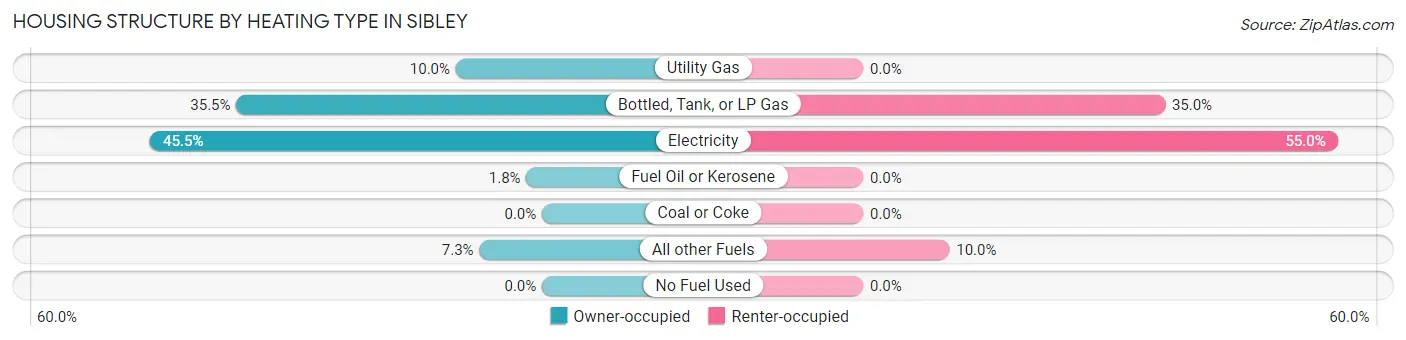
| Heating Type | Owner-occupied | Renter-occupied |
| Utility Gas | 11 (10.0%) | 0 (0.0%) |
| Bottled, Tank, or LP Gas | 39 (35.4%) | 7 (35.0%) |
| Electricity | 50 (45.5%) | 11 (55.0%) |
| Fuel Oil or Kerosene | 2 (1.8%) | 0 (0.0%) |
| Coal or Coke | 0 (0.0%) | 0 (0.0%) |
| All other Fuels | 8 (7.3%) | 2 (10.0%) |
| No Fuel Used | 0 (0.0%) | 0 (0.0%) |
| Total | 110 (100.0%) | 20 (100.0%) |
Household Vehicle Usage in Sibley
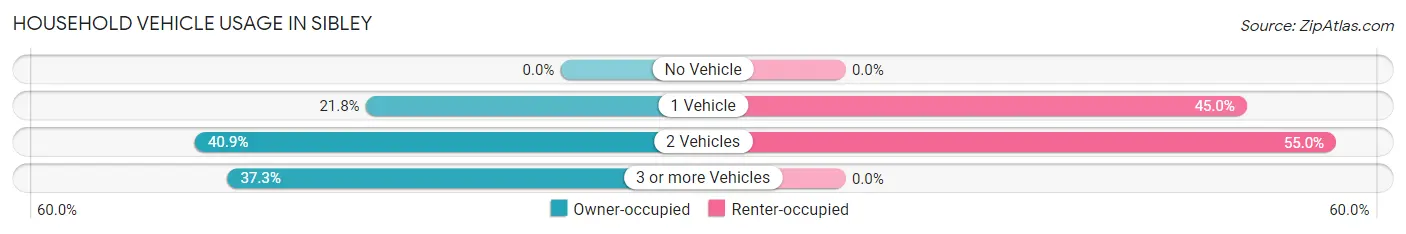
| Vehicles per Household | Owner-occupied | Renter-occupied |
| No Vehicle | 0 (0.0%) | 0 (0.0%) |
| 1 Vehicle | 24 (21.8%) | 9 (45.0%) |
| 2 Vehicles | 45 (40.9%) | 11 (55.0%) |
| 3 or more Vehicles | 41 (37.3%) | 0 (0.0%) |
| Total | 110 (100.0%) | 20 (100.0%) |
Real Estate & Mortgages in Sibley
Real Estate and Mortgage Overview in Sibley
| Characteristic | Without Mortgage | With Mortgage |
| Housing Units | 47 | 63 |
| Median Property Value | $127,500 | $122,800 |
| Median Household Income | $53,750 | $7 |
| Monthly Housing Costs | $586 | $0 |
| Real Estate Taxes | $1,825 | $0 |
Property Value by Mortgage Status in Sibley
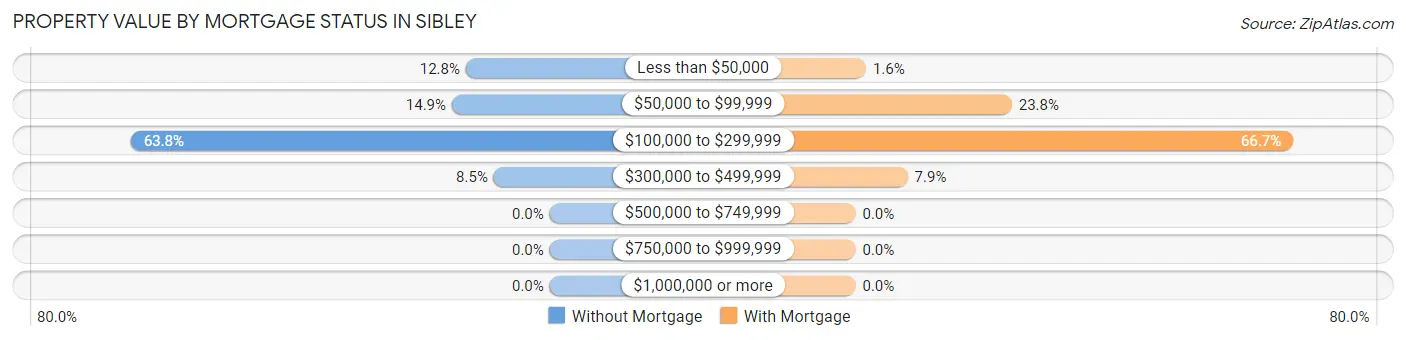
| Property Value | Without Mortgage | With Mortgage |
| Less than $50,000 | 6 (12.8%) | 1 (1.6%) |
| $50,000 to $99,999 | 7 (14.9%) | 15 (23.8%) |
| $100,000 to $299,999 | 30 (63.8%) | 42 (66.7%) |
| $300,000 to $499,999 | 4 (8.5%) | 5 (7.9%) |
| $500,000 to $749,999 | 0 (0.0%) | 0 (0.0%) |
| $750,000 to $999,999 | 0 (0.0%) | 0 (0.0%) |
| $1,000,000 or more | 0 (0.0%) | 0 (0.0%) |
| Total | 47 (100.0%) | 63 (100.0%) |
Household Income by Mortgage Status in Sibley
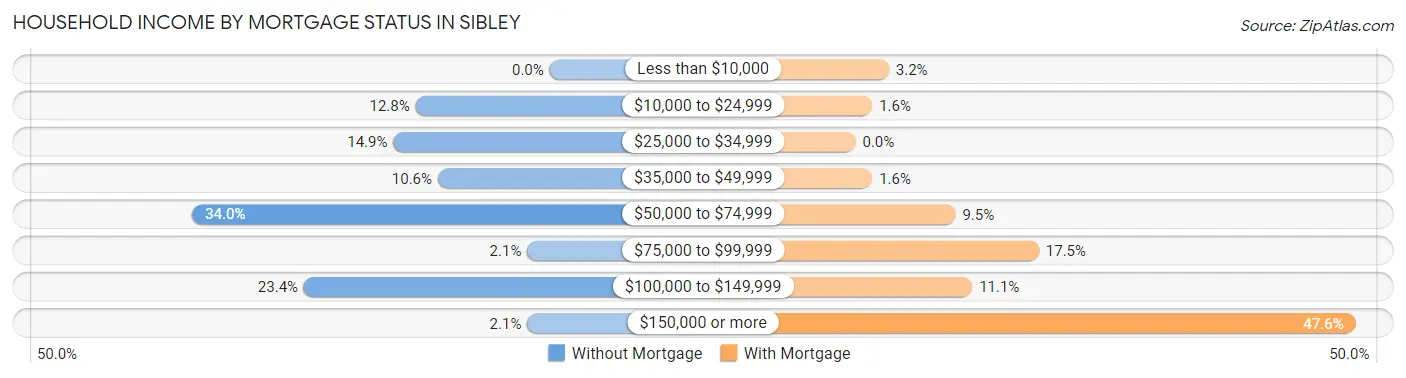
| Household Income | Without Mortgage | With Mortgage |
| Less than $10,000 | 0 (0.0%) | 2 (3.2%) |
| $10,000 to $24,999 | 6 (12.8%) | 1 (1.6%) |
| $25,000 to $34,999 | 7 (14.9%) | 0 (0.0%) |
| $35,000 to $49,999 | 5 (10.6%) | 1 (1.6%) |
| $50,000 to $74,999 | 16 (34.0%) | 6 (9.5%) |
| $75,000 to $99,999 | 1 (2.1%) | 11 (17.5%) |
| $100,000 to $149,999 | 11 (23.4%) | 7 (11.1%) |
| $150,000 or more | 1 (2.1%) | 30 (47.6%) |
| Total | 47 (100.0%) | 63 (100.0%) |
Property Value to Household Income Ratio in Sibley
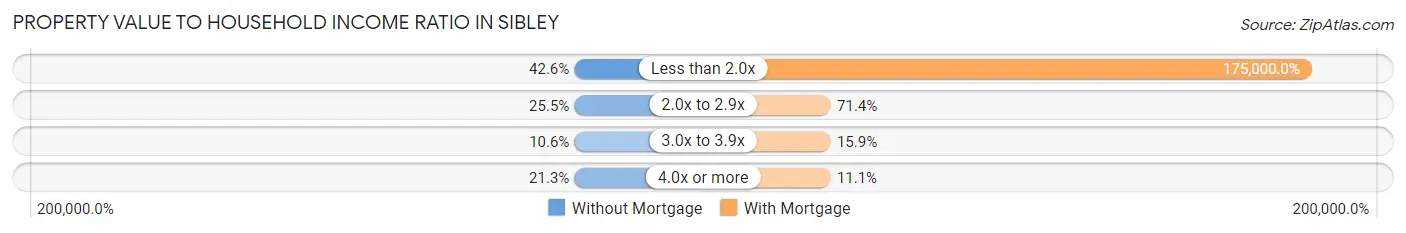
| Value-to-Income Ratio | Without Mortgage | With Mortgage |
| Less than 2.0x | 20 (42.5%) | 110,250 (175,000.0%) |
| 2.0x to 2.9x | 12 (25.5%) | 45 (71.4%) |
| 3.0x to 3.9x | 5 (10.6%) | 10 (15.9%) |
| 4.0x or more | 10 (21.3%) | 7 (11.1%) |
| Total | 47 (100.0%) | 63 (100.0%) |
Real Estate Taxes by Mortgage Status in Sibley
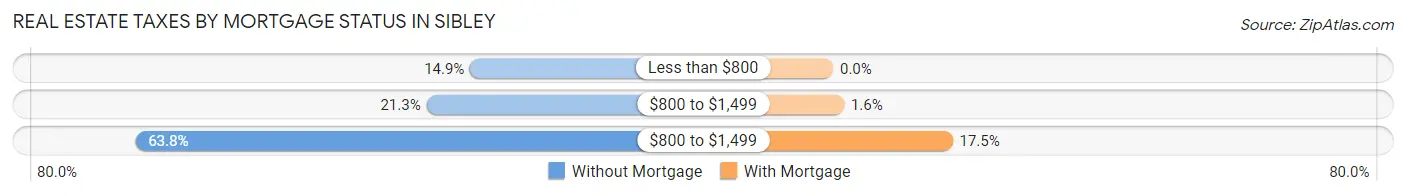
| Property Taxes | Without Mortgage | With Mortgage |
| Less than $800 | 7 (14.9%) | 0 (0.0%) |
| $800 to $1,499 | 10 (21.3%) | 1 (1.6%) |
| $800 to $1,499 | 30 (63.8%) | 11 (17.5%) |
| Total | 47 (100.0%) | 63 (100.0%) |
Health & Disability in Sibley
Health Insurance Coverage by Age in Sibley
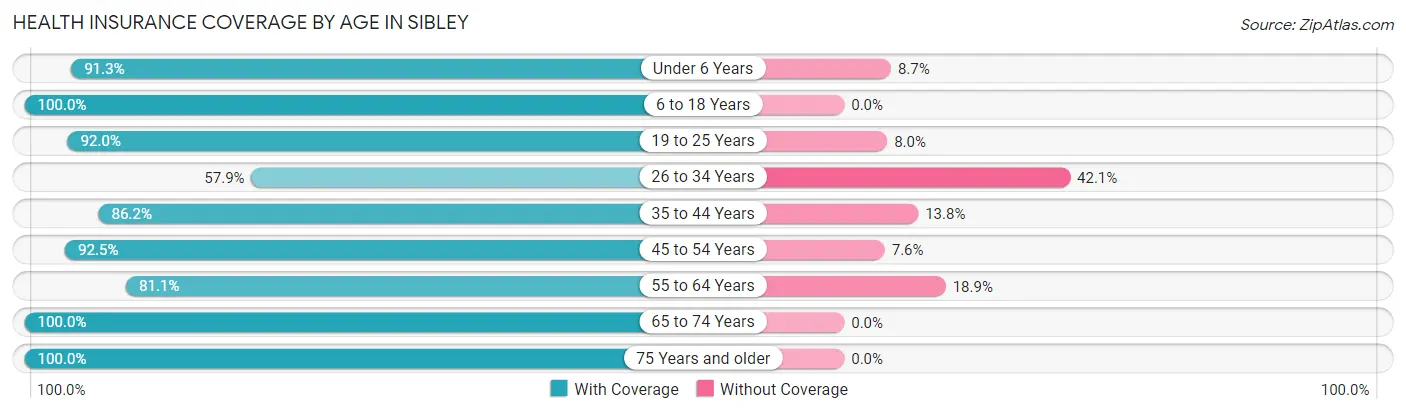
| Age Bracket | With Coverage | Without Coverage |
| Under 6 Years | 21 (91.3%) | 2 (8.7%) |
| 6 to 18 Years | 64 (100.0%) | 0 (0.0%) |
| 19 to 25 Years | 23 (92.0%) | 2 (8.0%) |
| 26 to 34 Years | 22 (57.9%) | 16 (42.1%) |
| 35 to 44 Years | 50 (86.2%) | 8 (13.8%) |
| 45 to 54 Years | 49 (92.4%) | 4 (7.5%) |
| 55 to 64 Years | 30 (81.1%) | 7 (18.9%) |
| 65 to 74 Years | 34 (100.0%) | 0 (0.0%) |
| 75 Years and older | 24 (100.0%) | 0 (0.0%) |
| Total | 317 (89.0%) | 39 (11.0%) |
Health Insurance Coverage by Citizenship Status in Sibley
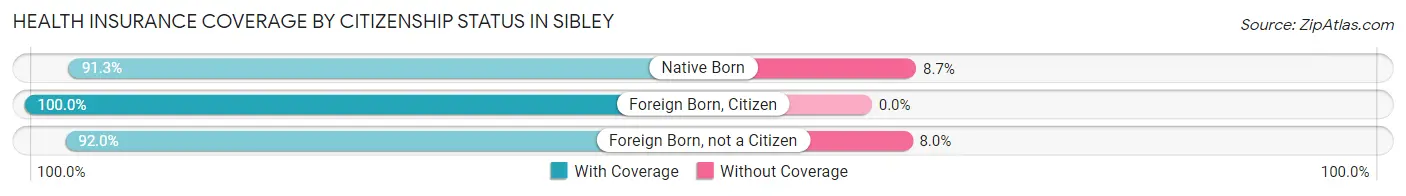
| Citizenship Status | With Coverage | Without Coverage |
| Native Born | 21 (91.3%) | 2 (8.7%) |
| Foreign Born, Citizen | 64 (100.0%) | 0 (0.0%) |
| Foreign Born, not a Citizen | 23 (92.0%) | 2 (8.0%) |
Health Insurance Coverage by Household Income in Sibley
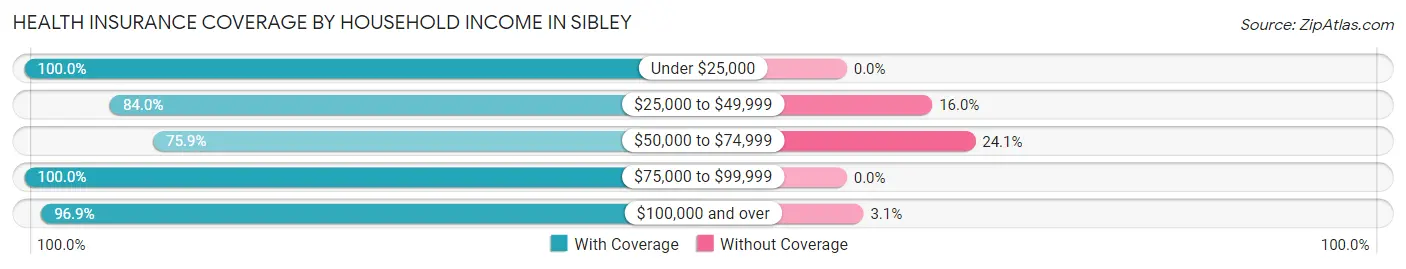
| Household Income | With Coverage | Without Coverage |
| Under $25,000 | 9 (100.0%) | 0 (0.0%) |
| $25,000 to $49,999 | 42 (84.0%) | 8 (16.0%) |
| $50,000 to $74,999 | 82 (75.9%) | 26 (24.1%) |
| $75,000 to $99,999 | 29 (100.0%) | 0 (0.0%) |
| $100,000 and over | 155 (96.9%) | 5 (3.1%) |
Public vs Private Health Insurance Coverage by Age in Sibley
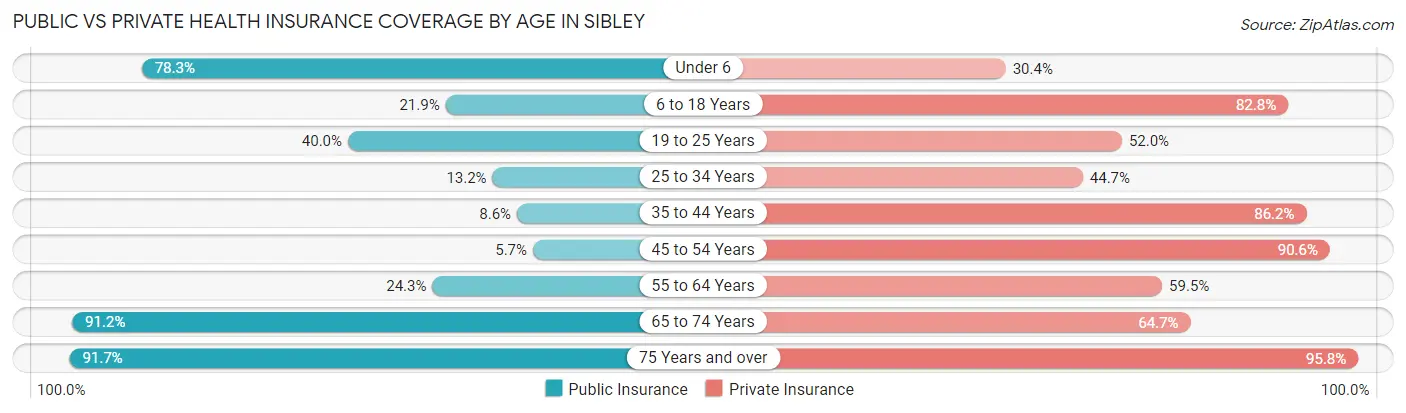
| Age Bracket | Public Insurance | Private Insurance |
| Under 6 | 18 (78.3%) | 7 (30.4%) |
| 6 to 18 Years | 14 (21.9%) | 53 (82.8%) |
| 19 to 25 Years | 10 (40.0%) | 13 (52.0%) |
| 25 to 34 Years | 5 (13.2%) | 17 (44.7%) |
| 35 to 44 Years | 5 (8.6%) | 50 (86.2%) |
| 45 to 54 Years | 3 (5.7%) | 48 (90.6%) |
| 55 to 64 Years | 9 (24.3%) | 22 (59.5%) |
| 65 to 74 Years | 31 (91.2%) | 22 (64.7%) |
| 75 Years and over | 22 (91.7%) | 23 (95.8%) |
| Total | 117 (32.9%) | 255 (71.6%) |
Disability Status by Sex by Age in Sibley
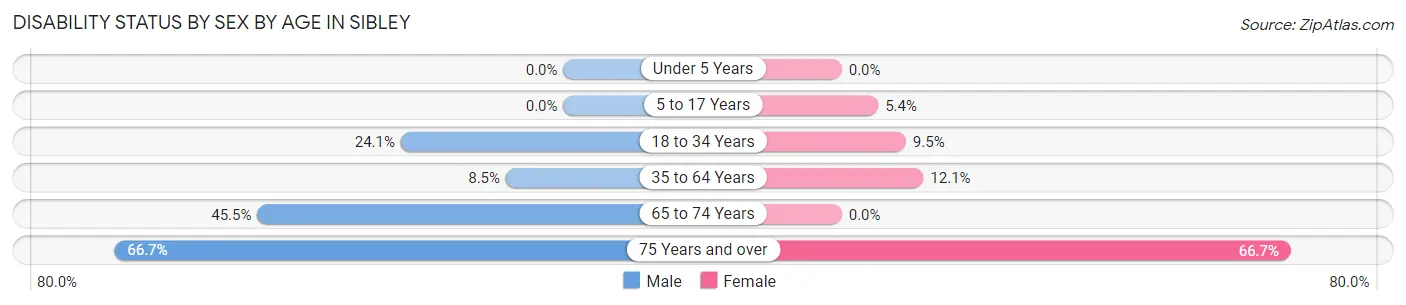
| Age Bracket | Male | Female |
| Under 5 Years | 0 (0.0%) | 0 (0.0%) |
| 5 to 17 Years | 0 (0.0%) | 2 (5.4%) |
| 18 to 34 Years | 7 (24.1%) | 4 (9.5%) |
| 35 to 64 Years | 7 (8.5%) | 8 (12.1%) |
| 65 to 74 Years | 10 (45.5%) | 0 (0.0%) |
| 75 Years and over | 8 (66.7%) | 8 (66.7%) |
Disability Class by Sex by Age in Sibley
Disability Class: Hearing Difficulty
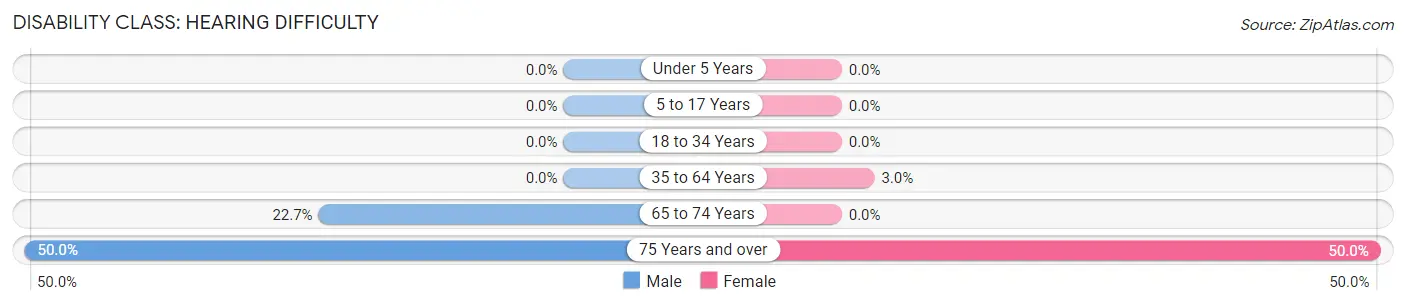
| Age Bracket | Male | Female |
| Under 5 Years | 0 (0.0%) | 0 (0.0%) |
| 5 to 17 Years | 0 (0.0%) | 0 (0.0%) |
| 18 to 34 Years | 0 (0.0%) | 0 (0.0%) |
| 35 to 64 Years | 0 (0.0%) | 2 (3.0%) |
| 65 to 74 Years | 5 (22.7%) | 0 (0.0%) |
| 75 Years and over | 6 (50.0%) | 6 (50.0%) |
Disability Class: Vision Difficulty
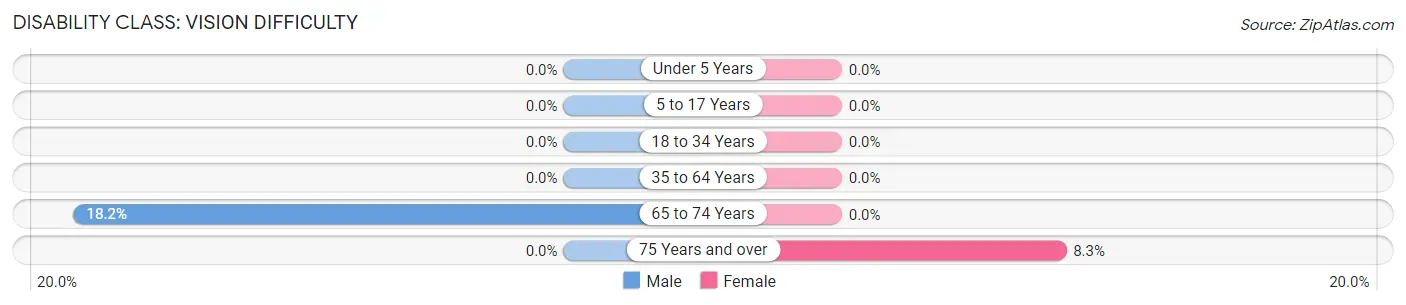
| Age Bracket | Male | Female |
| Under 5 Years | 0 (0.0%) | 0 (0.0%) |
| 5 to 17 Years | 0 (0.0%) | 0 (0.0%) |
| 18 to 34 Years | 0 (0.0%) | 0 (0.0%) |
| 35 to 64 Years | 0 (0.0%) | 0 (0.0%) |
| 65 to 74 Years | 4 (18.2%) | 0 (0.0%) |
| 75 Years and over | 0 (0.0%) | 1 (8.3%) |
Disability Class: Cognitive Difficulty
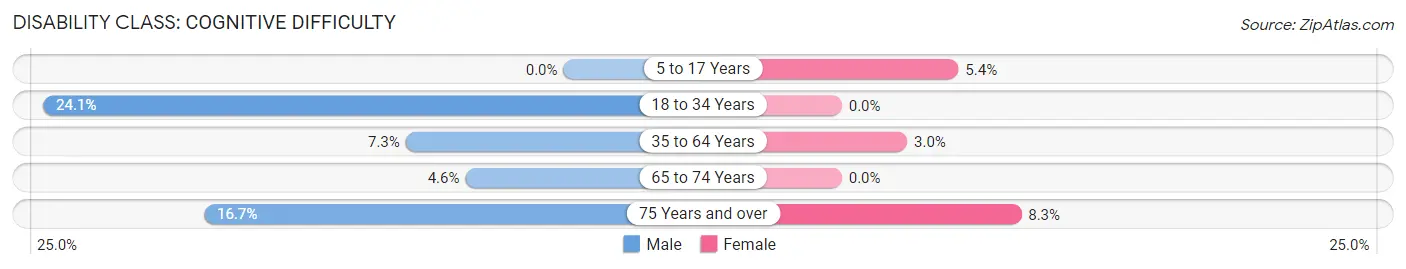
| Age Bracket | Male | Female |
| 5 to 17 Years | 0 (0.0%) | 2 (5.4%) |
| 18 to 34 Years | 7 (24.1%) | 0 (0.0%) |
| 35 to 64 Years | 6 (7.3%) | 2 (3.0%) |
| 65 to 74 Years | 1 (4.5%) | 0 (0.0%) |
| 75 Years and over | 2 (16.7%) | 1 (8.3%) |
Disability Class: Ambulatory Difficulty
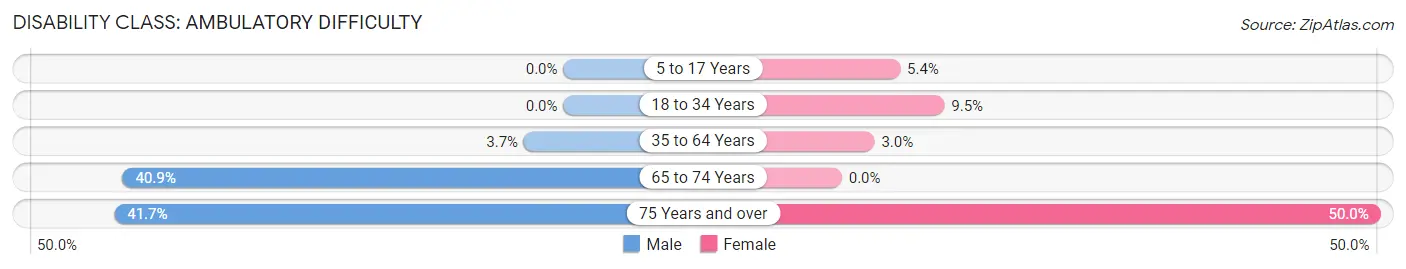
| Age Bracket | Male | Female |
| 5 to 17 Years | 0 (0.0%) | 2 (5.4%) |
| 18 to 34 Years | 0 (0.0%) | 4 (9.5%) |
| 35 to 64 Years | 3 (3.7%) | 2 (3.0%) |
| 65 to 74 Years | 9 (40.9%) | 0 (0.0%) |
| 75 Years and over | 5 (41.7%) | 6 (50.0%) |
Disability Class: Self-Care Difficulty
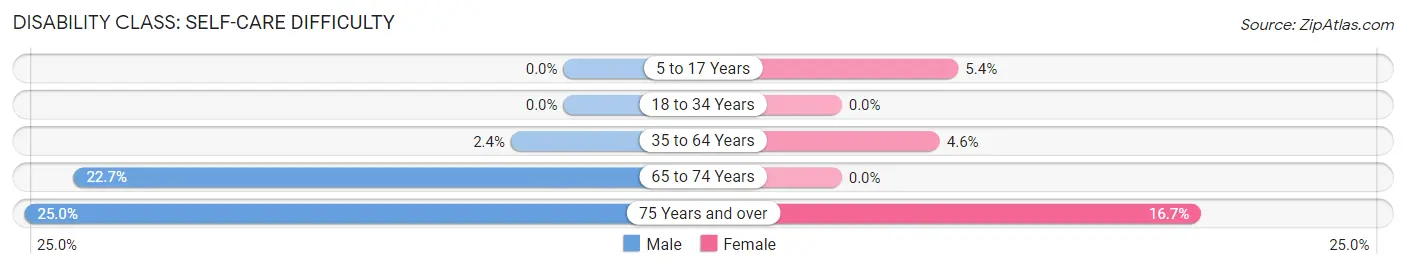
| Age Bracket | Male | Female |
| 5 to 17 Years | 0 (0.0%) | 2 (5.4%) |
| 18 to 34 Years | 0 (0.0%) | 0 (0.0%) |
| 35 to 64 Years | 2 (2.4%) | 3 (4.5%) |
| 65 to 74 Years | 5 (22.7%) | 0 (0.0%) |
| 75 Years and over | 3 (25.0%) | 2 (16.7%) |
Technology Access in Sibley
Computing Device Access in Sibley
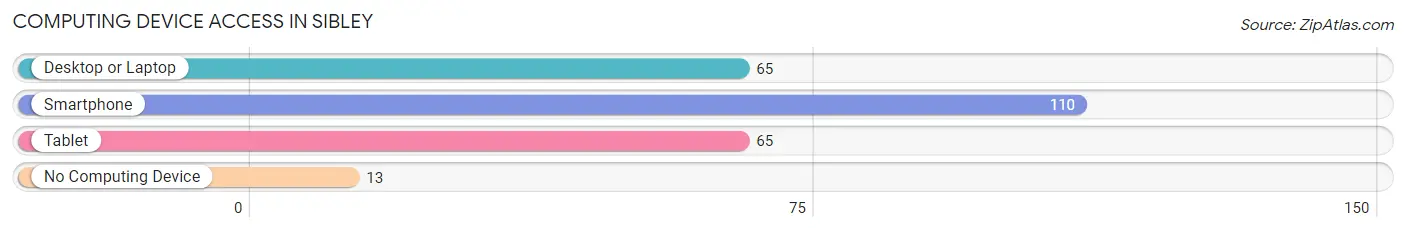
| Device Type | # Households | % Households |
| Desktop or Laptop | 65 | 50.0% |
| Smartphone | 110 | 84.6% |
| Tablet | 65 | 50.0% |
| No Computing Device | 13 | 10.0% |
| Total | 130 | 100.0% |
Internet Access in Sibley
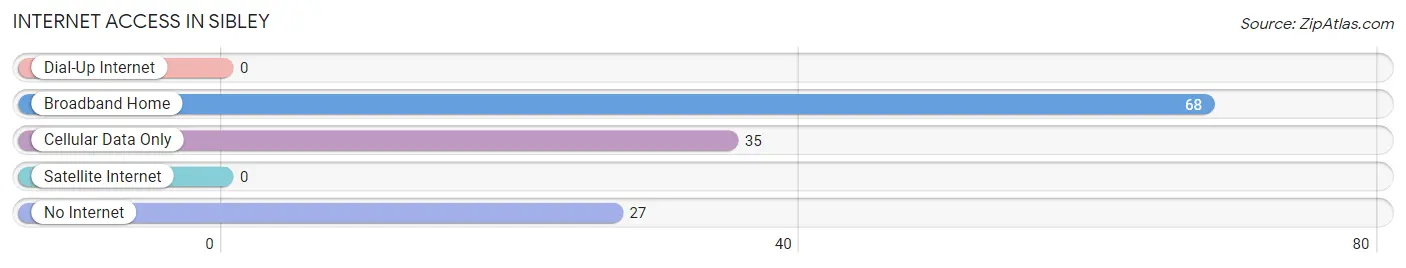
| Internet Type | # Households | % Households |
| Dial-Up Internet | 0 | 0.0% |
| Broadband Home | 68 | 52.3% |
| Cellular Data Only | 35 | 26.9% |
| Satellite Internet | 0 | 0.0% |
| No Internet | 27 | 20.8% |
| Total | 130 | 100.0% |
Sibley Summary
Sibley, Missouri is a small town located in the northwest corner of the state, in the Ozark Mountains. It is situated in Benton County, and is part of the Harrisonville Micropolitan Statistical Area. The town was founded in 1883 and has a population of approximately 1,000 people.
History
Sibley was founded in 1883 by William Sibley, a former Confederate soldier. He purchased the land from the government and began to develop the town. The first post office was established in 1884, and the town was officially incorporated in 1887.
The town was originally a farming community, but it soon became a center for timber production. The timber industry was the main source of income for the town until the early 1900s, when the railroad arrived. This allowed for the development of other industries, such as coal mining and manufacturing.
The town experienced a period of growth in the early 1900s, with the population reaching its peak of 1,500 in 1910. However, the Great Depression caused the population to decline, and it has remained relatively stable since then.
Geography
Sibley is located in the Ozark Mountains, in the northwest corner of Missouri. It is situated in Benton County, and is part of the Harrisonville Micropolitan Statistical Area. The town is located at the intersection of US Route 65 and Missouri Route 7.
The town is situated on a plateau, with an elevation of 1,000 feet. The surrounding area is mostly forested, with some agricultural land. The nearest major city is Springfield, which is about 50 miles away.
Economy
The economy of Sibley is largely based on agriculture and timber production. The town is home to several small businesses, including a grocery store, a hardware store, and a few restaurants.
The town is also home to a small manufacturing plant, which produces plastic products. The plant employs about 50 people.
Demographics
As of the 2010 census, the population of Sibley was 1,000. The racial makeup of the town was 97.2% White, 0.7% African American, 0.2% Native American, 0.2% Asian, and 1.7% from other races.
The median household income in Sibley was $37,500, and the median family income was $45,000. The per capita income was $18,000. About 11.2% of the population was below the poverty line.
Conclusion
Sibley, Missouri is a small town located in the northwest corner of the state, in the Ozark Mountains. It was founded in 1883 and has a population of approximately 1,000 people. The town is largely based on agriculture and timber production, and is home to several small businesses. The median household income in Sibley was $37,500, and the median family income was $45,000. The town is situated on a plateau, with an elevation of 1,000 feet, and is surrounded by mostly forested land.
Common Questions
What is Per Capita Income in Sibley?
Per Capita income in Sibley is $35,337.
What is the Median Family Income in Sibley?
Median Family Income in Sibley is $94,375.
What is the Median Household income in Sibley?
Median Household Income in Sibley is $64,091.
What is Income or Wage Gap in Sibley?
Income or Wage Gap in Sibley is 24.9%.
Women in Sibley earn 75.1 cents for every dollar earned by a man.
What is Inequality or Gini Index in Sibley?
Inequality or Gini Index in Sibley is 0.38.
What is the Total Population of Sibley?
Total Population of Sibley is 356.
What is the Total Male Population of Sibley?
Total Male Population of Sibley is 185.
What is the Total Female Population of Sibley?
Total Female Population of Sibley is 171.
What is the Ratio of Males per 100 Females in Sibley?
There are 108.19 Males per 100 Females in Sibley.
What is the Ratio of Females per 100 Males in Sibley?
There are 92.43 Females per 100 Males in Sibley.
What is the Median Population Age in Sibley?
Median Population Age in Sibley is 39.1 Years.
What is the Average Family Size in Sibley
Average Family Size in Sibley is 3.3 People.
What is the Average Household Size in Sibley
Average Household Size in Sibley is 2.7 People.
How Large is the Labor Force in Sibley?
There are 175 People in the Labor Forcein in Sibley.
What is the Percentage of People in the Labor Force in Sibley?
59.7% of People are in the Labor Force in Sibley.
What is the Unemployment Rate in Sibley?
Unemployment Rate in Sibley is 1.1%.