Cooter, MO Map & Demographics
Cooter Map
Cooter Overview
$37,794
PER CAPITA INCOME
$52,188
AVG FAMILY INCOME
$50,104
AVG HOUSEHOLD INCOME
31.9%
WAGE / INCOME GAP [ % ]
68.1¢/ $1
WAGE / INCOME GAP [ $ ]
0.66
INEQUALITY / GINI INDEX
343
TOTAL POPULATION
156
MALE POPULATION
187
FEMALE POPULATION
83.42
MALES / 100 FEMALES
119.87
FEMALES / 100 MALES
34.8
MEDIAN AGE
3.1
AVG FAMILY SIZE
2.5
AVG HOUSEHOLD SIZE
134
LABOR FORCE [ PEOPLE ]
55.6%
PERCENT IN LABOR FORCE
6.0%
UNEMPLOYMENT RATE
Cooter Zip Codes
Cooter Area Codes
Income in Cooter
Income Overview in Cooter
Per Capita Income in Cooter is $37,794, while median incomes of families and households are $52,188 and $50,104 respectively.
| Characteristic | Number | Measure |
| Per Capita Income | 343 | $37,794 |
| Median Family Income | 91 | $52,188 |
| Mean Family Income | 91 | $127,000 |
| Median Household Income | 135 | $50,104 |
| Mean Household Income | 135 | $98,153 |
| Income Deficit | 91 | $0 |
| Wage / Income Gap (%) | 343 | 31.89% |
| Wage / Income Gap ($) | 343 | 68.11¢ per $1 |
| Gini / Inequality Index | 343 | 0.66 |
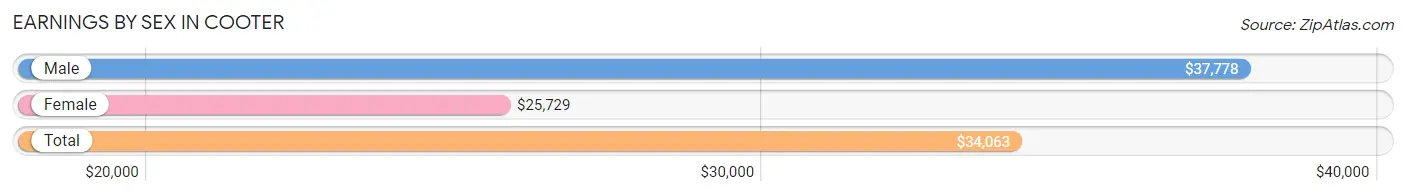
Earnings by Sex in Cooter
Average Earnings in Cooter are $34,063, $37,778 for men and $25,729 for women, a difference of 31.9%.
| Sex | Number | Average Earnings |
| Male | 82 (57.3%) | $37,778 |
| Female | 61 (42.7%) | $25,729 |
| Total | 143 (100.0%) | $34,063 |
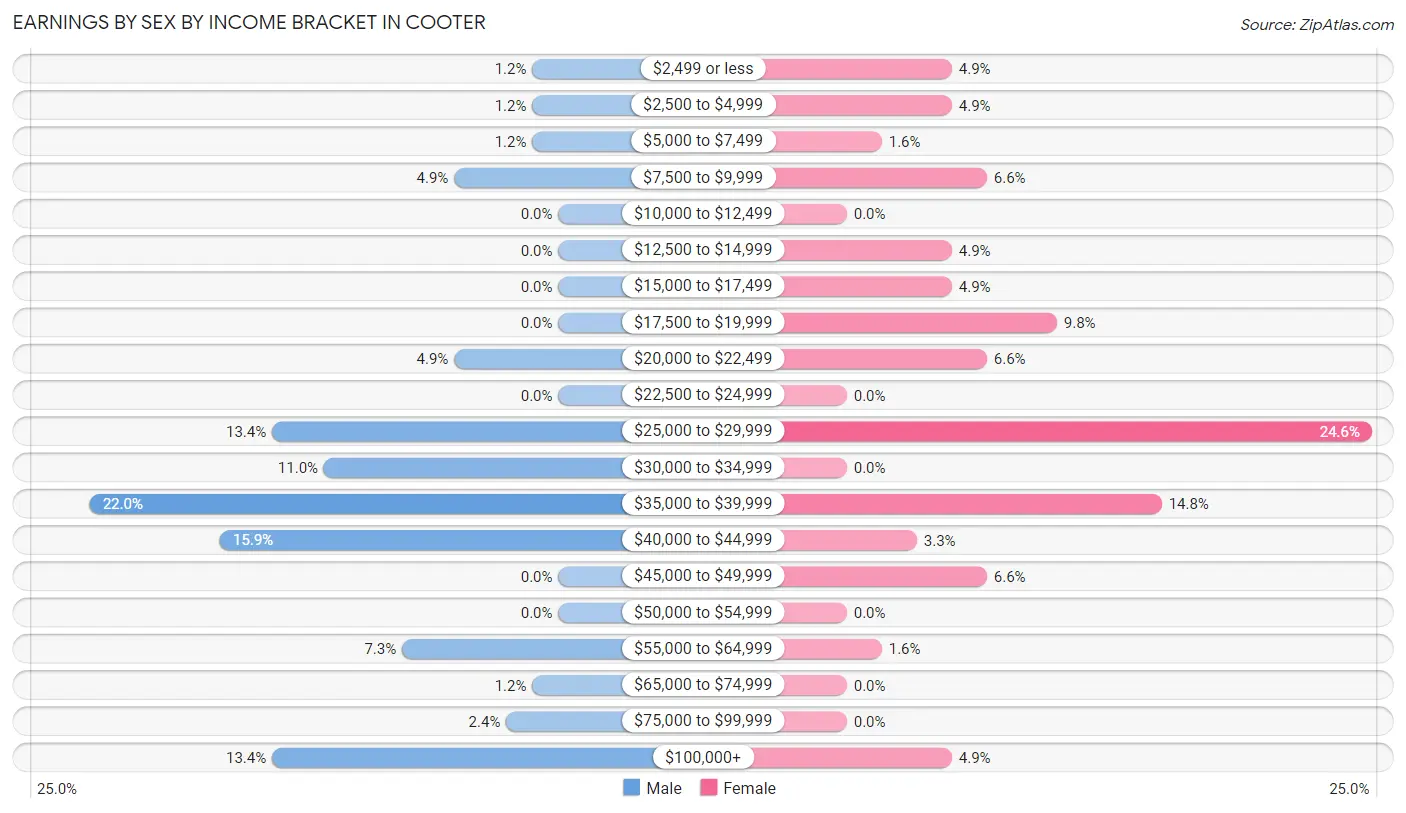
Earnings by Sex by Income Bracket in Cooter
The most common earnings brackets in Cooter are $35,000 to $39,999 for men (18 | 22.0%) and $25,000 to $29,999 for women (15 | 24.6%).
| Income | Male | Female |
| $2,499 or less | 1 (1.2%) | 3 (4.9%) |
| $2,500 to $4,999 | 1 (1.2%) | 3 (4.9%) |
| $5,000 to $7,499 | 1 (1.2%) | 1 (1.6%) |
| $7,500 to $9,999 | 4 (4.9%) | 4 (6.6%) |
| $10,000 to $12,499 | 0 (0.0%) | 0 (0.0%) |
| $12,500 to $14,999 | 0 (0.0%) | 3 (4.9%) |
| $15,000 to $17,499 | 0 (0.0%) | 3 (4.9%) |
| $17,500 to $19,999 | 0 (0.0%) | 6 (9.8%) |
| $20,000 to $22,499 | 4 (4.9%) | 4 (6.6%) |
| $22,500 to $24,999 | 0 (0.0%) | 0 (0.0%) |
| $25,000 to $29,999 | 11 (13.4%) | 15 (24.6%) |
| $30,000 to $34,999 | 9 (11.0%) | 0 (0.0%) |
| $35,000 to $39,999 | 18 (22.0%) | 9 (14.7%) |
| $40,000 to $44,999 | 13 (15.9%) | 2 (3.3%) |
| $45,000 to $49,999 | 0 (0.0%) | 4 (6.6%) |
| $50,000 to $54,999 | 0 (0.0%) | 0 (0.0%) |
| $55,000 to $64,999 | 6 (7.3%) | 1 (1.6%) |
| $65,000 to $74,999 | 1 (1.2%) | 0 (0.0%) |
| $75,000 to $99,999 | 2 (2.4%) | 0 (0.0%) |
| $100,000+ | 11 (13.4%) | 3 (4.9%) |
| Total | 82 (100.0%) | 61 (100.0%) |
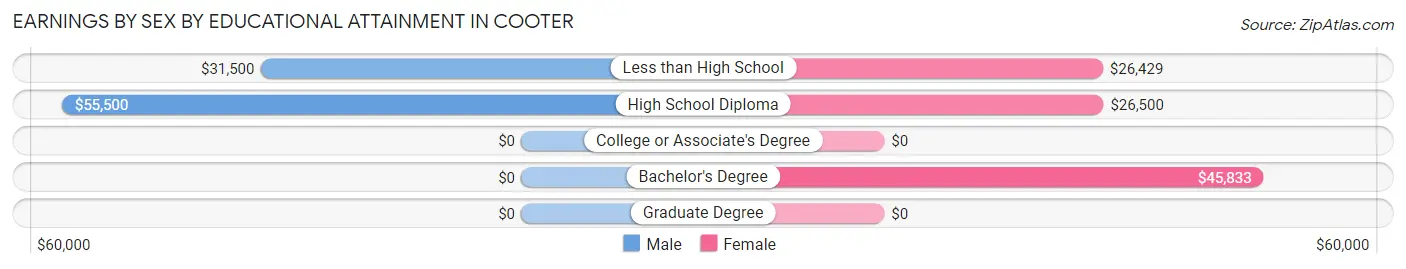
Earnings by Sex by Educational Attainment in Cooter
Average earnings in Cooter are $37,917 for men and $26,979 for women, a difference of 28.8%. Men with an educational attainment of high school diploma enjoy the highest average annual earnings of $55,500, while those with less than high school education earn the least with $31,500. Women with an educational attainment of bachelor's degree earn the most with the average annual earnings of $45,833, while those with less than high school education have the smallest earnings of $26,429.
| Educational Attainment | Male Income | Female Income |
| Less than High School | $31,500 | $26,429 |
| High School Diploma | $55,500 | $26,500 |
| College or Associate's Degree | - | - |
| Bachelor's Degree | - | - |
| Graduate Degree | - | - |
| Total | $37,917 | $26,979 |
Family Income in Cooter
Family Income Brackets in Cooter
According to the Cooter family income data, there are 24 families falling into the $50,000 to $74,999 income range, which is the most common income bracket and makes up 26.4% of all families.
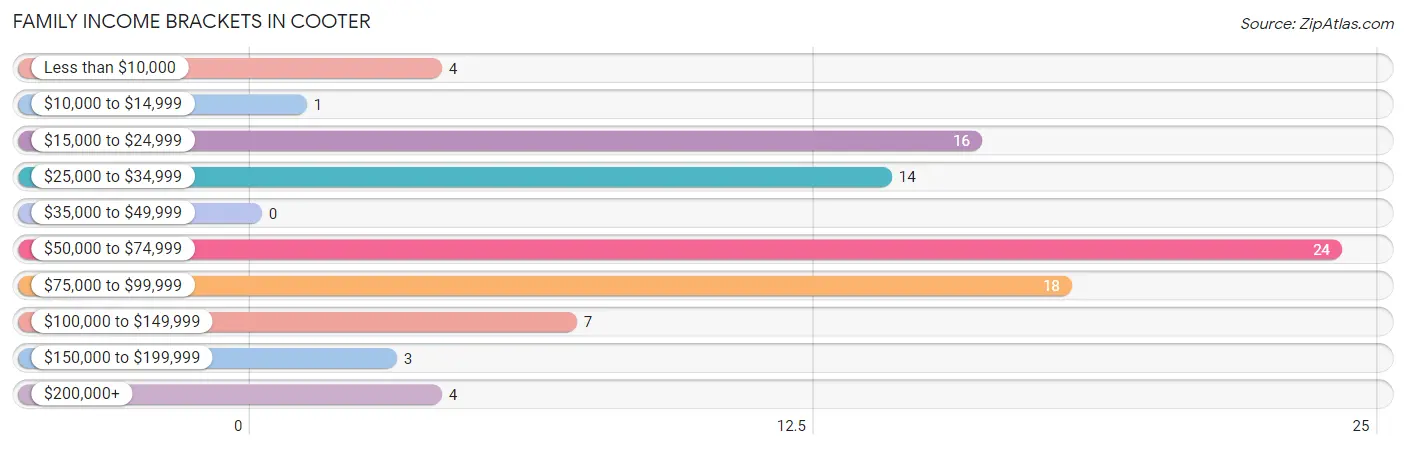
| Income Bracket | # Families | % Families |
| Less than $10,000 | 4 | 4.4% |
| $10,000 to $14,999 | 1 | 1.1% |
| $15,000 to $24,999 | 16 | 17.6% |
| $25,000 to $34,999 | 14 | 15.4% |
| $35,000 to $49,999 | 0 | 0.0% |
| $50,000 to $74,999 | 24 | 26.4% |
| $75,000 to $99,999 | 18 | 19.8% |
| $100,000 to $149,999 | 7 | 7.7% |
| $150,000 to $199,999 | 3 | 3.3% |
| $200,000+ | 4 | 4.4% |
Family Income by Famaliy Size in Cooter
4-person families (18 | 19.8%) account for the highest median family income in Cooter with $83,000 per family, while 4-person families (18 | 19.8%) have the highest median income of $20,750 per family member.
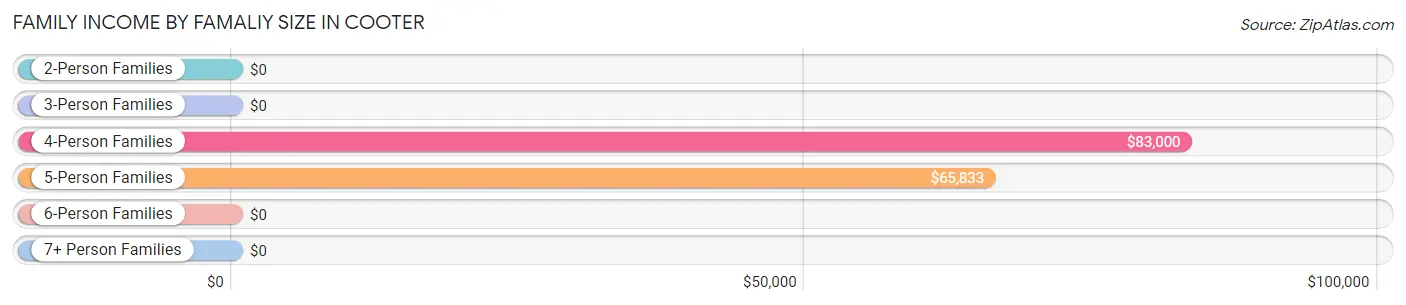
| Income Bracket | # Families | Median Income |
| 2-Person Families | 42 (46.2%) | $0 |
| 3-Person Families | 13 (14.3%) | $0 |
| 4-Person Families | 18 (19.8%) | $83,000 |
| 5-Person Families | 18 (19.8%) | $65,833 |
| 6-Person Families | 0 (0.0%) | $0 |
| 7+ Person Families | 0 (0.0%) | $0 |
| Total | 91 (100.0%) | $52,188 |
Family Income by Number of Earners in Cooter
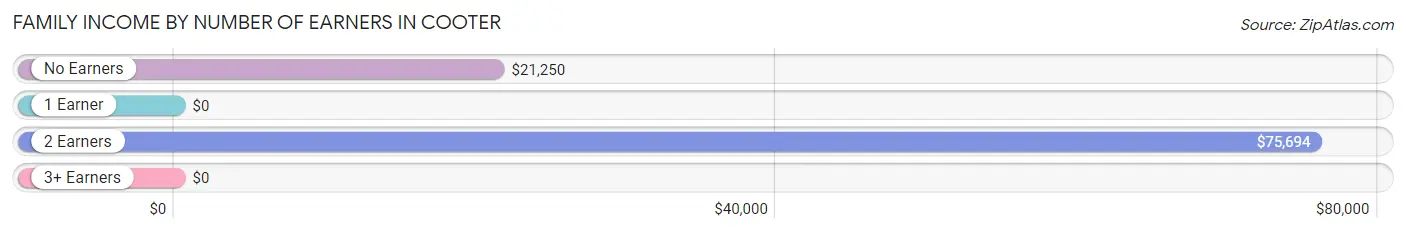
| Number of Earners | # Families | Median Income |
| No Earners | 12 (13.2%) | $21,250 |
| 1 Earner | 31 (34.1%) | $0 |
| 2 Earners | 43 (47.2%) | $75,694 |
| 3+ Earners | 5 (5.5%) | $0 |
| Total | 91 (100.0%) | $52,188 |
Household Income in Cooter
Household Income Brackets in Cooter
With 31 households falling in the category, the $50,000 to $74,999 income range is the most frequent in Cooter, accounting for 23.0% of all households. In contrast, only 3 households (2.2%) fall into the $150,000 to $199,999 income bracket, making it the least populous group.
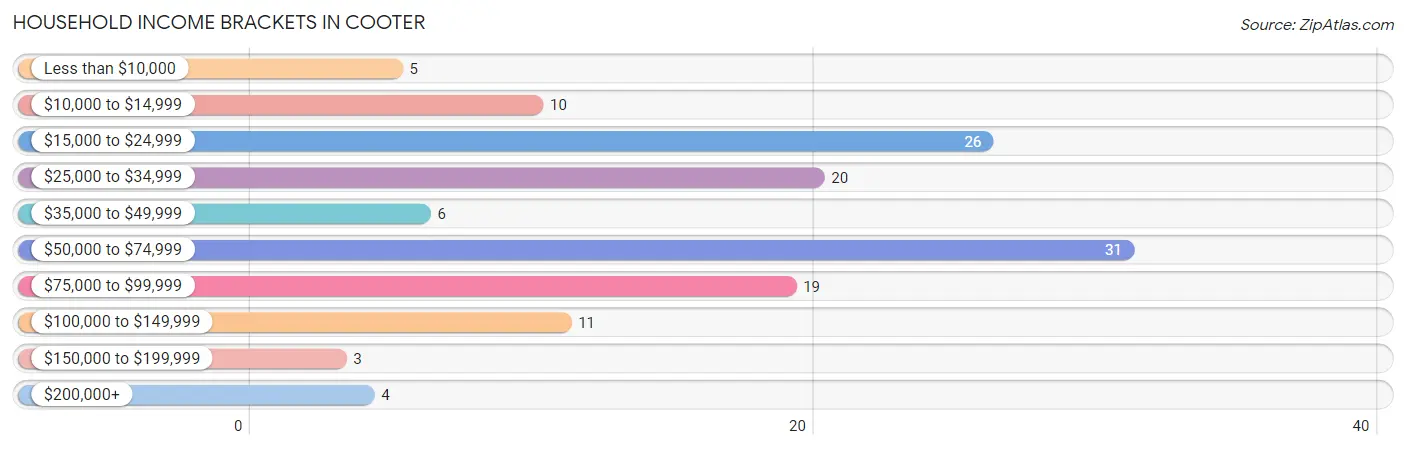
| Income Bracket | # Households | % Households |
| Less than $10,000 | 5 | 3.7% |
| $10,000 to $14,999 | 10 | 7.4% |
| $15,000 to $24,999 | 26 | 19.3% |
| $25,000 to $34,999 | 20 | 14.8% |
| $35,000 to $49,999 | 6 | 4.4% |
| $50,000 to $74,999 | 31 | 23.0% |
| $75,000 to $99,999 | 19 | 14.1% |
| $100,000 to $149,999 | 11 | 8.1% |
| $150,000 to $199,999 | 3 | 2.2% |
| $200,000+ | 4 | 3.0% |
Household Income by Householder Age in Cooter
The median household income in Cooter is $50,104, with the highest median household income of $65,288 found in the 25 to 44 years age bracket for the primary householder. A total of 45 households (33.3%) fall into this category. Meanwhile, the 15 to 24 years age bracket for the primary householder has the lowest median household income of $0, with 3 households (2.2%) in this group.
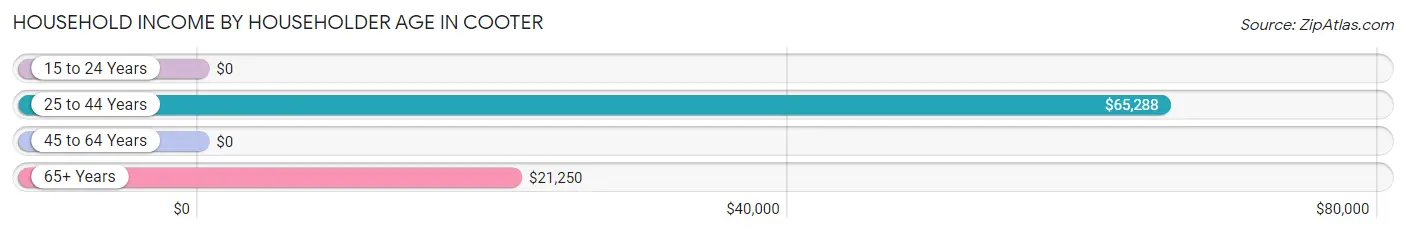
| Income Bracket | # Households | Median Income |
| 15 to 24 Years | 3 (2.2%) | $0 |
| 25 to 44 Years | 45 (33.3%) | $65,288 |
| 45 to 64 Years | 55 (40.7%) | $0 |
| 65+ Years | 32 (23.7%) | $21,250 |
| Total | 135 (100.0%) | $50,104 |
Poverty in Cooter
Income Below Poverty by Sex and Age in Cooter
With 12.2% poverty level for males and 22.6% for females among the residents of Cooter, 18 to 24 year old males and 75 year old and over females are the most vulnerable to poverty, with 1 males (100.0%) and 6 females (50.0%) in their respective age groups living below the poverty level.
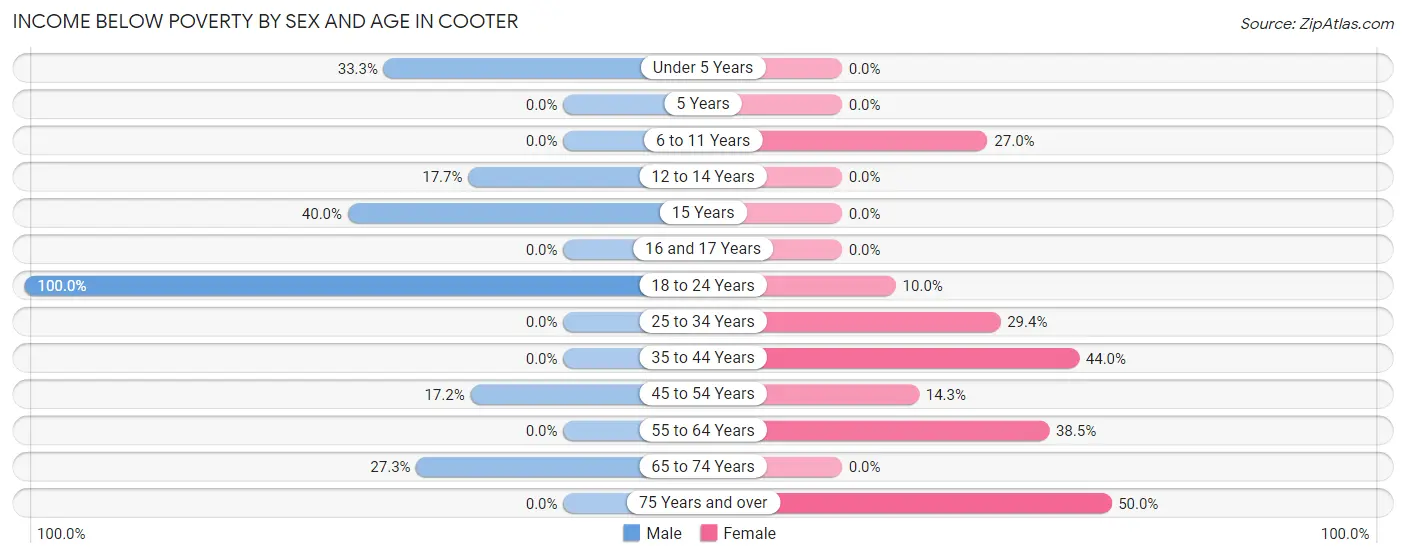
| Age Bracket | Male | Female |
| Under 5 Years | 1 (33.3%) | 0 (0.0%) |
| 5 Years | 0 (0.0%) | 0 (0.0%) |
| 6 to 11 Years | 0 (0.0%) | 10 (27.0%) |
| 12 to 14 Years | 3 (17.6%) | 0 (0.0%) |
| 15 Years | 6 (40.0%) | 0 (0.0%) |
| 16 and 17 Years | 0 (0.0%) | 0 (0.0%) |
| 18 to 24 Years | 1 (100.0%) | 1 (10.0%) |
| 25 to 34 Years | 0 (0.0%) | 5 (29.4%) |
| 35 to 44 Years | 0 (0.0%) | 11 (44.0%) |
| 45 to 54 Years | 5 (17.2%) | 4 (14.3%) |
| 55 to 64 Years | 0 (0.0%) | 5 (38.5%) |
| 65 to 74 Years | 3 (27.3%) | 0 (0.0%) |
| 75 Years and over | 0 (0.0%) | 6 (50.0%) |
| Total | 19 (12.2%) | 42 (22.6%) |
Income Above Poverty by Sex and Age in Cooter
According to the poverty statistics in Cooter, males aged 6 to 11 years and females aged under 5 years are the age groups that are most secure financially, with 100.0% of males and 100.0% of females in these age groups living above the poverty line.
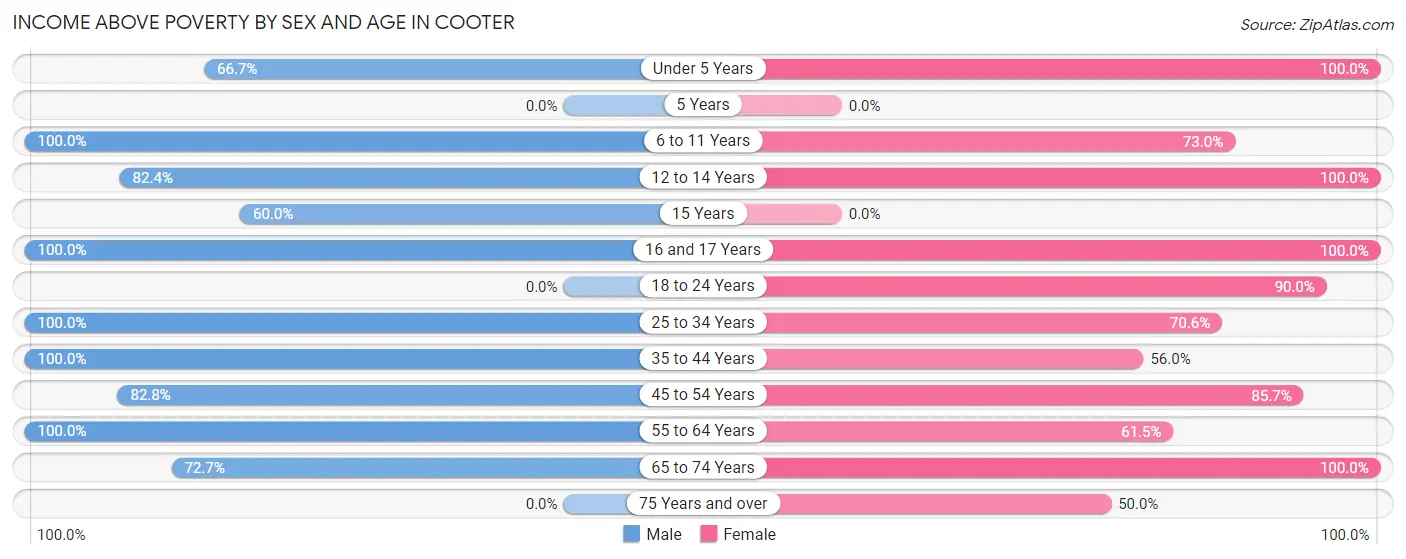
| Age Bracket | Male | Female |
| Under 5 Years | 2 (66.7%) | 13 (100.0%) |
| 5 Years | 0 (0.0%) | 0 (0.0%) |
| 6 to 11 Years | 12 (100.0%) | 27 (73.0%) |
| 12 to 14 Years | 14 (82.4%) | 4 (100.0%) |
| 15 Years | 9 (60.0%) | 0 (0.0%) |
| 16 and 17 Years | 12 (100.0%) | 12 (100.0%) |
| 18 to 24 Years | 0 (0.0%) | 9 (90.0%) |
| 25 to 34 Years | 18 (100.0%) | 12 (70.6%) |
| 35 to 44 Years | 24 (100.0%) | 14 (56.0%) |
| 45 to 54 Years | 24 (82.8%) | 24 (85.7%) |
| 55 to 64 Years | 14 (100.0%) | 8 (61.5%) |
| 65 to 74 Years | 8 (72.7%) | 15 (100.0%) |
| 75 Years and over | 0 (0.0%) | 6 (50.0%) |
| Total | 137 (87.8%) | 144 (77.4%) |
Income Below Poverty Among Married-Couple Families in Cooter
The poverty statistics for married-couple families in Cooter show that 1.6% or 1 of the total 63 families live below the poverty line. Families with 1 or 2 children have the highest poverty rate of 8.3%, comprising of 1 families. On the other hand, families with no children have the lowest poverty rate of 0.0%, which includes 0 families.
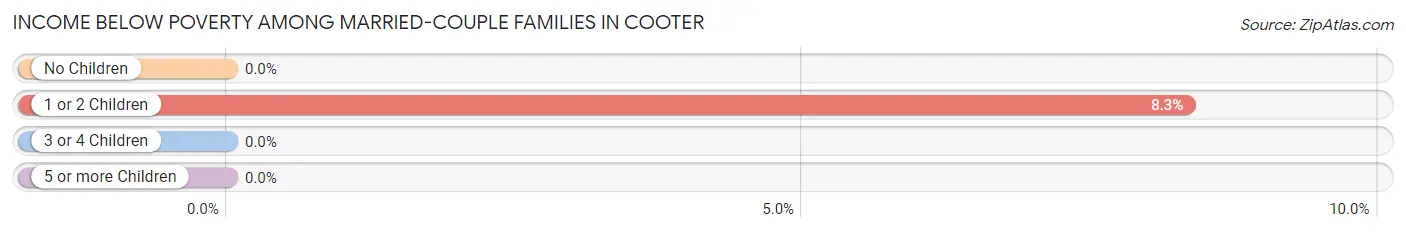
| Children | Above Poverty | Below Poverty |
| No Children | 38 (100.0%) | 0 (0.0%) |
| 1 or 2 Children | 11 (91.7%) | 1 (8.3%) |
| 3 or 4 Children | 13 (100.0%) | 0 (0.0%) |
| 5 or more Children | 0 (0.0%) | 0 (0.0%) |
| Total | 62 (98.4%) | 1 (1.6%) |
Income Below Poverty Among Single-Parent Households in Cooter
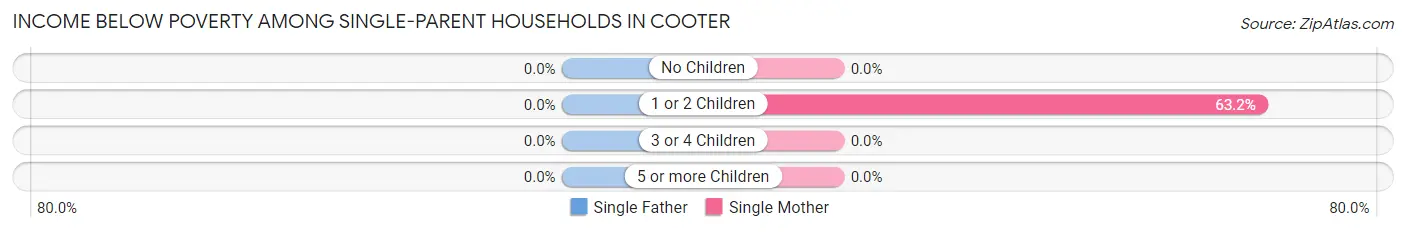
| Children | Single Father | Single Mother |
| No Children | 0 (0.0%) | 0 (0.0%) |
| 1 or 2 Children | 0 (0.0%) | 12 (63.2%) |
| 3 or 4 Children | 0 (0.0%) | 0 (0.0%) |
| 5 or more Children | 0 (0.0%) | 0 (0.0%) |
| Total | 0 (0.0%) | 12 (63.2%) |
Income Below Poverty Among Married-Couple vs Single-Parent Households in Cooter
The poverty data for Cooter shows that 1 of the married-couple family households (1.6%) and 12 of the single-parent households (42.9%) are living below the poverty level. Within the married-couple family households, those with 1 or 2 children have the highest poverty rate, with 1 households (8.3%) falling below the poverty line. Among the single-parent households, those with 1 or 2 children have the highest poverty rate, with 12 household (50.0%) living below poverty.
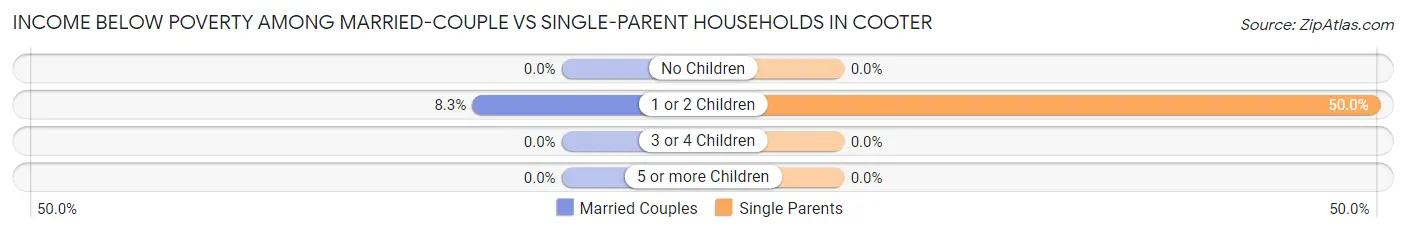
| Children | Married-Couple Families | Single-Parent Households |
| No Children | 0 (0.0%) | 0 (0.0%) |
| 1 or 2 Children | 1 (8.3%) | 12 (50.0%) |
| 3 or 4 Children | 0 (0.0%) | 0 (0.0%) |
| 5 or more Children | 0 (0.0%) | 0 (0.0%) |
| Total | 1 (1.6%) | 12 (42.9%) |
Race in Cooter
The most populous races in Cooter are White / Caucasian (323 | 94.2%), Two or more Races (20 | 5.8%), and Hispanic or Latino (5 | 1.5%).
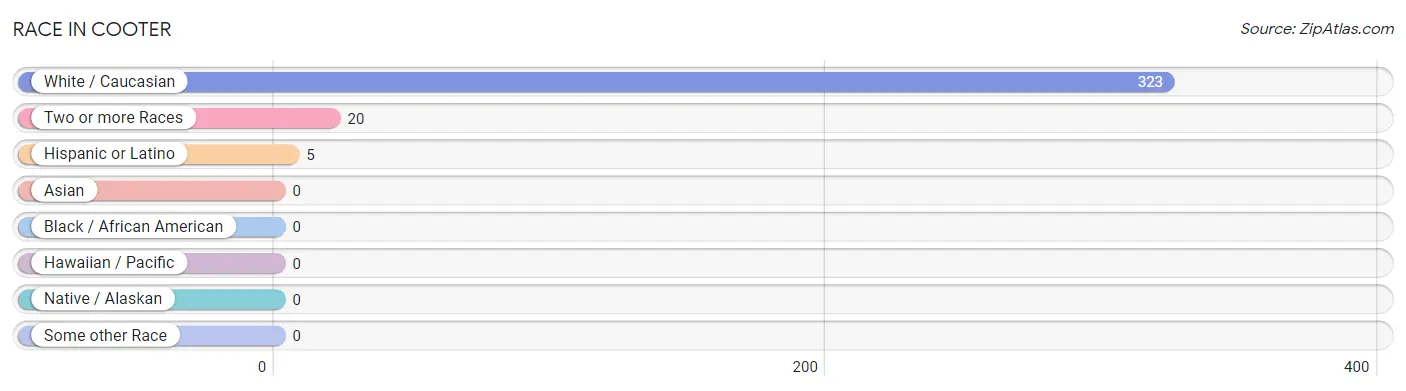
| Race | # Population | % Population |
| Asian | 0 | 0.0% |
| Black / African American | 0 | 0.0% |
| Hawaiian / Pacific | 0 | 0.0% |
| Hispanic or Latino | 5 | 1.5% |
| Native / Alaskan | 0 | 0.0% |
| White / Caucasian | 323 | 94.2% |
| Two or more Races | 20 | 5.8% |
| Some other Race | 0 | 0.0% |
| Total | 343 | 100.0% |
Ancestry in Cooter
The most populous ancestries reported in Cooter are Irish (92 | 26.8%), German (34 | 9.9%), English (33 | 9.6%), Scotch-Irish (12 | 3.5%), and French (9 | 2.6%), together accounting for 52.5% of all Cooter residents.
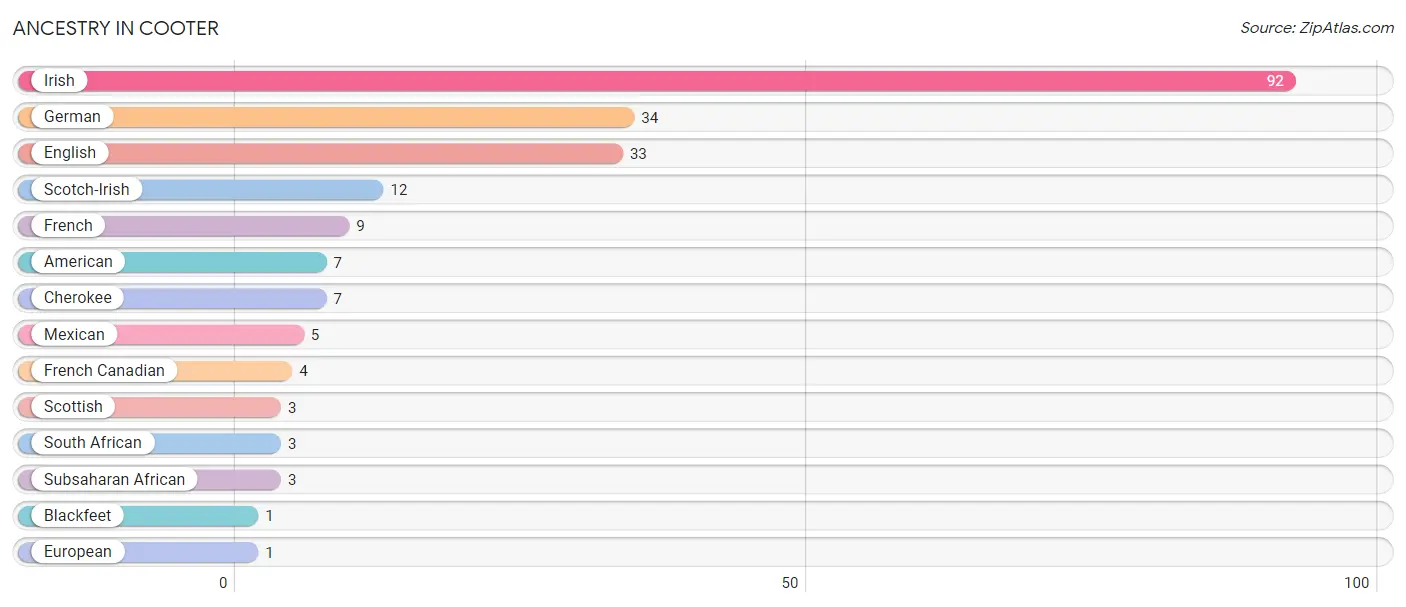
| Ancestry | # Population | % Population |
| American | 7 | 2.0% |
| Blackfeet | 1 | 0.3% |
| Cherokee | 7 | 2.0% |
| English | 33 | 9.6% |
| European | 1 | 0.3% |
| French | 9 | 2.6% |
| French Canadian | 4 | 1.2% |
| German | 34 | 9.9% |
| Irish | 92 | 26.8% |
| Mexican | 5 | 1.5% |
| Scotch-Irish | 12 | 3.5% |
| Scottish | 3 | 0.9% |
| South African | 3 | 0.9% |
| Subsaharan African | 3 | 0.9% | View All 14 Rows |
Immigrants in Cooter
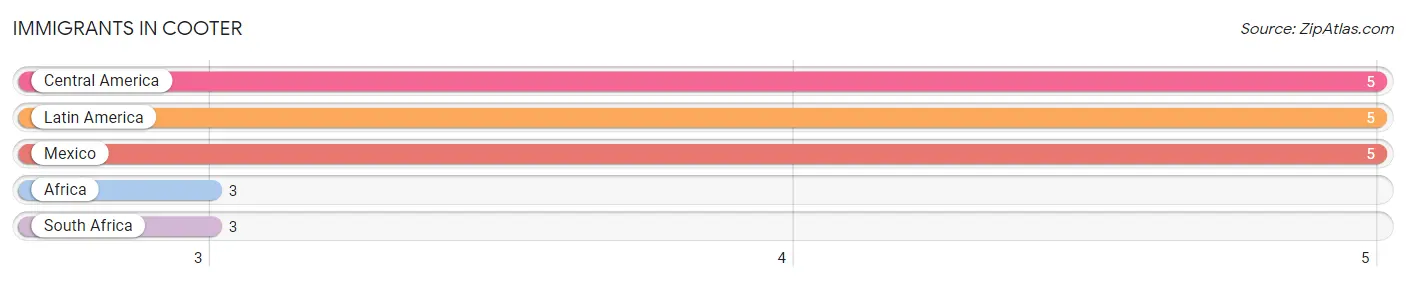
The most numerous immigrant groups reported in Cooter came from Central America (5 | 1.5%), Latin America (5 | 1.5%), Mexico (5 | 1.5%), Africa (3 | 0.9%), and South Africa (3 | 0.9%), together accounting for 6.1% of all Cooter residents.
| Immigration Origin | # Population | % Population |
| Africa | 3 | 0.9% |
| Central America | 5 | 1.5% |
| Latin America | 5 | 1.5% |
| Mexico | 5 | 1.5% |
| South Africa | 3 | 0.9% | View All 5 Rows |
Sex and Age in Cooter
Sex and Age in Cooter
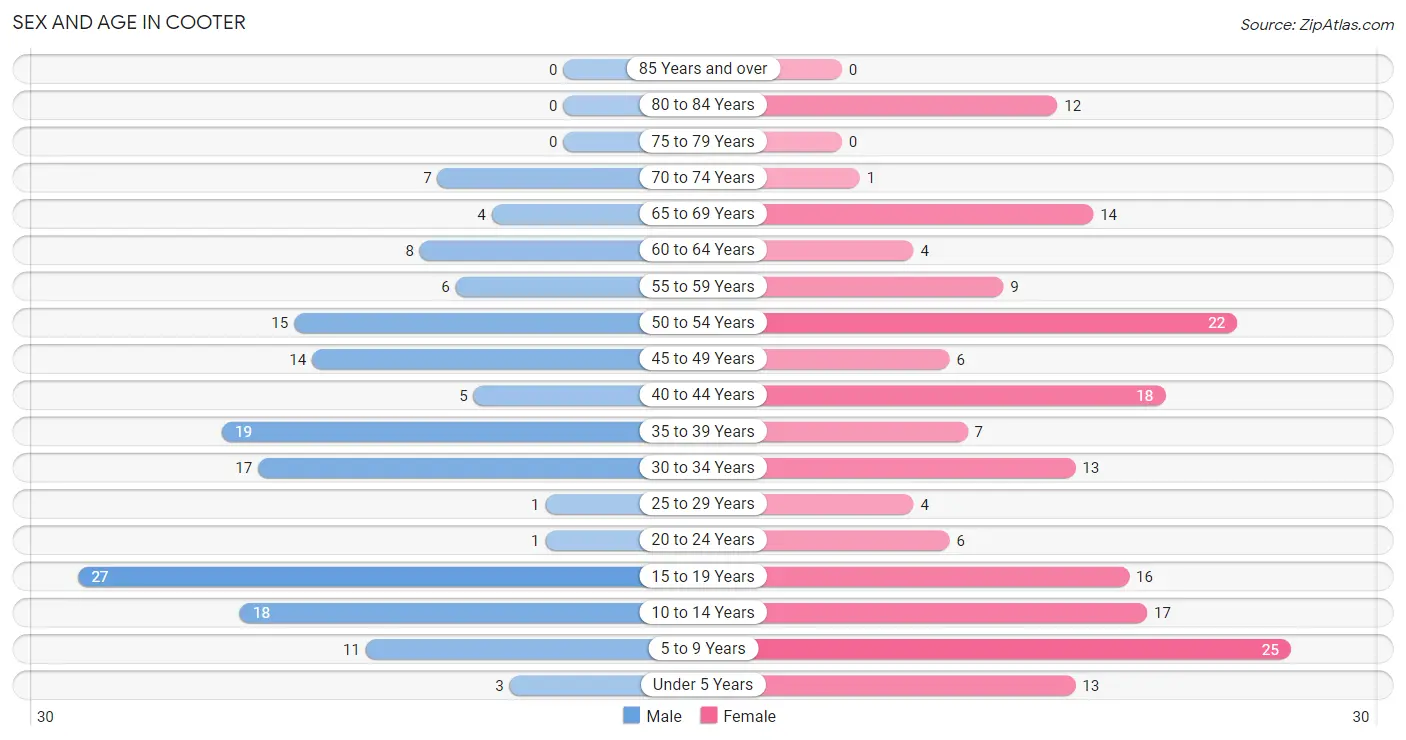
The most populous age groups in Cooter are 15 to 19 Years (27 | 17.3%) for men and 5 to 9 Years (25 | 13.4%) for women.
| Age Bracket | Male | Female |
| Under 5 Years | 3 (1.9%) | 13 (7.0%) |
| 5 to 9 Years | 11 (7.0%) | 25 (13.4%) |
| 10 to 14 Years | 18 (11.5%) | 17 (9.1%) |
| 15 to 19 Years | 27 (17.3%) | 16 (8.6%) |
| 20 to 24 Years | 1 (0.6%) | 6 (3.2%) |
| 25 to 29 Years | 1 (0.6%) | 4 (2.1%) |
| 30 to 34 Years | 17 (10.9%) | 13 (7.0%) |
| 35 to 39 Years | 19 (12.2%) | 7 (3.7%) |
| 40 to 44 Years | 5 (3.2%) | 18 (9.6%) |
| 45 to 49 Years | 14 (9.0%) | 6 (3.2%) |
| 50 to 54 Years | 15 (9.6%) | 22 (11.8%) |
| 55 to 59 Years | 6 (3.8%) | 9 (4.8%) |
| 60 to 64 Years | 8 (5.1%) | 4 (2.1%) |
| 65 to 69 Years | 4 (2.6%) | 14 (7.5%) |
| 70 to 74 Years | 7 (4.5%) | 1 (0.5%) |
| 75 to 79 Years | 0 (0.0%) | 0 (0.0%) |
| 80 to 84 Years | 0 (0.0%) | 12 (6.4%) |
| 85 Years and over | 0 (0.0%) | 0 (0.0%) |
| Total | 156 (100.0%) | 187 (100.0%) |
Families and Households in Cooter
Median Family Size in Cooter
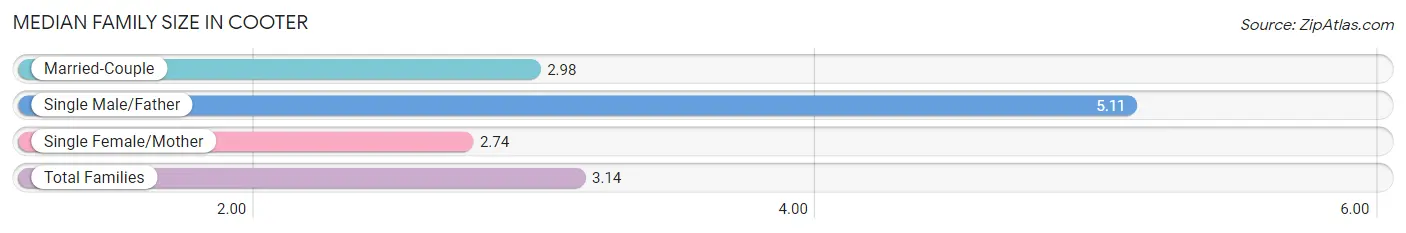
The median family size in Cooter is 3.14 persons per family, with single male/father families (9 | 9.9%) accounting for the largest median family size of 5.11 persons per family. On the other hand, single female/mother families (19 | 20.9%) represent the smallest median family size with 2.74 persons per family.
| Family Type | # Families | Family Size |
| Married-Couple | 63 (69.2%) | 2.98 |
| Single Male/Father | 9 (9.9%) | 5.11 |
| Single Female/Mother | 19 (20.9%) | 2.74 |
| Total Families | 91 (100.0%) | 3.14 |
Median Household Size in Cooter
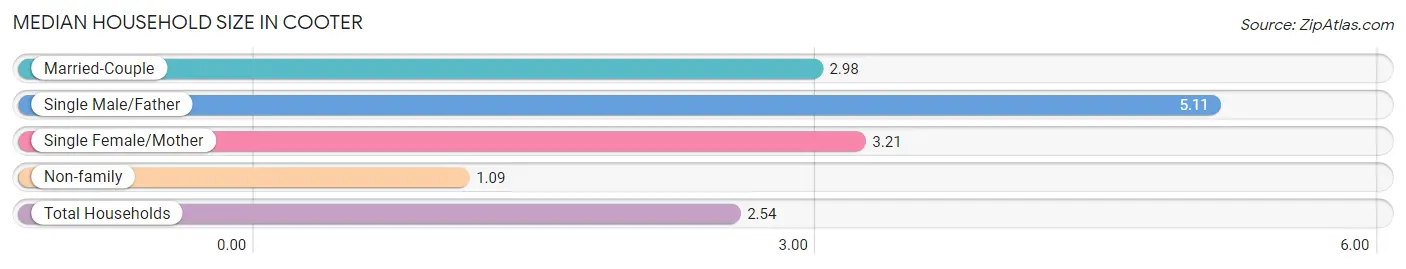
The median household size in Cooter is 2.54 persons per household, with single male/father households (9 | 6.7%) accounting for the largest median household size of 5.11 persons per household. non-family households (44 | 32.6%) represent the smallest median household size with 1.09 persons per household.
| Household Type | # Households | Household Size |
| Married-Couple | 63 (46.7%) | 2.98 |
| Single Male/Father | 9 (6.7%) | 5.11 |
| Single Female/Mother | 19 (14.1%) | 3.21 |
| Non-family | 44 (32.6%) | 1.09 |
| Total Households | 135 (100.0%) | 2.54 |
Household Size by Marriage Status in Cooter
Out of a total of 135 households in Cooter, 91 (67.4%) are family households, while 44 (32.6%) are nonfamily households. The most numerous type of family households are 2-person households, comprising 38, and the most common type of nonfamily households are 1-person households, comprising 38.
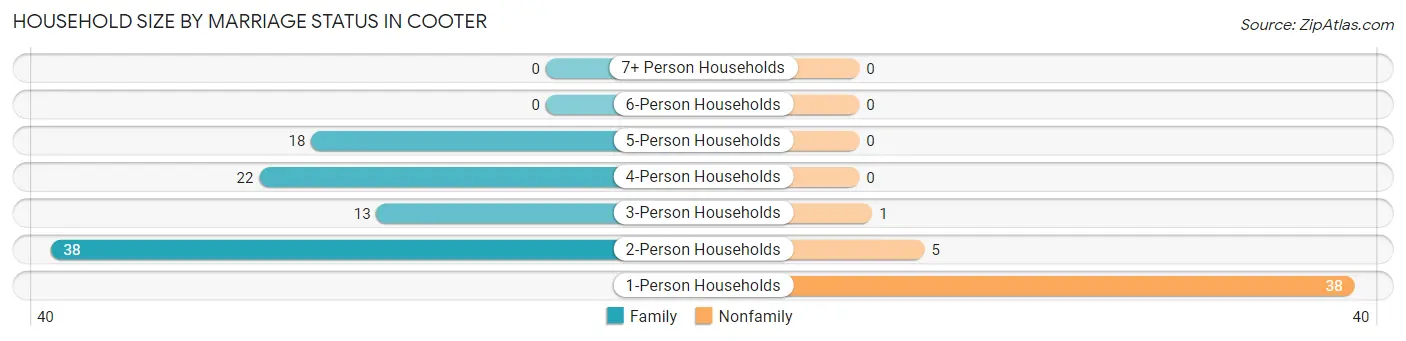
| Household Size | Family Households | Nonfamily Households |
| 1-Person Households | - | 38 (28.1%) |
| 2-Person Households | 38 (28.1%) | 5 (3.7%) |
| 3-Person Households | 13 (9.6%) | 1 (0.7%) |
| 4-Person Households | 22 (16.3%) | 0 (0.0%) |
| 5-Person Households | 18 (13.3%) | 0 (0.0%) |
| 6-Person Households | 0 (0.0%) | 0 (0.0%) |
| 7+ Person Households | 0 (0.0%) | 0 (0.0%) |
| Total | 91 (67.4%) | 44 (32.6%) |
Female Fertility in Cooter
Fertility by Age in Cooter
| Age Bracket | Women with Births | Births / 1,000 Women |
| 15 to 19 years | 0 (0.0%) | 0.0 |
| 20 to 34 years | 0 (0.0%) | 0.0 |
| 35 to 50 years | 0 (0.0%) | 0.0 |
| Total | 0 (0.0%) | 0.0 |
Fertility by Age by Marriage Status in Cooter
| Age Bracket | Married | Unmarried |
| 15 to 19 years | 0 (0.0%) | 0 (0.0%) |
| 20 to 34 years | 0 (0.0%) | 0 (0.0%) |
| 35 to 50 years | 0 (0.0%) | 0 (0.0%) |
| Total | 0 (0.0%) | 0 (0.0%) |
Fertility by Education in Cooter
| Educational Attainment | Women with Births | Births / 1,000 Women |
| Less than High School | 0 (0.0%) | 0.0 |
| High School Diploma | 0 (0.0%) | 0.0 |
| College or Associate's Degree | 0 (0.0%) | 0.0 |
| Bachelor's Degree | 0 (0.0%) | 0.0 |
| Graduate Degree | 0 (0.0%) | 0.0 |
| Total | 0 (0.0%) | 0.0 |
Fertility by Education by Marriage Status in Cooter
| Educational Attainment | Married | Unmarried |
| Less than High School | 0 (0.0%) | 0 (0.0%) |
| High School Diploma | 0 (0.0%) | 0 (0.0%) |
| College or Associate's Degree | 0 (0.0%) | 0 (0.0%) |
| Bachelor's Degree | 0 (0.0%) | 0 (0.0%) |
| Graduate Degree | 0 (0.0%) | 0 (0.0%) |
| Total | 0 (0.0%) | 0 (0.0%) |
Employment Characteristics in Cooter
Employment by Class of Employer in Cooter
Among the 126 employed individuals in Cooter, private company employees (95 | 75.4%), state government employees (11 | 8.7%), and self-employed (not incorporated) (8 | 6.4%) make up the most common classes of employment.
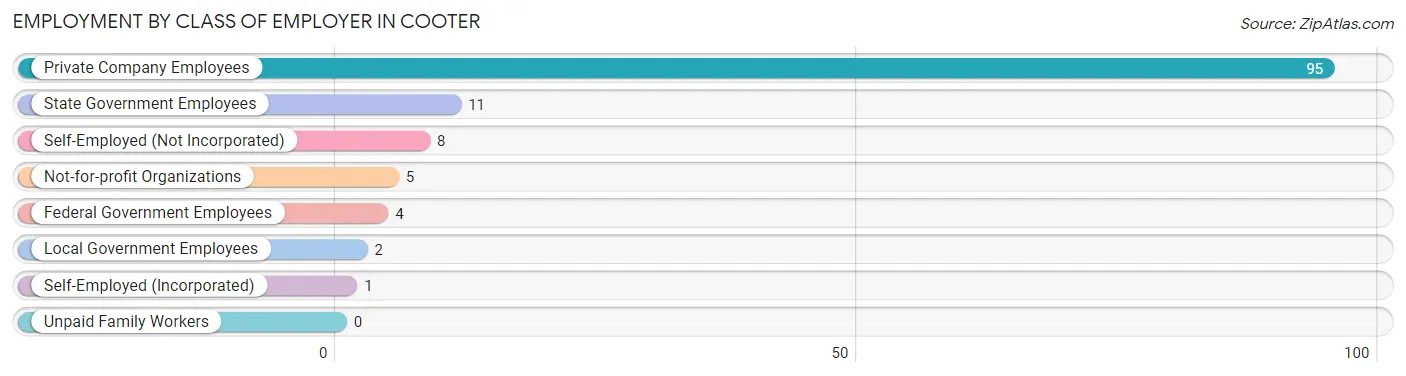
| Employer Class | # Employees | % Employees |
| Private Company Employees | 95 | 75.4% |
| Self-Employed (Incorporated) | 1 | 0.8% |
| Self-Employed (Not Incorporated) | 8 | 6.4% |
| Not-for-profit Organizations | 5 | 4.0% |
| Local Government Employees | 2 | 1.6% |
| State Government Employees | 11 | 8.7% |
| Federal Government Employees | 4 | 3.2% |
| Unpaid Family Workers | 0 | 0.0% |
| Total | 126 | 100.0% |
Employment Status by Age in Cooter
According to the labor force statistics for Cooter, out of the total population over 16 years of age (241), 55.6% or 134 individuals are in the labor force, with 6.0% or 8 of them unemployed. The age group with the highest labor force participation rate is 20 to 24 years, with 100.0% or 7 individuals in the labor force. Within the labor force, the 25 to 29 years age range has the highest percentage of unemployed individuals, with 80.0% or 4 of them being unemployed.
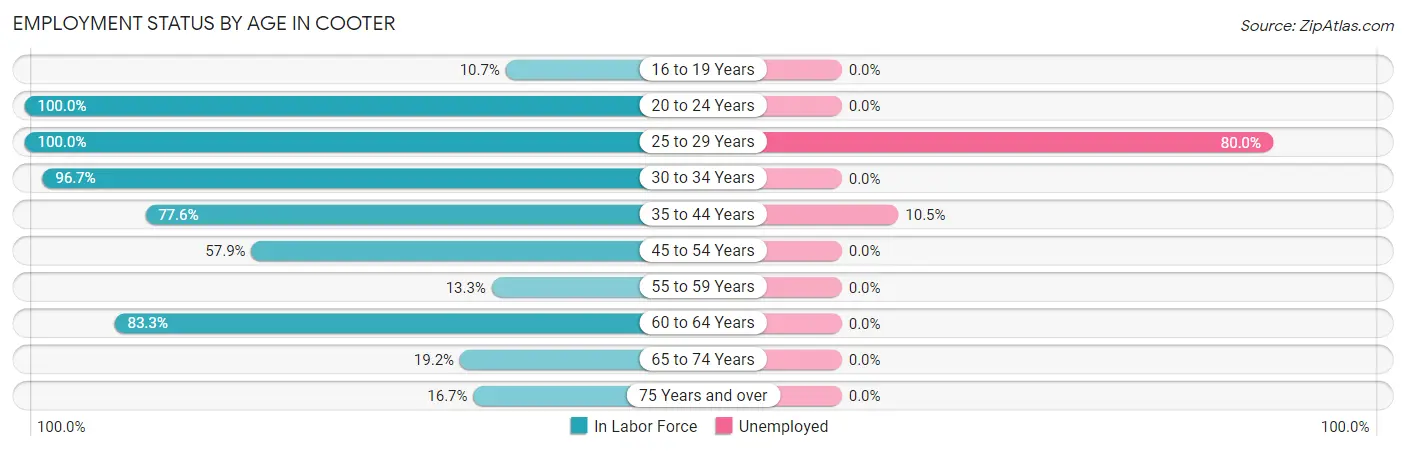
| Age Bracket | In Labor Force | Unemployed |
| 16 to 19 Years | 3 (10.7%) | 0 (0.0%) |
| 20 to 24 Years | 7 (100.0%) | 0 (0.0%) |
| 25 to 29 Years | 5 (100.0%) | 4 (80.0%) |
| 30 to 34 Years | 29 (96.7%) | 0 (0.0%) |
| 35 to 44 Years | 38 (77.6%) | 4 (10.5%) |
| 45 to 54 Years | 33 (57.9%) | 0 (0.0%) |
| 55 to 59 Years | 2 (13.3%) | 0 (0.0%) |
| 60 to 64 Years | 10 (83.3%) | 0 (0.0%) |
| 65 to 74 Years | 5 (19.2%) | 0 (0.0%) |
| 75 Years and over | 2 (16.7%) | 0 (0.0%) |
| Total | 134 (55.6%) | 8 (6.0%) |
Employment Status by Educational Attainment in Cooter
According to labor force statistics for Cooter, 69.6% of individuals (117) out of the total population between 25 and 64 years of age (168) are in the labor force, with 6.8% or 8 of them being unemployed. The group with the highest labor force participation rate are those with the educational attainment of bachelor's degree or higher, with 89.5% or 17 individuals in the labor force. Within the labor force, individuals with college / associate degree education have the highest percentage of unemployment, with 19.0% or 4 of them being unemployed.
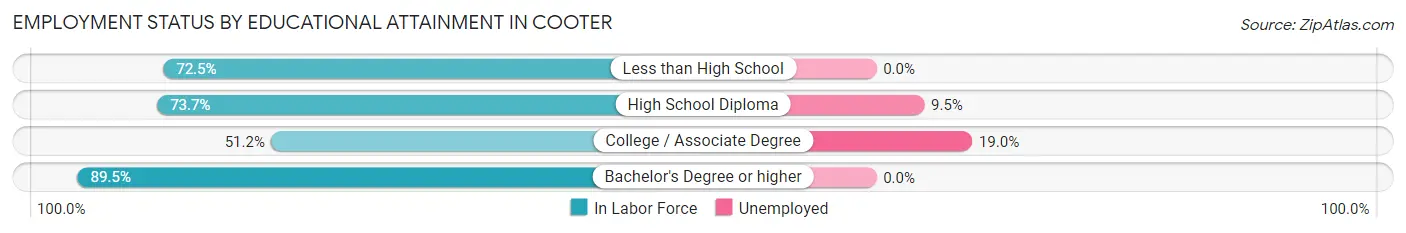
| Educational Attainment | In Labor Force | Unemployed |
| Less than High School | 37 (72.5%) | 0 (0.0%) |
| High School Diploma | 42 (73.7%) | 5 (9.5%) |
| College / Associate Degree | 21 (51.2%) | 8 (19.0%) |
| Bachelor's Degree or higher | 17 (89.5%) | 0 (0.0%) |
| Total | 117 (69.6%) | 11 (6.8%) |
Employment Occupations by Sex in Cooter
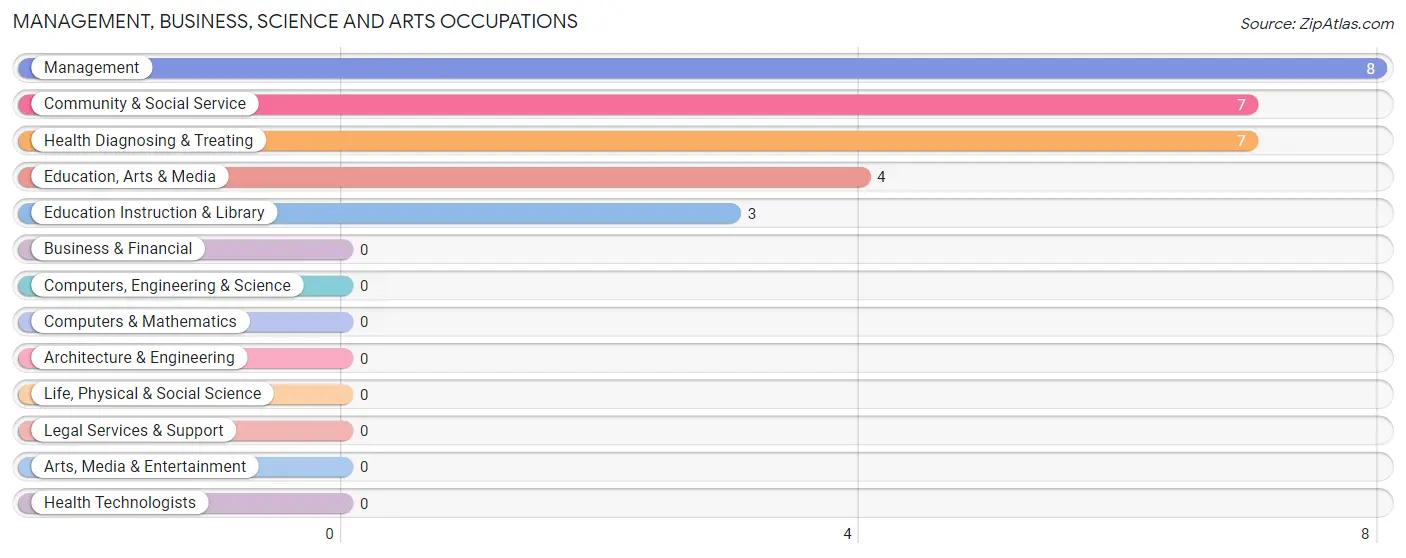
Management, Business, Science and Arts Occupations
The most common Management, Business, Science and Arts occupations in Cooter are Management (8 | 6.4%), Community & Social Service (7 | 5.6%), Health Diagnosing & Treating (7 | 5.6%), Education, Arts & Media (4 | 3.2%), and Education Instruction & Library (3 | 2.4%).
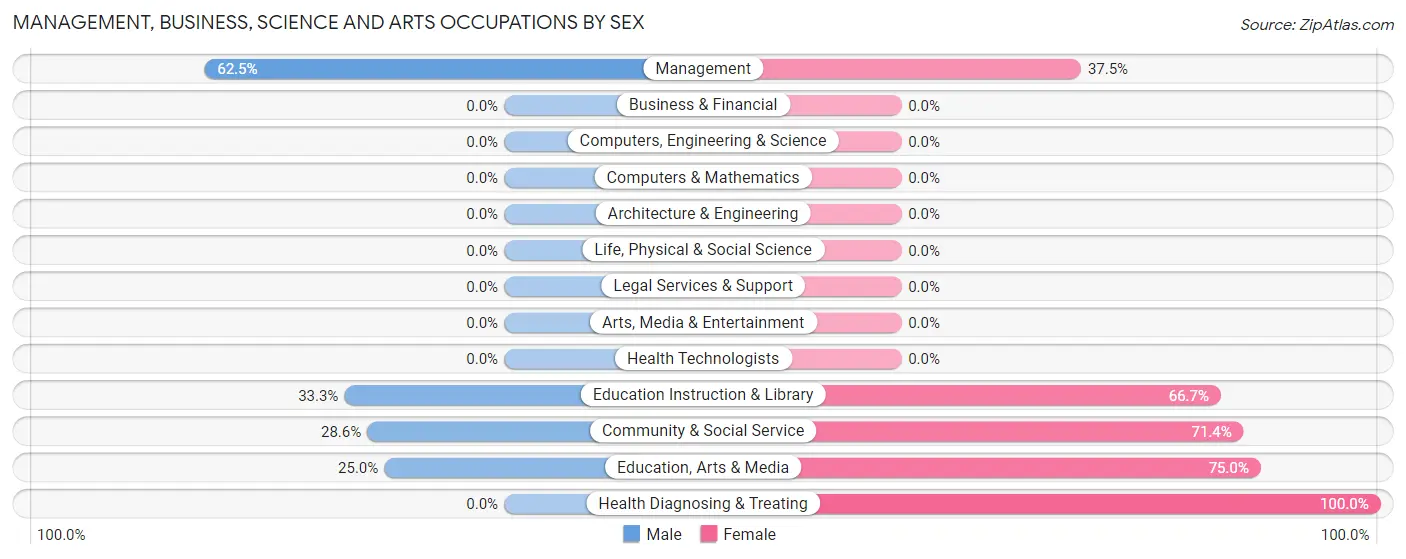
Management, Business, Science and Arts Occupations by Sex
Within the Management, Business, Science and Arts occupations in Cooter, the most male-oriented occupations are Management (62.5%), Education Instruction & Library (33.3%), and Community & Social Service (28.6%), while the most female-oriented occupations are Health Diagnosing & Treating (100.0%), Education, Arts & Media (75.0%), and Community & Social Service (71.4%).
| Occupation | Male | Female |
| Management | 5 (62.5%) | 3 (37.5%) |
| Business & Financial | 0 (0.0%) | 0 (0.0%) |
| Computers, Engineering & Science | 0 (0.0%) | 0 (0.0%) |
| Computers & Mathematics | 0 (0.0%) | 0 (0.0%) |
| Architecture & Engineering | 0 (0.0%) | 0 (0.0%) |
| Life, Physical & Social Science | 0 (0.0%) | 0 (0.0%) |
| Community & Social Service | 2 (28.6%) | 5 (71.4%) |
| Education, Arts & Media | 1 (25.0%) | 3 (75.0%) |
| Legal Services & Support | 0 (0.0%) | 0 (0.0%) |
| Education Instruction & Library | 1 (33.3%) | 2 (66.7%) |
| Arts, Media & Entertainment | 0 (0.0%) | 0 (0.0%) |
| Health Diagnosing & Treating | 0 (0.0%) | 7 (100.0%) |
| Health Technologists | 0 (0.0%) | 0 (0.0%) |
| Total (Category) | 7 (31.8%) | 15 (68.2%) |
| Total (Overall) | 77 (61.1%) | 49 (38.9%) |
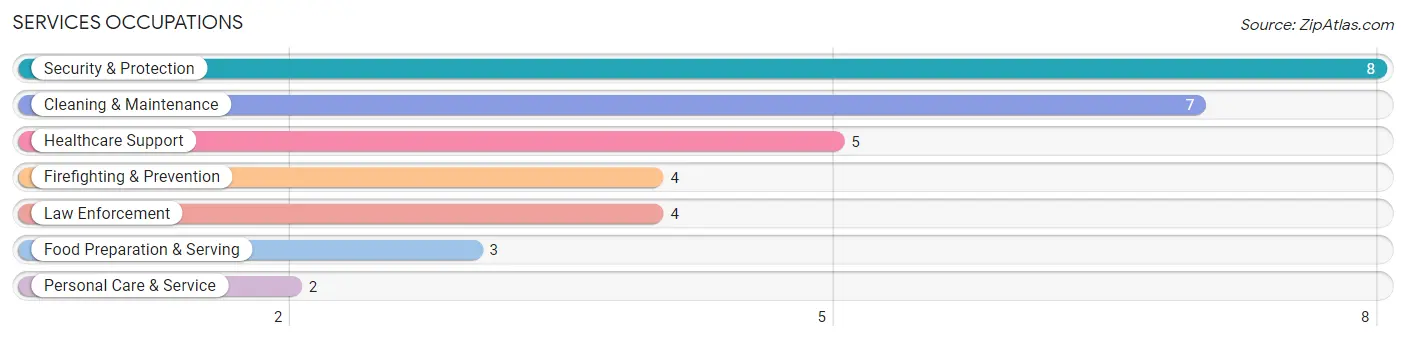
Services Occupations
The most common Services occupations in Cooter are Security & Protection (8 | 6.4%), Cleaning & Maintenance (7 | 5.6%), Healthcare Support (5 | 4.0%), Firefighting & Prevention (4 | 3.2%), and Law Enforcement (4 | 3.2%).
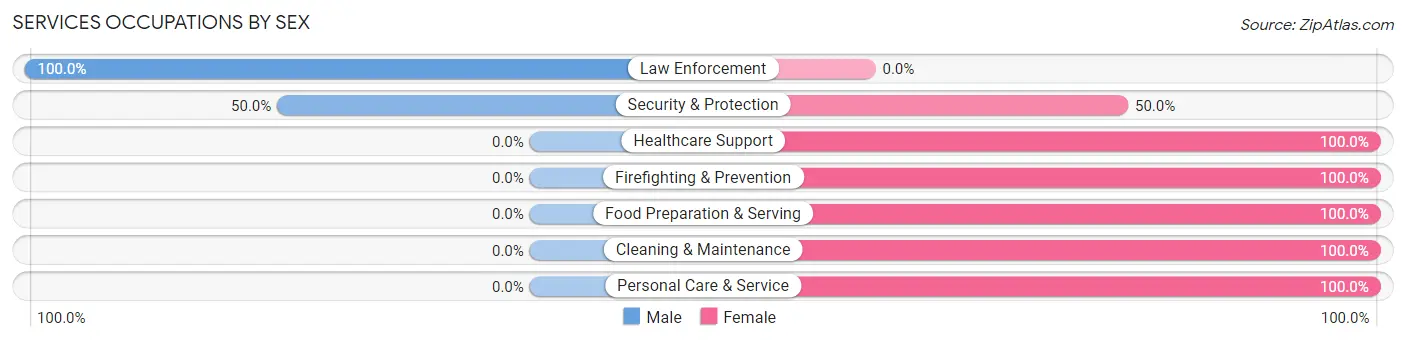
Services Occupations by Sex
Within the Services occupations in Cooter, the most male-oriented occupations are Law Enforcement (100.0%), and Security & Protection (50.0%), while the most female-oriented occupations are Healthcare Support (100.0%), Firefighting & Prevention (100.0%), and Food Preparation & Serving (100.0%).
| Occupation | Male | Female |
| Healthcare Support | 0 (0.0%) | 5 (100.0%) |
| Security & Protection | 4 (50.0%) | 4 (50.0%) |
| Firefighting & Prevention | 0 (0.0%) | 4 (100.0%) |
| Law Enforcement | 4 (100.0%) | 0 (0.0%) |
| Food Preparation & Serving | 0 (0.0%) | 3 (100.0%) |
| Cleaning & Maintenance | 0 (0.0%) | 7 (100.0%) |
| Personal Care & Service | 0 (0.0%) | 2 (100.0%) |
| Total (Category) | 4 (16.0%) | 21 (84.0%) |
| Total (Overall) | 77 (61.1%) | 49 (38.9%) |
Sales and Office Occupations
The most common Sales and Office occupations in Cooter are Sales & Related (6 | 4.8%), and Office & Administration (3 | 2.4%).
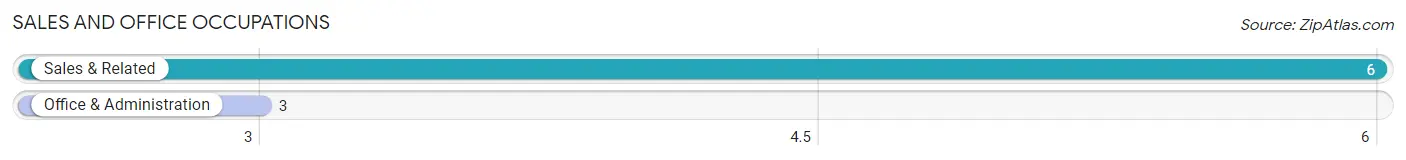
Sales and Office Occupations by Sex
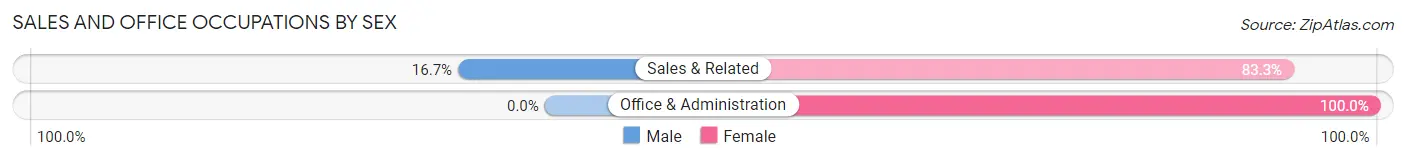
| Occupation | Male | Female |
| Sales & Related | 1 (16.7%) | 5 (83.3%) |
| Office & Administration | 0 (0.0%) | 3 (100.0%) |
| Total (Category) | 1 (11.1%) | 8 (88.9%) |
| Total (Overall) | 77 (61.1%) | 49 (38.9%) |
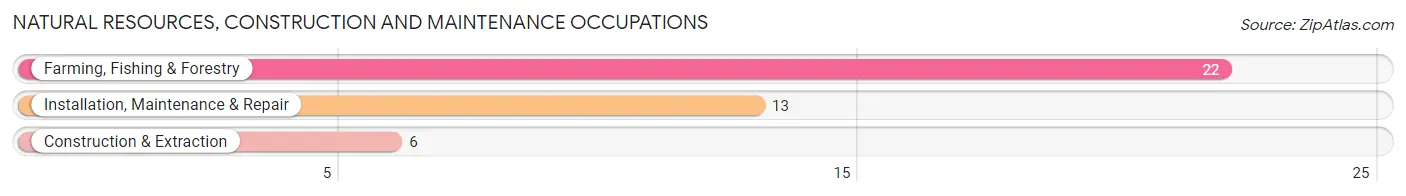
Natural Resources, Construction and Maintenance Occupations
The most common Natural Resources, Construction and Maintenance occupations in Cooter are Farming, Fishing & Forestry (22 | 17.5%), Installation, Maintenance & Repair (13 | 10.3%), and Construction & Extraction (6 | 4.8%).
Natural Resources, Construction and Maintenance Occupations by Sex
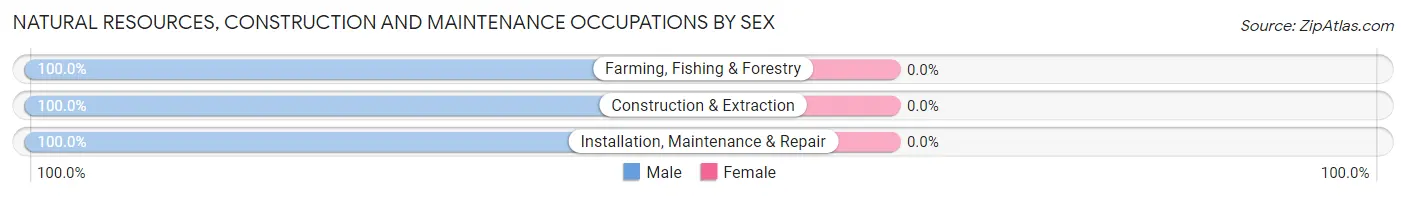
| Occupation | Male | Female |
| Farming, Fishing & Forestry | 22 (100.0%) | 0 (0.0%) |
| Construction & Extraction | 6 (100.0%) | 0 (0.0%) |
| Installation, Maintenance & Repair | 13 (100.0%) | 0 (0.0%) |
| Total (Category) | 41 (100.0%) | 0 (0.0%) |
| Total (Overall) | 77 (61.1%) | 49 (38.9%) |
Production, Transportation and Moving Occupations
The most common Production, Transportation and Moving occupations in Cooter are Material Moving (16 | 12.7%), and Production (13 | 10.3%).
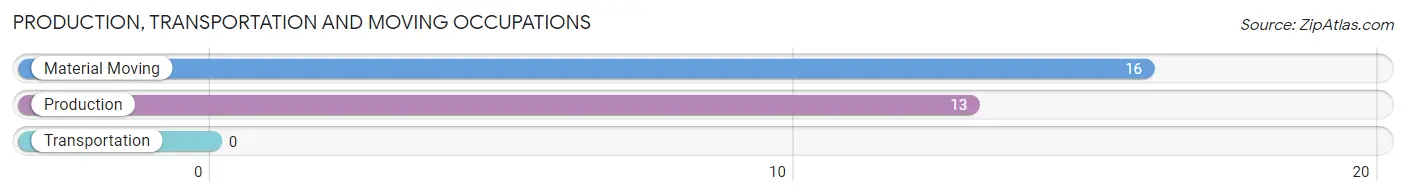
Production, Transportation and Moving Occupations by Sex
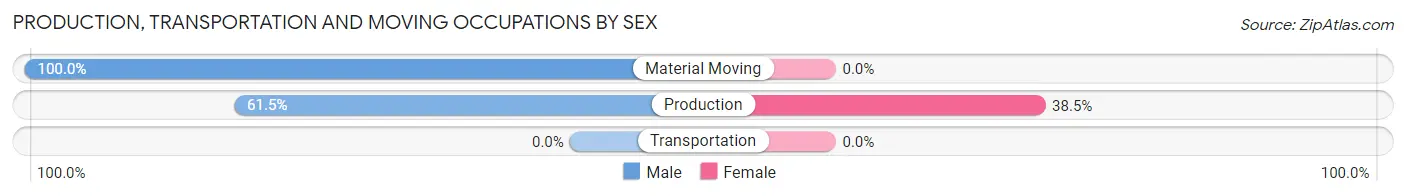
| Occupation | Male | Female |
| Production | 8 (61.5%) | 5 (38.5%) |
| Transportation | 0 (0.0%) | 0 (0.0%) |
| Material Moving | 16 (100.0%) | 0 (0.0%) |
| Total (Category) | 24 (82.8%) | 5 (17.2%) |
| Total (Overall) | 77 (61.1%) | 49 (38.9%) |
Employment Industries by Sex in Cooter
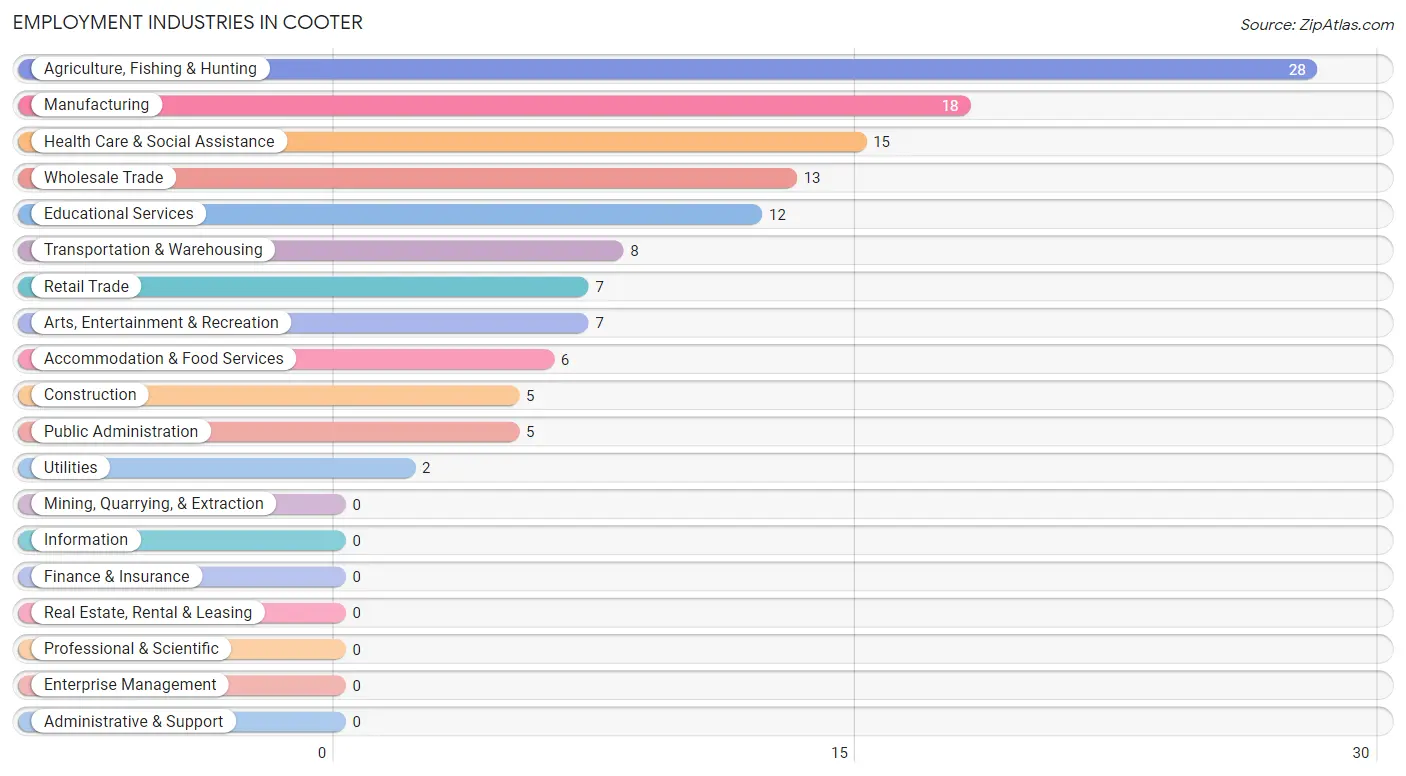
Employment Industries in Cooter
The major employment industries in Cooter include Agriculture, Fishing & Hunting (28 | 22.2%), Manufacturing (18 | 14.3%), Health Care & Social Assistance (15 | 11.9%), Wholesale Trade (13 | 10.3%), and Educational Services (12 | 9.5%).
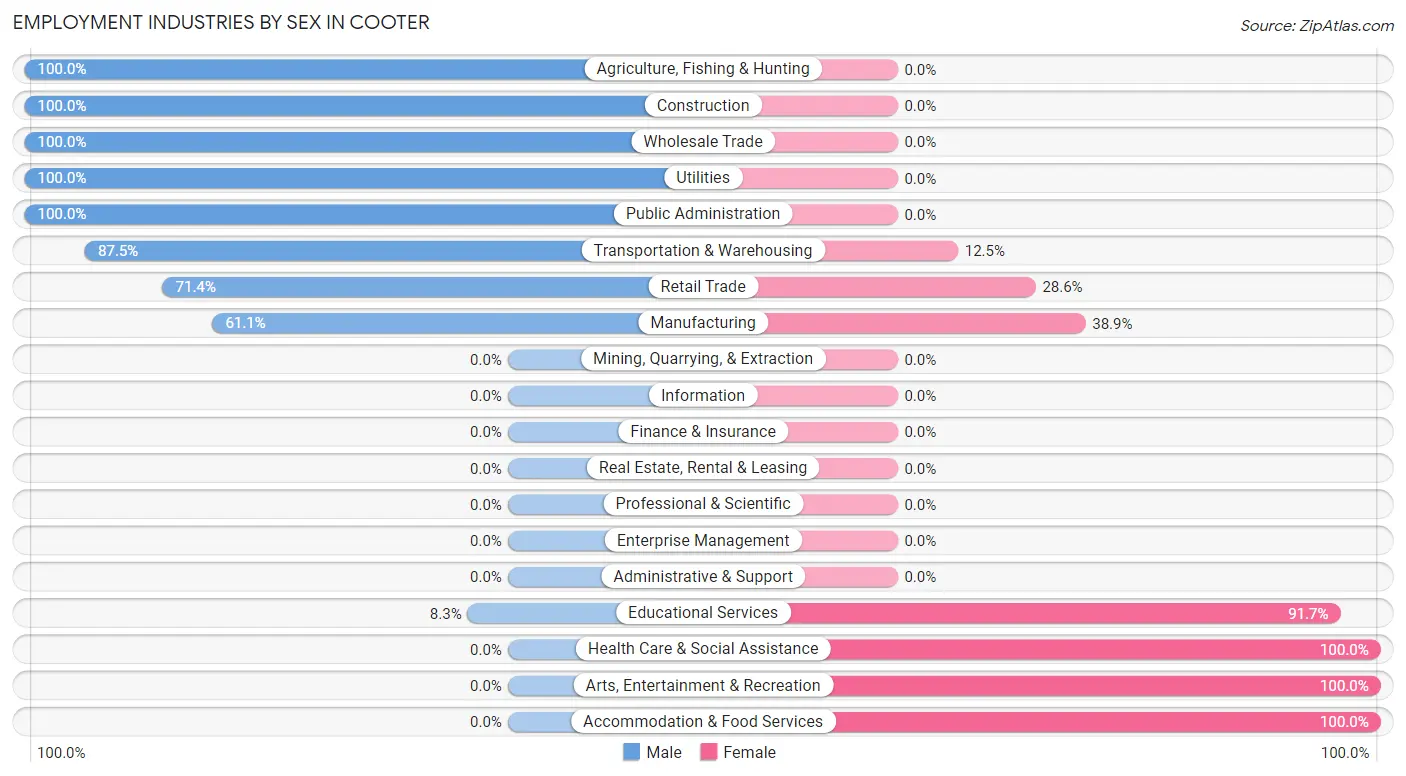
Employment Industries by Sex in Cooter
The Cooter industries that see more men than women are Agriculture, Fishing & Hunting (100.0%), Construction (100.0%), and Wholesale Trade (100.0%), whereas the industries that tend to have a higher number of women are Health Care & Social Assistance (100.0%), Arts, Entertainment & Recreation (100.0%), and Accommodation & Food Services (100.0%).
| Industry | Male | Female |
| Agriculture, Fishing & Hunting | 28 (100.0%) | 0 (0.0%) |
| Mining, Quarrying, & Extraction | 0 (0.0%) | 0 (0.0%) |
| Construction | 5 (100.0%) | 0 (0.0%) |
| Manufacturing | 11 (61.1%) | 7 (38.9%) |
| Wholesale Trade | 13 (100.0%) | 0 (0.0%) |
| Retail Trade | 5 (71.4%) | 2 (28.6%) |
| Transportation & Warehousing | 7 (87.5%) | 1 (12.5%) |
| Utilities | 2 (100.0%) | 0 (0.0%) |
| Information | 0 (0.0%) | 0 (0.0%) |
| Finance & Insurance | 0 (0.0%) | 0 (0.0%) |
| Real Estate, Rental & Leasing | 0 (0.0%) | 0 (0.0%) |
| Professional & Scientific | 0 (0.0%) | 0 (0.0%) |
| Enterprise Management | 0 (0.0%) | 0 (0.0%) |
| Administrative & Support | 0 (0.0%) | 0 (0.0%) |
| Educational Services | 1 (8.3%) | 11 (91.7%) |
| Health Care & Social Assistance | 0 (0.0%) | 15 (100.0%) |
| Arts, Entertainment & Recreation | 0 (0.0%) | 7 (100.0%) |
| Accommodation & Food Services | 0 (0.0%) | 6 (100.0%) |
| Public Administration | 5 (100.0%) | 0 (0.0%) |
| Total | 77 (61.1%) | 49 (38.9%) |
Education in Cooter
School Enrollment in Cooter
The most common levels of schooling among the 121 students in Cooter are high school (45 | 37.2%), elementary school (43 | 35.5%), and middle school (22 | 18.2%).
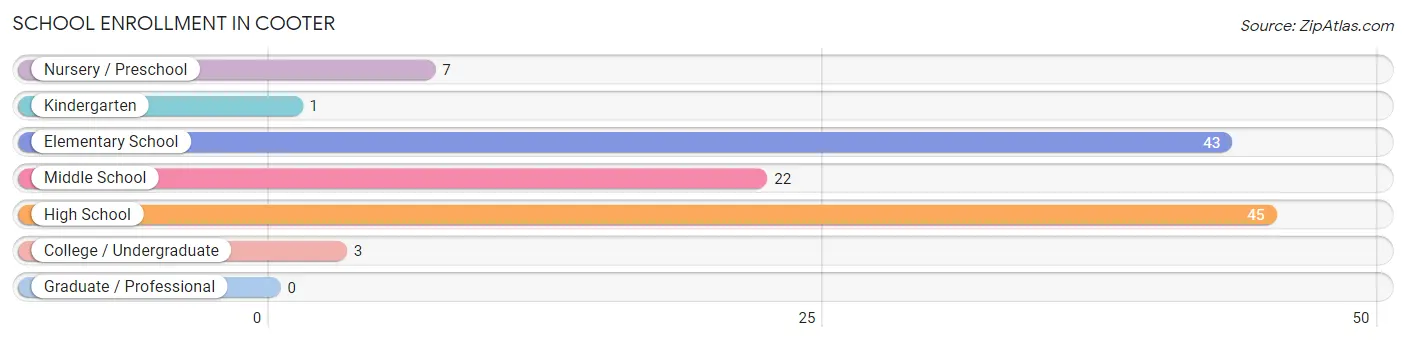
| School Level | # Students | % Students |
| Nursery / Preschool | 7 | 5.8% |
| Kindergarten | 1 | 0.8% |
| Elementary School | 43 | 35.5% |
| Middle School | 22 | 18.2% |
| High School | 45 | 37.2% |
| College / Undergraduate | 3 | 2.5% |
| Graduate / Professional | 0 | 0.0% |
| Total | 121 | 100.0% |
School Enrollment by Age by Funding Source in Cooter
Out of a total of 121 students who are enrolled in schools in Cooter, 12 (9.9%) attend a private institution, while the remaining 109 (90.1%) are enrolled in public schools. The age group of 5 to 9 year old has the highest likelihood of being enrolled in private schools, with 7 (19.4% in the age bracket) enrolled. Conversely, the age group of 10 to 14 year olds has the lowest likelihood of being enrolled in a private school, with 35 (100.0% in the age bracket) attending a public institution.
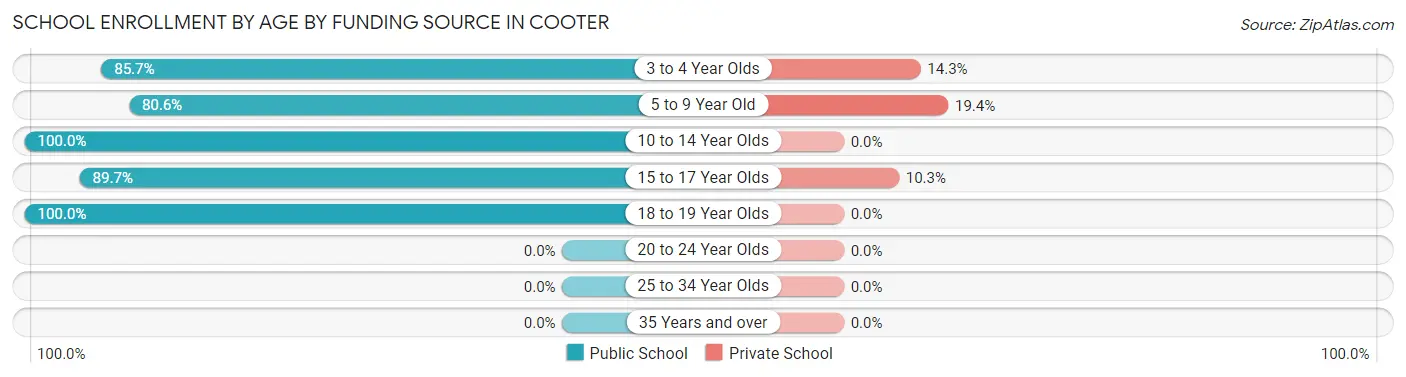
| Age Bracket | Public School | Private School |
| 3 to 4 Year Olds | 6 (85.7%) | 1 (14.3%) |
| 5 to 9 Year Old | 29 (80.6%) | 7 (19.4%) |
| 10 to 14 Year Olds | 35 (100.0%) | 0 (0.0%) |
| 15 to 17 Year Olds | 35 (89.7%) | 4 (10.3%) |
| 18 to 19 Year Olds | 4 (100.0%) | 0 (0.0%) |
| 20 to 24 Year Olds | 0 (0.0%) | 0 (0.0%) |
| 25 to 34 Year Olds | 0 (0.0%) | 0 (0.0%) |
| 35 Years and over | 0 (0.0%) | 0 (0.0%) |
| Total | 109 (90.1%) | 12 (9.9%) |
Educational Attainment by Field of Study in Cooter
Liberal arts & history (9 | 47.4%), education (5 | 26.3%), business (2 | 10.5%), arts & humanities (2 | 10.5%), and psychology (1 | 5.3%) are the most common fields of study among 19 individuals in Cooter who have obtained a bachelor's degree or higher.
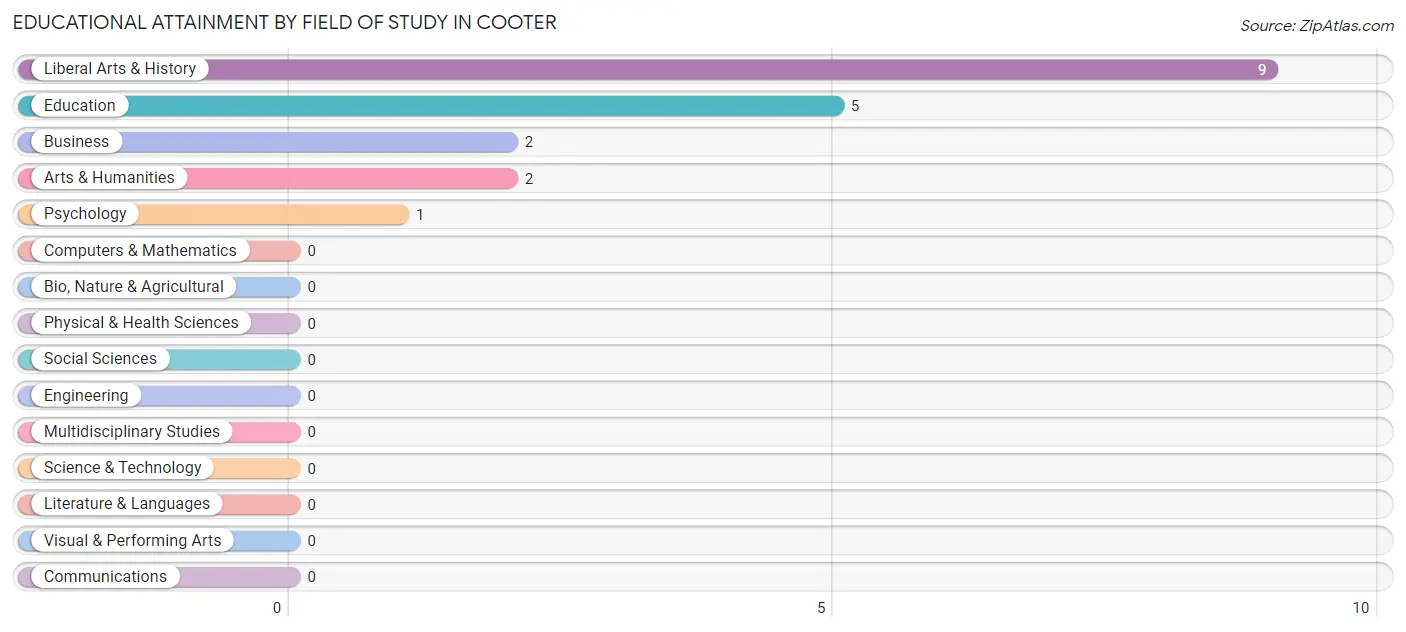
| Field of Study | # Graduates | % Graduates |
| Computers & Mathematics | 0 | 0.0% |
| Bio, Nature & Agricultural | 0 | 0.0% |
| Physical & Health Sciences | 0 | 0.0% |
| Psychology | 1 | 5.3% |
| Social Sciences | 0 | 0.0% |
| Engineering | 0 | 0.0% |
| Multidisciplinary Studies | 0 | 0.0% |
| Science & Technology | 0 | 0.0% |
| Business | 2 | 10.5% |
| Education | 5 | 26.3% |
| Literature & Languages | 0 | 0.0% |
| Liberal Arts & History | 9 | 47.4% |
| Visual & Performing Arts | 0 | 0.0% |
| Communications | 0 | 0.0% |
| Arts & Humanities | 2 | 10.5% |
| Total | 19 | 100.0% |
Transportation & Commute in Cooter
Vehicle Availability by Sex in Cooter
The most prevalent vehicle ownership categories in Cooter are males with 2 vehicles (55, accounting for 71.4%) and females with 2 vehicles (24, making up 112.2%).
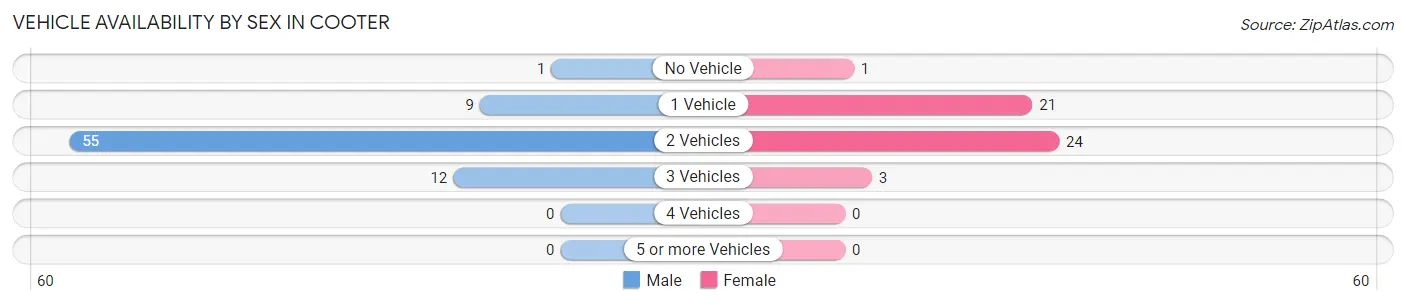
| Vehicles Available | Male | Female |
| No Vehicle | 1 (1.3%) | 1 (2.0%) |
| 1 Vehicle | 9 (11.7%) | 21 (42.9%) |
| 2 Vehicles | 55 (71.4%) | 24 (49.0%) |
| 3 Vehicles | 12 (15.6%) | 3 (6.1%) |
| 4 Vehicles | 0 (0.0%) | 0 (0.0%) |
| 5 or more Vehicles | 0 (0.0%) | 0 (0.0%) |
| Total | 77 (100.0%) | 49 (100.0%) |
Commute Time in Cooter
The most frequently occuring commute durations in Cooter are less than 5 minutes (27 commuters, 21.6%), 20 to 24 minutes (27 commuters, 21.6%), and 5 to 9 minutes (20 commuters, 16.0%).
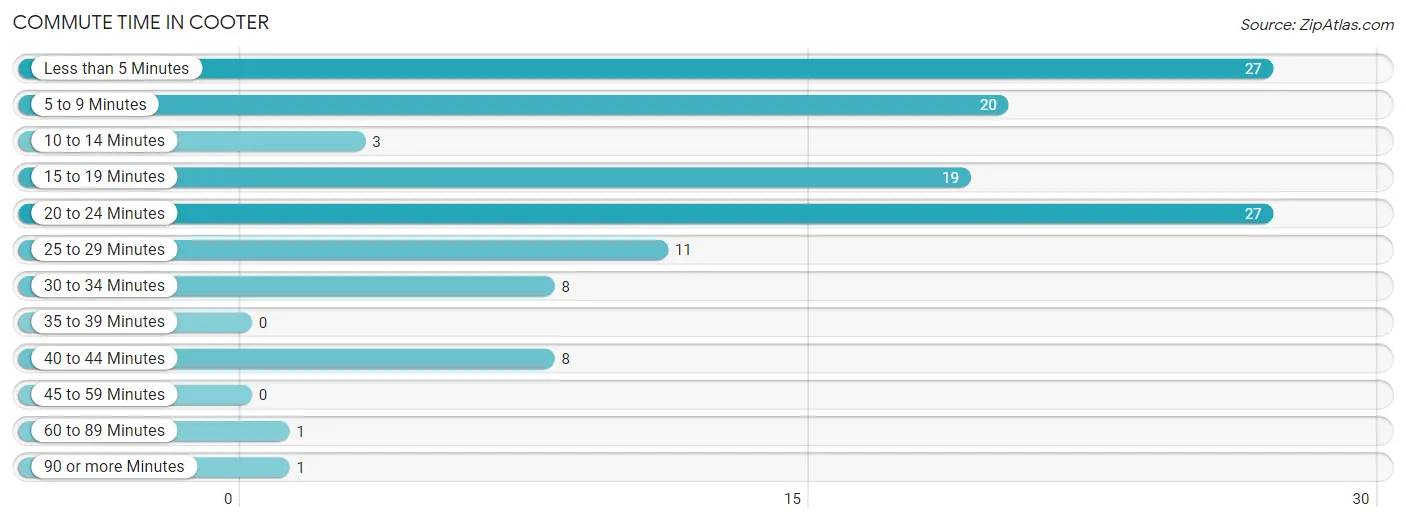
| Commute Time | # Commuters | % Commuters |
| Less than 5 Minutes | 27 | 21.6% |
| 5 to 9 Minutes | 20 | 16.0% |
| 10 to 14 Minutes | 3 | 2.4% |
| 15 to 19 Minutes | 19 | 15.2% |
| 20 to 24 Minutes | 27 | 21.6% |
| 25 to 29 Minutes | 11 | 8.8% |
| 30 to 34 Minutes | 8 | 6.4% |
| 35 to 39 Minutes | 0 | 0.0% |
| 40 to 44 Minutes | 8 | 6.4% |
| 45 to 59 Minutes | 0 | 0.0% |
| 60 to 89 Minutes | 1 | 0.8% |
| 90 or more Minutes | 1 | 0.8% |
Commute Time by Sex in Cooter
The most common commute times in Cooter are 20 to 24 minutes (20 commuters, 26.0%) for males and less than 5 minutes (15 commuters, 31.2%) for females.
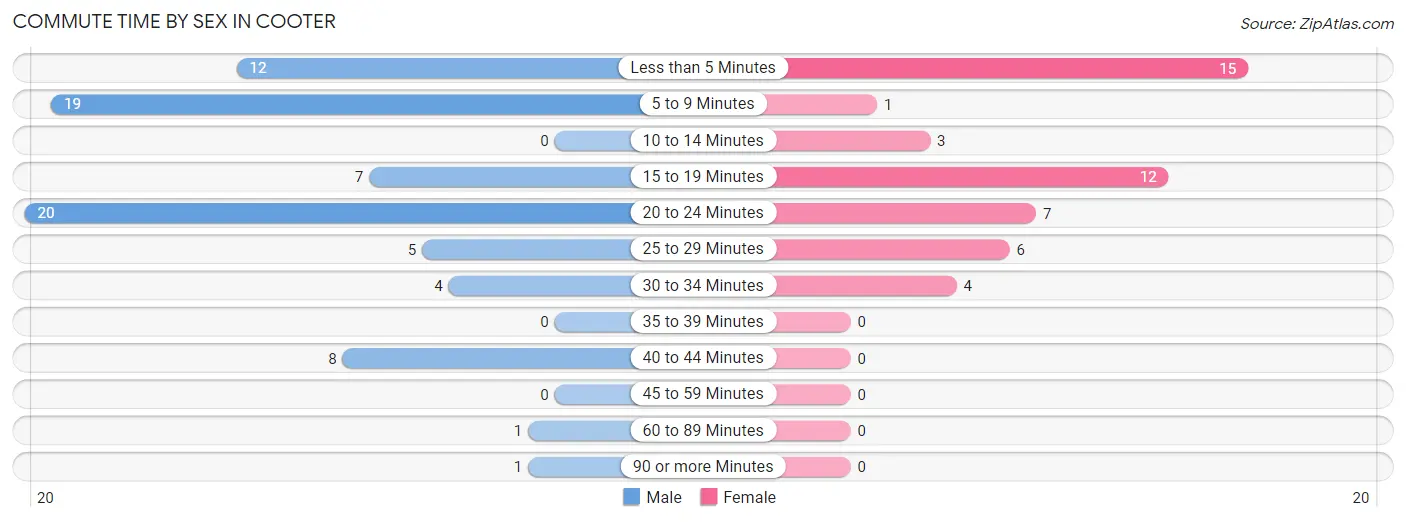
| Commute Time | Male | Female |
| Less than 5 Minutes | 12 (15.6%) | 15 (31.2%) |
| 5 to 9 Minutes | 19 (24.7%) | 1 (2.1%) |
| 10 to 14 Minutes | 0 (0.0%) | 3 (6.2%) |
| 15 to 19 Minutes | 7 (9.1%) | 12 (25.0%) |
| 20 to 24 Minutes | 20 (26.0%) | 7 (14.6%) |
| 25 to 29 Minutes | 5 (6.5%) | 6 (12.5%) |
| 30 to 34 Minutes | 4 (5.2%) | 4 (8.3%) |
| 35 to 39 Minutes | 0 (0.0%) | 0 (0.0%) |
| 40 to 44 Minutes | 8 (10.4%) | 0 (0.0%) |
| 45 to 59 Minutes | 0 (0.0%) | 0 (0.0%) |
| 60 to 89 Minutes | 1 (1.3%) | 0 (0.0%) |
| 90 or more Minutes | 1 (1.3%) | 0 (0.0%) |
Time of Departure to Work by Sex in Cooter
The most frequent times of departure to work in Cooter are 5:30 AM to 5:59 AM (17, 22.1%) for males and 7:30 AM to 7:59 AM (9, 18.8%) for females.
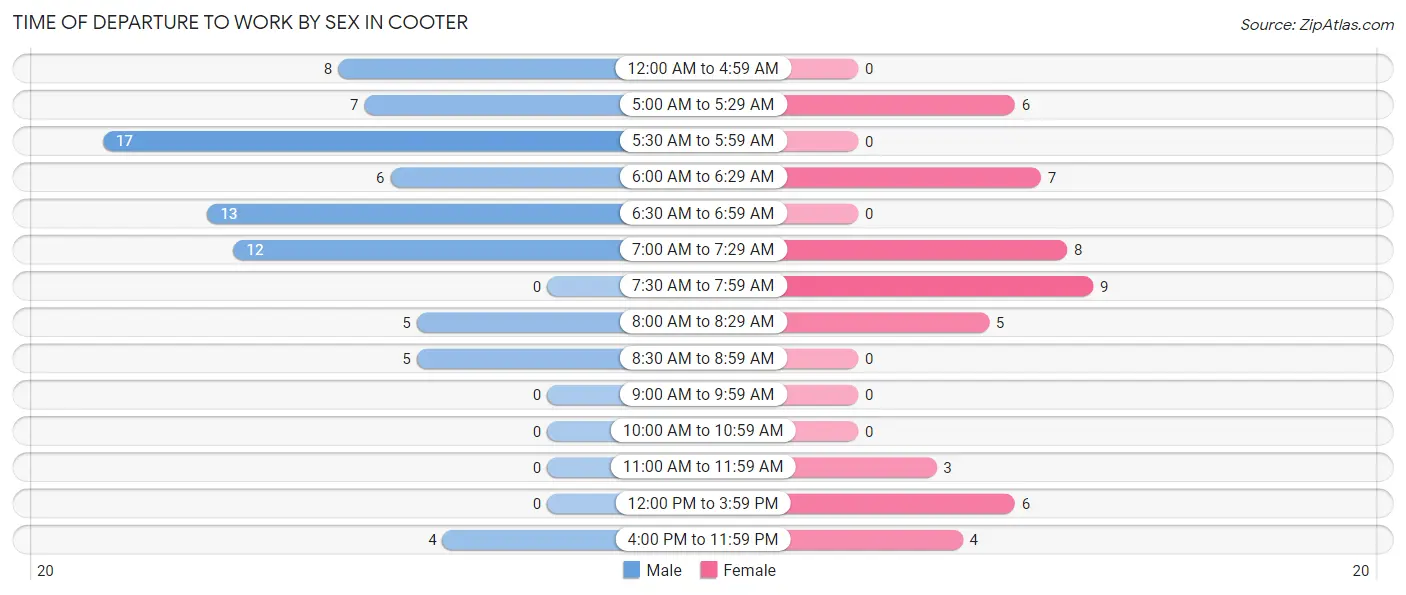
| Time of Departure | Male | Female |
| 12:00 AM to 4:59 AM | 8 (10.4%) | 0 (0.0%) |
| 5:00 AM to 5:29 AM | 7 (9.1%) | 6 (12.5%) |
| 5:30 AM to 5:59 AM | 17 (22.1%) | 0 (0.0%) |
| 6:00 AM to 6:29 AM | 6 (7.8%) | 7 (14.6%) |
| 6:30 AM to 6:59 AM | 13 (16.9%) | 0 (0.0%) |
| 7:00 AM to 7:29 AM | 12 (15.6%) | 8 (16.7%) |
| 7:30 AM to 7:59 AM | 0 (0.0%) | 9 (18.8%) |
| 8:00 AM to 8:29 AM | 5 (6.5%) | 5 (10.4%) |
| 8:30 AM to 8:59 AM | 5 (6.5%) | 0 (0.0%) |
| 9:00 AM to 9:59 AM | 0 (0.0%) | 0 (0.0%) |
| 10:00 AM to 10:59 AM | 0 (0.0%) | 0 (0.0%) |
| 11:00 AM to 11:59 AM | 0 (0.0%) | 3 (6.2%) |
| 12:00 PM to 3:59 PM | 0 (0.0%) | 6 (12.5%) |
| 4:00 PM to 11:59 PM | 4 (5.2%) | 4 (8.3%) |
| Total | 77 (100.0%) | 48 (100.0%) |
Housing Occupancy in Cooter
Occupancy by Ownership in Cooter
Of the total 135 dwellings in Cooter, owner-occupied units account for 60 (44.4%), while renter-occupied units make up 75 (55.6%).
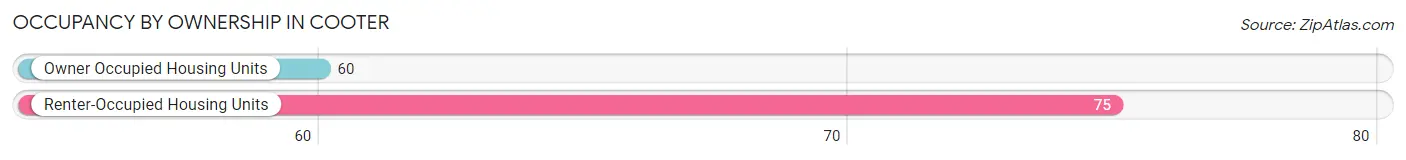
| Occupancy | # Housing Units | % Housing Units |
| Owner Occupied Housing Units | 60 | 44.4% |
| Renter-Occupied Housing Units | 75 | 55.6% |
| Total Occupied Housing Units | 135 | 100.0% |
Occupancy by Household Size in Cooter
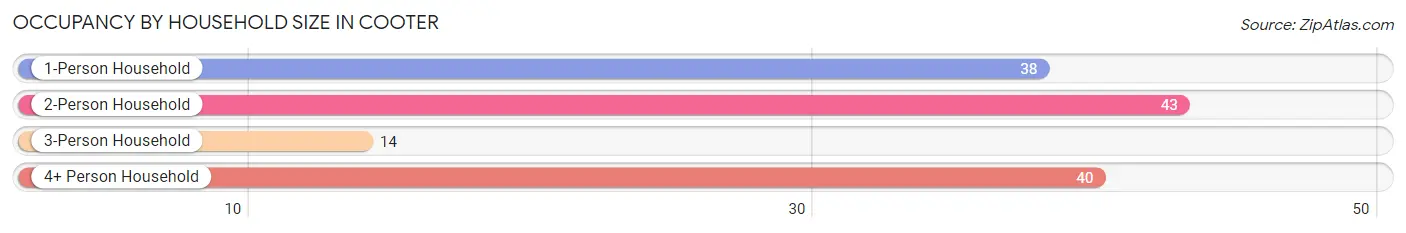
| Household Size | # Housing Units | % Housing Units |
| 1-Person Household | 38 | 28.1% |
| 2-Person Household | 43 | 31.9% |
| 3-Person Household | 14 | 10.4% |
| 4+ Person Household | 40 | 29.6% |
| Total Housing Units | 135 | 100.0% |
Occupancy by Ownership by Household Size in Cooter
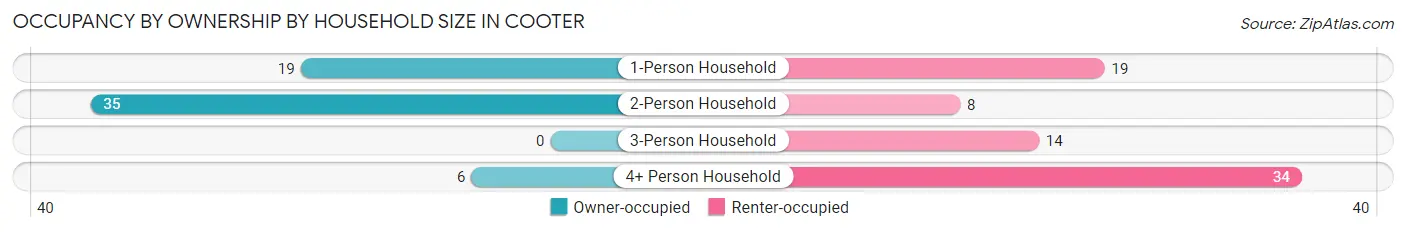
| Household Size | Owner-occupied | Renter-occupied |
| 1-Person Household | 19 (50.0%) | 19 (50.0%) |
| 2-Person Household | 35 (81.4%) | 8 (18.6%) |
| 3-Person Household | 0 (0.0%) | 14 (100.0%) |
| 4+ Person Household | 6 (15.0%) | 34 (85.0%) |
| Total Housing Units | 60 (44.4%) | 75 (55.6%) |
Occupancy by Educational Attainment in Cooter
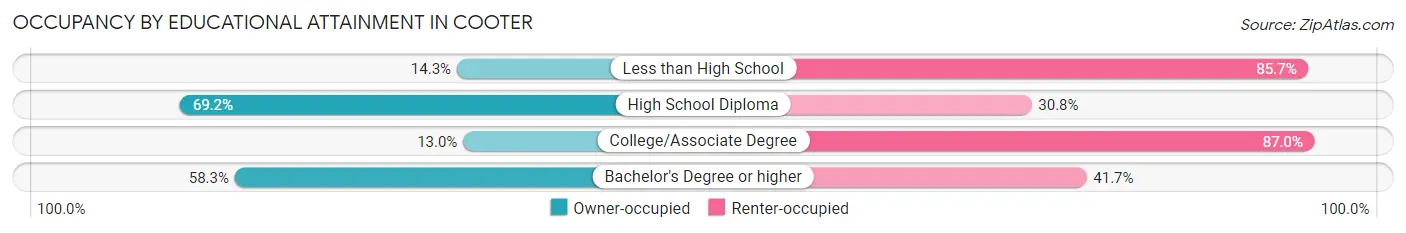
| Household Size | Owner-occupied | Renter-occupied |
| Less than High School | 5 (14.3%) | 30 (85.7%) |
| High School Diploma | 45 (69.2%) | 20 (30.8%) |
| College/Associate Degree | 3 (13.0%) | 20 (87.0%) |
| Bachelor's Degree or higher | 7 (58.3%) | 5 (41.7%) |
Occupancy by Age of Householder in Cooter
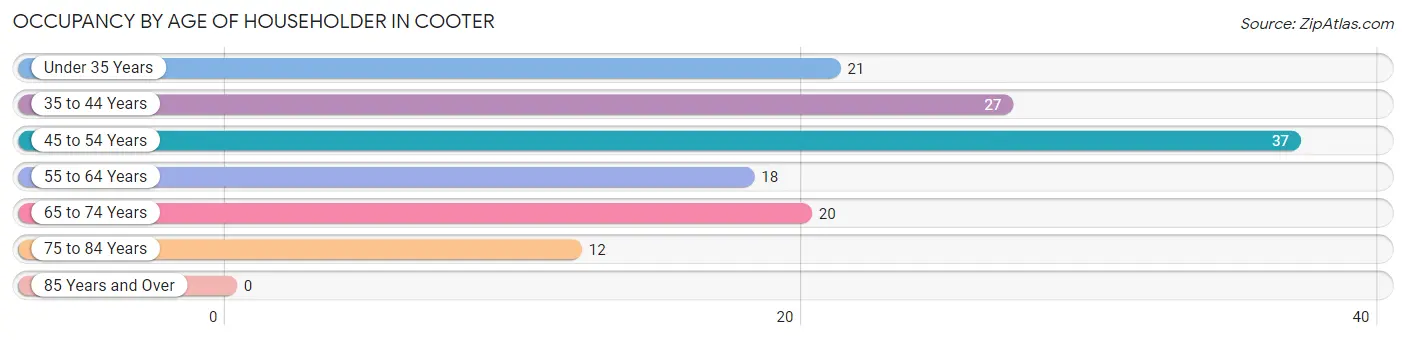
| Age Bracket | # Households | % Households |
| Under 35 Years | 21 | 15.6% |
| 35 to 44 Years | 27 | 20.0% |
| 45 to 54 Years | 37 | 27.4% |
| 55 to 64 Years | 18 | 13.3% |
| 65 to 74 Years | 20 | 14.8% |
| 75 to 84 Years | 12 | 8.9% |
| 85 Years and Over | 0 | 0.0% |
| Total | 135 | 100.0% |
Housing Finances in Cooter
Median Income by Occupancy in Cooter
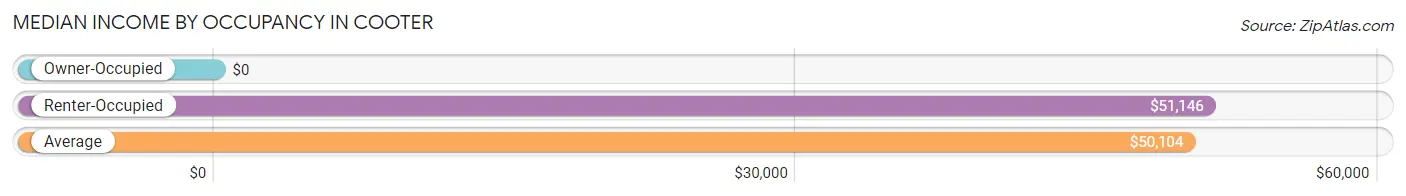
| Occupancy Type | # Households | Median Income |
| Owner-Occupied | 60 (44.4%) | $0 |
| Renter-Occupied | 75 (55.6%) | $51,146 |
| Average | 135 (100.0%) | $50,104 |
Occupancy by Householder Income Bracket in Cooter
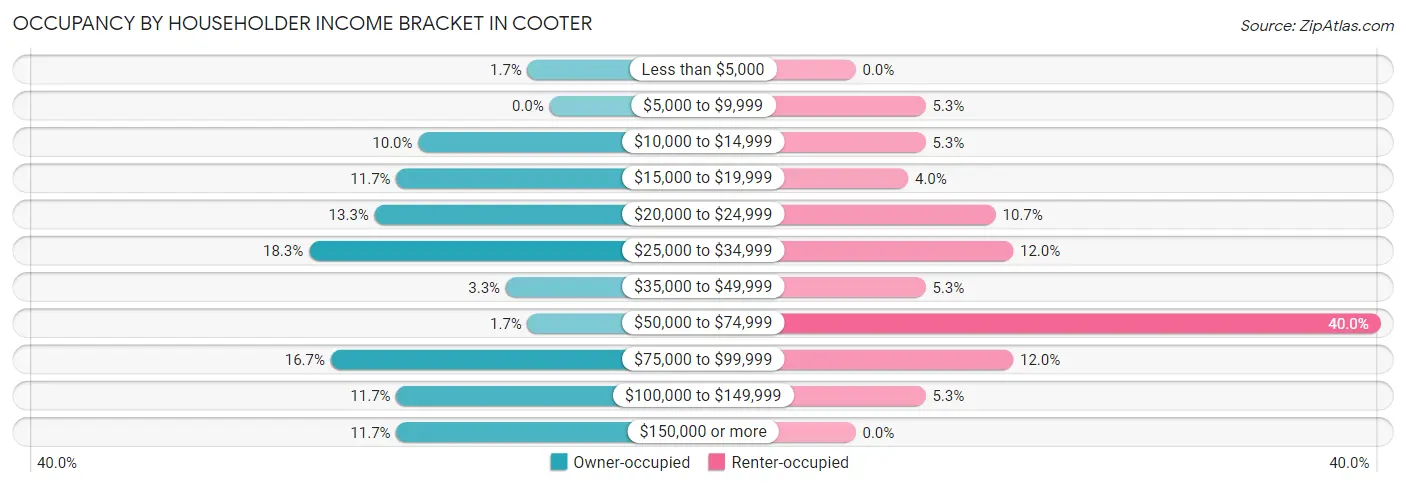
| Income Bracket | Owner-occupied | Renter-occupied |
| Less than $5,000 | 1 (1.7%) | 0 (0.0%) |
| $5,000 to $9,999 | 0 (0.0%) | 4 (5.3%) |
| $10,000 to $14,999 | 6 (10.0%) | 4 (5.3%) |
| $15,000 to $19,999 | 7 (11.7%) | 3 (4.0%) |
| $20,000 to $24,999 | 8 (13.3%) | 8 (10.7%) |
| $25,000 to $34,999 | 11 (18.3%) | 9 (12.0%) |
| $35,000 to $49,999 | 2 (3.3%) | 4 (5.3%) |
| $50,000 to $74,999 | 1 (1.7%) | 30 (40.0%) |
| $75,000 to $99,999 | 10 (16.7%) | 9 (12.0%) |
| $100,000 to $149,999 | 7 (11.7%) | 4 (5.3%) |
| $150,000 or more | 7 (11.7%) | 0 (0.0%) |
| Total | 60 (100.0%) | 75 (100.0%) |
Monthly Housing Cost Tiers in Cooter
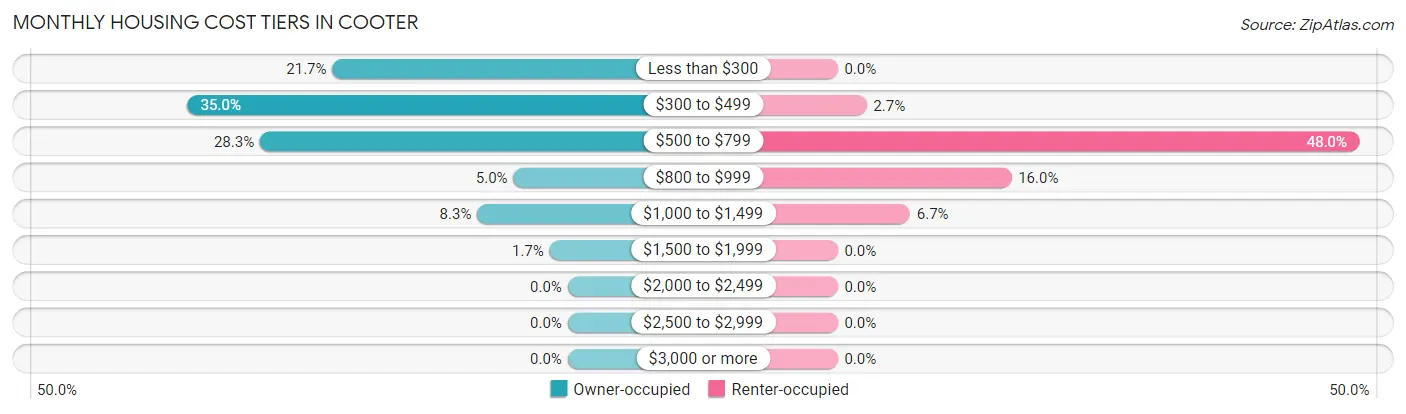
| Monthly Cost | Owner-occupied | Renter-occupied |
| Less than $300 | 13 (21.7%) | 0 (0.0%) |
| $300 to $499 | 21 (35.0%) | 2 (2.7%) |
| $500 to $799 | 17 (28.3%) | 36 (48.0%) |
| $800 to $999 | 3 (5.0%) | 12 (16.0%) |
| $1,000 to $1,499 | 5 (8.3%) | 5 (6.7%) |
| $1,500 to $1,999 | 1 (1.7%) | 0 (0.0%) |
| $2,000 to $2,499 | 0 (0.0%) | 0 (0.0%) |
| $2,500 to $2,999 | 0 (0.0%) | 0 (0.0%) |
| $3,000 or more | 0 (0.0%) | 0 (0.0%) |
| Total | 60 (100.0%) | 75 (100.0%) |
Physical Housing Characteristics in Cooter
Housing Structures in Cooter
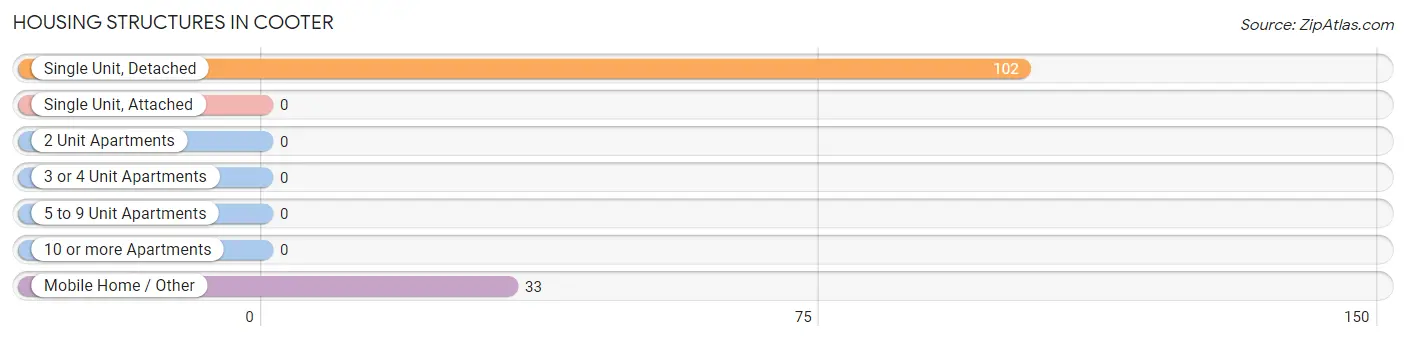
| Structure Type | # Housing Units | % Housing Units |
| Single Unit, Detached | 102 | 75.6% |
| Single Unit, Attached | 0 | 0.0% |
| 2 Unit Apartments | 0 | 0.0% |
| 3 or 4 Unit Apartments | 0 | 0.0% |
| 5 to 9 Unit Apartments | 0 | 0.0% |
| 10 or more Apartments | 0 | 0.0% |
| Mobile Home / Other | 33 | 24.4% |
| Total | 135 | 100.0% |
Housing Structures by Occupancy in Cooter
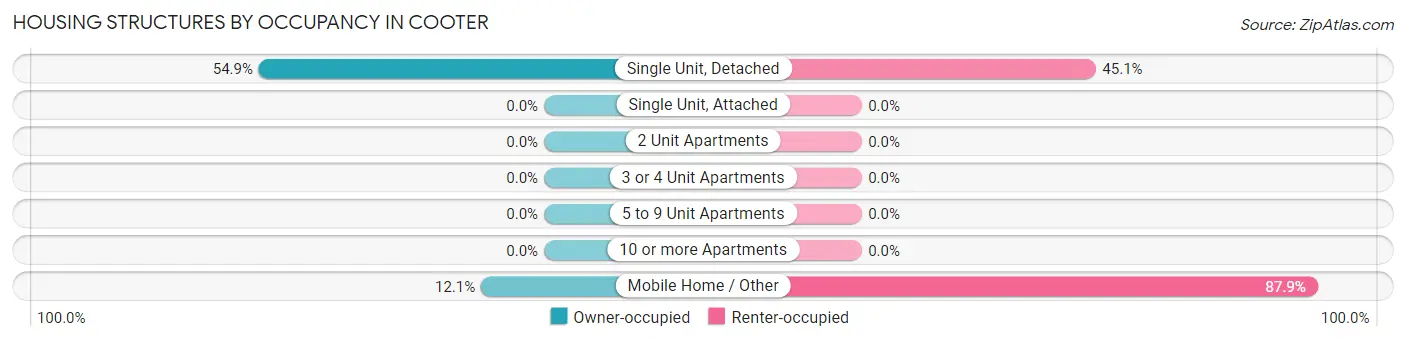
| Structure Type | Owner-occupied | Renter-occupied |
| Single Unit, Detached | 56 (54.9%) | 46 (45.1%) |
| Single Unit, Attached | 0 (0.0%) | 0 (0.0%) |
| 2 Unit Apartments | 0 (0.0%) | 0 (0.0%) |
| 3 or 4 Unit Apartments | 0 (0.0%) | 0 (0.0%) |
| 5 to 9 Unit Apartments | 0 (0.0%) | 0 (0.0%) |
| 10 or more Apartments | 0 (0.0%) | 0 (0.0%) |
| Mobile Home / Other | 4 (12.1%) | 29 (87.9%) |
| Total | 60 (44.4%) | 75 (55.6%) |
Housing Structures by Number of Rooms in Cooter
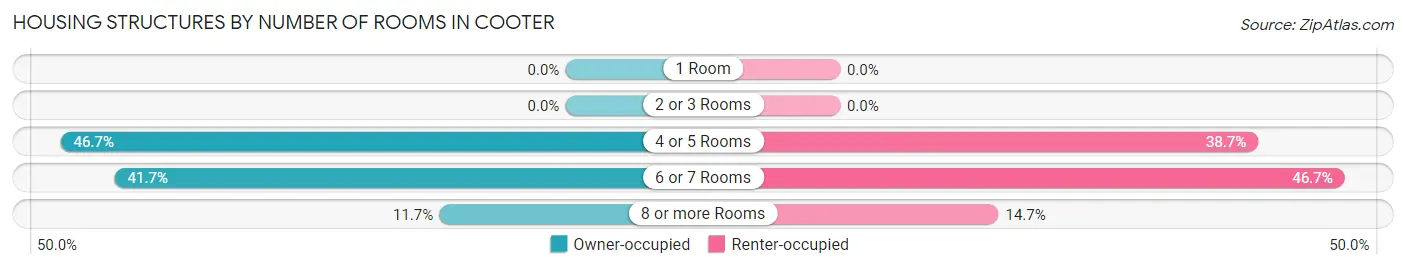
| Number of Rooms | Owner-occupied | Renter-occupied |
| 1 Room | 0 (0.0%) | 0 (0.0%) |
| 2 or 3 Rooms | 0 (0.0%) | 0 (0.0%) |
| 4 or 5 Rooms | 28 (46.7%) | 29 (38.7%) |
| 6 or 7 Rooms | 25 (41.7%) | 35 (46.7%) |
| 8 or more Rooms | 7 (11.7%) | 11 (14.7%) |
| Total | 60 (100.0%) | 75 (100.0%) |
Housing Structure by Heating Type in Cooter
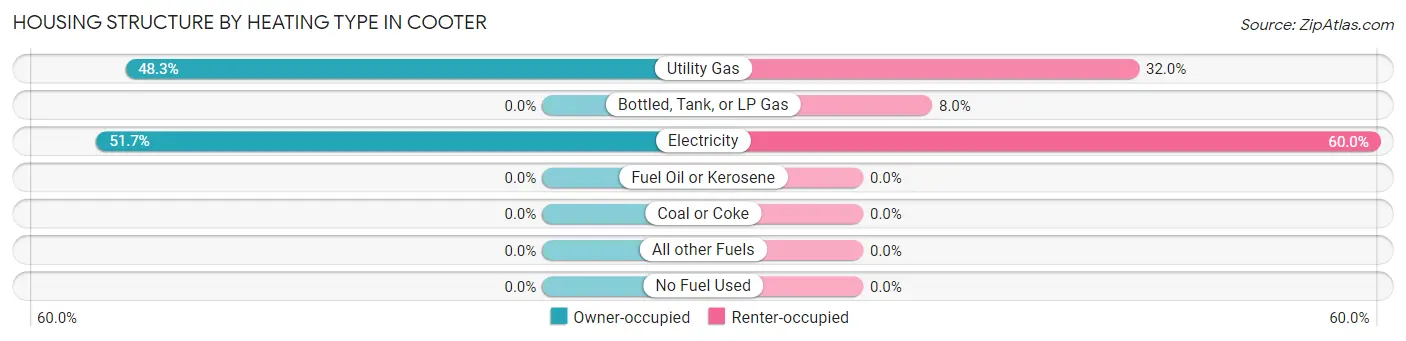
| Heating Type | Owner-occupied | Renter-occupied |
| Utility Gas | 29 (48.3%) | 24 (32.0%) |
| Bottled, Tank, or LP Gas | 0 (0.0%) | 6 (8.0%) |
| Electricity | 31 (51.7%) | 45 (60.0%) |
| Fuel Oil or Kerosene | 0 (0.0%) | 0 (0.0%) |
| Coal or Coke | 0 (0.0%) | 0 (0.0%) |
| All other Fuels | 0 (0.0%) | 0 (0.0%) |
| No Fuel Used | 0 (0.0%) | 0 (0.0%) |
| Total | 60 (100.0%) | 75 (100.0%) |
Household Vehicle Usage in Cooter
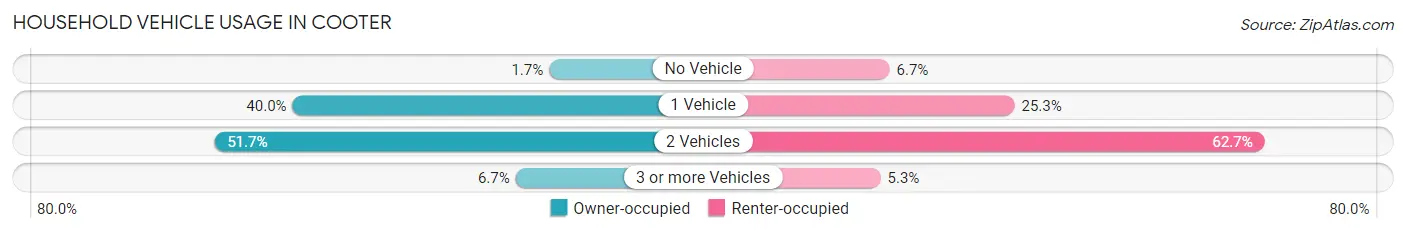
| Vehicles per Household | Owner-occupied | Renter-occupied |
| No Vehicle | 1 (1.7%) | 5 (6.7%) |
| 1 Vehicle | 24 (40.0%) | 19 (25.3%) |
| 2 Vehicles | 31 (51.7%) | 47 (62.7%) |
| 3 or more Vehicles | 4 (6.7%) | 4 (5.3%) |
| Total | 60 (100.0%) | 75 (100.0%) |
Real Estate & Mortgages in Cooter
Real Estate and Mortgage Overview in Cooter
| Characteristic | Without Mortgage | With Mortgage |
| Housing Units | 34 | 26 |
| Median Property Value | $45,300 | $88,300 |
| Median Household Income | $25,556 | $2 |
| Monthly Housing Costs | $313 | $0 |
| Real Estate Taxes | $520 | $0 |
Property Value by Mortgage Status in Cooter
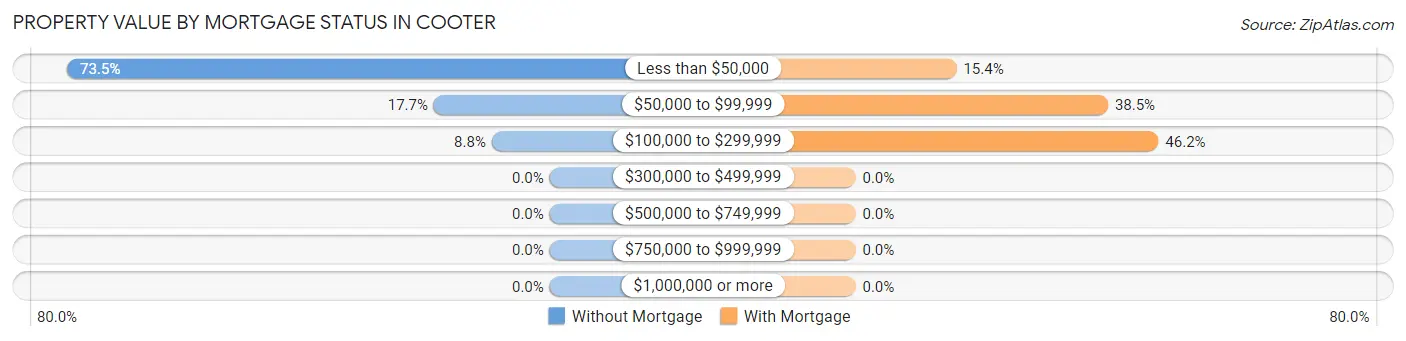
| Property Value | Without Mortgage | With Mortgage |
| Less than $50,000 | 25 (73.5%) | 4 (15.4%) |
| $50,000 to $99,999 | 6 (17.6%) | 10 (38.5%) |
| $100,000 to $299,999 | 3 (8.8%) | 12 (46.2%) |
| $300,000 to $499,999 | 0 (0.0%) | 0 (0.0%) |
| $500,000 to $749,999 | 0 (0.0%) | 0 (0.0%) |
| $750,000 to $999,999 | 0 (0.0%) | 0 (0.0%) |
| $1,000,000 or more | 0 (0.0%) | 0 (0.0%) |
| Total | 34 (100.0%) | 26 (100.0%) |
Household Income by Mortgage Status in Cooter
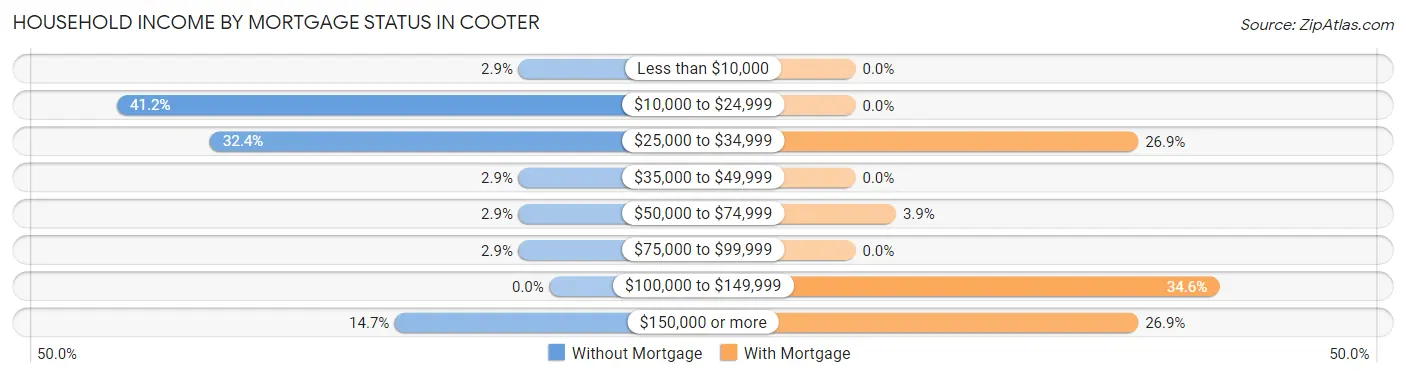
| Household Income | Without Mortgage | With Mortgage |
| Less than $10,000 | 1 (2.9%) | 0 (0.0%) |
| $10,000 to $24,999 | 14 (41.2%) | 0 (0.0%) |
| $25,000 to $34,999 | 11 (32.4%) | 7 (26.9%) |
| $35,000 to $49,999 | 1 (2.9%) | 0 (0.0%) |
| $50,000 to $74,999 | 1 (2.9%) | 1 (3.8%) |
| $75,000 to $99,999 | 1 (2.9%) | 0 (0.0%) |
| $100,000 to $149,999 | 0 (0.0%) | 9 (34.6%) |
| $150,000 or more | 5 (14.7%) | 7 (26.9%) |
| Total | 34 (100.0%) | 26 (100.0%) |
Property Value to Household Income Ratio in Cooter
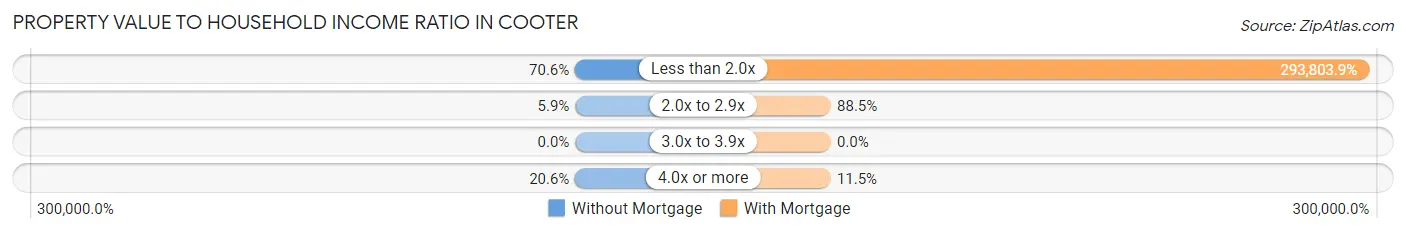
| Value-to-Income Ratio | Without Mortgage | With Mortgage |
| Less than 2.0x | 24 (70.6%) | 76,389 (293,803.9%) |
| 2.0x to 2.9x | 2 (5.9%) | 23 (88.5%) |
| 3.0x to 3.9x | 0 (0.0%) | 0 (0.0%) |
| 4.0x or more | 7 (20.6%) | 3 (11.5%) |
| Total | 34 (100.0%) | 26 (100.0%) |
Real Estate Taxes by Mortgage Status in Cooter
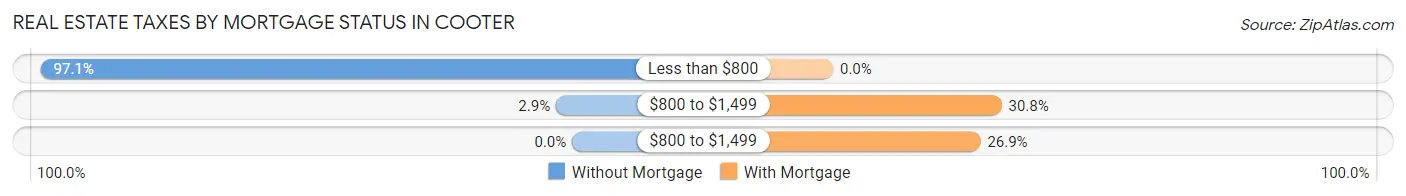
| Property Taxes | Without Mortgage | With Mortgage |
| Less than $800 | 33 (97.1%) | 0 (0.0%) |
| $800 to $1,499 | 1 (2.9%) | 8 (30.8%) |
| $800 to $1,499 | 0 (0.0%) | 7 (26.9%) |
| Total | 34 (100.0%) | 26 (100.0%) |
Health & Disability in Cooter
Health Insurance Coverage by Age in Cooter
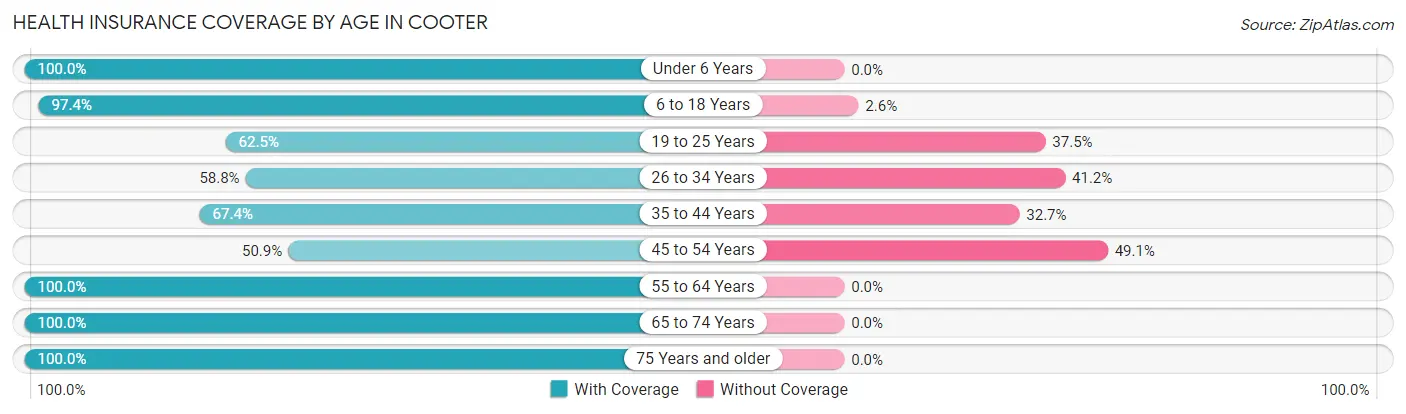
| Age Bracket | With Coverage | Without Coverage |
| Under 6 Years | 16 (100.0%) | 0 (0.0%) |
| 6 to 18 Years | 111 (97.4%) | 3 (2.6%) |
| 19 to 25 Years | 5 (62.5%) | 3 (37.5%) |
| 26 to 34 Years | 20 (58.8%) | 14 (41.2%) |
| 35 to 44 Years | 33 (67.3%) | 16 (32.7%) |
| 45 to 54 Years | 29 (50.9%) | 28 (49.1%) |
| 55 to 64 Years | 27 (100.0%) | 0 (0.0%) |
| 65 to 74 Years | 26 (100.0%) | 0 (0.0%) |
| 75 Years and older | 12 (100.0%) | 0 (0.0%) |
| Total | 279 (81.3%) | 64 (18.7%) |
Health Insurance Coverage by Citizenship Status in Cooter
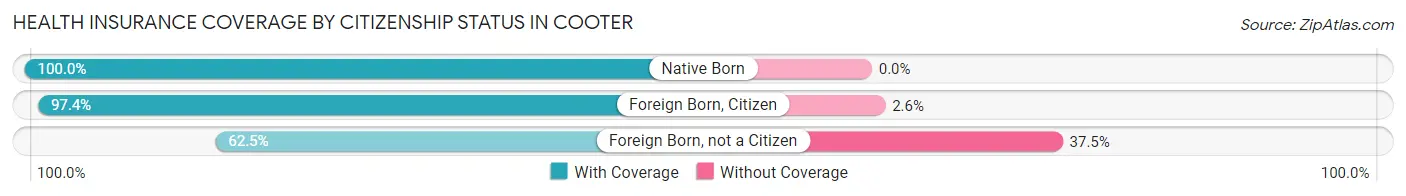
| Citizenship Status | With Coverage | Without Coverage |
| Native Born | 16 (100.0%) | 0 (0.0%) |
| Foreign Born, Citizen | 111 (97.4%) | 3 (2.6%) |
| Foreign Born, not a Citizen | 5 (62.5%) | 3 (37.5%) |
Health Insurance Coverage by Household Income in Cooter
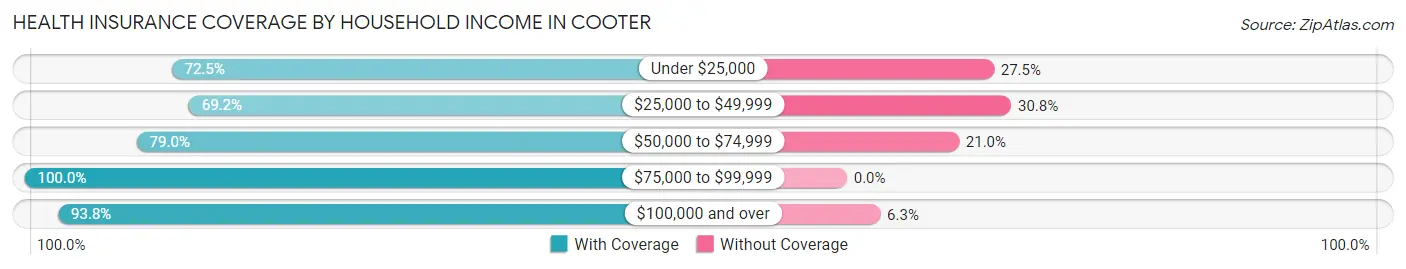
| Household Income | With Coverage | Without Coverage |
| Under $25,000 | 50 (72.5%) | 19 (27.5%) |
| $25,000 to $49,999 | 45 (69.2%) | 20 (30.8%) |
| $50,000 to $74,999 | 79 (79.0%) | 21 (21.0%) |
| $75,000 to $99,999 | 45 (100.0%) | 0 (0.0%) |
| $100,000 and over | 60 (93.8%) | 4 (6.2%) |
Public vs Private Health Insurance Coverage by Age in Cooter
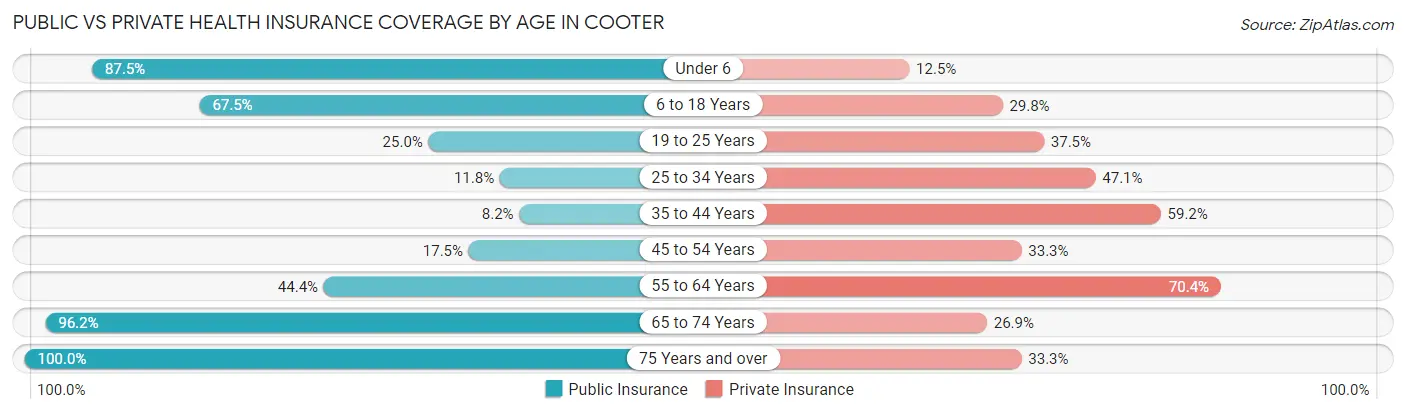
| Age Bracket | Public Insurance | Private Insurance |
| Under 6 | 14 (87.5%) | 2 (12.5%) |
| 6 to 18 Years | 77 (67.5%) | 34 (29.8%) |
| 19 to 25 Years | 2 (25.0%) | 3 (37.5%) |
| 25 to 34 Years | 4 (11.8%) | 16 (47.1%) |
| 35 to 44 Years | 4 (8.2%) | 29 (59.2%) |
| 45 to 54 Years | 10 (17.5%) | 19 (33.3%) |
| 55 to 64 Years | 12 (44.4%) | 19 (70.4%) |
| 65 to 74 Years | 25 (96.2%) | 7 (26.9%) |
| 75 Years and over | 12 (100.0%) | 4 (33.3%) |
| Total | 160 (46.7%) | 133 (38.8%) |
Disability Status by Sex by Age in Cooter
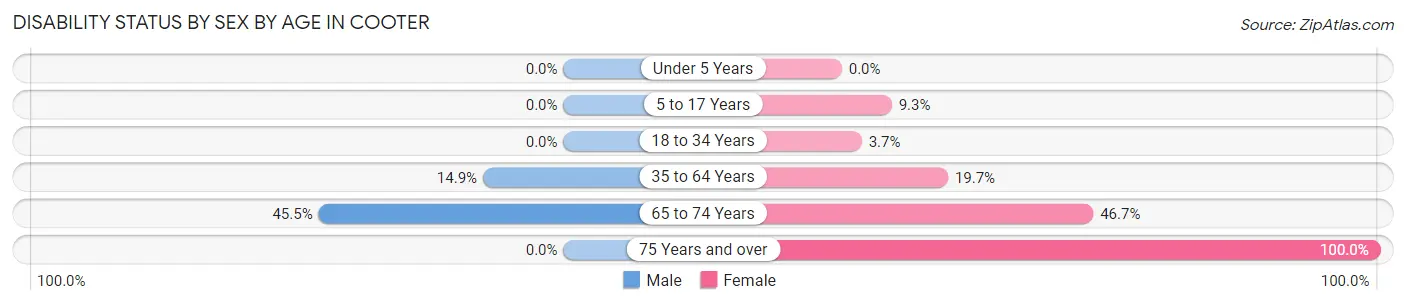
| Age Bracket | Male | Female |
| Under 5 Years | 0 (0.0%) | 0 (0.0%) |
| 5 to 17 Years | 0 (0.0%) | 5 (9.3%) |
| 18 to 34 Years | 0 (0.0%) | 1 (3.7%) |
| 35 to 64 Years | 10 (14.9%) | 13 (19.7%) |
| 65 to 74 Years | 5 (45.5%) | 7 (46.7%) |
| 75 Years and over | 0 (0.0%) | 12 (100.0%) |
Disability Class by Sex by Age in Cooter
Disability Class: Hearing Difficulty
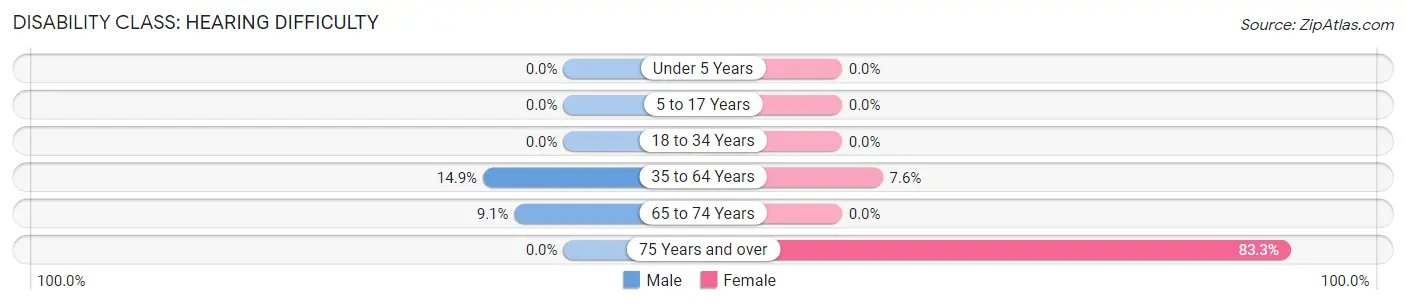
| Age Bracket | Male | Female |
| Under 5 Years | 0 (0.0%) | 0 (0.0%) |
| 5 to 17 Years | 0 (0.0%) | 0 (0.0%) |
| 18 to 34 Years | 0 (0.0%) | 0 (0.0%) |
| 35 to 64 Years | 10 (14.9%) | 5 (7.6%) |
| 65 to 74 Years | 1 (9.1%) | 0 (0.0%) |
| 75 Years and over | 0 (0.0%) | 10 (83.3%) |
Disability Class: Vision Difficulty
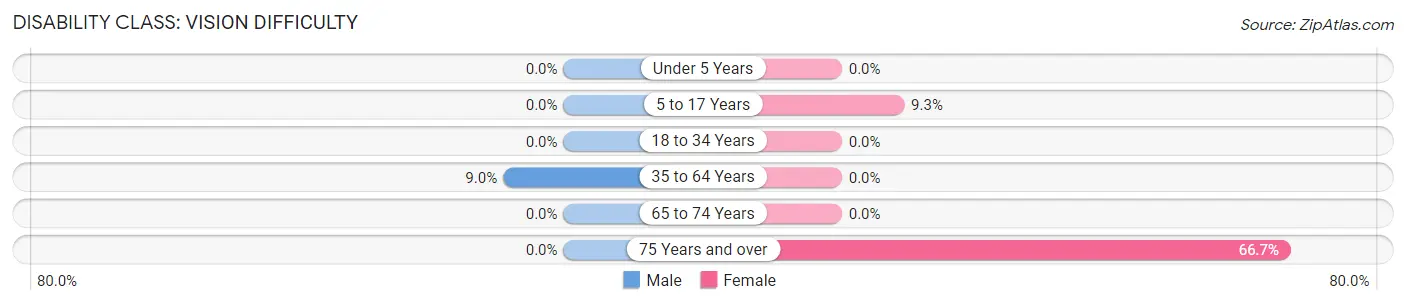
| Age Bracket | Male | Female |
| Under 5 Years | 0 (0.0%) | 0 (0.0%) |
| 5 to 17 Years | 0 (0.0%) | 5 (9.3%) |
| 18 to 34 Years | 0 (0.0%) | 0 (0.0%) |
| 35 to 64 Years | 6 (9.0%) | 0 (0.0%) |
| 65 to 74 Years | 0 (0.0%) | 0 (0.0%) |
| 75 Years and over | 0 (0.0%) | 8 (66.7%) |
Disability Class: Cognitive Difficulty
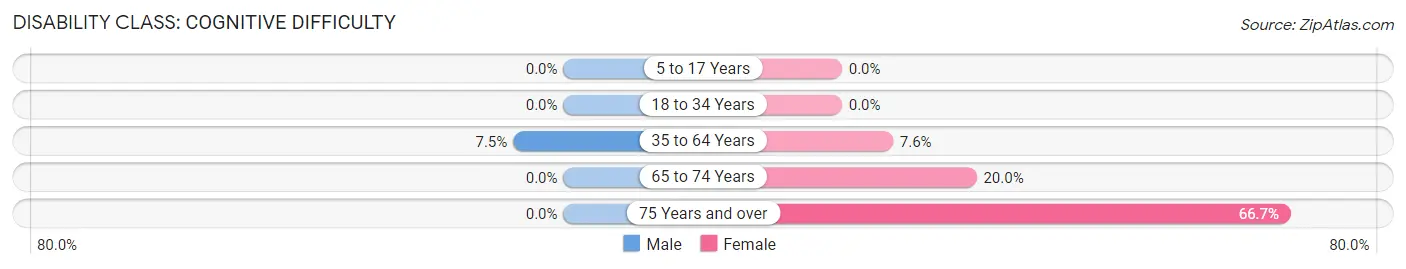
| Age Bracket | Male | Female |
| 5 to 17 Years | 0 (0.0%) | 0 (0.0%) |
| 18 to 34 Years | 0 (0.0%) | 0 (0.0%) |
| 35 to 64 Years | 5 (7.5%) | 5 (7.6%) |
| 65 to 74 Years | 0 (0.0%) | 3 (20.0%) |
| 75 Years and over | 0 (0.0%) | 8 (66.7%) |
Disability Class: Ambulatory Difficulty
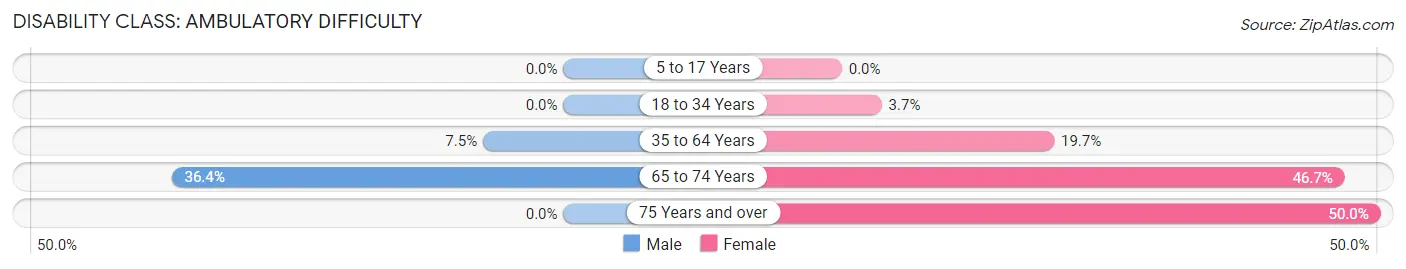
| Age Bracket | Male | Female |
| 5 to 17 Years | 0 (0.0%) | 0 (0.0%) |
| 18 to 34 Years | 0 (0.0%) | 1 (3.7%) |
| 35 to 64 Years | 5 (7.5%) | 13 (19.7%) |
| 65 to 74 Years | 4 (36.4%) | 7 (46.7%) |
| 75 Years and over | 0 (0.0%) | 6 (50.0%) |
Disability Class: Self-Care Difficulty
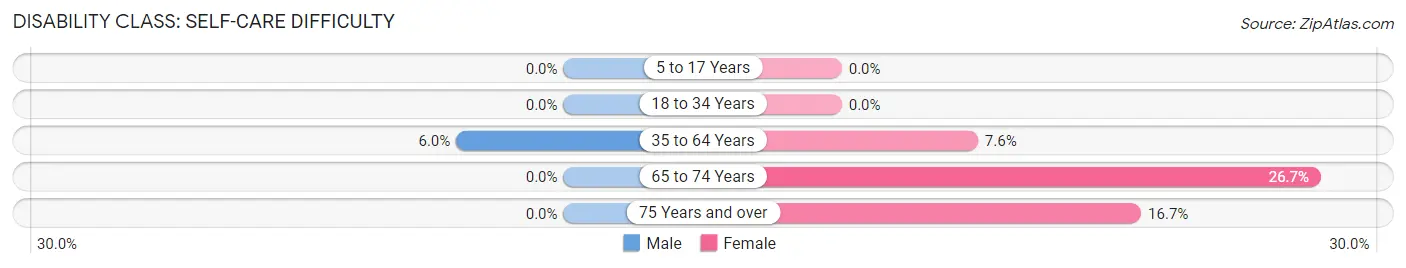
| Age Bracket | Male | Female |
| 5 to 17 Years | 0 (0.0%) | 0 (0.0%) |
| 18 to 34 Years | 0 (0.0%) | 0 (0.0%) |
| 35 to 64 Years | 4 (6.0%) | 5 (7.6%) |
| 65 to 74 Years | 0 (0.0%) | 4 (26.7%) |
| 75 Years and over | 0 (0.0%) | 2 (16.7%) |
Technology Access in Cooter
Computing Device Access in Cooter
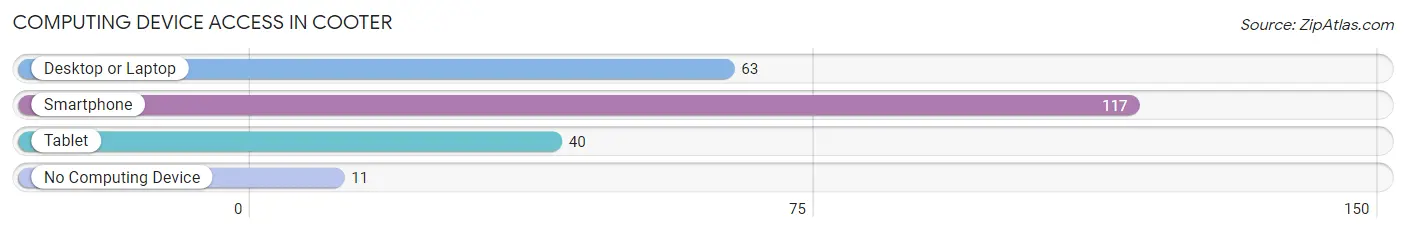
| Device Type | # Households | % Households |
| Desktop or Laptop | 63 | 46.7% |
| Smartphone | 117 | 86.7% |
| Tablet | 40 | 29.6% |
| No Computing Device | 11 | 8.2% |
| Total | 135 | 100.0% |
Internet Access in Cooter
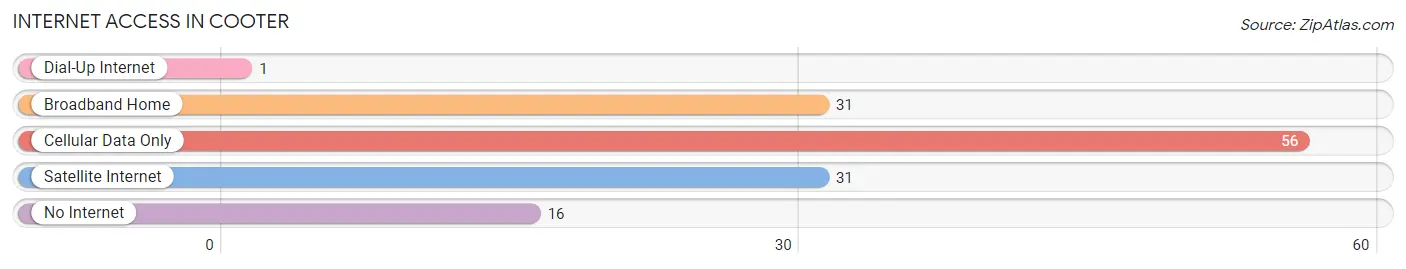
| Internet Type | # Households | % Households |
| Dial-Up Internet | 1 | 0.7% |
| Broadband Home | 31 | 23.0% |
| Cellular Data Only | 56 | 41.5% |
| Satellite Internet | 31 | 23.0% |
| No Internet | 16 | 11.8% |
| Total | 135 | 100.0% |
Cooter Summary
Cooter, Missouri is a small town located in Pemiscot County, in the southeastern corner of the state. It is situated on the banks of the St. Francis River, and is part of the Bootheel region of Missouri. The town was founded in 1883 and has a population of approximately 1,000 people.
History
Cooter was founded in 1883 by a group of settlers from Tennessee. The town was named after a local Native American chief, Chief Cooter. The town was originally a farming community, and the main crops grown were cotton, corn, and soybeans. The town was also known for its timber industry, and the local sawmill was a major employer in the area.
In the early 1900s, the town began to experience a period of growth and development. The railroad was extended to Cooter in 1906, and this allowed for the transportation of goods and services to and from the town. The town also experienced a population boom, as many people moved to the area to take advantage of the new economic opportunities.
In the 1950s, Cooter began to experience a decline in population and economic activity. The railroad was discontinued in the late 1950s, and the sawmill closed in the early 1960s. The town was also affected by the Great Depression, and many of the businesses in the area closed.
Geography
Cooter is located in the southeastern corner of Missouri, in Pemiscot County. The town is situated on the banks of the St. Francis River, and is part of the Bootheel region of the state. The town is located approximately 30 miles south of the city of Caruthersville, and is approximately 40 miles north of the city of Memphis, Tennessee.
The town is located in a rural area, and is surrounded by farmland and forests. The climate in the area is humid subtropical, with hot summers and mild winters. The average annual temperature is around 65 degrees Fahrenheit, and the average annual precipitation is around 45 inches.
Economy
The economy of Cooter is largely based on agriculture. The main crops grown in the area are cotton, corn, and soybeans. The town also has a small manufacturing sector, and there are several small businesses in the area.
The town is also home to a number of tourist attractions, including the Cooter Museum, which is dedicated to the history of the town. The museum features a variety of artifacts and exhibits related to the town’s history.
Demographics
As of the 2010 census, the population of Cooter was 1,000 people. The racial makeup of the town was 97.2% White, 0.7% African American, 0.2% Native American, 0.2% Asian, and 1.7% from other races. The median household income in the town was $30,000, and the median age was 40 years. The town has a poverty rate of 17.3%.
Common Questions
What is Per Capita Income in Cooter?
Per Capita income in Cooter is $37,794.
What is the Median Family Income in Cooter?
Median Family Income in Cooter is $52,188.
What is the Median Household income in Cooter?
Median Household Income in Cooter is $50,104.
What is Income or Wage Gap in Cooter?
Income or Wage Gap in Cooter is 31.9%.
Women in Cooter earn 68.1 cents for every dollar earned by a man.
What is Inequality or Gini Index in Cooter?
Inequality or Gini Index in Cooter is 0.66.
What is the Total Population of Cooter?
Total Population of Cooter is 343.
What is the Total Male Population of Cooter?
Total Male Population of Cooter is 156.
What is the Total Female Population of Cooter?
Total Female Population of Cooter is 187.
What is the Ratio of Males per 100 Females in Cooter?
There are 83.42 Males per 100 Females in Cooter.
What is the Ratio of Females per 100 Males in Cooter?
There are 119.87 Females per 100 Males in Cooter.
What is the Median Population Age in Cooter?
Median Population Age in Cooter is 34.8 Years.
What is the Average Family Size in Cooter
Average Family Size in Cooter is 3.1 People.
What is the Average Household Size in Cooter
Average Household Size in Cooter is 2.5 People.
How Large is the Labor Force in Cooter?
There are 134 People in the Labor Forcein in Cooter.
What is the Percentage of People in the Labor Force in Cooter?
55.6% of People are in the Labor Force in Cooter.
What is the Unemployment Rate in Cooter?
Unemployment Rate in Cooter is 6.0%.