Lawrence, MI Map & Demographics
Lawrence Map
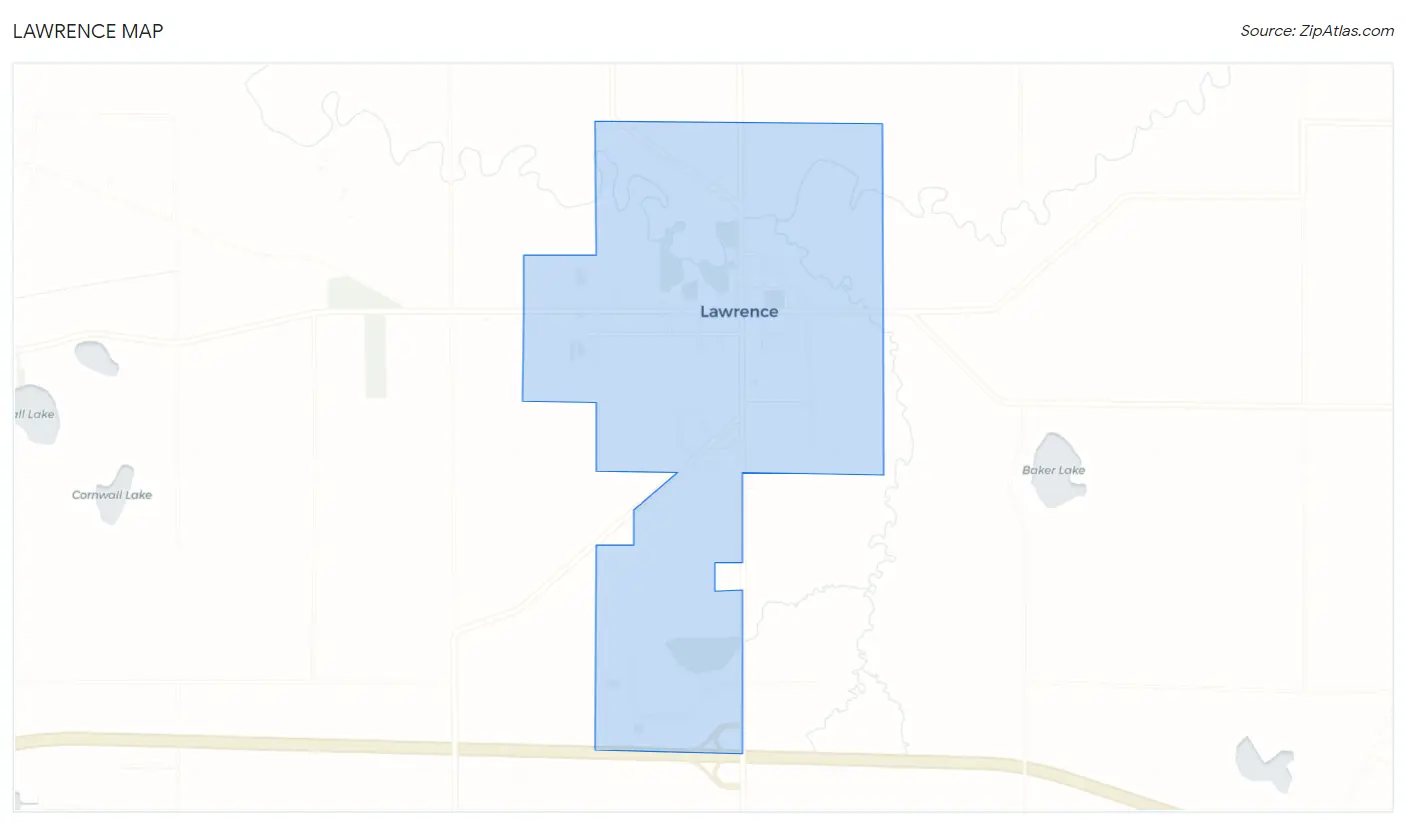
Lawrence Overview
$21,534
PER CAPITA INCOME
$68,295
AVG FAMILY INCOME
$41,250
AVG HOUSEHOLD INCOME
32.2%
WAGE / INCOME GAP [ % ]
67.8¢/ $1
WAGE / INCOME GAP [ $ ]
$14,109
FAMILY INCOME DEFICIT
0.47
INEQUALITY / GINI INDEX
1,007
TOTAL POPULATION
499
MALE POPULATION
508
FEMALE POPULATION
98.23
MALES / 100 FEMALES
101.80
FEMALES / 100 MALES
35.1
MEDIAN AGE
3.3
AVG FAMILY SIZE
2.8
AVG HOUSEHOLD SIZE
464
LABOR FORCE [ PEOPLE ]
61.7%
PERCENT IN LABOR FORCE
8.4%
UNEMPLOYMENT RATE
Lawrence Zip Codes
Lawrence Area Codes
Income in Lawrence
Income Overview in Lawrence
Per Capita Income in Lawrence is $21,534, while median incomes of families and households are $68,295 and $41,250 respectively.
| Characteristic | Number | Measure |
| Per Capita Income | 1,007 | $21,534 |
| Median Family Income | 236 | $68,295 |
| Mean Family Income | 236 | $64,375 |
| Median Household Income | 356 | $41,250 |
| Mean Household Income | 356 | $57,468 |
| Income Deficit | 236 | $14,109 |
| Wage / Income Gap (%) | 1,007 | 32.17% |
| Wage / Income Gap ($) | 1,007 | 67.83¢ per $1 |
| Gini / Inequality Index | 1,007 | 0.47 |
Earnings by Sex in Lawrence
Average Earnings in Lawrence are $29,400, $37,500 for men and $25,435 for women, a difference of 32.2%.
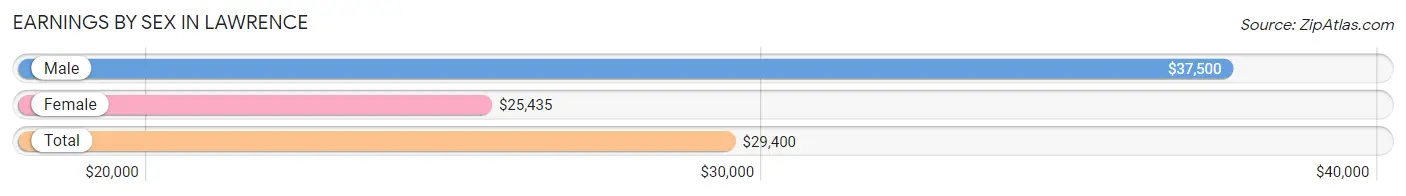
| Sex | Number | Average Earnings |
| Male | 248 (52.8%) | $37,500 |
| Female | 222 (47.2%) | $25,435 |
| Total | 470 (100.0%) | $29,400 |
Earnings by Sex by Income Bracket in Lawrence
The most common earnings brackets in Lawrence are $25,000 to $29,999 for men (30 | 12.1%) and $25,000 to $29,999 for women (36 | 16.2%).
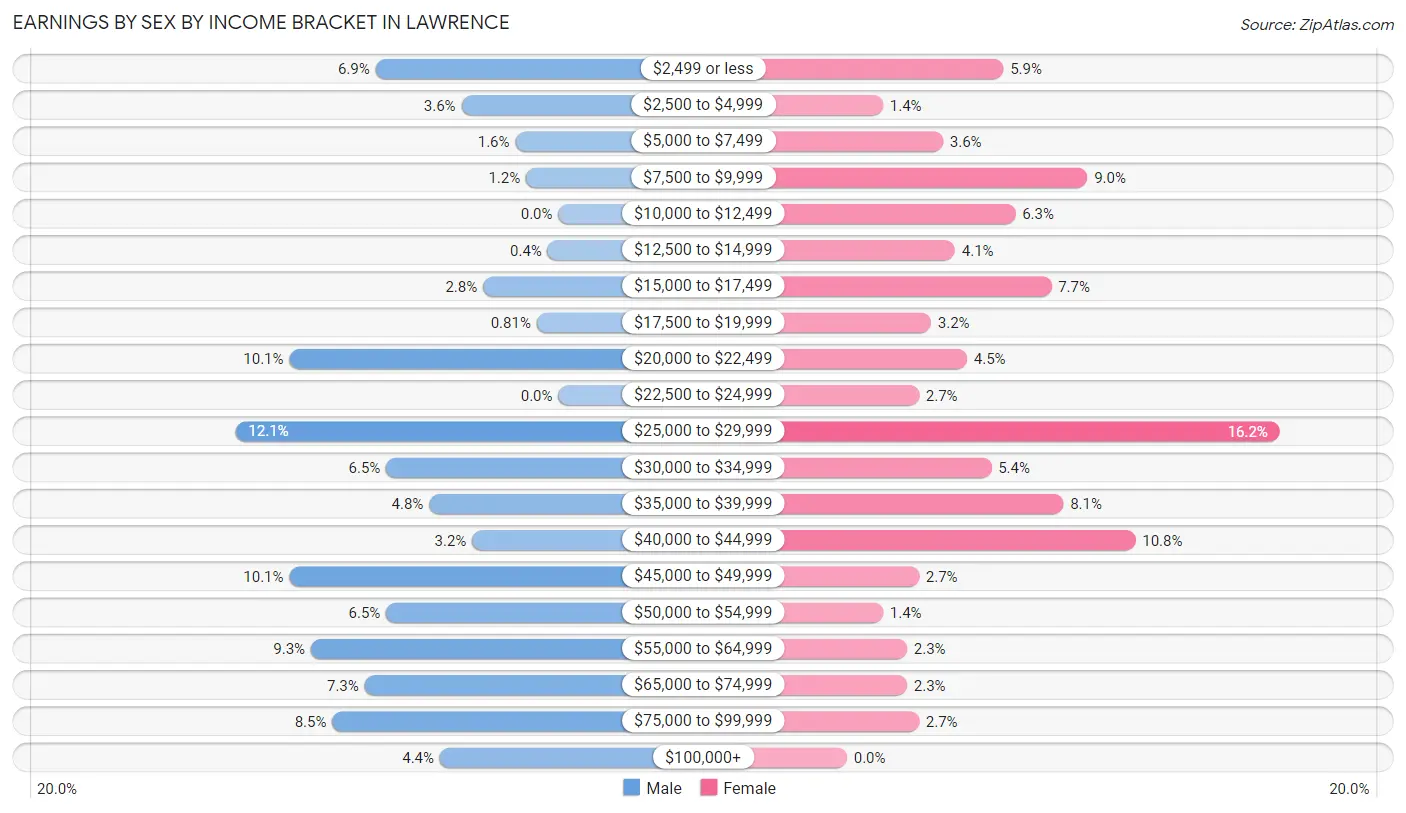
| Income | Male | Female |
| $2,499 or less | 17 (6.9%) | 13 (5.9%) |
| $2,500 to $4,999 | 9 (3.6%) | 3 (1.3%) |
| $5,000 to $7,499 | 4 (1.6%) | 8 (3.6%) |
| $7,500 to $9,999 | 3 (1.2%) | 20 (9.0%) |
| $10,000 to $12,499 | 0 (0.0%) | 14 (6.3%) |
| $12,500 to $14,999 | 1 (0.4%) | 9 (4.1%) |
| $15,000 to $17,499 | 7 (2.8%) | 17 (7.7%) |
| $17,500 to $19,999 | 2 (0.8%) | 7 (3.2%) |
| $20,000 to $22,499 | 25 (10.1%) | 10 (4.5%) |
| $22,500 to $24,999 | 0 (0.0%) | 6 (2.7%) |
| $25,000 to $29,999 | 30 (12.1%) | 36 (16.2%) |
| $30,000 to $34,999 | 16 (6.5%) | 12 (5.4%) |
| $35,000 to $39,999 | 12 (4.8%) | 18 (8.1%) |
| $40,000 to $44,999 | 8 (3.2%) | 24 (10.8%) |
| $45,000 to $49,999 | 25 (10.1%) | 6 (2.7%) |
| $50,000 to $54,999 | 16 (6.5%) | 3 (1.3%) |
| $55,000 to $64,999 | 23 (9.3%) | 5 (2.2%) |
| $65,000 to $74,999 | 18 (7.3%) | 5 (2.2%) |
| $75,000 to $99,999 | 21 (8.5%) | 6 (2.7%) |
| $100,000+ | 11 (4.4%) | 0 (0.0%) |
| Total | 248 (100.0%) | 222 (100.0%) |
Earnings by Sex by Educational Attainment in Lawrence
Average earnings in Lawrence are $46,458 for men and $27,404 for women, a difference of 41.0%. Men with an educational attainment of bachelor's degree enjoy the highest average annual earnings of $62,083, while those with less than high school education earn the least with $26,136. Women with an educational attainment of college or associate's degree earn the most with the average annual earnings of $30,625, while those with high school diploma education have the smallest earnings of $16,458.
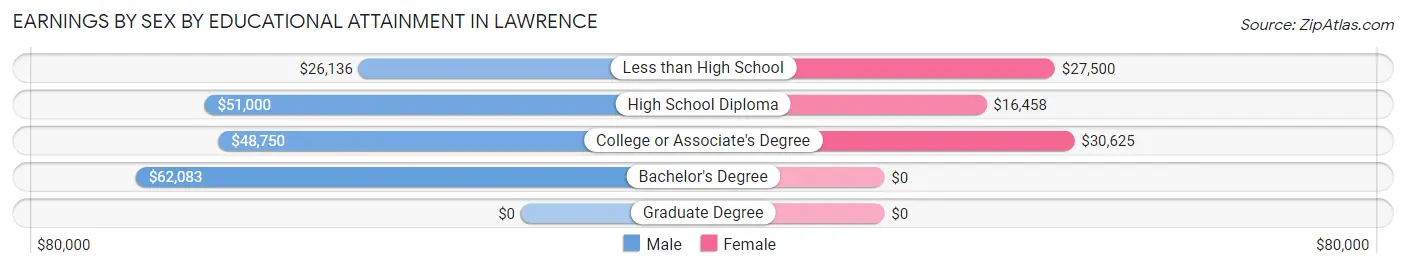
| Educational Attainment | Male Income | Female Income |
| Less than High School | $26,136 | $27,500 |
| High School Diploma | $51,000 | $16,458 |
| College or Associate's Degree | $48,750 | $30,625 |
| Bachelor's Degree | $62,083 | $0 |
| Graduate Degree | - | - |
| Total | $46,458 | $27,404 |
Family Income in Lawrence
Family Income Brackets in Lawrence
According to the Lawrence family income data, there are 47 families falling into the $75,000 to $99,999 income range, which is the most common income bracket and makes up 19.9% of all families. Conversely, the $200,000+ income bracket is the least frequent group with only 4 families (1.7%) belonging to this category.
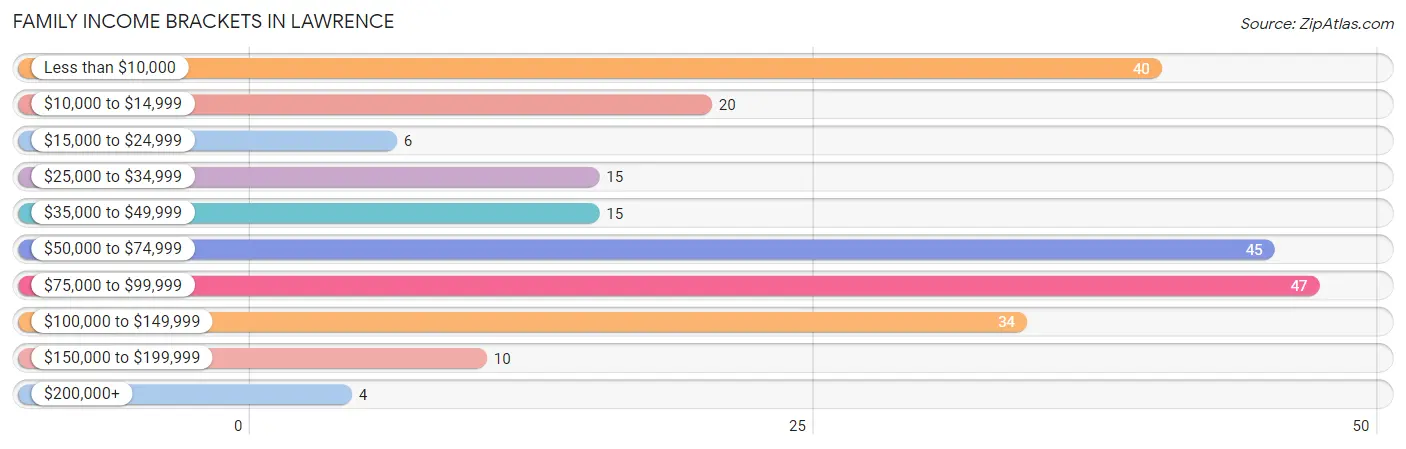
| Income Bracket | # Families | % Families |
| Less than $10,000 | 40 | 16.9% |
| $10,000 to $14,999 | 20 | 8.5% |
| $15,000 to $24,999 | 6 | 2.5% |
| $25,000 to $34,999 | 15 | 6.4% |
| $35,000 to $49,999 | 15 | 6.4% |
| $50,000 to $74,999 | 45 | 19.1% |
| $75,000 to $99,999 | 47 | 19.9% |
| $100,000 to $149,999 | 34 | 14.4% |
| $150,000 to $199,999 | 10 | 4.2% |
| $200,000+ | 4 | 1.7% |
Family Income by Famaliy Size in Lawrence
6-person families (14 | 5.9%) account for the highest median family income in Lawrence with $96,429 per family, while 2-person families (104 | 44.1%) have the highest median income of $31,500 per family member.
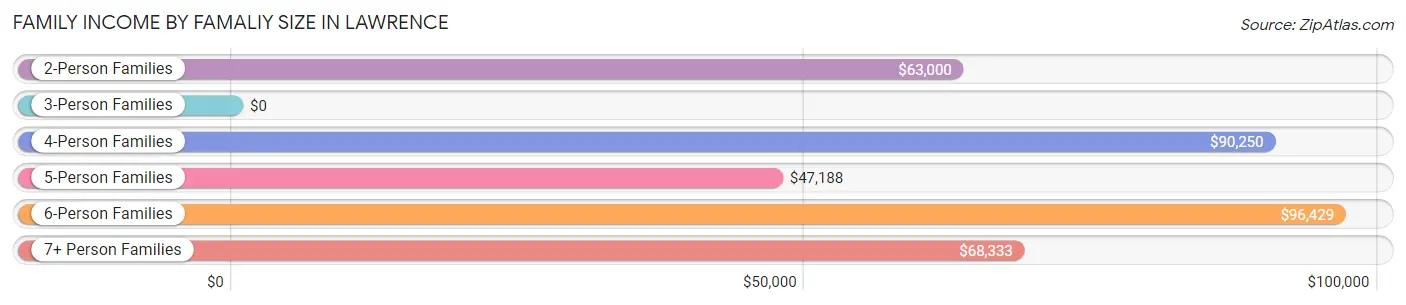
| Income Bracket | # Families | Median Income |
| 2-Person Families | 104 (44.1%) | $63,000 |
| 3-Person Families | 65 (27.5%) | $0 |
| 4-Person Families | 36 (15.2%) | $90,250 |
| 5-Person Families | 11 (4.7%) | $47,188 |
| 6-Person Families | 14 (5.9%) | $96,429 |
| 7+ Person Families | 6 (2.5%) | $68,333 |
| Total | 236 (100.0%) | $68,295 |
Family Income by Number of Earners in Lawrence

| Number of Earners | # Families | Median Income |
| No Earners | 56 (23.7%) | $0 |
| 1 Earner | 69 (29.2%) | $41,563 |
| 2 Earners | 90 (38.1%) | $89,167 |
| 3+ Earners | 21 (8.9%) | $99,375 |
| Total | 236 (100.0%) | $68,295 |
Household Income in Lawrence
Household Income Brackets in Lawrence
With 60 households falling in the category, the $50,000 to $74,999 income range is the most frequent in Lawrence, accounting for 16.9% of all households. In contrast, only 7 households (2.0%) fall into the $150,000 to $199,999 income bracket, making it the least populous group.
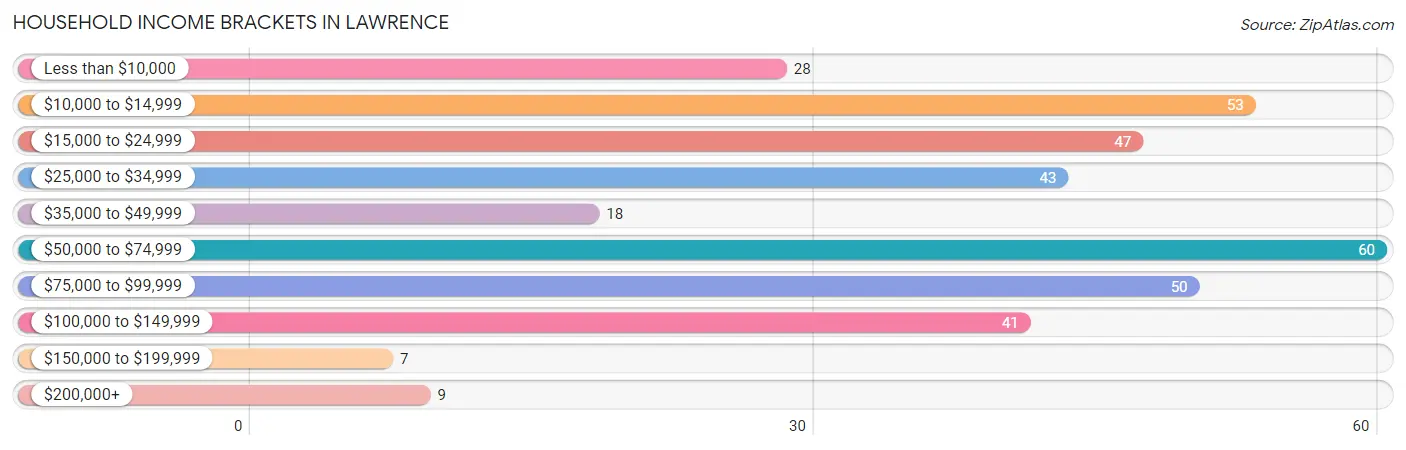
| Income Bracket | # Households | % Households |
| Less than $10,000 | 28 | 7.9% |
| $10,000 to $14,999 | 53 | 14.9% |
| $15,000 to $24,999 | 47 | 13.2% |
| $25,000 to $34,999 | 43 | 12.1% |
| $35,000 to $49,999 | 18 | 5.1% |
| $50,000 to $74,999 | 60 | 16.9% |
| $75,000 to $99,999 | 50 | 14.0% |
| $100,000 to $149,999 | 41 | 11.5% |
| $150,000 to $199,999 | 7 | 2.0% |
| $200,000+ | 9 | 2.5% |
Household Income by Householder Age in Lawrence
The median household income in Lawrence is $41,250, with the highest median household income of $62,750 found in the 25 to 44 years age bracket for the primary householder. A total of 79 households (22.2%) fall into this category. Meanwhile, the 15 to 24 years age bracket for the primary householder has the lowest median household income of $0, with 19 households (5.3%) in this group.
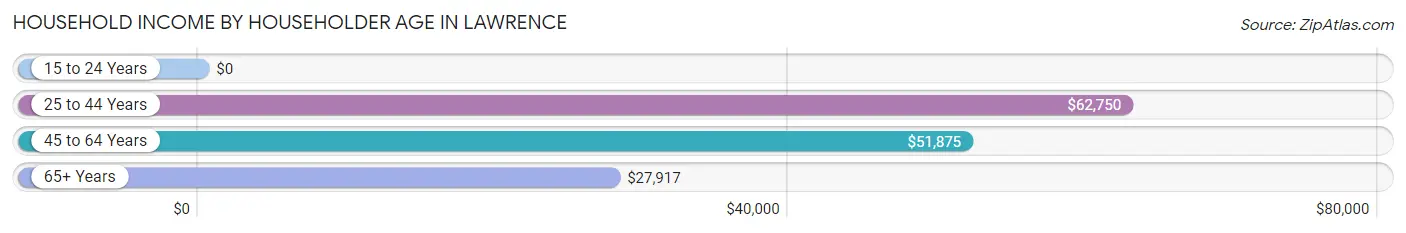
| Income Bracket | # Households | Median Income |
| 15 to 24 Years | 19 (5.3%) | $0 |
| 25 to 44 Years | 79 (22.2%) | $62,750 |
| 45 to 64 Years | 175 (49.2%) | $51,875 |
| 65+ Years | 83 (23.3%) | $27,917 |
| Total | 356 (100.0%) | $41,250 |
Poverty in Lawrence
Income Below Poverty by Sex and Age in Lawrence
With 23.3% poverty level for males and 29.5% for females among the residents of Lawrence, 5 year old males and 16 and 17 year old females are the most vulnerable to poverty, with 2 males (100.0%) and 4 females (66.7%) in their respective age groups living below the poverty level.
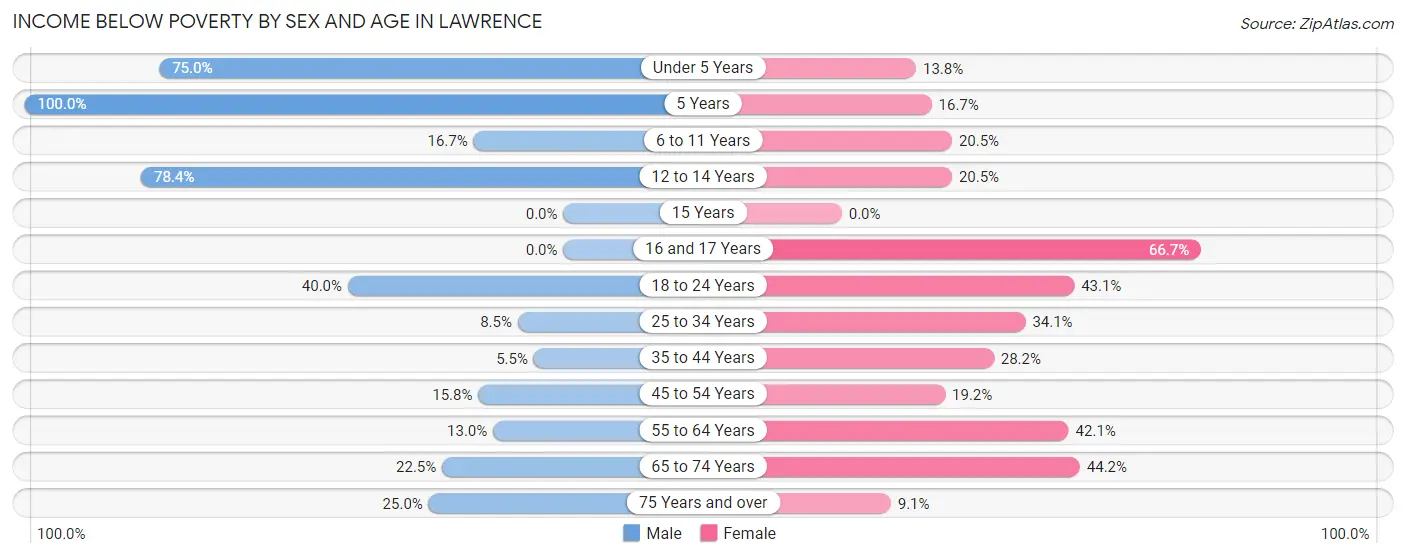
| Age Bracket | Male | Female |
| Under 5 Years | 15 (75.0%) | 4 (13.8%) |
| 5 Years | 2 (100.0%) | 1 (16.7%) |
| 6 to 11 Years | 9 (16.7%) | 9 (20.4%) |
| 12 to 14 Years | 29 (78.4%) | 9 (20.4%) |
| 15 Years | 0 (0.0%) | 0 (0.0%) |
| 16 and 17 Years | 0 (0.0%) | 4 (66.7%) |
| 18 to 24 Years | 24 (40.0%) | 22 (43.1%) |
| 25 to 34 Years | 6 (8.5%) | 15 (34.1%) |
| 35 to 44 Years | 4 (5.5%) | 11 (28.2%) |
| 45 to 54 Years | 6 (15.8%) | 14 (19.2%) |
| 55 to 64 Years | 9 (13.0%) | 40 (42.1%) |
| 65 to 74 Years | 9 (22.5%) | 19 (44.2%) |
| 75 Years and over | 3 (25.0%) | 2 (9.1%) |
| Total | 116 (23.3%) | 150 (29.5%) |
Income Above Poverty by Sex and Age in Lawrence
According to the poverty statistics in Lawrence, males aged 15 years and females aged 15 years are the age groups that are most secure financially, with 100.0% of males and 100.0% of females in these age groups living above the poverty line.
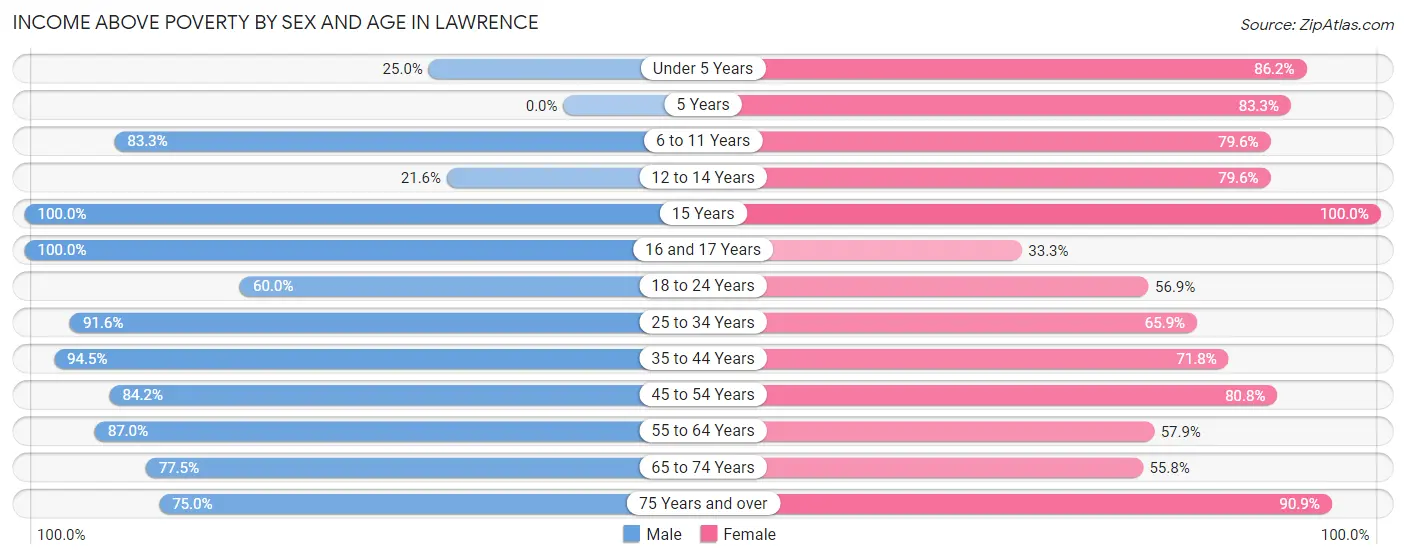
| Age Bracket | Male | Female |
| Under 5 Years | 5 (25.0%) | 25 (86.2%) |
| 5 Years | 0 (0.0%) | 5 (83.3%) |
| 6 to 11 Years | 45 (83.3%) | 35 (79.5%) |
| 12 to 14 Years | 8 (21.6%) | 35 (79.5%) |
| 15 Years | 7 (100.0%) | 12 (100.0%) |
| 16 and 17 Years | 16 (100.0%) | 2 (33.3%) |
| 18 to 24 Years | 36 (60.0%) | 29 (56.9%) |
| 25 to 34 Years | 65 (91.5%) | 29 (65.9%) |
| 35 to 44 Years | 69 (94.5%) | 28 (71.8%) |
| 45 to 54 Years | 32 (84.2%) | 59 (80.8%) |
| 55 to 64 Years | 60 (87.0%) | 55 (57.9%) |
| 65 to 74 Years | 31 (77.5%) | 24 (55.8%) |
| 75 Years and over | 9 (75.0%) | 20 (90.9%) |
| Total | 383 (76.7%) | 358 (70.5%) |
Income Below Poverty Among Married-Couple Families in Lawrence
The poverty statistics for married-couple families in Lawrence show that 6.8% or 9 of the total 133 families live below the poverty line. Families with 5 or more children have the highest poverty rate of 66.7%, comprising of 2 families. On the other hand, families with 3 or 4 children have the lowest poverty rate of 0.0%, which includes 0 families.
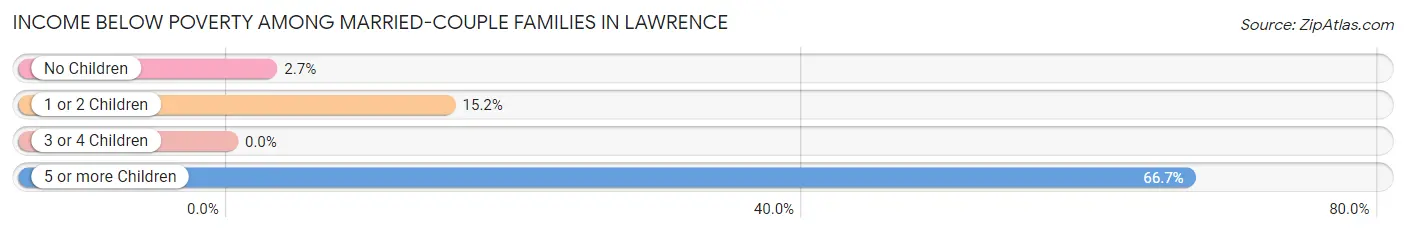
| Children | Above Poverty | Below Poverty |
| No Children | 71 (97.3%) | 2 (2.7%) |
| 1 or 2 Children | 28 (84.9%) | 5 (15.1%) |
| 3 or 4 Children | 24 (100.0%) | 0 (0.0%) |
| 5 or more Children | 1 (33.3%) | 2 (66.7%) |
| Total | 124 (93.2%) | 9 (6.8%) |
Income Below Poverty Among Single-Parent Households in Lawrence
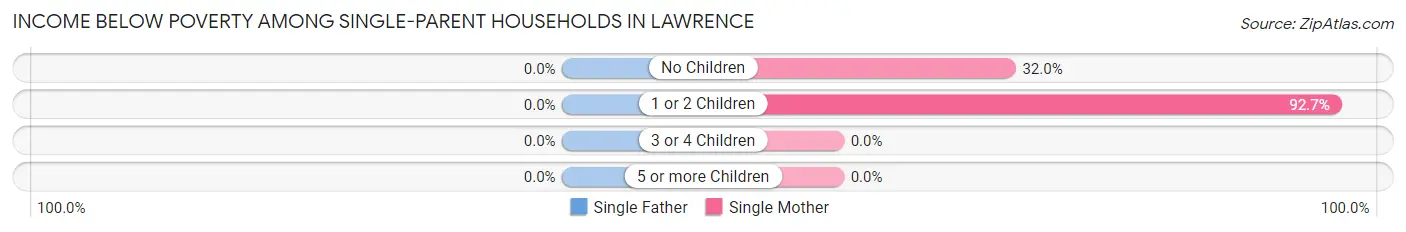
| Children | Single Father | Single Mother |
| No Children | 0 (0.0%) | 8 (32.0%) |
| 1 or 2 Children | 0 (0.0%) | 51 (92.7%) |
| 3 or 4 Children | 0 (0.0%) | 0 (0.0%) |
| 5 or more Children | 0 (0.0%) | 0 (0.0%) |
| Total | 0 (0.0%) | 59 (73.8%) |
Income Below Poverty Among Married-Couple vs Single-Parent Households in Lawrence
The poverty data for Lawrence shows that 9 of the married-couple family households (6.8%) and 59 of the single-parent households (57.3%) are living below the poverty level. Within the married-couple family households, those with 5 or more children have the highest poverty rate, with 2 households (66.7%) falling below the poverty line. Among the single-parent households, those with 1 or 2 children have the highest poverty rate, with 51 household (75.0%) living below poverty.
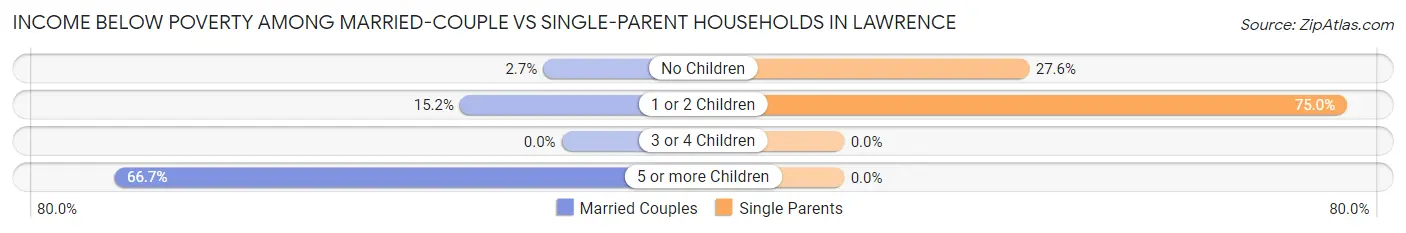
| Children | Married-Couple Families | Single-Parent Households |
| No Children | 2 (2.7%) | 8 (27.6%) |
| 1 or 2 Children | 5 (15.1%) | 51 (75.0%) |
| 3 or 4 Children | 0 (0.0%) | 0 (0.0%) |
| 5 or more Children | 2 (66.7%) | 0 (0.0%) |
| Total | 9 (6.8%) | 59 (57.3%) |
Race in Lawrence
The most populous races in Lawrence are White / Caucasian (711 | 70.6%), Hispanic or Latino (363 | 36.0%), and Some other Race (207 | 20.6%).
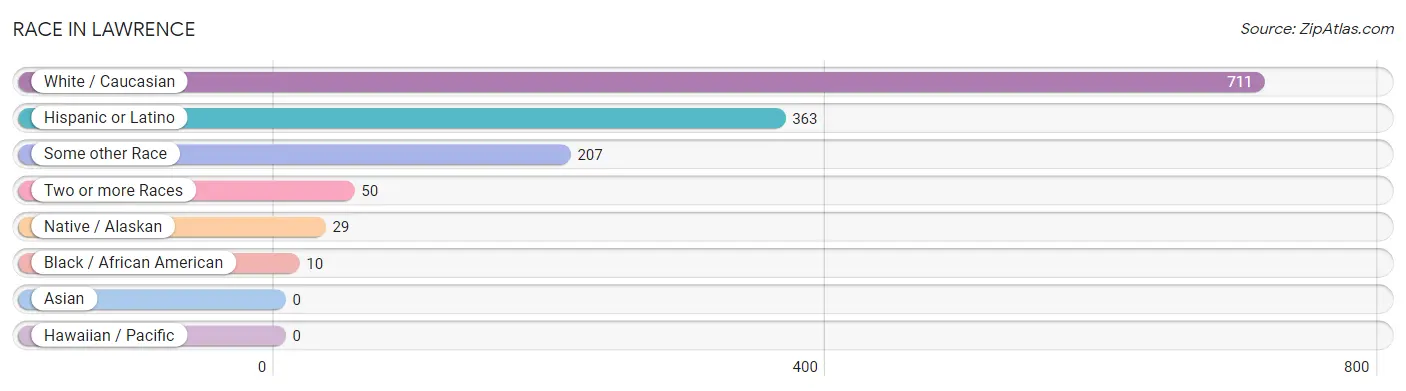
| Race | # Population | % Population |
| Asian | 0 | 0.0% |
| Black / African American | 10 | 1.0% |
| Hawaiian / Pacific | 0 | 0.0% |
| Hispanic or Latino | 363 | 36.0% |
| Native / Alaskan | 29 | 2.9% |
| White / Caucasian | 711 | 70.6% |
| Two or more Races | 50 | 5.0% |
| Some other Race | 207 | 20.6% |
| Total | 1,007 | 100.0% |
Ancestry in Lawrence
The most populous ancestries reported in Lawrence are Mexican (271 | 26.9%), German (140 | 13.9%), Irish (87 | 8.6%), English (82 | 8.1%), and Central American (74 | 7.3%), together accounting for 64.9% of all Lawrence residents.
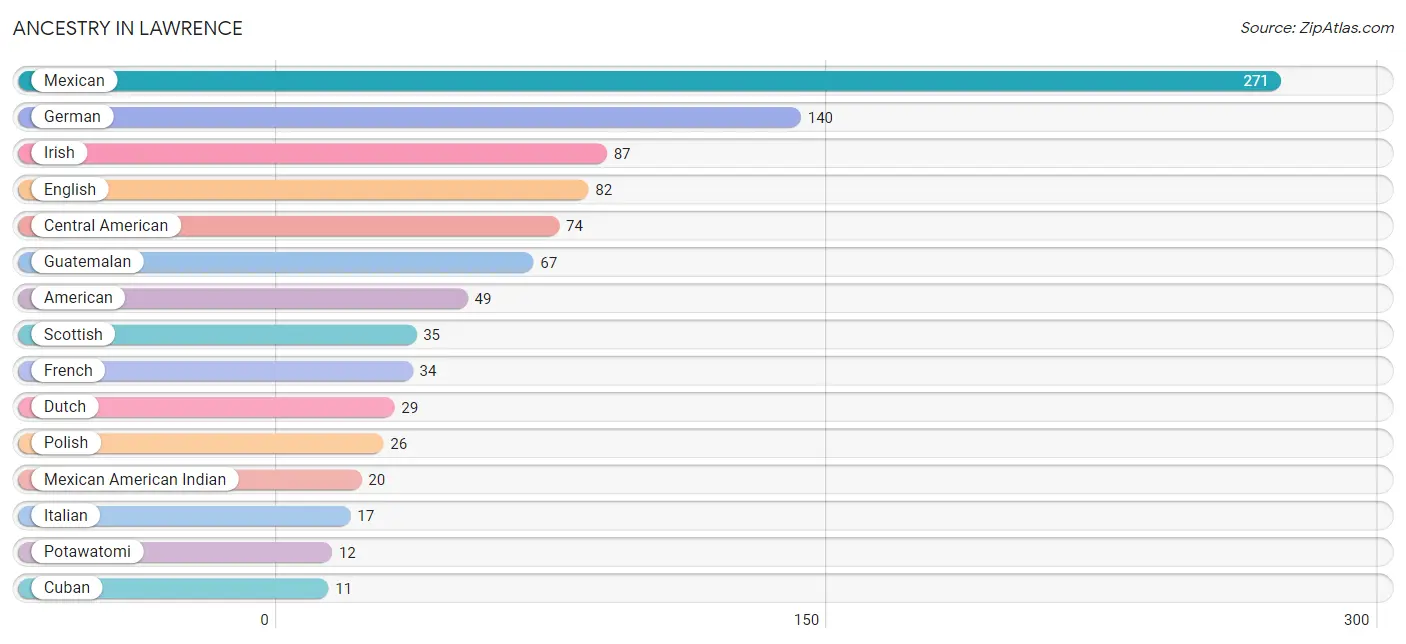
| Ancestry | # Population | % Population |
| African | 6 | 0.6% |
| American | 49 | 4.9% |
| Belgian | 5 | 0.5% |
| British | 5 | 0.5% |
| Central American | 74 | 7.3% |
| Croatian | 8 | 0.8% |
| Cuban | 11 | 1.1% |
| Czech | 10 | 1.0% |
| Danish | 5 | 0.5% |
| Dutch | 29 | 2.9% |
| Eastern European | 3 | 0.3% |
| English | 82 | 8.1% |
| French | 34 | 3.4% |
| French Canadian | 5 | 0.5% |
| German | 140 | 13.9% |
| Guatemalan | 67 | 6.7% |
| Irish | 87 | 8.6% |
| Italian | 17 | 1.7% |
| Mexican | 271 | 26.9% |
| Mexican American Indian | 20 | 2.0% |
| Norwegian | 10 | 1.0% |
| Panamanian | 7 | 0.7% |
| Polish | 26 | 2.6% |
| Potawatomi | 12 | 1.2% |
| Scotch-Irish | 5 | 0.5% |
| Scottish | 35 | 3.5% |
| Subsaharan African | 6 | 0.6% |
| Swedish | 4 | 0.4% |
| Swiss | 2 | 0.2% |
| Ukrainian | 2 | 0.2% |
| Welsh | 3 | 0.3% | View All 31 Rows |
Immigrants in Lawrence
The most numerous immigrant groups reported in Lawrence came from Latin America (93 | 9.2%), Central America (92 | 9.1%), Guatemala (50 | 5.0%), Mexico (42 | 4.2%), and Canada (16 | 1.6%), together accounting for 29.1% of all Lawrence residents.
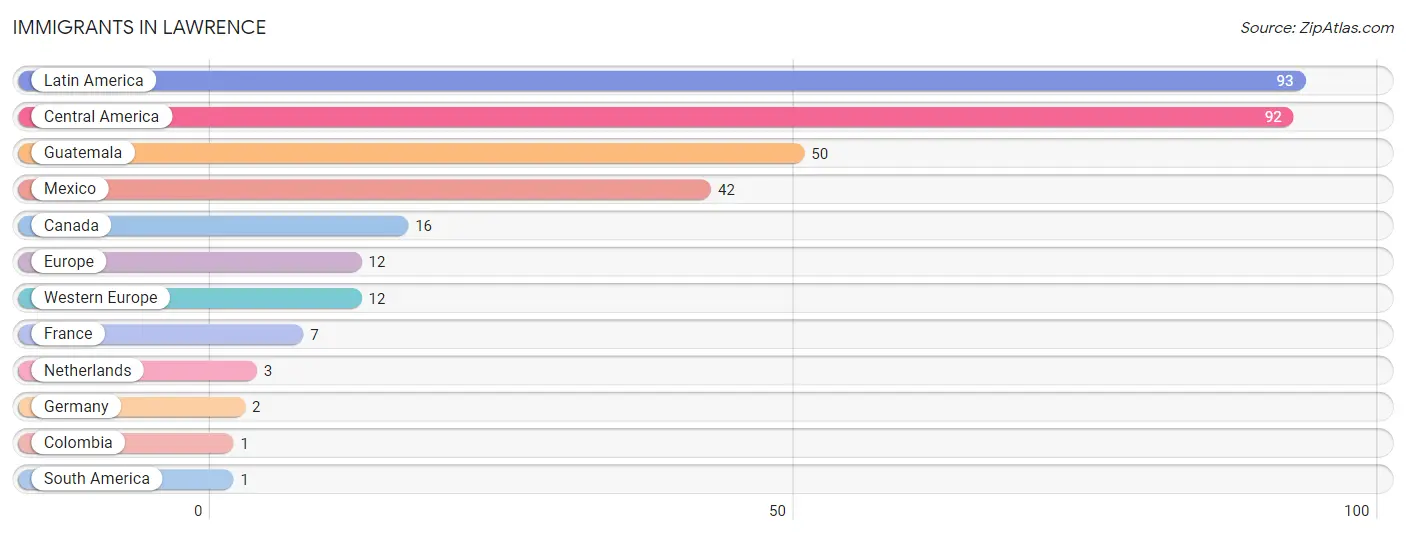
| Immigration Origin | # Population | % Population |
| Canada | 16 | 1.6% |
| Central America | 92 | 9.1% |
| Colombia | 1 | 0.1% |
| Europe | 12 | 1.2% |
| France | 7 | 0.7% |
| Germany | 2 | 0.2% |
| Guatemala | 50 | 5.0% |
| Latin America | 93 | 9.2% |
| Mexico | 42 | 4.2% |
| Netherlands | 3 | 0.3% |
| South America | 1 | 0.1% |
| Western Europe | 12 | 1.2% | View All 12 Rows |
Sex and Age in Lawrence
Sex and Age in Lawrence
The most populous age groups in Lawrence are 10 to 14 Years (63 | 12.6%) for men and 10 to 14 Years (64 | 12.6%) for women.
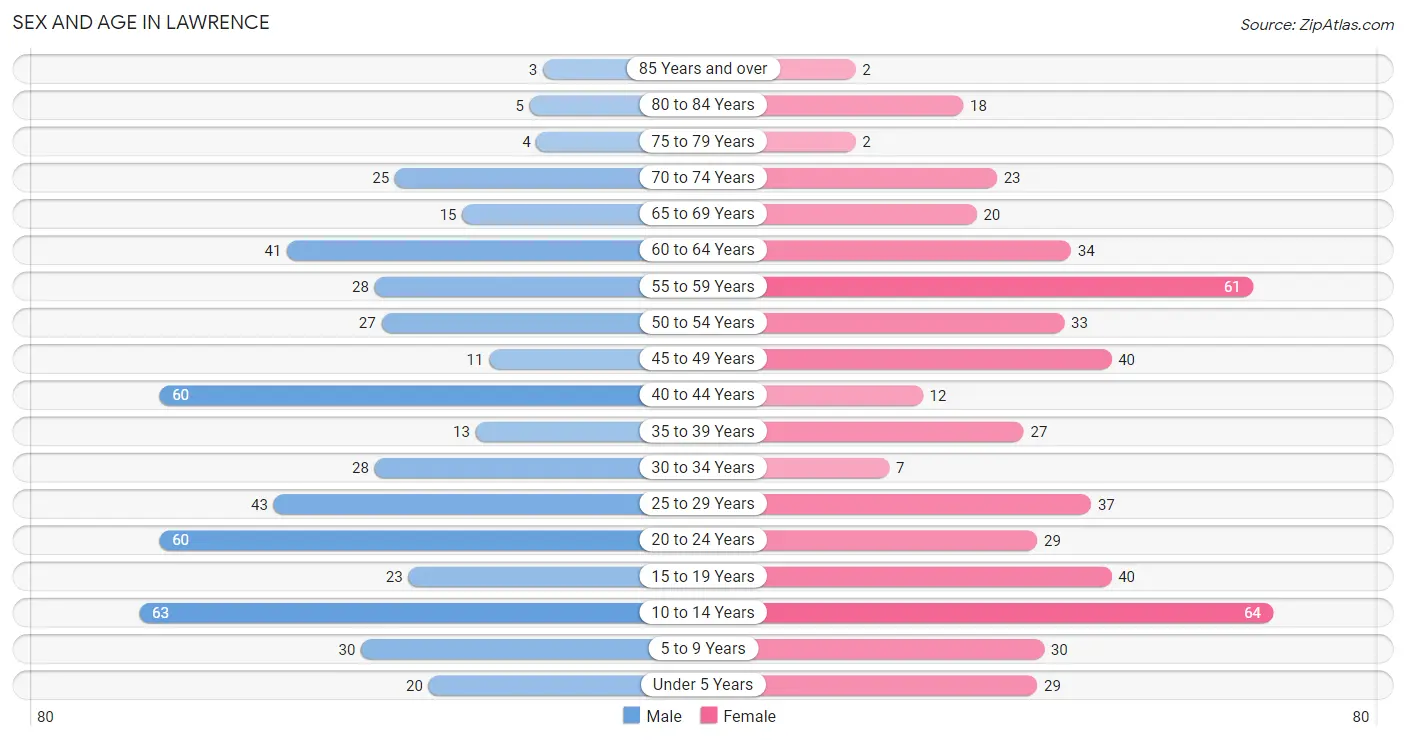
| Age Bracket | Male | Female |
| Under 5 Years | 20 (4.0%) | 29 (5.7%) |
| 5 to 9 Years | 30 (6.0%) | 30 (5.9%) |
| 10 to 14 Years | 63 (12.6%) | 64 (12.6%) |
| 15 to 19 Years | 23 (4.6%) | 40 (7.9%) |
| 20 to 24 Years | 60 (12.0%) | 29 (5.7%) |
| 25 to 29 Years | 43 (8.6%) | 37 (7.3%) |
| 30 to 34 Years | 28 (5.6%) | 7 (1.4%) |
| 35 to 39 Years | 13 (2.6%) | 27 (5.3%) |
| 40 to 44 Years | 60 (12.0%) | 12 (2.4%) |
| 45 to 49 Years | 11 (2.2%) | 40 (7.9%) |
| 50 to 54 Years | 27 (5.4%) | 33 (6.5%) |
| 55 to 59 Years | 28 (5.6%) | 61 (12.0%) |
| 60 to 64 Years | 41 (8.2%) | 34 (6.7%) |
| 65 to 69 Years | 15 (3.0%) | 20 (3.9%) |
| 70 to 74 Years | 25 (5.0%) | 23 (4.5%) |
| 75 to 79 Years | 4 (0.8%) | 2 (0.4%) |
| 80 to 84 Years | 5 (1.0%) | 18 (3.5%) |
| 85 Years and over | 3 (0.6%) | 2 (0.4%) |
| Total | 499 (100.0%) | 508 (100.0%) |
Families and Households in Lawrence
Median Family Size in Lawrence
The median family size in Lawrence is 3.33 persons per family, with married-couple families (133 | 56.4%) accounting for the largest median family size of 3.71 persons per family. On the other hand, single female/mother families (80 | 33.9%) represent the smallest median family size with 2.78 persons per family.
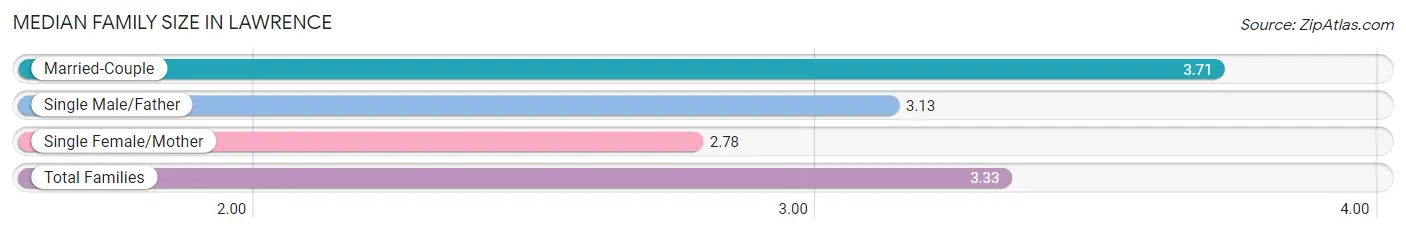
| Family Type | # Families | Family Size |
| Married-Couple | 133 (56.4%) | 3.71 |
| Single Male/Father | 23 (9.8%) | 3.13 |
| Single Female/Mother | 80 (33.9%) | 2.78 |
| Total Families | 236 (100.0%) | 3.33 |
Median Household Size in Lawrence
The median household size in Lawrence is 2.80 persons per household, with married-couple households (133 | 37.4%) accounting for the largest median household size of 3.74 persons per household. non-family households (120 | 33.7%) represent the smallest median household size with 1.22 persons per household.
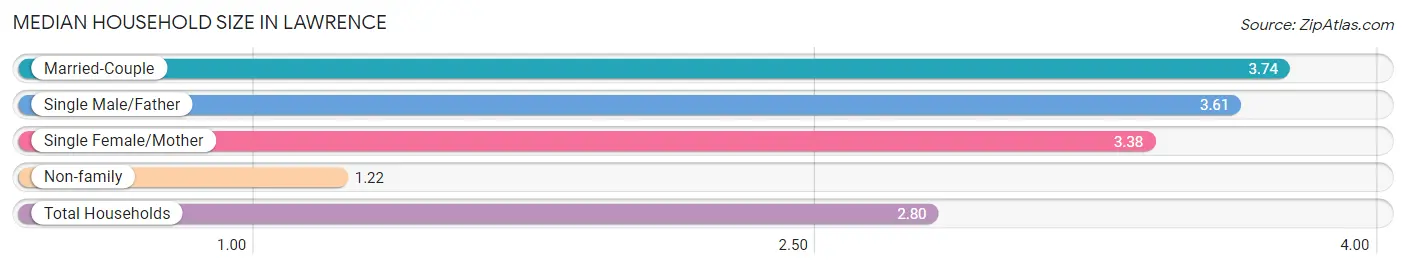
| Household Type | # Households | Household Size |
| Married-Couple | 133 (37.4%) | 3.74 |
| Single Male/Father | 23 (6.5%) | 3.61 |
| Single Female/Mother | 80 (22.5%) | 3.38 |
| Non-family | 120 (33.7%) | 1.22 |
| Total Households | 356 (100.0%) | 2.80 |
Household Size by Marriage Status in Lawrence
Out of a total of 356 households in Lawrence, 236 (66.3%) are family households, while 120 (33.7%) are nonfamily households. The most numerous type of family households are 3-person households, comprising 78, and the most common type of nonfamily households are 1-person households, comprising 98.
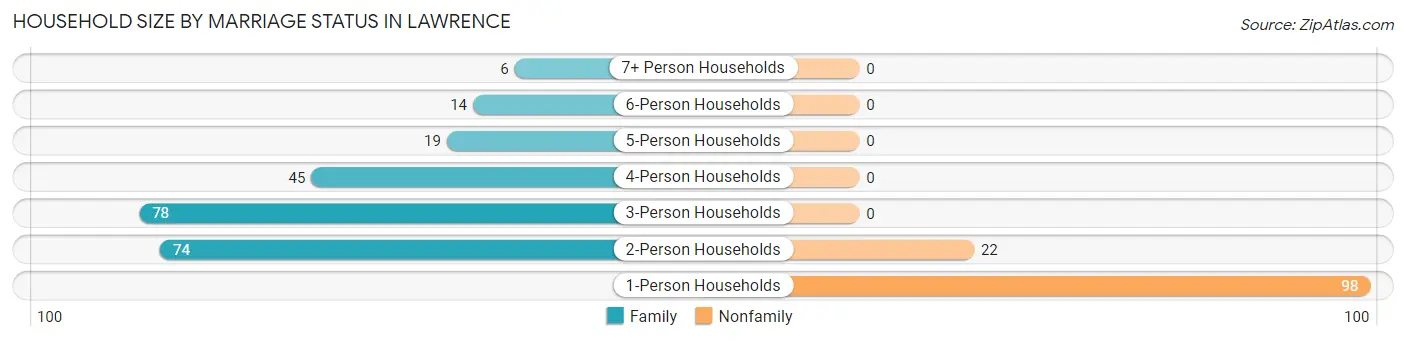
| Household Size | Family Households | Nonfamily Households |
| 1-Person Households | - | 98 (27.5%) |
| 2-Person Households | 74 (20.8%) | 22 (6.2%) |
| 3-Person Households | 78 (21.9%) | 0 (0.0%) |
| 4-Person Households | 45 (12.6%) | 0 (0.0%) |
| 5-Person Households | 19 (5.3%) | 0 (0.0%) |
| 6-Person Households | 14 (3.9%) | 0 (0.0%) |
| 7+ Person Households | 6 (1.7%) | 0 (0.0%) |
| Total | 236 (66.3%) | 120 (33.7%) |
Female Fertility in Lawrence
Fertility by Age in Lawrence
Average fertility rate in Lawrence is 40.0 births per 1,000 women. Women in the age bracket of 20 to 34 years have the highest fertility rate with 110.0 births per 1,000 women. Women in the age bracket of 20 to 34 years acount for 100.0% of all women with births.
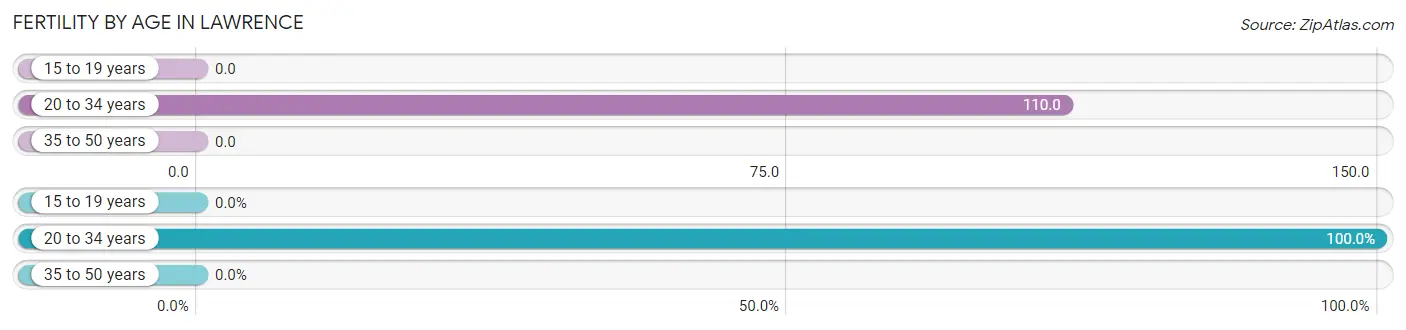
| Age Bracket | Women with Births | Births / 1,000 Women |
| 15 to 19 years | 0 (0.0%) | 0.0 |
| 20 to 34 years | 8 (100.0%) | 110.0 |
| 35 to 50 years | 0 (0.0%) | 0.0 |
| Total | 8 (100.0%) | 40.0 |
Fertility by Age by Marriage Status in Lawrence
25.0% of women with births (8) in Lawrence are married. The highest percentage of unmarried women with births falls into 20 to 34 years age bracket with 75.0% of them unmarried at the time of birth, while the lowest percentage of unmarried women with births belong to 20 to 34 years age bracket with 75.0% of them unmarried.
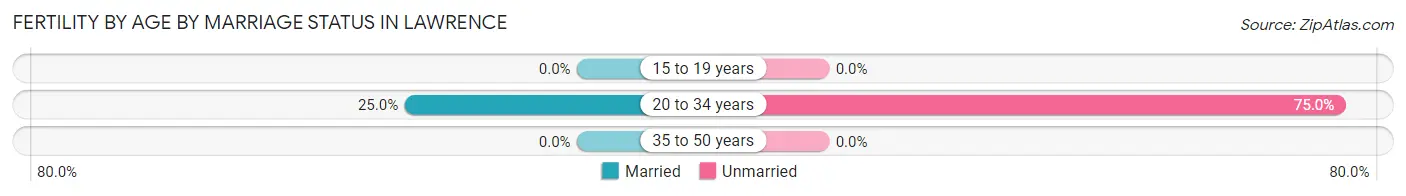
| Age Bracket | Married | Unmarried |
| 15 to 19 years | 0 (0.0%) | 0 (0.0%) |
| 20 to 34 years | 2 (25.0%) | 6 (75.0%) |
| 35 to 50 years | 0 (0.0%) | 0 (0.0%) |
| Total | 2 (25.0%) | 6 (75.0%) |
Fertility by Education in Lawrence
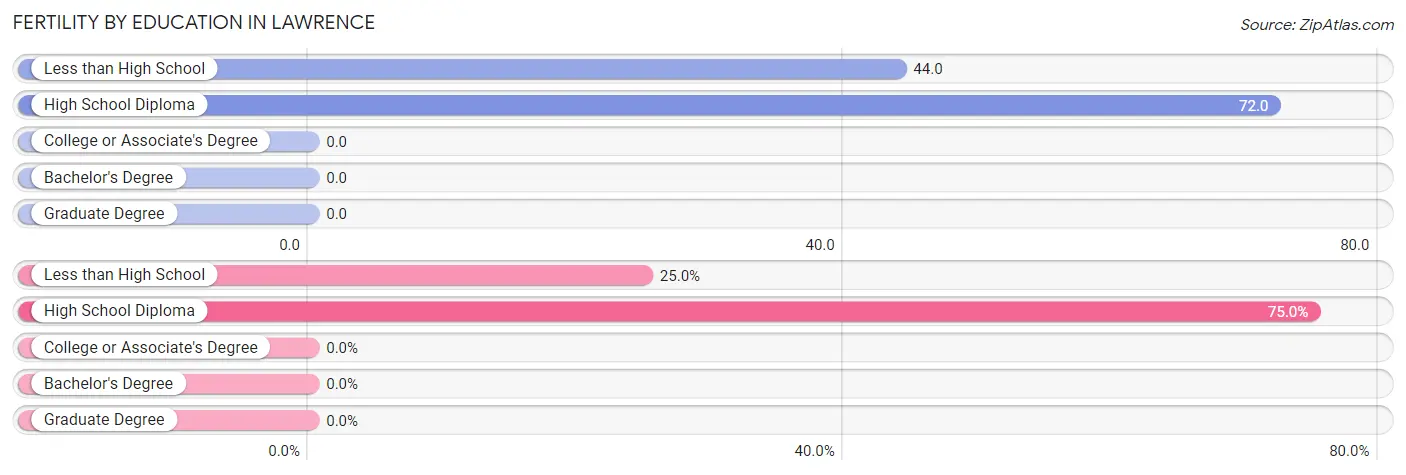
| Educational Attainment | Women with Births | Births / 1,000 Women |
| Less than High School | 2 (25.0%) | 44.0 |
| High School Diploma | 6 (75.0%) | 72.0 |
| College or Associate's Degree | 0 (0.0%) | 0.0 |
| Bachelor's Degree | 0 (0.0%) | 0.0 |
| Graduate Degree | 0 (0.0%) | 0.0 |
| Total | 8 (100.0%) | 40.0 |
Fertility by Education by Marriage Status in Lawrence
75.0% of women with births in Lawrence are unmarried. Women with the educational attainment of less than high school are most likely to be married with 100.0% of them married at childbirth, while women with the educational attainment of high school diploma are least likely to be married with 100.0% of them unmarried at childbirth.
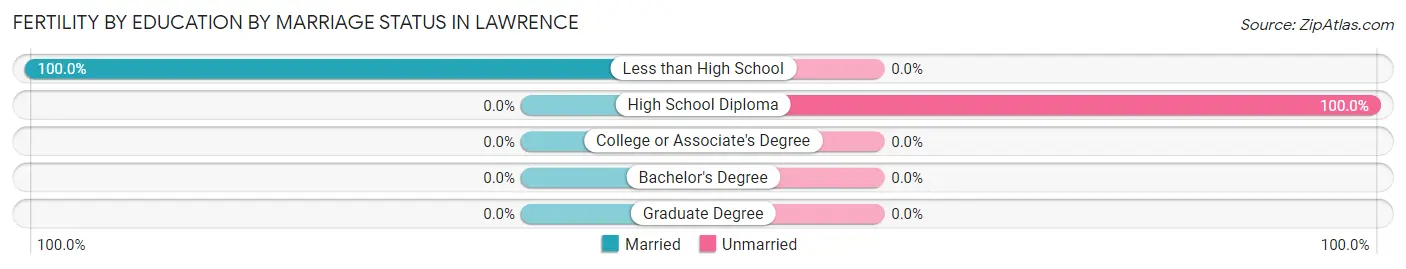
| Educational Attainment | Married | Unmarried |
| Less than High School | 2 (100.0%) | 0 (0.0%) |
| High School Diploma | 0 (0.0%) | 6 (100.0%) |
| College or Associate's Degree | 0 (0.0%) | 0 (0.0%) |
| Bachelor's Degree | 0 (0.0%) | 0 (0.0%) |
| Graduate Degree | 0 (0.0%) | 0 (0.0%) |
| Total | 2 (25.0%) | 6 (75.0%) |
Employment Characteristics in Lawrence
Employment by Class of Employer in Lawrence
Among the 411 employed individuals in Lawrence, private company employees (279 | 67.9%), local government employees (41 | 10.0%), and not-for-profit organizations (32 | 7.8%) make up the most common classes of employment.
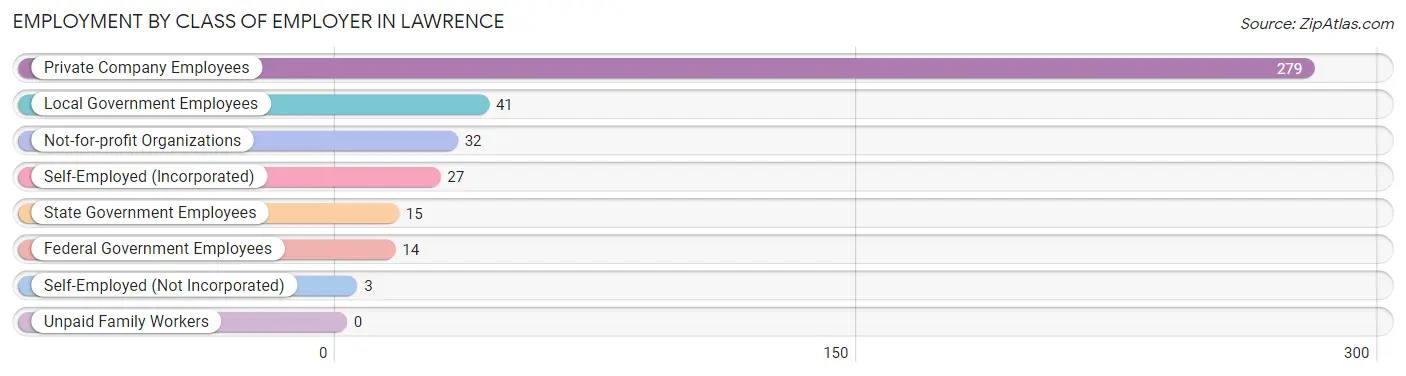
| Employer Class | # Employees | % Employees |
| Private Company Employees | 279 | 67.9% |
| Self-Employed (Incorporated) | 27 | 6.6% |
| Self-Employed (Not Incorporated) | 3 | 0.7% |
| Not-for-profit Organizations | 32 | 7.8% |
| Local Government Employees | 41 | 10.0% |
| State Government Employees | 15 | 3.6% |
| Federal Government Employees | 14 | 3.4% |
| Unpaid Family Workers | 0 | 0.0% |
| Total | 411 | 100.0% |
Employment Status by Age in Lawrence
According to the labor force statistics for Lawrence, out of the total population over 16 years of age (752), 61.7% or 464 individuals are in the labor force, with 8.4% or 39 of them unemployed. The age group with the highest labor force participation rate is 25 to 29 years, with 92.5% or 74 individuals in the labor force. Within the labor force, the 20 to 24 years age range has the highest percentage of unemployed individuals, with 31.9% or 22 of them being unemployed.
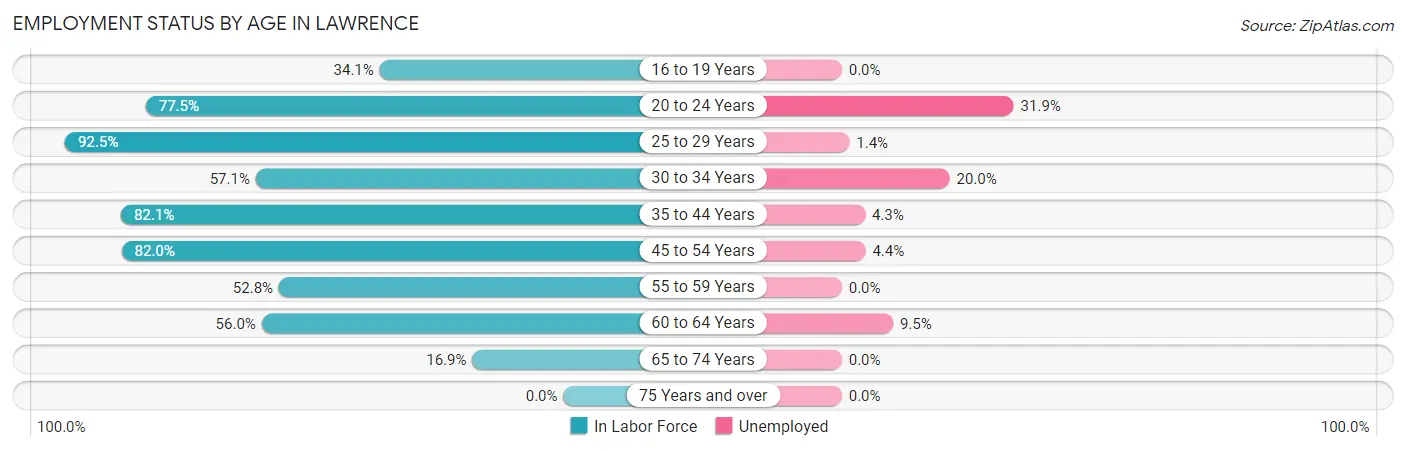
| Age Bracket | In Labor Force | Unemployed |
| 16 to 19 Years | 15 (34.1%) | 0 (0.0%) |
| 20 to 24 Years | 69 (77.5%) | 22 (31.9%) |
| 25 to 29 Years | 74 (92.5%) | 1 (1.4%) |
| 30 to 34 Years | 20 (57.1%) | 4 (20.0%) |
| 35 to 44 Years | 92 (82.1%) | 4 (4.3%) |
| 45 to 54 Years | 91 (82.0%) | 4 (4.4%) |
| 55 to 59 Years | 47 (52.8%) | 0 (0.0%) |
| 60 to 64 Years | 42 (56.0%) | 4 (9.5%) |
| 65 to 74 Years | 14 (16.9%) | 0 (0.0%) |
| 75 Years and over | 0 (0.0%) | 0 (0.0%) |
| Total | 464 (61.7%) | 39 (8.4%) |
Employment Status by Educational Attainment in Lawrence
According to labor force statistics for Lawrence, 72.9% of individuals (366) out of the total population between 25 and 64 years of age (502) are in the labor force, with 4.6% or 17 of them being unemployed. The group with the highest labor force participation rate are those with the educational attainment of bachelor's degree or higher, with 91.7% or 66 individuals in the labor force. Within the labor force, individuals with college / associate degree education have the highest percentage of unemployment, with 7.7% or 7 of them being unemployed.
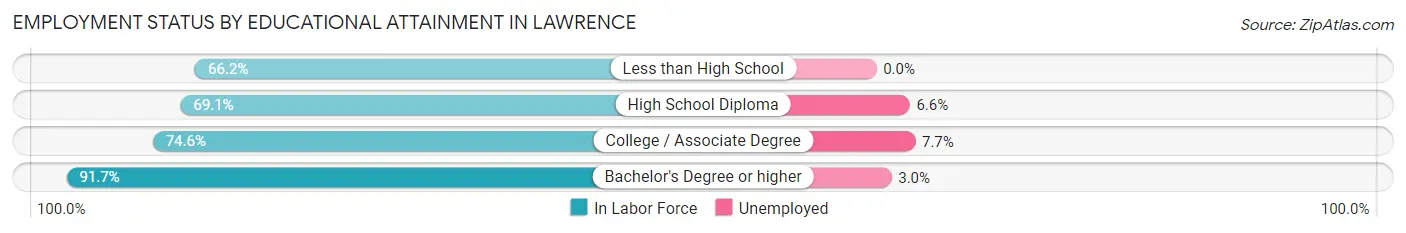
| Educational Attainment | In Labor Force | Unemployed |
| Less than High School | 88 (66.2%) | 0 (0.0%) |
| High School Diploma | 121 (69.1%) | 12 (6.6%) |
| College / Associate Degree | 91 (74.6%) | 9 (7.7%) |
| Bachelor's Degree or higher | 66 (91.7%) | 2 (3.0%) |
| Total | 366 (72.9%) | 23 (4.6%) |
Employment Occupations by Sex in Lawrence
Management, Business, Science and Arts Occupations
The most common Management, Business, Science and Arts occupations in Lawrence are Management (27 | 6.4%), Community & Social Service (22 | 5.2%), Computers, Engineering & Science (20 | 4.7%), Education Instruction & Library (12 | 2.8%), and Computers & Mathematics (11 | 2.6%).
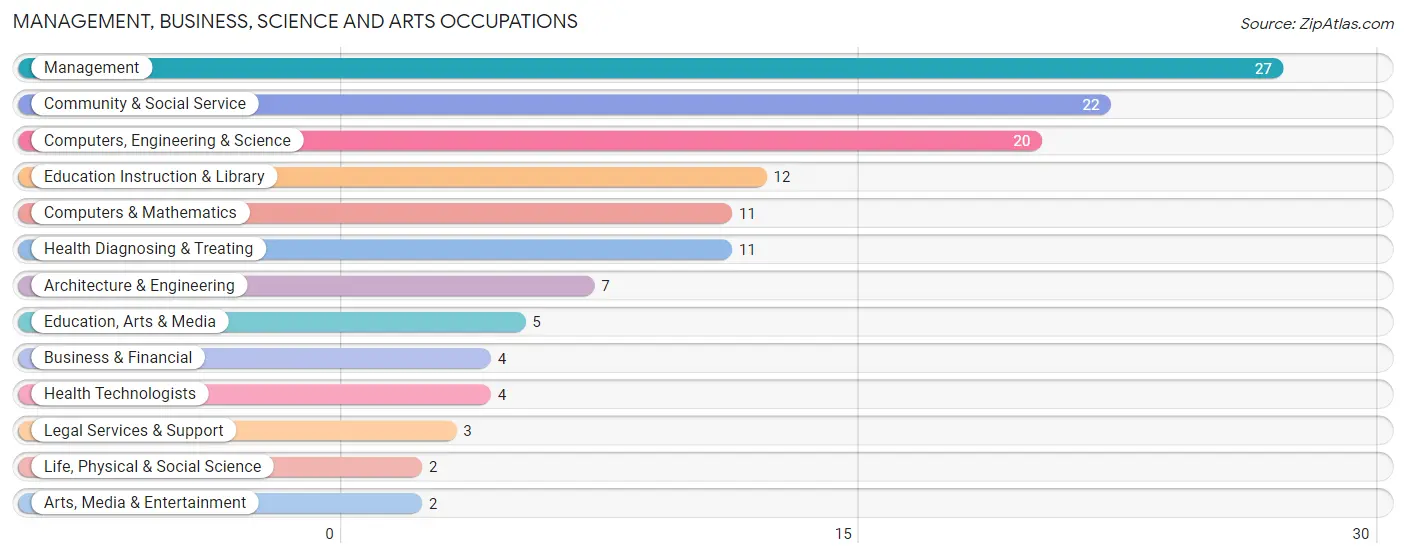
Management, Business, Science and Arts Occupations by Sex
Within the Management, Business, Science and Arts occupations in Lawrence, the most male-oriented occupations are Computers, Engineering & Science (100.0%), Computers & Mathematics (100.0%), and Architecture & Engineering (100.0%), while the most female-oriented occupations are Business & Financial (100.0%), Education Instruction & Library (100.0%), and Health Diagnosing & Treating (81.8%).
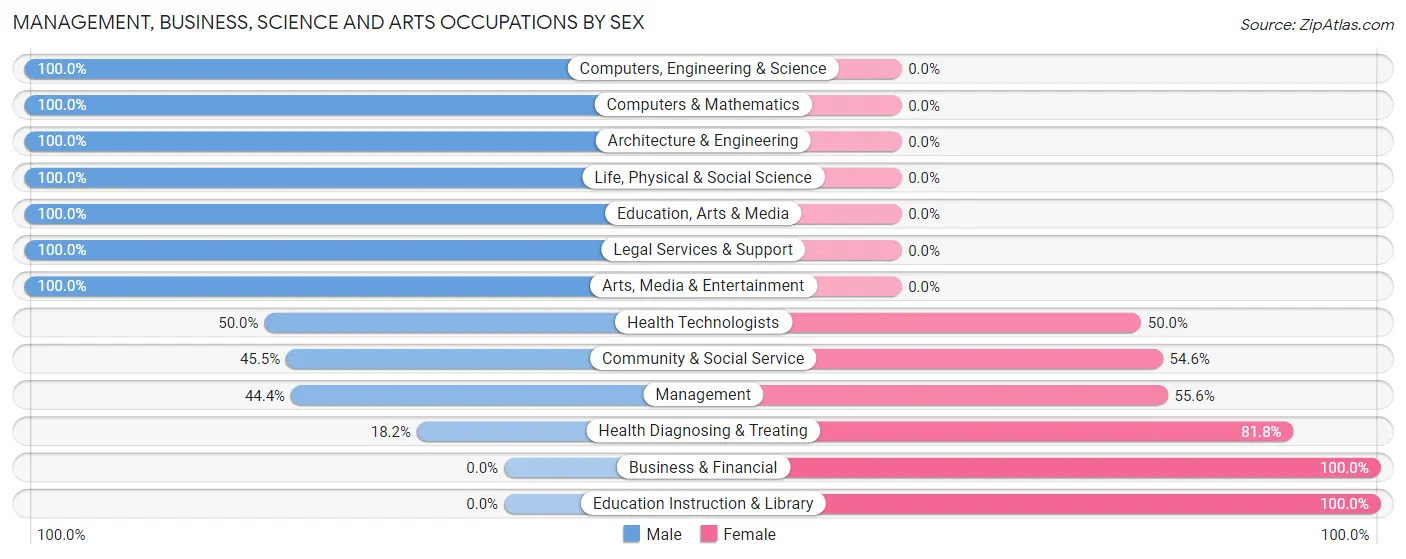
| Occupation | Male | Female |
| Management | 12 (44.4%) | 15 (55.6%) |
| Business & Financial | 0 (0.0%) | 4 (100.0%) |
| Computers, Engineering & Science | 20 (100.0%) | 0 (0.0%) |
| Computers & Mathematics | 11 (100.0%) | 0 (0.0%) |
| Architecture & Engineering | 7 (100.0%) | 0 (0.0%) |
| Life, Physical & Social Science | 2 (100.0%) | 0 (0.0%) |
| Community & Social Service | 10 (45.5%) | 12 (54.5%) |
| Education, Arts & Media | 5 (100.0%) | 0 (0.0%) |
| Legal Services & Support | 3 (100.0%) | 0 (0.0%) |
| Education Instruction & Library | 0 (0.0%) | 12 (100.0%) |
| Arts, Media & Entertainment | 2 (100.0%) | 0 (0.0%) |
| Health Diagnosing & Treating | 2 (18.2%) | 9 (81.8%) |
| Health Technologists | 2 (50.0%) | 2 (50.0%) |
| Total (Category) | 44 (52.4%) | 40 (47.6%) |
| Total (Overall) | 222 (52.2%) | 203 (47.8%) |
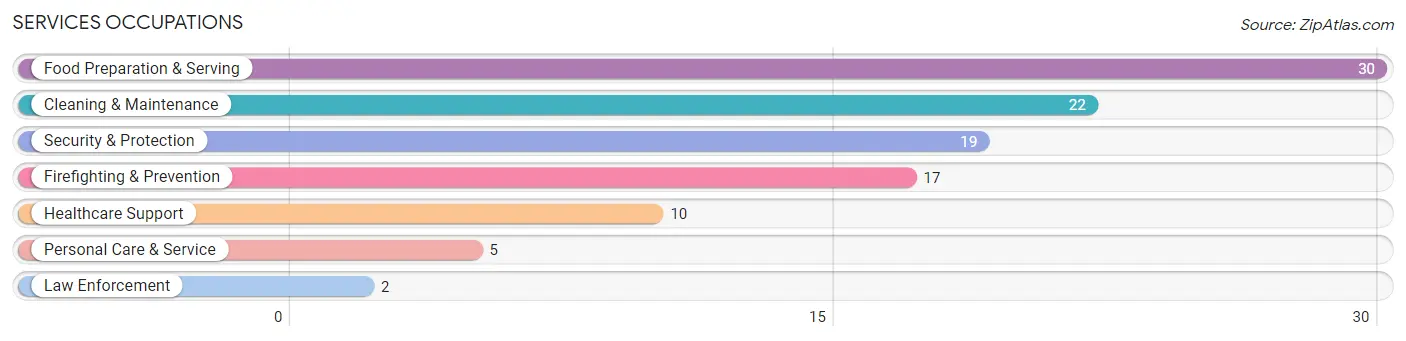
Services Occupations
The most common Services occupations in Lawrence are Food Preparation & Serving (30 | 7.1%), Cleaning & Maintenance (22 | 5.2%), Security & Protection (19 | 4.5%), Firefighting & Prevention (17 | 4.0%), and Healthcare Support (10 | 2.4%).
Services Occupations by Sex
Within the Services occupations in Lawrence, the most male-oriented occupations are Security & Protection (100.0%), Firefighting & Prevention (100.0%), and Law Enforcement (100.0%), while the most female-oriented occupations are Healthcare Support (100.0%), Personal Care & Service (100.0%), and Cleaning & Maintenance (68.2%).
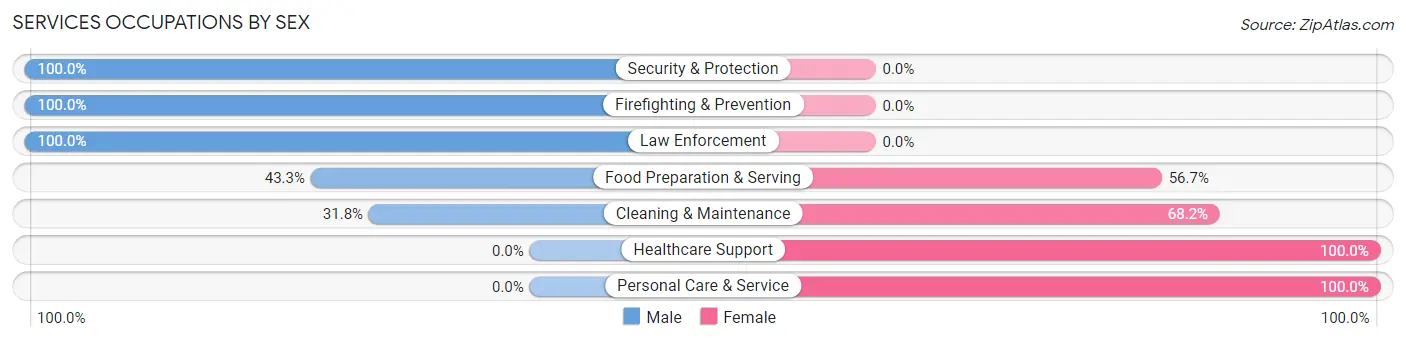
| Occupation | Male | Female |
| Healthcare Support | 0 (0.0%) | 10 (100.0%) |
| Security & Protection | 19 (100.0%) | 0 (0.0%) |
| Firefighting & Prevention | 17 (100.0%) | 0 (0.0%) |
| Law Enforcement | 2 (100.0%) | 0 (0.0%) |
| Food Preparation & Serving | 13 (43.3%) | 17 (56.7%) |
| Cleaning & Maintenance | 7 (31.8%) | 15 (68.2%) |
| Personal Care & Service | 0 (0.0%) | 5 (100.0%) |
| Total (Category) | 39 (45.4%) | 47 (54.6%) |
| Total (Overall) | 222 (52.2%) | 203 (47.8%) |
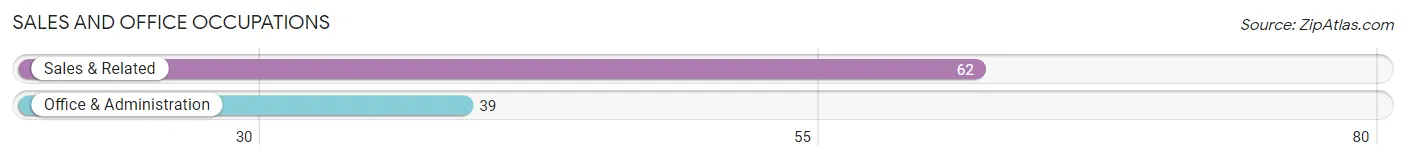
Sales and Office Occupations
The most common Sales and Office occupations in Lawrence are Sales & Related (62 | 14.6%), and Office & Administration (39 | 9.2%).
Sales and Office Occupations by Sex
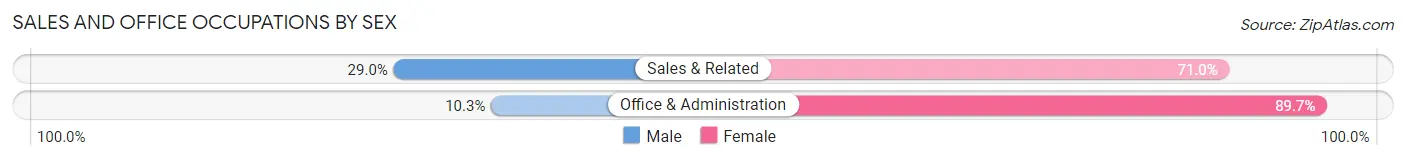
| Occupation | Male | Female |
| Sales & Related | 18 (29.0%) | 44 (71.0%) |
| Office & Administration | 4 (10.3%) | 35 (89.7%) |
| Total (Category) | 22 (21.8%) | 79 (78.2%) |
| Total (Overall) | 222 (52.2%) | 203 (47.8%) |
Natural Resources, Construction and Maintenance Occupations
The most common Natural Resources, Construction and Maintenance occupations in Lawrence are Installation, Maintenance & Repair (30 | 7.1%), and Construction & Extraction (17 | 4.0%).
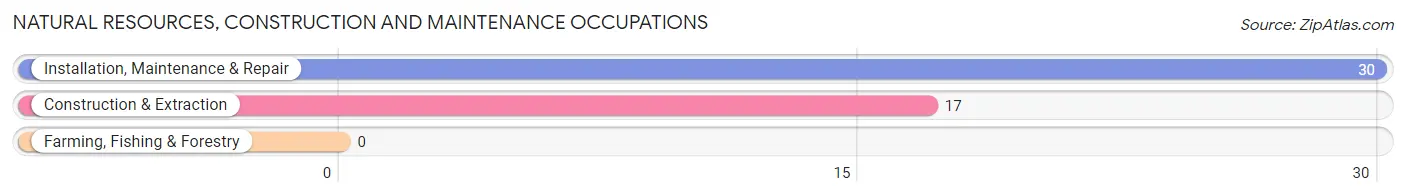
Natural Resources, Construction and Maintenance Occupations by Sex
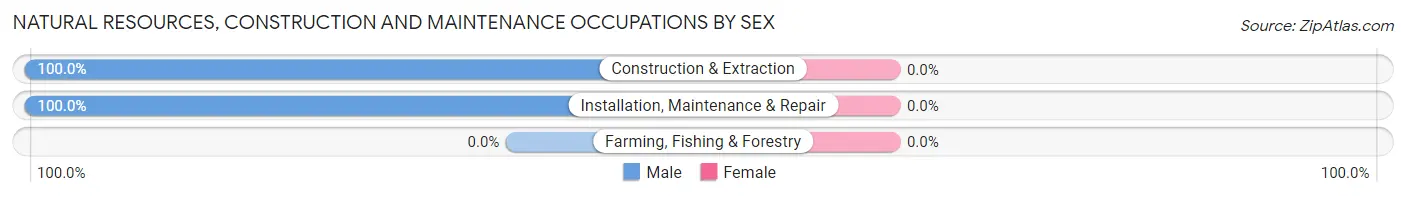
| Occupation | Male | Female |
| Farming, Fishing & Forestry | 0 (0.0%) | 0 (0.0%) |
| Construction & Extraction | 17 (100.0%) | 0 (0.0%) |
| Installation, Maintenance & Repair | 30 (100.0%) | 0 (0.0%) |
| Total (Category) | 47 (100.0%) | 0 (0.0%) |
| Total (Overall) | 222 (52.2%) | 203 (47.8%) |
Production, Transportation and Moving Occupations
The most common Production, Transportation and Moving occupations in Lawrence are Production (72 | 16.9%), Transportation (27 | 6.4%), and Material Moving (8 | 1.9%).
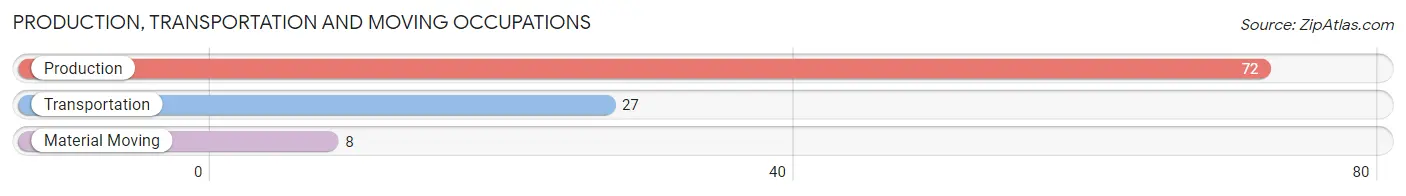
Production, Transportation and Moving Occupations by Sex
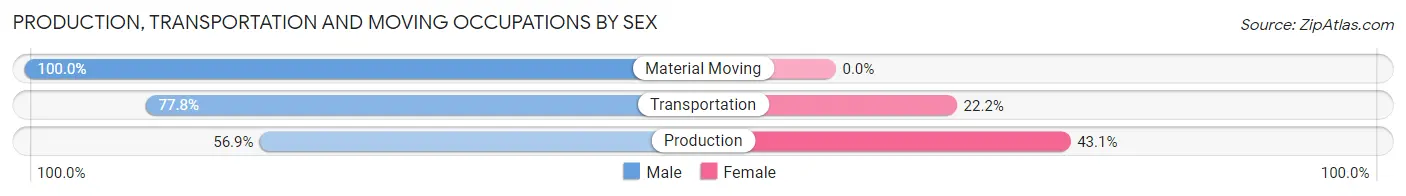
| Occupation | Male | Female |
| Production | 41 (56.9%) | 31 (43.1%) |
| Transportation | 21 (77.8%) | 6 (22.2%) |
| Material Moving | 8 (100.0%) | 0 (0.0%) |
| Total (Category) | 70 (65.4%) | 37 (34.6%) |
| Total (Overall) | 222 (52.2%) | 203 (47.8%) |
Employment Industries by Sex in Lawrence
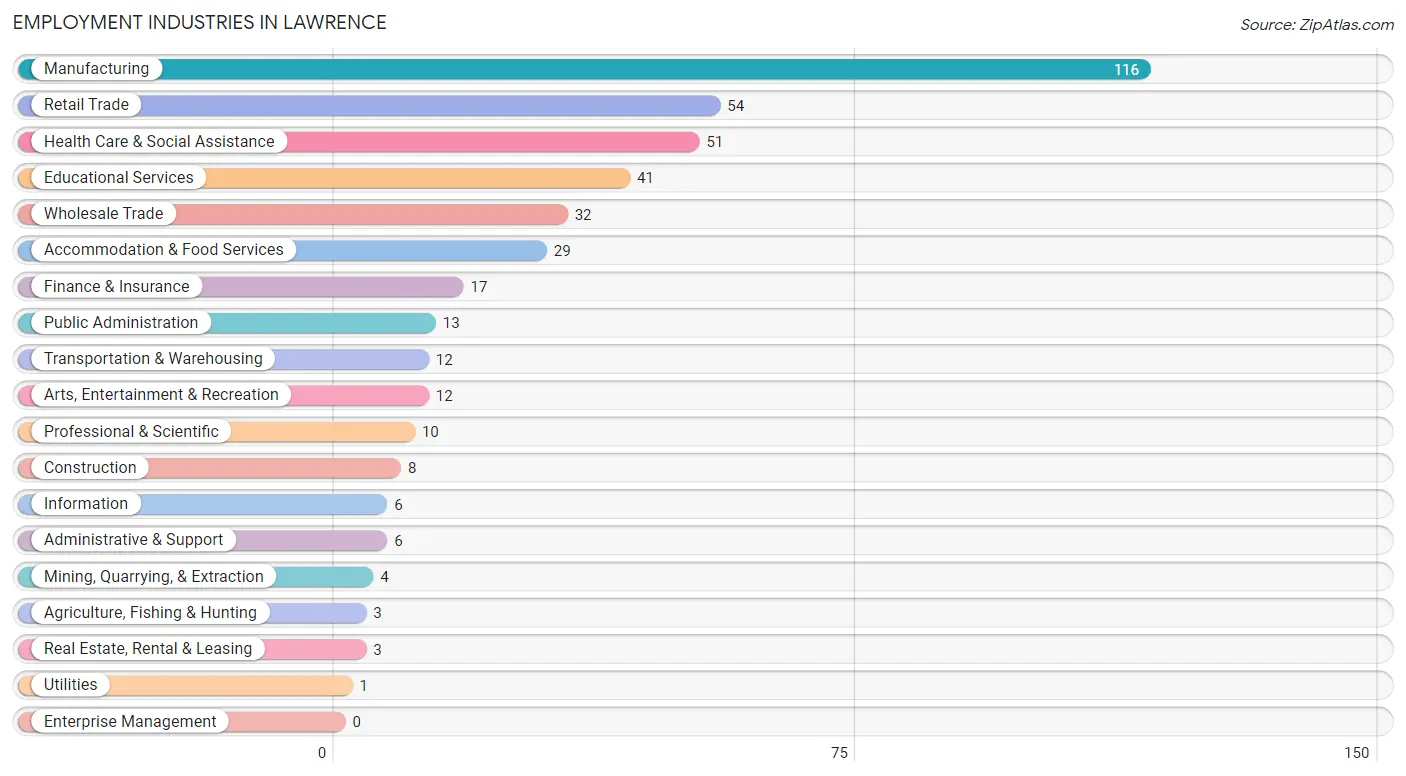
Employment Industries in Lawrence
The major employment industries in Lawrence include Manufacturing (116 | 27.3%), Retail Trade (54 | 12.7%), Health Care & Social Assistance (51 | 12.0%), Educational Services (41 | 9.7%), and Wholesale Trade (32 | 7.5%).
Employment Industries by Sex in Lawrence
The Lawrence industries that see more men than women are Agriculture, Fishing & Hunting (100.0%), Mining, Quarrying, & Extraction (100.0%), and Utilities (100.0%), whereas the industries that tend to have a higher number of women are Administrative & Support (100.0%), Health Care & Social Assistance (92.2%), and Arts, Entertainment & Recreation (75.0%).
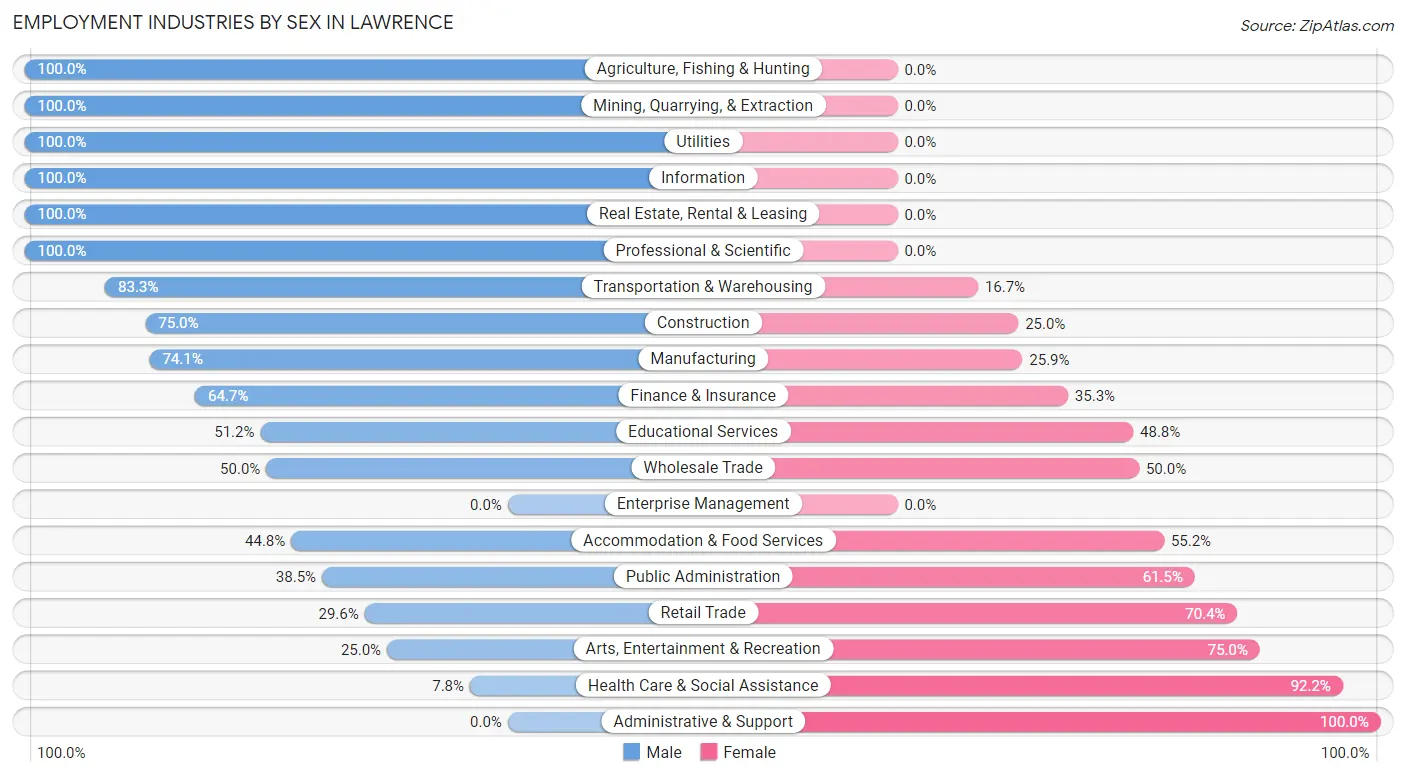
| Industry | Male | Female |
| Agriculture, Fishing & Hunting | 3 (100.0%) | 0 (0.0%) |
| Mining, Quarrying, & Extraction | 4 (100.0%) | 0 (0.0%) |
| Construction | 6 (75.0%) | 2 (25.0%) |
| Manufacturing | 86 (74.1%) | 30 (25.9%) |
| Wholesale Trade | 16 (50.0%) | 16 (50.0%) |
| Retail Trade | 16 (29.6%) | 38 (70.4%) |
| Transportation & Warehousing | 10 (83.3%) | 2 (16.7%) |
| Utilities | 1 (100.0%) | 0 (0.0%) |
| Information | 6 (100.0%) | 0 (0.0%) |
| Finance & Insurance | 11 (64.7%) | 6 (35.3%) |
| Real Estate, Rental & Leasing | 3 (100.0%) | 0 (0.0%) |
| Professional & Scientific | 10 (100.0%) | 0 (0.0%) |
| Enterprise Management | 0 (0.0%) | 0 (0.0%) |
| Administrative & Support | 0 (0.0%) | 6 (100.0%) |
| Educational Services | 21 (51.2%) | 20 (48.8%) |
| Health Care & Social Assistance | 4 (7.8%) | 47 (92.2%) |
| Arts, Entertainment & Recreation | 3 (25.0%) | 9 (75.0%) |
| Accommodation & Food Services | 13 (44.8%) | 16 (55.2%) |
| Public Administration | 5 (38.5%) | 8 (61.5%) |
| Total | 222 (52.2%) | 203 (47.8%) |
Education in Lawrence
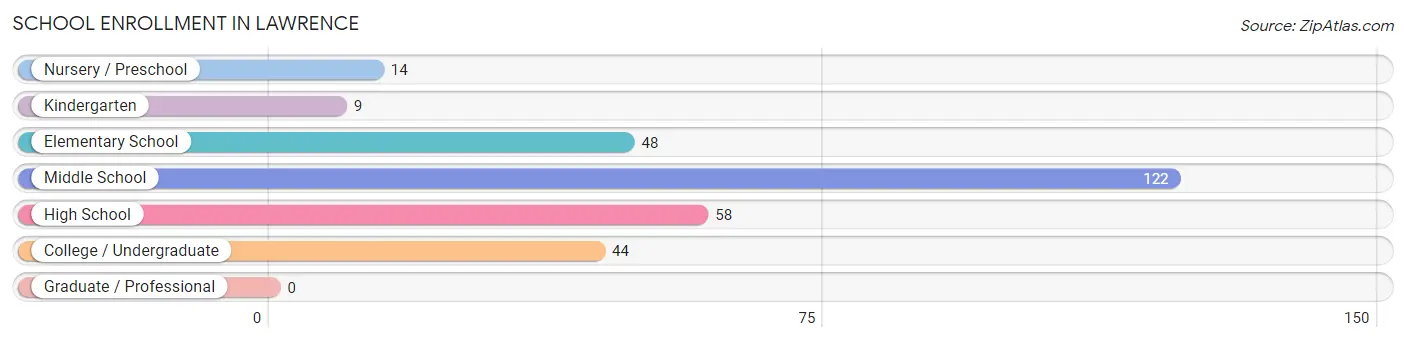
School Enrollment in Lawrence
The most common levels of schooling among the 295 students in Lawrence are middle school (122 | 41.4%), high school (58 | 19.7%), and elementary school (48 | 16.3%).
| School Level | # Students | % Students |
| Nursery / Preschool | 14 | 4.8% |
| Kindergarten | 9 | 3.0% |
| Elementary School | 48 | 16.3% |
| Middle School | 122 | 41.4% |
| High School | 58 | 19.7% |
| College / Undergraduate | 44 | 14.9% |
| Graduate / Professional | 0 | 0.0% |
| Total | 295 | 100.0% |
School Enrollment by Age by Funding Source in Lawrence
Out of a total of 295 students who are enrolled in schools in Lawrence, 4 (1.4%) attend a private institution, while the remaining 291 (98.6%) are enrolled in public schools. The age group of 3 to 4 year olds has the highest likelihood of being enrolled in private schools, with 2 (18.2% in the age bracket) enrolled. Conversely, the age group of 5 to 9 year old has the lowest likelihood of being enrolled in a private school, with 58 (100.0% in the age bracket) attending a public institution.
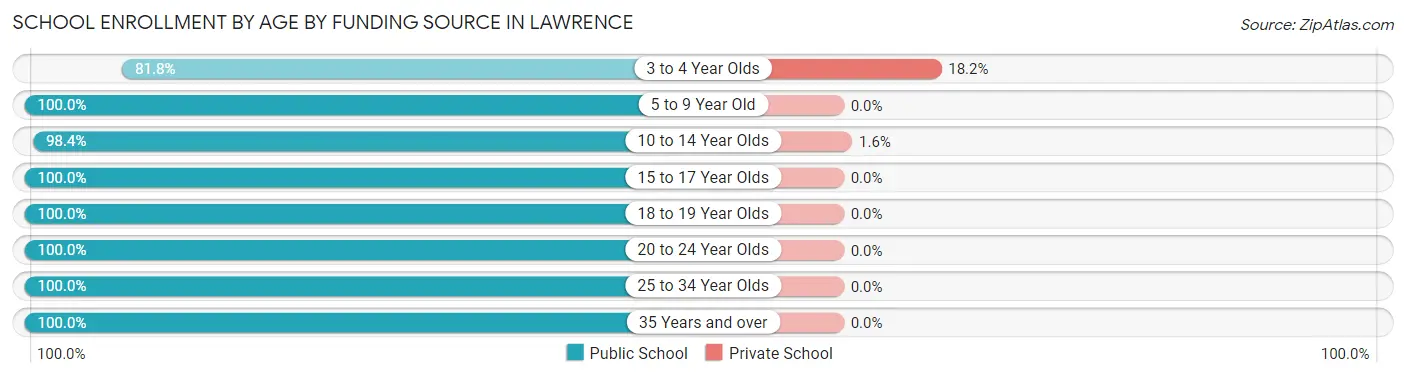
| Age Bracket | Public School | Private School |
| 3 to 4 Year Olds | 9 (81.8%) | 2 (18.2%) |
| 5 to 9 Year Old | 58 (100.0%) | 0 (0.0%) |
| 10 to 14 Year Olds | 125 (98.4%) | 2 (1.6%) |
| 15 to 17 Year Olds | 41 (100.0%) | 0 (0.0%) |
| 18 to 19 Year Olds | 11 (100.0%) | 0 (0.0%) |
| 20 to 24 Year Olds | 24 (100.0%) | 0 (0.0%) |
| 25 to 34 Year Olds | 6 (100.0%) | 0 (0.0%) |
| 35 Years and over | 17 (100.0%) | 0 (0.0%) |
| Total | 291 (98.6%) | 4 (1.4%) |
Educational Attainment by Field of Study in Lawrence
Arts & humanities (35 | 29.7%), business (25 | 21.2%), bio, nature & agricultural (17 | 14.4%), engineering (9 | 7.6%), and education (7 | 5.9%) are the most common fields of study among 118 individuals in Lawrence who have obtained a bachelor's degree or higher.
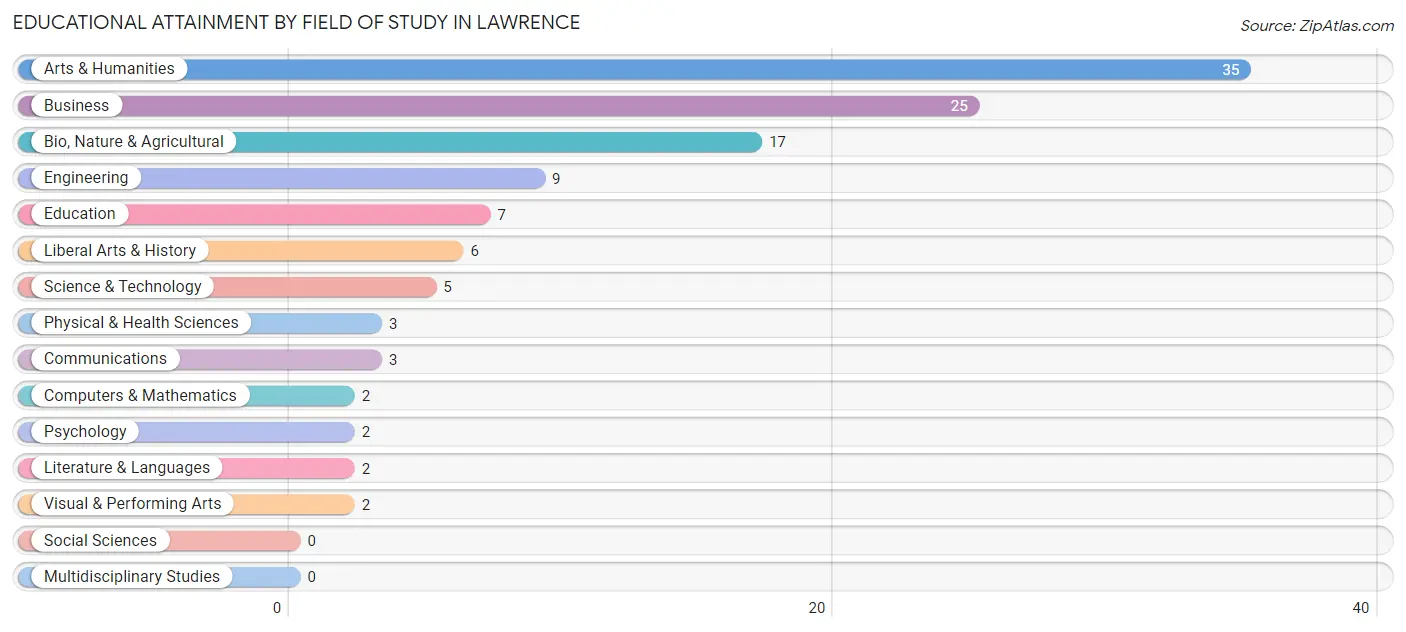
| Field of Study | # Graduates | % Graduates |
| Computers & Mathematics | 2 | 1.7% |
| Bio, Nature & Agricultural | 17 | 14.4% |
| Physical & Health Sciences | 3 | 2.5% |
| Psychology | 2 | 1.7% |
| Social Sciences | 0 | 0.0% |
| Engineering | 9 | 7.6% |
| Multidisciplinary Studies | 0 | 0.0% |
| Science & Technology | 5 | 4.2% |
| Business | 25 | 21.2% |
| Education | 7 | 5.9% |
| Literature & Languages | 2 | 1.7% |
| Liberal Arts & History | 6 | 5.1% |
| Visual & Performing Arts | 2 | 1.7% |
| Communications | 3 | 2.5% |
| Arts & Humanities | 35 | 29.7% |
| Total | 118 | 100.0% |
Transportation & Commute in Lawrence
Vehicle Availability by Sex in Lawrence
The most prevalent vehicle ownership categories in Lawrence are males with 2 vehicles (116, accounting for 53.7%) and females with 2 vehicles (61, making up 62.4%).
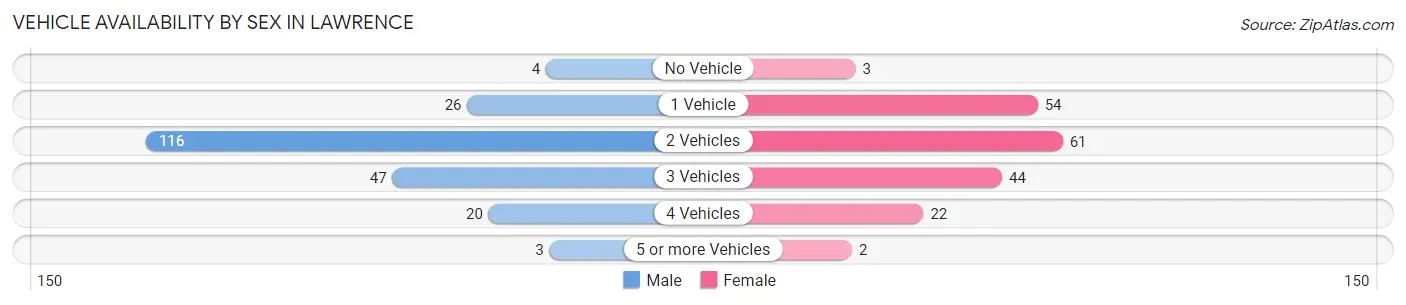
| Vehicles Available | Male | Female |
| No Vehicle | 4 (1.8%) | 3 (1.6%) |
| 1 Vehicle | 26 (12.0%) | 54 (29.0%) |
| 2 Vehicles | 116 (53.7%) | 61 (32.8%) |
| 3 Vehicles | 47 (21.8%) | 44 (23.7%) |
| 4 Vehicles | 20 (9.3%) | 22 (11.8%) |
| 5 or more Vehicles | 3 (1.4%) | 2 (1.1%) |
| Total | 216 (100.0%) | 186 (100.0%) |
Commute Time in Lawrence
The most frequently occuring commute durations in Lawrence are 15 to 19 minutes (76 commuters, 19.5%), 30 to 34 minutes (59 commuters, 15.1%), and 10 to 14 minutes (50 commuters, 12.8%).
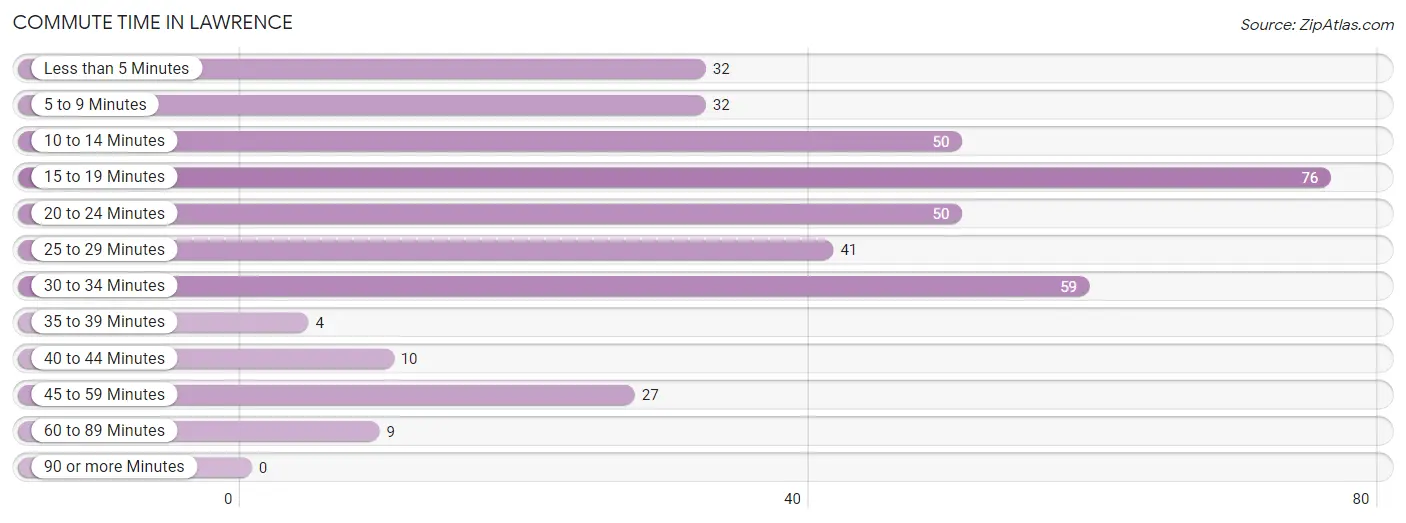
| Commute Time | # Commuters | % Commuters |
| Less than 5 Minutes | 32 | 8.2% |
| 5 to 9 Minutes | 32 | 8.2% |
| 10 to 14 Minutes | 50 | 12.8% |
| 15 to 19 Minutes | 76 | 19.5% |
| 20 to 24 Minutes | 50 | 12.8% |
| 25 to 29 Minutes | 41 | 10.5% |
| 30 to 34 Minutes | 59 | 15.1% |
| 35 to 39 Minutes | 4 | 1.0% |
| 40 to 44 Minutes | 10 | 2.6% |
| 45 to 59 Minutes | 27 | 6.9% |
| 60 to 89 Minutes | 9 | 2.3% |
| 90 or more Minutes | 0 | 0.0% |
Commute Time by Sex in Lawrence
The most common commute times in Lawrence are 30 to 34 minutes (54 commuters, 26.2%) for males and 10 to 14 minutes (37 commuters, 20.1%) for females.
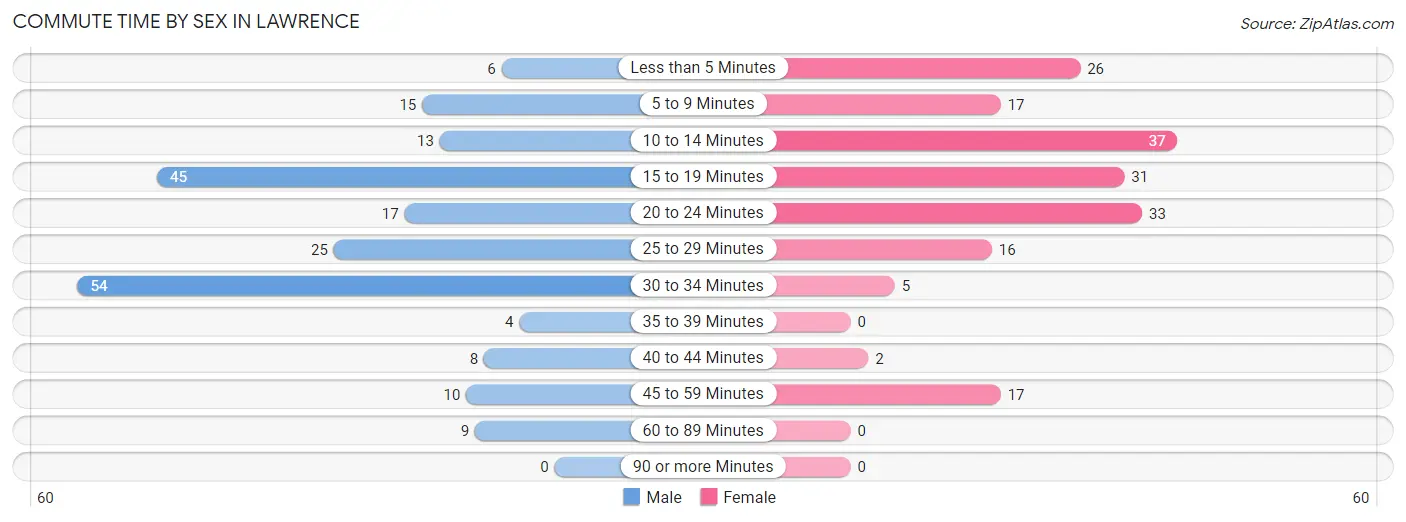
| Commute Time | Male | Female |
| Less than 5 Minutes | 6 (2.9%) | 26 (14.1%) |
| 5 to 9 Minutes | 15 (7.3%) | 17 (9.2%) |
| 10 to 14 Minutes | 13 (6.3%) | 37 (20.1%) |
| 15 to 19 Minutes | 45 (21.8%) | 31 (16.9%) |
| 20 to 24 Minutes | 17 (8.3%) | 33 (17.9%) |
| 25 to 29 Minutes | 25 (12.1%) | 16 (8.7%) |
| 30 to 34 Minutes | 54 (26.2%) | 5 (2.7%) |
| 35 to 39 Minutes | 4 (1.9%) | 0 (0.0%) |
| 40 to 44 Minutes | 8 (3.9%) | 2 (1.1%) |
| 45 to 59 Minutes | 10 (4.9%) | 17 (9.2%) |
| 60 to 89 Minutes | 9 (4.4%) | 0 (0.0%) |
| 90 or more Minutes | 0 (0.0%) | 0 (0.0%) |
Time of Departure to Work by Sex in Lawrence
The most frequent times of departure to work in Lawrence are 12:00 AM to 4:59 AM (51, 24.8%) for males and 7:00 AM to 7:29 AM (47, 25.5%) for females.
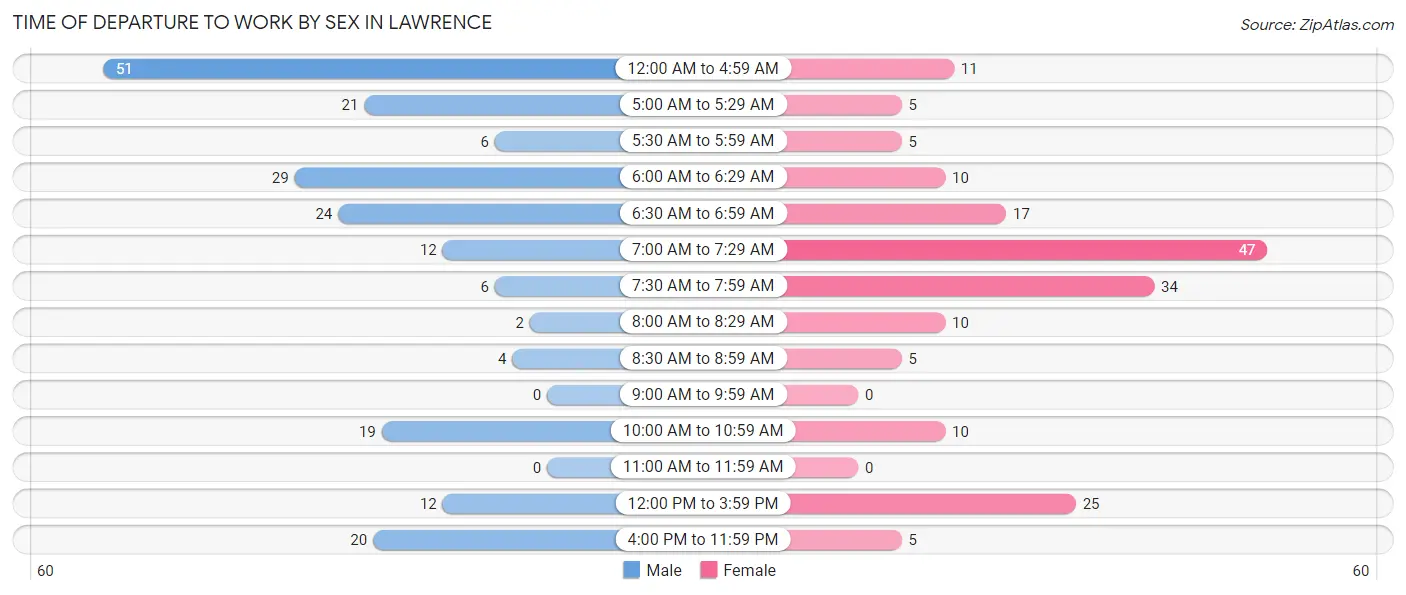
| Time of Departure | Male | Female |
| 12:00 AM to 4:59 AM | 51 (24.8%) | 11 (6.0%) |
| 5:00 AM to 5:29 AM | 21 (10.2%) | 5 (2.7%) |
| 5:30 AM to 5:59 AM | 6 (2.9%) | 5 (2.7%) |
| 6:00 AM to 6:29 AM | 29 (14.1%) | 10 (5.4%) |
| 6:30 AM to 6:59 AM | 24 (11.7%) | 17 (9.2%) |
| 7:00 AM to 7:29 AM | 12 (5.8%) | 47 (25.5%) |
| 7:30 AM to 7:59 AM | 6 (2.9%) | 34 (18.5%) |
| 8:00 AM to 8:29 AM | 2 (1.0%) | 10 (5.4%) |
| 8:30 AM to 8:59 AM | 4 (1.9%) | 5 (2.7%) |
| 9:00 AM to 9:59 AM | 0 (0.0%) | 0 (0.0%) |
| 10:00 AM to 10:59 AM | 19 (9.2%) | 10 (5.4%) |
| 11:00 AM to 11:59 AM | 0 (0.0%) | 0 (0.0%) |
| 12:00 PM to 3:59 PM | 12 (5.8%) | 25 (13.6%) |
| 4:00 PM to 11:59 PM | 20 (9.7%) | 5 (2.7%) |
| Total | 206 (100.0%) | 184 (100.0%) |
Housing Occupancy in Lawrence
Occupancy by Ownership in Lawrence
Of the total 356 dwellings in Lawrence, owner-occupied units account for 176 (49.4%), while renter-occupied units make up 180 (50.6%).
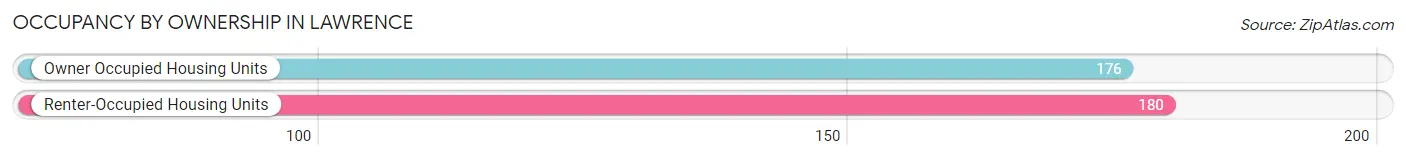
| Occupancy | # Housing Units | % Housing Units |
| Owner Occupied Housing Units | 176 | 49.4% |
| Renter-Occupied Housing Units | 180 | 50.6% |
| Total Occupied Housing Units | 356 | 100.0% |
Occupancy by Household Size in Lawrence
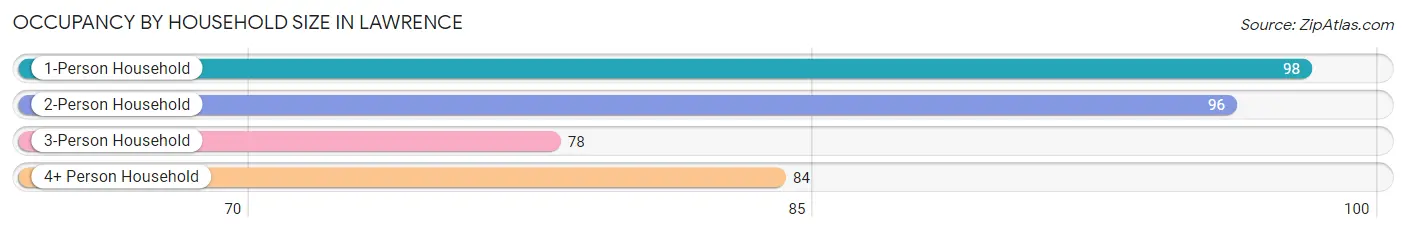
| Household Size | # Housing Units | % Housing Units |
| 1-Person Household | 98 | 27.5% |
| 2-Person Household | 96 | 27.0% |
| 3-Person Household | 78 | 21.9% |
| 4+ Person Household | 84 | 23.6% |
| Total Housing Units | 356 | 100.0% |
Occupancy by Ownership by Household Size in Lawrence
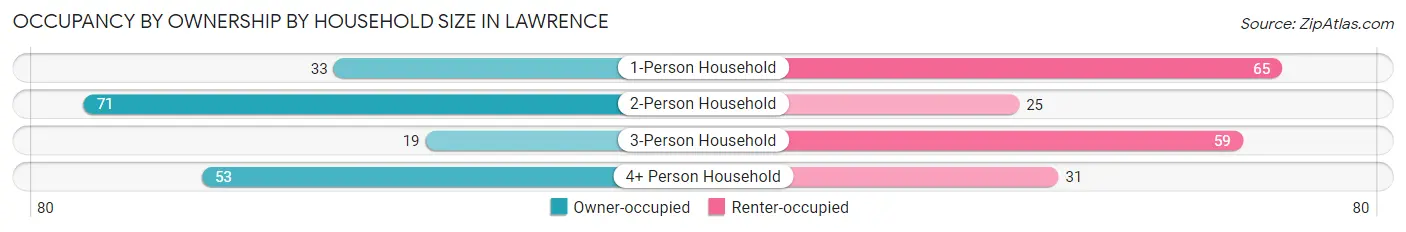
| Household Size | Owner-occupied | Renter-occupied |
| 1-Person Household | 33 (33.7%) | 65 (66.3%) |
| 2-Person Household | 71 (74.0%) | 25 (26.0%) |
| 3-Person Household | 19 (24.4%) | 59 (75.6%) |
| 4+ Person Household | 53 (63.1%) | 31 (36.9%) |
| Total Housing Units | 176 (49.4%) | 180 (50.6%) |
Occupancy by Educational Attainment in Lawrence
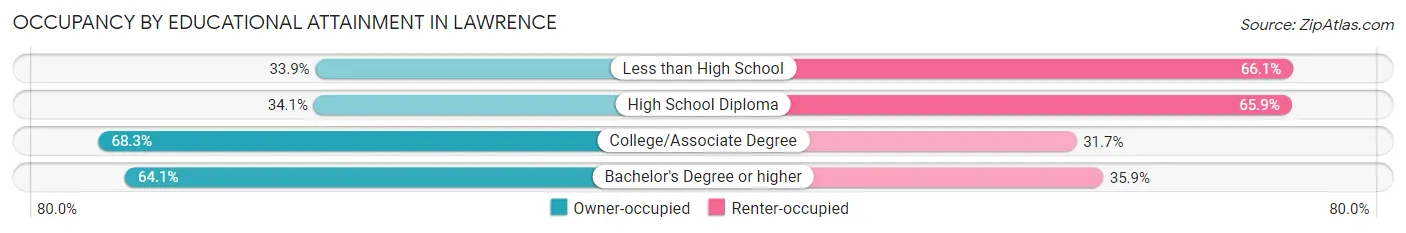
| Household Size | Owner-occupied | Renter-occupied |
| Less than High School | 21 (33.9%) | 41 (66.1%) |
| High School Diploma | 43 (34.1%) | 83 (65.9%) |
| College/Associate Degree | 71 (68.3%) | 33 (31.7%) |
| Bachelor's Degree or higher | 41 (64.1%) | 23 (35.9%) |
Occupancy by Age of Householder in Lawrence
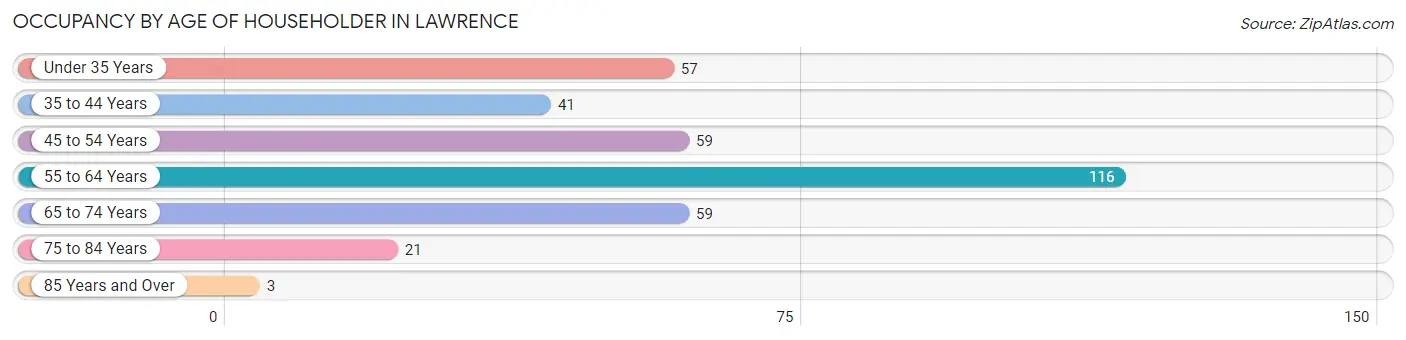
| Age Bracket | # Households | % Households |
| Under 35 Years | 57 | 16.0% |
| 35 to 44 Years | 41 | 11.5% |
| 45 to 54 Years | 59 | 16.6% |
| 55 to 64 Years | 116 | 32.6% |
| 65 to 74 Years | 59 | 16.6% |
| 75 to 84 Years | 21 | 5.9% |
| 85 Years and Over | 3 | 0.8% |
| Total | 356 | 100.0% |
Housing Finances in Lawrence
Median Income by Occupancy in Lawrence
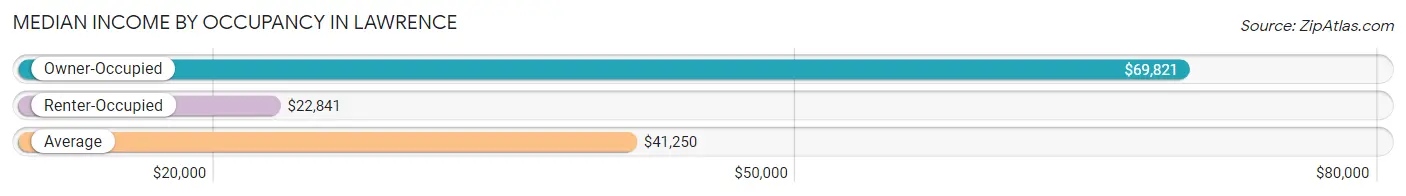
| Occupancy Type | # Households | Median Income |
| Owner-Occupied | 176 (49.4%) | $69,821 |
| Renter-Occupied | 180 (50.6%) | $22,841 |
| Average | 356 (100.0%) | $41,250 |
Occupancy by Householder Income Bracket in Lawrence
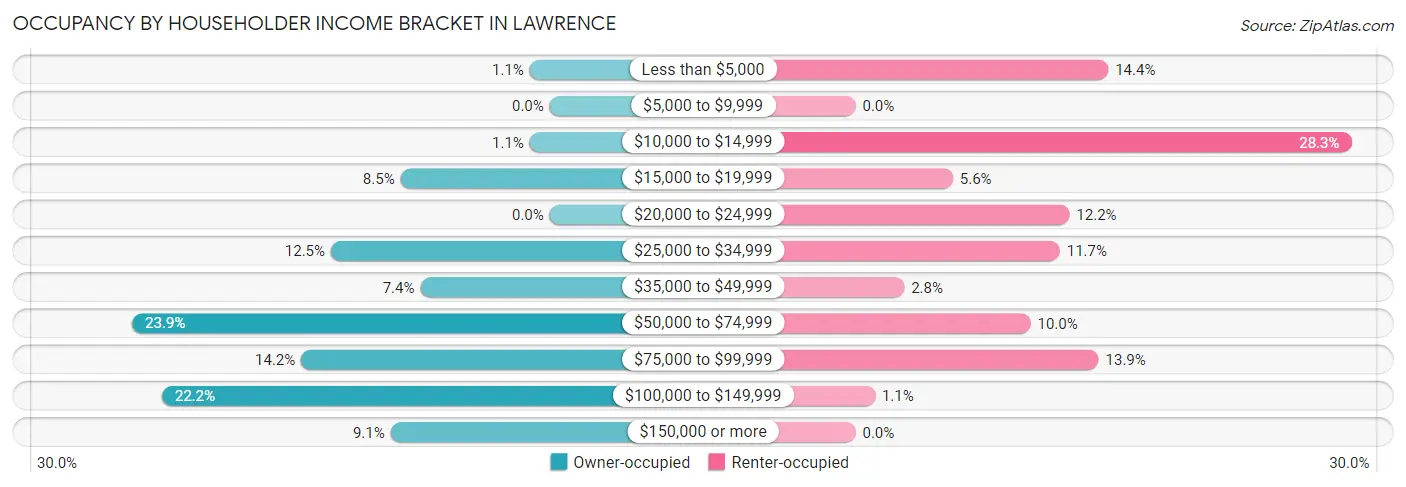
| Income Bracket | Owner-occupied | Renter-occupied |
| Less than $5,000 | 2 (1.1%) | 26 (14.4%) |
| $5,000 to $9,999 | 0 (0.0%) | 0 (0.0%) |
| $10,000 to $14,999 | 2 (1.1%) | 51 (28.3%) |
| $15,000 to $19,999 | 15 (8.5%) | 10 (5.6%) |
| $20,000 to $24,999 | 0 (0.0%) | 22 (12.2%) |
| $25,000 to $34,999 | 22 (12.5%) | 21 (11.7%) |
| $35,000 to $49,999 | 13 (7.4%) | 5 (2.8%) |
| $50,000 to $74,999 | 42 (23.9%) | 18 (10.0%) |
| $75,000 to $99,999 | 25 (14.2%) | 25 (13.9%) |
| $100,000 to $149,999 | 39 (22.2%) | 2 (1.1%) |
| $150,000 or more | 16 (9.1%) | 0 (0.0%) |
| Total | 176 (100.0%) | 180 (100.0%) |
Monthly Housing Cost Tiers in Lawrence
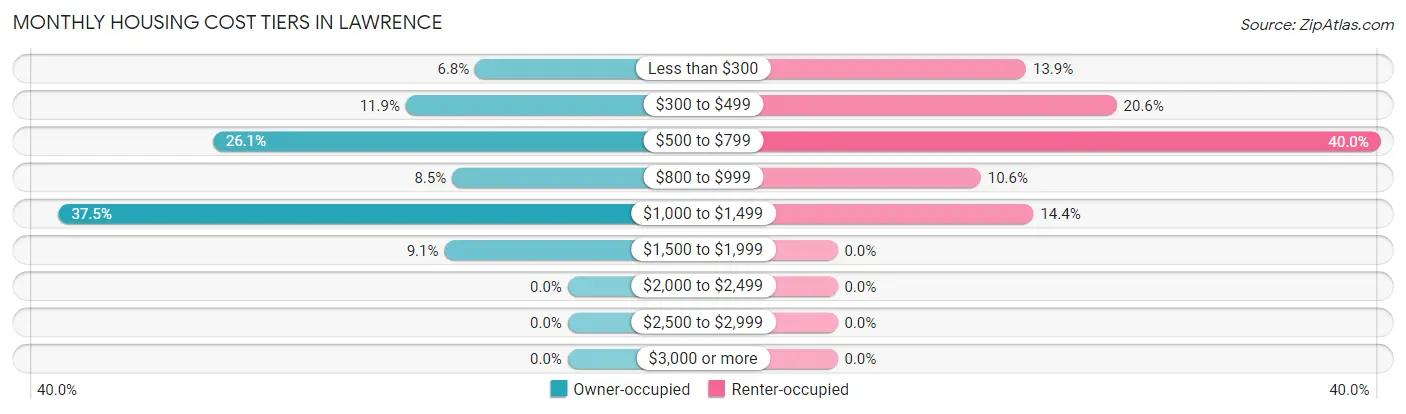
| Monthly Cost | Owner-occupied | Renter-occupied |
| Less than $300 | 12 (6.8%) | 25 (13.9%) |
| $300 to $499 | 21 (11.9%) | 37 (20.6%) |
| $500 to $799 | 46 (26.1%) | 72 (40.0%) |
| $800 to $999 | 15 (8.5%) | 19 (10.6%) |
| $1,000 to $1,499 | 66 (37.5%) | 26 (14.4%) |
| $1,500 to $1,999 | 16 (9.1%) | 0 (0.0%) |
| $2,000 to $2,499 | 0 (0.0%) | 0 (0.0%) |
| $2,500 to $2,999 | 0 (0.0%) | 0 (0.0%) |
| $3,000 or more | 0 (0.0%) | 0 (0.0%) |
| Total | 176 (100.0%) | 180 (100.0%) |
Physical Housing Characteristics in Lawrence
Housing Structures in Lawrence
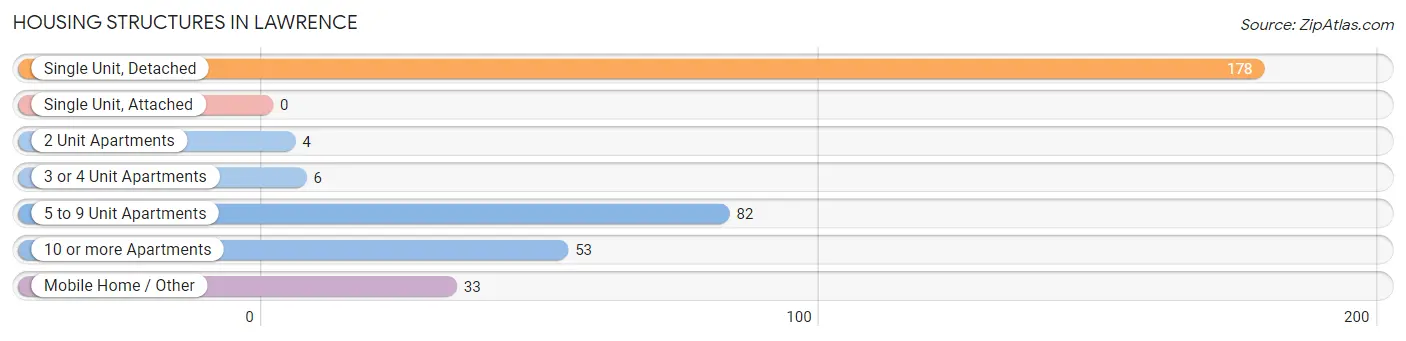
| Structure Type | # Housing Units | % Housing Units |
| Single Unit, Detached | 178 | 50.0% |
| Single Unit, Attached | 0 | 0.0% |
| 2 Unit Apartments | 4 | 1.1% |
| 3 or 4 Unit Apartments | 6 | 1.7% |
| 5 to 9 Unit Apartments | 82 | 23.0% |
| 10 or more Apartments | 53 | 14.9% |
| Mobile Home / Other | 33 | 9.3% |
| Total | 356 | 100.0% |
Housing Structures by Occupancy in Lawrence
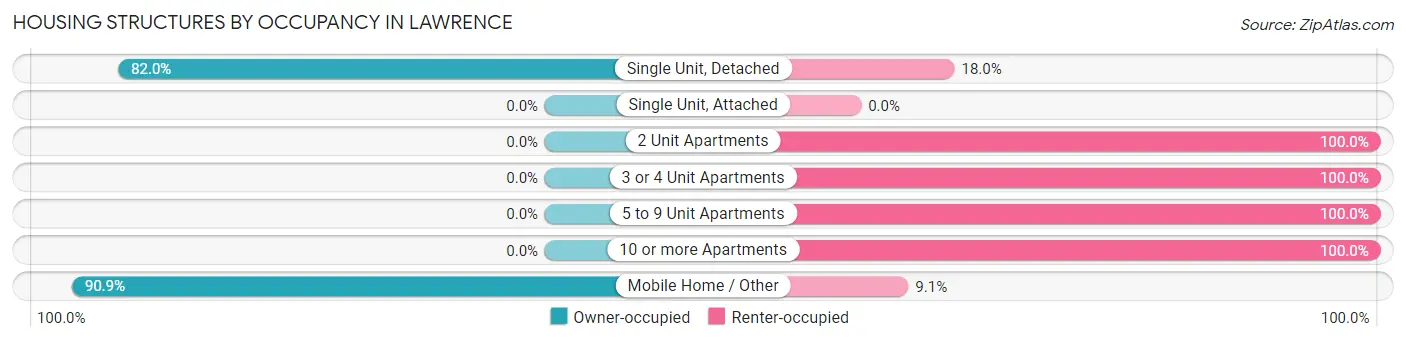
| Structure Type | Owner-occupied | Renter-occupied |
| Single Unit, Detached | 146 (82.0%) | 32 (18.0%) |
| Single Unit, Attached | 0 (0.0%) | 0 (0.0%) |
| 2 Unit Apartments | 0 (0.0%) | 4 (100.0%) |
| 3 or 4 Unit Apartments | 0 (0.0%) | 6 (100.0%) |
| 5 to 9 Unit Apartments | 0 (0.0%) | 82 (100.0%) |
| 10 or more Apartments | 0 (0.0%) | 53 (100.0%) |
| Mobile Home / Other | 30 (90.9%) | 3 (9.1%) |
| Total | 176 (49.4%) | 180 (50.6%) |
Housing Structures by Number of Rooms in Lawrence
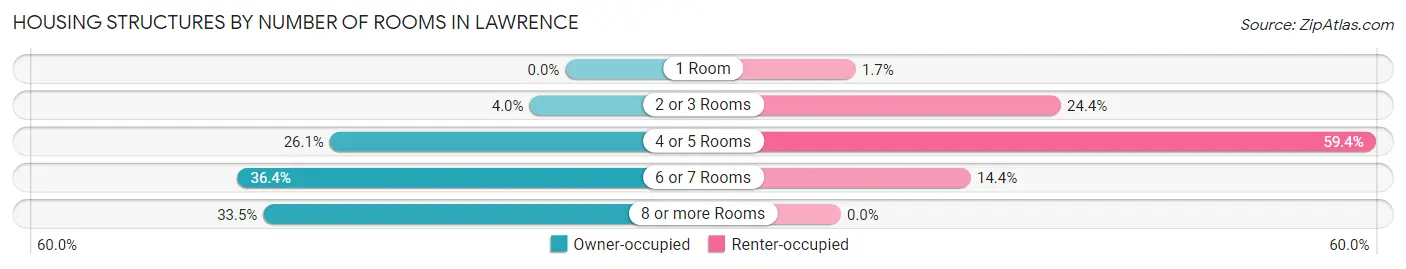
| Number of Rooms | Owner-occupied | Renter-occupied |
| 1 Room | 0 (0.0%) | 3 (1.7%) |
| 2 or 3 Rooms | 7 (4.0%) | 44 (24.4%) |
| 4 or 5 Rooms | 46 (26.1%) | 107 (59.4%) |
| 6 or 7 Rooms | 64 (36.4%) | 26 (14.4%) |
| 8 or more Rooms | 59 (33.5%) | 0 (0.0%) |
| Total | 176 (100.0%) | 180 (100.0%) |
Housing Structure by Heating Type in Lawrence
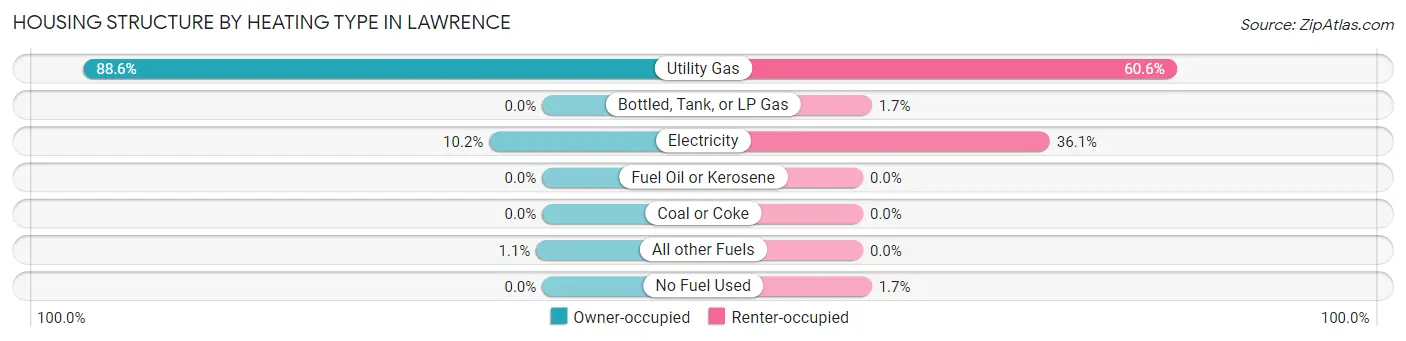
| Heating Type | Owner-occupied | Renter-occupied |
| Utility Gas | 156 (88.6%) | 109 (60.6%) |
| Bottled, Tank, or LP Gas | 0 (0.0%) | 3 (1.7%) |
| Electricity | 18 (10.2%) | 65 (36.1%) |
| Fuel Oil or Kerosene | 0 (0.0%) | 0 (0.0%) |
| Coal or Coke | 0 (0.0%) | 0 (0.0%) |
| All other Fuels | 2 (1.1%) | 0 (0.0%) |
| No Fuel Used | 0 (0.0%) | 3 (1.7%) |
| Total | 176 (100.0%) | 180 (100.0%) |
Household Vehicle Usage in Lawrence
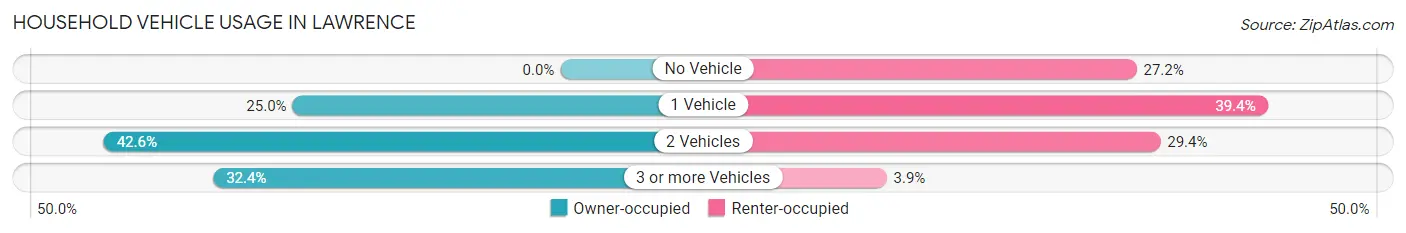
| Vehicles per Household | Owner-occupied | Renter-occupied |
| No Vehicle | 0 (0.0%) | 49 (27.2%) |
| 1 Vehicle | 44 (25.0%) | 71 (39.4%) |
| 2 Vehicles | 75 (42.6%) | 53 (29.4%) |
| 3 or more Vehicles | 57 (32.4%) | 7 (3.9%) |
| Total | 176 (100.0%) | 180 (100.0%) |
Real Estate & Mortgages in Lawrence
Real Estate and Mortgage Overview in Lawrence
| Characteristic | Without Mortgage | With Mortgage |
| Housing Units | 75 | 101 |
| Median Property Value | $68,800 | $117,300 |
| Median Household Income | $43,750 | $10 |
| Monthly Housing Costs | $526 | $0 |
| Real Estate Taxes | $1,396 | $2 |
Property Value by Mortgage Status in Lawrence
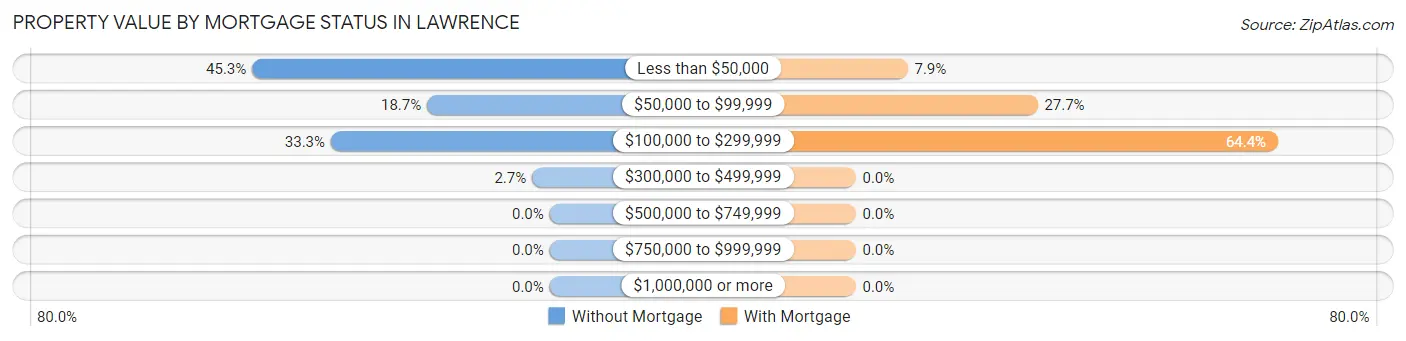
| Property Value | Without Mortgage | With Mortgage |
| Less than $50,000 | 34 (45.3%) | 8 (7.9%) |
| $50,000 to $99,999 | 14 (18.7%) | 28 (27.7%) |
| $100,000 to $299,999 | 25 (33.3%) | 65 (64.4%) |
| $300,000 to $499,999 | 2 (2.7%) | 0 (0.0%) |
| $500,000 to $749,999 | 0 (0.0%) | 0 (0.0%) |
| $750,000 to $999,999 | 0 (0.0%) | 0 (0.0%) |
| $1,000,000 or more | 0 (0.0%) | 0 (0.0%) |
| Total | 75 (100.0%) | 101 (100.0%) |
Household Income by Mortgage Status in Lawrence
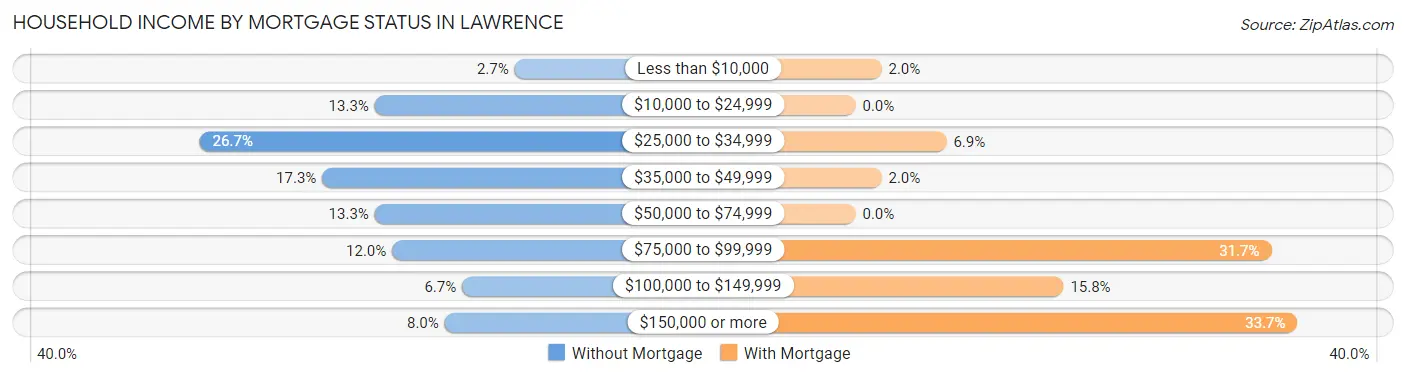
| Household Income | Without Mortgage | With Mortgage |
| Less than $10,000 | 2 (2.7%) | 2 (2.0%) |
| $10,000 to $24,999 | 10 (13.3%) | 0 (0.0%) |
| $25,000 to $34,999 | 20 (26.7%) | 7 (6.9%) |
| $35,000 to $49,999 | 13 (17.3%) | 2 (2.0%) |
| $50,000 to $74,999 | 10 (13.3%) | 0 (0.0%) |
| $75,000 to $99,999 | 9 (12.0%) | 32 (31.7%) |
| $100,000 to $149,999 | 5 (6.7%) | 16 (15.8%) |
| $150,000 or more | 6 (8.0%) | 34 (33.7%) |
| Total | 75 (100.0%) | 101 (100.0%) |
Property Value to Household Income Ratio in Lawrence
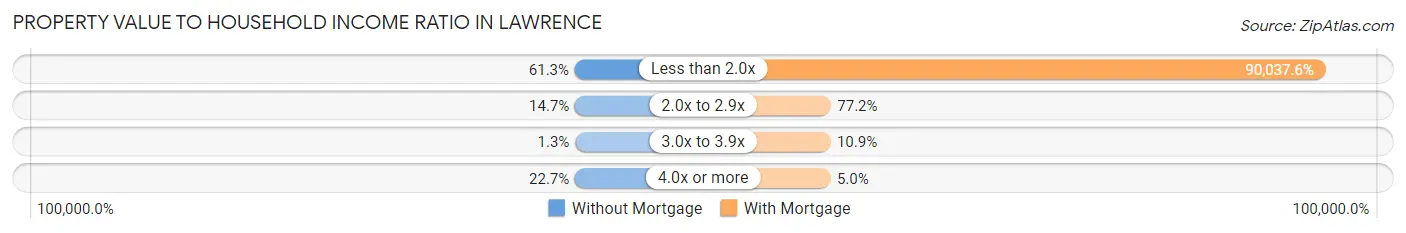
| Value-to-Income Ratio | Without Mortgage | With Mortgage |
| Less than 2.0x | 46 (61.3%) | 90,938 (90,037.6%) |
| 2.0x to 2.9x | 11 (14.7%) | 78 (77.2%) |
| 3.0x to 3.9x | 1 (1.3%) | 11 (10.9%) |
| 4.0x or more | 17 (22.7%) | 5 (5.0%) |
| Total | 75 (100.0%) | 101 (100.0%) |
Real Estate Taxes by Mortgage Status in Lawrence
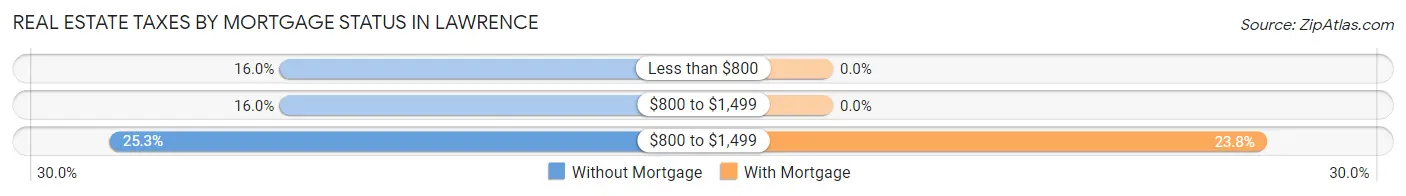
| Property Taxes | Without Mortgage | With Mortgage |
| Less than $800 | 12 (16.0%) | 0 (0.0%) |
| $800 to $1,499 | 12 (16.0%) | 0 (0.0%) |
| $800 to $1,499 | 19 (25.3%) | 24 (23.8%) |
| Total | 75 (100.0%) | 101 (100.0%) |
Health & Disability in Lawrence
Health Insurance Coverage by Age in Lawrence
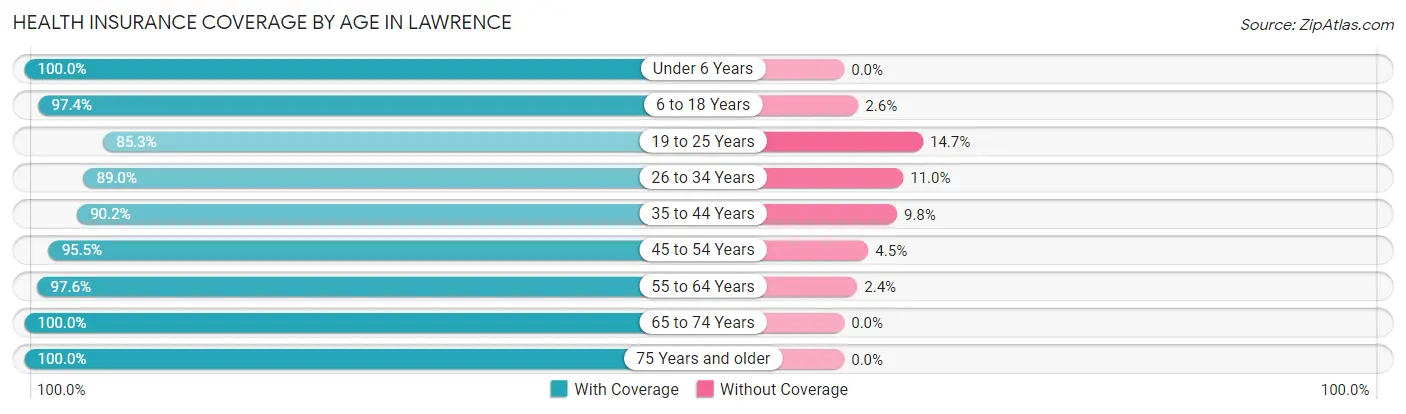
| Age Bracket | With Coverage | Without Coverage |
| Under 6 Years | 57 (100.0%) | 0 (0.0%) |
| 6 to 18 Years | 222 (97.4%) | 6 (2.6%) |
| 19 to 25 Years | 93 (85.3%) | 16 (14.7%) |
| 26 to 34 Years | 97 (89.0%) | 12 (11.0%) |
| 35 to 44 Years | 101 (90.2%) | 11 (9.8%) |
| 45 to 54 Years | 106 (95.5%) | 5 (4.5%) |
| 55 to 64 Years | 160 (97.6%) | 4 (2.4%) |
| 65 to 74 Years | 83 (100.0%) | 0 (0.0%) |
| 75 Years and older | 34 (100.0%) | 0 (0.0%) |
| Total | 953 (94.6%) | 54 (5.4%) |
Health Insurance Coverage by Citizenship Status in Lawrence
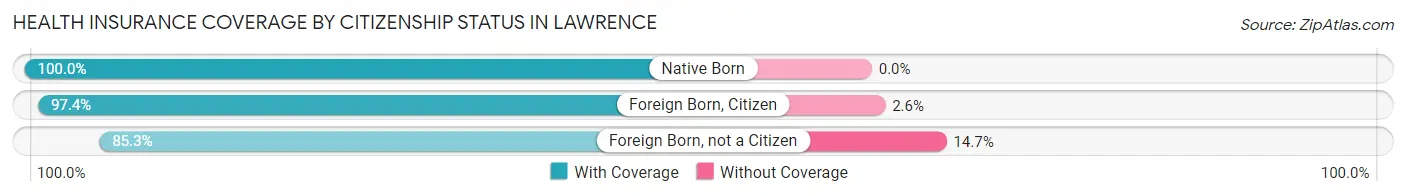
| Citizenship Status | With Coverage | Without Coverage |
| Native Born | 57 (100.0%) | 0 (0.0%) |
| Foreign Born, Citizen | 222 (97.4%) | 6 (2.6%) |
| Foreign Born, not a Citizen | 93 (85.3%) | 16 (14.7%) |
Health Insurance Coverage by Household Income in Lawrence
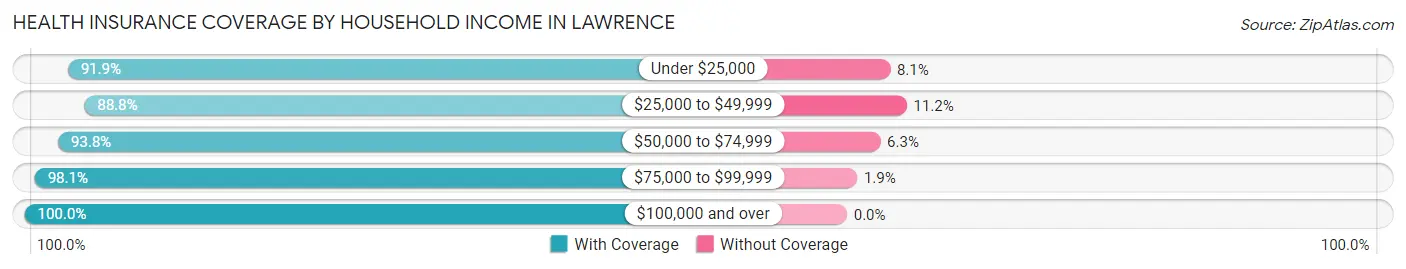
| Household Income | With Coverage | Without Coverage |
| Under $25,000 | 250 (91.9%) | 22 (8.1%) |
| $25,000 to $49,999 | 119 (88.8%) | 15 (11.2%) |
| $50,000 to $74,999 | 195 (93.8%) | 13 (6.2%) |
| $75,000 to $99,999 | 206 (98.1%) | 4 (1.9%) |
| $100,000 and over | 172 (100.0%) | 0 (0.0%) |
Public vs Private Health Insurance Coverage by Age in Lawrence
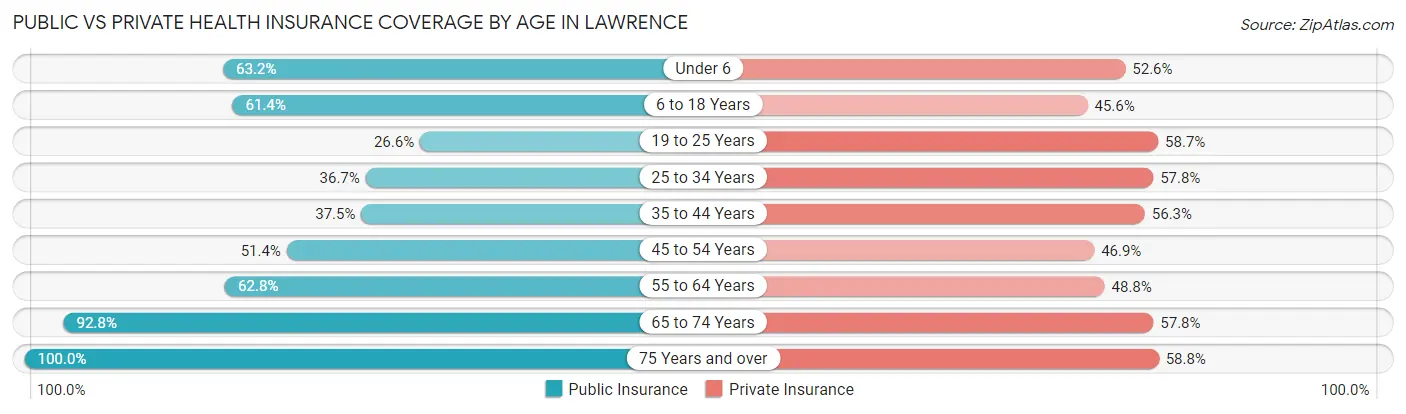
| Age Bracket | Public Insurance | Private Insurance |
| Under 6 | 36 (63.2%) | 30 (52.6%) |
| 6 to 18 Years | 140 (61.4%) | 104 (45.6%) |
| 19 to 25 Years | 29 (26.6%) | 64 (58.7%) |
| 25 to 34 Years | 40 (36.7%) | 63 (57.8%) |
| 35 to 44 Years | 42 (37.5%) | 63 (56.2%) |
| 45 to 54 Years | 57 (51.3%) | 52 (46.9%) |
| 55 to 64 Years | 103 (62.8%) | 80 (48.8%) |
| 65 to 74 Years | 77 (92.8%) | 48 (57.8%) |
| 75 Years and over | 34 (100.0%) | 20 (58.8%) |
| Total | 558 (55.4%) | 524 (52.0%) |
Disability Status by Sex by Age in Lawrence
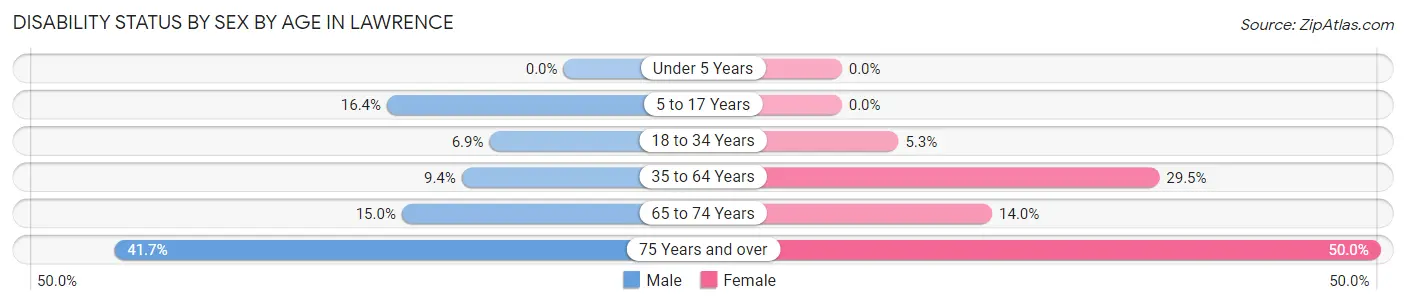
| Age Bracket | Male | Female |
| Under 5 Years | 0 (0.0%) | 0 (0.0%) |
| 5 to 17 Years | 19 (16.4%) | 0 (0.0%) |
| 18 to 34 Years | 9 (6.9%) | 5 (5.3%) |
| 35 to 64 Years | 17 (9.4%) | 61 (29.5%) |
| 65 to 74 Years | 6 (15.0%) | 6 (14.0%) |
| 75 Years and over | 5 (41.7%) | 11 (50.0%) |
Disability Class by Sex by Age in Lawrence
Disability Class: Hearing Difficulty
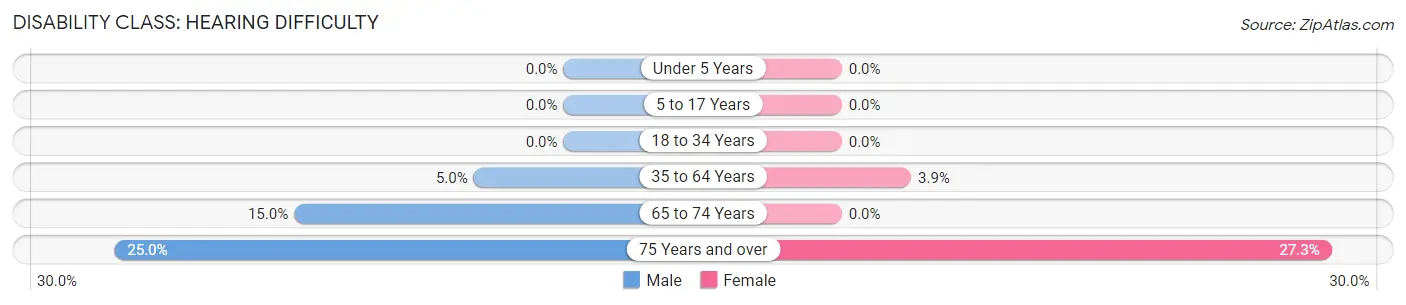
| Age Bracket | Male | Female |
| Under 5 Years | 0 (0.0%) | 0 (0.0%) |
| 5 to 17 Years | 0 (0.0%) | 0 (0.0%) |
| 18 to 34 Years | 0 (0.0%) | 0 (0.0%) |
| 35 to 64 Years | 9 (5.0%) | 8 (3.9%) |
| 65 to 74 Years | 6 (15.0%) | 0 (0.0%) |
| 75 Years and over | 3 (25.0%) | 6 (27.3%) |
Disability Class: Vision Difficulty
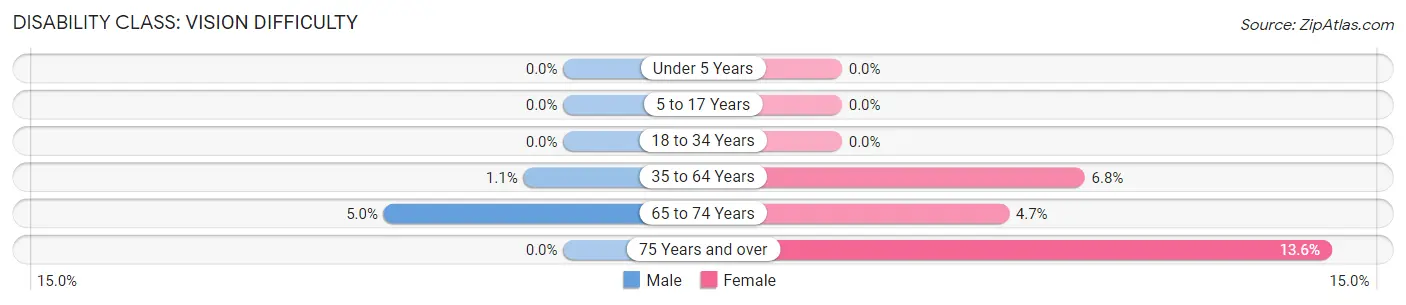
| Age Bracket | Male | Female |
| Under 5 Years | 0 (0.0%) | 0 (0.0%) |
| 5 to 17 Years | 0 (0.0%) | 0 (0.0%) |
| 18 to 34 Years | 0 (0.0%) | 0 (0.0%) |
| 35 to 64 Years | 2 (1.1%) | 14 (6.8%) |
| 65 to 74 Years | 2 (5.0%) | 2 (4.6%) |
| 75 Years and over | 0 (0.0%) | 3 (13.6%) |
Disability Class: Cognitive Difficulty
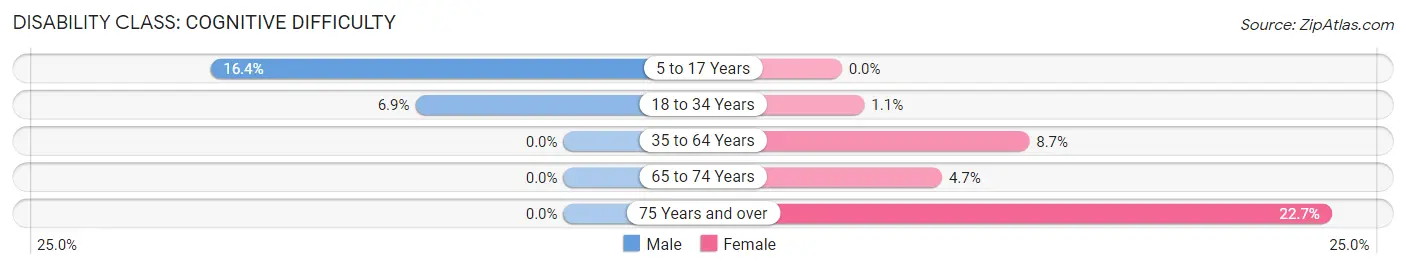
| Age Bracket | Male | Female |
| 5 to 17 Years | 19 (16.4%) | 0 (0.0%) |
| 18 to 34 Years | 9 (6.9%) | 1 (1.1%) |
| 35 to 64 Years | 0 (0.0%) | 18 (8.7%) |
| 65 to 74 Years | 0 (0.0%) | 2 (4.6%) |
| 75 Years and over | 0 (0.0%) | 5 (22.7%) |
Disability Class: Ambulatory Difficulty
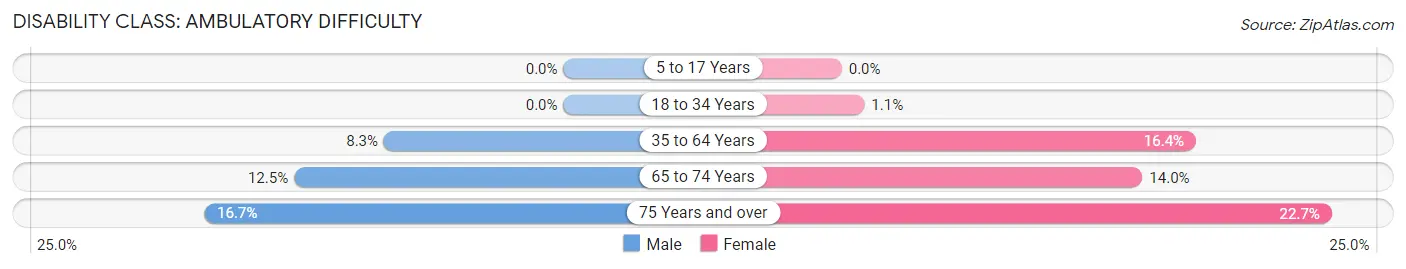
| Age Bracket | Male | Female |
| 5 to 17 Years | 0 (0.0%) | 0 (0.0%) |
| 18 to 34 Years | 0 (0.0%) | 1 (1.1%) |
| 35 to 64 Years | 15 (8.3%) | 34 (16.4%) |
| 65 to 74 Years | 5 (12.5%) | 6 (14.0%) |
| 75 Years and over | 2 (16.7%) | 5 (22.7%) |
Disability Class: Self-Care Difficulty
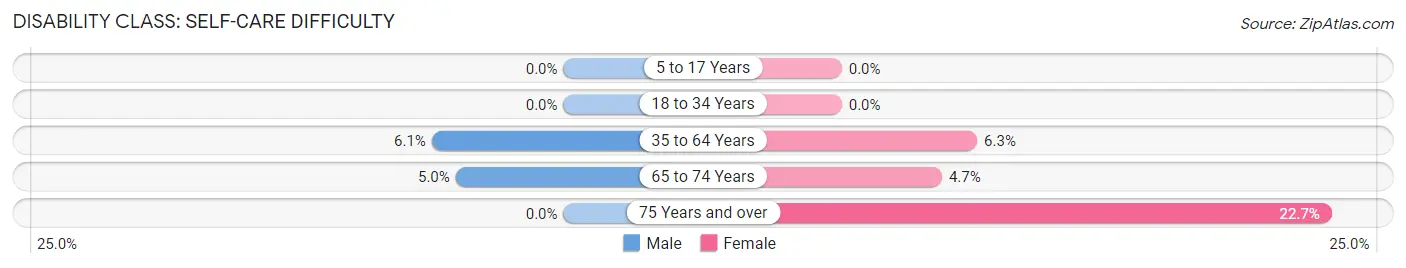
| Age Bracket | Male | Female |
| 5 to 17 Years | 0 (0.0%) | 0 (0.0%) |
| 18 to 34 Years | 0 (0.0%) | 0 (0.0%) |
| 35 to 64 Years | 11 (6.1%) | 13 (6.3%) |
| 65 to 74 Years | 2 (5.0%) | 2 (4.6%) |
| 75 Years and over | 0 (0.0%) | 5 (22.7%) |
Technology Access in Lawrence
Computing Device Access in Lawrence
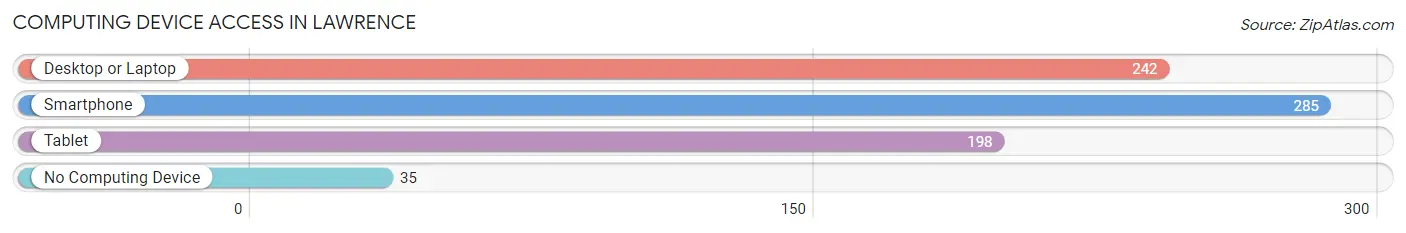
| Device Type | # Households | % Households |
| Desktop or Laptop | 242 | 68.0% |
| Smartphone | 285 | 80.1% |
| Tablet | 198 | 55.6% |
| No Computing Device | 35 | 9.8% |
| Total | 356 | 100.0% |
Internet Access in Lawrence
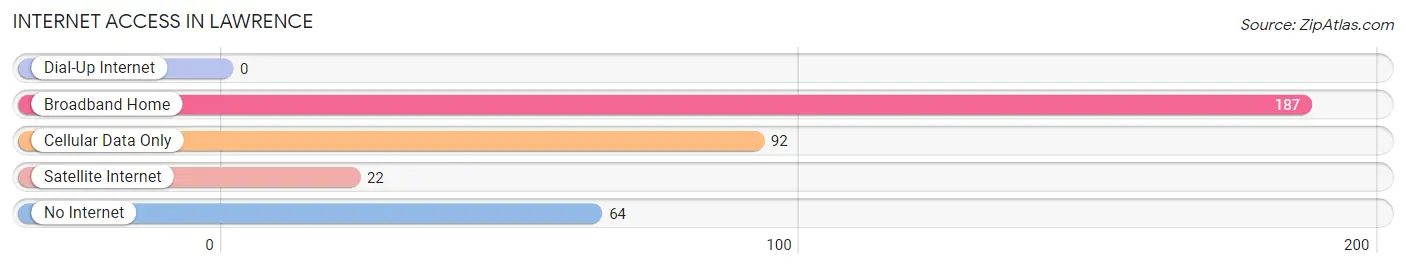
| Internet Type | # Households | % Households |
| Dial-Up Internet | 0 | 0.0% |
| Broadband Home | 187 | 52.5% |
| Cellular Data Only | 92 | 25.8% |
| Satellite Internet | 22 | 6.2% |
| No Internet | 64 | 18.0% |
| Total | 356 | 100.0% |
Lawrence Summary
Lawrence is a small city located in the state of Michigan in the United States. It is located in the southwestern corner of the state, just north of the Indiana border. The city is part of the Kalamazoo-Portage Metropolitan Statistical Area and is home to a population of just over 4,000 people.
History
The area that is now Lawrence was first settled in the early 1800s by settlers from New York. The first settler was a man named John Lawrence, who arrived in 1831 and established a trading post. The area was known as Lawrenceville until 1836 when it was officially incorporated as the village of Lawrence.
In 1837, the village was renamed to Lawrenceburg and in 1838 it was incorporated as a city. The city was named after John Lawrence, the first settler.
In the late 1800s, Lawrence was a thriving industrial center. It was home to several factories, including a paper mill, a sawmill, a grist mill, and a woolen mill. The city also had a large number of stores and businesses.
In the early 1900s, the city began to decline as the factories closed and the population decreased. The city was hit hard by the Great Depression and World War II. After the war, the city began to slowly recover and the population began to grow again.
Geography
Lawrence is located in the southwestern corner of Michigan, just north of the Indiana border. The city is situated on the banks of the St. Joseph River and is surrounded by rolling hills and farmland. The city has a total area of 2.3 square miles, all of which is land.
The climate in Lawrence is classified as humid continental, with hot summers and cold winters. The average temperature in the summer is around 75 degrees Fahrenheit and the average temperature in the winter is around 25 degrees Fahrenheit.
Economy
The economy of Lawrence is largely based on agriculture and manufacturing. The city is home to several factories, including a paper mill, a sawmill, a grist mill, and a woolen mill. The city also has a number of stores and businesses.
The city is also home to a number of educational institutions, including Lawrence High School, Lawrence Middle School, and Lawrence Elementary School.
Demographics
As of the 2010 census, the population of Lawrence was 4,039. The racial makeup of the city was 94.3% White, 1.2% African American, 0.3% Native American, 0.7% Asian, 0.1% Pacific Islander, 1.2% from other races, and 2.3% from two or more races. Hispanic or Latino of any race were 3.2% of the population.
The median income for a household in the city was $37,917 and the median income for a family was $45,938. The per capita income for the city was $18,945. About 11.2% of families and 14.2% of the population were below the poverty line, including 19.2% of those under age 18 and 8.2% of those age 65 or over.
Conclusion
Lawrence is a small city located in the southwestern corner of Michigan. It is home to a population of just over 4,000 people and is part of the Kalamazoo-Portage Metropolitan Statistical Area. The city has a long history, dating back to the early 1800s when it was first settled by settlers from New York. The economy of Lawrence is largely based on agriculture and manufacturing, and the city is home to several factories, stores, and businesses. The population of Lawrence is largely white, with a small percentage of African Americans, Native Americans, Asians, and other races. The median income for a household in the city is $37,917 and the per capita income is $18,945.
Common Questions
What is Per Capita Income in Lawrence?
Per Capita income in Lawrence is $21,534.
What is the Median Family Income in Lawrence?
Median Family Income in Lawrence is $68,295.
What is the Median Household income in Lawrence?
Median Household Income in Lawrence is $41,250.
What is Income or Wage Gap in Lawrence?
Income or Wage Gap in Lawrence is 32.2%.
Women in Lawrence earn 67.8 cents for every dollar earned by a man.
What is Family Income Deficit in Lawrence?
Family Income Deficit in Lawrence is $14,109.
Families that are below poverty line in Lawrence earn $14,109 less on average than the poverty threshold level.
What is Inequality or Gini Index in Lawrence?
Inequality or Gini Index in Lawrence is 0.47.
What is the Total Population of Lawrence?
Total Population of Lawrence is 1,007.
What is the Total Male Population of Lawrence?
Total Male Population of Lawrence is 499.
What is the Total Female Population of Lawrence?
Total Female Population of Lawrence is 508.
What is the Ratio of Males per 100 Females in Lawrence?
There are 98.23 Males per 100 Females in Lawrence.
What is the Ratio of Females per 100 Males in Lawrence?
There are 101.80 Females per 100 Males in Lawrence.
What is the Median Population Age in Lawrence?
Median Population Age in Lawrence is 35.1 Years.
What is the Average Family Size in Lawrence
Average Family Size in Lawrence is 3.3 People.
What is the Average Household Size in Lawrence
Average Household Size in Lawrence is 2.8 People.
How Large is the Labor Force in Lawrence?
There are 464 People in the Labor Forcein in Lawrence.
What is the Percentage of People in the Labor Force in Lawrence?
61.7% of People are in the Labor Force in Lawrence.
What is the Unemployment Rate in Lawrence?
Unemployment Rate in Lawrence is 8.4%.