Eastlake, MI Map & Demographics
Eastlake Map
Eastlake Overview
$33,147
PER CAPITA INCOME
$59,375
AVG FAMILY INCOME
$51,389
AVG HOUSEHOLD INCOME
8.2%
WAGE / INCOME GAP [ % ]
91.8¢/ $1
WAGE / INCOME GAP [ $ ]
0.42
INEQUALITY / GINI INDEX
281
TOTAL POPULATION
142
MALE POPULATION
139
FEMALE POPULATION
102.16
MALES / 100 FEMALES
97.89
FEMALES / 100 MALES
54.9
MEDIAN AGE
2.7
AVG FAMILY SIZE
2.1
AVG HOUSEHOLD SIZE
129
LABOR FORCE [ PEOPLE ]
49.0%
PERCENT IN LABOR FORCE
2.3%
UNEMPLOYMENT RATE
Eastlake Zip Codes
Eastlake Area Codes
Income in Eastlake
Income Overview in Eastlake
Per Capita Income in Eastlake is $33,147, while median incomes of families and households are $59,375 and $51,389 respectively.
| Characteristic | Number | Measure |
| Per Capita Income | 281 | $33,147 |
| Median Family Income | 81 | $59,375 |
| Mean Family Income | 81 | $69,240 |
| Median Household Income | 132 | $51,389 |
| Mean Household Income | 132 | $68,571 |
| Income Deficit | 81 | $0 |
| Wage / Income Gap (%) | 281 | 8.20% |
| Wage / Income Gap ($) | 281 | 91.80¢ per $1 |
| Gini / Inequality Index | 281 | 0.42 |
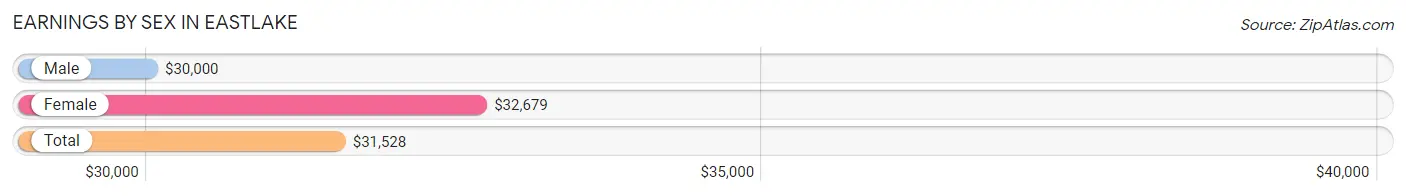
Earnings by Sex in Eastlake
Average Earnings in Eastlake are $31,528, $30,000 for men and $32,679 for women, a difference of 8.2%.
| Sex | Number | Average Earnings |
| Male | 78 (54.5%) | $30,000 |
| Female | 65 (45.5%) | $32,679 |
| Total | 143 (100.0%) | $31,528 |
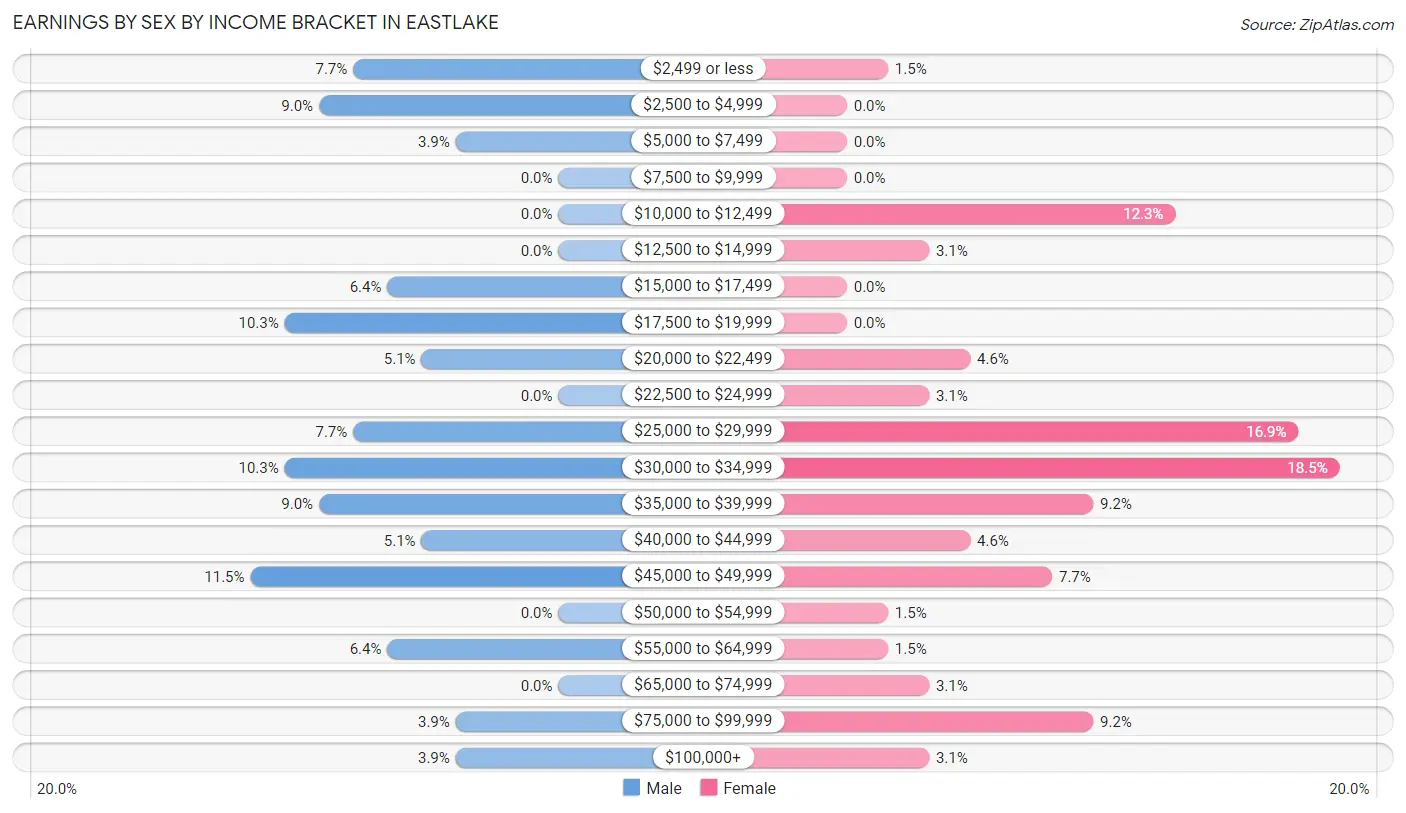
Earnings by Sex by Income Bracket in Eastlake
The most common earnings brackets in Eastlake are $45,000 to $49,999 for men (9 | 11.5%) and $30,000 to $34,999 for women (12 | 18.5%).
| Income | Male | Female |
| $2,499 or less | 6 (7.7%) | 1 (1.5%) |
| $2,500 to $4,999 | 7 (9.0%) | 0 (0.0%) |
| $5,000 to $7,499 | 3 (3.8%) | 0 (0.0%) |
| $7,500 to $9,999 | 0 (0.0%) | 0 (0.0%) |
| $10,000 to $12,499 | 0 (0.0%) | 8 (12.3%) |
| $12,500 to $14,999 | 0 (0.0%) | 2 (3.1%) |
| $15,000 to $17,499 | 5 (6.4%) | 0 (0.0%) |
| $17,500 to $19,999 | 8 (10.3%) | 0 (0.0%) |
| $20,000 to $22,499 | 4 (5.1%) | 3 (4.6%) |
| $22,500 to $24,999 | 0 (0.0%) | 2 (3.1%) |
| $25,000 to $29,999 | 6 (7.7%) | 11 (16.9%) |
| $30,000 to $34,999 | 8 (10.3%) | 12 (18.5%) |
| $35,000 to $39,999 | 7 (9.0%) | 6 (9.2%) |
| $40,000 to $44,999 | 4 (5.1%) | 3 (4.6%) |
| $45,000 to $49,999 | 9 (11.5%) | 5 (7.7%) |
| $50,000 to $54,999 | 0 (0.0%) | 1 (1.5%) |
| $55,000 to $64,999 | 5 (6.4%) | 1 (1.5%) |
| $65,000 to $74,999 | 0 (0.0%) | 2 (3.1%) |
| $75,000 to $99,999 | 3 (3.8%) | 6 (9.2%) |
| $100,000+ | 3 (3.8%) | 2 (3.1%) |
| Total | 78 (100.0%) | 65 (100.0%) |
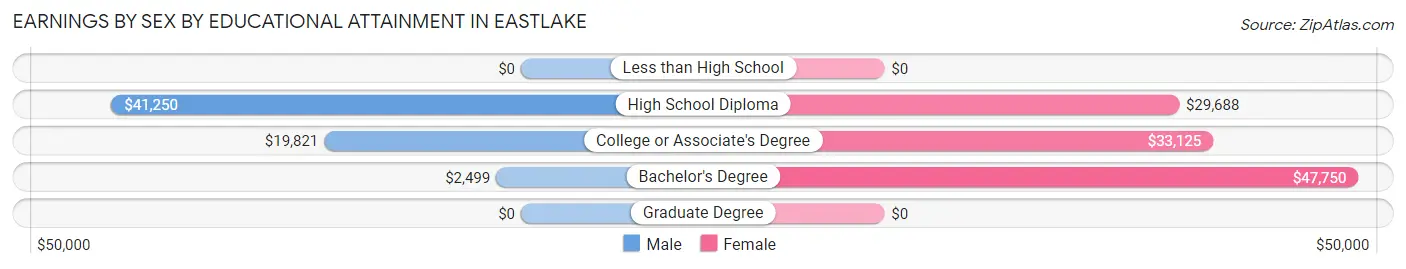
Earnings by Sex by Educational Attainment in Eastlake
Average earnings in Eastlake are $30,938 for men and $33,929 for women, a difference of 8.8%. Men with an educational attainment of high school diploma enjoy the highest average annual earnings of $41,250, while those with bachelor's degree education earn the least with $2,499. Women with an educational attainment of bachelor's degree earn the most with the average annual earnings of $47,750, while those with high school diploma education have the smallest earnings of $29,688.
| Educational Attainment | Male Income | Female Income |
| Less than High School | - | - |
| High School Diploma | $41,250 | $29,688 |
| College or Associate's Degree | $19,821 | $33,125 |
| Bachelor's Degree | $2,499 | $47,750 |
| Graduate Degree | - | - |
| Total | $30,938 | $33,929 |
Family Income in Eastlake
Family Income Brackets in Eastlake
According to the Eastlake family income data, there are 24 families falling into the $50,000 to $74,999 income range, which is the most common income bracket and makes up 29.6% of all families.
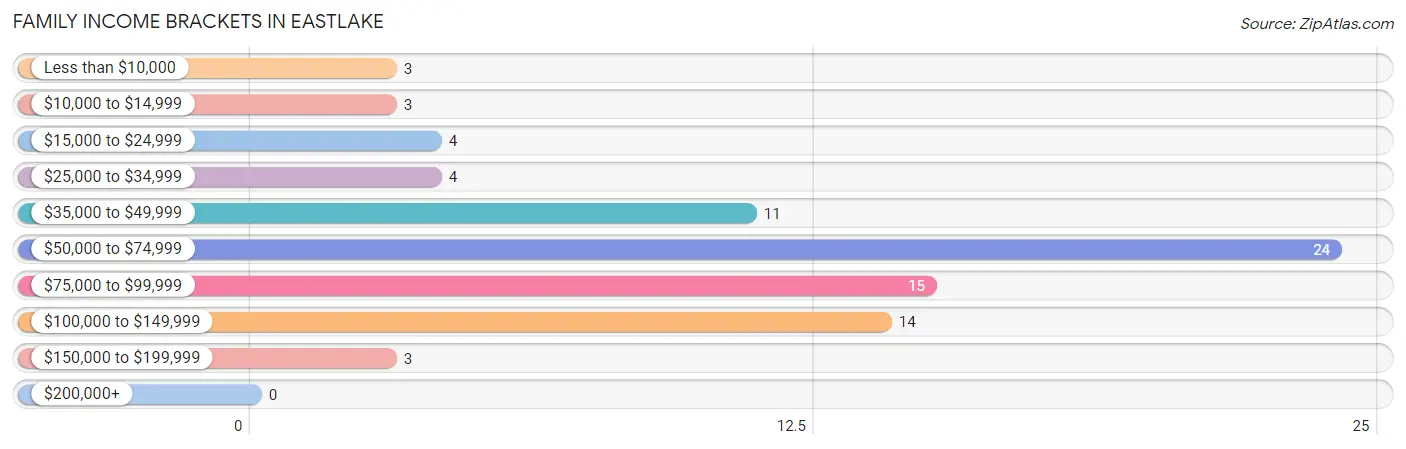
| Income Bracket | # Families | % Families |
| Less than $10,000 | 3 | 3.7% |
| $10,000 to $14,999 | 3 | 3.7% |
| $15,000 to $24,999 | 4 | 4.9% |
| $25,000 to $34,999 | 4 | 4.9% |
| $35,000 to $49,999 | 11 | 13.6% |
| $50,000 to $74,999 | 24 | 29.6% |
| $75,000 to $99,999 | 15 | 18.5% |
| $100,000 to $149,999 | 14 | 17.3% |
| $150,000 to $199,999 | 3 | 3.7% |
| $200,000+ | 0 | 0.0% |
Family Income by Famaliy Size in Eastlake
4-person families (5 | 6.2%) account for the highest median family income in Eastlake with $98,750 per family, while 3-person families (18 | 22.2%) have the highest median income of $30,000 per family member.
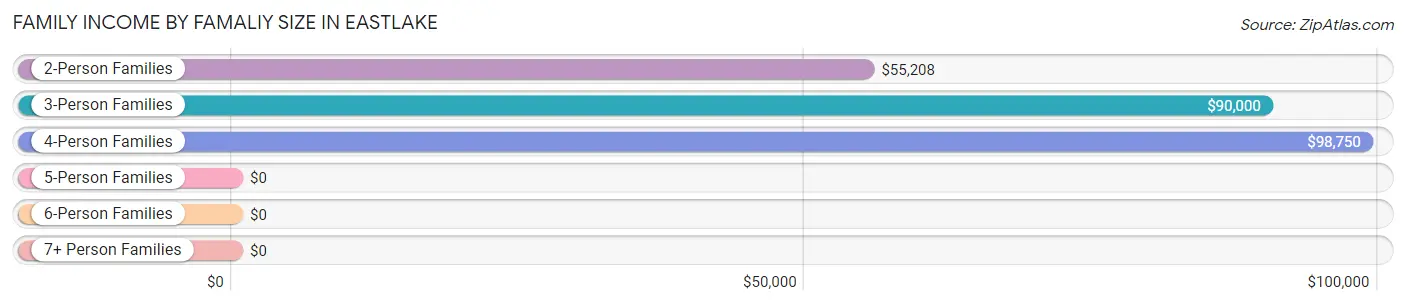
| Income Bracket | # Families | Median Income |
| 2-Person Families | 55 (67.9%) | $55,208 |
| 3-Person Families | 18 (22.2%) | $90,000 |
| 4-Person Families | 5 (6.2%) | $98,750 |
| 5-Person Families | 3 (3.7%) | $0 |
| 6-Person Families | 0 (0.0%) | $0 |
| 7+ Person Families | 0 (0.0%) | $0 |
| Total | 81 (100.0%) | $59,375 |
Family Income by Number of Earners in Eastlake
The median family income in Eastlake is $59,375, with families comprising 2 earners (22) having the highest median family income of $90,625, while families with 1 earner (33) have the lowest median family income of $49,844, accounting for 27.2% and 40.7% of families, respectively.
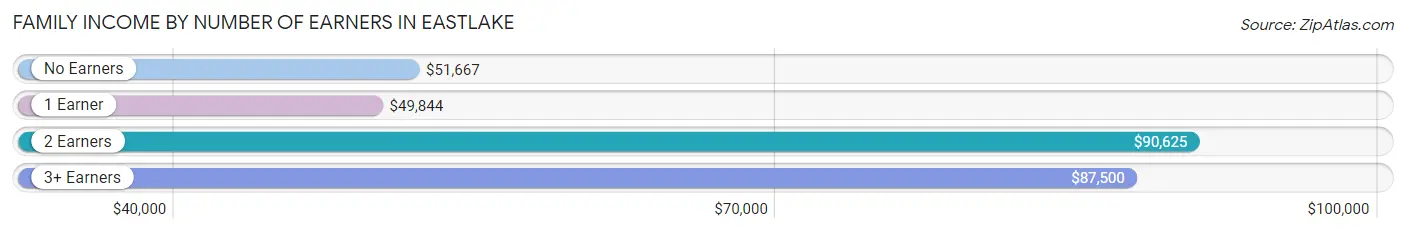
| Number of Earners | # Families | Median Income |
| No Earners | 18 (22.2%) | $51,667 |
| 1 Earner | 33 (40.7%) | $49,844 |
| 2 Earners | 22 (27.2%) | $90,625 |
| 3+ Earners | 8 (9.9%) | $87,500 |
| Total | 81 (100.0%) | $59,375 |
Household Income in Eastlake
Household Income Brackets in Eastlake
With 32 households falling in the category, the $50,000 to $74,999 income range is the most frequent in Eastlake, accounting for 24.2% of all households. In contrast, only 3 households (2.3%) fall into the $10,000 to $14,999 income bracket, making it the least populous group.
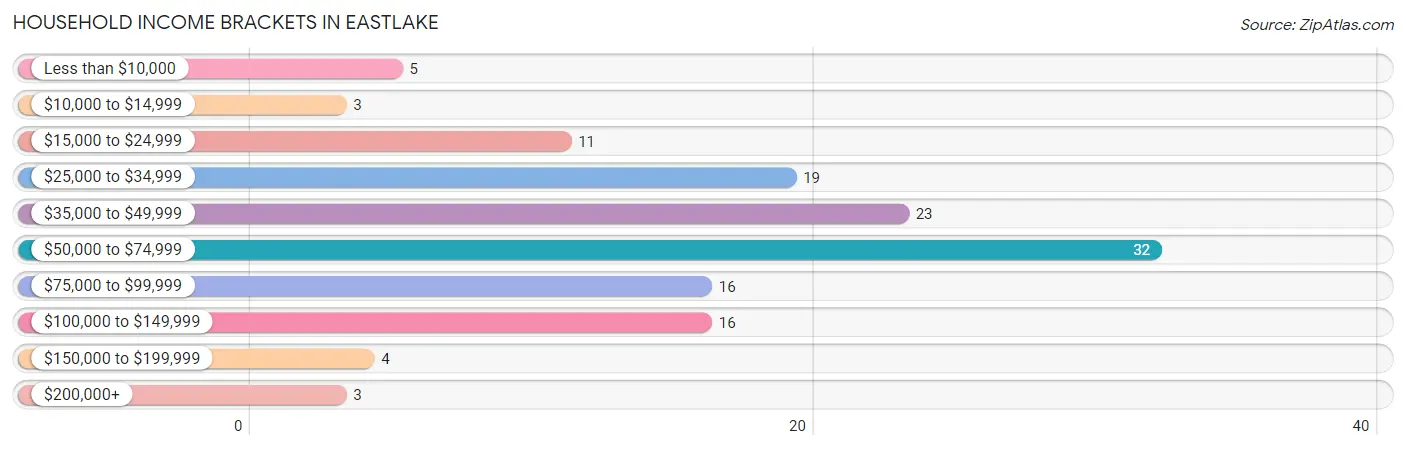
| Income Bracket | # Households | % Households |
| Less than $10,000 | 5 | 3.8% |
| $10,000 to $14,999 | 3 | 2.3% |
| $15,000 to $24,999 | 11 | 8.3% |
| $25,000 to $34,999 | 19 | 14.4% |
| $35,000 to $49,999 | 23 | 17.4% |
| $50,000 to $74,999 | 32 | 24.2% |
| $75,000 to $99,999 | 16 | 12.1% |
| $100,000 to $149,999 | 16 | 12.1% |
| $150,000 to $199,999 | 4 | 3.0% |
| $200,000+ | 3 | 2.3% |
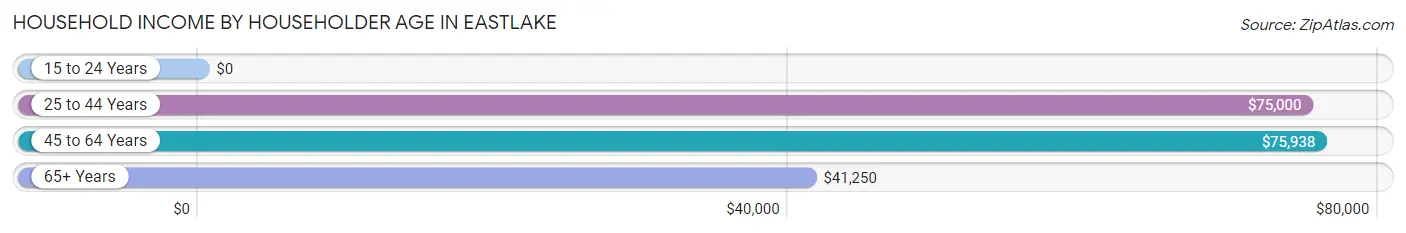
Household Income by Householder Age in Eastlake
The median household income in Eastlake is $51,389, with the highest median household income of $75,938 found in the 45 to 64 years age bracket for the primary householder. A total of 47 households (35.6%) fall into this category. Meanwhile, the 15 to 24 years age bracket for the primary householder has the lowest median household income of $0, with 1 households (0.8%) in this group.
| Income Bracket | # Households | Median Income |
| 15 to 24 Years | 1 (0.8%) | $0 |
| 25 to 44 Years | 14 (10.6%) | $75,000 |
| 45 to 64 Years | 47 (35.6%) | $75,938 |
| 65+ Years | 70 (53.0%) | $41,250 |
| Total | 132 (100.0%) | $51,389 |
Poverty in Eastlake
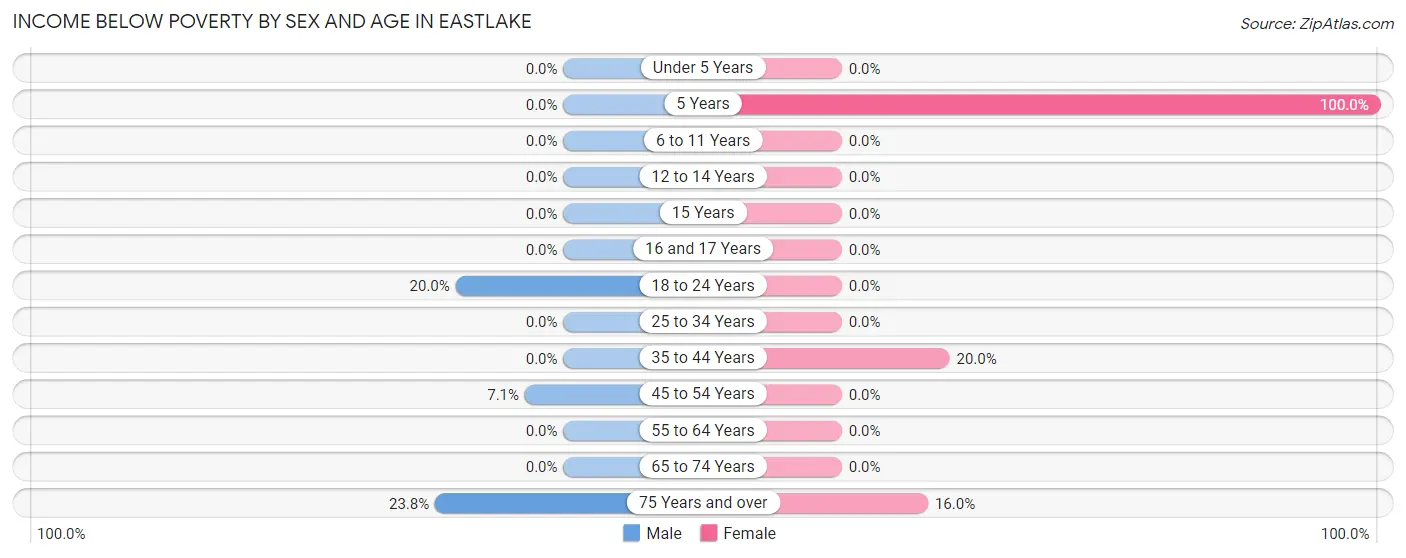
Income Below Poverty by Sex and Age in Eastlake
With 5.6% poverty level for males and 5.8% for females among the residents of Eastlake, 75 year old and over males and 5 year old females are the most vulnerable to poverty, with 5 males (23.8%) and 1 females (100.0%) in their respective age groups living below the poverty level.
| Age Bracket | Male | Female |
| Under 5 Years | 0 (0.0%) | 0 (0.0%) |
| 5 Years | 0 (0.0%) | 1 (100.0%) |
| 6 to 11 Years | 0 (0.0%) | 0 (0.0%) |
| 12 to 14 Years | 0 (0.0%) | 0 (0.0%) |
| 15 Years | 0 (0.0%) | 0 (0.0%) |
| 16 and 17 Years | 0 (0.0%) | 0 (0.0%) |
| 18 to 24 Years | 1 (20.0%) | 0 (0.0%) |
| 25 to 34 Years | 0 (0.0%) | 0 (0.0%) |
| 35 to 44 Years | 0 (0.0%) | 3 (20.0%) |
| 45 to 54 Years | 2 (7.1%) | 0 (0.0%) |
| 55 to 64 Years | 0 (0.0%) | 0 (0.0%) |
| 65 to 74 Years | 0 (0.0%) | 0 (0.0%) |
| 75 Years and over | 5 (23.8%) | 4 (16.0%) |
| Total | 8 (5.6%) | 8 (5.8%) |
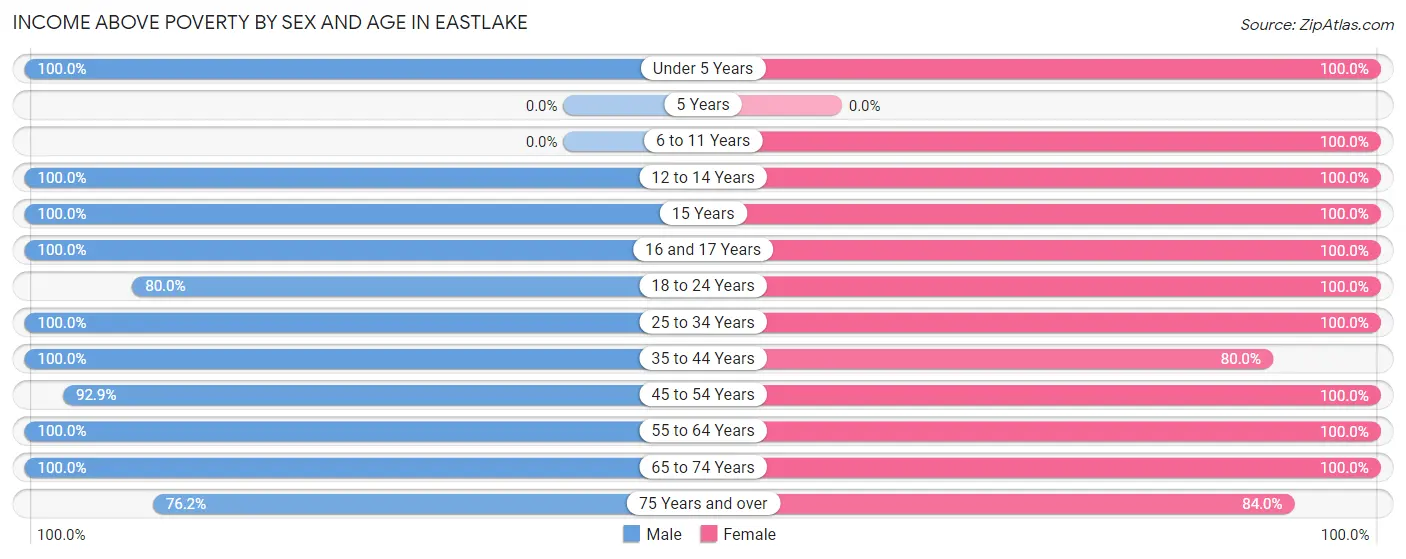
Income Above Poverty by Sex and Age in Eastlake
According to the poverty statistics in Eastlake, males aged under 5 years and females aged under 5 years are the age groups that are most secure financially, with 100.0% of males and 100.0% of females in these age groups living above the poverty line.
| Age Bracket | Male | Female |
| Under 5 Years | 4 (100.0%) | 3 (100.0%) |
| 5 Years | 0 (0.0%) | 0 (0.0%) |
| 6 to 11 Years | 0 (0.0%) | 3 (100.0%) |
| 12 to 14 Years | 2 (100.0%) | 1 (100.0%) |
| 15 Years | 3 (100.0%) | 1 (100.0%) |
| 16 and 17 Years | 3 (100.0%) | 2 (100.0%) |
| 18 to 24 Years | 4 (80.0%) | 7 (100.0%) |
| 25 to 34 Years | 23 (100.0%) | 13 (100.0%) |
| 35 to 44 Years | 9 (100.0%) | 12 (80.0%) |
| 45 to 54 Years | 26 (92.9%) | 18 (100.0%) |
| 55 to 64 Years | 13 (100.0%) | 28 (100.0%) |
| 65 to 74 Years | 31 (100.0%) | 22 (100.0%) |
| 75 Years and over | 16 (76.2%) | 21 (84.0%) |
| Total | 134 (94.4%) | 131 (94.2%) |
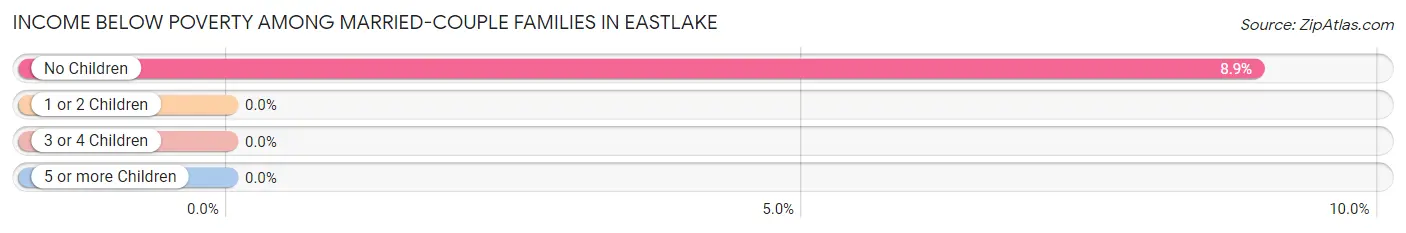
Income Below Poverty Among Married-Couple Families in Eastlake
The poverty statistics for married-couple families in Eastlake show that 7.9% or 5 of the total 63 families live below the poverty line. Families with no children have the highest poverty rate of 8.9%, comprising of 5 families. On the other hand, families with 1 or 2 children have the lowest poverty rate of 0.0%, which includes 0 families.
| Children | Above Poverty | Below Poverty |
| No Children | 51 (91.1%) | 5 (8.9%) |
| 1 or 2 Children | 7 (100.0%) | 0 (0.0%) |
| 3 or 4 Children | 0 (0.0%) | 0 (0.0%) |
| 5 or more Children | 0 (0.0%) | 0 (0.0%) |
| Total | 58 (92.1%) | 5 (7.9%) |
Income Below Poverty Among Single-Parent Households in Eastlake
According to the poverty data in Eastlake, 66.7% or 2 single-father households and 6.7% or 1 single-mother households are living below the poverty line. Among single-father households, those with 1 or 2 children have the highest poverty rate, with 2 households (100.0%) experiencing poverty. Likewise, among single-mother households, those with no children have the highest poverty rate, with 1 households (11.1%) falling below the poverty line.
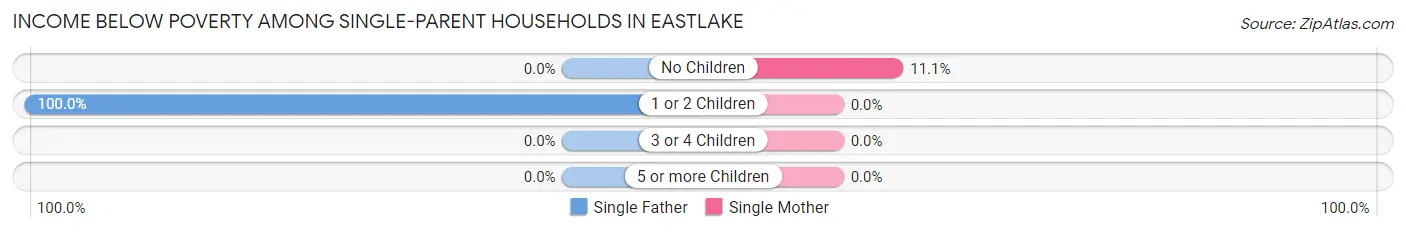
| Children | Single Father | Single Mother |
| No Children | 0 (0.0%) | 1 (11.1%) |
| 1 or 2 Children | 2 (100.0%) | 0 (0.0%) |
| 3 or 4 Children | 0 (0.0%) | 0 (0.0%) |
| 5 or more Children | 0 (0.0%) | 0 (0.0%) |
| Total | 2 (66.7%) | 1 (6.7%) |
Income Below Poverty Among Married-Couple vs Single-Parent Households in Eastlake
The poverty data for Eastlake shows that 5 of the married-couple family households (7.9%) and 3 of the single-parent households (16.7%) are living below the poverty level. Within the married-couple family households, those with no children have the highest poverty rate, with 5 households (8.9%) falling below the poverty line. Among the single-parent households, those with 1 or 2 children have the highest poverty rate, with 2 household (28.6%) living below poverty.
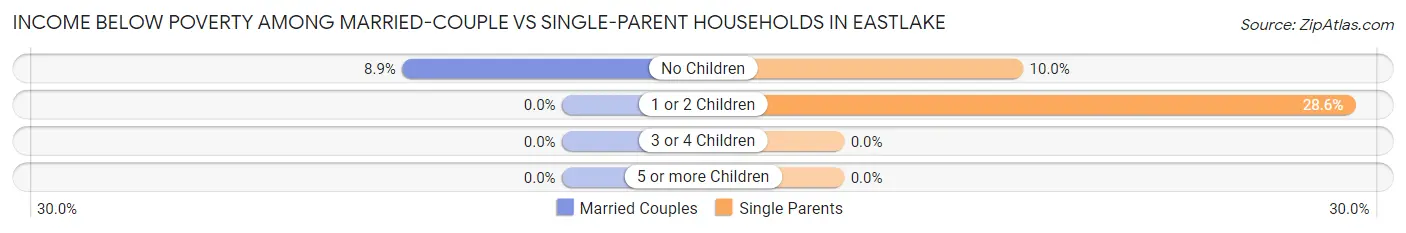
| Children | Married-Couple Families | Single-Parent Households |
| No Children | 5 (8.9%) | 1 (10.0%) |
| 1 or 2 Children | 0 (0.0%) | 2 (28.6%) |
| 3 or 4 Children | 0 (0.0%) | 0 (0.0%) |
| 5 or more Children | 0 (0.0%) | 0 (0.0%) |
| Total | 5 (7.9%) | 3 (16.7%) |
Race in Eastlake
The most populous races in Eastlake are White / Caucasian (260 | 92.5%), Native / Alaskan (9 | 3.2%), and Two or more Races (8 | 2.9%).
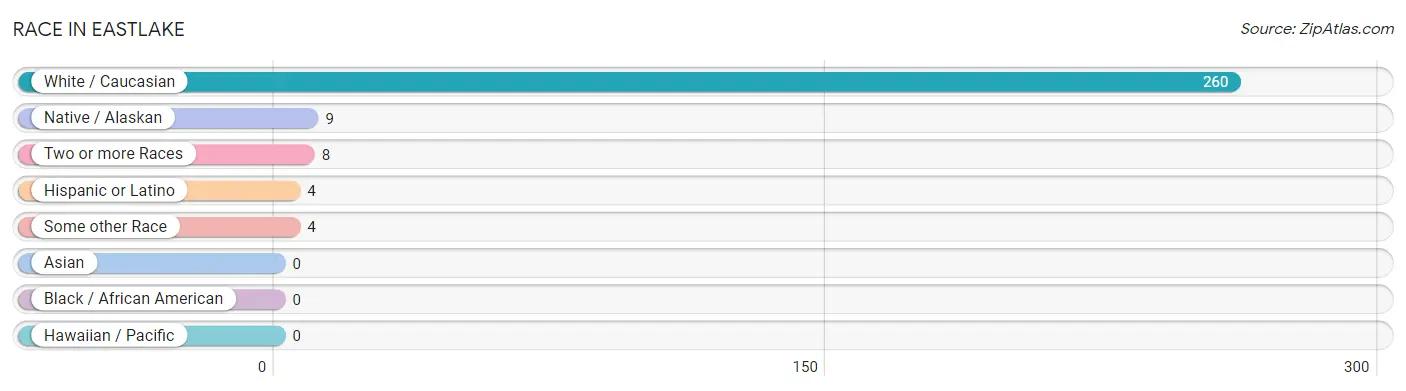
| Race | # Population | % Population |
| Asian | 0 | 0.0% |
| Black / African American | 0 | 0.0% |
| Hawaiian / Pacific | 0 | 0.0% |
| Hispanic or Latino | 4 | 1.4% |
| Native / Alaskan | 9 | 3.2% |
| White / Caucasian | 260 | 92.5% |
| Two or more Races | 8 | 2.9% |
| Some other Race | 4 | 1.4% |
| Total | 281 | 100.0% |
Ancestry in Eastlake
The most populous ancestries reported in Eastlake are German (71 | 25.3%), Polish (66 | 23.5%), Irish (29 | 10.3%), English (23 | 8.2%), and American (22 | 7.8%), together accounting for 75.1% of all Eastlake residents.
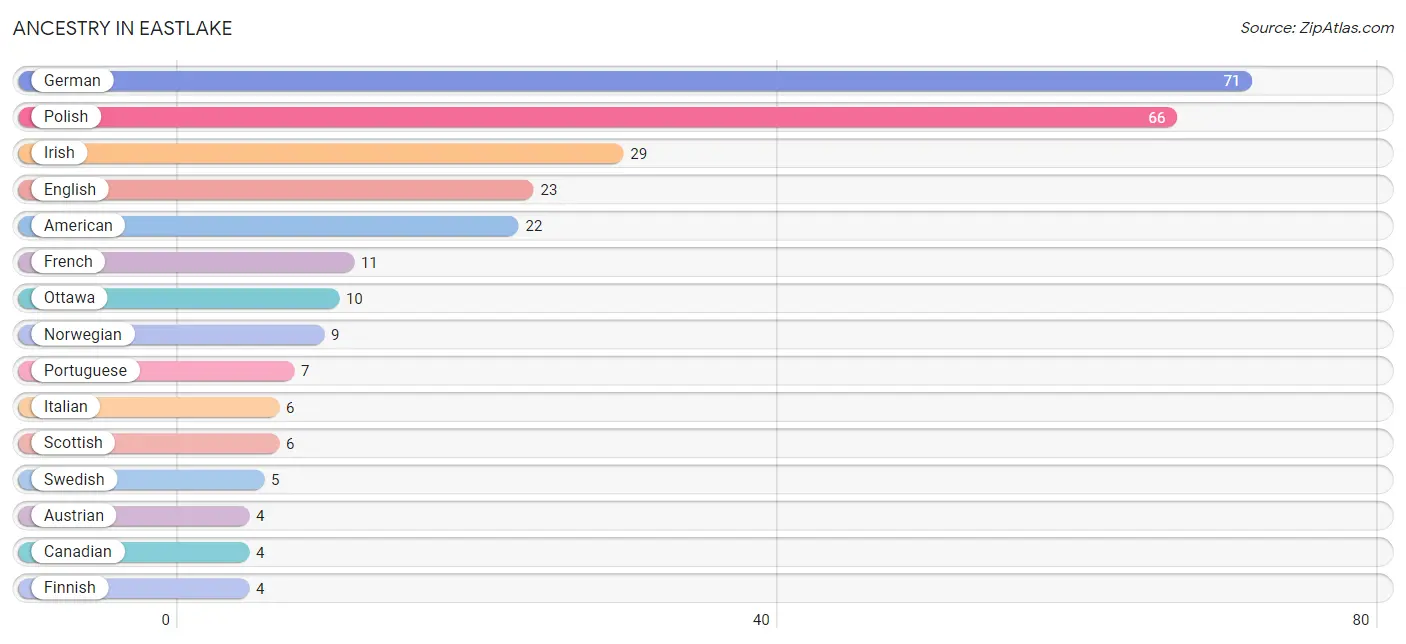
| Ancestry | # Population | % Population |
| American | 22 | 7.8% |
| Austrian | 4 | 1.4% |
| Canadian | 4 | 1.4% |
| Dutch | 3 | 1.1% |
| English | 23 | 8.2% |
| Finnish | 4 | 1.4% |
| French | 11 | 3.9% |
| French Canadian | 1 | 0.4% |
| German | 71 | 25.3% |
| Irish | 29 | 10.3% |
| Italian | 6 | 2.1% |
| Northern European | 3 | 1.1% |
| Norwegian | 9 | 3.2% |
| Ottawa | 10 | 3.6% |
| Polish | 66 | 23.5% |
| Portuguese | 7 | 2.5% |
| Russian | 3 | 1.1% |
| Scotch-Irish | 2 | 0.7% |
| Scottish | 6 | 2.1% |
| Swedish | 5 | 1.8% |
| Swiss | 2 | 0.7% | View All 21 Rows |
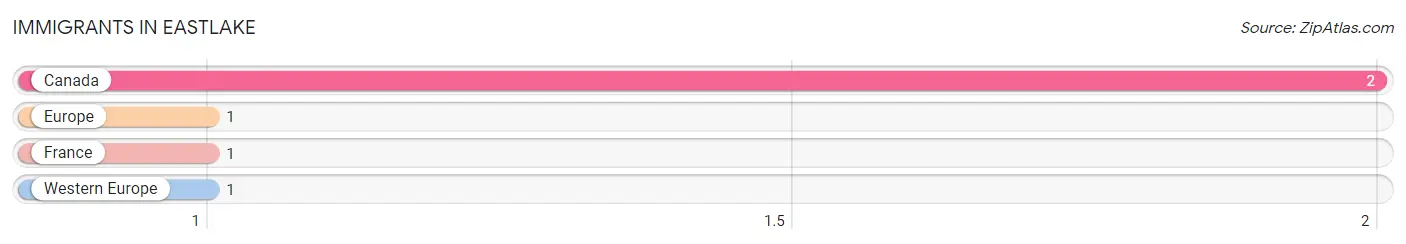
Immigrants in Eastlake
The most numerous immigrant groups reported in Eastlake came from Canada (2 | 0.7%), Europe (1 | 0.4%), France (1 | 0.4%), and Western Europe (1 | 0.4%), together accounting for 1.8% of all Eastlake residents.
| Immigration Origin | # Population | % Population |
| Canada | 2 | 0.7% |
| Europe | 1 | 0.4% |
| France | 1 | 0.4% |
| Western Europe | 1 | 0.4% | View All 4 Rows |
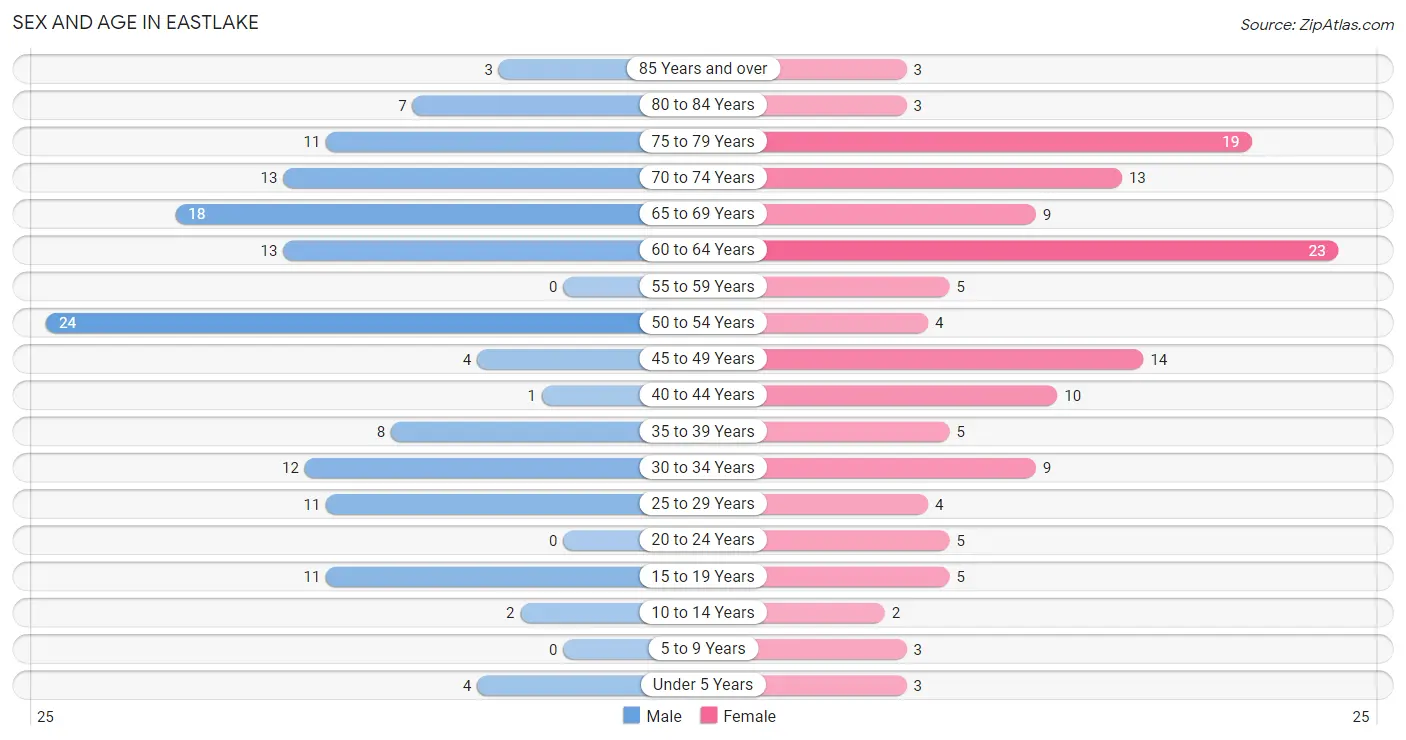
Sex and Age in Eastlake
Sex and Age in Eastlake
The most populous age groups in Eastlake are 50 to 54 Years (24 | 16.9%) for men and 60 to 64 Years (23 | 16.6%) for women.
| Age Bracket | Male | Female |
| Under 5 Years | 4 (2.8%) | 3 (2.2%) |
| 5 to 9 Years | 0 (0.0%) | 3 (2.2%) |
| 10 to 14 Years | 2 (1.4%) | 2 (1.4%) |
| 15 to 19 Years | 11 (7.7%) | 5 (3.6%) |
| 20 to 24 Years | 0 (0.0%) | 5 (3.6%) |
| 25 to 29 Years | 11 (7.7%) | 4 (2.9%) |
| 30 to 34 Years | 12 (8.5%) | 9 (6.5%) |
| 35 to 39 Years | 8 (5.6%) | 5 (3.6%) |
| 40 to 44 Years | 1 (0.7%) | 10 (7.2%) |
| 45 to 49 Years | 4 (2.8%) | 14 (10.1%) |
| 50 to 54 Years | 24 (16.9%) | 4 (2.9%) |
| 55 to 59 Years | 0 (0.0%) | 5 (3.6%) |
| 60 to 64 Years | 13 (9.1%) | 23 (16.6%) |
| 65 to 69 Years | 18 (12.7%) | 9 (6.5%) |
| 70 to 74 Years | 13 (9.1%) | 13 (9.3%) |
| 75 to 79 Years | 11 (7.7%) | 19 (13.7%) |
| 80 to 84 Years | 7 (4.9%) | 3 (2.2%) |
| 85 Years and over | 3 (2.1%) | 3 (2.2%) |
| Total | 142 (100.0%) | 139 (100.0%) |
Families and Households in Eastlake
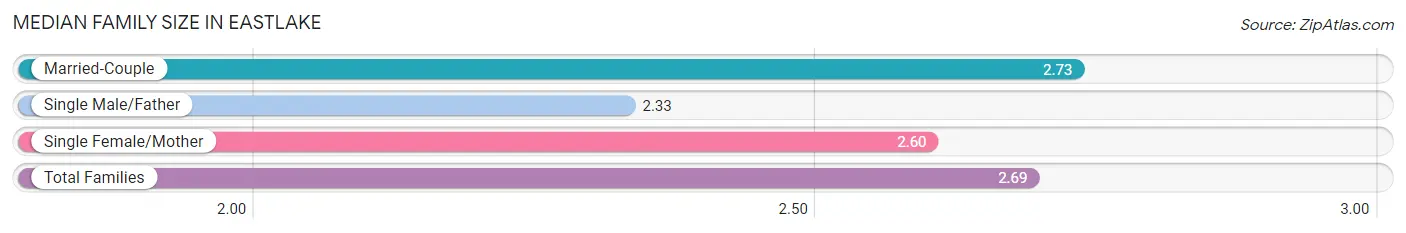
Median Family Size in Eastlake
The median family size in Eastlake is 2.69 persons per family, with married-couple families (63 | 77.8%) accounting for the largest median family size of 2.73 persons per family. On the other hand, single male/father families (3 | 3.7%) represent the smallest median family size with 2.33 persons per family.
| Family Type | # Families | Family Size |
| Married-Couple | 63 (77.8%) | 2.73 |
| Single Male/Father | 3 (3.7%) | 2.33 |
| Single Female/Mother | 15 (18.5%) | 2.60 |
| Total Families | 81 (100.0%) | 2.69 |
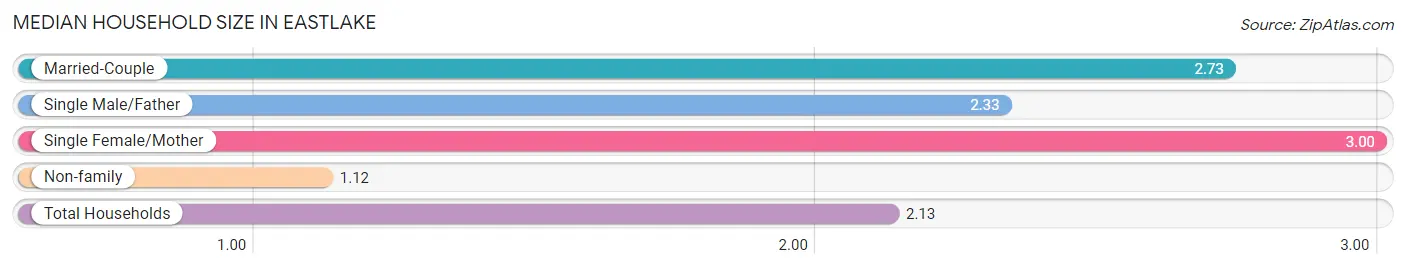
Median Household Size in Eastlake
The median household size in Eastlake is 2.13 persons per household, with single female/mother households (15 | 11.4%) accounting for the largest median household size of 3 persons per household. non-family households (51 | 38.6%) represent the smallest median household size with 1.12 persons per household.
| Household Type | # Households | Household Size |
| Married-Couple | 63 (47.7%) | 2.73 |
| Single Male/Father | 3 (2.3%) | 2.33 |
| Single Female/Mother | 15 (11.4%) | 3.00 |
| Non-family | 51 (38.6%) | 1.12 |
| Total Households | 132 (100.0%) | 2.13 |
Household Size by Marriage Status in Eastlake
Out of a total of 132 households in Eastlake, 81 (61.4%) are family households, while 51 (38.6%) are nonfamily households. The most numerous type of family households are 2-person households, comprising 51, and the most common type of nonfamily households are 1-person households, comprising 39.
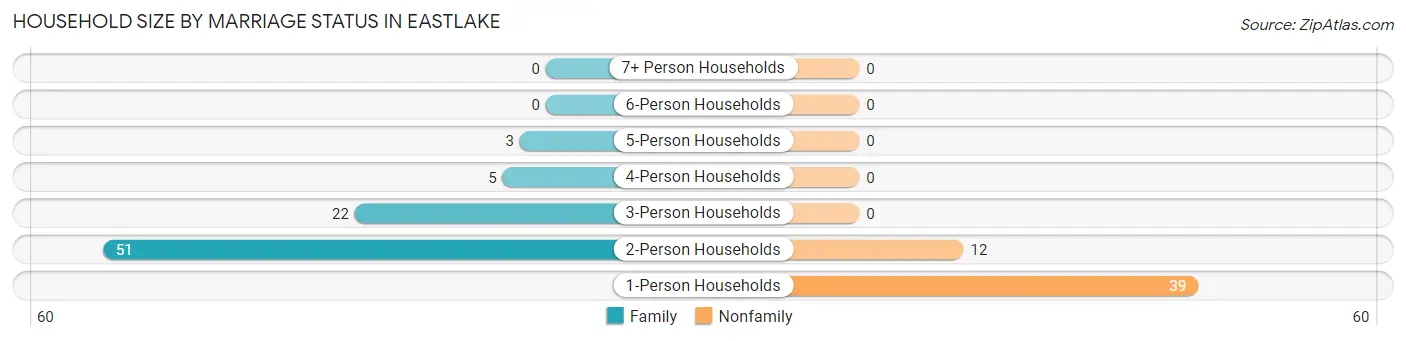
| Household Size | Family Households | Nonfamily Households |
| 1-Person Households | - | 39 (29.5%) |
| 2-Person Households | 51 (38.6%) | 12 (9.1%) |
| 3-Person Households | 22 (16.7%) | 0 (0.0%) |
| 4-Person Households | 5 (3.8%) | 0 (0.0%) |
| 5-Person Households | 3 (2.3%) | 0 (0.0%) |
| 6-Person Households | 0 (0.0%) | 0 (0.0%) |
| 7+ Person Households | 0 (0.0%) | 0 (0.0%) |
| Total | 81 (61.4%) | 51 (38.6%) |
Female Fertility in Eastlake
Fertility by Age in Eastlake
Average fertility rate in Eastlake is 19.0 births per 1,000 women. Women in the age bracket of 20 to 34 years have the highest fertility rate with 56.0 births per 1,000 women. Women in the age bracket of 20 to 34 years acount for 100.0% of all women with births.
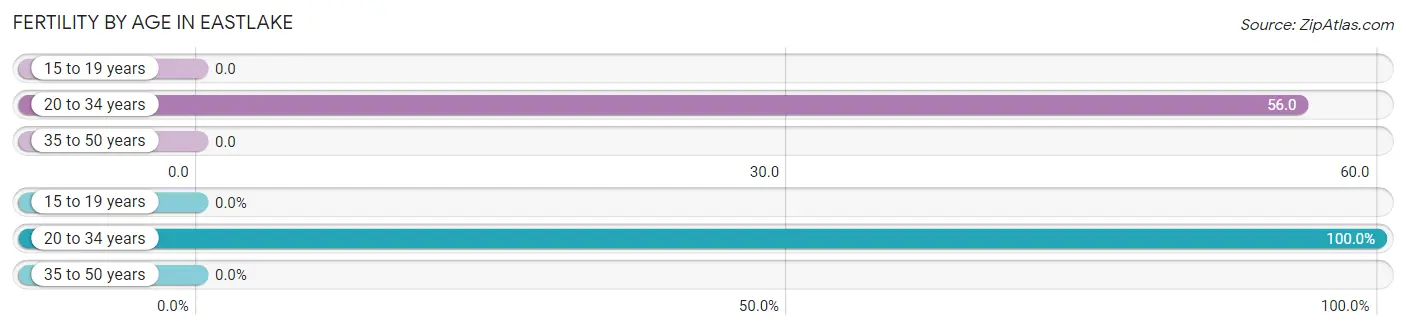
| Age Bracket | Women with Births | Births / 1,000 Women |
| 15 to 19 years | 0 (0.0%) | 0.0 |
| 20 to 34 years | 1 (100.0%) | 56.0 |
| 35 to 50 years | 0 (0.0%) | 0.0 |
| Total | 1 (100.0%) | 19.0 |
Fertility by Age by Marriage Status in Eastlake
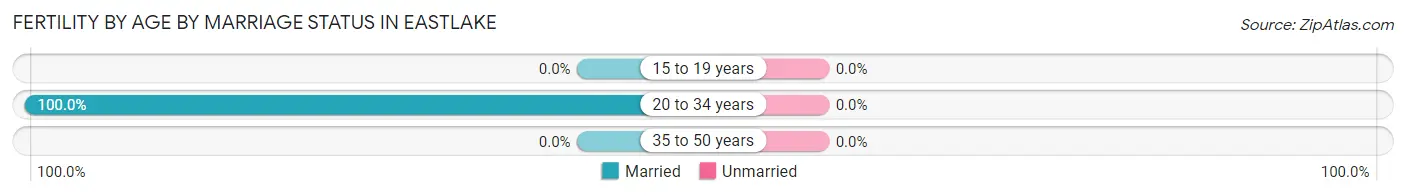
| Age Bracket | Married | Unmarried |
| 15 to 19 years | 0 (0.0%) | 0 (0.0%) |
| 20 to 34 years | 1 (100.0%) | 0 (0.0%) |
| 35 to 50 years | 0 (0.0%) | 0 (0.0%) |
| Total | 1 (100.0%) | 0 (0.0%) |
Fertility by Education in Eastlake
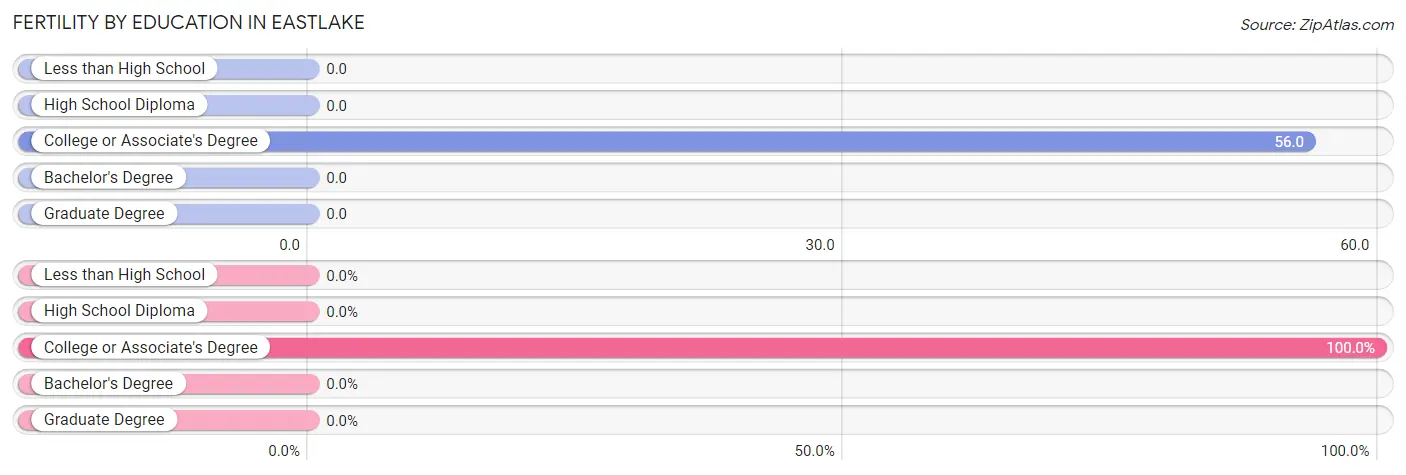
| Educational Attainment | Women with Births | Births / 1,000 Women |
| Less than High School | 0 (0.0%) | 0.0 |
| High School Diploma | 0 (0.0%) | 0.0 |
| College or Associate's Degree | 1 (100.0%) | 56.0 |
| Bachelor's Degree | 0 (0.0%) | 0.0 |
| Graduate Degree | 0 (0.0%) | 0.0 |
| Total | 1 (100.0%) | 19.0 |
Fertility by Education by Marriage Status in Eastlake
| Educational Attainment | Married | Unmarried |
| Less than High School | 0 (0.0%) | 0 (0.0%) |
| High School Diploma | 0 (0.0%) | 0 (0.0%) |
| College or Associate's Degree | 1 (100.0%) | 0 (0.0%) |
| Bachelor's Degree | 0 (0.0%) | 0 (0.0%) |
| Graduate Degree | 0 (0.0%) | 0 (0.0%) |
| Total | 1 (100.0%) | 0 (0.0%) |
Employment Characteristics in Eastlake
Employment by Class of Employer in Eastlake
Among the 122 employed individuals in Eastlake, private company employees (90 | 73.8%), not-for-profit organizations (10 | 8.2%), and self-employed (not incorporated) (9 | 7.4%) make up the most common classes of employment.
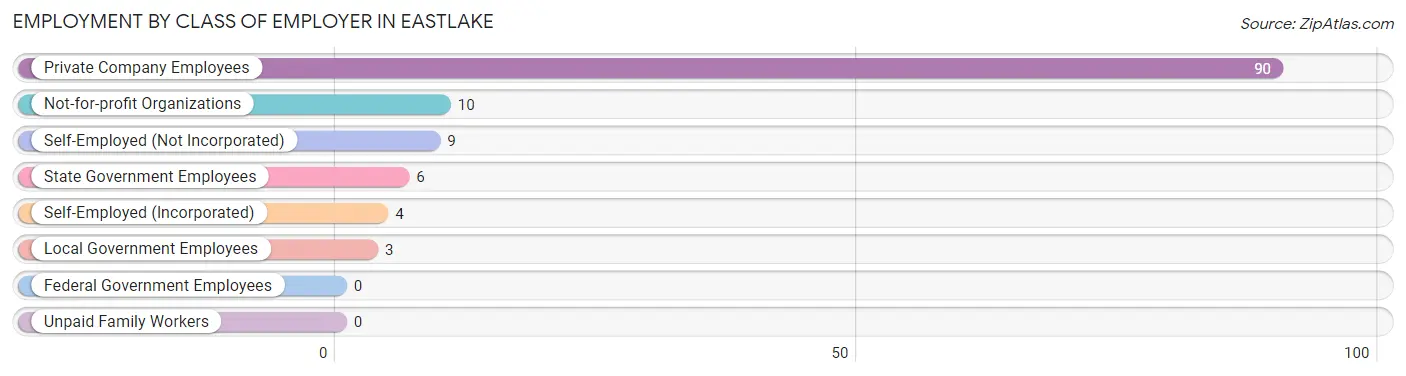
| Employer Class | # Employees | % Employees |
| Private Company Employees | 90 | 73.8% |
| Self-Employed (Incorporated) | 4 | 3.3% |
| Self-Employed (Not Incorporated) | 9 | 7.4% |
| Not-for-profit Organizations | 10 | 8.2% |
| Local Government Employees | 3 | 2.5% |
| State Government Employees | 6 | 4.9% |
| Federal Government Employees | 0 | 0.0% |
| Unpaid Family Workers | 0 | 0.0% |
| Total | 122 | 100.0% |
Employment Status by Age in Eastlake
According to the labor force statistics for Eastlake, out of the total population over 16 years of age (263), 49.0% or 129 individuals are in the labor force, with 2.3% or 3 of them unemployed. The age group with the highest labor force participation rate is 20 to 24 years, with 100.0% or 5 individuals in the labor force. Within the labor force, the 16 to 19 years age range has the highest percentage of unemployed individuals, with 60.0% or 3 of them being unemployed.
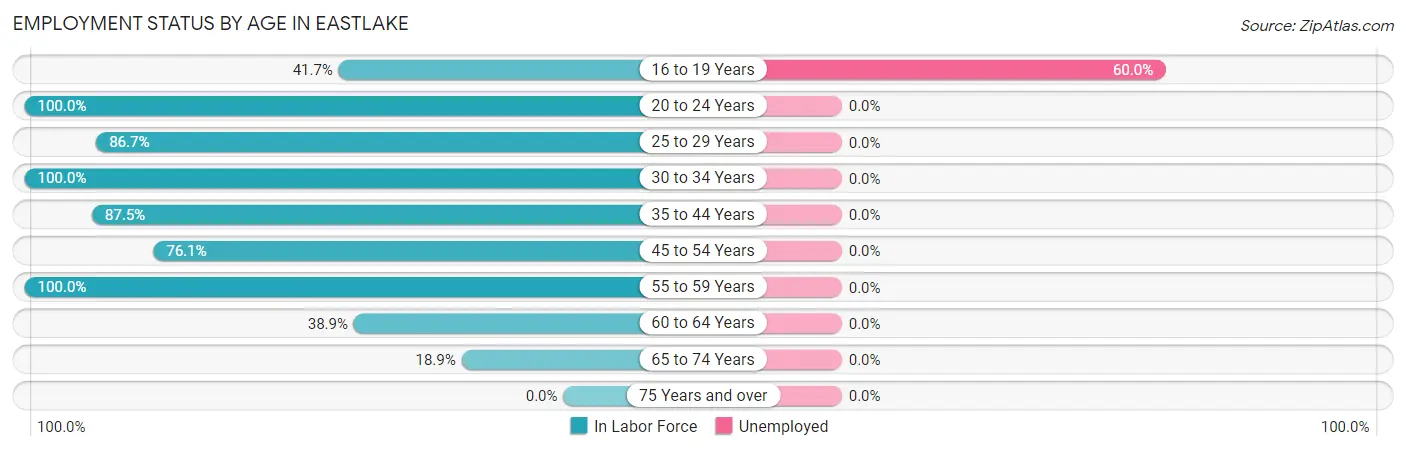
| Age Bracket | In Labor Force | Unemployed |
| 16 to 19 Years | 5 (41.7%) | 3 (60.0%) |
| 20 to 24 Years | 5 (100.0%) | 0 (0.0%) |
| 25 to 29 Years | 13 (86.7%) | 0 (0.0%) |
| 30 to 34 Years | 21 (100.0%) | 0 (0.0%) |
| 35 to 44 Years | 21 (87.5%) | 0 (0.0%) |
| 45 to 54 Years | 35 (76.1%) | 0 (0.0%) |
| 55 to 59 Years | 5 (100.0%) | 0 (0.0%) |
| 60 to 64 Years | 14 (38.9%) | 0 (0.0%) |
| 65 to 74 Years | 10 (18.9%) | 0 (0.0%) |
| 75 Years and over | 0 (0.0%) | 0 (0.0%) |
| Total | 129 (49.0%) | 3 (2.3%) |
Employment Status by Educational Attainment in Eastlake
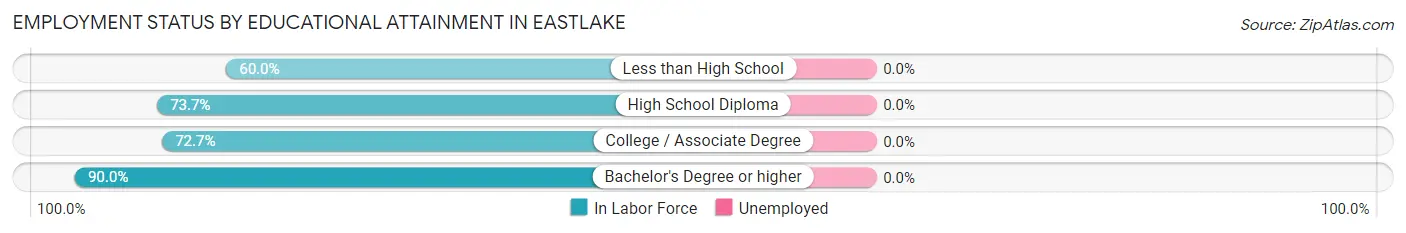
| Educational Attainment | In Labor Force | Unemployed |
| Less than High School | 9 (60.0%) | 0 (0.0%) |
| High School Diploma | 42 (73.7%) | 0 (0.0%) |
| College / Associate Degree | 40 (72.7%) | 0 (0.0%) |
| Bachelor's Degree or higher | 18 (90.0%) | 0 (0.0%) |
| Total | 109 (74.1%) | 0 (0.0%) |
Employment Occupations by Sex in Eastlake
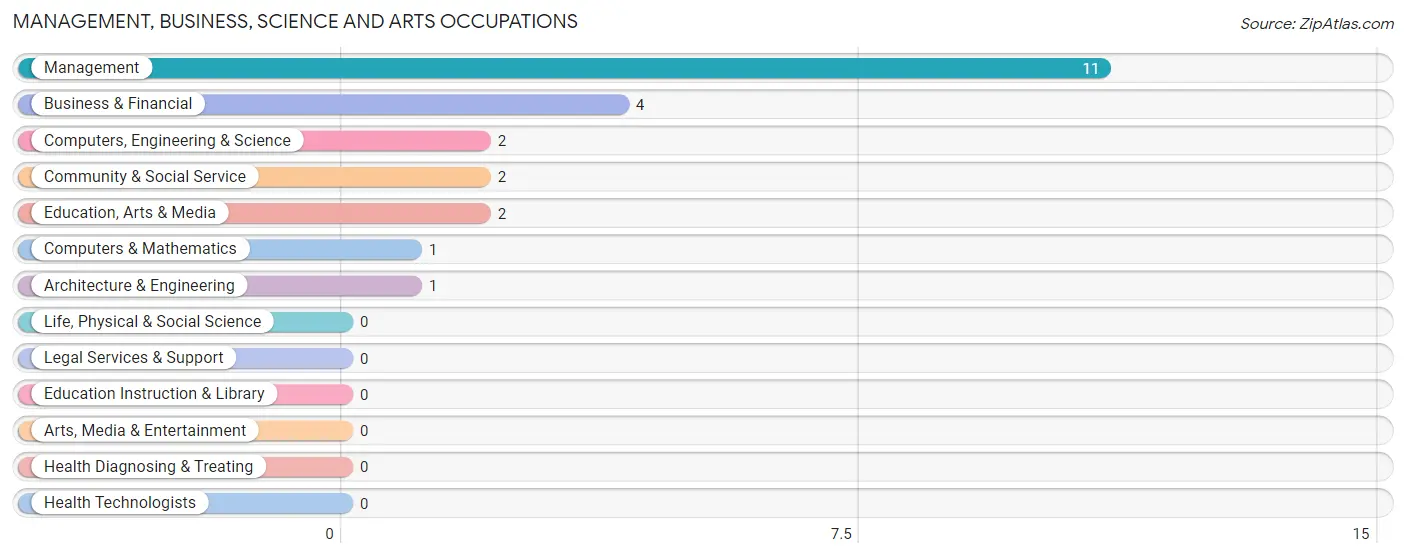
Management, Business, Science and Arts Occupations
The most common Management, Business, Science and Arts occupations in Eastlake are Management (11 | 8.7%), Business & Financial (4 | 3.2%), Computers, Engineering & Science (2 | 1.6%), Community & Social Service (2 | 1.6%), and Education, Arts & Media (2 | 1.6%).
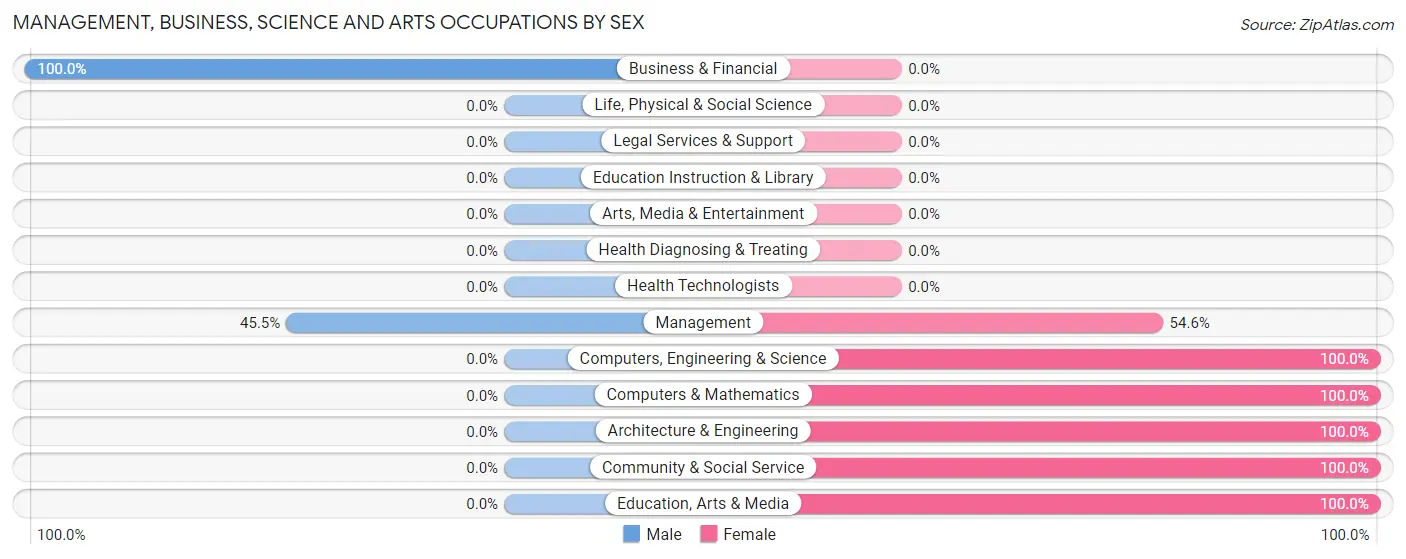
Management, Business, Science and Arts Occupations by Sex
Within the Management, Business, Science and Arts occupations in Eastlake, the most male-oriented occupations are Business & Financial (100.0%), and Management (45.5%), while the most female-oriented occupations are Computers, Engineering & Science (100.0%), Computers & Mathematics (100.0%), and Architecture & Engineering (100.0%).
| Occupation | Male | Female |
| Management | 5 (45.5%) | 6 (54.5%) |
| Business & Financial | 4 (100.0%) | 0 (0.0%) |
| Computers, Engineering & Science | 0 (0.0%) | 2 (100.0%) |
| Computers & Mathematics | 0 (0.0%) | 1 (100.0%) |
| Architecture & Engineering | 0 (0.0%) | 1 (100.0%) |
| Life, Physical & Social Science | 0 (0.0%) | 0 (0.0%) |
| Community & Social Service | 0 (0.0%) | 2 (100.0%) |
| Education, Arts & Media | 0 (0.0%) | 2 (100.0%) |
| Legal Services & Support | 0 (0.0%) | 0 (0.0%) |
| Education Instruction & Library | 0 (0.0%) | 0 (0.0%) |
| Arts, Media & Entertainment | 0 (0.0%) | 0 (0.0%) |
| Health Diagnosing & Treating | 0 (0.0%) | 0 (0.0%) |
| Health Technologists | 0 (0.0%) | 0 (0.0%) |
| Total (Category) | 9 (47.4%) | 10 (52.6%) |
| Total (Overall) | 61 (48.4%) | 65 (51.6%) |
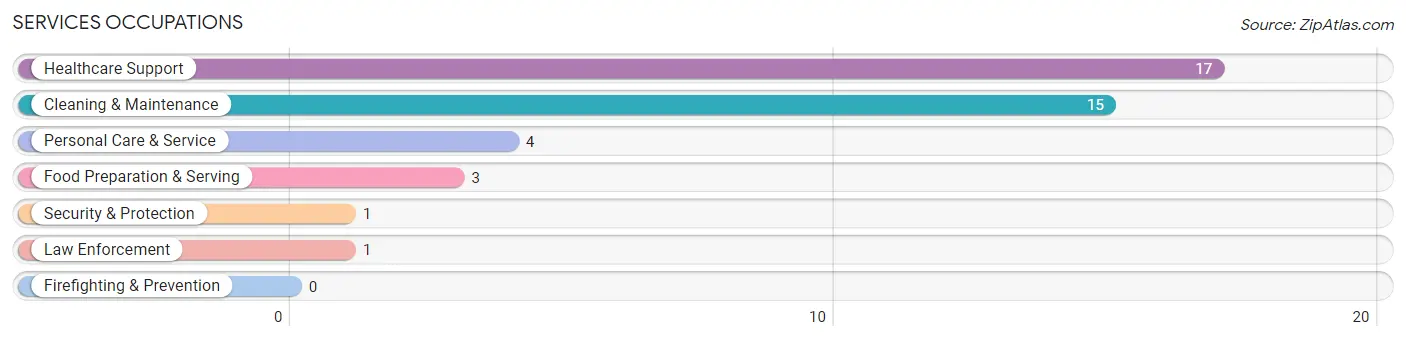
Services Occupations
The most common Services occupations in Eastlake are Healthcare Support (17 | 13.5%), Cleaning & Maintenance (15 | 11.9%), Personal Care & Service (4 | 3.2%), Food Preparation & Serving (3 | 2.4%), and Security & Protection (1 | 0.8%).
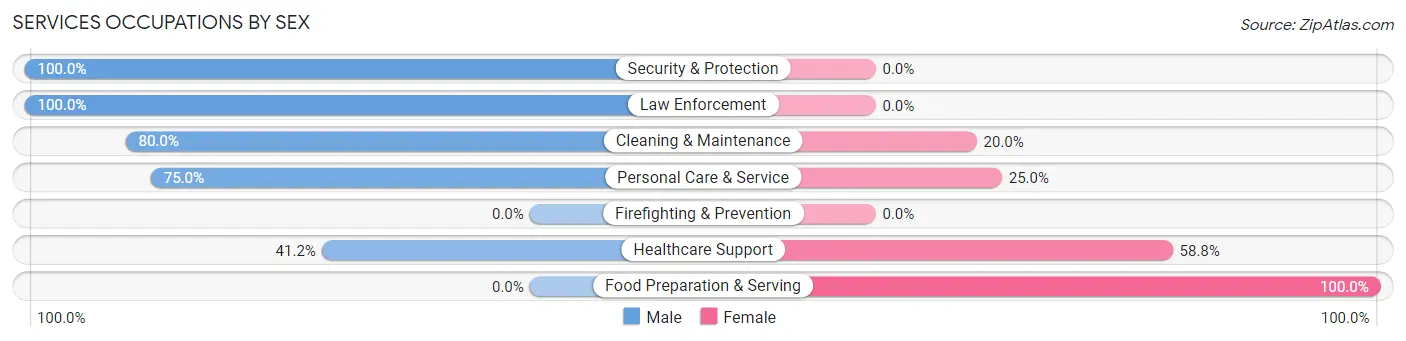
Services Occupations by Sex
Within the Services occupations in Eastlake, the most male-oriented occupations are Security & Protection (100.0%), Law Enforcement (100.0%), and Cleaning & Maintenance (80.0%), while the most female-oriented occupations are Food Preparation & Serving (100.0%), Healthcare Support (58.8%), and Personal Care & Service (25.0%).
| Occupation | Male | Female |
| Healthcare Support | 7 (41.2%) | 10 (58.8%) |
| Security & Protection | 1 (100.0%) | 0 (0.0%) |
| Firefighting & Prevention | 0 (0.0%) | 0 (0.0%) |
| Law Enforcement | 1 (100.0%) | 0 (0.0%) |
| Food Preparation & Serving | 0 (0.0%) | 3 (100.0%) |
| Cleaning & Maintenance | 12 (80.0%) | 3 (20.0%) |
| Personal Care & Service | 3 (75.0%) | 1 (25.0%) |
| Total (Category) | 23 (57.5%) | 17 (42.5%) |
| Total (Overall) | 61 (48.4%) | 65 (51.6%) |
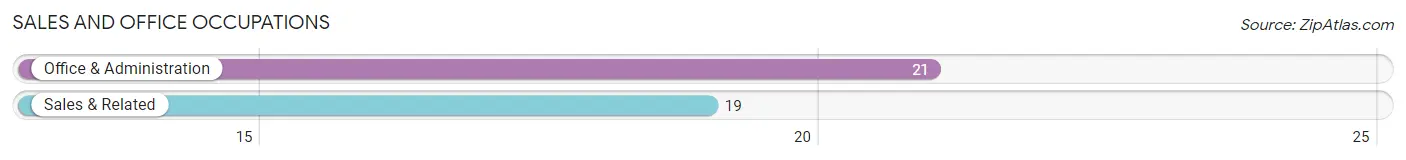
Sales and Office Occupations
The most common Sales and Office occupations in Eastlake are Office & Administration (21 | 16.7%), and Sales & Related (19 | 15.1%).
Sales and Office Occupations by Sex
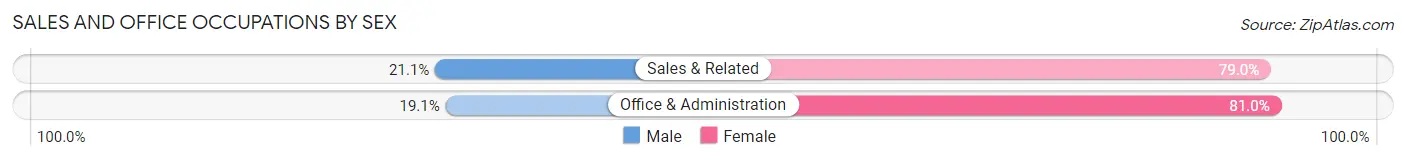
| Occupation | Male | Female |
| Sales & Related | 4 (21.0%) | 15 (78.9%) |
| Office & Administration | 4 (19.1%) | 17 (80.9%) |
| Total (Category) | 8 (20.0%) | 32 (80.0%) |
| Total (Overall) | 61 (48.4%) | 65 (51.6%) |
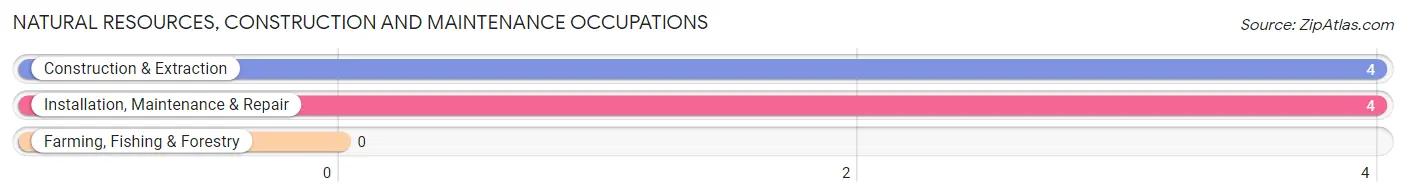
Natural Resources, Construction and Maintenance Occupations
The most common Natural Resources, Construction and Maintenance occupations in Eastlake are Construction & Extraction (4 | 3.2%), and Installation, Maintenance & Repair (4 | 3.2%).
Natural Resources, Construction and Maintenance Occupations by Sex
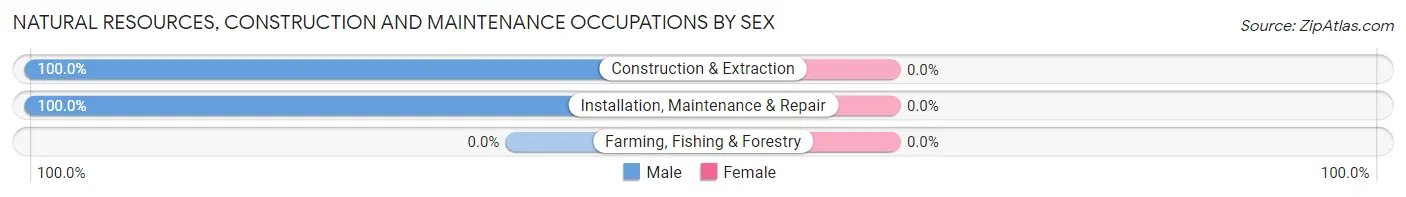
| Occupation | Male | Female |
| Farming, Fishing & Forestry | 0 (0.0%) | 0 (0.0%) |
| Construction & Extraction | 4 (100.0%) | 0 (0.0%) |
| Installation, Maintenance & Repair | 4 (100.0%) | 0 (0.0%) |
| Total (Category) | 8 (100.0%) | 0 (0.0%) |
| Total (Overall) | 61 (48.4%) | 65 (51.6%) |
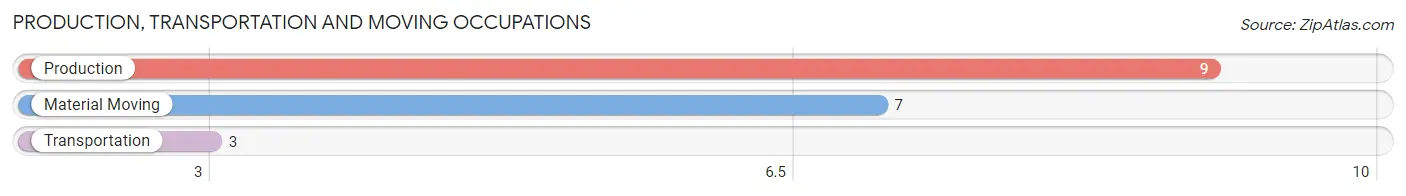
Production, Transportation and Moving Occupations
The most common Production, Transportation and Moving occupations in Eastlake are Production (9 | 7.1%), Material Moving (7 | 5.6%), and Transportation (3 | 2.4%).
Production, Transportation and Moving Occupations by Sex
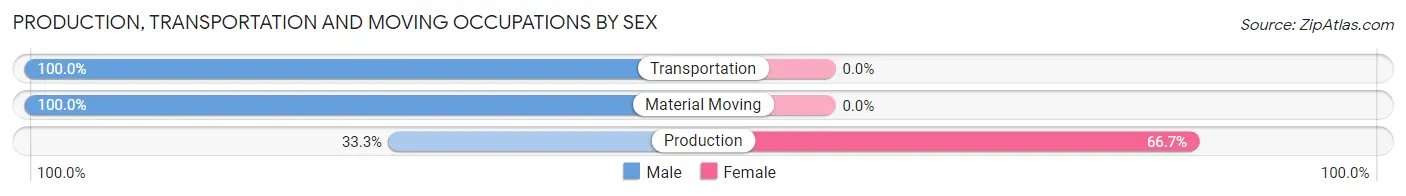
| Occupation | Male | Female |
| Production | 3 (33.3%) | 6 (66.7%) |
| Transportation | 3 (100.0%) | 0 (0.0%) |
| Material Moving | 7 (100.0%) | 0 (0.0%) |
| Total (Category) | 13 (68.4%) | 6 (31.6%) |
| Total (Overall) | 61 (48.4%) | 65 (51.6%) |
Employment Industries by Sex in Eastlake
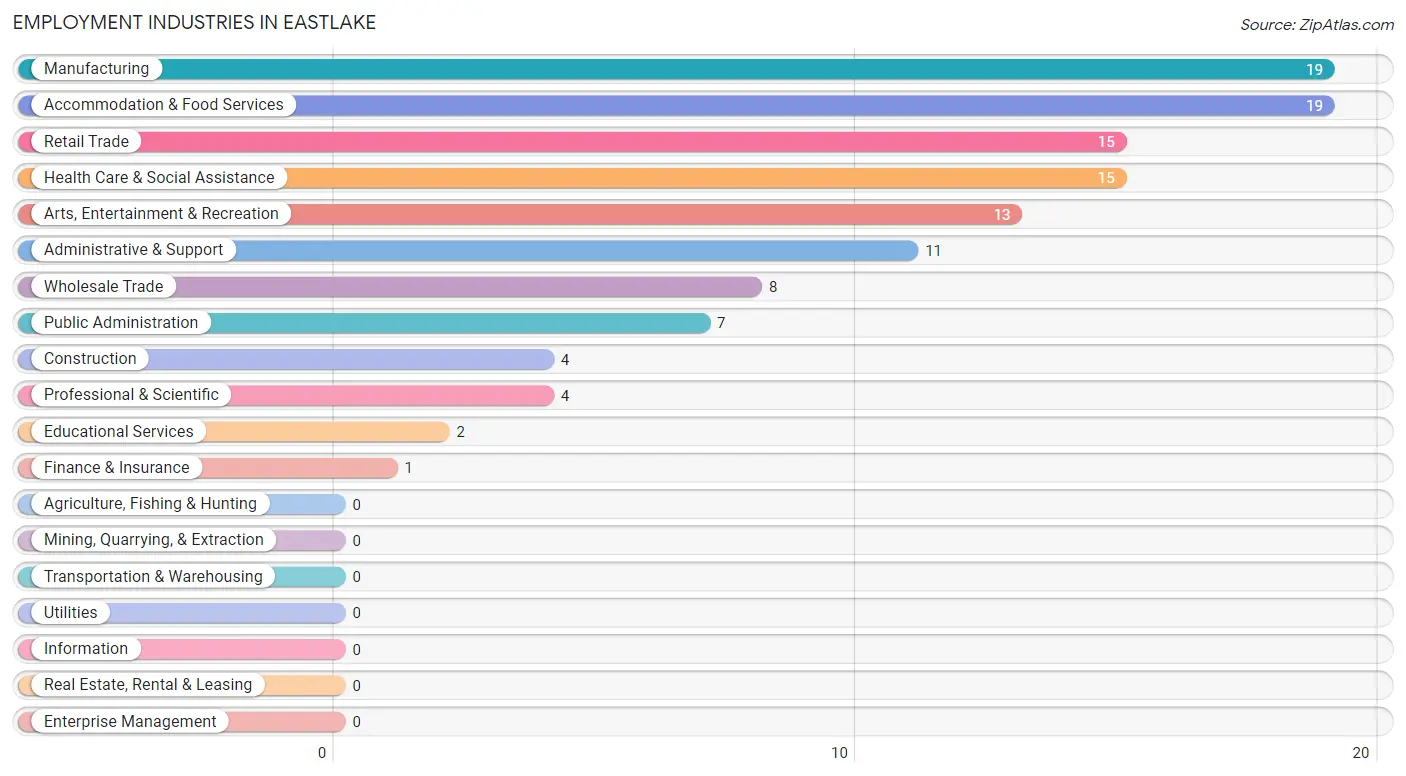
Employment Industries in Eastlake
The major employment industries in Eastlake include Manufacturing (19 | 15.1%), Accommodation & Food Services (19 | 15.1%), Retail Trade (15 | 11.9%), Health Care & Social Assistance (15 | 11.9%), and Arts, Entertainment & Recreation (13 | 10.3%).
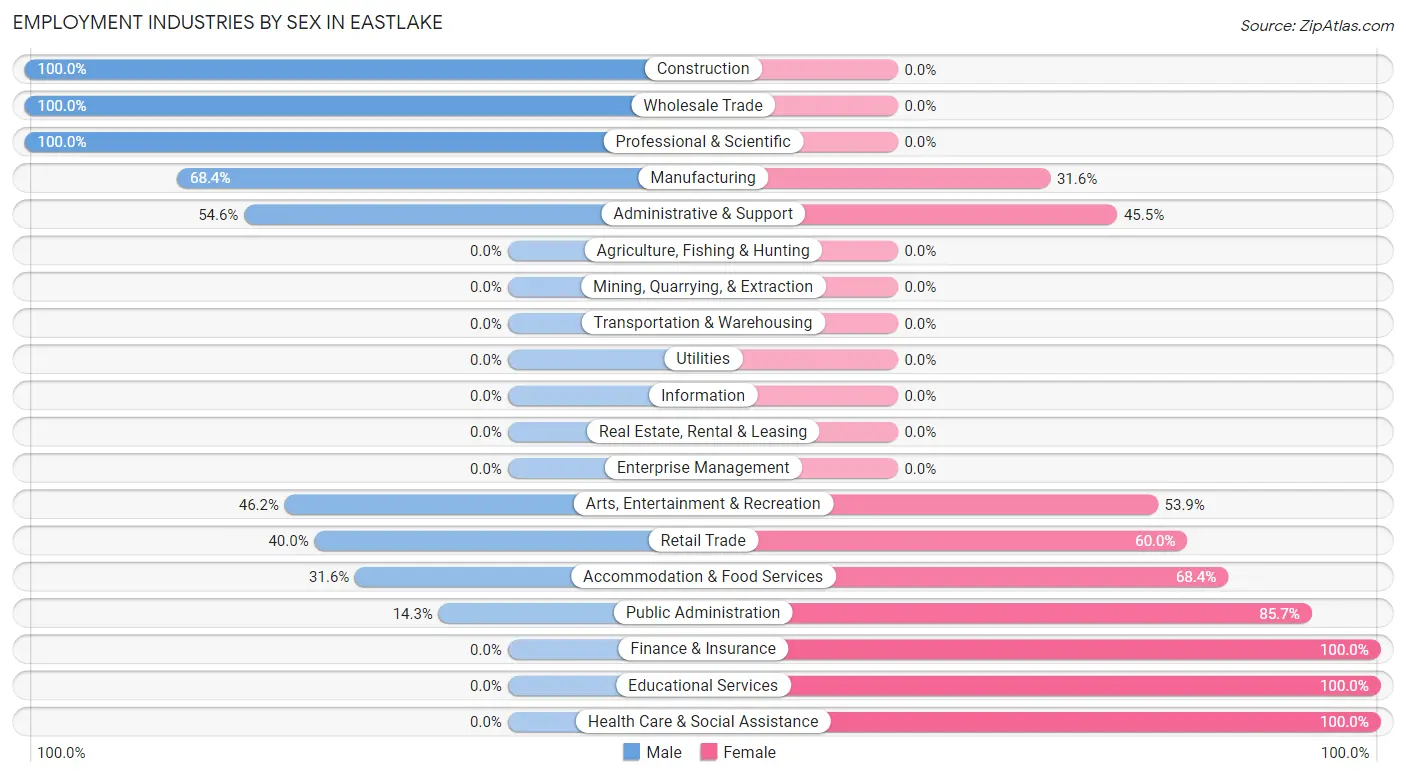
Employment Industries by Sex in Eastlake
The Eastlake industries that see more men than women are Construction (100.0%), Wholesale Trade (100.0%), and Professional & Scientific (100.0%), whereas the industries that tend to have a higher number of women are Finance & Insurance (100.0%), Educational Services (100.0%), and Health Care & Social Assistance (100.0%).
| Industry | Male | Female |
| Agriculture, Fishing & Hunting | 0 (0.0%) | 0 (0.0%) |
| Mining, Quarrying, & Extraction | 0 (0.0%) | 0 (0.0%) |
| Construction | 4 (100.0%) | 0 (0.0%) |
| Manufacturing | 13 (68.4%) | 6 (31.6%) |
| Wholesale Trade | 8 (100.0%) | 0 (0.0%) |
| Retail Trade | 6 (40.0%) | 9 (60.0%) |
| Transportation & Warehousing | 0 (0.0%) | 0 (0.0%) |
| Utilities | 0 (0.0%) | 0 (0.0%) |
| Information | 0 (0.0%) | 0 (0.0%) |
| Finance & Insurance | 0 (0.0%) | 1 (100.0%) |
| Real Estate, Rental & Leasing | 0 (0.0%) | 0 (0.0%) |
| Professional & Scientific | 4 (100.0%) | 0 (0.0%) |
| Enterprise Management | 0 (0.0%) | 0 (0.0%) |
| Administrative & Support | 6 (54.5%) | 5 (45.5%) |
| Educational Services | 0 (0.0%) | 2 (100.0%) |
| Health Care & Social Assistance | 0 (0.0%) | 15 (100.0%) |
| Arts, Entertainment & Recreation | 6 (46.2%) | 7 (53.8%) |
| Accommodation & Food Services | 6 (31.6%) | 13 (68.4%) |
| Public Administration | 1 (14.3%) | 6 (85.7%) |
| Total | 61 (48.4%) | 65 (51.6%) |
Education in Eastlake
School Enrollment in Eastlake
The most common levels of schooling among the 18 students in Eastlake are high school (11 | 61.1%), nursery / preschool (2 | 11.1%), and elementary school (2 | 11.1%).
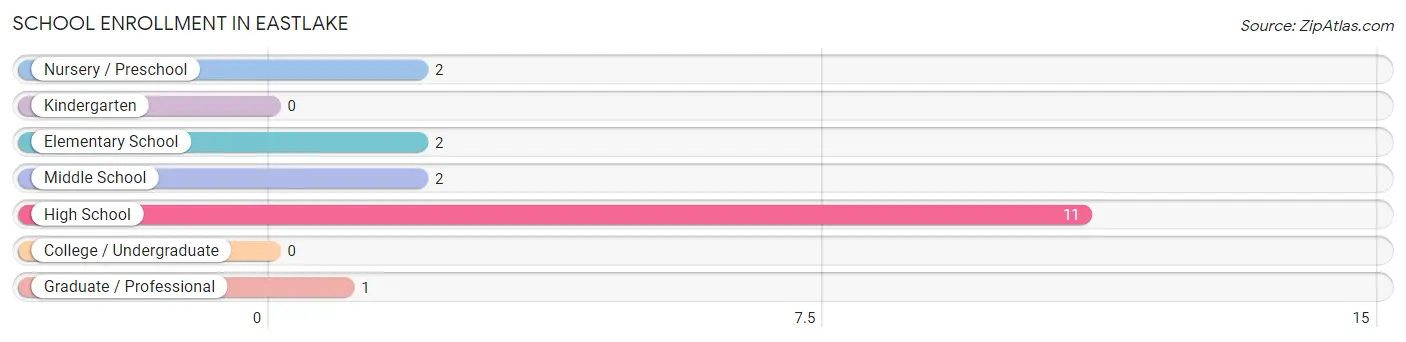
| School Level | # Students | % Students |
| Nursery / Preschool | 2 | 11.1% |
| Kindergarten | 0 | 0.0% |
| Elementary School | 2 | 11.1% |
| Middle School | 2 | 11.1% |
| High School | 11 | 61.1% |
| College / Undergraduate | 0 | 0.0% |
| Graduate / Professional | 1 | 5.6% |
| Total | 18 | 100.0% |
School Enrollment by Age by Funding Source in Eastlake
Out of a total of 18 students who are enrolled in schools in Eastlake, 1 (5.6%) attend a private institution, while the remaining 17 (94.4%) are enrolled in public schools. The age group of 10 to 14 year olds has the highest likelihood of being enrolled in private schools, with 1 (33.3% in the age bracket) enrolled. Conversely, the age group of 3 to 4 year olds has the lowest likelihood of being enrolled in a private school, with 2 (100.0% in the age bracket) attending a public institution.
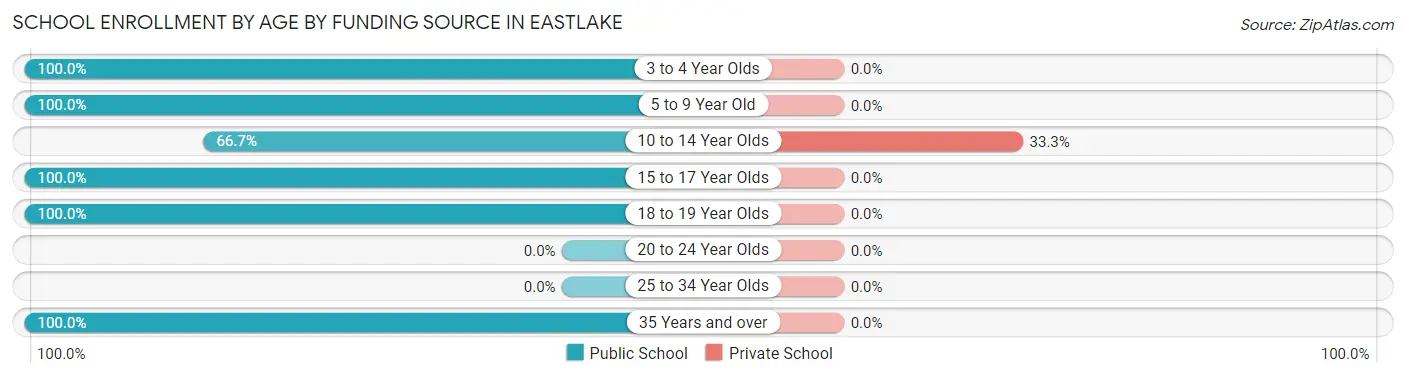
| Age Bracket | Public School | Private School |
| 3 to 4 Year Olds | 2 (100.0%) | 0 (0.0%) |
| 5 to 9 Year Old | 2 (100.0%) | 0 (0.0%) |
| 10 to 14 Year Olds | 2 (66.7%) | 1 (33.3%) |
| 15 to 17 Year Olds | 9 (100.0%) | 0 (0.0%) |
| 18 to 19 Year Olds | 1 (100.0%) | 0 (0.0%) |
| 20 to 24 Year Olds | 0 (0.0%) | 0 (0.0%) |
| 25 to 34 Year Olds | 0 (0.0%) | 0 (0.0%) |
| 35 Years and over | 1 (100.0%) | 0 (0.0%) |
| Total | 17 (94.4%) | 1 (5.6%) |
Educational Attainment by Field of Study in Eastlake
Psychology (14 | 31.1%), business (9 | 20.0%), communications (8 | 17.8%), arts & humanities (7 | 15.6%), and education (3 | 6.7%) are the most common fields of study among 45 individuals in Eastlake who have obtained a bachelor's degree or higher.
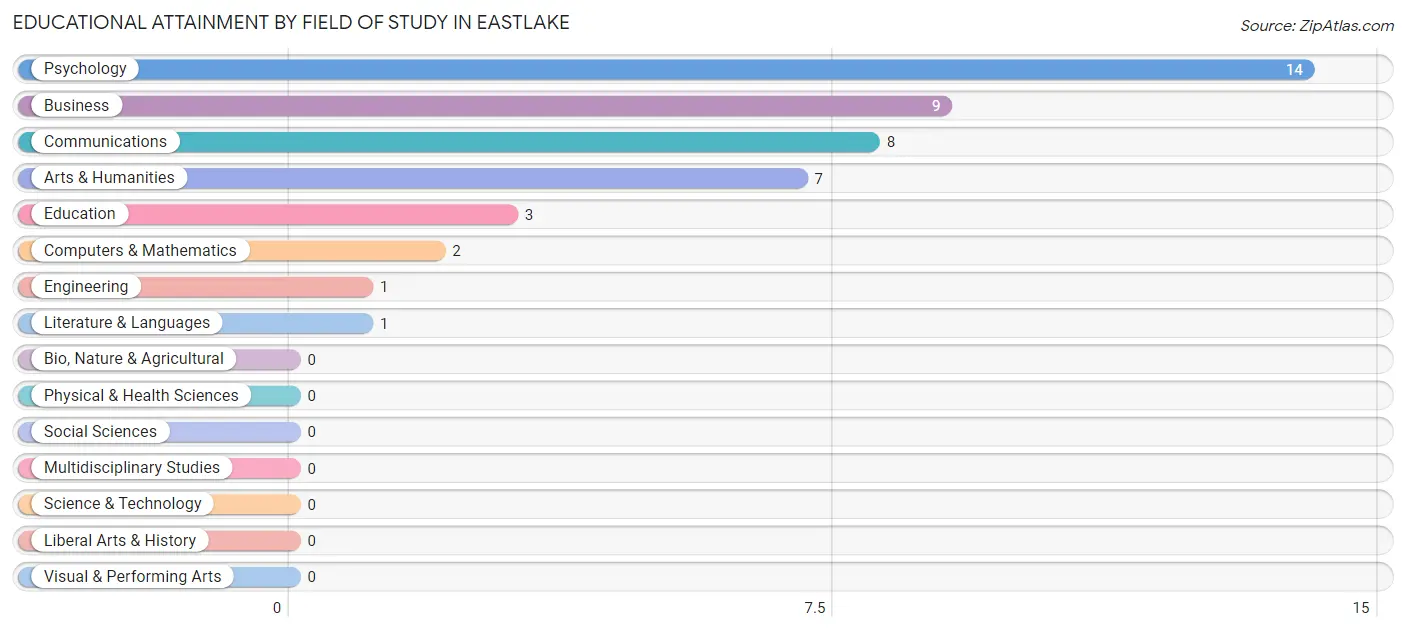
| Field of Study | # Graduates | % Graduates |
| Computers & Mathematics | 2 | 4.4% |
| Bio, Nature & Agricultural | 0 | 0.0% |
| Physical & Health Sciences | 0 | 0.0% |
| Psychology | 14 | 31.1% |
| Social Sciences | 0 | 0.0% |
| Engineering | 1 | 2.2% |
| Multidisciplinary Studies | 0 | 0.0% |
| Science & Technology | 0 | 0.0% |
| Business | 9 | 20.0% |
| Education | 3 | 6.7% |
| Literature & Languages | 1 | 2.2% |
| Liberal Arts & History | 0 | 0.0% |
| Visual & Performing Arts | 0 | 0.0% |
| Communications | 8 | 17.8% |
| Arts & Humanities | 7 | 15.6% |
| Total | 45 | 100.0% |
Transportation & Commute in Eastlake
Vehicle Availability by Sex in Eastlake
The most prevalent vehicle ownership categories in Eastlake are males with 2 vehicles (22, accounting for 36.1%) and females with 2 vehicles (30, making up 36.1%).
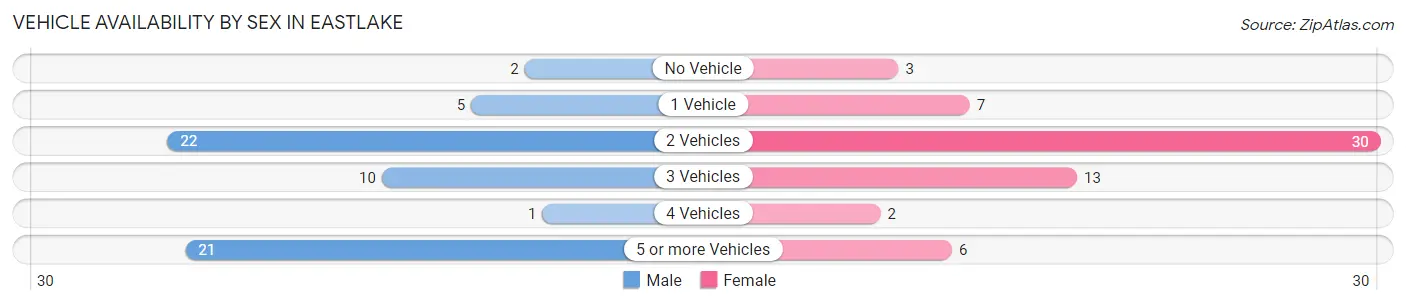
| Vehicles Available | Male | Female |
| No Vehicle | 2 (3.3%) | 3 (4.9%) |
| 1 Vehicle | 5 (8.2%) | 7 (11.5%) |
| 2 Vehicles | 22 (36.1%) | 30 (49.2%) |
| 3 Vehicles | 10 (16.4%) | 13 (21.3%) |
| 4 Vehicles | 1 (1.6%) | 2 (3.3%) |
| 5 or more Vehicles | 21 (34.4%) | 6 (9.8%) |
| Total | 61 (100.0%) | 61 (100.0%) |
Commute Time in Eastlake
The most frequently occuring commute durations in Eastlake are 10 to 14 minutes (35 commuters, 28.7%), 15 to 19 minutes (25 commuters, 20.5%), and 5 to 9 minutes (21 commuters, 17.2%).
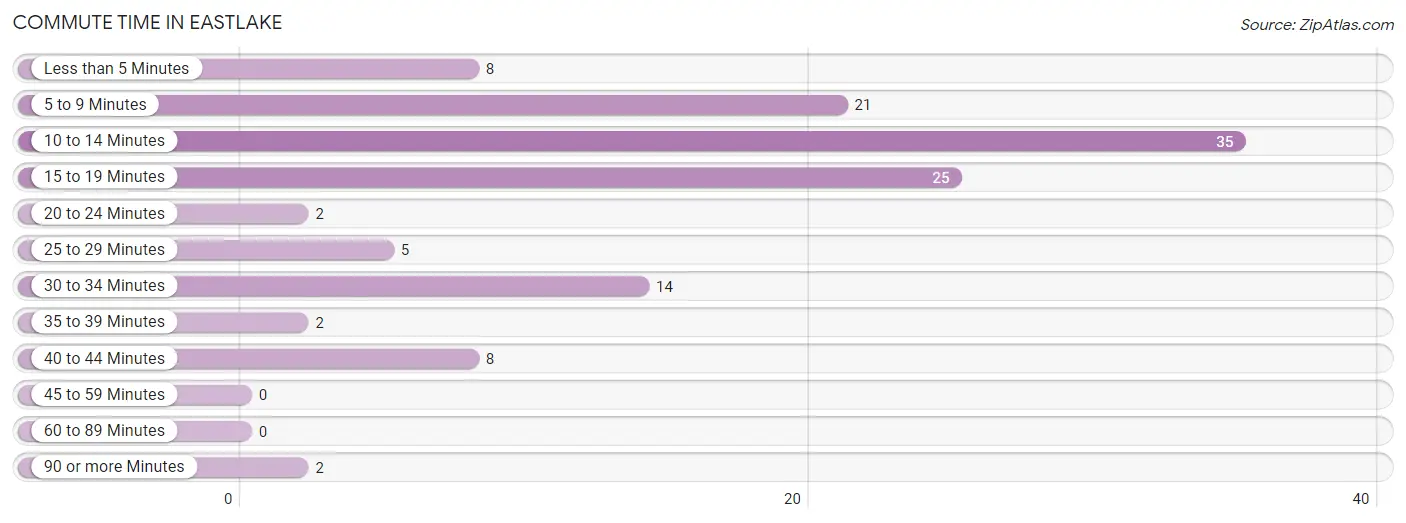
| Commute Time | # Commuters | % Commuters |
| Less than 5 Minutes | 8 | 6.6% |
| 5 to 9 Minutes | 21 | 17.2% |
| 10 to 14 Minutes | 35 | 28.7% |
| 15 to 19 Minutes | 25 | 20.5% |
| 20 to 24 Minutes | 2 | 1.6% |
| 25 to 29 Minutes | 5 | 4.1% |
| 30 to 34 Minutes | 14 | 11.5% |
| 35 to 39 Minutes | 2 | 1.6% |
| 40 to 44 Minutes | 8 | 6.6% |
| 45 to 59 Minutes | 0 | 0.0% |
| 60 to 89 Minutes | 0 | 0.0% |
| 90 or more Minutes | 2 | 1.6% |
Commute Time by Sex in Eastlake
The most common commute times in Eastlake are 10 to 14 minutes (23 commuters, 37.7%) for males and 5 to 9 minutes (17 commuters, 27.9%) for females.
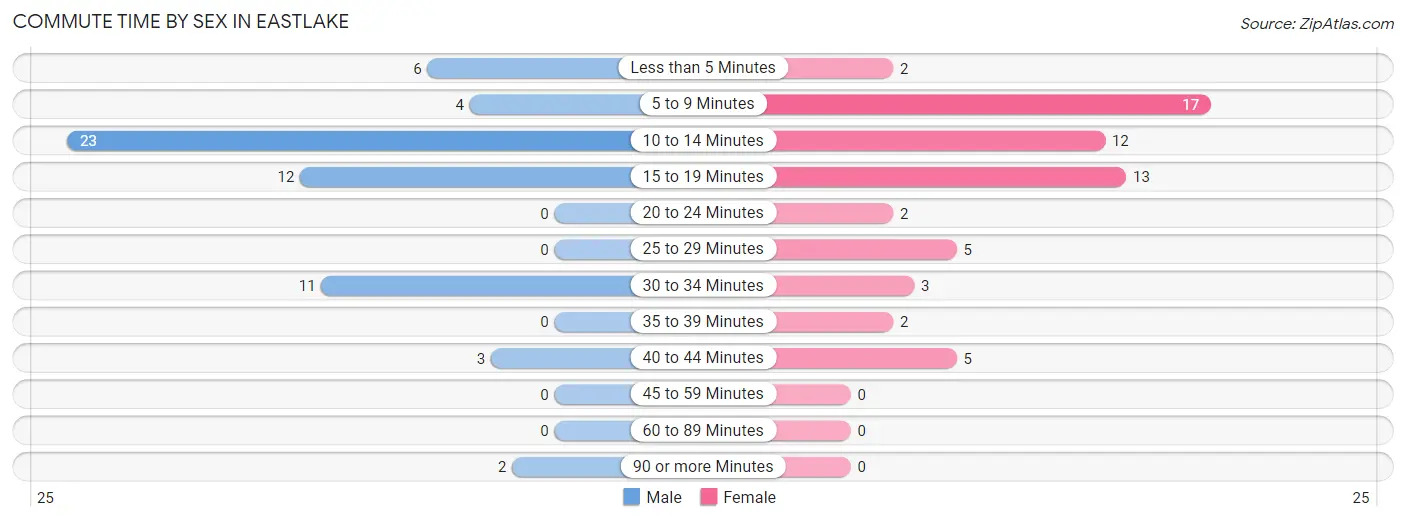
| Commute Time | Male | Female |
| Less than 5 Minutes | 6 (9.8%) | 2 (3.3%) |
| 5 to 9 Minutes | 4 (6.6%) | 17 (27.9%) |
| 10 to 14 Minutes | 23 (37.7%) | 12 (19.7%) |
| 15 to 19 Minutes | 12 (19.7%) | 13 (21.3%) |
| 20 to 24 Minutes | 0 (0.0%) | 2 (3.3%) |
| 25 to 29 Minutes | 0 (0.0%) | 5 (8.2%) |
| 30 to 34 Minutes | 11 (18.0%) | 3 (4.9%) |
| 35 to 39 Minutes | 0 (0.0%) | 2 (3.3%) |
| 40 to 44 Minutes | 3 (4.9%) | 5 (8.2%) |
| 45 to 59 Minutes | 0 (0.0%) | 0 (0.0%) |
| 60 to 89 Minutes | 0 (0.0%) | 0 (0.0%) |
| 90 or more Minutes | 2 (3.3%) | 0 (0.0%) |
Time of Departure to Work by Sex in Eastlake
The most frequent times of departure to work in Eastlake are 7:30 AM to 7:59 AM (14, 23.0%) for males and 8:00 AM to 8:29 AM (16, 26.2%) for females.
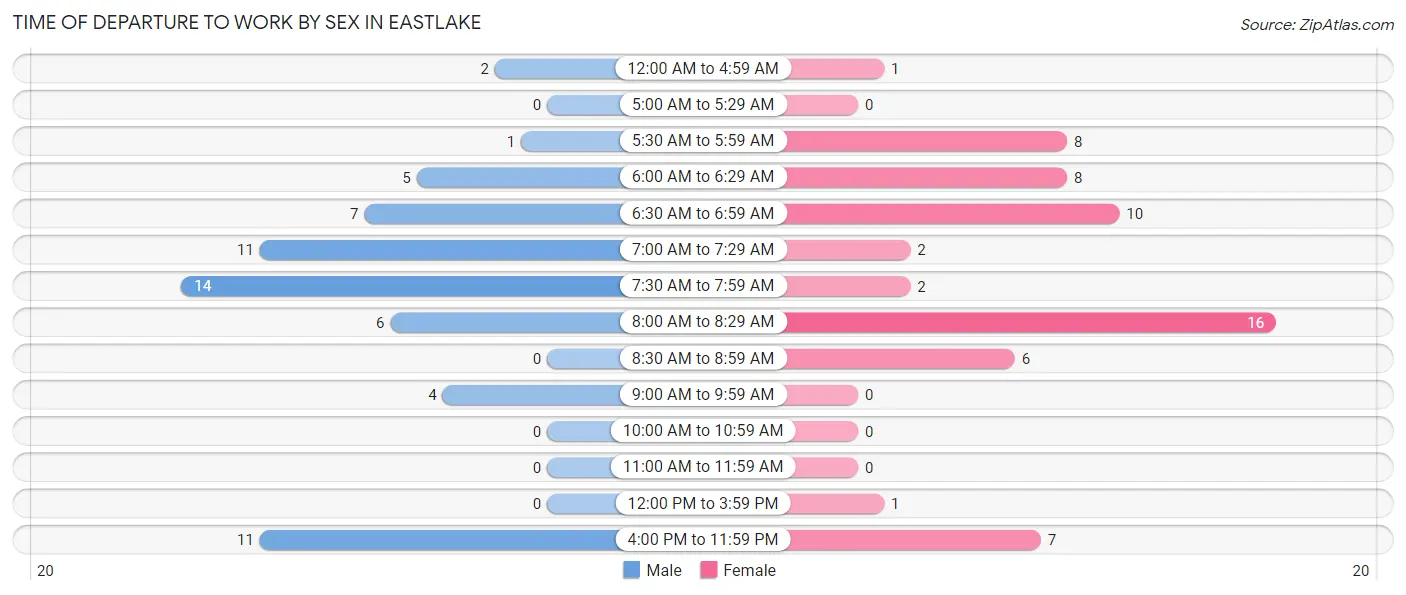
| Time of Departure | Male | Female |
| 12:00 AM to 4:59 AM | 2 (3.3%) | 1 (1.6%) |
| 5:00 AM to 5:29 AM | 0 (0.0%) | 0 (0.0%) |
| 5:30 AM to 5:59 AM | 1 (1.6%) | 8 (13.1%) |
| 6:00 AM to 6:29 AM | 5 (8.2%) | 8 (13.1%) |
| 6:30 AM to 6:59 AM | 7 (11.5%) | 10 (16.4%) |
| 7:00 AM to 7:29 AM | 11 (18.0%) | 2 (3.3%) |
| 7:30 AM to 7:59 AM | 14 (23.0%) | 2 (3.3%) |
| 8:00 AM to 8:29 AM | 6 (9.8%) | 16 (26.2%) |
| 8:30 AM to 8:59 AM | 0 (0.0%) | 6 (9.8%) |
| 9:00 AM to 9:59 AM | 4 (6.6%) | 0 (0.0%) |
| 10:00 AM to 10:59 AM | 0 (0.0%) | 0 (0.0%) |
| 11:00 AM to 11:59 AM | 0 (0.0%) | 0 (0.0%) |
| 12:00 PM to 3:59 PM | 0 (0.0%) | 1 (1.6%) |
| 4:00 PM to 11:59 PM | 11 (18.0%) | 7 (11.5%) |
| Total | 61 (100.0%) | 61 (100.0%) |
Housing Occupancy in Eastlake
Occupancy by Ownership in Eastlake
Of the total 132 dwellings in Eastlake, owner-occupied units account for 124 (93.9%), while renter-occupied units make up 8 (6.1%).
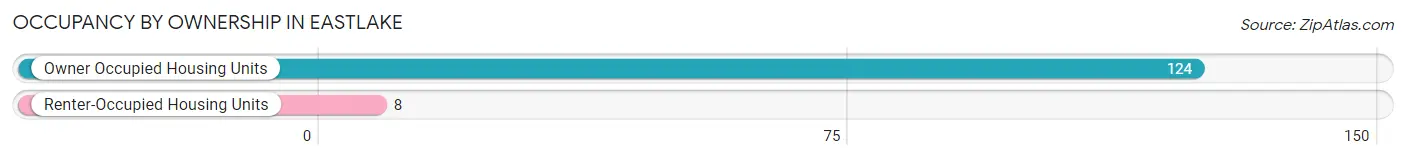
| Occupancy | # Housing Units | % Housing Units |
| Owner Occupied Housing Units | 124 | 93.9% |
| Renter-Occupied Housing Units | 8 | 6.1% |
| Total Occupied Housing Units | 132 | 100.0% |
Occupancy by Household Size in Eastlake
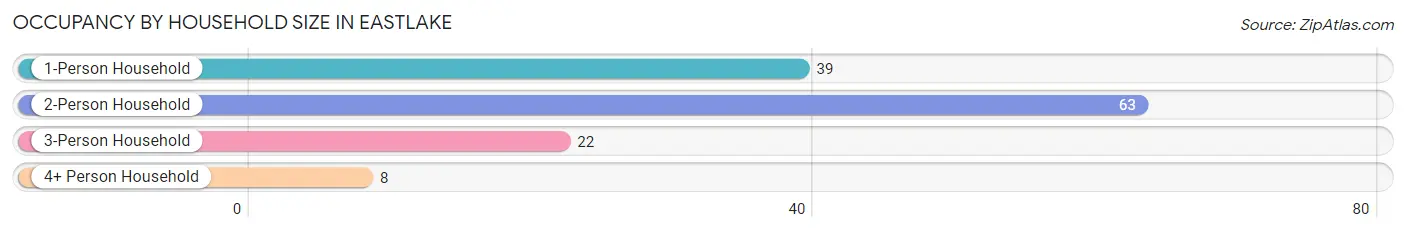
| Household Size | # Housing Units | % Housing Units |
| 1-Person Household | 39 | 29.5% |
| 2-Person Household | 63 | 47.7% |
| 3-Person Household | 22 | 16.7% |
| 4+ Person Household | 8 | 6.1% |
| Total Housing Units | 132 | 100.0% |
Occupancy by Ownership by Household Size in Eastlake
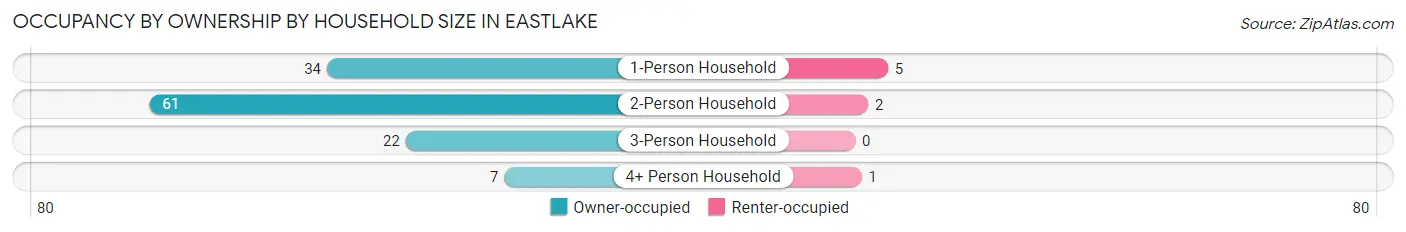
| Household Size | Owner-occupied | Renter-occupied |
| 1-Person Household | 34 (87.2%) | 5 (12.8%) |
| 2-Person Household | 61 (96.8%) | 2 (3.2%) |
| 3-Person Household | 22 (100.0%) | 0 (0.0%) |
| 4+ Person Household | 7 (87.5%) | 1 (12.5%) |
| Total Housing Units | 124 (93.9%) | 8 (6.1%) |
Occupancy by Educational Attainment in Eastlake
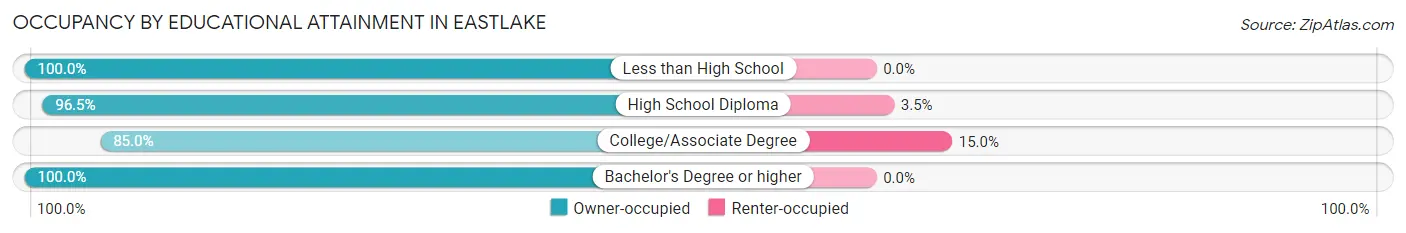
| Household Size | Owner-occupied | Renter-occupied |
| Less than High School | 9 (100.0%) | 0 (0.0%) |
| High School Diploma | 55 (96.5%) | 2 (3.5%) |
| College/Associate Degree | 34 (85.0%) | 6 (15.0%) |
| Bachelor's Degree or higher | 26 (100.0%) | 0 (0.0%) |
Occupancy by Age of Householder in Eastlake
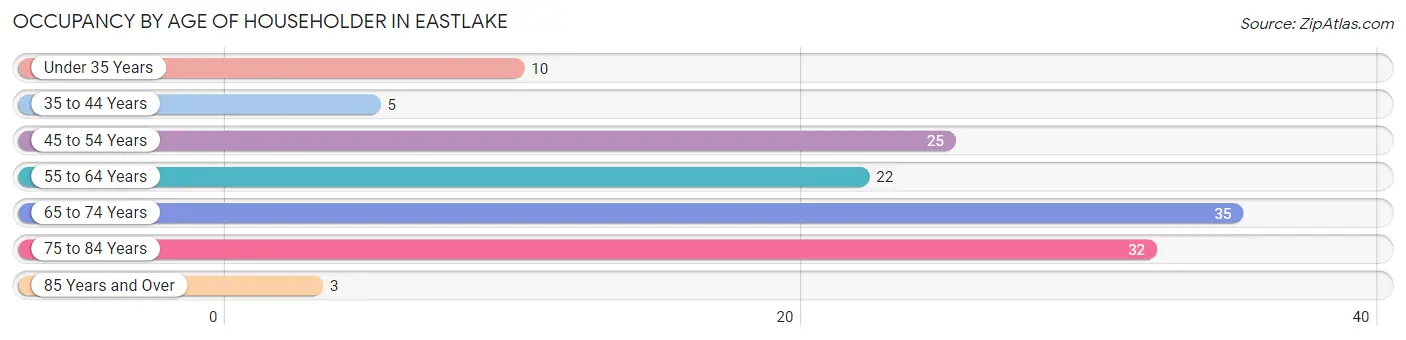
| Age Bracket | # Households | % Households |
| Under 35 Years | 10 | 7.6% |
| 35 to 44 Years | 5 | 3.8% |
| 45 to 54 Years | 25 | 18.9% |
| 55 to 64 Years | 22 | 16.7% |
| 65 to 74 Years | 35 | 26.5% |
| 75 to 84 Years | 32 | 24.2% |
| 85 Years and Over | 3 | 2.3% |
| Total | 132 | 100.0% |
Housing Finances in Eastlake
Median Income by Occupancy in Eastlake
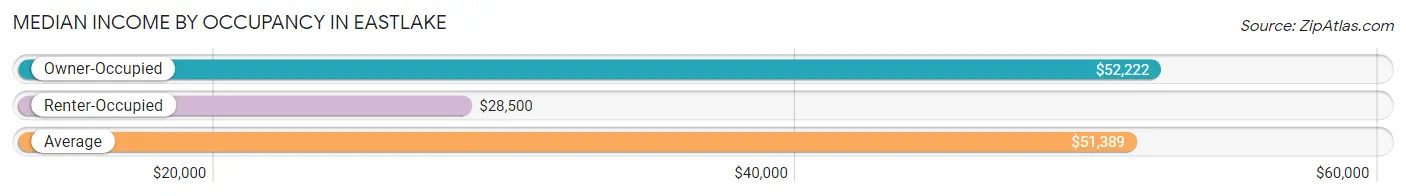
| Occupancy Type | # Households | Median Income |
| Owner-Occupied | 124 (93.9%) | $52,222 |
| Renter-Occupied | 8 (6.1%) | $28,500 |
| Average | 132 (100.0%) | $51,389 |
Occupancy by Householder Income Bracket in Eastlake
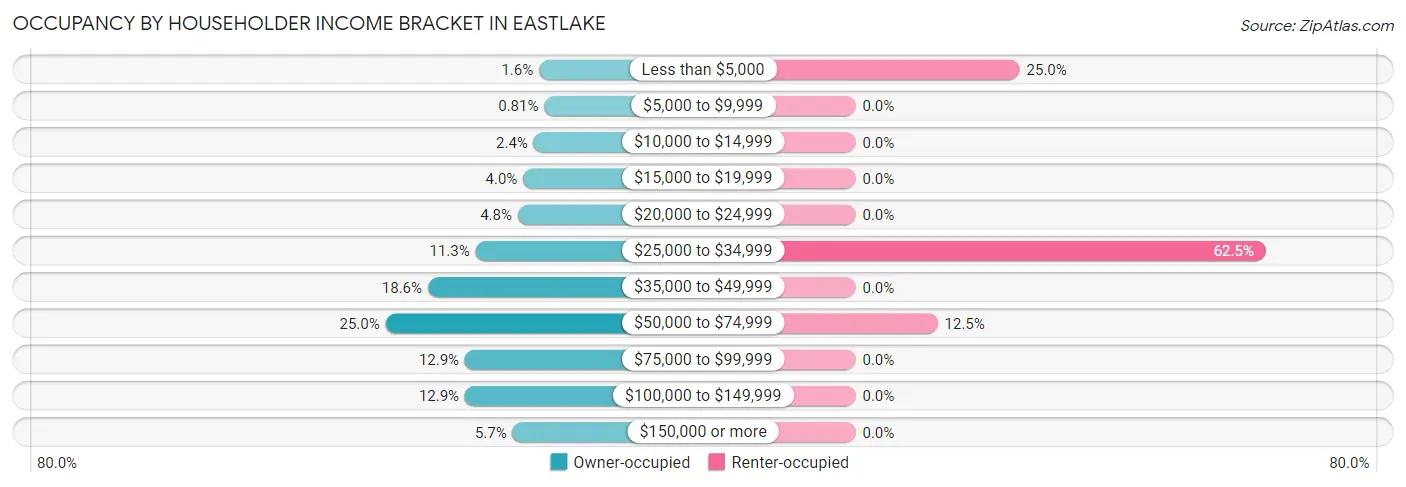
| Income Bracket | Owner-occupied | Renter-occupied |
| Less than $5,000 | 2 (1.6%) | 2 (25.0%) |
| $5,000 to $9,999 | 1 (0.8%) | 0 (0.0%) |
| $10,000 to $14,999 | 3 (2.4%) | 0 (0.0%) |
| $15,000 to $19,999 | 5 (4.0%) | 0 (0.0%) |
| $20,000 to $24,999 | 6 (4.8%) | 0 (0.0%) |
| $25,000 to $34,999 | 14 (11.3%) | 5 (62.5%) |
| $35,000 to $49,999 | 23 (18.5%) | 0 (0.0%) |
| $50,000 to $74,999 | 31 (25.0%) | 1 (12.5%) |
| $75,000 to $99,999 | 16 (12.9%) | 0 (0.0%) |
| $100,000 to $149,999 | 16 (12.9%) | 0 (0.0%) |
| $150,000 or more | 7 (5.7%) | 0 (0.0%) |
| Total | 124 (100.0%) | 8 (100.0%) |
Monthly Housing Cost Tiers in Eastlake
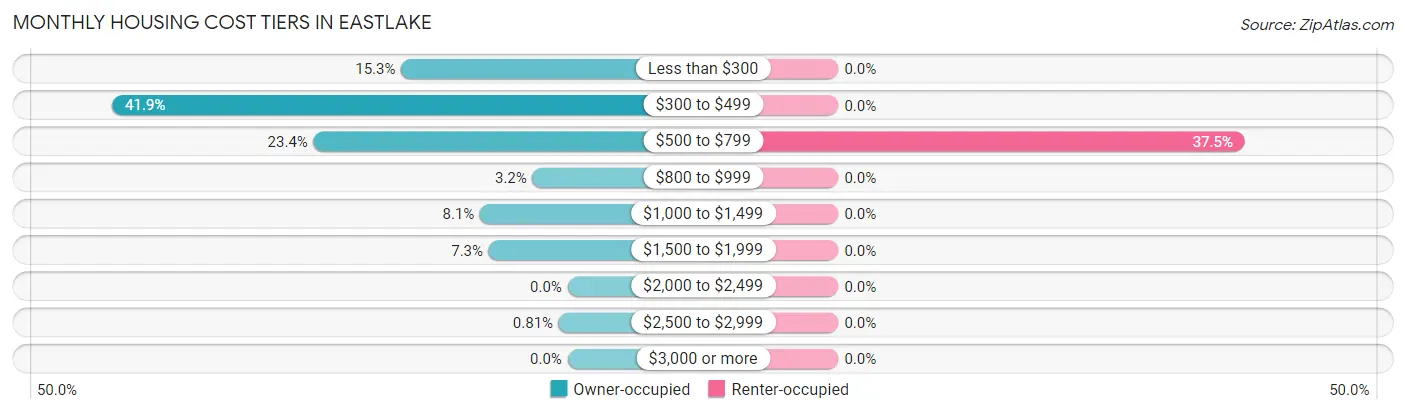
| Monthly Cost | Owner-occupied | Renter-occupied |
| Less than $300 | 19 (15.3%) | 0 (0.0%) |
| $300 to $499 | 52 (41.9%) | 0 (0.0%) |
| $500 to $799 | 29 (23.4%) | 3 (37.5%) |
| $800 to $999 | 4 (3.2%) | 0 (0.0%) |
| $1,000 to $1,499 | 10 (8.1%) | 0 (0.0%) |
| $1,500 to $1,999 | 9 (7.3%) | 0 (0.0%) |
| $2,000 to $2,499 | 0 (0.0%) | 0 (0.0%) |
| $2,500 to $2,999 | 1 (0.8%) | 0 (0.0%) |
| $3,000 or more | 0 (0.0%) | 0 (0.0%) |
| Total | 124 (100.0%) | 8 (100.0%) |
Physical Housing Characteristics in Eastlake
Housing Structures in Eastlake
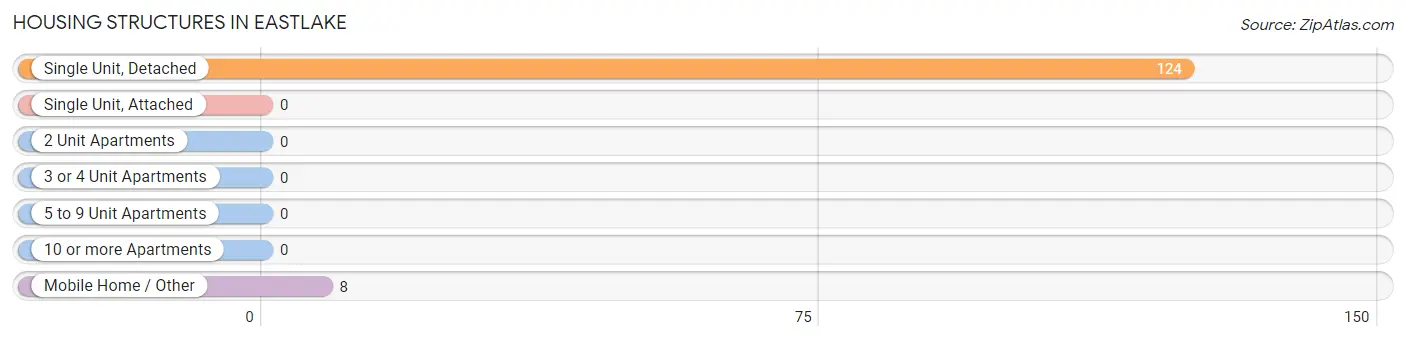
| Structure Type | # Housing Units | % Housing Units |
| Single Unit, Detached | 124 | 93.9% |
| Single Unit, Attached | 0 | 0.0% |
| 2 Unit Apartments | 0 | 0.0% |
| 3 or 4 Unit Apartments | 0 | 0.0% |
| 5 to 9 Unit Apartments | 0 | 0.0% |
| 10 or more Apartments | 0 | 0.0% |
| Mobile Home / Other | 8 | 6.1% |
| Total | 132 | 100.0% |
Housing Structures by Occupancy in Eastlake
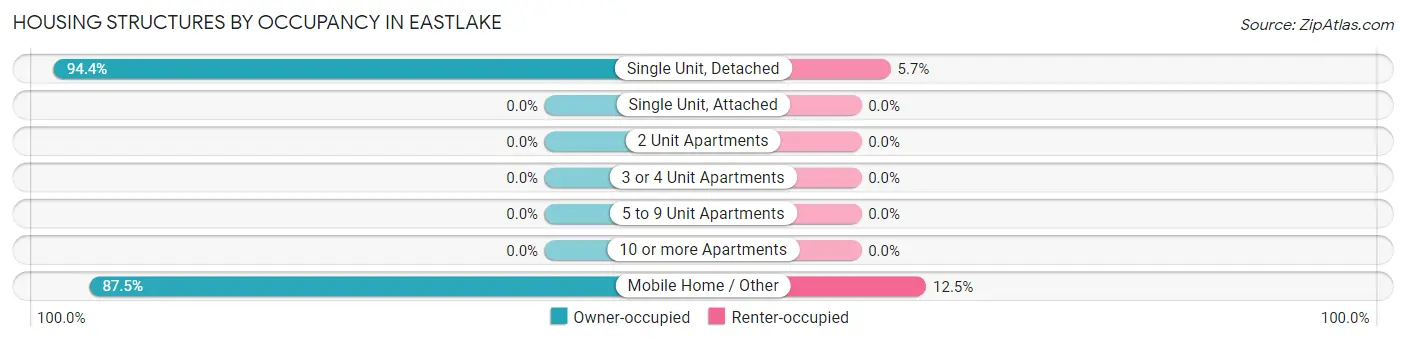
| Structure Type | Owner-occupied | Renter-occupied |
| Single Unit, Detached | 117 (94.4%) | 7 (5.7%) |
| Single Unit, Attached | 0 (0.0%) | 0 (0.0%) |
| 2 Unit Apartments | 0 (0.0%) | 0 (0.0%) |
| 3 or 4 Unit Apartments | 0 (0.0%) | 0 (0.0%) |
| 5 to 9 Unit Apartments | 0 (0.0%) | 0 (0.0%) |
| 10 or more Apartments | 0 (0.0%) | 0 (0.0%) |
| Mobile Home / Other | 7 (87.5%) | 1 (12.5%) |
| Total | 124 (93.9%) | 8 (6.1%) |
Housing Structures by Number of Rooms in Eastlake
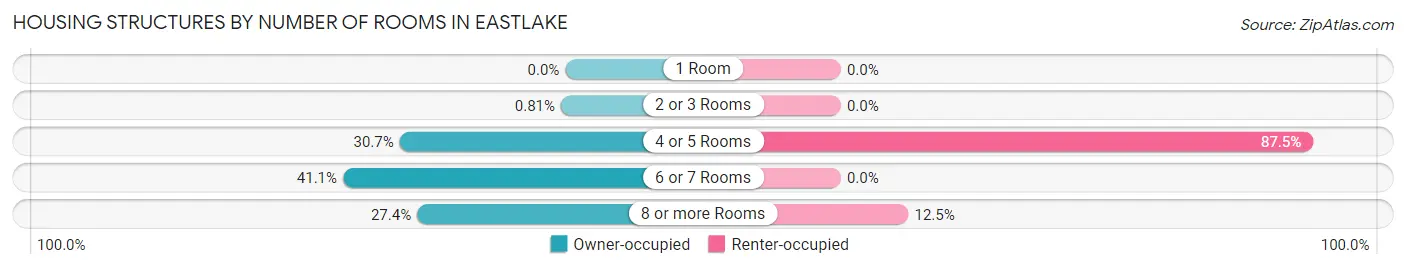
| Number of Rooms | Owner-occupied | Renter-occupied |
| 1 Room | 0 (0.0%) | 0 (0.0%) |
| 2 or 3 Rooms | 1 (0.8%) | 0 (0.0%) |
| 4 or 5 Rooms | 38 (30.6%) | 7 (87.5%) |
| 6 or 7 Rooms | 51 (41.1%) | 0 (0.0%) |
| 8 or more Rooms | 34 (27.4%) | 1 (12.5%) |
| Total | 124 (100.0%) | 8 (100.0%) |
Housing Structure by Heating Type in Eastlake
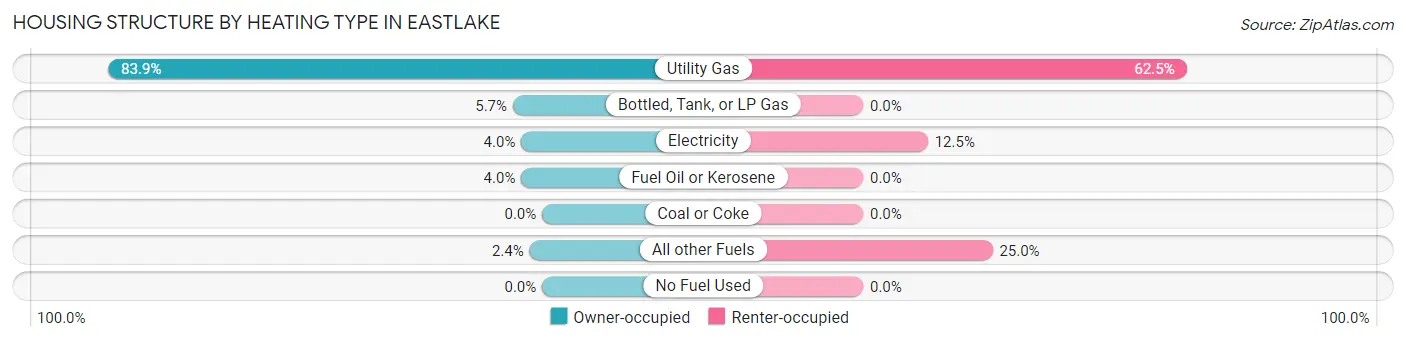
| Heating Type | Owner-occupied | Renter-occupied |
| Utility Gas | 104 (83.9%) | 5 (62.5%) |
| Bottled, Tank, or LP Gas | 7 (5.7%) | 0 (0.0%) |
| Electricity | 5 (4.0%) | 1 (12.5%) |
| Fuel Oil or Kerosene | 5 (4.0%) | 0 (0.0%) |
| Coal or Coke | 0 (0.0%) | 0 (0.0%) |
| All other Fuels | 3 (2.4%) | 2 (25.0%) |
| No Fuel Used | 0 (0.0%) | 0 (0.0%) |
| Total | 124 (100.0%) | 8 (100.0%) |
Household Vehicle Usage in Eastlake
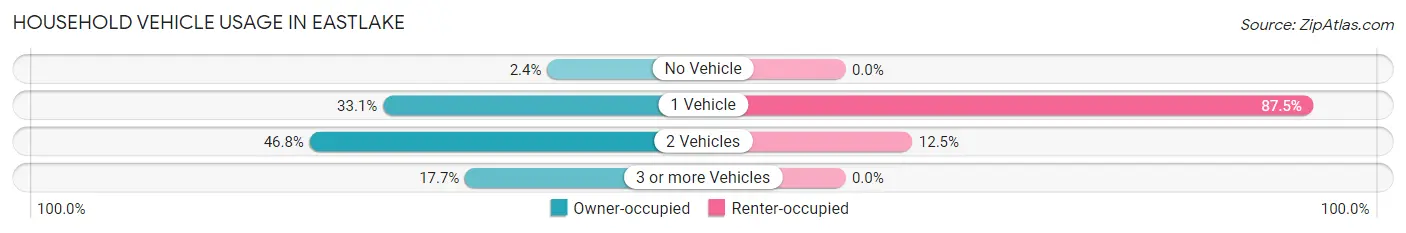
| Vehicles per Household | Owner-occupied | Renter-occupied |
| No Vehicle | 3 (2.4%) | 0 (0.0%) |
| 1 Vehicle | 41 (33.1%) | 7 (87.5%) |
| 2 Vehicles | 58 (46.8%) | 1 (12.5%) |
| 3 or more Vehicles | 22 (17.7%) | 0 (0.0%) |
| Total | 124 (100.0%) | 8 (100.0%) |
Real Estate & Mortgages in Eastlake
Real Estate and Mortgage Overview in Eastlake
| Characteristic | Without Mortgage | With Mortgage |
| Housing Units | 80 | 44 |
| Median Property Value | $111,300 | $152,100 |
| Median Household Income | $48,333 | $7 |
| Monthly Housing Costs | $348 | $0 |
| Real Estate Taxes | $1,587 | $2 |
Property Value by Mortgage Status in Eastlake
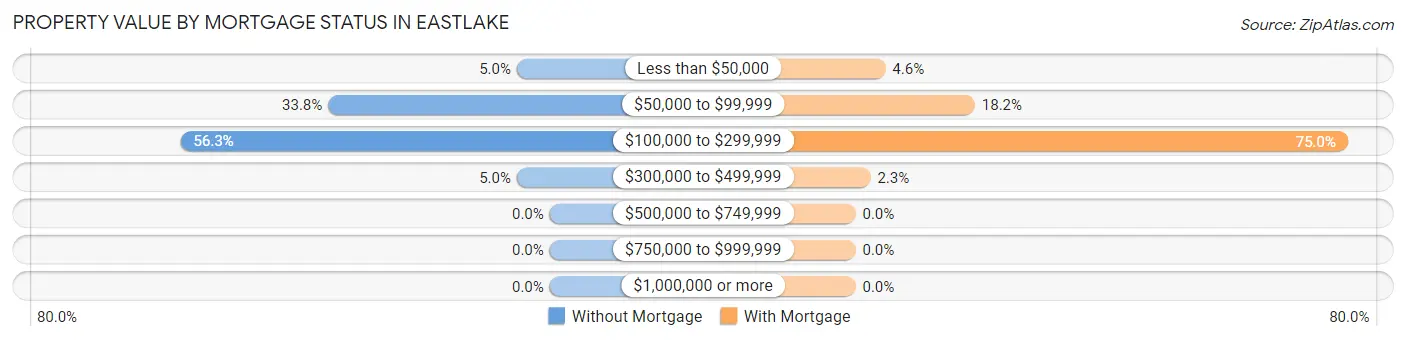
| Property Value | Without Mortgage | With Mortgage |
| Less than $50,000 | 4 (5.0%) | 2 (4.5%) |
| $50,000 to $99,999 | 27 (33.8%) | 8 (18.2%) |
| $100,000 to $299,999 | 45 (56.2%) | 33 (75.0%) |
| $300,000 to $499,999 | 4 (5.0%) | 1 (2.3%) |
| $500,000 to $749,999 | 0 (0.0%) | 0 (0.0%) |
| $750,000 to $999,999 | 0 (0.0%) | 0 (0.0%) |
| $1,000,000 or more | 0 (0.0%) | 0 (0.0%) |
| Total | 80 (100.0%) | 44 (100.0%) |
Household Income by Mortgage Status in Eastlake
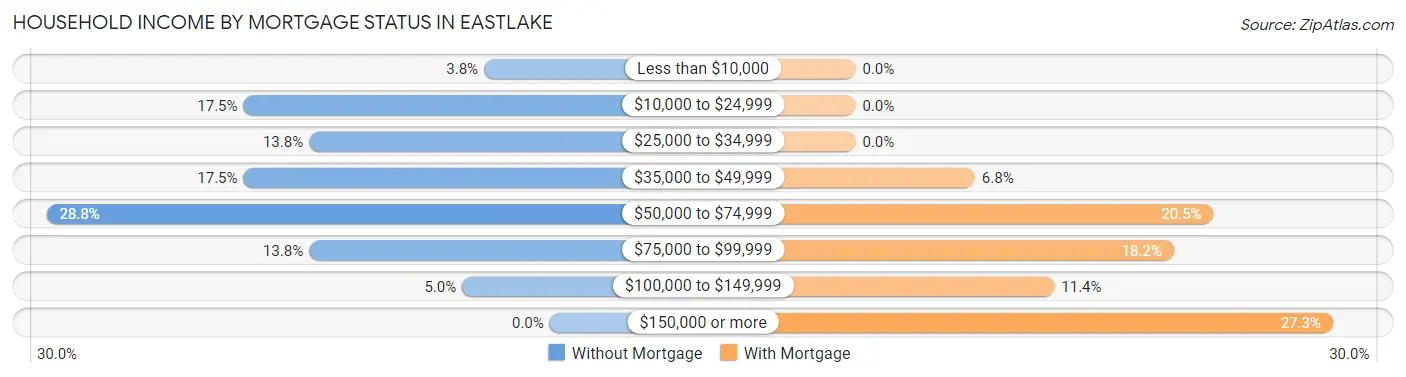
| Household Income | Without Mortgage | With Mortgage |
| Less than $10,000 | 3 (3.7%) | 0 (0.0%) |
| $10,000 to $24,999 | 14 (17.5%) | 0 (0.0%) |
| $25,000 to $34,999 | 11 (13.8%) | 0 (0.0%) |
| $35,000 to $49,999 | 14 (17.5%) | 3 (6.8%) |
| $50,000 to $74,999 | 23 (28.7%) | 9 (20.4%) |
| $75,000 to $99,999 | 11 (13.8%) | 8 (18.2%) |
| $100,000 to $149,999 | 4 (5.0%) | 5 (11.4%) |
| $150,000 or more | 0 (0.0%) | 12 (27.3%) |
| Total | 80 (100.0%) | 44 (100.0%) |
Property Value to Household Income Ratio in Eastlake
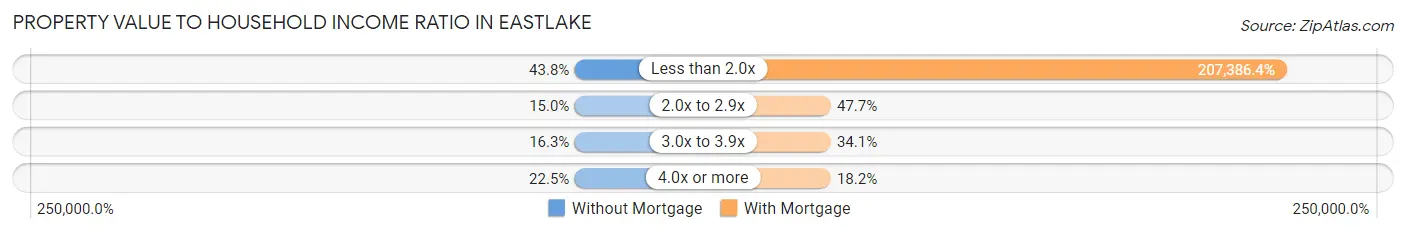
| Value-to-Income Ratio | Without Mortgage | With Mortgage |
| Less than 2.0x | 35 (43.8%) | 91,250 (207,386.4%) |
| 2.0x to 2.9x | 12 (15.0%) | 21 (47.7%) |
| 3.0x to 3.9x | 13 (16.3%) | 15 (34.1%) |
| 4.0x or more | 18 (22.5%) | 8 (18.2%) |
| Total | 80 (100.0%) | 44 (100.0%) |
Real Estate Taxes by Mortgage Status in Eastlake
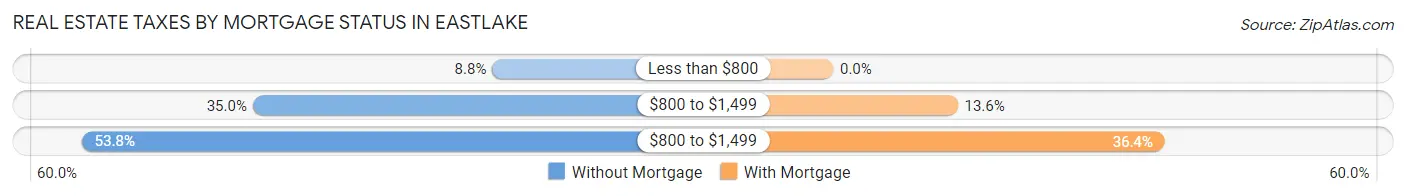
| Property Taxes | Without Mortgage | With Mortgage |
| Less than $800 | 7 (8.7%) | 0 (0.0%) |
| $800 to $1,499 | 28 (35.0%) | 6 (13.6%) |
| $800 to $1,499 | 43 (53.7%) | 16 (36.4%) |
| Total | 80 (100.0%) | 44 (100.0%) |
Health & Disability in Eastlake
Health Insurance Coverage by Age in Eastlake
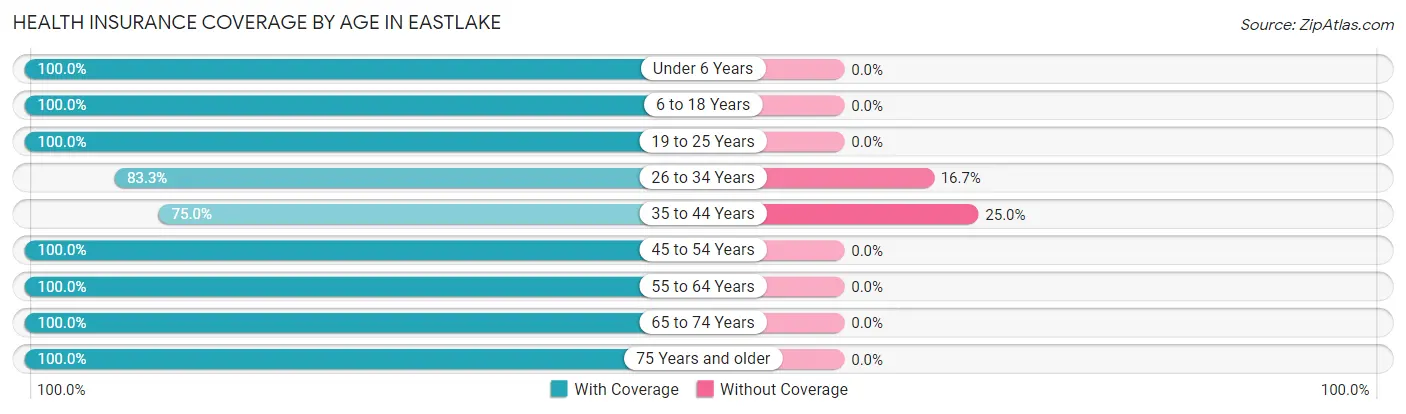
| Age Bracket | With Coverage | Without Coverage |
| Under 6 Years | 8 (100.0%) | 0 (0.0%) |
| 6 to 18 Years | 16 (100.0%) | 0 (0.0%) |
| 19 to 25 Years | 11 (100.0%) | 0 (0.0%) |
| 26 to 34 Years | 30 (83.3%) | 6 (16.7%) |
| 35 to 44 Years | 18 (75.0%) | 6 (25.0%) |
| 45 to 54 Years | 46 (100.0%) | 0 (0.0%) |
| 55 to 64 Years | 41 (100.0%) | 0 (0.0%) |
| 65 to 74 Years | 53 (100.0%) | 0 (0.0%) |
| 75 Years and older | 46 (100.0%) | 0 (0.0%) |
| Total | 269 (95.7%) | 12 (4.3%) |
Health Insurance Coverage by Citizenship Status in Eastlake
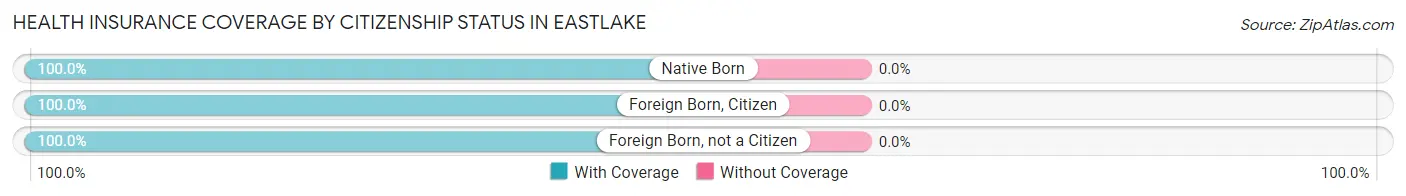
| Citizenship Status | With Coverage | Without Coverage |
| Native Born | 8 (100.0%) | 0 (0.0%) |
| Foreign Born, Citizen | 16 (100.0%) | 0 (0.0%) |
| Foreign Born, not a Citizen | 11 (100.0%) | 0 (0.0%) |
Health Insurance Coverage by Household Income in Eastlake
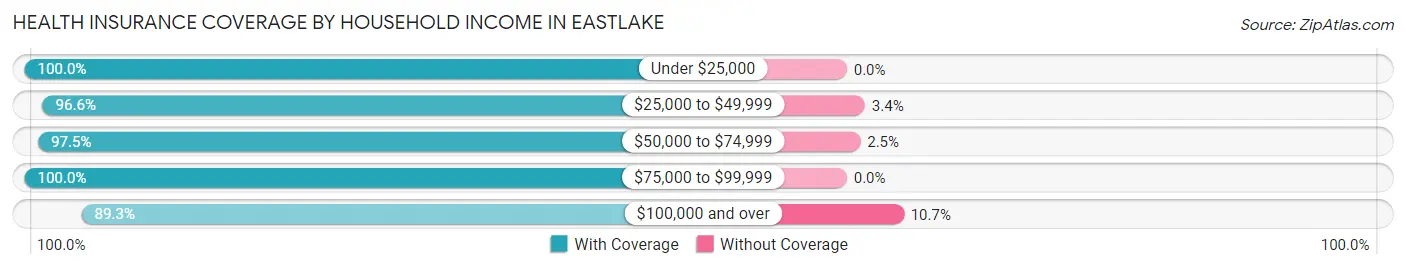
| Household Income | With Coverage | Without Coverage |
| Under $25,000 | 29 (100.0%) | 0 (0.0%) |
| $25,000 to $49,999 | 57 (96.6%) | 2 (3.4%) |
| $50,000 to $74,999 | 77 (97.5%) | 2 (2.5%) |
| $75,000 to $99,999 | 39 (100.0%) | 0 (0.0%) |
| $100,000 and over | 67 (89.3%) | 8 (10.7%) |
Public vs Private Health Insurance Coverage by Age in Eastlake
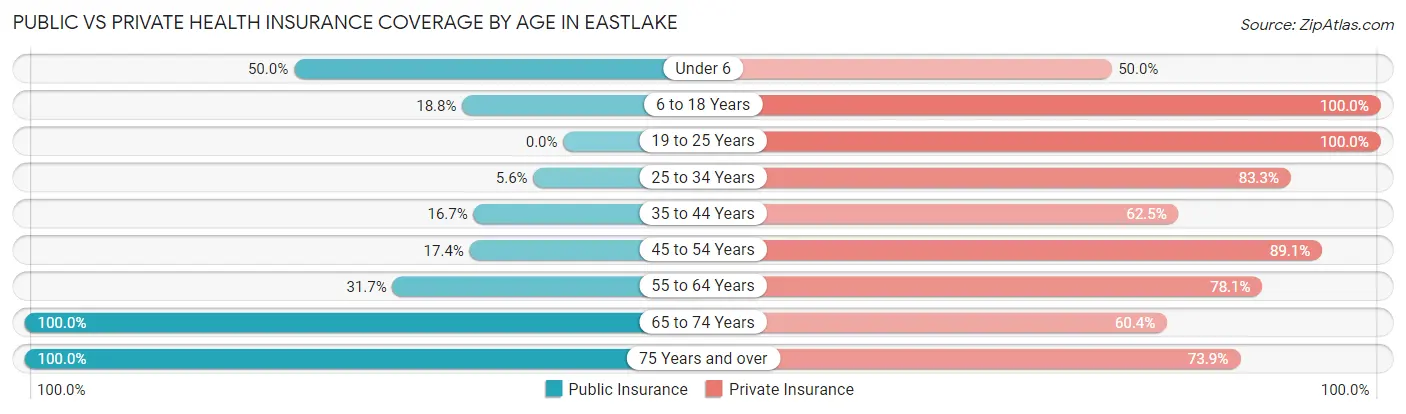
| Age Bracket | Public Insurance | Private Insurance |
| Under 6 | 4 (50.0%) | 4 (50.0%) |
| 6 to 18 Years | 3 (18.8%) | 16 (100.0%) |
| 19 to 25 Years | 0 (0.0%) | 11 (100.0%) |
| 25 to 34 Years | 2 (5.6%) | 30 (83.3%) |
| 35 to 44 Years | 4 (16.7%) | 15 (62.5%) |
| 45 to 54 Years | 8 (17.4%) | 41 (89.1%) |
| 55 to 64 Years | 13 (31.7%) | 32 (78.0%) |
| 65 to 74 Years | 53 (100.0%) | 32 (60.4%) |
| 75 Years and over | 46 (100.0%) | 34 (73.9%) |
| Total | 133 (47.3%) | 215 (76.5%) |
Disability Status by Sex by Age in Eastlake
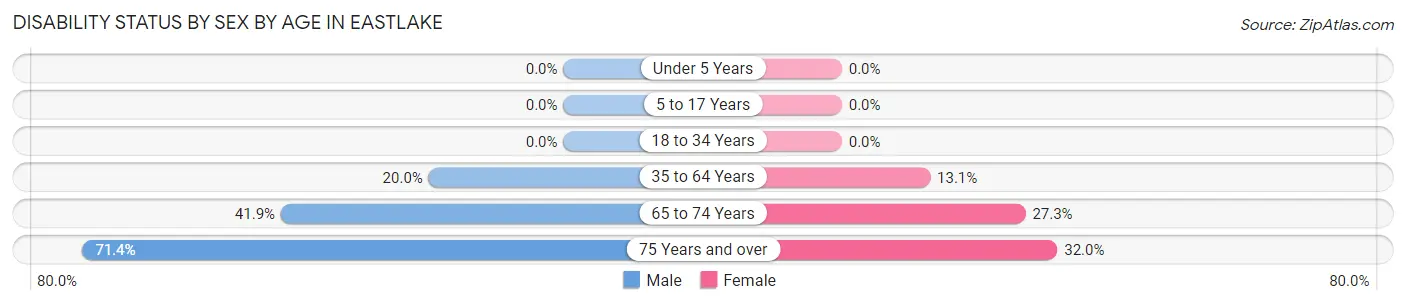
| Age Bracket | Male | Female |
| Under 5 Years | 0 (0.0%) | 0 (0.0%) |
| 5 to 17 Years | 0 (0.0%) | 0 (0.0%) |
| 18 to 34 Years | 0 (0.0%) | 0 (0.0%) |
| 35 to 64 Years | 10 (20.0%) | 8 (13.1%) |
| 65 to 74 Years | 13 (41.9%) | 6 (27.3%) |
| 75 Years and over | 15 (71.4%) | 8 (32.0%) |
Disability Class by Sex by Age in Eastlake
Disability Class: Hearing Difficulty
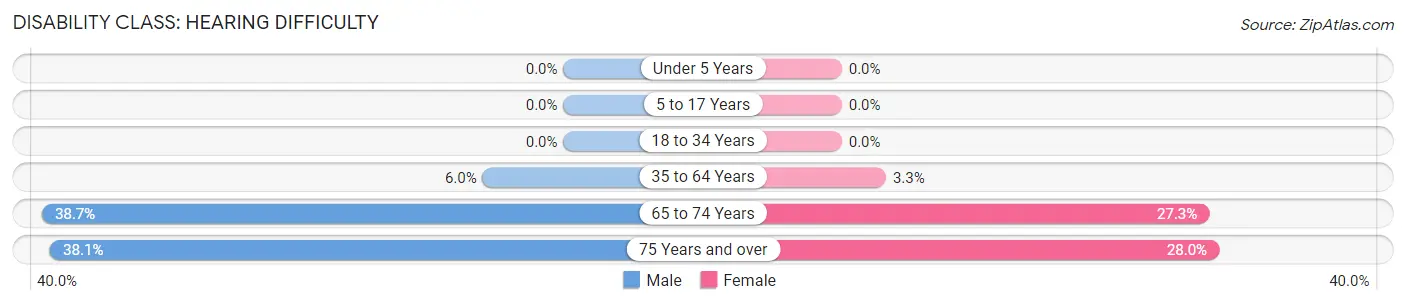
| Age Bracket | Male | Female |
| Under 5 Years | 0 (0.0%) | 0 (0.0%) |
| 5 to 17 Years | 0 (0.0%) | 0 (0.0%) |
| 18 to 34 Years | 0 (0.0%) | 0 (0.0%) |
| 35 to 64 Years | 3 (6.0%) | 2 (3.3%) |
| 65 to 74 Years | 12 (38.7%) | 6 (27.3%) |
| 75 Years and over | 8 (38.1%) | 7 (28.0%) |
Disability Class: Vision Difficulty
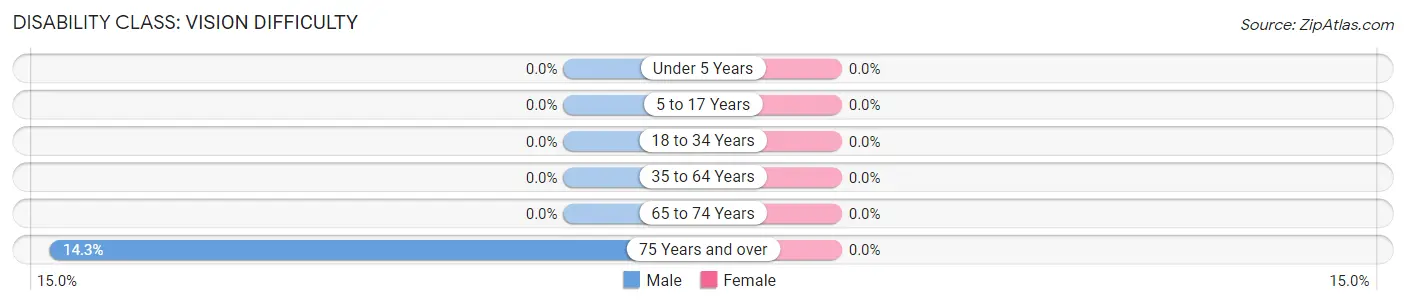
| Age Bracket | Male | Female |
| Under 5 Years | 0 (0.0%) | 0 (0.0%) |
| 5 to 17 Years | 0 (0.0%) | 0 (0.0%) |
| 18 to 34 Years | 0 (0.0%) | 0 (0.0%) |
| 35 to 64 Years | 0 (0.0%) | 0 (0.0%) |
| 65 to 74 Years | 0 (0.0%) | 0 (0.0%) |
| 75 Years and over | 3 (14.3%) | 0 (0.0%) |
Disability Class: Cognitive Difficulty
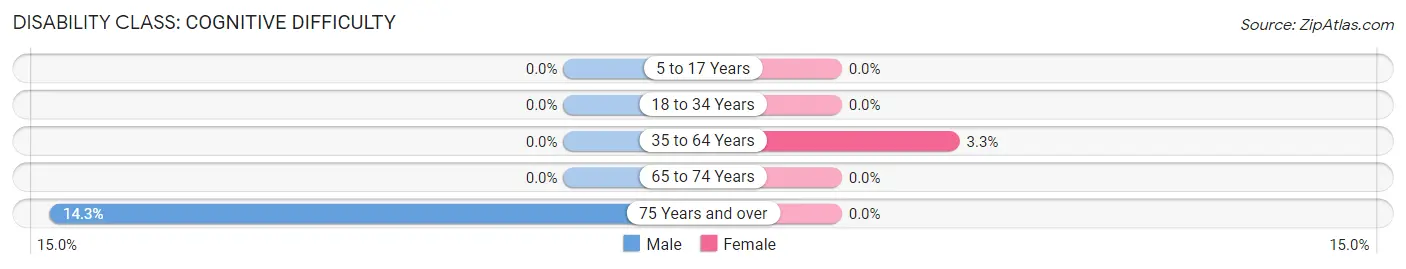
| Age Bracket | Male | Female |
| 5 to 17 Years | 0 (0.0%) | 0 (0.0%) |
| 18 to 34 Years | 0 (0.0%) | 0 (0.0%) |
| 35 to 64 Years | 0 (0.0%) | 2 (3.3%) |
| 65 to 74 Years | 0 (0.0%) | 0 (0.0%) |
| 75 Years and over | 3 (14.3%) | 0 (0.0%) |
Disability Class: Ambulatory Difficulty
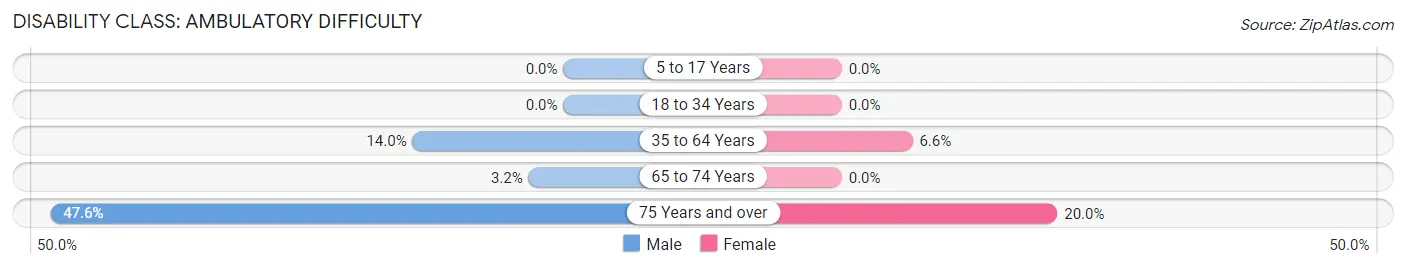
| Age Bracket | Male | Female |
| 5 to 17 Years | 0 (0.0%) | 0 (0.0%) |
| 18 to 34 Years | 0 (0.0%) | 0 (0.0%) |
| 35 to 64 Years | 7 (14.0%) | 4 (6.6%) |
| 65 to 74 Years | 1 (3.2%) | 0 (0.0%) |
| 75 Years and over | 10 (47.6%) | 5 (20.0%) |
Disability Class: Self-Care Difficulty
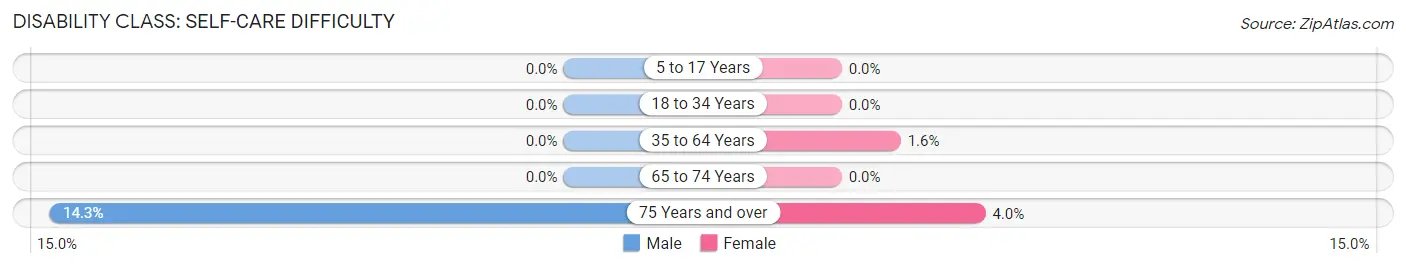
| Age Bracket | Male | Female |
| 5 to 17 Years | 0 (0.0%) | 0 (0.0%) |
| 18 to 34 Years | 0 (0.0%) | 0 (0.0%) |
| 35 to 64 Years | 0 (0.0%) | 1 (1.6%) |
| 65 to 74 Years | 0 (0.0%) | 0 (0.0%) |
| 75 Years and over | 3 (14.3%) | 1 (4.0%) |
Technology Access in Eastlake
Computing Device Access in Eastlake
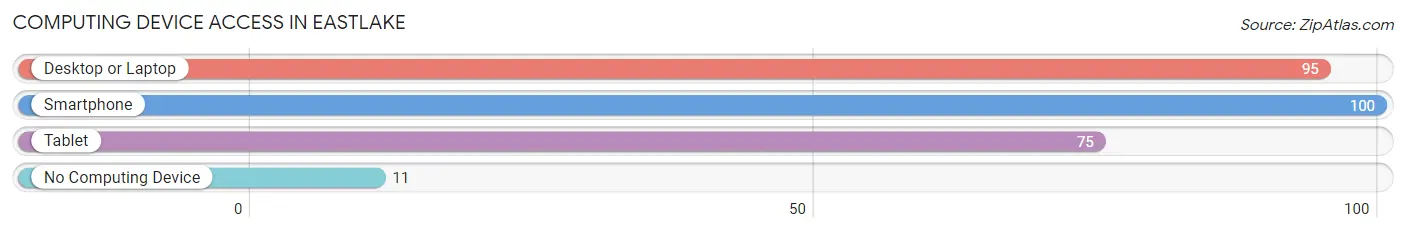
| Device Type | # Households | % Households |
| Desktop or Laptop | 95 | 72.0% |
| Smartphone | 100 | 75.8% |
| Tablet | 75 | 56.8% |
| No Computing Device | 11 | 8.3% |
| Total | 132 | 100.0% |
Internet Access in Eastlake
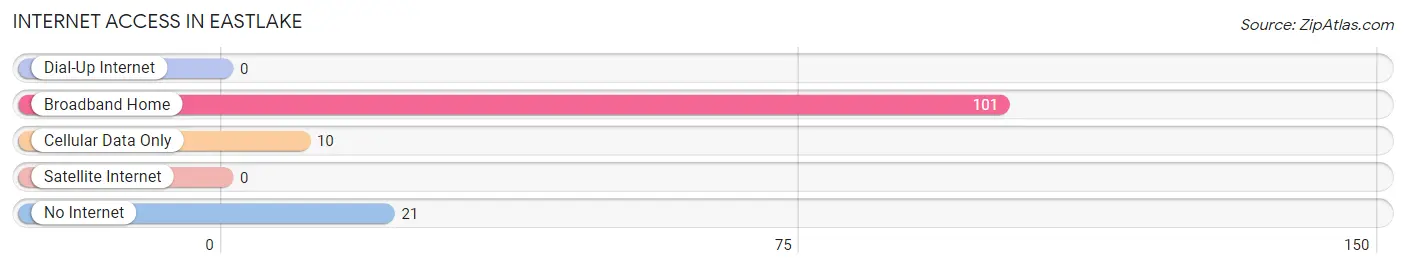
| Internet Type | # Households | % Households |
| Dial-Up Internet | 0 | 0.0% |
| Broadband Home | 101 | 76.5% |
| Cellular Data Only | 10 | 7.6% |
| Satellite Internet | 0 | 0.0% |
| No Internet | 21 | 15.9% |
| Total | 132 | 100.0% |
Eastlake Summary
History
Eastlake is a city located in the state of Michigan in the United States. It is located in the county of Macomb and is part of the Detroit metropolitan area. The city was founded in 1837 and was originally known as East Lake. The name was changed to Eastlake in 1891.
The area was originally inhabited by the Potawatomi Native American tribe. The first settlers to the area were French fur traders who arrived in the late 1700s. The first permanent settlers were farmers who arrived in the early 1800s. The city was officially incorporated in 1837 and was named after the nearby lake.
The city grew slowly in the 19th century, but experienced a period of rapid growth in the early 20th century. This was due to the development of the automobile industry in the Detroit area. The city was home to several auto parts manufacturers, as well as a number of other industries.
Geography
Eastlake is located in the southeastern corner of Macomb County, Michigan. It is situated on the shores of Lake St. Clair, which is part of the Great Lakes system. The city is bordered by the cities of St. Clair Shores to the north, Roseville to the east, and Warren to the south.
The city has a total area of 4.2 square miles, of which 4.1 square miles is land and 0.1 square miles is water. The terrain is mostly flat, with some rolling hills in the northern part of the city. The city is located in the humid continental climate zone, with hot summers and cold winters.
Economy
Eastlake’s economy is largely based on manufacturing and retail. The city is home to several auto parts manufacturers, as well as a number of other industries. The city is also home to several retail stores, including a Walmart Supercenter and a Meijer store.
The city’s largest employer is the Eastlake Community Schools, which employs over 1,000 people. Other major employers include the Eastlake Public Library, Eastlake City Hall, and Eastlake Fire Department.
Demographics
As of the 2010 census, the population of Eastlake was 11,945. The racial makeup of the city was 79.3% White, 14.2% African American, 0.5% Native American, 1.2% Asian, 0.1% Pacific Islander, and 4.7% from other races. Hispanic or Latino of any race were 5.3% of the population.
The median household income in Eastlake was $45,945, and the median family income was $54,945. The per capita income was $21,945. About 8.3% of families and 10.2% of the population were below the poverty line, including 14.2% of those under age 18 and 6.2% of those age 65 or over.
Common Questions
What is Per Capita Income in Eastlake?
Per Capita income in Eastlake is $33,147.
What is the Median Family Income in Eastlake?
Median Family Income in Eastlake is $59,375.
What is the Median Household income in Eastlake?
Median Household Income in Eastlake is $51,389.
What is Income or Wage Gap in Eastlake?
Income or Wage Gap in Eastlake is 8.2%.
Women in Eastlake earn 91.8 cents for every dollar earned by a man.
What is Inequality or Gini Index in Eastlake?
Inequality or Gini Index in Eastlake is 0.42.
What is the Total Population of Eastlake?
Total Population of Eastlake is 281.
What is the Total Male Population of Eastlake?
Total Male Population of Eastlake is 142.
What is the Total Female Population of Eastlake?
Total Female Population of Eastlake is 139.
What is the Ratio of Males per 100 Females in Eastlake?
There are 102.16 Males per 100 Females in Eastlake.
What is the Ratio of Females per 100 Males in Eastlake?
There are 97.89 Females per 100 Males in Eastlake.
What is the Median Population Age in Eastlake?
Median Population Age in Eastlake is 54.9 Years.
What is the Average Family Size in Eastlake
Average Family Size in Eastlake is 2.7 People.
What is the Average Household Size in Eastlake
Average Household Size in Eastlake is 2.1 People.
How Large is the Labor Force in Eastlake?
There are 129 People in the Labor Forcein in Eastlake.
What is the Percentage of People in the Labor Force in Eastlake?
49.0% of People are in the Labor Force in Eastlake.
What is the Unemployment Rate in Eastlake?
Unemployment Rate in Eastlake is 2.3%.