Charlotte, MI Map & Demographics
Charlotte Map
Charlotte Overview
$28,042
PER CAPITA INCOME
$76,688
AVG FAMILY INCOME
$65,507
AVG HOUSEHOLD INCOME
33.5%
WAGE / INCOME GAP [ % ]
66.5¢/ $1
WAGE / INCOME GAP [ $ ]
0.37
INEQUALITY / GINI INDEX
9,273
TOTAL POPULATION
4,707
MALE POPULATION
4,566
FEMALE POPULATION
103.09
MALES / 100 FEMALES
97.00
FEMALES / 100 MALES
35.7
MEDIAN AGE
3.2
AVG FAMILY SIZE
2.6
AVG HOUSEHOLD SIZE
4,430
LABOR FORCE [ PEOPLE ]
59.5%
PERCENT IN LABOR FORCE
6.2%
UNEMPLOYMENT RATE
Charlotte Zip Codes
Charlotte Area Codes
Income in Charlotte
Income Overview in Charlotte
Per Capita Income in Charlotte is $28,042, while median incomes of families and households are $76,688 and $65,507 respectively.
| Characteristic | Number | Measure |
| Per Capita Income | 9,273 | $28,042 |
| Median Family Income | 2,080 | $76,688 |
| Mean Family Income | 2,080 | $84,296 |
| Median Household Income | 3,443 | $65,507 |
| Mean Household Income | 3,443 | $71,758 |
| Income Deficit | 2,080 | $0 |
| Wage / Income Gap (%) | 9,273 | 33.49% |
| Wage / Income Gap ($) | 9,273 | 66.51¢ per $1 |
| Gini / Inequality Index | 9,273 | 0.37 |
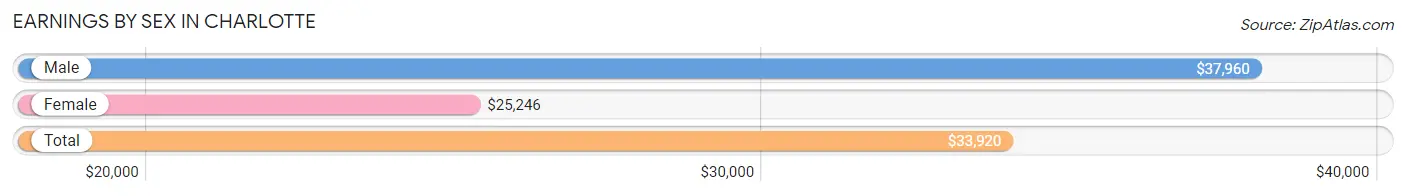
Earnings by Sex in Charlotte
Average Earnings in Charlotte are $33,920, $37,960 for men and $25,246 for women, a difference of 33.5%.
| Sex | Number | Average Earnings |
| Male | 2,732 (55.7%) | $37,960 |
| Female | 2,170 (44.3%) | $25,246 |
| Total | 4,902 (100.0%) | $33,920 |
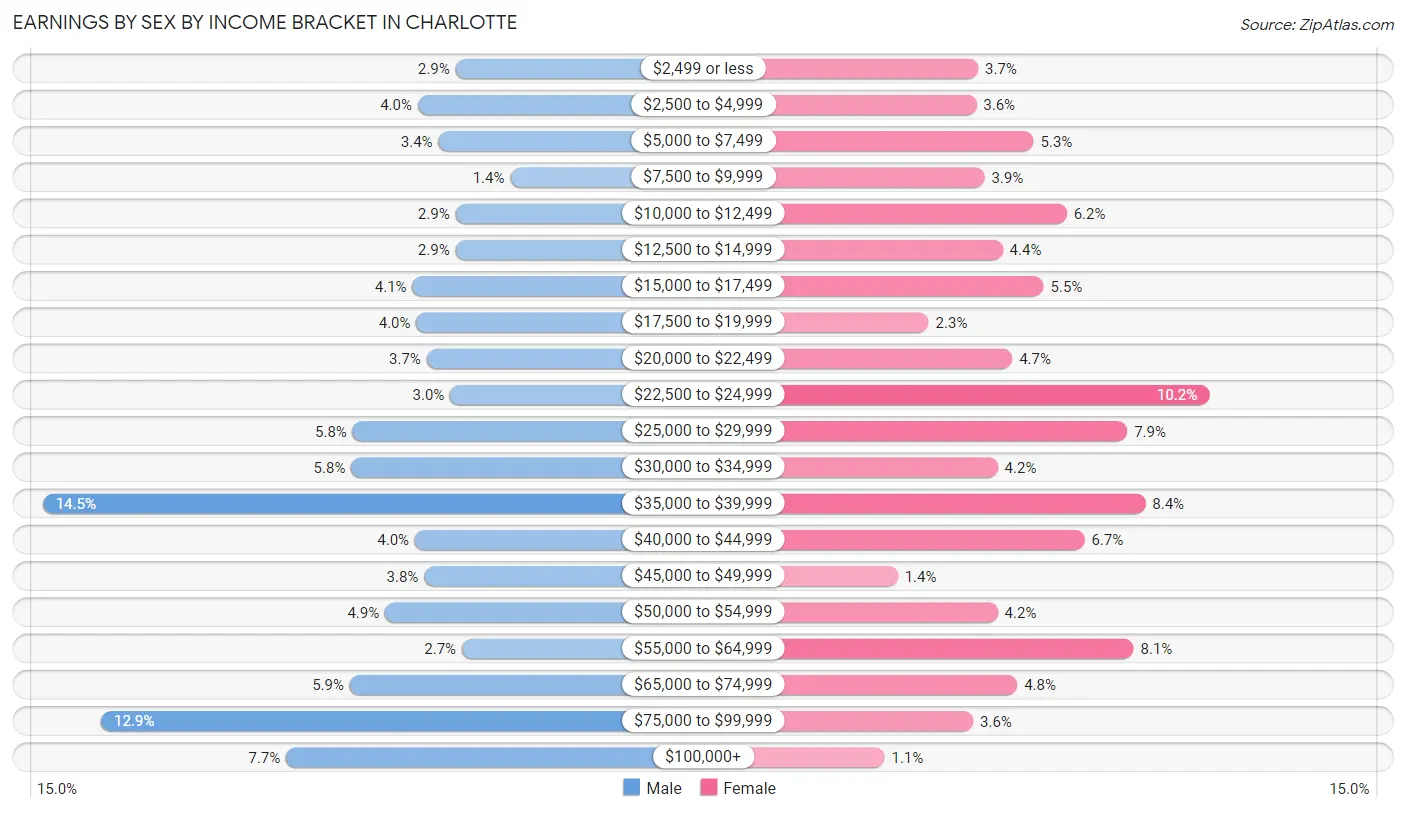
Earnings by Sex by Income Bracket in Charlotte
The most common earnings brackets in Charlotte are $35,000 to $39,999 for men (396 | 14.5%) and $22,500 to $24,999 for women (221 | 10.2%).
| Income | Male | Female |
| $2,499 or less | 79 (2.9%) | 80 (3.7%) |
| $2,500 to $4,999 | 108 (4.0%) | 79 (3.6%) |
| $5,000 to $7,499 | 92 (3.4%) | 114 (5.2%) |
| $7,500 to $9,999 | 37 (1.3%) | 84 (3.9%) |
| $10,000 to $12,499 | 79 (2.9%) | 134 (6.2%) |
| $12,500 to $14,999 | 79 (2.9%) | 95 (4.4%) |
| $15,000 to $17,499 | 112 (4.1%) | 120 (5.5%) |
| $17,500 to $19,999 | 109 (4.0%) | 50 (2.3%) |
| $20,000 to $22,499 | 101 (3.7%) | 101 (4.6%) |
| $22,500 to $24,999 | 83 (3.0%) | 221 (10.2%) |
| $25,000 to $29,999 | 158 (5.8%) | 171 (7.9%) |
| $30,000 to $34,999 | 159 (5.8%) | 92 (4.2%) |
| $35,000 to $39,999 | 396 (14.5%) | 182 (8.4%) |
| $40,000 to $44,999 | 110 (4.0%) | 145 (6.7%) |
| $45,000 to $49,999 | 103 (3.8%) | 31 (1.4%) |
| $50,000 to $54,999 | 133 (4.9%) | 92 (4.2%) |
| $55,000 to $64,999 | 74 (2.7%) | 175 (8.1%) |
| $65,000 to $74,999 | 160 (5.9%) | 104 (4.8%) |
| $75,000 to $99,999 | 351 (12.9%) | 77 (3.5%) |
| $100,000+ | 209 (7.6%) | 23 (1.1%) |
| Total | 2,732 (100.0%) | 2,170 (100.0%) |
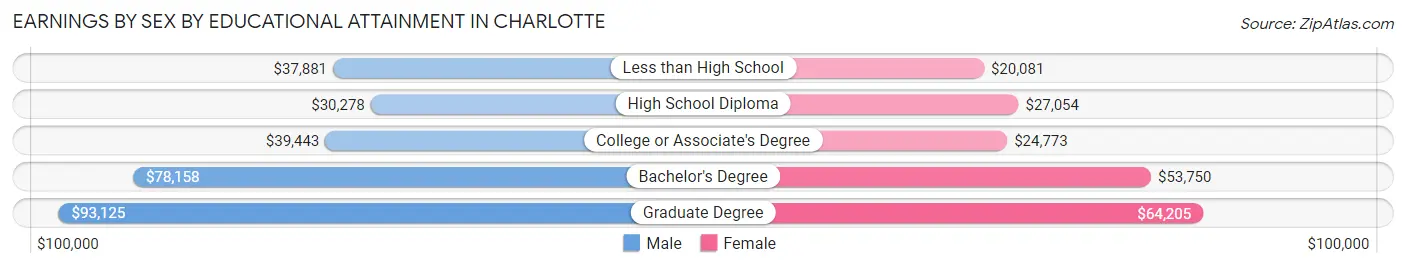
Earnings by Sex by Educational Attainment in Charlotte
Average earnings in Charlotte are $39,507 for men and $29,726 for women, a difference of 24.8%. Men with an educational attainment of graduate degree enjoy the highest average annual earnings of $93,125, while those with high school diploma education earn the least with $30,278. Women with an educational attainment of graduate degree earn the most with the average annual earnings of $64,205, while those with less than high school education have the smallest earnings of $20,081.
| Educational Attainment | Male Income | Female Income |
| Less than High School | $37,881 | $20,081 |
| High School Diploma | $30,278 | $27,054 |
| College or Associate's Degree | $39,443 | $24,773 |
| Bachelor's Degree | $78,158 | $53,750 |
| Graduate Degree | $93,125 | $64,205 |
| Total | $39,507 | $29,726 |
Family Income in Charlotte
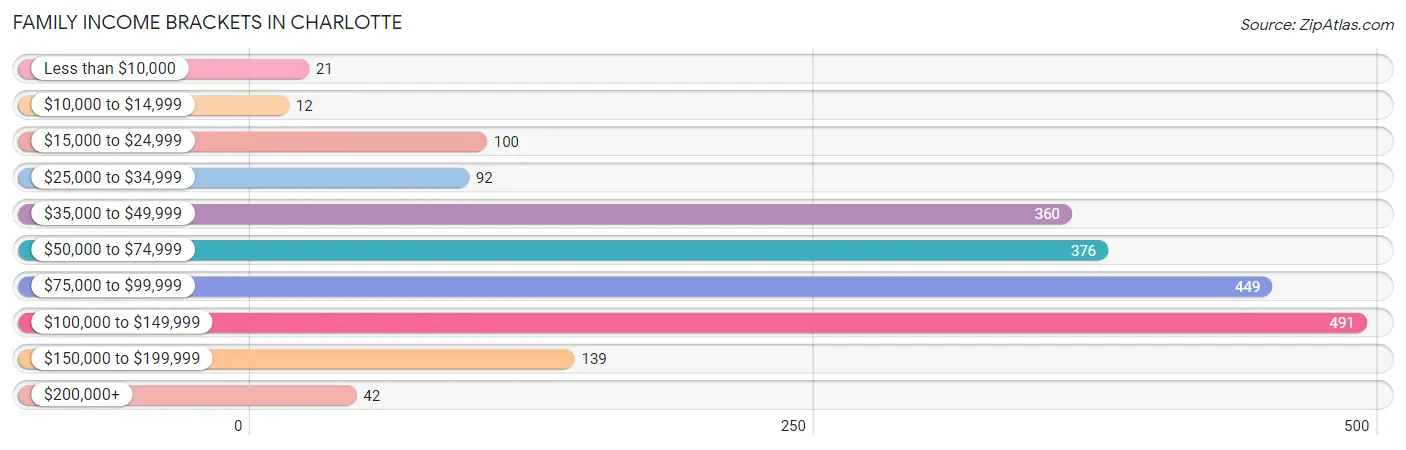
Family Income Brackets in Charlotte
According to the Charlotte family income data, there are 491 families falling into the $100,000 to $149,999 income range, which is the most common income bracket and makes up 23.6% of all families. Conversely, the $10,000 to $14,999 income bracket is the least frequent group with only 12 families (0.6%) belonging to this category.
| Income Bracket | # Families | % Families |
| Less than $10,000 | 21 | 1.0% |
| $10,000 to $14,999 | 12 | 0.6% |
| $15,000 to $24,999 | 100 | 4.8% |
| $25,000 to $34,999 | 92 | 4.4% |
| $35,000 to $49,999 | 360 | 17.3% |
| $50,000 to $74,999 | 376 | 18.1% |
| $75,000 to $99,999 | 449 | 21.6% |
| $100,000 to $149,999 | 491 | 23.6% |
| $150,000 to $199,999 | 139 | 6.7% |
| $200,000+ | 42 | 2.0% |
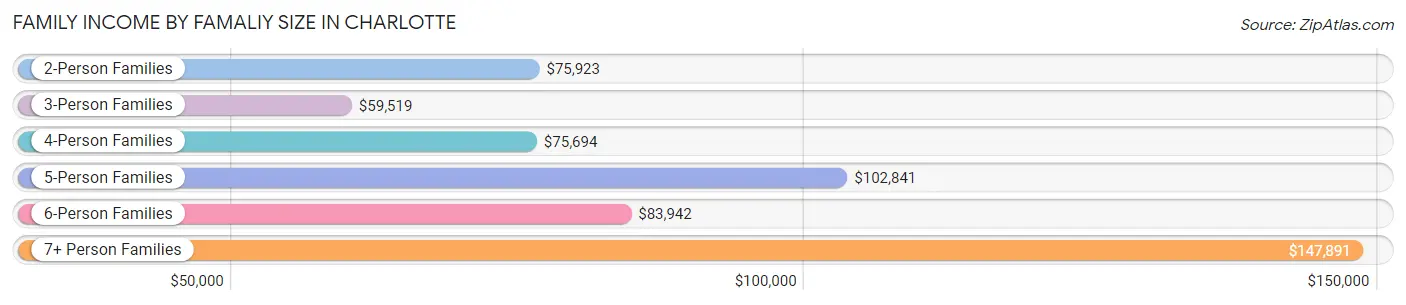
Family Income by Famaliy Size in Charlotte
7+ person families (54 | 2.6%) account for the highest median family income in Charlotte with $147,891 per family, while 2-person families (1,000 | 48.1%) have the highest median income of $37,962 per family member.
| Income Bracket | # Families | Median Income |
| 2-Person Families | 1,000 (48.1%) | $75,923 |
| 3-Person Families | 499 (24.0%) | $59,519 |
| 4-Person Families | 290 (13.9%) | $75,694 |
| 5-Person Families | 182 (8.7%) | $102,841 |
| 6-Person Families | 55 (2.6%) | $83,942 |
| 7+ Person Families | 54 (2.6%) | $147,891 |
| Total | 2,080 (100.0%) | $76,688 |
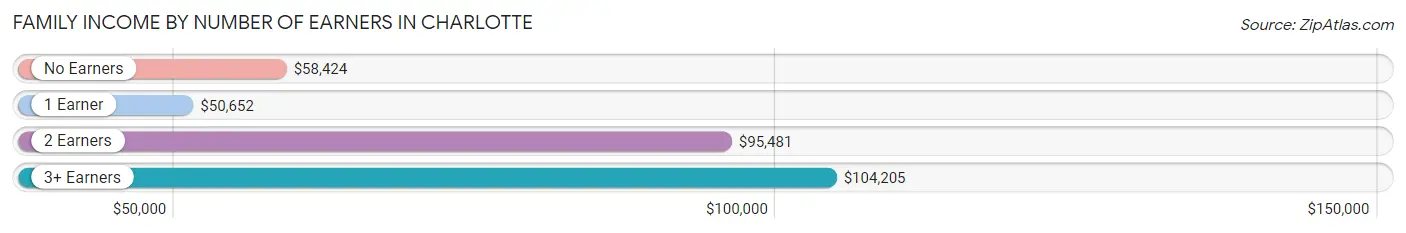
Family Income by Number of Earners in Charlotte
The median family income in Charlotte is $76,688, with families comprising 3+ earners (228) having the highest median family income of $104,205, while families with 1 earner (734) have the lowest median family income of $50,652, accounting for 11.0% and 35.3% of families, respectively.
| Number of Earners | # Families | Median Income |
| No Earners | 247 (11.9%) | $58,424 |
| 1 Earner | 734 (35.3%) | $50,652 |
| 2 Earners | 871 (41.9%) | $95,481 |
| 3+ Earners | 228 (11.0%) | $104,205 |
| Total | 2,080 (100.0%) | $76,688 |
Household Income in Charlotte
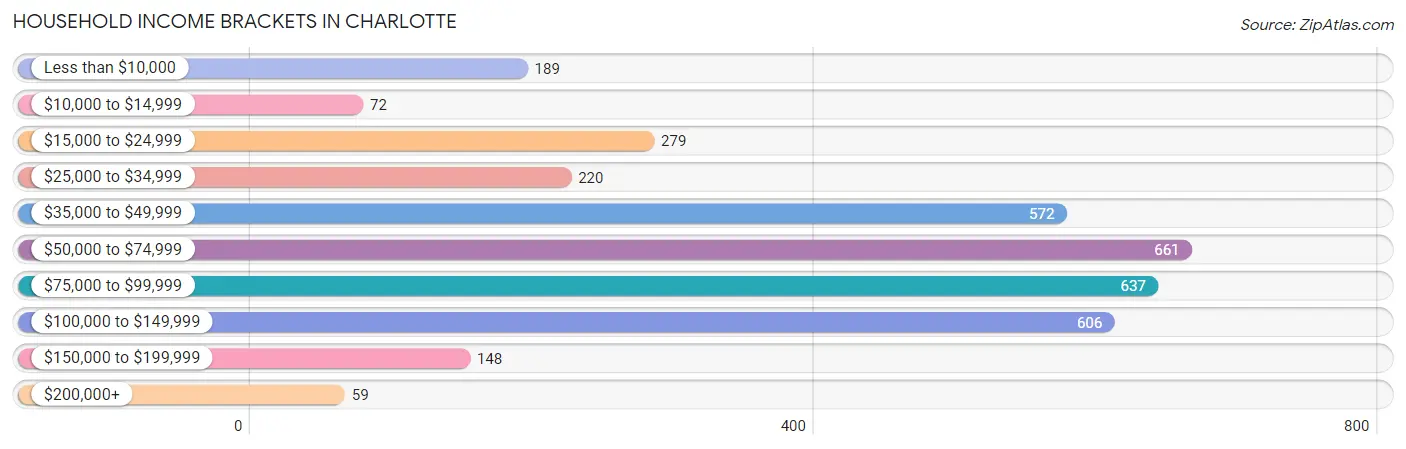
Household Income Brackets in Charlotte
With 661 households falling in the category, the $50,000 to $74,999 income range is the most frequent in Charlotte, accounting for 19.2% of all households. In contrast, only 59 households (1.7%) fall into the $200,000+ income bracket, making it the least populous group.
| Income Bracket | # Households | % Households |
| Less than $10,000 | 189 | 5.5% |
| $10,000 to $14,999 | 72 | 2.1% |
| $15,000 to $24,999 | 279 | 8.1% |
| $25,000 to $34,999 | 220 | 6.4% |
| $35,000 to $49,999 | 572 | 16.6% |
| $50,000 to $74,999 | 661 | 19.2% |
| $75,000 to $99,999 | 637 | 18.5% |
| $100,000 to $149,999 | 606 | 17.6% |
| $150,000 to $199,999 | 148 | 4.3% |
| $200,000+ | 59 | 1.7% |
Household Income by Householder Age in Charlotte
The median household income in Charlotte is $65,507, with the highest median household income of $74,333 found in the 45 to 64 years age bracket for the primary householder. A total of 1,202 households (34.9%) fall into this category. Meanwhile, the 15 to 24 years age bracket for the primary householder has the lowest median household income of $46,389, with 82 households (2.4%) in this group.
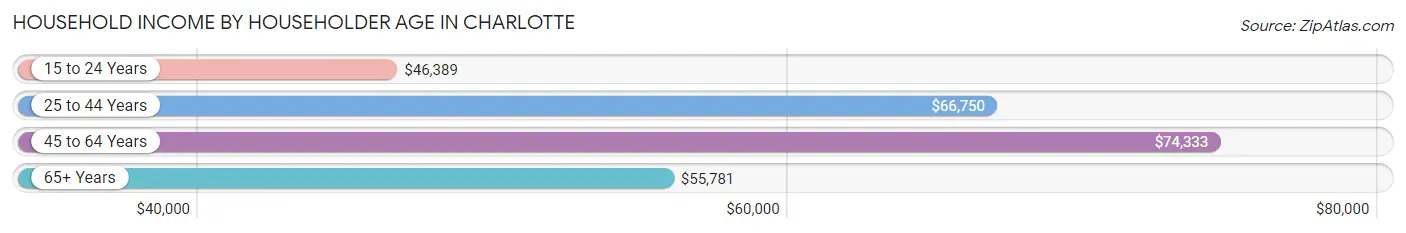
| Income Bracket | # Households | Median Income |
| 15 to 24 Years | 82 (2.4%) | $46,389 |
| 25 to 44 Years | 1,293 (37.6%) | $66,750 |
| 45 to 64 Years | 1,202 (34.9%) | $74,333 |
| 65+ Years | 866 (25.2%) | $55,781 |
| Total | 3,443 (100.0%) | $65,507 |
Poverty in Charlotte
Income Below Poverty by Sex and Age in Charlotte
With 9.1% poverty level for males and 10.4% for females among the residents of Charlotte, 16 and 17 year old males and 6 to 11 year old females are the most vulnerable to poverty, with 43 males (29.0%) and 79 females (27.0%) in their respective age groups living below the poverty level.
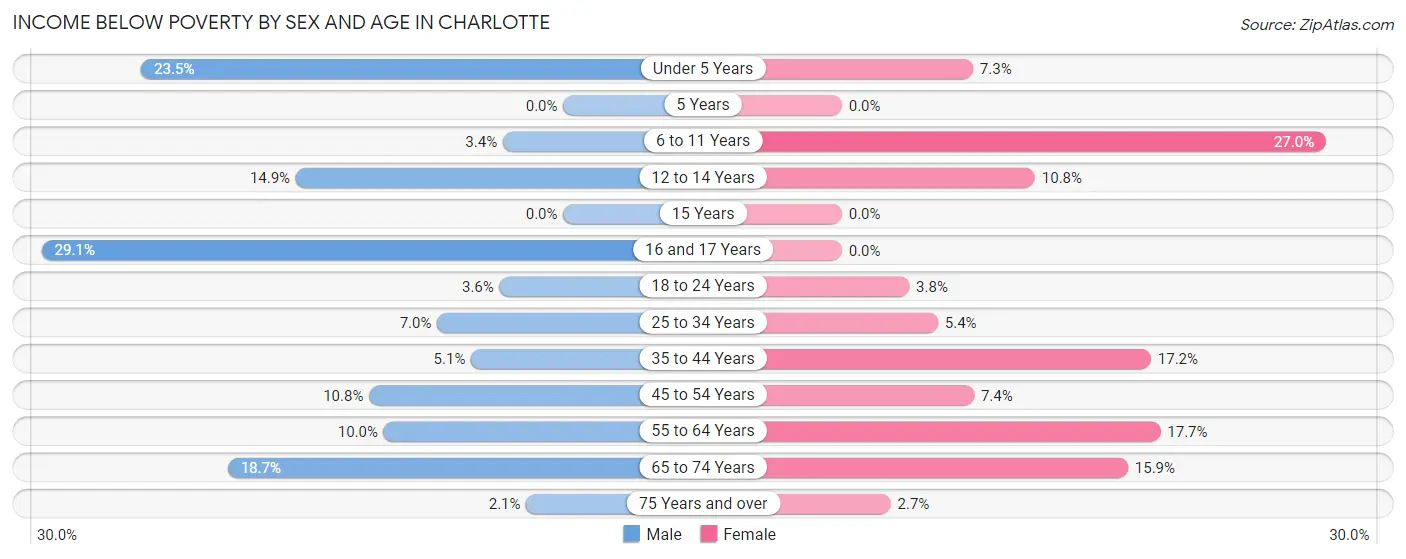
| Age Bracket | Male | Female |
| Under 5 Years | 63 (23.5%) | 20 (7.3%) |
| 5 Years | 0 (0.0%) | 0 (0.0%) |
| 6 to 11 Years | 12 (3.4%) | 79 (27.0%) |
| 12 to 14 Years | 14 (14.9%) | 23 (10.7%) |
| 15 Years | 0 (0.0%) | 0 (0.0%) |
| 16 and 17 Years | 43 (29.0%) | 0 (0.0%) |
| 18 to 24 Years | 15 (3.5%) | 15 (3.7%) |
| 25 to 34 Years | 48 (7.0%) | 34 (5.3%) |
| 35 to 44 Years | 37 (5.1%) | 95 (17.2%) |
| 45 to 54 Years | 56 (10.8%) | 27 (7.4%) |
| 55 to 64 Years | 52 (10.0%) | 99 (17.7%) |
| 65 to 74 Years | 54 (18.7%) | 54 (15.9%) |
| 75 Years and over | 5 (2.1%) | 11 (2.7%) |
| Total | 399 (9.1%) | 457 (10.4%) |
Income Above Poverty by Sex and Age in Charlotte
According to the poverty statistics in Charlotte, males aged 5 years and females aged 5 years are the age groups that are most secure financially, with 100.0% of males and 100.0% of females in these age groups living above the poverty line.
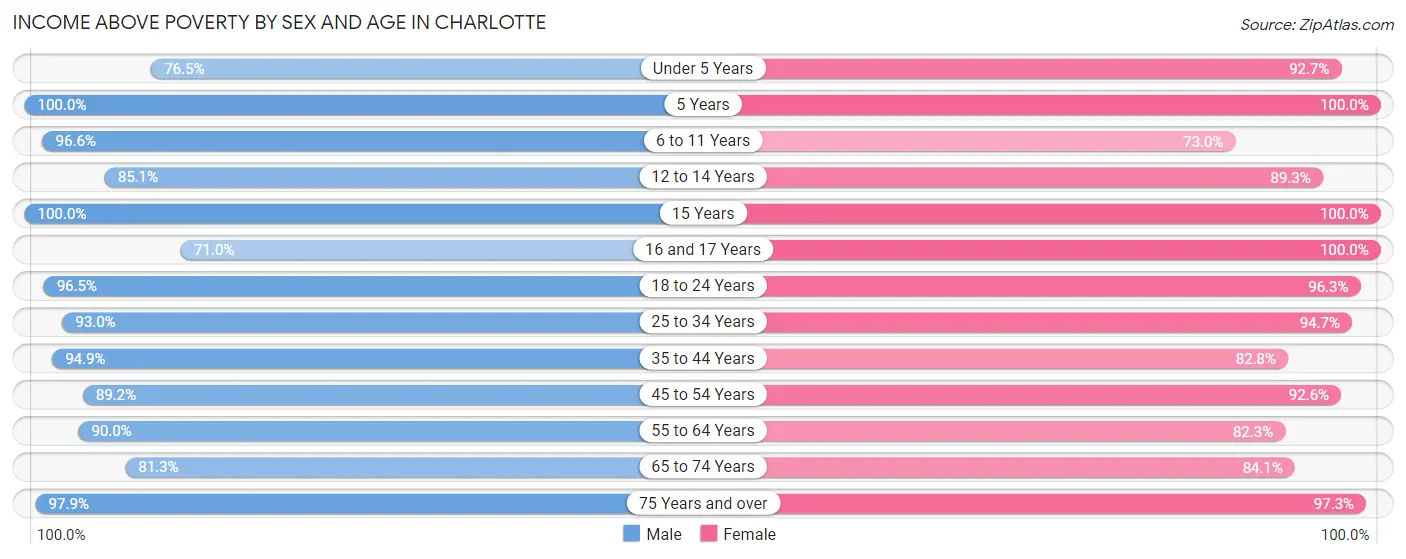
| Age Bracket | Male | Female |
| Under 5 Years | 205 (76.5%) | 254 (92.7%) |
| 5 Years | 67 (100.0%) | 30 (100.0%) |
| 6 to 11 Years | 345 (96.6%) | 214 (73.0%) |
| 12 to 14 Years | 80 (85.1%) | 191 (89.2%) |
| 15 Years | 63 (100.0%) | 103 (100.0%) |
| 16 and 17 Years | 105 (71.0%) | 216 (100.0%) |
| 18 to 24 Years | 408 (96.5%) | 385 (96.3%) |
| 25 to 34 Years | 636 (93.0%) | 601 (94.7%) |
| 35 to 44 Years | 684 (94.9%) | 457 (82.8%) |
| 45 to 54 Years | 462 (89.2%) | 340 (92.6%) |
| 55 to 64 Years | 468 (90.0%) | 459 (82.3%) |
| 65 to 74 Years | 235 (81.3%) | 285 (84.1%) |
| 75 Years and over | 238 (97.9%) | 393 (97.3%) |
| Total | 3,996 (90.9%) | 3,928 (89.6%) |
Income Below Poverty Among Married-Couple Families in Charlotte
The poverty statistics for married-couple families in Charlotte show that 1.2% or 17 of the total 1,414 families live below the poverty line. Families with 5 or more children have the highest poverty rate of 13.5%, comprising of 5 families. On the other hand, families with no children have the lowest poverty rate of 0.0%, which includes 0 families.
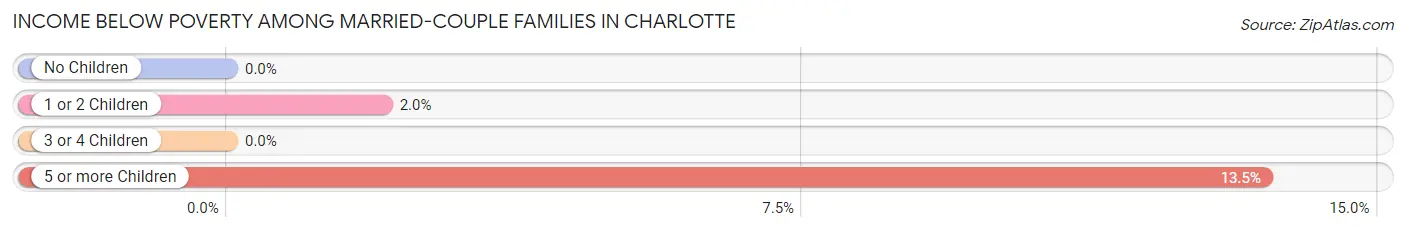
| Children | Above Poverty | Below Poverty |
| No Children | 698 (100.0%) | 0 (0.0%) |
| 1 or 2 Children | 583 (98.0%) | 12 (2.0%) |
| 3 or 4 Children | 84 (100.0%) | 0 (0.0%) |
| 5 or more Children | 32 (86.5%) | 5 (13.5%) |
| Total | 1,397 (98.8%) | 17 (1.2%) |
Income Below Poverty Among Single-Parent Households in Charlotte
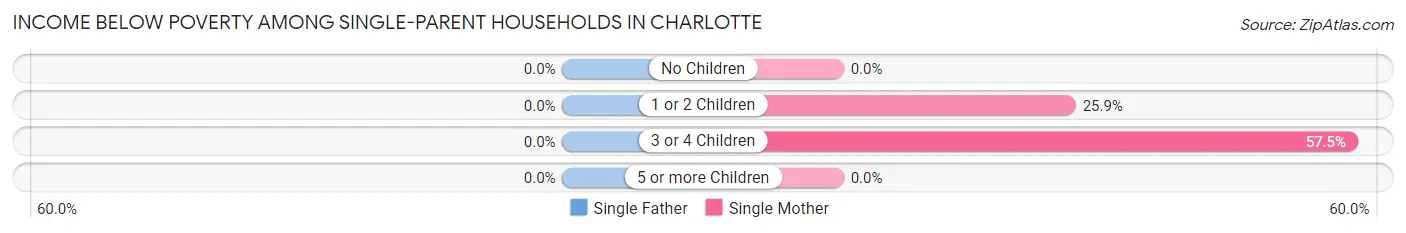
| Children | Single Father | Single Mother |
| No Children | 0 (0.0%) | 0 (0.0%) |
| 1 or 2 Children | 0 (0.0%) | 63 (25.9%) |
| 3 or 4 Children | 0 (0.0%) | 27 (57.5%) |
| 5 or more Children | 0 (0.0%) | 0 (0.0%) |
| Total | 0 (0.0%) | 90 (20.8%) |
Income Below Poverty Among Married-Couple vs Single-Parent Households in Charlotte
The poverty data for Charlotte shows that 17 of the married-couple family households (1.2%) and 90 of the single-parent households (13.5%) are living below the poverty level. Within the married-couple family households, those with 5 or more children have the highest poverty rate, with 5 households (13.5%) falling below the poverty line. Among the single-parent households, those with 3 or 4 children have the highest poverty rate, with 27 household (57.5%) living below poverty.
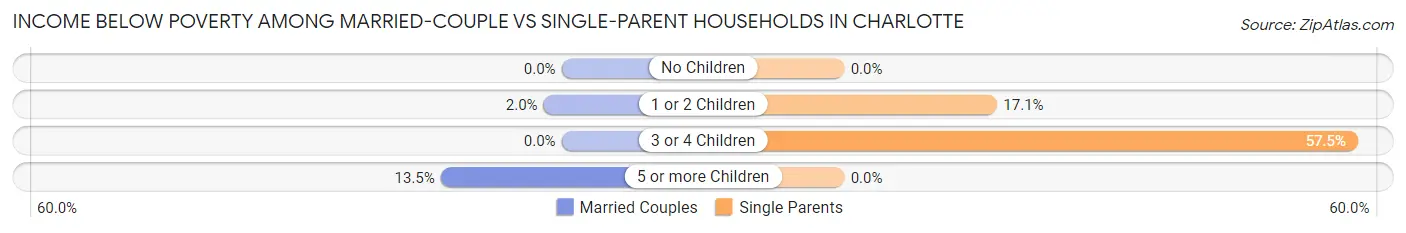
| Children | Married-Couple Families | Single-Parent Households |
| No Children | 0 (0.0%) | 0 (0.0%) |
| 1 or 2 Children | 12 (2.0%) | 63 (17.1%) |
| 3 or 4 Children | 0 (0.0%) | 27 (57.5%) |
| 5 or more Children | 5 (13.5%) | 0 (0.0%) |
| Total | 17 (1.2%) | 90 (13.5%) |
Race in Charlotte
The most populous races in Charlotte are White / Caucasian (8,453 | 91.2%), Hispanic or Latino (568 | 6.1%), and Two or more Races (555 | 6.0%).
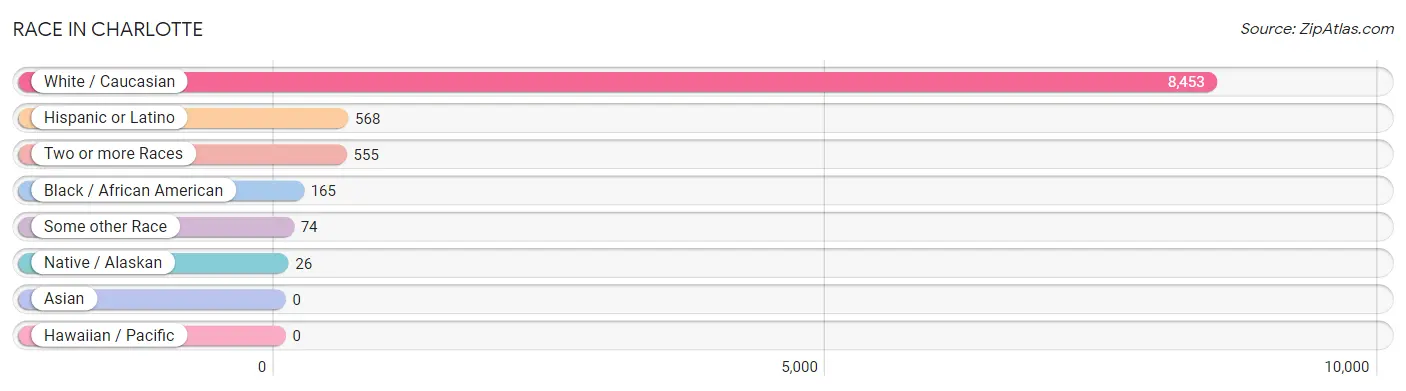
| Race | # Population | % Population |
| Asian | 0 | 0.0% |
| Black / African American | 165 | 1.8% |
| Hawaiian / Pacific | 0 | 0.0% |
| Hispanic or Latino | 568 | 6.1% |
| Native / Alaskan | 26 | 0.3% |
| White / Caucasian | 8,453 | 91.2% |
| Two or more Races | 555 | 6.0% |
| Some other Race | 74 | 0.8% |
| Total | 9,273 | 100.0% |
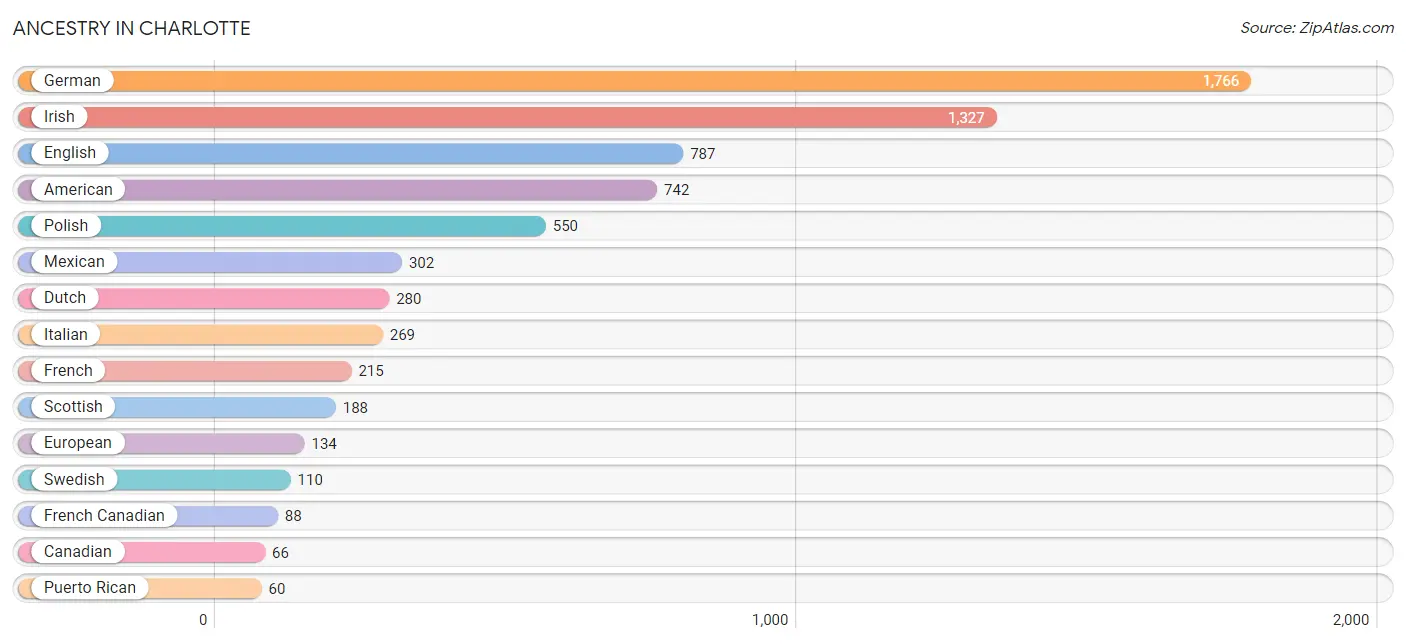
Ancestry in Charlotte
The most populous ancestries reported in Charlotte are German (1,766 | 19.0%), Irish (1,327 | 14.3%), English (787 | 8.5%), American (742 | 8.0%), and Polish (550 | 5.9%), together accounting for 55.8% of all Charlotte residents.
| Ancestry | # Population | % Population |
| African | 15 | 0.2% |
| American | 742 | 8.0% |
| Arab | 28 | 0.3% |
| Belgian | 30 | 0.3% |
| Bhutanese | 8 | 0.1% |
| British | 24 | 0.3% |
| Canadian | 66 | 0.7% |
| Celtic | 11 | 0.1% |
| Central American | 46 | 0.5% |
| Cherokee | 29 | 0.3% |
| Chippewa | 8 | 0.1% |
| Costa Rican | 46 | 0.5% |
| Czech | 7 | 0.1% |
| Czechoslovakian | 15 | 0.2% |
| Danish | 19 | 0.2% |
| Delaware | 7 | 0.1% |
| Dutch | 280 | 3.0% |
| English | 787 | 8.5% |
| European | 134 | 1.5% |
| Finnish | 25 | 0.3% |
| French | 215 | 2.3% |
| French Canadian | 88 | 0.9% |
| German | 1,766 | 19.0% |
| Greek | 27 | 0.3% |
| Hopi | 21 | 0.2% |
| Hungarian | 15 | 0.2% |
| Irish | 1,327 | 14.3% |
| Italian | 269 | 2.9% |
| Lebanese | 20 | 0.2% |
| Lithuanian | 21 | 0.2% |
| Mexican | 302 | 3.3% |
| Northern European | 8 | 0.1% |
| Norwegian | 40 | 0.4% |
| Pennsylvania German | 22 | 0.2% |
| Polish | 550 | 5.9% |
| Portuguese | 5 | 0.1% |
| Puerto Rican | 60 | 0.6% |
| Romanian | 17 | 0.2% |
| Russian | 18 | 0.2% |
| Scandinavian | 14 | 0.2% |
| Scotch-Irish | 35 | 0.4% |
| Scottish | 188 | 2.0% |
| Seminole | 8 | 0.1% |
| Serbian | 9 | 0.1% |
| Slovak | 11 | 0.1% |
| Spaniard | 34 | 0.4% |
| Subsaharan African | 15 | 0.2% |
| Swedish | 110 | 1.2% |
| Swiss | 9 | 0.1% |
| Syrian | 8 | 0.1% |
| Ukrainian | 21 | 0.2% |
| Welsh | 25 | 0.3% |
| Yugoslavian | 9 | 0.1% | View All 53 Rows |
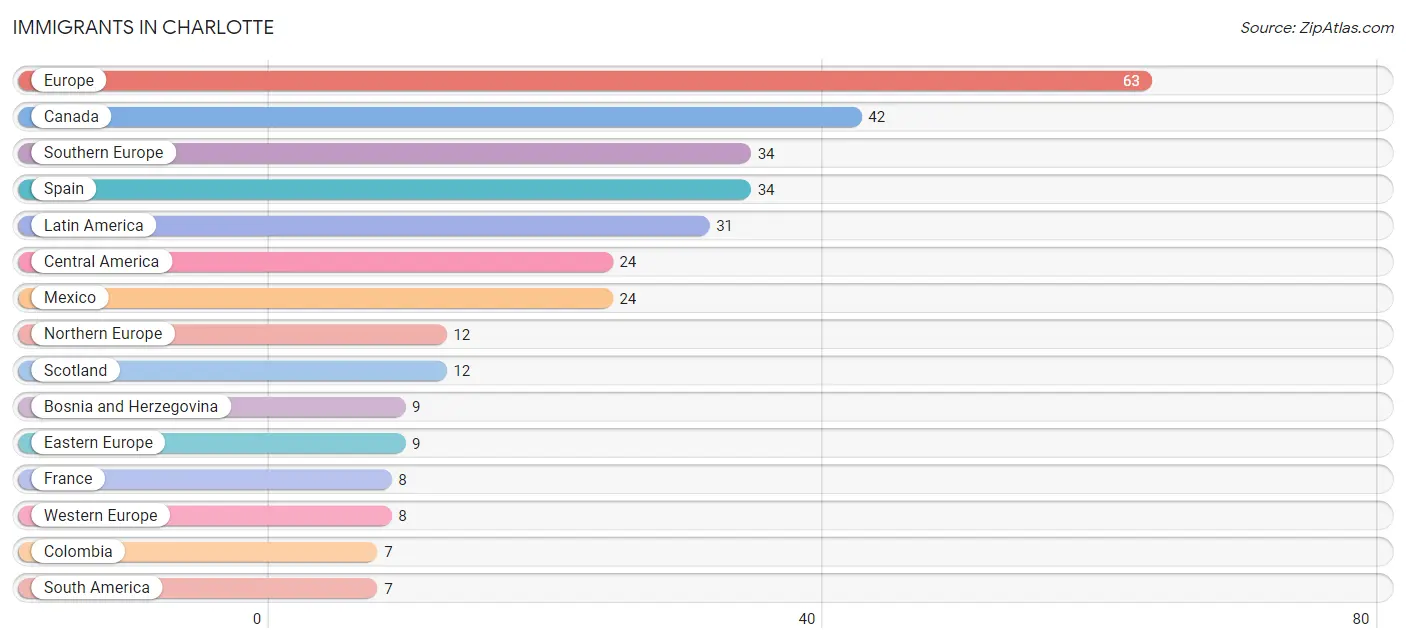
Immigrants in Charlotte
The most numerous immigrant groups reported in Charlotte came from Europe (63 | 0.7%), Canada (42 | 0.4%), Southern Europe (34 | 0.4%), Spain (34 | 0.4%), and Latin America (31 | 0.3%), together accounting for 2.2% of all Charlotte residents.
| Immigration Origin | # Population | % Population |
| Bosnia and Herzegovina | 9 | 0.1% |
| Canada | 42 | 0.4% |
| Central America | 24 | 0.3% |
| Colombia | 7 | 0.1% |
| Eastern Europe | 9 | 0.1% |
| Europe | 63 | 0.7% |
| France | 8 | 0.1% |
| Latin America | 31 | 0.3% |
| Mexico | 24 | 0.3% |
| Northern Europe | 12 | 0.1% |
| Scotland | 12 | 0.1% |
| South America | 7 | 0.1% |
| Southern Europe | 34 | 0.4% |
| Spain | 34 | 0.4% |
| Western Europe | 8 | 0.1% | View All 15 Rows |
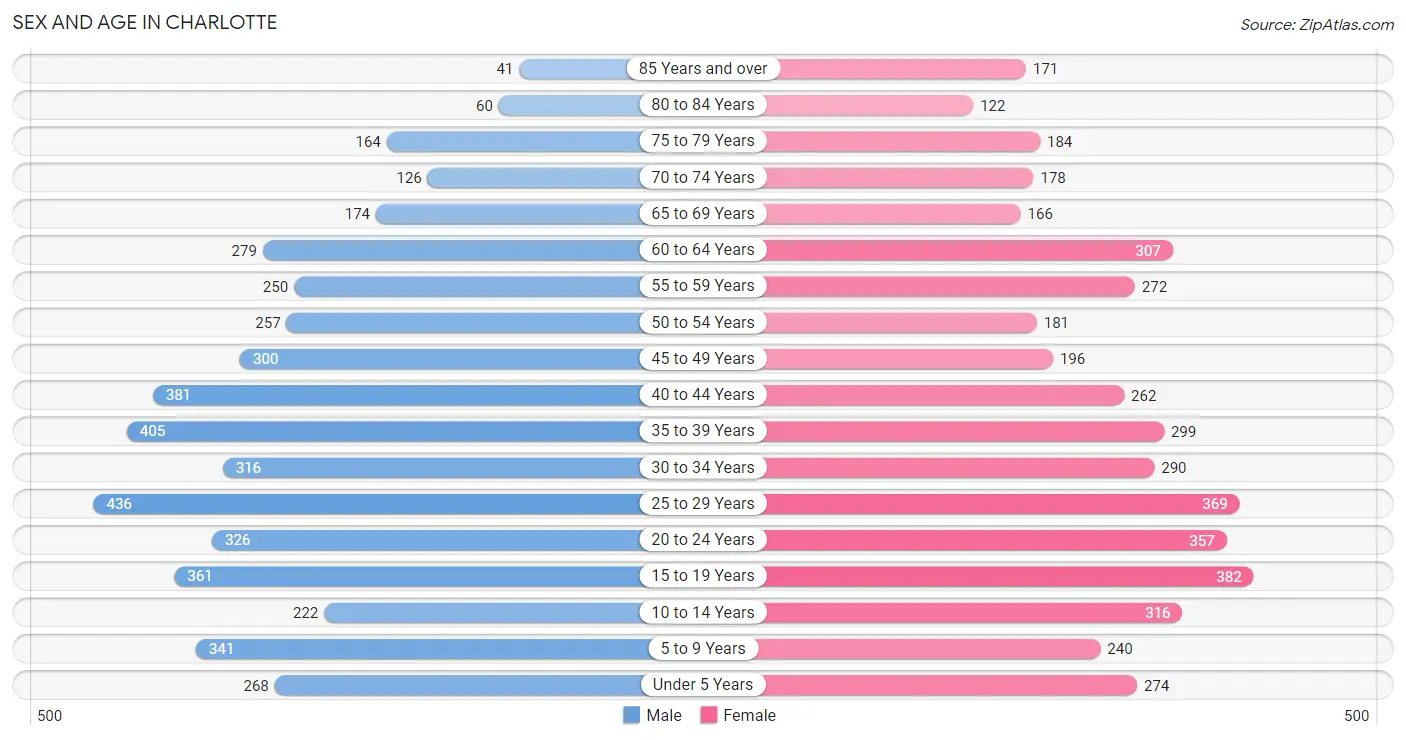
Sex and Age in Charlotte
Sex and Age in Charlotte
The most populous age groups in Charlotte are 25 to 29 Years (436 | 9.3%) for men and 15 to 19 Years (382 | 8.4%) for women.
| Age Bracket | Male | Female |
| Under 5 Years | 268 (5.7%) | 274 (6.0%) |
| 5 to 9 Years | 341 (7.2%) | 240 (5.3%) |
| 10 to 14 Years | 222 (4.7%) | 316 (6.9%) |
| 15 to 19 Years | 361 (7.7%) | 382 (8.4%) |
| 20 to 24 Years | 326 (6.9%) | 357 (7.8%) |
| 25 to 29 Years | 436 (9.3%) | 369 (8.1%) |
| 30 to 34 Years | 316 (6.7%) | 290 (6.4%) |
| 35 to 39 Years | 405 (8.6%) | 299 (6.6%) |
| 40 to 44 Years | 381 (8.1%) | 262 (5.7%) |
| 45 to 49 Years | 300 (6.4%) | 196 (4.3%) |
| 50 to 54 Years | 257 (5.5%) | 181 (4.0%) |
| 55 to 59 Years | 250 (5.3%) | 272 (6.0%) |
| 60 to 64 Years | 279 (5.9%) | 307 (6.7%) |
| 65 to 69 Years | 174 (3.7%) | 166 (3.6%) |
| 70 to 74 Years | 126 (2.7%) | 178 (3.9%) |
| 75 to 79 Years | 164 (3.5%) | 184 (4.0%) |
| 80 to 84 Years | 60 (1.3%) | 122 (2.7%) |
| 85 Years and over | 41 (0.9%) | 171 (3.7%) |
| Total | 4,707 (100.0%) | 4,566 (100.0%) |
Families and Households in Charlotte
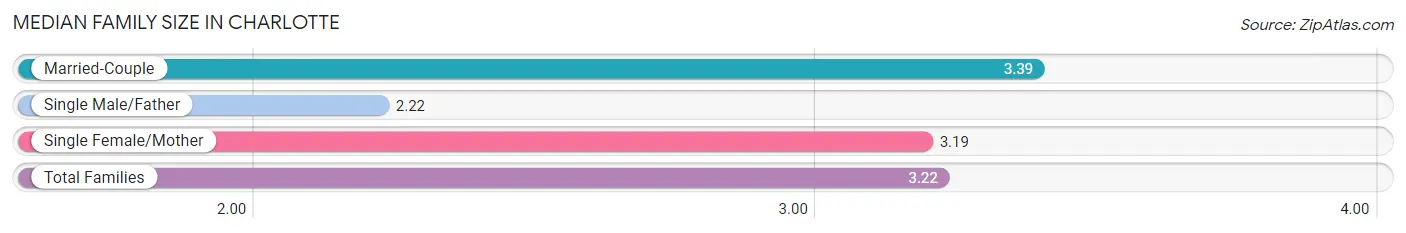
Median Family Size in Charlotte
The median family size in Charlotte is 3.22 persons per family, with married-couple families (1,414 | 68.0%) accounting for the largest median family size of 3.39 persons per family. On the other hand, single male/father families (233 | 11.2%) represent the smallest median family size with 2.22 persons per family.
| Family Type | # Families | Family Size |
| Married-Couple | 1,414 (68.0%) | 3.39 |
| Single Male/Father | 233 (11.2%) | 2.22 |
| Single Female/Mother | 433 (20.8%) | 3.19 |
| Total Families | 2,080 (100.0%) | 3.22 |
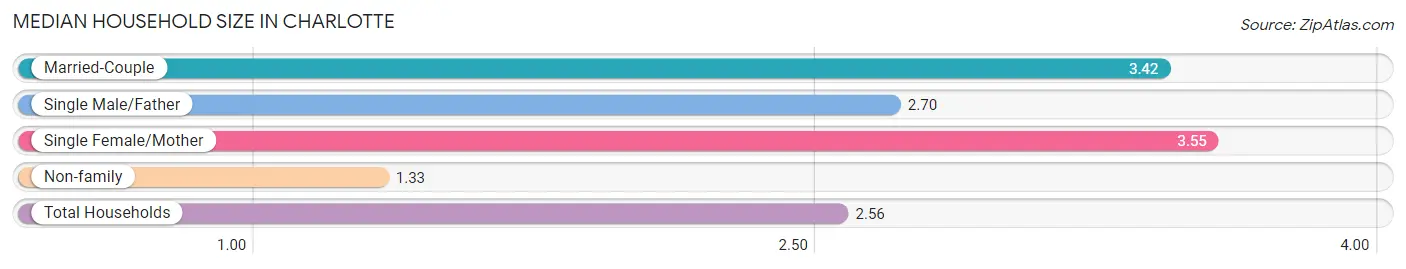
Median Household Size in Charlotte
The median household size in Charlotte is 2.56 persons per household, with single female/mother households (433 | 12.6%) accounting for the largest median household size of 3.55 persons per household. non-family households (1,363 | 39.6%) represent the smallest median household size with 1.33 persons per household.
| Household Type | # Households | Household Size |
| Married-Couple | 1,414 (41.1%) | 3.42 |
| Single Male/Father | 233 (6.8%) | 2.70 |
| Single Female/Mother | 433 (12.6%) | 3.55 |
| Non-family | 1,363 (39.6%) | 1.33 |
| Total Households | 3,443 (100.0%) | 2.56 |
Household Size by Marriage Status in Charlotte
Out of a total of 3,443 households in Charlotte, 2,080 (60.4%) are family households, while 1,363 (39.6%) are nonfamily households. The most numerous type of family households are 2-person households, comprising 943, and the most common type of nonfamily households are 1-person households, comprising 1,019.
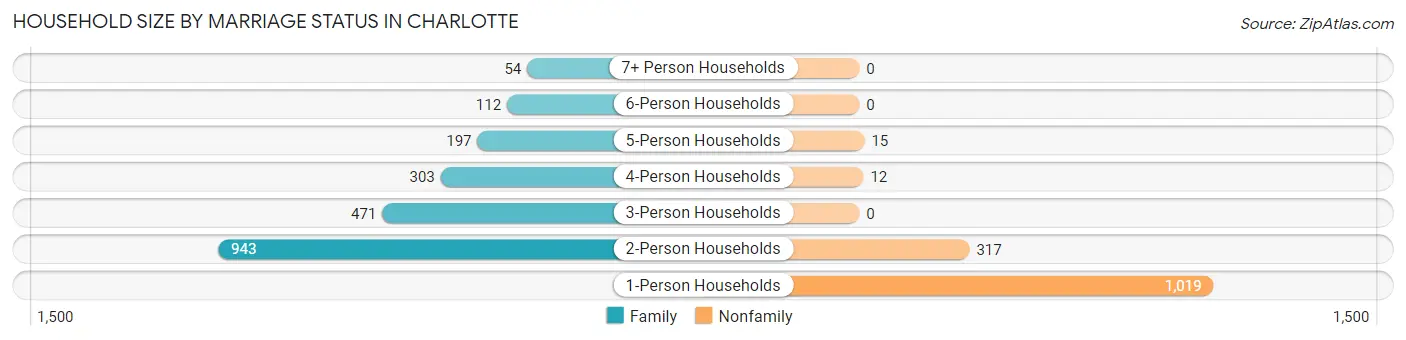
| Household Size | Family Households | Nonfamily Households |
| 1-Person Households | - | 1,019 (29.6%) |
| 2-Person Households | 943 (27.4%) | 317 (9.2%) |
| 3-Person Households | 471 (13.7%) | 0 (0.0%) |
| 4-Person Households | 303 (8.8%) | 12 (0.4%) |
| 5-Person Households | 197 (5.7%) | 15 (0.4%) |
| 6-Person Households | 112 (3.3%) | 0 (0.0%) |
| 7+ Person Households | 54 (1.6%) | 0 (0.0%) |
| Total | 2,080 (60.4%) | 1,363 (39.6%) |
Female Fertility in Charlotte
Fertility by Age in Charlotte
Average fertility rate in Charlotte is 27.0 births per 1,000 women. Women in the age bracket of 20 to 34 years have the highest fertility rate with 50.0 births per 1,000 women. Women in the age bracket of 20 to 34 years acount for 86.4% of all women with births.
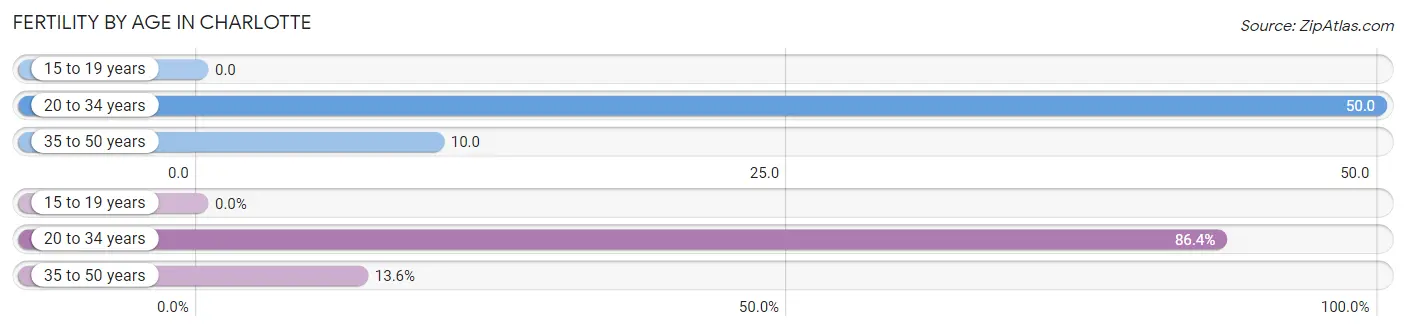
| Age Bracket | Women with Births | Births / 1,000 Women |
| 15 to 19 years | 0 (0.0%) | 0.0 |
| 20 to 34 years | 51 (86.4%) | 50.0 |
| 35 to 50 years | 8 (13.6%) | 10.0 |
| Total | 59 (100.0%) | 27.0 |
Fertility by Age by Marriage Status in Charlotte
86.4% of women with births (59) in Charlotte are married. The highest percentage of unmarried women with births falls into 20 to 34 years age bracket with 15.7% of them unmarried at the time of birth, while the lowest percentage of unmarried women with births belong to 35 to 50 years age bracket with 0.0% of them unmarried.
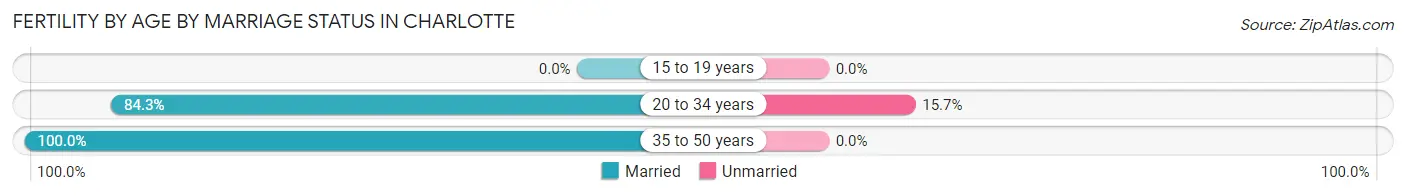
| Age Bracket | Married | Unmarried |
| 15 to 19 years | 0 (0.0%) | 0 (0.0%) |
| 20 to 34 years | 43 (84.3%) | 8 (15.7%) |
| 35 to 50 years | 8 (100.0%) | 0 (0.0%) |
| Total | 51 (86.4%) | 8 (13.6%) |
Fertility by Education in Charlotte
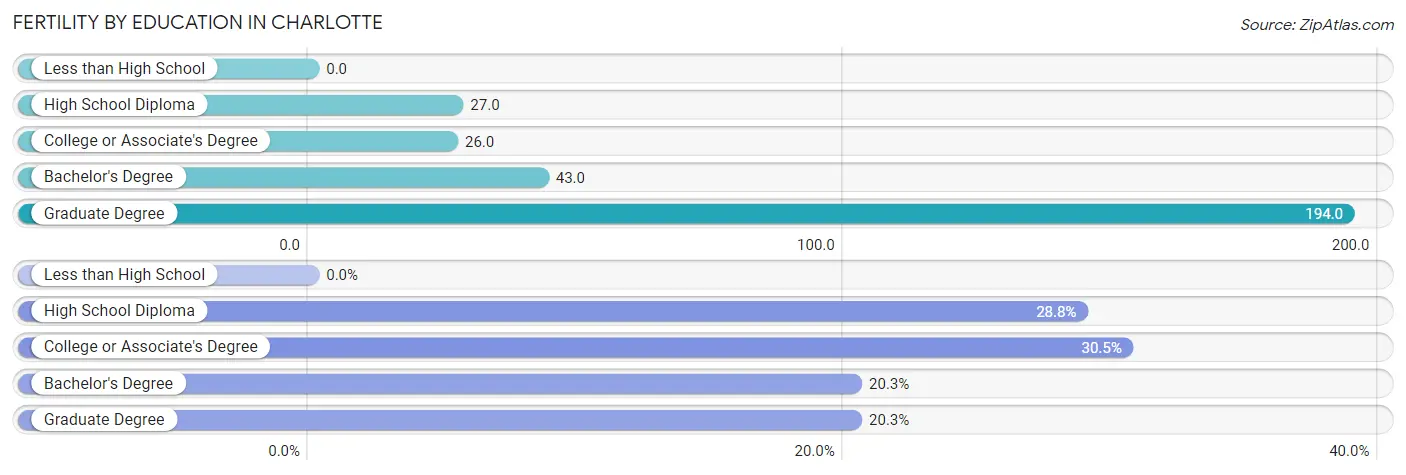
| Educational Attainment | Women with Births | Births / 1,000 Women |
| Less than High School | 0 (0.0%) | 0.0 |
| High School Diploma | 17 (28.8%) | 27.0 |
| College or Associate's Degree | 18 (30.5%) | 26.0 |
| Bachelor's Degree | 12 (20.3%) | 43.0 |
| Graduate Degree | 12 (20.3%) | 194.0 |
| Total | 59 (100.0%) | 27.0 |
Fertility by Education by Marriage Status in Charlotte
13.6% of women with births in Charlotte are unmarried. Women with the educational attainment of college or associate's degree are most likely to be married with 100.0% of them married at childbirth, while women with the educational attainment of high school diploma are least likely to be married with 47.1% of them unmarried at childbirth.
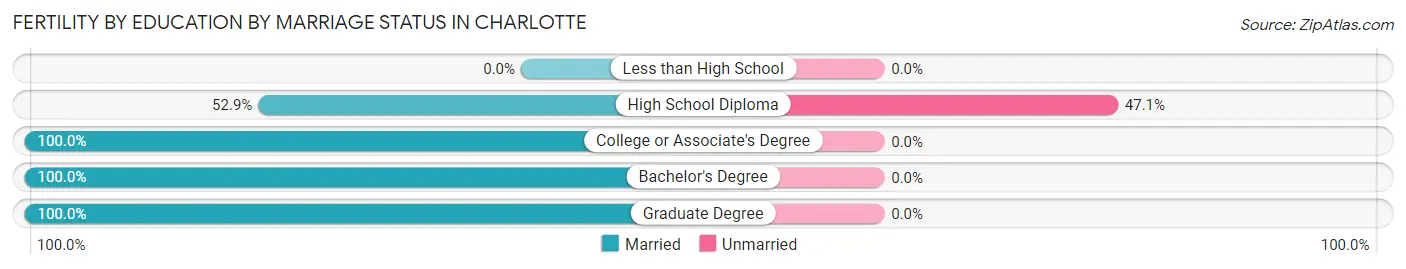
| Educational Attainment | Married | Unmarried |
| Less than High School | 0 (0.0%) | 0 (0.0%) |
| High School Diploma | 9 (52.9%) | 8 (47.1%) |
| College or Associate's Degree | 18 (100.0%) | 0 (0.0%) |
| Bachelor's Degree | 12 (100.0%) | 0 (0.0%) |
| Graduate Degree | 12 (100.0%) | 0 (0.0%) |
| Total | 51 (86.4%) | 8 (13.6%) |
Employment Characteristics in Charlotte
Employment by Class of Employer in Charlotte
Among the 4,093 employed individuals in Charlotte, private company employees (3,245 | 79.3%), local government employees (273 | 6.7%), and state government employees (155 | 3.8%) make up the most common classes of employment.
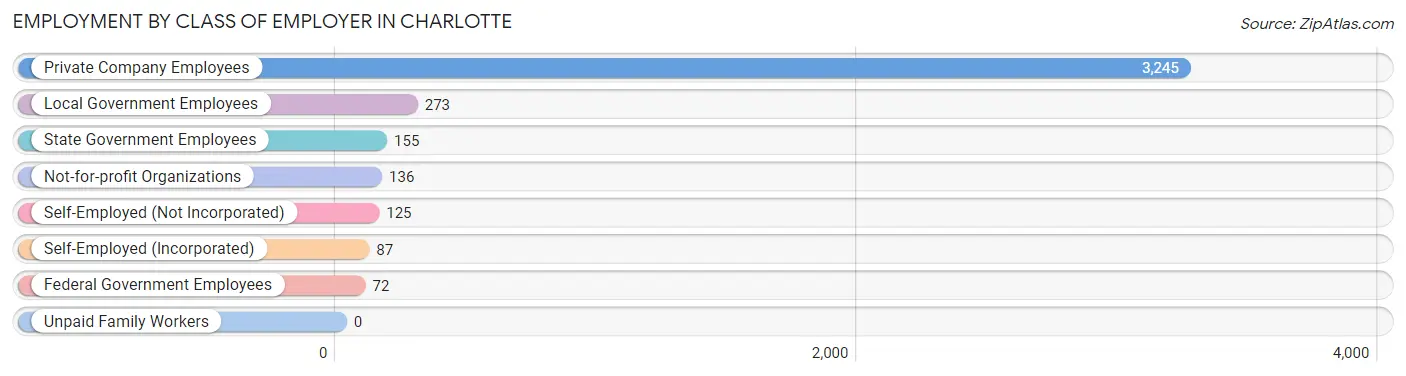
| Employer Class | # Employees | % Employees |
| Private Company Employees | 3,245 | 79.3% |
| Self-Employed (Incorporated) | 87 | 2.1% |
| Self-Employed (Not Incorporated) | 125 | 3.0% |
| Not-for-profit Organizations | 136 | 3.3% |
| Local Government Employees | 273 | 6.7% |
| State Government Employees | 155 | 3.8% |
| Federal Government Employees | 72 | 1.8% |
| Unpaid Family Workers | 0 | 0.0% |
| Total | 4,093 | 100.0% |
Employment Status by Age in Charlotte
According to the labor force statistics for Charlotte, out of the total population over 16 years of age (7,446), 59.5% or 4,430 individuals are in the labor force, with 6.2% or 275 of them unemployed. The age group with the highest labor force participation rate is 20 to 24 years, with 87.6% or 598 individuals in the labor force. Within the labor force, the 16 to 19 years age range has the highest percentage of unemployed individuals, with 19.5% or 48 of them being unemployed.
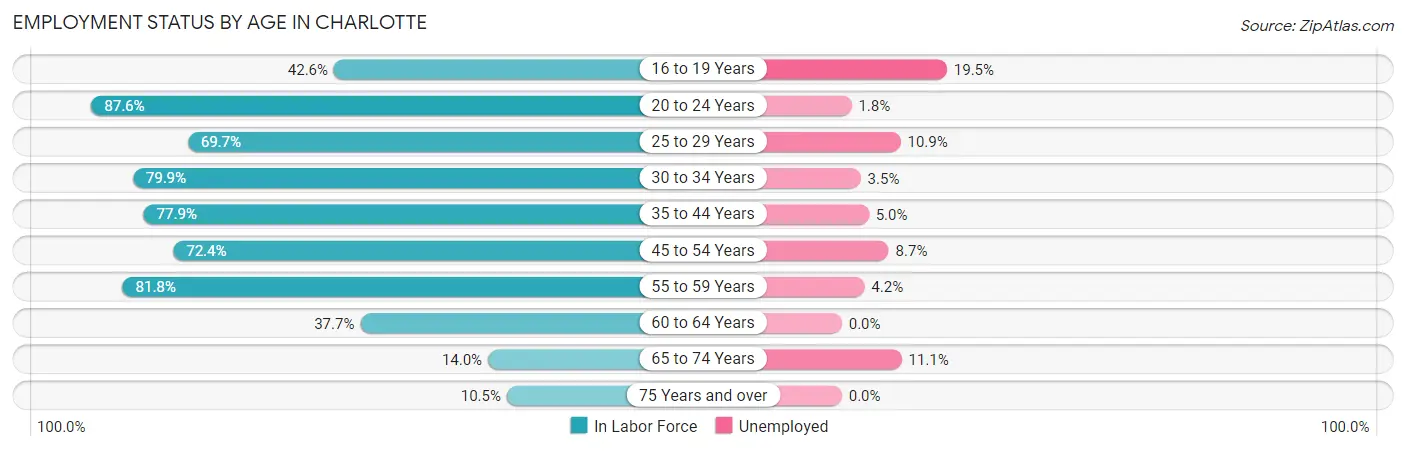
| Age Bracket | In Labor Force | Unemployed |
| 16 to 19 Years | 246 (42.6%) | 48 (19.5%) |
| 20 to 24 Years | 598 (87.6%) | 11 (1.8%) |
| 25 to 29 Years | 561 (69.7%) | 61 (10.9%) |
| 30 to 34 Years | 484 (79.9%) | 17 (3.5%) |
| 35 to 44 Years | 1,049 (77.9%) | 52 (5.0%) |
| 45 to 54 Years | 676 (72.4%) | 59 (8.7%) |
| 55 to 59 Years | 427 (81.8%) | 18 (4.2%) |
| 60 to 64 Years | 221 (37.7%) | 0 (0.0%) |
| 65 to 74 Years | 90 (14.0%) | 10 (11.1%) |
| 75 Years and over | 78 (10.5%) | 0 (0.0%) |
| Total | 4,430 (59.5%) | 275 (6.2%) |
Employment Status by Educational Attainment in Charlotte
According to labor force statistics for Charlotte, 71.2% of individuals (3,418) out of the total population between 25 and 64 years of age (4,800) are in the labor force, with 6.1% or 208 of them being unemployed. The group with the highest labor force participation rate are those with the educational attainment of bachelor's degree or higher, with 82.6% or 726 individuals in the labor force. Within the labor force, individuals with high school diploma education have the highest percentage of unemployment, with 9.0% or 95 of them being unemployed.
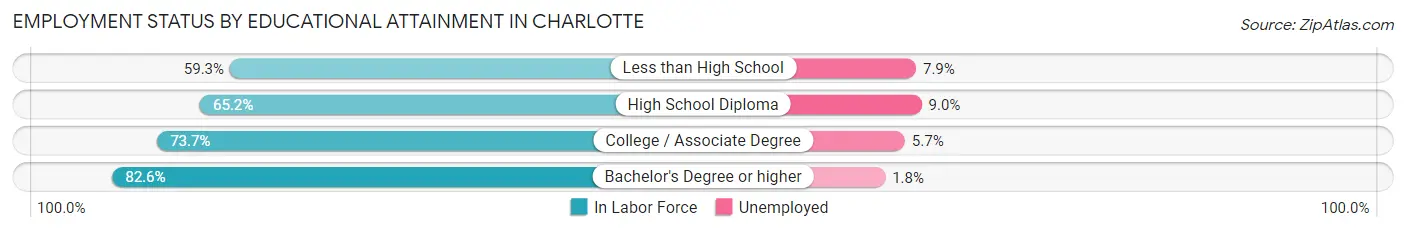
| Educational Attainment | In Labor Force | Unemployed |
| Less than High School | 242 (59.3%) | 32 (7.9%) |
| High School Diploma | 1,058 (65.2%) | 146 (9.0%) |
| College / Associate Degree | 1,394 (73.7%) | 108 (5.7%) |
| Bachelor's Degree or higher | 726 (82.6%) | 16 (1.8%) |
| Total | 3,418 (71.2%) | 293 (6.1%) |
Employment Occupations by Sex in Charlotte
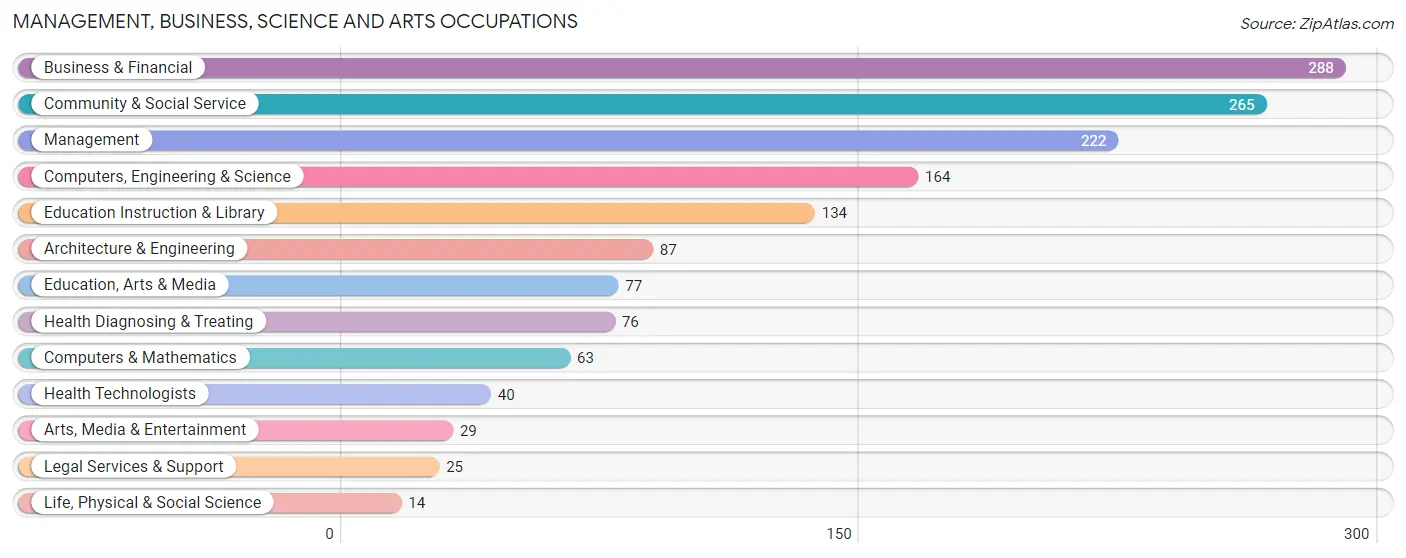
Management, Business, Science and Arts Occupations
The most common Management, Business, Science and Arts occupations in Charlotte are Business & Financial (288 | 6.9%), Community & Social Service (265 | 6.4%), Management (222 | 5.3%), Computers, Engineering & Science (164 | 4.0%), and Education Instruction & Library (134 | 3.2%).
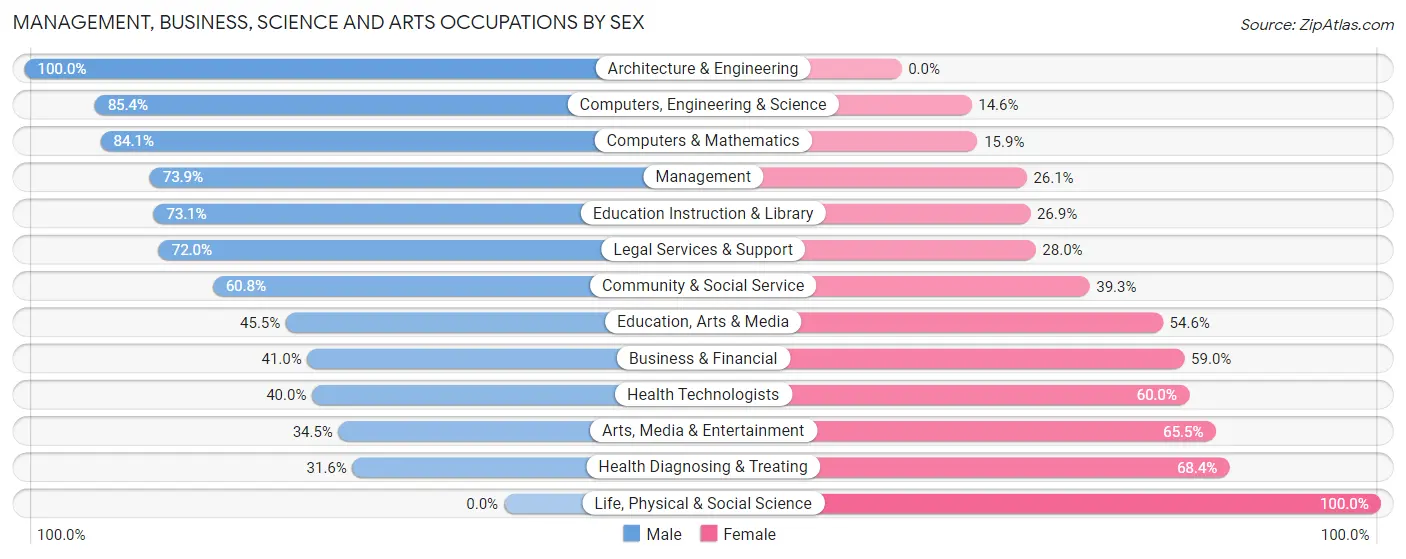
Management, Business, Science and Arts Occupations by Sex
Within the Management, Business, Science and Arts occupations in Charlotte, the most male-oriented occupations are Architecture & Engineering (100.0%), Computers, Engineering & Science (85.4%), and Computers & Mathematics (84.1%), while the most female-oriented occupations are Life, Physical & Social Science (100.0%), Health Diagnosing & Treating (68.4%), and Arts, Media & Entertainment (65.5%).
| Occupation | Male | Female |
| Management | 164 (73.9%) | 58 (26.1%) |
| Business & Financial | 118 (41.0%) | 170 (59.0%) |
| Computers, Engineering & Science | 140 (85.4%) | 24 (14.6%) |
| Computers & Mathematics | 53 (84.1%) | 10 (15.9%) |
| Architecture & Engineering | 87 (100.0%) | 0 (0.0%) |
| Life, Physical & Social Science | 0 (0.0%) | 14 (100.0%) |
| Community & Social Service | 161 (60.8%) | 104 (39.3%) |
| Education, Arts & Media | 35 (45.5%) | 42 (54.5%) |
| Legal Services & Support | 18 (72.0%) | 7 (28.0%) |
| Education Instruction & Library | 98 (73.1%) | 36 (26.9%) |
| Arts, Media & Entertainment | 10 (34.5%) | 19 (65.5%) |
| Health Diagnosing & Treating | 24 (31.6%) | 52 (68.4%) |
| Health Technologists | 16 (40.0%) | 24 (60.0%) |
| Total (Category) | 607 (59.8%) | 408 (40.2%) |
| Total (Overall) | 2,307 (55.5%) | 1,847 (44.5%) |
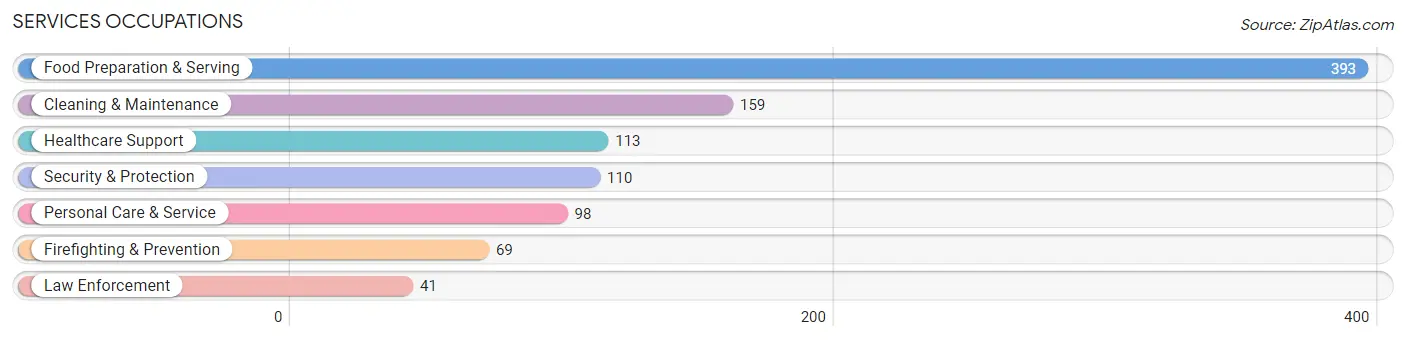
Services Occupations
The most common Services occupations in Charlotte are Food Preparation & Serving (393 | 9.5%), Cleaning & Maintenance (159 | 3.8%), Healthcare Support (113 | 2.7%), Security & Protection (110 | 2.6%), and Personal Care & Service (98 | 2.4%).
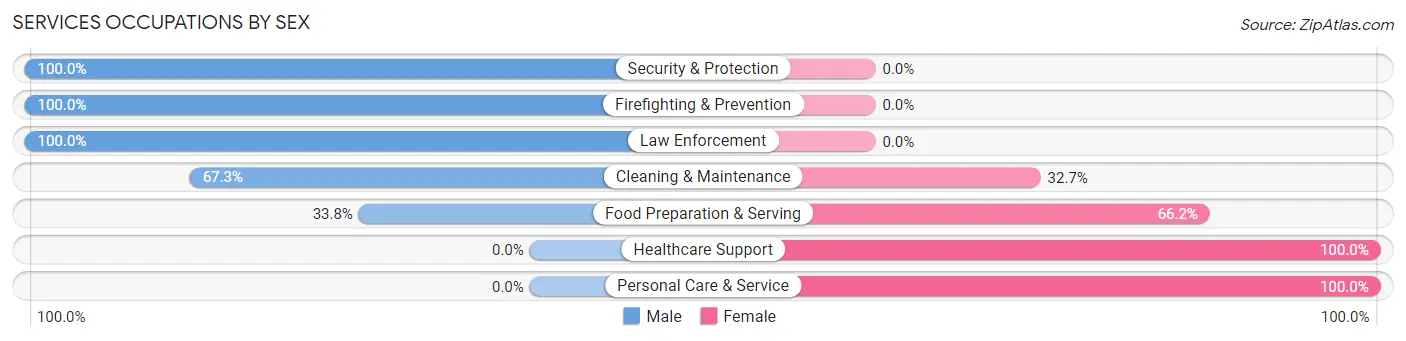
Services Occupations by Sex
Within the Services occupations in Charlotte, the most male-oriented occupations are Security & Protection (100.0%), Firefighting & Prevention (100.0%), and Law Enforcement (100.0%), while the most female-oriented occupations are Healthcare Support (100.0%), Personal Care & Service (100.0%), and Food Preparation & Serving (66.2%).
| Occupation | Male | Female |
| Healthcare Support | 0 (0.0%) | 113 (100.0%) |
| Security & Protection | 110 (100.0%) | 0 (0.0%) |
| Firefighting & Prevention | 69 (100.0%) | 0 (0.0%) |
| Law Enforcement | 41 (100.0%) | 0 (0.0%) |
| Food Preparation & Serving | 133 (33.8%) | 260 (66.2%) |
| Cleaning & Maintenance | 107 (67.3%) | 52 (32.7%) |
| Personal Care & Service | 0 (0.0%) | 98 (100.0%) |
| Total (Category) | 350 (40.1%) | 523 (59.9%) |
| Total (Overall) | 2,307 (55.5%) | 1,847 (44.5%) |
Sales and Office Occupations
The most common Sales and Office occupations in Charlotte are Office & Administration (543 | 13.1%), and Sales & Related (191 | 4.6%).

Sales and Office Occupations by Sex
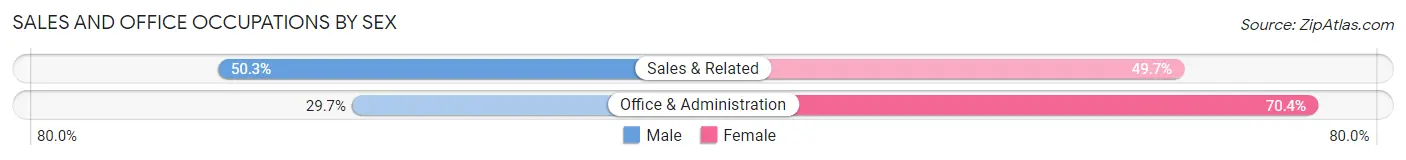
| Occupation | Male | Female |
| Sales & Related | 96 (50.3%) | 95 (49.7%) |
| Office & Administration | 161 (29.6%) | 382 (70.4%) |
| Total (Category) | 257 (35.0%) | 477 (65.0%) |
| Total (Overall) | 2,307 (55.5%) | 1,847 (44.5%) |
Natural Resources, Construction and Maintenance Occupations
The most common Natural Resources, Construction and Maintenance occupations in Charlotte are Construction & Extraction (169 | 4.1%), Installation, Maintenance & Repair (114 | 2.7%), and Farming, Fishing & Forestry (5 | 0.1%).

Natural Resources, Construction and Maintenance Occupations by Sex
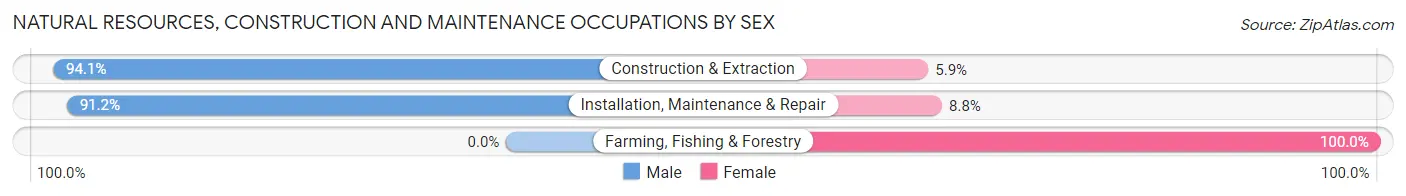
| Occupation | Male | Female |
| Farming, Fishing & Forestry | 0 (0.0%) | 5 (100.0%) |
| Construction & Extraction | 159 (94.1%) | 10 (5.9%) |
| Installation, Maintenance & Repair | 104 (91.2%) | 10 (8.8%) |
| Total (Category) | 263 (91.3%) | 25 (8.7%) |
| Total (Overall) | 2,307 (55.5%) | 1,847 (44.5%) |
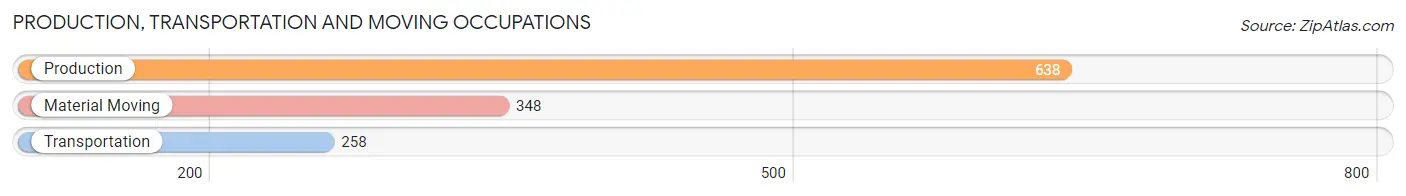
Production, Transportation and Moving Occupations
The most common Production, Transportation and Moving occupations in Charlotte are Production (638 | 15.4%), Material Moving (348 | 8.4%), and Transportation (258 | 6.2%).
Production, Transportation and Moving Occupations by Sex
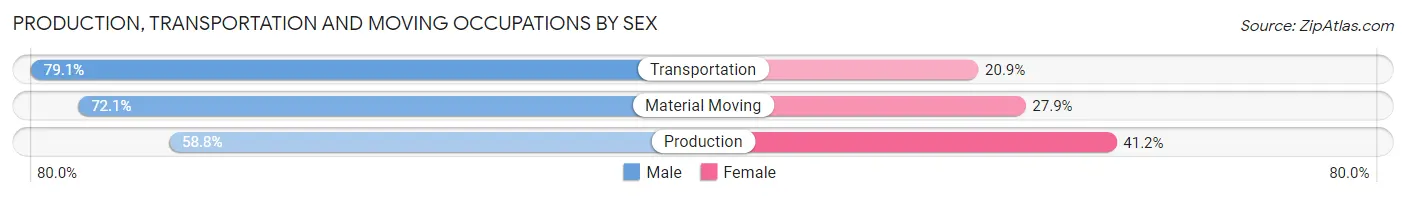
| Occupation | Male | Female |
| Production | 375 (58.8%) | 263 (41.2%) |
| Transportation | 204 (79.1%) | 54 (20.9%) |
| Material Moving | 251 (72.1%) | 97 (27.9%) |
| Total (Category) | 830 (66.7%) | 414 (33.3%) |
| Total (Overall) | 2,307 (55.5%) | 1,847 (44.5%) |
Employment Industries by Sex in Charlotte
Employment Industries in Charlotte
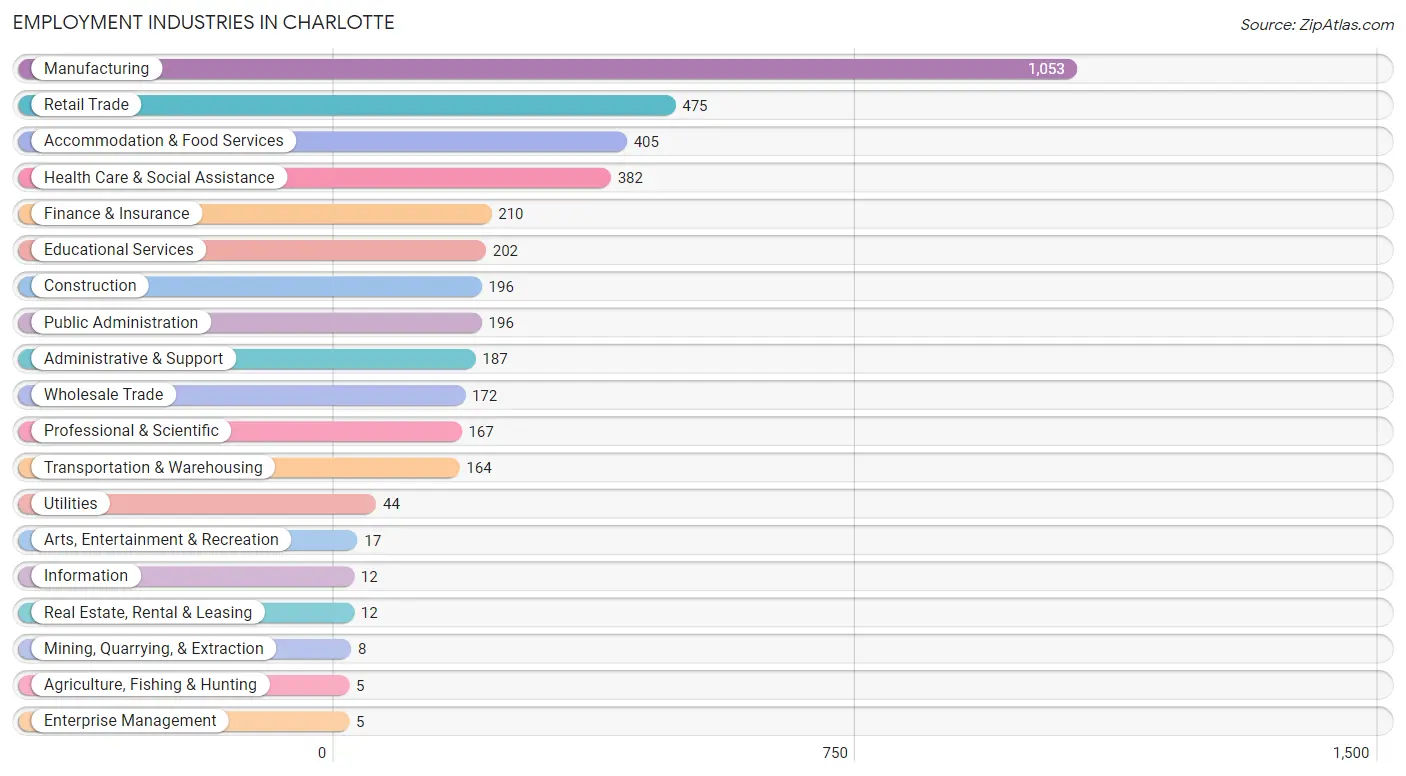
The major employment industries in Charlotte include Manufacturing (1,053 | 25.4%), Retail Trade (475 | 11.4%), Accommodation & Food Services (405 | 9.8%), Health Care & Social Assistance (382 | 9.2%), and Finance & Insurance (210 | 5.1%).
Employment Industries by Sex in Charlotte
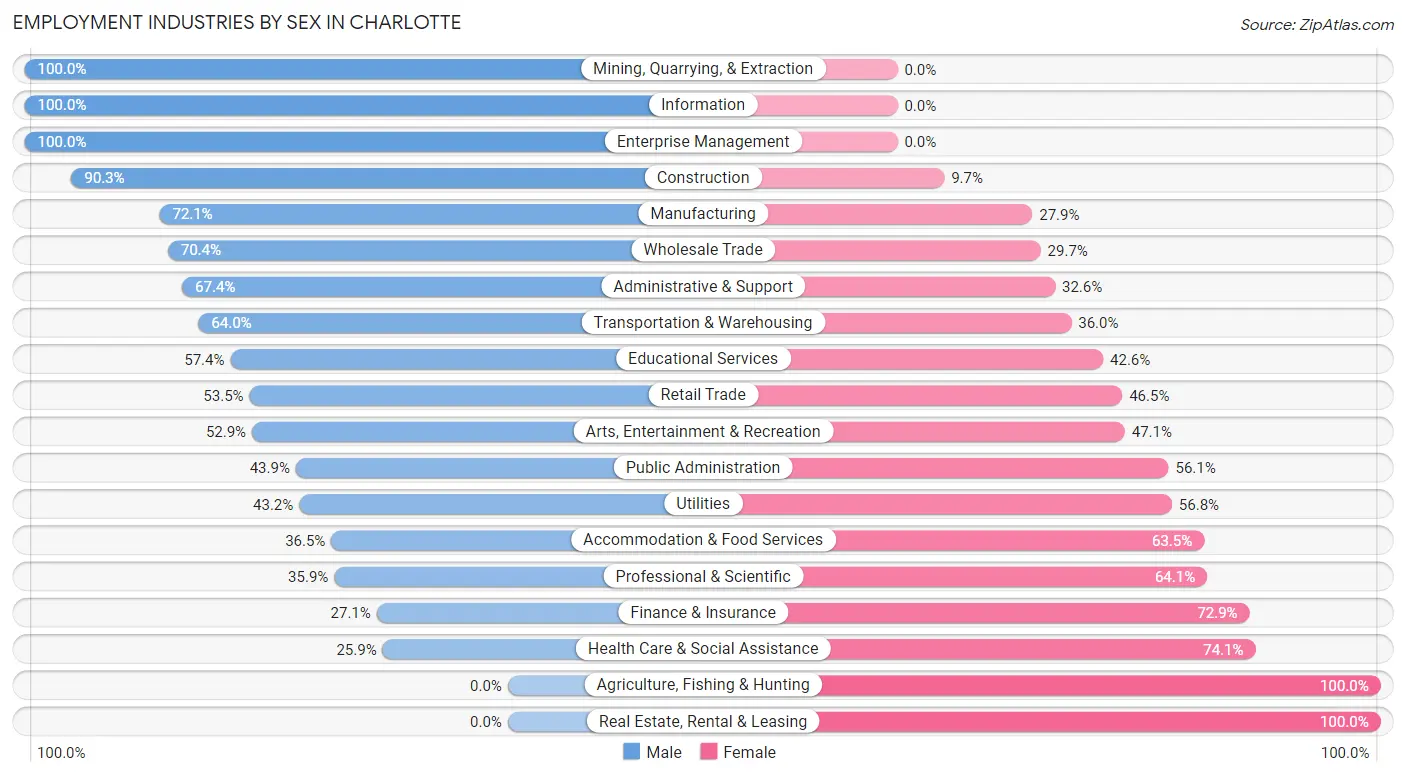
The Charlotte industries that see more men than women are Mining, Quarrying, & Extraction (100.0%), Information (100.0%), and Enterprise Management (100.0%), whereas the industries that tend to have a higher number of women are Agriculture, Fishing & Hunting (100.0%), Real Estate, Rental & Leasing (100.0%), and Health Care & Social Assistance (74.1%).
| Industry | Male | Female |
| Agriculture, Fishing & Hunting | 0 (0.0%) | 5 (100.0%) |
| Mining, Quarrying, & Extraction | 8 (100.0%) | 0 (0.0%) |
| Construction | 177 (90.3%) | 19 (9.7%) |
| Manufacturing | 759 (72.1%) | 294 (27.9%) |
| Wholesale Trade | 121 (70.4%) | 51 (29.6%) |
| Retail Trade | 254 (53.5%) | 221 (46.5%) |
| Transportation & Warehousing | 105 (64.0%) | 59 (36.0%) |
| Utilities | 19 (43.2%) | 25 (56.8%) |
| Information | 12 (100.0%) | 0 (0.0%) |
| Finance & Insurance | 57 (27.1%) | 153 (72.9%) |
| Real Estate, Rental & Leasing | 0 (0.0%) | 12 (100.0%) |
| Professional & Scientific | 60 (35.9%) | 107 (64.1%) |
| Enterprise Management | 5 (100.0%) | 0 (0.0%) |
| Administrative & Support | 126 (67.4%) | 61 (32.6%) |
| Educational Services | 116 (57.4%) | 86 (42.6%) |
| Health Care & Social Assistance | 99 (25.9%) | 283 (74.1%) |
| Arts, Entertainment & Recreation | 9 (52.9%) | 8 (47.1%) |
| Accommodation & Food Services | 148 (36.5%) | 257 (63.5%) |
| Public Administration | 86 (43.9%) | 110 (56.1%) |
| Total | 2,307 (55.5%) | 1,847 (44.5%) |
Education in Charlotte
School Enrollment in Charlotte
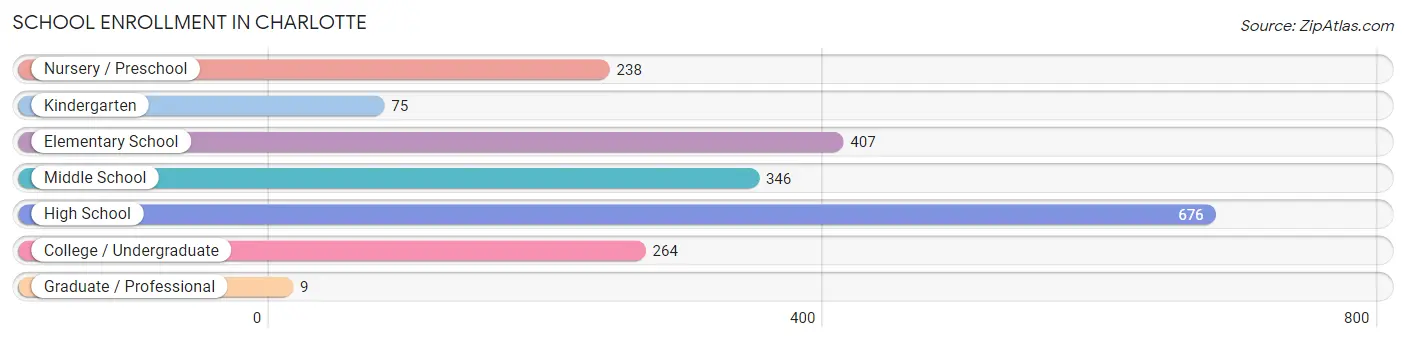
The most common levels of schooling among the 2,015 students in Charlotte are high school (676 | 33.6%), elementary school (407 | 20.2%), and middle school (346 | 17.2%).
| School Level | # Students | % Students |
| Nursery / Preschool | 238 | 11.8% |
| Kindergarten | 75 | 3.7% |
| Elementary School | 407 | 20.2% |
| Middle School | 346 | 17.2% |
| High School | 676 | 33.6% |
| College / Undergraduate | 264 | 13.1% |
| Graduate / Professional | 9 | 0.4% |
| Total | 2,015 | 100.0% |
School Enrollment by Age by Funding Source in Charlotte
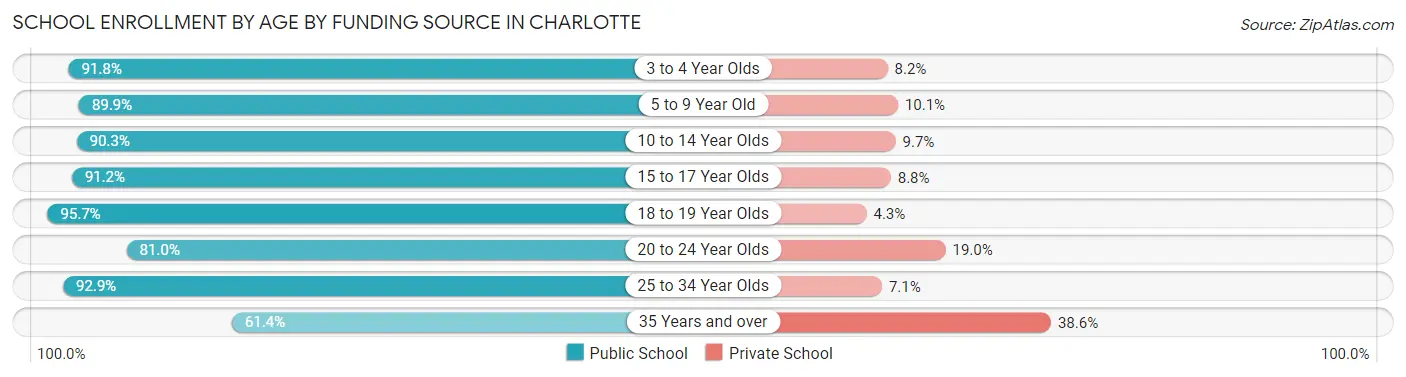
Out of a total of 2,015 students who are enrolled in schools in Charlotte, 222 (11.0%) attend a private institution, while the remaining 1,793 (89.0%) are enrolled in public schools. The age group of 35 years and over has the highest likelihood of being enrolled in private schools, with 39 (38.6% in the age bracket) enrolled. Conversely, the age group of 18 to 19 year olds has the lowest likelihood of being enrolled in a private school, with 135 (95.7% in the age bracket) attending a public institution.
| Age Bracket | Public School | Private School |
| 3 to 4 Year Olds | 202 (91.8%) | 18 (8.2%) |
| 5 to 9 Year Old | 400 (89.9%) | 45 (10.1%) |
| 10 to 14 Year Olds | 392 (90.3%) | 42 (9.7%) |
| 15 to 17 Year Olds | 426 (91.2%) | 41 (8.8%) |
| 18 to 19 Year Olds | 135 (95.7%) | 6 (4.3%) |
| 20 to 24 Year Olds | 111 (81.0%) | 26 (19.0%) |
| 25 to 34 Year Olds | 65 (92.9%) | 5 (7.1%) |
| 35 Years and over | 62 (61.4%) | 39 (38.6%) |
| Total | 1,793 (89.0%) | 222 (11.0%) |
Educational Attainment by Field of Study in Charlotte
Business (282 | 24.3%), arts & humanities (178 | 15.4%), education (122 | 10.5%), bio, nature & agricultural (112 | 9.7%), and science & technology (76 | 6.6%) are the most common fields of study among 1,159 individuals in Charlotte who have obtained a bachelor's degree or higher.
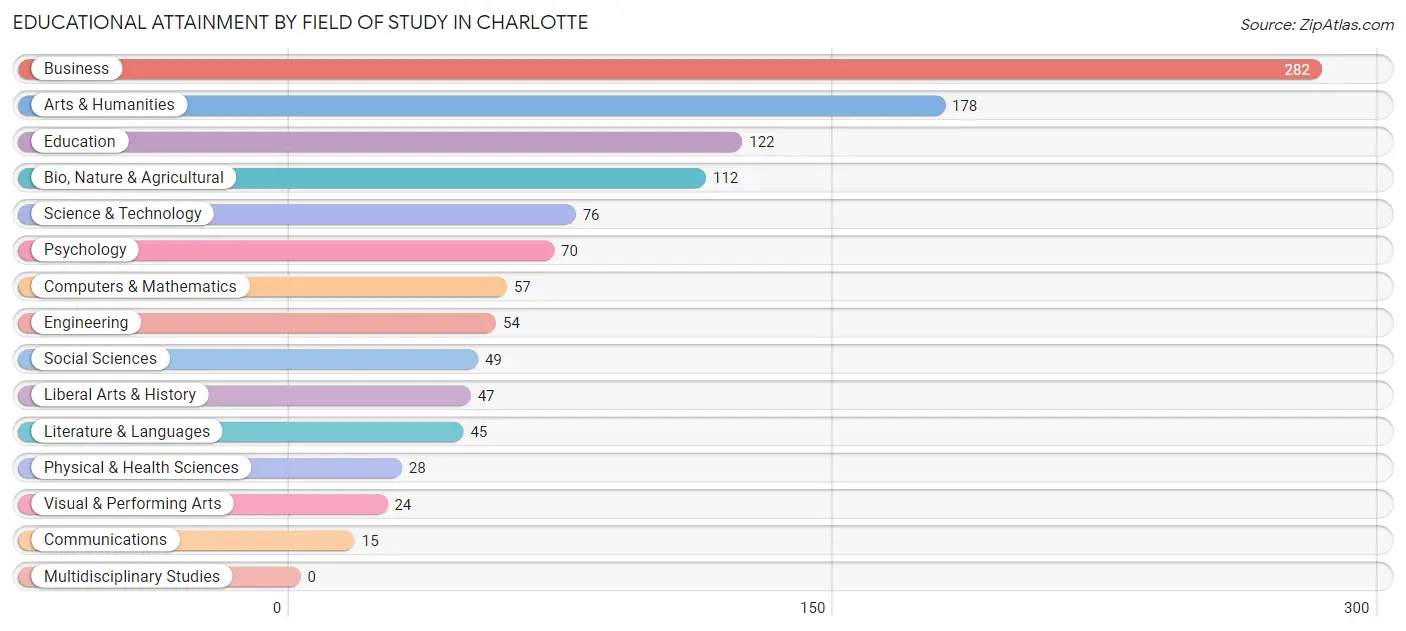
| Field of Study | # Graduates | % Graduates |
| Computers & Mathematics | 57 | 4.9% |
| Bio, Nature & Agricultural | 112 | 9.7% |
| Physical & Health Sciences | 28 | 2.4% |
| Psychology | 70 | 6.0% |
| Social Sciences | 49 | 4.2% |
| Engineering | 54 | 4.7% |
| Multidisciplinary Studies | 0 | 0.0% |
| Science & Technology | 76 | 6.6% |
| Business | 282 | 24.3% |
| Education | 122 | 10.5% |
| Literature & Languages | 45 | 3.9% |
| Liberal Arts & History | 47 | 4.1% |
| Visual & Performing Arts | 24 | 2.1% |
| Communications | 15 | 1.3% |
| Arts & Humanities | 178 | 15.4% |
| Total | 1,159 | 100.0% |
Transportation & Commute in Charlotte
Vehicle Availability by Sex in Charlotte
The most prevalent vehicle ownership categories in Charlotte are males with 2 vehicles (952, accounting for 41.9%) and females with 2 vehicles (776, making up 52.6%).
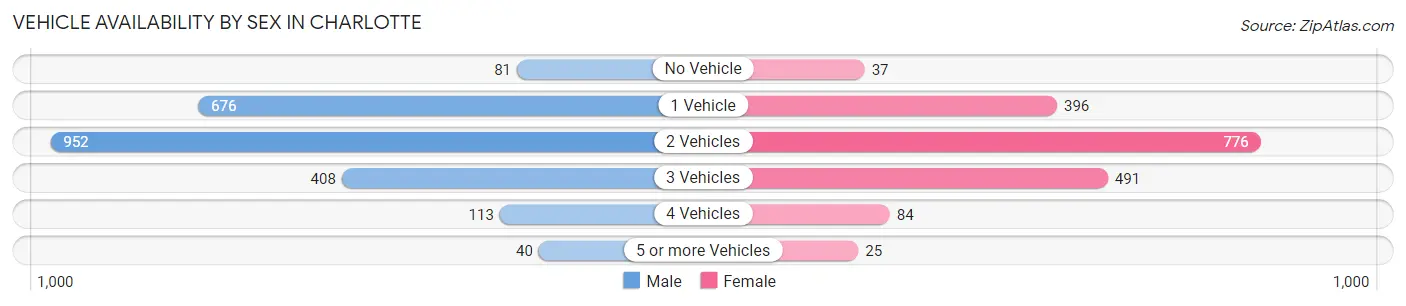
| Vehicles Available | Male | Female |
| No Vehicle | 81 (3.6%) | 37 (2.1%) |
| 1 Vehicle | 676 (29.8%) | 396 (21.9%) |
| 2 Vehicles | 952 (41.9%) | 776 (42.9%) |
| 3 Vehicles | 408 (18.0%) | 491 (27.1%) |
| 4 Vehicles | 113 (5.0%) | 84 (4.6%) |
| 5 or more Vehicles | 40 (1.8%) | 25 (1.4%) |
| Total | 2,270 (100.0%) | 1,809 (100.0%) |
Commute Time in Charlotte
The most frequently occuring commute durations in Charlotte are 5 to 9 minutes (696 commuters, 18.6%), 10 to 14 minutes (617 commuters, 16.5%), and 20 to 24 minutes (504 commuters, 13.4%).
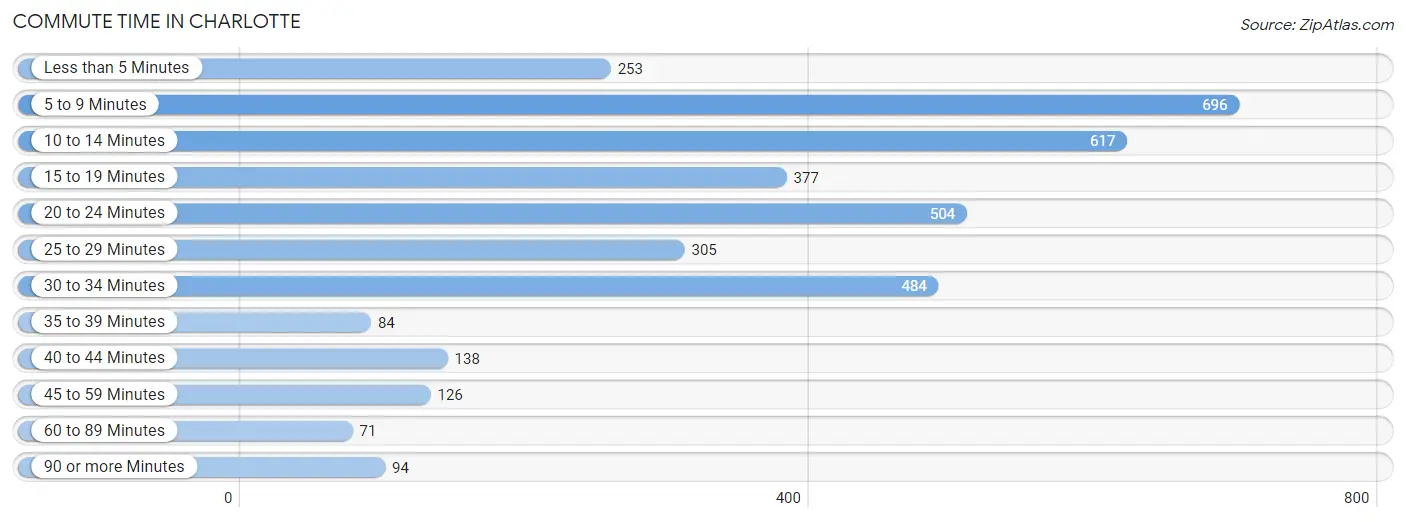
| Commute Time | # Commuters | % Commuters |
| Less than 5 Minutes | 253 | 6.8% |
| 5 to 9 Minutes | 696 | 18.6% |
| 10 to 14 Minutes | 617 | 16.5% |
| 15 to 19 Minutes | 377 | 10.1% |
| 20 to 24 Minutes | 504 | 13.4% |
| 25 to 29 Minutes | 305 | 8.1% |
| 30 to 34 Minutes | 484 | 12.9% |
| 35 to 39 Minutes | 84 | 2.2% |
| 40 to 44 Minutes | 138 | 3.7% |
| 45 to 59 Minutes | 126 | 3.4% |
| 60 to 89 Minutes | 71 | 1.9% |
| 90 or more Minutes | 94 | 2.5% |
Commute Time by Sex in Charlotte
The most common commute times in Charlotte are 20 to 24 minutes (318 commuters, 15.4%) for males and 5 to 9 minutes (445 commuters, 26.4%) for females.
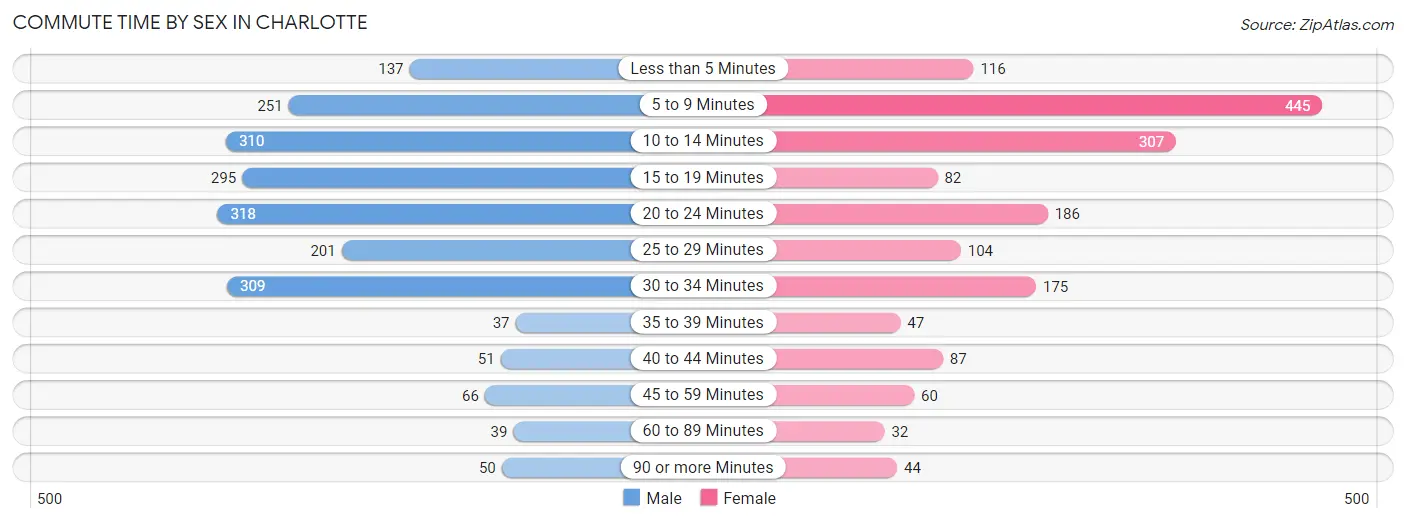
| Commute Time | Male | Female |
| Less than 5 Minutes | 137 (6.6%) | 116 (6.9%) |
| 5 to 9 Minutes | 251 (12.2%) | 445 (26.4%) |
| 10 to 14 Minutes | 310 (15.0%) | 307 (18.2%) |
| 15 to 19 Minutes | 295 (14.3%) | 82 (4.9%) |
| 20 to 24 Minutes | 318 (15.4%) | 186 (11.0%) |
| 25 to 29 Minutes | 201 (9.7%) | 104 (6.2%) |
| 30 to 34 Minutes | 309 (15.0%) | 175 (10.4%) |
| 35 to 39 Minutes | 37 (1.8%) | 47 (2.8%) |
| 40 to 44 Minutes | 51 (2.5%) | 87 (5.2%) |
| 45 to 59 Minutes | 66 (3.2%) | 60 (3.6%) |
| 60 to 89 Minutes | 39 (1.9%) | 32 (1.9%) |
| 90 or more Minutes | 50 (2.4%) | 44 (2.6%) |
Time of Departure to Work by Sex in Charlotte
The most frequent times of departure to work in Charlotte are 4:00 PM to 11:59 PM (307, 14.9%) for males and 6:00 AM to 6:29 AM (255, 15.1%) for females.
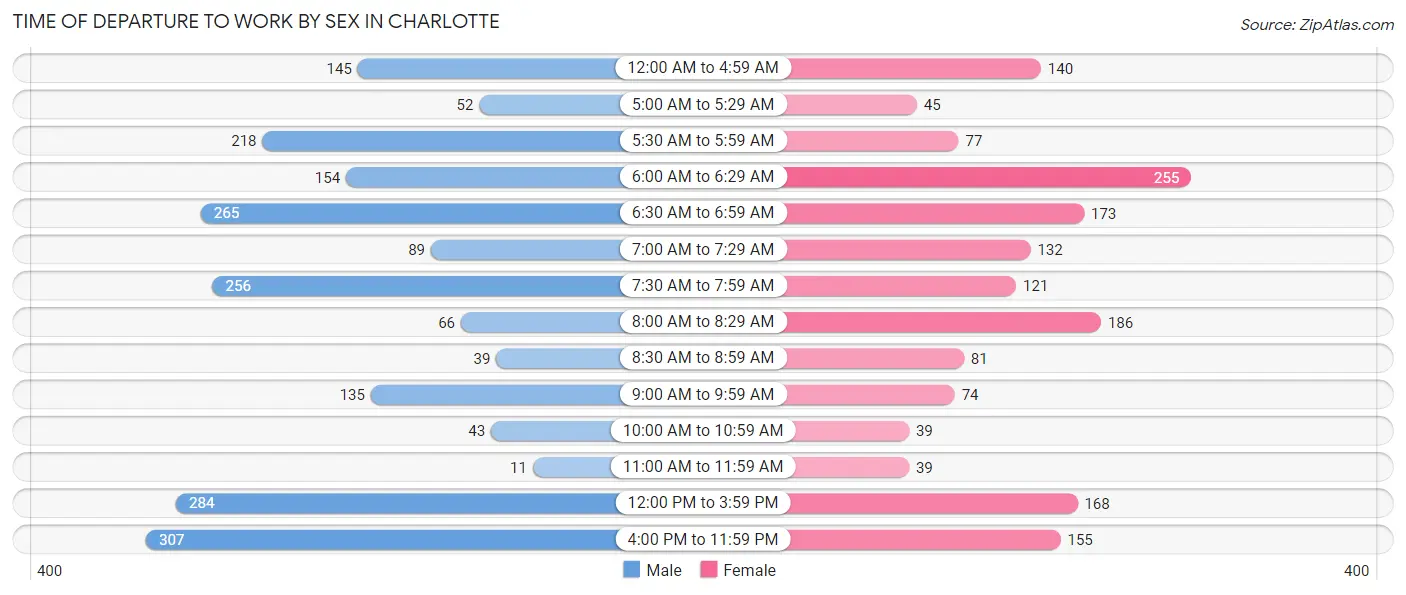
| Time of Departure | Male | Female |
| 12:00 AM to 4:59 AM | 145 (7.0%) | 140 (8.3%) |
| 5:00 AM to 5:29 AM | 52 (2.5%) | 45 (2.7%) |
| 5:30 AM to 5:59 AM | 218 (10.6%) | 77 (4.6%) |
| 6:00 AM to 6:29 AM | 154 (7.5%) | 255 (15.1%) |
| 6:30 AM to 6:59 AM | 265 (12.8%) | 173 (10.3%) |
| 7:00 AM to 7:29 AM | 89 (4.3%) | 132 (7.8%) |
| 7:30 AM to 7:59 AM | 256 (12.4%) | 121 (7.2%) |
| 8:00 AM to 8:29 AM | 66 (3.2%) | 186 (11.0%) |
| 8:30 AM to 8:59 AM | 39 (1.9%) | 81 (4.8%) |
| 9:00 AM to 9:59 AM | 135 (6.5%) | 74 (4.4%) |
| 10:00 AM to 10:59 AM | 43 (2.1%) | 39 (2.3%) |
| 11:00 AM to 11:59 AM | 11 (0.5%) | 39 (2.3%) |
| 12:00 PM to 3:59 PM | 284 (13.8%) | 168 (10.0%) |
| 4:00 PM to 11:59 PM | 307 (14.9%) | 155 (9.2%) |
| Total | 2,064 (100.0%) | 1,685 (100.0%) |
Housing Occupancy in Charlotte
Occupancy by Ownership in Charlotte
Of the total 3,443 dwellings in Charlotte, owner-occupied units account for 2,233 (64.9%), while renter-occupied units make up 1,210 (35.1%).
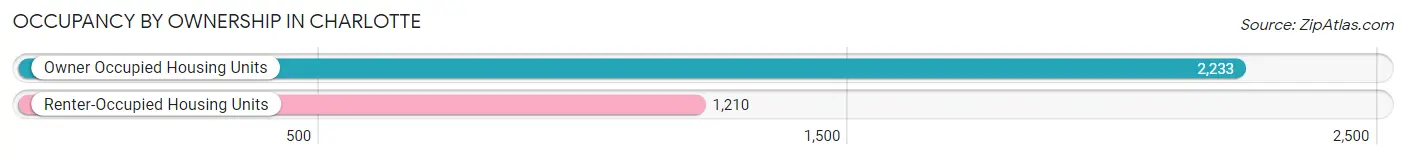
| Occupancy | # Housing Units | % Housing Units |
| Owner Occupied Housing Units | 2,233 | 64.9% |
| Renter-Occupied Housing Units | 1,210 | 35.1% |
| Total Occupied Housing Units | 3,443 | 100.0% |
Occupancy by Household Size in Charlotte
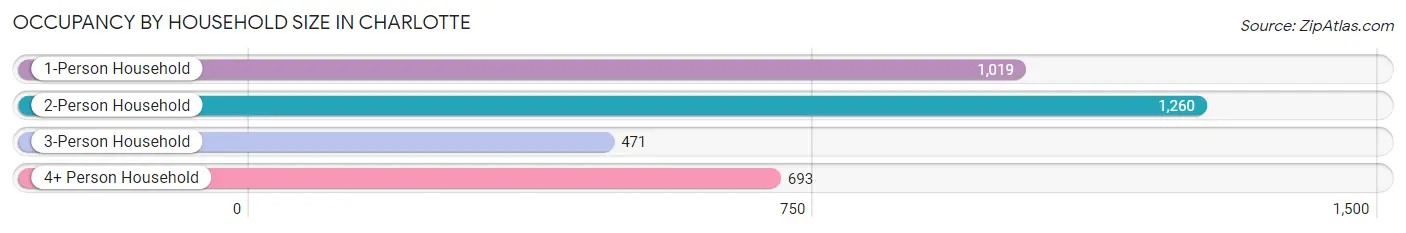
| Household Size | # Housing Units | % Housing Units |
| 1-Person Household | 1,019 | 29.6% |
| 2-Person Household | 1,260 | 36.6% |
| 3-Person Household | 471 | 13.7% |
| 4+ Person Household | 693 | 20.1% |
| Total Housing Units | 3,443 | 100.0% |
Occupancy by Ownership by Household Size in Charlotte
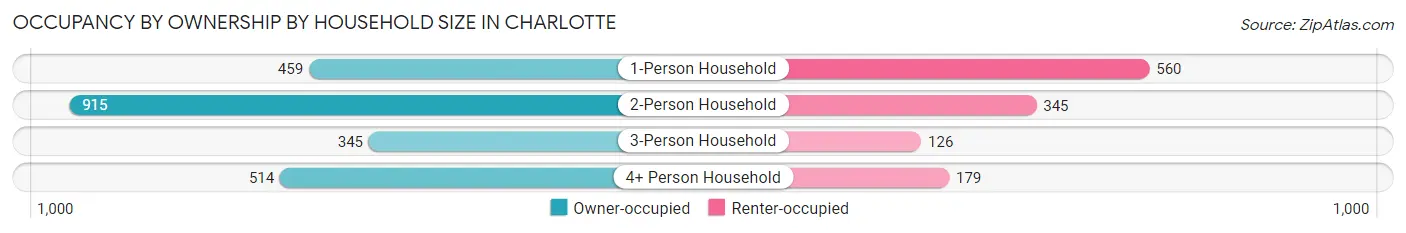
| Household Size | Owner-occupied | Renter-occupied |
| 1-Person Household | 459 (45.0%) | 560 (55.0%) |
| 2-Person Household | 915 (72.6%) | 345 (27.4%) |
| 3-Person Household | 345 (73.3%) | 126 (26.8%) |
| 4+ Person Household | 514 (74.2%) | 179 (25.8%) |
| Total Housing Units | 2,233 (64.9%) | 1,210 (35.1%) |
Occupancy by Educational Attainment in Charlotte
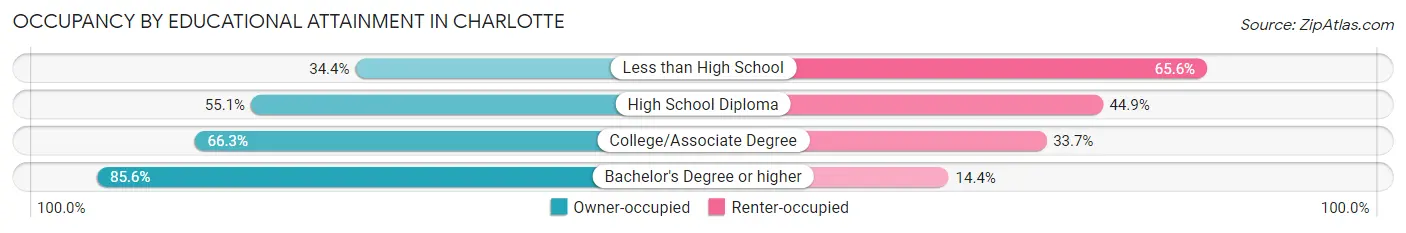
| Household Size | Owner-occupied | Renter-occupied |
| Less than High School | 63 (34.4%) | 120 (65.6%) |
| High School Diploma | 634 (55.1%) | 516 (44.9%) |
| College/Associate Degree | 928 (66.3%) | 472 (33.7%) |
| Bachelor's Degree or higher | 608 (85.6%) | 102 (14.4%) |
Occupancy by Age of Householder in Charlotte

| Age Bracket | # Households | % Households |
| Under 35 Years | 700 | 20.3% |
| 35 to 44 Years | 675 | 19.6% |
| 45 to 54 Years | 539 | 15.7% |
| 55 to 64 Years | 663 | 19.3% |
| 65 to 74 Years | 417 | 12.1% |
| 75 to 84 Years | 333 | 9.7% |
| 85 Years and Over | 116 | 3.4% |
| Total | 3,443 | 100.0% |
Housing Finances in Charlotte
Median Income by Occupancy in Charlotte
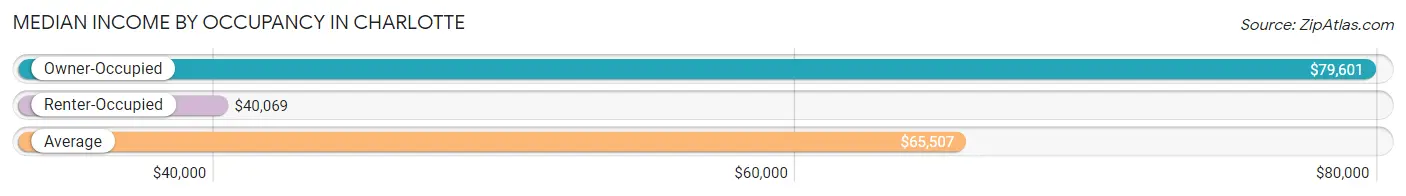
| Occupancy Type | # Households | Median Income |
| Owner-Occupied | 2,233 (64.9%) | $79,601 |
| Renter-Occupied | 1,210 (35.1%) | $40,069 |
| Average | 3,443 (100.0%) | $65,507 |
Occupancy by Householder Income Bracket in Charlotte
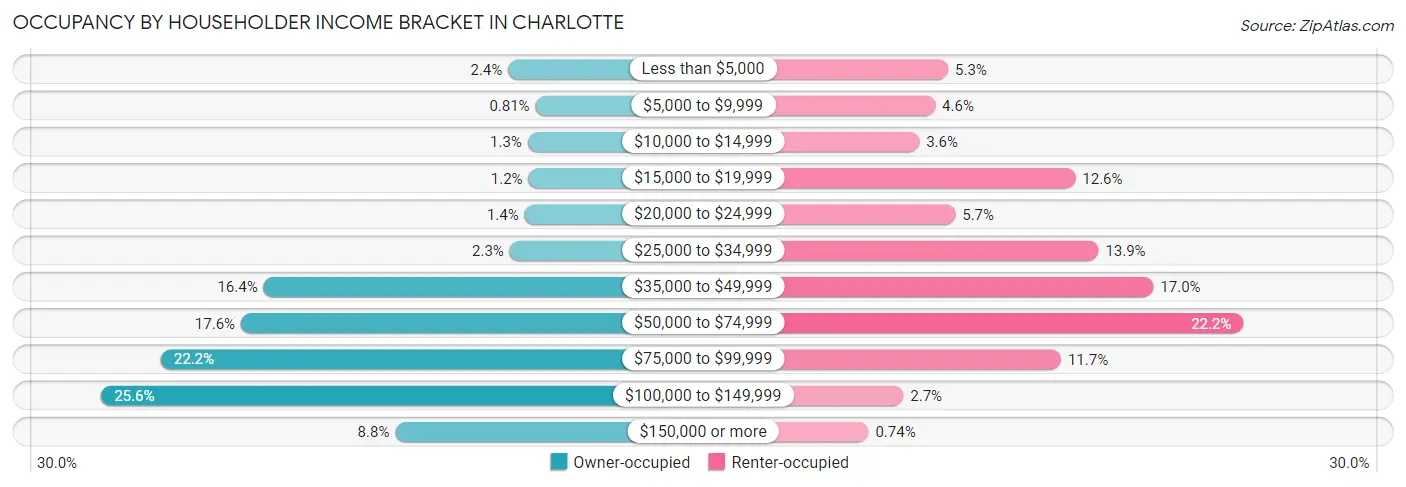
| Income Bracket | Owner-occupied | Renter-occupied |
| Less than $5,000 | 53 (2.4%) | 64 (5.3%) |
| $5,000 to $9,999 | 18 (0.8%) | 55 (4.5%) |
| $10,000 to $14,999 | 28 (1.3%) | 44 (3.6%) |
| $15,000 to $19,999 | 27 (1.2%) | 152 (12.6%) |
| $20,000 to $24,999 | 32 (1.4%) | 69 (5.7%) |
| $25,000 to $34,999 | 51 (2.3%) | 168 (13.9%) |
| $35,000 to $49,999 | 365 (16.4%) | 206 (17.0%) |
| $50,000 to $74,999 | 394 (17.6%) | 268 (22.2%) |
| $75,000 to $99,999 | 496 (22.2%) | 142 (11.7%) |
| $100,000 to $149,999 | 572 (25.6%) | 33 (2.7%) |
| $150,000 or more | 197 (8.8%) | 9 (0.7%) |
| Total | 2,233 (100.0%) | 1,210 (100.0%) |
Monthly Housing Cost Tiers in Charlotte
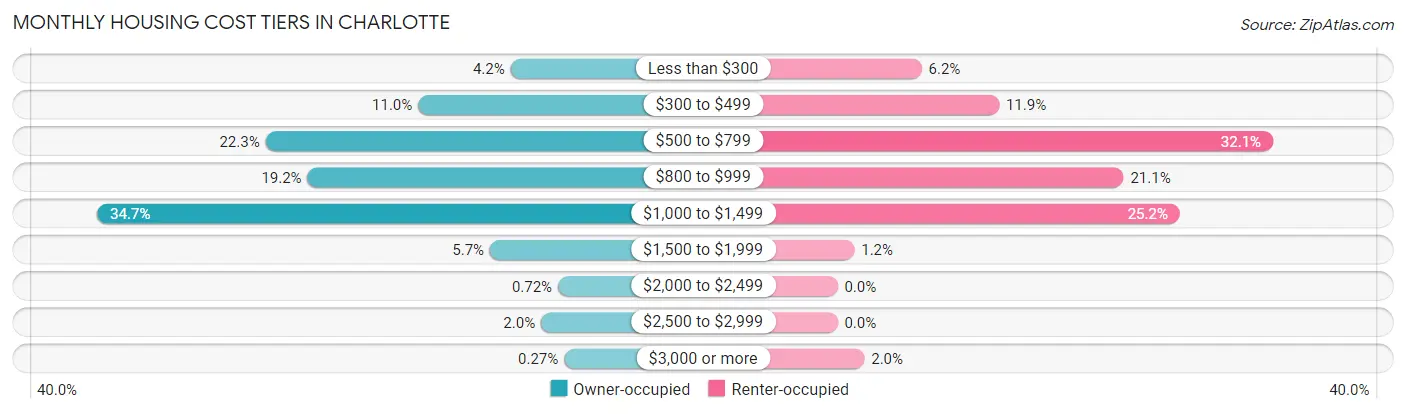
| Monthly Cost | Owner-occupied | Renter-occupied |
| Less than $300 | 94 (4.2%) | 75 (6.2%) |
| $300 to $499 | 246 (11.0%) | 144 (11.9%) |
| $500 to $799 | 497 (22.3%) | 388 (32.1%) |
| $800 to $999 | 428 (19.2%) | 255 (21.1%) |
| $1,000 to $1,499 | 774 (34.7%) | 305 (25.2%) |
| $1,500 to $1,999 | 128 (5.7%) | 15 (1.2%) |
| $2,000 to $2,499 | 16 (0.7%) | 0 (0.0%) |
| $2,500 to $2,999 | 44 (2.0%) | 0 (0.0%) |
| $3,000 or more | 6 (0.3%) | 24 (2.0%) |
| Total | 2,233 (100.0%) | 1,210 (100.0%) |
Physical Housing Characteristics in Charlotte
Housing Structures in Charlotte
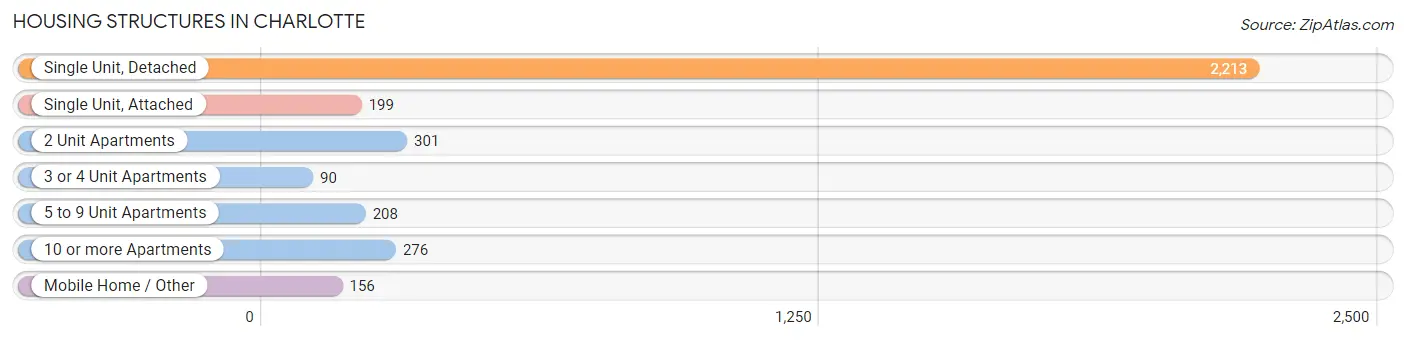
| Structure Type | # Housing Units | % Housing Units |
| Single Unit, Detached | 2,213 | 64.3% |
| Single Unit, Attached | 199 | 5.8% |
| 2 Unit Apartments | 301 | 8.7% |
| 3 or 4 Unit Apartments | 90 | 2.6% |
| 5 to 9 Unit Apartments | 208 | 6.0% |
| 10 or more Apartments | 276 | 8.0% |
| Mobile Home / Other | 156 | 4.5% |
| Total | 3,443 | 100.0% |
Housing Structures by Occupancy in Charlotte
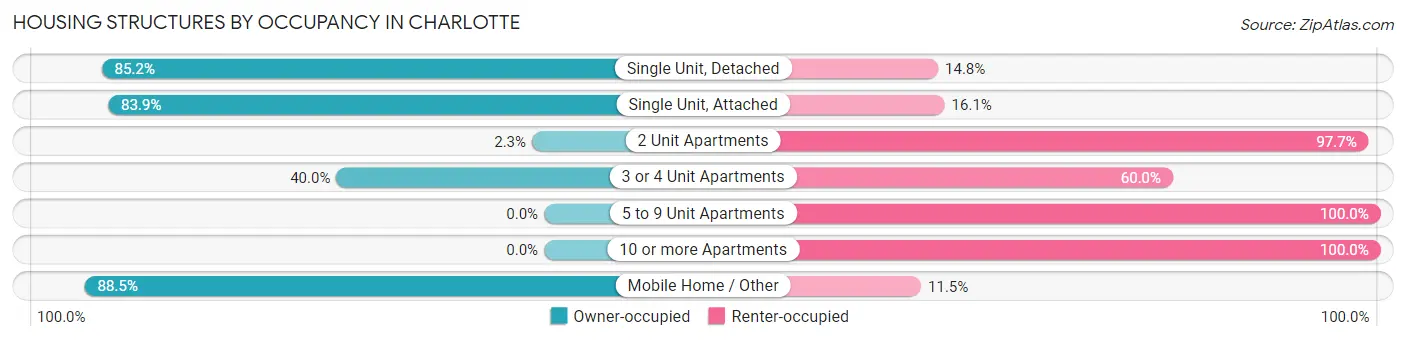
| Structure Type | Owner-occupied | Renter-occupied |
| Single Unit, Detached | 1,885 (85.2%) | 328 (14.8%) |
| Single Unit, Attached | 167 (83.9%) | 32 (16.1%) |
| 2 Unit Apartments | 7 (2.3%) | 294 (97.7%) |
| 3 or 4 Unit Apartments | 36 (40.0%) | 54 (60.0%) |
| 5 to 9 Unit Apartments | 0 (0.0%) | 208 (100.0%) |
| 10 or more Apartments | 0 (0.0%) | 276 (100.0%) |
| Mobile Home / Other | 138 (88.5%) | 18 (11.5%) |
| Total | 2,233 (64.9%) | 1,210 (35.1%) |
Housing Structures by Number of Rooms in Charlotte
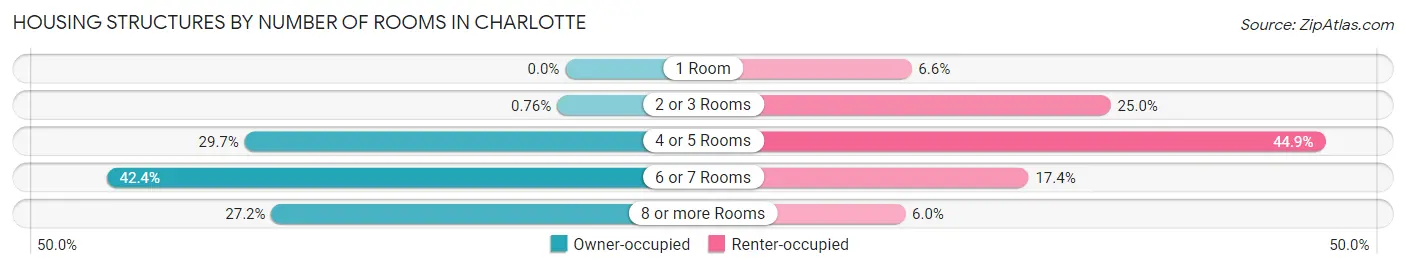
| Number of Rooms | Owner-occupied | Renter-occupied |
| 1 Room | 0 (0.0%) | 80 (6.6%) |
| 2 or 3 Rooms | 17 (0.8%) | 303 (25.0%) |
| 4 or 5 Rooms | 662 (29.6%) | 543 (44.9%) |
| 6 or 7 Rooms | 947 (42.4%) | 211 (17.4%) |
| 8 or more Rooms | 607 (27.2%) | 73 (6.0%) |
| Total | 2,233 (100.0%) | 1,210 (100.0%) |
Housing Structure by Heating Type in Charlotte
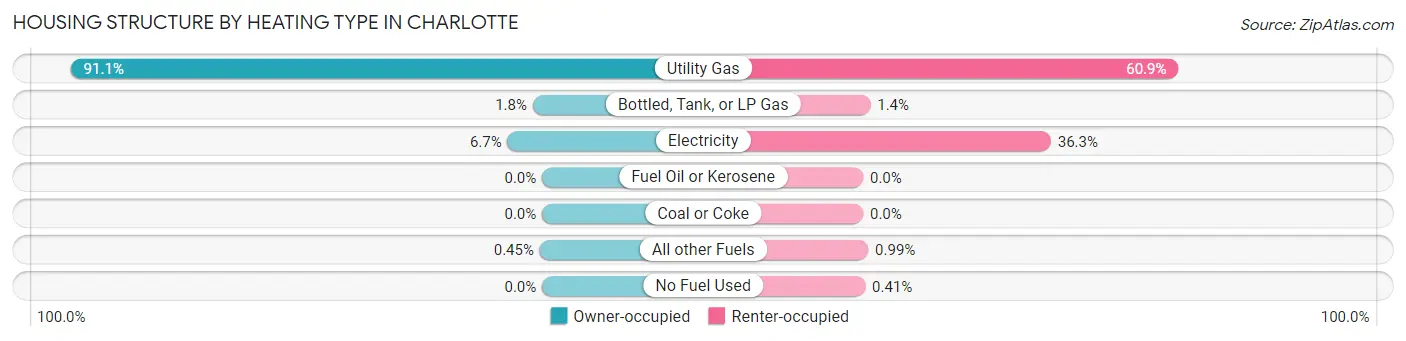
| Heating Type | Owner-occupied | Renter-occupied |
| Utility Gas | 2,034 (91.1%) | 737 (60.9%) |
| Bottled, Tank, or LP Gas | 40 (1.8%) | 17 (1.4%) |
| Electricity | 149 (6.7%) | 439 (36.3%) |
| Fuel Oil or Kerosene | 0 (0.0%) | 0 (0.0%) |
| Coal or Coke | 0 (0.0%) | 0 (0.0%) |
| All other Fuels | 10 (0.4%) | 12 (1.0%) |
| No Fuel Used | 0 (0.0%) | 5 (0.4%) |
| Total | 2,233 (100.0%) | 1,210 (100.0%) |
Household Vehicle Usage in Charlotte
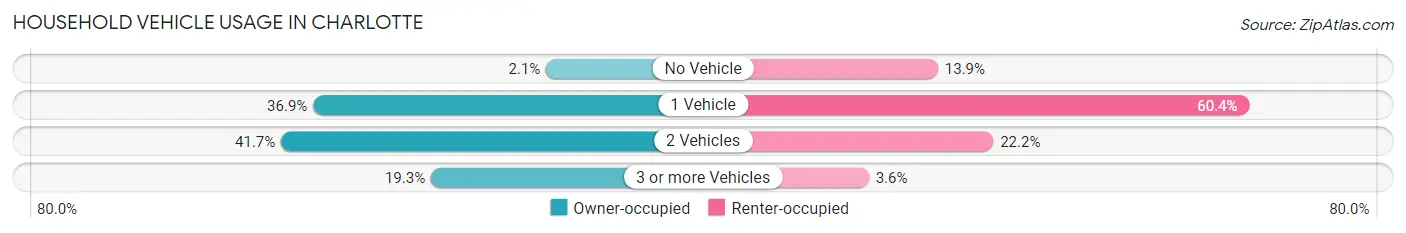
| Vehicles per Household | Owner-occupied | Renter-occupied |
| No Vehicle | 47 (2.1%) | 168 (13.9%) |
| 1 Vehicle | 824 (36.9%) | 731 (60.4%) |
| 2 Vehicles | 931 (41.7%) | 268 (22.2%) |
| 3 or more Vehicles | 431 (19.3%) | 43 (3.5%) |
| Total | 2,233 (100.0%) | 1,210 (100.0%) |
Real Estate & Mortgages in Charlotte
Real Estate and Mortgage Overview in Charlotte
| Characteristic | Without Mortgage | With Mortgage |
| Housing Units | 695 | 1,538 |
| Median Property Value | $110,700 | $128,900 |
| Median Household Income | $65,125 | $163 |
| Monthly Housing Costs | $559 | $6 |
| Real Estate Taxes | $2,225 | $28 |
Property Value by Mortgage Status in Charlotte
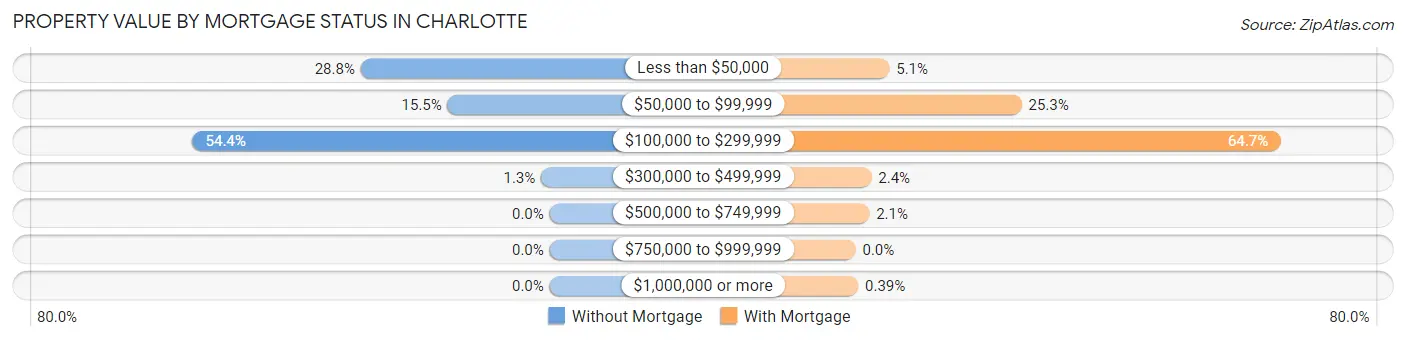
| Property Value | Without Mortgage | With Mortgage |
| Less than $50,000 | 200 (28.8%) | 79 (5.1%) |
| $50,000 to $99,999 | 108 (15.5%) | 389 (25.3%) |
| $100,000 to $299,999 | 378 (54.4%) | 995 (64.7%) |
| $300,000 to $499,999 | 9 (1.3%) | 37 (2.4%) |
| $500,000 to $749,999 | 0 (0.0%) | 32 (2.1%) |
| $750,000 to $999,999 | 0 (0.0%) | 0 (0.0%) |
| $1,000,000 or more | 0 (0.0%) | 6 (0.4%) |
| Total | 695 (100.0%) | 1,538 (100.0%) |
Household Income by Mortgage Status in Charlotte
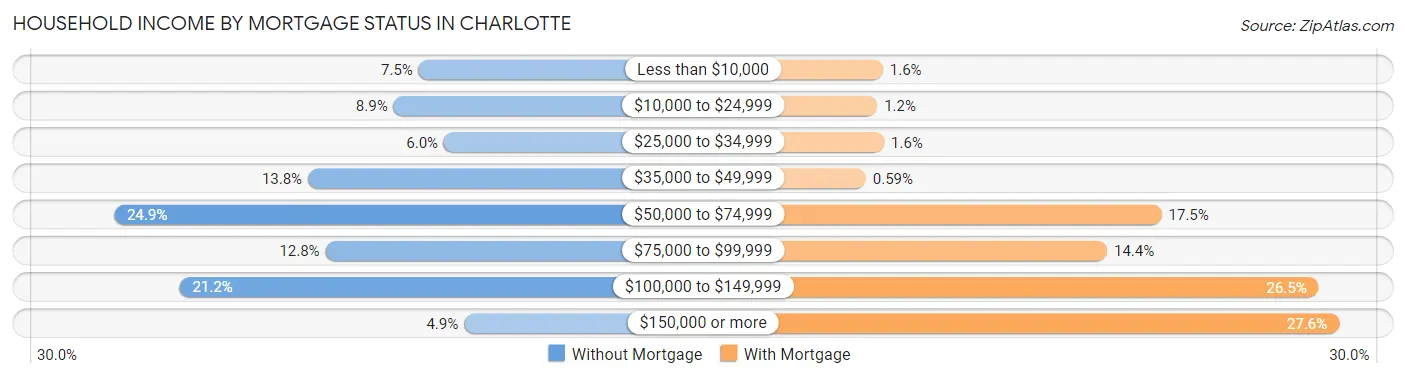
| Household Income | Without Mortgage | With Mortgage |
| Less than $10,000 | 52 (7.5%) | 24 (1.6%) |
| $10,000 to $24,999 | 62 (8.9%) | 19 (1.2%) |
| $25,000 to $34,999 | 42 (6.0%) | 25 (1.6%) |
| $35,000 to $49,999 | 96 (13.8%) | 9 (0.6%) |
| $50,000 to $74,999 | 173 (24.9%) | 269 (17.5%) |
| $75,000 to $99,999 | 89 (12.8%) | 221 (14.4%) |
| $100,000 to $149,999 | 147 (21.1%) | 407 (26.5%) |
| $150,000 or more | 34 (4.9%) | 425 (27.6%) |
| Total | 695 (100.0%) | 1,538 (100.0%) |
Property Value to Household Income Ratio in Charlotte
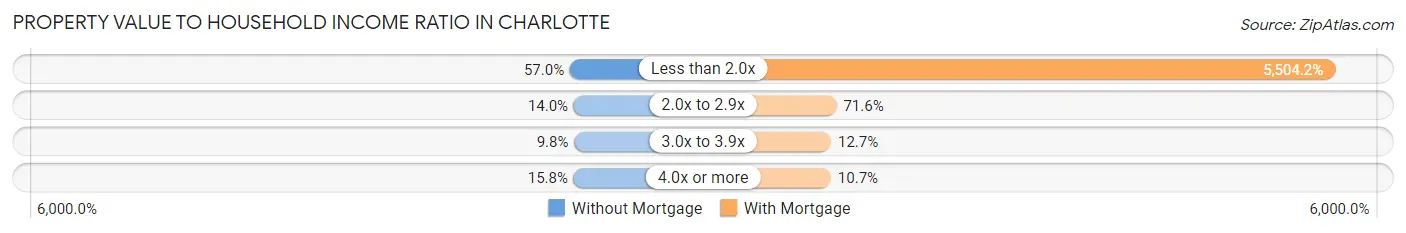
| Value-to-Income Ratio | Without Mortgage | With Mortgage |
| Less than 2.0x | 396 (57.0%) | 84,655 (5,504.2%) |
| 2.0x to 2.9x | 97 (14.0%) | 1,101 (71.6%) |
| 3.0x to 3.9x | 68 (9.8%) | 195 (12.7%) |
| 4.0x or more | 110 (15.8%) | 165 (10.7%) |
| Total | 695 (100.0%) | 1,538 (100.0%) |
Real Estate Taxes by Mortgage Status in Charlotte
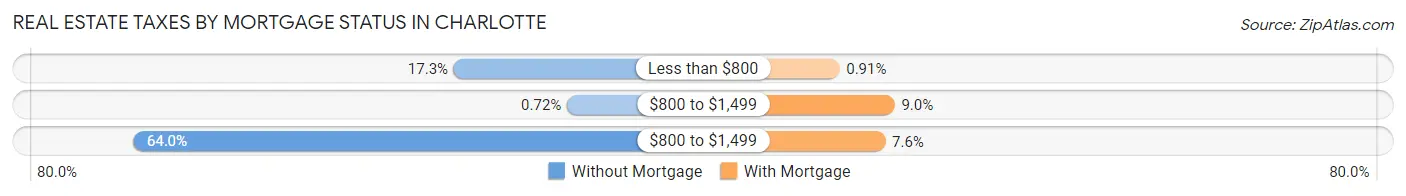
| Property Taxes | Without Mortgage | With Mortgage |
| Less than $800 | 120 (17.3%) | 14 (0.9%) |
| $800 to $1,499 | 5 (0.7%) | 138 (9.0%) |
| $800 to $1,499 | 445 (64.0%) | 117 (7.6%) |
| Total | 695 (100.0%) | 1,538 (100.0%) |
Health & Disability in Charlotte
Health Insurance Coverage by Age in Charlotte
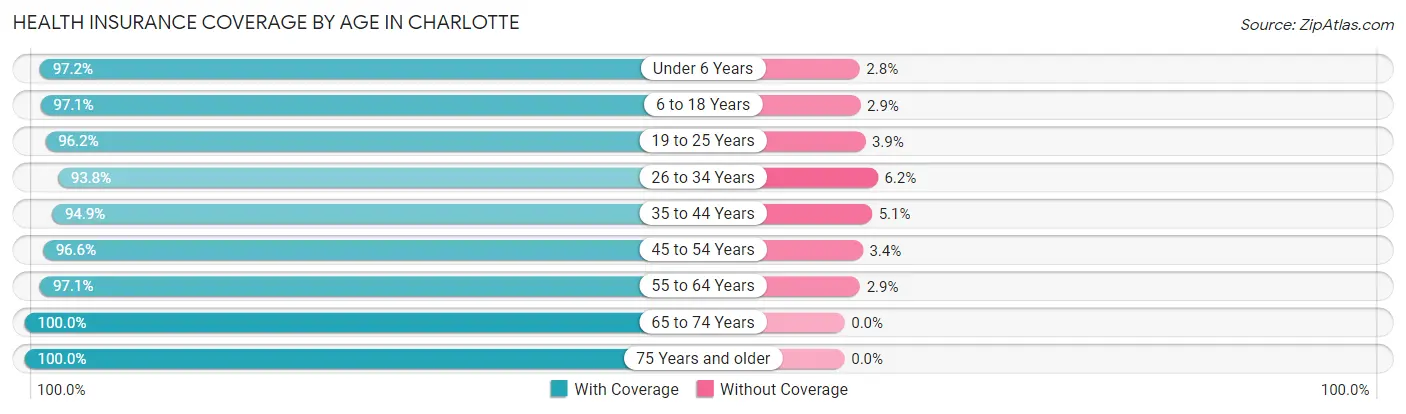
| Age Bracket | With Coverage | Without Coverage |
| Under 6 Years | 621 (97.2%) | 18 (2.8%) |
| 6 to 18 Years | 1,615 (97.1%) | 49 (2.9%) |
| 19 to 25 Years | 774 (96.2%) | 31 (3.8%) |
| 26 to 34 Years | 1,137 (93.8%) | 75 (6.2%) |
| 35 to 44 Years | 1,208 (94.9%) | 65 (5.1%) |
| 45 to 54 Years | 855 (96.6%) | 30 (3.4%) |
| 55 to 64 Years | 1,047 (97.1%) | 31 (2.9%) |
| 65 to 74 Years | 628 (100.0%) | 0 (0.0%) |
| 75 Years and older | 647 (100.0%) | 0 (0.0%) |
| Total | 8,532 (96.6%) | 299 (3.4%) |
Health Insurance Coverage by Citizenship Status in Charlotte
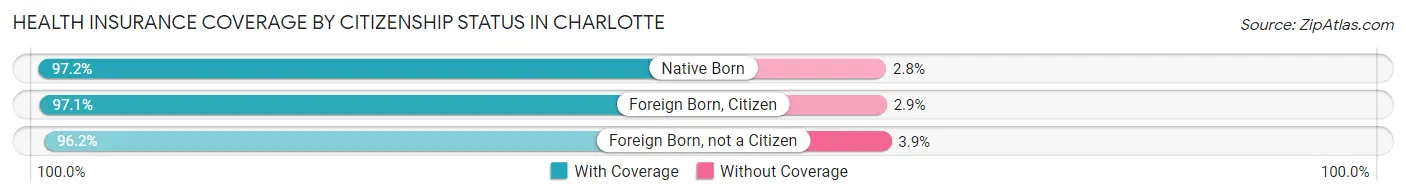
| Citizenship Status | With Coverage | Without Coverage |
| Native Born | 621 (97.2%) | 18 (2.8%) |
| Foreign Born, Citizen | 1,615 (97.1%) | 49 (2.9%) |
| Foreign Born, not a Citizen | 774 (96.2%) | 31 (3.8%) |
Health Insurance Coverage by Household Income in Charlotte
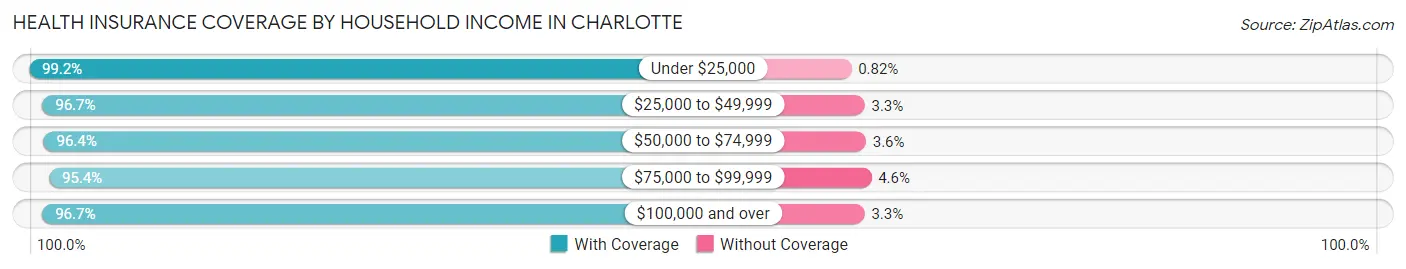
| Household Income | With Coverage | Without Coverage |
| Under $25,000 | 730 (99.2%) | 6 (0.8%) |
| $25,000 to $49,999 | 1,890 (96.7%) | 65 (3.3%) |
| $50,000 to $74,999 | 1,518 (96.4%) | 56 (3.6%) |
| $75,000 to $99,999 | 1,629 (95.4%) | 78 (4.6%) |
| $100,000 and over | 2,744 (96.7%) | 94 (3.3%) |
Public vs Private Health Insurance Coverage by Age in Charlotte
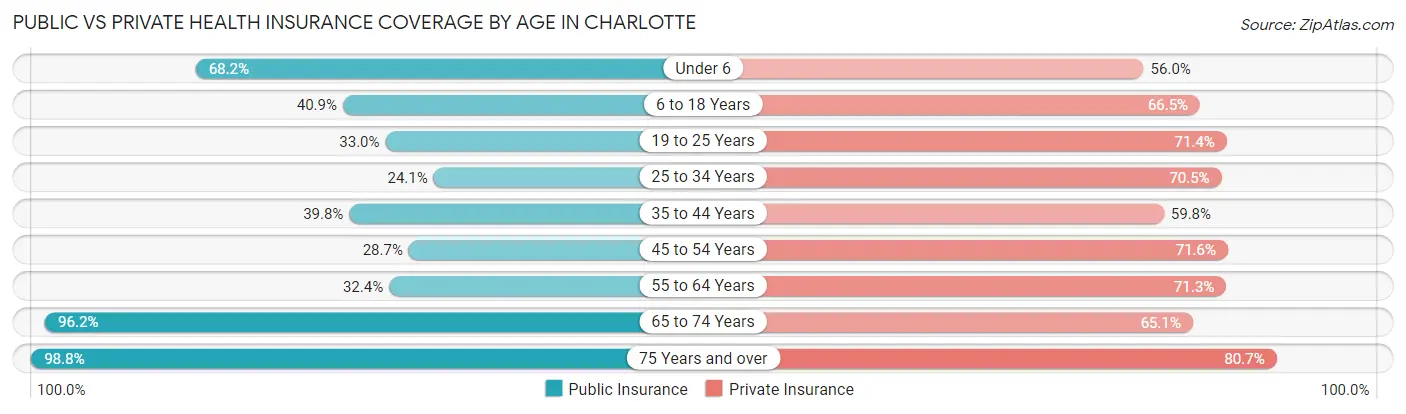
| Age Bracket | Public Insurance | Private Insurance |
| Under 6 | 436 (68.2%) | 358 (56.0%) |
| 6 to 18 Years | 681 (40.9%) | 1,106 (66.5%) |
| 19 to 25 Years | 266 (33.0%) | 575 (71.4%) |
| 25 to 34 Years | 292 (24.1%) | 854 (70.5%) |
| 35 to 44 Years | 506 (39.8%) | 761 (59.8%) |
| 45 to 54 Years | 254 (28.7%) | 634 (71.6%) |
| 55 to 64 Years | 349 (32.4%) | 769 (71.3%) |
| 65 to 74 Years | 604 (96.2%) | 409 (65.1%) |
| 75 Years and over | 639 (98.8%) | 522 (80.7%) |
| Total | 4,027 (45.6%) | 5,988 (67.8%) |
Disability Status by Sex by Age in Charlotte
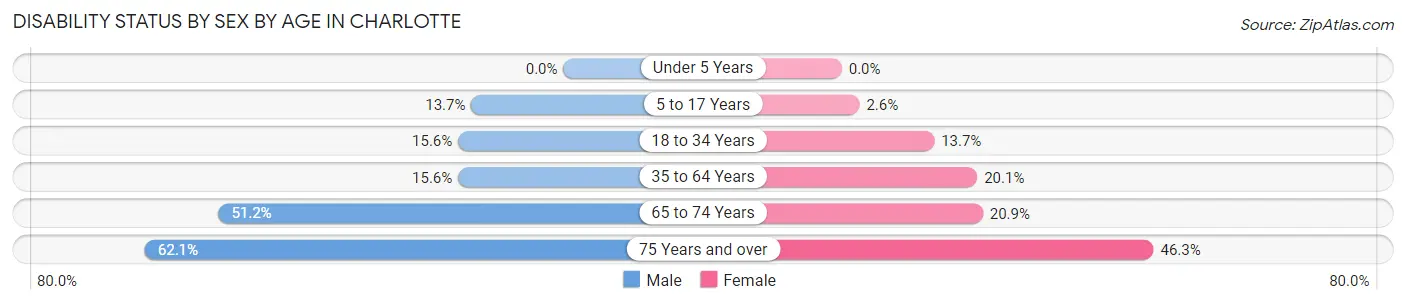
| Age Bracket | Male | Female |
| Under 5 Years | 0 (0.0%) | 0 (0.0%) |
| 5 to 17 Years | 104 (13.7%) | 23 (2.6%) |
| 18 to 34 Years | 173 (15.6%) | 142 (13.7%) |
| 35 to 64 Years | 275 (15.6%) | 297 (20.1%) |
| 65 to 74 Years | 148 (51.2%) | 71 (20.9%) |
| 75 Years and over | 151 (62.1%) | 187 (46.3%) |
Disability Class by Sex by Age in Charlotte
Disability Class: Hearing Difficulty
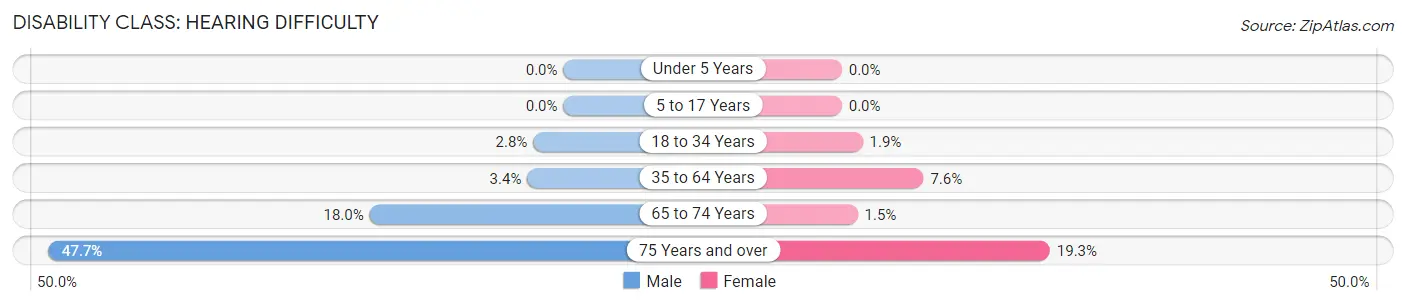
| Age Bracket | Male | Female |
| Under 5 Years | 0 (0.0%) | 0 (0.0%) |
| 5 to 17 Years | 0 (0.0%) | 0 (0.0%) |
| 18 to 34 Years | 31 (2.8%) | 20 (1.9%) |
| 35 to 64 Years | 59 (3.4%) | 112 (7.6%) |
| 65 to 74 Years | 52 (18.0%) | 5 (1.5%) |
| 75 Years and over | 116 (47.7%) | 78 (19.3%) |
Disability Class: Vision Difficulty
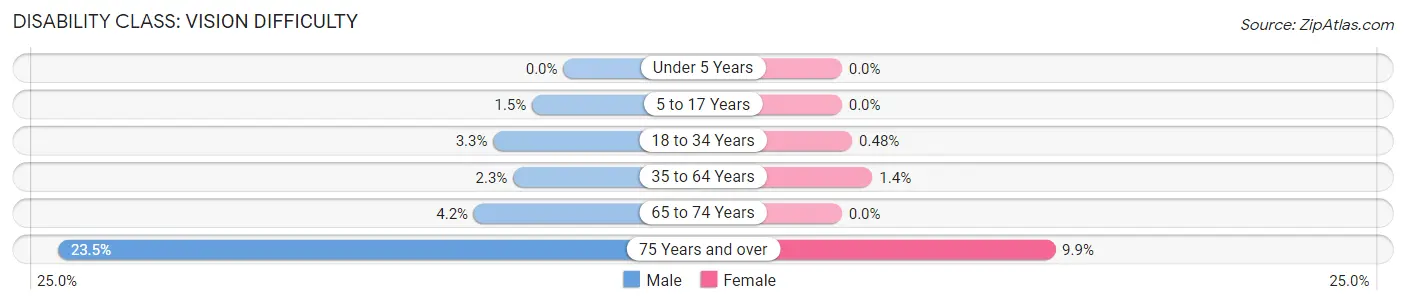
| Age Bracket | Male | Female |
| Under 5 Years | 0 (0.0%) | 0 (0.0%) |
| 5 to 17 Years | 11 (1.5%) | 0 (0.0%) |
| 18 to 34 Years | 36 (3.3%) | 5 (0.5%) |
| 35 to 64 Years | 41 (2.3%) | 21 (1.4%) |
| 65 to 74 Years | 12 (4.2%) | 0 (0.0%) |
| 75 Years and over | 57 (23.5%) | 40 (9.9%) |
Disability Class: Cognitive Difficulty
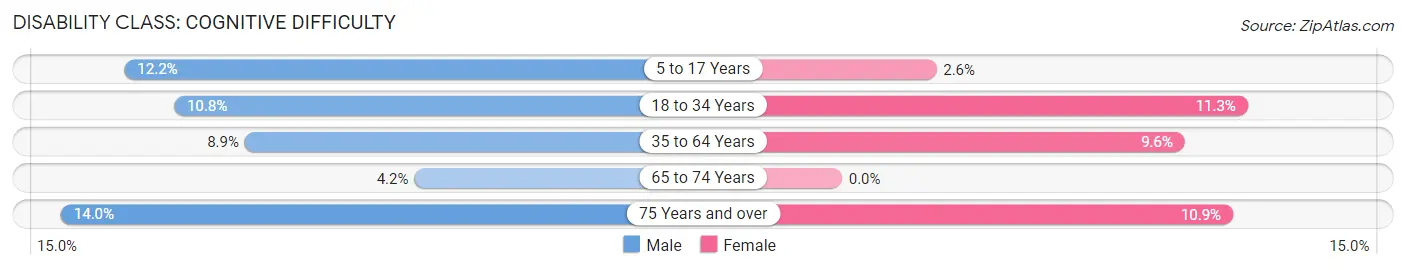
| Age Bracket | Male | Female |
| 5 to 17 Years | 93 (12.2%) | 23 (2.6%) |
| 18 to 34 Years | 120 (10.8%) | 117 (11.3%) |
| 35 to 64 Years | 156 (8.9%) | 141 (9.6%) |
| 65 to 74 Years | 12 (4.2%) | 0 (0.0%) |
| 75 Years and over | 34 (14.0%) | 44 (10.9%) |
Disability Class: Ambulatory Difficulty
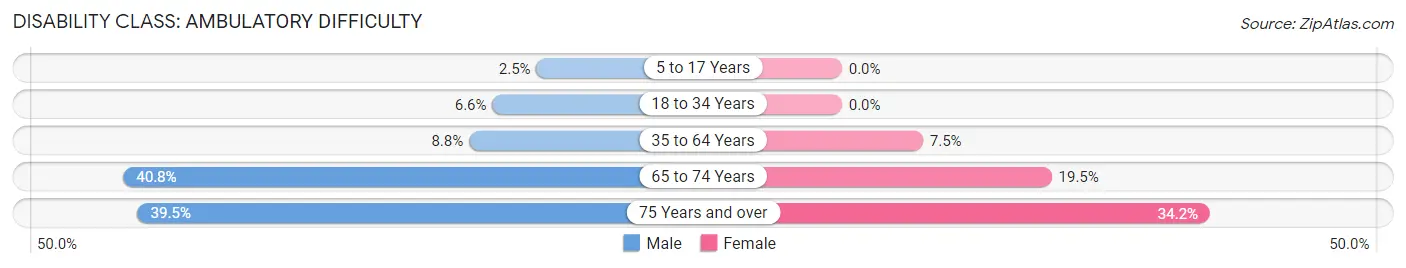
| Age Bracket | Male | Female |
| 5 to 17 Years | 19 (2.5%) | 0 (0.0%) |
| 18 to 34 Years | 73 (6.6%) | 0 (0.0%) |
| 35 to 64 Years | 154 (8.7%) | 111 (7.5%) |
| 65 to 74 Years | 118 (40.8%) | 66 (19.5%) |
| 75 Years and over | 96 (39.5%) | 138 (34.2%) |
Disability Class: Self-Care Difficulty
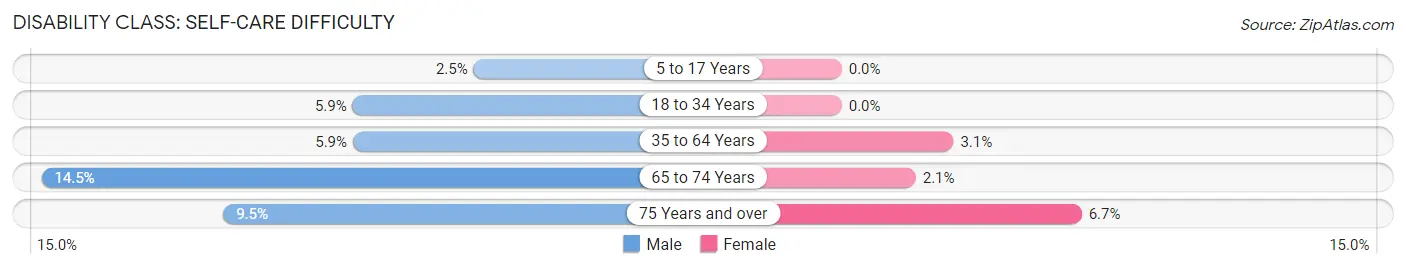
| Age Bracket | Male | Female |
| 5 to 17 Years | 19 (2.5%) | 0 (0.0%) |
| 18 to 34 Years | 65 (5.9%) | 0 (0.0%) |
| 35 to 64 Years | 103 (5.9%) | 46 (3.1%) |
| 65 to 74 Years | 42 (14.5%) | 7 (2.1%) |
| 75 Years and over | 23 (9.5%) | 27 (6.7%) |
Technology Access in Charlotte
Computing Device Access in Charlotte
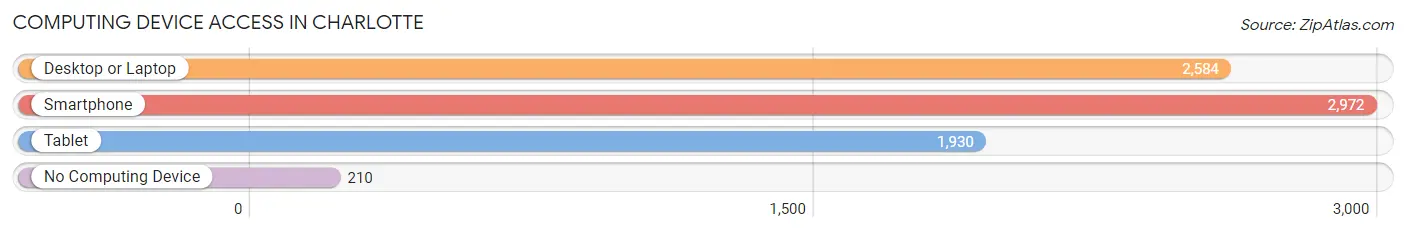
| Device Type | # Households | % Households |
| Desktop or Laptop | 2,584 | 75.0% |
| Smartphone | 2,972 | 86.3% |
| Tablet | 1,930 | 56.1% |
| No Computing Device | 210 | 6.1% |
| Total | 3,443 | 100.0% |
Internet Access in Charlotte
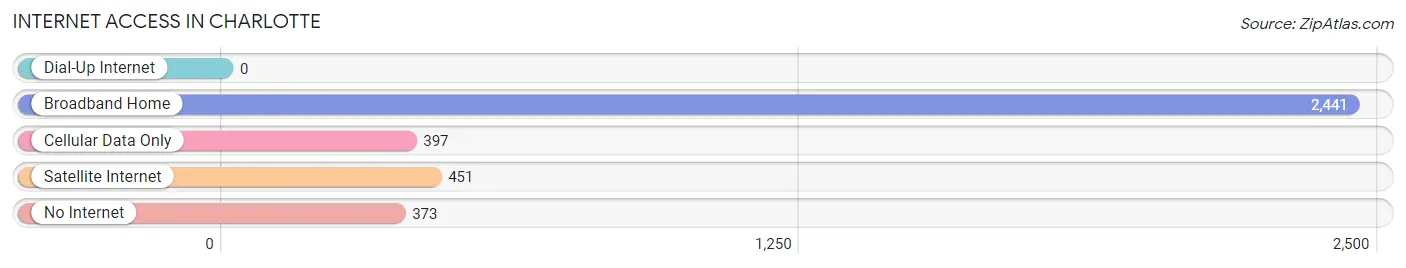
| Internet Type | # Households | % Households |
| Dial-Up Internet | 0 | 0.0% |
| Broadband Home | 2,441 | 70.9% |
| Cellular Data Only | 397 | 11.5% |
| Satellite Internet | 451 | 13.1% |
| No Internet | 373 | 10.8% |
| Total | 3,443 | 100.0% |
Charlotte Summary
Charlotte, Michigan is a small city located in Eaton County, Michigan. It is situated on the Grand River, approximately 25 miles west of Lansing, the state capital. The city has a population of 8,817 as of the 2010 census, making it the largest city in Eaton County.
History
Charlotte was first settled in 1832 by a group of settlers from New York. The city was named after Charlotte, the wife of one of the settlers. The city was incorporated in 1871 and was the county seat of Eaton County until it was moved to Eaton Rapids in 1887.
In the late 19th century, Charlotte was a major center for the lumber industry. The city was home to several sawmills and lumber yards, and the Grand River was used to transport logs to the mills. The city also had a thriving agricultural industry, with many farmers growing wheat, corn, and other crops.
Geography
Charlotte is located in the central part of Michigan, approximately 25 miles west of Lansing. The city is situated on the Grand River, which flows through the city and is a major source of recreation for the area. The city is surrounded by rolling hills and farmland, and is located in a region known as the Irish Hills.
The city has a total area of 4.2 square miles, all of which is land. The city has a humid continental climate, with cold winters and hot, humid summers.
Economy
Charlotte’s economy is largely based on manufacturing and agriculture. The city is home to several manufacturing companies, including Eaton Corporation, which produces automotive parts, and Charlotte Plastics, which produces plastic products. The city also has a thriving agricultural industry, with many farmers growing wheat, corn, and other crops.
The city is also home to several retail stores, restaurants, and other businesses. The city is served by the Charlotte Public Schools, which includes four elementary schools, one middle school, and one high school.
Demographics
As of the 2010 census, Charlotte had a population of 8,817. The racial makeup of the city was 94.2% White, 1.3% African American, 0.4% Native American, 0.7% Asian, 0.1% Pacific Islander, 1.3% from other races, and 2.0% from two or more races. Hispanic or Latino of any race were 3.2% of the population.
The median income for a household in the city was $41,945, and the median income for a family was $50,945. The per capita income for the city was $20,845. About 11.2% of families and 14.2% of the population were below the poverty line, including 19.2% of those under age 18 and 8.2% of those age 65 or over.
Common Questions
What is Per Capita Income in Charlotte?
Per Capita income in Charlotte is $28,042.
What is the Median Family Income in Charlotte?
Median Family Income in Charlotte is $76,688.
What is the Median Household income in Charlotte?
Median Household Income in Charlotte is $65,507.
What is Income or Wage Gap in Charlotte?
Income or Wage Gap in Charlotte is 33.5%.
Women in Charlotte earn 66.5 cents for every dollar earned by a man.
What is Inequality or Gini Index in Charlotte?
Inequality or Gini Index in Charlotte is 0.37.
What is the Total Population of Charlotte?
Total Population of Charlotte is 9,273.
What is the Total Male Population of Charlotte?
Total Male Population of Charlotte is 4,707.
What is the Total Female Population of Charlotte?
Total Female Population of Charlotte is 4,566.
What is the Ratio of Males per 100 Females in Charlotte?
There are 103.09 Males per 100 Females in Charlotte.
What is the Ratio of Females per 100 Males in Charlotte?
There are 97.00 Females per 100 Males in Charlotte.
What is the Median Population Age in Charlotte?
Median Population Age in Charlotte is 35.7 Years.
What is the Average Family Size in Charlotte
Average Family Size in Charlotte is 3.2 People.
What is the Average Household Size in Charlotte
Average Household Size in Charlotte is 2.6 People.
How Large is the Labor Force in Charlotte?
There are 4,430 People in the Labor Forcein in Charlotte.
What is the Percentage of People in the Labor Force in Charlotte?
59.5% of People are in the Labor Force in Charlotte.
What is the Unemployment Rate in Charlotte?
Unemployment Rate in Charlotte is 6.2%.