Cities with the Highest Percentage of Population Employed in Finance & Insurance in Kansas
RELATED REPORTS & OPTIONS
Finance & Insurance
Kansas
Compare Cities
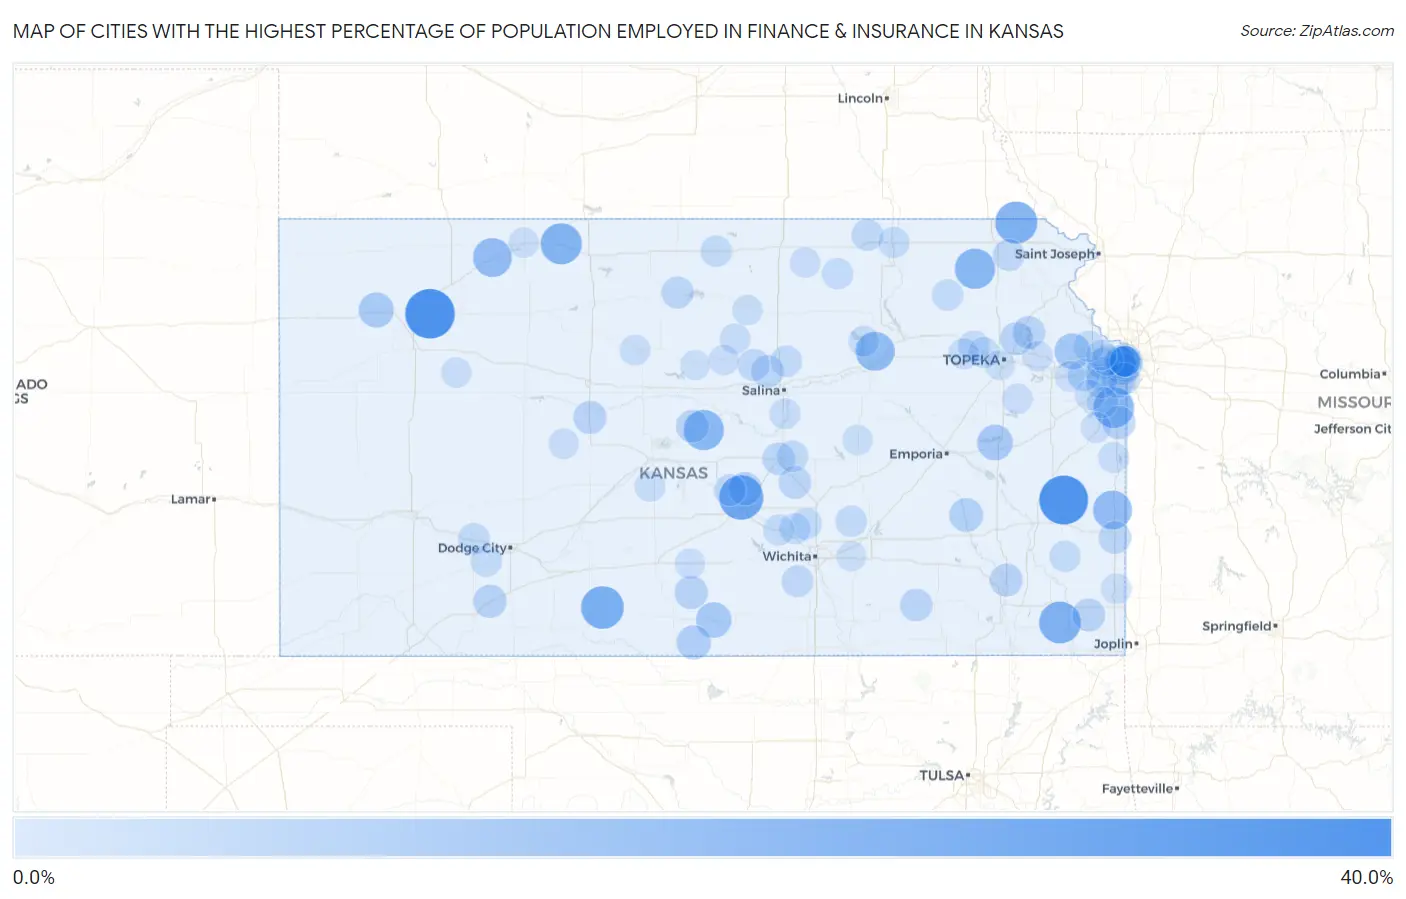
Map of Cities with the Highest Percentage of Population Employed in Finance & Insurance in Kansas
0.0%
40.0%
Cities with the Highest Percentage of Population Employed in Finance & Insurance in Kansas
| City | % Employed | vs State | vs National | |
| 1. | Menlo | 33.3% | 5.1%(+28.2)#1 | 4.8%(+28.6)#123 |
| 2. | Kincaid | 32.3% | 5.1%(+27.2)#2 | 4.8%(+27.5)#132 |
| 3. | Willowbrook | 25.8% | 5.1%(+20.7)#3 | 4.8%(+21.0)#209 |
| 4. | Wilmore | 23.5% | 5.1%(+18.4)#4 | 4.8%(+18.8)#247 |
| 5. | Reserve | 22.6% | 5.1%(+17.5)#5 | 4.8%(+17.8)#275 |
| 6. | Labette | 22.2% | 5.1%(+17.1)#6 | 4.8%(+17.5)#283 |
| 7. | Wabaunsee | 21.7% | 5.1%(+16.6)#7 | 4.8%(+17.0)#299 |
| 8. | Prairie View | 21.3% | 5.1%(+16.2)#8 | 4.8%(+16.5)#318 |
| 9. | Bucyrus | 20.5% | 5.1%(+15.4)#9 | 4.8%(+15.7)#346 |
| 10. | Lorraine | 20.0% | 5.1%(+14.9)#10 | 4.8%(+15.2)#362 |
| 11. | Goff | 20.0% | 5.1%(+14.9)#11 | 4.8%(+15.2)#369 |
| 12. | Sycamore | 19.5% | 5.1%(+14.4)#12 | 4.8%(+14.8)#394 |
| 13. | Fort Riley | 18.2% | 5.1%(+13.1)#13 | 4.8%(+13.4)#453 |
| 14. | Fulton | 18.2% | 5.1%(+13.1)#14 | 4.8%(+13.4)#457 |
| 15. | Clayton | 18.2% | 5.1%(+13.1)#15 | 4.8%(+13.4)#458 |
| 16. | Tonganoxie | 14.0% | 5.1%(+8.85)#16 | 4.8%(+9.18)#846 |
| 17. | Olivet | 13.6% | 5.1%(+8.54)#17 | 4.8%(+8.87)#882 |
| 18. | Attica | 13.4% | 5.1%(+8.32)#18 | 4.8%(+8.65)#921 |
| 19. | Levant | 12.9% | 5.1%(+7.80)#19 | 4.8%(+8.14)#1,016 |
| 20. | Mission Hills | 12.9% | 5.1%(+7.77)#20 | 4.8%(+8.10)#1,021 |
| 21. | Mission Woods | 12.3% | 5.1%(+7.25)#21 | 4.8%(+7.58)#1,142 |
| 22. | Hazelton | 11.8% | 5.1%(+6.67)#22 | 4.8%(+7.00)#1,299 |
| 23. | Virgil | 11.1% | 5.1%(+6.01)#23 | 4.8%(+6.34)#1,496 |
| 24. | Lenexa | 10.7% | 5.1%(+5.63)#24 | 4.8%(+5.97)#1,624 |
| 25. | The Highlands | 10.7% | 5.1%(+5.60)#25 | 4.8%(+5.93)#1,639 |
| 26. | Fowler | 10.4% | 5.1%(+5.26)#26 | 4.8%(+5.59)#1,751 |
| 27. | Nashville | 10.3% | 5.1%(+5.25)#27 | 4.8%(+5.58)#1,762 |
| 28. | Louisburg | 10.3% | 5.1%(+5.16)#28 | 4.8%(+5.49)#1,794 |
| 29. | Overland Park | 10.2% | 5.1%(+5.13)#29 | 4.8%(+5.46)#1,804 |
| 30. | Liebenthal | 10.0% | 5.1%(+4.90)#30 | 4.8%(+5.23)#1,919 |
| 31. | Altoona | 9.9% | 5.1%(+4.82)#31 | 4.8%(+5.15)#1,952 |
| 32. | Fairway | 9.9% | 5.1%(+4.77)#32 | 4.8%(+5.10)#1,981 |
| 33. | Meriden | 9.8% | 5.1%(+4.71)#33 | 4.8%(+5.04)#2,005 |
| 34. | West Mineral | 9.8% | 5.1%(+4.71)#34 | 4.8%(+5.04)#2,006 |
| 35. | Holyrood | 9.7% | 5.1%(+4.62)#35 | 4.8%(+4.95)#2,048 |
| 36. | Ozawkie | 9.6% | 5.1%(+4.52)#36 | 4.8%(+4.85)#2,100 |
| 37. | Prairie Village | 9.5% | 5.1%(+4.43)#37 | 4.8%(+4.76)#2,158 |
| 38. | Culver | 9.5% | 5.1%(+4.43)#38 | 4.8%(+4.76)#2,174 |
| 39. | Grenola | 9.5% | 5.1%(+4.36)#39 | 4.8%(+4.69)#2,213 |
| 40. | Fort Scott | 9.5% | 5.1%(+4.36)#40 | 4.8%(+4.69)#2,215 |
| 41. | Mcpherson | 9.4% | 5.1%(+4.35)#41 | 4.8%(+4.68)#2,223 |
| 42. | Moundridge | 9.4% | 5.1%(+4.31)#42 | 4.8%(+4.64)#2,250 |
| 43. | Roeland Park | 9.4% | 5.1%(+4.27)#43 | 4.8%(+4.60)#2,268 |
| 44. | Mission | 9.1% | 5.1%(+3.95)#44 | 4.8%(+4.28)#2,453 |
| 45. | De Soto | 9.0% | 5.1%(+3.91)#45 | 4.8%(+4.24)#2,490 |
| 46. | Downs | 8.9% | 5.1%(+3.82)#46 | 4.8%(+4.15)#2,536 |
| 47. | Leawood | 8.8% | 5.1%(+3.72)#47 | 4.8%(+4.05)#2,612 |
| 48. | Tescott | 8.7% | 5.1%(+3.60)#48 | 4.8%(+3.93)#2,685 |
| 49. | Hanover | 8.5% | 5.1%(+3.37)#49 | 4.8%(+3.70)#2,863 |
| 50. | Nickerson | 8.4% | 5.1%(+3.30)#50 | 4.8%(+3.64)#2,914 |
| 51. | Powhattan | 8.3% | 5.1%(+3.23)#51 | 4.8%(+3.57)#2,966 |
| 52. | Clearwater | 8.3% | 5.1%(+3.23)#52 | 4.8%(+3.56)#2,972 |
| 53. | Cimarron | 8.2% | 5.1%(+3.12)#53 | 4.8%(+3.45)#3,049 |
| 54. | Bennington | 8.1% | 5.1%(+3.03)#54 | 4.8%(+3.36)#3,135 |
| 55. | Shawnee | 8.1% | 5.1%(+2.99)#55 | 4.8%(+3.32)#3,161 |
| 56. | Westwood | 8.1% | 5.1%(+2.97)#56 | 4.8%(+3.30)#3,174 |
| 57. | Mankato | 8.1% | 5.1%(+2.97)#57 | 4.8%(+3.30)#3,179 |
| 58. | Galva | 8.0% | 5.1%(+2.94)#58 | 4.8%(+3.27)#3,201 |
| 59. | Olathe | 8.0% | 5.1%(+2.89)#59 | 4.8%(+3.22)#3,250 |
| 60. | Sedgwick | 7.9% | 5.1%(+2.83)#60 | 4.8%(+3.16)#3,314 |
| 61. | Potwin | 7.9% | 5.1%(+2.82)#61 | 4.8%(+3.15)#3,324 |
| 62. | Lake Quivira | 7.9% | 5.1%(+2.80)#62 | 4.8%(+3.13)#3,333 |
| 63. | Ensign | 7.8% | 5.1%(+2.68)#63 | 4.8%(+3.01)#3,451 |
| 64. | Rossville | 7.7% | 5.1%(+2.59)#64 | 4.8%(+2.92)#3,529 |
| 65. | Onaga | 7.7% | 5.1%(+2.59)#65 | 4.8%(+2.92)#3,531 |
| 66. | Stark | 7.7% | 5.1%(+2.59)#66 | 4.8%(+2.92)#3,551 |
| 67. | Bentley | 7.7% | 5.1%(+2.55)#67 | 4.8%(+2.89)#3,582 |
| 68. | Silver Lake | 7.6% | 5.1%(+2.55)#68 | 4.8%(+2.88)#3,595 |
| 69. | Basehor | 7.6% | 5.1%(+2.51)#69 | 4.8%(+2.84)#3,628 |
| 70. | Marysville | 7.6% | 5.1%(+2.50)#70 | 4.8%(+2.83)#3,640 |
| 71. | Palmer | 7.6% | 5.1%(+2.48)#71 | 4.8%(+2.81)#3,667 |
| 72. | Mount Hope | 7.5% | 5.1%(+2.44)#72 | 4.8%(+2.77)#3,699 |
| 73. | Spring Hill | 7.5% | 5.1%(+2.35)#73 | 4.8%(+2.68)#3,783 |
| 74. | Maple Hill | 7.3% | 5.1%(+2.18)#74 | 4.8%(+2.51)#3,972 |
| 75. | Linn Valley | 7.2% | 5.1%(+2.10)#75 | 4.8%(+2.44)#4,059 |
| 76. | Assaria | 7.2% | 5.1%(+2.10)#76 | 4.8%(+2.44)#4,060 |
| 77. | Milford | 7.0% | 5.1%(+1.93)#77 | 4.8%(+2.26)#4,283 |
| 78. | Seward | 7.0% | 5.1%(+1.92)#78 | 4.8%(+2.25)#4,305 |
| 79. | Westwood Hills | 6.9% | 5.1%(+1.84)#79 | 4.8%(+2.17)#4,405 |
| 80. | Barnard | 6.9% | 5.1%(+1.80)#80 | 4.8%(+2.13)#4,467 |
| 81. | Paradise | 6.9% | 5.1%(+1.80)#81 | 4.8%(+2.13)#4,468 |
| 82. | Paola | 6.9% | 5.1%(+1.78)#82 | 4.8%(+2.11)#4,485 |
| 83. | Frontenac | 6.8% | 5.1%(+1.75)#83 | 4.8%(+2.08)#4,537 |
| 84. | Edwardsville | 6.8% | 5.1%(+1.70)#84 | 4.8%(+2.03)#4,603 |
| 85. | Lincolnville | 6.7% | 5.1%(+1.64)#85 | 4.8%(+1.97)#4,681 |
| 86. | Perry | 6.7% | 5.1%(+1.62)#86 | 4.8%(+1.95)#4,704 |
| 87. | Lincoln Center | 6.7% | 5.1%(+1.61)#87 | 4.8%(+1.94)#4,724 |
| 88. | Overbrook | 6.7% | 5.1%(+1.59)#88 | 4.8%(+1.92)#4,746 |
| 89. | Eudora | 6.7% | 5.1%(+1.58)#89 | 4.8%(+1.91)#4,755 |
| 90. | Agenda | 6.7% | 5.1%(+1.57)#90 | 4.8%(+1.90)#4,783 |
| 91. | Alexander | 6.7% | 5.1%(+1.57)#91 | 4.8%(+1.90)#4,786 |
| 92. | Cunningham | 6.6% | 5.1%(+1.46)#92 | 4.8%(+1.79)#4,933 |
| 93. | Simpson | 6.6% | 5.1%(+1.46)#93 | 4.8%(+1.79)#4,938 |
| 94. | Niles | 6.5% | 5.1%(+1.35)#94 | 4.8%(+1.68)#5,096 |
| 95. | Gove City | 6.5% | 5.1%(+1.35)#95 | 4.8%(+1.68)#5,097 |
| 96. | Gardner | 6.4% | 5.1%(+1.35)#96 | 4.8%(+1.68)#5,106 |
| 97. | Norton | 6.4% | 5.1%(+1.35)#97 | 4.8%(+1.68)#5,110 |
| 98. | Augusta | 6.4% | 5.1%(+1.27)#98 | 4.8%(+1.60)#5,221 |
| 99. | Topeka | 6.4% | 5.1%(+1.26)#99 | 4.8%(+1.59)#5,230 |
| 100. | Sylvan Grove | 6.2% | 5.1%(+1.11)#100 | 4.8%(+1.44)#5,440 |
Common Questions
What are the Top 10 Cities with the Highest Percentage of Population Employed in Finance & Insurance in Kansas?
Top 10 Cities with the Highest Percentage of Population Employed in Finance & Insurance in Kansas are:
#1
33.3%
#2
32.3%
#3
25.8%
#4
23.5%
#5
22.6%
#6
22.2%
#7
21.3%
#8
20.5%
#9
20.0%
#10
20.0%
What city has the Highest Percentage of Population Employed in Finance & Insurance in Kansas?
Menlo has the Highest Percentage of Population Employed in Finance & Insurance in Kansas with 33.3%.
What is the Percentage of Population Employed in Finance & Insurance in the State of Kansas?
Percentage of Population Employed in Finance & Insurance in Kansas is 5.1%.
What is the Percentage of Population Employed in Finance & Insurance in the United States?
Percentage of Population Employed in Finance & Insurance in the United States is 4.8%.