Ensign, KS Map & Demographics
Ensign Map
Ensign Overview
$33,784
PER CAPITA INCOME
$85,000
AVG FAMILY INCOME
$70,417
AVG HOUSEHOLD INCOME
18.8%
WAGE / INCOME GAP [ % ]
81.2¢/ $1
WAGE / INCOME GAP [ $ ]
0.27
INEQUALITY / GINI INDEX
140
TOTAL POPULATION
87
MALE POPULATION
53
FEMALE POPULATION
164.15
MALES / 100 FEMALES
60.92
FEMALES / 100 MALES
45.6
MEDIAN AGE
2.5
AVG FAMILY SIZE
2.0
AVG HOUSEHOLD SIZE
99
LABOR FORCE [ PEOPLE ]
76.2%
PERCENT IN LABOR FORCE
9.1%
UNEMPLOYMENT RATE
Ensign Zip Codes
Ensign Area Codes
Income in Ensign
Income Overview in Ensign
Per Capita Income in Ensign is $33,784, while median incomes of families and households are $85,000 and $70,417 respectively.
| Characteristic | Number | Measure |
| Per Capita Income | 140 | $33,784 |
| Median Family Income | 38 | $85,000 |
| Mean Family Income | 38 | $81,813 |
| Median Household Income | 69 | $70,417 |
| Mean Household Income | 69 | $67,449 |
| Income Deficit | 38 | $0 |
| Wage / Income Gap (%) | 140 | 18.80% |
| Wage / Income Gap ($) | 140 | 81.20¢ per $1 |
| Gini / Inequality Index | 140 | 0.27 |
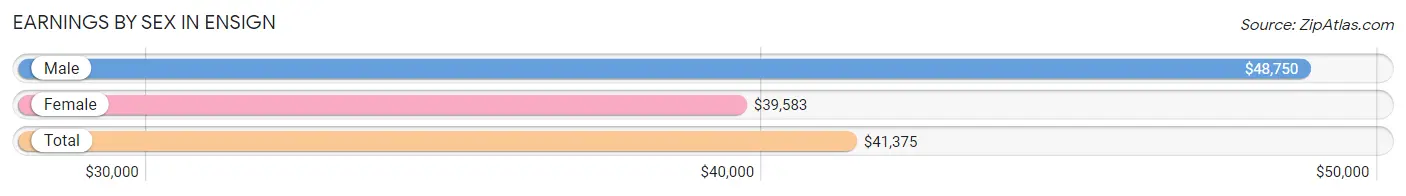
Earnings by Sex in Ensign
Average Earnings in Ensign are $41,375, $48,750 for men and $39,583 for women, a difference of 18.8%.
| Sex | Number | Average Earnings |
| Male | 58 (62.4%) | $48,750 |
| Female | 35 (37.6%) | $39,583 |
| Total | 93 (100.0%) | $41,375 |
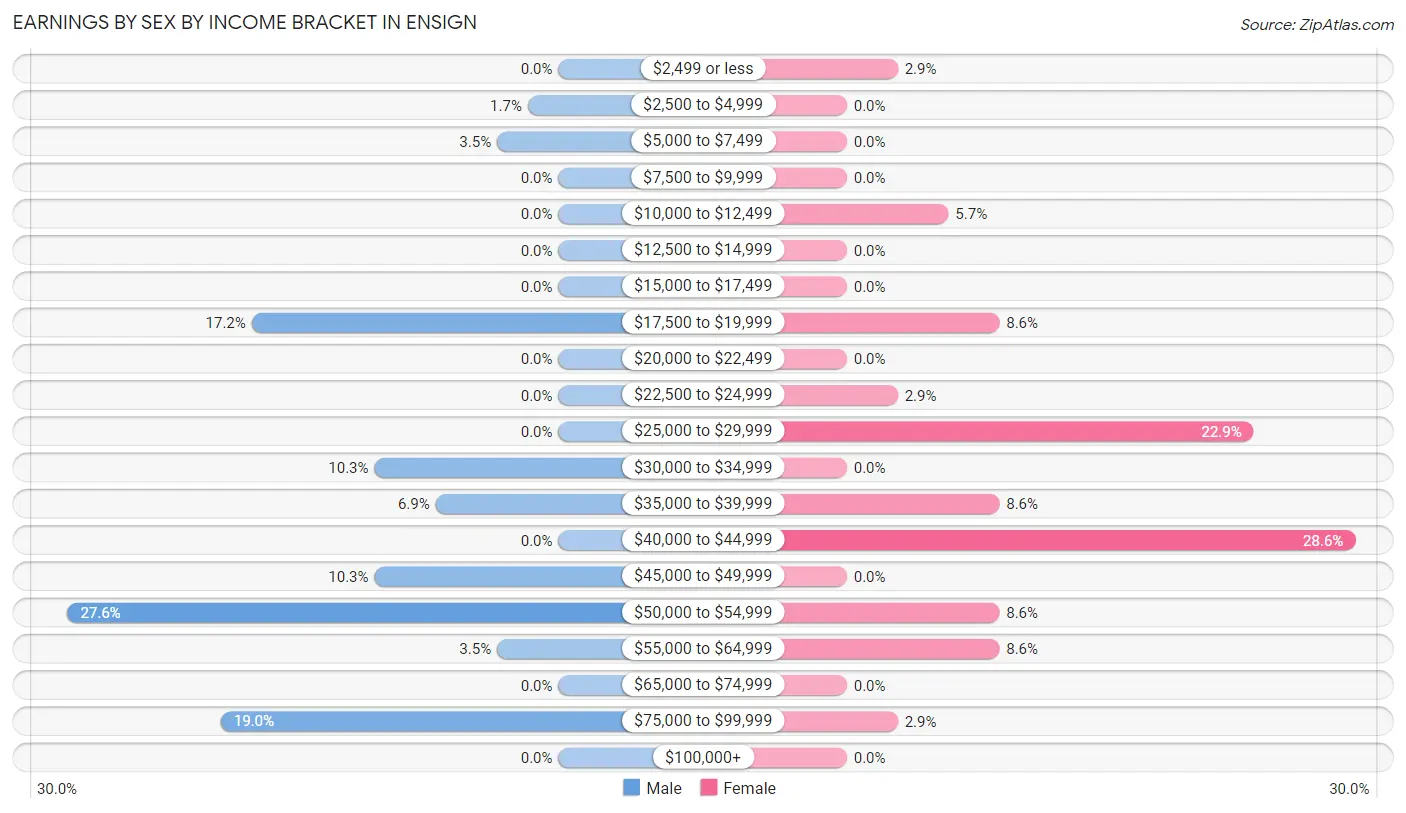
Earnings by Sex by Income Bracket in Ensign
The most common earnings brackets in Ensign are $50,000 to $54,999 for men (16 | 27.6%) and $40,000 to $44,999 for women (10 | 28.6%).
| Income | Male | Female |
| $2,499 or less | 0 (0.0%) | 1 (2.9%) |
| $2,500 to $4,999 | 1 (1.7%) | 0 (0.0%) |
| $5,000 to $7,499 | 2 (3.5%) | 0 (0.0%) |
| $7,500 to $9,999 | 0 (0.0%) | 0 (0.0%) |
| $10,000 to $12,499 | 0 (0.0%) | 2 (5.7%) |
| $12,500 to $14,999 | 0 (0.0%) | 0 (0.0%) |
| $15,000 to $17,499 | 0 (0.0%) | 0 (0.0%) |
| $17,500 to $19,999 | 10 (17.2%) | 3 (8.6%) |
| $20,000 to $22,499 | 0 (0.0%) | 0 (0.0%) |
| $22,500 to $24,999 | 0 (0.0%) | 1 (2.9%) |
| $25,000 to $29,999 | 0 (0.0%) | 8 (22.9%) |
| $30,000 to $34,999 | 6 (10.3%) | 0 (0.0%) |
| $35,000 to $39,999 | 4 (6.9%) | 3 (8.6%) |
| $40,000 to $44,999 | 0 (0.0%) | 10 (28.6%) |
| $45,000 to $49,999 | 6 (10.3%) | 0 (0.0%) |
| $50,000 to $54,999 | 16 (27.6%) | 3 (8.6%) |
| $55,000 to $64,999 | 2 (3.5%) | 3 (8.6%) |
| $65,000 to $74,999 | 0 (0.0%) | 0 (0.0%) |
| $75,000 to $99,999 | 11 (19.0%) | 1 (2.9%) |
| $100,000+ | 0 (0.0%) | 0 (0.0%) |
| Total | 58 (100.0%) | 35 (100.0%) |
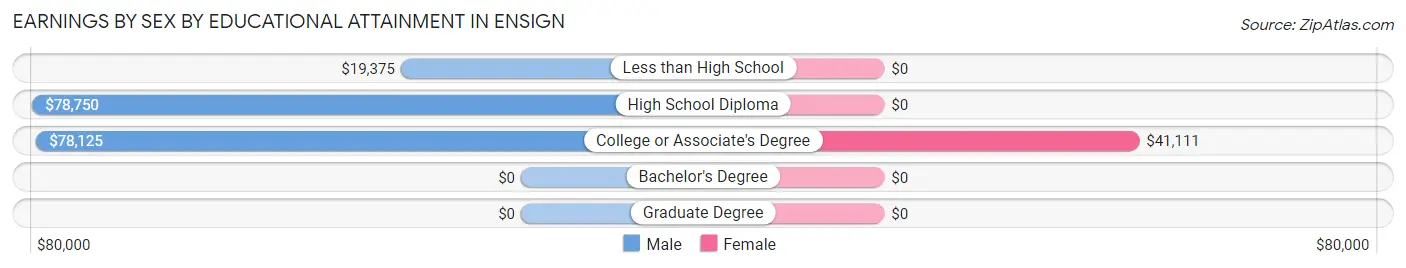
Earnings by Sex by Educational Attainment in Ensign
Average earnings in Ensign are $36,250 for men and $40,750 for women, a difference of 11.0%. Men with an educational attainment of high school diploma enjoy the highest average annual earnings of $78,750, while those with less than high school education earn the least with $19,375. Women with an educational attainment of college or associate's degree earn the most with the average annual earnings of $41,111, while those with college or associate's degree education have the smallest earnings of $41,111.
| Educational Attainment | Male Income | Female Income |
| Less than High School | $19,375 | $0 |
| High School Diploma | $78,750 | $0 |
| College or Associate's Degree | $78,125 | $41,111 |
| Bachelor's Degree | - | - |
| Graduate Degree | - | - |
| Total | $36,250 | $40,750 |
Family Income in Ensign
Family Income Brackets in Ensign
According to the Ensign family income data, there are 14 families falling into the $100,000 to $149,999 income range, which is the most common income bracket and makes up 36.8% of all families.
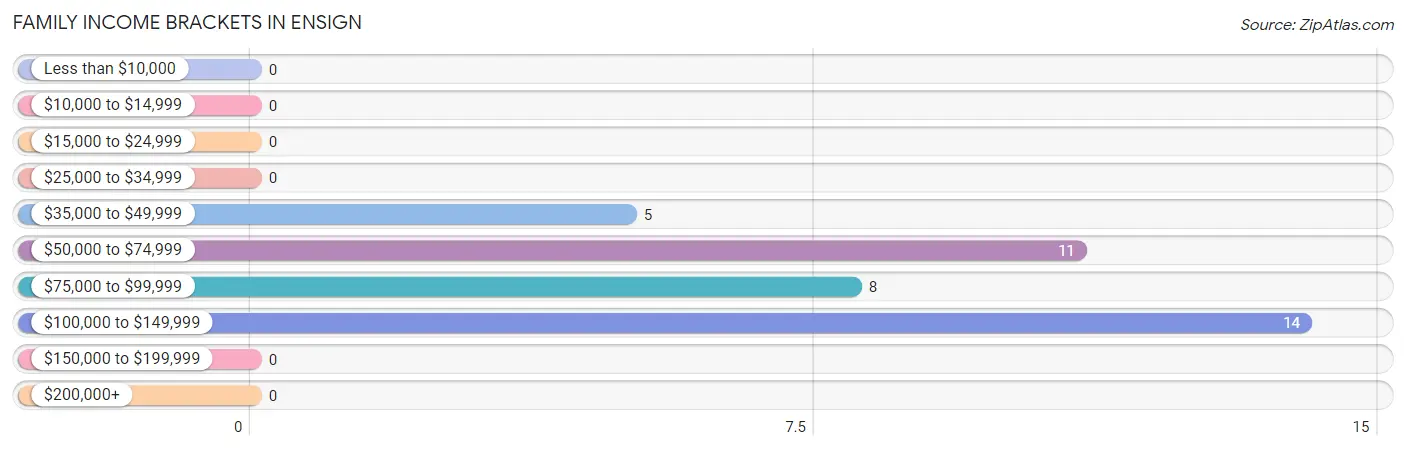
| Income Bracket | # Families | % Families |
| Less than $10,000 | 0 | 0.0% |
| $10,000 to $14,999 | 0 | 0.0% |
| $15,000 to $24,999 | 0 | 0.0% |
| $25,000 to $34,999 | 0 | 0.0% |
| $35,000 to $49,999 | 5 | 13.2% |
| $50,000 to $74,999 | 11 | 28.9% |
| $75,000 to $99,999 | 8 | 21.1% |
| $100,000 to $149,999 | 14 | 36.8% |
| $150,000 to $199,999 | 0 | 0.0% |
| $200,000+ | 0 | 0.0% |
Family Income by Famaliy Size in Ensign
2-person families (33 | 86.8%) account for the highest median family income in Ensign with $76,875 per family, while 2-person families (33 | 86.8%) have the highest median income of $38,438 per family member.
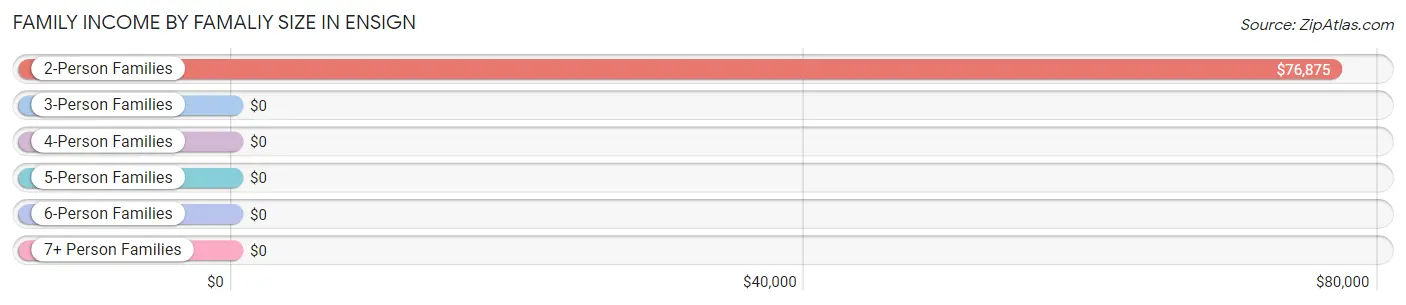
| Income Bracket | # Families | Median Income |
| 2-Person Families | 33 (86.8%) | $76,875 |
| 3-Person Families | 2 (5.3%) | $0 |
| 4-Person Families | 1 (2.6%) | $0 |
| 5-Person Families | 2 (5.3%) | $0 |
| 6-Person Families | 0 (0.0%) | $0 |
| 7+ Person Families | 0 (0.0%) | $0 |
| Total | 38 (100.0%) | $85,000 |
Family Income by Number of Earners in Ensign
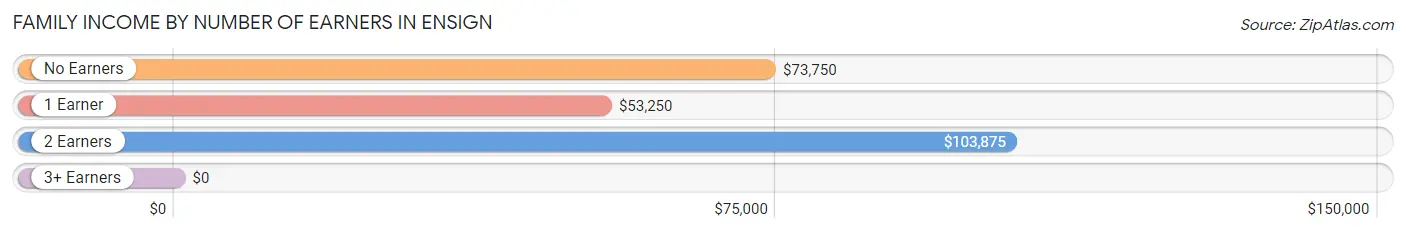
| Number of Earners | # Families | Median Income |
| No Earners | 8 (21.0%) | $73,750 |
| 1 Earner | 11 (28.9%) | $53,250 |
| 2 Earners | 17 (44.7%) | $103,875 |
| 3+ Earners | 2 (5.3%) | $0 |
| Total | 38 (100.0%) | $85,000 |
Household Income in Ensign
Household Income Brackets in Ensign
With 22 households falling in the category, the $50,000 to $74,999 income range is the most frequent in Ensign, accounting for 31.9% of all households.
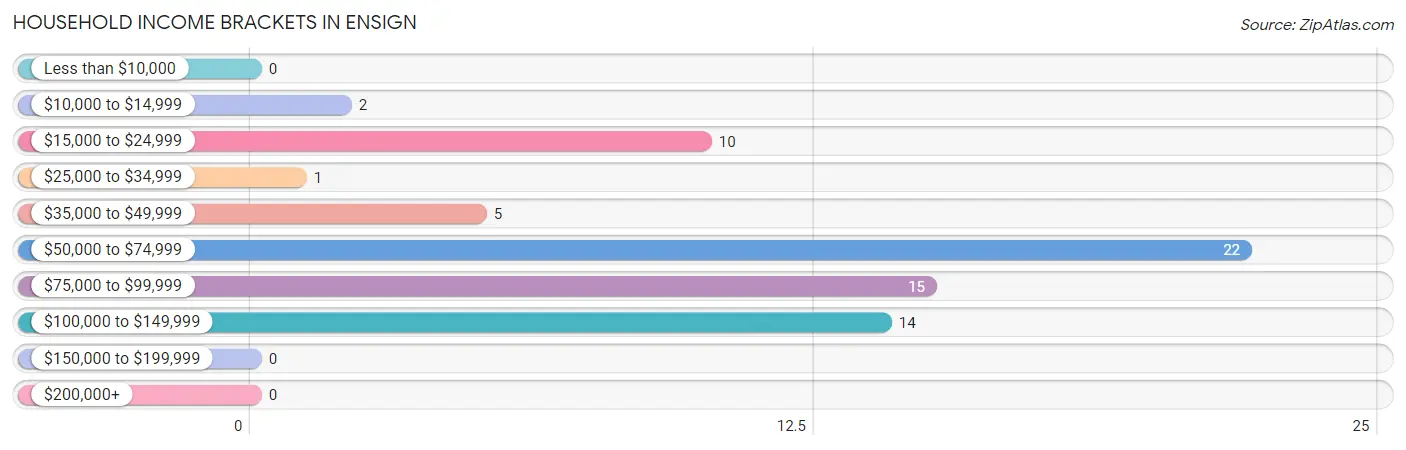
| Income Bracket | # Households | % Households |
| Less than $10,000 | 0 | 0.0% |
| $10,000 to $14,999 | 2 | 2.9% |
| $15,000 to $24,999 | 10 | 14.5% |
| $25,000 to $34,999 | 1 | 1.4% |
| $35,000 to $49,999 | 5 | 7.2% |
| $50,000 to $74,999 | 22 | 31.9% |
| $75,000 to $99,999 | 15 | 21.7% |
| $100,000 to $149,999 | 14 | 20.3% |
| $150,000 to $199,999 | 0 | 0.0% |
| $200,000+ | 0 | 0.0% |
Household Income by Householder Age in Ensign
The median household income in Ensign is $70,417, with the highest median household income of $92,500 found in the 15 to 24 years age bracket for the primary householder. A total of 20 households (29.0%) fall into this category. Meanwhile, the 45 to 64 years age bracket for the primary householder has the lowest median household income of $53,500, with 30 households (43.5%) in this group.
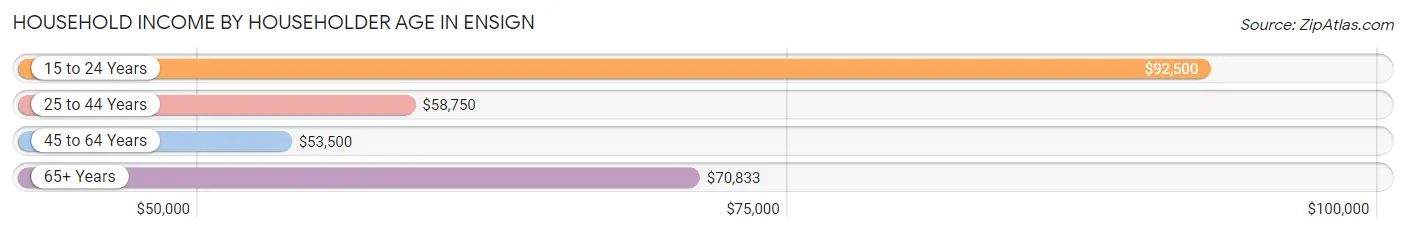
| Income Bracket | # Households | Median Income |
| 15 to 24 Years | 20 (29.0%) | $92,500 |
| 25 to 44 Years | 5 (7.2%) | $58,750 |
| 45 to 64 Years | 30 (43.5%) | $53,500 |
| 65+ Years | 14 (20.3%) | $70,833 |
| Total | 69 (100.0%) | $70,417 |
Poverty in Ensign
Income Below Poverty by Sex and Age in Ensign
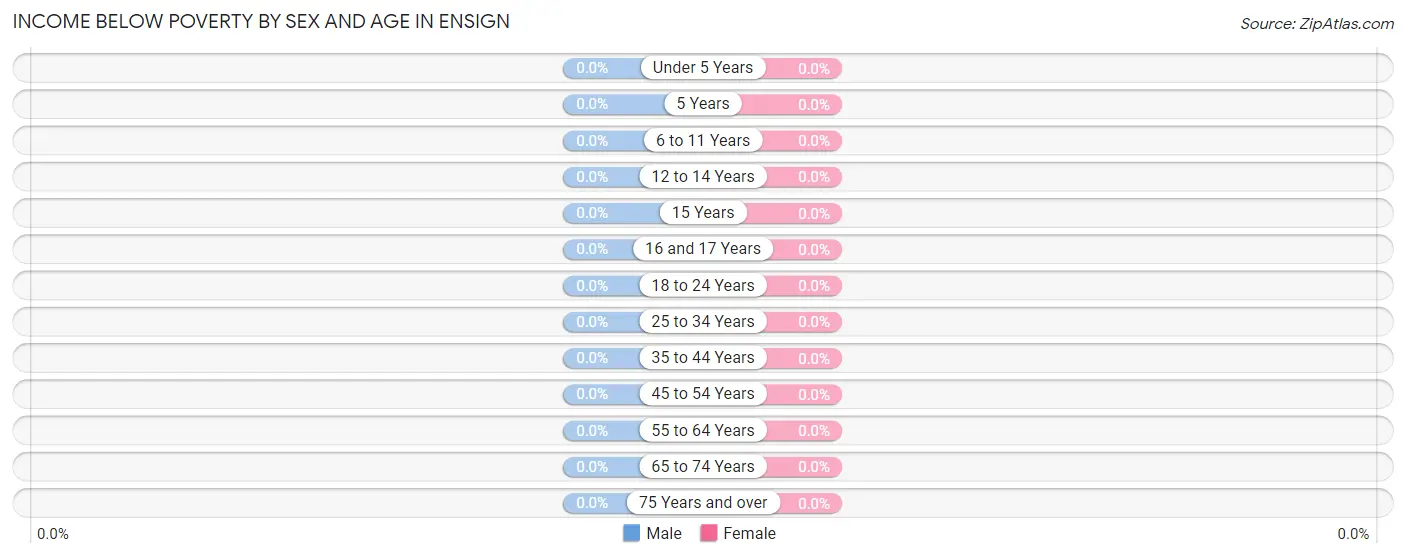
| Age Bracket | Male | Female |
| Under 5 Years | 0 (0.0%) | 0 (0.0%) |
| 5 Years | 0 (0.0%) | 0 (0.0%) |
| 6 to 11 Years | 0 (0.0%) | 0 (0.0%) |
| 12 to 14 Years | 0 (0.0%) | 0 (0.0%) |
| 15 Years | 0 (0.0%) | 0 (0.0%) |
| 16 and 17 Years | 0 (0.0%) | 0 (0.0%) |
| 18 to 24 Years | 0 (0.0%) | 0 (0.0%) |
| 25 to 34 Years | 0 (0.0%) | 0 (0.0%) |
| 35 to 44 Years | 0 (0.0%) | 0 (0.0%) |
| 45 to 54 Years | 0 (0.0%) | 0 (0.0%) |
| 55 to 64 Years | 0 (0.0%) | 0 (0.0%) |
| 65 to 74 Years | 0 (0.0%) | 0 (0.0%) |
| 75 Years and over | 0 (0.0%) | 0 (0.0%) |
| Total | 0 (0.0%) | 0 (0.0%) |
Income Above Poverty by Sex and Age in Ensign
According to the poverty statistics in Ensign, males aged 6 to 11 years and females aged under 5 years are the age groups that are most secure financially, with 100.0% of males and 100.0% of females in these age groups living above the poverty line.
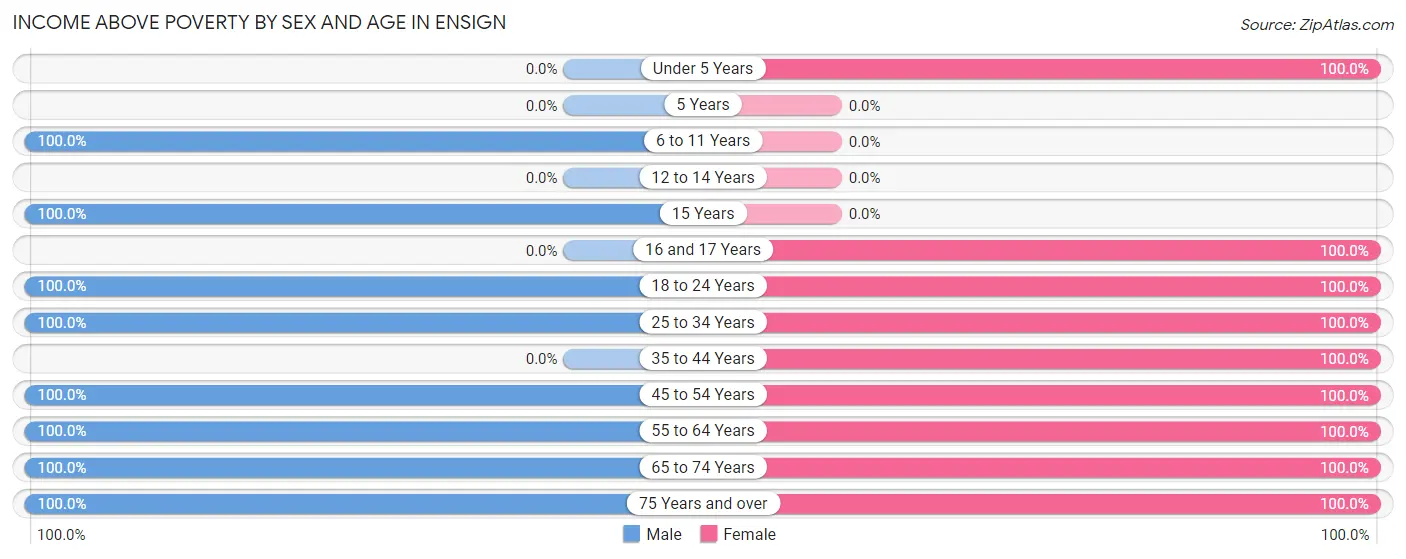
| Age Bracket | Male | Female |
| Under 5 Years | 0 (0.0%) | 1 (100.0%) |
| 5 Years | 0 (0.0%) | 0 (0.0%) |
| 6 to 11 Years | 8 (100.0%) | 0 (0.0%) |
| 12 to 14 Years | 0 (0.0%) | 0 (0.0%) |
| 15 Years | 1 (100.0%) | 0 (0.0%) |
| 16 and 17 Years | 0 (0.0%) | 1 (100.0%) |
| 18 to 24 Years | 31 (100.0%) | 16 (100.0%) |
| 25 to 34 Years | 3 (100.0%) | 5 (100.0%) |
| 35 to 44 Years | 0 (0.0%) | 1 (100.0%) |
| 45 to 54 Years | 17 (100.0%) | 7 (100.0%) |
| 55 to 64 Years | 11 (100.0%) | 9 (100.0%) |
| 65 to 74 Years | 8 (100.0%) | 11 (100.0%) |
| 75 Years and over | 8 (100.0%) | 2 (100.0%) |
| Total | 87 (100.0%) | 53 (100.0%) |
Income Below Poverty Among Married-Couple Families in Ensign
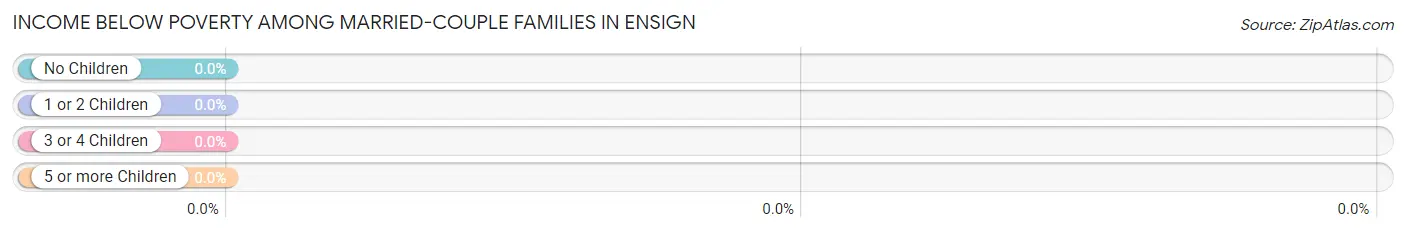
| Children | Above Poverty | Below Poverty |
| No Children | 30 (100.0%) | 0 (0.0%) |
| 1 or 2 Children | 5 (100.0%) | 0 (0.0%) |
| 3 or 4 Children | 0 (0.0%) | 0 (0.0%) |
| 5 or more Children | 0 (0.0%) | 0 (0.0%) |
| Total | 35 (100.0%) | 0 (0.0%) |
Income Below Poverty Among Single-Parent Households in Ensign
| Children | Single Father | Single Mother |
| No Children | 0 (0.0%) | 0 (0.0%) |
| 1 or 2 Children | 0 (0.0%) | 0 (0.0%) |
| 3 or 4 Children | 0 (0.0%) | 0 (0.0%) |
| 5 or more Children | 0 (0.0%) | 0 (0.0%) |
| Total | 0 (0.0%) | 0 (0.0%) |
Income Below Poverty Among Married-Couple vs Single-Parent Households in Ensign
| Children | Married-Couple Families | Single-Parent Households |
| No Children | 0 (0.0%) | 0 (0.0%) |
| 1 or 2 Children | 0 (0.0%) | 0 (0.0%) |
| 3 or 4 Children | 0 (0.0%) | 0 (0.0%) |
| 5 or more Children | 0 (0.0%) | 0 (0.0%) |
| Total | 0 (0.0%) | 0 (0.0%) |
Race in Ensign
The most populous races in Ensign are White / Caucasian (120 | 85.7%), Hispanic or Latino (48 | 34.3%), and Two or more Races (14 | 10.0%).
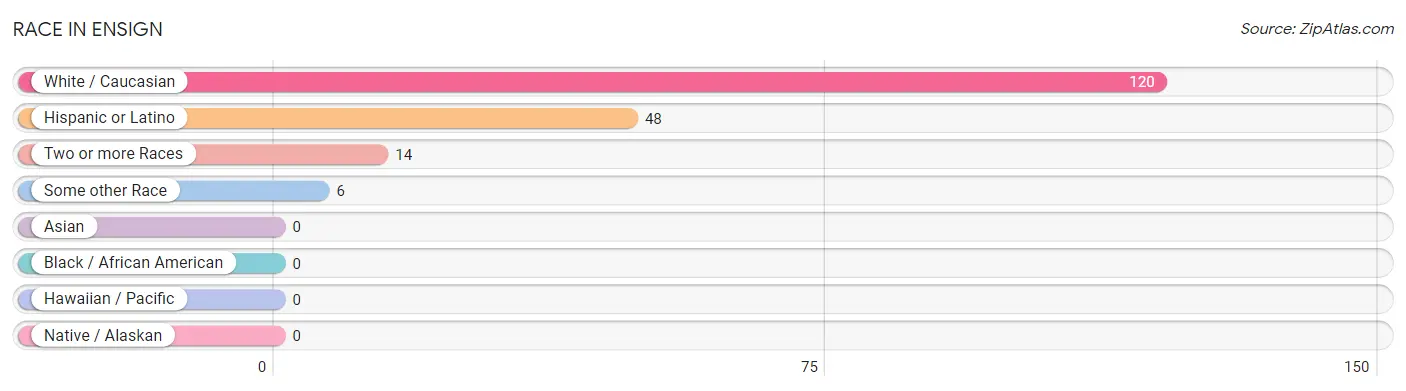
| Race | # Population | % Population |
| Asian | 0 | 0.0% |
| Black / African American | 0 | 0.0% |
| Hawaiian / Pacific | 0 | 0.0% |
| Hispanic or Latino | 48 | 34.3% |
| Native / Alaskan | 0 | 0.0% |
| White / Caucasian | 120 | 85.7% |
| Two or more Races | 14 | 10.0% |
| Some other Race | 6 | 4.3% |
| Total | 140 | 100.0% |
Ancestry in Ensign
The most populous ancestries reported in Ensign are Mexican (48 | 34.3%), German (29 | 20.7%), Irish (11 | 7.9%), French (8 | 5.7%), and American (4 | 2.9%), together accounting for 71.4% of all Ensign residents.
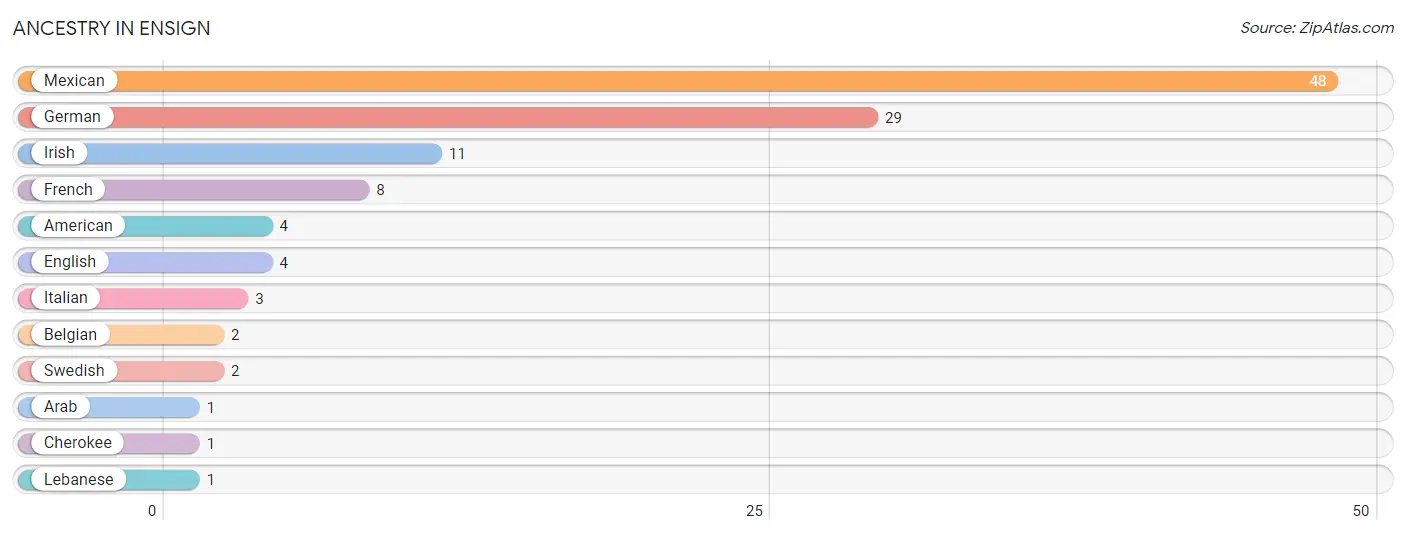
| Ancestry | # Population | % Population |
| American | 4 | 2.9% |
| Arab | 1 | 0.7% |
| Belgian | 2 | 1.4% |
| Cherokee | 1 | 0.7% |
| English | 4 | 2.9% |
| French | 8 | 5.7% |
| German | 29 | 20.7% |
| Irish | 11 | 7.9% |
| Italian | 3 | 2.1% |
| Lebanese | 1 | 0.7% |
| Mexican | 48 | 34.3% |
| Swedish | 2 | 1.4% | View All 12 Rows |
Immigrants in Ensign
The most numerous immigrant groups reported in Ensign came from Central America (34 | 24.3%), Latin America (34 | 24.3%), and Mexico (34 | 24.3%), together accounting for 72.9% of all Ensign residents.
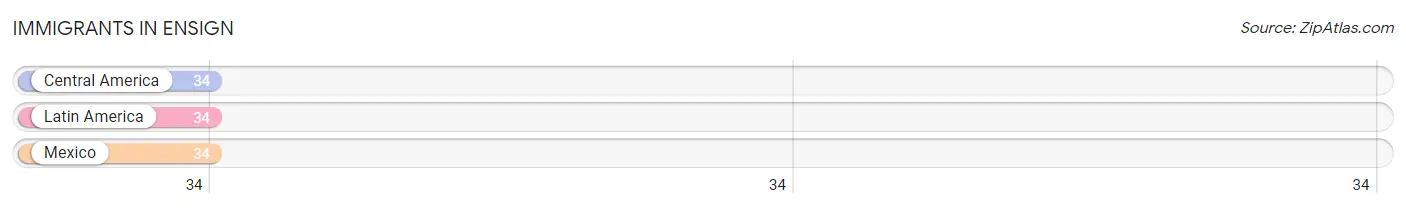
| Immigration Origin | # Population | % Population |
| Central America | 34 | 24.3% |
| Latin America | 34 | 24.3% |
| Mexico | 34 | 24.3% | View All 3 Rows |
Sex and Age in Ensign
Sex and Age in Ensign
The most populous age groups in Ensign are 20 to 24 Years (24 | 27.6%) for men and 20 to 24 Years (10 | 18.9%) for women.
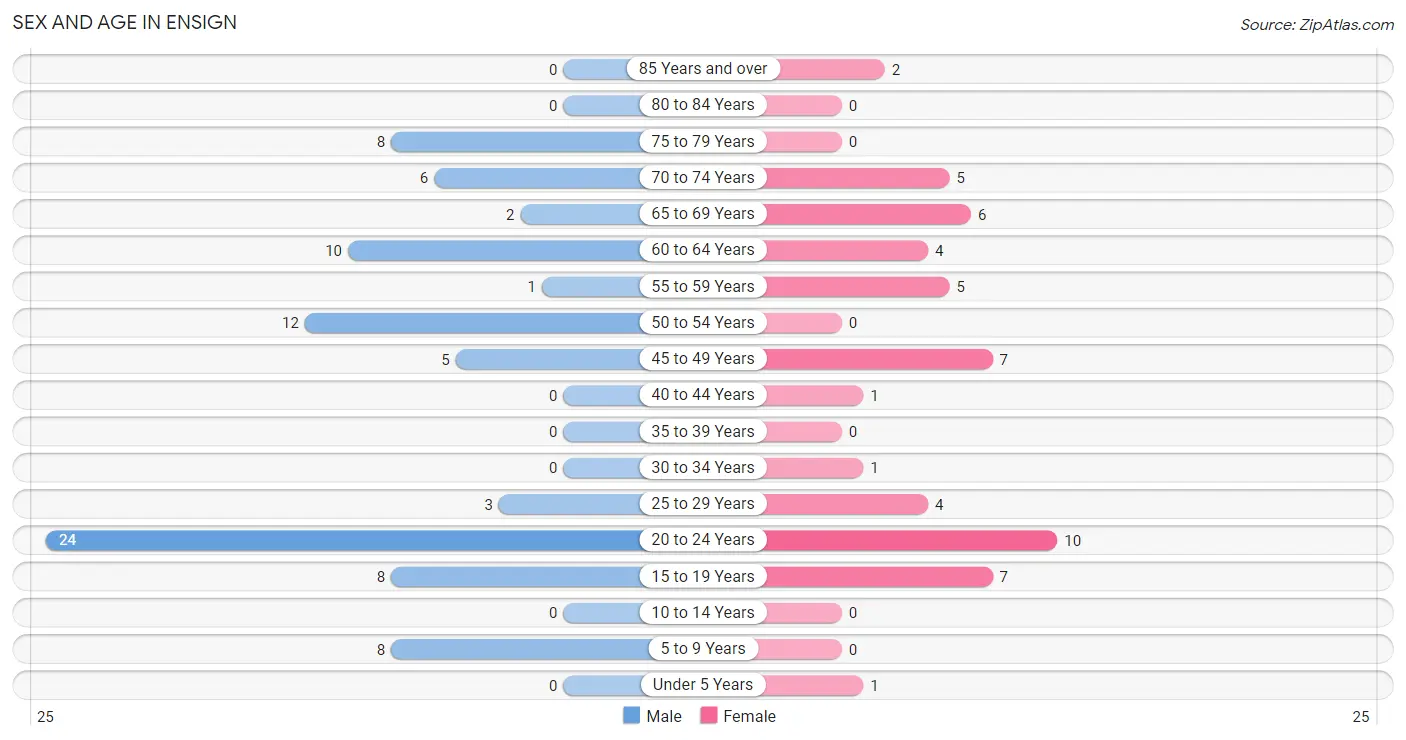
| Age Bracket | Male | Female |
| Under 5 Years | 0 (0.0%) | 1 (1.9%) |
| 5 to 9 Years | 8 (9.2%) | 0 (0.0%) |
| 10 to 14 Years | 0 (0.0%) | 0 (0.0%) |
| 15 to 19 Years | 8 (9.2%) | 7 (13.2%) |
| 20 to 24 Years | 24 (27.6%) | 10 (18.9%) |
| 25 to 29 Years | 3 (3.5%) | 4 (7.5%) |
| 30 to 34 Years | 0 (0.0%) | 1 (1.9%) |
| 35 to 39 Years | 0 (0.0%) | 0 (0.0%) |
| 40 to 44 Years | 0 (0.0%) | 1 (1.9%) |
| 45 to 49 Years | 5 (5.8%) | 7 (13.2%) |
| 50 to 54 Years | 12 (13.8%) | 0 (0.0%) |
| 55 to 59 Years | 1 (1.1%) | 5 (9.4%) |
| 60 to 64 Years | 10 (11.5%) | 4 (7.5%) |
| 65 to 69 Years | 2 (2.3%) | 6 (11.3%) |
| 70 to 74 Years | 6 (6.9%) | 5 (9.4%) |
| 75 to 79 Years | 8 (9.2%) | 0 (0.0%) |
| 80 to 84 Years | 0 (0.0%) | 0 (0.0%) |
| 85 Years and over | 0 (0.0%) | 2 (3.8%) |
| Total | 87 (100.0%) | 53 (100.0%) |
Families and Households in Ensign
Median Family Size in Ensign
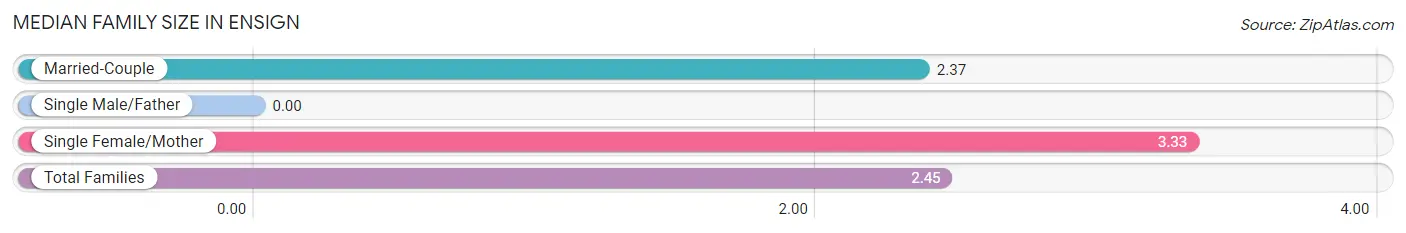
| Family Type | # Families | Family Size |
| Married-Couple | 35 (92.1%) | 2.37 |
| Single Male/Father | 0 (0.0%) | - |
| Single Female/Mother | 3 (7.9%) | 3.33 |
| Total Families | 38 (100.0%) | 2.45 |
Median Household Size in Ensign
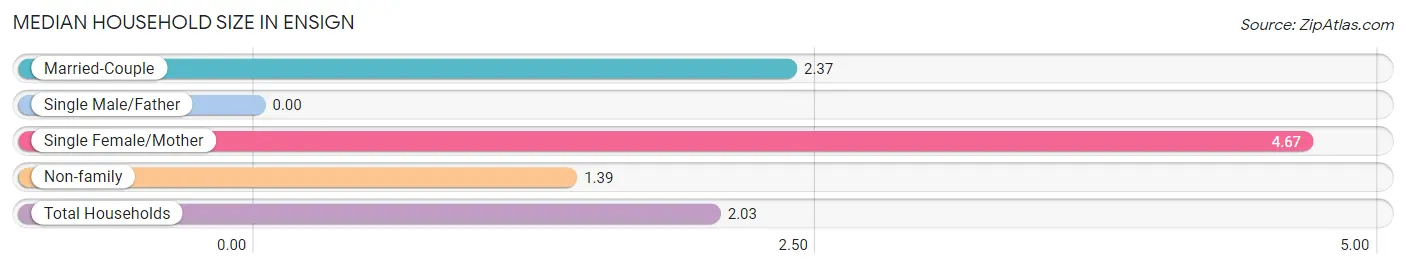
| Household Type | # Households | Household Size |
| Married-Couple | 35 (50.7%) | 2.37 |
| Single Male/Father | 0 (0.0%) | - |
| Single Female/Mother | 3 (4.3%) | 4.67 |
| Non-family | 31 (44.9%) | 1.39 |
| Total Households | 69 (100.0%) | 2.03 |
Household Size by Marriage Status in Ensign
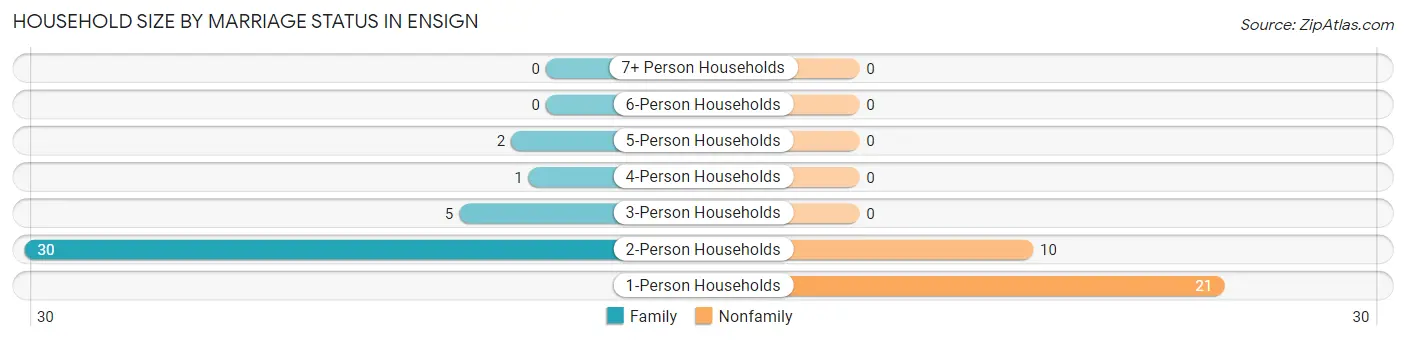
Out of a total of 69 households in Ensign, 38 (55.1%) are family households, while 31 (44.9%) are nonfamily households. The most numerous type of family households are 2-person households, comprising 30, and the most common type of nonfamily households are 1-person households, comprising 21.
| Household Size | Family Households | Nonfamily Households |
| 1-Person Households | - | 21 (30.4%) |
| 2-Person Households | 30 (43.5%) | 10 (14.5%) |
| 3-Person Households | 5 (7.2%) | 0 (0.0%) |
| 4-Person Households | 1 (1.5%) | 0 (0.0%) |
| 5-Person Households | 2 (2.9%) | 0 (0.0%) |
| 6-Person Households | 0 (0.0%) | 0 (0.0%) |
| 7+ Person Households | 0 (0.0%) | 0 (0.0%) |
| Total | 38 (55.1%) | 31 (44.9%) |
Female Fertility in Ensign
Fertility by Age in Ensign
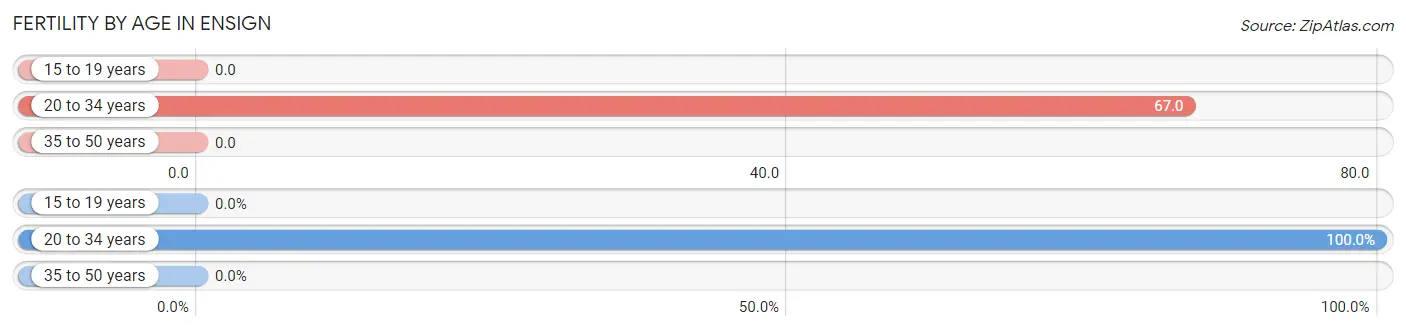
Average fertility rate in Ensign is 33.0 births per 1,000 women. Women in the age bracket of 20 to 34 years have the highest fertility rate with 67.0 births per 1,000 women. Women in the age bracket of 20 to 34 years acount for 100.0% of all women with births.
| Age Bracket | Women with Births | Births / 1,000 Women |
| 15 to 19 years | 0 (0.0%) | 0.0 |
| 20 to 34 years | 1 (100.0%) | 67.0 |
| 35 to 50 years | 0 (0.0%) | 0.0 |
| Total | 1 (100.0%) | 33.0 |
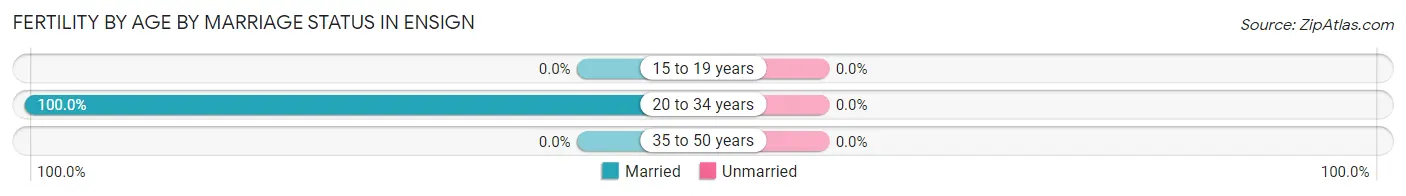
Fertility by Age by Marriage Status in Ensign
| Age Bracket | Married | Unmarried |
| 15 to 19 years | 0 (0.0%) | 0 (0.0%) |
| 20 to 34 years | 1 (100.0%) | 0 (0.0%) |
| 35 to 50 years | 0 (0.0%) | 0 (0.0%) |
| Total | 1 (100.0%) | 0 (0.0%) |
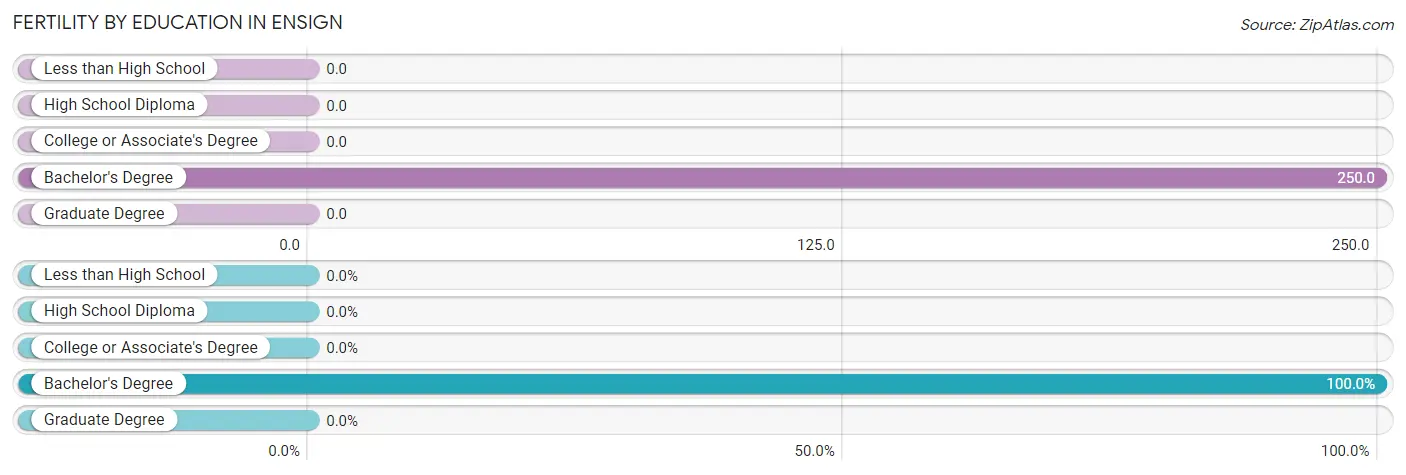
Fertility by Education in Ensign
| Educational Attainment | Women with Births | Births / 1,000 Women |
| Less than High School | 0 (0.0%) | 0.0 |
| High School Diploma | 0 (0.0%) | 0.0 |
| College or Associate's Degree | 0 (0.0%) | 0.0 |
| Bachelor's Degree | 1 (100.0%) | 250.0 |
| Graduate Degree | 0 (0.0%) | 0.0 |
| Total | 1 (100.0%) | 33.0 |
Fertility by Education by Marriage Status in Ensign
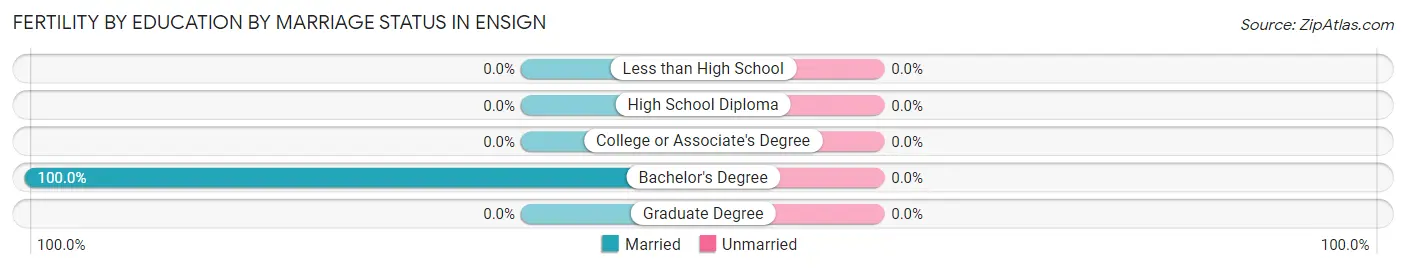
| Educational Attainment | Married | Unmarried |
| Less than High School | 0 (0.0%) | 0 (0.0%) |
| High School Diploma | 0 (0.0%) | 0 (0.0%) |
| College or Associate's Degree | 0 (0.0%) | 0 (0.0%) |
| Bachelor's Degree | 1 (100.0%) | 0 (0.0%) |
| Graduate Degree | 0 (0.0%) | 0 (0.0%) |
| Total | 1 (100.0%) | 0 (0.0%) |
Employment Characteristics in Ensign
Employment by Class of Employer in Ensign
Among the 90 employed individuals in Ensign, private company employees (75 | 83.3%), self-employed (not incorporated) (5 | 5.6%), and state government employees (5 | 5.6%) make up the most common classes of employment.
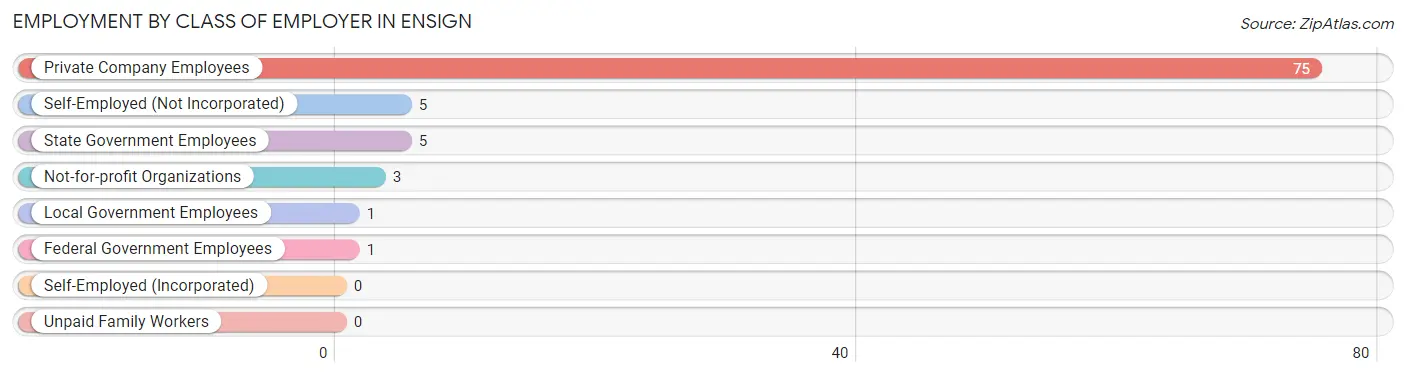
| Employer Class | # Employees | % Employees |
| Private Company Employees | 75 | 83.3% |
| Self-Employed (Incorporated) | 0 | 0.0% |
| Self-Employed (Not Incorporated) | 5 | 5.6% |
| Not-for-profit Organizations | 3 | 3.3% |
| Local Government Employees | 1 | 1.1% |
| State Government Employees | 5 | 5.6% |
| Federal Government Employees | 1 | 1.1% |
| Unpaid Family Workers | 0 | 0.0% |
| Total | 90 | 100.0% |
Employment Status by Age in Ensign
According to the labor force statistics for Ensign, out of the total population over 16 years of age (130), 76.2% or 99 individuals are in the labor force, with 9.1% or 9 of them unemployed. The age group with the highest labor force participation rate is 20 to 24 years, with 100.0% or 34 individuals in the labor force. Within the labor force, the 16 to 19 years age range has the highest percentage of unemployed individuals, with 70.0% or 7 of them being unemployed.
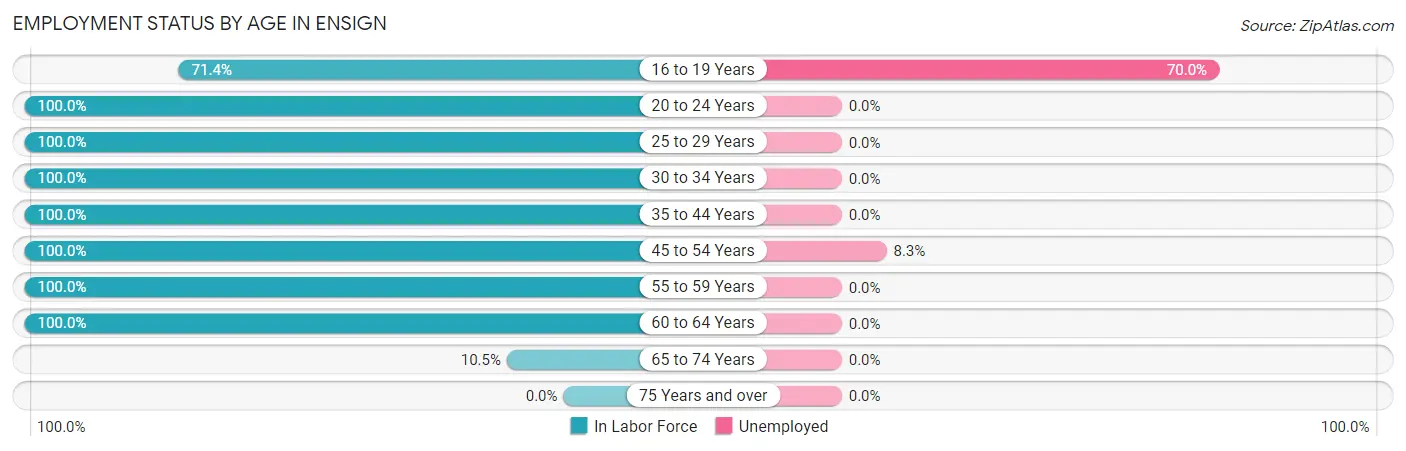
| Age Bracket | In Labor Force | Unemployed |
| 16 to 19 Years | 10 (71.4%) | 7 (70.0%) |
| 20 to 24 Years | 34 (100.0%) | 0 (0.0%) |
| 25 to 29 Years | 7 (100.0%) | 0 (0.0%) |
| 30 to 34 Years | 1 (100.0%) | 0 (0.0%) |
| 35 to 44 Years | 1 (100.0%) | 0 (0.0%) |
| 45 to 54 Years | 24 (100.0%) | 2 (8.3%) |
| 55 to 59 Years | 6 (100.0%) | 0 (0.0%) |
| 60 to 64 Years | 14 (100.0%) | 0 (0.0%) |
| 65 to 74 Years | 2 (10.5%) | 0 (0.0%) |
| 75 Years and over | 0 (0.0%) | 0 (0.0%) |
| Total | 99 (76.2%) | 9 (9.1%) |
Employment Status by Educational Attainment in Ensign
According to labor force statistics for Ensign, 100.0% of individuals (53) out of the total population between 25 and 64 years of age (53) are in the labor force, with 3.8% or 2 of them being unemployed. The group with the highest labor force participation rate are those with the educational attainment of less than high school, with 100.0% or 19 individuals in the labor force. Within the labor force, individuals with college / associate degree education have the highest percentage of unemployment, with 8.7% or 2 of them being unemployed.
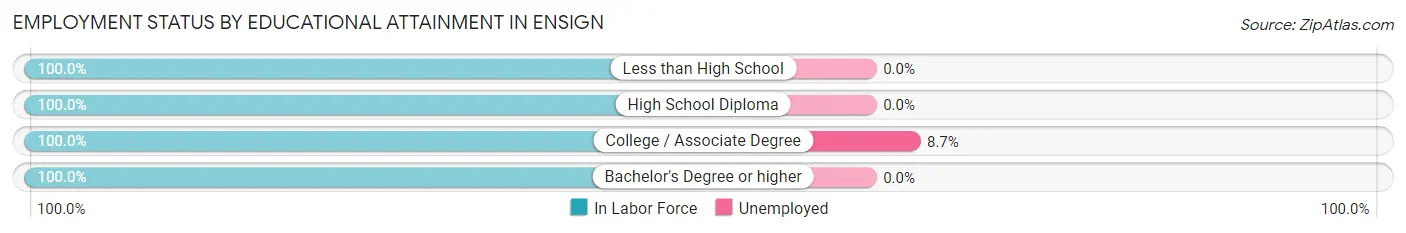
| Educational Attainment | In Labor Force | Unemployed |
| Less than High School | 19 (100.0%) | 0 (0.0%) |
| High School Diploma | 7 (100.0%) | 0 (0.0%) |
| College / Associate Degree | 23 (100.0%) | 2 (8.7%) |
| Bachelor's Degree or higher | 4 (100.0%) | 0 (0.0%) |
| Total | 53 (100.0%) | 2 (3.8%) |
Employment Occupations by Sex in Ensign
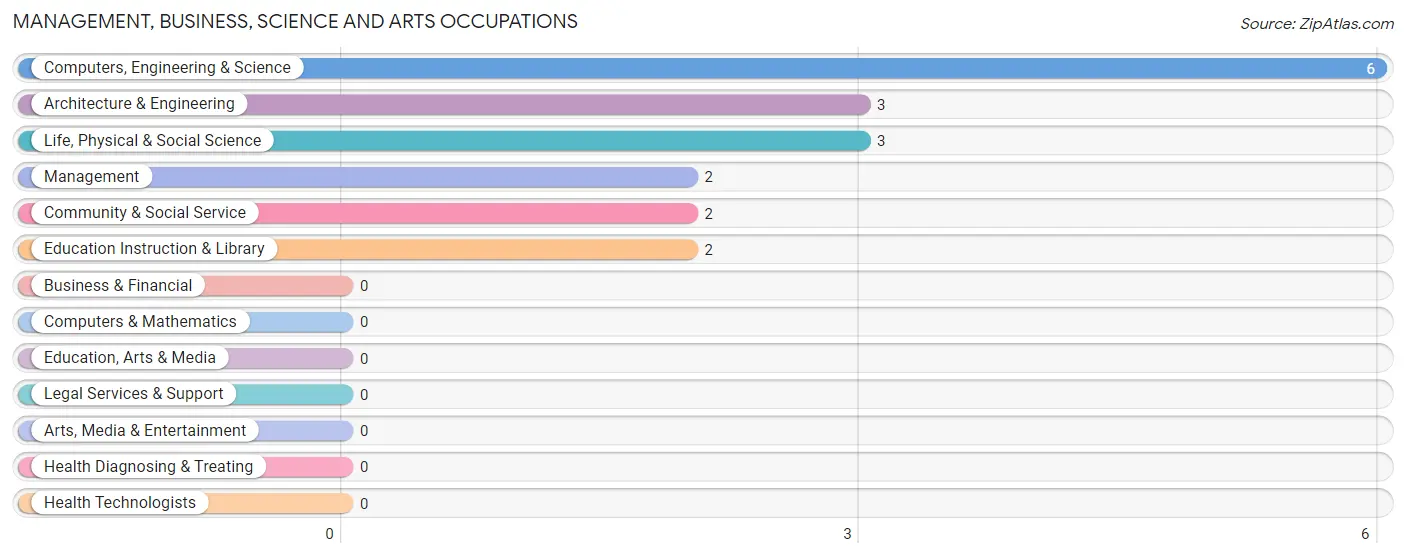
Management, Business, Science and Arts Occupations
The most common Management, Business, Science and Arts occupations in Ensign are Computers, Engineering & Science (6 | 6.7%), Architecture & Engineering (3 | 3.3%), Life, Physical & Social Science (3 | 3.3%), Management (2 | 2.2%), and Community & Social Service (2 | 2.2%).
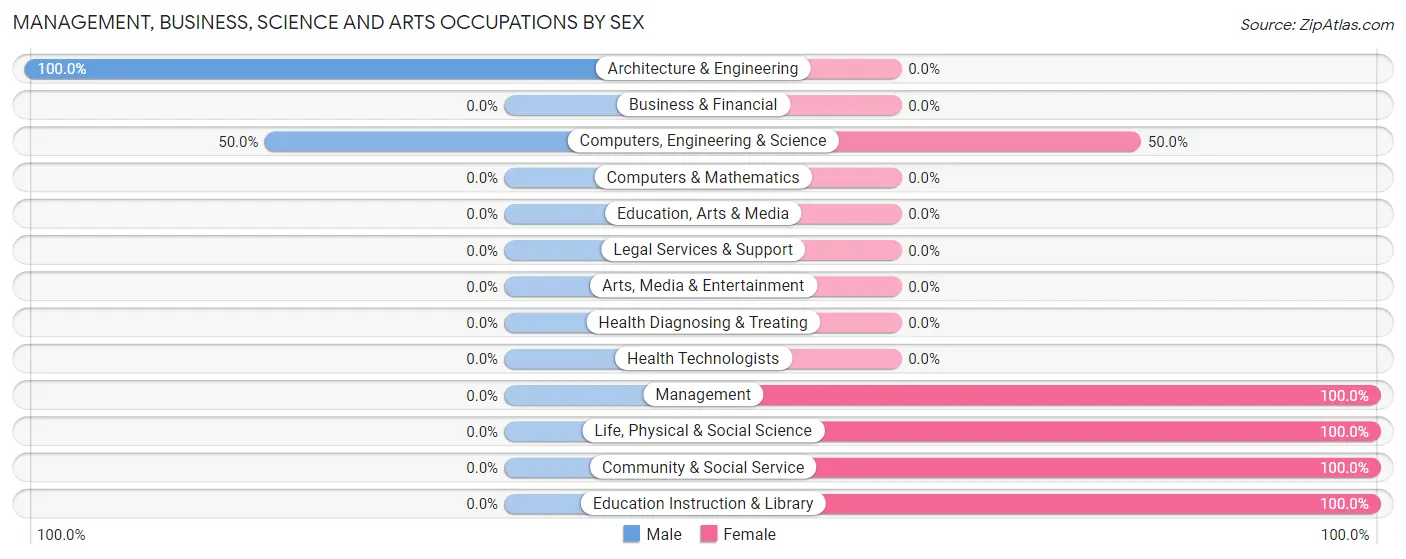
Management, Business, Science and Arts Occupations by Sex
Within the Management, Business, Science and Arts occupations in Ensign, the most male-oriented occupations are Architecture & Engineering (100.0%), and Computers, Engineering & Science (50.0%), while the most female-oriented occupations are Management (100.0%), Life, Physical & Social Science (100.0%), and Community & Social Service (100.0%).
| Occupation | Male | Female |
| Management | 0 (0.0%) | 2 (100.0%) |
| Business & Financial | 0 (0.0%) | 0 (0.0%) |
| Computers, Engineering & Science | 3 (50.0%) | 3 (50.0%) |
| Computers & Mathematics | 0 (0.0%) | 0 (0.0%) |
| Architecture & Engineering | 3 (100.0%) | 0 (0.0%) |
| Life, Physical & Social Science | 0 (0.0%) | 3 (100.0%) |
| Community & Social Service | 0 (0.0%) | 2 (100.0%) |
| Education, Arts & Media | 0 (0.0%) | 0 (0.0%) |
| Legal Services & Support | 0 (0.0%) | 0 (0.0%) |
| Education Instruction & Library | 0 (0.0%) | 2 (100.0%) |
| Arts, Media & Entertainment | 0 (0.0%) | 0 (0.0%) |
| Health Diagnosing & Treating | 0 (0.0%) | 0 (0.0%) |
| Health Technologists | 0 (0.0%) | 0 (0.0%) |
| Total (Category) | 3 (30.0%) | 7 (70.0%) |
| Total (Overall) | 56 (62.2%) | 34 (37.8%) |
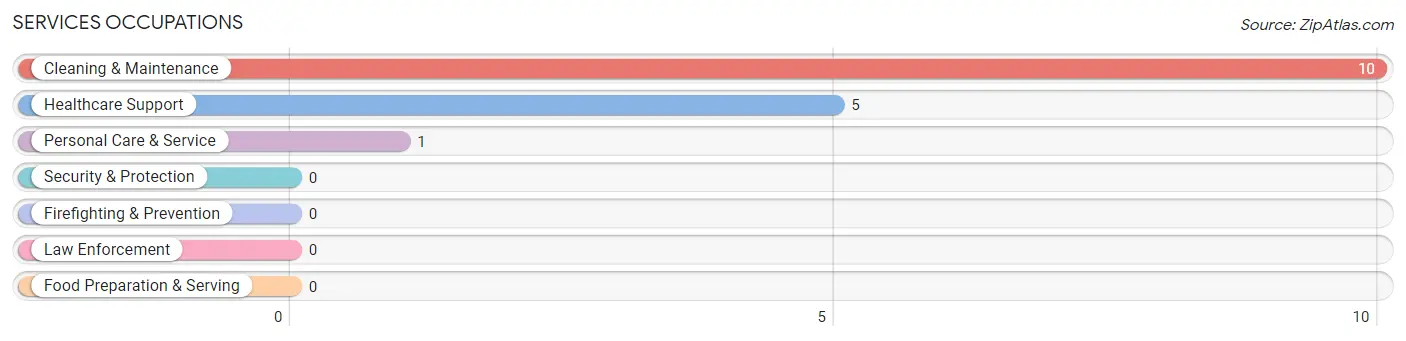
Services Occupations
The most common Services occupations in Ensign are Cleaning & Maintenance (10 | 11.1%), Healthcare Support (5 | 5.6%), and Personal Care & Service (1 | 1.1%).
Services Occupations by Sex
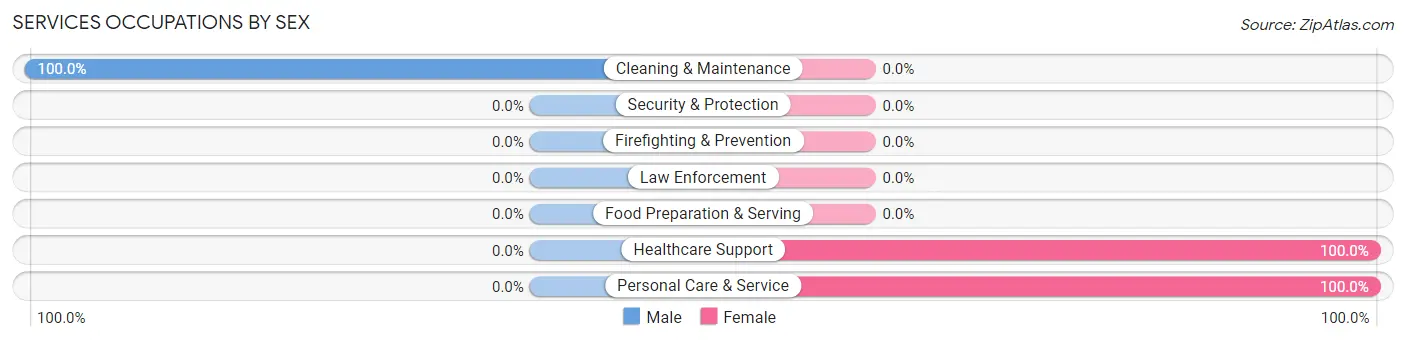
| Occupation | Male | Female |
| Healthcare Support | 0 (0.0%) | 5 (100.0%) |
| Security & Protection | 0 (0.0%) | 0 (0.0%) |
| Firefighting & Prevention | 0 (0.0%) | 0 (0.0%) |
| Law Enforcement | 0 (0.0%) | 0 (0.0%) |
| Food Preparation & Serving | 0 (0.0%) | 0 (0.0%) |
| Cleaning & Maintenance | 10 (100.0%) | 0 (0.0%) |
| Personal Care & Service | 0 (0.0%) | 1 (100.0%) |
| Total (Category) | 10 (62.5%) | 6 (37.5%) |
| Total (Overall) | 56 (62.2%) | 34 (37.8%) |
Sales and Office Occupations
The most common Sales and Office occupations in Ensign are Office & Administration (9 | 10.0%), and Sales & Related (7 | 7.8%).
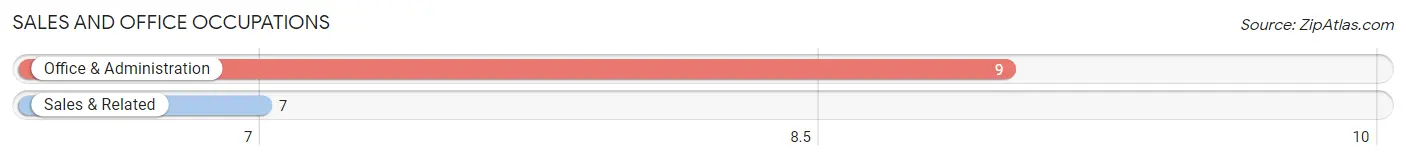
Sales and Office Occupations by Sex
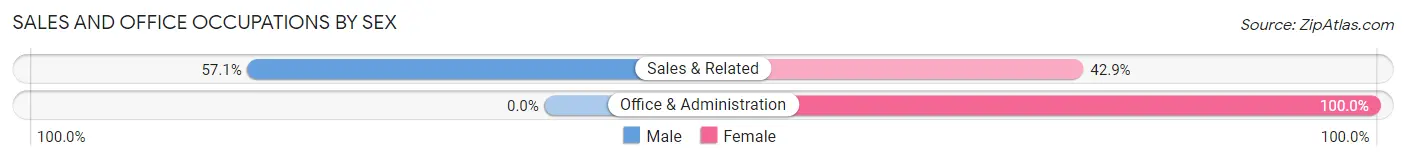
| Occupation | Male | Female |
| Sales & Related | 4 (57.1%) | 3 (42.9%) |
| Office & Administration | 0 (0.0%) | 9 (100.0%) |
| Total (Category) | 4 (25.0%) | 12 (75.0%) |
| Total (Overall) | 56 (62.2%) | 34 (37.8%) |
Natural Resources, Construction and Maintenance Occupations
The most common Natural Resources, Construction and Maintenance occupations in Ensign are Construction & Extraction (11 | 12.2%), and Installation, Maintenance & Repair (5 | 5.6%).
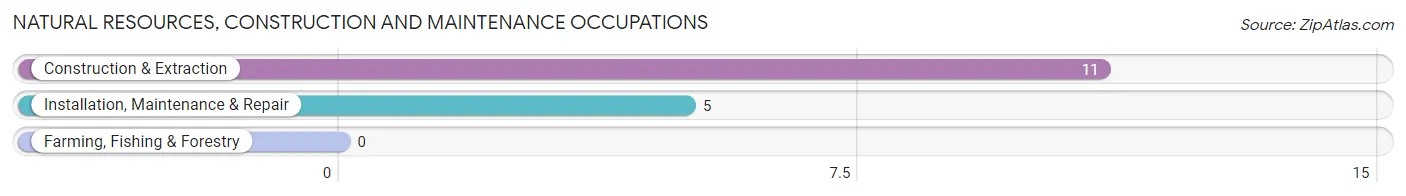
Natural Resources, Construction and Maintenance Occupations by Sex
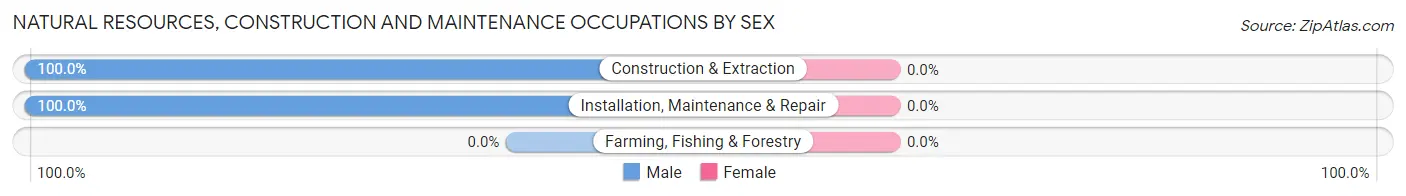
| Occupation | Male | Female |
| Farming, Fishing & Forestry | 0 (0.0%) | 0 (0.0%) |
| Construction & Extraction | 11 (100.0%) | 0 (0.0%) |
| Installation, Maintenance & Repair | 5 (100.0%) | 0 (0.0%) |
| Total (Category) | 16 (100.0%) | 0 (0.0%) |
| Total (Overall) | 56 (62.2%) | 34 (37.8%) |
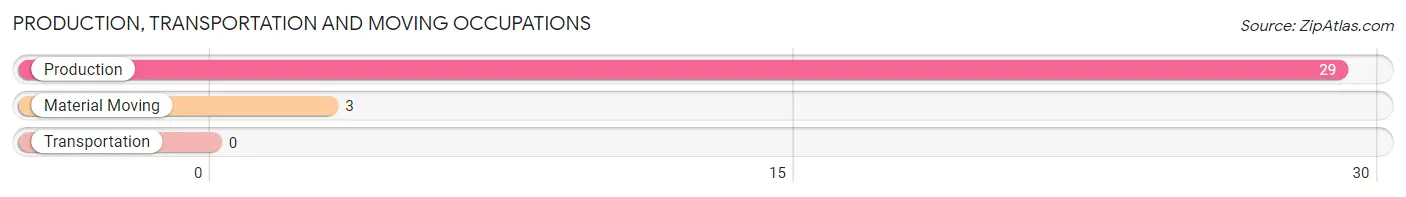
Production, Transportation and Moving Occupations
The most common Production, Transportation and Moving occupations in Ensign are Production (29 | 32.2%), and Material Moving (3 | 3.3%).
Production, Transportation and Moving Occupations by Sex
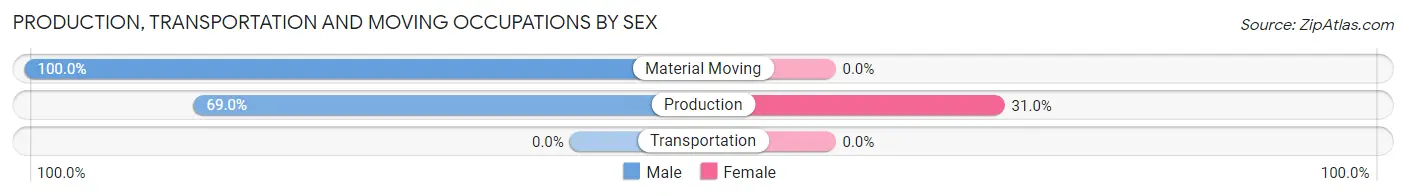
| Occupation | Male | Female |
| Production | 20 (69.0%) | 9 (31.0%) |
| Transportation | 0 (0.0%) | 0 (0.0%) |
| Material Moving | 3 (100.0%) | 0 (0.0%) |
| Total (Category) | 23 (71.9%) | 9 (28.1%) |
| Total (Overall) | 56 (62.2%) | 34 (37.8%) |
Employment Industries by Sex in Ensign
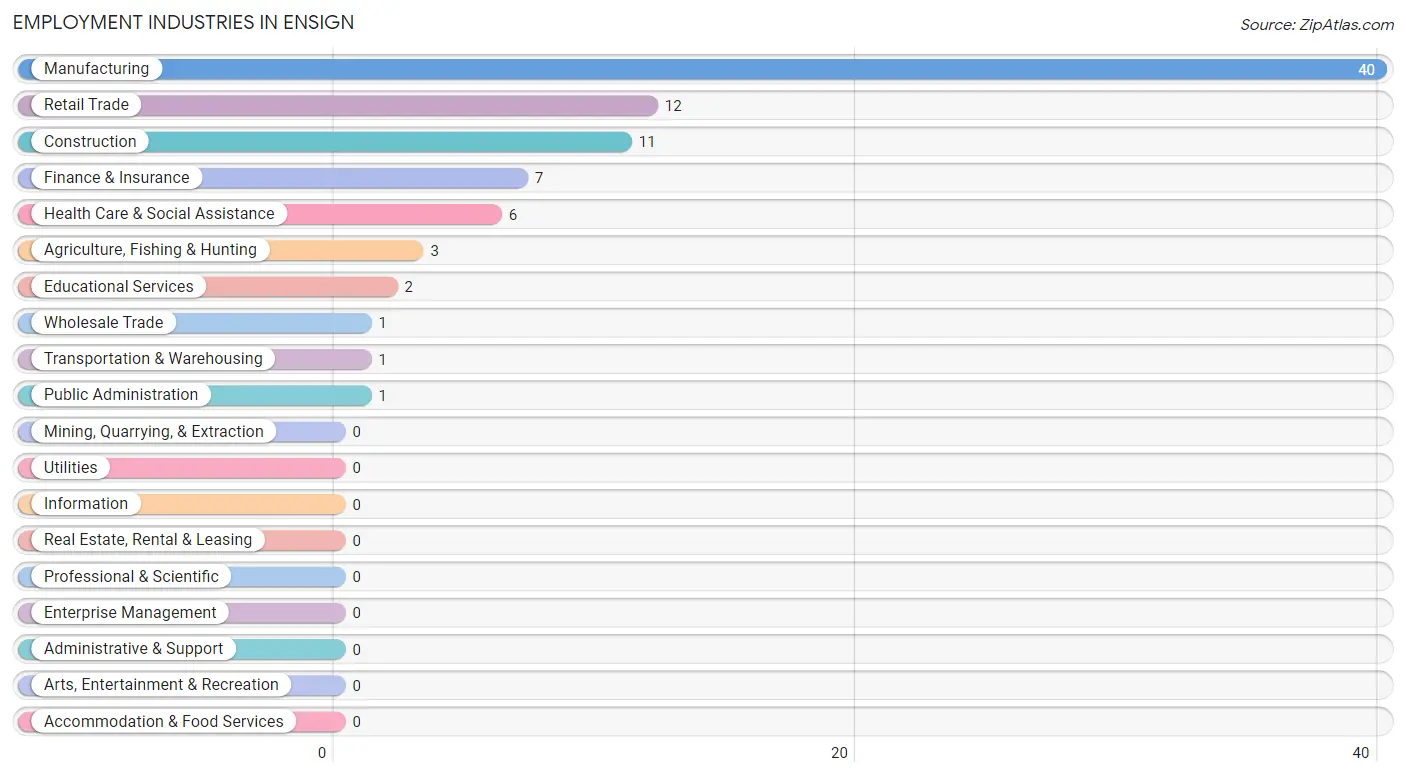
Employment Industries in Ensign
The major employment industries in Ensign include Manufacturing (40 | 44.4%), Retail Trade (12 | 13.3%), Construction (11 | 12.2%), Finance & Insurance (7 | 7.8%), and Health Care & Social Assistance (6 | 6.7%).
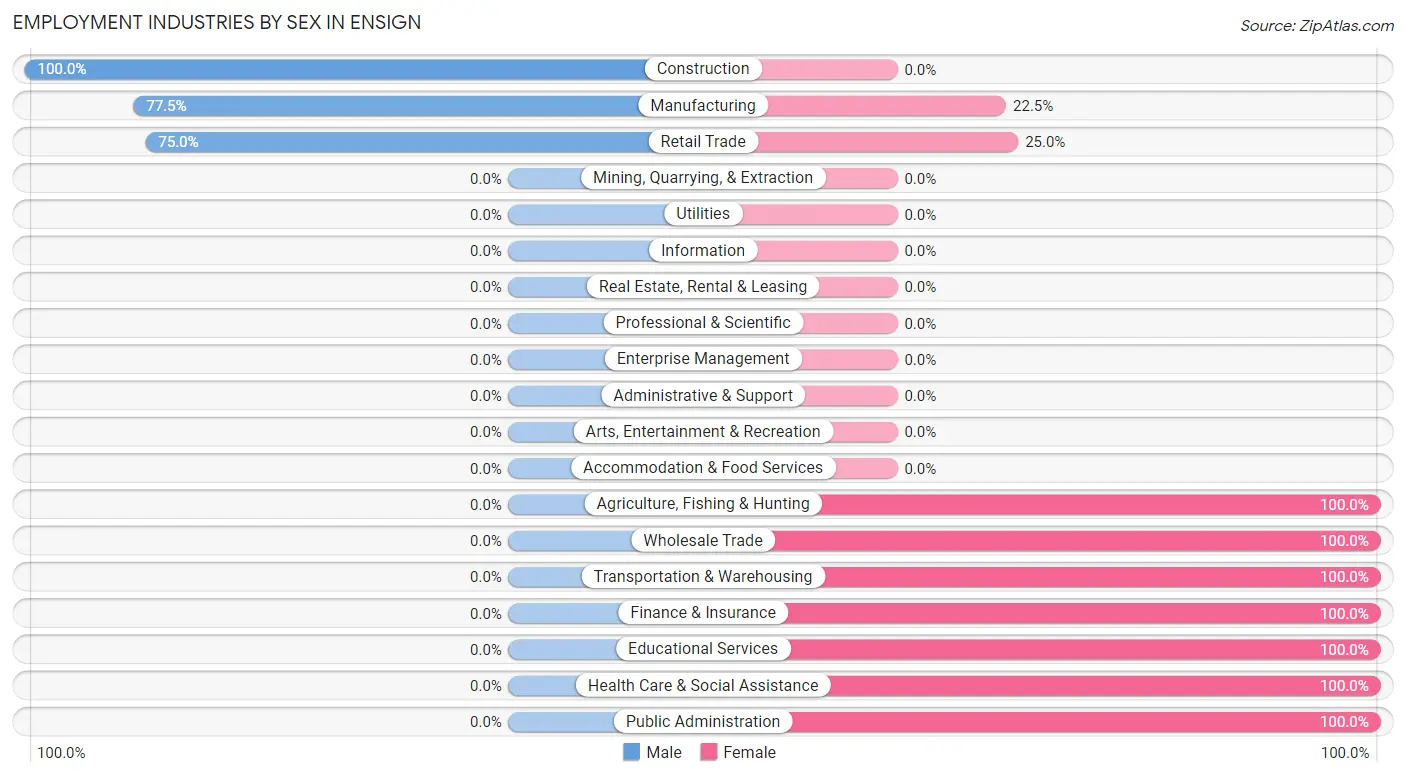
Employment Industries by Sex in Ensign
The Ensign industries that see more men than women are Construction (100.0%), Manufacturing (77.5%), and Retail Trade (75.0%), whereas the industries that tend to have a higher number of women are Agriculture, Fishing & Hunting (100.0%), Wholesale Trade (100.0%), and Transportation & Warehousing (100.0%).
| Industry | Male | Female |
| Agriculture, Fishing & Hunting | 0 (0.0%) | 3 (100.0%) |
| Mining, Quarrying, & Extraction | 0 (0.0%) | 0 (0.0%) |
| Construction | 11 (100.0%) | 0 (0.0%) |
| Manufacturing | 31 (77.5%) | 9 (22.5%) |
| Wholesale Trade | 0 (0.0%) | 1 (100.0%) |
| Retail Trade | 9 (75.0%) | 3 (25.0%) |
| Transportation & Warehousing | 0 (0.0%) | 1 (100.0%) |
| Utilities | 0 (0.0%) | 0 (0.0%) |
| Information | 0 (0.0%) | 0 (0.0%) |
| Finance & Insurance | 0 (0.0%) | 7 (100.0%) |
| Real Estate, Rental & Leasing | 0 (0.0%) | 0 (0.0%) |
| Professional & Scientific | 0 (0.0%) | 0 (0.0%) |
| Enterprise Management | 0 (0.0%) | 0 (0.0%) |
| Administrative & Support | 0 (0.0%) | 0 (0.0%) |
| Educational Services | 0 (0.0%) | 2 (100.0%) |
| Health Care & Social Assistance | 0 (0.0%) | 6 (100.0%) |
| Arts, Entertainment & Recreation | 0 (0.0%) | 0 (0.0%) |
| Accommodation & Food Services | 0 (0.0%) | 0 (0.0%) |
| Public Administration | 0 (0.0%) | 1 (100.0%) |
| Total | 56 (62.2%) | 34 (37.8%) |
Education in Ensign
School Enrollment in Ensign
The most common levels of schooling among the 22 students in Ensign are college / undergraduate (9 | 40.9%), elementary school (8 | 36.4%), and high school (5 | 22.7%).
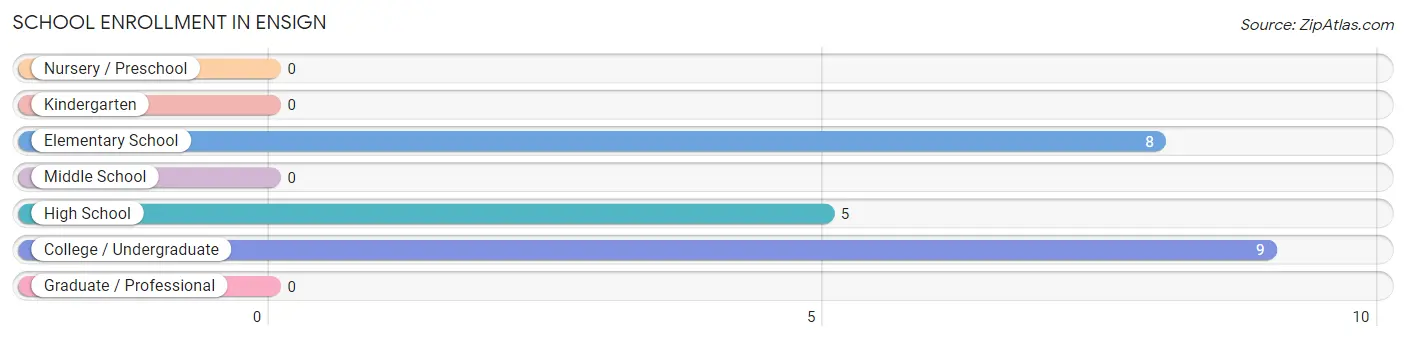
| School Level | # Students | % Students |
| Nursery / Preschool | 0 | 0.0% |
| Kindergarten | 0 | 0.0% |
| Elementary School | 8 | 36.4% |
| Middle School | 0 | 0.0% |
| High School | 5 | 22.7% |
| College / Undergraduate | 9 | 40.9% |
| Graduate / Professional | 0 | 0.0% |
| Total | 22 | 100.0% |
School Enrollment by Age by Funding Source in Ensign
Out of a total of 22 students who are enrolled in schools in Ensign, 3 (13.6%) attend a private institution, while the remaining 19 (86.4%) are enrolled in public schools. The age group of 5 to 9 year old has the highest likelihood of being enrolled in private schools, with 3 (37.5% in the age bracket) enrolled. Conversely, the age group of 15 to 17 year olds has the lowest likelihood of being enrolled in a private school, with 2 (100.0% in the age bracket) attending a public institution.
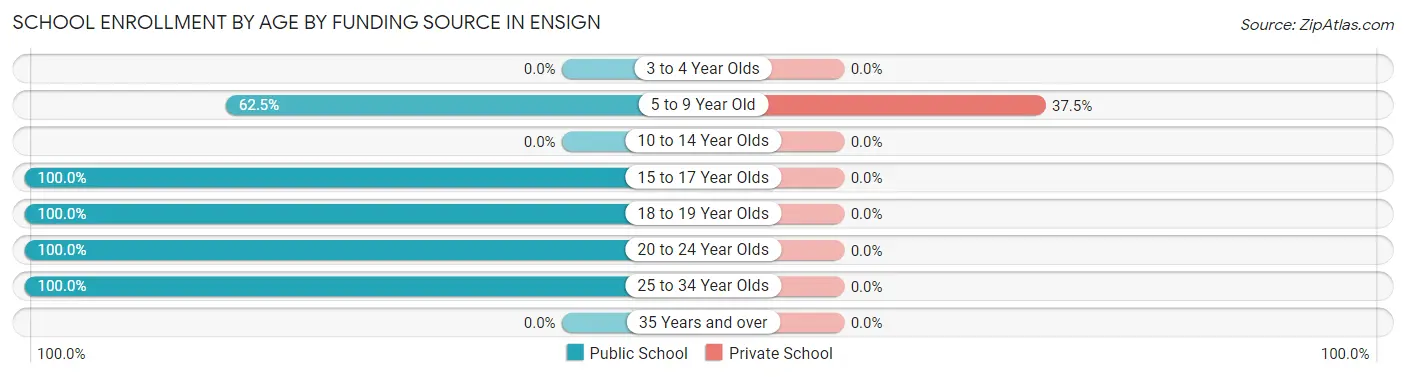
| Age Bracket | Public School | Private School |
| 3 to 4 Year Olds | 0 (0.0%) | 0 (0.0%) |
| 5 to 9 Year Old | 5 (62.5%) | 3 (37.5%) |
| 10 to 14 Year Olds | 0 (0.0%) | 0 (0.0%) |
| 15 to 17 Year Olds | 2 (100.0%) | 0 (0.0%) |
| 18 to 19 Year Olds | 3 (100.0%) | 0 (0.0%) |
| 20 to 24 Year Olds | 8 (100.0%) | 0 (0.0%) |
| 25 to 34 Year Olds | 1 (100.0%) | 0 (0.0%) |
| 35 Years and over | 0 (0.0%) | 0 (0.0%) |
| Total | 19 (86.4%) | 3 (13.6%) |
Educational Attainment by Field of Study in Ensign
Bio, nature & agricultural (6 | 40.0%), education (4 | 26.7%), business (3 | 20.0%), and arts & humanities (2 | 13.3%) are the most common fields of study among 15 individuals in Ensign who have obtained a bachelor's degree or higher.
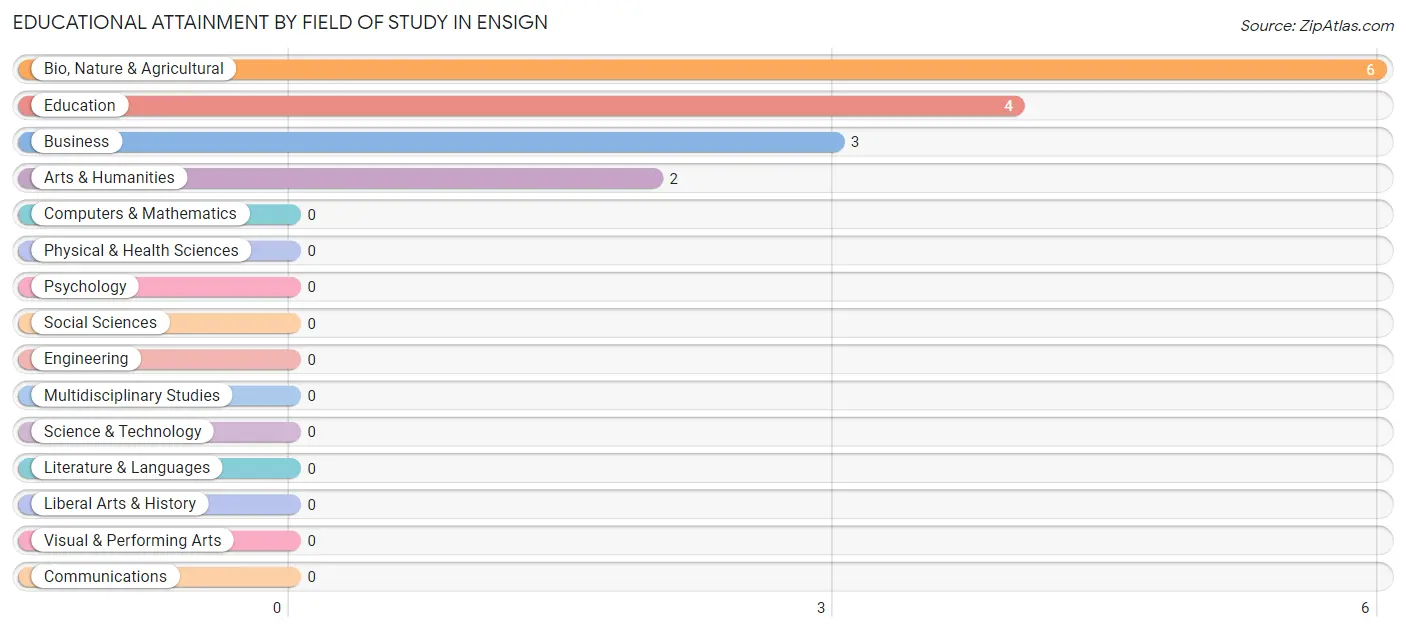
| Field of Study | # Graduates | % Graduates |
| Computers & Mathematics | 0 | 0.0% |
| Bio, Nature & Agricultural | 6 | 40.0% |
| Physical & Health Sciences | 0 | 0.0% |
| Psychology | 0 | 0.0% |
| Social Sciences | 0 | 0.0% |
| Engineering | 0 | 0.0% |
| Multidisciplinary Studies | 0 | 0.0% |
| Science & Technology | 0 | 0.0% |
| Business | 3 | 20.0% |
| Education | 4 | 26.7% |
| Literature & Languages | 0 | 0.0% |
| Liberal Arts & History | 0 | 0.0% |
| Visual & Performing Arts | 0 | 0.0% |
| Communications | 0 | 0.0% |
| Arts & Humanities | 2 | 13.3% |
| Total | 15 | 100.0% |
Transportation & Commute in Ensign
Vehicle Availability by Sex in Ensign
The most prevalent vehicle ownership categories in Ensign are males with 3 vehicles (27, accounting for 48.2%) and females with 3 vehicles (12, making up 79.4%).
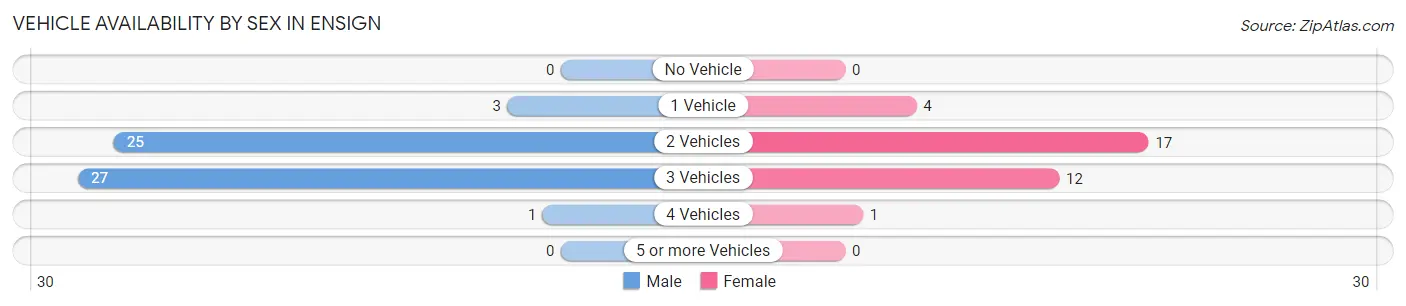
| Vehicles Available | Male | Female |
| No Vehicle | 0 (0.0%) | 0 (0.0%) |
| 1 Vehicle | 3 (5.4%) | 4 (11.8%) |
| 2 Vehicles | 25 (44.6%) | 17 (50.0%) |
| 3 Vehicles | 27 (48.2%) | 12 (35.3%) |
| 4 Vehicles | 1 (1.8%) | 1 (2.9%) |
| 5 or more Vehicles | 0 (0.0%) | 0 (0.0%) |
| Total | 56 (100.0%) | 34 (100.0%) |
Commute Time in Ensign
The most frequently occuring commute durations in Ensign are 30 to 34 minutes (35 commuters, 41.2%), 20 to 24 minutes (18 commuters, 21.2%), and 15 to 19 minutes (14 commuters, 16.5%).
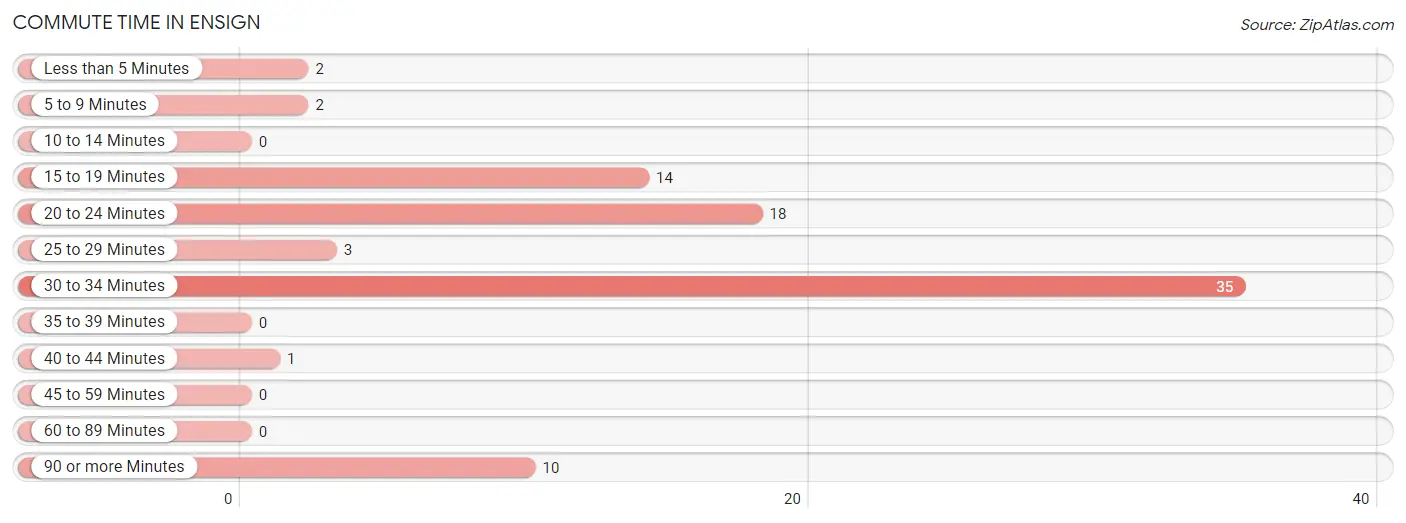
| Commute Time | # Commuters | % Commuters |
| Less than 5 Minutes | 2 | 2.4% |
| 5 to 9 Minutes | 2 | 2.4% |
| 10 to 14 Minutes | 0 | 0.0% |
| 15 to 19 Minutes | 14 | 16.5% |
| 20 to 24 Minutes | 18 | 21.2% |
| 25 to 29 Minutes | 3 | 3.5% |
| 30 to 34 Minutes | 35 | 41.2% |
| 35 to 39 Minutes | 0 | 0.0% |
| 40 to 44 Minutes | 1 | 1.2% |
| 45 to 59 Minutes | 0 | 0.0% |
| 60 to 89 Minutes | 0 | 0.0% |
| 90 or more Minutes | 10 | 11.8% |
Commute Time by Sex in Ensign
The most common commute times in Ensign are 30 to 34 minutes (30 commuters, 58.8%) for males and 20 to 24 minutes (14 commuters, 41.2%) for females.
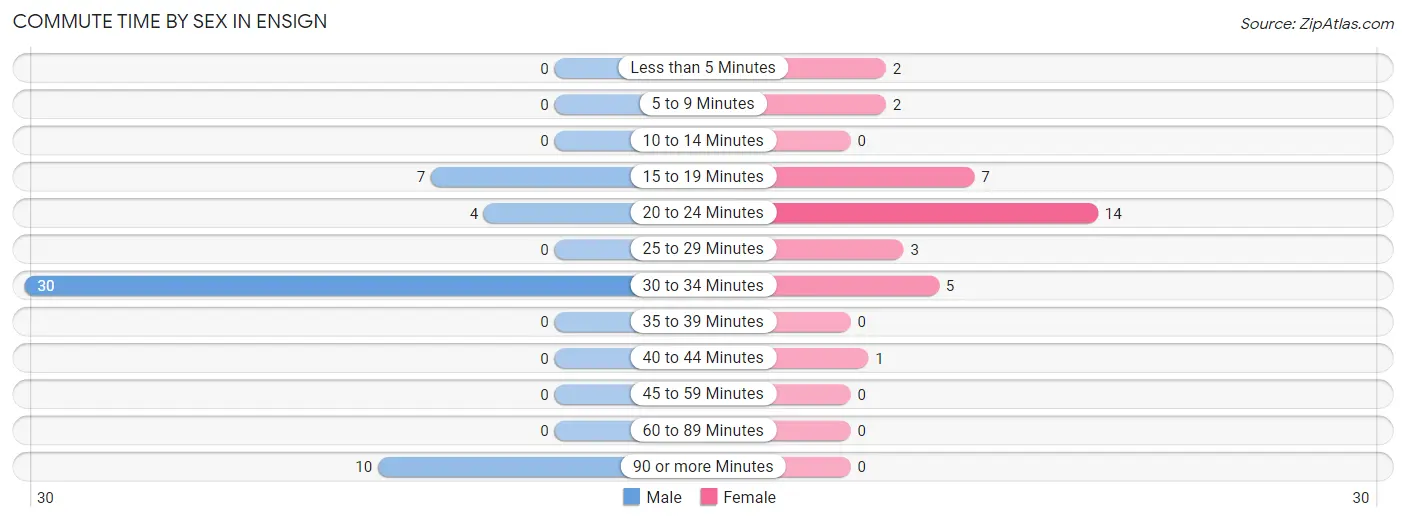
| Commute Time | Male | Female |
| Less than 5 Minutes | 0 (0.0%) | 2 (5.9%) |
| 5 to 9 Minutes | 0 (0.0%) | 2 (5.9%) |
| 10 to 14 Minutes | 0 (0.0%) | 0 (0.0%) |
| 15 to 19 Minutes | 7 (13.7%) | 7 (20.6%) |
| 20 to 24 Minutes | 4 (7.8%) | 14 (41.2%) |
| 25 to 29 Minutes | 0 (0.0%) | 3 (8.8%) |
| 30 to 34 Minutes | 30 (58.8%) | 5 (14.7%) |
| 35 to 39 Minutes | 0 (0.0%) | 0 (0.0%) |
| 40 to 44 Minutes | 0 (0.0%) | 1 (2.9%) |
| 45 to 59 Minutes | 0 (0.0%) | 0 (0.0%) |
| 60 to 89 Minutes | 0 (0.0%) | 0 (0.0%) |
| 90 or more Minutes | 10 (19.6%) | 0 (0.0%) |
Time of Departure to Work by Sex in Ensign
The most frequent times of departure to work in Ensign are 5:00 AM to 5:29 AM (17, 33.3%) for males and 7:30 AM to 7:59 AM (12, 35.3%) for females.
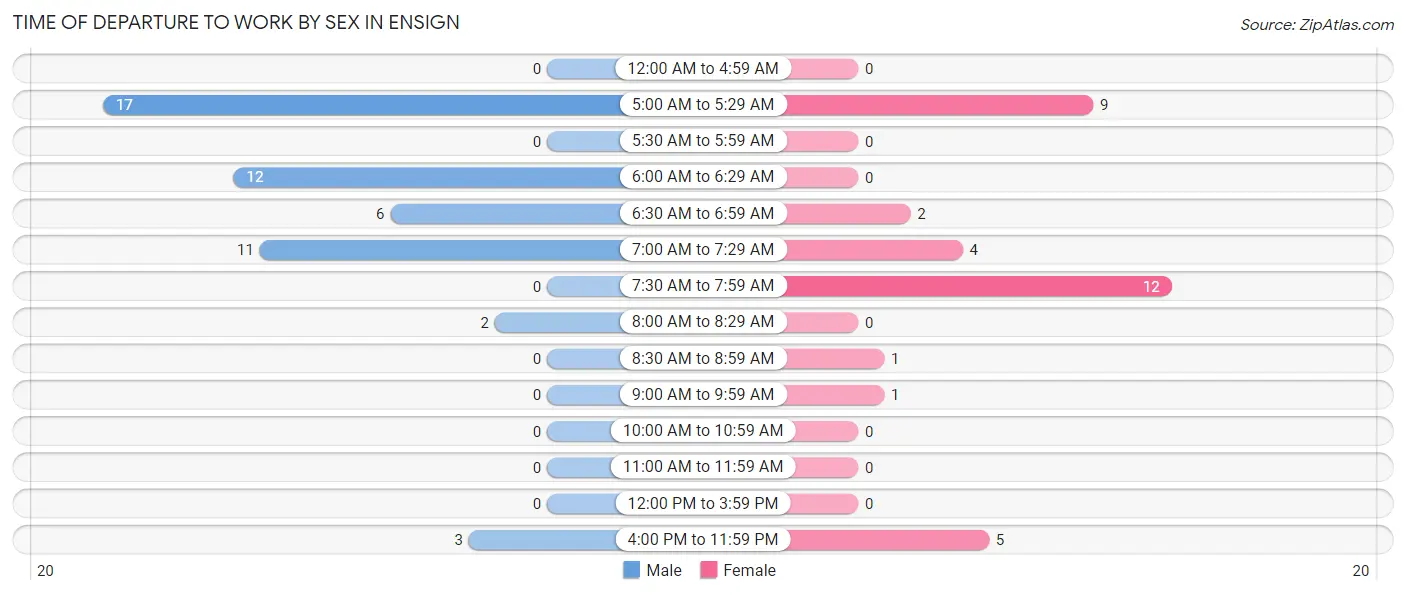
| Time of Departure | Male | Female |
| 12:00 AM to 4:59 AM | 0 (0.0%) | 0 (0.0%) |
| 5:00 AM to 5:29 AM | 17 (33.3%) | 9 (26.5%) |
| 5:30 AM to 5:59 AM | 0 (0.0%) | 0 (0.0%) |
| 6:00 AM to 6:29 AM | 12 (23.5%) | 0 (0.0%) |
| 6:30 AM to 6:59 AM | 6 (11.8%) | 2 (5.9%) |
| 7:00 AM to 7:29 AM | 11 (21.6%) | 4 (11.8%) |
| 7:30 AM to 7:59 AM | 0 (0.0%) | 12 (35.3%) |
| 8:00 AM to 8:29 AM | 2 (3.9%) | 0 (0.0%) |
| 8:30 AM to 8:59 AM | 0 (0.0%) | 1 (2.9%) |
| 9:00 AM to 9:59 AM | 0 (0.0%) | 1 (2.9%) |
| 10:00 AM to 10:59 AM | 0 (0.0%) | 0 (0.0%) |
| 11:00 AM to 11:59 AM | 0 (0.0%) | 0 (0.0%) |
| 12:00 PM to 3:59 PM | 0 (0.0%) | 0 (0.0%) |
| 4:00 PM to 11:59 PM | 3 (5.9%) | 5 (14.7%) |
| Total | 51 (100.0%) | 34 (100.0%) |
Housing Occupancy in Ensign
Occupancy by Ownership in Ensign
Of the total 69 dwellings in Ensign, owner-occupied units account for 56 (81.2%), while renter-occupied units make up 13 (18.8%).
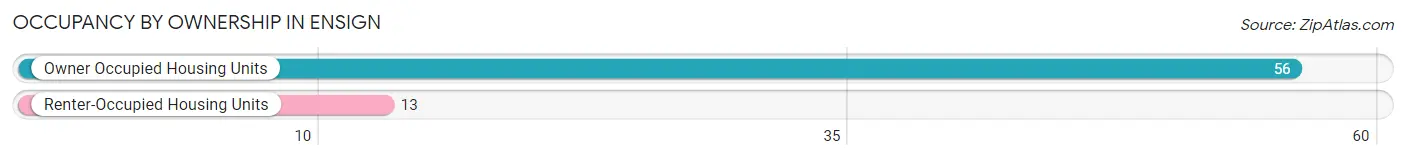
| Occupancy | # Housing Units | % Housing Units |
| Owner Occupied Housing Units | 56 | 81.2% |
| Renter-Occupied Housing Units | 13 | 18.8% |
| Total Occupied Housing Units | 69 | 100.0% |
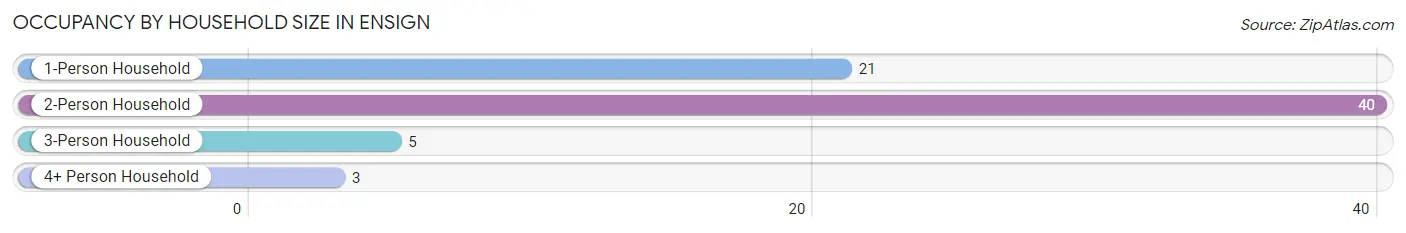
Occupancy by Household Size in Ensign
| Household Size | # Housing Units | % Housing Units |
| 1-Person Household | 21 | 30.4% |
| 2-Person Household | 40 | 58.0% |
| 3-Person Household | 5 | 7.2% |
| 4+ Person Household | 3 | 4.3% |
| Total Housing Units | 69 | 100.0% |
Occupancy by Ownership by Household Size in Ensign
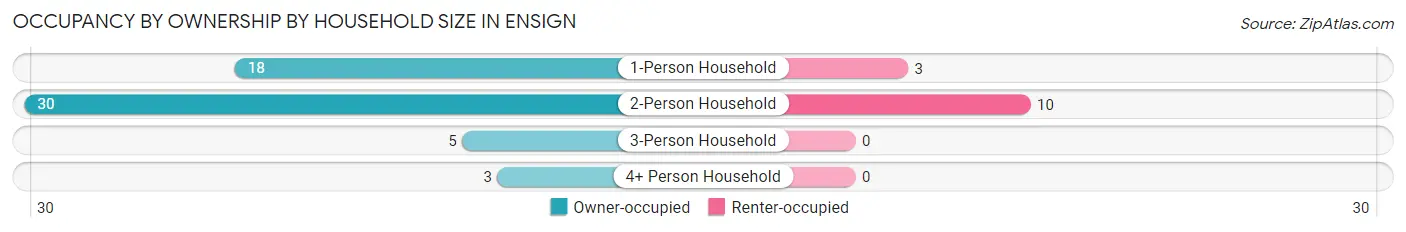
| Household Size | Owner-occupied | Renter-occupied |
| 1-Person Household | 18 (85.7%) | 3 (14.3%) |
| 2-Person Household | 30 (75.0%) | 10 (25.0%) |
| 3-Person Household | 5 (100.0%) | 0 (0.0%) |
| 4+ Person Household | 3 (100.0%) | 0 (0.0%) |
| Total Housing Units | 56 (81.2%) | 13 (18.8%) |
Occupancy by Educational Attainment in Ensign
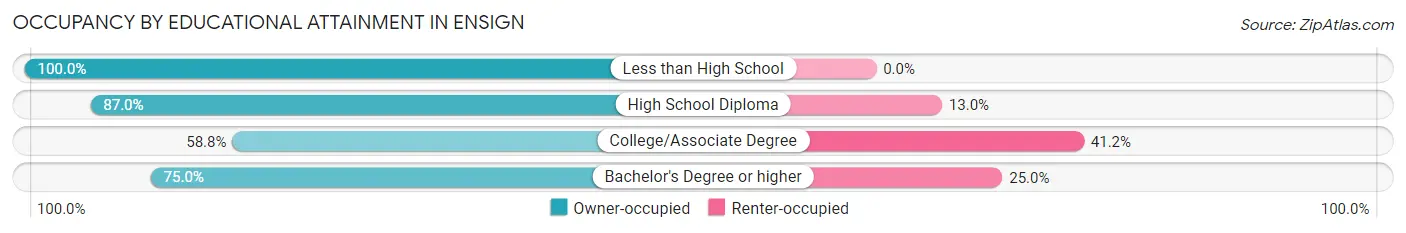
| Household Size | Owner-occupied | Renter-occupied |
| Less than High School | 17 (100.0%) | 0 (0.0%) |
| High School Diploma | 20 (87.0%) | 3 (13.0%) |
| College/Associate Degree | 10 (58.8%) | 7 (41.2%) |
| Bachelor's Degree or higher | 9 (75.0%) | 3 (25.0%) |
Occupancy by Age of Householder in Ensign
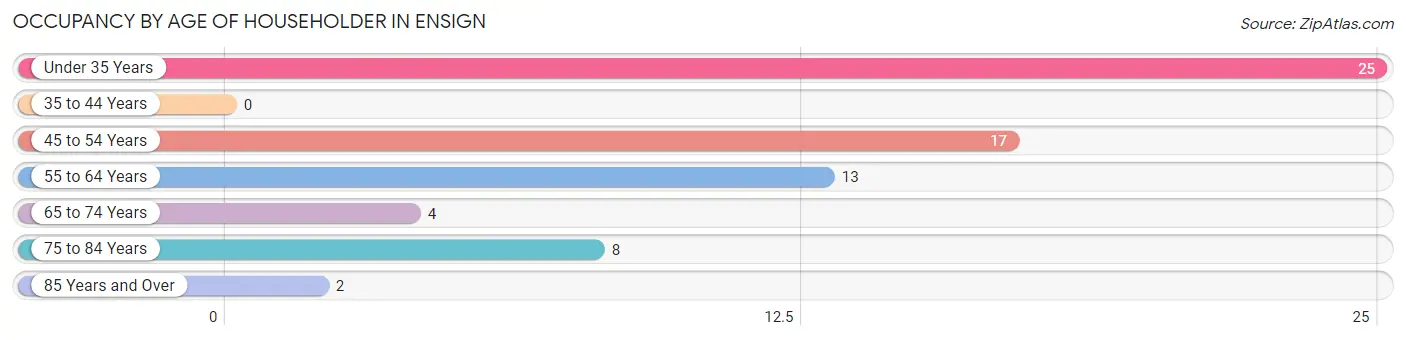
| Age Bracket | # Households | % Households |
| Under 35 Years | 25 | 36.2% |
| 35 to 44 Years | 0 | 0.0% |
| 45 to 54 Years | 17 | 24.6% |
| 55 to 64 Years | 13 | 18.8% |
| 65 to 74 Years | 4 | 5.8% |
| 75 to 84 Years | 8 | 11.6% |
| 85 Years and Over | 2 | 2.9% |
| Total | 69 | 100.0% |
Housing Finances in Ensign
Median Income by Occupancy in Ensign
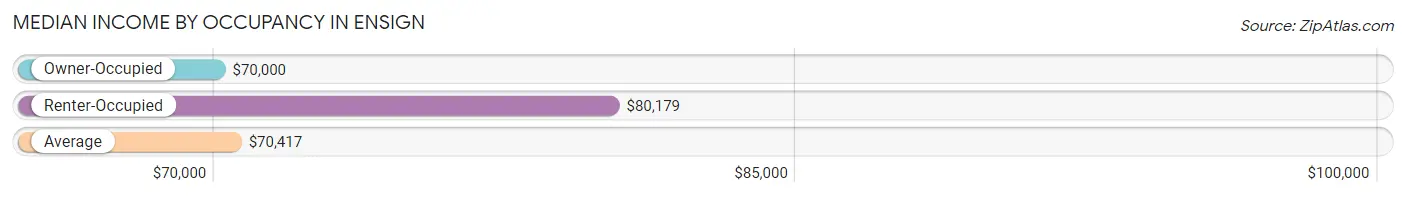
| Occupancy Type | # Households | Median Income |
| Owner-Occupied | 56 (81.2%) | $70,000 |
| Renter-Occupied | 13 (18.8%) | $80,179 |
| Average | 69 (100.0%) | $70,417 |
Occupancy by Householder Income Bracket in Ensign
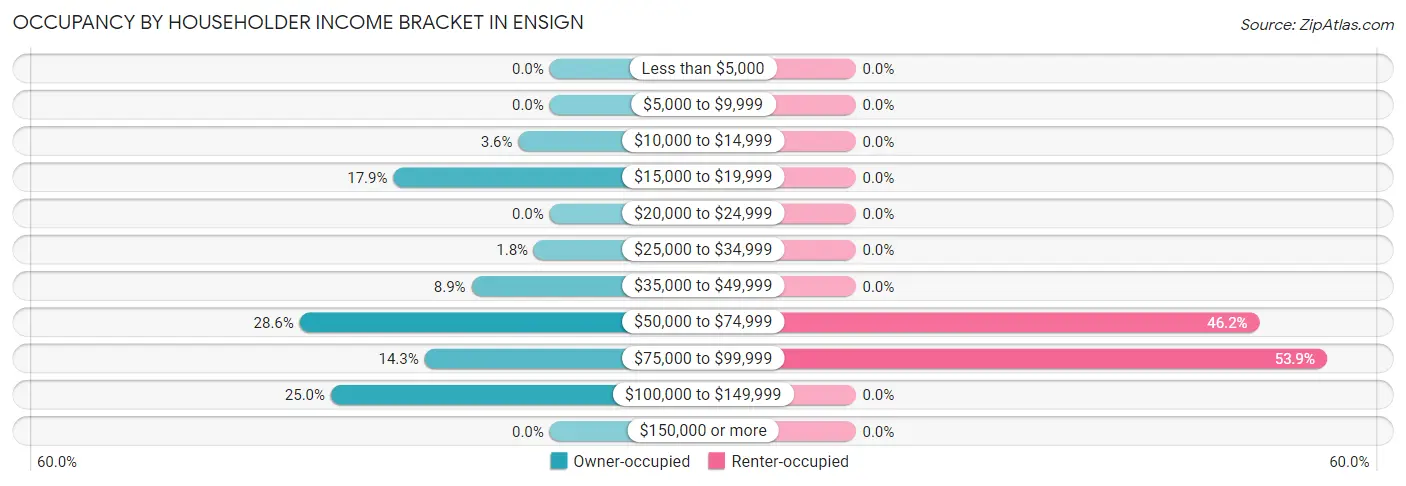
| Income Bracket | Owner-occupied | Renter-occupied |
| Less than $5,000 | 0 (0.0%) | 0 (0.0%) |
| $5,000 to $9,999 | 0 (0.0%) | 0 (0.0%) |
| $10,000 to $14,999 | 2 (3.6%) | 0 (0.0%) |
| $15,000 to $19,999 | 10 (17.9%) | 0 (0.0%) |
| $20,000 to $24,999 | 0 (0.0%) | 0 (0.0%) |
| $25,000 to $34,999 | 1 (1.8%) | 0 (0.0%) |
| $35,000 to $49,999 | 5 (8.9%) | 0 (0.0%) |
| $50,000 to $74,999 | 16 (28.6%) | 6 (46.2%) |
| $75,000 to $99,999 | 8 (14.3%) | 7 (53.8%) |
| $100,000 to $149,999 | 14 (25.0%) | 0 (0.0%) |
| $150,000 or more | 0 (0.0%) | 0 (0.0%) |
| Total | 56 (100.0%) | 13 (100.0%) |
Monthly Housing Cost Tiers in Ensign
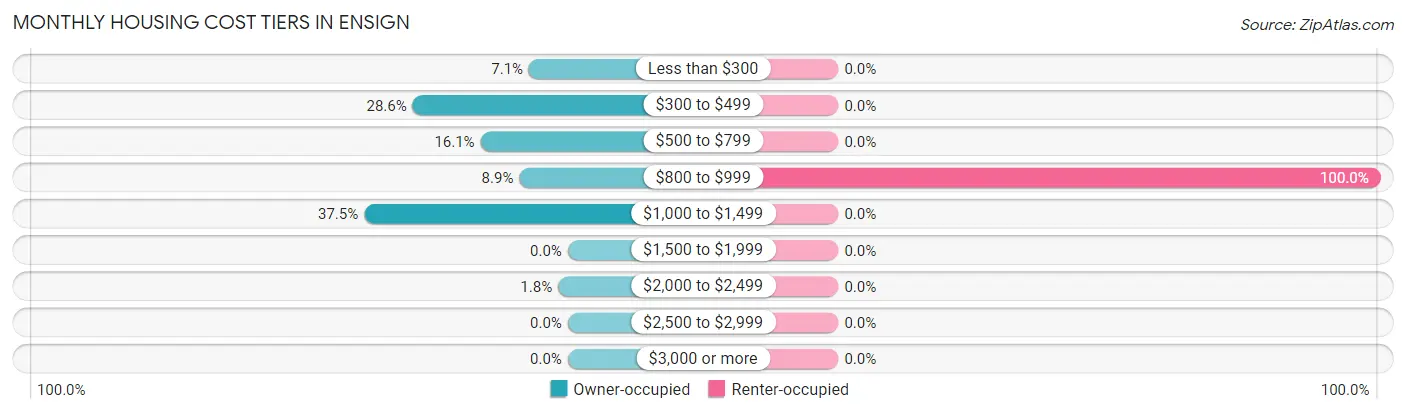
| Monthly Cost | Owner-occupied | Renter-occupied |
| Less than $300 | 4 (7.1%) | 0 (0.0%) |
| $300 to $499 | 16 (28.6%) | 0 (0.0%) |
| $500 to $799 | 9 (16.1%) | 0 (0.0%) |
| $800 to $999 | 5 (8.9%) | 13 (100.0%) |
| $1,000 to $1,499 | 21 (37.5%) | 0 (0.0%) |
| $1,500 to $1,999 | 0 (0.0%) | 0 (0.0%) |
| $2,000 to $2,499 | 1 (1.8%) | 0 (0.0%) |
| $2,500 to $2,999 | 0 (0.0%) | 0 (0.0%) |
| $3,000 or more | 0 (0.0%) | 0 (0.0%) |
| Total | 56 (100.0%) | 13 (100.0%) |
Physical Housing Characteristics in Ensign
Housing Structures in Ensign
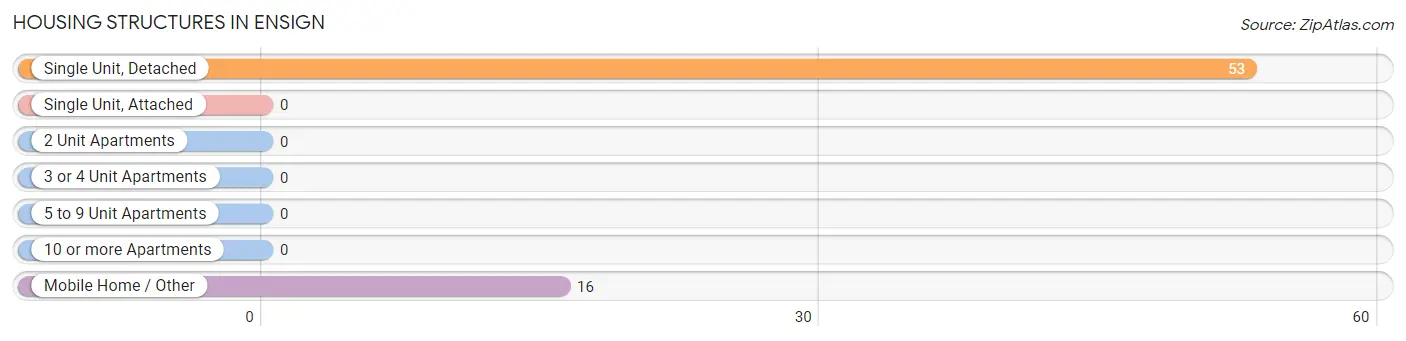
| Structure Type | # Housing Units | % Housing Units |
| Single Unit, Detached | 53 | 76.8% |
| Single Unit, Attached | 0 | 0.0% |
| 2 Unit Apartments | 0 | 0.0% |
| 3 or 4 Unit Apartments | 0 | 0.0% |
| 5 to 9 Unit Apartments | 0 | 0.0% |
| 10 or more Apartments | 0 | 0.0% |
| Mobile Home / Other | 16 | 23.2% |
| Total | 69 | 100.0% |
Housing Structures by Occupancy in Ensign
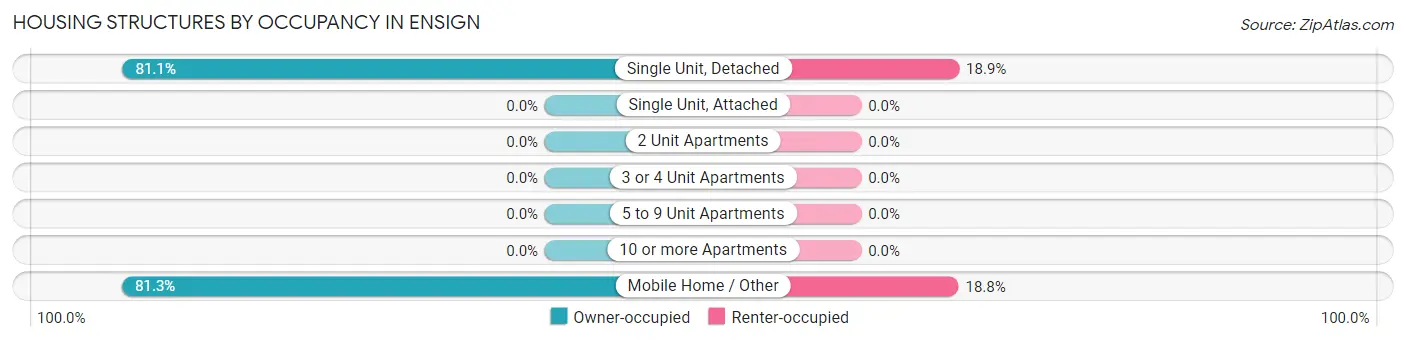
| Structure Type | Owner-occupied | Renter-occupied |
| Single Unit, Detached | 43 (81.1%) | 10 (18.9%) |
| Single Unit, Attached | 0 (0.0%) | 0 (0.0%) |
| 2 Unit Apartments | 0 (0.0%) | 0 (0.0%) |
| 3 or 4 Unit Apartments | 0 (0.0%) | 0 (0.0%) |
| 5 to 9 Unit Apartments | 0 (0.0%) | 0 (0.0%) |
| 10 or more Apartments | 0 (0.0%) | 0 (0.0%) |
| Mobile Home / Other | 13 (81.2%) | 3 (18.8%) |
| Total | 56 (81.2%) | 13 (18.8%) |
Housing Structures by Number of Rooms in Ensign
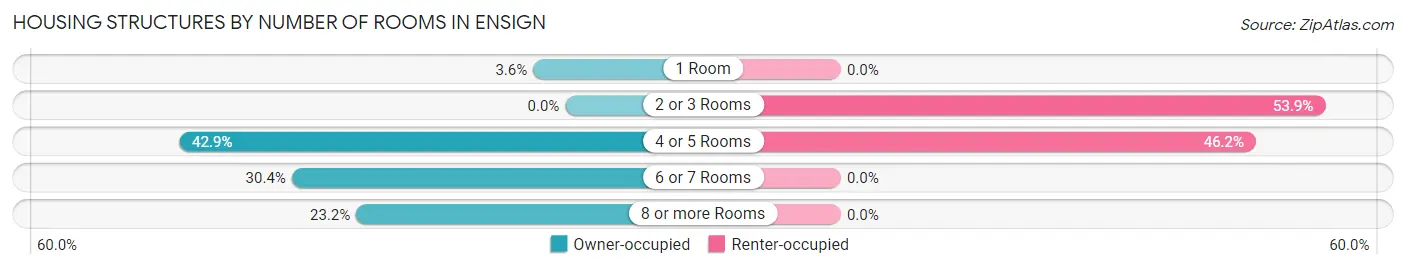
| Number of Rooms | Owner-occupied | Renter-occupied |
| 1 Room | 2 (3.6%) | 0 (0.0%) |
| 2 or 3 Rooms | 0 (0.0%) | 7 (53.8%) |
| 4 or 5 Rooms | 24 (42.9%) | 6 (46.2%) |
| 6 or 7 Rooms | 17 (30.4%) | 0 (0.0%) |
| 8 or more Rooms | 13 (23.2%) | 0 (0.0%) |
| Total | 56 (100.0%) | 13 (100.0%) |
Housing Structure by Heating Type in Ensign
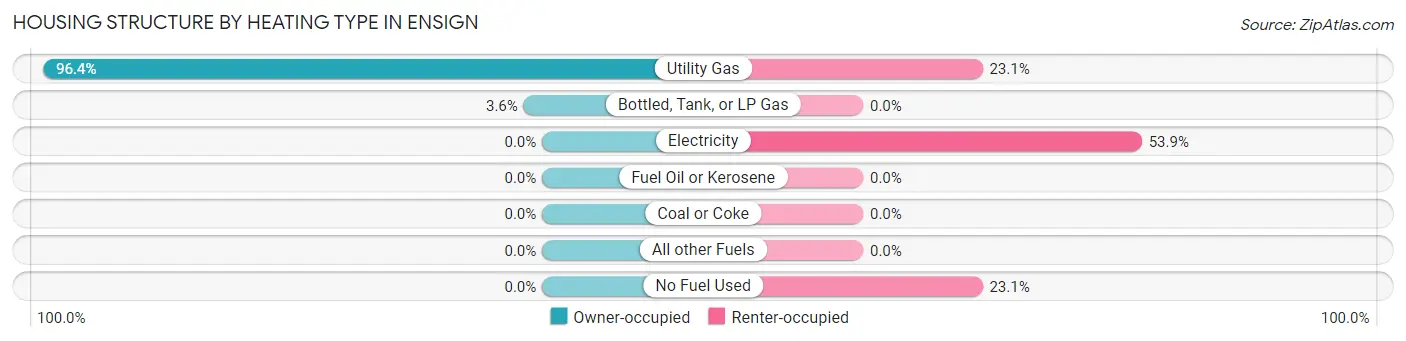
| Heating Type | Owner-occupied | Renter-occupied |
| Utility Gas | 54 (96.4%) | 3 (23.1%) |
| Bottled, Tank, or LP Gas | 2 (3.6%) | 0 (0.0%) |
| Electricity | 0 (0.0%) | 7 (53.8%) |
| Fuel Oil or Kerosene | 0 (0.0%) | 0 (0.0%) |
| Coal or Coke | 0 (0.0%) | 0 (0.0%) |
| All other Fuels | 0 (0.0%) | 0 (0.0%) |
| No Fuel Used | 0 (0.0%) | 3 (23.1%) |
| Total | 56 (100.0%) | 13 (100.0%) |
Household Vehicle Usage in Ensign
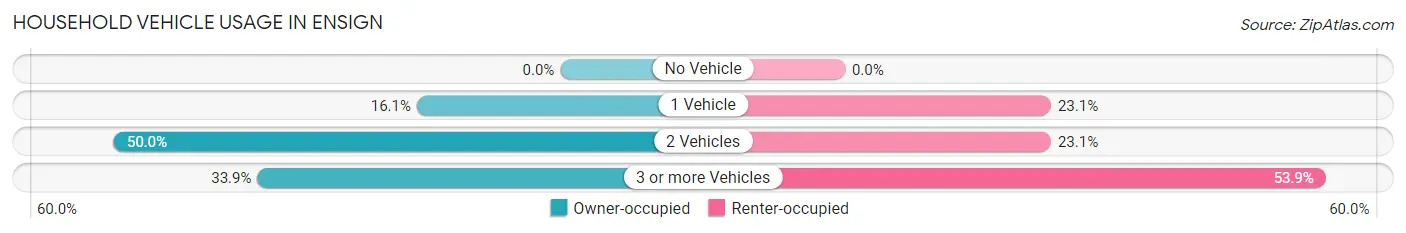
| Vehicles per Household | Owner-occupied | Renter-occupied |
| No Vehicle | 0 (0.0%) | 0 (0.0%) |
| 1 Vehicle | 9 (16.1%) | 3 (23.1%) |
| 2 Vehicles | 28 (50.0%) | 3 (23.1%) |
| 3 or more Vehicles | 19 (33.9%) | 7 (53.8%) |
| Total | 56 (100.0%) | 13 (100.0%) |
Real Estate & Mortgages in Ensign
Real Estate and Mortgage Overview in Ensign
| Characteristic | Without Mortgage | With Mortgage |
| Housing Units | 30 | 26 |
| Median Property Value | - | - |
| Median Household Income | $60,000 | $0 |
| Monthly Housing Costs | $458 | $0 |
| Real Estate Taxes | $760 | $0 |
Property Value by Mortgage Status in Ensign
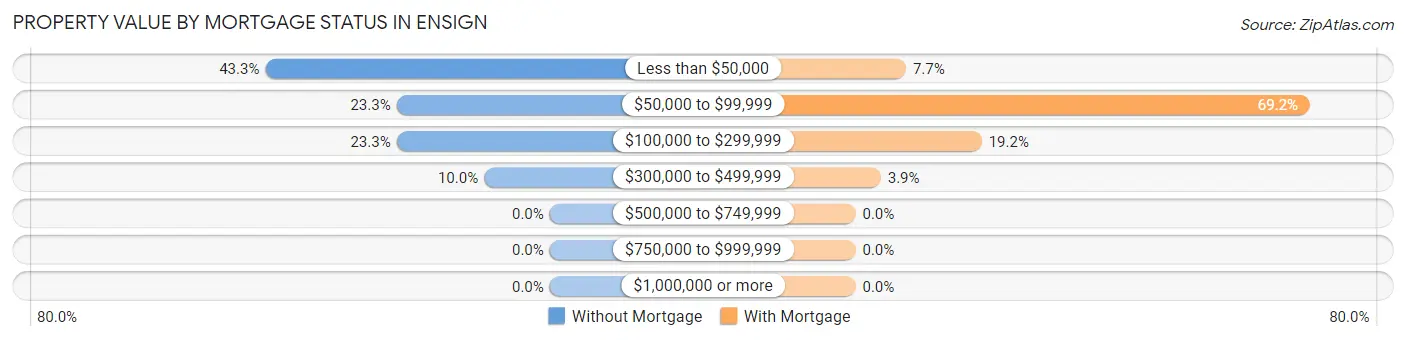
| Property Value | Without Mortgage | With Mortgage |
| Less than $50,000 | 13 (43.3%) | 2 (7.7%) |
| $50,000 to $99,999 | 7 (23.3%) | 18 (69.2%) |
| $100,000 to $299,999 | 7 (23.3%) | 5 (19.2%) |
| $300,000 to $499,999 | 3 (10.0%) | 1 (3.8%) |
| $500,000 to $749,999 | 0 (0.0%) | 0 (0.0%) |
| $750,000 to $999,999 | 0 (0.0%) | 0 (0.0%) |
| $1,000,000 or more | 0 (0.0%) | 0 (0.0%) |
| Total | 30 (100.0%) | 26 (100.0%) |
Household Income by Mortgage Status in Ensign
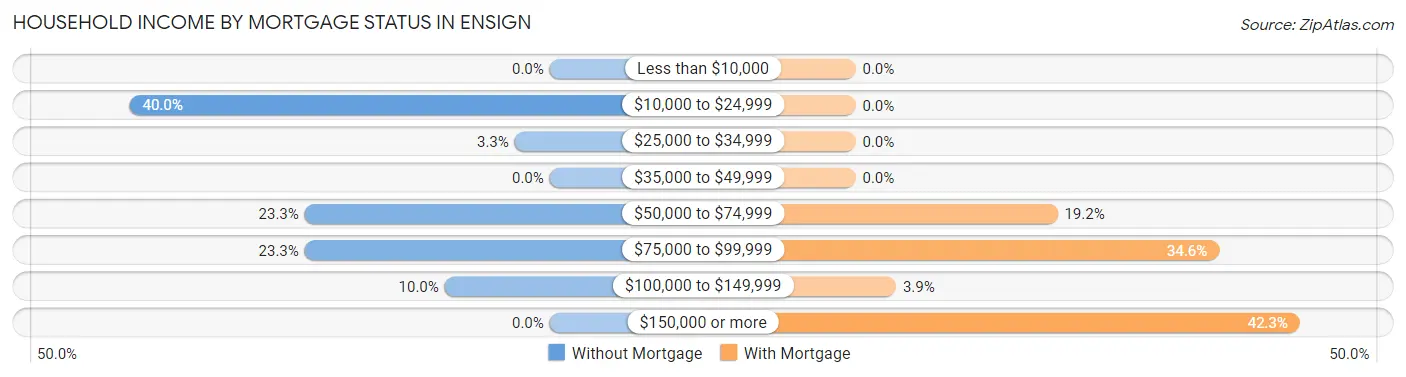
| Household Income | Without Mortgage | With Mortgage |
| Less than $10,000 | 0 (0.0%) | 0 (0.0%) |
| $10,000 to $24,999 | 12 (40.0%) | 0 (0.0%) |
| $25,000 to $34,999 | 1 (3.3%) | 0 (0.0%) |
| $35,000 to $49,999 | 0 (0.0%) | 0 (0.0%) |
| $50,000 to $74,999 | 7 (23.3%) | 5 (19.2%) |
| $75,000 to $99,999 | 7 (23.3%) | 9 (34.6%) |
| $100,000 to $149,999 | 3 (10.0%) | 1 (3.8%) |
| $150,000 or more | 0 (0.0%) | 11 (42.3%) |
| Total | 30 (100.0%) | 26 (100.0%) |
Property Value to Household Income Ratio in Ensign
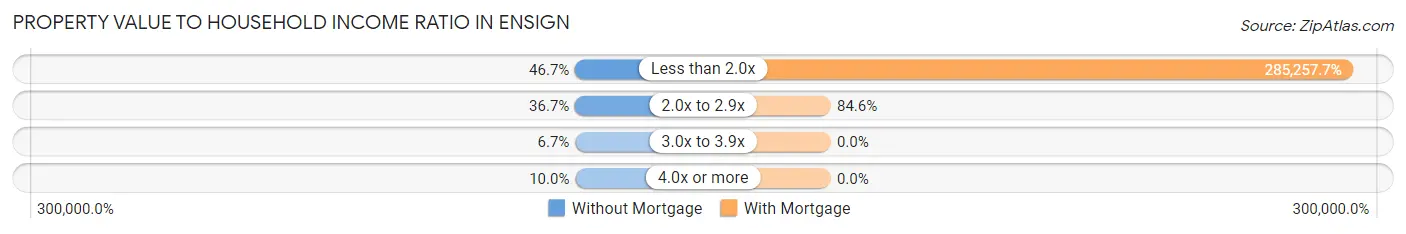
| Value-to-Income Ratio | Without Mortgage | With Mortgage |
| Less than 2.0x | 14 (46.7%) | 74,167 (285,257.7%) |
| 2.0x to 2.9x | 11 (36.7%) | 22 (84.6%) |
| 3.0x to 3.9x | 2 (6.7%) | 0 (0.0%) |
| 4.0x or more | 3 (10.0%) | 0 (0.0%) |
| Total | 30 (100.0%) | 26 (100.0%) |
Real Estate Taxes by Mortgage Status in Ensign
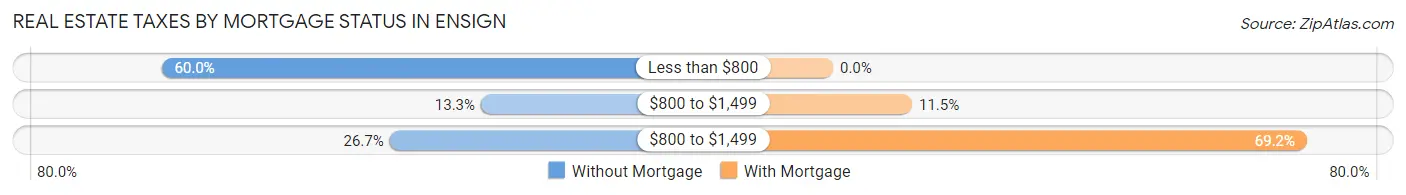
| Property Taxes | Without Mortgage | With Mortgage |
| Less than $800 | 18 (60.0%) | 0 (0.0%) |
| $800 to $1,499 | 4 (13.3%) | 3 (11.5%) |
| $800 to $1,499 | 8 (26.7%) | 18 (69.2%) |
| Total | 30 (100.0%) | 26 (100.0%) |
Health & Disability in Ensign
Health Insurance Coverage by Age in Ensign
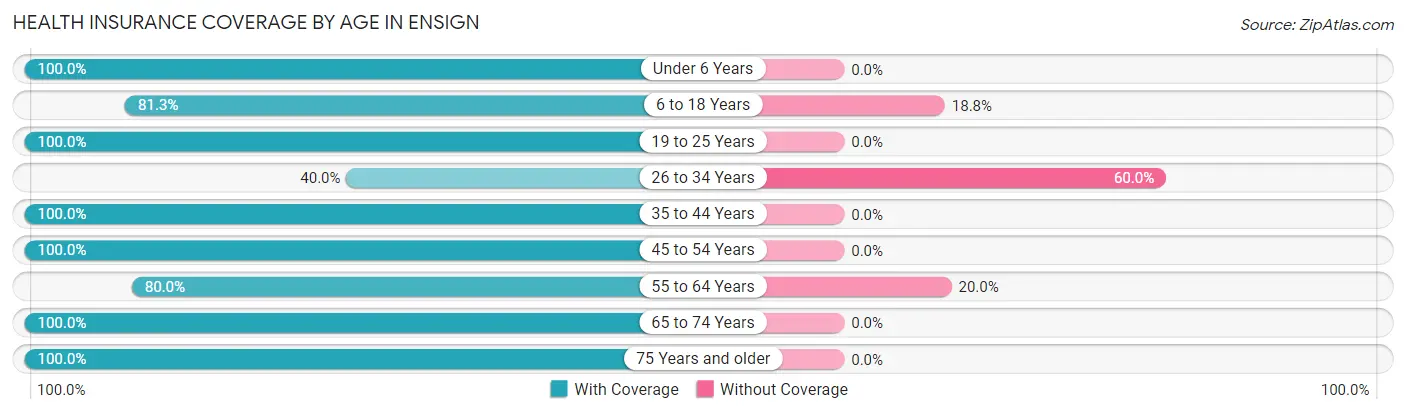
| Age Bracket | With Coverage | Without Coverage |
| Under 6 Years | 1 (100.0%) | 0 (0.0%) |
| 6 to 18 Years | 13 (81.2%) | 3 (18.8%) |
| 19 to 25 Years | 44 (100.0%) | 0 (0.0%) |
| 26 to 34 Years | 2 (40.0%) | 3 (60.0%) |
| 35 to 44 Years | 1 (100.0%) | 0 (0.0%) |
| 45 to 54 Years | 24 (100.0%) | 0 (0.0%) |
| 55 to 64 Years | 16 (80.0%) | 4 (20.0%) |
| 65 to 74 Years | 19 (100.0%) | 0 (0.0%) |
| 75 Years and older | 10 (100.0%) | 0 (0.0%) |
| Total | 130 (92.9%) | 10 (7.1%) |
Health Insurance Coverage by Citizenship Status in Ensign
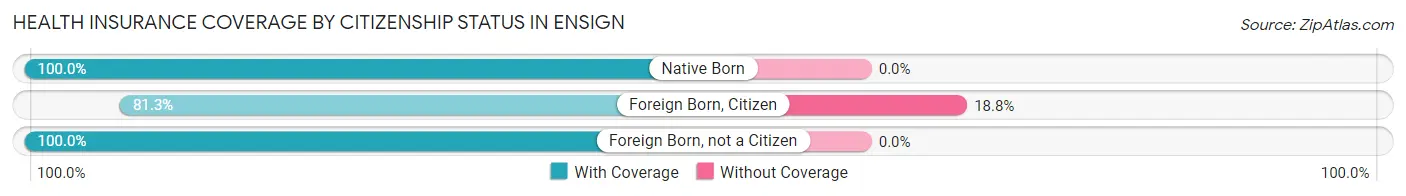
| Citizenship Status | With Coverage | Without Coverage |
| Native Born | 1 (100.0%) | 0 (0.0%) |
| Foreign Born, Citizen | 13 (81.2%) | 3 (18.8%) |
| Foreign Born, not a Citizen | 44 (100.0%) | 0 (0.0%) |
Health Insurance Coverage by Household Income in Ensign
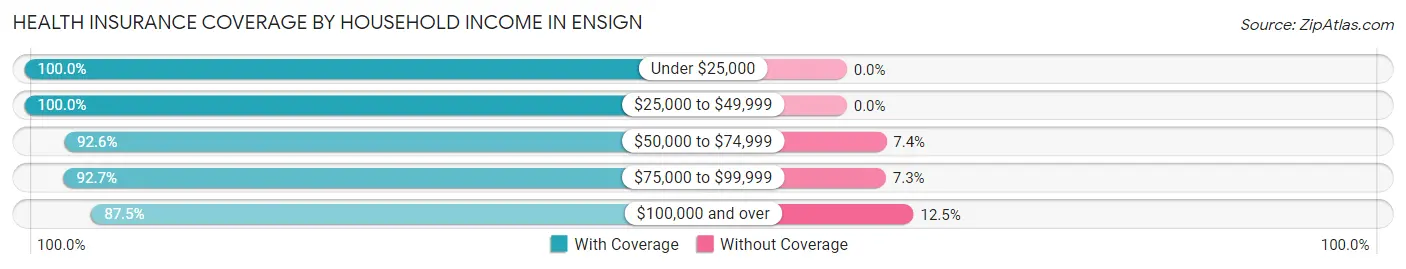
| Household Income | With Coverage | Without Coverage |
| Under $25,000 | 12 (100.0%) | 0 (0.0%) |
| $25,000 to $49,999 | 9 (100.0%) | 0 (0.0%) |
| $50,000 to $74,999 | 50 (92.6%) | 4 (7.4%) |
| $75,000 to $99,999 | 38 (92.7%) | 3 (7.3%) |
| $100,000 and over | 21 (87.5%) | 3 (12.5%) |
Public vs Private Health Insurance Coverage by Age in Ensign
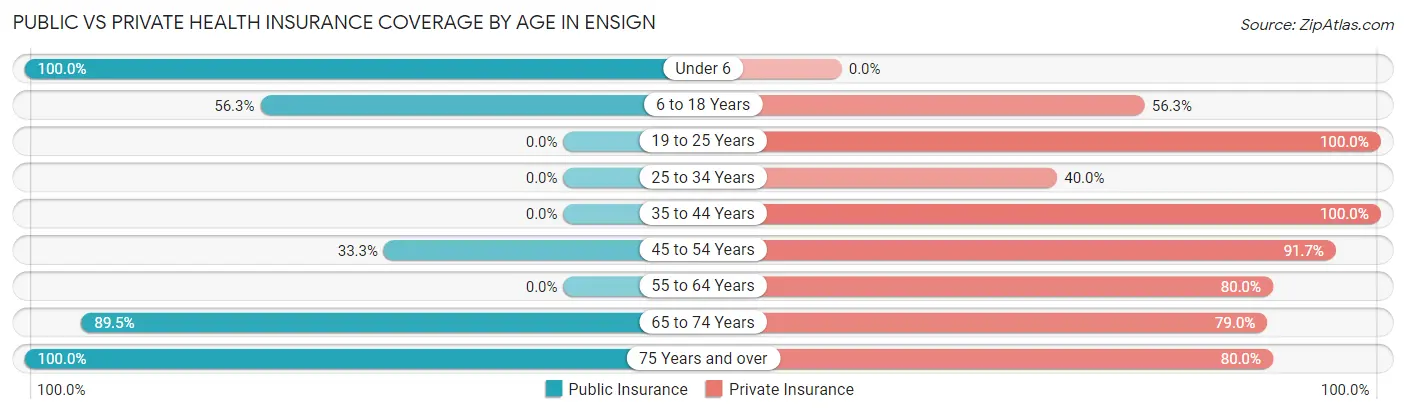
| Age Bracket | Public Insurance | Private Insurance |
| Under 6 | 1 (100.0%) | 0 (0.0%) |
| 6 to 18 Years | 9 (56.2%) | 9 (56.2%) |
| 19 to 25 Years | 0 (0.0%) | 44 (100.0%) |
| 25 to 34 Years | 0 (0.0%) | 2 (40.0%) |
| 35 to 44 Years | 0 (0.0%) | 1 (100.0%) |
| 45 to 54 Years | 8 (33.3%) | 22 (91.7%) |
| 55 to 64 Years | 0 (0.0%) | 16 (80.0%) |
| 65 to 74 Years | 17 (89.5%) | 15 (78.9%) |
| 75 Years and over | 10 (100.0%) | 8 (80.0%) |
| Total | 45 (32.1%) | 117 (83.6%) |
Disability Status by Sex by Age in Ensign
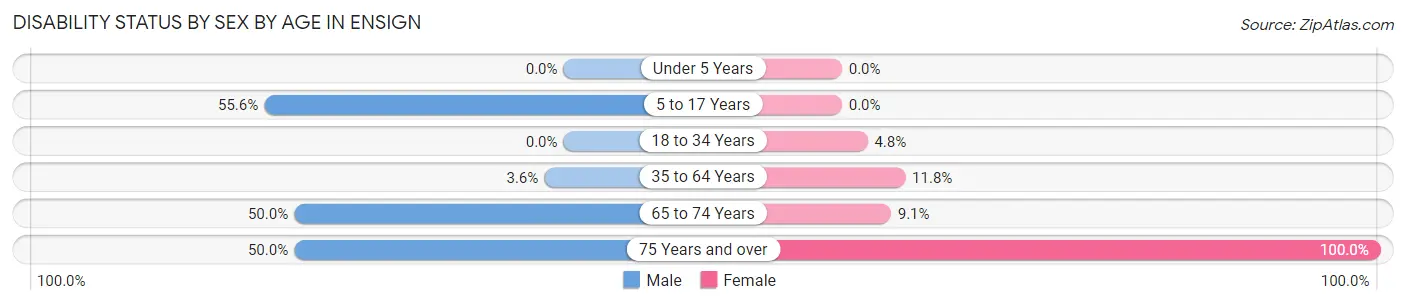
| Age Bracket | Male | Female |
| Under 5 Years | 0 (0.0%) | 0 (0.0%) |
| 5 to 17 Years | 5 (55.6%) | 0 (0.0%) |
| 18 to 34 Years | 0 (0.0%) | 1 (4.8%) |
| 35 to 64 Years | 1 (3.6%) | 2 (11.8%) |
| 65 to 74 Years | 4 (50.0%) | 1 (9.1%) |
| 75 Years and over | 4 (50.0%) | 2 (100.0%) |
Disability Class by Sex by Age in Ensign
Disability Class: Hearing Difficulty
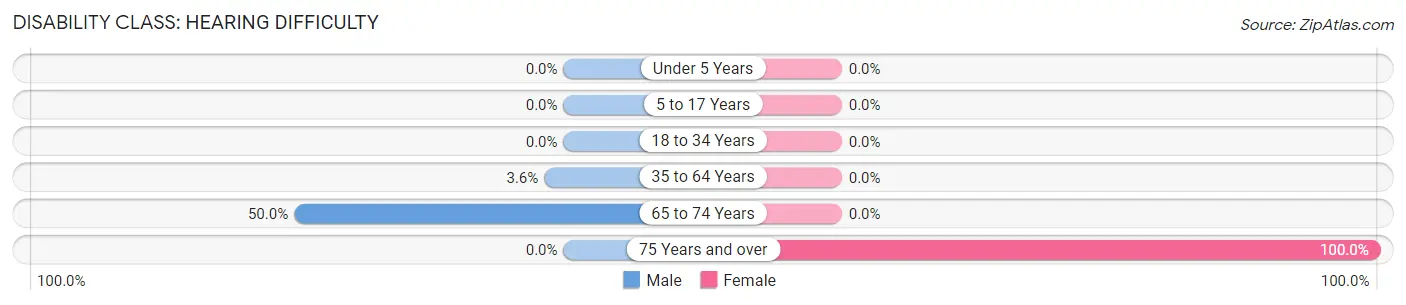
| Age Bracket | Male | Female |
| Under 5 Years | 0 (0.0%) | 0 (0.0%) |
| 5 to 17 Years | 0 (0.0%) | 0 (0.0%) |
| 18 to 34 Years | 0 (0.0%) | 0 (0.0%) |
| 35 to 64 Years | 1 (3.6%) | 0 (0.0%) |
| 65 to 74 Years | 4 (50.0%) | 0 (0.0%) |
| 75 Years and over | 0 (0.0%) | 2 (100.0%) |
Disability Class: Vision Difficulty
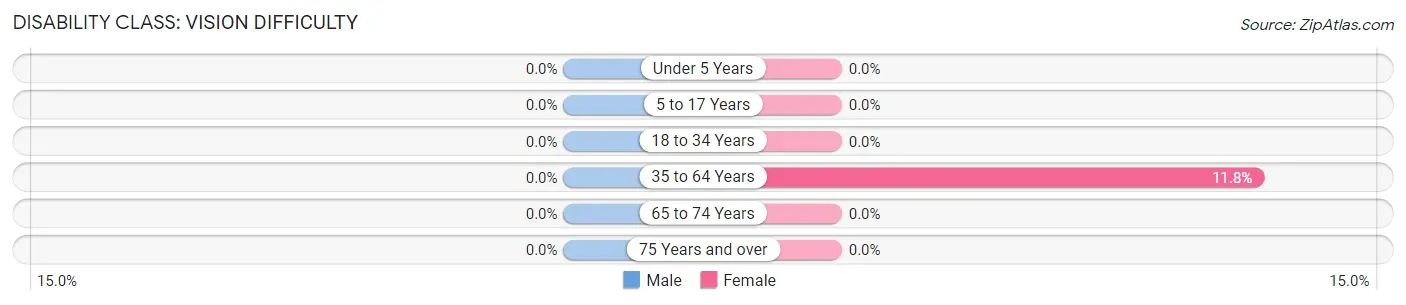
| Age Bracket | Male | Female |
| Under 5 Years | 0 (0.0%) | 0 (0.0%) |
| 5 to 17 Years | 0 (0.0%) | 0 (0.0%) |
| 18 to 34 Years | 0 (0.0%) | 0 (0.0%) |
| 35 to 64 Years | 0 (0.0%) | 2 (11.8%) |
| 65 to 74 Years | 0 (0.0%) | 0 (0.0%) |
| 75 Years and over | 0 (0.0%) | 0 (0.0%) |
Disability Class: Cognitive Difficulty
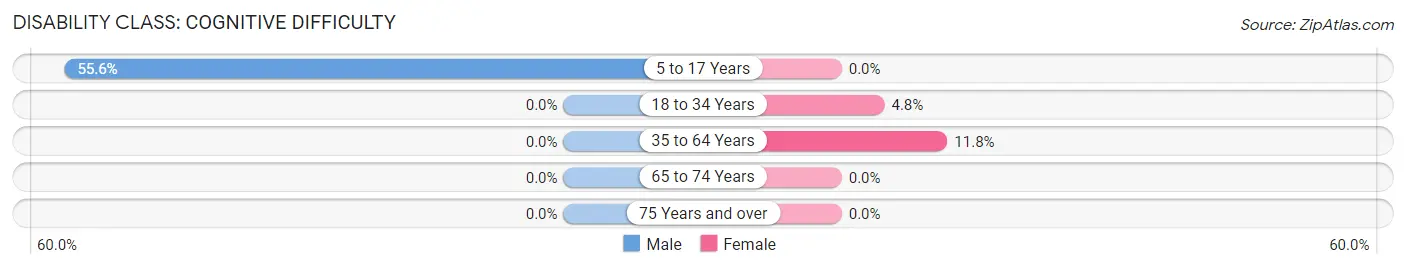
| Age Bracket | Male | Female |
| 5 to 17 Years | 5 (55.6%) | 0 (0.0%) |
| 18 to 34 Years | 0 (0.0%) | 1 (4.8%) |
| 35 to 64 Years | 0 (0.0%) | 2 (11.8%) |
| 65 to 74 Years | 0 (0.0%) | 0 (0.0%) |
| 75 Years and over | 0 (0.0%) | 0 (0.0%) |
Disability Class: Ambulatory Difficulty
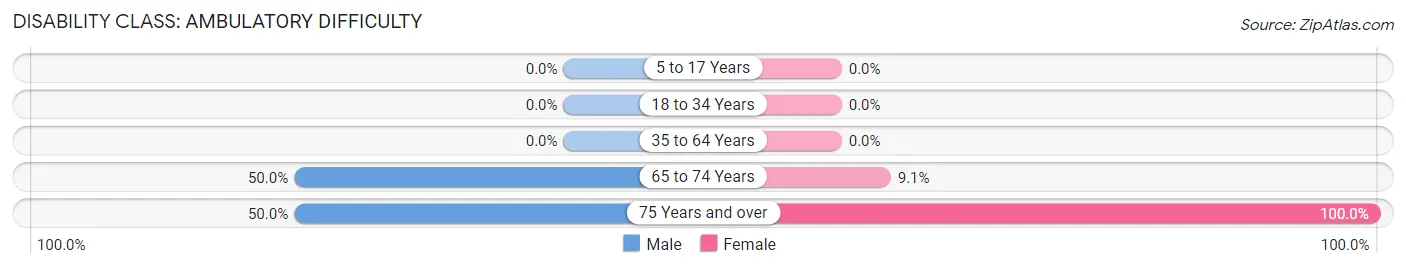
| Age Bracket | Male | Female |
| 5 to 17 Years | 0 (0.0%) | 0 (0.0%) |
| 18 to 34 Years | 0 (0.0%) | 0 (0.0%) |
| 35 to 64 Years | 0 (0.0%) | 0 (0.0%) |
| 65 to 74 Years | 4 (50.0%) | 1 (9.1%) |
| 75 Years and over | 4 (50.0%) | 2 (100.0%) |
Disability Class: Self-Care Difficulty
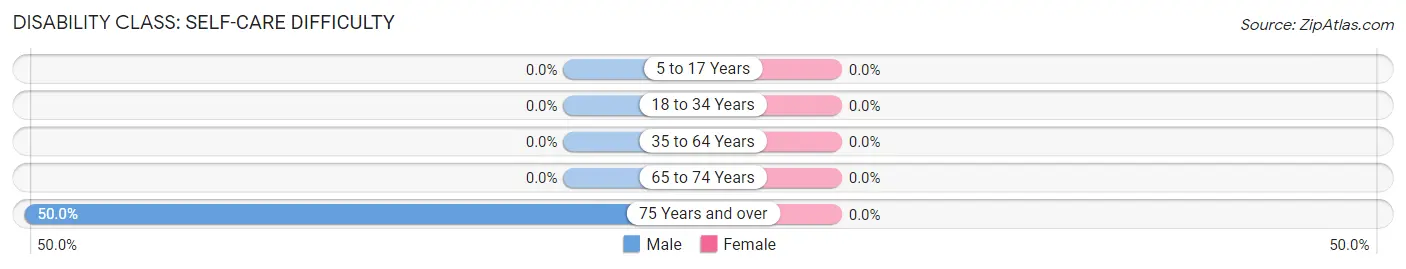
| Age Bracket | Male | Female |
| 5 to 17 Years | 0 (0.0%) | 0 (0.0%) |
| 18 to 34 Years | 0 (0.0%) | 0 (0.0%) |
| 35 to 64 Years | 0 (0.0%) | 0 (0.0%) |
| 65 to 74 Years | 0 (0.0%) | 0 (0.0%) |
| 75 Years and over | 4 (50.0%) | 0 (0.0%) |
Technology Access in Ensign
Computing Device Access in Ensign
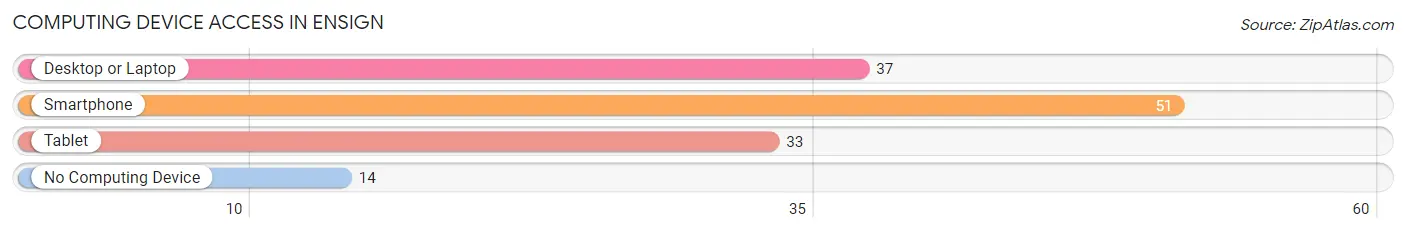
| Device Type | # Households | % Households |
| Desktop or Laptop | 37 | 53.6% |
| Smartphone | 51 | 73.9% |
| Tablet | 33 | 47.8% |
| No Computing Device | 14 | 20.3% |
| Total | 69 | 100.0% |
Internet Access in Ensign
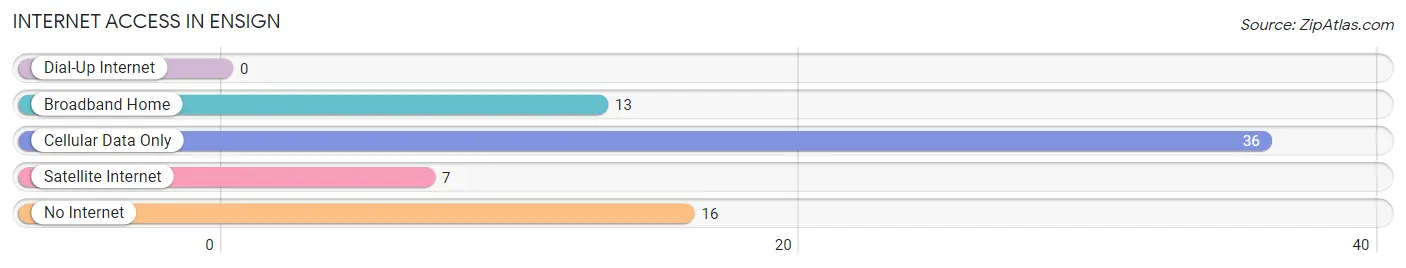
| Internet Type | # Households | % Households |
| Dial-Up Internet | 0 | 0.0% |
| Broadband Home | 13 | 18.8% |
| Cellular Data Only | 36 | 52.2% |
| Satellite Internet | 7 | 10.1% |
| No Internet | 16 | 23.2% |
| Total | 69 | 100.0% |
Ensign Summary
Ensign is a small town located in the southwestern corner of Kansas, in the county of Gray. It is situated on the banks of the Arkansas River, and is surrounded by rolling hills and prairies. The town has a population of just over 500 people, and is known for its rural charm and friendly atmosphere.
History
Ensign was founded in 1887 by a group of settlers from the nearby town of Cimarron. The town was named after the Ensign family, who were among the first settlers. The town quickly grew, and by the early 1900s, it had become a thriving agricultural community. The town was home to several businesses, including a general store, a blacksmith, a hotel, and a bank.
In the early 1900s, Ensign was also home to a large number of Native American tribes, including the Kiowa, Comanche, and Apache. The town was a popular trading post for the tribes, and many of the settlers in the area were of Native American descent.
In the 1920s, Ensign experienced a period of growth and prosperity. The town was home to several businesses, including a movie theater, a bank, and a hotel. The town also had a thriving agricultural industry, and was home to several large farms.
In the 1950s, Ensign began to decline. The town's population began to decline, and many of the businesses closed. The town was also hit hard by the Dust Bowl, and many of the farms in the area were abandoned.
In the late 1970s, Ensign began to experience a resurgence. The town was revitalized by the construction of a new school, and the opening of a new grocery store. The town also began to attract new businesses, and the population began to grow again.
Geography
Ensign is located in the southwestern corner of Kansas, in the county of Gray. The town is situated on the banks of the Arkansas River, and is surrounded by rolling hills and prairies. The town has a total area of 0.7 square miles, and is located at an elevation of 1,845 feet.
The climate in Ensign is semi-arid, with hot summers and cold winters. The average annual temperature is around 60 degrees Fahrenheit, and the average annual precipitation is around 18 inches.
Economy
Ensign's economy is largely based on agriculture. The town is home to several large farms, and the surrounding area is known for its production of wheat, corn, and other grains. The town is also home to several small businesses, including a grocery store, a hardware store, and a restaurant.
The town is also home to a number of tourist attractions, including the Ensign Museum, which houses artifacts from the town's history, and the Ensign Historical Society, which offers tours of the town.
Demographics
As of the 2010 census, Ensign had a population of 517 people. The racial makeup of the town was 97.3% White, 0.6% Native American, 0.2% Asian, 0.2% from other races, and 1.7% from two or more races. The median household income was $37,500, and the median family income was $41,250.
Ensign is a small, rural town with a friendly atmosphere and a strong sense of community. The town is home to a diverse population, and is known for its rural charm and friendly atmosphere.
Common Questions
What is Per Capita Income in Ensign?
Per Capita income in Ensign is $33,784.
What is the Median Family Income in Ensign?
Median Family Income in Ensign is $85,000.
What is the Median Household income in Ensign?
Median Household Income in Ensign is $70,417.
What is Income or Wage Gap in Ensign?
Income or Wage Gap in Ensign is 18.8%.
Women in Ensign earn 81.2 cents for every dollar earned by a man.
What is Inequality or Gini Index in Ensign?
Inequality or Gini Index in Ensign is 0.27.
What is the Total Population of Ensign?
Total Population of Ensign is 140.
What is the Total Male Population of Ensign?
Total Male Population of Ensign is 87.
What is the Total Female Population of Ensign?
Total Female Population of Ensign is 53.
What is the Ratio of Males per 100 Females in Ensign?
There are 164.15 Males per 100 Females in Ensign.
What is the Ratio of Females per 100 Males in Ensign?
There are 60.92 Females per 100 Males in Ensign.
What is the Median Population Age in Ensign?
Median Population Age in Ensign is 45.6 Years.
What is the Average Family Size in Ensign
Average Family Size in Ensign is 2.5 People.
What is the Average Household Size in Ensign
Average Household Size in Ensign is 2.0 People.
How Large is the Labor Force in Ensign?
There are 99 People in the Labor Forcein in Ensign.
What is the Percentage of People in the Labor Force in Ensign?
76.2% of People are in the Labor Force in Ensign.
What is the Unemployment Rate in Ensign?
Unemployment Rate in Ensign is 9.1%.