Fort Scott, KS Map & Demographics
Fort Scott Map
Fort Scott Overview
$27,897
PER CAPITA INCOME
$71,250
AVG FAMILY INCOME
$45,206
AVG HOUSEHOLD INCOME
35.1%
WAGE / INCOME GAP [ % ]
64.9¢/ $1
WAGE / INCOME GAP [ $ ]
$11,712
FAMILY INCOME DEFICIT
0.44
INEQUALITY / GINI INDEX
7,569
TOTAL POPULATION
3,454
MALE POPULATION
4,115
FEMALE POPULATION
83.94
MALES / 100 FEMALES
119.14
FEMALES / 100 MALES
38.3
MEDIAN AGE
2.7
AVG FAMILY SIZE
2.1
AVG HOUSEHOLD SIZE
3,364
LABOR FORCE [ PEOPLE ]
56.0%
PERCENT IN LABOR FORCE
4.5%
UNEMPLOYMENT RATE
Fort Scott Zip Codes
Fort Scott Area Codes
Income in Fort Scott
Income Overview in Fort Scott
Per Capita Income in Fort Scott is $27,897, while median incomes of families and households are $71,250 and $45,206 respectively.
| Characteristic | Number | Measure |
| Per Capita Income | 7,569 | $27,897 |
| Median Family Income | 1,973 | $71,250 |
| Mean Family Income | 1,973 | $76,933 |
| Median Household Income | 3,470 | $45,206 |
| Mean Household Income | 3,470 | $63,361 |
| Income Deficit | 1,973 | $11,712 |
| Wage / Income Gap (%) | 7,569 | 35.13% |
| Wage / Income Gap ($) | 7,569 | 64.87¢ per $1 |
| Gini / Inequality Index | 7,569 | 0.44 |
Earnings by Sex in Fort Scott
Average Earnings in Fort Scott are $31,860, $36,528 for men and $23,696 for women, a difference of 35.1%.
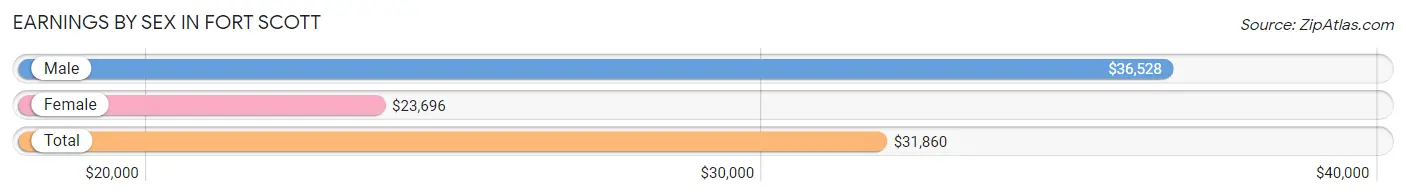
| Sex | Number | Average Earnings |
| Male | 1,845 (49.7%) | $36,528 |
| Female | 1,870 (50.3%) | $23,696 |
| Total | 3,715 (100.0%) | $31,860 |
Earnings by Sex by Income Bracket in Fort Scott
The most common earnings brackets in Fort Scott are $35,000 to $39,999 for men (267 | 14.5%) and $30,000 to $34,999 for women (188 | 10.1%).
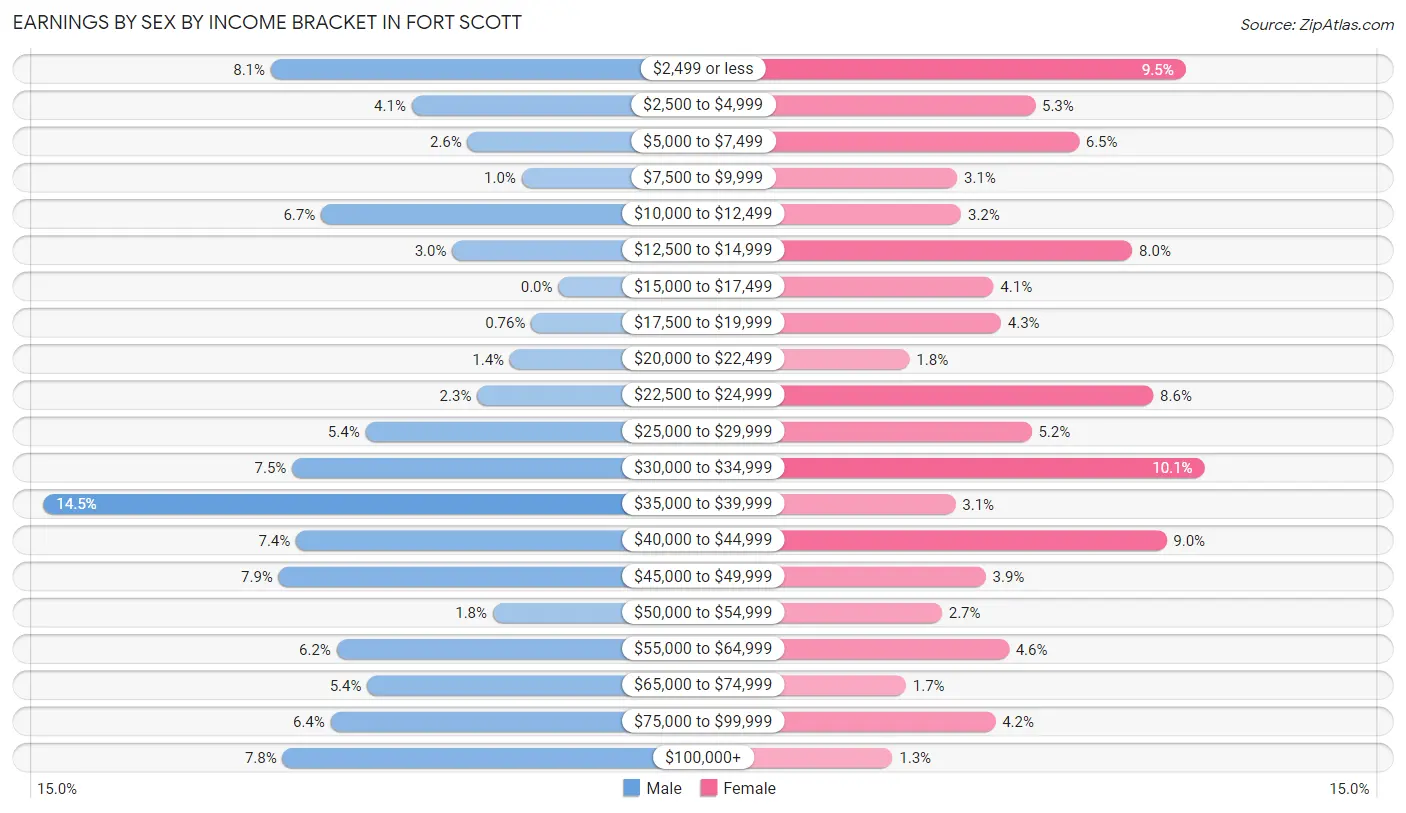
| Income | Male | Female |
| $2,499 or less | 149 (8.1%) | 178 (9.5%) |
| $2,500 to $4,999 | 76 (4.1%) | 99 (5.3%) |
| $5,000 to $7,499 | 47 (2.5%) | 122 (6.5%) |
| $7,500 to $9,999 | 19 (1.0%) | 58 (3.1%) |
| $10,000 to $12,499 | 123 (6.7%) | 60 (3.2%) |
| $12,500 to $14,999 | 55 (3.0%) | 150 (8.0%) |
| $15,000 to $17,499 | 0 (0.0%) | 77 (4.1%) |
| $17,500 to $19,999 | 14 (0.8%) | 81 (4.3%) |
| $20,000 to $22,499 | 25 (1.4%) | 33 (1.8%) |
| $22,500 to $24,999 | 42 (2.3%) | 161 (8.6%) |
| $25,000 to $29,999 | 100 (5.4%) | 97 (5.2%) |
| $30,000 to $34,999 | 138 (7.5%) | 188 (10.1%) |
| $35,000 to $39,999 | 267 (14.5%) | 57 (3.0%) |
| $40,000 to $44,999 | 136 (7.4%) | 168 (9.0%) |
| $45,000 to $49,999 | 145 (7.9%) | 73 (3.9%) |
| $50,000 to $54,999 | 34 (1.8%) | 50 (2.7%) |
| $55,000 to $64,999 | 115 (6.2%) | 85 (4.5%) |
| $65,000 to $74,999 | 99 (5.4%) | 31 (1.7%) |
| $75,000 to $99,999 | 118 (6.4%) | 78 (4.2%) |
| $100,000+ | 143 (7.7%) | 24 (1.3%) |
| Total | 1,845 (100.0%) | 1,870 (100.0%) |
Earnings by Sex by Educational Attainment in Fort Scott
Average earnings in Fort Scott are $40,176 for men and $26,563 for women, a difference of 33.9%. Men with an educational attainment of graduate degree enjoy the highest average annual earnings of $44,750, while those with high school diploma education earn the least with $36,379. Women with an educational attainment of graduate degree earn the most with the average annual earnings of $48,333, while those with less than high school education have the smallest earnings of $13,472.
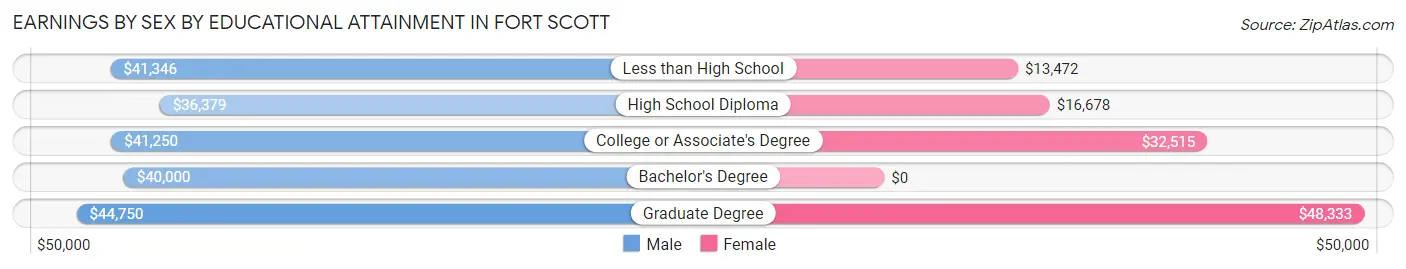
| Educational Attainment | Male Income | Female Income |
| Less than High School | $41,346 | $13,472 |
| High School Diploma | $36,379 | $16,678 |
| College or Associate's Degree | $41,250 | $32,515 |
| Bachelor's Degree | $40,000 | $0 |
| Graduate Degree | $44,750 | $48,333 |
| Total | $40,176 | $26,563 |
Family Income in Fort Scott
Family Income Brackets in Fort Scott
According to the Fort Scott family income data, there are 468 families falling into the $50,000 to $74,999 income range, which is the most common income bracket and makes up 23.7% of all families. Conversely, the $200,000+ income bracket is the least frequent group with only 45 families (2.3%) belonging to this category.
| Income Bracket | # Families | % Families |
| Less than $10,000 | 49 | 2.5% |
| $10,000 to $14,999 | 61 | 3.1% |
| $15,000 to $24,999 | 77 | 3.9% |
| $25,000 to $34,999 | 152 | 7.7% |
| $35,000 to $49,999 | 339 | 17.2% |
| $50,000 to $74,999 | 468 | 23.7% |
| $75,000 to $99,999 | 361 | 18.3% |
| $100,000 to $149,999 | 312 | 15.8% |
| $150,000 to $199,999 | 109 | 5.5% |
| $200,000+ | 45 | 2.3% |
Family Income by Famaliy Size in Fort Scott
5-person families (115 | 5.8%) account for the highest median family income in Fort Scott with $88,274 per family, while 2-person families (1,234 | 62.5%) have the highest median income of $36,736 per family member.
| Income Bracket | # Families | Median Income |
| 2-Person Families | 1,234 (62.5%) | $73,471 |
| 3-Person Families | 282 (14.3%) | $56,071 |
| 4-Person Families | 222 (11.3%) | $59,712 |
| 5-Person Families | 115 (5.8%) | $88,274 |
| 6-Person Families | 87 (4.4%) | $51,354 |
| 7+ Person Families | 33 (1.7%) | $0 |
| Total | 1,973 (100.0%) | $71,250 |
Family Income by Number of Earners in Fort Scott
The median family income in Fort Scott is $71,250, with families comprising 2 earners (855) having the highest median family income of $89,821, while families with 1 earner (601) have the lowest median family income of $46,194, accounting for 43.3% and 30.5% of families, respectively.
| Number of Earners | # Families | Median Income |
| No Earners | 356 (18.0%) | $66,371 |
| 1 Earner | 601 (30.5%) | $46,194 |
| 2 Earners | 855 (43.3%) | $89,821 |
| 3+ Earners | 161 (8.2%) | $82,813 |
| Total | 1,973 (100.0%) | $71,250 |
Household Income in Fort Scott
Household Income Brackets in Fort Scott
With 621 households falling in the category, the $50,000 to $74,999 income range is the most frequent in Fort Scott, accounting for 17.9% of all households. In contrast, only 62 households (1.8%) fall into the $200,000+ income bracket, making it the least populous group.
| Income Bracket | # Households | % Households |
| Less than $10,000 | 167 | 4.8% |
| $10,000 to $14,999 | 194 | 5.6% |
| $15,000 to $24,999 | 427 | 12.3% |
| $25,000 to $34,999 | 552 | 15.9% |
| $35,000 to $49,999 | 520 | 15.0% |
| $50,000 to $74,999 | 621 | 17.9% |
| $75,000 to $99,999 | 475 | 13.7% |
| $100,000 to $149,999 | 337 | 9.7% |
| $150,000 to $199,999 | 118 | 3.4% |
| $200,000+ | 62 | 1.8% |
Household Income by Householder Age in Fort Scott
The median household income in Fort Scott is $45,206, with the highest median household income of $61,964 found in the 45 to 64 years age bracket for the primary householder. A total of 961 households (27.7%) fall into this category. Meanwhile, the 65+ years age bracket for the primary householder has the lowest median household income of $35,440, with 1,345 households (38.8%) in this group.
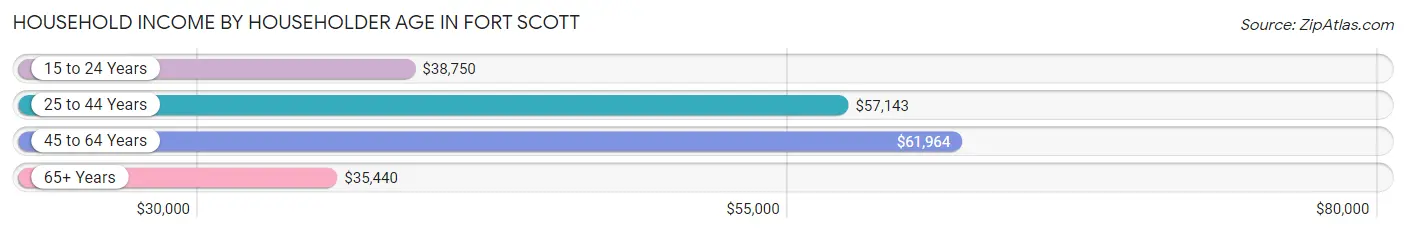
| Income Bracket | # Households | Median Income |
| 15 to 24 Years | 252 (7.3%) | $38,750 |
| 25 to 44 Years | 912 (26.3%) | $57,143 |
| 45 to 64 Years | 961 (27.7%) | $61,964 |
| 65+ Years | 1,345 (38.8%) | $35,440 |
| Total | 3,470 (100.0%) | $45,206 |
Poverty in Fort Scott
Income Below Poverty by Sex and Age in Fort Scott
With 13.0% poverty level for males and 17.5% for females among the residents of Fort Scott, 18 to 24 year old males and 6 to 11 year old females are the most vulnerable to poverty, with 110 males (42.6%) and 150 females (37.7%) in their respective age groups living below the poverty level.
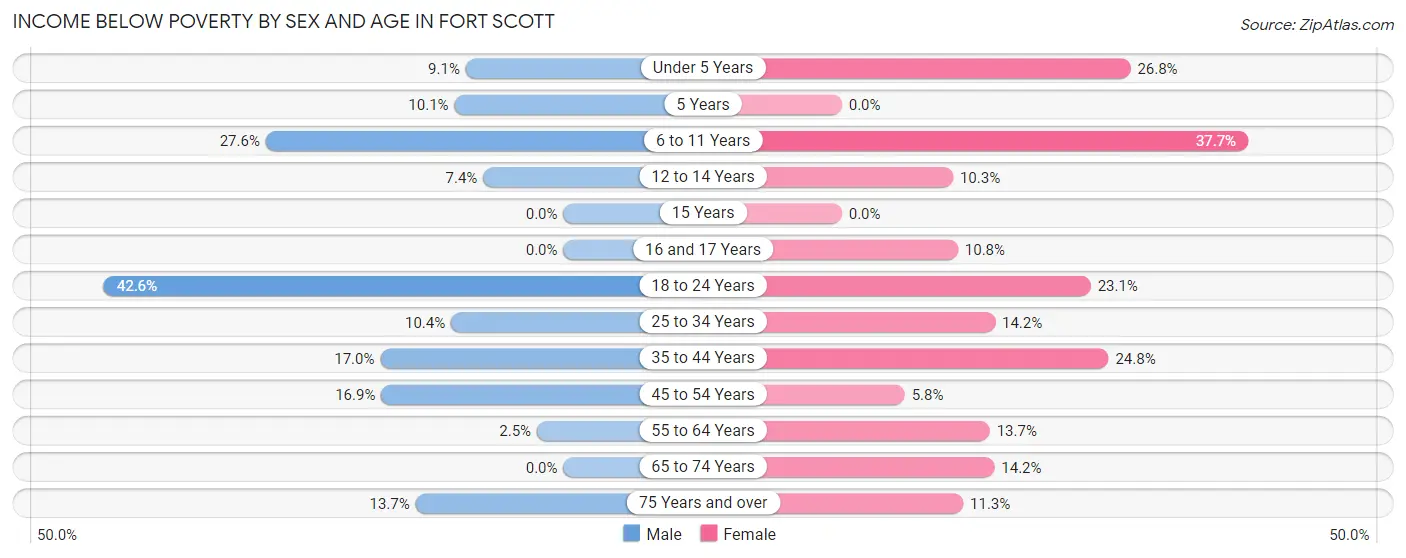
| Age Bracket | Male | Female |
| Under 5 Years | 25 (9.1%) | 56 (26.8%) |
| 5 Years | 9 (10.1%) | 0 (0.0%) |
| 6 to 11 Years | 58 (27.6%) | 150 (37.7%) |
| 12 to 14 Years | 9 (7.4%) | 13 (10.3%) |
| 15 Years | 0 (0.0%) | 0 (0.0%) |
| 16 and 17 Years | 0 (0.0%) | 7 (10.8%) |
| 18 to 24 Years | 110 (42.6%) | 76 (23.1%) |
| 25 to 34 Years | 42 (10.4%) | 65 (14.2%) |
| 35 to 44 Years | 78 (17.0%) | 100 (24.7%) |
| 45 to 54 Years | 48 (16.9%) | 17 (5.8%) |
| 55 to 64 Years | 12 (2.5%) | 77 (13.7%) |
| 65 to 74 Years | 0 (0.0%) | 63 (14.2%) |
| 75 Years and over | 31 (13.7%) | 59 (11.3%) |
| Total | 422 (13.0%) | 683 (17.5%) |
Income Above Poverty by Sex and Age in Fort Scott
According to the poverty statistics in Fort Scott, males aged 15 years and females aged 5 years are the age groups that are most secure financially, with 100.0% of males and 100.0% of females in these age groups living above the poverty line.
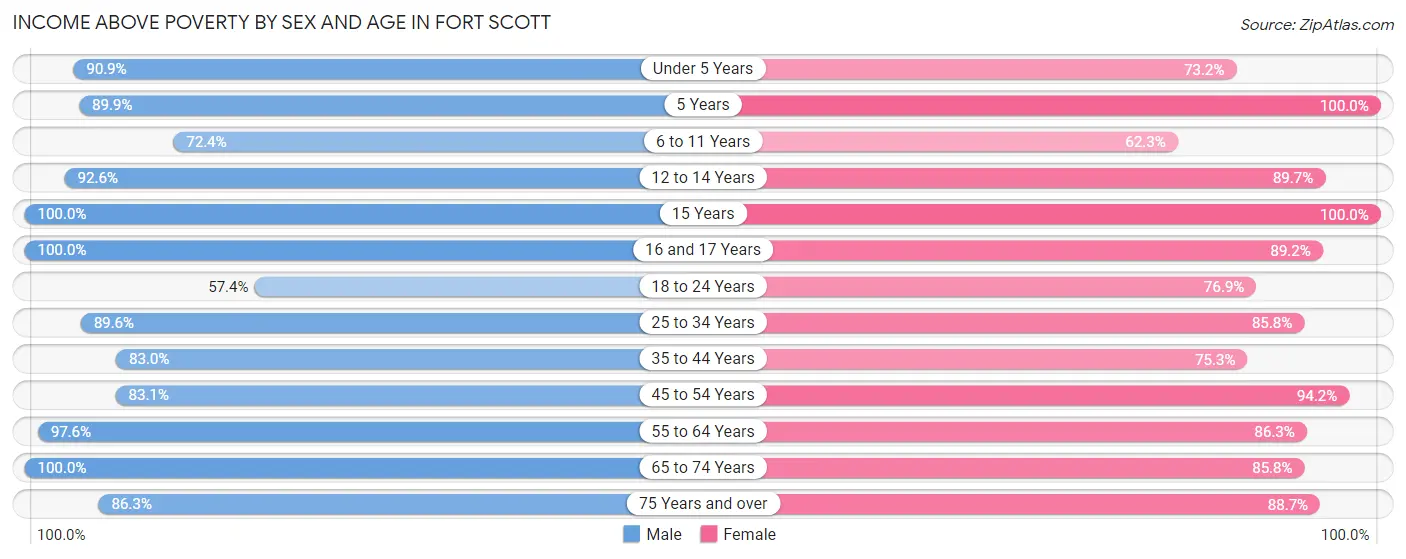
| Age Bracket | Male | Female |
| Under 5 Years | 251 (90.9%) | 153 (73.2%) |
| 5 Years | 80 (89.9%) | 76 (100.0%) |
| 6 to 11 Years | 152 (72.4%) | 248 (62.3%) |
| 12 to 14 Years | 112 (92.6%) | 113 (89.7%) |
| 15 Years | 26 (100.0%) | 6 (100.0%) |
| 16 and 17 Years | 65 (100.0%) | 58 (89.2%) |
| 18 to 24 Years | 148 (57.4%) | 253 (76.9%) |
| 25 to 34 Years | 361 (89.6%) | 392 (85.8%) |
| 35 to 44 Years | 381 (83.0%) | 304 (75.2%) |
| 45 to 54 Years | 236 (83.1%) | 274 (94.2%) |
| 55 to 64 Years | 477 (97.6%) | 484 (86.3%) |
| 65 to 74 Years | 342 (100.0%) | 382 (85.8%) |
| 75 Years and over | 195 (86.3%) | 465 (88.7%) |
| Total | 2,826 (87.0%) | 3,208 (82.5%) |
Income Below Poverty Among Married-Couple Families in Fort Scott
The poverty statistics for married-couple families in Fort Scott show that 3.3% or 46 of the total 1,406 families live below the poverty line. Families with 1 or 2 children have the highest poverty rate of 11.9%, comprising of 38 families. On the other hand, families with 3 or 4 children have the lowest poverty rate of 0.0%, which includes 0 families.
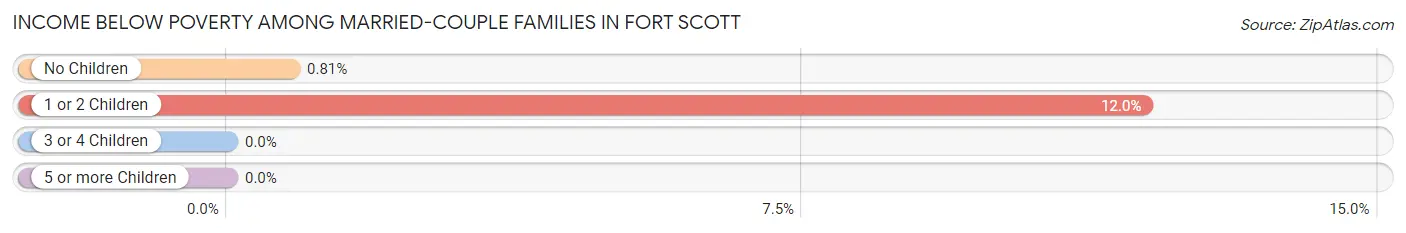
| Children | Above Poverty | Below Poverty |
| No Children | 982 (99.2%) | 8 (0.8%) |
| 1 or 2 Children | 280 (88.0%) | 38 (11.9%) |
| 3 or 4 Children | 98 (100.0%) | 0 (0.0%) |
| 5 or more Children | 0 (0.0%) | 0 (0.0%) |
| Total | 1,360 (96.7%) | 46 (3.3%) |
Income Below Poverty Among Single-Parent Households in Fort Scott
According to the poverty data in Fort Scott, 55.6% or 74 single-father households and 13.4% or 58 single-mother households are living below the poverty line. Among single-father households, those with 3 or 4 children have the highest poverty rate, with 19 households (100.0%) experiencing poverty. Likewise, among single-mother households, those with 5 or more children have the highest poverty rate, with 33 households (100.0%) falling below the poverty line.
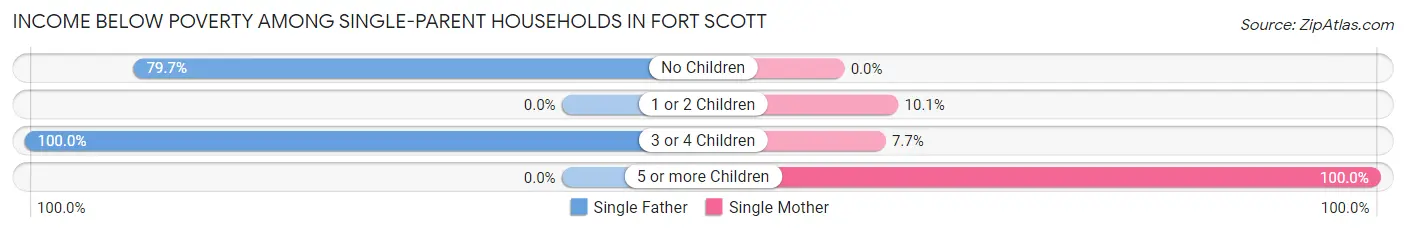
| Children | Single Father | Single Mother |
| No Children | 55 (79.7%) | 0 (0.0%) |
| 1 or 2 Children | 0 (0.0%) | 21 (10.1%) |
| 3 or 4 Children | 19 (100.0%) | 4 (7.7%) |
| 5 or more Children | 0 (0.0%) | 33 (100.0%) |
| Total | 74 (55.6%) | 58 (13.4%) |
Income Below Poverty Among Married-Couple vs Single-Parent Households in Fort Scott
The poverty data for Fort Scott shows that 46 of the married-couple family households (3.3%) and 132 of the single-parent households (23.3%) are living below the poverty level. Within the married-couple family households, those with 1 or 2 children have the highest poverty rate, with 38 households (11.9%) falling below the poverty line. Among the single-parent households, those with 5 or more children have the highest poverty rate, with 33 household (100.0%) living below poverty.
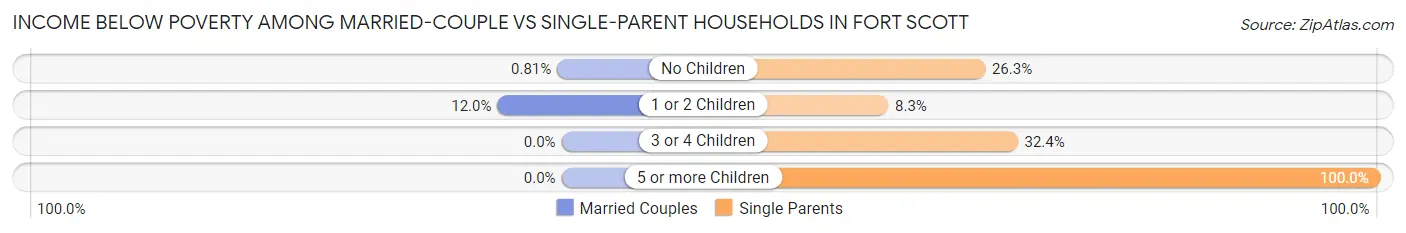
| Children | Married-Couple Families | Single-Parent Households |
| No Children | 8 (0.8%) | 55 (26.3%) |
| 1 or 2 Children | 38 (11.9%) | 21 (8.3%) |
| 3 or 4 Children | 0 (0.0%) | 23 (32.4%) |
| 5 or more Children | 0 (0.0%) | 33 (100.0%) |
| Total | 46 (3.3%) | 132 (23.3%) |
Race in Fort Scott
The most populous races in Fort Scott are White / Caucasian (6,711 | 88.7%), Two or more Races (488 | 6.5%), and Black / African American (327 | 4.3%).
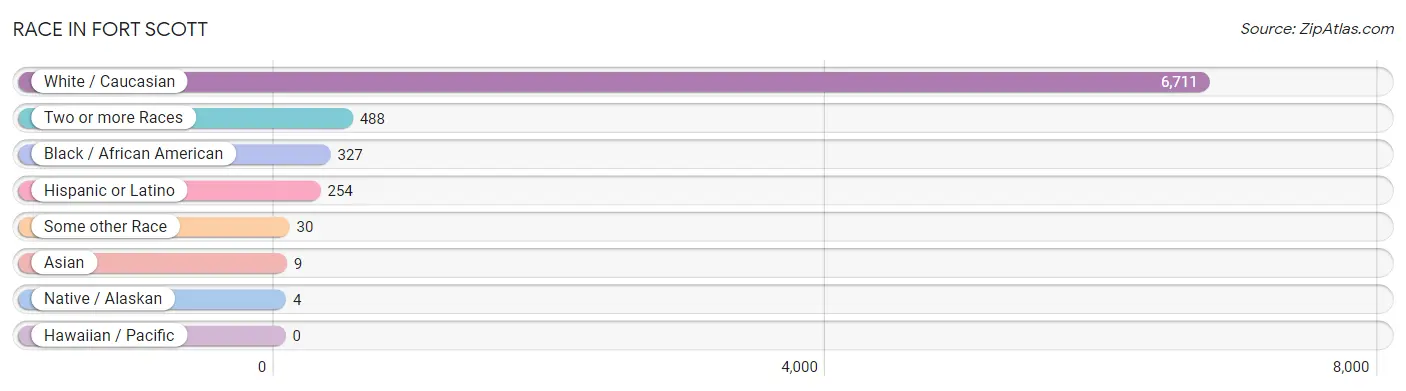
| Race | # Population | % Population |
| Asian | 9 | 0.1% |
| Black / African American | 327 | 4.3% |
| Hawaiian / Pacific | 0 | 0.0% |
| Hispanic or Latino | 254 | 3.4% |
| Native / Alaskan | 4 | 0.1% |
| White / Caucasian | 6,711 | 88.7% |
| Two or more Races | 488 | 6.5% |
| Some other Race | 30 | 0.4% |
| Total | 7,569 | 100.0% |
Ancestry in Fort Scott
The most populous ancestries reported in Fort Scott are German (1,556 | 20.6%), Irish (1,151 | 15.2%), American (939 | 12.4%), English (707 | 9.3%), and Italian (185 | 2.4%), together accounting for 60.0% of all Fort Scott residents.
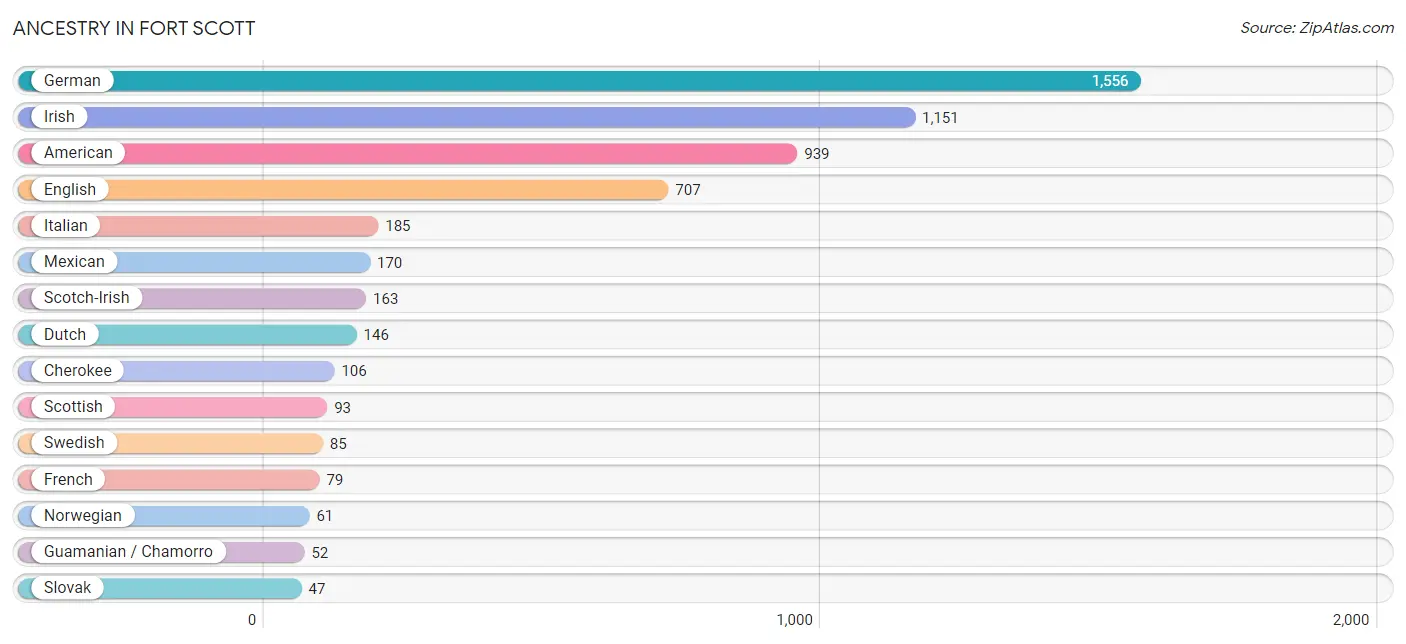
| Ancestry | # Population | % Population |
| African | 42 | 0.5% |
| American | 939 | 12.4% |
| Austrian | 24 | 0.3% |
| Blackfeet | 2 | 0.0% |
| British | 38 | 0.5% |
| Central American | 35 | 0.5% |
| Cherokee | 106 | 1.4% |
| Comanche | 7 | 0.1% |
| Czech | 11 | 0.2% |
| Czechoslovakian | 1 | 0.0% |
| Danish | 10 | 0.1% |
| Dutch | 146 | 1.9% |
| Eastern European | 10 | 0.1% |
| English | 707 | 9.3% |
| European | 42 | 0.5% |
| French | 79 | 1.0% |
| French American Indian | 14 | 0.2% |
| German | 1,556 | 20.6% |
| Greek | 5 | 0.1% |
| Guamanian / Chamorro | 52 | 0.7% |
| Honduran | 35 | 0.5% |
| Irish | 1,151 | 15.2% |
| Italian | 185 | 2.4% |
| Korean | 18 | 0.2% |
| Malaysian | 9 | 0.1% |
| Mexican | 170 | 2.2% |
| Norwegian | 61 | 0.8% |
| Polish | 19 | 0.3% |
| Portuguese | 8 | 0.1% |
| Puerto Rican | 15 | 0.2% |
| Russian | 4 | 0.1% |
| Scandinavian | 28 | 0.4% |
| Scotch-Irish | 163 | 2.1% |
| Scottish | 93 | 1.2% |
| Slovak | 47 | 0.6% |
| Spaniard | 26 | 0.3% |
| Sri Lankan | 36 | 0.5% |
| Subsaharan African | 42 | 0.5% |
| Swedish | 85 | 1.1% |
| Swiss | 38 | 0.5% |
| Thai | 47 | 0.6% |
| Turkish | 15 | 0.2% |
| Welsh | 16 | 0.2% | View All 43 Rows |
Immigrants in Fort Scott
The most numerous immigrant groups reported in Fort Scott came from Asia (24 | 0.3%), Turkey (15 | 0.2%), Western Asia (15 | 0.2%), Europe (11 | 0.2%), and Northern Europe (11 | 0.2%), together accounting for 1.0% of all Fort Scott residents.
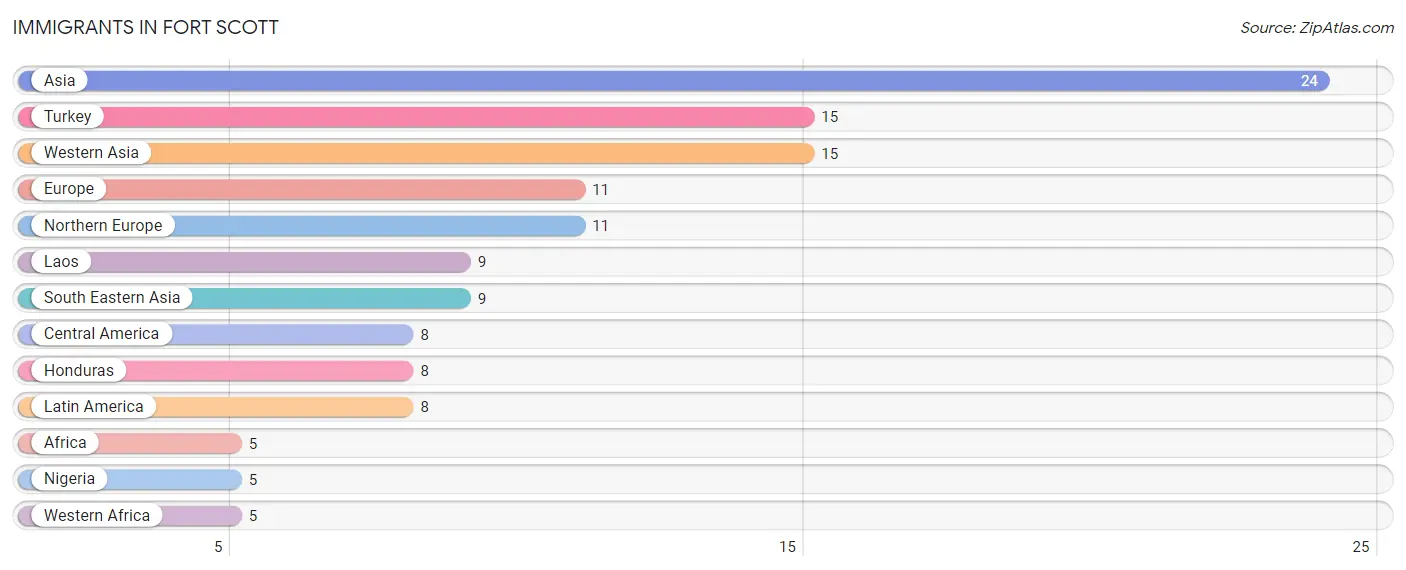
| Immigration Origin | # Population | % Population |
| Africa | 5 | 0.1% |
| Asia | 24 | 0.3% |
| Central America | 8 | 0.1% |
| Europe | 11 | 0.2% |
| Honduras | 8 | 0.1% |
| Laos | 9 | 0.1% |
| Latin America | 8 | 0.1% |
| Nigeria | 5 | 0.1% |
| Northern Europe | 11 | 0.2% |
| South Eastern Asia | 9 | 0.1% |
| Turkey | 15 | 0.2% |
| Western Africa | 5 | 0.1% |
| Western Asia | 15 | 0.2% | View All 13 Rows |
Sex and Age in Fort Scott
Sex and Age in Fort Scott
The most populous age groups in Fort Scott are 60 to 64 Years (353 | 10.2%) for men and 60 to 64 Years (374 | 9.1%) for women.
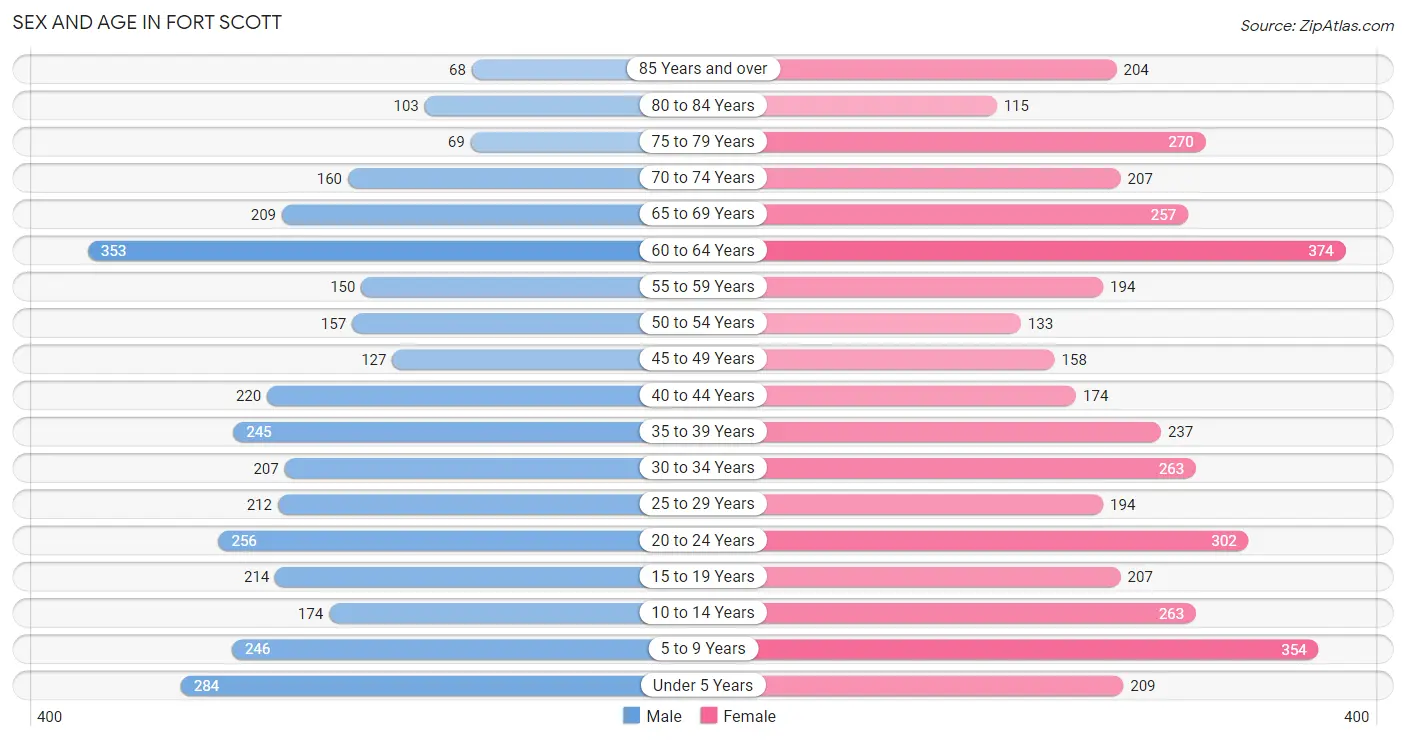
| Age Bracket | Male | Female |
| Under 5 Years | 284 (8.2%) | 209 (5.1%) |
| 5 to 9 Years | 246 (7.1%) | 354 (8.6%) |
| 10 to 14 Years | 174 (5.0%) | 263 (6.4%) |
| 15 to 19 Years | 214 (6.2%) | 207 (5.0%) |
| 20 to 24 Years | 256 (7.4%) | 302 (7.3%) |
| 25 to 29 Years | 212 (6.1%) | 194 (4.7%) |
| 30 to 34 Years | 207 (6.0%) | 263 (6.4%) |
| 35 to 39 Years | 245 (7.1%) | 237 (5.8%) |
| 40 to 44 Years | 220 (6.4%) | 174 (4.2%) |
| 45 to 49 Years | 127 (3.7%) | 158 (3.8%) |
| 50 to 54 Years | 157 (4.5%) | 133 (3.2%) |
| 55 to 59 Years | 150 (4.3%) | 194 (4.7%) |
| 60 to 64 Years | 353 (10.2%) | 374 (9.1%) |
| 65 to 69 Years | 209 (6.0%) | 257 (6.2%) |
| 70 to 74 Years | 160 (4.6%) | 207 (5.0%) |
| 75 to 79 Years | 69 (2.0%) | 270 (6.6%) |
| 80 to 84 Years | 103 (3.0%) | 115 (2.8%) |
| 85 Years and over | 68 (2.0%) | 204 (5.0%) |
| Total | 3,454 (100.0%) | 4,115 (100.0%) |
Families and Households in Fort Scott
Median Family Size in Fort Scott
The median family size in Fort Scott is 2.68 persons per family, with single female/mother families (434 | 22.0%) accounting for the largest median family size of 3.18 persons per family. On the other hand, married-couple families (1,406 | 71.3%) represent the smallest median family size with 2.53 persons per family.
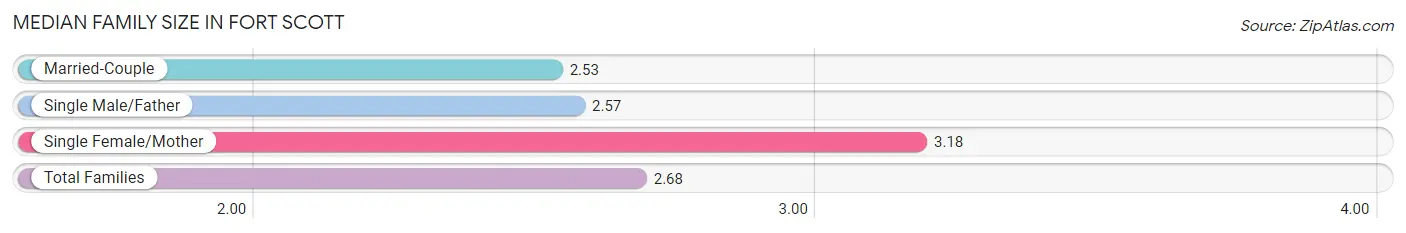
| Family Type | # Families | Family Size |
| Married-Couple | 1,406 (71.3%) | 2.53 |
| Single Male/Father | 133 (6.7%) | 2.57 |
| Single Female/Mother | 434 (22.0%) | 3.18 |
| Total Families | 1,973 (100.0%) | 2.68 |
Median Household Size in Fort Scott
The median household size in Fort Scott is 2.06 persons per household, with single female/mother households (434 | 12.5%) accounting for the largest median household size of 3.46 persons per household. non-family households (1,497 | 43.1%) represent the smallest median household size with 1.13 persons per household.
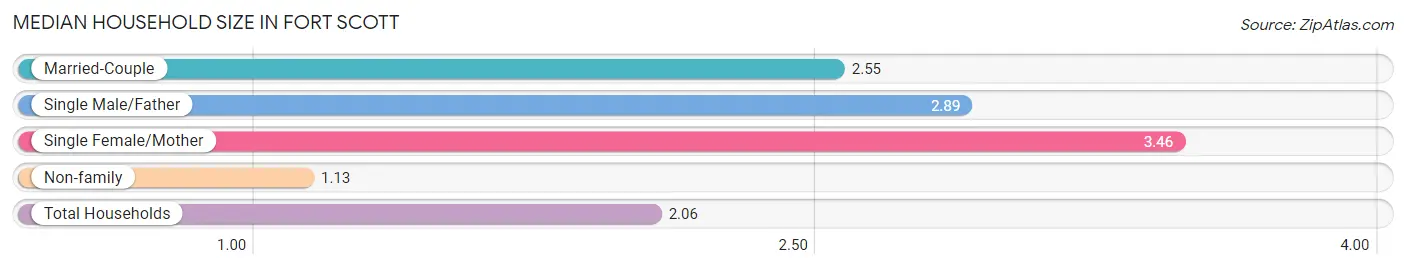
| Household Type | # Households | Household Size |
| Married-Couple | 1,406 (40.5%) | 2.55 |
| Single Male/Father | 133 (3.8%) | 2.89 |
| Single Female/Mother | 434 (12.5%) | 3.46 |
| Non-family | 1,497 (43.1%) | 1.13 |
| Total Households | 3,470 (100.0%) | 2.06 |
Household Size by Marriage Status in Fort Scott
Out of a total of 3,470 households in Fort Scott, 1,973 (56.9%) are family households, while 1,497 (43.1%) are nonfamily households. The most numerous type of family households are 2-person households, comprising 1,207, and the most common type of nonfamily households are 1-person households, comprising 1,313.
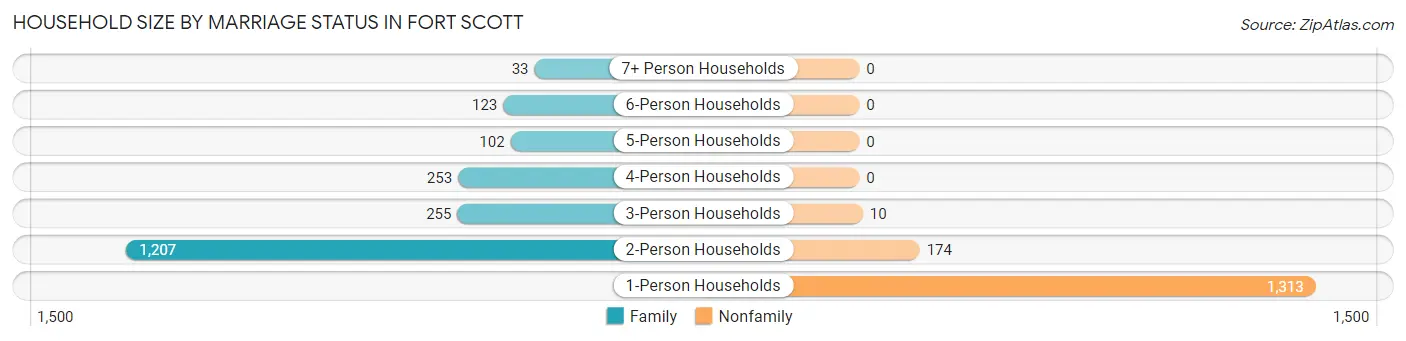
| Household Size | Family Households | Nonfamily Households |
| 1-Person Households | - | 1,313 (37.8%) |
| 2-Person Households | 1,207 (34.8%) | 174 (5.0%) |
| 3-Person Households | 255 (7.3%) | 10 (0.3%) |
| 4-Person Households | 253 (7.3%) | 0 (0.0%) |
| 5-Person Households | 102 (2.9%) | 0 (0.0%) |
| 6-Person Households | 123 (3.5%) | 0 (0.0%) |
| 7+ Person Households | 33 (0.9%) | 0 (0.0%) |
| Total | 1,973 (56.9%) | 1,497 (43.1%) |
Female Fertility in Fort Scott
Fertility by Age in Fort Scott
Average fertility rate in Fort Scott is 93.0 births per 1,000 women. Women in the age bracket of 20 to 34 years have the highest fertility rate with 130.0 births per 1,000 women. Women in the age bracket of 20 to 34 years acount for 68.3% of all women with births.
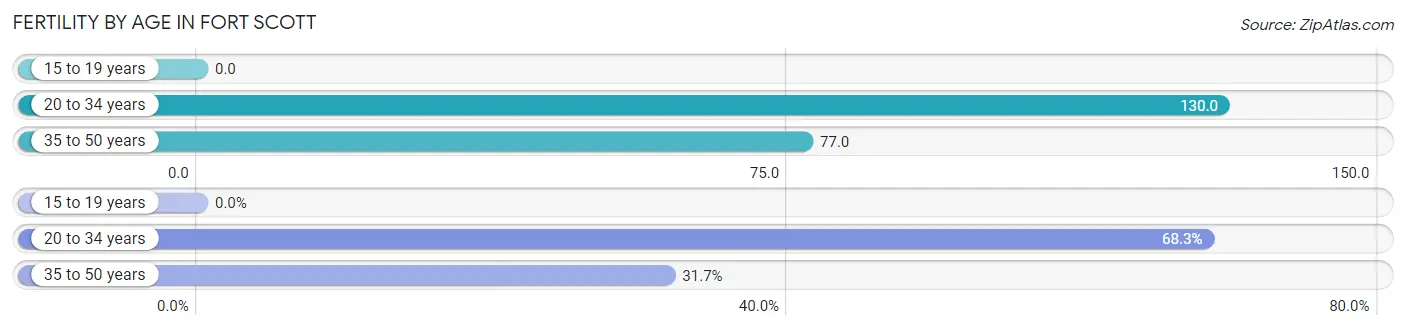
| Age Bracket | Women with Births | Births / 1,000 Women |
| 15 to 19 years | 0 (0.0%) | 0.0 |
| 20 to 34 years | 99 (68.3%) | 130.0 |
| 35 to 50 years | 46 (31.7%) | 77.0 |
| Total | 145 (100.0%) | 93.0 |
Fertility by Age by Marriage Status in Fort Scott
57.2% of women with births (145) in Fort Scott are married. The highest percentage of unmarried women with births falls into 20 to 34 years age bracket with 58.6% of them unmarried at the time of birth, while the lowest percentage of unmarried women with births belong to 35 to 50 years age bracket with 8.7% of them unmarried.
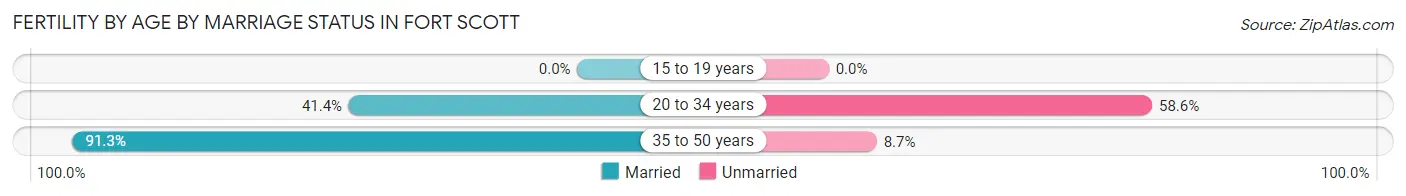
| Age Bracket | Married | Unmarried |
| 15 to 19 years | 0 (0.0%) | 0 (0.0%) |
| 20 to 34 years | 41 (41.4%) | 58 (58.6%) |
| 35 to 50 years | 42 (91.3%) | 4 (8.7%) |
| Total | 83 (57.2%) | 62 (42.8%) |
Fertility by Education in Fort Scott
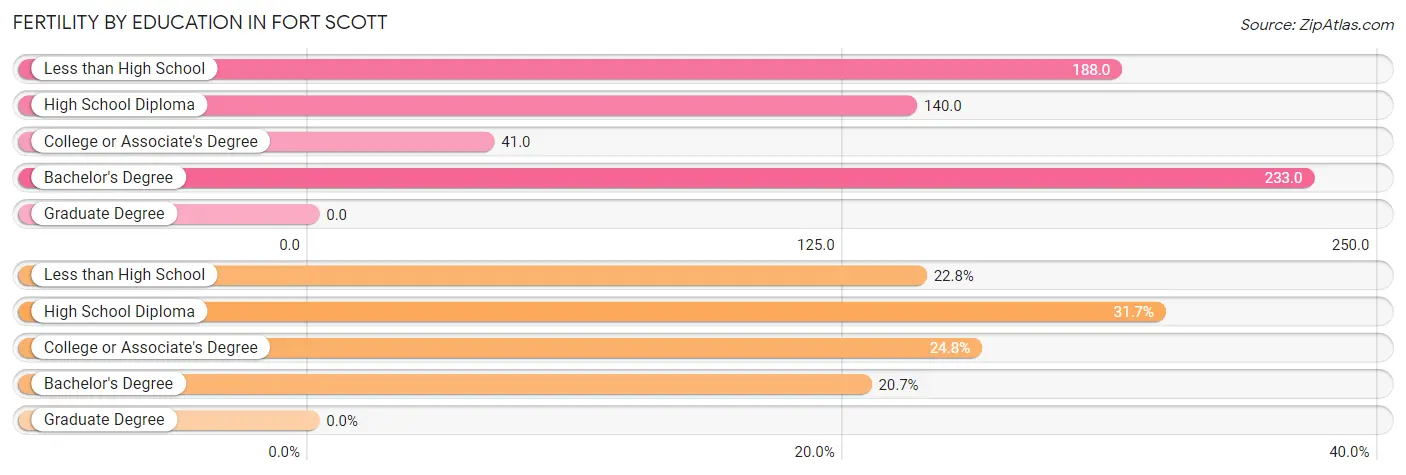
| Educational Attainment | Women with Births | Births / 1,000 Women |
| Less than High School | 33 (22.8%) | 188.0 |
| High School Diploma | 46 (31.7%) | 140.0 |
| College or Associate's Degree | 36 (24.8%) | 41.0 |
| Bachelor's Degree | 30 (20.7%) | 233.0 |
| Graduate Degree | 0 (0.0%) | 0.0 |
| Total | 145 (100.0%) | 93.0 |
Fertility by Education by Marriage Status in Fort Scott
42.8% of women with births in Fort Scott are unmarried. Women with the educational attainment of bachelor's degree are most likely to be married with 100.0% of them married at childbirth, while women with the educational attainment of less than high school are least likely to be married with 100.0% of them unmarried at childbirth.
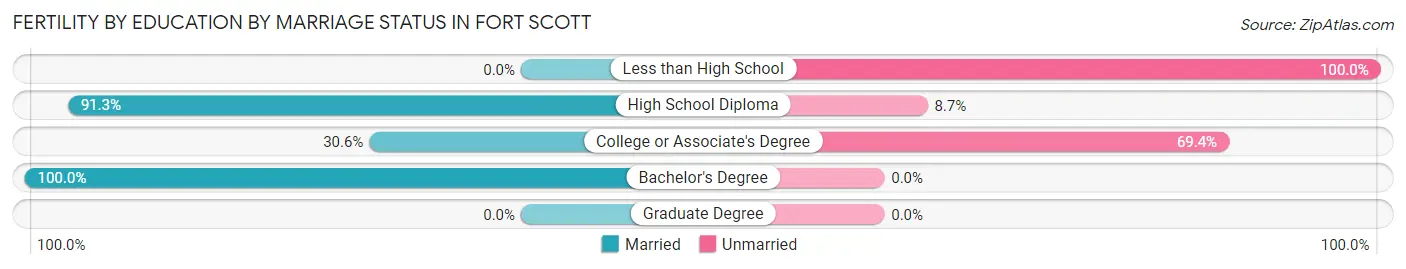
| Educational Attainment | Married | Unmarried |
| Less than High School | 0 (0.0%) | 33 (100.0%) |
| High School Diploma | 42 (91.3%) | 4 (8.7%) |
| College or Associate's Degree | 11 (30.6%) | 25 (69.4%) |
| Bachelor's Degree | 30 (100.0%) | 0 (0.0%) |
| Graduate Degree | 0 (0.0%) | 0 (0.0%) |
| Total | 83 (57.2%) | 62 (42.8%) |
Employment Characteristics in Fort Scott
Employment by Class of Employer in Fort Scott
Among the 3,206 employed individuals in Fort Scott, private company employees (2,347 | 73.2%), not-for-profit organizations (265 | 8.3%), and self-employed (not incorporated) (202 | 6.3%) make up the most common classes of employment.
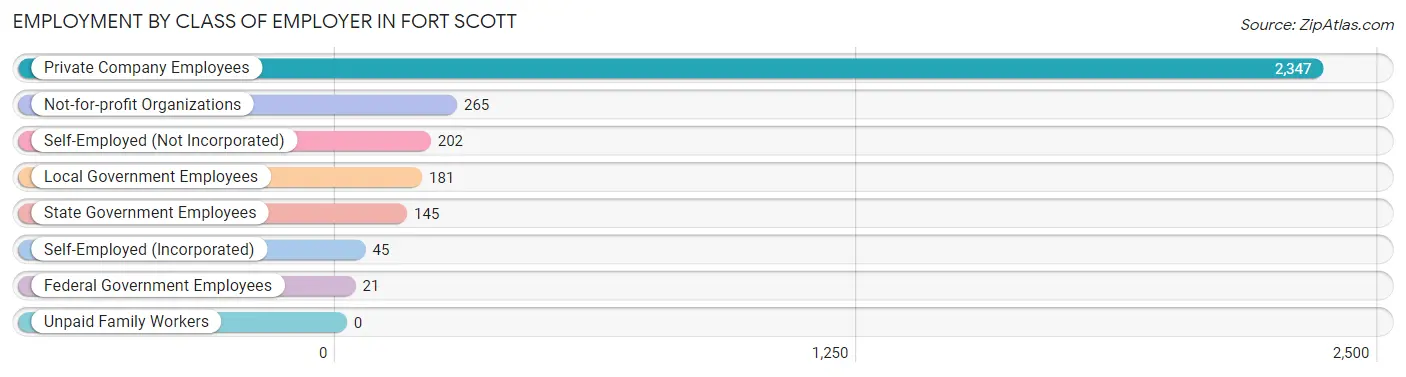
| Employer Class | # Employees | % Employees |
| Private Company Employees | 2,347 | 73.2% |
| Self-Employed (Incorporated) | 45 | 1.4% |
| Self-Employed (Not Incorporated) | 202 | 6.3% |
| Not-for-profit Organizations | 265 | 8.3% |
| Local Government Employees | 181 | 5.7% |
| State Government Employees | 145 | 4.5% |
| Federal Government Employees | 21 | 0.7% |
| Unpaid Family Workers | 0 | 0.0% |
| Total | 3,206 | 100.0% |
Employment Status by Age in Fort Scott
According to the labor force statistics for Fort Scott, out of the total population over 16 years of age (6,007), 56.0% or 3,364 individuals are in the labor force, with 4.5% or 151 of them unemployed. The age group with the highest labor force participation rate is 30 to 34 years, with 83.2% or 391 individuals in the labor force. Within the labor force, the 20 to 24 years age range has the highest percentage of unemployed individuals, with 10.4% or 47 of them being unemployed.
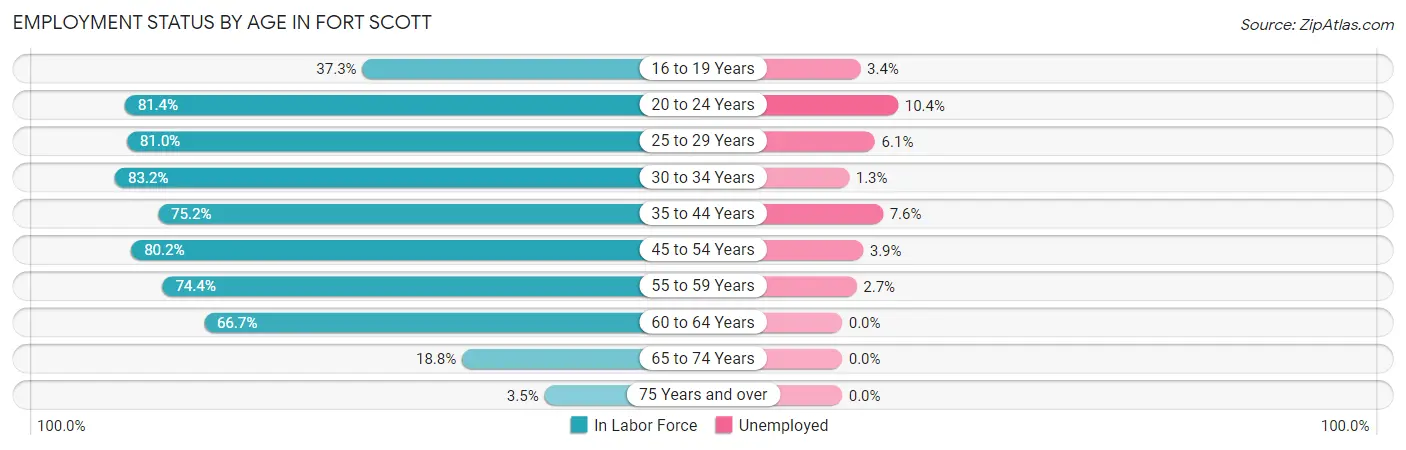
| Age Bracket | In Labor Force | Unemployed |
| 16 to 19 Years | 145 (37.3%) | 5 (3.4%) |
| 20 to 24 Years | 454 (81.4%) | 47 (10.4%) |
| 25 to 29 Years | 329 (81.0%) | 20 (6.1%) |
| 30 to 34 Years | 391 (83.2%) | 5 (1.3%) |
| 35 to 44 Years | 659 (75.2%) | 50 (7.6%) |
| 45 to 54 Years | 461 (80.2%) | 18 (3.9%) |
| 55 to 59 Years | 256 (74.4%) | 7 (2.7%) |
| 60 to 64 Years | 485 (66.7%) | 0 (0.0%) |
| 65 to 74 Years | 157 (18.8%) | 0 (0.0%) |
| 75 Years and over | 29 (3.5%) | 0 (0.0%) |
| Total | 3,364 (56.0%) | 151 (4.5%) |
Employment Status by Educational Attainment in Fort Scott
According to labor force statistics for Fort Scott, 76.0% of individuals (2,582) out of the total population between 25 and 64 years of age (3,398) are in the labor force, with 3.9% or 101 of them being unemployed. The group with the highest labor force participation rate are those with the educational attainment of college / associate degree, with 87.1% or 1,264 individuals in the labor force. Within the labor force, individuals with less than high school education have the highest percentage of unemployment, with 5.6% or 12 of them being unemployed.
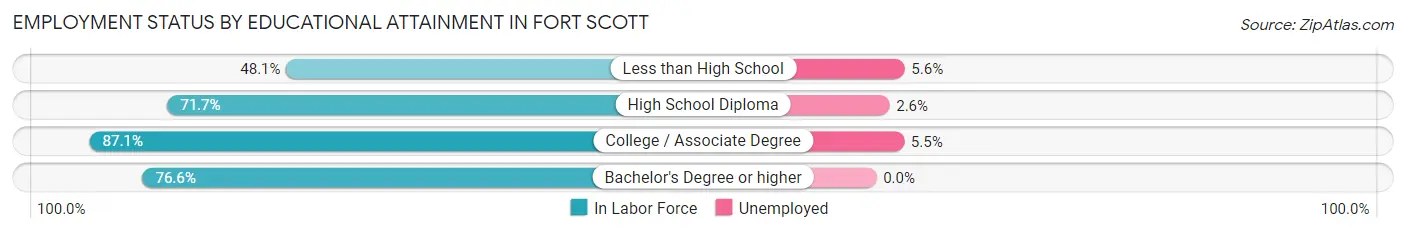
| Educational Attainment | In Labor Force | Unemployed |
| Less than High School | 216 (48.1%) | 25 (5.6%) |
| High School Diploma | 685 (71.7%) | 25 (2.6%) |
| College / Associate Degree | 1,264 (87.1%) | 80 (5.5%) |
| Bachelor's Degree or higher | 416 (76.6%) | 0 (0.0%) |
| Total | 2,582 (76.0%) | 133 (3.9%) |
Employment Occupations by Sex in Fort Scott
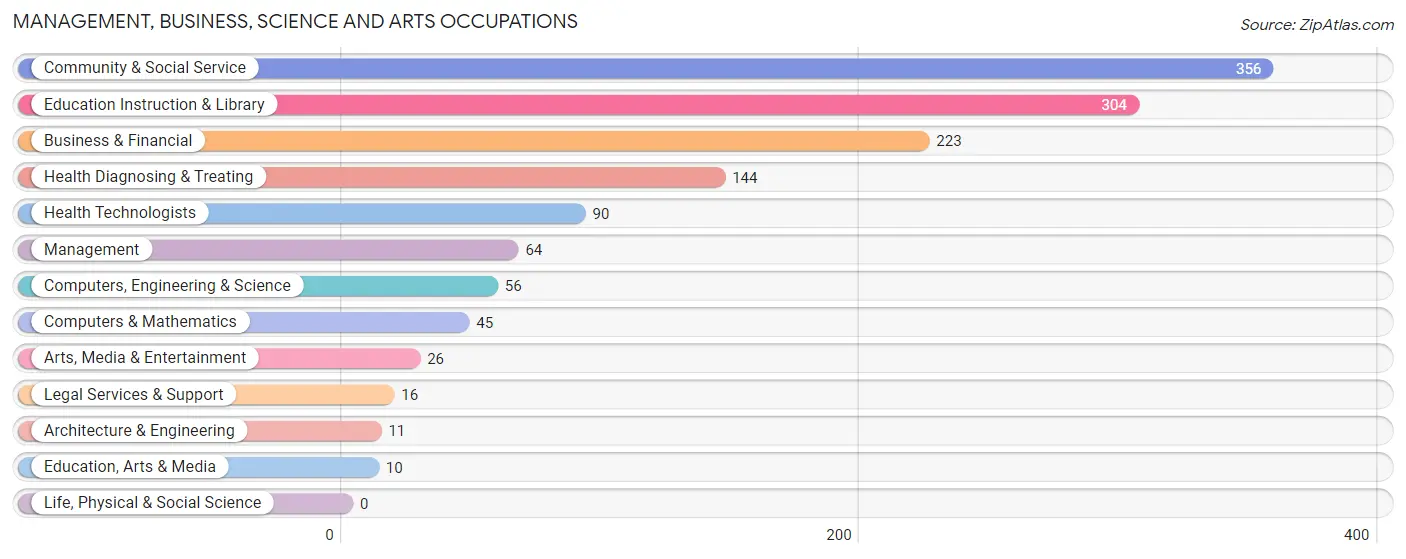
Management, Business, Science and Arts Occupations
The most common Management, Business, Science and Arts occupations in Fort Scott are Community & Social Service (356 | 11.1%), Education Instruction & Library (304 | 9.5%), Business & Financial (223 | 6.9%), Health Diagnosing & Treating (144 | 4.5%), and Health Technologists (90 | 2.8%).
Management, Business, Science and Arts Occupations by Sex
Within the Management, Business, Science and Arts occupations in Fort Scott, the most male-oriented occupations are Architecture & Engineering (100.0%), Education, Arts & Media (90.0%), and Computers, Engineering & Science (73.2%), while the most female-oriented occupations are Legal Services & Support (100.0%), Arts, Media & Entertainment (100.0%), and Health Diagnosing & Treating (100.0%).
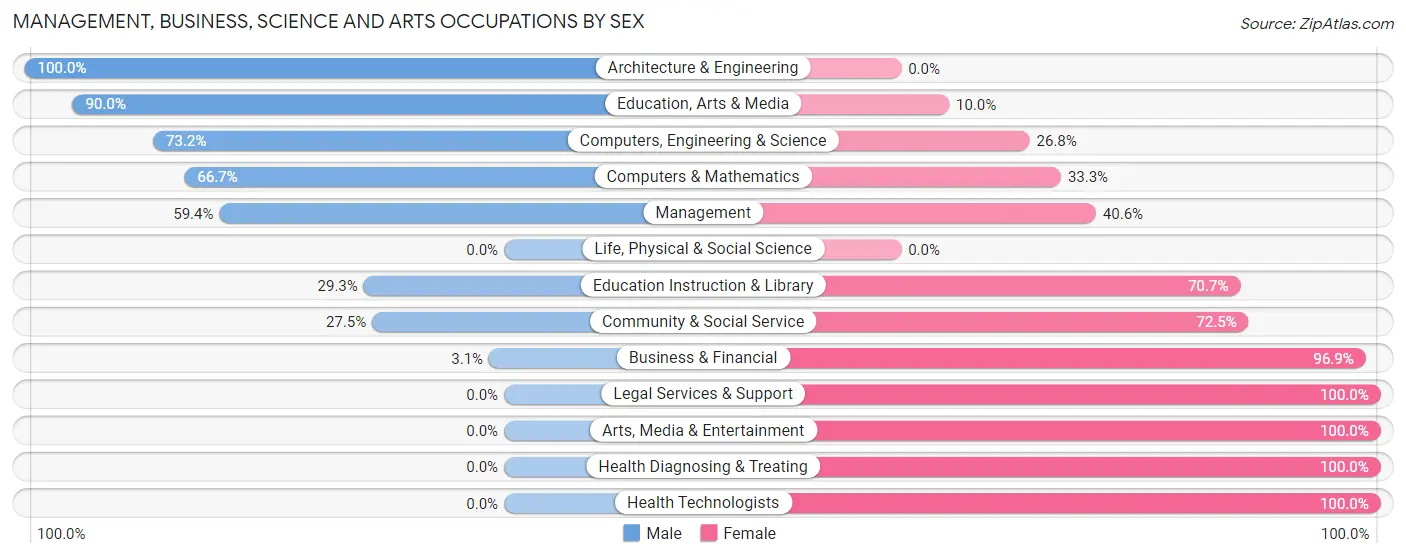
| Occupation | Male | Female |
| Management | 38 (59.4%) | 26 (40.6%) |
| Business & Financial | 7 (3.1%) | 216 (96.9%) |
| Computers, Engineering & Science | 41 (73.2%) | 15 (26.8%) |
| Computers & Mathematics | 30 (66.7%) | 15 (33.3%) |
| Architecture & Engineering | 11 (100.0%) | 0 (0.0%) |
| Life, Physical & Social Science | 0 (0.0%) | 0 (0.0%) |
| Community & Social Service | 98 (27.5%) | 258 (72.5%) |
| Education, Arts & Media | 9 (90.0%) | 1 (10.0%) |
| Legal Services & Support | 0 (0.0%) | 16 (100.0%) |
| Education Instruction & Library | 89 (29.3%) | 215 (70.7%) |
| Arts, Media & Entertainment | 0 (0.0%) | 26 (100.0%) |
| Health Diagnosing & Treating | 0 (0.0%) | 144 (100.0%) |
| Health Technologists | 0 (0.0%) | 90 (100.0%) |
| Total (Category) | 184 (21.8%) | 659 (78.2%) |
| Total (Overall) | 1,608 (50.0%) | 1,606 (50.0%) |
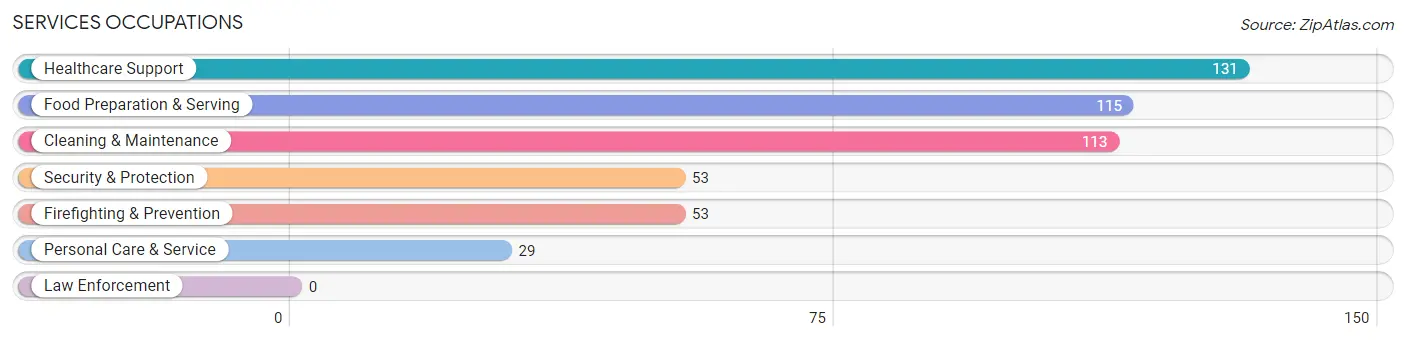
Services Occupations
The most common Services occupations in Fort Scott are Healthcare Support (131 | 4.1%), Food Preparation & Serving (115 | 3.6%), Cleaning & Maintenance (113 | 3.5%), Security & Protection (53 | 1.7%), and Firefighting & Prevention (53 | 1.7%).
Services Occupations by Sex
Within the Services occupations in Fort Scott, the most male-oriented occupations are Cleaning & Maintenance (77.9%), Security & Protection (71.7%), and Firefighting & Prevention (71.7%), while the most female-oriented occupations are Healthcare Support (100.0%), Food Preparation & Serving (66.1%), and Personal Care & Service (65.5%).
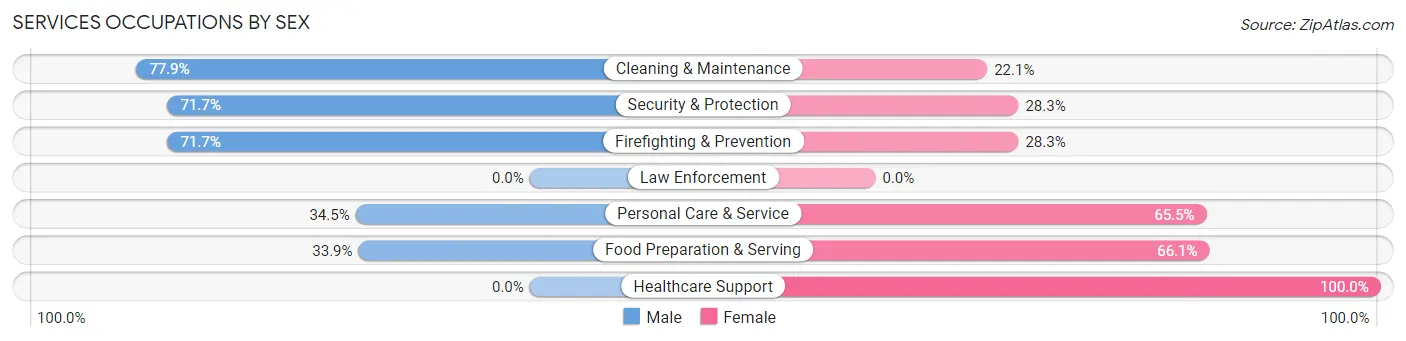
| Occupation | Male | Female |
| Healthcare Support | 0 (0.0%) | 131 (100.0%) |
| Security & Protection | 38 (71.7%) | 15 (28.3%) |
| Firefighting & Prevention | 38 (71.7%) | 15 (28.3%) |
| Law Enforcement | 0 (0.0%) | 0 (0.0%) |
| Food Preparation & Serving | 39 (33.9%) | 76 (66.1%) |
| Cleaning & Maintenance | 88 (77.9%) | 25 (22.1%) |
| Personal Care & Service | 10 (34.5%) | 19 (65.5%) |
| Total (Category) | 175 (39.7%) | 266 (60.3%) |
| Total (Overall) | 1,608 (50.0%) | 1,606 (50.0%) |
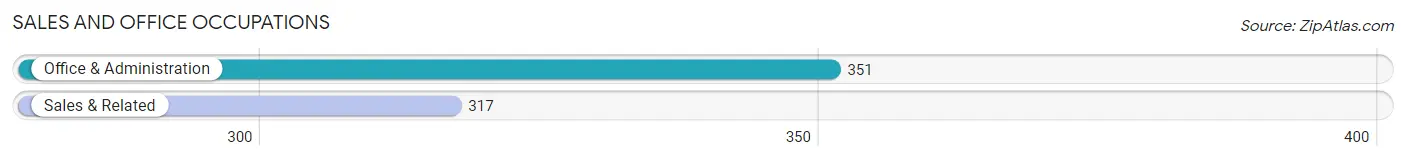
Sales and Office Occupations
The most common Sales and Office occupations in Fort Scott are Office & Administration (351 | 10.9%), and Sales & Related (317 | 9.9%).
Sales and Office Occupations by Sex
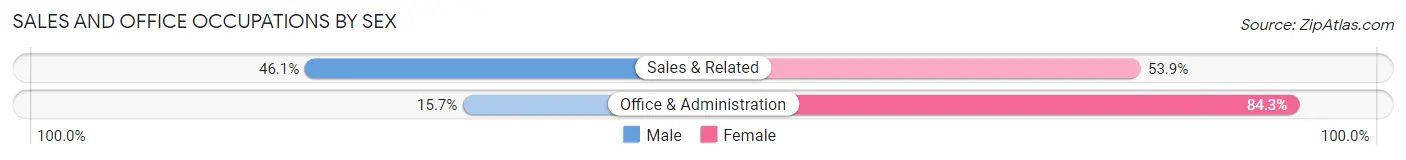
| Occupation | Male | Female |
| Sales & Related | 146 (46.1%) | 171 (53.9%) |
| Office & Administration | 55 (15.7%) | 296 (84.3%) |
| Total (Category) | 201 (30.1%) | 467 (69.9%) |
| Total (Overall) | 1,608 (50.0%) | 1,606 (50.0%) |
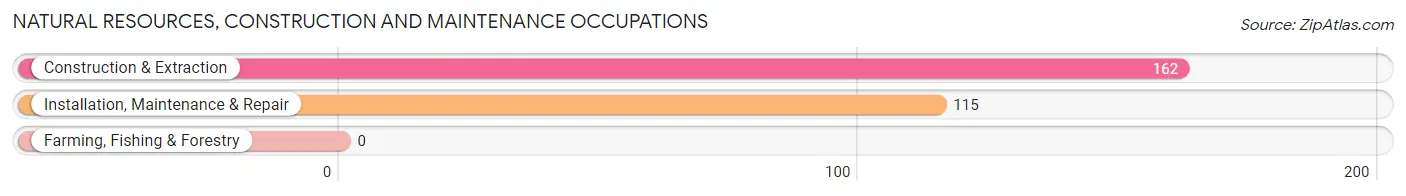
Natural Resources, Construction and Maintenance Occupations
The most common Natural Resources, Construction and Maintenance occupations in Fort Scott are Construction & Extraction (162 | 5.0%), and Installation, Maintenance & Repair (115 | 3.6%).
Natural Resources, Construction and Maintenance Occupations by Sex
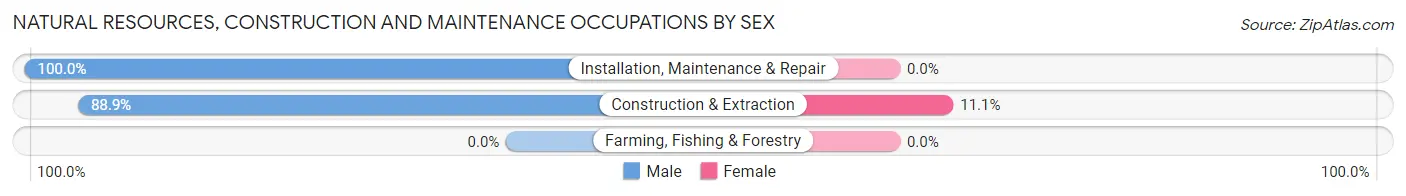
| Occupation | Male | Female |
| Farming, Fishing & Forestry | 0 (0.0%) | 0 (0.0%) |
| Construction & Extraction | 144 (88.9%) | 18 (11.1%) |
| Installation, Maintenance & Repair | 115 (100.0%) | 0 (0.0%) |
| Total (Category) | 259 (93.5%) | 18 (6.5%) |
| Total (Overall) | 1,608 (50.0%) | 1,606 (50.0%) |
Production, Transportation and Moving Occupations
The most common Production, Transportation and Moving occupations in Fort Scott are Production (589 | 18.3%), Material Moving (214 | 6.7%), and Transportation (182 | 5.7%).
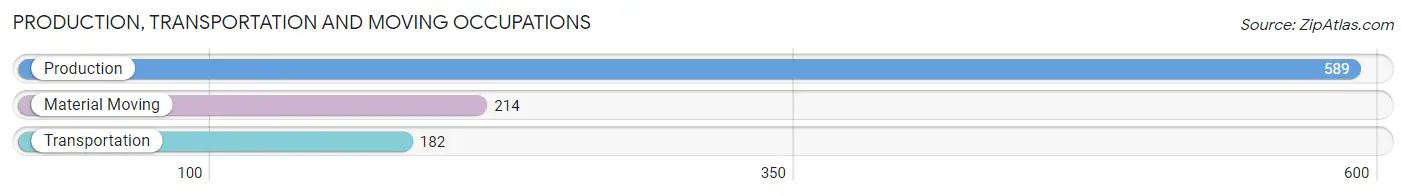
Production, Transportation and Moving Occupations by Sex
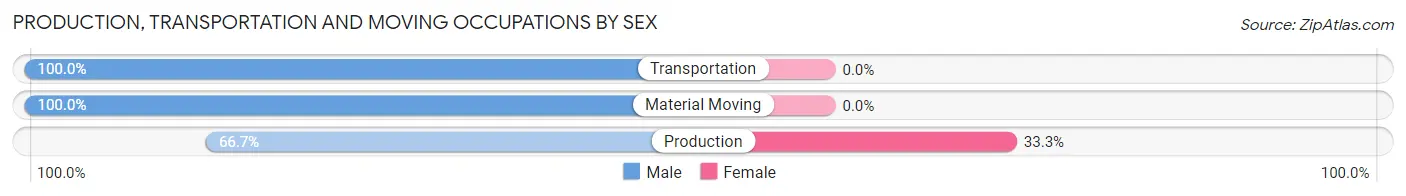
| Occupation | Male | Female |
| Production | 393 (66.7%) | 196 (33.3%) |
| Transportation | 182 (100.0%) | 0 (0.0%) |
| Material Moving | 214 (100.0%) | 0 (0.0%) |
| Total (Category) | 789 (80.1%) | 196 (19.9%) |
| Total (Overall) | 1,608 (50.0%) | 1,606 (50.0%) |
Employment Industries by Sex in Fort Scott
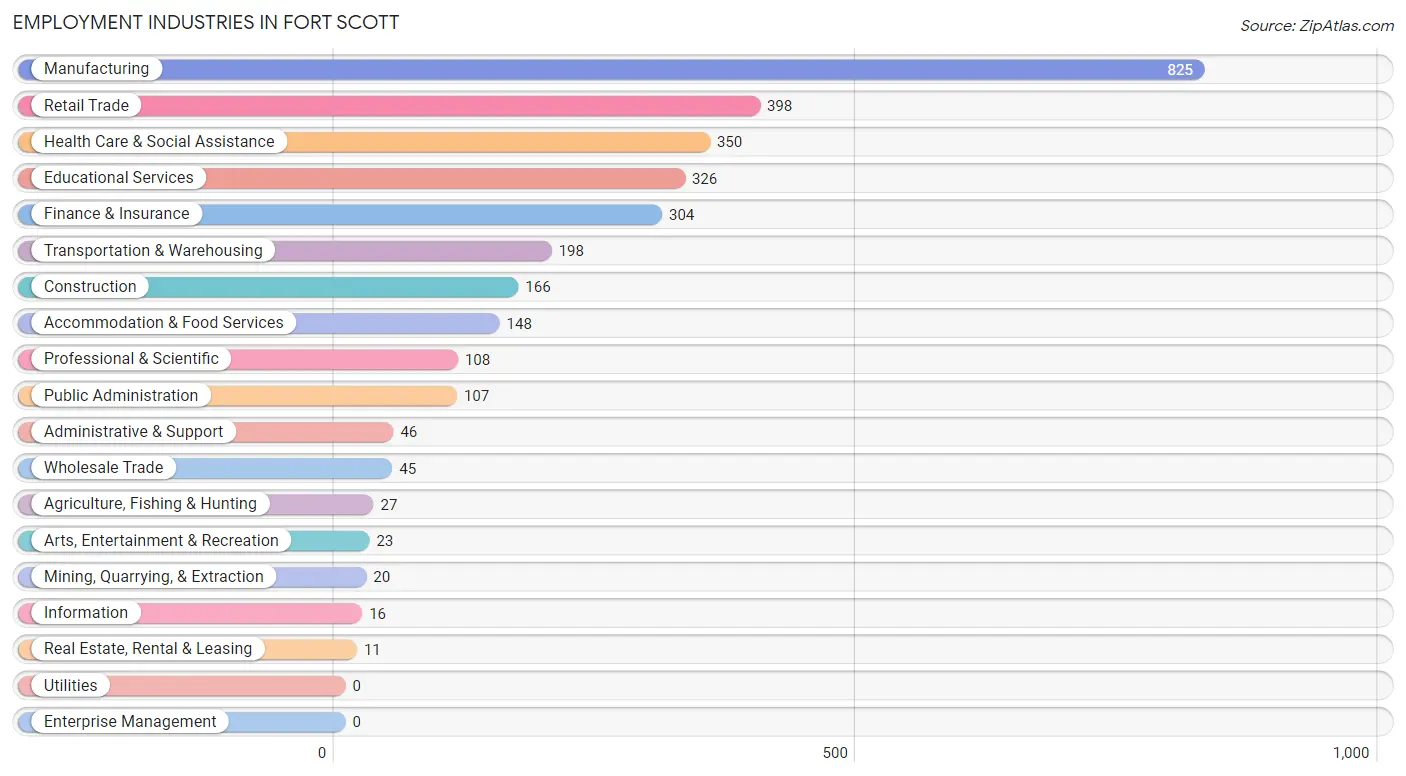
Employment Industries in Fort Scott
The major employment industries in Fort Scott include Manufacturing (825 | 25.7%), Retail Trade (398 | 12.4%), Health Care & Social Assistance (350 | 10.9%), Educational Services (326 | 10.1%), and Finance & Insurance (304 | 9.5%).
Employment Industries by Sex in Fort Scott
The Fort Scott industries that see more men than women are Wholesale Trade (100.0%), Real Estate, Rental & Leasing (100.0%), and Construction (95.2%), whereas the industries that tend to have a higher number of women are Mining, Quarrying, & Extraction (100.0%), Information (100.0%), and Arts, Entertainment & Recreation (100.0%).
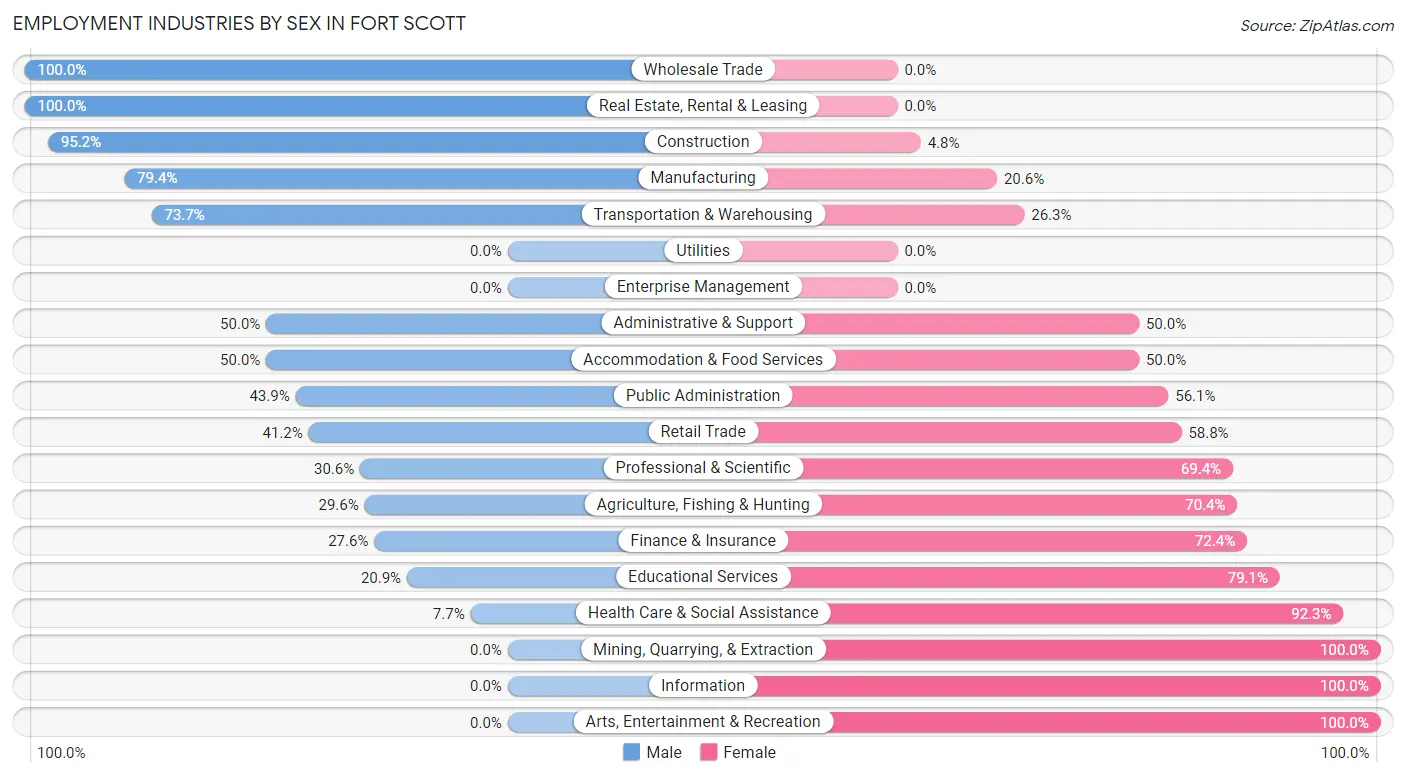
| Industry | Male | Female |
| Agriculture, Fishing & Hunting | 8 (29.6%) | 19 (70.4%) |
| Mining, Quarrying, & Extraction | 0 (0.0%) | 20 (100.0%) |
| Construction | 158 (95.2%) | 8 (4.8%) |
| Manufacturing | 655 (79.4%) | 170 (20.6%) |
| Wholesale Trade | 45 (100.0%) | 0 (0.0%) |
| Retail Trade | 164 (41.2%) | 234 (58.8%) |
| Transportation & Warehousing | 146 (73.7%) | 52 (26.3%) |
| Utilities | 0 (0.0%) | 0 (0.0%) |
| Information | 0 (0.0%) | 16 (100.0%) |
| Finance & Insurance | 84 (27.6%) | 220 (72.4%) |
| Real Estate, Rental & Leasing | 11 (100.0%) | 0 (0.0%) |
| Professional & Scientific | 33 (30.6%) | 75 (69.4%) |
| Enterprise Management | 0 (0.0%) | 0 (0.0%) |
| Administrative & Support | 23 (50.0%) | 23 (50.0%) |
| Educational Services | 68 (20.9%) | 258 (79.1%) |
| Health Care & Social Assistance | 27 (7.7%) | 323 (92.3%) |
| Arts, Entertainment & Recreation | 0 (0.0%) | 23 (100.0%) |
| Accommodation & Food Services | 74 (50.0%) | 74 (50.0%) |
| Public Administration | 47 (43.9%) | 60 (56.1%) |
| Total | 1,608 (50.0%) | 1,606 (50.0%) |
Education in Fort Scott
School Enrollment in Fort Scott
The most common levels of schooling among the 1,674 students in Fort Scott are college / undergraduate (453 | 27.1%), elementary school (444 | 26.5%), and middle school (355 | 21.2%).
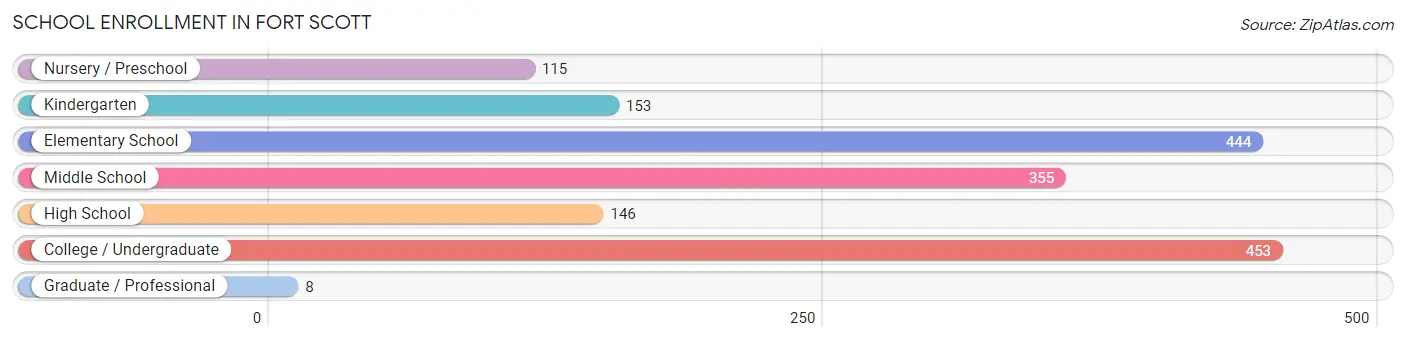
| School Level | # Students | % Students |
| Nursery / Preschool | 115 | 6.9% |
| Kindergarten | 153 | 9.1% |
| Elementary School | 444 | 26.5% |
| Middle School | 355 | 21.2% |
| High School | 146 | 8.7% |
| College / Undergraduate | 453 | 27.1% |
| Graduate / Professional | 8 | 0.5% |
| Total | 1,674 | 100.0% |
School Enrollment by Age by Funding Source in Fort Scott
Out of a total of 1,674 students who are enrolled in schools in Fort Scott, 126 (7.5%) attend a private institution, while the remaining 1,548 (92.5%) are enrolled in public schools. The age group of 3 to 4 year olds has the highest likelihood of being enrolled in private schools, with 19 (21.6% in the age bracket) enrolled. Conversely, the age group of 15 to 17 year olds has the lowest likelihood of being enrolled in a private school, with 106 (100.0% in the age bracket) attending a public institution.
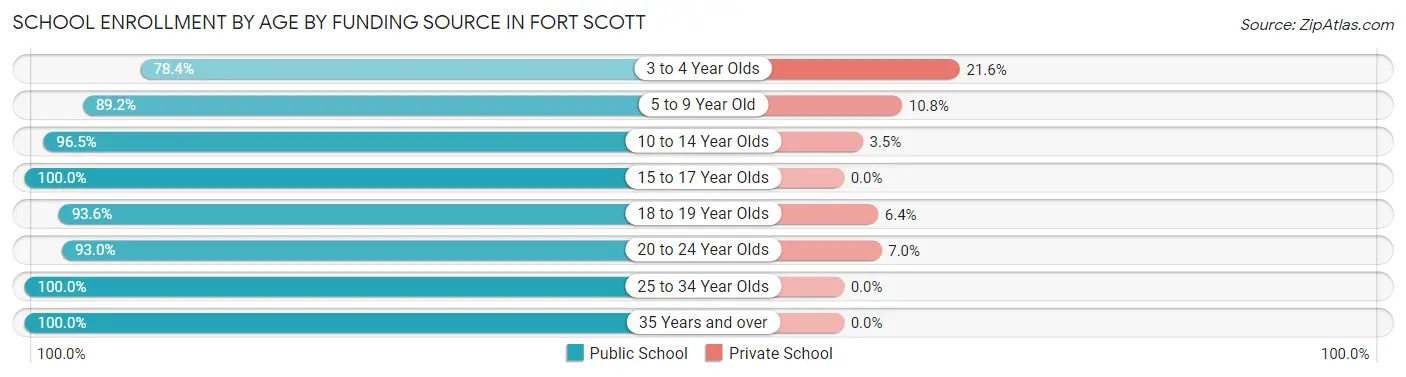
| Age Bracket | Public School | Private School |
| 3 to 4 Year Olds | 69 (78.4%) | 19 (21.6%) |
| 5 to 9 Year Old | 535 (89.2%) | 65 (10.8%) |
| 10 to 14 Year Olds | 385 (96.5%) | 14 (3.5%) |
| 15 to 17 Year Olds | 106 (100.0%) | 0 (0.0%) |
| 18 to 19 Year Olds | 191 (93.6%) | 13 (6.4%) |
| 20 to 24 Year Olds | 186 (93.0%) | 14 (7.0%) |
| 25 to 34 Year Olds | 28 (100.0%) | 0 (0.0%) |
| 35 Years and over | 49 (100.0%) | 0 (0.0%) |
| Total | 1,548 (92.5%) | 126 (7.5%) |
Educational Attainment by Field of Study in Fort Scott
Education (418 | 38.5%), business (181 | 16.7%), science & technology (143 | 13.2%), visual & performing arts (63 | 5.8%), and communications (60 | 5.5%) are the most common fields of study among 1,087 individuals in Fort Scott who have obtained a bachelor's degree or higher.
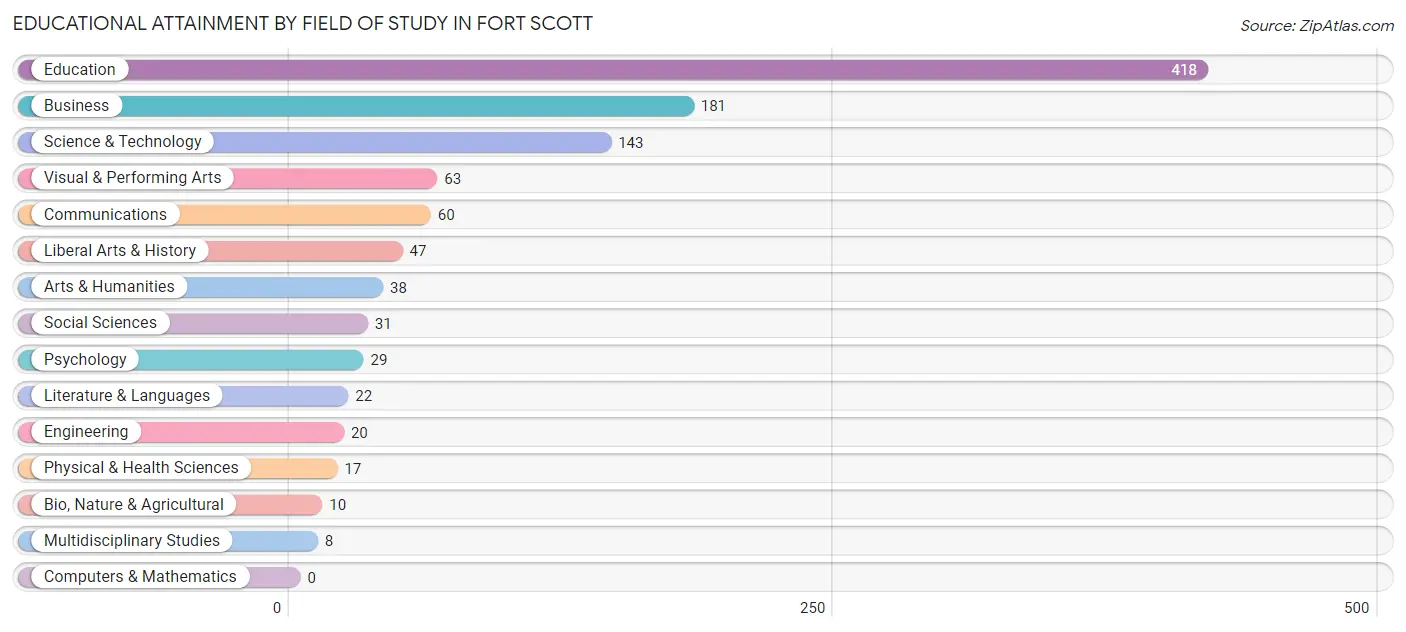
| Field of Study | # Graduates | % Graduates |
| Computers & Mathematics | 0 | 0.0% |
| Bio, Nature & Agricultural | 10 | 0.9% |
| Physical & Health Sciences | 17 | 1.6% |
| Psychology | 29 | 2.7% |
| Social Sciences | 31 | 2.9% |
| Engineering | 20 | 1.8% |
| Multidisciplinary Studies | 8 | 0.7% |
| Science & Technology | 143 | 13.2% |
| Business | 181 | 16.7% |
| Education | 418 | 38.5% |
| Literature & Languages | 22 | 2.0% |
| Liberal Arts & History | 47 | 4.3% |
| Visual & Performing Arts | 63 | 5.8% |
| Communications | 60 | 5.5% |
| Arts & Humanities | 38 | 3.5% |
| Total | 1,087 | 100.0% |
Transportation & Commute in Fort Scott
Vehicle Availability by Sex in Fort Scott
The most prevalent vehicle ownership categories in Fort Scott are males with 2 vehicles (659, accounting for 41.5%) and females with 2 vehicles (490, making up 41.3%).
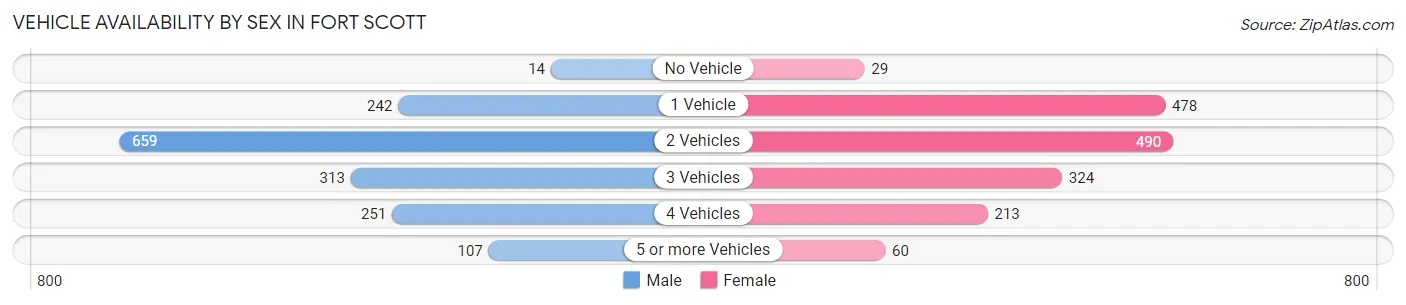
| Vehicles Available | Male | Female |
| No Vehicle | 14 (0.9%) | 29 (1.8%) |
| 1 Vehicle | 242 (15.3%) | 478 (30.0%) |
| 2 Vehicles | 659 (41.5%) | 490 (30.7%) |
| 3 Vehicles | 313 (19.7%) | 324 (20.3%) |
| 4 Vehicles | 251 (15.8%) | 213 (13.4%) |
| 5 or more Vehicles | 107 (6.8%) | 60 (3.8%) |
| Total | 1,586 (100.0%) | 1,594 (100.0%) |
Commute Time in Fort Scott
The most frequently occuring commute durations in Fort Scott are 5 to 9 minutes (1,000 commuters, 35.0%), 10 to 14 minutes (623 commuters, 21.8%), and less than 5 minutes (415 commuters, 14.5%).
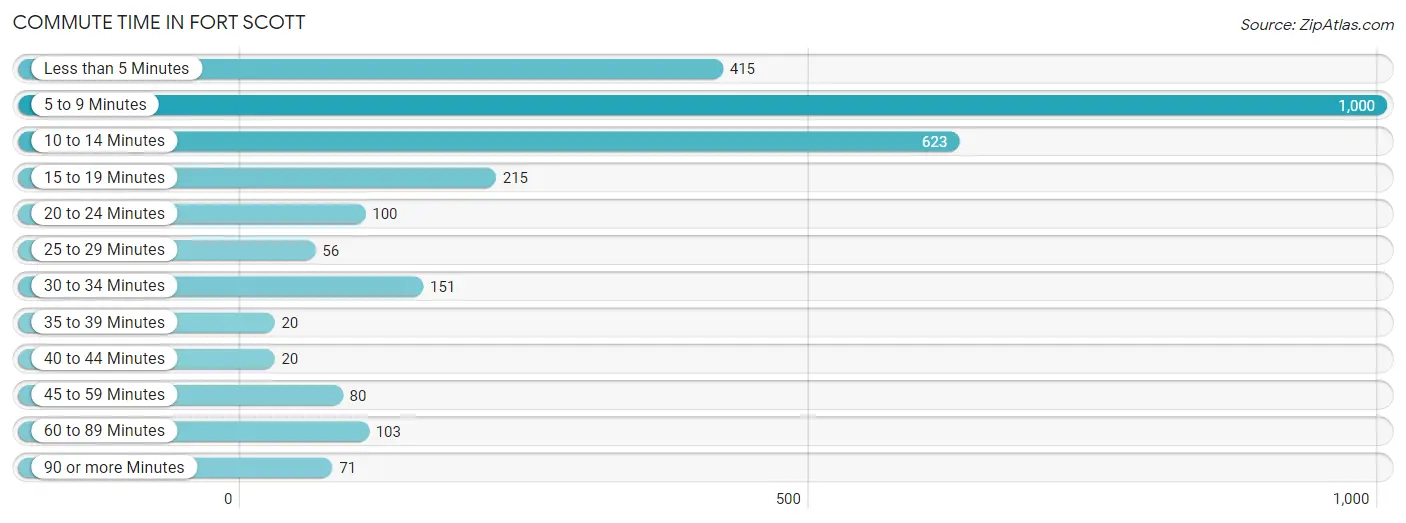
| Commute Time | # Commuters | % Commuters |
| Less than 5 Minutes | 415 | 14.5% |
| 5 to 9 Minutes | 1,000 | 35.0% |
| 10 to 14 Minutes | 623 | 21.8% |
| 15 to 19 Minutes | 215 | 7.5% |
| 20 to 24 Minutes | 100 | 3.5% |
| 25 to 29 Minutes | 56 | 2.0% |
| 30 to 34 Minutes | 151 | 5.3% |
| 35 to 39 Minutes | 20 | 0.7% |
| 40 to 44 Minutes | 20 | 0.7% |
| 45 to 59 Minutes | 80 | 2.8% |
| 60 to 89 Minutes | 103 | 3.6% |
| 90 or more Minutes | 71 | 2.5% |
Commute Time by Sex in Fort Scott
The most common commute times in Fort Scott are 5 to 9 minutes (536 commuters, 35.2%) for males and 5 to 9 minutes (464 commuters, 34.9%) for females.
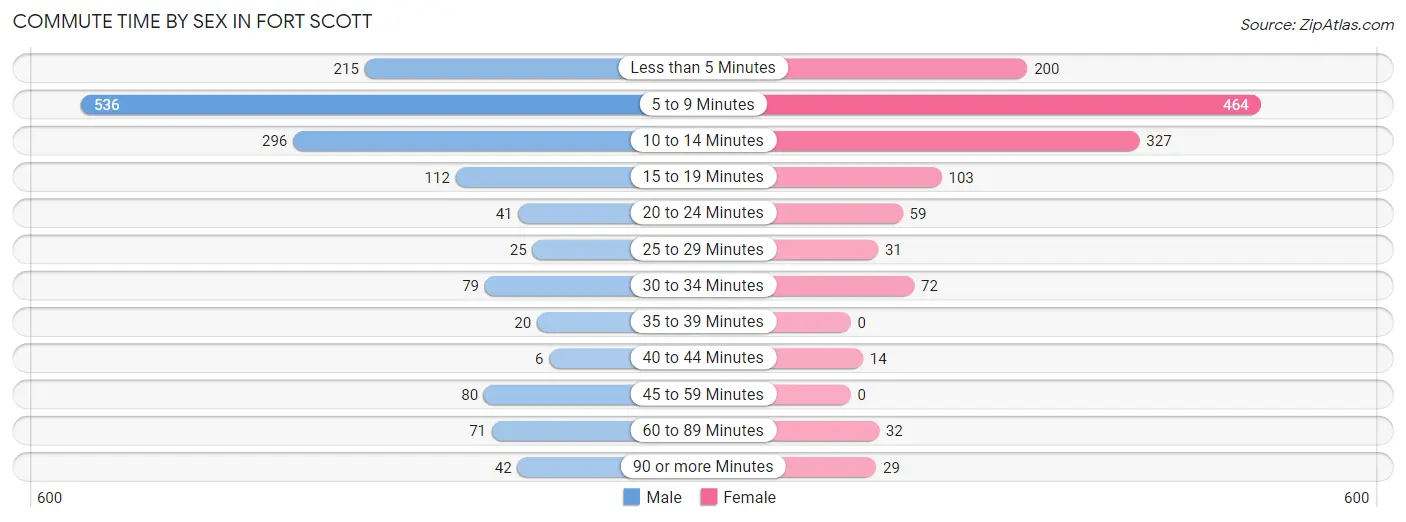
| Commute Time | Male | Female |
| Less than 5 Minutes | 215 (14.1%) | 200 (15.0%) |
| 5 to 9 Minutes | 536 (35.2%) | 464 (34.9%) |
| 10 to 14 Minutes | 296 (19.4%) | 327 (24.6%) |
| 15 to 19 Minutes | 112 (7.3%) | 103 (7.7%) |
| 20 to 24 Minutes | 41 (2.7%) | 59 (4.4%) |
| 25 to 29 Minutes | 25 (1.6%) | 31 (2.3%) |
| 30 to 34 Minutes | 79 (5.2%) | 72 (5.4%) |
| 35 to 39 Minutes | 20 (1.3%) | 0 (0.0%) |
| 40 to 44 Minutes | 6 (0.4%) | 14 (1.1%) |
| 45 to 59 Minutes | 80 (5.2%) | 0 (0.0%) |
| 60 to 89 Minutes | 71 (4.7%) | 32 (2.4%) |
| 90 or more Minutes | 42 (2.8%) | 29 (2.2%) |
Time of Departure to Work by Sex in Fort Scott
The most frequent times of departure to work in Fort Scott are 12:00 AM to 4:59 AM (252, 16.6%) for males and 6:30 AM to 6:59 AM (248, 18.6%) for females.
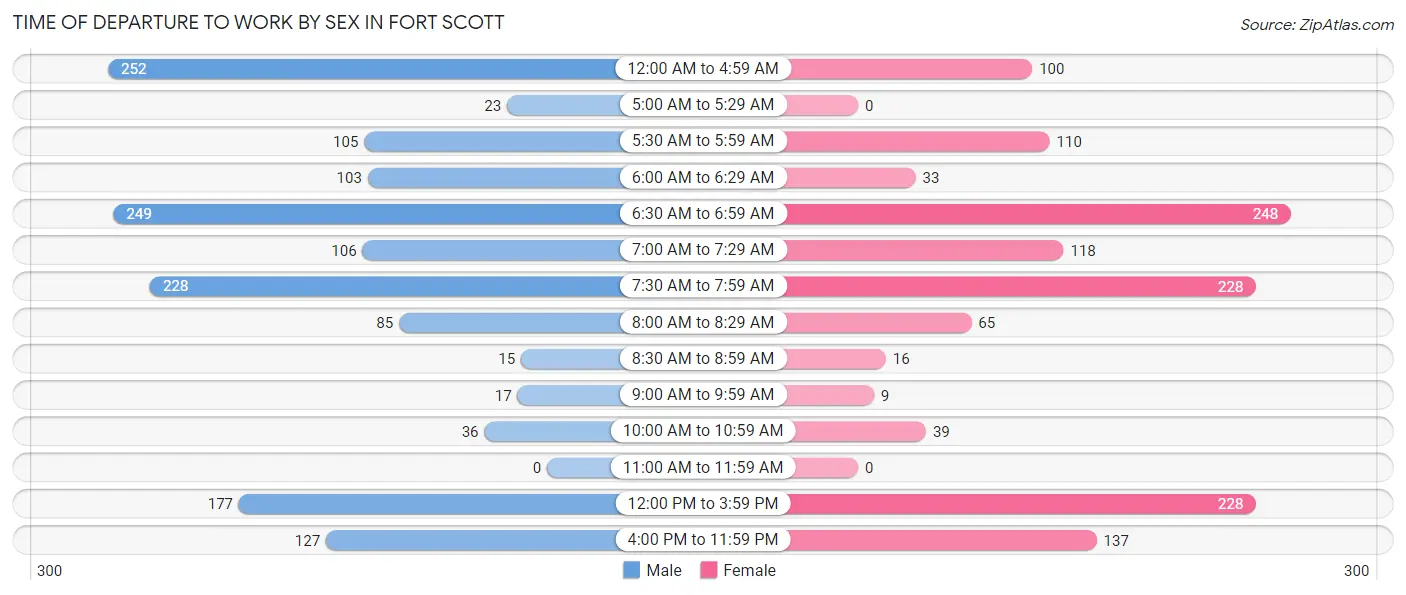
| Time of Departure | Male | Female |
| 12:00 AM to 4:59 AM | 252 (16.6%) | 100 (7.5%) |
| 5:00 AM to 5:29 AM | 23 (1.5%) | 0 (0.0%) |
| 5:30 AM to 5:59 AM | 105 (6.9%) | 110 (8.3%) |
| 6:00 AM to 6:29 AM | 103 (6.8%) | 33 (2.5%) |
| 6:30 AM to 6:59 AM | 249 (16.4%) | 248 (18.6%) |
| 7:00 AM to 7:29 AM | 106 (7.0%) | 118 (8.9%) |
| 7:30 AM to 7:59 AM | 228 (15.0%) | 228 (17.1%) |
| 8:00 AM to 8:29 AM | 85 (5.6%) | 65 (4.9%) |
| 8:30 AM to 8:59 AM | 15 (1.0%) | 16 (1.2%) |
| 9:00 AM to 9:59 AM | 17 (1.1%) | 9 (0.7%) |
| 10:00 AM to 10:59 AM | 36 (2.4%) | 39 (2.9%) |
| 11:00 AM to 11:59 AM | 0 (0.0%) | 0 (0.0%) |
| 12:00 PM to 3:59 PM | 177 (11.6%) | 228 (17.1%) |
| 4:00 PM to 11:59 PM | 127 (8.3%) | 137 (10.3%) |
| Total | 1,523 (100.0%) | 1,331 (100.0%) |
Housing Occupancy in Fort Scott
Occupancy by Ownership in Fort Scott
Of the total 3,470 dwellings in Fort Scott, owner-occupied units account for 2,095 (60.4%), while renter-occupied units make up 1,375 (39.6%).
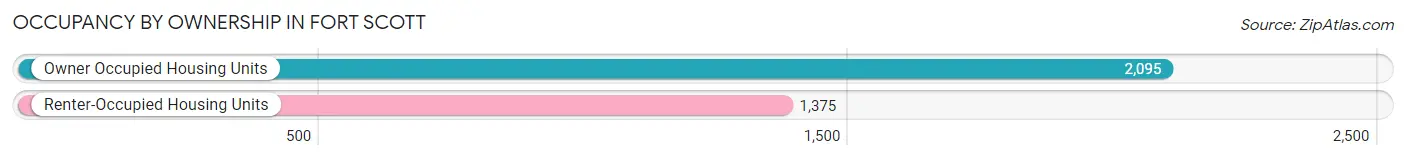
| Occupancy | # Housing Units | % Housing Units |
| Owner Occupied Housing Units | 2,095 | 60.4% |
| Renter-Occupied Housing Units | 1,375 | 39.6% |
| Total Occupied Housing Units | 3,470 | 100.0% |
Occupancy by Household Size in Fort Scott
| Household Size | # Housing Units | % Housing Units |
| 1-Person Household | 1,313 | 37.8% |
| 2-Person Household | 1,381 | 39.8% |
| 3-Person Household | 265 | 7.6% |
| 4+ Person Household | 511 | 14.7% |
| Total Housing Units | 3,470 | 100.0% |
Occupancy by Ownership by Household Size in Fort Scott
| Household Size | Owner-occupied | Renter-occupied |
| 1-Person Household | 677 (51.6%) | 636 (48.4%) |
| 2-Person Household | 947 (68.6%) | 434 (31.4%) |
| 3-Person Household | 180 (67.9%) | 85 (32.1%) |
| 4+ Person Household | 291 (57.0%) | 220 (43.0%) |
| Total Housing Units | 2,095 (60.4%) | 1,375 (39.6%) |
Occupancy by Educational Attainment in Fort Scott
| Household Size | Owner-occupied | Renter-occupied |
| Less than High School | 204 (45.2%) | 247 (54.8%) |
| High School Diploma | 450 (55.8%) | 357 (44.2%) |
| College/Associate Degree | 959 (65.5%) | 504 (34.4%) |
| Bachelor's Degree or higher | 482 (64.3%) | 267 (35.6%) |
Occupancy by Age of Householder in Fort Scott
| Age Bracket | # Households | % Households |
| Under 35 Years | 718 | 20.7% |
| 35 to 44 Years | 446 | 12.9% |
| 45 to 54 Years | 345 | 9.9% |
| 55 to 64 Years | 616 | 17.7% |
| 65 to 74 Years | 674 | 19.4% |
| 75 to 84 Years | 472 | 13.6% |
| 85 Years and Over | 199 | 5.7% |
| Total | 3,470 | 100.0% |
Housing Finances in Fort Scott
Median Income by Occupancy in Fort Scott
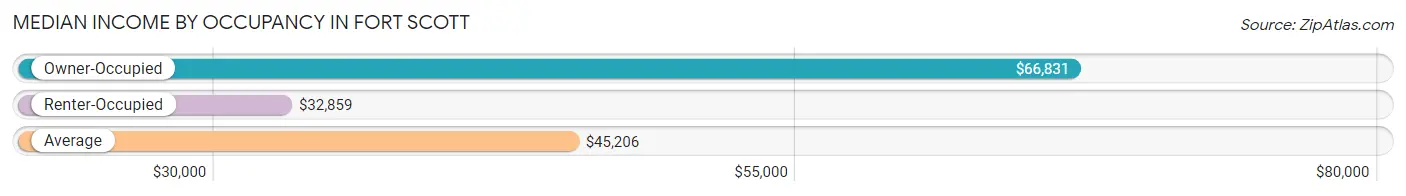
| Occupancy Type | # Households | Median Income |
| Owner-Occupied | 2,095 (60.4%) | $66,831 |
| Renter-Occupied | 1,375 (39.6%) | $32,859 |
| Average | 3,470 (100.0%) | $45,206 |
Occupancy by Householder Income Bracket in Fort Scott
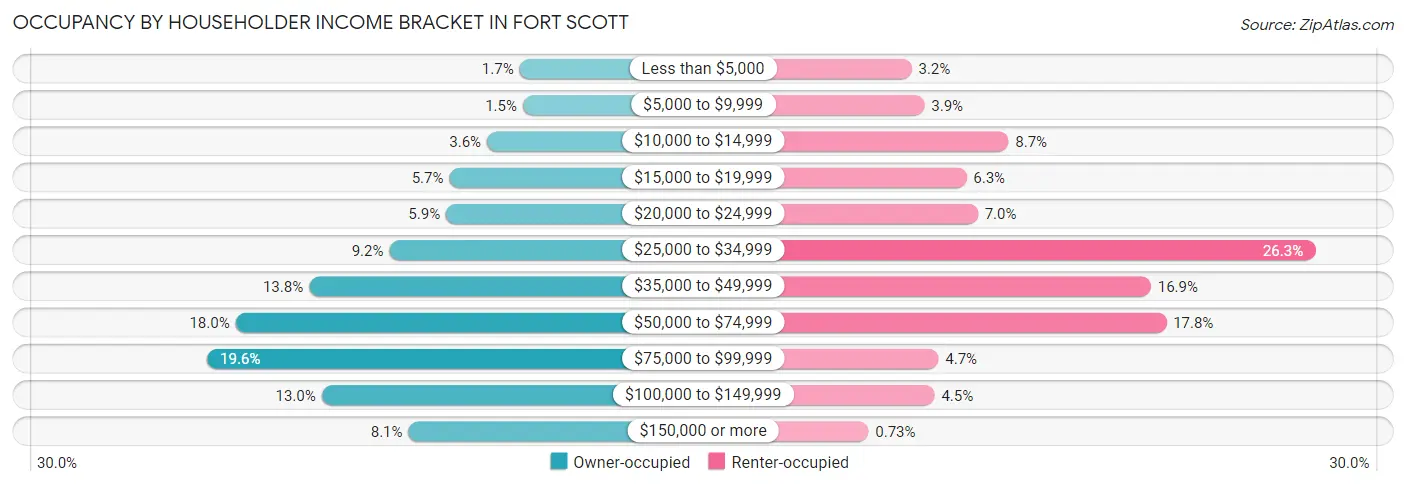
| Income Bracket | Owner-occupied | Renter-occupied |
| Less than $5,000 | 36 (1.7%) | 44 (3.2%) |
| $5,000 to $9,999 | 32 (1.5%) | 54 (3.9%) |
| $10,000 to $14,999 | 75 (3.6%) | 120 (8.7%) |
| $15,000 to $19,999 | 120 (5.7%) | 87 (6.3%) |
| $20,000 to $24,999 | 124 (5.9%) | 96 (7.0%) |
| $25,000 to $34,999 | 192 (9.2%) | 361 (26.3%) |
| $35,000 to $49,999 | 288 (13.8%) | 232 (16.9%) |
| $50,000 to $74,999 | 376 (17.9%) | 244 (17.7%) |
| $75,000 to $99,999 | 410 (19.6%) | 65 (4.7%) |
| $100,000 to $149,999 | 273 (13.0%) | 62 (4.5%) |
| $150,000 or more | 169 (8.1%) | 10 (0.7%) |
| Total | 2,095 (100.0%) | 1,375 (100.0%) |
Monthly Housing Cost Tiers in Fort Scott
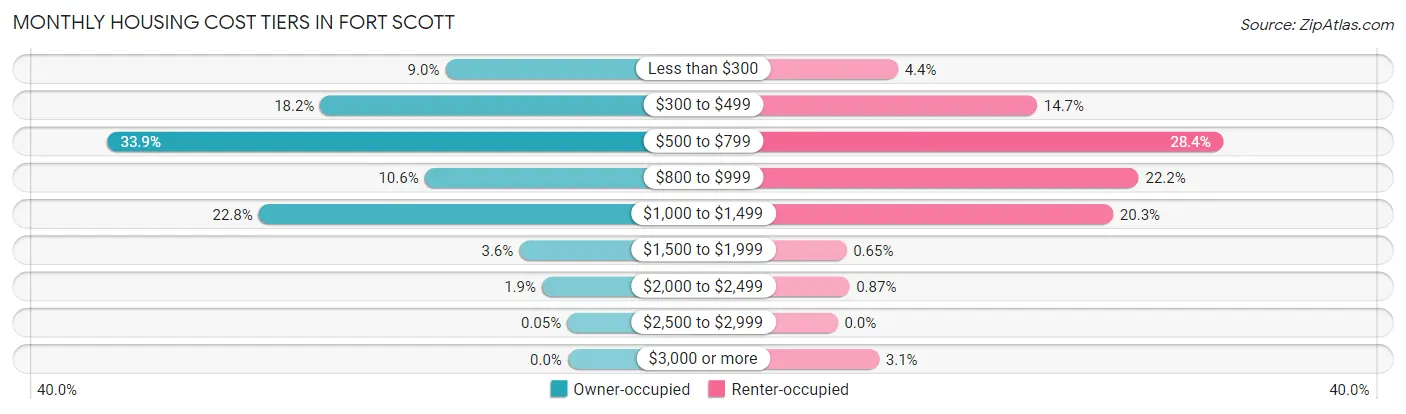
| Monthly Cost | Owner-occupied | Renter-occupied |
| Less than $300 | 189 (9.0%) | 61 (4.4%) |
| $300 to $499 | 382 (18.2%) | 202 (14.7%) |
| $500 to $799 | 710 (33.9%) | 390 (28.4%) |
| $800 to $999 | 221 (10.5%) | 305 (22.2%) |
| $1,000 to $1,499 | 477 (22.8%) | 279 (20.3%) |
| $1,500 to $1,999 | 75 (3.6%) | 9 (0.6%) |
| $2,000 to $2,499 | 40 (1.9%) | 12 (0.9%) |
| $2,500 to $2,999 | 1 (0.1%) | 0 (0.0%) |
| $3,000 or more | 0 (0.0%) | 42 (3.0%) |
| Total | 2,095 (100.0%) | 1,375 (100.0%) |
Physical Housing Characteristics in Fort Scott
Housing Structures in Fort Scott
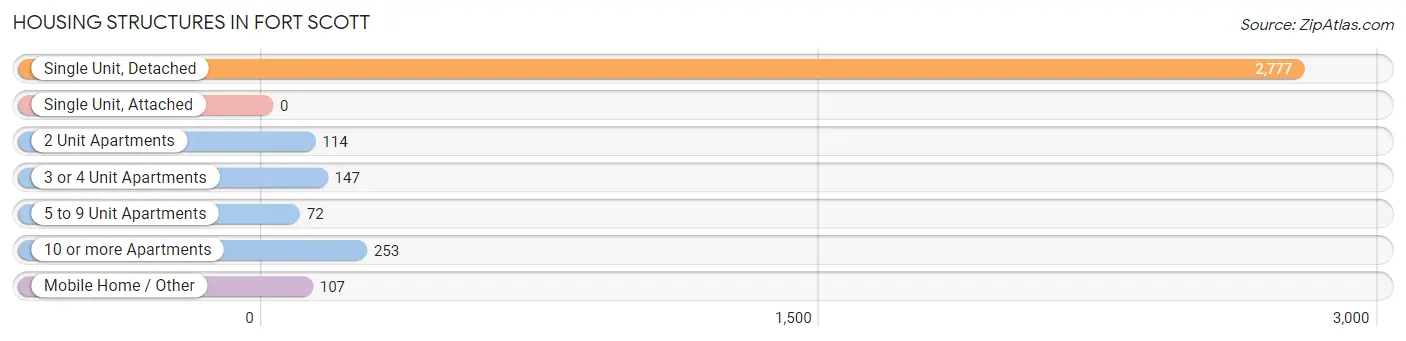
| Structure Type | # Housing Units | % Housing Units |
| Single Unit, Detached | 2,777 | 80.0% |
| Single Unit, Attached | 0 | 0.0% |
| 2 Unit Apartments | 114 | 3.3% |
| 3 or 4 Unit Apartments | 147 | 4.2% |
| 5 to 9 Unit Apartments | 72 | 2.1% |
| 10 or more Apartments | 253 | 7.3% |
| Mobile Home / Other | 107 | 3.1% |
| Total | 3,470 | 100.0% |
Housing Structures by Occupancy in Fort Scott
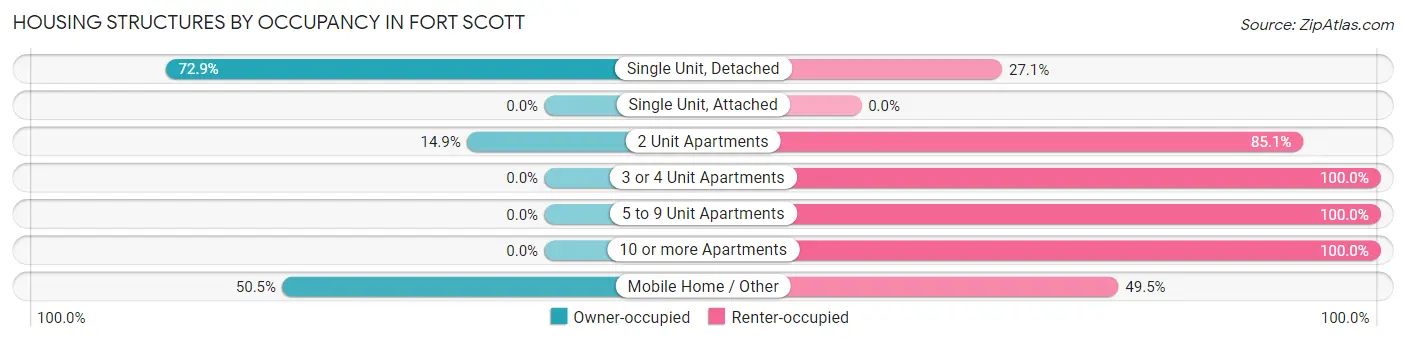
| Structure Type | Owner-occupied | Renter-occupied |
| Single Unit, Detached | 2,024 (72.9%) | 753 (27.1%) |
| Single Unit, Attached | 0 (0.0%) | 0 (0.0%) |
| 2 Unit Apartments | 17 (14.9%) | 97 (85.1%) |
| 3 or 4 Unit Apartments | 0 (0.0%) | 147 (100.0%) |
| 5 to 9 Unit Apartments | 0 (0.0%) | 72 (100.0%) |
| 10 or more Apartments | 0 (0.0%) | 253 (100.0%) |
| Mobile Home / Other | 54 (50.5%) | 53 (49.5%) |
| Total | 2,095 (60.4%) | 1,375 (39.6%) |
Housing Structures by Number of Rooms in Fort Scott
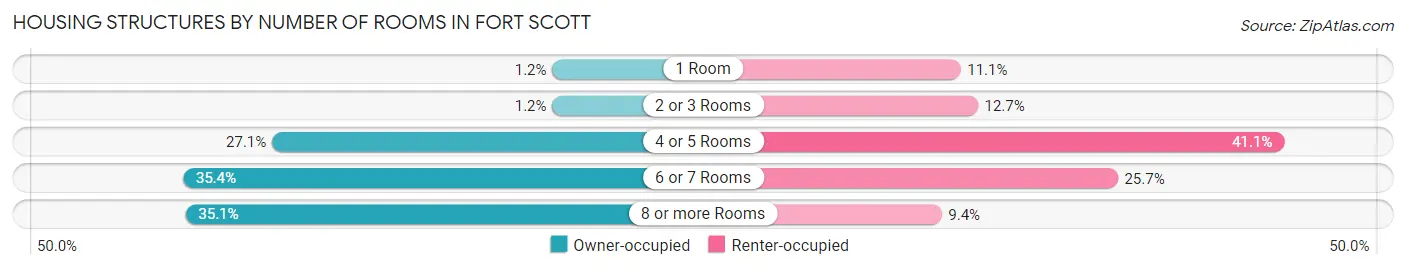
| Number of Rooms | Owner-occupied | Renter-occupied |
| 1 Room | 25 (1.2%) | 153 (11.1%) |
| 2 or 3 Rooms | 25 (1.2%) | 175 (12.7%) |
| 4 or 5 Rooms | 568 (27.1%) | 565 (41.1%) |
| 6 or 7 Rooms | 741 (35.4%) | 353 (25.7%) |
| 8 or more Rooms | 736 (35.1%) | 129 (9.4%) |
| Total | 2,095 (100.0%) | 1,375 (100.0%) |
Housing Structure by Heating Type in Fort Scott
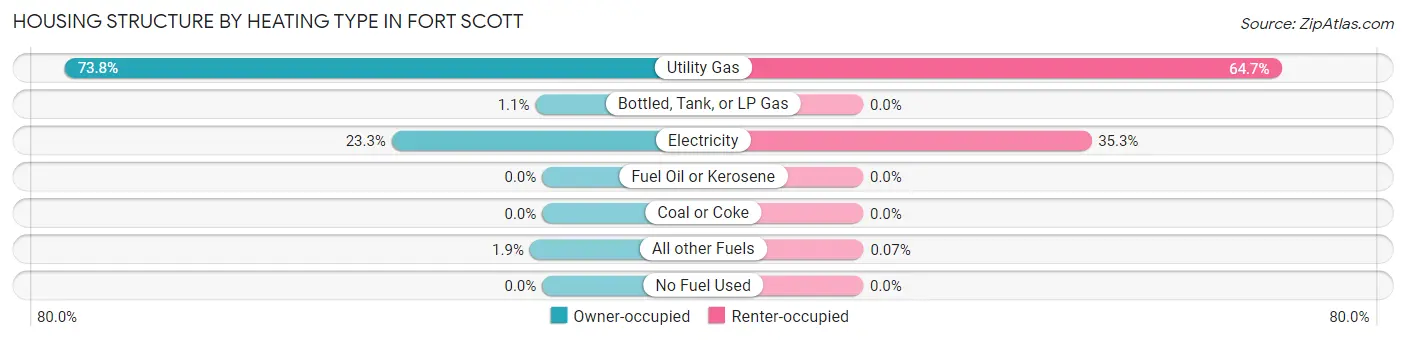
| Heating Type | Owner-occupied | Renter-occupied |
| Utility Gas | 1,546 (73.8%) | 889 (64.6%) |
| Bottled, Tank, or LP Gas | 22 (1.1%) | 0 (0.0%) |
| Electricity | 487 (23.3%) | 485 (35.3%) |
| Fuel Oil or Kerosene | 0 (0.0%) | 0 (0.0%) |
| Coal or Coke | 0 (0.0%) | 0 (0.0%) |
| All other Fuels | 40 (1.9%) | 1 (0.1%) |
| No Fuel Used | 0 (0.0%) | 0 (0.0%) |
| Total | 2,095 (100.0%) | 1,375 (100.0%) |
Household Vehicle Usage in Fort Scott
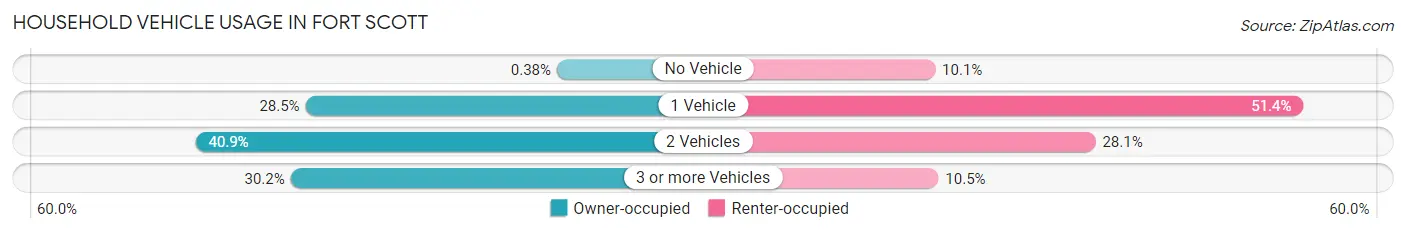
| Vehicles per Household | Owner-occupied | Renter-occupied |
| No Vehicle | 8 (0.4%) | 139 (10.1%) |
| 1 Vehicle | 598 (28.5%) | 706 (51.3%) |
| 2 Vehicles | 856 (40.9%) | 386 (28.1%) |
| 3 or more Vehicles | 633 (30.2%) | 144 (10.5%) |
| Total | 2,095 (100.0%) | 1,375 (100.0%) |
Real Estate & Mortgages in Fort Scott
Real Estate and Mortgage Overview in Fort Scott
| Characteristic | Without Mortgage | With Mortgage |
| Housing Units | 1,230 | 865 |
| Median Property Value | $84,300 | $80,500 |
| Median Household Income | $54,750 | $31 |
| Monthly Housing Costs | $536 | $0 |
| Real Estate Taxes | $1,656 | $110 |
Property Value by Mortgage Status in Fort Scott
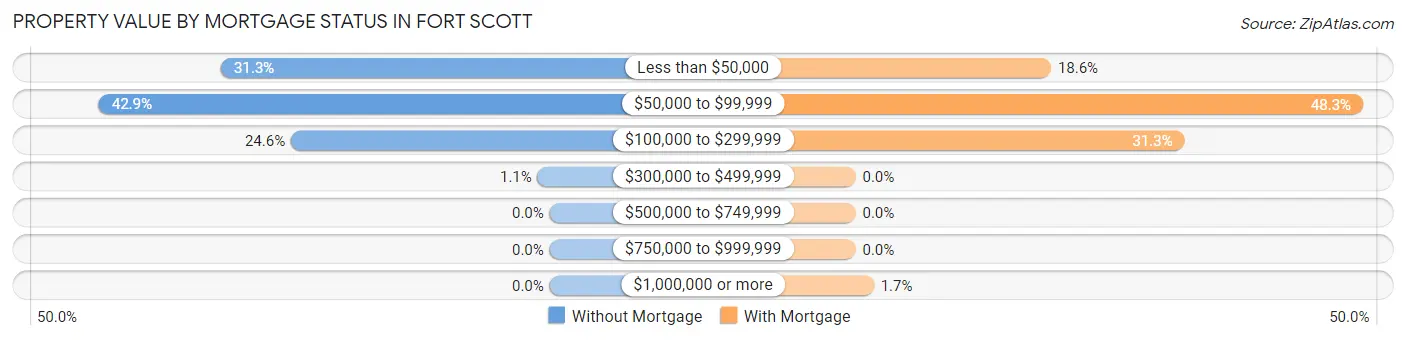
| Property Value | Without Mortgage | With Mortgage |
| Less than $50,000 | 385 (31.3%) | 161 (18.6%) |
| $50,000 to $99,999 | 528 (42.9%) | 418 (48.3%) |
| $100,000 to $299,999 | 303 (24.6%) | 271 (31.3%) |
| $300,000 to $499,999 | 14 (1.1%) | 0 (0.0%) |
| $500,000 to $749,999 | 0 (0.0%) | 0 (0.0%) |
| $750,000 to $999,999 | 0 (0.0%) | 0 (0.0%) |
| $1,000,000 or more | 0 (0.0%) | 15 (1.7%) |
| Total | 1,230 (100.0%) | 865 (100.0%) |
Household Income by Mortgage Status in Fort Scott
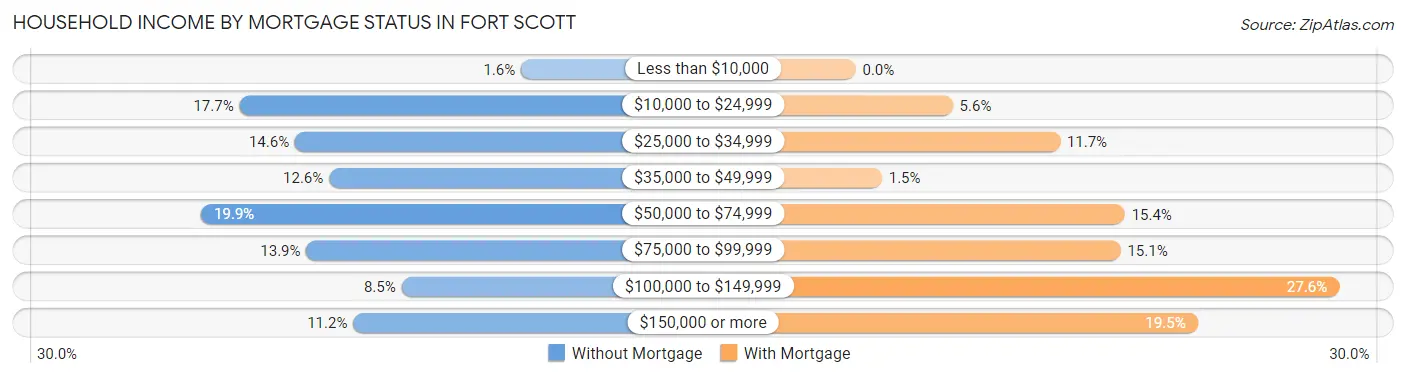
| Household Income | Without Mortgage | With Mortgage |
| Less than $10,000 | 20 (1.6%) | 0 (0.0%) |
| $10,000 to $24,999 | 218 (17.7%) | 48 (5.6%) |
| $25,000 to $34,999 | 179 (14.5%) | 101 (11.7%) |
| $35,000 to $49,999 | 155 (12.6%) | 13 (1.5%) |
| $50,000 to $74,999 | 245 (19.9%) | 133 (15.4%) |
| $75,000 to $99,999 | 171 (13.9%) | 131 (15.1%) |
| $100,000 to $149,999 | 104 (8.5%) | 239 (27.6%) |
| $150,000 or more | 138 (11.2%) | 169 (19.5%) |
| Total | 1,230 (100.0%) | 865 (100.0%) |
Property Value to Household Income Ratio in Fort Scott
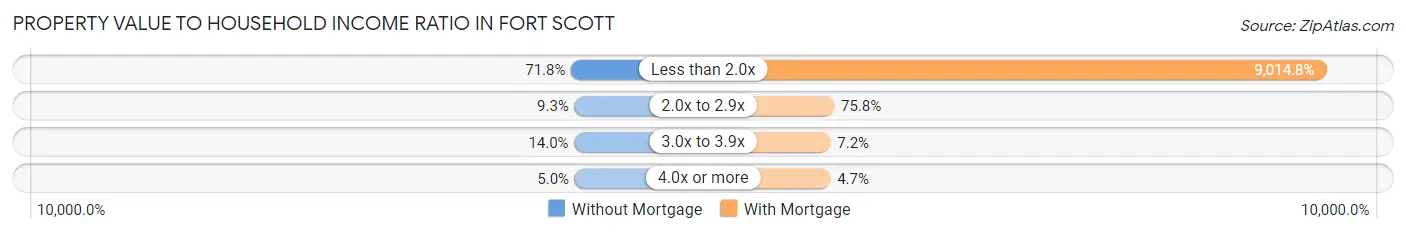
| Value-to-Income Ratio | Without Mortgage | With Mortgage |
| Less than 2.0x | 883 (71.8%) | 77,978 (9,014.8%) |
| 2.0x to 2.9x | 114 (9.3%) | 656 (75.8%) |
| 3.0x to 3.9x | 172 (14.0%) | 62 (7.2%) |
| 4.0x or more | 61 (5.0%) | 41 (4.7%) |
| Total | 1,230 (100.0%) | 865 (100.0%) |
Real Estate Taxes by Mortgage Status in Fort Scott
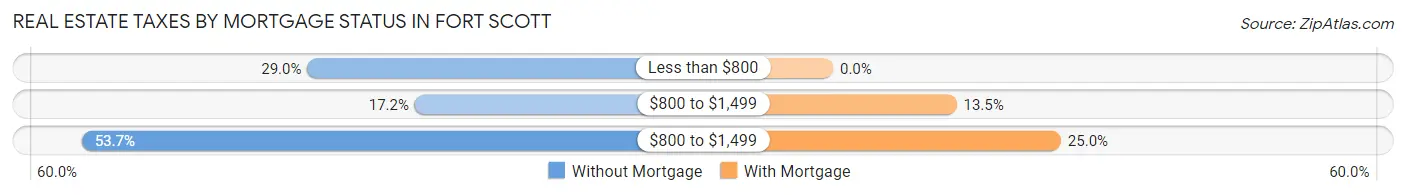
| Property Taxes | Without Mortgage | With Mortgage |
| Less than $800 | 357 (29.0%) | 0 (0.0%) |
| $800 to $1,499 | 212 (17.2%) | 117 (13.5%) |
| $800 to $1,499 | 661 (53.7%) | 216 (25.0%) |
| Total | 1,230 (100.0%) | 865 (100.0%) |
Health & Disability in Fort Scott
Health Insurance Coverage by Age in Fort Scott
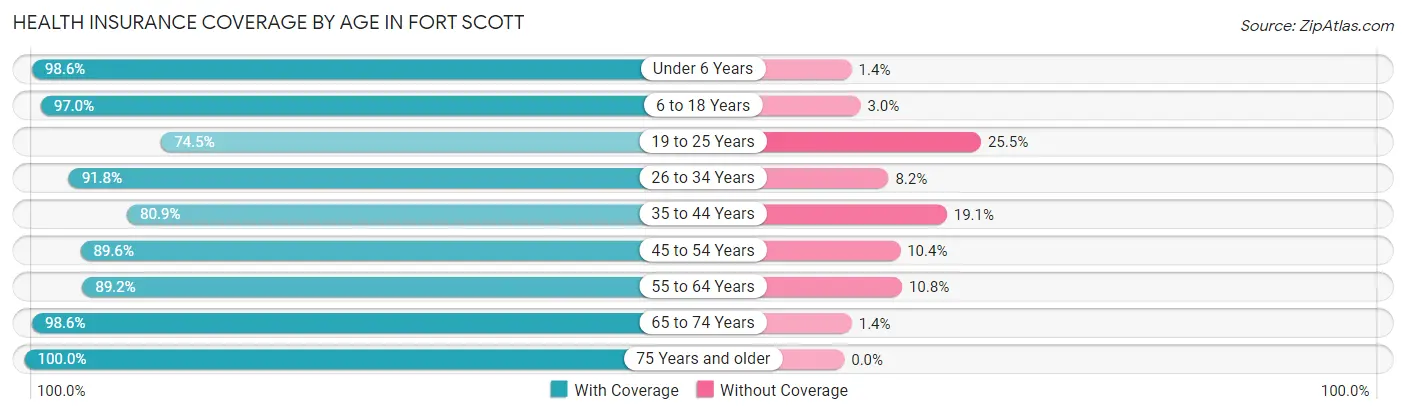
| Age Bracket | With Coverage | Without Coverage |
| Under 6 Years | 649 (98.6%) | 9 (1.4%) |
| 6 to 18 Years | 1,153 (97.0%) | 36 (3.0%) |
| 19 to 25 Years | 535 (74.5%) | 183 (25.5%) |
| 26 to 34 Years | 724 (91.8%) | 65 (8.2%) |
| 35 to 44 Years | 698 (80.9%) | 165 (19.1%) |
| 45 to 54 Years | 515 (89.6%) | 60 (10.4%) |
| 55 to 64 Years | 937 (89.2%) | 113 (10.8%) |
| 65 to 74 Years | 776 (98.6%) | 11 (1.4%) |
| 75 Years and older | 750 (100.0%) | 0 (0.0%) |
| Total | 6,737 (91.3%) | 642 (8.7%) |
Health Insurance Coverage by Citizenship Status in Fort Scott
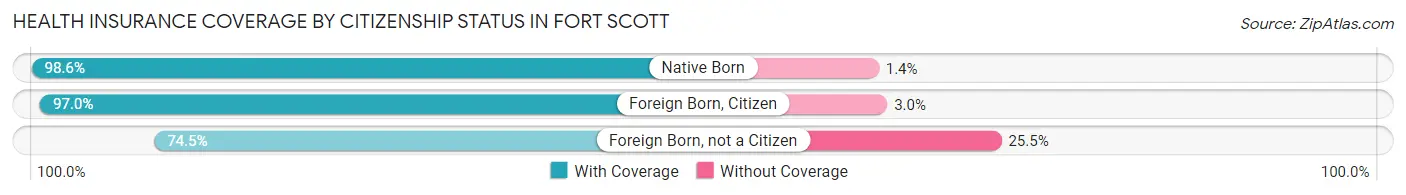
| Citizenship Status | With Coverage | Without Coverage |
| Native Born | 649 (98.6%) | 9 (1.4%) |
| Foreign Born, Citizen | 1,153 (97.0%) | 36 (3.0%) |
| Foreign Born, not a Citizen | 535 (74.5%) | 183 (25.5%) |
Health Insurance Coverage by Household Income in Fort Scott
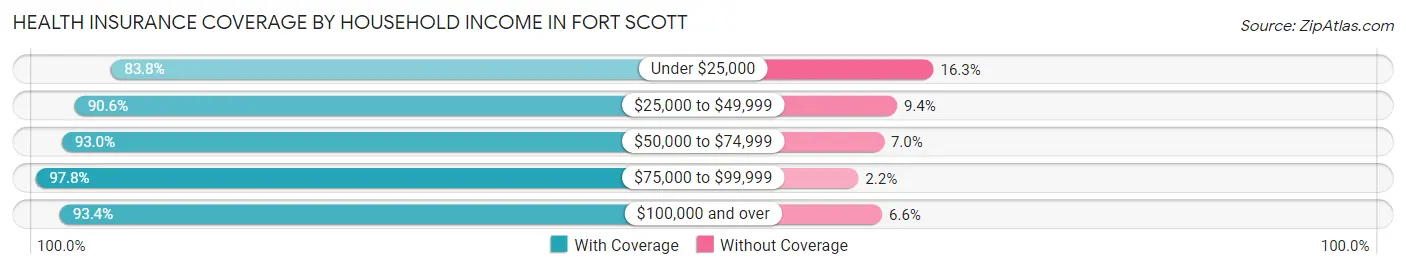
| Household Income | With Coverage | Without Coverage |
| Under $25,000 | 964 (83.8%) | 187 (16.3%) |
| $25,000 to $49,999 | 1,821 (90.6%) | 189 (9.4%) |
| $50,000 to $74,999 | 1,454 (93.0%) | 109 (7.0%) |
| $75,000 to $99,999 | 1,258 (97.8%) | 28 (2.2%) |
| $100,000 and over | 1,073 (93.4%) | 76 (6.6%) |
Public vs Private Health Insurance Coverage by Age in Fort Scott
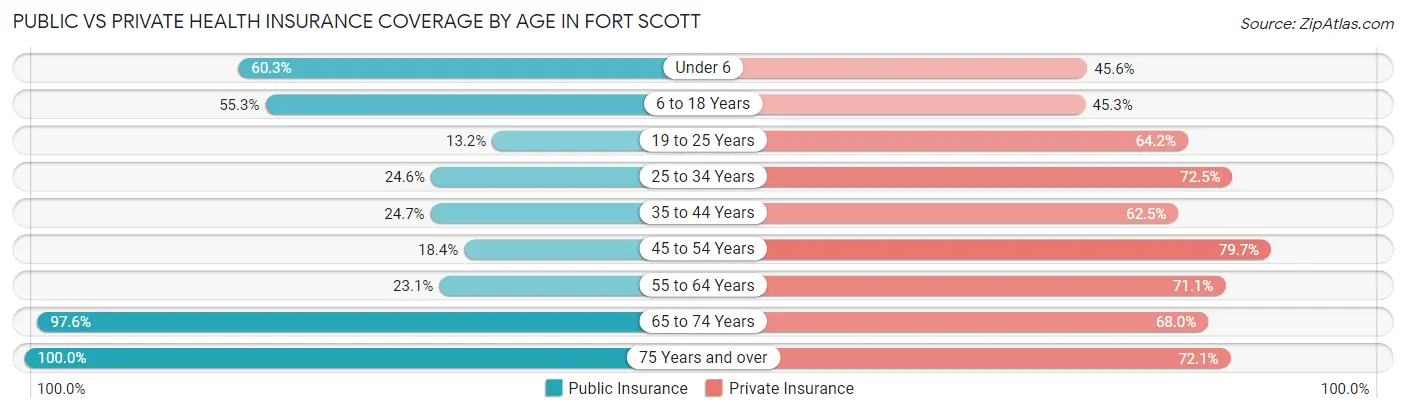
| Age Bracket | Public Insurance | Private Insurance |
| Under 6 | 397 (60.3%) | 300 (45.6%) |
| 6 to 18 Years | 658 (55.3%) | 538 (45.3%) |
| 19 to 25 Years | 95 (13.2%) | 461 (64.2%) |
| 25 to 34 Years | 194 (24.6%) | 572 (72.5%) |
| 35 to 44 Years | 213 (24.7%) | 539 (62.5%) |
| 45 to 54 Years | 106 (18.4%) | 458 (79.6%) |
| 55 to 64 Years | 242 (23.1%) | 747 (71.1%) |
| 65 to 74 Years | 768 (97.6%) | 535 (68.0%) |
| 75 Years and over | 750 (100.0%) | 541 (72.1%) |
| Total | 3,423 (46.4%) | 4,691 (63.6%) |
Disability Status by Sex by Age in Fort Scott
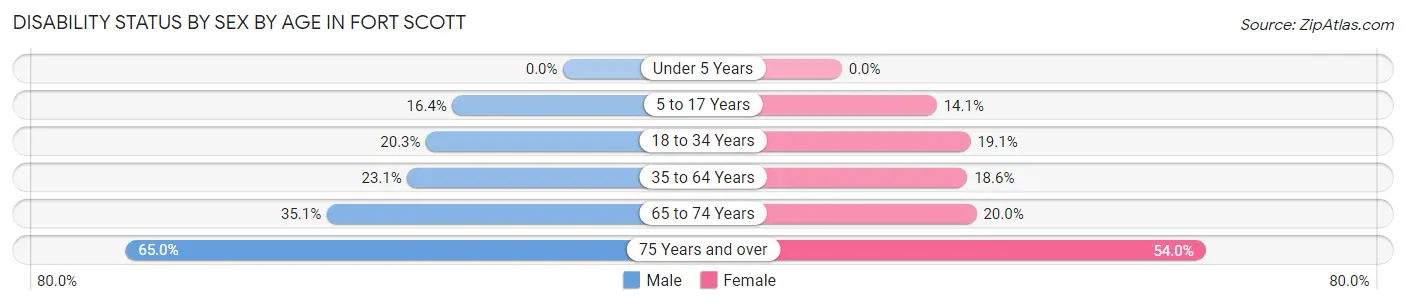
| Age Bracket | Male | Female |
| Under 5 Years | 0 (0.0%) | 0 (0.0%) |
| 5 to 17 Years | 84 (16.4%) | 97 (14.1%) |
| 18 to 34 Years | 156 (20.3%) | 171 (19.1%) |
| 35 to 64 Years | 285 (23.1%) | 234 (18.6%) |
| 65 to 74 Years | 120 (35.1%) | 89 (20.0%) |
| 75 Years and over | 147 (65.0%) | 283 (54.0%) |
Disability Class by Sex by Age in Fort Scott
Disability Class: Hearing Difficulty
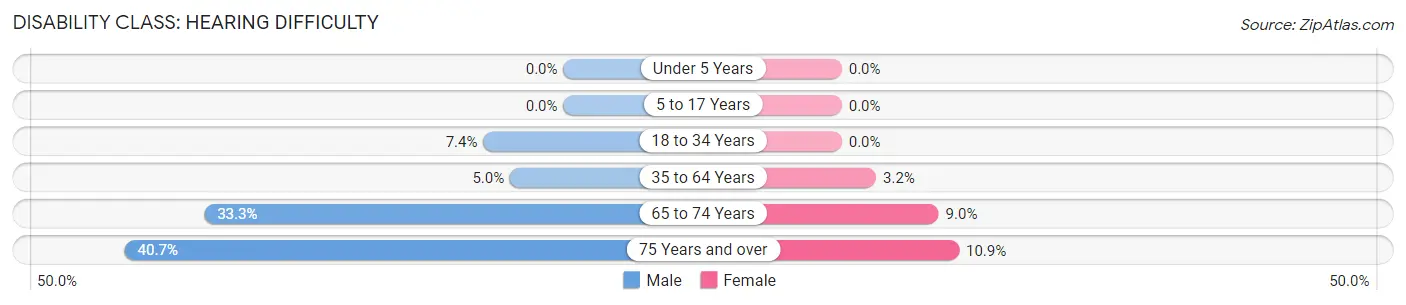
| Age Bracket | Male | Female |
| Under 5 Years | 0 (0.0%) | 0 (0.0%) |
| 5 to 17 Years | 0 (0.0%) | 0 (0.0%) |
| 18 to 34 Years | 57 (7.4%) | 0 (0.0%) |
| 35 to 64 Years | 61 (5.0%) | 40 (3.2%) |
| 65 to 74 Years | 114 (33.3%) | 40 (9.0%) |
| 75 Years and over | 92 (40.7%) | 57 (10.9%) |
Disability Class: Vision Difficulty
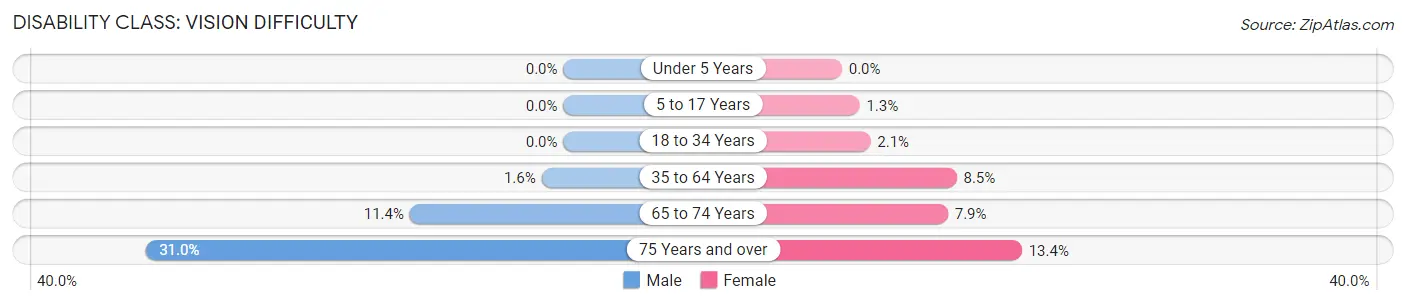
| Age Bracket | Male | Female |
| Under 5 Years | 0 (0.0%) | 0 (0.0%) |
| 5 to 17 Years | 0 (0.0%) | 9 (1.3%) |
| 18 to 34 Years | 0 (0.0%) | 19 (2.1%) |
| 35 to 64 Years | 20 (1.6%) | 107 (8.5%) |
| 65 to 74 Years | 39 (11.4%) | 35 (7.9%) |
| 75 Years and over | 70 (31.0%) | 70 (13.4%) |
Disability Class: Cognitive Difficulty
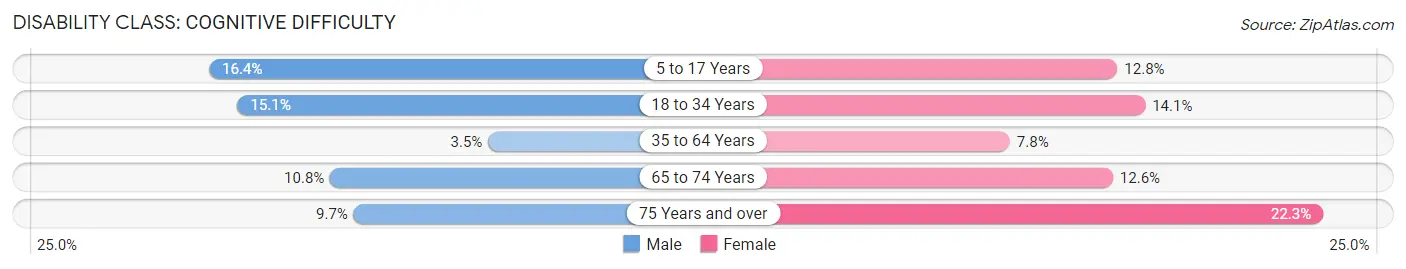
| Age Bracket | Male | Female |
| 5 to 17 Years | 84 (16.4%) | 88 (12.8%) |
| 18 to 34 Years | 116 (15.1%) | 126 (14.1%) |
| 35 to 64 Years | 43 (3.5%) | 98 (7.8%) |
| 65 to 74 Years | 37 (10.8%) | 56 (12.6%) |
| 75 Years and over | 22 (9.7%) | 117 (22.3%) |
Disability Class: Ambulatory Difficulty
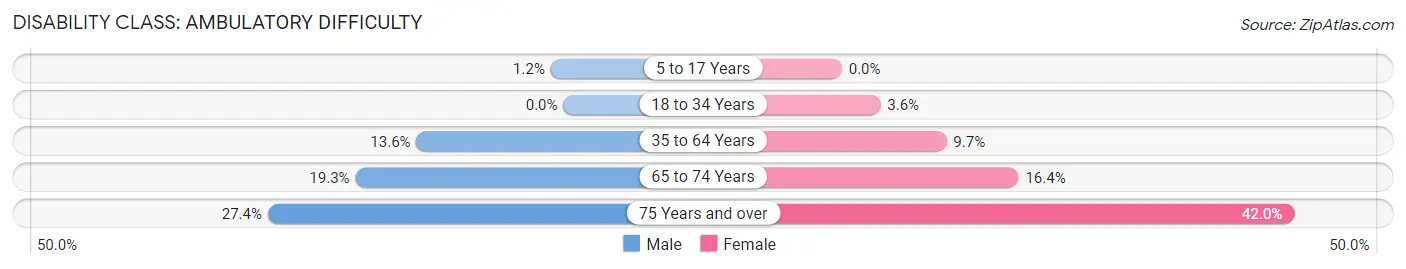
| Age Bracket | Male | Female |
| 5 to 17 Years | 6 (1.2%) | 0 (0.0%) |
| 18 to 34 Years | 0 (0.0%) | 32 (3.6%) |
| 35 to 64 Years | 168 (13.6%) | 122 (9.7%) |
| 65 to 74 Years | 66 (19.3%) | 73 (16.4%) |
| 75 Years and over | 62 (27.4%) | 220 (42.0%) |
Disability Class: Self-Care Difficulty
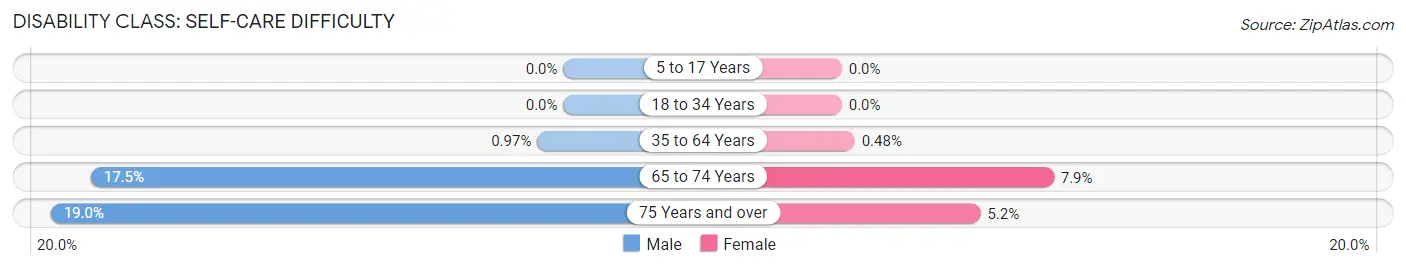
| Age Bracket | Male | Female |
| 5 to 17 Years | 0 (0.0%) | 0 (0.0%) |
| 18 to 34 Years | 0 (0.0%) | 0 (0.0%) |
| 35 to 64 Years | 12 (1.0%) | 6 (0.5%) |
| 65 to 74 Years | 60 (17.5%) | 35 (7.9%) |
| 75 Years and over | 43 (19.0%) | 27 (5.1%) |
Technology Access in Fort Scott
Computing Device Access in Fort Scott
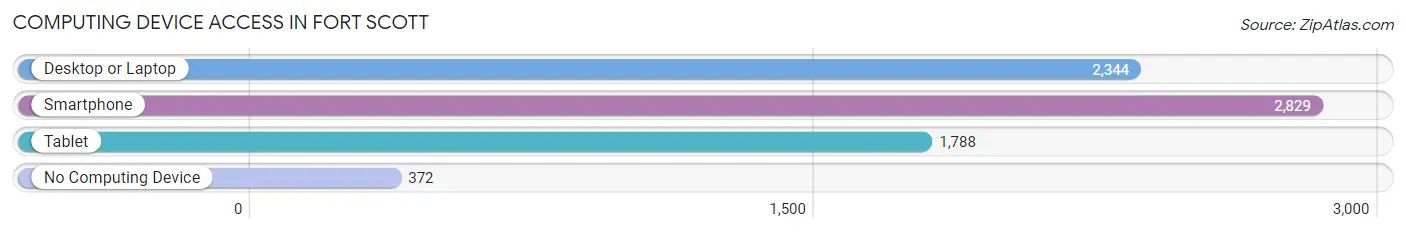
| Device Type | # Households | % Households |
| Desktop or Laptop | 2,344 | 67.5% |
| Smartphone | 2,829 | 81.5% |
| Tablet | 1,788 | 51.5% |
| No Computing Device | 372 | 10.7% |
| Total | 3,470 | 100.0% |
Internet Access in Fort Scott
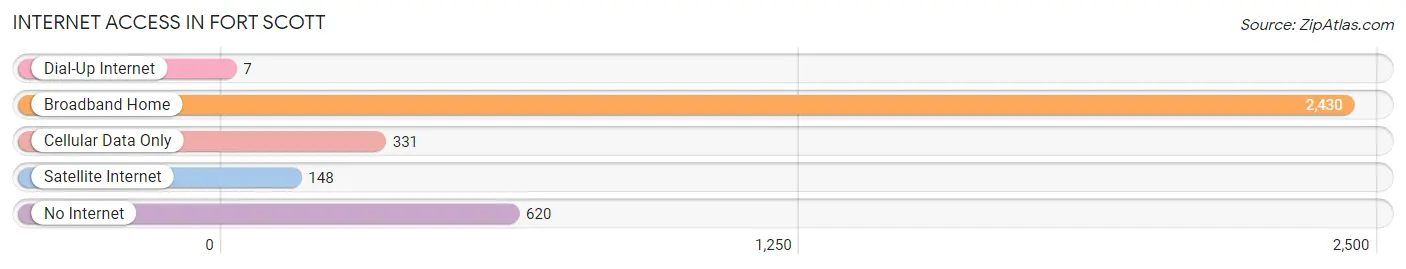
| Internet Type | # Households | % Households |
| Dial-Up Internet | 7 | 0.2% |
| Broadband Home | 2,430 | 70.0% |
| Cellular Data Only | 331 | 9.5% |
| Satellite Internet | 148 | 4.3% |
| No Internet | 620 | 17.9% |
| Total | 3,470 | 100.0% |
Fort Scott Summary
Fort Scott, Kansas is a small city located in Bourbon County, in the southeastern corner of the state. It is situated on the Marmaton River, and is the county seat of Bourbon County. The city has a population of 8,087, according to the 2010 census.
Fort Scott was founded in 1842 as a military post, and was named after General Winfield Scott. The fort was established to protect the Santa Fe Trail, and was an important stop for travelers and traders. The fort was abandoned in 1853, but the town of Fort Scott was established in 1855.
Fort Scott is located in the Ozark Plateau region of Kansas, and is part of the Osage Plains. The city is situated on the Marmaton River, and is surrounded by rolling hills and wooded areas. The climate is humid continental, with hot summers and cold winters.
The economy of Fort Scott is largely based on agriculture and manufacturing. The city is home to several large companies, including Fort Scott National Bank, Fort Scott Community College, and Fort Scott Manufacturing. The city also has a strong tourism industry, with many attractions such as the Fort Scott National Historic Site, the Fort Scott Historic District, and the Fort Scott National Cemetery.
Fort Scott has a diverse population, with a median age of 37.7 years. The racial makeup of the city is 87.3% White, 8.2% African American, 0.7% Native American, 0.7% Asian, 0.2% Pacific Islander, and 2.1% from other races. The median household income is $35,945, and the median family income is $45,945.
Fort Scott is served by the Fort Scott Public School District, which includes four elementary schools, one middle school, and one high school. The city is also home to Fort Scott Community College, which offers a variety of degree and certificate programs.
Fort Scott is a small city with a rich history and a diverse population. It is home to a variety of businesses and attractions, and is a great place to live and work. With its beautiful scenery and friendly people, Fort Scott is a great place to call home.
Common Questions
What is Per Capita Income in Fort Scott?
Per Capita income in Fort Scott is $27,897.
What is the Median Family Income in Fort Scott?
Median Family Income in Fort Scott is $71,250.
What is the Median Household income in Fort Scott?
Median Household Income in Fort Scott is $45,206.
What is Income or Wage Gap in Fort Scott?
Income or Wage Gap in Fort Scott is 35.1%.
Women in Fort Scott earn 64.9 cents for every dollar earned by a man.
What is Family Income Deficit in Fort Scott?
Family Income Deficit in Fort Scott is $11,712.
Families that are below poverty line in Fort Scott earn $11,712 less on average than the poverty threshold level.
What is Inequality or Gini Index in Fort Scott?
Inequality or Gini Index in Fort Scott is 0.44.
What is the Total Population of Fort Scott?
Total Population of Fort Scott is 7,569.
What is the Total Male Population of Fort Scott?
Total Male Population of Fort Scott is 3,454.
What is the Total Female Population of Fort Scott?
Total Female Population of Fort Scott is 4,115.
What is the Ratio of Males per 100 Females in Fort Scott?
There are 83.94 Males per 100 Females in Fort Scott.
What is the Ratio of Females per 100 Males in Fort Scott?
There are 119.14 Females per 100 Males in Fort Scott.
What is the Median Population Age in Fort Scott?
Median Population Age in Fort Scott is 38.3 Years.
What is the Average Family Size in Fort Scott
Average Family Size in Fort Scott is 2.7 People.
What is the Average Household Size in Fort Scott
Average Household Size in Fort Scott is 2.1 People.
How Large is the Labor Force in Fort Scott?
There are 3,364 People in the Labor Forcein in Fort Scott.
What is the Percentage of People in the Labor Force in Fort Scott?
56.0% of People are in the Labor Force in Fort Scott.
What is the Unemployment Rate in Fort Scott?
Unemployment Rate in Fort Scott is 4.5%.