Frontenac, KS Map & Demographics
Frontenac Map
Frontenac Overview
$27,597
PER CAPITA INCOME
$71,289
AVG FAMILY INCOME
$54,905
AVG HOUSEHOLD INCOME
6.8%
WAGE / INCOME GAP [ % ]
93.2¢/ $1
WAGE / INCOME GAP [ $ ]
0.37
INEQUALITY / GINI INDEX
3,384
TOTAL POPULATION
1,609
MALE POPULATION
1,775
FEMALE POPULATION
90.65
MALES / 100 FEMALES
110.32
FEMALES / 100 MALES
35.9
MEDIAN AGE
2.7
AVG FAMILY SIZE
2.4
AVG HOUSEHOLD SIZE
1,719
LABOR FORCE [ PEOPLE ]
67.4%
PERCENT IN LABOR FORCE
1.6%
UNEMPLOYMENT RATE
Frontenac Zip Codes
Frontenac Area Codes
Income in Frontenac
Income Overview in Frontenac
Per Capita Income in Frontenac is $27,597, while median incomes of families and households are $71,289 and $54,905 respectively.
| Characteristic | Number | Measure |
| Per Capita Income | 3,384 | $27,597 |
| Median Family Income | 995 | $71,289 |
| Mean Family Income | 995 | $77,956 |
| Median Household Income | 1,358 | $54,905 |
| Mean Household Income | 1,358 | $67,911 |
| Income Deficit | 995 | $0 |
| Wage / Income Gap (%) | 3,384 | 6.79% |
| Wage / Income Gap ($) | 3,384 | 93.21¢ per $1 |
| Gini / Inequality Index | 3,384 | 0.37 |
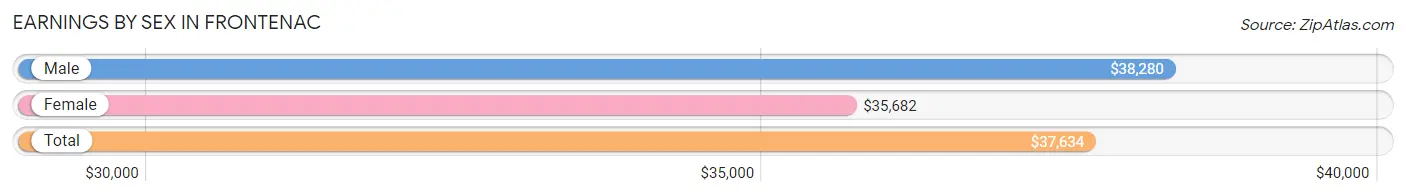
Earnings by Sex in Frontenac
Average Earnings in Frontenac are $37,634, $38,280 for men and $35,682 for women, a difference of 6.8%.
| Sex | Number | Average Earnings |
| Male | 864 (49.4%) | $38,280 |
| Female | 886 (50.6%) | $35,682 |
| Total | 1,750 (100.0%) | $37,634 |
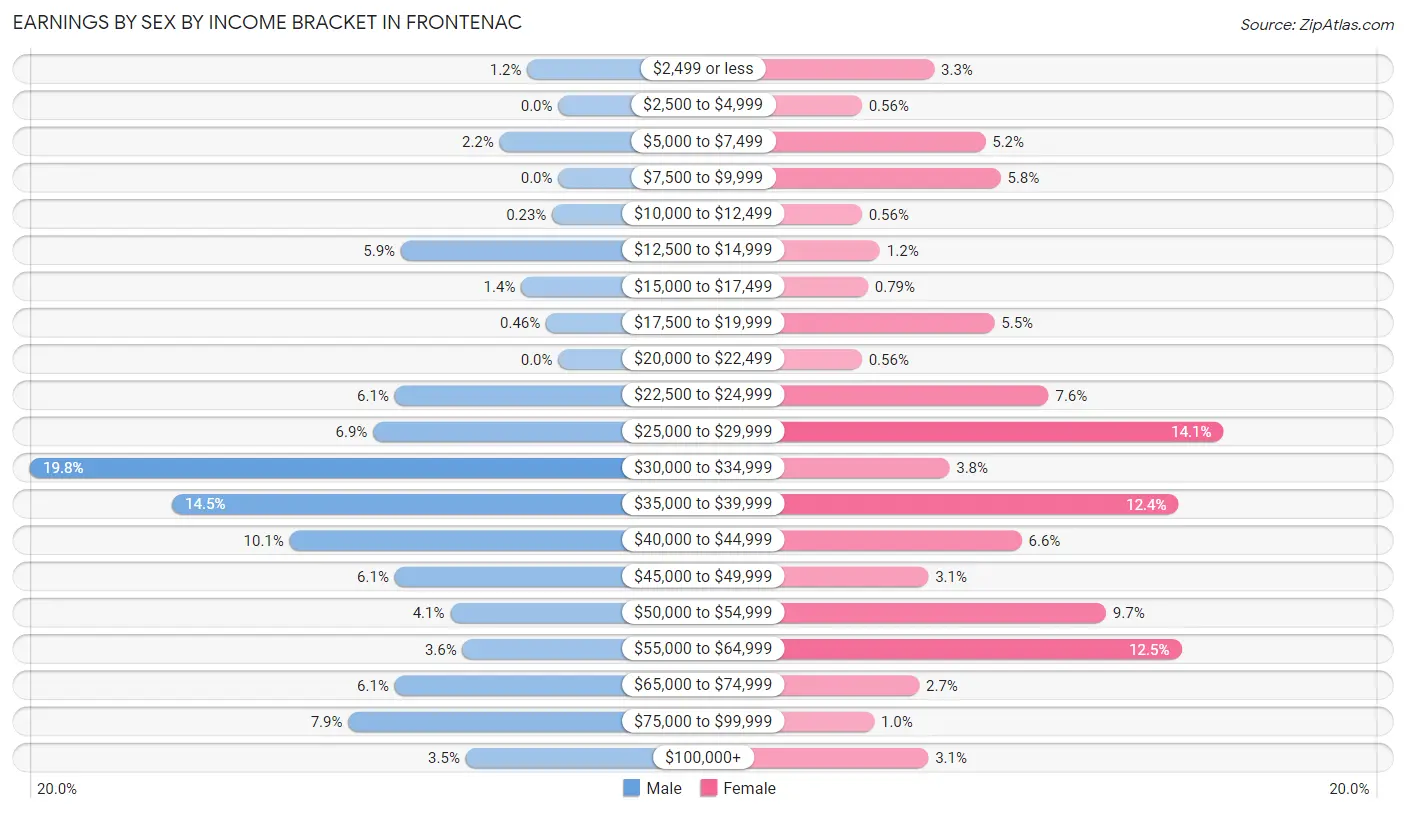
Earnings by Sex by Income Bracket in Frontenac
The most common earnings brackets in Frontenac are $30,000 to $34,999 for men (171 | 19.8%) and $25,000 to $29,999 for women (125 | 14.1%).
| Income | Male | Female |
| $2,499 or less | 10 (1.2%) | 29 (3.3%) |
| $2,500 to $4,999 | 0 (0.0%) | 5 (0.6%) |
| $5,000 to $7,499 | 19 (2.2%) | 46 (5.2%) |
| $7,500 to $9,999 | 0 (0.0%) | 51 (5.8%) |
| $10,000 to $12,499 | 2 (0.2%) | 5 (0.6%) |
| $12,500 to $14,999 | 51 (5.9%) | 11 (1.2%) |
| $15,000 to $17,499 | 12 (1.4%) | 7 (0.8%) |
| $17,500 to $19,999 | 4 (0.5%) | 49 (5.5%) |
| $20,000 to $22,499 | 0 (0.0%) | 5 (0.6%) |
| $22,500 to $24,999 | 53 (6.1%) | 67 (7.6%) |
| $25,000 to $29,999 | 60 (6.9%) | 125 (14.1%) |
| $30,000 to $34,999 | 171 (19.8%) | 34 (3.8%) |
| $35,000 to $39,999 | 125 (14.5%) | 110 (12.4%) |
| $40,000 to $44,999 | 87 (10.1%) | 58 (6.6%) |
| $45,000 to $49,999 | 53 (6.1%) | 27 (3.0%) |
| $50,000 to $54,999 | 35 (4.1%) | 86 (9.7%) |
| $55,000 to $64,999 | 31 (3.6%) | 111 (12.5%) |
| $65,000 to $74,999 | 53 (6.1%) | 24 (2.7%) |
| $75,000 to $99,999 | 68 (7.9%) | 9 (1.0%) |
| $100,000+ | 30 (3.5%) | 27 (3.0%) |
| Total | 864 (100.0%) | 886 (100.0%) |
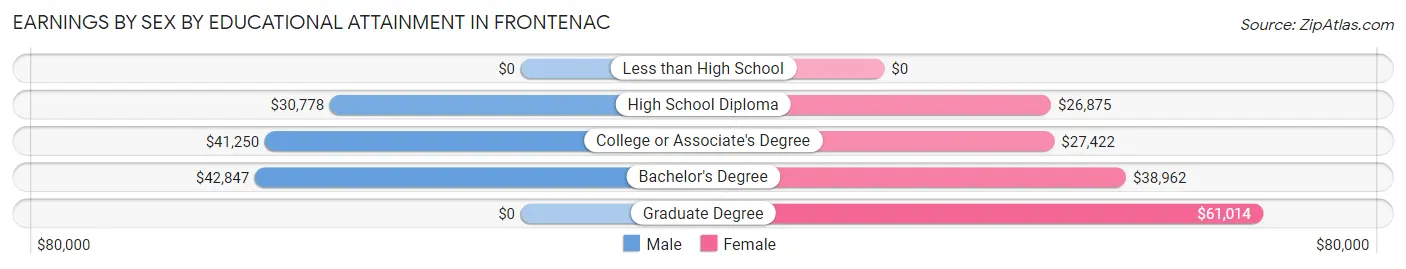
Earnings by Sex by Educational Attainment in Frontenac
Average earnings in Frontenac are $39,220 for men and $37,987 for women, a difference of 3.1%. Men with an educational attainment of bachelor's degree enjoy the highest average annual earnings of $42,847, while those with high school diploma education earn the least with $30,778. Women with an educational attainment of graduate degree earn the most with the average annual earnings of $61,014, while those with high school diploma education have the smallest earnings of $26,875.
| Educational Attainment | Male Income | Female Income |
| Less than High School | - | - |
| High School Diploma | $30,778 | $26,875 |
| College or Associate's Degree | $41,250 | $27,422 |
| Bachelor's Degree | $42,847 | $38,962 |
| Graduate Degree | - | - |
| Total | $39,220 | $37,987 |
Family Income in Frontenac
Family Income Brackets in Frontenac
According to the Frontenac family income data, there are 214 families falling into the $100,000 to $149,999 income range, which is the most common income bracket and makes up 21.5% of all families. Conversely, the less than $10,000 income bracket is the least frequent group with only 8 families (0.8%) belonging to this category.
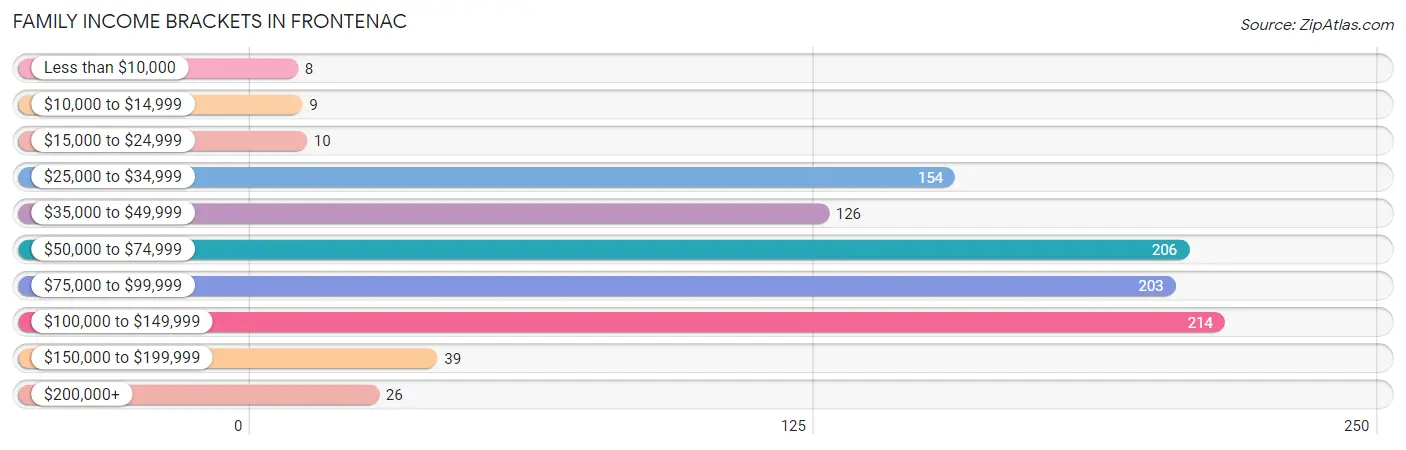
| Income Bracket | # Families | % Families |
| Less than $10,000 | 8 | 0.8% |
| $10,000 to $14,999 | 9 | 0.9% |
| $15,000 to $24,999 | 10 | 1.0% |
| $25,000 to $34,999 | 154 | 15.5% |
| $35,000 to $49,999 | 126 | 12.7% |
| $50,000 to $74,999 | 206 | 20.7% |
| $75,000 to $99,999 | 203 | 20.4% |
| $100,000 to $149,999 | 214 | 21.5% |
| $150,000 to $199,999 | 39 | 3.9% |
| $200,000+ | 26 | 2.6% |
Family Income by Famaliy Size in Frontenac
4-person families (221 | 22.2%) account for the highest median family income in Frontenac with $82,102 per family, while 2-person families (492 | 49.4%) have the highest median income of $25,714 per family member.
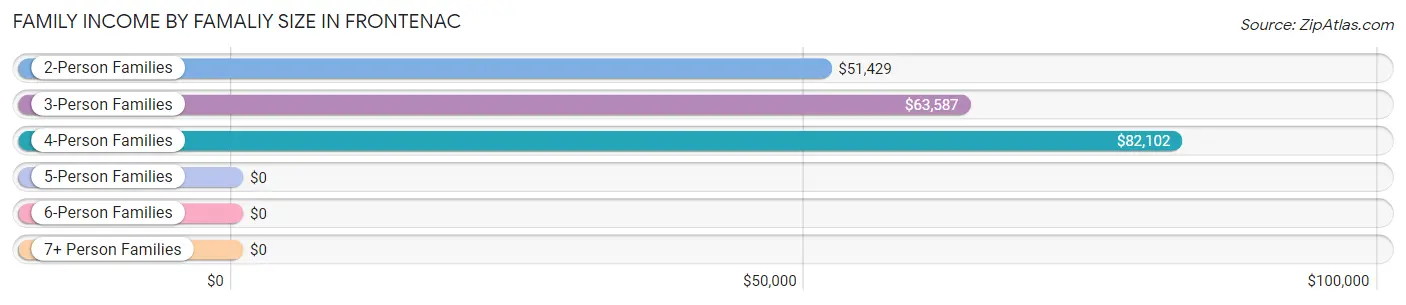
| Income Bracket | # Families | Median Income |
| 2-Person Families | 492 (49.4%) | $51,429 |
| 3-Person Families | 202 (20.3%) | $63,587 |
| 4-Person Families | 221 (22.2%) | $82,102 |
| 5-Person Families | 80 (8.0%) | $0 |
| 6-Person Families | 0 (0.0%) | $0 |
| 7+ Person Families | 0 (0.0%) | $0 |
| Total | 995 (100.0%) | $71,289 |
Family Income by Number of Earners in Frontenac
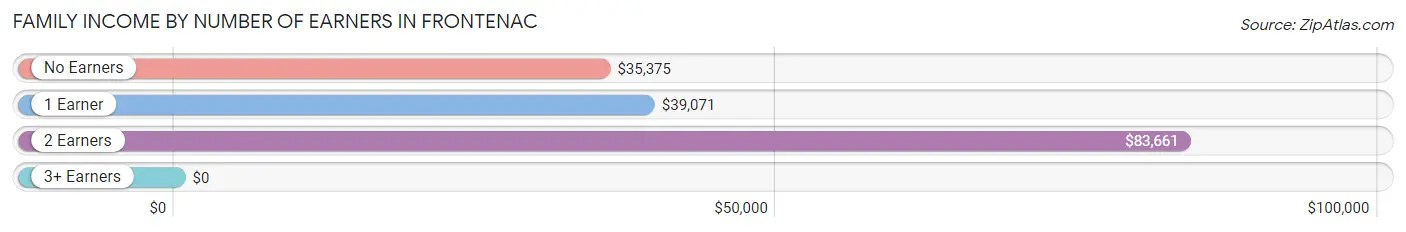
| Number of Earners | # Families | Median Income |
| No Earners | 119 (12.0%) | $35,375 |
| 1 Earner | 297 (29.8%) | $39,071 |
| 2 Earners | 537 (54.0%) | $83,661 |
| 3+ Earners | 42 (4.2%) | $0 |
| Total | 995 (100.0%) | $71,289 |
Household Income in Frontenac
Household Income Brackets in Frontenac
With 253 households falling in the category, the $50,000 to $74,999 income range is the most frequent in Frontenac, accounting for 18.6% of all households. In contrast, only 26 households (1.9%) fall into the $200,000+ income bracket, making it the least populous group.
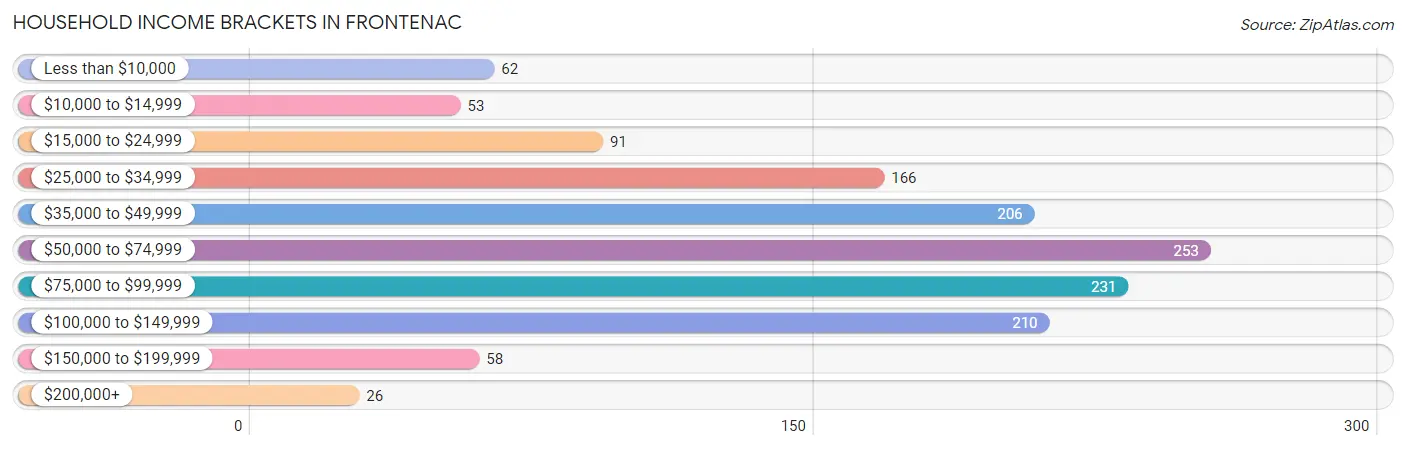
| Income Bracket | # Households | % Households |
| Less than $10,000 | 62 | 4.6% |
| $10,000 to $14,999 | 53 | 3.9% |
| $15,000 to $24,999 | 91 | 6.7% |
| $25,000 to $34,999 | 166 | 12.2% |
| $35,000 to $49,999 | 206 | 15.2% |
| $50,000 to $74,999 | 253 | 18.6% |
| $75,000 to $99,999 | 231 | 17.0% |
| $100,000 to $149,999 | 210 | 15.5% |
| $150,000 to $199,999 | 58 | 4.3% |
| $200,000+ | 26 | 1.9% |
Household Income by Householder Age in Frontenac
The median household income in Frontenac is $54,905, with the highest median household income of $75,904 found in the 25 to 44 years age bracket for the primary householder. A total of 554 households (40.8%) fall into this category. Meanwhile, the 15 to 24 years age bracket for the primary householder has the lowest median household income of $0, with 68 households (5.0%) in this group.
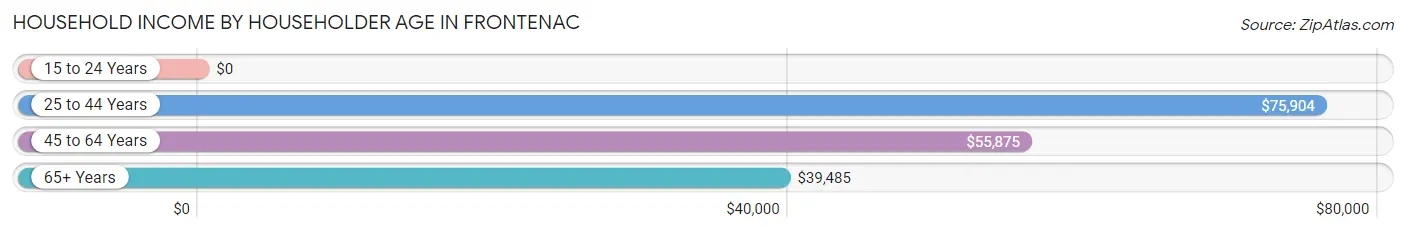
| Income Bracket | # Households | Median Income |
| 15 to 24 Years | 68 (5.0%) | $0 |
| 25 to 44 Years | 554 (40.8%) | $75,904 |
| 45 to 64 Years | 349 (25.7%) | $55,875 |
| 65+ Years | 387 (28.5%) | $39,485 |
| Total | 1,358 (100.0%) | $54,905 |
Poverty in Frontenac
Income Below Poverty by Sex and Age in Frontenac
With 9.1% poverty level for males and 5.9% for females among the residents of Frontenac, 16 and 17 year old males and 18 to 24 year old females are the most vulnerable to poverty, with 15 males (44.1%) and 32 females (36.4%) in their respective age groups living below the poverty level.
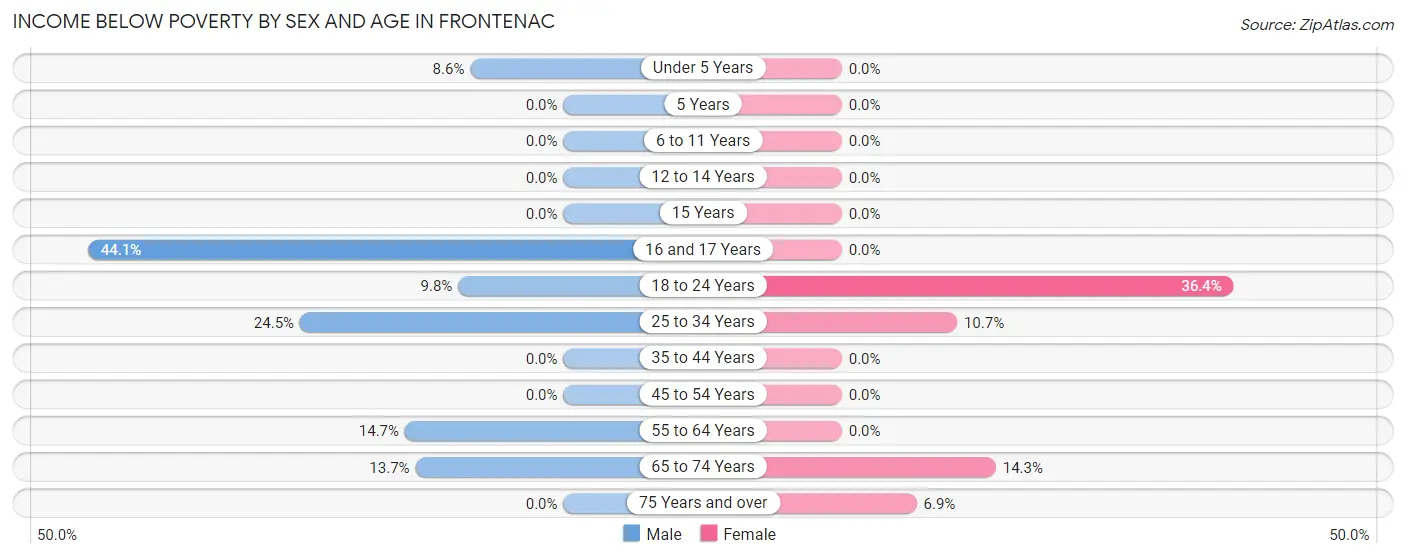
| Age Bracket | Male | Female |
| Under 5 Years | 7 (8.6%) | 0 (0.0%) |
| 5 Years | 0 (0.0%) | 0 (0.0%) |
| 6 to 11 Years | 0 (0.0%) | 0 (0.0%) |
| 12 to 14 Years | 0 (0.0%) | 0 (0.0%) |
| 15 Years | 0 (0.0%) | 0 (0.0%) |
| 16 and 17 Years | 15 (44.1%) | 0 (0.0%) |
| 18 to 24 Years | 8 (9.8%) | 32 (36.4%) |
| 25 to 34 Years | 67 (24.4%) | 34 (10.7%) |
| 35 to 44 Years | 0 (0.0%) | 0 (0.0%) |
| 45 to 54 Years | 0 (0.0%) | 0 (0.0%) |
| 55 to 64 Years | 25 (14.7%) | 0 (0.0%) |
| 65 to 74 Years | 21 (13.7%) | 23 (14.3%) |
| 75 Years and over | 0 (0.0%) | 10 (6.9%) |
| Total | 143 (9.1%) | 99 (5.9%) |
Income Above Poverty by Sex and Age in Frontenac
According to the poverty statistics in Frontenac, males aged 5 years and females aged under 5 years are the age groups that are most secure financially, with 100.0% of males and 100.0% of females in these age groups living above the poverty line.
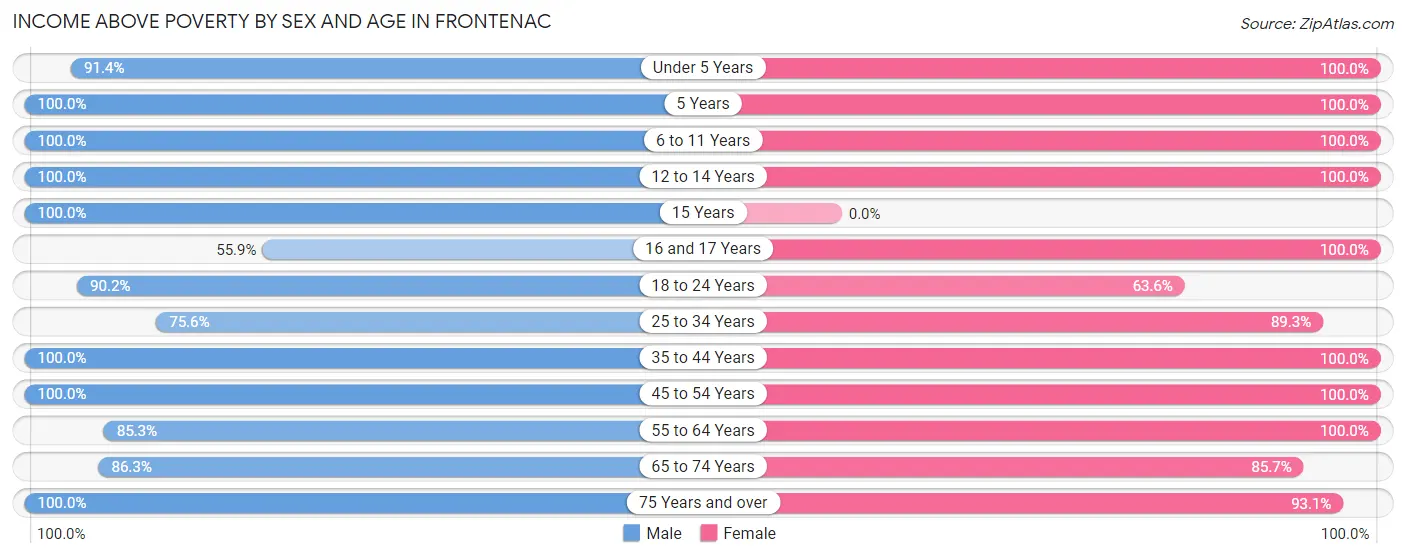
| Age Bracket | Male | Female |
| Under 5 Years | 74 (91.4%) | 200 (100.0%) |
| 5 Years | 124 (100.0%) | 34 (100.0%) |
| 6 to 11 Years | 58 (100.0%) | 144 (100.0%) |
| 12 to 14 Years | 32 (100.0%) | 89 (100.0%) |
| 15 Years | 31 (100.0%) | 0 (0.0%) |
| 16 and 17 Years | 19 (55.9%) | 11 (100.0%) |
| 18 to 24 Years | 74 (90.2%) | 56 (63.6%) |
| 25 to 34 Years | 207 (75.5%) | 284 (89.3%) |
| 35 to 44 Years | 290 (100.0%) | 200 (100.0%) |
| 45 to 54 Years | 165 (100.0%) | 108 (100.0%) |
| 55 to 64 Years | 145 (85.3%) | 188 (100.0%) |
| 65 to 74 Years | 132 (86.3%) | 138 (85.7%) |
| 75 Years and over | 82 (100.0%) | 134 (93.1%) |
| Total | 1,433 (90.9%) | 1,586 (94.1%) |
Income Below Poverty Among Married-Couple Families in Frontenac
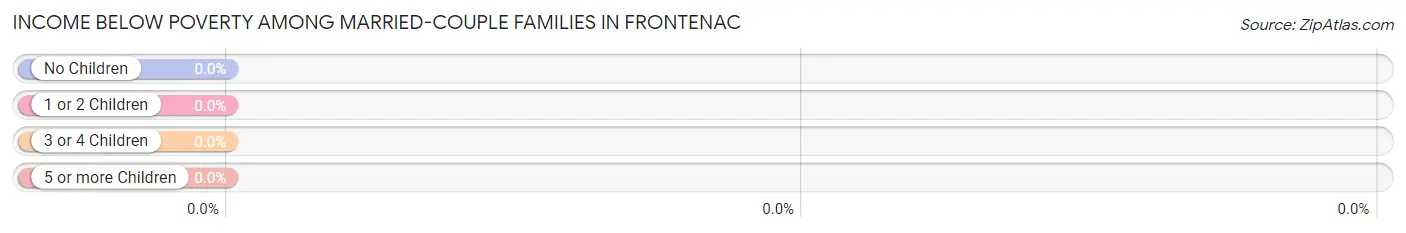
| Children | Above Poverty | Below Poverty |
| No Children | 427 (100.0%) | 0 (0.0%) |
| 1 or 2 Children | 260 (100.0%) | 0 (0.0%) |
| 3 or 4 Children | 80 (100.0%) | 0 (0.0%) |
| 5 or more Children | 0 (0.0%) | 0 (0.0%) |
| Total | 767 (100.0%) | 0 (0.0%) |
Income Below Poverty Among Single-Parent Households in Frontenac
According to the poverty data in Frontenac, 9.2% or 8 single-father households and 6.4% or 9 single-mother households are living below the poverty line. Among single-father households, those with 1 or 2 children have the highest poverty rate, with 8 households (10.0%) experiencing poverty. Likewise, among single-mother households, those with no children have the highest poverty rate, with 9 households (29.0%) falling below the poverty line.
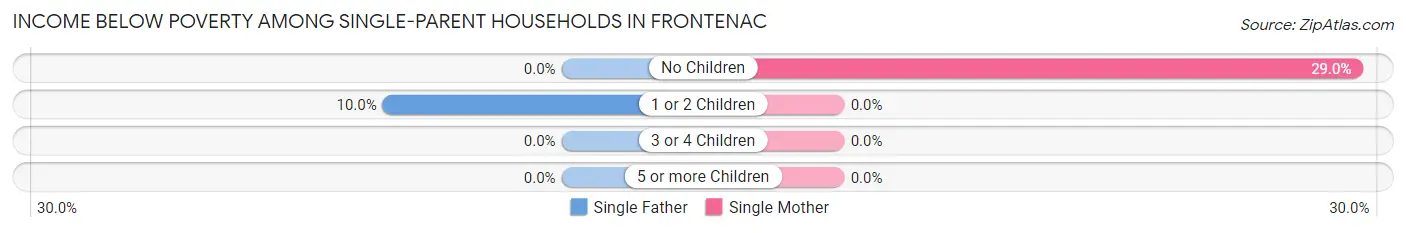
| Children | Single Father | Single Mother |
| No Children | 0 (0.0%) | 9 (29.0%) |
| 1 or 2 Children | 8 (10.0%) | 0 (0.0%) |
| 3 or 4 Children | 0 (0.0%) | 0 (0.0%) |
| 5 or more Children | 0 (0.0%) | 0 (0.0%) |
| Total | 8 (9.2%) | 9 (6.4%) |
Income Below Poverty Among Married-Couple vs Single-Parent Households in Frontenac
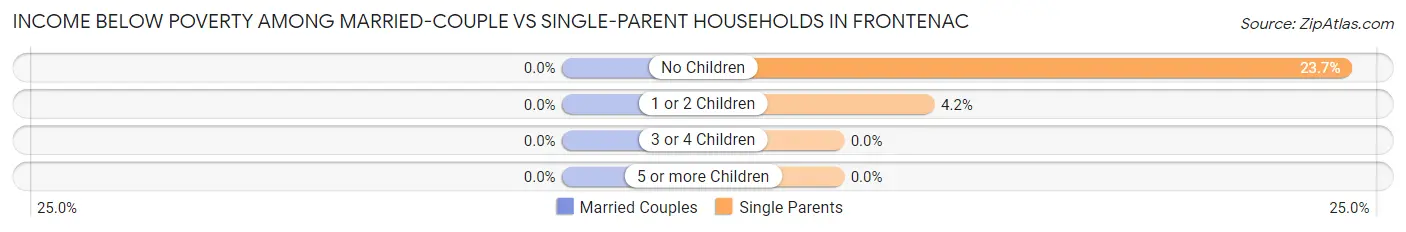
| Children | Married-Couple Families | Single-Parent Households |
| No Children | 0 (0.0%) | 9 (23.7%) |
| 1 or 2 Children | 0 (0.0%) | 8 (4.2%) |
| 3 or 4 Children | 0 (0.0%) | 0 (0.0%) |
| 5 or more Children | 0 (0.0%) | 0 (0.0%) |
| Total | 0 (0.0%) | 17 (7.5%) |
Race in Frontenac
The most populous races in Frontenac are White / Caucasian (3,079 | 91.0%), Two or more Races (140 | 4.1%), and Asian (96 | 2.8%).
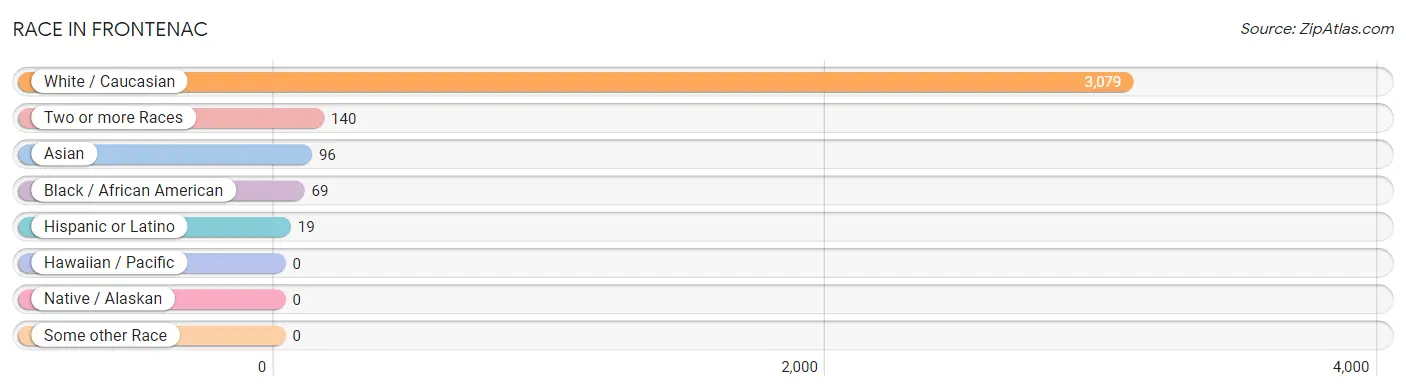
| Race | # Population | % Population |
| Asian | 96 | 2.8% |
| Black / African American | 69 | 2.0% |
| Hawaiian / Pacific | 0 | 0.0% |
| Hispanic or Latino | 19 | 0.6% |
| Native / Alaskan | 0 | 0.0% |
| White / Caucasian | 3,079 | 91.0% |
| Two or more Races | 140 | 4.1% |
| Some other Race | 0 | 0.0% |
| Total | 3,384 | 100.0% |
Ancestry in Frontenac
The most populous ancestries reported in Frontenac are American (676 | 20.0%), Irish (649 | 19.2%), German (570 | 16.8%), Italian (363 | 10.7%), and English (151 | 4.5%), together accounting for 71.2% of all Frontenac residents.
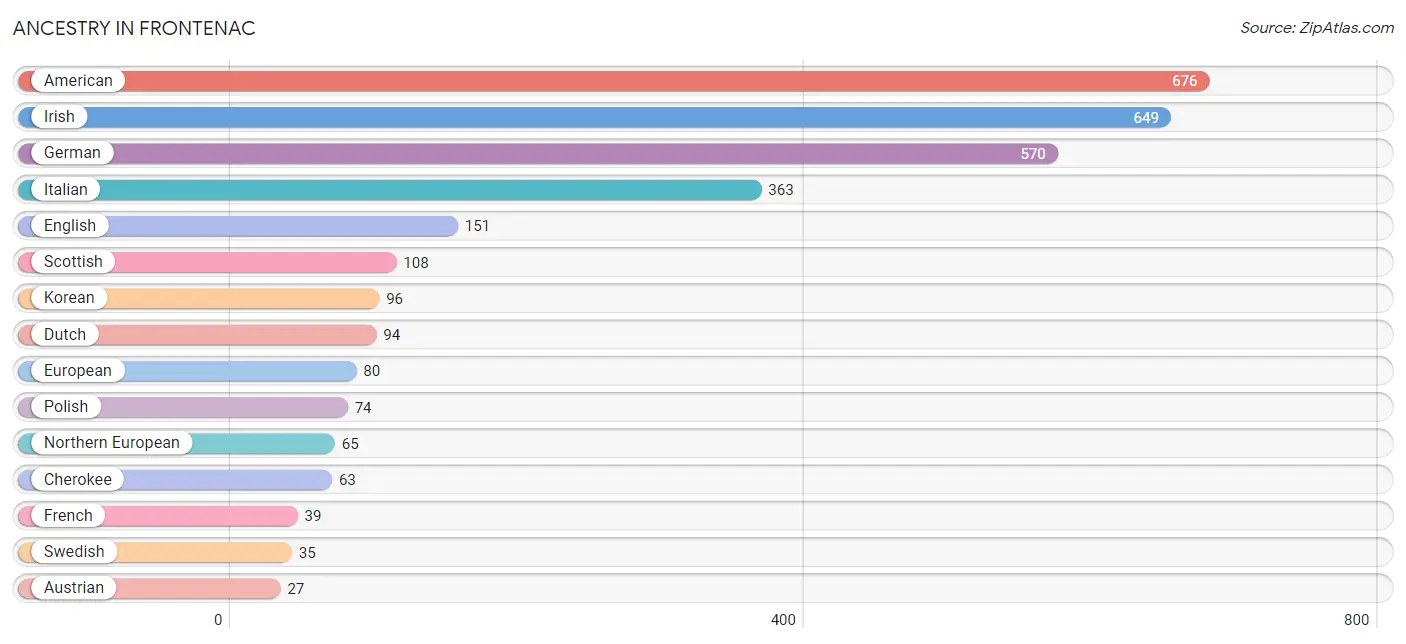
| Ancestry | # Population | % Population |
| American | 676 | 20.0% |
| Australian | 7 | 0.2% |
| Austrian | 27 | 0.8% |
| Belgian | 3 | 0.1% |
| British | 9 | 0.3% |
| Canadian | 8 | 0.2% |
| Cherokee | 63 | 1.9% |
| Czech | 16 | 0.5% |
| Dutch | 94 | 2.8% |
| English | 151 | 4.5% |
| European | 80 | 2.4% |
| French | 39 | 1.1% |
| German | 570 | 16.8% |
| Hungarian | 7 | 0.2% |
| Irish | 649 | 19.2% |
| Italian | 363 | 10.7% |
| Korean | 96 | 2.8% |
| Mexican | 19 | 0.6% |
| Northern European | 65 | 1.9% |
| Norwegian | 24 | 0.7% |
| Polish | 74 | 2.2% |
| Scottish | 108 | 3.2% |
| Slovak | 8 | 0.2% |
| Slovene | 14 | 0.4% |
| Swedish | 35 | 1.0% |
| Yugoslavian | 8 | 0.2% | View All 26 Rows |
Immigrants in Frontenac

| Immigration Origin | # Population | % Population | View All 0 Rows |
Sex and Age in Frontenac
Sex and Age in Frontenac
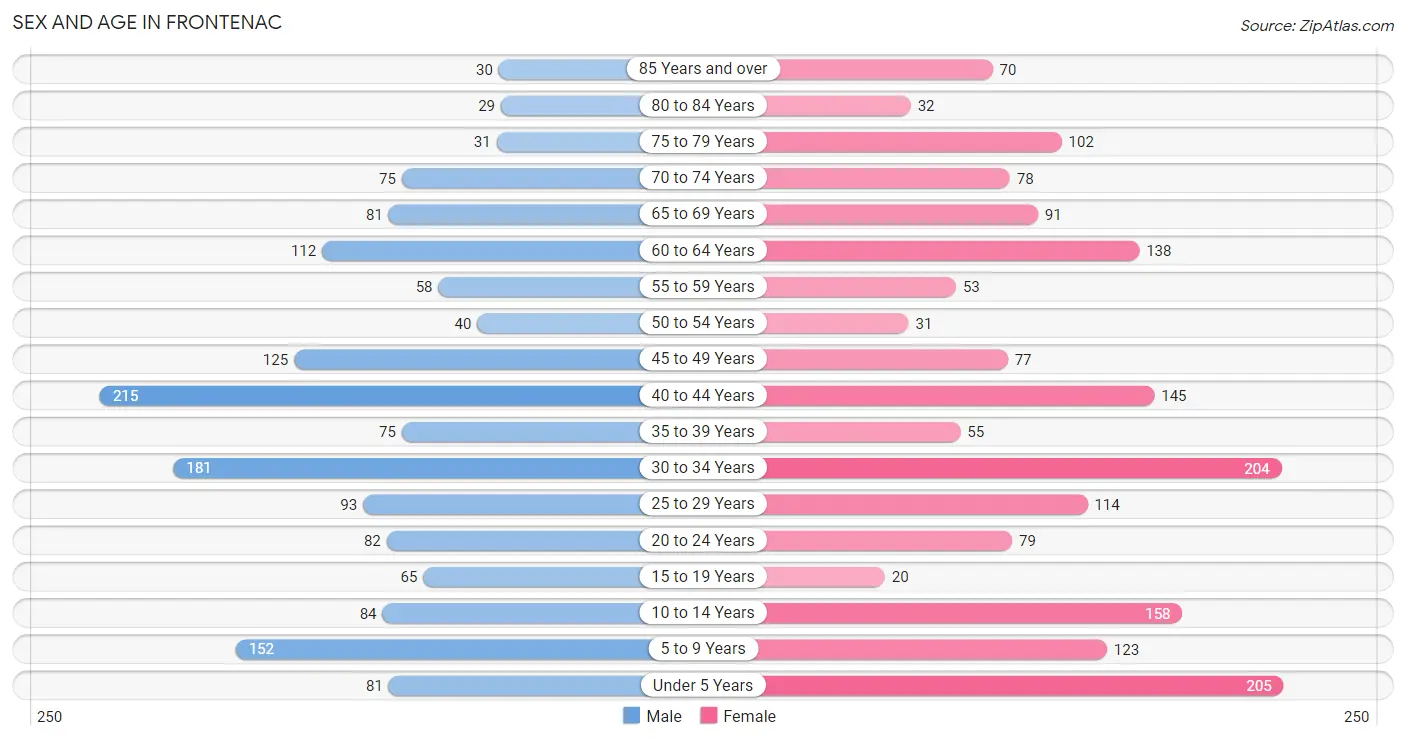
The most populous age groups in Frontenac are 40 to 44 Years (215 | 13.4%) for men and Under 5 Years (205 | 11.6%) for women.
| Age Bracket | Male | Female |
| Under 5 Years | 81 (5.0%) | 205 (11.6%) |
| 5 to 9 Years | 152 (9.5%) | 123 (6.9%) |
| 10 to 14 Years | 84 (5.2%) | 158 (8.9%) |
| 15 to 19 Years | 65 (4.0%) | 20 (1.1%) |
| 20 to 24 Years | 82 (5.1%) | 79 (4.4%) |
| 25 to 29 Years | 93 (5.8%) | 114 (6.4%) |
| 30 to 34 Years | 181 (11.3%) | 204 (11.5%) |
| 35 to 39 Years | 75 (4.7%) | 55 (3.1%) |
| 40 to 44 Years | 215 (13.4%) | 145 (8.2%) |
| 45 to 49 Years | 125 (7.8%) | 77 (4.3%) |
| 50 to 54 Years | 40 (2.5%) | 31 (1.8%) |
| 55 to 59 Years | 58 (3.6%) | 53 (3.0%) |
| 60 to 64 Years | 112 (7.0%) | 138 (7.8%) |
| 65 to 69 Years | 81 (5.0%) | 91 (5.1%) |
| 70 to 74 Years | 75 (4.7%) | 78 (4.4%) |
| 75 to 79 Years | 31 (1.9%) | 102 (5.8%) |
| 80 to 84 Years | 29 (1.8%) | 32 (1.8%) |
| 85 Years and over | 30 (1.9%) | 70 (3.9%) |
| Total | 1,609 (100.0%) | 1,775 (100.0%) |
Families and Households in Frontenac
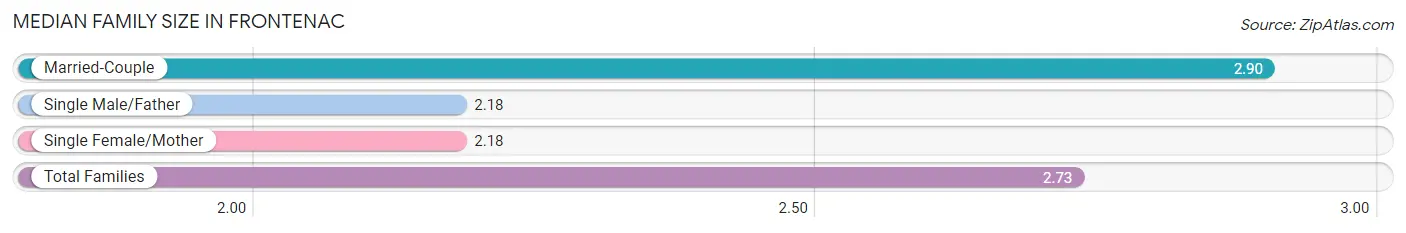
Median Family Size in Frontenac
The median family size in Frontenac is 2.73 persons per family, with married-couple families (767 | 77.1%) accounting for the largest median family size of 2.9 persons per family. On the other hand, single male/father families (87 | 8.7%) represent the smallest median family size with 2.18 persons per family.
| Family Type | # Families | Family Size |
| Married-Couple | 767 (77.1%) | 2.90 |
| Single Male/Father | 87 (8.7%) | 2.18 |
| Single Female/Mother | 141 (14.2%) | 2.18 |
| Total Families | 995 (100.0%) | 2.73 |
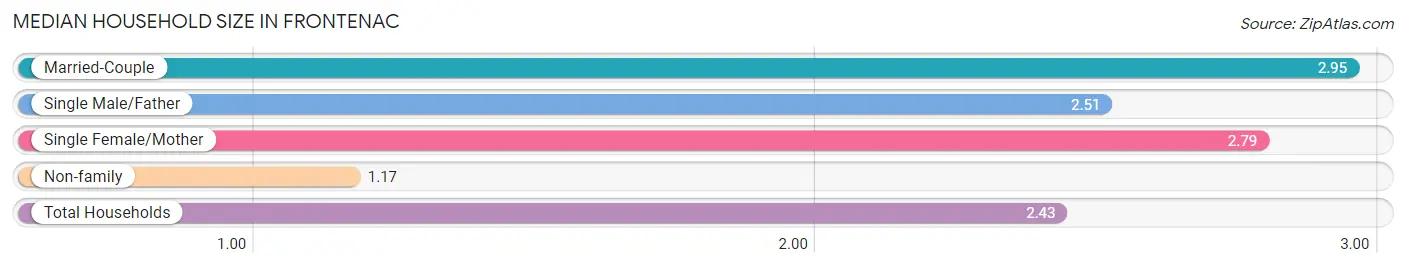
Median Household Size in Frontenac
The median household size in Frontenac is 2.43 persons per household, with married-couple households (767 | 56.5%) accounting for the largest median household size of 2.95 persons per household. non-family households (363 | 26.7%) represent the smallest median household size with 1.17 persons per household.
| Household Type | # Households | Household Size |
| Married-Couple | 767 (56.5%) | 2.95 |
| Single Male/Father | 87 (6.4%) | 2.51 |
| Single Female/Mother | 141 (10.4%) | 2.79 |
| Non-family | 363 (26.7%) | 1.17 |
| Total Households | 1,358 (100.0%) | 2.43 |
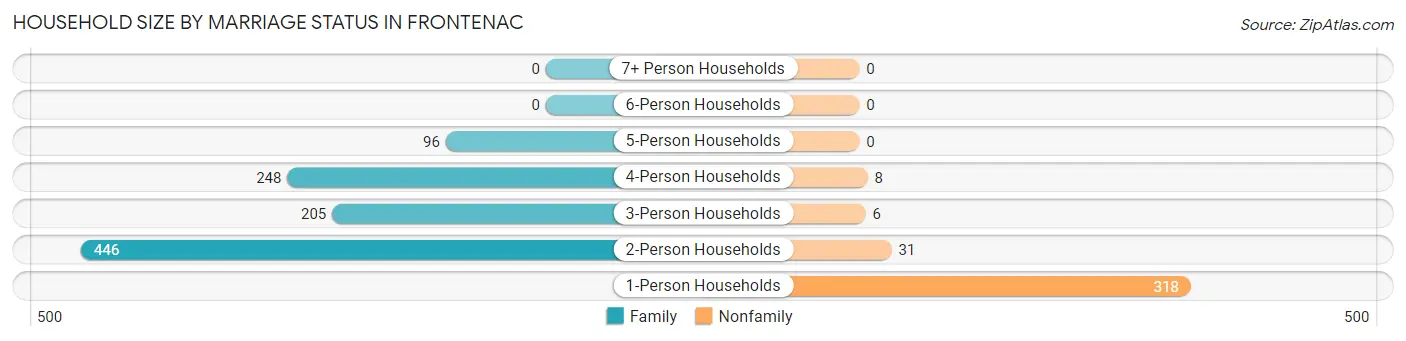
Household Size by Marriage Status in Frontenac
Out of a total of 1,358 households in Frontenac, 995 (73.3%) are family households, while 363 (26.7%) are nonfamily households. The most numerous type of family households are 2-person households, comprising 446, and the most common type of nonfamily households are 1-person households, comprising 318.
| Household Size | Family Households | Nonfamily Households |
| 1-Person Households | - | 318 (23.4%) |
| 2-Person Households | 446 (32.8%) | 31 (2.3%) |
| 3-Person Households | 205 (15.1%) | 6 (0.4%) |
| 4-Person Households | 248 (18.3%) | 8 (0.6%) |
| 5-Person Households | 96 (7.1%) | 0 (0.0%) |
| 6-Person Households | 0 (0.0%) | 0 (0.0%) |
| 7+ Person Households | 0 (0.0%) | 0 (0.0%) |
| Total | 995 (73.3%) | 363 (26.7%) |
Female Fertility in Frontenac
Fertility by Age in Frontenac
Average fertility rate in Frontenac is 118.0 births per 1,000 women. Women in the age bracket of 20 to 34 years have the highest fertility rate with 207.0 births per 1,000 women. Women in the age bracket of 20 to 34 years acount for 100.0% of all women with births.
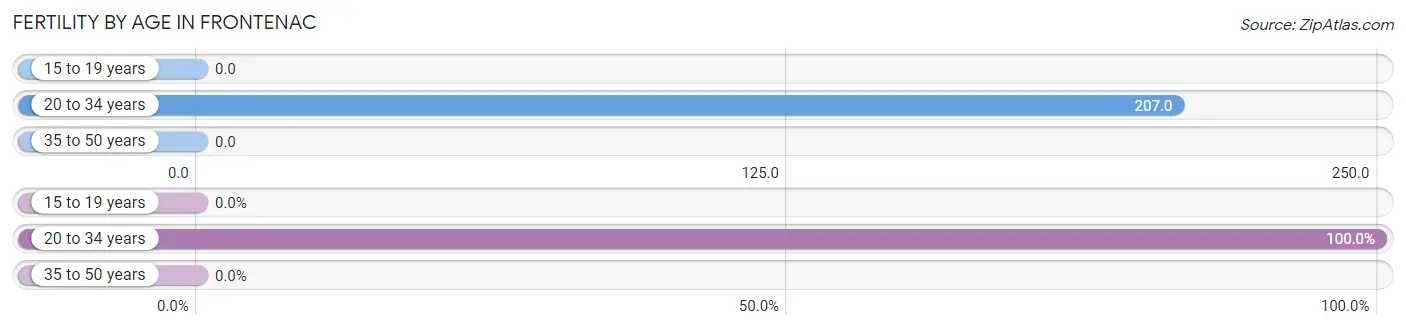
| Age Bracket | Women with Births | Births / 1,000 Women |
| 15 to 19 years | 0 (0.0%) | 0.0 |
| 20 to 34 years | 82 (100.0%) | 207.0 |
| 35 to 50 years | 0 (0.0%) | 0.0 |
| Total | 82 (100.0%) | 118.0 |
Fertility by Age by Marriage Status in Frontenac
93.9% of women with births (82) in Frontenac are married. The highest percentage of unmarried women with births falls into 20 to 34 years age bracket with 6.1% of them unmarried at the time of birth, while the lowest percentage of unmarried women with births belong to 20 to 34 years age bracket with 6.1% of them unmarried.
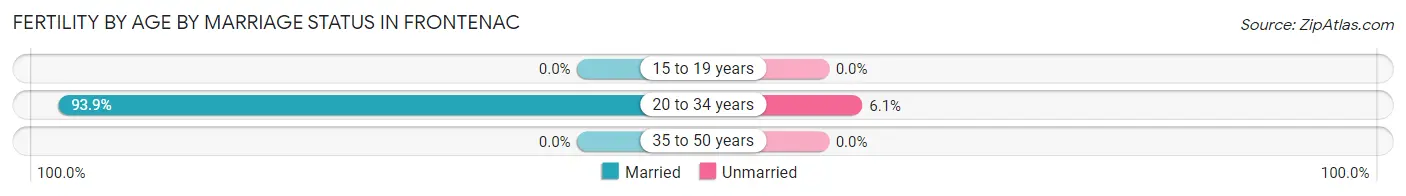
| Age Bracket | Married | Unmarried |
| 15 to 19 years | 0 (0.0%) | 0 (0.0%) |
| 20 to 34 years | 77 (93.9%) | 5 (6.1%) |
| 35 to 50 years | 0 (0.0%) | 0 (0.0%) |
| Total | 77 (93.9%) | 5 (6.1%) |
Fertility by Education in Frontenac
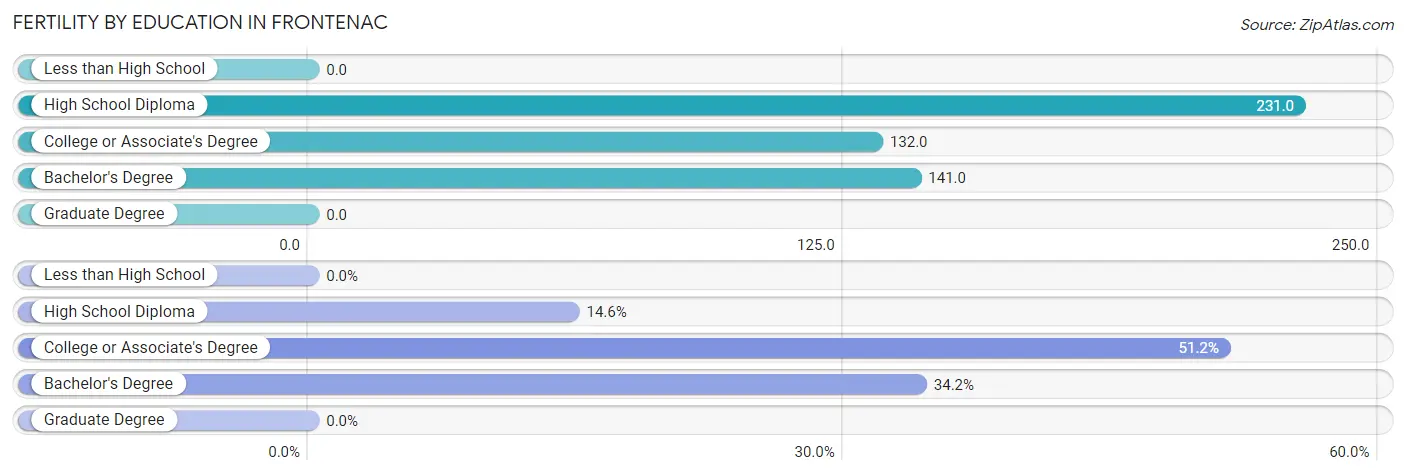
| Educational Attainment | Women with Births | Births / 1,000 Women |
| Less than High School | 0 (0.0%) | 0.0 |
| High School Diploma | 12 (14.6%) | 231.0 |
| College or Associate's Degree | 42 (51.2%) | 132.0 |
| Bachelor's Degree | 28 (34.2%) | 141.0 |
| Graduate Degree | 0 (0.0%) | 0.0 |
| Total | 82 (100.0%) | 118.0 |
Fertility by Education by Marriage Status in Frontenac
6.1% of women with births in Frontenac are unmarried. Women with the educational attainment of high school diploma are most likely to be married with 100.0% of them married at childbirth, while women with the educational attainment of bachelor's degree are least likely to be married with 17.9% of them unmarried at childbirth.
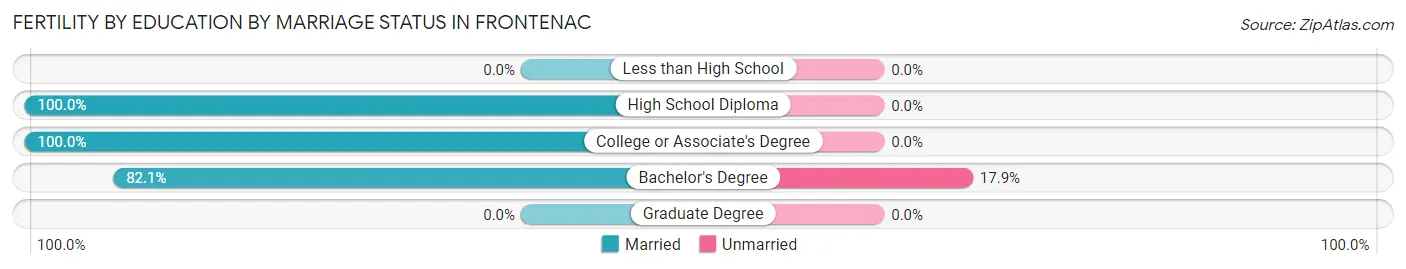
| Educational Attainment | Married | Unmarried |
| Less than High School | 0 (0.0%) | 0 (0.0%) |
| High School Diploma | 12 (100.0%) | 0 (0.0%) |
| College or Associate's Degree | 42 (100.0%) | 0 (0.0%) |
| Bachelor's Degree | 23 (82.1%) | 5 (17.9%) |
| Graduate Degree | 0 (0.0%) | 0 (0.0%) |
| Total | 77 (93.9%) | 5 (6.1%) |
Employment Characteristics in Frontenac
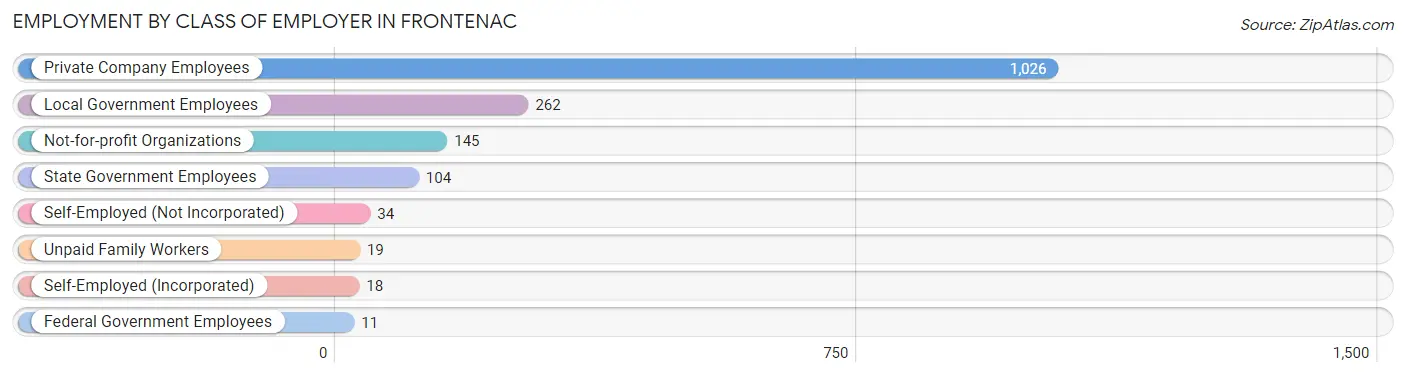
Employment by Class of Employer in Frontenac
Among the 1,619 employed individuals in Frontenac, private company employees (1,026 | 63.4%), local government employees (262 | 16.2%), and not-for-profit organizations (145 | 9.0%) make up the most common classes of employment.
| Employer Class | # Employees | % Employees |
| Private Company Employees | 1,026 | 63.4% |
| Self-Employed (Incorporated) | 18 | 1.1% |
| Self-Employed (Not Incorporated) | 34 | 2.1% |
| Not-for-profit Organizations | 145 | 9.0% |
| Local Government Employees | 262 | 16.2% |
| State Government Employees | 104 | 6.4% |
| Federal Government Employees | 11 | 0.7% |
| Unpaid Family Workers | 19 | 1.2% |
| Total | 1,619 | 100.0% |
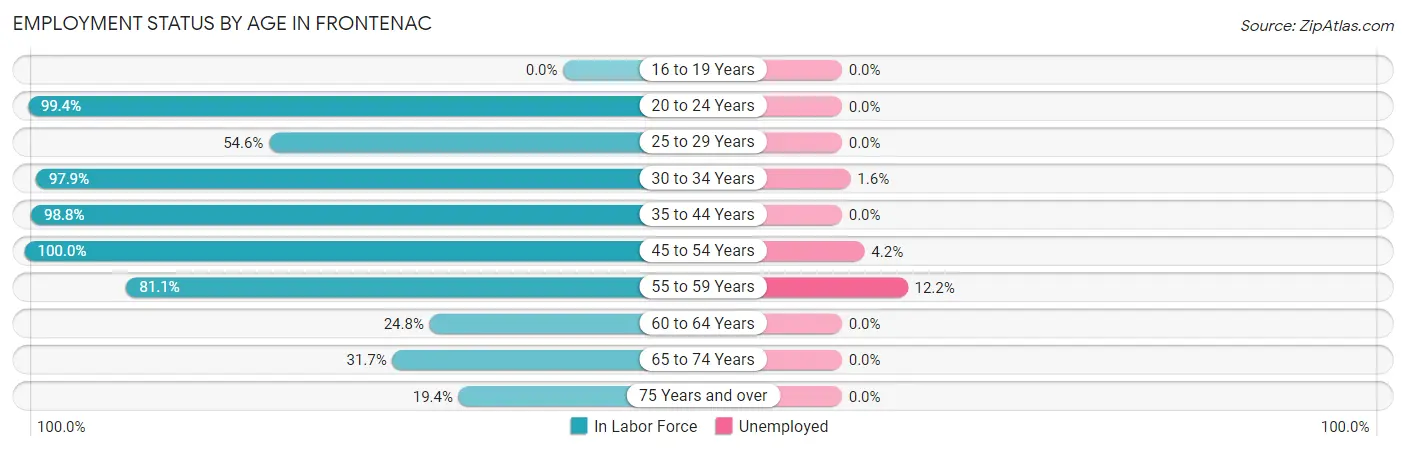
Employment Status by Age in Frontenac
According to the labor force statistics for Frontenac, out of the total population over 16 years of age (2,550), 67.4% or 1,719 individuals are in the labor force, with 1.6% or 28 of them unemployed. The age group with the highest labor force participation rate is 45 to 54 years, with 100.0% or 273 individuals in the labor force. Within the labor force, the 55 to 59 years age range has the highest percentage of unemployed individuals, with 12.2% or 11 of them being unemployed.
| Age Bracket | In Labor Force | Unemployed |
| 16 to 19 Years | 0 (0.0%) | 0 (0.0%) |
| 20 to 24 Years | 160 (99.4%) | 0 (0.0%) |
| 25 to 29 Years | 113 (54.6%) | 0 (0.0%) |
| 30 to 34 Years | 377 (97.9%) | 6 (1.6%) |
| 35 to 44 Years | 484 (98.8%) | 0 (0.0%) |
| 45 to 54 Years | 273 (100.0%) | 11 (4.2%) |
| 55 to 59 Years | 90 (81.1%) | 11 (12.2%) |
| 60 to 64 Years | 62 (24.8%) | 0 (0.0%) |
| 65 to 74 Years | 103 (31.7%) | 0 (0.0%) |
| 75 Years and over | 57 (19.4%) | 0 (0.0%) |
| Total | 1,719 (67.4%) | 28 (1.6%) |
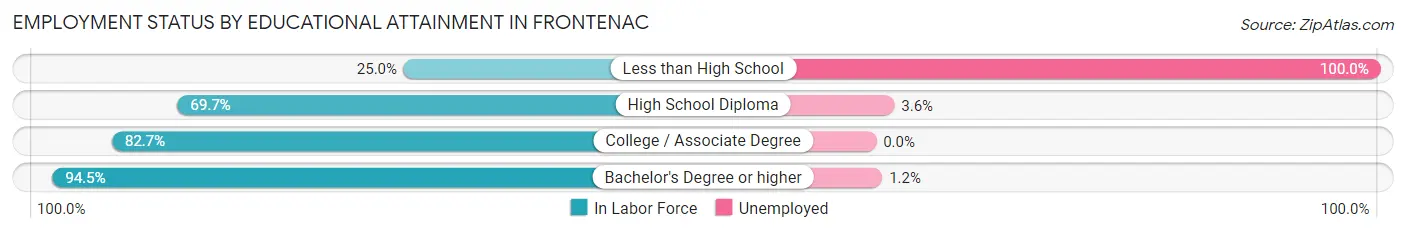
Employment Status by Educational Attainment in Frontenac
According to labor force statistics for Frontenac, 81.5% of individuals (1,399) out of the total population between 25 and 64 years of age (1,716) are in the labor force, with 2.0% or 28 of them being unemployed. The group with the highest labor force participation rate are those with the educational attainment of bachelor's degree or higher, with 94.5% or 497 individuals in the labor force. Within the labor force, individuals with less than high school education have the highest percentage of unemployment, with 100.0% or 11 of them being unemployed.
| Educational Attainment | In Labor Force | Unemployed |
| Less than High School | 11 (25.0%) | 44 (100.0%) |
| High School Diploma | 306 (69.7%) | 16 (3.6%) |
| College / Associate Degree | 585 (82.7%) | 0 (0.0%) |
| Bachelor's Degree or higher | 497 (94.5%) | 6 (1.2%) |
| Total | 1,399 (81.5%) | 34 (2.0%) |
Employment Occupations by Sex in Frontenac
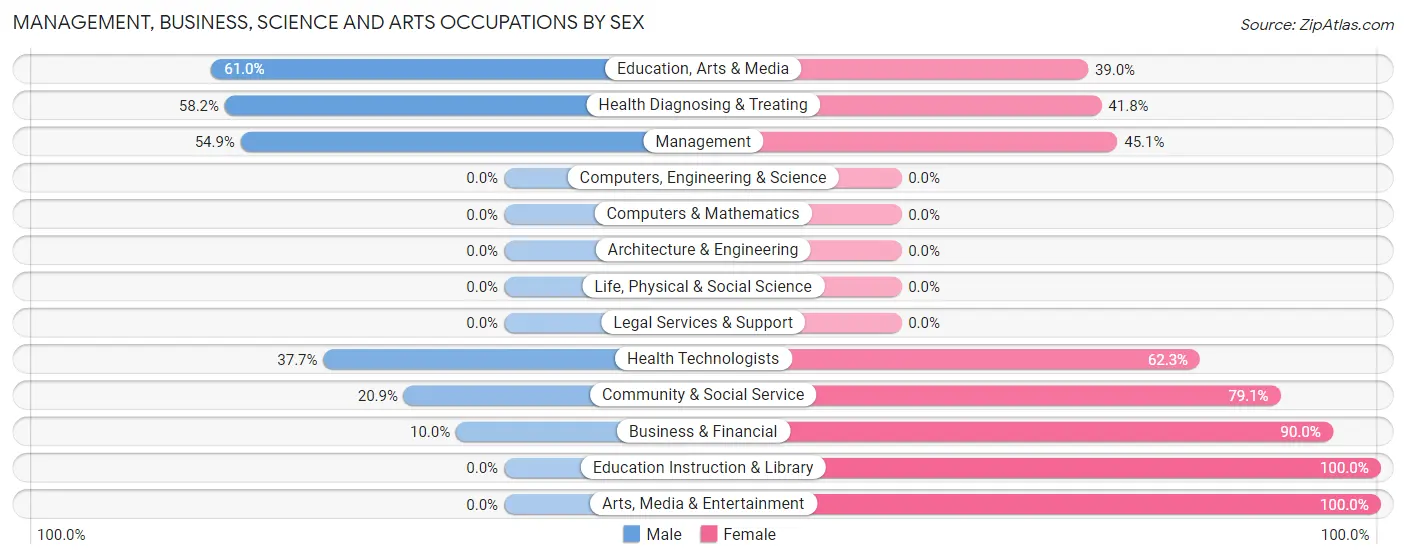
Management, Business, Science and Arts Occupations
The most common Management, Business, Science and Arts occupations in Frontenac are Community & Social Service (225 | 13.4%), Business & Financial (180 | 10.7%), Health Diagnosing & Treating (158 | 9.4%), Education Instruction & Library (136 | 8.1%), and Management (122 | 7.3%).

Management, Business, Science and Arts Occupations by Sex
Within the Management, Business, Science and Arts occupations in Frontenac, the most male-oriented occupations are Education, Arts & Media (61.0%), Health Diagnosing & Treating (58.2%), and Management (54.9%), while the most female-oriented occupations are Education Instruction & Library (100.0%), Arts, Media & Entertainment (100.0%), and Business & Financial (90.0%).
| Occupation | Male | Female |
| Management | 67 (54.9%) | 55 (45.1%) |
| Business & Financial | 18 (10.0%) | 162 (90.0%) |
| Computers, Engineering & Science | 0 (0.0%) | 0 (0.0%) |
| Computers & Mathematics | 0 (0.0%) | 0 (0.0%) |
| Architecture & Engineering | 0 (0.0%) | 0 (0.0%) |
| Life, Physical & Social Science | 0 (0.0%) | 0 (0.0%) |
| Community & Social Service | 47 (20.9%) | 178 (79.1%) |
| Education, Arts & Media | 47 (61.0%) | 30 (39.0%) |
| Legal Services & Support | 0 (0.0%) | 0 (0.0%) |
| Education Instruction & Library | 0 (0.0%) | 136 (100.0%) |
| Arts, Media & Entertainment | 0 (0.0%) | 12 (100.0%) |
| Health Diagnosing & Treating | 92 (58.2%) | 66 (41.8%) |
| Health Technologists | 26 (37.7%) | 43 (62.3%) |
| Total (Category) | 224 (32.7%) | 461 (67.3%) |
| Total (Overall) | 832 (49.5%) | 848 (50.5%) |
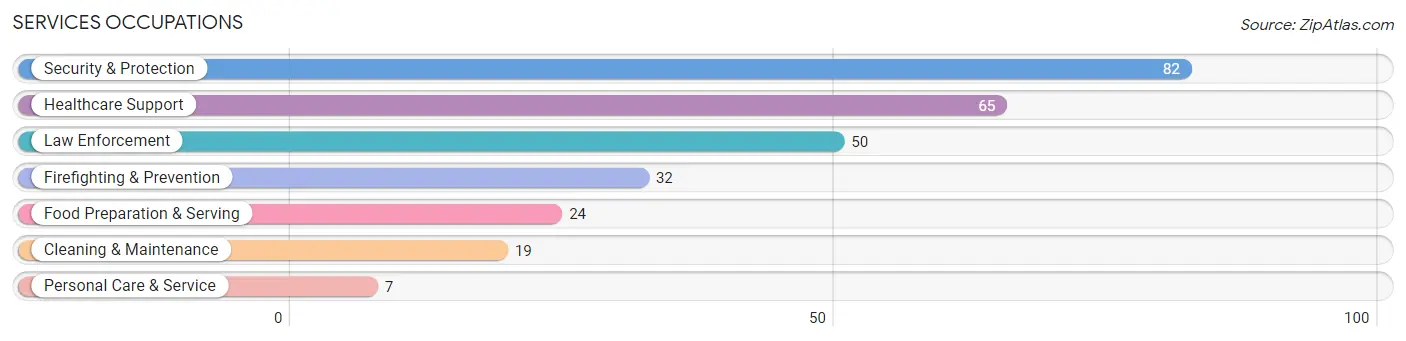
Services Occupations
The most common Services occupations in Frontenac are Security & Protection (82 | 4.9%), Healthcare Support (65 | 3.9%), Law Enforcement (50 | 3.0%), Firefighting & Prevention (32 | 1.9%), and Food Preparation & Serving (24 | 1.4%).
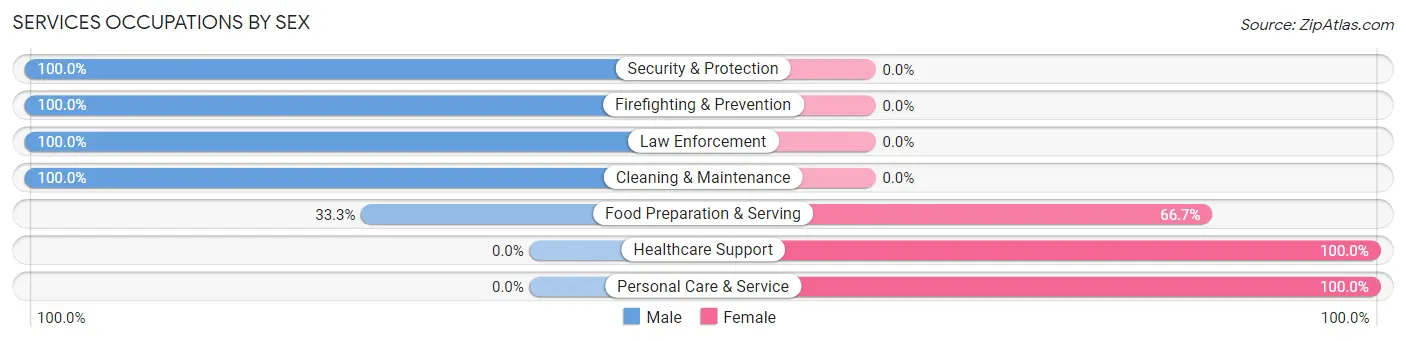
Services Occupations by Sex
Within the Services occupations in Frontenac, the most male-oriented occupations are Security & Protection (100.0%), Firefighting & Prevention (100.0%), and Law Enforcement (100.0%), while the most female-oriented occupations are Healthcare Support (100.0%), Personal Care & Service (100.0%), and Food Preparation & Serving (66.7%).
| Occupation | Male | Female |
| Healthcare Support | 0 (0.0%) | 65 (100.0%) |
| Security & Protection | 82 (100.0%) | 0 (0.0%) |
| Firefighting & Prevention | 32 (100.0%) | 0 (0.0%) |
| Law Enforcement | 50 (100.0%) | 0 (0.0%) |
| Food Preparation & Serving | 8 (33.3%) | 16 (66.7%) |
| Cleaning & Maintenance | 19 (100.0%) | 0 (0.0%) |
| Personal Care & Service | 0 (0.0%) | 7 (100.0%) |
| Total (Category) | 109 (55.3%) | 88 (44.7%) |
| Total (Overall) | 832 (49.5%) | 848 (50.5%) |
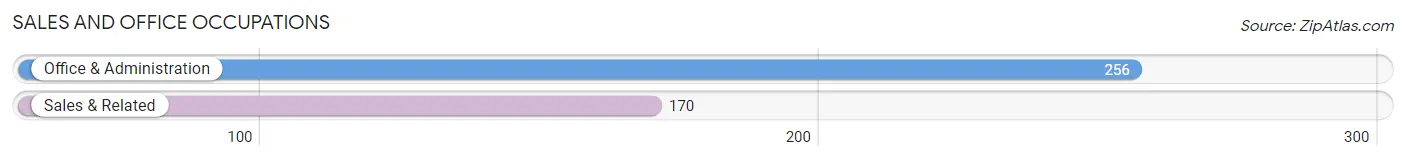
Sales and Office Occupations
The most common Sales and Office occupations in Frontenac are Office & Administration (256 | 15.2%), and Sales & Related (170 | 10.1%).
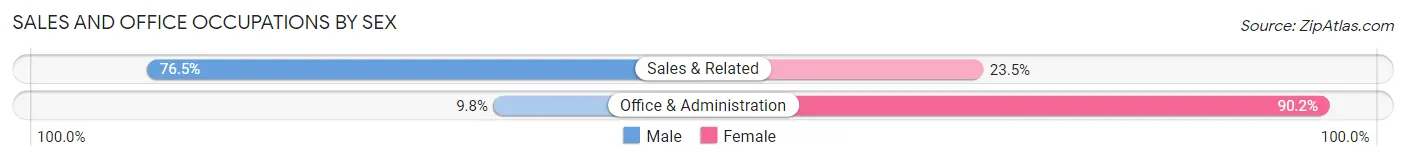
Sales and Office Occupations by Sex
| Occupation | Male | Female |
| Sales & Related | 130 (76.5%) | 40 (23.5%) |
| Office & Administration | 25 (9.8%) | 231 (90.2%) |
| Total (Category) | 155 (36.4%) | 271 (63.6%) |
| Total (Overall) | 832 (49.5%) | 848 (50.5%) |
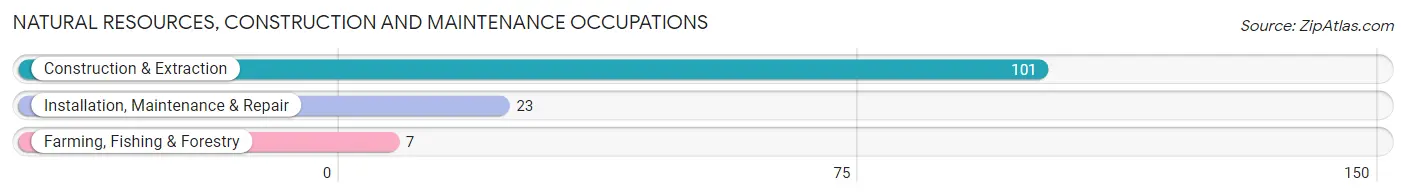
Natural Resources, Construction and Maintenance Occupations
The most common Natural Resources, Construction and Maintenance occupations in Frontenac are Construction & Extraction (101 | 6.0%), Installation, Maintenance & Repair (23 | 1.4%), and Farming, Fishing & Forestry (7 | 0.4%).
Natural Resources, Construction and Maintenance Occupations by Sex
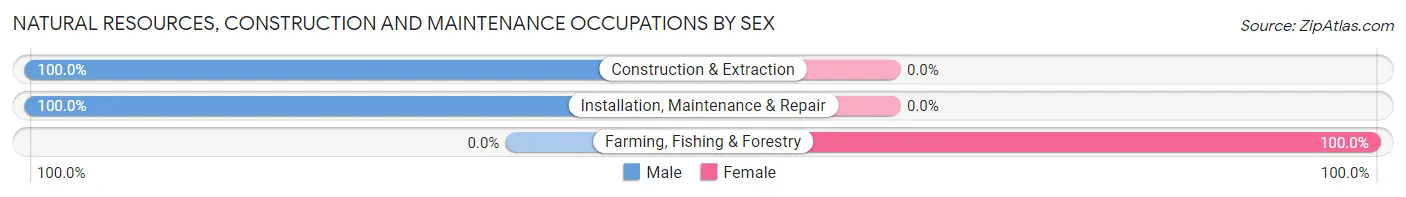
| Occupation | Male | Female |
| Farming, Fishing & Forestry | 0 (0.0%) | 7 (100.0%) |
| Construction & Extraction | 101 (100.0%) | 0 (0.0%) |
| Installation, Maintenance & Repair | 23 (100.0%) | 0 (0.0%) |
| Total (Category) | 124 (94.7%) | 7 (5.3%) |
| Total (Overall) | 832 (49.5%) | 848 (50.5%) |
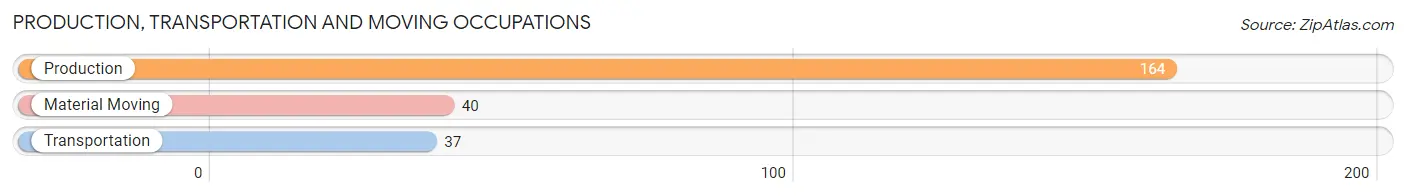
Production, Transportation and Moving Occupations
The most common Production, Transportation and Moving occupations in Frontenac are Production (164 | 9.8%), Material Moving (40 | 2.4%), and Transportation (37 | 2.2%).
Production, Transportation and Moving Occupations by Sex
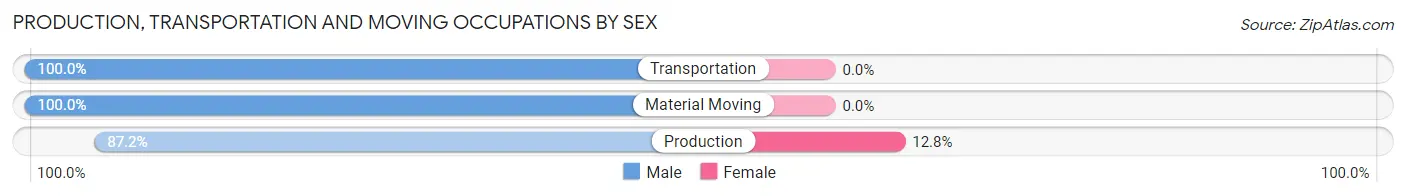
| Occupation | Male | Female |
| Production | 143 (87.2%) | 21 (12.8%) |
| Transportation | 37 (100.0%) | 0 (0.0%) |
| Material Moving | 40 (100.0%) | 0 (0.0%) |
| Total (Category) | 220 (91.3%) | 21 (8.7%) |
| Total (Overall) | 832 (49.5%) | 848 (50.5%) |
Employment Industries by Sex in Frontenac
Employment Industries in Frontenac
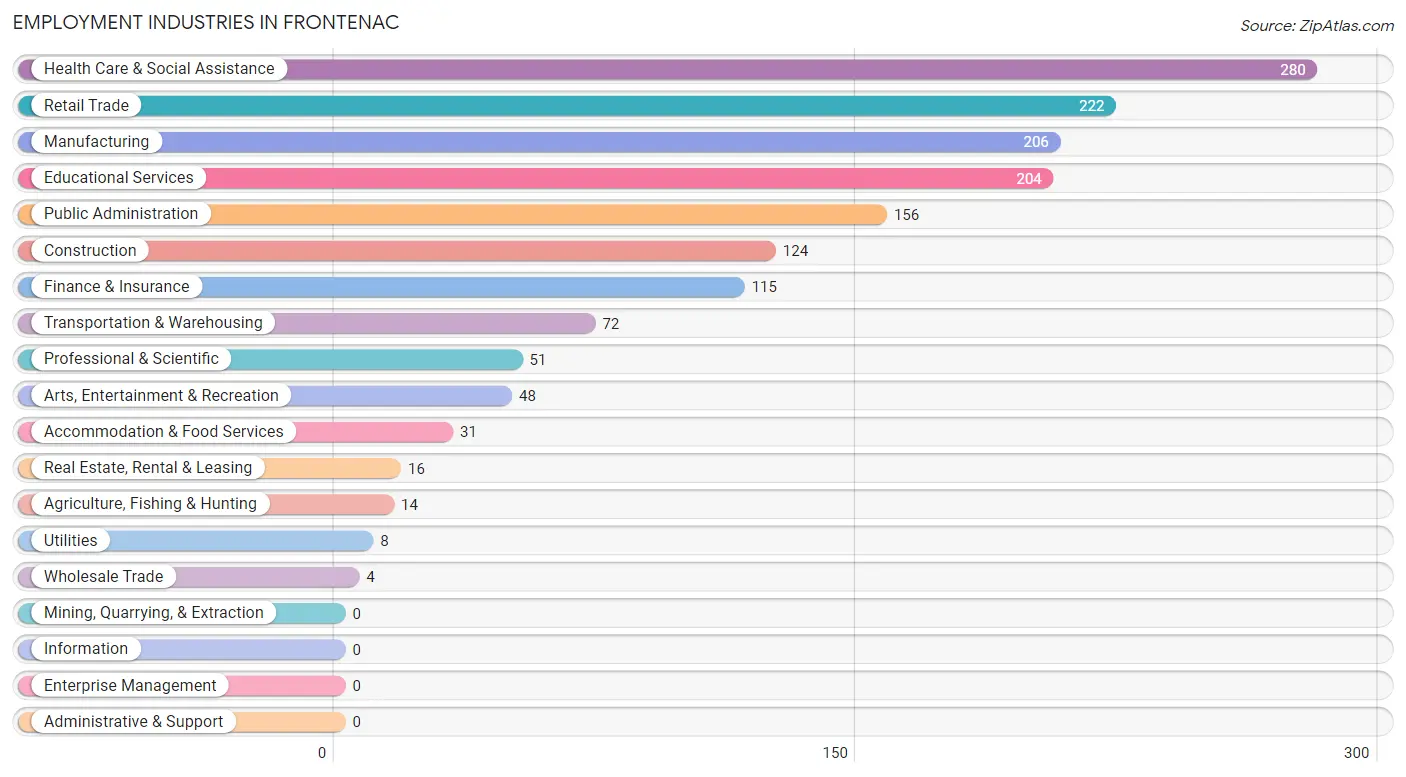
The major employment industries in Frontenac include Health Care & Social Assistance (280 | 16.7%), Retail Trade (222 | 13.2%), Manufacturing (206 | 12.3%), Educational Services (204 | 12.1%), and Public Administration (156 | 9.3%).
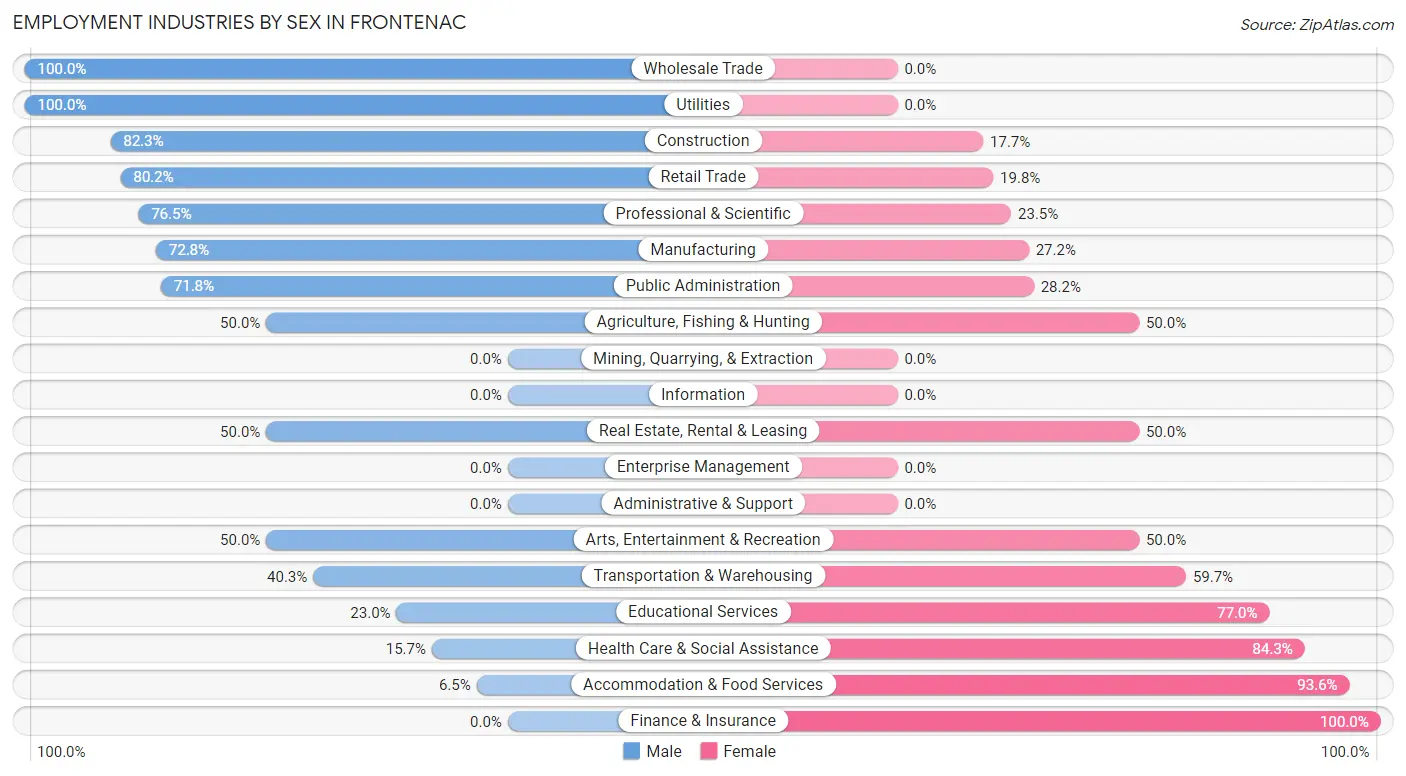
Employment Industries by Sex in Frontenac
The Frontenac industries that see more men than women are Wholesale Trade (100.0%), Utilities (100.0%), and Construction (82.3%), whereas the industries that tend to have a higher number of women are Finance & Insurance (100.0%), Accommodation & Food Services (93.5%), and Health Care & Social Assistance (84.3%).
| Industry | Male | Female |
| Agriculture, Fishing & Hunting | 7 (50.0%) | 7 (50.0%) |
| Mining, Quarrying, & Extraction | 0 (0.0%) | 0 (0.0%) |
| Construction | 102 (82.3%) | 22 (17.7%) |
| Manufacturing | 150 (72.8%) | 56 (27.2%) |
| Wholesale Trade | 4 (100.0%) | 0 (0.0%) |
| Retail Trade | 178 (80.2%) | 44 (19.8%) |
| Transportation & Warehousing | 29 (40.3%) | 43 (59.7%) |
| Utilities | 8 (100.0%) | 0 (0.0%) |
| Information | 0 (0.0%) | 0 (0.0%) |
| Finance & Insurance | 0 (0.0%) | 115 (100.0%) |
| Real Estate, Rental & Leasing | 8 (50.0%) | 8 (50.0%) |
| Professional & Scientific | 39 (76.5%) | 12 (23.5%) |
| Enterprise Management | 0 (0.0%) | 0 (0.0%) |
| Administrative & Support | 0 (0.0%) | 0 (0.0%) |
| Educational Services | 47 (23.0%) | 157 (77.0%) |
| Health Care & Social Assistance | 44 (15.7%) | 236 (84.3%) |
| Arts, Entertainment & Recreation | 24 (50.0%) | 24 (50.0%) |
| Accommodation & Food Services | 2 (6.5%) | 29 (93.5%) |
| Public Administration | 112 (71.8%) | 44 (28.2%) |
| Total | 832 (49.5%) | 848 (50.5%) |
Education in Frontenac
School Enrollment in Frontenac
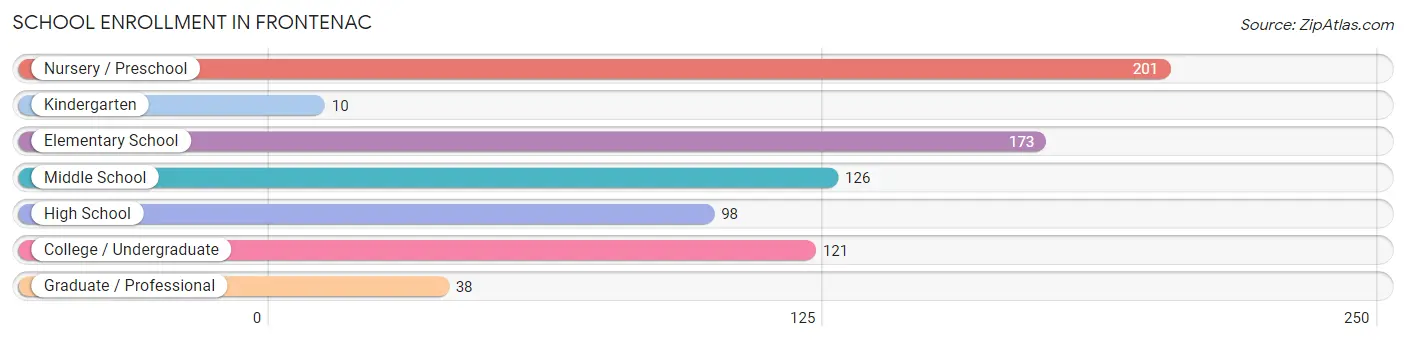
The most common levels of schooling among the 767 students in Frontenac are nursery / preschool (201 | 26.2%), elementary school (173 | 22.6%), and middle school (126 | 16.4%).
| School Level | # Students | % Students |
| Nursery / Preschool | 201 | 26.2% |
| Kindergarten | 10 | 1.3% |
| Elementary School | 173 | 22.6% |
| Middle School | 126 | 16.4% |
| High School | 98 | 12.8% |
| College / Undergraduate | 121 | 15.8% |
| Graduate / Professional | 38 | 5.0% |
| Total | 767 | 100.0% |
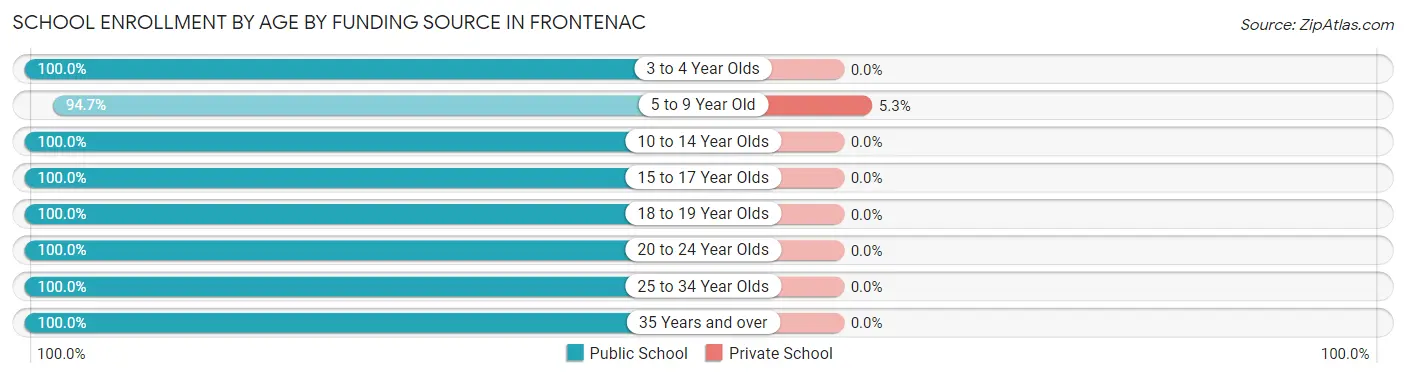
School Enrollment by Age by Funding Source in Frontenac
Out of a total of 767 students who are enrolled in schools in Frontenac, 14 (1.8%) attend a private institution, while the remaining 753 (98.2%) are enrolled in public schools. The age group of 5 to 9 year old has the highest likelihood of being enrolled in private schools, with 14 (5.3% in the age bracket) enrolled. Conversely, the age group of 3 to 4 year olds has the lowest likelihood of being enrolled in a private school, with 53 (100.0% in the age bracket) attending a public institution.
| Age Bracket | Public School | Private School |
| 3 to 4 Year Olds | 53 (100.0%) | 0 (0.0%) |
| 5 to 9 Year Old | 252 (94.7%) | 14 (5.3%) |
| 10 to 14 Year Olds | 223 (100.0%) | 0 (0.0%) |
| 15 to 17 Year Olds | 66 (100.0%) | 0 (0.0%) |
| 18 to 19 Year Olds | 9 (100.0%) | 0 (0.0%) |
| 20 to 24 Year Olds | 88 (100.0%) | 0 (0.0%) |
| 25 to 34 Year Olds | 44 (100.0%) | 0 (0.0%) |
| 35 Years and over | 18 (100.0%) | 0 (0.0%) |
| Total | 753 (98.2%) | 14 (1.8%) |
Educational Attainment by Field of Study in Frontenac
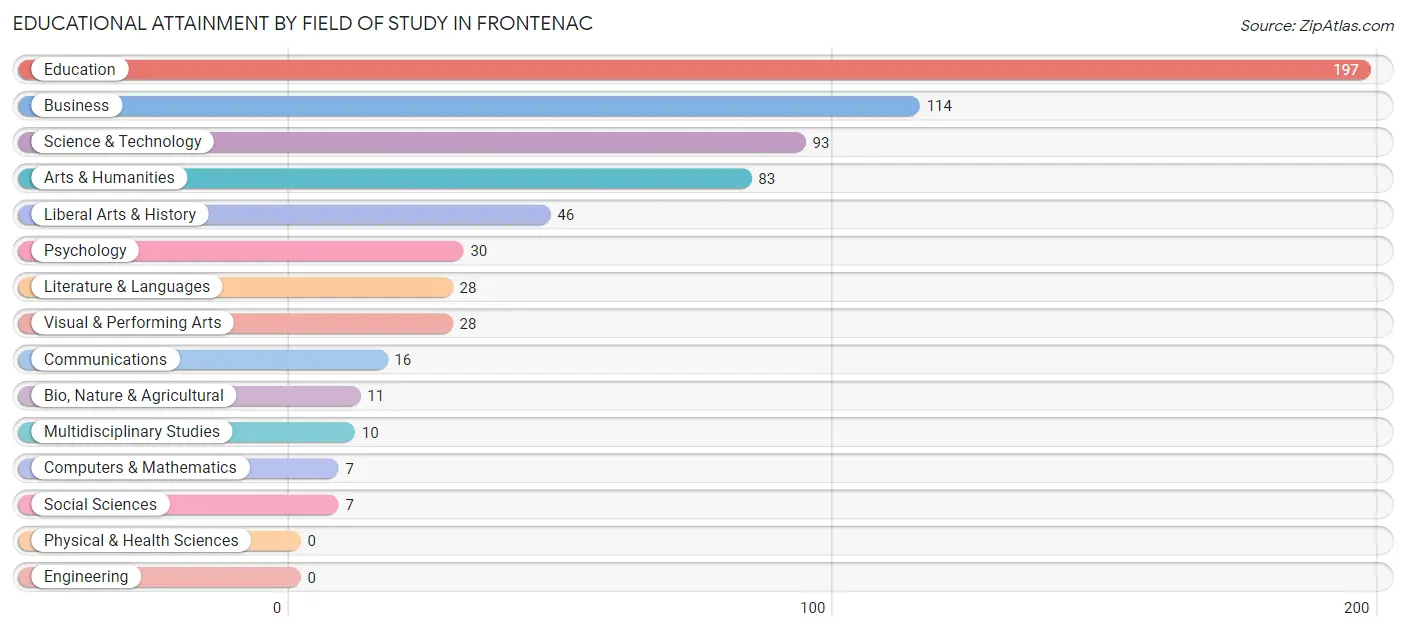
Education (197 | 29.4%), business (114 | 17.0%), science & technology (93 | 13.9%), arts & humanities (83 | 12.4%), and liberal arts & history (46 | 6.9%) are the most common fields of study among 670 individuals in Frontenac who have obtained a bachelor's degree or higher.
| Field of Study | # Graduates | % Graduates |
| Computers & Mathematics | 7 | 1.0% |
| Bio, Nature & Agricultural | 11 | 1.6% |
| Physical & Health Sciences | 0 | 0.0% |
| Psychology | 30 | 4.5% |
| Social Sciences | 7 | 1.0% |
| Engineering | 0 | 0.0% |
| Multidisciplinary Studies | 10 | 1.5% |
| Science & Technology | 93 | 13.9% |
| Business | 114 | 17.0% |
| Education | 197 | 29.4% |
| Literature & Languages | 28 | 4.2% |
| Liberal Arts & History | 46 | 6.9% |
| Visual & Performing Arts | 28 | 4.2% |
| Communications | 16 | 2.4% |
| Arts & Humanities | 83 | 12.4% |
| Total | 670 | 100.0% |
Transportation & Commute in Frontenac
Vehicle Availability by Sex in Frontenac
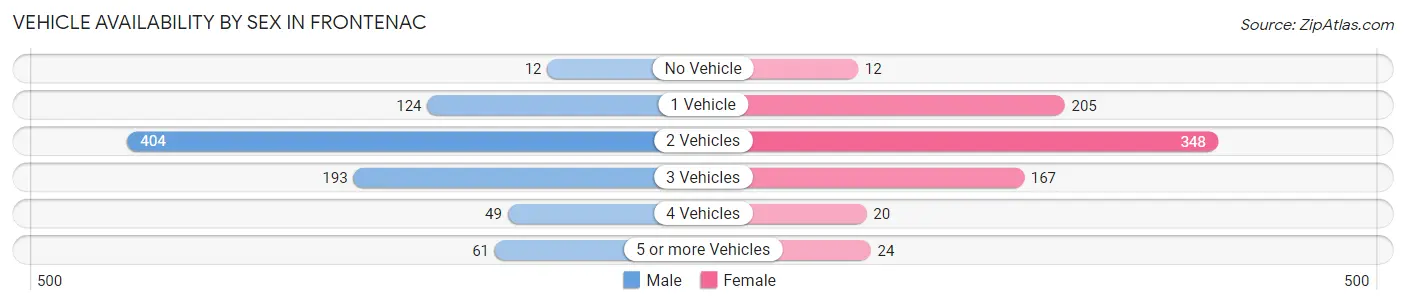
The most prevalent vehicle ownership categories in Frontenac are males with 2 vehicles (404, accounting for 47.9%) and females with 2 vehicles (348, making up 52.1%).
| Vehicles Available | Male | Female |
| No Vehicle | 12 (1.4%) | 12 (1.5%) |
| 1 Vehicle | 124 (14.7%) | 205 (26.4%) |
| 2 Vehicles | 404 (47.9%) | 348 (44.9%) |
| 3 Vehicles | 193 (22.9%) | 167 (21.5%) |
| 4 Vehicles | 49 (5.8%) | 20 (2.6%) |
| 5 or more Vehicles | 61 (7.2%) | 24 (3.1%) |
| Total | 843 (100.0%) | 776 (100.0%) |
Commute Time in Frontenac
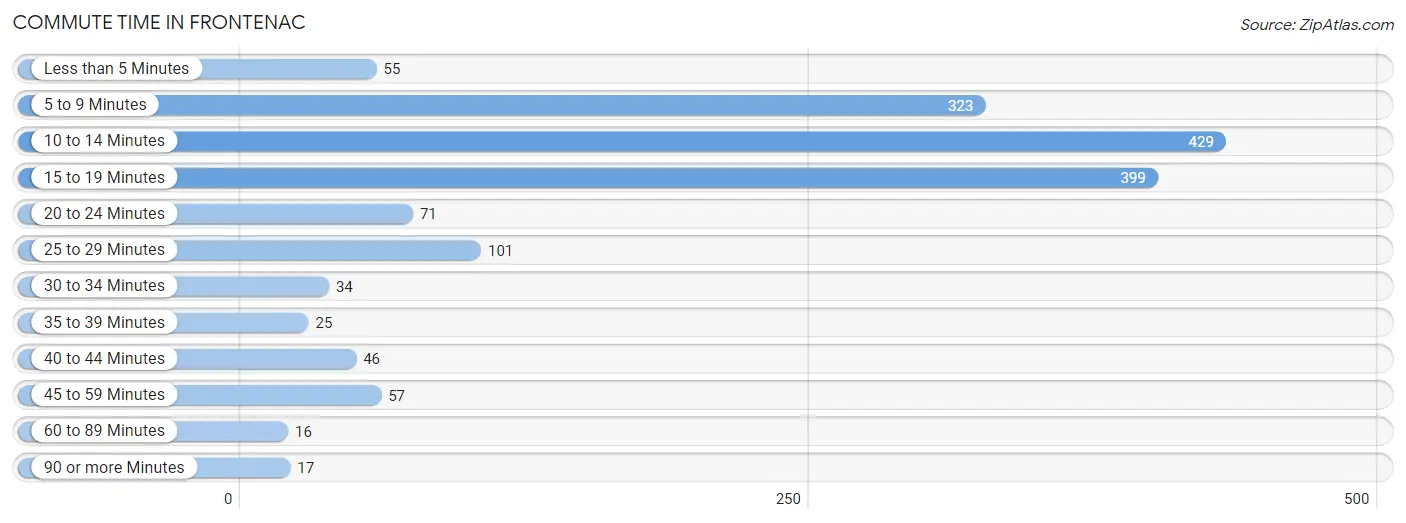
The most frequently occuring commute durations in Frontenac are 10 to 14 minutes (429 commuters, 27.3%), 15 to 19 minutes (399 commuters, 25.4%), and 5 to 9 minutes (323 commuters, 20.5%).
| Commute Time | # Commuters | % Commuters |
| Less than 5 Minutes | 55 | 3.5% |
| 5 to 9 Minutes | 323 | 20.5% |
| 10 to 14 Minutes | 429 | 27.3% |
| 15 to 19 Minutes | 399 | 25.4% |
| 20 to 24 Minutes | 71 | 4.5% |
| 25 to 29 Minutes | 101 | 6.4% |
| 30 to 34 Minutes | 34 | 2.2% |
| 35 to 39 Minutes | 25 | 1.6% |
| 40 to 44 Minutes | 46 | 2.9% |
| 45 to 59 Minutes | 57 | 3.6% |
| 60 to 89 Minutes | 16 | 1.0% |
| 90 or more Minutes | 17 | 1.1% |
Commute Time by Sex in Frontenac
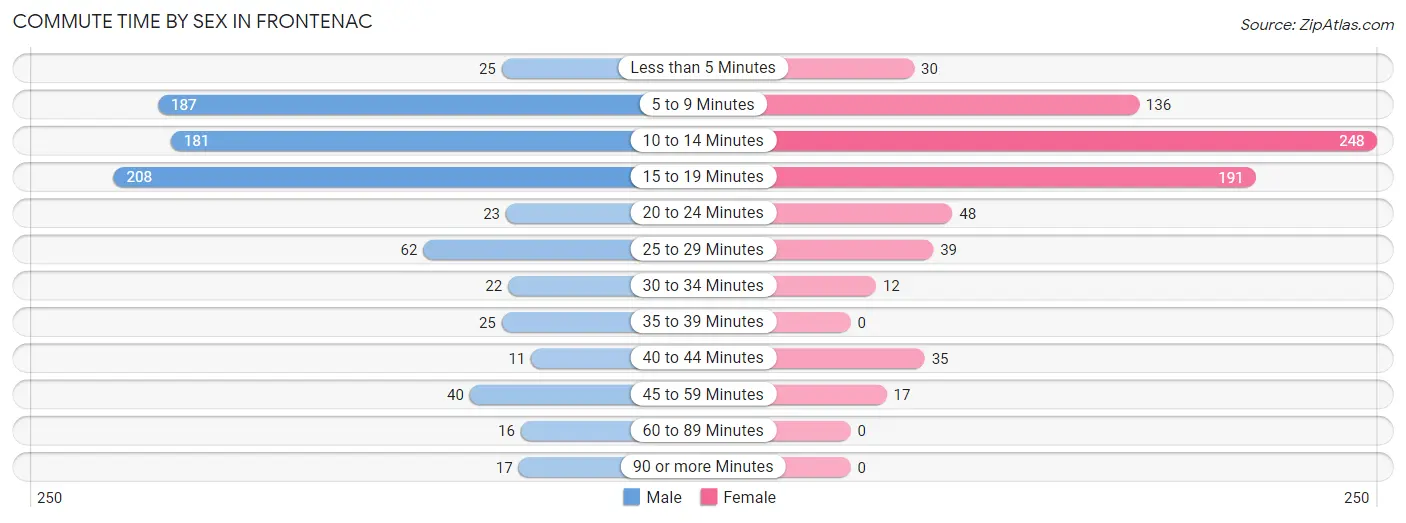
The most common commute times in Frontenac are 15 to 19 minutes (208 commuters, 25.5%) for males and 10 to 14 minutes (248 commuters, 32.8%) for females.
| Commute Time | Male | Female |
| Less than 5 Minutes | 25 (3.1%) | 30 (4.0%) |
| 5 to 9 Minutes | 187 (22.9%) | 136 (18.0%) |
| 10 to 14 Minutes | 181 (22.2%) | 248 (32.8%) |
| 15 to 19 Minutes | 208 (25.5%) | 191 (25.3%) |
| 20 to 24 Minutes | 23 (2.8%) | 48 (6.4%) |
| 25 to 29 Minutes | 62 (7.6%) | 39 (5.2%) |
| 30 to 34 Minutes | 22 (2.7%) | 12 (1.6%) |
| 35 to 39 Minutes | 25 (3.1%) | 0 (0.0%) |
| 40 to 44 Minutes | 11 (1.3%) | 35 (4.6%) |
| 45 to 59 Minutes | 40 (4.9%) | 17 (2.2%) |
| 60 to 89 Minutes | 16 (2.0%) | 0 (0.0%) |
| 90 or more Minutes | 17 (2.1%) | 0 (0.0%) |
Time of Departure to Work by Sex in Frontenac
The most frequent times of departure to work in Frontenac are 7:30 AM to 7:59 AM (237, 29.0%) for males and 7:30 AM to 7:59 AM (300, 39.7%) for females.
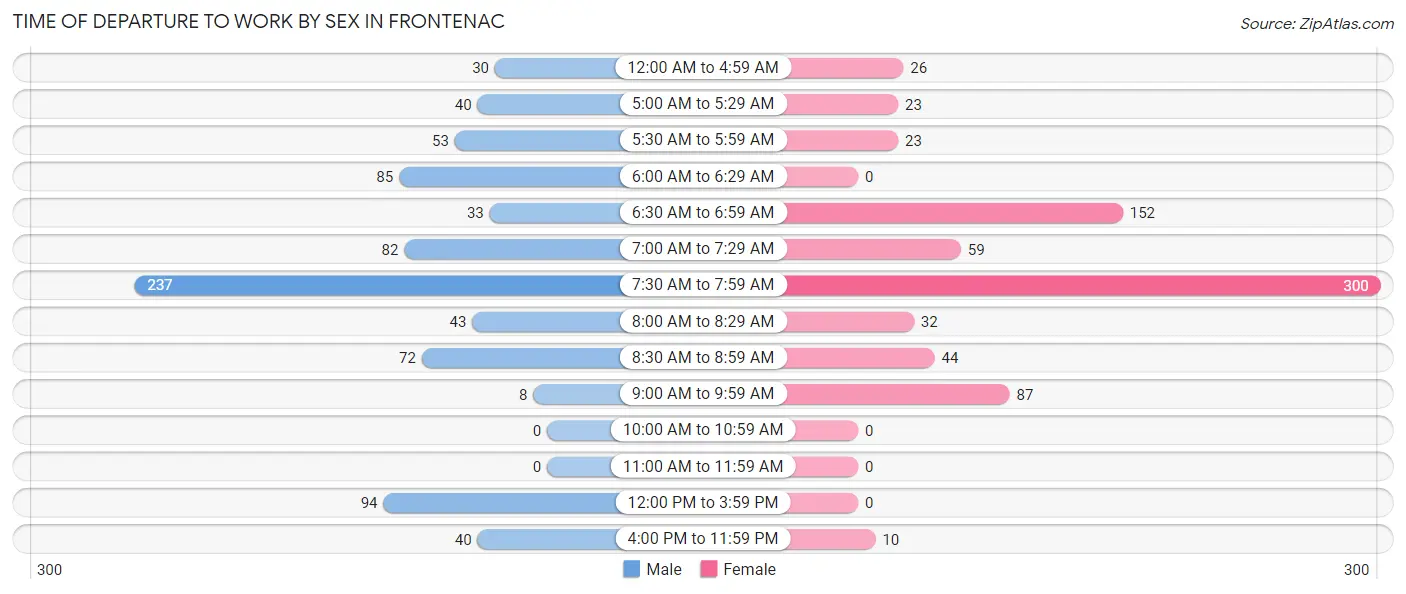
| Time of Departure | Male | Female |
| 12:00 AM to 4:59 AM | 30 (3.7%) | 26 (3.4%) |
| 5:00 AM to 5:29 AM | 40 (4.9%) | 23 (3.0%) |
| 5:30 AM to 5:59 AM | 53 (6.5%) | 23 (3.0%) |
| 6:00 AM to 6:29 AM | 85 (10.4%) | 0 (0.0%) |
| 6:30 AM to 6:59 AM | 33 (4.0%) | 152 (20.1%) |
| 7:00 AM to 7:29 AM | 82 (10.0%) | 59 (7.8%) |
| 7:30 AM to 7:59 AM | 237 (29.0%) | 300 (39.7%) |
| 8:00 AM to 8:29 AM | 43 (5.3%) | 32 (4.2%) |
| 8:30 AM to 8:59 AM | 72 (8.8%) | 44 (5.8%) |
| 9:00 AM to 9:59 AM | 8 (1.0%) | 87 (11.5%) |
| 10:00 AM to 10:59 AM | 0 (0.0%) | 0 (0.0%) |
| 11:00 AM to 11:59 AM | 0 (0.0%) | 0 (0.0%) |
| 12:00 PM to 3:59 PM | 94 (11.5%) | 0 (0.0%) |
| 4:00 PM to 11:59 PM | 40 (4.9%) | 10 (1.3%) |
| Total | 817 (100.0%) | 756 (100.0%) |
Housing Occupancy in Frontenac
Occupancy by Ownership in Frontenac
Of the total 1,358 dwellings in Frontenac, owner-occupied units account for 883 (65.0%), while renter-occupied units make up 475 (35.0%).
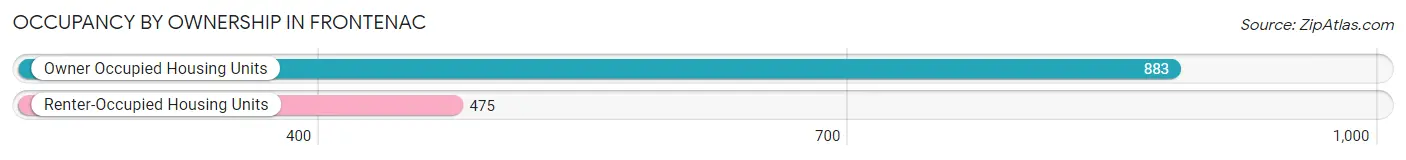
| Occupancy | # Housing Units | % Housing Units |
| Owner Occupied Housing Units | 883 | 65.0% |
| Renter-Occupied Housing Units | 475 | 35.0% |
| Total Occupied Housing Units | 1,358 | 100.0% |
Occupancy by Household Size in Frontenac
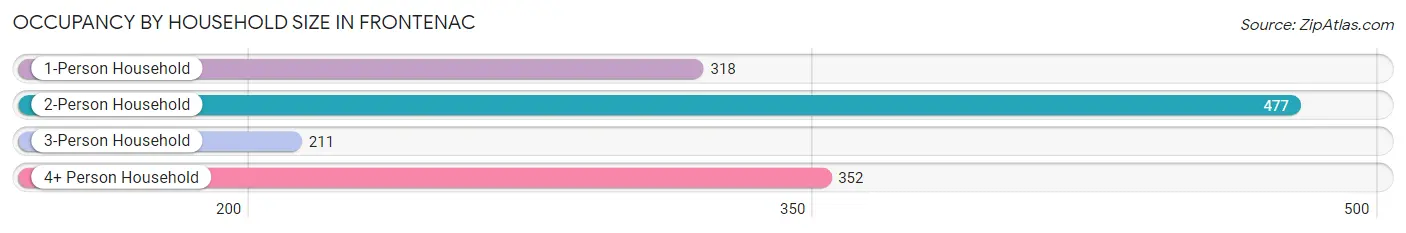
| Household Size | # Housing Units | % Housing Units |
| 1-Person Household | 318 | 23.4% |
| 2-Person Household | 477 | 35.1% |
| 3-Person Household | 211 | 15.5% |
| 4+ Person Household | 352 | 25.9% |
| Total Housing Units | 1,358 | 100.0% |
Occupancy by Ownership by Household Size in Frontenac
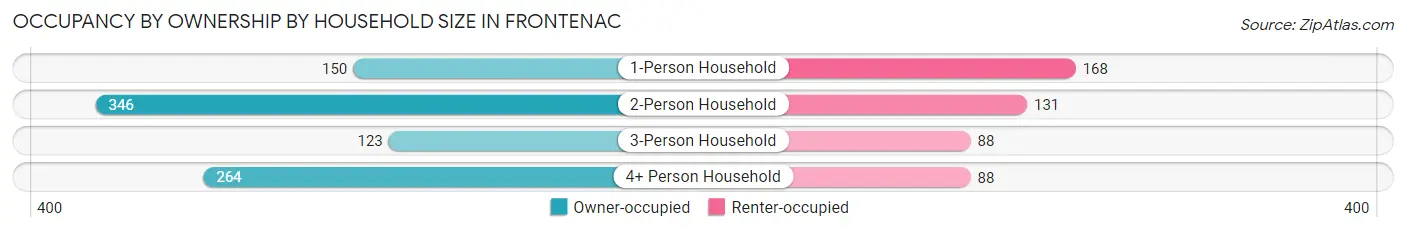
| Household Size | Owner-occupied | Renter-occupied |
| 1-Person Household | 150 (47.2%) | 168 (52.8%) |
| 2-Person Household | 346 (72.5%) | 131 (27.5%) |
| 3-Person Household | 123 (58.3%) | 88 (41.7%) |
| 4+ Person Household | 264 (75.0%) | 88 (25.0%) |
| Total Housing Units | 883 (65.0%) | 475 (35.0%) |
Occupancy by Educational Attainment in Frontenac
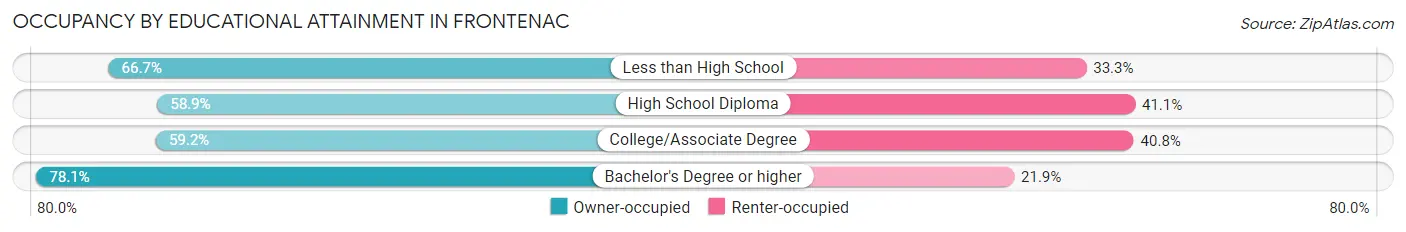
| Household Size | Owner-occupied | Renter-occupied |
| Less than High School | 50 (66.7%) | 25 (33.3%) |
| High School Diploma | 145 (58.9%) | 101 (41.1%) |
| College/Associate Degree | 381 (59.2%) | 263 (40.8%) |
| Bachelor's Degree or higher | 307 (78.1%) | 86 (21.9%) |
Occupancy by Age of Householder in Frontenac
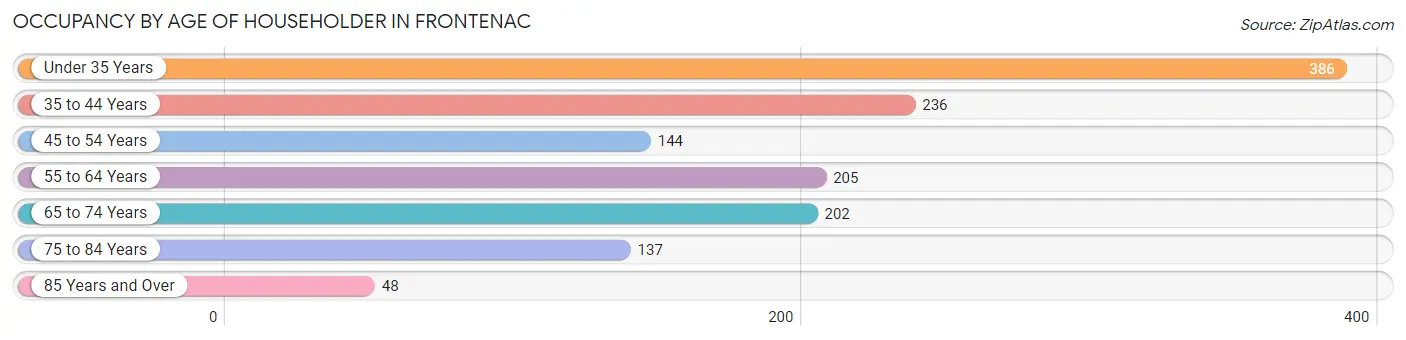
| Age Bracket | # Households | % Households |
| Under 35 Years | 386 | 28.4% |
| 35 to 44 Years | 236 | 17.4% |
| 45 to 54 Years | 144 | 10.6% |
| 55 to 64 Years | 205 | 15.1% |
| 65 to 74 Years | 202 | 14.9% |
| 75 to 84 Years | 137 | 10.1% |
| 85 Years and Over | 48 | 3.5% |
| Total | 1,358 | 100.0% |
Housing Finances in Frontenac
Median Income by Occupancy in Frontenac
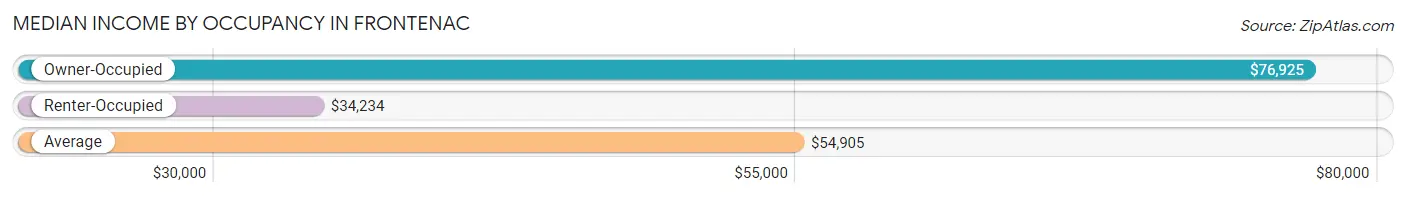
| Occupancy Type | # Households | Median Income |
| Owner-Occupied | 883 (65.0%) | $76,925 |
| Renter-Occupied | 475 (35.0%) | $34,234 |
| Average | 1,358 (100.0%) | $54,905 |
Occupancy by Householder Income Bracket in Frontenac
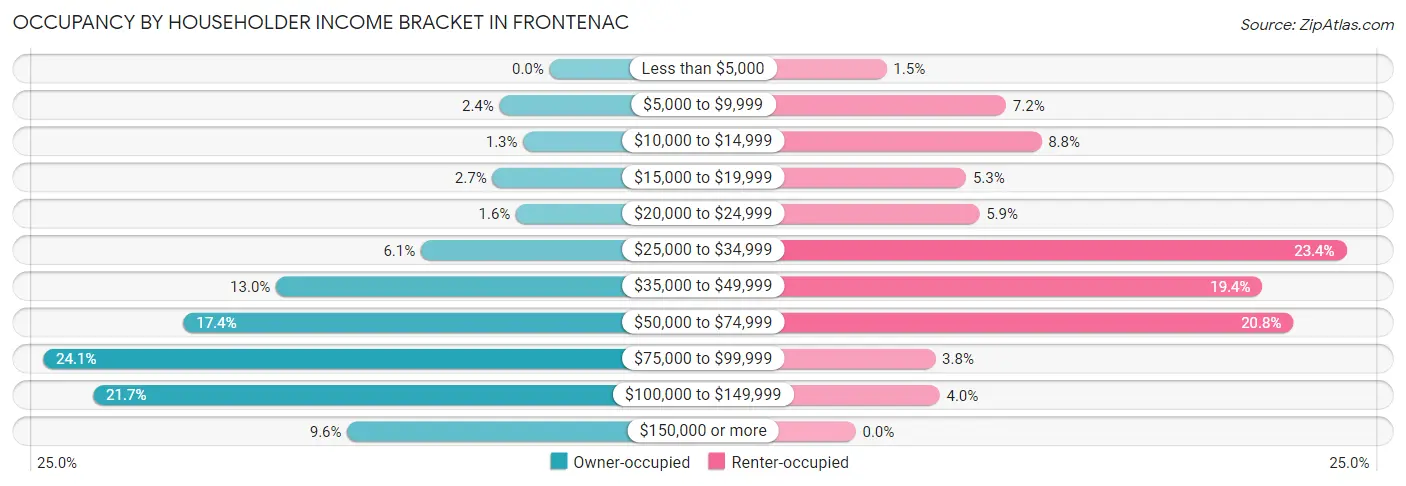
| Income Bracket | Owner-occupied | Renter-occupied |
| Less than $5,000 | 0 (0.0%) | 7 (1.5%) |
| $5,000 to $9,999 | 21 (2.4%) | 34 (7.2%) |
| $10,000 to $14,999 | 11 (1.3%) | 42 (8.8%) |
| $15,000 to $19,999 | 24 (2.7%) | 25 (5.3%) |
| $20,000 to $24,999 | 14 (1.6%) | 28 (5.9%) |
| $25,000 to $34,999 | 54 (6.1%) | 111 (23.4%) |
| $35,000 to $49,999 | 115 (13.0%) | 92 (19.4%) |
| $50,000 to $74,999 | 154 (17.4%) | 99 (20.8%) |
| $75,000 to $99,999 | 213 (24.1%) | 18 (3.8%) |
| $100,000 to $149,999 | 192 (21.7%) | 19 (4.0%) |
| $150,000 or more | 85 (9.6%) | 0 (0.0%) |
| Total | 883 (100.0%) | 475 (100.0%) |
Monthly Housing Cost Tiers in Frontenac
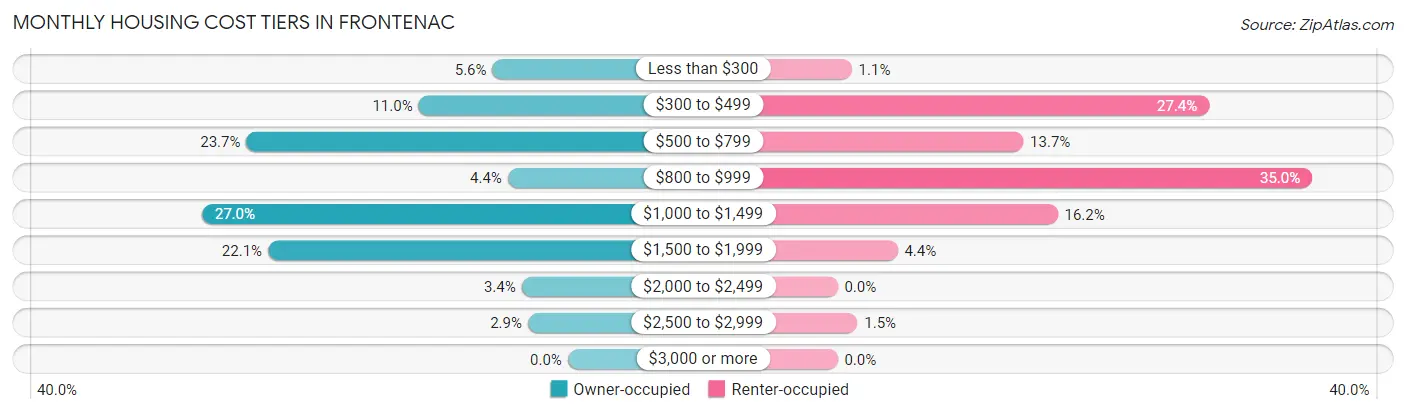
| Monthly Cost | Owner-occupied | Renter-occupied |
| Less than $300 | 49 (5.6%) | 5 (1.1%) |
| $300 to $499 | 97 (11.0%) | 130 (27.4%) |
| $500 to $799 | 209 (23.7%) | 65 (13.7%) |
| $800 to $999 | 39 (4.4%) | 166 (34.9%) |
| $1,000 to $1,499 | 238 (27.0%) | 77 (16.2%) |
| $1,500 to $1,999 | 195 (22.1%) | 21 (4.4%) |
| $2,000 to $2,499 | 30 (3.4%) | 0 (0.0%) |
| $2,500 to $2,999 | 26 (2.9%) | 7 (1.5%) |
| $3,000 or more | 0 (0.0%) | 0 (0.0%) |
| Total | 883 (100.0%) | 475 (100.0%) |
Physical Housing Characteristics in Frontenac
Housing Structures in Frontenac
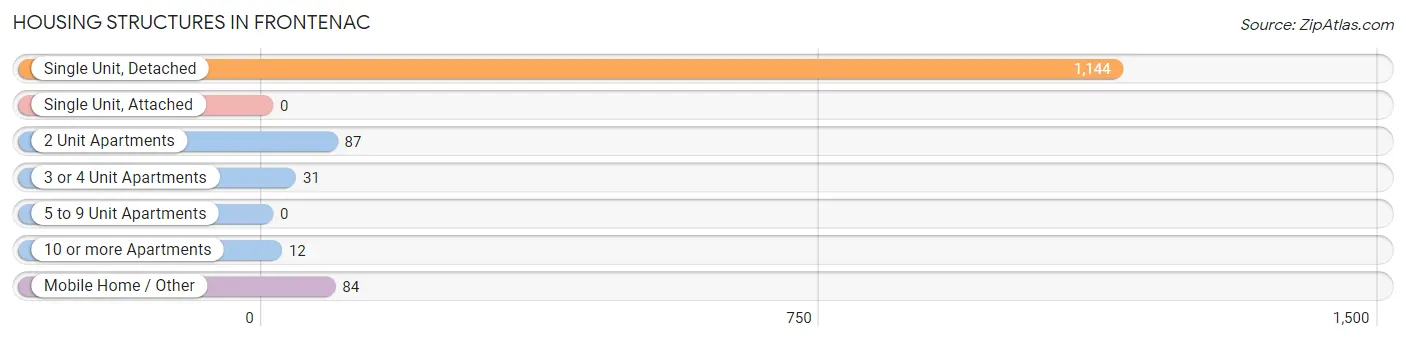
| Structure Type | # Housing Units | % Housing Units |
| Single Unit, Detached | 1,144 | 84.2% |
| Single Unit, Attached | 0 | 0.0% |
| 2 Unit Apartments | 87 | 6.4% |
| 3 or 4 Unit Apartments | 31 | 2.3% |
| 5 to 9 Unit Apartments | 0 | 0.0% |
| 10 or more Apartments | 12 | 0.9% |
| Mobile Home / Other | 84 | 6.2% |
| Total | 1,358 | 100.0% |
Housing Structures by Occupancy in Frontenac
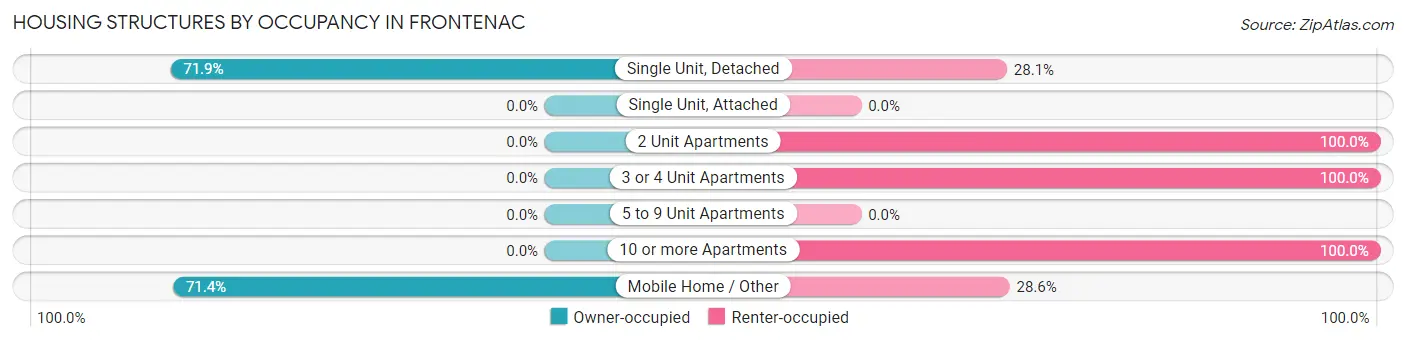
| Structure Type | Owner-occupied | Renter-occupied |
| Single Unit, Detached | 823 (71.9%) | 321 (28.1%) |
| Single Unit, Attached | 0 (0.0%) | 0 (0.0%) |
| 2 Unit Apartments | 0 (0.0%) | 87 (100.0%) |
| 3 or 4 Unit Apartments | 0 (0.0%) | 31 (100.0%) |
| 5 to 9 Unit Apartments | 0 (0.0%) | 0 (0.0%) |
| 10 or more Apartments | 0 (0.0%) | 12 (100.0%) |
| Mobile Home / Other | 60 (71.4%) | 24 (28.6%) |
| Total | 883 (65.0%) | 475 (35.0%) |
Housing Structures by Number of Rooms in Frontenac
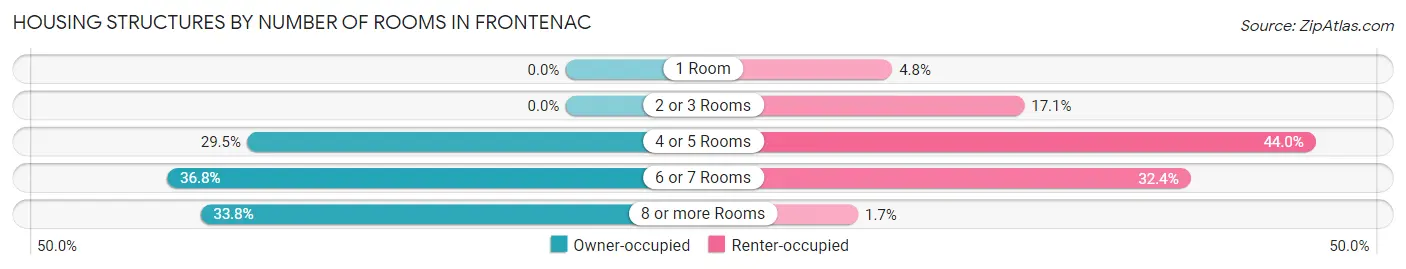
| Number of Rooms | Owner-occupied | Renter-occupied |
| 1 Room | 0 (0.0%) | 23 (4.8%) |
| 2 or 3 Rooms | 0 (0.0%) | 81 (17.1%) |
| 4 or 5 Rooms | 260 (29.4%) | 209 (44.0%) |
| 6 or 7 Rooms | 325 (36.8%) | 154 (32.4%) |
| 8 or more Rooms | 298 (33.8%) | 8 (1.7%) |
| Total | 883 (100.0%) | 475 (100.0%) |
Housing Structure by Heating Type in Frontenac
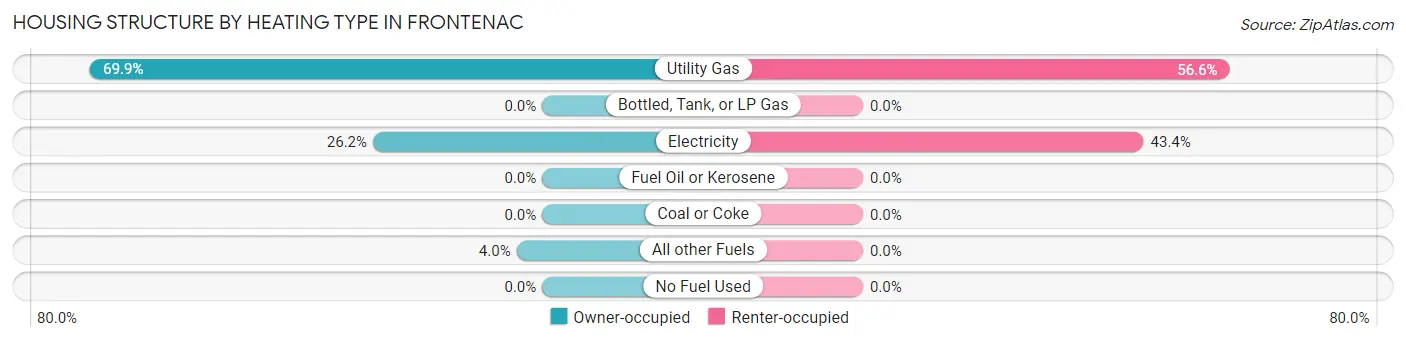
| Heating Type | Owner-occupied | Renter-occupied |
| Utility Gas | 617 (69.9%) | 269 (56.6%) |
| Bottled, Tank, or LP Gas | 0 (0.0%) | 0 (0.0%) |
| Electricity | 231 (26.2%) | 206 (43.4%) |
| Fuel Oil or Kerosene | 0 (0.0%) | 0 (0.0%) |
| Coal or Coke | 0 (0.0%) | 0 (0.0%) |
| All other Fuels | 35 (4.0%) | 0 (0.0%) |
| No Fuel Used | 0 (0.0%) | 0 (0.0%) |
| Total | 883 (100.0%) | 475 (100.0%) |
Household Vehicle Usage in Frontenac
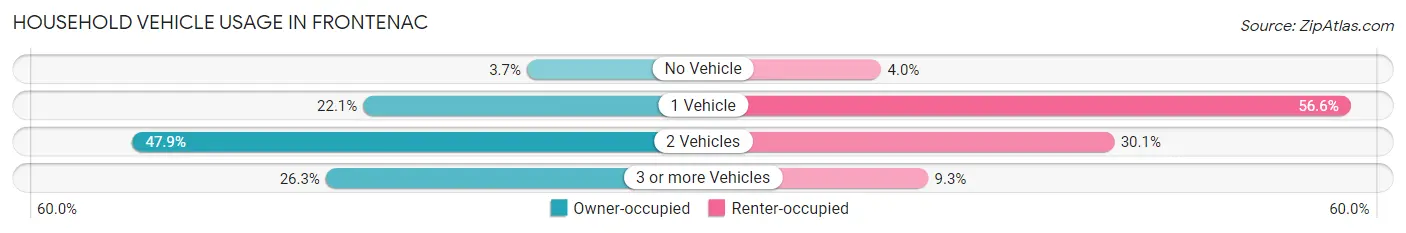
| Vehicles per Household | Owner-occupied | Renter-occupied |
| No Vehicle | 33 (3.7%) | 19 (4.0%) |
| 1 Vehicle | 195 (22.1%) | 269 (56.6%) |
| 2 Vehicles | 423 (47.9%) | 143 (30.1%) |
| 3 or more Vehicles | 232 (26.3%) | 44 (9.3%) |
| Total | 883 (100.0%) | 475 (100.0%) |
Real Estate & Mortgages in Frontenac
Real Estate and Mortgage Overview in Frontenac
| Characteristic | Without Mortgage | With Mortgage |
| Housing Units | 305 | 578 |
| Median Property Value | $122,600 | $154,300 |
| Median Household Income | $38,897 | $74 |
| Monthly Housing Costs | $507 | $0 |
| Real Estate Taxes | $2,141 | $0 |
Property Value by Mortgage Status in Frontenac
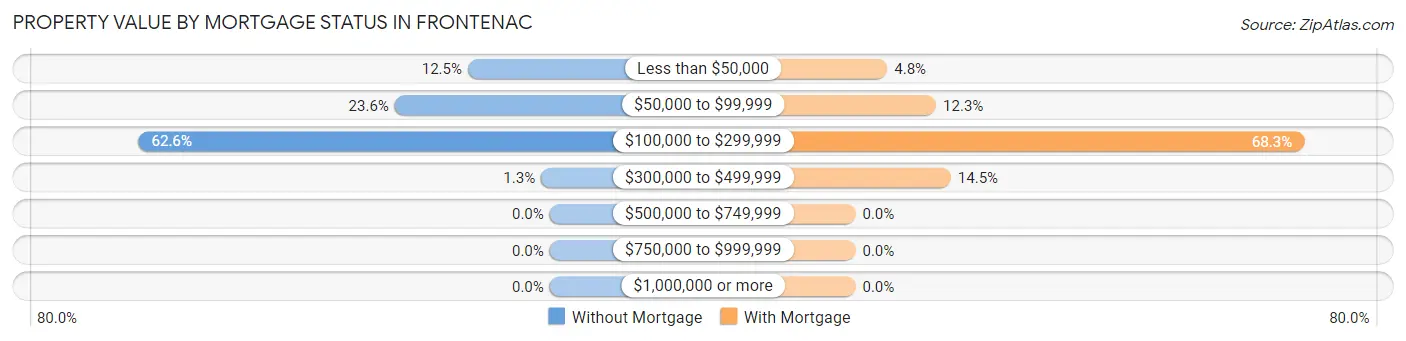
| Property Value | Without Mortgage | With Mortgage |
| Less than $50,000 | 38 (12.5%) | 28 (4.8%) |
| $50,000 to $99,999 | 72 (23.6%) | 71 (12.3%) |
| $100,000 to $299,999 | 191 (62.6%) | 395 (68.3%) |
| $300,000 to $499,999 | 4 (1.3%) | 84 (14.5%) |
| $500,000 to $749,999 | 0 (0.0%) | 0 (0.0%) |
| $750,000 to $999,999 | 0 (0.0%) | 0 (0.0%) |
| $1,000,000 or more | 0 (0.0%) | 0 (0.0%) |
| Total | 305 (100.0%) | 578 (100.0%) |
Household Income by Mortgage Status in Frontenac
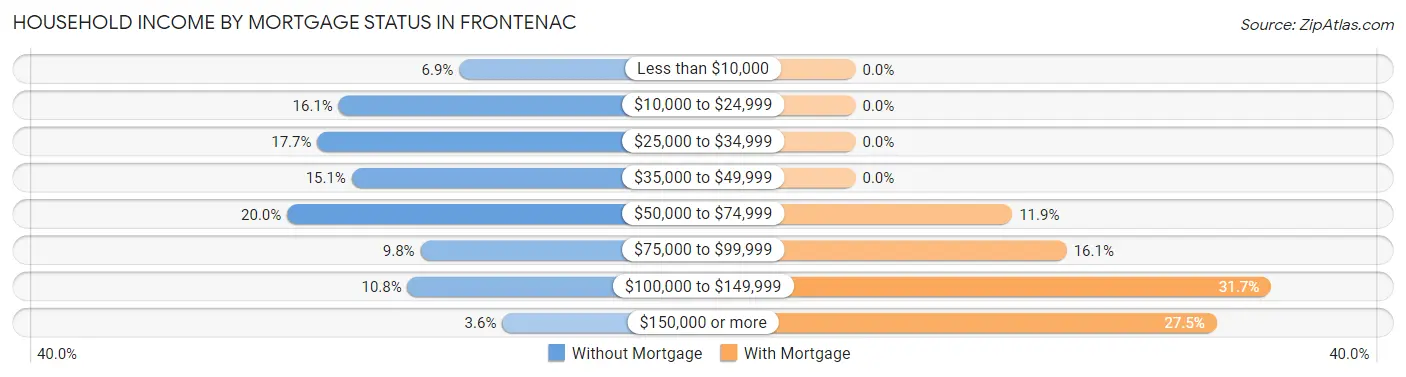
| Household Income | Without Mortgage | With Mortgage |
| Less than $10,000 | 21 (6.9%) | 0 (0.0%) |
| $10,000 to $24,999 | 49 (16.1%) | 0 (0.0%) |
| $25,000 to $34,999 | 54 (17.7%) | 0 (0.0%) |
| $35,000 to $49,999 | 46 (15.1%) | 0 (0.0%) |
| $50,000 to $74,999 | 61 (20.0%) | 69 (11.9%) |
| $75,000 to $99,999 | 30 (9.8%) | 93 (16.1%) |
| $100,000 to $149,999 | 33 (10.8%) | 183 (31.7%) |
| $150,000 or more | 11 (3.6%) | 159 (27.5%) |
| Total | 305 (100.0%) | 578 (100.0%) |
Property Value to Household Income Ratio in Frontenac
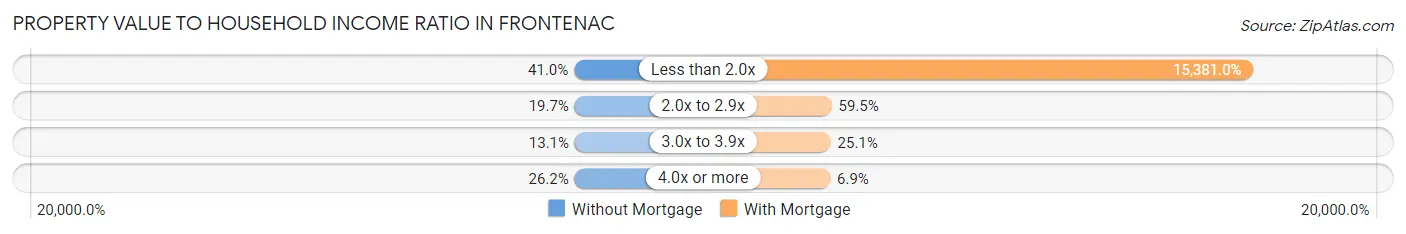
| Value-to-Income Ratio | Without Mortgage | With Mortgage |
| Less than 2.0x | 125 (41.0%) | 88,902 (15,381.0%) |
| 2.0x to 2.9x | 60 (19.7%) | 344 (59.5%) |
| 3.0x to 3.9x | 40 (13.1%) | 145 (25.1%) |
| 4.0x or more | 80 (26.2%) | 40 (6.9%) |
| Total | 305 (100.0%) | 578 (100.0%) |
Real Estate Taxes by Mortgage Status in Frontenac
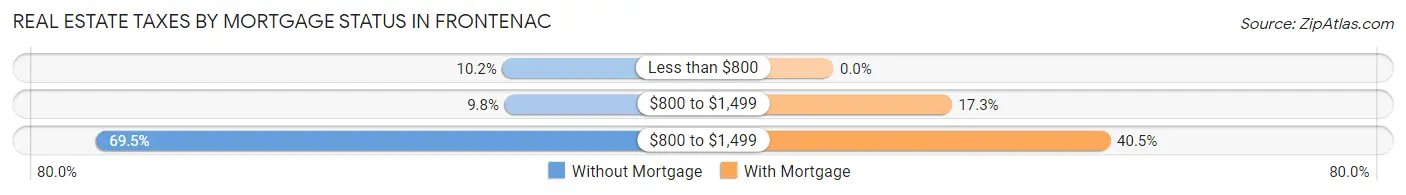
| Property Taxes | Without Mortgage | With Mortgage |
| Less than $800 | 31 (10.2%) | 0 (0.0%) |
| $800 to $1,499 | 30 (9.8%) | 100 (17.3%) |
| $800 to $1,499 | 212 (69.5%) | 234 (40.5%) |
| Total | 305 (100.0%) | 578 (100.0%) |
Health & Disability in Frontenac
Health Insurance Coverage by Age in Frontenac
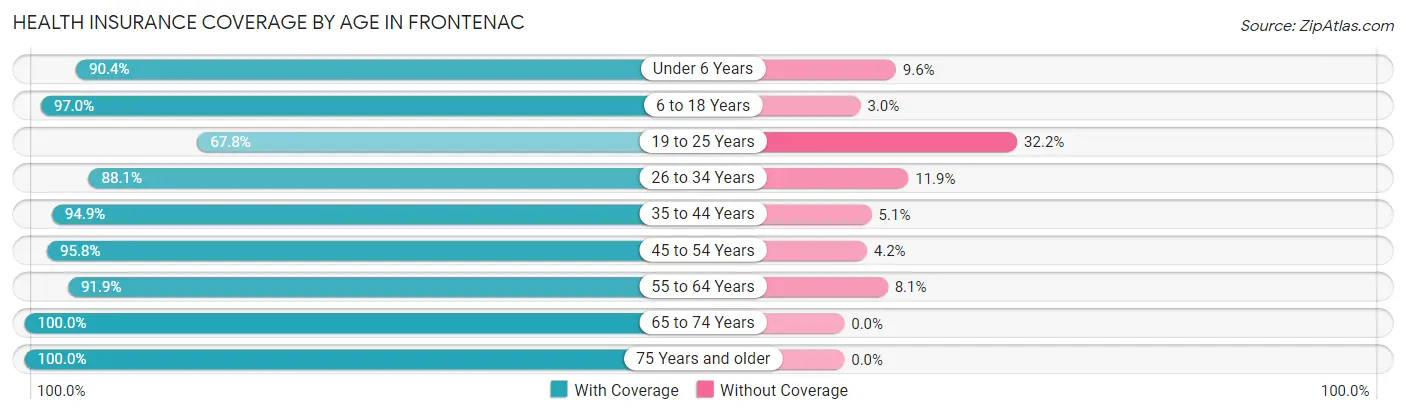
| Age Bracket | With Coverage | Without Coverage |
| Under 6 Years | 414 (90.4%) | 44 (9.6%) |
| 6 to 18 Years | 417 (97.0%) | 13 (3.0%) |
| 19 to 25 Years | 164 (67.8%) | 78 (32.2%) |
| 26 to 34 Years | 450 (88.1%) | 61 (11.9%) |
| 35 to 44 Years | 465 (94.9%) | 25 (5.1%) |
| 45 to 54 Years | 251 (95.8%) | 11 (4.2%) |
| 55 to 64 Years | 329 (91.9%) | 29 (8.1%) |
| 65 to 74 Years | 314 (100.0%) | 0 (0.0%) |
| 75 Years and older | 226 (100.0%) | 0 (0.0%) |
| Total | 3,030 (92.1%) | 261 (7.9%) |
Health Insurance Coverage by Citizenship Status in Frontenac
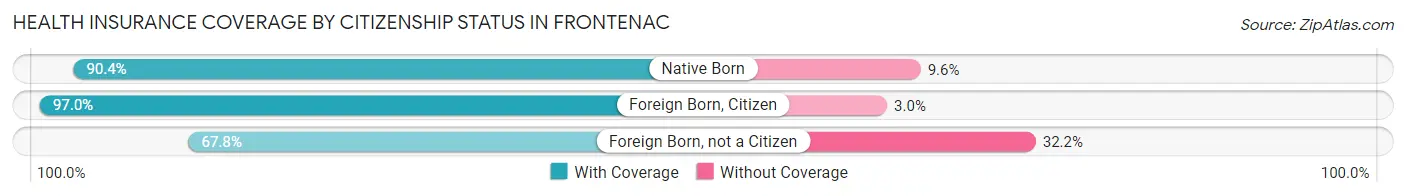
| Citizenship Status | With Coverage | Without Coverage |
| Native Born | 414 (90.4%) | 44 (9.6%) |
| Foreign Born, Citizen | 417 (97.0%) | 13 (3.0%) |
| Foreign Born, not a Citizen | 164 (67.8%) | 78 (32.2%) |
Health Insurance Coverage by Household Income in Frontenac
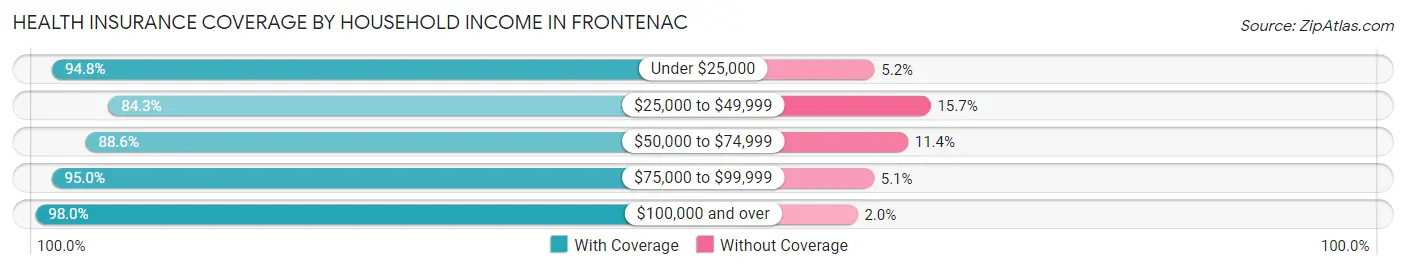
| Household Income | With Coverage | Without Coverage |
| Under $25,000 | 239 (94.8%) | 13 (5.2%) |
| $25,000 to $49,999 | 624 (84.3%) | 116 (15.7%) |
| $50,000 to $74,999 | 620 (88.6%) | 80 (11.4%) |
| $75,000 to $99,999 | 621 (95.0%) | 33 (5.1%) |
| $100,000 and over | 926 (98.0%) | 19 (2.0%) |
Public vs Private Health Insurance Coverage by Age in Frontenac
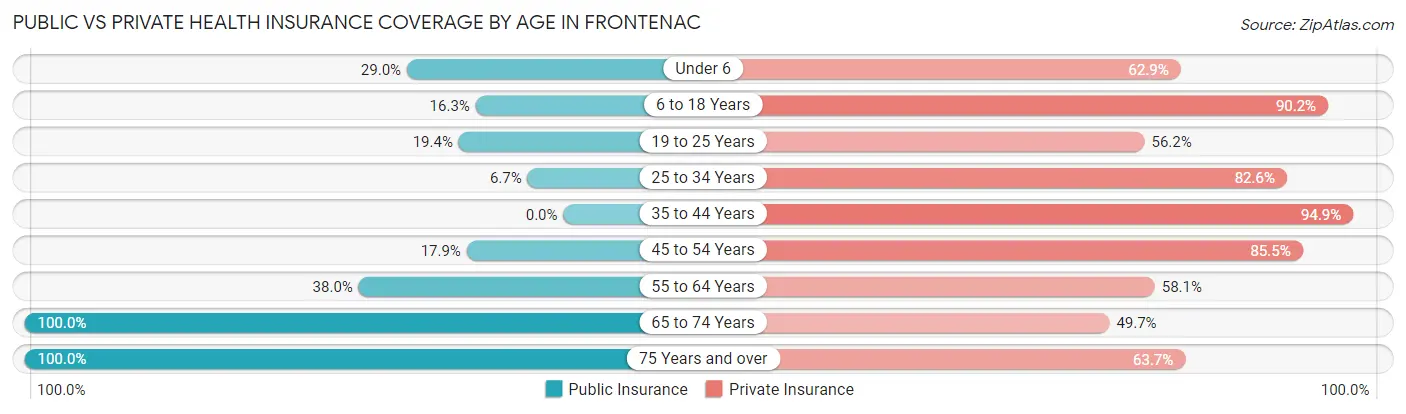
| Age Bracket | Public Insurance | Private Insurance |
| Under 6 | 133 (29.0%) | 288 (62.9%) |
| 6 to 18 Years | 70 (16.3%) | 388 (90.2%) |
| 19 to 25 Years | 47 (19.4%) | 136 (56.2%) |
| 25 to 34 Years | 34 (6.7%) | 422 (82.6%) |
| 35 to 44 Years | 0 (0.0%) | 465 (94.9%) |
| 45 to 54 Years | 47 (17.9%) | 224 (85.5%) |
| 55 to 64 Years | 136 (38.0%) | 208 (58.1%) |
| 65 to 74 Years | 314 (100.0%) | 156 (49.7%) |
| 75 Years and over | 226 (100.0%) | 144 (63.7%) |
| Total | 1,007 (30.6%) | 2,431 (73.9%) |
Disability Status by Sex by Age in Frontenac
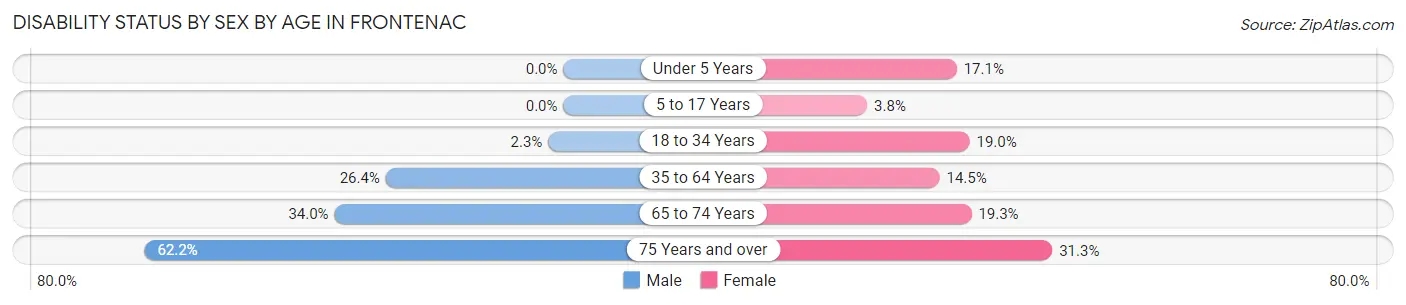
| Age Bracket | Male | Female |
| Under 5 Years | 0 (0.0%) | 35 (17.1%) |
| 5 to 17 Years | 0 (0.0%) | 11 (3.8%) |
| 18 to 34 Years | 8 (2.2%) | 77 (19.0%) |
| 35 to 64 Years | 162 (26.4%) | 72 (14.5%) |
| 65 to 74 Years | 52 (34.0%) | 31 (19.3%) |
| 75 Years and over | 51 (62.2%) | 45 (31.2%) |
Disability Class by Sex by Age in Frontenac
Disability Class: Hearing Difficulty
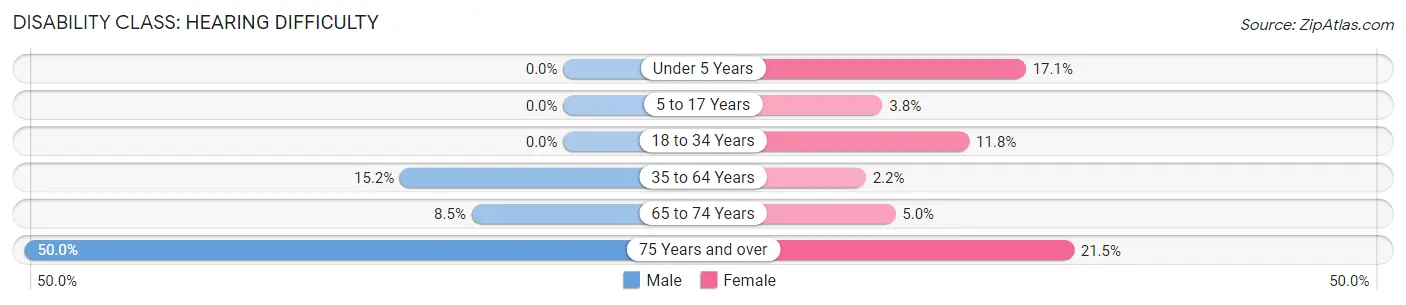
| Age Bracket | Male | Female |
| Under 5 Years | 0 (0.0%) | 35 (17.1%) |
| 5 to 17 Years | 0 (0.0%) | 11 (3.8%) |
| 18 to 34 Years | 0 (0.0%) | 48 (11.8%) |
| 35 to 64 Years | 93 (15.1%) | 11 (2.2%) |
| 65 to 74 Years | 13 (8.5%) | 8 (5.0%) |
| 75 Years and over | 41 (50.0%) | 31 (21.5%) |
Disability Class: Vision Difficulty
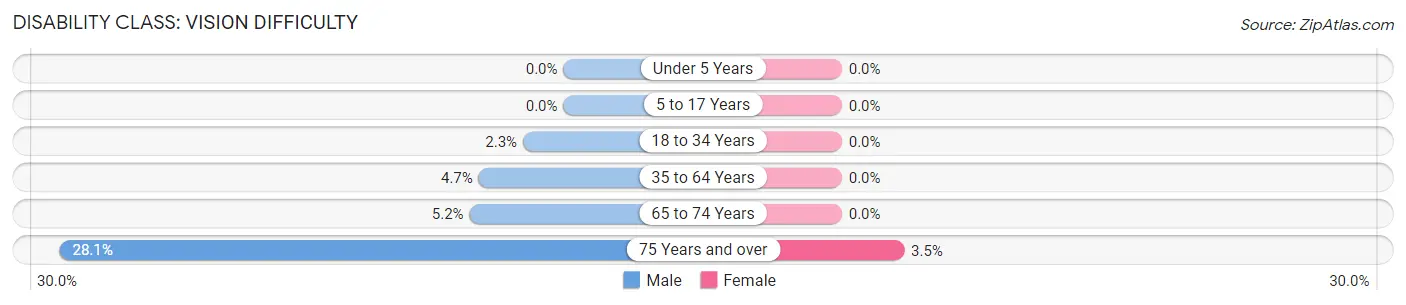
| Age Bracket | Male | Female |
| Under 5 Years | 0 (0.0%) | 0 (0.0%) |
| 5 to 17 Years | 0 (0.0%) | 0 (0.0%) |
| 18 to 34 Years | 8 (2.2%) | 0 (0.0%) |
| 35 to 64 Years | 29 (4.7%) | 0 (0.0%) |
| 65 to 74 Years | 8 (5.2%) | 0 (0.0%) |
| 75 Years and over | 23 (28.1%) | 5 (3.5%) |
Disability Class: Cognitive Difficulty
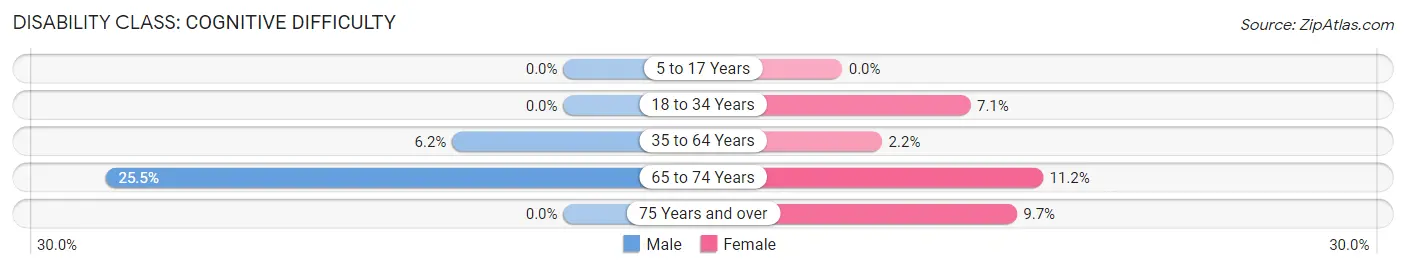
| Age Bracket | Male | Female |
| 5 to 17 Years | 0 (0.0%) | 0 (0.0%) |
| 18 to 34 Years | 0 (0.0%) | 29 (7.1%) |
| 35 to 64 Years | 38 (6.2%) | 11 (2.2%) |
| 65 to 74 Years | 39 (25.5%) | 18 (11.2%) |
| 75 Years and over | 0 (0.0%) | 14 (9.7%) |
Disability Class: Ambulatory Difficulty
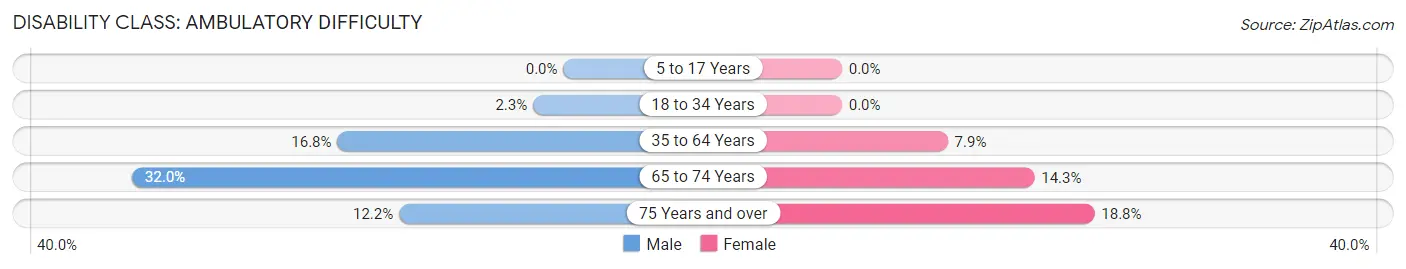
| Age Bracket | Male | Female |
| 5 to 17 Years | 0 (0.0%) | 0 (0.0%) |
| 18 to 34 Years | 8 (2.2%) | 0 (0.0%) |
| 35 to 64 Years | 103 (16.8%) | 39 (7.9%) |
| 65 to 74 Years | 49 (32.0%) | 23 (14.3%) |
| 75 Years and over | 10 (12.2%) | 27 (18.8%) |
Disability Class: Self-Care Difficulty
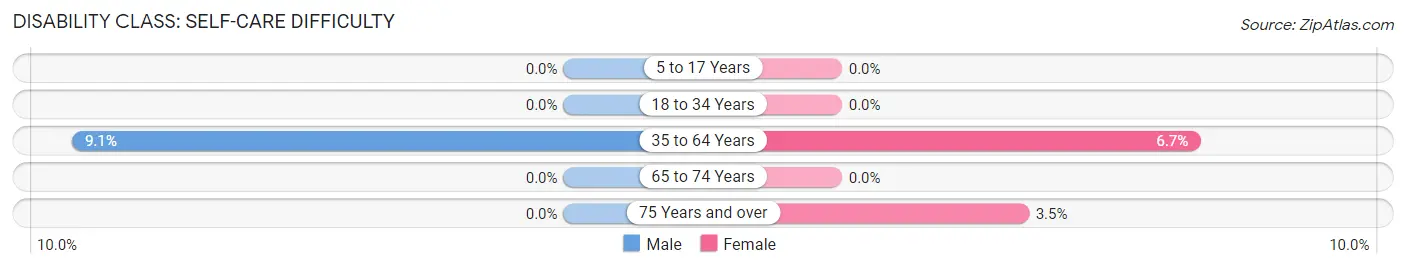
| Age Bracket | Male | Female |
| 5 to 17 Years | 0 (0.0%) | 0 (0.0%) |
| 18 to 34 Years | 0 (0.0%) | 0 (0.0%) |
| 35 to 64 Years | 56 (9.1%) | 33 (6.7%) |
| 65 to 74 Years | 0 (0.0%) | 0 (0.0%) |
| 75 Years and over | 0 (0.0%) | 5 (3.5%) |
Technology Access in Frontenac
Computing Device Access in Frontenac
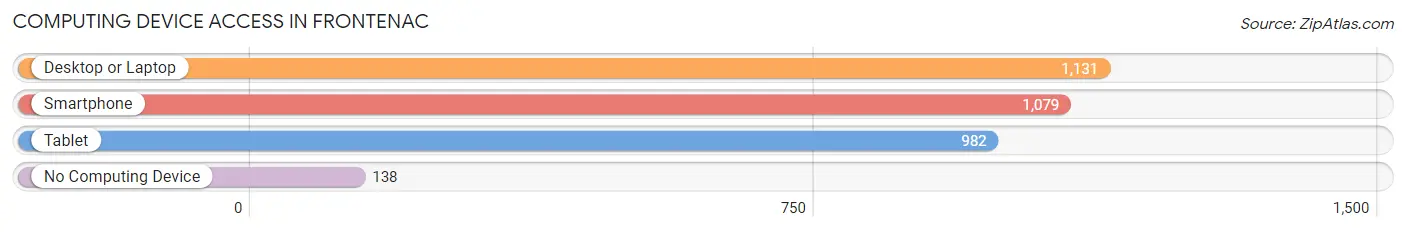
| Device Type | # Households | % Households |
| Desktop or Laptop | 1,131 | 83.3% |
| Smartphone | 1,079 | 79.5% |
| Tablet | 982 | 72.3% |
| No Computing Device | 138 | 10.2% |
| Total | 1,358 | 100.0% |
Internet Access in Frontenac
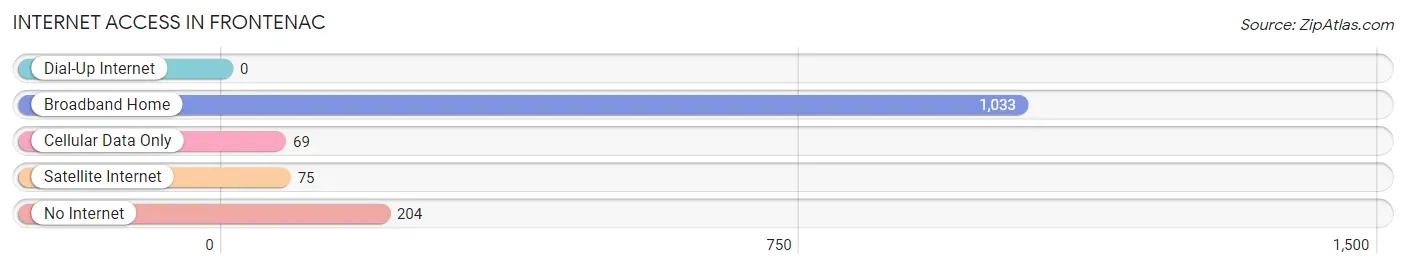
| Internet Type | # Households | % Households |
| Dial-Up Internet | 0 | 0.0% |
| Broadband Home | 1,033 | 76.1% |
| Cellular Data Only | 69 | 5.1% |
| Satellite Internet | 75 | 5.5% |
| No Internet | 204 | 15.0% |
| Total | 1,358 | 100.0% |
Frontenac Summary
Frontenac, Kansas is a small city located in Crawford County, in the southeastern corner of the state. It is situated on the banks of the Verdigris River, and is part of the Pittsburg, KS Metropolitan Statistical Area. The city has a population of approximately 3,000 people, and is home to a variety of businesses, including a large industrial park.
History
Frontenac was founded in 1872 by a group of settlers from France, who named the city after the French city of Frontenac. The city was incorporated in 1887, and the first mayor was elected in 1888. The city was originally a farming community, but in the early 1900s, the discovery of coal in the area led to the development of a coal mining industry. The coal industry was the main source of employment for the city until the 1950s, when the mines began to close.
In the late 1950s, the city began to diversify its economy, and the industrial park was established. This park has attracted a variety of businesses, including manufacturing, warehousing, and distribution companies. The city also has a number of retail stores, restaurants, and other businesses.
Geography
Frontenac is located in the southeastern corner of Kansas, on the banks of the Verdigris River. The city is situated in the Ozark Plateau region of the state, and is surrounded by rolling hills and wooded areas. The city has a total area of 4.2 square miles, and is located approximately 30 miles south of Pittsburg, KS.
The climate in Frontenac is generally mild, with hot summers and cold winters. The average annual temperature is around 54 degrees Fahrenheit, and the average annual precipitation is around 40 inches.
Economy
Frontenac’s economy is largely based on the industrial park, which is home to a variety of businesses, including manufacturing, warehousing, and distribution companies. The city also has a number of retail stores, restaurants, and other businesses.
The city is also home to a number of educational institutions, including Pittsburg State University, which is located just outside of the city limits. The university offers a variety of degree programs, and is a major employer in the area.
Demographics
As of the 2010 census, Frontenac had a population of 3,000 people. The racial makeup of the city was 95.3% White, 0.7% African American, 0.3% Native American, 0.7% Asian, and 2.7% from other races. The median household income was $37,500, and the median family income was $45,000.
Frontenac is a small city with a diverse population and a strong economy. The city has a variety of businesses, educational institutions, and other amenities, and is a great place to live and work.
Common Questions
What is Per Capita Income in Frontenac?
Per Capita income in Frontenac is $27,597.
What is the Median Family Income in Frontenac?
Median Family Income in Frontenac is $71,289.
What is the Median Household income in Frontenac?
Median Household Income in Frontenac is $54,905.
What is Income or Wage Gap in Frontenac?
Income or Wage Gap in Frontenac is 6.8%.
Women in Frontenac earn 93.2 cents for every dollar earned by a man.
What is Inequality or Gini Index in Frontenac?
Inequality or Gini Index in Frontenac is 0.37.
What is the Total Population of Frontenac?
Total Population of Frontenac is 3,384.
What is the Total Male Population of Frontenac?
Total Male Population of Frontenac is 1,609.
What is the Total Female Population of Frontenac?
Total Female Population of Frontenac is 1,775.
What is the Ratio of Males per 100 Females in Frontenac?
There are 90.65 Males per 100 Females in Frontenac.
What is the Ratio of Females per 100 Males in Frontenac?
There are 110.32 Females per 100 Males in Frontenac.
What is the Median Population Age in Frontenac?
Median Population Age in Frontenac is 35.9 Years.
What is the Average Family Size in Frontenac
Average Family Size in Frontenac is 2.7 People.
What is the Average Household Size in Frontenac
Average Household Size in Frontenac is 2.4 People.
How Large is the Labor Force in Frontenac?
There are 1,719 People in the Labor Forcein in Frontenac.
What is the Percentage of People in the Labor Force in Frontenac?
67.4% of People are in the Labor Force in Frontenac.
What is the Unemployment Rate in Frontenac?
Unemployment Rate in Frontenac is 1.6%.