Moundridge, KS Map & Demographics
Moundridge Map
Moundridge Overview
$32,177
PER CAPITA INCOME
$83,365
AVG FAMILY INCOME
$59,048
AVG HOUSEHOLD INCOME
28.9%
WAGE / INCOME GAP [ % ]
71.1¢/ $1
WAGE / INCOME GAP [ $ ]
0.39
INEQUALITY / GINI INDEX
1,854
TOTAL POPULATION
797
MALE POPULATION
1,057
FEMALE POPULATION
75.40
MALES / 100 FEMALES
132.62
FEMALES / 100 MALES
52.4
MEDIAN AGE
2.9
AVG FAMILY SIZE
2.2
AVG HOUSEHOLD SIZE
772
LABOR FORCE [ PEOPLE ]
50.5%
PERCENT IN LABOR FORCE
2.2%
UNEMPLOYMENT RATE
Moundridge Zip Codes
Moundridge Area Codes
Income in Moundridge
Income Overview in Moundridge
Per Capita Income in Moundridge is $32,177, while median incomes of families and households are $83,365 and $59,048 respectively.
| Characteristic | Number | Measure |
| Per Capita Income | 1,854 | $32,177 |
| Median Family Income | 461 | $83,365 |
| Mean Family Income | 461 | $92,275 |
| Median Household Income | 750 | $59,048 |
| Mean Household Income | 750 | $73,305 |
| Income Deficit | 461 | $0 |
| Wage / Income Gap (%) | 1,854 | 28.85% |
| Wage / Income Gap ($) | 1,854 | 71.15¢ per $1 |
| Gini / Inequality Index | 1,854 | 0.39 |
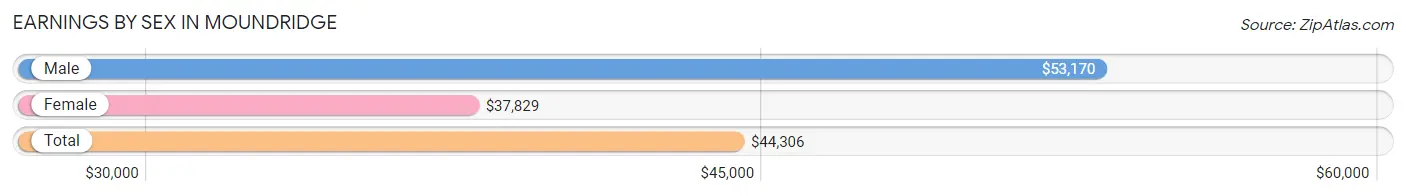
Earnings by Sex in Moundridge
Average Earnings in Moundridge are $44,306, $53,170 for men and $37,829 for women, a difference of 28.8%.
| Sex | Number | Average Earnings |
| Male | 389 (46.2%) | $53,170 |
| Female | 453 (53.8%) | $37,829 |
| Total | 842 (100.0%) | $44,306 |
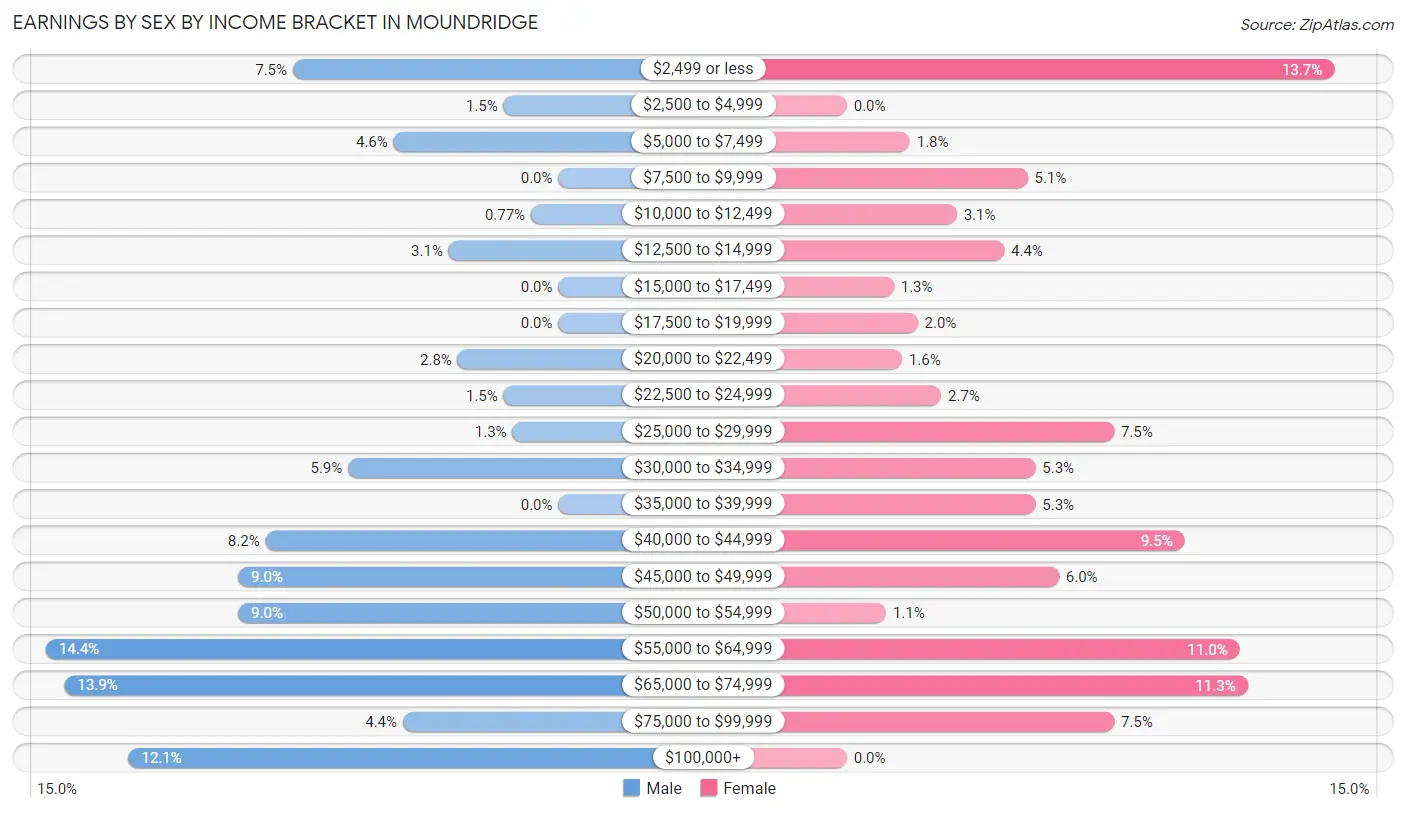
Earnings by Sex by Income Bracket in Moundridge
The most common earnings brackets in Moundridge are $55,000 to $64,999 for men (56 | 14.4%) and $2,499 or less for women (62 | 13.7%).
| Income | Male | Female |
| $2,499 or less | 29 (7.5%) | 62 (13.7%) |
| $2,500 to $4,999 | 6 (1.5%) | 0 (0.0%) |
| $5,000 to $7,499 | 18 (4.6%) | 8 (1.8%) |
| $7,500 to $9,999 | 0 (0.0%) | 23 (5.1%) |
| $10,000 to $12,499 | 3 (0.8%) | 14 (3.1%) |
| $12,500 to $14,999 | 12 (3.1%) | 20 (4.4%) |
| $15,000 to $17,499 | 0 (0.0%) | 6 (1.3%) |
| $17,500 to $19,999 | 0 (0.0%) | 9 (2.0%) |
| $20,000 to $22,499 | 11 (2.8%) | 7 (1.5%) |
| $22,500 to $24,999 | 6 (1.5%) | 12 (2.6%) |
| $25,000 to $29,999 | 5 (1.3%) | 34 (7.5%) |
| $30,000 to $34,999 | 23 (5.9%) | 24 (5.3%) |
| $35,000 to $39,999 | 0 (0.0%) | 24 (5.3%) |
| $40,000 to $44,999 | 32 (8.2%) | 43 (9.5%) |
| $45,000 to $49,999 | 35 (9.0%) | 27 (6.0%) |
| $50,000 to $54,999 | 35 (9.0%) | 5 (1.1%) |
| $55,000 to $64,999 | 56 (14.4%) | 50 (11.0%) |
| $65,000 to $74,999 | 54 (13.9%) | 51 (11.3%) |
| $75,000 to $99,999 | 17 (4.4%) | 34 (7.5%) |
| $100,000+ | 47 (12.1%) | 0 (0.0%) |
| Total | 389 (100.0%) | 453 (100.0%) |
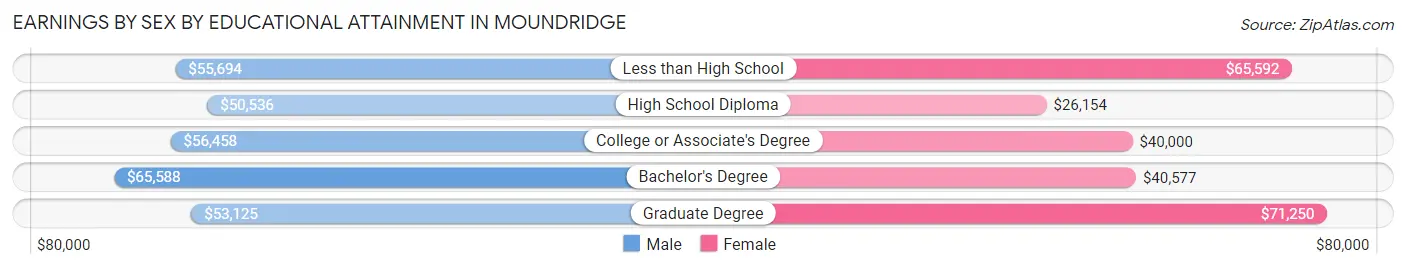
Earnings by Sex by Educational Attainment in Moundridge
Average earnings in Moundridge are $55,403 for men and $41,118 for women, a difference of 25.8%. Men with an educational attainment of bachelor's degree enjoy the highest average annual earnings of $65,588, while those with high school diploma education earn the least with $50,536. Women with an educational attainment of graduate degree earn the most with the average annual earnings of $71,250, while those with high school diploma education have the smallest earnings of $26,154.
| Educational Attainment | Male Income | Female Income |
| Less than High School | $55,694 | $65,592 |
| High School Diploma | $50,536 | $26,154 |
| College or Associate's Degree | $56,458 | $40,000 |
| Bachelor's Degree | $65,588 | $40,577 |
| Graduate Degree | $53,125 | $71,250 |
| Total | $55,403 | $41,118 |
Family Income in Moundridge
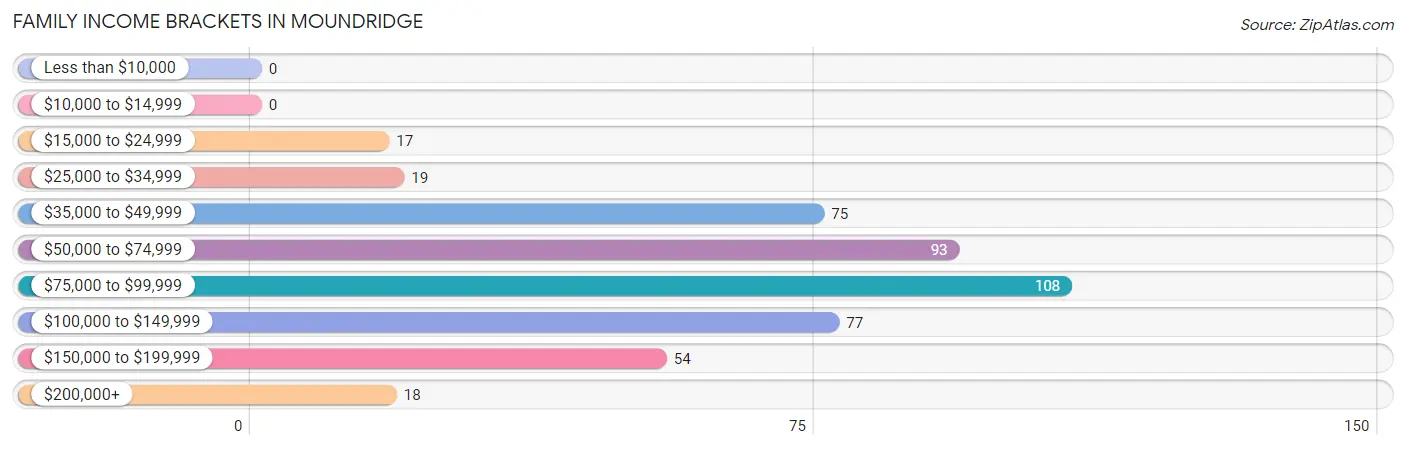
Family Income Brackets in Moundridge
According to the Moundridge family income data, there are 108 families falling into the $75,000 to $99,999 income range, which is the most common income bracket and makes up 23.4% of all families.
| Income Bracket | # Families | % Families |
| Less than $10,000 | 0 | 0.0% |
| $10,000 to $14,999 | 0 | 0.0% |
| $15,000 to $24,999 | 17 | 3.7% |
| $25,000 to $34,999 | 19 | 4.1% |
| $35,000 to $49,999 | 75 | 16.3% |
| $50,000 to $74,999 | 93 | 20.2% |
| $75,000 to $99,999 | 108 | 23.4% |
| $100,000 to $149,999 | 77 | 16.7% |
| $150,000 to $199,999 | 54 | 11.7% |
| $200,000+ | 18 | 3.9% |
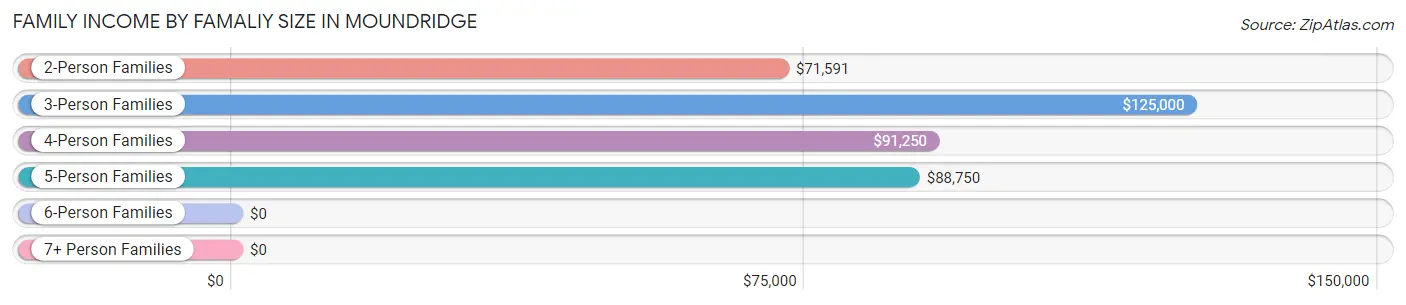
Family Income by Famaliy Size in Moundridge
3-person families (52 | 11.3%) account for the highest median family income in Moundridge with $125,000 per family, while 3-person families (52 | 11.3%) have the highest median income of $41,667 per family member.
| Income Bracket | # Families | Median Income |
| 2-Person Families | 282 (61.2%) | $71,591 |
| 3-Person Families | 52 (11.3%) | $125,000 |
| 4-Person Families | 70 (15.2%) | $91,250 |
| 5-Person Families | 37 (8.0%) | $88,750 |
| 6-Person Families | 0 (0.0%) | $0 |
| 7+ Person Families | 20 (4.3%) | $0 |
| Total | 461 (100.0%) | $83,365 |
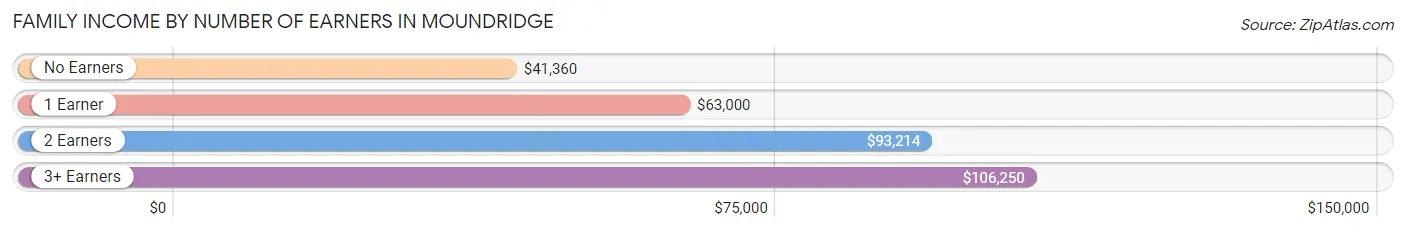
Family Income by Number of Earners in Moundridge
The median family income in Moundridge is $83,365, with families comprising 3+ earners (36) having the highest median family income of $106,250, while families with no earners (103) have the lowest median family income of $41,360, accounting for 7.8% and 22.3% of families, respectively.
| Number of Earners | # Families | Median Income |
| No Earners | 103 (22.3%) | $41,360 |
| 1 Earner | 98 (21.3%) | $63,000 |
| 2 Earners | 224 (48.6%) | $93,214 |
| 3+ Earners | 36 (7.8%) | $106,250 |
| Total | 461 (100.0%) | $83,365 |
Household Income in Moundridge
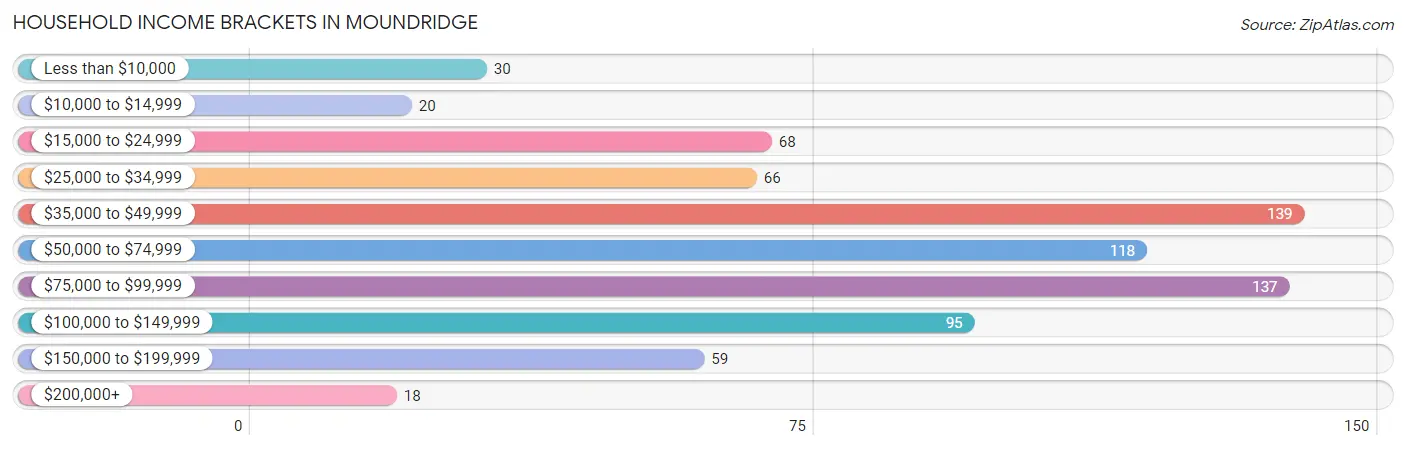
Household Income Brackets in Moundridge
With 139 households falling in the category, the $35,000 to $49,999 income range is the most frequent in Moundridge, accounting for 18.5% of all households. In contrast, only 18 households (2.4%) fall into the $200,000+ income bracket, making it the least populous group.
| Income Bracket | # Households | % Households |
| Less than $10,000 | 30 | 4.0% |
| $10,000 to $14,999 | 20 | 2.7% |
| $15,000 to $24,999 | 68 | 9.1% |
| $25,000 to $34,999 | 66 | 8.8% |
| $35,000 to $49,999 | 139 | 18.5% |
| $50,000 to $74,999 | 118 | 15.7% |
| $75,000 to $99,999 | 137 | 18.3% |
| $100,000 to $149,999 | 95 | 12.7% |
| $150,000 to $199,999 | 59 | 7.9% |
| $200,000+ | 18 | 2.4% |
Household Income by Householder Age in Moundridge
The median household income in Moundridge is $59,048, with the highest median household income of $88,194 found in the 45 to 64 years age bracket for the primary householder. A total of 239 households (31.9%) fall into this category. Meanwhile, the 65+ years age bracket for the primary householder has the lowest median household income of $37,250, with 289 households (38.5%) in this group.
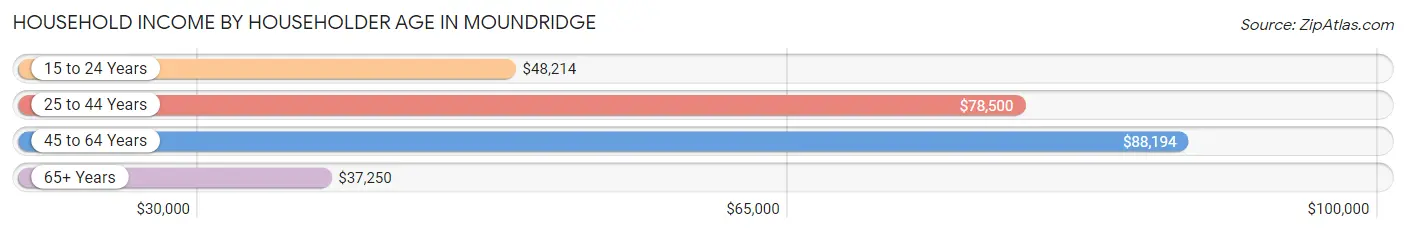
| Income Bracket | # Households | Median Income |
| 15 to 24 Years | 20 (2.7%) | $48,214 |
| 25 to 44 Years | 202 (26.9%) | $78,500 |
| 45 to 64 Years | 239 (31.9%) | $88,194 |
| 65+ Years | 289 (38.5%) | $37,250 |
| Total | 750 (100.0%) | $59,048 |
Poverty in Moundridge
Income Below Poverty by Sex and Age in Moundridge
With 8.2% poverty level for males and 7.4% for females among the residents of Moundridge, 18 to 24 year old males and 5 year old females are the most vulnerable to poverty, with 12 males (28.6%) and 5 females (55.6%) in their respective age groups living below the poverty level.
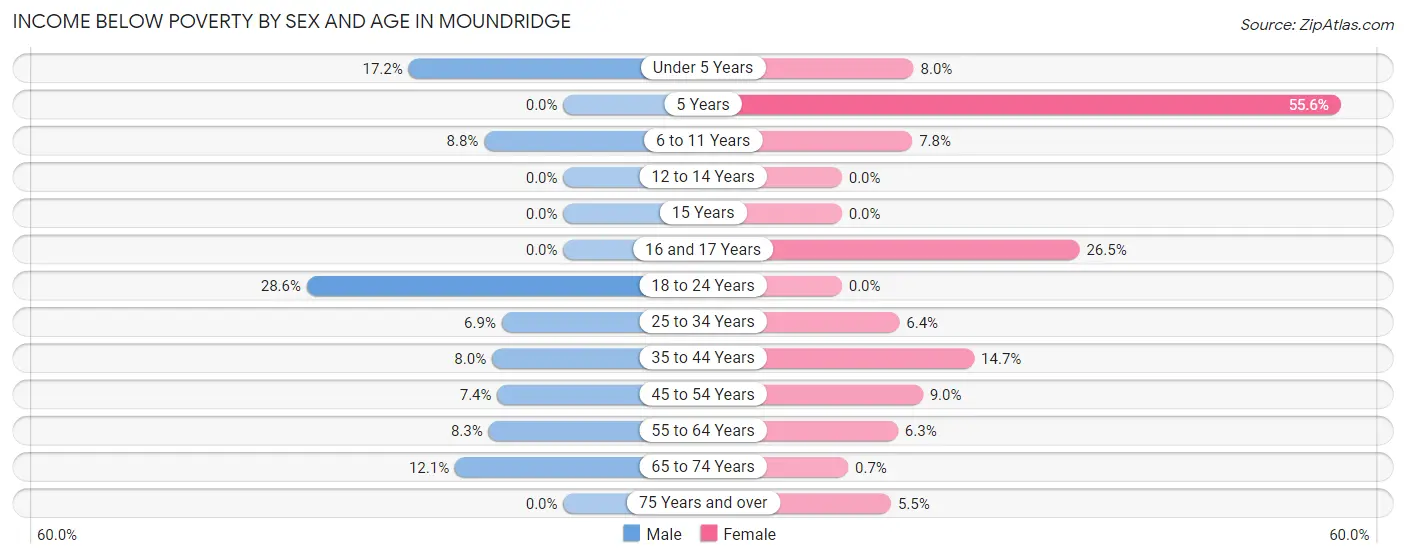
| Age Bracket | Male | Female |
| Under 5 Years | 10 (17.2%) | 4 (8.0%) |
| 5 Years | 0 (0.0%) | 5 (55.6%) |
| 6 to 11 Years | 6 (8.8%) | 4 (7.8%) |
| 12 to 14 Years | 0 (0.0%) | 0 (0.0%) |
| 15 Years | 0 (0.0%) | 0 (0.0%) |
| 16 and 17 Years | 0 (0.0%) | 9 (26.5%) |
| 18 to 24 Years | 12 (28.6%) | 0 (0.0%) |
| 25 to 34 Years | 7 (6.9%) | 5 (6.4%) |
| 35 to 44 Years | 7 (8.0%) | 14 (14.7%) |
| 45 to 54 Years | 5 (7.3%) | 10 (9.0%) |
| 55 to 64 Years | 6 (8.3%) | 7 (6.2%) |
| 65 to 74 Years | 7 (12.1%) | 1 (0.7%) |
| 75 Years and over | 0 (0.0%) | 8 (5.5%) |
| Total | 60 (8.2%) | 67 (7.4%) |
Income Above Poverty by Sex and Age in Moundridge
According to the poverty statistics in Moundridge, males aged 5 years and females aged 12 to 14 years are the age groups that are most secure financially, with 100.0% of males and 100.0% of females in these age groups living above the poverty line.
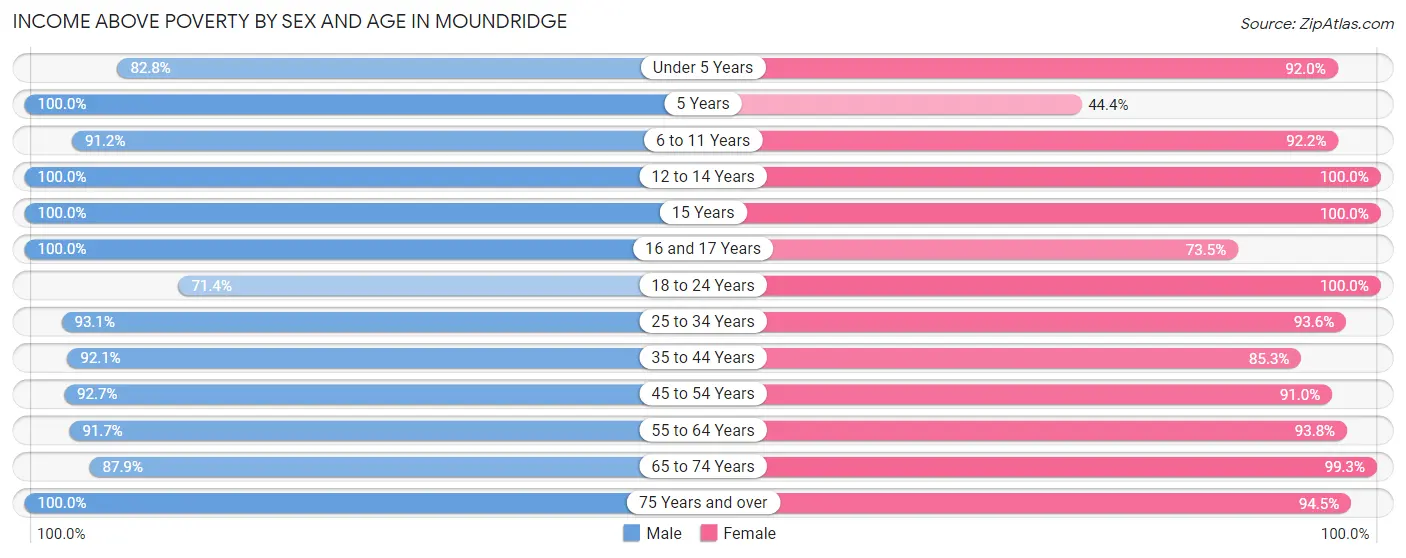
| Age Bracket | Male | Female |
| Under 5 Years | 48 (82.8%) | 46 (92.0%) |
| 5 Years | 4 (100.0%) | 4 (44.4%) |
| 6 to 11 Years | 62 (91.2%) | 47 (92.2%) |
| 12 to 14 Years | 45 (100.0%) | 24 (100.0%) |
| 15 Years | 11 (100.0%) | 6 (100.0%) |
| 16 and 17 Years | 9 (100.0%) | 25 (73.5%) |
| 18 to 24 Years | 30 (71.4%) | 50 (100.0%) |
| 25 to 34 Years | 95 (93.1%) | 73 (93.6%) |
| 35 to 44 Years | 81 (92.0%) | 81 (85.3%) |
| 45 to 54 Years | 63 (92.6%) | 101 (91.0%) |
| 55 to 64 Years | 66 (91.7%) | 105 (93.8%) |
| 65 to 74 Years | 51 (87.9%) | 142 (99.3%) |
| 75 Years and over | 111 (100.0%) | 138 (94.5%) |
| Total | 676 (91.8%) | 842 (92.6%) |
Income Below Poverty Among Married-Couple Families in Moundridge
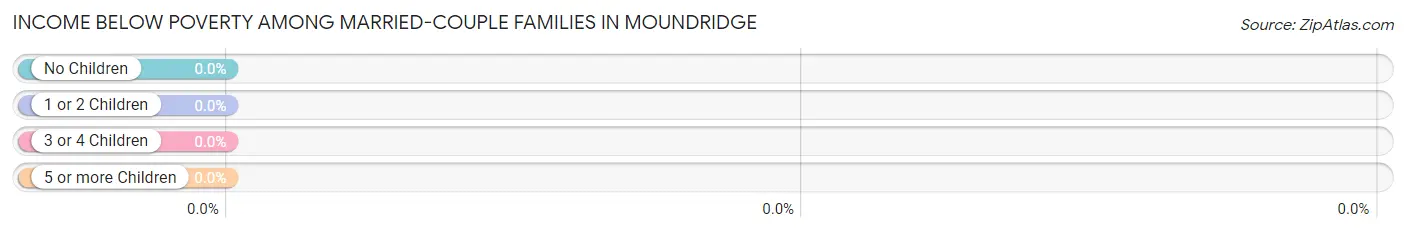
| Children | Above Poverty | Below Poverty |
| No Children | 223 (100.0%) | 0 (0.0%) |
| 1 or 2 Children | 100 (100.0%) | 0 (0.0%) |
| 3 or 4 Children | 23 (100.0%) | 0 (0.0%) |
| 5 or more Children | 13 (100.0%) | 0 (0.0%) |
| Total | 359 (100.0%) | 0 (0.0%) |
Income Below Poverty Among Single-Parent Households in Moundridge
According to the poverty data in Moundridge, 26.1% or 6 single-father households and 8.9% or 7 single-mother households are living below the poverty line. Among single-father households, those with 1 or 2 children have the highest poverty rate, with 6 households (42.9%) experiencing poverty. Likewise, among single-mother households, those with 5 or more children have the highest poverty rate, with 7 households (100.0%) falling below the poverty line.
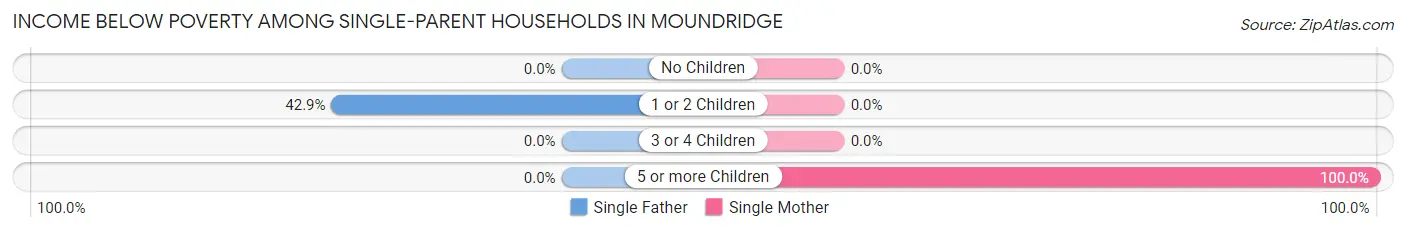
| Children | Single Father | Single Mother |
| No Children | 0 (0.0%) | 0 (0.0%) |
| 1 or 2 Children | 6 (42.9%) | 0 (0.0%) |
| 3 or 4 Children | 0 (0.0%) | 0 (0.0%) |
| 5 or more Children | 0 (0.0%) | 7 (100.0%) |
| Total | 6 (26.1%) | 7 (8.9%) |
Income Below Poverty Among Married-Couple vs Single-Parent Households in Moundridge
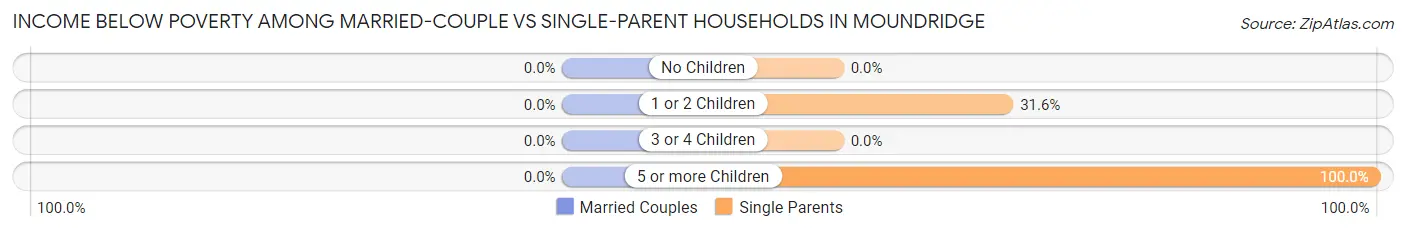
| Children | Married-Couple Families | Single-Parent Households |
| No Children | 0 (0.0%) | 0 (0.0%) |
| 1 or 2 Children | 0 (0.0%) | 6 (31.6%) |
| 3 or 4 Children | 0 (0.0%) | 0 (0.0%) |
| 5 or more Children | 0 (0.0%) | 7 (100.0%) |
| Total | 0 (0.0%) | 13 (12.8%) |
Race in Moundridge
The most populous races in Moundridge are White / Caucasian (1,742 | 94.0%), Hispanic or Latino (100 | 5.4%), and Two or more Races (98 | 5.3%).
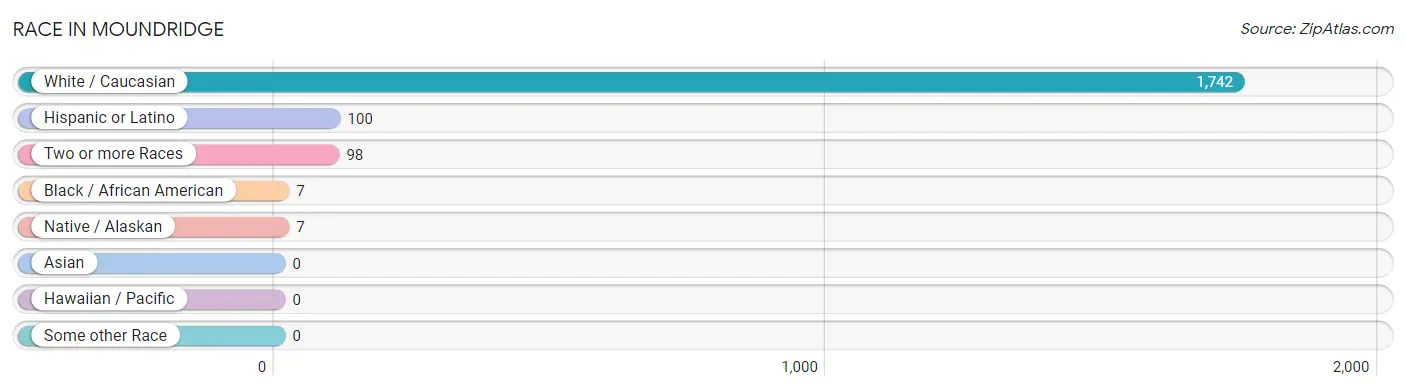
| Race | # Population | % Population |
| Asian | 0 | 0.0% |
| Black / African American | 7 | 0.4% |
| Hawaiian / Pacific | 0 | 0.0% |
| Hispanic or Latino | 100 | 5.4% |
| Native / Alaskan | 7 | 0.4% |
| White / Caucasian | 1,742 | 94.0% |
| Two or more Races | 98 | 5.3% |
| Some other Race | 0 | 0.0% |
| Total | 1,854 | 100.0% |
Ancestry in Moundridge
The most populous ancestries reported in Moundridge are German (681 | 36.7%), American (172 | 9.3%), English (158 | 8.5%), Irish (85 | 4.6%), and Dutch (75 | 4.1%), together accounting for 63.2% of all Moundridge residents.
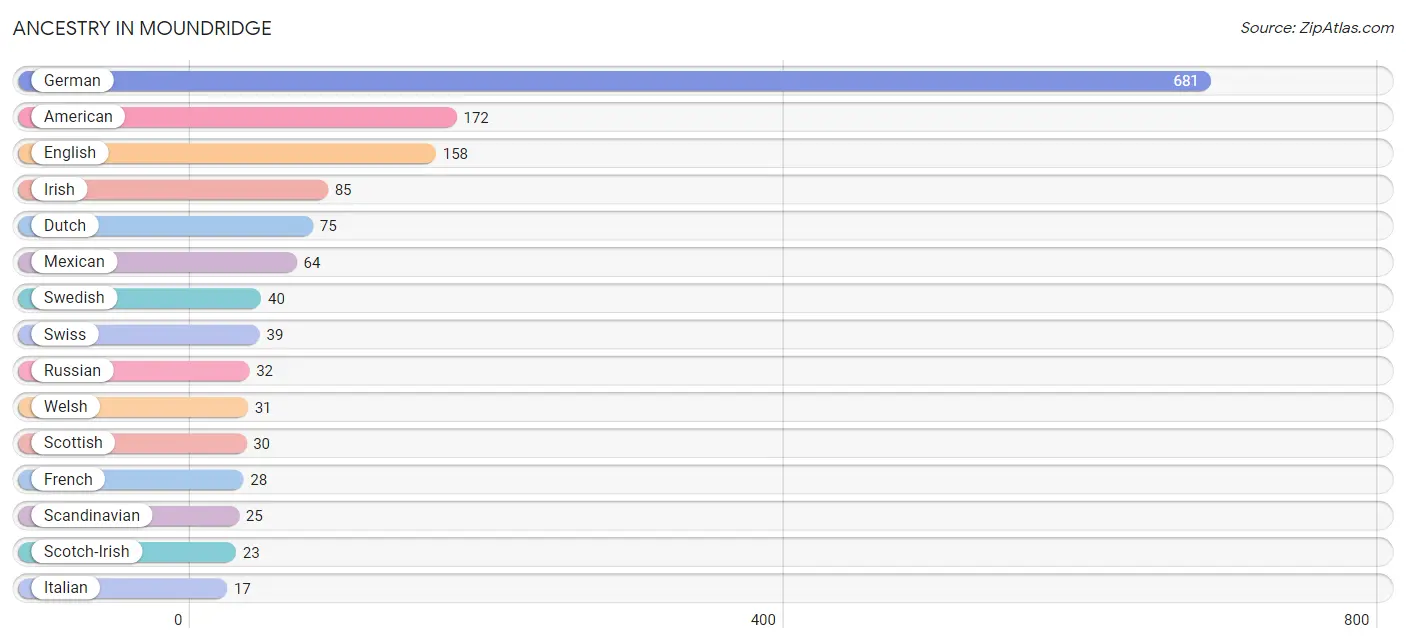
| Ancestry | # Population | % Population |
| African | 7 | 0.4% |
| American | 172 | 9.3% |
| Austrian | 4 | 0.2% |
| Bolivian | 5 | 0.3% |
| British | 9 | 0.5% |
| Burmese | 3 | 0.2% |
| Central American | 15 | 0.8% |
| Central American Indian | 6 | 0.3% |
| Choctaw | 16 | 0.9% |
| Czech | 10 | 0.5% |
| Czechoslovakian | 7 | 0.4% |
| Dutch | 75 | 4.1% |
| English | 158 | 8.5% |
| European | 9 | 0.5% |
| Finnish | 9 | 0.5% |
| French | 28 | 1.5% |
| German | 681 | 36.7% |
| Guatemalan | 15 | 0.8% |
| Irish | 85 | 4.6% |
| Italian | 17 | 0.9% |
| Mexican | 64 | 3.5% |
| Norwegian | 2 | 0.1% |
| Pennsylvania German | 10 | 0.5% |
| Peruvian | 8 | 0.4% |
| Polish | 9 | 0.5% |
| Puerto Rican | 8 | 0.4% |
| Russian | 32 | 1.7% |
| Scandinavian | 25 | 1.3% |
| Scotch-Irish | 23 | 1.2% |
| Scottish | 30 | 1.6% |
| South American | 13 | 0.7% |
| Subsaharan African | 7 | 0.4% |
| Swedish | 40 | 2.2% |
| Swiss | 39 | 2.1% |
| Ukrainian | 7 | 0.4% |
| Welsh | 31 | 1.7% | View All 36 Rows |
Immigrants in Moundridge
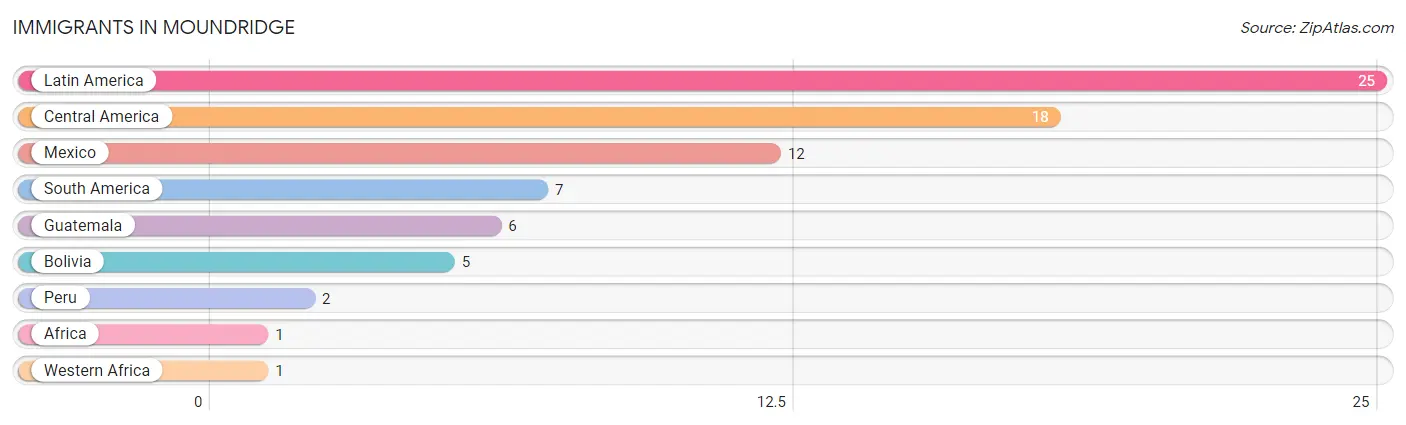
The most numerous immigrant groups reported in Moundridge came from Latin America (25 | 1.3%), Central America (18 | 1.0%), Mexico (12 | 0.6%), South America (7 | 0.4%), and Guatemala (6 | 0.3%), together accounting for 3.7% of all Moundridge residents.
| Immigration Origin | # Population | % Population |
| Africa | 1 | 0.1% |
| Bolivia | 5 | 0.3% |
| Central America | 18 | 1.0% |
| Guatemala | 6 | 0.3% |
| Latin America | 25 | 1.3% |
| Mexico | 12 | 0.6% |
| Peru | 2 | 0.1% |
| South America | 7 | 0.4% |
| Western Africa | 1 | 0.1% | View All 9 Rows |
Sex and Age in Moundridge
Sex and Age in Moundridge
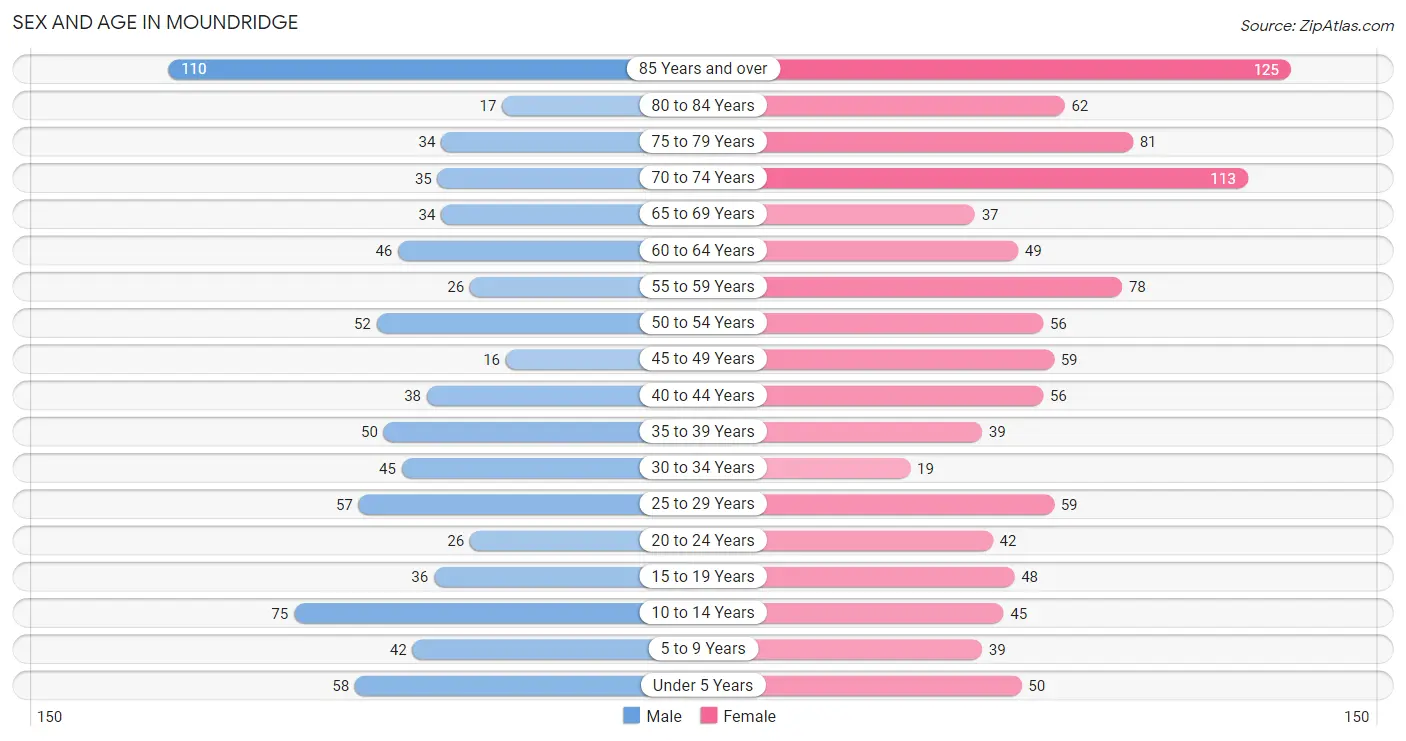
The most populous age groups in Moundridge are 85 Years and over (110 | 13.8%) for men and 85 Years and over (125 | 11.8%) for women.
| Age Bracket | Male | Female |
| Under 5 Years | 58 (7.3%) | 50 (4.7%) |
| 5 to 9 Years | 42 (5.3%) | 39 (3.7%) |
| 10 to 14 Years | 75 (9.4%) | 45 (4.3%) |
| 15 to 19 Years | 36 (4.5%) | 48 (4.5%) |
| 20 to 24 Years | 26 (3.3%) | 42 (4.0%) |
| 25 to 29 Years | 57 (7.1%) | 59 (5.6%) |
| 30 to 34 Years | 45 (5.7%) | 19 (1.8%) |
| 35 to 39 Years | 50 (6.3%) | 39 (3.7%) |
| 40 to 44 Years | 38 (4.8%) | 56 (5.3%) |
| 45 to 49 Years | 16 (2.0%) | 59 (5.6%) |
| 50 to 54 Years | 52 (6.5%) | 56 (5.3%) |
| 55 to 59 Years | 26 (3.3%) | 78 (7.4%) |
| 60 to 64 Years | 46 (5.8%) | 49 (4.6%) |
| 65 to 69 Years | 34 (4.3%) | 37 (3.5%) |
| 70 to 74 Years | 35 (4.4%) | 113 (10.7%) |
| 75 to 79 Years | 34 (4.3%) | 81 (7.7%) |
| 80 to 84 Years | 17 (2.1%) | 62 (5.9%) |
| 85 Years and over | 110 (13.8%) | 125 (11.8%) |
| Total | 797 (100.0%) | 1,057 (100.0%) |
Families and Households in Moundridge
Median Family Size in Moundridge
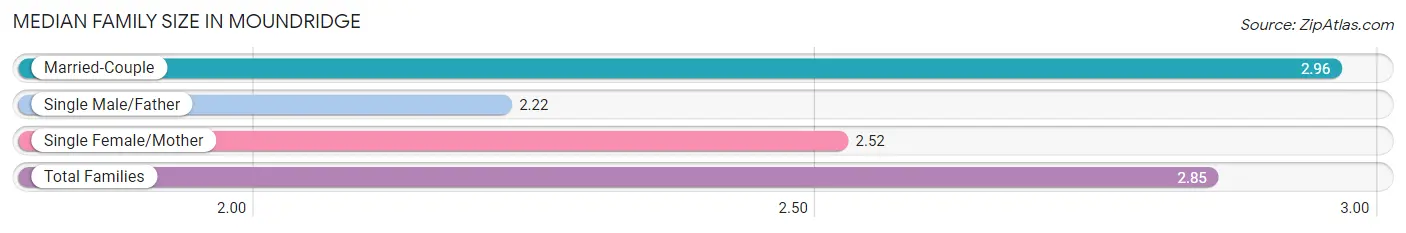
The median family size in Moundridge is 2.85 persons per family, with married-couple families (359 | 77.9%) accounting for the largest median family size of 2.96 persons per family. On the other hand, single male/father families (23 | 5.0%) represent the smallest median family size with 2.22 persons per family.
| Family Type | # Families | Family Size |
| Married-Couple | 359 (77.9%) | 2.96 |
| Single Male/Father | 23 (5.0%) | 2.22 |
| Single Female/Mother | 79 (17.1%) | 2.52 |
| Total Families | 461 (100.0%) | 2.85 |
Median Household Size in Moundridge
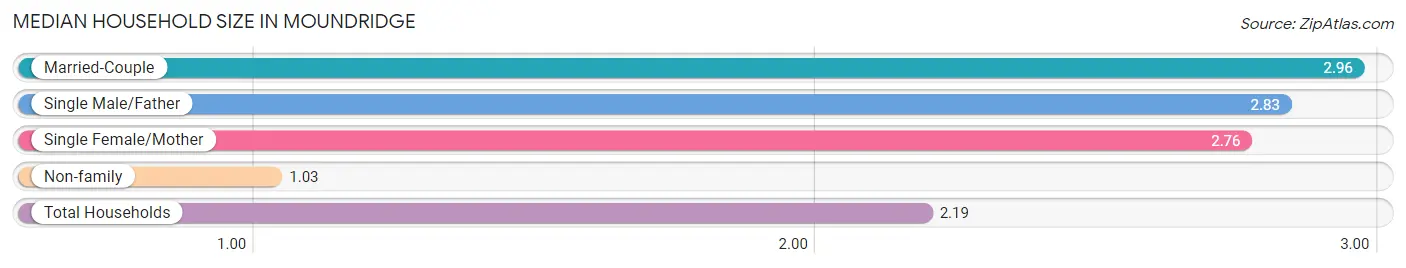
The median household size in Moundridge is 2.19 persons per household, with married-couple households (359 | 47.9%) accounting for the largest median household size of 2.96 persons per household. non-family households (289 | 38.5%) represent the smallest median household size with 1.03 persons per household.
| Household Type | # Households | Household Size |
| Married-Couple | 359 (47.9%) | 2.96 |
| Single Male/Father | 23 (3.1%) | 2.83 |
| Single Female/Mother | 79 (10.5%) | 2.76 |
| Non-family | 289 (38.5%) | 1.03 |
| Total Households | 750 (100.0%) | 2.19 |
Household Size by Marriage Status in Moundridge
Out of a total of 750 households in Moundridge, 461 (61.5%) are family households, while 289 (38.5%) are nonfamily households. The most numerous type of family households are 2-person households, comprising 260, and the most common type of nonfamily households are 1-person households, comprising 277.
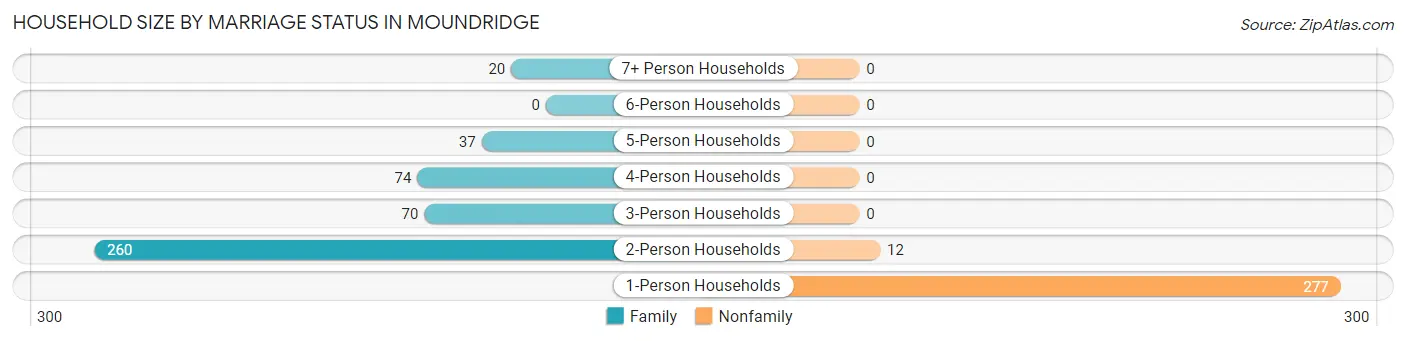
| Household Size | Family Households | Nonfamily Households |
| 1-Person Households | - | 277 (36.9%) |
| 2-Person Households | 260 (34.7%) | 12 (1.6%) |
| 3-Person Households | 70 (9.3%) | 0 (0.0%) |
| 4-Person Households | 74 (9.9%) | 0 (0.0%) |
| 5-Person Households | 37 (4.9%) | 0 (0.0%) |
| 6-Person Households | 0 (0.0%) | 0 (0.0%) |
| 7+ Person Households | 20 (2.7%) | 0 (0.0%) |
| Total | 461 (61.5%) | 289 (38.5%) |
Female Fertility in Moundridge
Fertility by Age in Moundridge
Average fertility rate in Moundridge is 83.0 births per 1,000 women. Women in the age bracket of 20 to 34 years have the highest fertility rate with 150.0 births per 1,000 women. Women in the age bracket of 20 to 34 years acount for 66.7% of all women with births.
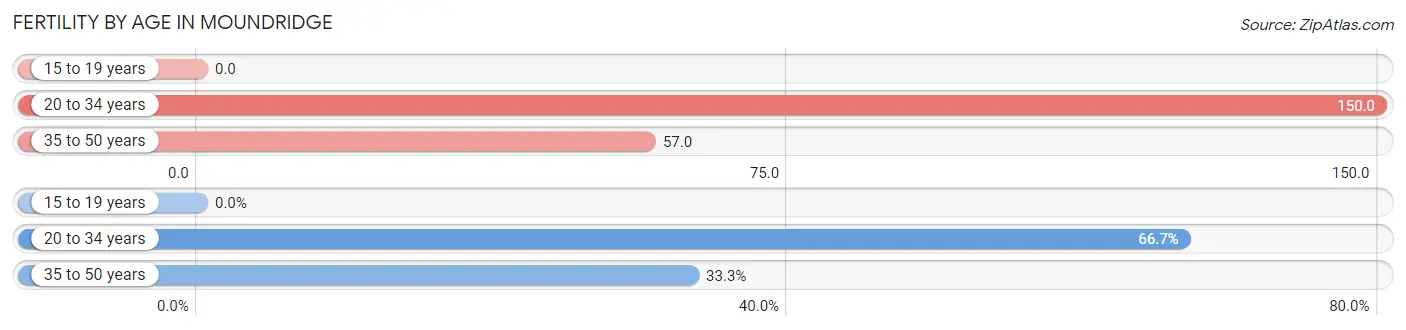
| Age Bracket | Women with Births | Births / 1,000 Women |
| 15 to 19 years | 0 (0.0%) | 0.0 |
| 20 to 34 years | 18 (66.7%) | 150.0 |
| 35 to 50 years | 9 (33.3%) | 57.0 |
| Total | 27 (100.0%) | 83.0 |
Fertility by Age by Marriage Status in Moundridge
59.3% of women with births (27) in Moundridge are married. The highest percentage of unmarried women with births falls into 35 to 50 years age bracket with 77.8% of them unmarried at the time of birth, while the lowest percentage of unmarried women with births belong to 20 to 34 years age bracket with 22.2% of them unmarried.
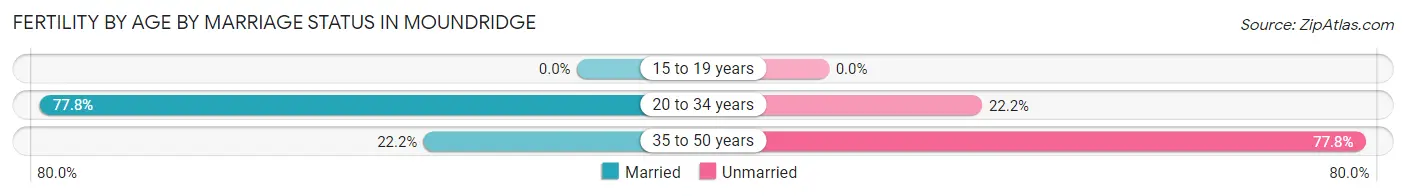
| Age Bracket | Married | Unmarried |
| 15 to 19 years | 0 (0.0%) | 0 (0.0%) |
| 20 to 34 years | 14 (77.8%) | 4 (22.2%) |
| 35 to 50 years | 2 (22.2%) | 7 (77.8%) |
| Total | 16 (59.3%) | 11 (40.7%) |
Fertility by Education in Moundridge
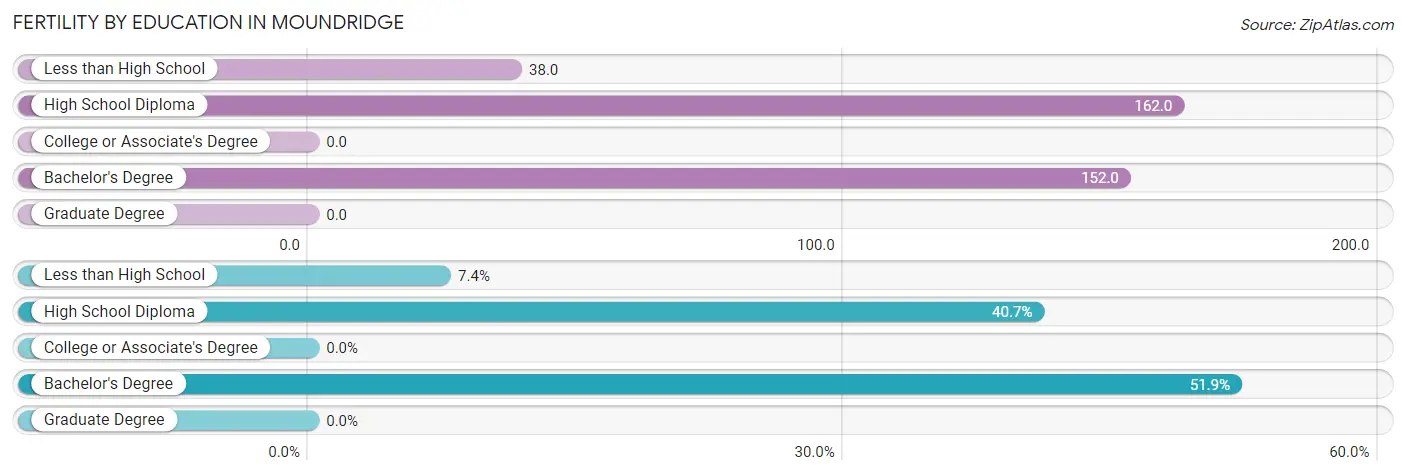
| Educational Attainment | Women with Births | Births / 1,000 Women |
| Less than High School | 2 (7.4%) | 38.0 |
| High School Diploma | 11 (40.7%) | 162.0 |
| College or Associate's Degree | 0 (0.0%) | 0.0 |
| Bachelor's Degree | 14 (51.8%) | 152.0 |
| Graduate Degree | 0 (0.0%) | 0.0 |
| Total | 27 (100.0%) | 83.0 |
Fertility by Education by Marriage Status in Moundridge
40.7% of women with births in Moundridge are unmarried. Women with the educational attainment of less than high school are most likely to be married with 100.0% of them married at childbirth, while women with the educational attainment of high school diploma are least likely to be married with 100.0% of them unmarried at childbirth.
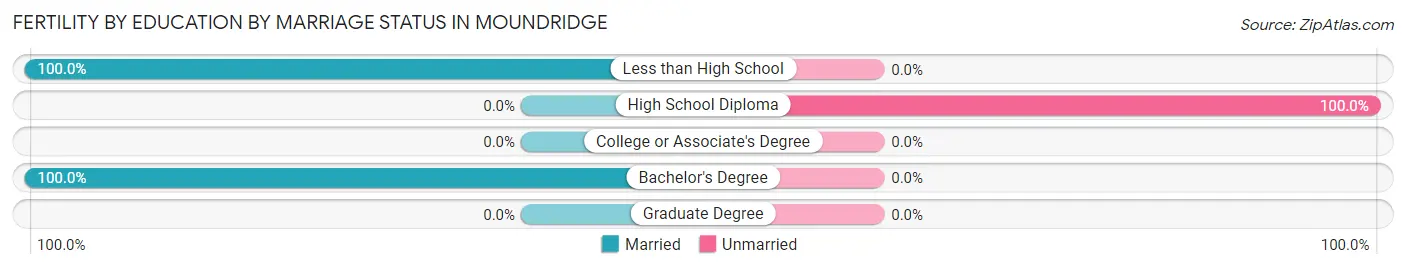
| Educational Attainment | Married | Unmarried |
| Less than High School | 2 (100.0%) | 0 (0.0%) |
| High School Diploma | 0 (0.0%) | 11 (100.0%) |
| College or Associate's Degree | 0 (0.0%) | 0 (0.0%) |
| Bachelor's Degree | 14 (100.0%) | 0 (0.0%) |
| Graduate Degree | 0 (0.0%) | 0 (0.0%) |
| Total | 16 (59.3%) | 11 (40.7%) |
Employment Characteristics in Moundridge
Employment by Class of Employer in Moundridge
Among the 722 employed individuals in Moundridge, private company employees (442 | 61.2%), not-for-profit organizations (143 | 19.8%), and local government employees (96 | 13.3%) make up the most common classes of employment.
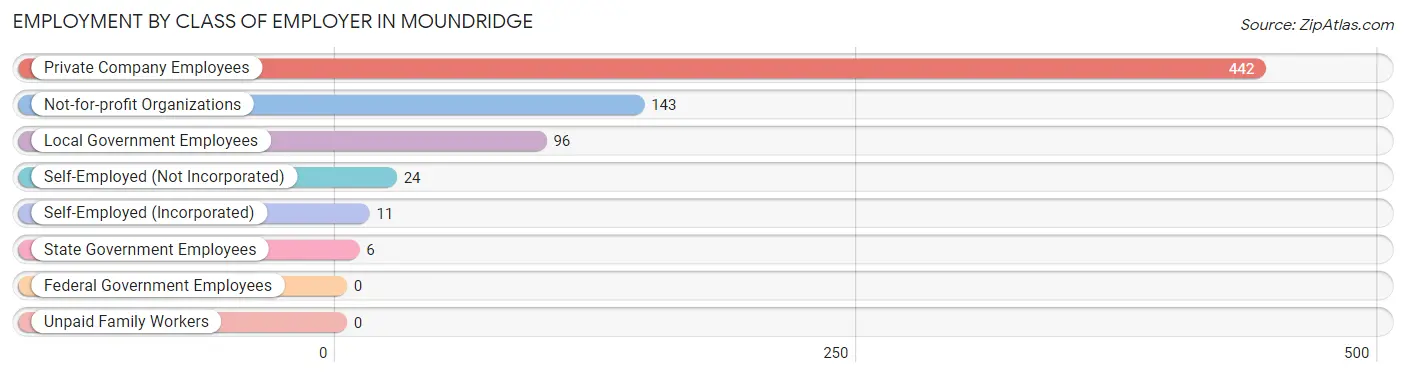
| Employer Class | # Employees | % Employees |
| Private Company Employees | 442 | 61.2% |
| Self-Employed (Incorporated) | 11 | 1.5% |
| Self-Employed (Not Incorporated) | 24 | 3.3% |
| Not-for-profit Organizations | 143 | 19.8% |
| Local Government Employees | 96 | 13.3% |
| State Government Employees | 6 | 0.8% |
| Federal Government Employees | 0 | 0.0% |
| Unpaid Family Workers | 0 | 0.0% |
| Total | 722 | 100.0% |
Employment Status by Age in Moundridge
According to the labor force statistics for Moundridge, out of the total population over 16 years of age (1,528), 50.5% or 772 individuals are in the labor force, with 2.2% or 17 of them unemployed. The age group with the highest labor force participation rate is 20 to 24 years, with 100.0% or 68 individuals in the labor force. Within the labor force, the 35 to 44 years age range has the highest percentage of unemployed individuals, with 10.8% or 17 of them being unemployed.
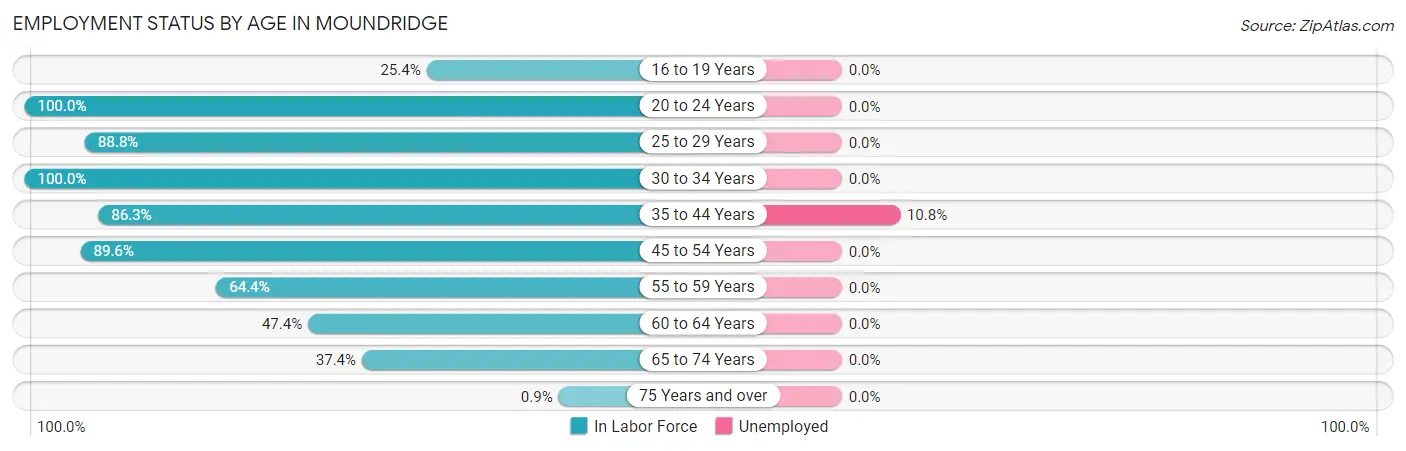
| Age Bracket | In Labor Force | Unemployed |
| 16 to 19 Years | 17 (25.4%) | 0 (0.0%) |
| 20 to 24 Years | 68 (100.0%) | 0 (0.0%) |
| 25 to 29 Years | 103 (88.8%) | 0 (0.0%) |
| 30 to 34 Years | 64 (100.0%) | 0 (0.0%) |
| 35 to 44 Years | 158 (86.3%) | 17 (10.8%) |
| 45 to 54 Years | 164 (89.6%) | 0 (0.0%) |
| 55 to 59 Years | 67 (64.4%) | 0 (0.0%) |
| 60 to 64 Years | 45 (47.4%) | 0 (0.0%) |
| 65 to 74 Years | 82 (37.4%) | 0 (0.0%) |
| 75 Years and over | 4 (0.9%) | 0 (0.0%) |
| Total | 772 (50.5%) | 17 (2.2%) |
Employment Status by Educational Attainment in Moundridge
According to labor force statistics for Moundridge, 80.7% of individuals (601) out of the total population between 25 and 64 years of age (745) are in the labor force, with 2.8% or 17 of them being unemployed. The group with the highest labor force participation rate are those with the educational attainment of bachelor's degree or higher, with 90.1% or 228 individuals in the labor force. Within the labor force, individuals with less than high school education have the highest percentage of unemployment, with 15.9% or 7 of them being unemployed.
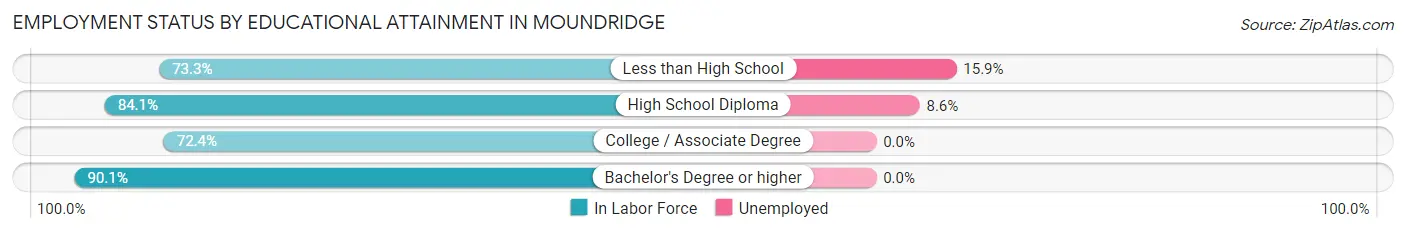
| Educational Attainment | In Labor Force | Unemployed |
| Less than High School | 44 (73.3%) | 10 (15.9%) |
| High School Diploma | 116 (84.1%) | 12 (8.6%) |
| College / Associate Degree | 213 (72.4%) | 0 (0.0%) |
| Bachelor's Degree or higher | 228 (90.1%) | 0 (0.0%) |
| Total | 601 (80.7%) | 21 (2.8%) |
Employment Occupations by Sex in Moundridge
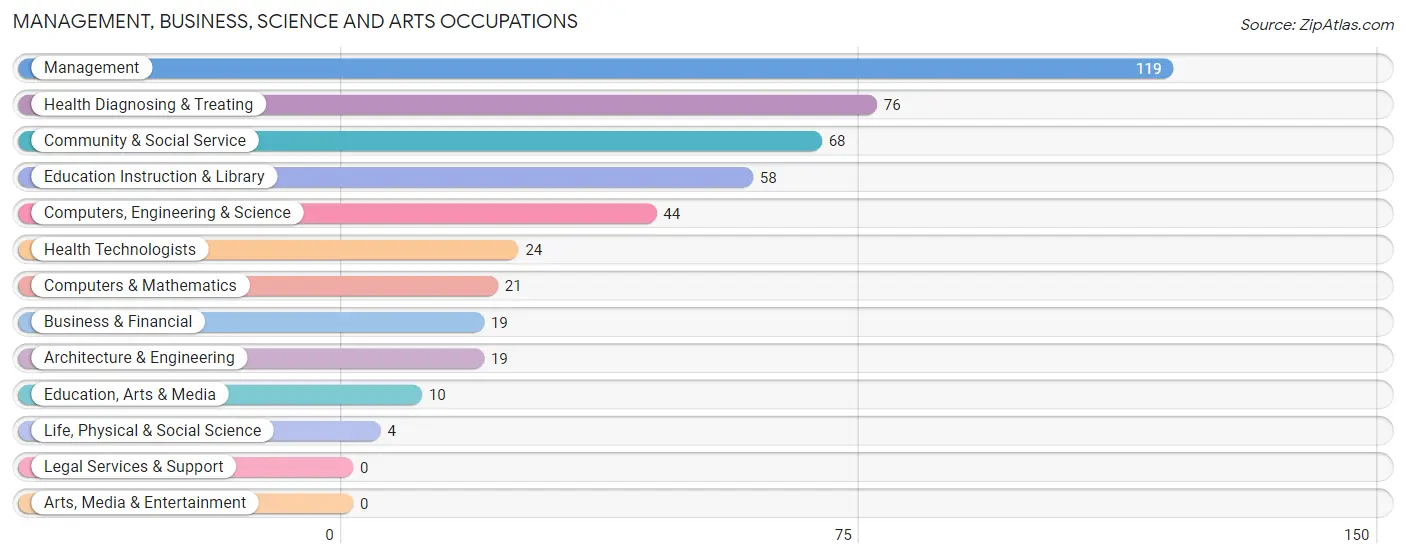
Management, Business, Science and Arts Occupations
The most common Management, Business, Science and Arts occupations in Moundridge are Management (119 | 15.8%), Health Diagnosing & Treating (76 | 10.1%), Community & Social Service (68 | 9.0%), Education Instruction & Library (58 | 7.7%), and Computers, Engineering & Science (44 | 5.8%).
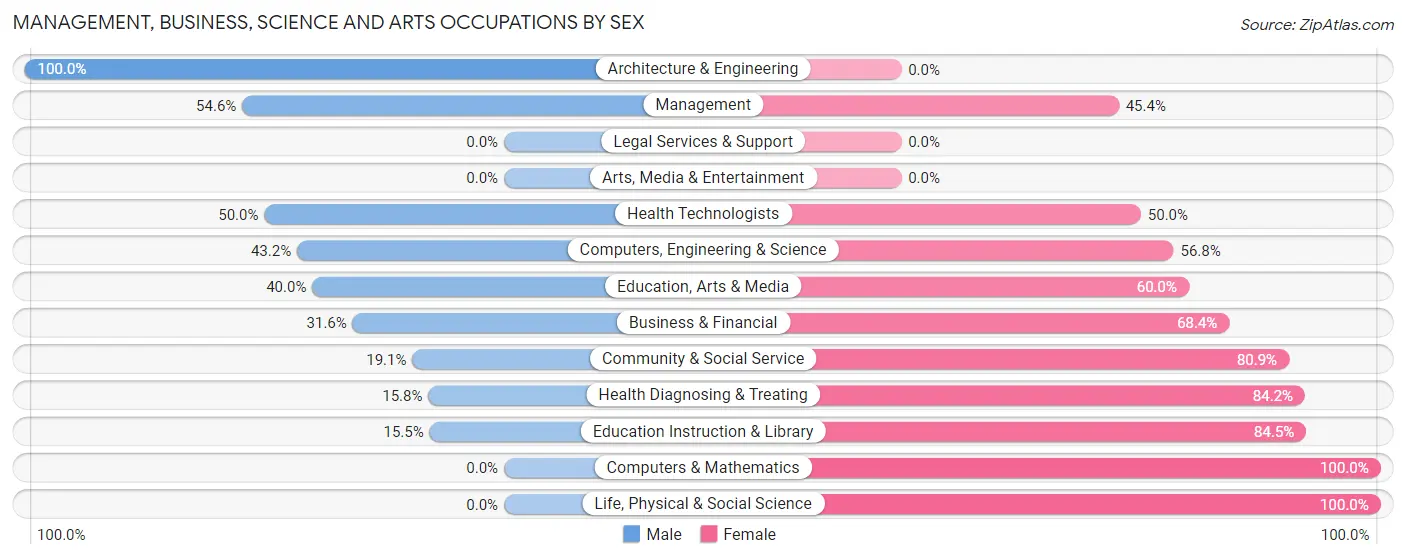
Management, Business, Science and Arts Occupations by Sex
Within the Management, Business, Science and Arts occupations in Moundridge, the most male-oriented occupations are Architecture & Engineering (100.0%), Management (54.6%), and Health Technologists (50.0%), while the most female-oriented occupations are Computers & Mathematics (100.0%), Life, Physical & Social Science (100.0%), and Education Instruction & Library (84.5%).
| Occupation | Male | Female |
| Management | 65 (54.6%) | 54 (45.4%) |
| Business & Financial | 6 (31.6%) | 13 (68.4%) |
| Computers, Engineering & Science | 19 (43.2%) | 25 (56.8%) |
| Computers & Mathematics | 0 (0.0%) | 21 (100.0%) |
| Architecture & Engineering | 19 (100.0%) | 0 (0.0%) |
| Life, Physical & Social Science | 0 (0.0%) | 4 (100.0%) |
| Community & Social Service | 13 (19.1%) | 55 (80.9%) |
| Education, Arts & Media | 4 (40.0%) | 6 (60.0%) |
| Legal Services & Support | 0 (0.0%) | 0 (0.0%) |
| Education Instruction & Library | 9 (15.5%) | 49 (84.5%) |
| Arts, Media & Entertainment | 0 (0.0%) | 0 (0.0%) |
| Health Diagnosing & Treating | 12 (15.8%) | 64 (84.2%) |
| Health Technologists | 12 (50.0%) | 12 (50.0%) |
| Total (Category) | 115 (35.3%) | 211 (64.7%) |
| Total (Overall) | 365 (48.3%) | 390 (51.7%) |
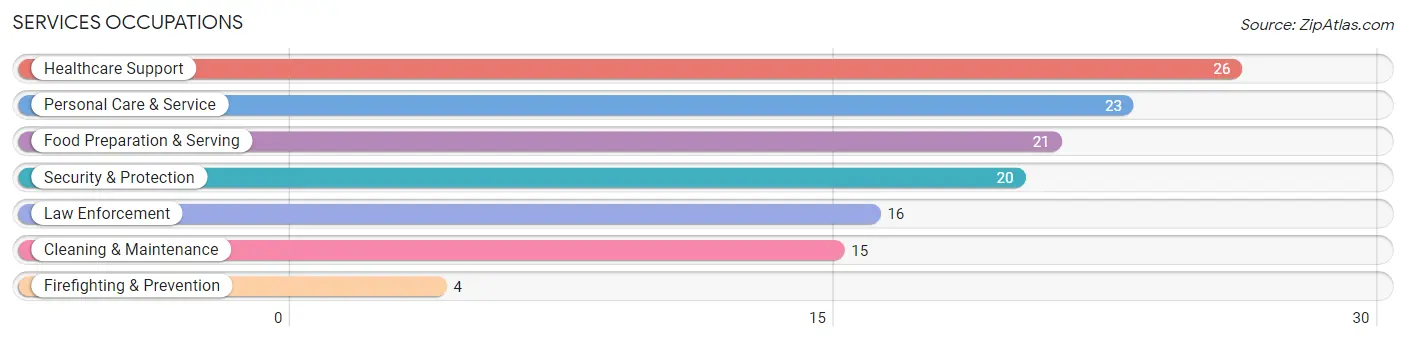
Services Occupations
The most common Services occupations in Moundridge are Healthcare Support (26 | 3.4%), Personal Care & Service (23 | 3.0%), Food Preparation & Serving (21 | 2.8%), Security & Protection (20 | 2.6%), and Law Enforcement (16 | 2.1%).
Services Occupations by Sex
Within the Services occupations in Moundridge, the most male-oriented occupations are Security & Protection (100.0%), Firefighting & Prevention (100.0%), and Law Enforcement (100.0%), while the most female-oriented occupations are Healthcare Support (100.0%), Personal Care & Service (73.9%), and Cleaning & Maintenance (73.3%).

| Occupation | Male | Female |
| Healthcare Support | 0 (0.0%) | 26 (100.0%) |
| Security & Protection | 20 (100.0%) | 0 (0.0%) |
| Firefighting & Prevention | 4 (100.0%) | 0 (0.0%) |
| Law Enforcement | 16 (100.0%) | 0 (0.0%) |
| Food Preparation & Serving | 10 (47.6%) | 11 (52.4%) |
| Cleaning & Maintenance | 4 (26.7%) | 11 (73.3%) |
| Personal Care & Service | 6 (26.1%) | 17 (73.9%) |
| Total (Category) | 40 (38.1%) | 65 (61.9%) |
| Total (Overall) | 365 (48.3%) | 390 (51.7%) |
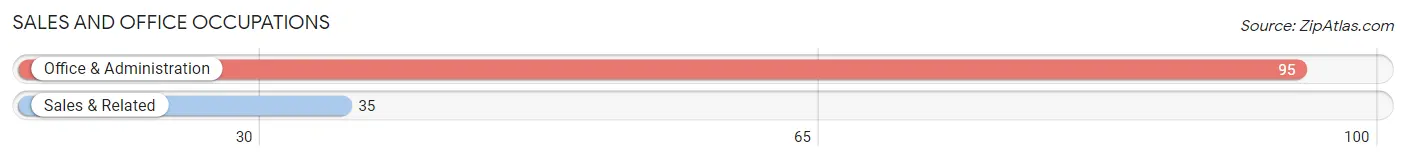
Sales and Office Occupations
The most common Sales and Office occupations in Moundridge are Office & Administration (95 | 12.6%), and Sales & Related (35 | 4.6%).
Sales and Office Occupations by Sex
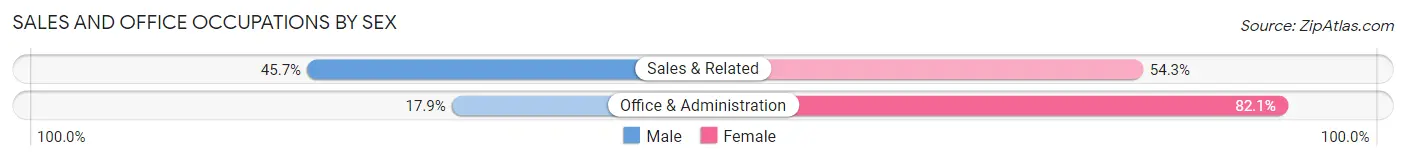
| Occupation | Male | Female |
| Sales & Related | 16 (45.7%) | 19 (54.3%) |
| Office & Administration | 17 (17.9%) | 78 (82.1%) |
| Total (Category) | 33 (25.4%) | 97 (74.6%) |
| Total (Overall) | 365 (48.3%) | 390 (51.7%) |
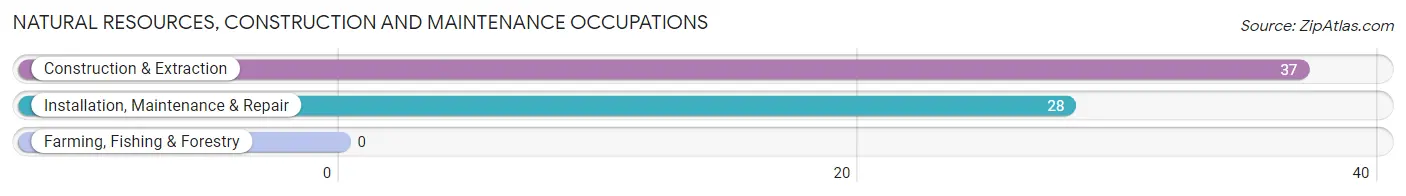
Natural Resources, Construction and Maintenance Occupations
The most common Natural Resources, Construction and Maintenance occupations in Moundridge are Construction & Extraction (37 | 4.9%), and Installation, Maintenance & Repair (28 | 3.7%).
Natural Resources, Construction and Maintenance Occupations by Sex
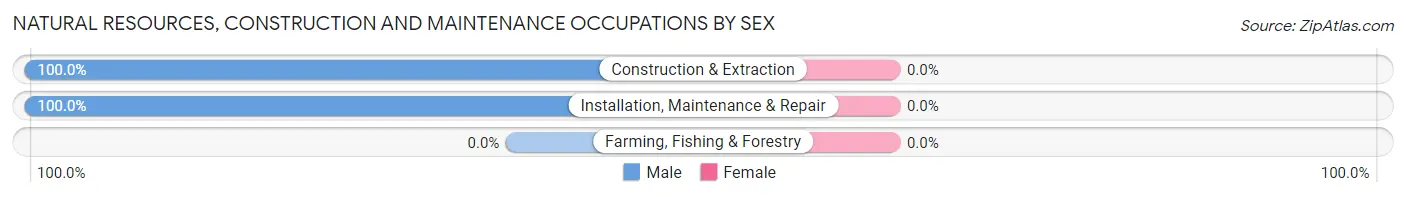
| Occupation | Male | Female |
| Farming, Fishing & Forestry | 0 (0.0%) | 0 (0.0%) |
| Construction & Extraction | 37 (100.0%) | 0 (0.0%) |
| Installation, Maintenance & Repair | 28 (100.0%) | 0 (0.0%) |
| Total (Category) | 65 (100.0%) | 0 (0.0%) |
| Total (Overall) | 365 (48.3%) | 390 (51.7%) |
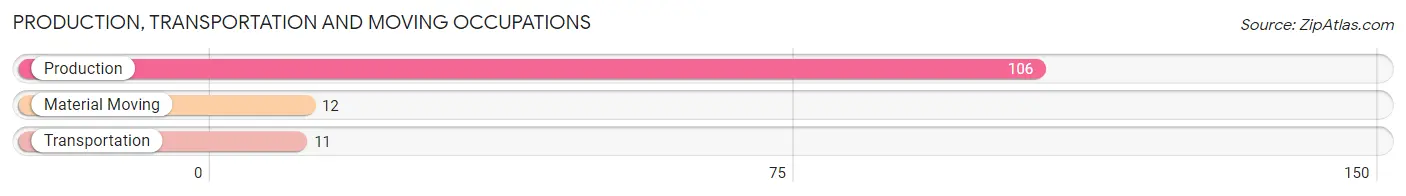
Production, Transportation and Moving Occupations
The most common Production, Transportation and Moving occupations in Moundridge are Production (106 | 14.0%), Material Moving (12 | 1.6%), and Transportation (11 | 1.5%).
Production, Transportation and Moving Occupations by Sex
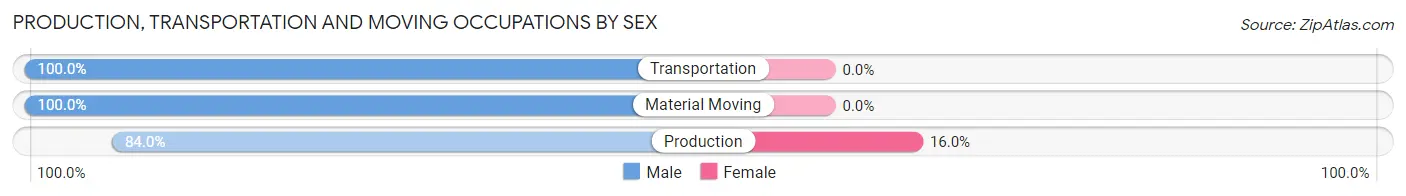
| Occupation | Male | Female |
| Production | 89 (84.0%) | 17 (16.0%) |
| Transportation | 11 (100.0%) | 0 (0.0%) |
| Material Moving | 12 (100.0%) | 0 (0.0%) |
| Total (Category) | 112 (86.8%) | 17 (13.2%) |
| Total (Overall) | 365 (48.3%) | 390 (51.7%) |
Employment Industries by Sex in Moundridge
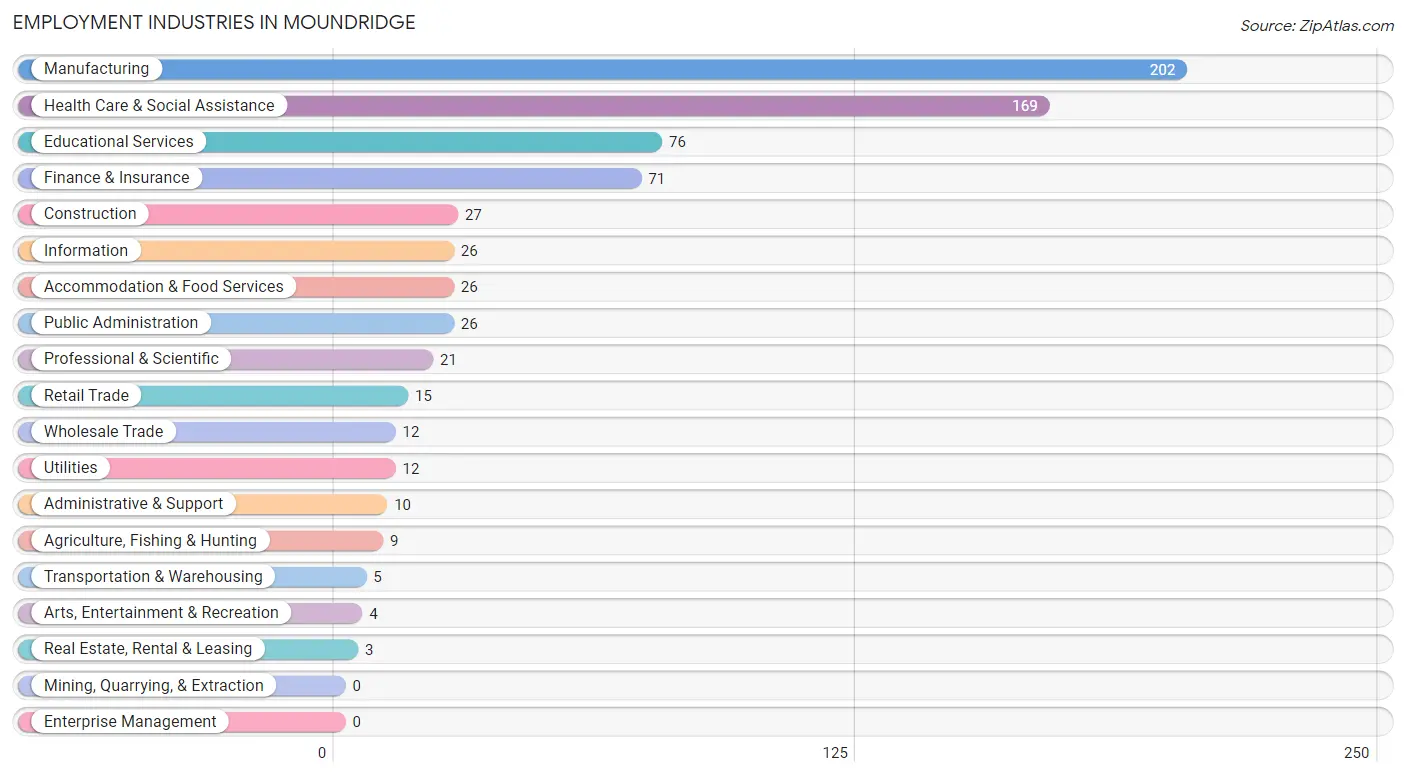
Employment Industries in Moundridge
The major employment industries in Moundridge include Manufacturing (202 | 26.8%), Health Care & Social Assistance (169 | 22.4%), Educational Services (76 | 10.1%), Finance & Insurance (71 | 9.4%), and Construction (27 | 3.6%).
Employment Industries by Sex in Moundridge
The Moundridge industries that see more men than women are Agriculture, Fishing & Hunting (100.0%), Utilities (100.0%), and Administrative & Support (100.0%), whereas the industries that tend to have a higher number of women are Transportation & Warehousing (100.0%), Real Estate, Rental & Leasing (100.0%), and Health Care & Social Assistance (90.5%).
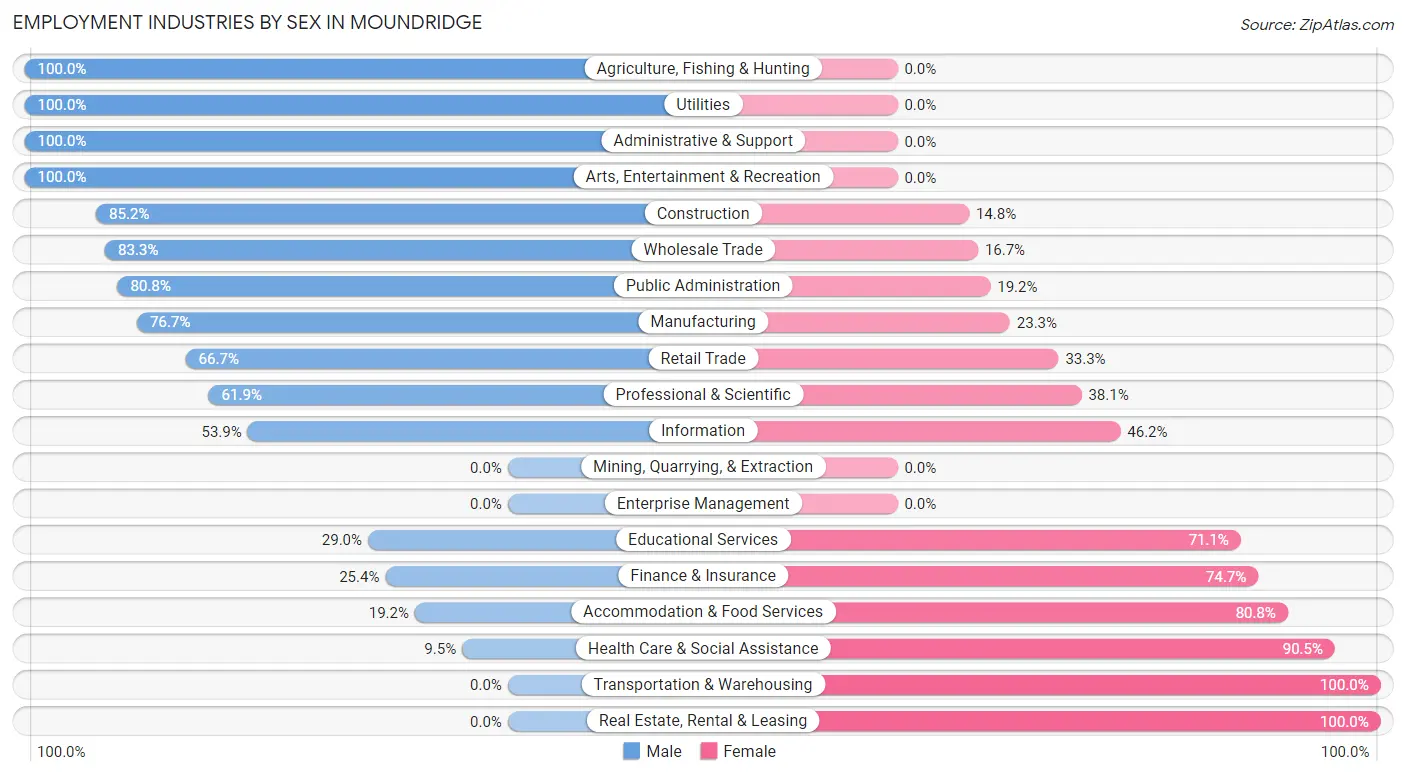
| Industry | Male | Female |
| Agriculture, Fishing & Hunting | 9 (100.0%) | 0 (0.0%) |
| Mining, Quarrying, & Extraction | 0 (0.0%) | 0 (0.0%) |
| Construction | 23 (85.2%) | 4 (14.8%) |
| Manufacturing | 155 (76.7%) | 47 (23.3%) |
| Wholesale Trade | 10 (83.3%) | 2 (16.7%) |
| Retail Trade | 10 (66.7%) | 5 (33.3%) |
| Transportation & Warehousing | 0 (0.0%) | 5 (100.0%) |
| Utilities | 12 (100.0%) | 0 (0.0%) |
| Information | 14 (53.8%) | 12 (46.2%) |
| Finance & Insurance | 18 (25.4%) | 53 (74.7%) |
| Real Estate, Rental & Leasing | 0 (0.0%) | 3 (100.0%) |
| Professional & Scientific | 13 (61.9%) | 8 (38.1%) |
| Enterprise Management | 0 (0.0%) | 0 (0.0%) |
| Administrative & Support | 10 (100.0%) | 0 (0.0%) |
| Educational Services | 22 (28.9%) | 54 (71.1%) |
| Health Care & Social Assistance | 16 (9.5%) | 153 (90.5%) |
| Arts, Entertainment & Recreation | 4 (100.0%) | 0 (0.0%) |
| Accommodation & Food Services | 5 (19.2%) | 21 (80.8%) |
| Public Administration | 21 (80.8%) | 5 (19.2%) |
| Total | 365 (48.3%) | 390 (51.7%) |
Education in Moundridge
School Enrollment in Moundridge
The most common levels of schooling among the 342 students in Moundridge are middle school (96 | 28.1%), high school (80 | 23.4%), and elementary school (62 | 18.1%).
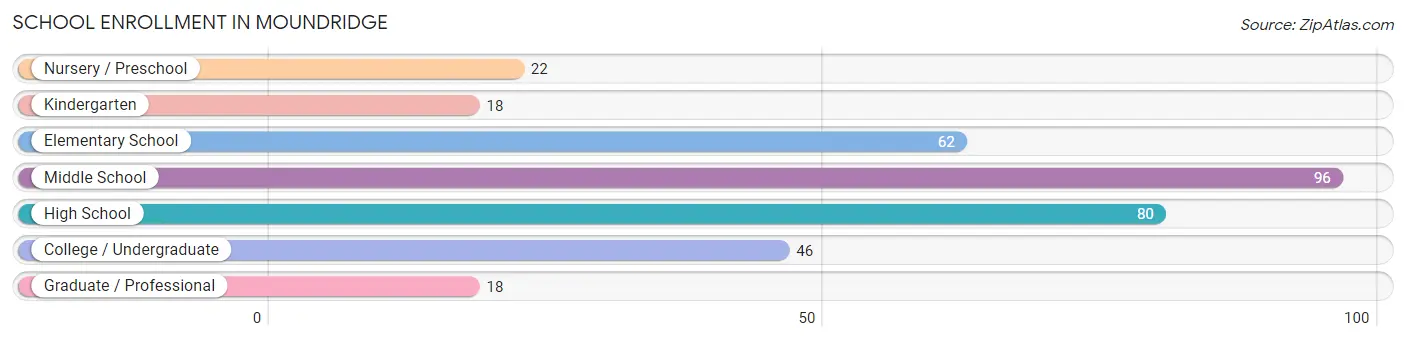
| School Level | # Students | % Students |
| Nursery / Preschool | 22 | 6.4% |
| Kindergarten | 18 | 5.3% |
| Elementary School | 62 | 18.1% |
| Middle School | 96 | 28.1% |
| High School | 80 | 23.4% |
| College / Undergraduate | 46 | 13.5% |
| Graduate / Professional | 18 | 5.3% |
| Total | 342 | 100.0% |
School Enrollment by Age by Funding Source in Moundridge
Out of a total of 342 students who are enrolled in schools in Moundridge, 58 (17.0%) attend a private institution, while the remaining 284 (83.0%) are enrolled in public schools. The age group of 35 years and over has the highest likelihood of being enrolled in private schools, with 4 (100.0% in the age bracket) enrolled. Conversely, the age group of 5 to 9 year old has the lowest likelihood of being enrolled in a private school, with 72 (100.0% in the age bracket) attending a public institution.
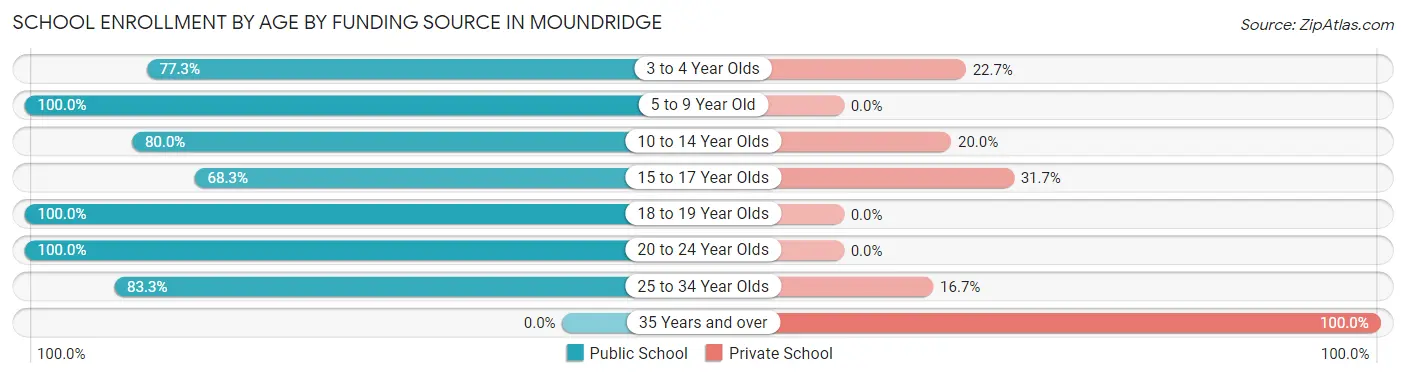
| Age Bracket | Public School | Private School |
| 3 to 4 Year Olds | 17 (77.3%) | 5 (22.7%) |
| 5 to 9 Year Old | 72 (100.0%) | 0 (0.0%) |
| 10 to 14 Year Olds | 96 (80.0%) | 24 (20.0%) |
| 15 to 17 Year Olds | 41 (68.3%) | 19 (31.7%) |
| 18 to 19 Year Olds | 12 (100.0%) | 0 (0.0%) |
| 20 to 24 Year Olds | 16 (100.0%) | 0 (0.0%) |
| 25 to 34 Year Olds | 30 (83.3%) | 6 (16.7%) |
| 35 Years and over | 0 (0.0%) | 4 (100.0%) |
| Total | 284 (83.0%) | 58 (17.0%) |
Educational Attainment by Field of Study in Moundridge
Education (119 | 27.4%), business (87 | 20.1%), social sciences (59 | 13.6%), liberal arts & history (40 | 9.2%), and literature & languages (26 | 6.0%) are the most common fields of study among 434 individuals in Moundridge who have obtained a bachelor's degree or higher.
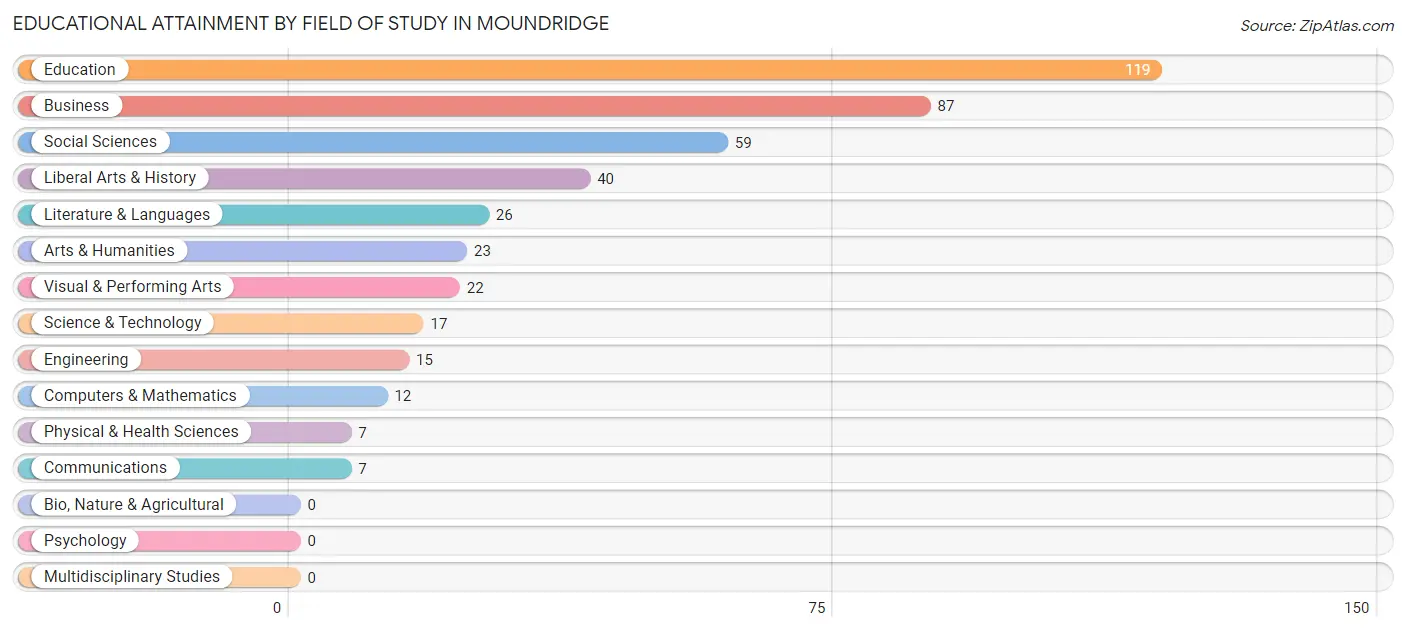
| Field of Study | # Graduates | % Graduates |
| Computers & Mathematics | 12 | 2.8% |
| Bio, Nature & Agricultural | 0 | 0.0% |
| Physical & Health Sciences | 7 | 1.6% |
| Psychology | 0 | 0.0% |
| Social Sciences | 59 | 13.6% |
| Engineering | 15 | 3.5% |
| Multidisciplinary Studies | 0 | 0.0% |
| Science & Technology | 17 | 3.9% |
| Business | 87 | 20.1% |
| Education | 119 | 27.4% |
| Literature & Languages | 26 | 6.0% |
| Liberal Arts & History | 40 | 9.2% |
| Visual & Performing Arts | 22 | 5.1% |
| Communications | 7 | 1.6% |
| Arts & Humanities | 23 | 5.3% |
| Total | 434 | 100.0% |
Transportation & Commute in Moundridge
Vehicle Availability by Sex in Moundridge
The most prevalent vehicle ownership categories in Moundridge are males with 2 vehicles (146, accounting for 41.9%) and females with 2 vehicles (138, making up 39.0%).
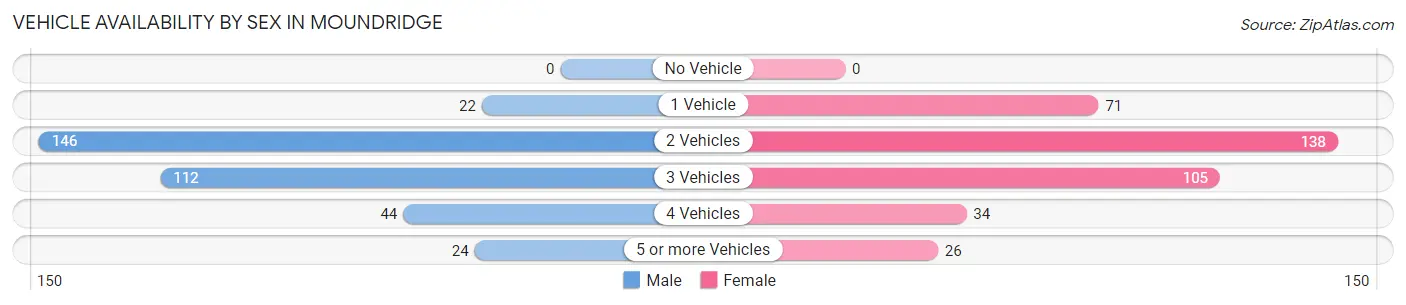
| Vehicles Available | Male | Female |
| No Vehicle | 0 (0.0%) | 0 (0.0%) |
| 1 Vehicle | 22 (6.3%) | 71 (19.0%) |
| 2 Vehicles | 146 (41.9%) | 138 (36.9%) |
| 3 Vehicles | 112 (32.2%) | 105 (28.1%) |
| 4 Vehicles | 44 (12.6%) | 34 (9.1%) |
| 5 or more Vehicles | 24 (6.9%) | 26 (7.0%) |
| Total | 348 (100.0%) | 374 (100.0%) |
Commute Time in Moundridge
The most frequently occuring commute durations in Moundridge are less than 5 minutes (181 commuters, 26.0%), 5 to 9 minutes (160 commuters, 23.0%), and 10 to 14 minutes (102 commuters, 14.7%).
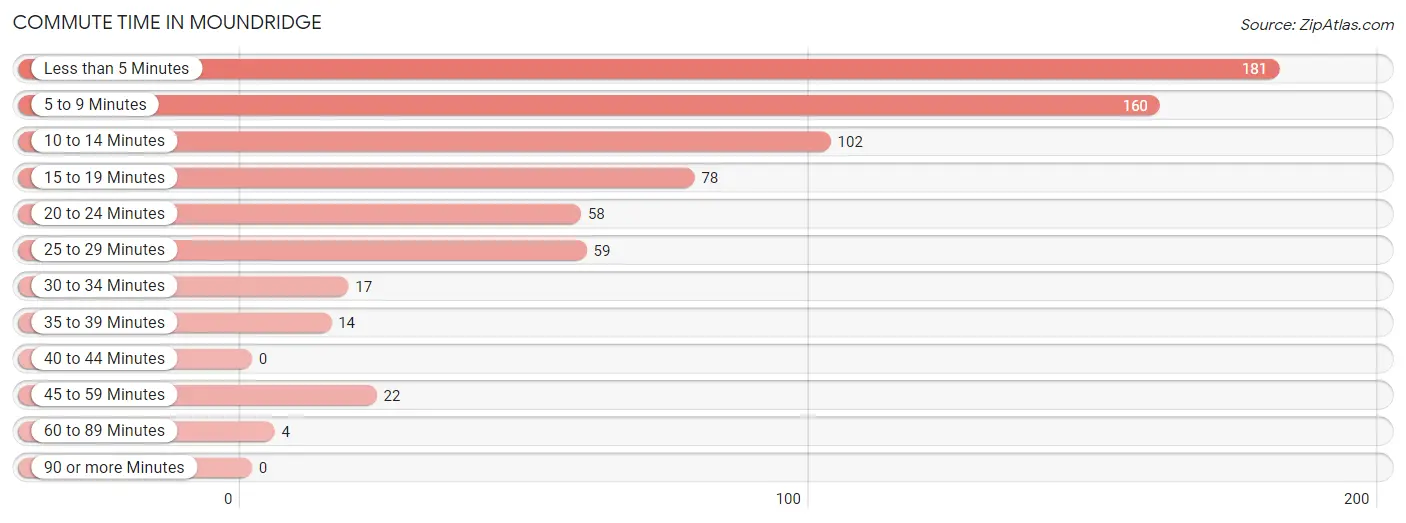
| Commute Time | # Commuters | % Commuters |
| Less than 5 Minutes | 181 | 26.0% |
| 5 to 9 Minutes | 160 | 23.0% |
| 10 to 14 Minutes | 102 | 14.7% |
| 15 to 19 Minutes | 78 | 11.2% |
| 20 to 24 Minutes | 58 | 8.4% |
| 25 to 29 Minutes | 59 | 8.5% |
| 30 to 34 Minutes | 17 | 2.5% |
| 35 to 39 Minutes | 14 | 2.0% |
| 40 to 44 Minutes | 0 | 0.0% |
| 45 to 59 Minutes | 22 | 3.2% |
| 60 to 89 Minutes | 4 | 0.6% |
| 90 or more Minutes | 0 | 0.0% |
Commute Time by Sex in Moundridge
The most common commute times in Moundridge are less than 5 minutes (84 commuters, 24.8%) for males and 5 to 9 minutes (109 commuters, 30.5%) for females.
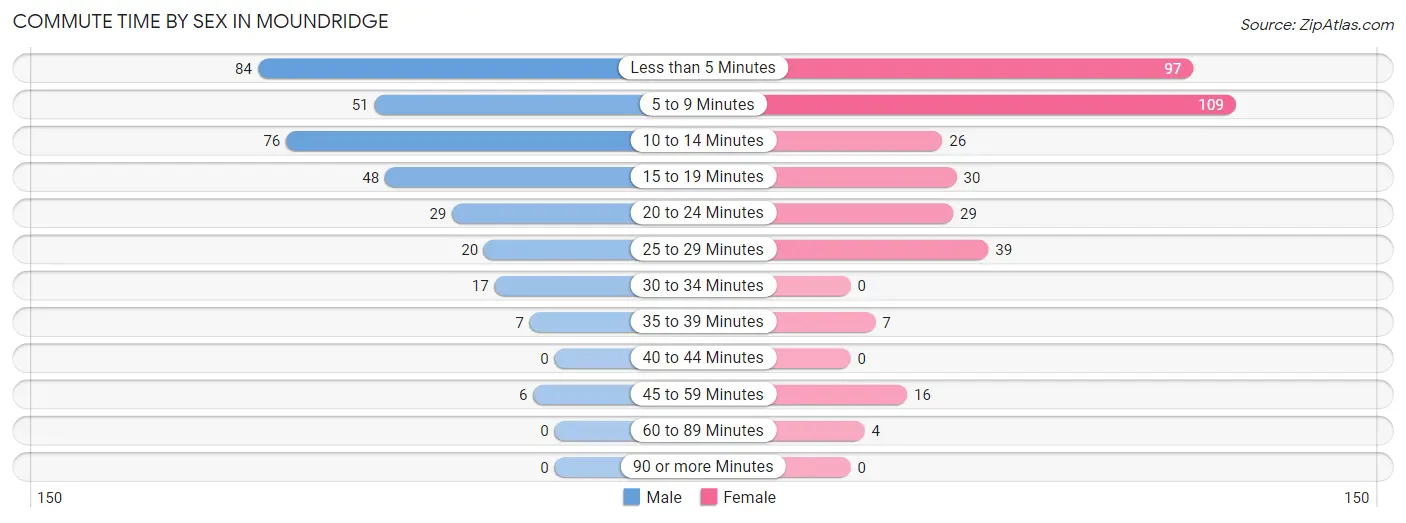
| Commute Time | Male | Female |
| Less than 5 Minutes | 84 (24.8%) | 97 (27.2%) |
| 5 to 9 Minutes | 51 (15.1%) | 109 (30.5%) |
| 10 to 14 Minutes | 76 (22.5%) | 26 (7.3%) |
| 15 to 19 Minutes | 48 (14.2%) | 30 (8.4%) |
| 20 to 24 Minutes | 29 (8.6%) | 29 (8.1%) |
| 25 to 29 Minutes | 20 (5.9%) | 39 (10.9%) |
| 30 to 34 Minutes | 17 (5.0%) | 0 (0.0%) |
| 35 to 39 Minutes | 7 (2.1%) | 7 (2.0%) |
| 40 to 44 Minutes | 0 (0.0%) | 0 (0.0%) |
| 45 to 59 Minutes | 6 (1.8%) | 16 (4.5%) |
| 60 to 89 Minutes | 0 (0.0%) | 4 (1.1%) |
| 90 or more Minutes | 0 (0.0%) | 0 (0.0%) |
Time of Departure to Work by Sex in Moundridge
The most frequent times of departure to work in Moundridge are 7:30 AM to 7:59 AM (78, 23.1%) for males and 7:30 AM to 7:59 AM (66, 18.5%) for females.
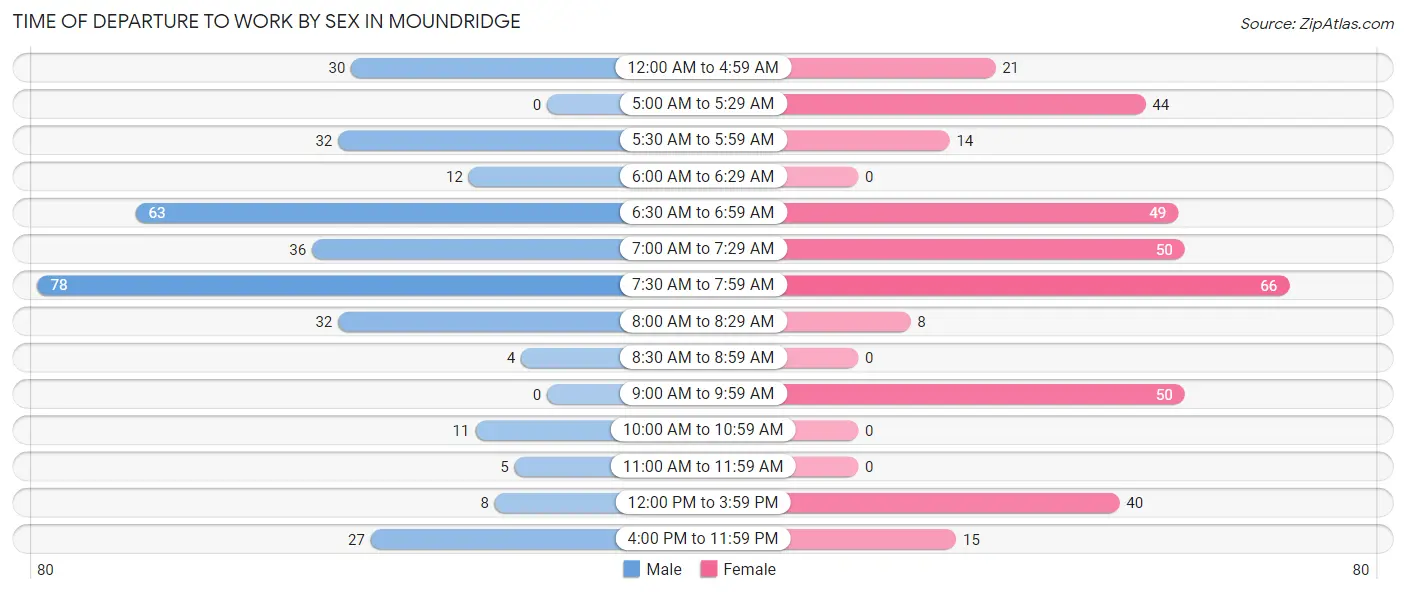
| Time of Departure | Male | Female |
| 12:00 AM to 4:59 AM | 30 (8.9%) | 21 (5.9%) |
| 5:00 AM to 5:29 AM | 0 (0.0%) | 44 (12.3%) |
| 5:30 AM to 5:59 AM | 32 (9.5%) | 14 (3.9%) |
| 6:00 AM to 6:29 AM | 12 (3.5%) | 0 (0.0%) |
| 6:30 AM to 6:59 AM | 63 (18.6%) | 49 (13.7%) |
| 7:00 AM to 7:29 AM | 36 (10.6%) | 50 (14.0%) |
| 7:30 AM to 7:59 AM | 78 (23.1%) | 66 (18.5%) |
| 8:00 AM to 8:29 AM | 32 (9.5%) | 8 (2.2%) |
| 8:30 AM to 8:59 AM | 4 (1.2%) | 0 (0.0%) |
| 9:00 AM to 9:59 AM | 0 (0.0%) | 50 (14.0%) |
| 10:00 AM to 10:59 AM | 11 (3.3%) | 0 (0.0%) |
| 11:00 AM to 11:59 AM | 5 (1.5%) | 0 (0.0%) |
| 12:00 PM to 3:59 PM | 8 (2.4%) | 40 (11.2%) |
| 4:00 PM to 11:59 PM | 27 (8.0%) | 15 (4.2%) |
| Total | 338 (100.0%) | 357 (100.0%) |
Housing Occupancy in Moundridge
Occupancy by Ownership in Moundridge
Of the total 750 dwellings in Moundridge, owner-occupied units account for 505 (67.3%), while renter-occupied units make up 245 (32.7%).
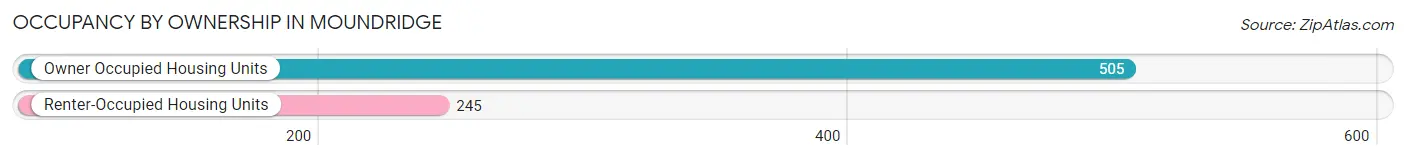
| Occupancy | # Housing Units | % Housing Units |
| Owner Occupied Housing Units | 505 | 67.3% |
| Renter-Occupied Housing Units | 245 | 32.7% |
| Total Occupied Housing Units | 750 | 100.0% |
Occupancy by Household Size in Moundridge
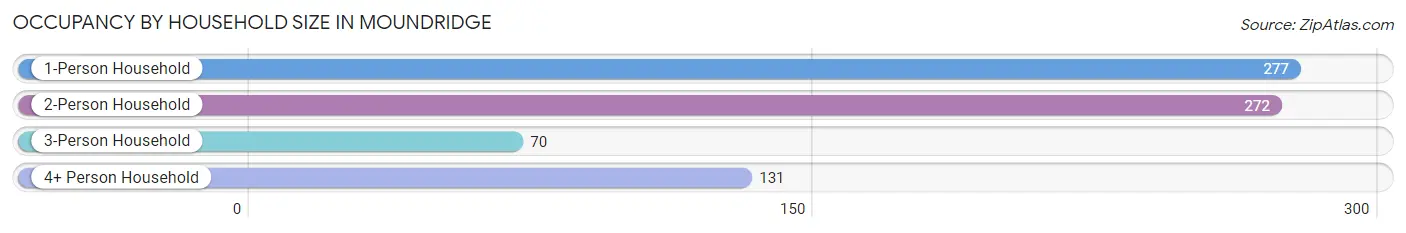
| Household Size | # Housing Units | % Housing Units |
| 1-Person Household | 277 | 36.9% |
| 2-Person Household | 272 | 36.3% |
| 3-Person Household | 70 | 9.3% |
| 4+ Person Household | 131 | 17.5% |
| Total Housing Units | 750 | 100.0% |
Occupancy by Ownership by Household Size in Moundridge
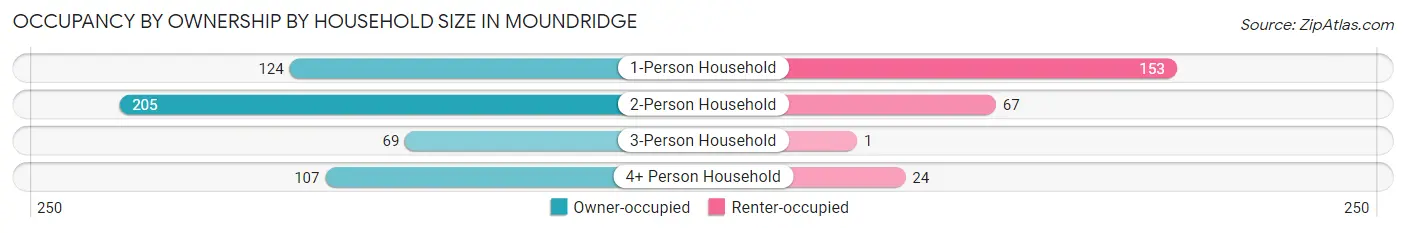
| Household Size | Owner-occupied | Renter-occupied |
| 1-Person Household | 124 (44.8%) | 153 (55.2%) |
| 2-Person Household | 205 (75.4%) | 67 (24.6%) |
| 3-Person Household | 69 (98.6%) | 1 (1.4%) |
| 4+ Person Household | 107 (81.7%) | 24 (18.3%) |
| Total Housing Units | 505 (67.3%) | 245 (32.7%) |
Occupancy by Educational Attainment in Moundridge

| Household Size | Owner-occupied | Renter-occupied |
| Less than High School | 43 (36.4%) | 75 (63.6%) |
| High School Diploma | 136 (69.0%) | 61 (31.0%) |
| College/Associate Degree | 169 (65.2%) | 90 (34.7%) |
| Bachelor's Degree or higher | 157 (89.2%) | 19 (10.8%) |
Occupancy by Age of Householder in Moundridge
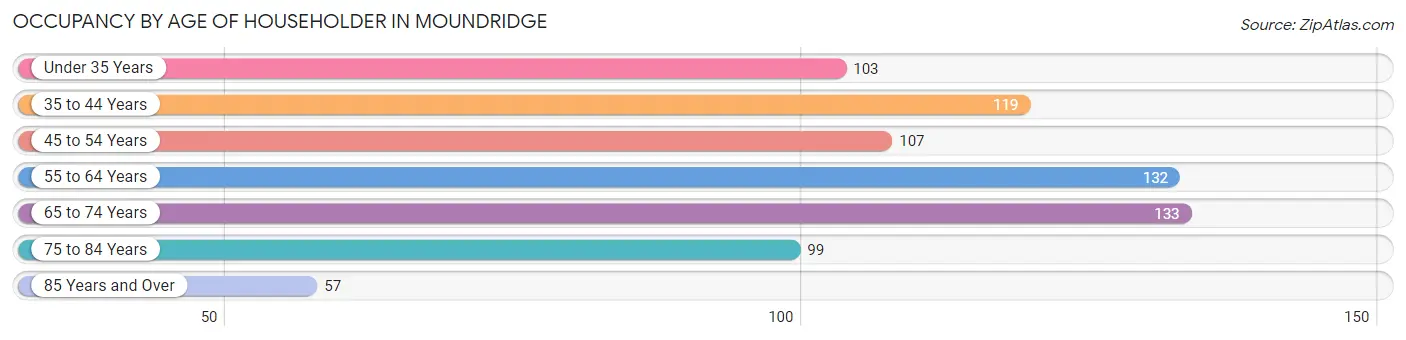
| Age Bracket | # Households | % Households |
| Under 35 Years | 103 | 13.7% |
| 35 to 44 Years | 119 | 15.9% |
| 45 to 54 Years | 107 | 14.3% |
| 55 to 64 Years | 132 | 17.6% |
| 65 to 74 Years | 133 | 17.7% |
| 75 to 84 Years | 99 | 13.2% |
| 85 Years and Over | 57 | 7.6% |
| Total | 750 | 100.0% |
Housing Finances in Moundridge
Median Income by Occupancy in Moundridge
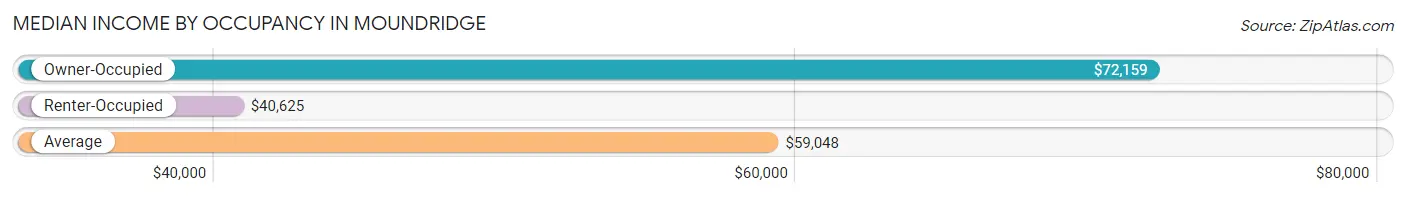
| Occupancy Type | # Households | Median Income |
| Owner-Occupied | 505 (67.3%) | $72,159 |
| Renter-Occupied | 245 (32.7%) | $40,625 |
| Average | 750 (100.0%) | $59,048 |
Occupancy by Householder Income Bracket in Moundridge
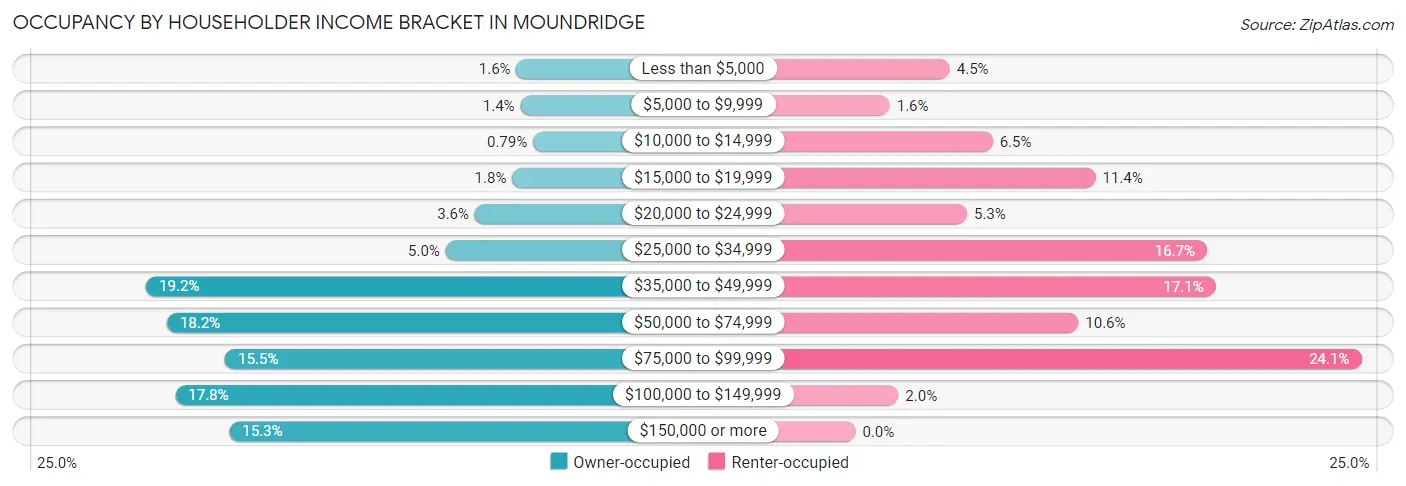
| Income Bracket | Owner-occupied | Renter-occupied |
| Less than $5,000 | 8 (1.6%) | 11 (4.5%) |
| $5,000 to $9,999 | 7 (1.4%) | 4 (1.6%) |
| $10,000 to $14,999 | 4 (0.8%) | 16 (6.5%) |
| $15,000 to $19,999 | 9 (1.8%) | 28 (11.4%) |
| $20,000 to $24,999 | 18 (3.6%) | 13 (5.3%) |
| $25,000 to $34,999 | 25 (5.0%) | 41 (16.7%) |
| $35,000 to $49,999 | 97 (19.2%) | 42 (17.1%) |
| $50,000 to $74,999 | 92 (18.2%) | 26 (10.6%) |
| $75,000 to $99,999 | 78 (15.4%) | 59 (24.1%) |
| $100,000 to $149,999 | 90 (17.8%) | 5 (2.0%) |
| $150,000 or more | 77 (15.2%) | 0 (0.0%) |
| Total | 505 (100.0%) | 245 (100.0%) |
Monthly Housing Cost Tiers in Moundridge
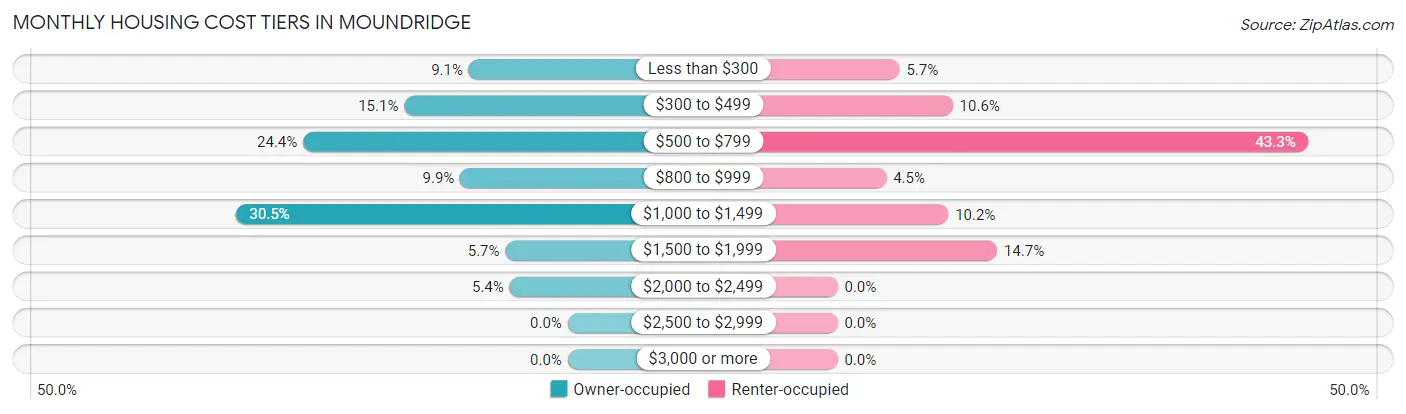
| Monthly Cost | Owner-occupied | Renter-occupied |
| Less than $300 | 46 (9.1%) | 14 (5.7%) |
| $300 to $499 | 76 (15.0%) | 26 (10.6%) |
| $500 to $799 | 123 (24.4%) | 106 (43.3%) |
| $800 to $999 | 50 (9.9%) | 11 (4.5%) |
| $1,000 to $1,499 | 154 (30.5%) | 25 (10.2%) |
| $1,500 to $1,999 | 29 (5.7%) | 36 (14.7%) |
| $2,000 to $2,499 | 27 (5.3%) | 0 (0.0%) |
| $2,500 to $2,999 | 0 (0.0%) | 0 (0.0%) |
| $3,000 or more | 0 (0.0%) | 0 (0.0%) |
| Total | 505 (100.0%) | 245 (100.0%) |
Physical Housing Characteristics in Moundridge
Housing Structures in Moundridge
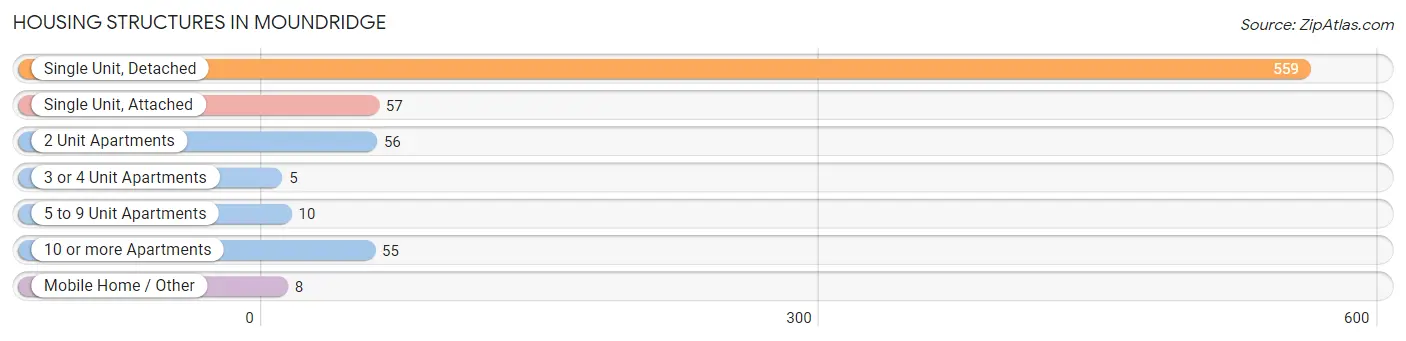
| Structure Type | # Housing Units | % Housing Units |
| Single Unit, Detached | 559 | 74.5% |
| Single Unit, Attached | 57 | 7.6% |
| 2 Unit Apartments | 56 | 7.5% |
| 3 or 4 Unit Apartments | 5 | 0.7% |
| 5 to 9 Unit Apartments | 10 | 1.3% |
| 10 or more Apartments | 55 | 7.3% |
| Mobile Home / Other | 8 | 1.1% |
| Total | 750 | 100.0% |
Housing Structures by Occupancy in Moundridge
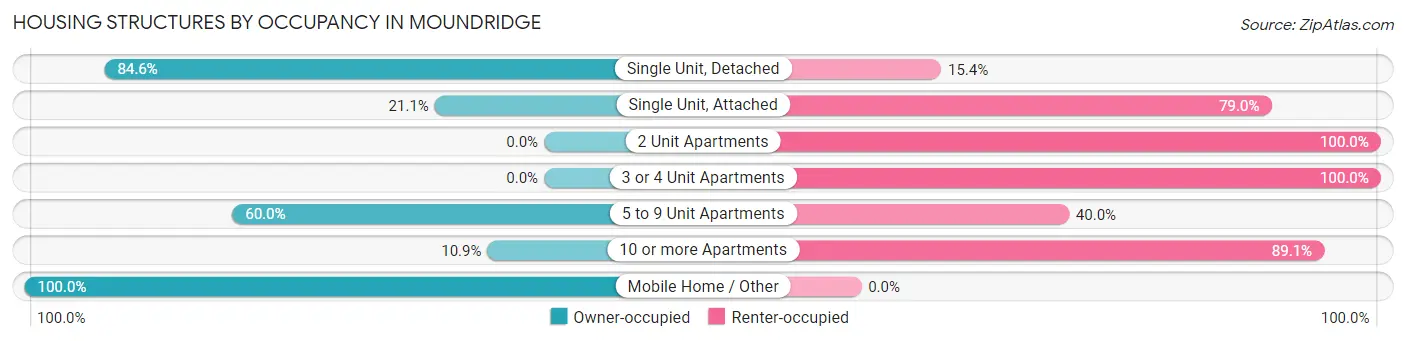
| Structure Type | Owner-occupied | Renter-occupied |
| Single Unit, Detached | 473 (84.6%) | 86 (15.4%) |
| Single Unit, Attached | 12 (21.0%) | 45 (78.9%) |
| 2 Unit Apartments | 0 (0.0%) | 56 (100.0%) |
| 3 or 4 Unit Apartments | 0 (0.0%) | 5 (100.0%) |
| 5 to 9 Unit Apartments | 6 (60.0%) | 4 (40.0%) |
| 10 or more Apartments | 6 (10.9%) | 49 (89.1%) |
| Mobile Home / Other | 8 (100.0%) | 0 (0.0%) |
| Total | 505 (67.3%) | 245 (32.7%) |
Housing Structures by Number of Rooms in Moundridge
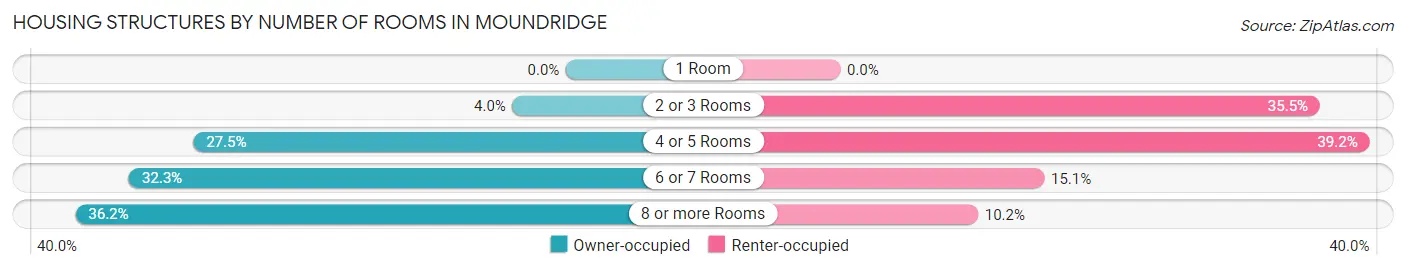
| Number of Rooms | Owner-occupied | Renter-occupied |
| 1 Room | 0 (0.0%) | 0 (0.0%) |
| 2 or 3 Rooms | 20 (4.0%) | 87 (35.5%) |
| 4 or 5 Rooms | 139 (27.5%) | 96 (39.2%) |
| 6 or 7 Rooms | 163 (32.3%) | 37 (15.1%) |
| 8 or more Rooms | 183 (36.2%) | 25 (10.2%) |
| Total | 505 (100.0%) | 245 (100.0%) |
Housing Structure by Heating Type in Moundridge
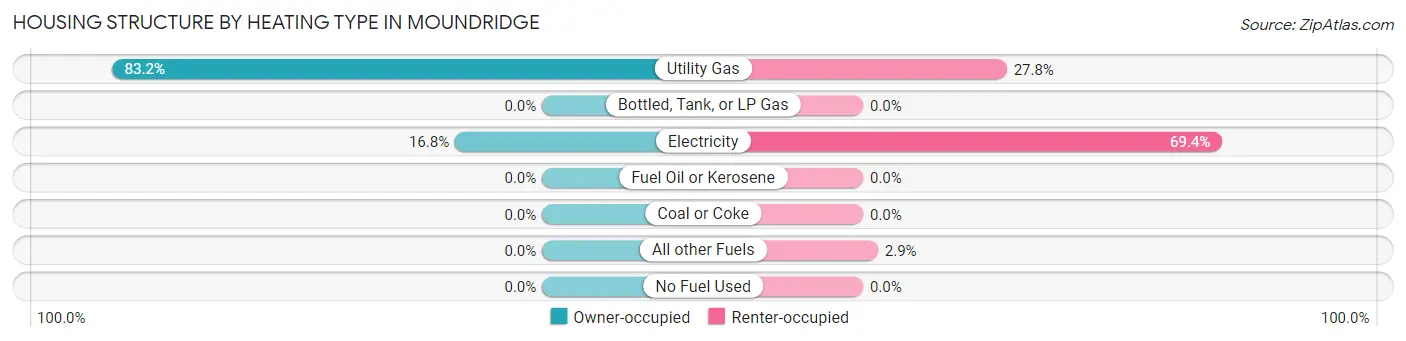
| Heating Type | Owner-occupied | Renter-occupied |
| Utility Gas | 420 (83.2%) | 68 (27.8%) |
| Bottled, Tank, or LP Gas | 0 (0.0%) | 0 (0.0%) |
| Electricity | 85 (16.8%) | 170 (69.4%) |
| Fuel Oil or Kerosene | 0 (0.0%) | 0 (0.0%) |
| Coal or Coke | 0 (0.0%) | 0 (0.0%) |
| All other Fuels | 0 (0.0%) | 7 (2.9%) |
| No Fuel Used | 0 (0.0%) | 0 (0.0%) |
| Total | 505 (100.0%) | 245 (100.0%) |
Household Vehicle Usage in Moundridge
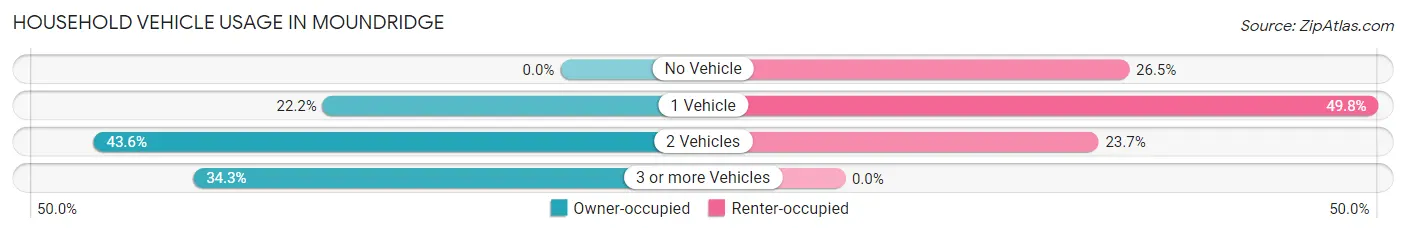
| Vehicles per Household | Owner-occupied | Renter-occupied |
| No Vehicle | 0 (0.0%) | 65 (26.5%) |
| 1 Vehicle | 112 (22.2%) | 122 (49.8%) |
| 2 Vehicles | 220 (43.6%) | 58 (23.7%) |
| 3 or more Vehicles | 173 (34.3%) | 0 (0.0%) |
| Total | 505 (100.0%) | 245 (100.0%) |
Real Estate & Mortgages in Moundridge
Real Estate and Mortgage Overview in Moundridge
| Characteristic | Without Mortgage | With Mortgage |
| Housing Units | 216 | 289 |
| Median Property Value | $162,700 | $168,500 |
| Median Household Income | $67,000 | $39 |
| Monthly Housing Costs | $478 | $0 |
| Real Estate Taxes | $2,368 | $13 |
Property Value by Mortgage Status in Moundridge
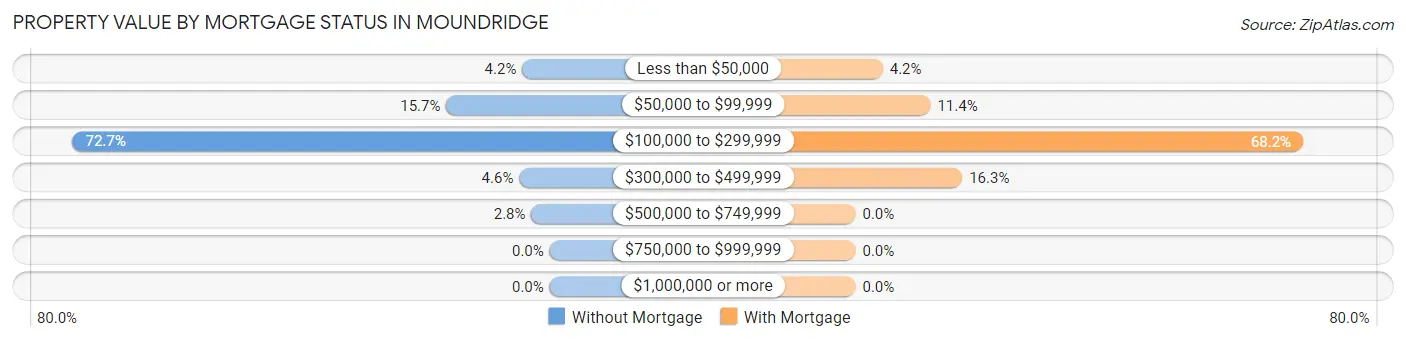
| Property Value | Without Mortgage | With Mortgage |
| Less than $50,000 | 9 (4.2%) | 12 (4.2%) |
| $50,000 to $99,999 | 34 (15.7%) | 33 (11.4%) |
| $100,000 to $299,999 | 157 (72.7%) | 197 (68.2%) |
| $300,000 to $499,999 | 10 (4.6%) | 47 (16.3%) |
| $500,000 to $749,999 | 6 (2.8%) | 0 (0.0%) |
| $750,000 to $999,999 | 0 (0.0%) | 0 (0.0%) |
| $1,000,000 or more | 0 (0.0%) | 0 (0.0%) |
| Total | 216 (100.0%) | 289 (100.0%) |
Household Income by Mortgage Status in Moundridge
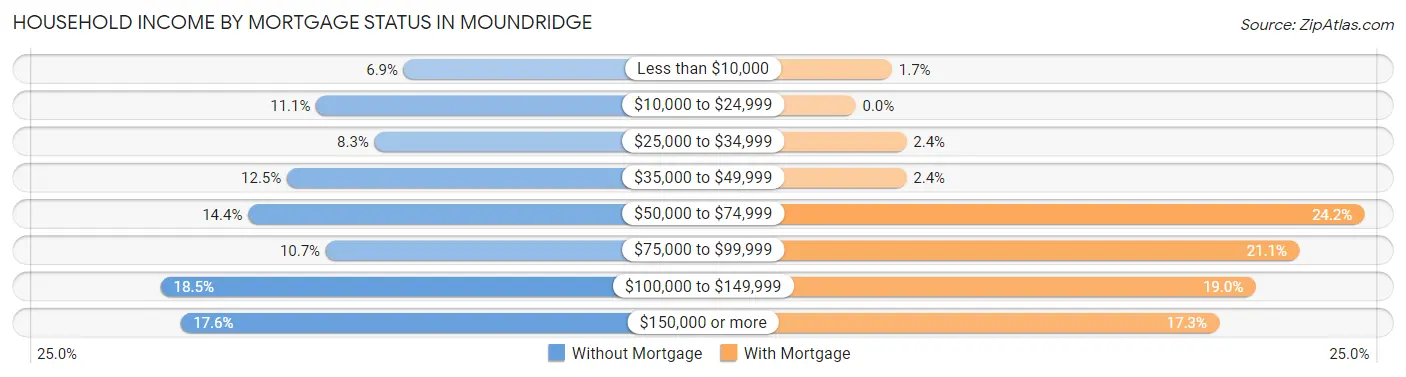
| Household Income | Without Mortgage | With Mortgage |
| Less than $10,000 | 15 (6.9%) | 5 (1.7%) |
| $10,000 to $24,999 | 24 (11.1%) | 0 (0.0%) |
| $25,000 to $34,999 | 18 (8.3%) | 7 (2.4%) |
| $35,000 to $49,999 | 27 (12.5%) | 7 (2.4%) |
| $50,000 to $74,999 | 31 (14.3%) | 70 (24.2%) |
| $75,000 to $99,999 | 23 (10.6%) | 61 (21.1%) |
| $100,000 to $149,999 | 40 (18.5%) | 55 (19.0%) |
| $150,000 or more | 38 (17.6%) | 50 (17.3%) |
| Total | 216 (100.0%) | 289 (100.0%) |
Property Value to Household Income Ratio in Moundridge
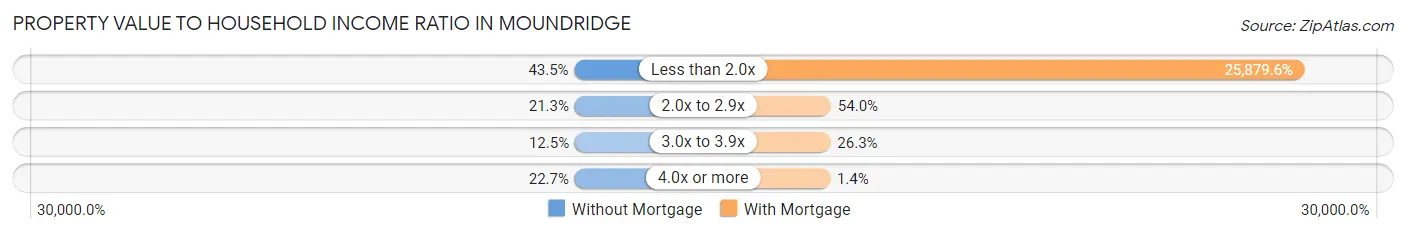
| Value-to-Income Ratio | Without Mortgage | With Mortgage |
| Less than 2.0x | 94 (43.5%) | 74,792 (25,879.6%) |
| 2.0x to 2.9x | 46 (21.3%) | 156 (54.0%) |
| 3.0x to 3.9x | 27 (12.5%) | 76 (26.3%) |
| 4.0x or more | 49 (22.7%) | 4 (1.4%) |
| Total | 216 (100.0%) | 289 (100.0%) |
Real Estate Taxes by Mortgage Status in Moundridge
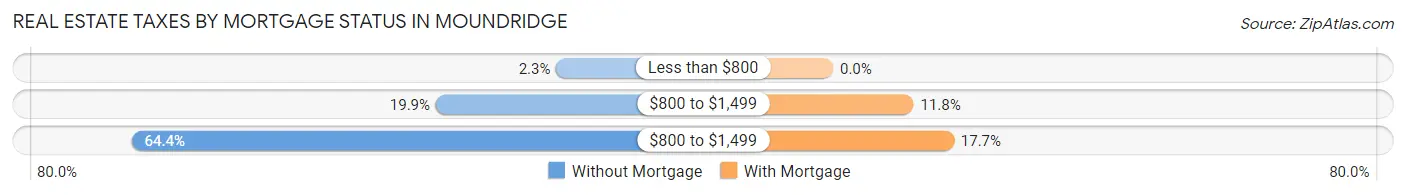
| Property Taxes | Without Mortgage | With Mortgage |
| Less than $800 | 5 (2.3%) | 0 (0.0%) |
| $800 to $1,499 | 43 (19.9%) | 34 (11.8%) |
| $800 to $1,499 | 139 (64.3%) | 51 (17.6%) |
| Total | 216 (100.0%) | 289 (100.0%) |
Health & Disability in Moundridge
Health Insurance Coverage by Age in Moundridge
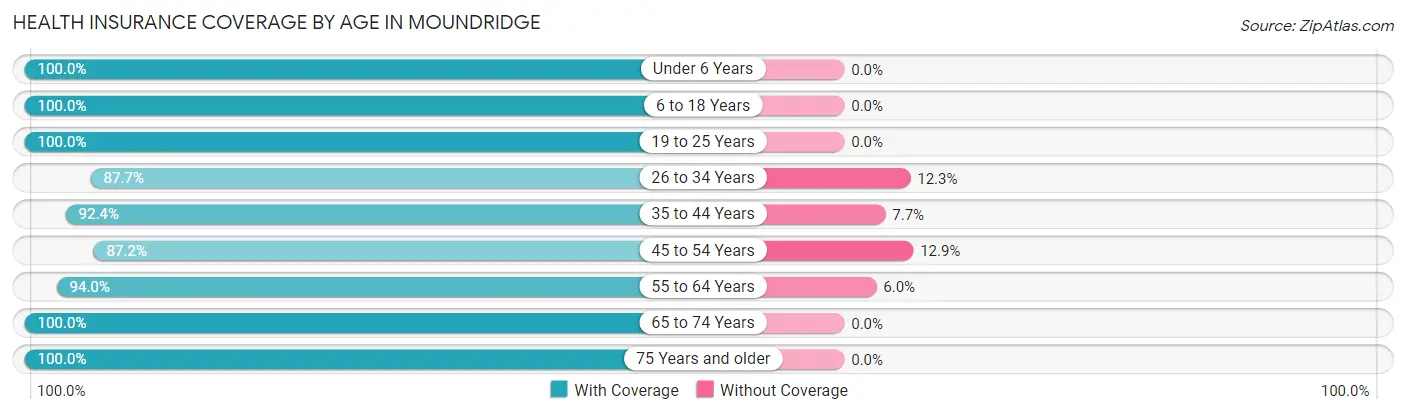
| Age Bracket | With Coverage | Without Coverage |
| Under 6 Years | 121 (100.0%) | 0 (0.0%) |
| 6 to 18 Years | 264 (100.0%) | 0 (0.0%) |
| 19 to 25 Years | 134 (100.0%) | 0 (0.0%) |
| 26 to 34 Years | 107 (87.7%) | 15 (12.3%) |
| 35 to 44 Years | 169 (92.3%) | 14 (7.6%) |
| 45 to 54 Years | 156 (87.2%) | 23 (12.9%) |
| 55 to 64 Years | 173 (94.0%) | 11 (6.0%) |
| 65 to 74 Years | 201 (100.0%) | 0 (0.0%) |
| 75 Years and older | 257 (100.0%) | 0 (0.0%) |
| Total | 1,582 (96.2%) | 63 (3.8%) |
Health Insurance Coverage by Citizenship Status in Moundridge
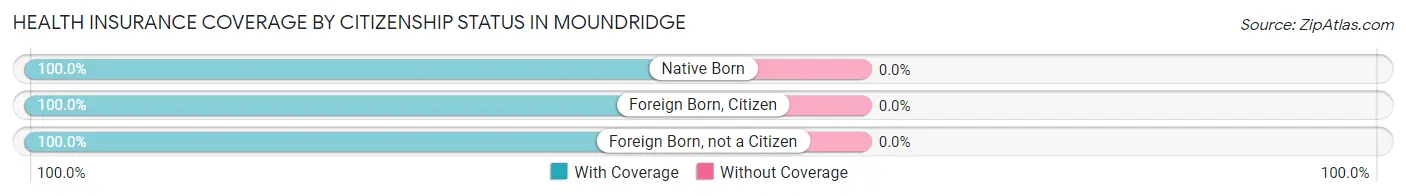
| Citizenship Status | With Coverage | Without Coverage |
| Native Born | 121 (100.0%) | 0 (0.0%) |
| Foreign Born, Citizen | 264 (100.0%) | 0 (0.0%) |
| Foreign Born, not a Citizen | 134 (100.0%) | 0 (0.0%) |
Health Insurance Coverage by Household Income in Moundridge
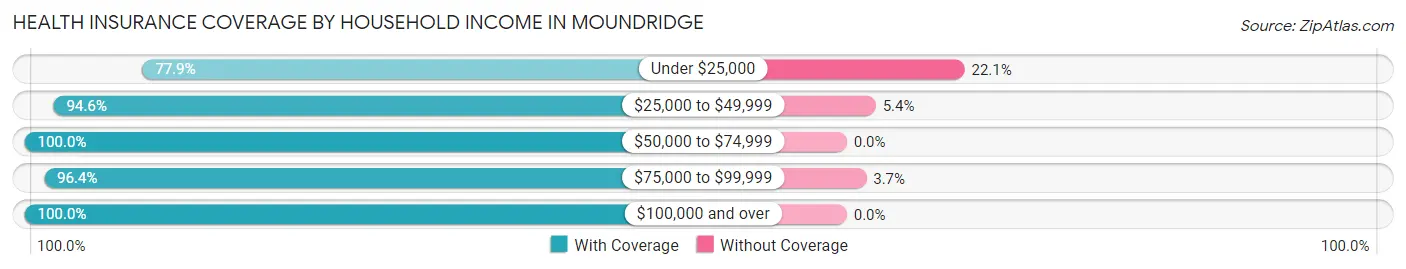
| Household Income | With Coverage | Without Coverage |
| Under $25,000 | 106 (77.9%) | 30 (22.1%) |
| $25,000 to $49,999 | 349 (94.6%) | 20 (5.4%) |
| $50,000 to $74,999 | 339 (100.0%) | 0 (0.0%) |
| $75,000 to $99,999 | 343 (96.4%) | 13 (3.6%) |
| $100,000 and over | 445 (100.0%) | 0 (0.0%) |
Public vs Private Health Insurance Coverage by Age in Moundridge
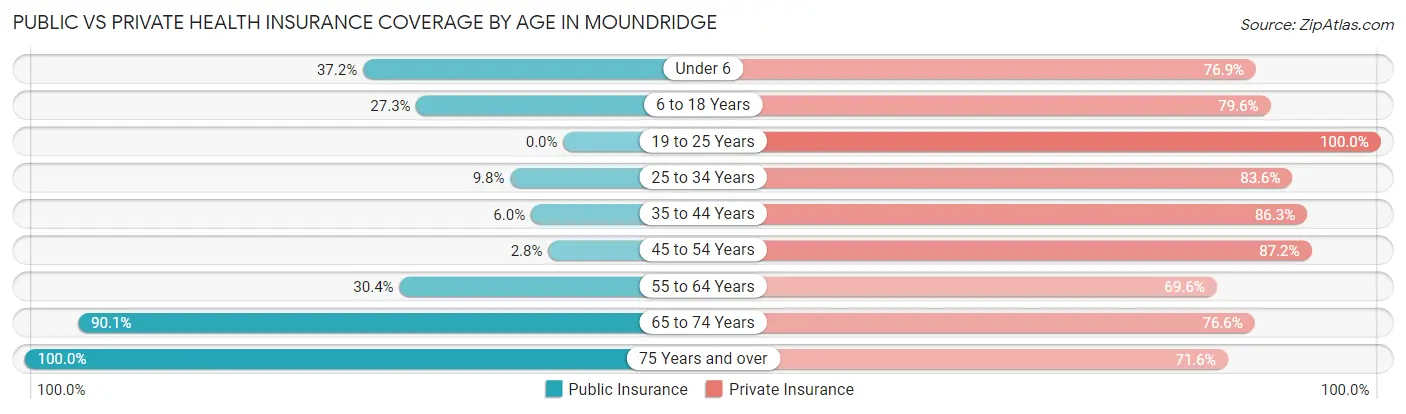
| Age Bracket | Public Insurance | Private Insurance |
| Under 6 | 45 (37.2%) | 93 (76.9%) |
| 6 to 18 Years | 72 (27.3%) | 210 (79.5%) |
| 19 to 25 Years | 0 (0.0%) | 134 (100.0%) |
| 25 to 34 Years | 12 (9.8%) | 102 (83.6%) |
| 35 to 44 Years | 11 (6.0%) | 158 (86.3%) |
| 45 to 54 Years | 5 (2.8%) | 156 (87.2%) |
| 55 to 64 Years | 56 (30.4%) | 128 (69.6%) |
| 65 to 74 Years | 181 (90.0%) | 154 (76.6%) |
| 75 Years and over | 257 (100.0%) | 184 (71.6%) |
| Total | 639 (38.8%) | 1,319 (80.2%) |
Disability Status by Sex by Age in Moundridge
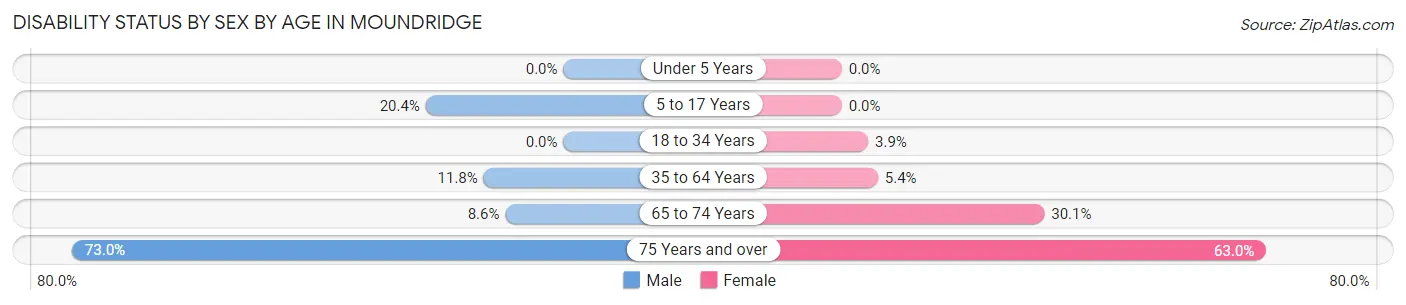
| Age Bracket | Male | Female |
| Under 5 Years | 0 (0.0%) | 0 (0.0%) |
| 5 to 17 Years | 28 (20.4%) | 0 (0.0%) |
| 18 to 34 Years | 0 (0.0%) | 5 (3.9%) |
| 35 to 64 Years | 27 (11.8%) | 17 (5.3%) |
| 65 to 74 Years | 5 (8.6%) | 43 (30.1%) |
| 75 Years and over | 81 (73.0%) | 92 (63.0%) |
Disability Class by Sex by Age in Moundridge
Disability Class: Hearing Difficulty
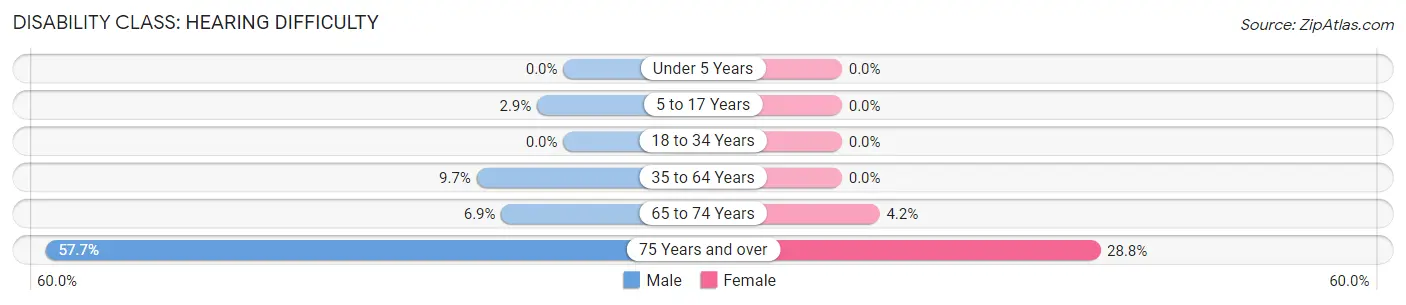
| Age Bracket | Male | Female |
| Under 5 Years | 0 (0.0%) | 0 (0.0%) |
| 5 to 17 Years | 4 (2.9%) | 0 (0.0%) |
| 18 to 34 Years | 0 (0.0%) | 0 (0.0%) |
| 35 to 64 Years | 22 (9.7%) | 0 (0.0%) |
| 65 to 74 Years | 4 (6.9%) | 6 (4.2%) |
| 75 Years and over | 64 (57.7%) | 42 (28.8%) |
Disability Class: Vision Difficulty
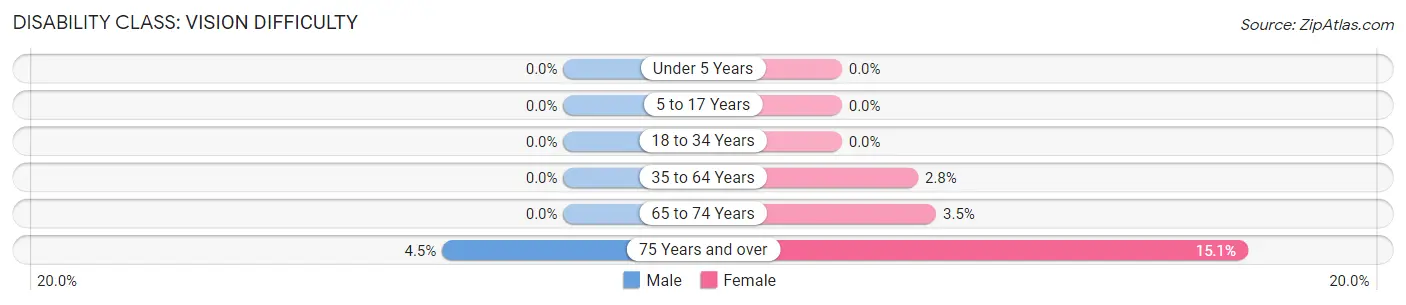
| Age Bracket | Male | Female |
| Under 5 Years | 0 (0.0%) | 0 (0.0%) |
| 5 to 17 Years | 0 (0.0%) | 0 (0.0%) |
| 18 to 34 Years | 0 (0.0%) | 0 (0.0%) |
| 35 to 64 Years | 0 (0.0%) | 9 (2.8%) |
| 65 to 74 Years | 0 (0.0%) | 5 (3.5%) |
| 75 Years and over | 5 (4.5%) | 22 (15.1%) |
Disability Class: Cognitive Difficulty
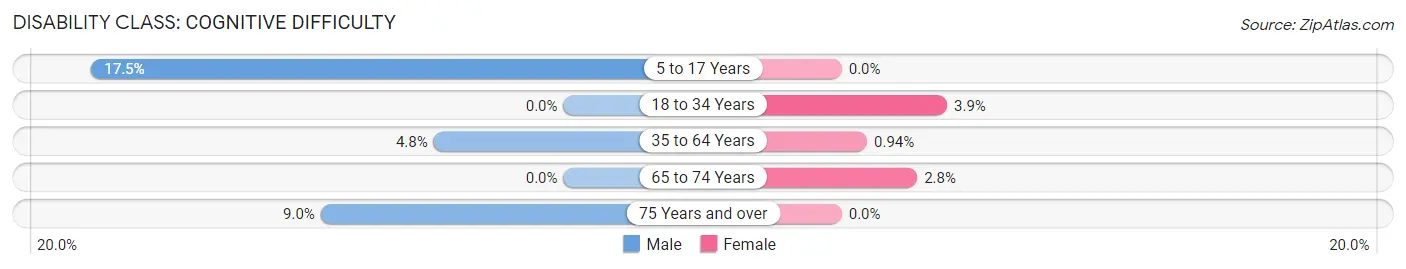
| Age Bracket | Male | Female |
| 5 to 17 Years | 24 (17.5%) | 0 (0.0%) |
| 18 to 34 Years | 0 (0.0%) | 5 (3.9%) |
| 35 to 64 Years | 11 (4.8%) | 3 (0.9%) |
| 65 to 74 Years | 0 (0.0%) | 4 (2.8%) |
| 75 Years and over | 10 (9.0%) | 0 (0.0%) |
Disability Class: Ambulatory Difficulty
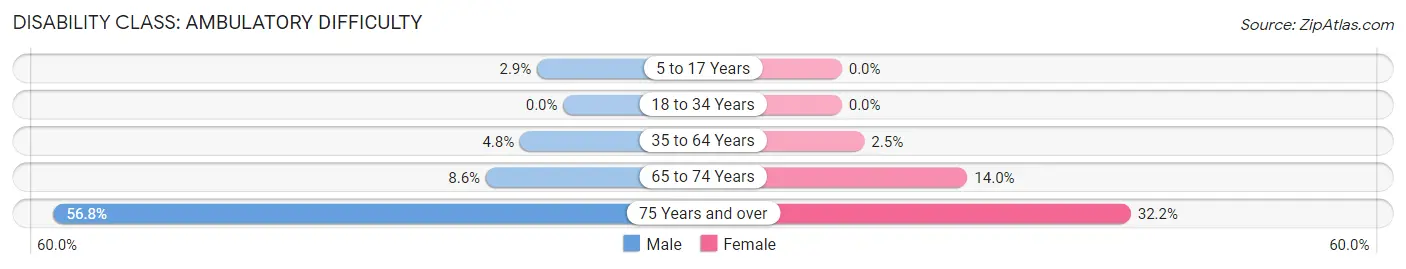
| Age Bracket | Male | Female |
| 5 to 17 Years | 4 (2.9%) | 0 (0.0%) |
| 18 to 34 Years | 0 (0.0%) | 0 (0.0%) |
| 35 to 64 Years | 11 (4.8%) | 8 (2.5%) |
| 65 to 74 Years | 5 (8.6%) | 20 (14.0%) |
| 75 Years and over | 63 (56.8%) | 47 (32.2%) |
Disability Class: Self-Care Difficulty
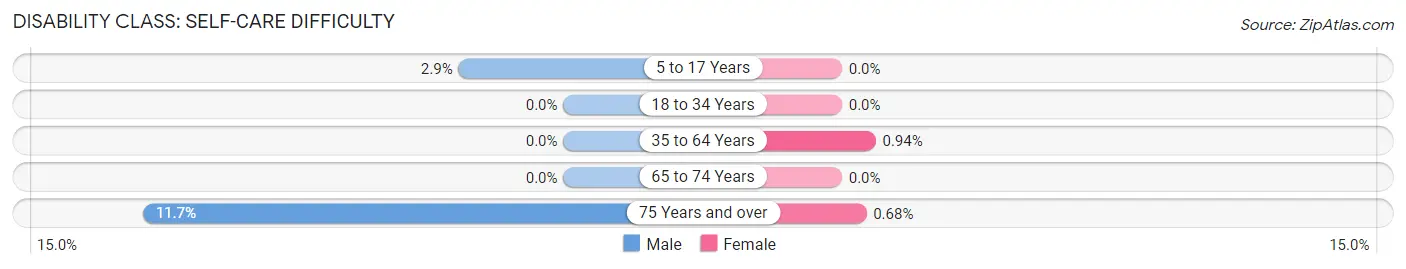
| Age Bracket | Male | Female |
| 5 to 17 Years | 4 (2.9%) | 0 (0.0%) |
| 18 to 34 Years | 0 (0.0%) | 0 (0.0%) |
| 35 to 64 Years | 0 (0.0%) | 3 (0.9%) |
| 65 to 74 Years | 0 (0.0%) | 0 (0.0%) |
| 75 Years and over | 13 (11.7%) | 1 (0.7%) |
Technology Access in Moundridge
Computing Device Access in Moundridge
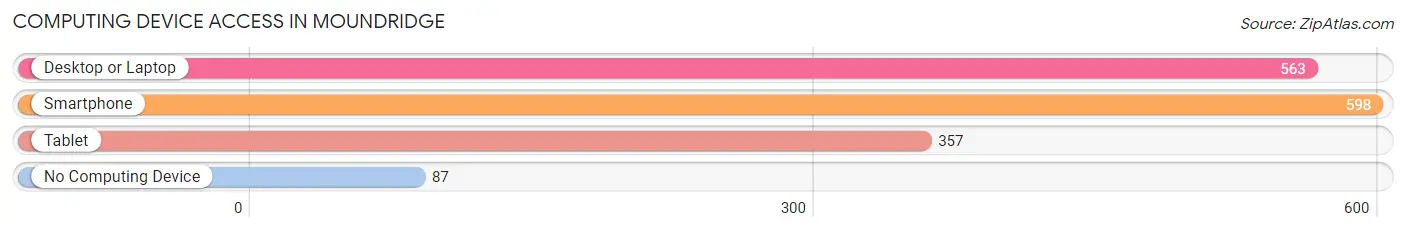
| Device Type | # Households | % Households |
| Desktop or Laptop | 563 | 75.1% |
| Smartphone | 598 | 79.7% |
| Tablet | 357 | 47.6% |
| No Computing Device | 87 | 11.6% |
| Total | 750 | 100.0% |
Internet Access in Moundridge
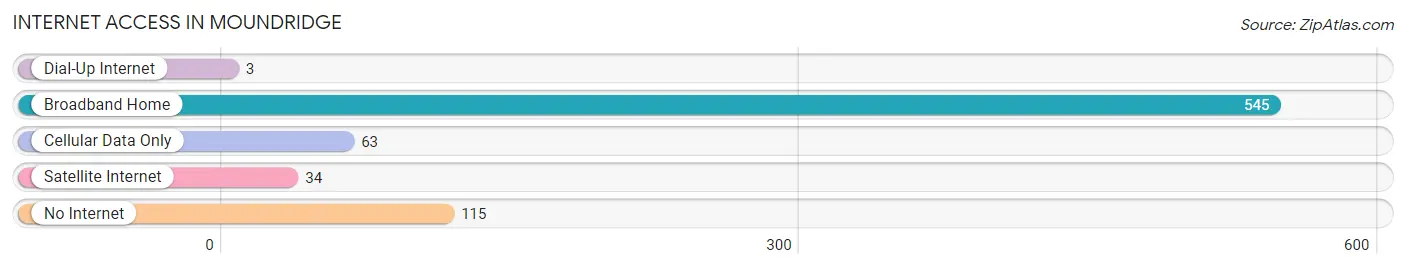
| Internet Type | # Households | % Households |
| Dial-Up Internet | 3 | 0.4% |
| Broadband Home | 545 | 72.7% |
| Cellular Data Only | 63 | 8.4% |
| Satellite Internet | 34 | 4.5% |
| No Internet | 115 | 15.3% |
| Total | 750 | 100.0% |
Moundridge Summary
Moundridge is a small city located in McPherson County, Kansas, United States. It is situated in the south-central part of the state, approximately 25 miles north of Wichita. The city has a population of 1,845 as of the 2010 census.
History
Moundridge was founded in 1872 by a group of Mennonites from Russia. The city was named after the nearby Moundridge Mound, a large earthen mound built by Native Americans. The Mennonites were attracted to the area due to its fertile soil and abundant water supply.
The first settlers built a school, a church, and a store. The town grew slowly but steadily, and by the early 1900s, it had become a thriving agricultural community. The city was incorporated in 1906.
Geography
Moundridge is located at 38°17'N 97°37'W (38.2833, -97.6167). According to the United States Census Bureau, the city has a total area of 1.2 square miles (3.1 km2), all of it land.
Economy
Moundridge is a small agricultural community. The city is home to several businesses, including a grain elevator, a feed mill, a lumber yard, and a hardware store. The city also has a small manufacturing sector, with several companies producing furniture, metal products, and other goods.
Demographics
As of the 2010 census, there were 1,845 people, 717 households, and 486 families residing in the city. The population density was 1,539.2 people per square mile (593.7/km2). There were 790 housing units at an average density of 658.3 per square mile (254.2/km2). The racial makeup of the city was 97.2% White, 0.2% African American, 0.3% Native American, 0.2% Asian, 0.2% from other races, and 1.9% from two or more races. Hispanic or Latino of any race were 1.2% of the population.
There were 717 households, out of which 32.2% had children under the age of 18 living with them, 53.2% were married couples living together, 8.7% had a female householder with no husband present, and 33.7% were non-families. 29.7% of all households were made up of individuals, and 15.2% had someone living alone who was 65 years of age or older. The average household size was 2.50 and the average family size was 3.12.
In the city, the population was spread out, with 27.2% under the age of 18, 7.2% from 18 to 24, 25.3% from 25 to 44, 22.2% from 45 to 64, and 18.1% who were 65 years of age or older. The median age was 38 years. For every 100 females, there were 91.2 males. For every 100 females age 18 and over, there were 87.2 males.
The median income for a household in the city was $37,500, and the median income for a family was $45,000. Males had a median income of $31,250 versus $21,250 for females. The per capita income for the city was $17,845. About 5.2% of families and 7.2% of the population were below the poverty line, including 8.2% of those under age 18 and 8.3% of those age 65 or over.
Common Questions
What is Per Capita Income in Moundridge?
Per Capita income in Moundridge is $32,177.
What is the Median Family Income in Moundridge?
Median Family Income in Moundridge is $83,365.
What is the Median Household income in Moundridge?
Median Household Income in Moundridge is $59,048.
What is Income or Wage Gap in Moundridge?
Income or Wage Gap in Moundridge is 28.9%.
Women in Moundridge earn 71.1 cents for every dollar earned by a man.
What is Inequality or Gini Index in Moundridge?
Inequality or Gini Index in Moundridge is 0.39.
What is the Total Population of Moundridge?
Total Population of Moundridge is 1,854.
What is the Total Male Population of Moundridge?
Total Male Population of Moundridge is 797.
What is the Total Female Population of Moundridge?
Total Female Population of Moundridge is 1,057.
What is the Ratio of Males per 100 Females in Moundridge?
There are 75.40 Males per 100 Females in Moundridge.
What is the Ratio of Females per 100 Males in Moundridge?
There are 132.62 Females per 100 Males in Moundridge.
What is the Median Population Age in Moundridge?
Median Population Age in Moundridge is 52.4 Years.
What is the Average Family Size in Moundridge
Average Family Size in Moundridge is 2.9 People.
What is the Average Household Size in Moundridge
Average Household Size in Moundridge is 2.2 People.
How Large is the Labor Force in Moundridge?
There are 772 People in the Labor Forcein in Moundridge.
What is the Percentage of People in the Labor Force in Moundridge?
50.5% of People are in the Labor Force in Moundridge.
What is the Unemployment Rate in Moundridge?
Unemployment Rate in Moundridge is 2.2%.