Mohave Valley, AZ Map & Demographics
Mohave Valley Map
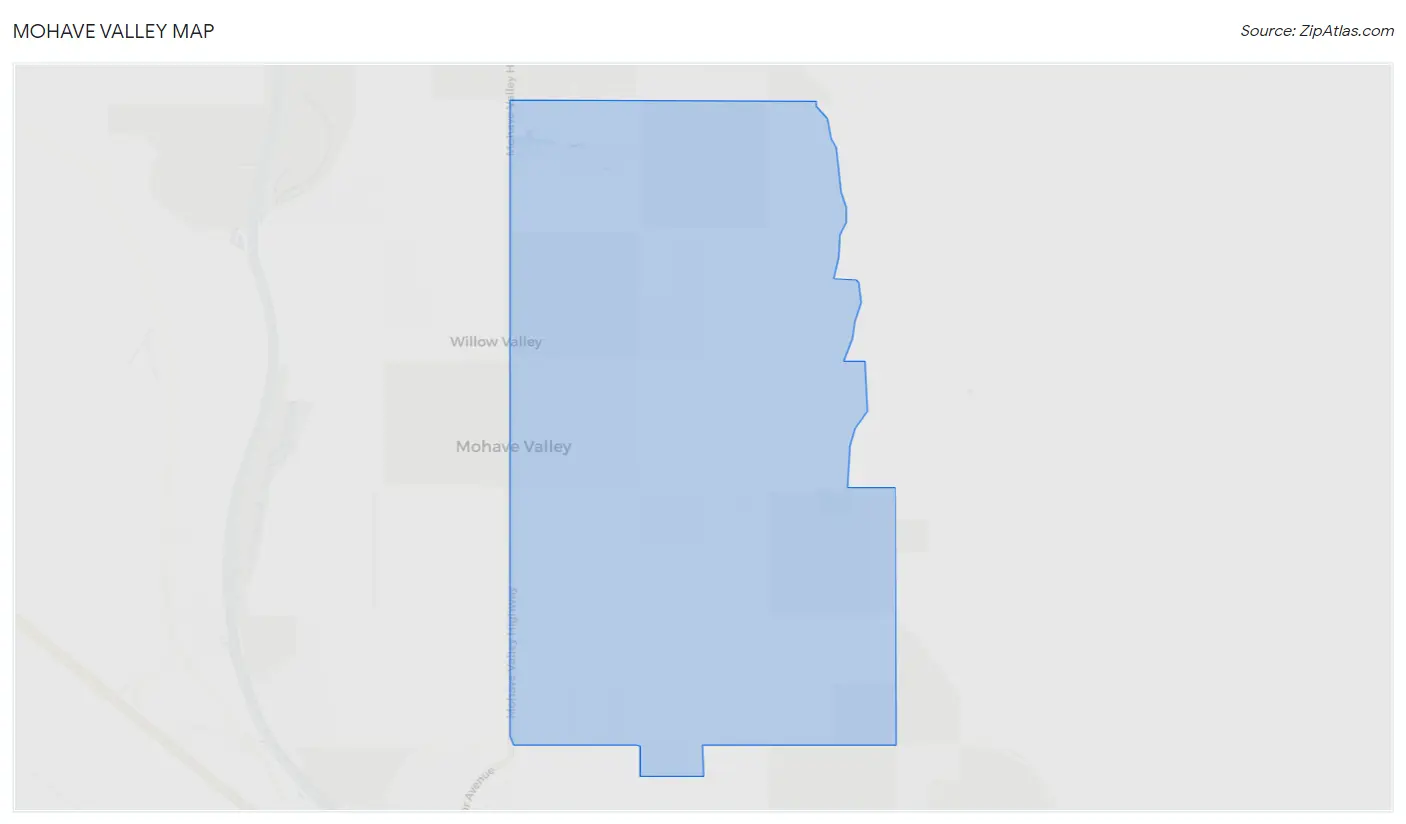
Mohave Valley Overview
$34,906
PER CAPITA INCOME
$75,156
AVG FAMILY INCOME
$69,313
AVG HOUSEHOLD INCOME
23.0%
WAGE / INCOME GAP [ % ]
77.0¢/ $1
WAGE / INCOME GAP [ $ ]
0.36
INEQUALITY / GINI INDEX
2,724
TOTAL POPULATION
1,568
MALE POPULATION
1,156
FEMALE POPULATION
135.64
MALES / 100 FEMALES
73.72
FEMALES / 100 MALES
38.9
MEDIAN AGE
2.8
AVG FAMILY SIZE
2.3
AVG HOUSEHOLD SIZE
1,163
LABOR FORCE [ PEOPLE ]
56.0%
PERCENT IN LABOR FORCE
4.8%
UNEMPLOYMENT RATE
Mohave Valley Zip Codes
Mohave Valley Area Codes
Income in Mohave Valley
Income Overview in Mohave Valley
Per Capita Income in Mohave Valley is $34,906, while median incomes of families and households are $75,156 and $69,313 respectively.
| Characteristic | Number | Measure |
| Per Capita Income | 2,724 | $34,906 |
| Median Family Income | 745 | $75,156 |
| Mean Family Income | 745 | $88,728 |
| Median Household Income | 1,186 | $69,313 |
| Mean Household Income | 1,186 | $80,218 |
| Income Deficit | 745 | $0 |
| Wage / Income Gap (%) | 2,724 | 22.95% |
| Wage / Income Gap ($) | 2,724 | 77.05¢ per $1 |
| Gini / Inequality Index | 2,724 | 0.36 |
Earnings by Sex in Mohave Valley
Average Earnings in Mohave Valley are $48,224, $49,589 for men and $38,208 for women, a difference of 23.0%.
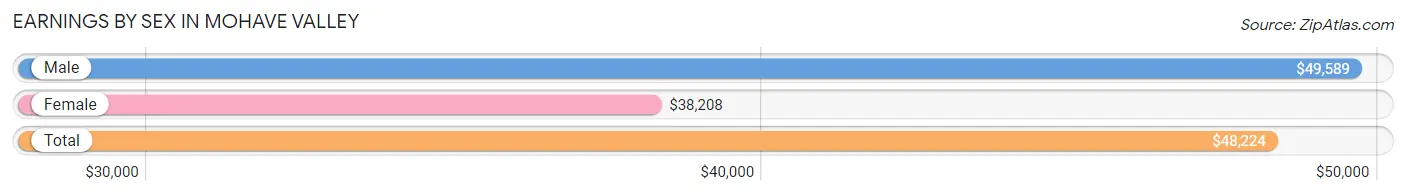
| Sex | Number | Average Earnings |
| Male | 815 (67.6%) | $49,589 |
| Female | 390 (32.4%) | $38,208 |
| Total | 1,205 (100.0%) | $48,224 |
Earnings by Sex by Income Bracket in Mohave Valley
The most common earnings brackets in Mohave Valley are $100,000+ for men (248 | 30.4%) and $30,000 to $34,999 for women (55 | 14.1%).
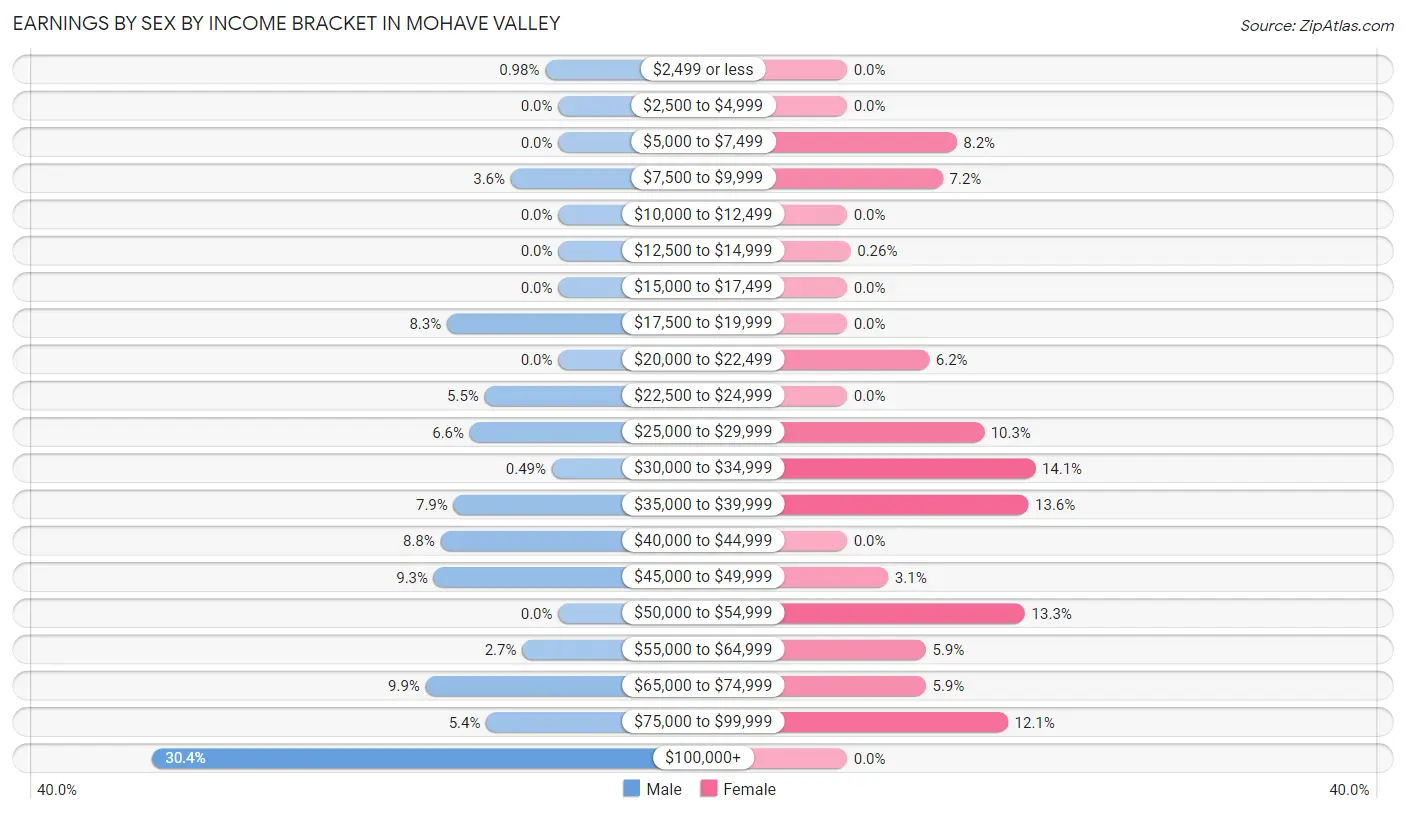
| Income | Male | Female |
| $2,499 or less | 8 (1.0%) | 0 (0.0%) |
| $2,500 to $4,999 | 0 (0.0%) | 0 (0.0%) |
| $5,000 to $7,499 | 0 (0.0%) | 32 (8.2%) |
| $7,500 to $9,999 | 29 (3.6%) | 28 (7.2%) |
| $10,000 to $12,499 | 0 (0.0%) | 0 (0.0%) |
| $12,500 to $14,999 | 0 (0.0%) | 1 (0.3%) |
| $15,000 to $17,499 | 0 (0.0%) | 0 (0.0%) |
| $17,500 to $19,999 | 68 (8.3%) | 0 (0.0%) |
| $20,000 to $22,499 | 0 (0.0%) | 24 (6.1%) |
| $22,500 to $24,999 | 45 (5.5%) | 0 (0.0%) |
| $25,000 to $29,999 | 54 (6.6%) | 40 (10.3%) |
| $30,000 to $34,999 | 4 (0.5%) | 55 (14.1%) |
| $35,000 to $39,999 | 64 (7.9%) | 53 (13.6%) |
| $40,000 to $44,999 | 72 (8.8%) | 0 (0.0%) |
| $45,000 to $49,999 | 76 (9.3%) | 12 (3.1%) |
| $50,000 to $54,999 | 0 (0.0%) | 52 (13.3%) |
| $55,000 to $64,999 | 22 (2.7%) | 23 (5.9%) |
| $65,000 to $74,999 | 81 (9.9%) | 23 (5.9%) |
| $75,000 to $99,999 | 44 (5.4%) | 47 (12.0%) |
| $100,000+ | 248 (30.4%) | 0 (0.0%) |
| Total | 815 (100.0%) | 390 (100.0%) |
Earnings by Sex by Educational Attainment in Mohave Valley
Average earnings in Mohave Valley are $49,589 for men and $38,208 for women, a difference of 23.0%. Men with an educational attainment of college or associate's degree enjoy the highest average annual earnings of $103,017, while those with less than high school education earn the least with $42,713. Women with an educational attainment of high school diploma earn the most with the average annual earnings of $38,750, while those with college or associate's degree education have the smallest earnings of $33,083.
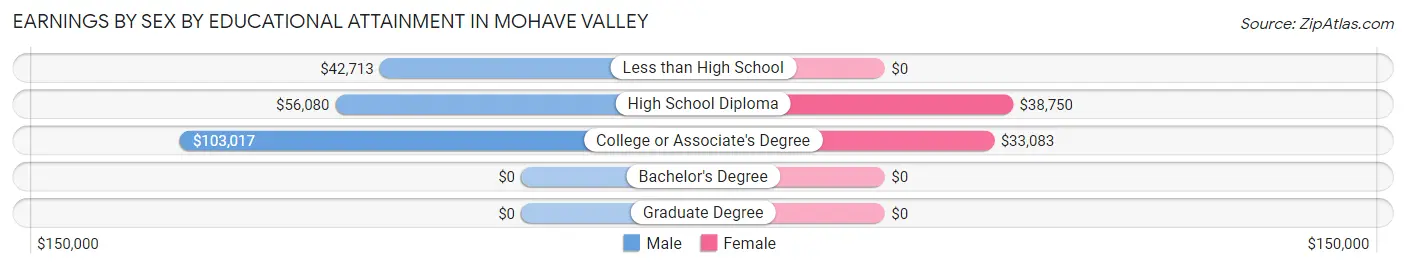
| Educational Attainment | Male Income | Female Income |
| Less than High School | $42,713 | $0 |
| High School Diploma | $56,080 | $38,750 |
| College or Associate's Degree | $103,017 | $33,083 |
| Bachelor's Degree | - | - |
| Graduate Degree | - | - |
| Total | $49,589 | $38,208 |
Family Income in Mohave Valley
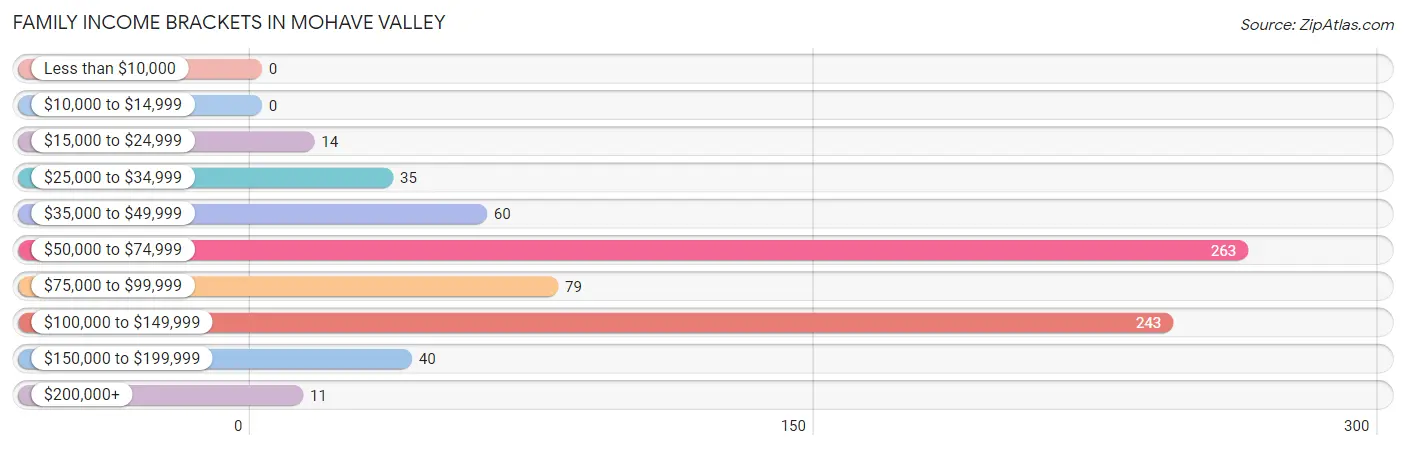
Family Income Brackets in Mohave Valley
According to the Mohave Valley family income data, there are 263 families falling into the $50,000 to $74,999 income range, which is the most common income bracket and makes up 35.3% of all families.
| Income Bracket | # Families | % Families |
| Less than $10,000 | 0 | 0.0% |
| $10,000 to $14,999 | 0 | 0.0% |
| $15,000 to $24,999 | 14 | 1.9% |
| $25,000 to $34,999 | 35 | 4.7% |
| $35,000 to $49,999 | 60 | 8.1% |
| $50,000 to $74,999 | 263 | 35.3% |
| $75,000 to $99,999 | 79 | 10.6% |
| $100,000 to $149,999 | 243 | 32.6% |
| $150,000 to $199,999 | 40 | 5.4% |
| $200,000+ | 11 | 1.5% |
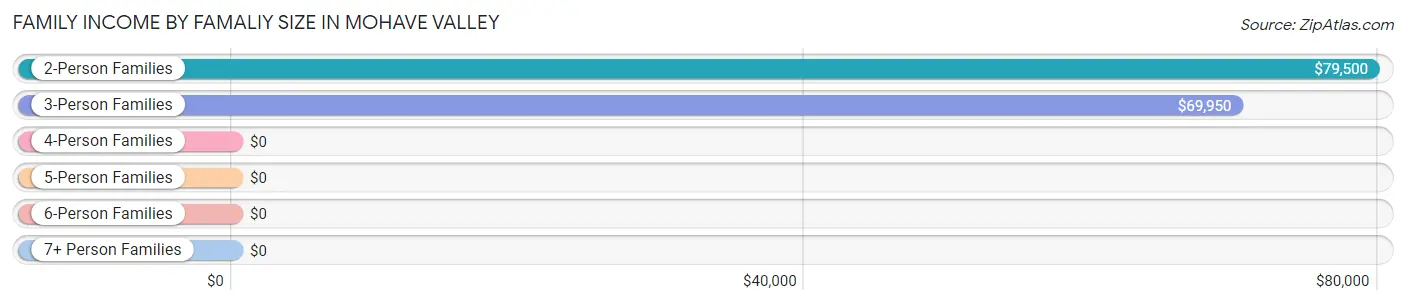
Family Income by Famaliy Size in Mohave Valley
2-person families (274 | 36.8%) account for the highest median family income in Mohave Valley with $79,500 per family, while 2-person families (274 | 36.8%) have the highest median income of $39,750 per family member.
| Income Bracket | # Families | Median Income |
| 2-Person Families | 274 (36.8%) | $79,500 |
| 3-Person Families | 255 (34.2%) | $69,950 |
| 4-Person Families | 200 (26.9%) | $0 |
| 5-Person Families | 16 (2.1%) | $0 |
| 6-Person Families | 0 (0.0%) | $0 |
| 7+ Person Families | 0 (0.0%) | $0 |
| Total | 745 (100.0%) | $75,156 |
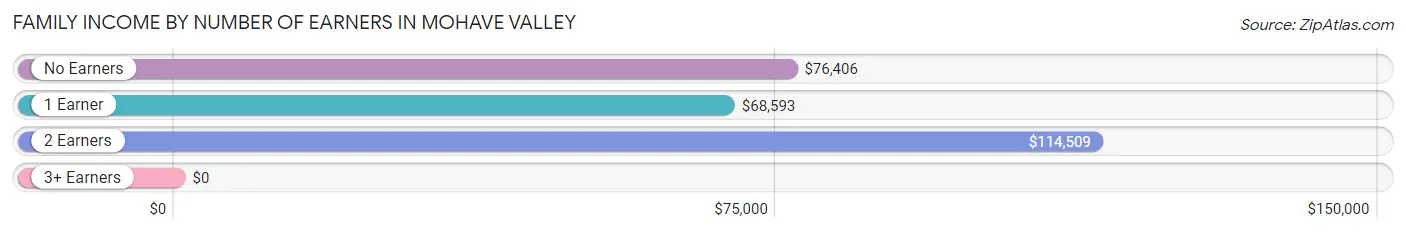
Family Income by Number of Earners in Mohave Valley
| Number of Earners | # Families | Median Income |
| No Earners | 111 (14.9%) | $76,406 |
| 1 Earner | 449 (60.3%) | $68,593 |
| 2 Earners | 185 (24.8%) | $114,509 |
| 3+ Earners | 0 (0.0%) | $0 |
| Total | 745 (100.0%) | $75,156 |
Household Income in Mohave Valley
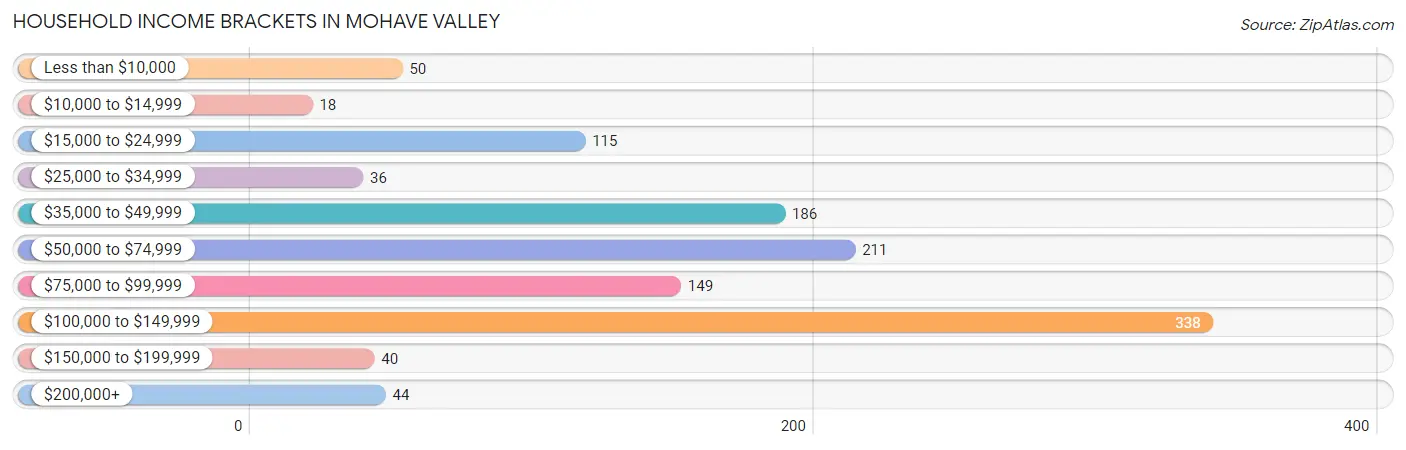
Household Income Brackets in Mohave Valley
With 338 households falling in the category, the $100,000 to $149,999 income range is the most frequent in Mohave Valley, accounting for 28.5% of all households. In contrast, only 18 households (1.5%) fall into the $10,000 to $14,999 income bracket, making it the least populous group.
| Income Bracket | # Households | % Households |
| Less than $10,000 | 50 | 4.2% |
| $10,000 to $14,999 | 18 | 1.5% |
| $15,000 to $24,999 | 115 | 9.7% |
| $25,000 to $34,999 | 36 | 3.0% |
| $35,000 to $49,999 | 186 | 15.7% |
| $50,000 to $74,999 | 211 | 17.8% |
| $75,000 to $99,999 | 149 | 12.6% |
| $100,000 to $149,999 | 338 | 28.5% |
| $150,000 to $199,999 | 40 | 3.4% |
| $200,000+ | 44 | 3.7% |
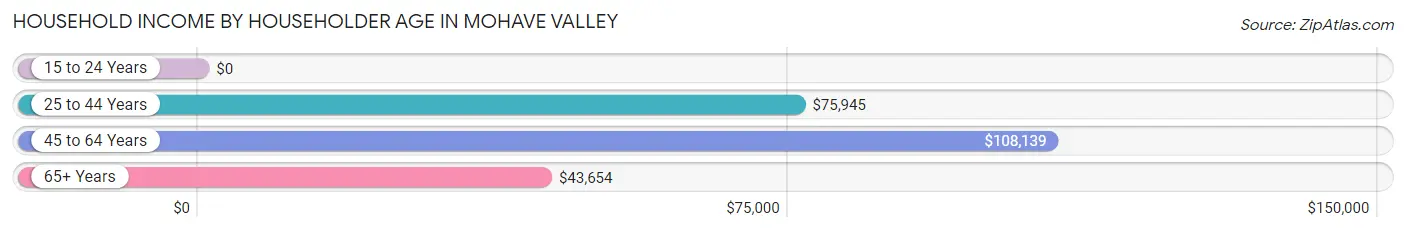
Household Income by Householder Age in Mohave Valley
The median household income in Mohave Valley is $69,313, with the highest median household income of $108,139 found in the 45 to 64 years age bracket for the primary householder. A total of 201 households (17.0%) fall into this category.
| Income Bracket | # Households | Median Income |
| 15 to 24 Years | 0 (0.0%) | $0 |
| 25 to 44 Years | 453 (38.2%) | $75,945 |
| 45 to 64 Years | 201 (17.0%) | $108,139 |
| 65+ Years | 532 (44.9%) | $43,654 |
| Total | 1,186 (100.0%) | $69,313 |
Poverty in Mohave Valley
Income Below Poverty by Sex and Age in Mohave Valley
With 2.9% poverty level for males and 9.8% for females among the residents of Mohave Valley, 55 to 64 year old males and 12 to 14 year old females are the most vulnerable to poverty, with 14 males (15.6%) and 13 females (100.0%) in their respective age groups living below the poverty level.
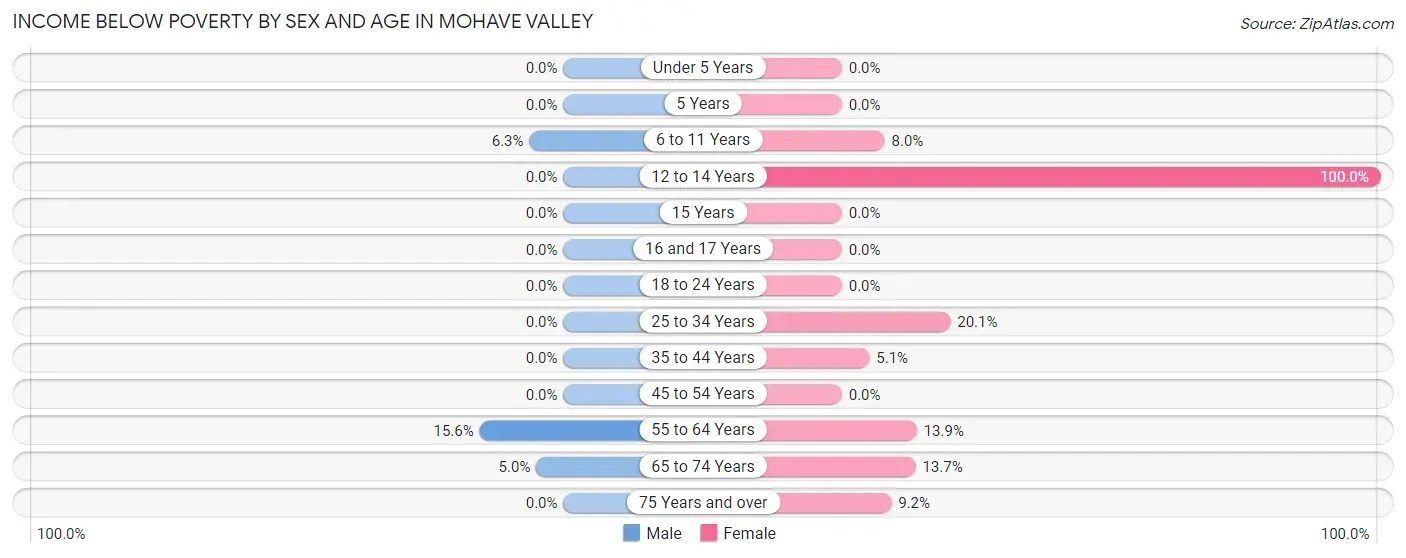
| Age Bracket | Male | Female |
| Under 5 Years | 0 (0.0%) | 0 (0.0%) |
| 5 Years | 0 (0.0%) | 0 (0.0%) |
| 6 to 11 Years | 14 (6.3%) | 12 (8.0%) |
| 12 to 14 Years | 0 (0.0%) | 13 (100.0%) |
| 15 Years | 0 (0.0%) | 0 (0.0%) |
| 16 and 17 Years | 0 (0.0%) | 0 (0.0%) |
| 18 to 24 Years | 0 (0.0%) | 0 (0.0%) |
| 25 to 34 Years | 0 (0.0%) | 28 (20.1%) |
| 35 to 44 Years | 0 (0.0%) | 14 (5.1%) |
| 45 to 54 Years | 0 (0.0%) | 0 (0.0%) |
| 55 to 64 Years | 14 (15.6%) | 16 (13.9%) |
| 65 to 74 Years | 17 (5.0%) | 13 (13.7%) |
| 75 Years and over | 0 (0.0%) | 17 (9.2%) |
| Total | 45 (2.9%) | 113 (9.8%) |
Income Above Poverty by Sex and Age in Mohave Valley
According to the poverty statistics in Mohave Valley, males aged under 5 years and females aged 5 years are the age groups that are most secure financially, with 100.0% of males and 100.0% of females in these age groups living above the poverty line.
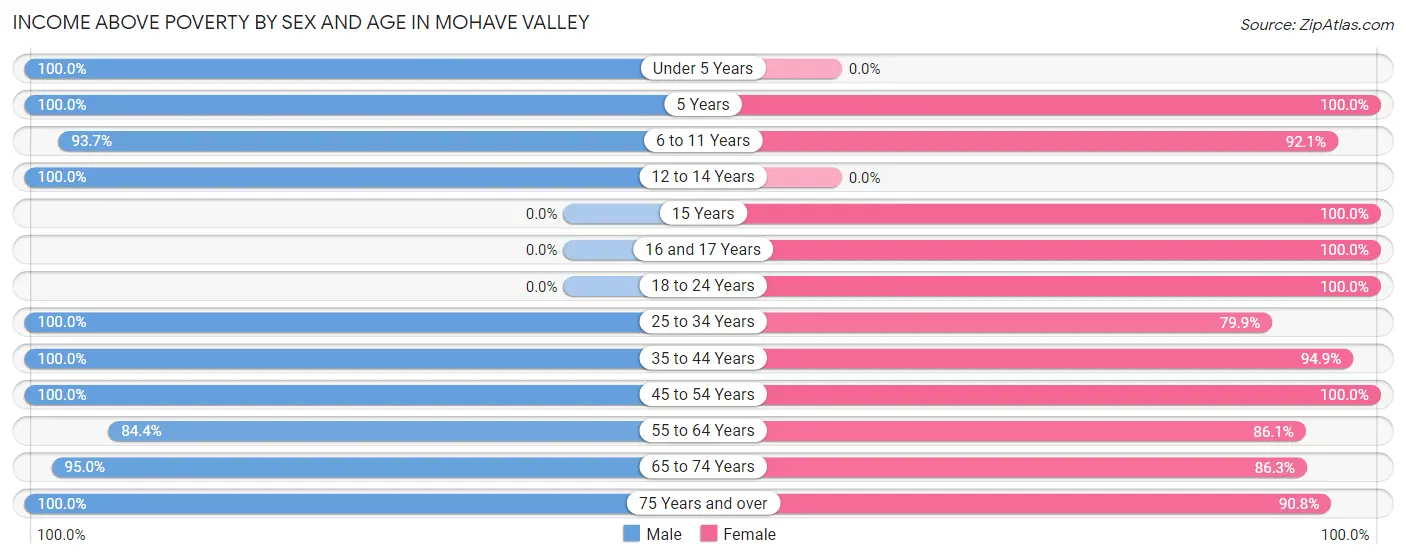
| Age Bracket | Male | Female |
| Under 5 Years | 146 (100.0%) | 0 (0.0%) |
| 5 Years | 70 (100.0%) | 29 (100.0%) |
| 6 to 11 Years | 208 (93.7%) | 139 (92.0%) |
| 12 to 14 Years | 4 (100.0%) | 0 (0.0%) |
| 15 Years | 0 (0.0%) | 12 (100.0%) |
| 16 and 17 Years | 0 (0.0%) | 49 (100.0%) |
| 18 to 24 Years | 0 (0.0%) | 5 (100.0%) |
| 25 to 34 Years | 65 (100.0%) | 111 (79.9%) |
| 35 to 44 Years | 421 (100.0%) | 260 (94.9%) |
| 45 to 54 Years | 52 (100.0%) | 89 (100.0%) |
| 55 to 64 Years | 76 (84.4%) | 99 (86.1%) |
| 65 to 74 Years | 321 (95.0%) | 82 (86.3%) |
| 75 Years and over | 152 (100.0%) | 168 (90.8%) |
| Total | 1,515 (97.1%) | 1,043 (90.2%) |
Income Below Poverty Among Married-Couple Families in Mohave Valley
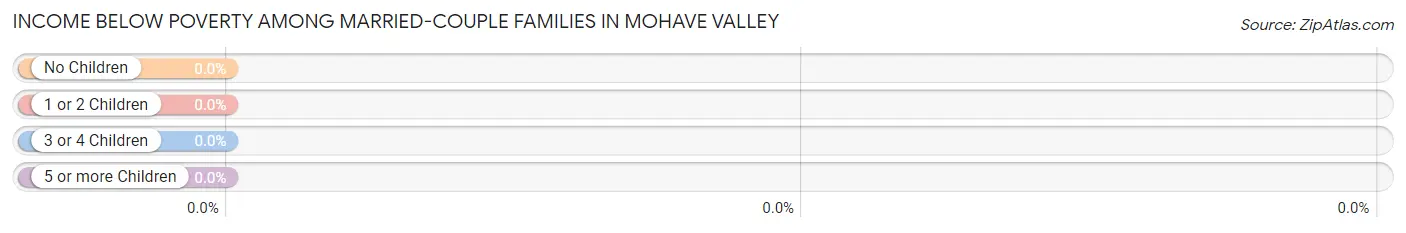
| Children | Above Poverty | Below Poverty |
| No Children | 206 (100.0%) | 0 (0.0%) |
| 1 or 2 Children | 285 (100.0%) | 0 (0.0%) |
| 3 or 4 Children | 16 (100.0%) | 0 (0.0%) |
| 5 or more Children | 0 (0.0%) | 0 (0.0%) |
| Total | 507 (100.0%) | 0 (0.0%) |
Income Below Poverty Among Single-Parent Households in Mohave Valley
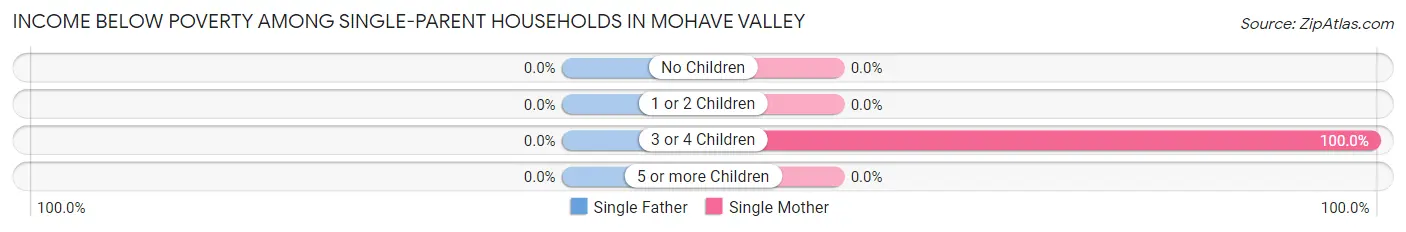
| Children | Single Father | Single Mother |
| No Children | 0 (0.0%) | 0 (0.0%) |
| 1 or 2 Children | 0 (0.0%) | 0 (0.0%) |
| 3 or 4 Children | 0 (0.0%) | 14 (100.0%) |
| 5 or more Children | 0 (0.0%) | 0 (0.0%) |
| Total | 0 (0.0%) | 14 (10.9%) |
Income Below Poverty Among Married-Couple vs Single-Parent Households in Mohave Valley
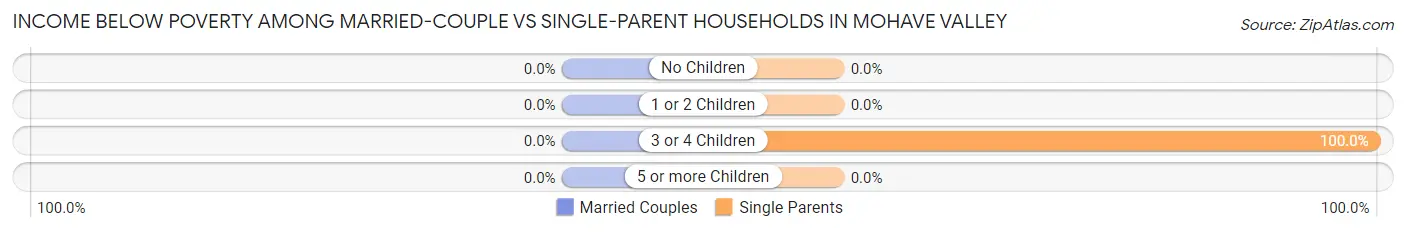
| Children | Married-Couple Families | Single-Parent Households |
| No Children | 0 (0.0%) | 0 (0.0%) |
| 1 or 2 Children | 0 (0.0%) | 0 (0.0%) |
| 3 or 4 Children | 0 (0.0%) | 14 (100.0%) |
| 5 or more Children | 0 (0.0%) | 0 (0.0%) |
| Total | 0 (0.0%) | 14 (5.9%) |
Race in Mohave Valley
The most populous races in Mohave Valley are White / Caucasian (2,247 | 82.5%), Hispanic or Latino (439 | 16.1%), and Two or more Races (329 | 12.1%).
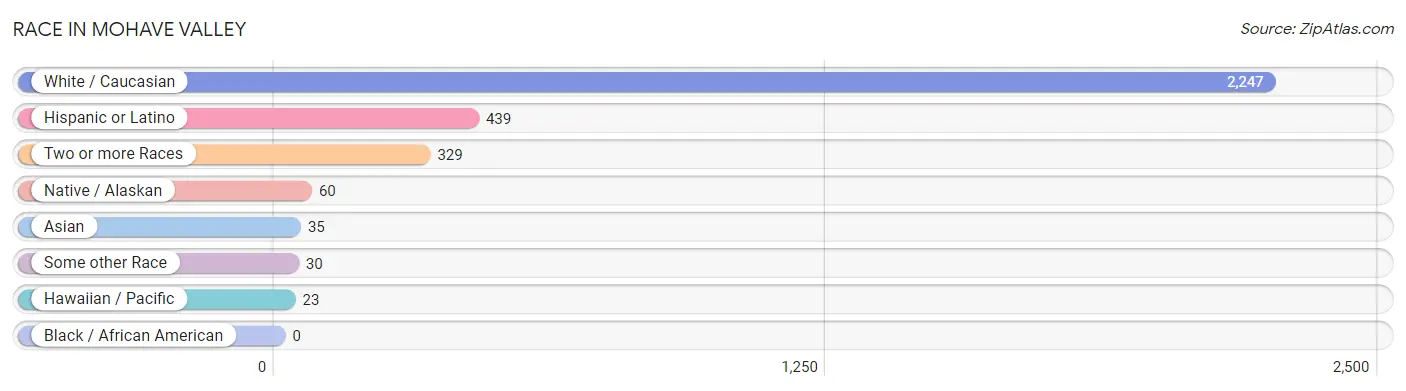
| Race | # Population | % Population |
| Asian | 35 | 1.3% |
| Black / African American | 0 | 0.0% |
| Hawaiian / Pacific | 23 | 0.8% |
| Hispanic or Latino | 439 | 16.1% |
| Native / Alaskan | 60 | 2.2% |
| White / Caucasian | 2,247 | 82.5% |
| Two or more Races | 329 | 12.1% |
| Some other Race | 30 | 1.1% |
| Total | 2,724 | 100.0% |
Ancestry in Mohave Valley
The most populous ancestries reported in Mohave Valley are German (346 | 12.7%), Mexican (259 | 9.5%), Irish (216 | 7.9%), American (207 | 7.6%), and European (171 | 6.3%), together accounting for 44.0% of all Mohave Valley residents.
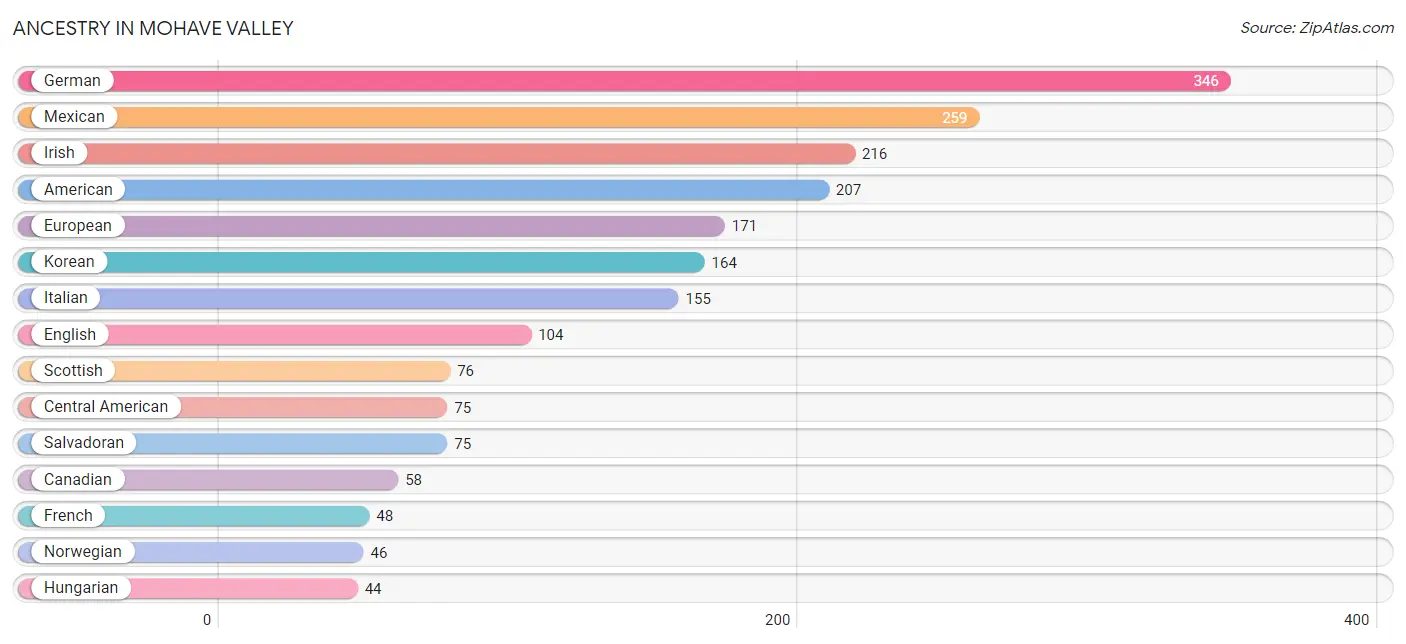
| Ancestry | # Population | % Population |
| Alaska Native | 2 | 0.1% |
| American | 207 | 7.6% |
| British | 25 | 0.9% |
| Canadian | 58 | 2.1% |
| Central American | 75 | 2.8% |
| Dutch | 7 | 0.3% |
| English | 104 | 3.8% |
| European | 171 | 6.3% |
| French | 48 | 1.8% |
| French Canadian | 18 | 0.7% |
| German | 346 | 12.7% |
| Guamanian / Chamorro | 23 | 0.8% |
| Hungarian | 44 | 1.6% |
| Irish | 216 | 7.9% |
| Italian | 155 | 5.7% |
| Korean | 164 | 6.0% |
| Mexican | 259 | 9.5% |
| Norwegian | 46 | 1.7% |
| Polish | 8 | 0.3% |
| Portuguese | 16 | 0.6% |
| Puerto Rican | 41 | 1.5% |
| Russian | 17 | 0.6% |
| Salvadoran | 75 | 2.8% |
| Scotch-Irish | 15 | 0.5% |
| Scottish | 76 | 2.8% |
| Slovak | 2 | 0.1% |
| Slovene | 33 | 1.2% |
| Spanish | 22 | 0.8% |
| Yuman | 26 | 0.9% | View All 29 Rows |
Immigrants in Mohave Valley
The most numerous immigrant groups reported in Mohave Valley came from Europe (38 | 1.4%), Asia (35 | 1.3%), Philippines (35 | 1.3%), South Eastern Asia (35 | 1.3%), and Central America (30 | 1.1%), together accounting for 6.3% of all Mohave Valley residents.
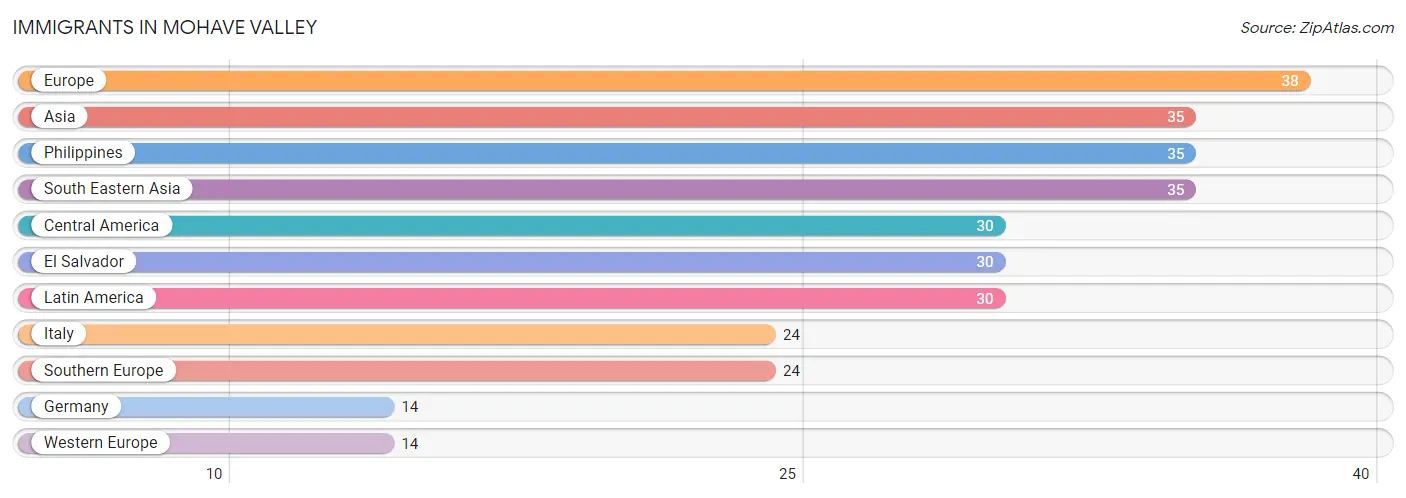
| Immigration Origin | # Population | % Population |
| Asia | 35 | 1.3% |
| Central America | 30 | 1.1% |
| El Salvador | 30 | 1.1% |
| Europe | 38 | 1.4% |
| Germany | 14 | 0.5% |
| Italy | 24 | 0.9% |
| Latin America | 30 | 1.1% |
| Philippines | 35 | 1.3% |
| South Eastern Asia | 35 | 1.3% |
| Southern Europe | 24 | 0.9% |
| Western Europe | 14 | 0.5% | View All 11 Rows |
Sex and Age in Mohave Valley
Sex and Age in Mohave Valley
The most populous age groups in Mohave Valley are 35 to 39 Years (373 | 23.8%) for men and 35 to 39 Years (260 | 22.5%) for women.
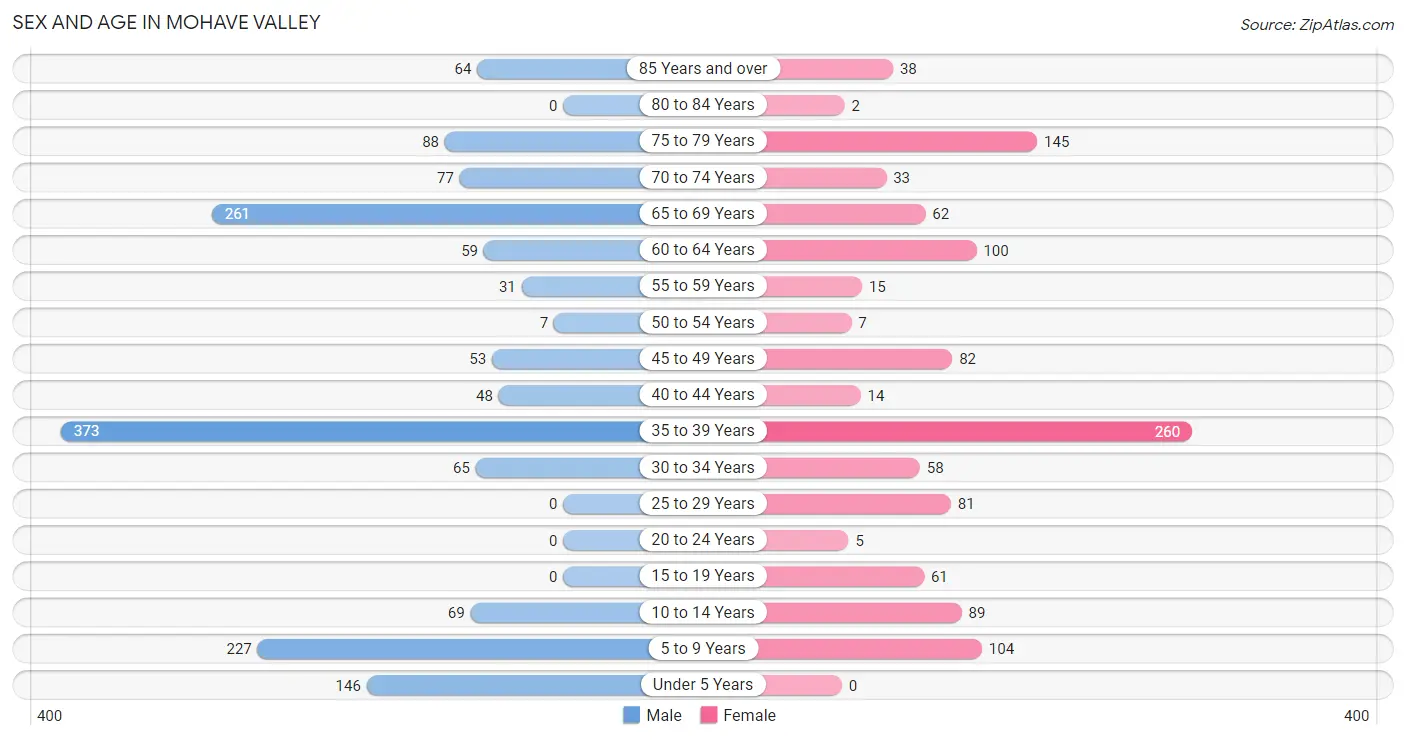
| Age Bracket | Male | Female |
| Under 5 Years | 146 (9.3%) | 0 (0.0%) |
| 5 to 9 Years | 227 (14.5%) | 104 (9.0%) |
| 10 to 14 Years | 69 (4.4%) | 89 (7.7%) |
| 15 to 19 Years | 0 (0.0%) | 61 (5.3%) |
| 20 to 24 Years | 0 (0.0%) | 5 (0.4%) |
| 25 to 29 Years | 0 (0.0%) | 81 (7.0%) |
| 30 to 34 Years | 65 (4.2%) | 58 (5.0%) |
| 35 to 39 Years | 373 (23.8%) | 260 (22.5%) |
| 40 to 44 Years | 48 (3.1%) | 14 (1.2%) |
| 45 to 49 Years | 53 (3.4%) | 82 (7.1%) |
| 50 to 54 Years | 7 (0.4%) | 7 (0.6%) |
| 55 to 59 Years | 31 (2.0%) | 15 (1.3%) |
| 60 to 64 Years | 59 (3.8%) | 100 (8.6%) |
| 65 to 69 Years | 261 (16.7%) | 62 (5.4%) |
| 70 to 74 Years | 77 (4.9%) | 33 (2.9%) |
| 75 to 79 Years | 88 (5.6%) | 145 (12.5%) |
| 80 to 84 Years | 0 (0.0%) | 2 (0.2%) |
| 85 Years and over | 64 (4.1%) | 38 (3.3%) |
| Total | 1,568 (100.0%) | 1,156 (100.0%) |
Families and Households in Mohave Valley
Median Family Size in Mohave Valley
The median family size in Mohave Valley is 2.83 persons per family, with married-couple families (507 | 68.0%) accounting for the largest median family size of 3 persons per family. On the other hand, single male/father families (110 | 14.8%) represent the smallest median family size with 2.24 persons per family.
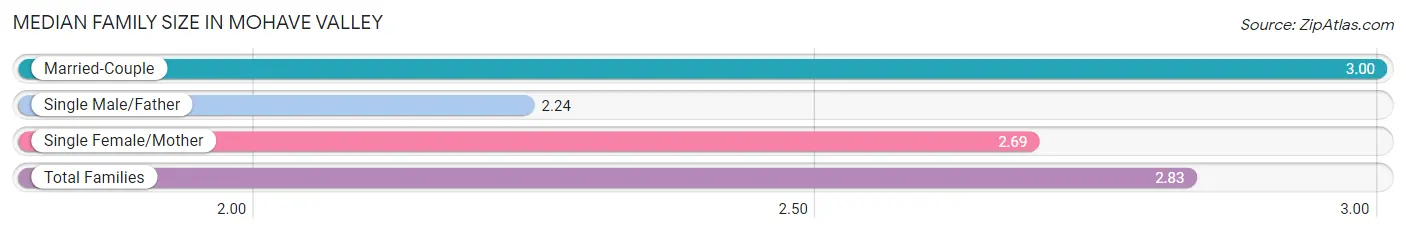
| Family Type | # Families | Family Size |
| Married-Couple | 507 (68.0%) | 3.00 |
| Single Male/Father | 110 (14.8%) | 2.24 |
| Single Female/Mother | 128 (17.2%) | 2.69 |
| Total Families | 745 (100.0%) | 2.83 |
Median Household Size in Mohave Valley
The median household size in Mohave Valley is 2.29 persons per household, with single female/mother households (128 | 10.8%) accounting for the largest median household size of 3.47 persons per household. non-family households (441 | 37.2%) represent the smallest median household size with 1.07 persons per household.
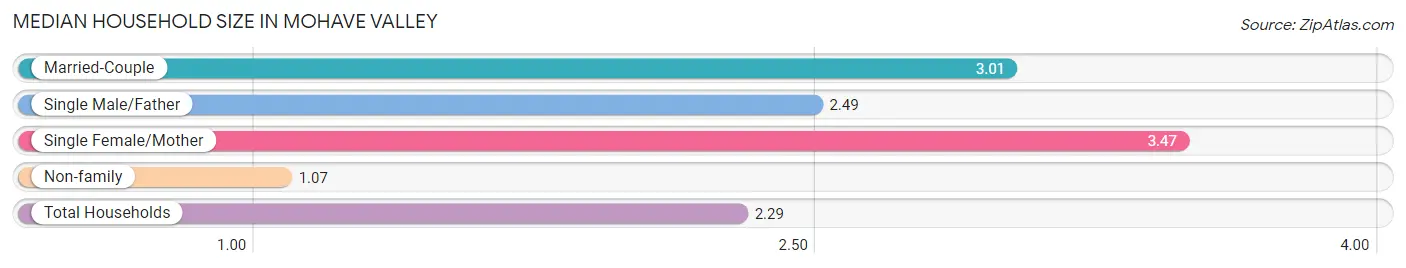
| Household Type | # Households | Household Size |
| Married-Couple | 507 (42.7%) | 3.01 |
| Single Male/Father | 110 (9.3%) | 2.49 |
| Single Female/Mother | 128 (10.8%) | 3.47 |
| Non-family | 441 (37.2%) | 1.07 |
| Total Households | 1,186 (100.0%) | 2.29 |
Household Size by Marriage Status in Mohave Valley
Out of a total of 1,186 households in Mohave Valley, 745 (62.8%) are family households, while 441 (37.2%) are nonfamily households. The most numerous type of family households are 3-person households, comprising 277, and the most common type of nonfamily households are 1-person households, comprising 397.
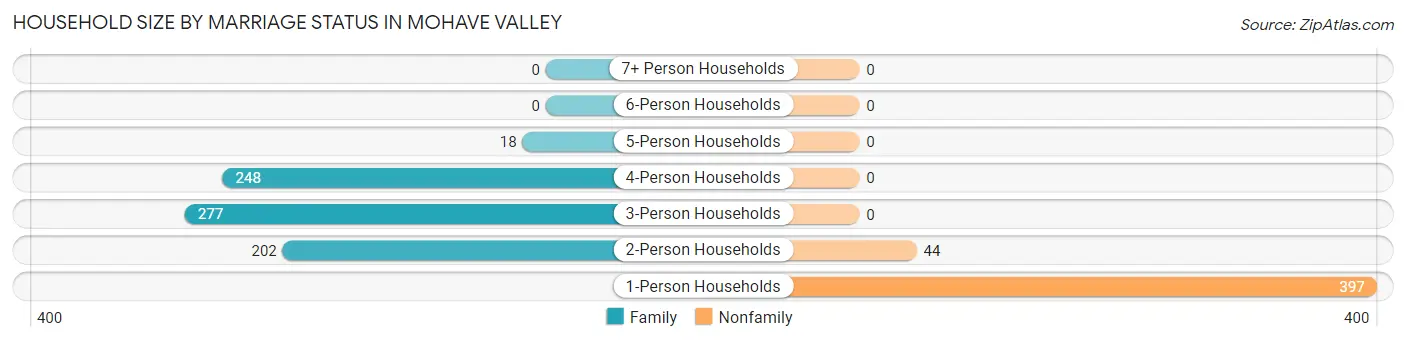
| Household Size | Family Households | Nonfamily Households |
| 1-Person Households | - | 397 (33.5%) |
| 2-Person Households | 202 (17.0%) | 44 (3.7%) |
| 3-Person Households | 277 (23.4%) | 0 (0.0%) |
| 4-Person Households | 248 (20.9%) | 0 (0.0%) |
| 5-Person Households | 18 (1.5%) | 0 (0.0%) |
| 6-Person Households | 0 (0.0%) | 0 (0.0%) |
| 7+ Person Households | 0 (0.0%) | 0 (0.0%) |
| Total | 745 (62.8%) | 441 (37.2%) |
Female Fertility in Mohave Valley
Fertility by Age in Mohave Valley
Average fertility rate in Mohave Valley is 9.0 births per 1,000 women. Women in the age bracket of 20 to 34 years have the highest fertility rate with 35.0 births per 1,000 women. Women in the age bracket of 20 to 34 years acount for 100.0% of all women with births.
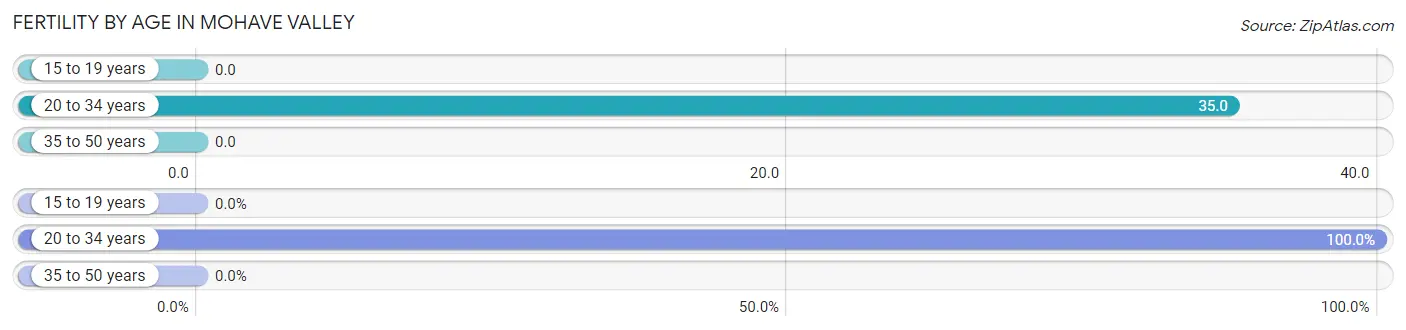
| Age Bracket | Women with Births | Births / 1,000 Women |
| 15 to 19 years | 0 (0.0%) | 0.0 |
| 20 to 34 years | 5 (100.0%) | 35.0 |
| 35 to 50 years | 0 (0.0%) | 0.0 |
| Total | 5 (100.0%) | 9.0 |
Fertility by Age by Marriage Status in Mohave Valley
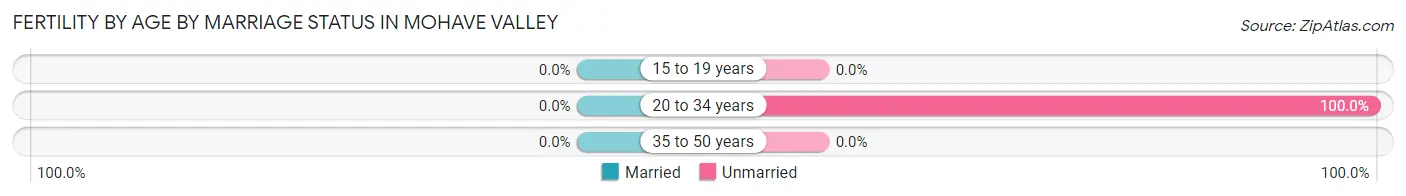
| Age Bracket | Married | Unmarried |
| 15 to 19 years | 0 (0.0%) | 0 (0.0%) |
| 20 to 34 years | 0 (0.0%) | 5 (100.0%) |
| 35 to 50 years | 0 (0.0%) | 0 (0.0%) |
| Total | 0 (0.0%) | 5 (100.0%) |
Fertility by Education in Mohave Valley
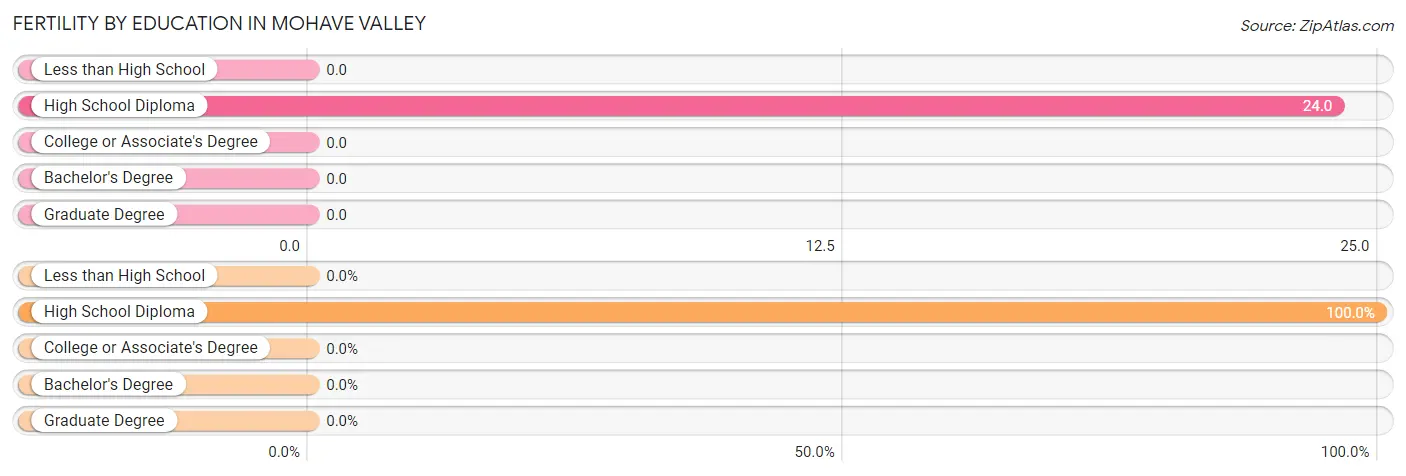
| Educational Attainment | Women with Births | Births / 1,000 Women |
| Less than High School | 0 (0.0%) | 0.0 |
| High School Diploma | 5 (100.0%) | 24.0 |
| College or Associate's Degree | 0 (0.0%) | 0.0 |
| Bachelor's Degree | 0 (0.0%) | 0.0 |
| Graduate Degree | 0 (0.0%) | 0.0 |
| Total | 5 (100.0%) | 9.0 |
Fertility by Education by Marriage Status in Mohave Valley
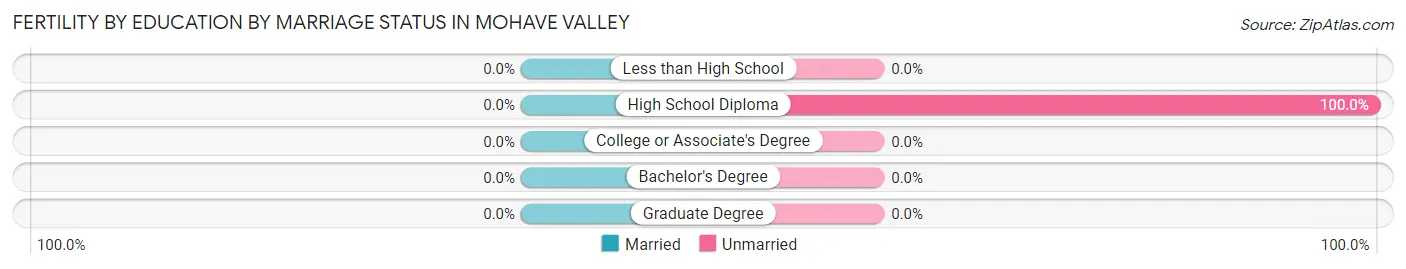
| Educational Attainment | Married | Unmarried |
| Less than High School | 0 (0.0%) | 0 (0.0%) |
| High School Diploma | 0 (0.0%) | 5 (100.0%) |
| College or Associate's Degree | 0 (0.0%) | 0 (0.0%) |
| Bachelor's Degree | 0 (0.0%) | 0 (0.0%) |
| Graduate Degree | 0 (0.0%) | 0 (0.0%) |
| Total | 0 (0.0%) | 5 (100.0%) |
Employment Characteristics in Mohave Valley
Employment by Class of Employer in Mohave Valley
Among the 1,108 employed individuals in Mohave Valley, private company employees (587 | 53.0%), local government employees (241 | 21.7%), and not-for-profit organizations (129 | 11.6%) make up the most common classes of employment.
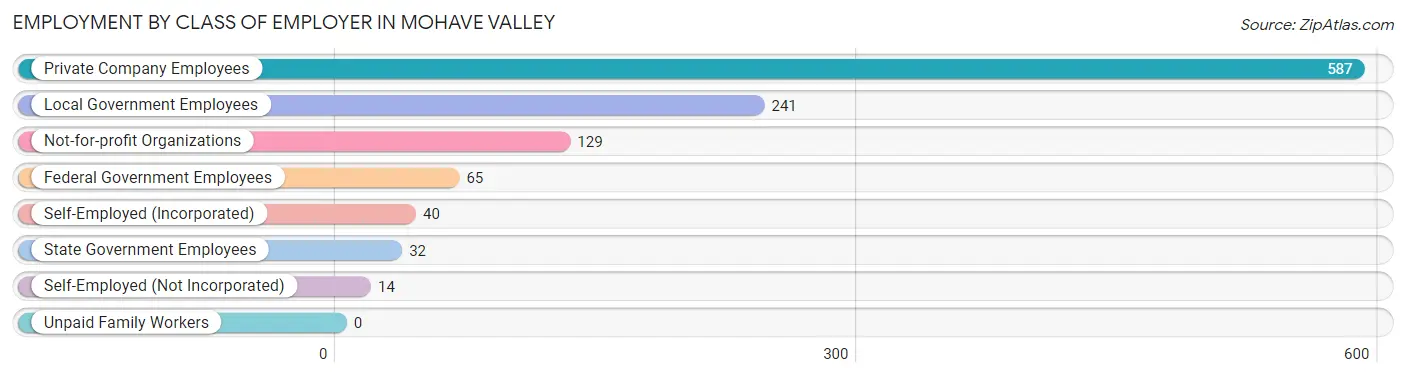
| Employer Class | # Employees | % Employees |
| Private Company Employees | 587 | 53.0% |
| Self-Employed (Incorporated) | 40 | 3.6% |
| Self-Employed (Not Incorporated) | 14 | 1.3% |
| Not-for-profit Organizations | 129 | 11.6% |
| Local Government Employees | 241 | 21.7% |
| State Government Employees | 32 | 2.9% |
| Federal Government Employees | 65 | 5.9% |
| Unpaid Family Workers | 0 | 0.0% |
| Total | 1,108 | 100.0% |
Employment Status by Age in Mohave Valley
According to the labor force statistics for Mohave Valley, out of the total population over 16 years of age (2,077), 56.0% or 1,163 individuals are in the labor force, with 4.8% or 56 of them unemployed. The age group with the highest labor force participation rate is 25 to 29 years, with 100.0% or 81 individuals in the labor force. Within the labor force, the 30 to 34 years age range has the highest percentage of unemployed individuals, with 27.8% or 25 of them being unemployed.
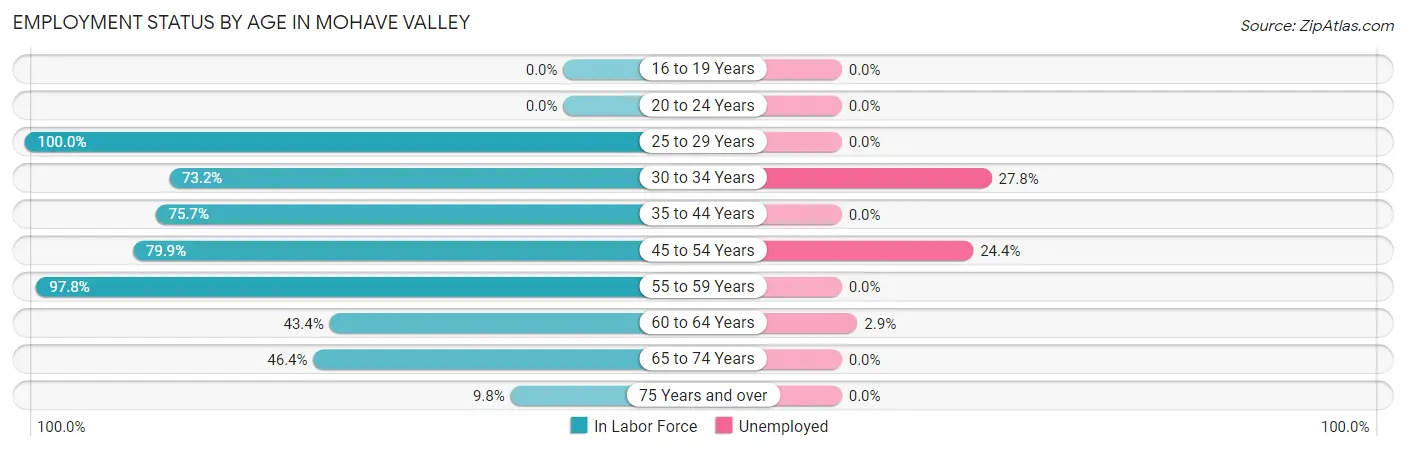
| Age Bracket | In Labor Force | Unemployed |
| 16 to 19 Years | 0 (0.0%) | 0 (0.0%) |
| 20 to 24 Years | 0 (0.0%) | 0 (0.0%) |
| 25 to 29 Years | 81 (100.0%) | 0 (0.0%) |
| 30 to 34 Years | 90 (73.2%) | 25 (27.8%) |
| 35 to 44 Years | 526 (75.7%) | 0 (0.0%) |
| 45 to 54 Years | 119 (79.9%) | 29 (24.4%) |
| 55 to 59 Years | 45 (97.8%) | 0 (0.0%) |
| 60 to 64 Years | 69 (43.4%) | 2 (2.9%) |
| 65 to 74 Years | 201 (46.4%) | 0 (0.0%) |
| 75 Years and over | 33 (9.8%) | 0 (0.0%) |
| Total | 1,163 (56.0%) | 56 (4.8%) |
Employment Status by Educational Attainment in Mohave Valley
According to labor force statistics for Mohave Valley, 74.2% of individuals (930) out of the total population between 25 and 64 years of age (1,253) are in the labor force, with 6.0% or 56 of them being unemployed. The group with the highest labor force participation rate are those with the educational attainment of bachelor's degree or higher, with 100.0% or 89 individuals in the labor force. Within the labor force, individuals with less than high school education have the highest percentage of unemployment, with 37.9% or 25 of them being unemployed.
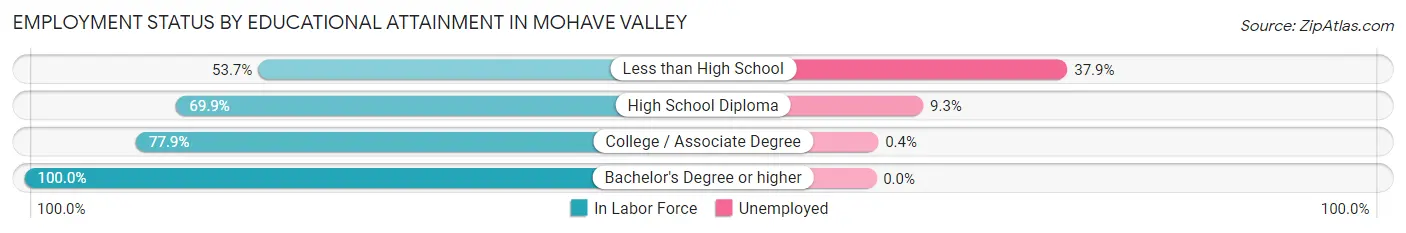
| Educational Attainment | In Labor Force | Unemployed |
| Less than High School | 66 (53.7%) | 47 (37.9%) |
| High School Diploma | 311 (69.9%) | 41 (9.3%) |
| College / Associate Degree | 464 (77.9%) | 2 (0.4%) |
| Bachelor's Degree or higher | 89 (100.0%) | 0 (0.0%) |
| Total | 930 (74.2%) | 75 (6.0%) |
Employment Occupations by Sex in Mohave Valley
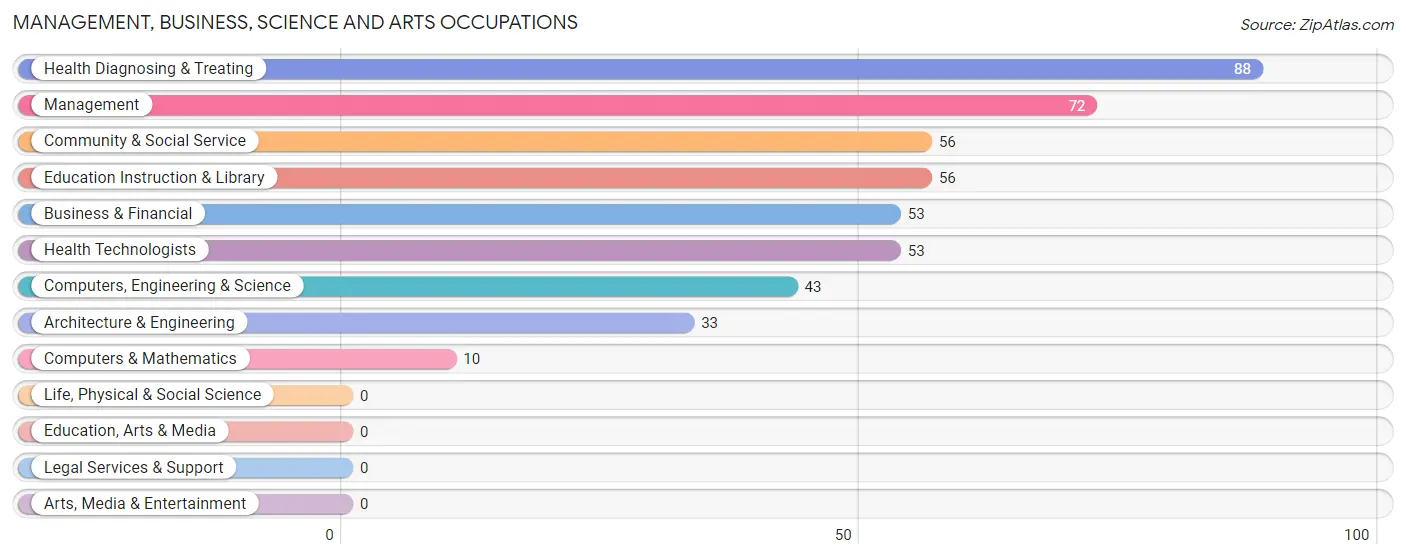
Management, Business, Science and Arts Occupations
The most common Management, Business, Science and Arts occupations in Mohave Valley are Health Diagnosing & Treating (88 | 7.9%), Management (72 | 6.5%), Community & Social Service (56 | 5.1%), Education Instruction & Library (56 | 5.1%), and Business & Financial (53 | 4.8%).
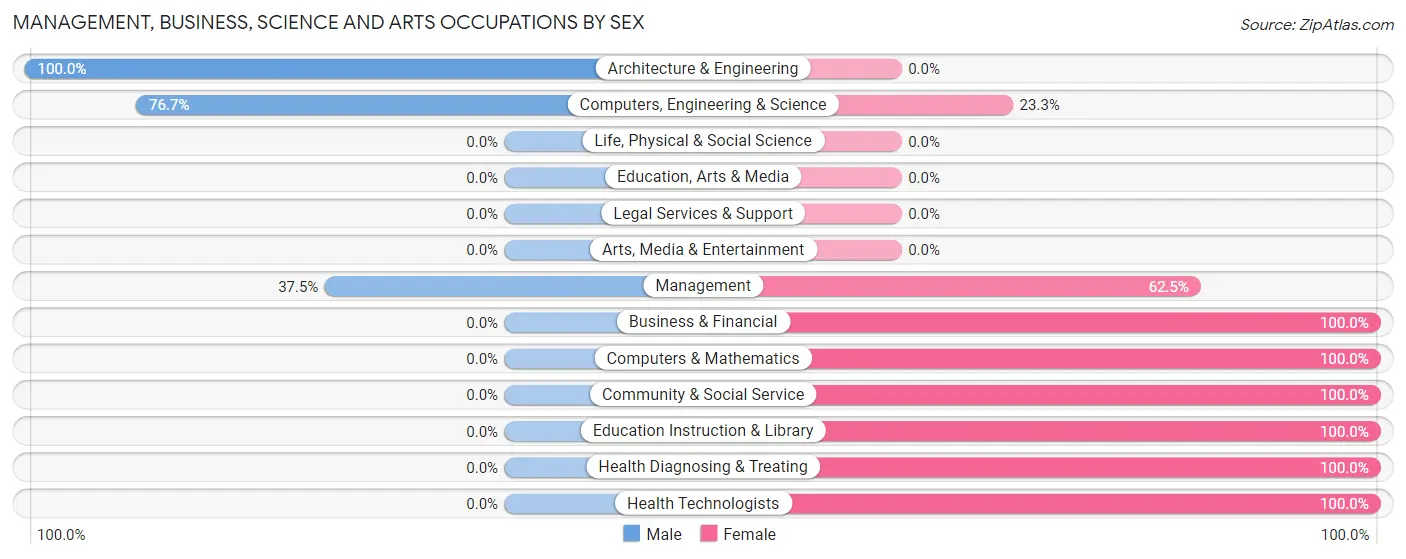
Management, Business, Science and Arts Occupations by Sex
Within the Management, Business, Science and Arts occupations in Mohave Valley, the most male-oriented occupations are Architecture & Engineering (100.0%), Computers, Engineering & Science (76.7%), and Management (37.5%), while the most female-oriented occupations are Business & Financial (100.0%), Computers & Mathematics (100.0%), and Community & Social Service (100.0%).
| Occupation | Male | Female |
| Management | 27 (37.5%) | 45 (62.5%) |
| Business & Financial | 0 (0.0%) | 53 (100.0%) |
| Computers, Engineering & Science | 33 (76.7%) | 10 (23.3%) |
| Computers & Mathematics | 0 (0.0%) | 10 (100.0%) |
| Architecture & Engineering | 33 (100.0%) | 0 (0.0%) |
| Life, Physical & Social Science | 0 (0.0%) | 0 (0.0%) |
| Community & Social Service | 0 (0.0%) | 56 (100.0%) |
| Education, Arts & Media | 0 (0.0%) | 0 (0.0%) |
| Legal Services & Support | 0 (0.0%) | 0 (0.0%) |
| Education Instruction & Library | 0 (0.0%) | 56 (100.0%) |
| Arts, Media & Entertainment | 0 (0.0%) | 0 (0.0%) |
| Health Diagnosing & Treating | 0 (0.0%) | 88 (100.0%) |
| Health Technologists | 0 (0.0%) | 53 (100.0%) |
| Total (Category) | 60 (19.2%) | 252 (80.8%) |
| Total (Overall) | 731 (66.0%) | 377 (34.0%) |
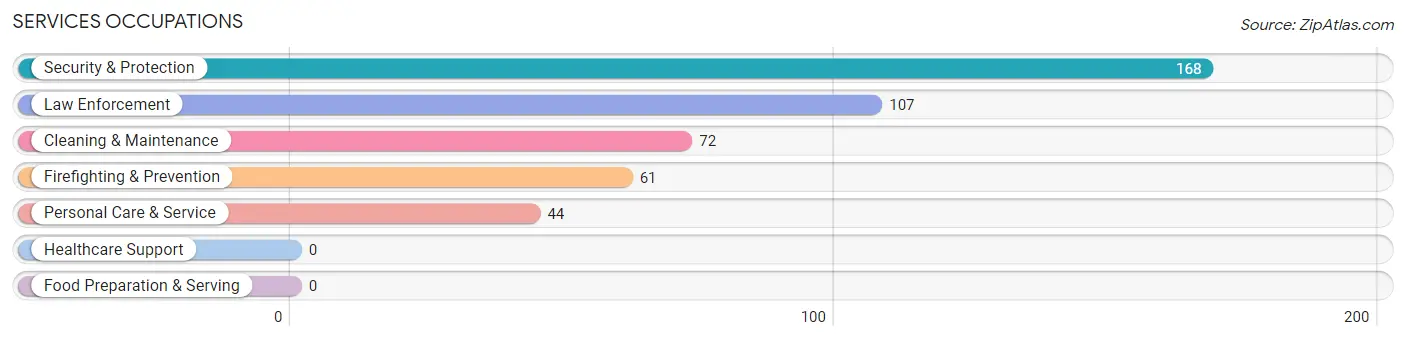
Services Occupations
The most common Services occupations in Mohave Valley are Security & Protection (168 | 15.2%), Law Enforcement (107 | 9.7%), Cleaning & Maintenance (72 | 6.5%), Firefighting & Prevention (61 | 5.5%), and Personal Care & Service (44 | 4.0%).
Services Occupations by Sex
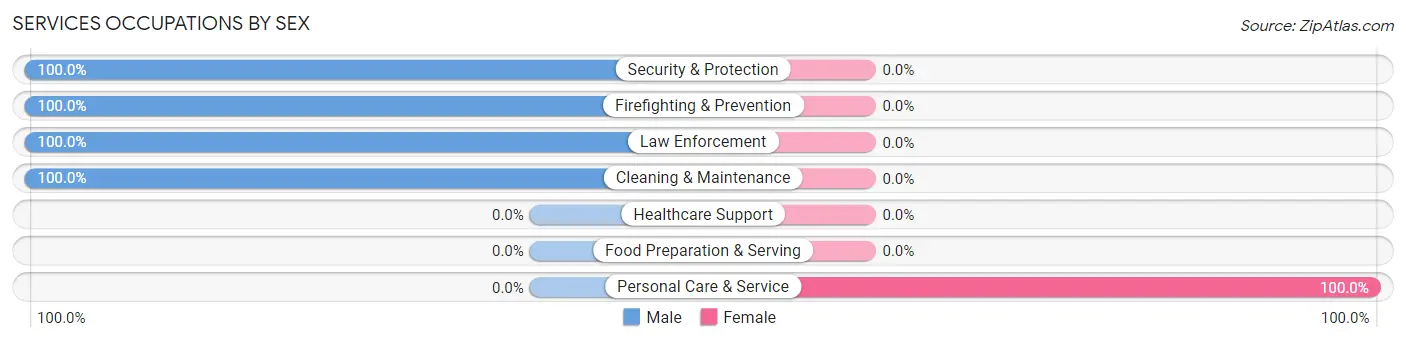
| Occupation | Male | Female |
| Healthcare Support | 0 (0.0%) | 0 (0.0%) |
| Security & Protection | 168 (100.0%) | 0 (0.0%) |
| Firefighting & Prevention | 61 (100.0%) | 0 (0.0%) |
| Law Enforcement | 107 (100.0%) | 0 (0.0%) |
| Food Preparation & Serving | 0 (0.0%) | 0 (0.0%) |
| Cleaning & Maintenance | 72 (100.0%) | 0 (0.0%) |
| Personal Care & Service | 0 (0.0%) | 44 (100.0%) |
| Total (Category) | 240 (84.5%) | 44 (15.5%) |
| Total (Overall) | 731 (66.0%) | 377 (34.0%) |
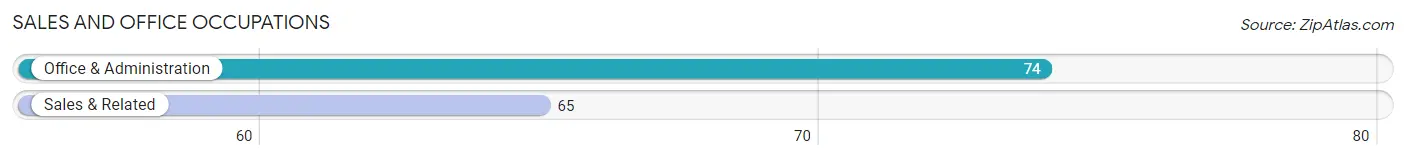
Sales and Office Occupations
The most common Sales and Office occupations in Mohave Valley are Office & Administration (74 | 6.7%), and Sales & Related (65 | 5.9%).
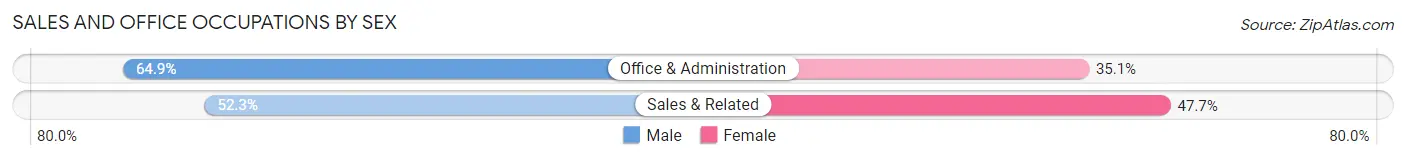
Sales and Office Occupations by Sex
| Occupation | Male | Female |
| Sales & Related | 34 (52.3%) | 31 (47.7%) |
| Office & Administration | 48 (64.9%) | 26 (35.1%) |
| Total (Category) | 82 (59.0%) | 57 (41.0%) |
| Total (Overall) | 731 (66.0%) | 377 (34.0%) |
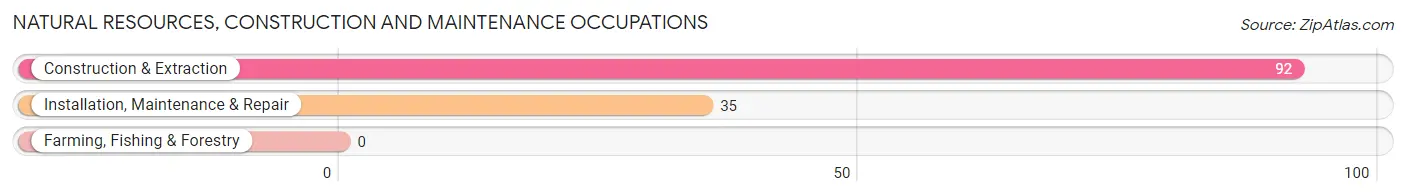
Natural Resources, Construction and Maintenance Occupations
The most common Natural Resources, Construction and Maintenance occupations in Mohave Valley are Construction & Extraction (92 | 8.3%), and Installation, Maintenance & Repair (35 | 3.2%).
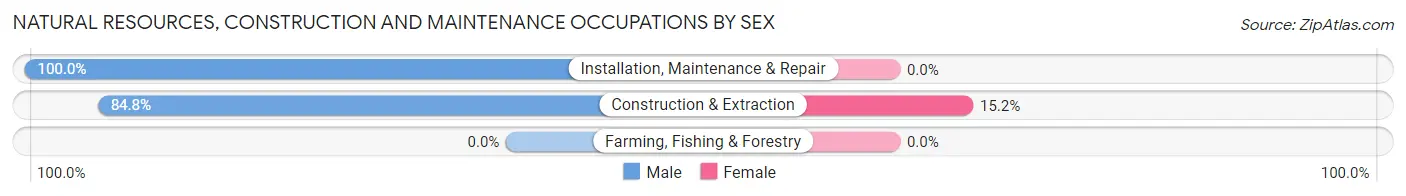
Natural Resources, Construction and Maintenance Occupations by Sex
| Occupation | Male | Female |
| Farming, Fishing & Forestry | 0 (0.0%) | 0 (0.0%) |
| Construction & Extraction | 78 (84.8%) | 14 (15.2%) |
| Installation, Maintenance & Repair | 35 (100.0%) | 0 (0.0%) |
| Total (Category) | 113 (89.0%) | 14 (11.0%) |
| Total (Overall) | 731 (66.0%) | 377 (34.0%) |
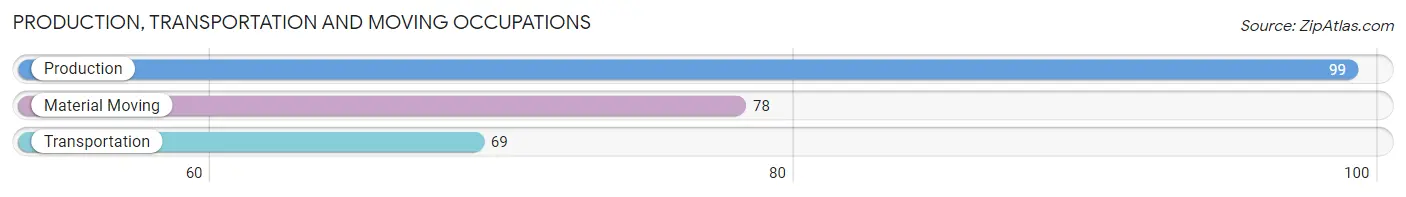
Production, Transportation and Moving Occupations
The most common Production, Transportation and Moving occupations in Mohave Valley are Production (99 | 8.9%), Material Moving (78 | 7.0%), and Transportation (69 | 6.2%).
Production, Transportation and Moving Occupations by Sex
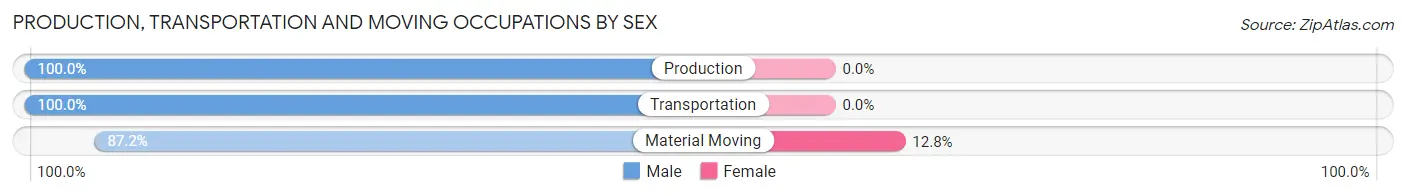
| Occupation | Male | Female |
| Production | 99 (100.0%) | 0 (0.0%) |
| Transportation | 69 (100.0%) | 0 (0.0%) |
| Material Moving | 68 (87.2%) | 10 (12.8%) |
| Total (Category) | 236 (95.9%) | 10 (4.1%) |
| Total (Overall) | 731 (66.0%) | 377 (34.0%) |
Employment Industries by Sex in Mohave Valley
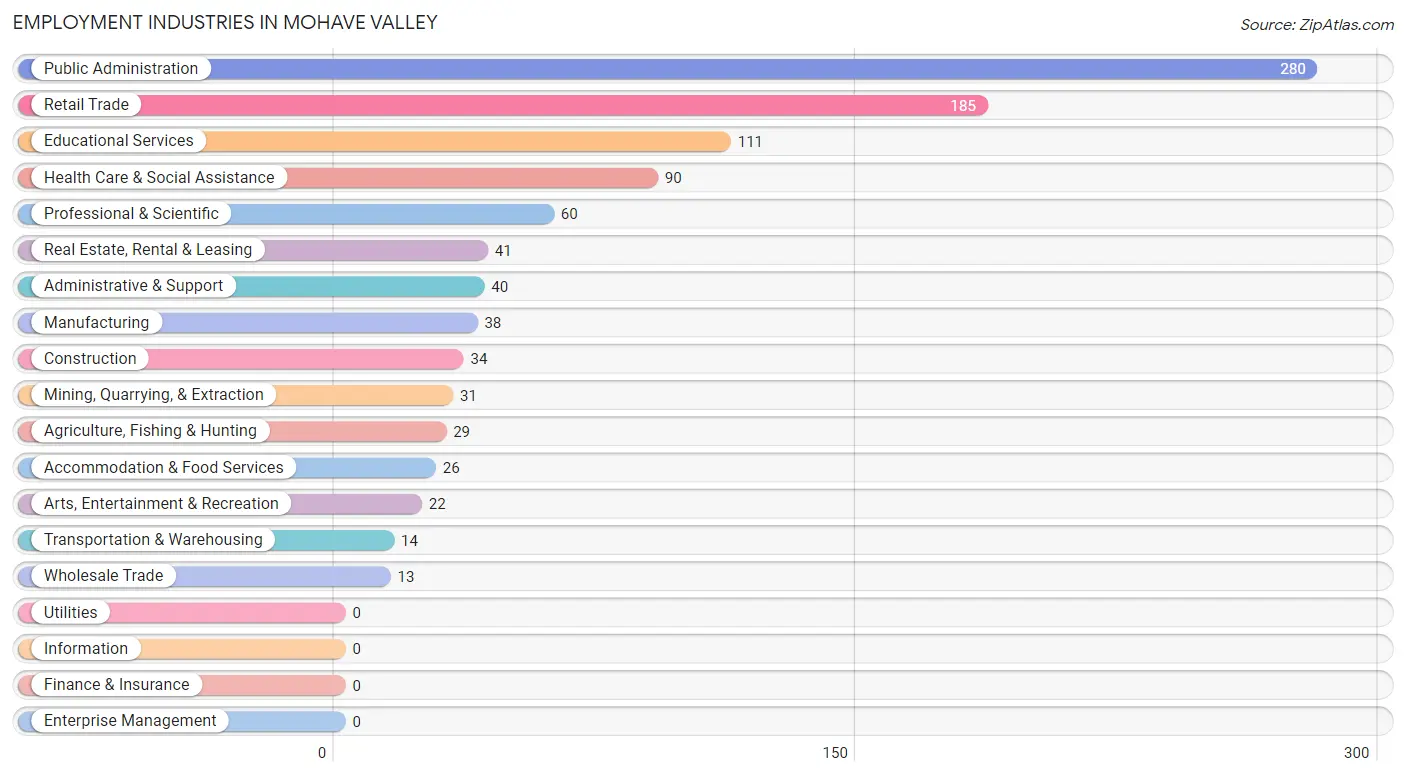
Employment Industries in Mohave Valley
The major employment industries in Mohave Valley include Public Administration (280 | 25.3%), Retail Trade (185 | 16.7%), Educational Services (111 | 10.0%), Health Care & Social Assistance (90 | 8.1%), and Professional & Scientific (60 | 5.4%).
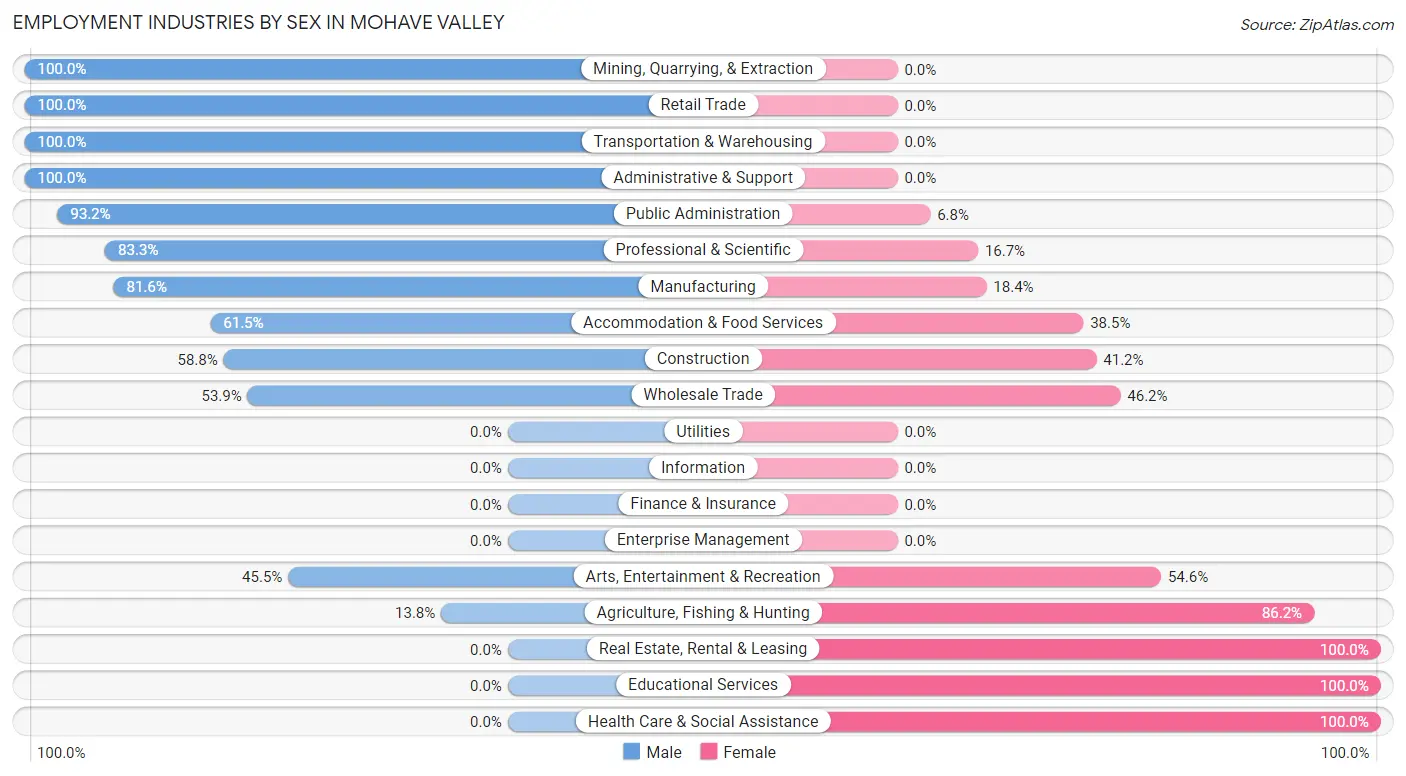
Employment Industries by Sex in Mohave Valley
The Mohave Valley industries that see more men than women are Mining, Quarrying, & Extraction (100.0%), Retail Trade (100.0%), and Transportation & Warehousing (100.0%), whereas the industries that tend to have a higher number of women are Real Estate, Rental & Leasing (100.0%), Educational Services (100.0%), and Health Care & Social Assistance (100.0%).
| Industry | Male | Female |
| Agriculture, Fishing & Hunting | 4 (13.8%) | 25 (86.2%) |
| Mining, Quarrying, & Extraction | 31 (100.0%) | 0 (0.0%) |
| Construction | 20 (58.8%) | 14 (41.2%) |
| Manufacturing | 31 (81.6%) | 7 (18.4%) |
| Wholesale Trade | 7 (53.8%) | 6 (46.2%) |
| Retail Trade | 185 (100.0%) | 0 (0.0%) |
| Transportation & Warehousing | 14 (100.0%) | 0 (0.0%) |
| Utilities | 0 (0.0%) | 0 (0.0%) |
| Information | 0 (0.0%) | 0 (0.0%) |
| Finance & Insurance | 0 (0.0%) | 0 (0.0%) |
| Real Estate, Rental & Leasing | 0 (0.0%) | 41 (100.0%) |
| Professional & Scientific | 50 (83.3%) | 10 (16.7%) |
| Enterprise Management | 0 (0.0%) | 0 (0.0%) |
| Administrative & Support | 40 (100.0%) | 0 (0.0%) |
| Educational Services | 0 (0.0%) | 111 (100.0%) |
| Health Care & Social Assistance | 0 (0.0%) | 90 (100.0%) |
| Arts, Entertainment & Recreation | 10 (45.5%) | 12 (54.5%) |
| Accommodation & Food Services | 16 (61.5%) | 10 (38.5%) |
| Public Administration | 261 (93.2%) | 19 (6.8%) |
| Total | 731 (66.0%) | 377 (34.0%) |
Education in Mohave Valley
School Enrollment in Mohave Valley
The most common levels of schooling among the 679 students in Mohave Valley are elementary school (160 | 23.6%), kindergarten (158 | 23.3%), and college / undergraduate (109 | 16.1%).
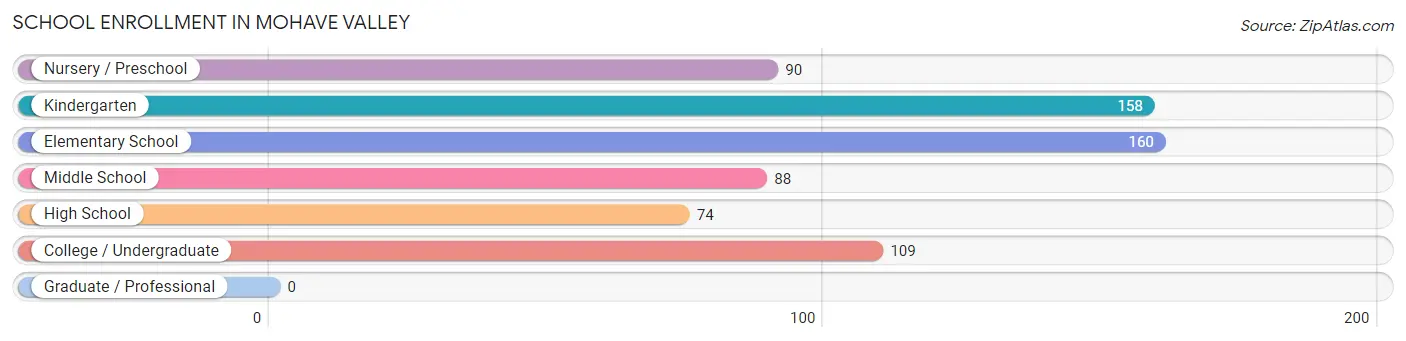
| School Level | # Students | % Students |
| Nursery / Preschool | 90 | 13.3% |
| Kindergarten | 158 | 23.3% |
| Elementary School | 160 | 23.6% |
| Middle School | 88 | 13.0% |
| High School | 74 | 10.9% |
| College / Undergraduate | 109 | 16.1% |
| Graduate / Professional | 0 | 0.0% |
| Total | 679 | 100.0% |
School Enrollment by Age by Funding Source in Mohave Valley
Out of a total of 679 students who are enrolled in schools in Mohave Valley, 20 (2.9%) attend a private institution, while the remaining 659 (97.1%) are enrolled in public schools. The age group of 3 to 4 year olds has the highest likelihood of being enrolled in private schools, with 20 (100.0% in the age bracket) enrolled. Conversely, the age group of 5 to 9 year old has the lowest likelihood of being enrolled in a private school, with 331 (100.0% in the age bracket) attending a public institution.
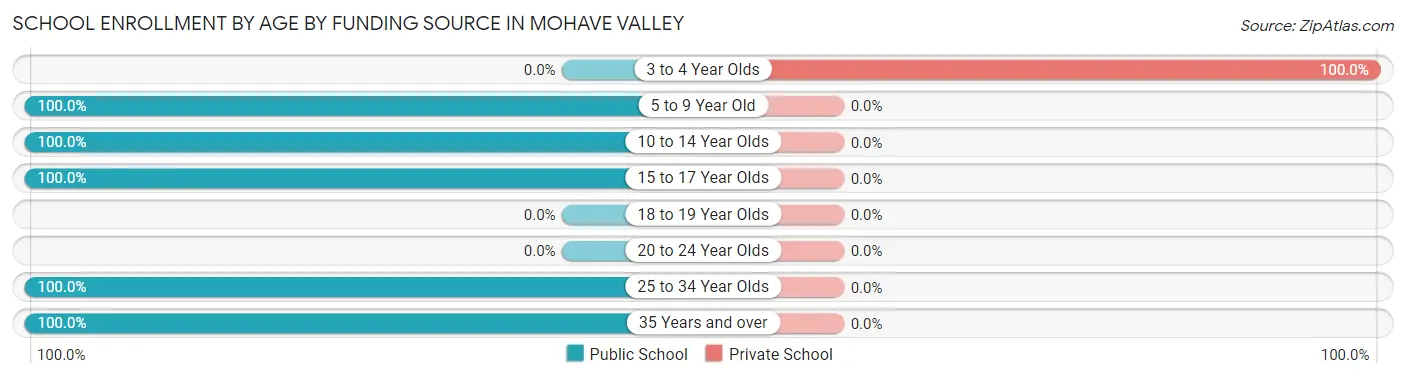
| Age Bracket | Public School | Private School |
| 3 to 4 Year Olds | 0 (0.0%) | 20 (100.0%) |
| 5 to 9 Year Old | 331 (100.0%) | 0 (0.0%) |
| 10 to 14 Year Olds | 158 (100.0%) | 0 (0.0%) |
| 15 to 17 Year Olds | 61 (100.0%) | 0 (0.0%) |
| 18 to 19 Year Olds | 0 (0.0%) | 0 (0.0%) |
| 20 to 24 Year Olds | 0 (0.0%) | 0 (0.0%) |
| 25 to 34 Year Olds | 61 (100.0%) | 0 (0.0%) |
| 35 Years and over | 48 (100.0%) | 0 (0.0%) |
| Total | 659 (97.1%) | 20 (2.9%) |
Educational Attainment by Field of Study in Mohave Valley
Liberal arts & history (45 | 46.4%), physical & health sciences (23 | 23.7%), computers & mathematics (14 | 14.4%), education (8 | 8.3%), and business (7 | 7.2%) are the most common fields of study among 97 individuals in Mohave Valley who have obtained a bachelor's degree or higher.
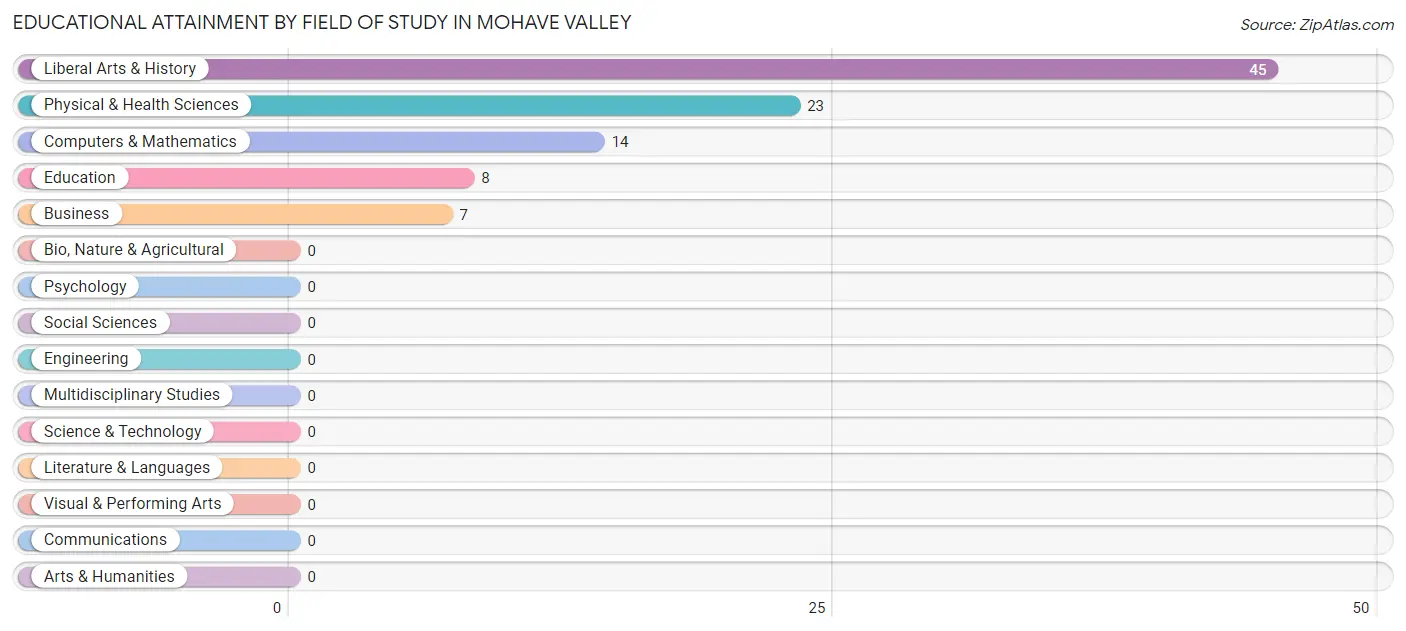
| Field of Study | # Graduates | % Graduates |
| Computers & Mathematics | 14 | 14.4% |
| Bio, Nature & Agricultural | 0 | 0.0% |
| Physical & Health Sciences | 23 | 23.7% |
| Psychology | 0 | 0.0% |
| Social Sciences | 0 | 0.0% |
| Engineering | 0 | 0.0% |
| Multidisciplinary Studies | 0 | 0.0% |
| Science & Technology | 0 | 0.0% |
| Business | 7 | 7.2% |
| Education | 8 | 8.3% |
| Literature & Languages | 0 | 0.0% |
| Liberal Arts & History | 45 | 46.4% |
| Visual & Performing Arts | 0 | 0.0% |
| Communications | 0 | 0.0% |
| Arts & Humanities | 0 | 0.0% |
| Total | 97 | 100.0% |
Transportation & Commute in Mohave Valley
Vehicle Availability by Sex in Mohave Valley
The most prevalent vehicle ownership categories in Mohave Valley are males with 2 vehicles (366, accounting for 50.1%) and females with 2 vehicles (151, making up 97.1%).
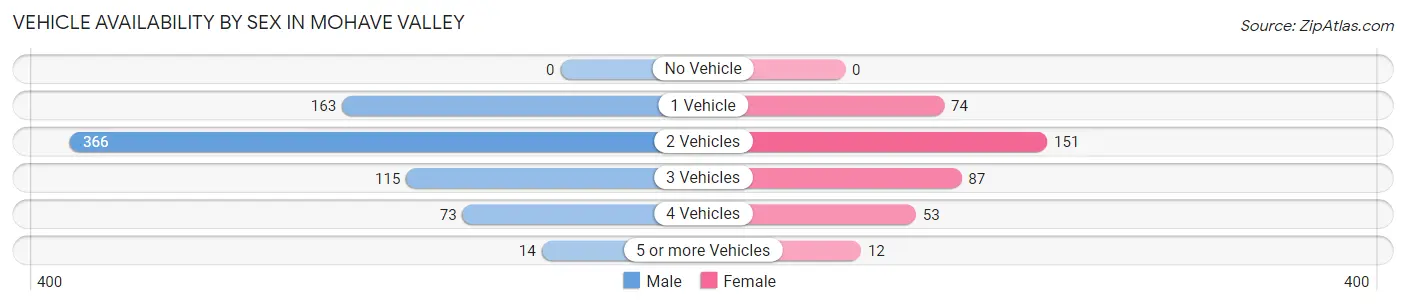
| Vehicles Available | Male | Female |
| No Vehicle | 0 (0.0%) | 0 (0.0%) |
| 1 Vehicle | 163 (22.3%) | 74 (19.6%) |
| 2 Vehicles | 366 (50.1%) | 151 (40.1%) |
| 3 Vehicles | 115 (15.7%) | 87 (23.1%) |
| 4 Vehicles | 73 (10.0%) | 53 (14.1%) |
| 5 or more Vehicles | 14 (1.9%) | 12 (3.2%) |
| Total | 731 (100.0%) | 377 (100.0%) |
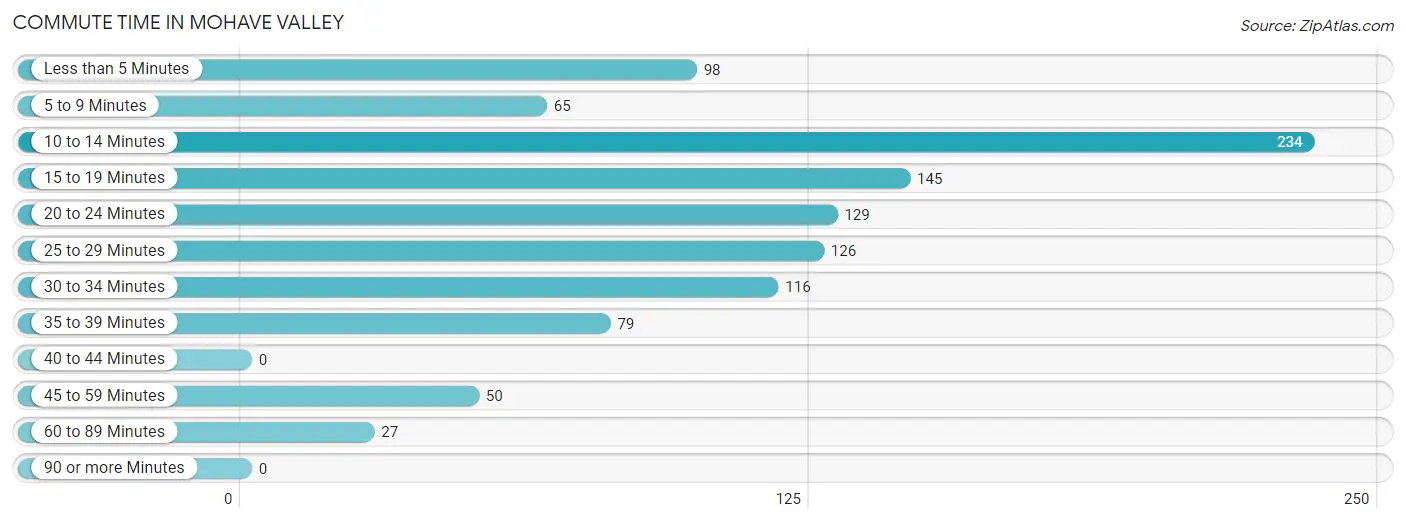
Commute Time in Mohave Valley
The most frequently occuring commute durations in Mohave Valley are 10 to 14 minutes (234 commuters, 21.9%), 15 to 19 minutes (145 commuters, 13.6%), and 20 to 24 minutes (129 commuters, 12.1%).
| Commute Time | # Commuters | % Commuters |
| Less than 5 Minutes | 98 | 9.2% |
| 5 to 9 Minutes | 65 | 6.1% |
| 10 to 14 Minutes | 234 | 21.9% |
| 15 to 19 Minutes | 145 | 13.6% |
| 20 to 24 Minutes | 129 | 12.1% |
| 25 to 29 Minutes | 126 | 11.8% |
| 30 to 34 Minutes | 116 | 10.8% |
| 35 to 39 Minutes | 79 | 7.4% |
| 40 to 44 Minutes | 0 | 0.0% |
| 45 to 59 Minutes | 50 | 4.7% |
| 60 to 89 Minutes | 27 | 2.5% |
| 90 or more Minutes | 0 | 0.0% |
Commute Time by Sex in Mohave Valley
The most common commute times in Mohave Valley are 30 to 34 minutes (116 commuters, 16.3%) for males and 10 to 14 minutes (132 commuters, 37.1%) for females.
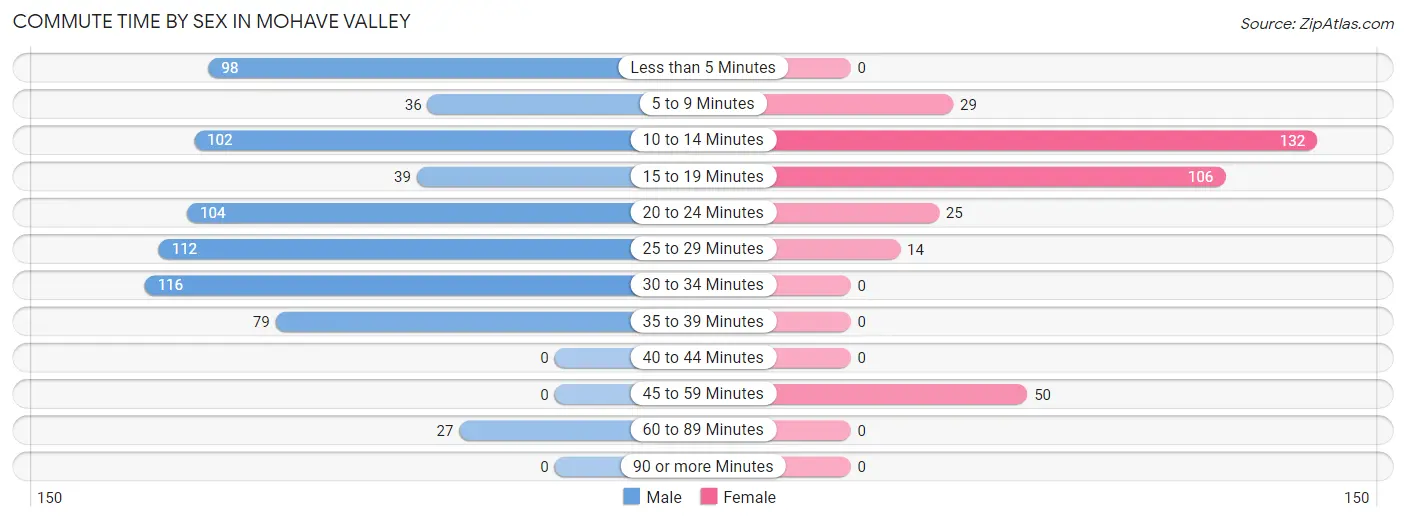
| Commute Time | Male | Female |
| Less than 5 Minutes | 98 (13.7%) | 0 (0.0%) |
| 5 to 9 Minutes | 36 (5.1%) | 29 (8.2%) |
| 10 to 14 Minutes | 102 (14.3%) | 132 (37.1%) |
| 15 to 19 Minutes | 39 (5.5%) | 106 (29.8%) |
| 20 to 24 Minutes | 104 (14.6%) | 25 (7.0%) |
| 25 to 29 Minutes | 112 (15.7%) | 14 (3.9%) |
| 30 to 34 Minutes | 116 (16.3%) | 0 (0.0%) |
| 35 to 39 Minutes | 79 (11.1%) | 0 (0.0%) |
| 40 to 44 Minutes | 0 (0.0%) | 0 (0.0%) |
| 45 to 59 Minutes | 0 (0.0%) | 50 (14.0%) |
| 60 to 89 Minutes | 27 (3.8%) | 0 (0.0%) |
| 90 or more Minutes | 0 (0.0%) | 0 (0.0%) |
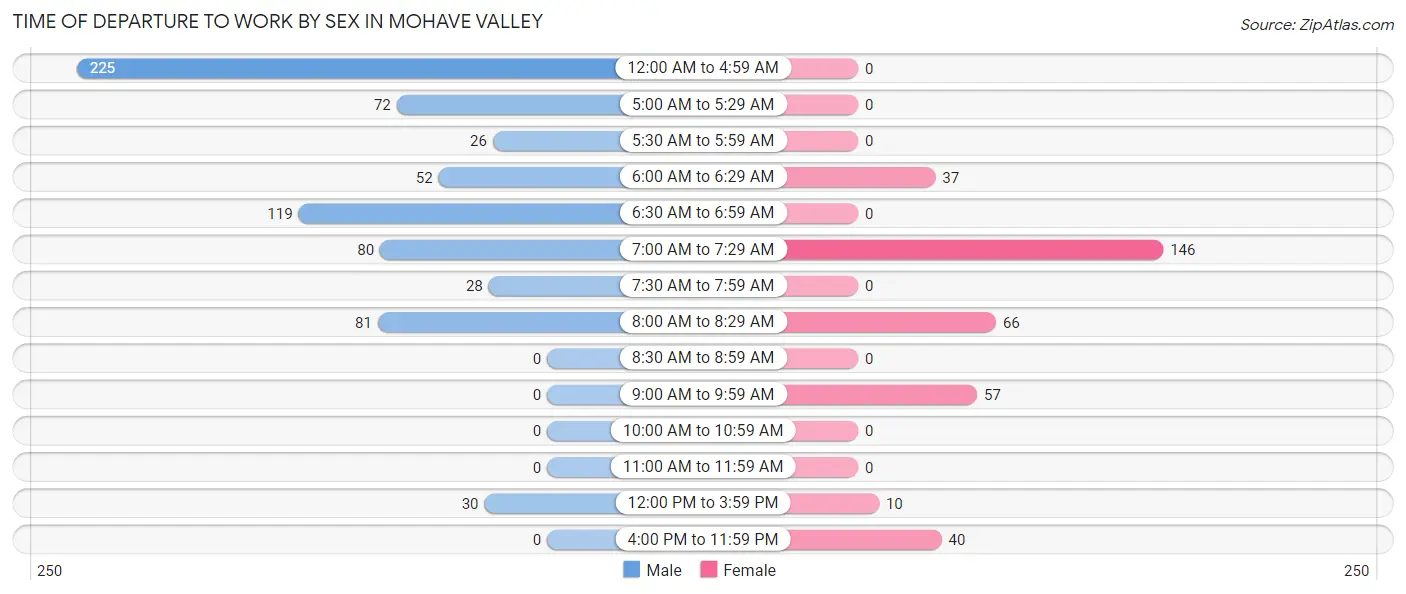
Time of Departure to Work by Sex in Mohave Valley
The most frequent times of departure to work in Mohave Valley are 12:00 AM to 4:59 AM (225, 31.6%) for males and 7:00 AM to 7:29 AM (146, 41.0%) for females.
| Time of Departure | Male | Female |
| 12:00 AM to 4:59 AM | 225 (31.6%) | 0 (0.0%) |
| 5:00 AM to 5:29 AM | 72 (10.1%) | 0 (0.0%) |
| 5:30 AM to 5:59 AM | 26 (3.6%) | 0 (0.0%) |
| 6:00 AM to 6:29 AM | 52 (7.3%) | 37 (10.4%) |
| 6:30 AM to 6:59 AM | 119 (16.7%) | 0 (0.0%) |
| 7:00 AM to 7:29 AM | 80 (11.2%) | 146 (41.0%) |
| 7:30 AM to 7:59 AM | 28 (3.9%) | 0 (0.0%) |
| 8:00 AM to 8:29 AM | 81 (11.4%) | 66 (18.5%) |
| 8:30 AM to 8:59 AM | 0 (0.0%) | 0 (0.0%) |
| 9:00 AM to 9:59 AM | 0 (0.0%) | 57 (16.0%) |
| 10:00 AM to 10:59 AM | 0 (0.0%) | 0 (0.0%) |
| 11:00 AM to 11:59 AM | 0 (0.0%) | 0 (0.0%) |
| 12:00 PM to 3:59 PM | 30 (4.2%) | 10 (2.8%) |
| 4:00 PM to 11:59 PM | 0 (0.0%) | 40 (11.2%) |
| Total | 713 (100.0%) | 356 (100.0%) |
Housing Occupancy in Mohave Valley
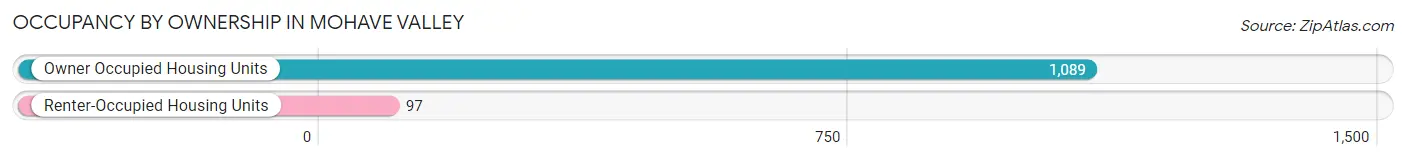
Occupancy by Ownership in Mohave Valley
Of the total 1,186 dwellings in Mohave Valley, owner-occupied units account for 1,089 (91.8%), while renter-occupied units make up 97 (8.2%).
| Occupancy | # Housing Units | % Housing Units |
| Owner Occupied Housing Units | 1,089 | 91.8% |
| Renter-Occupied Housing Units | 97 | 8.2% |
| Total Occupied Housing Units | 1,186 | 100.0% |
Occupancy by Household Size in Mohave Valley
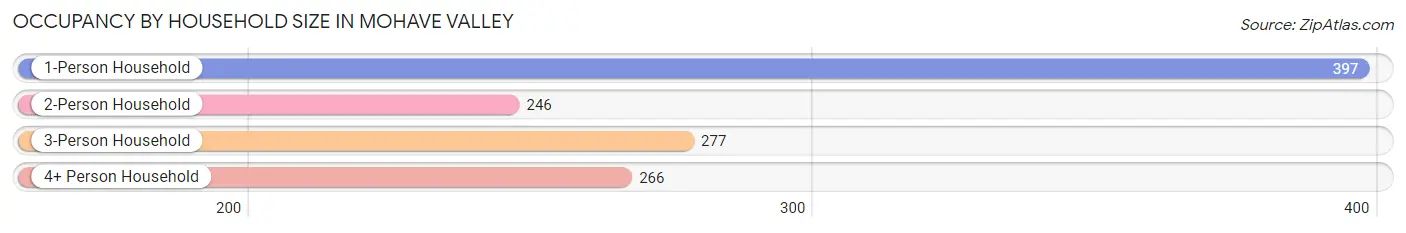
| Household Size | # Housing Units | % Housing Units |
| 1-Person Household | 397 | 33.5% |
| 2-Person Household | 246 | 20.7% |
| 3-Person Household | 277 | 23.4% |
| 4+ Person Household | 266 | 22.4% |
| Total Housing Units | 1,186 | 100.0% |
Occupancy by Ownership by Household Size in Mohave Valley
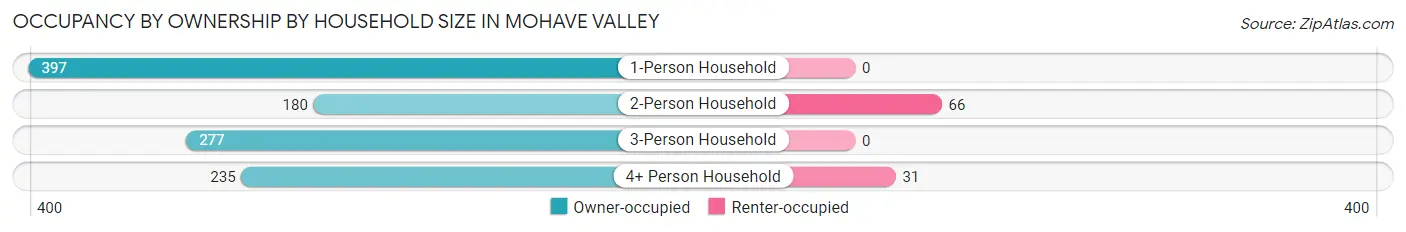
| Household Size | Owner-occupied | Renter-occupied |
| 1-Person Household | 397 (100.0%) | 0 (0.0%) |
| 2-Person Household | 180 (73.2%) | 66 (26.8%) |
| 3-Person Household | 277 (100.0%) | 0 (0.0%) |
| 4+ Person Household | 235 (88.3%) | 31 (11.7%) |
| Total Housing Units | 1,089 (91.8%) | 97 (8.2%) |
Occupancy by Educational Attainment in Mohave Valley
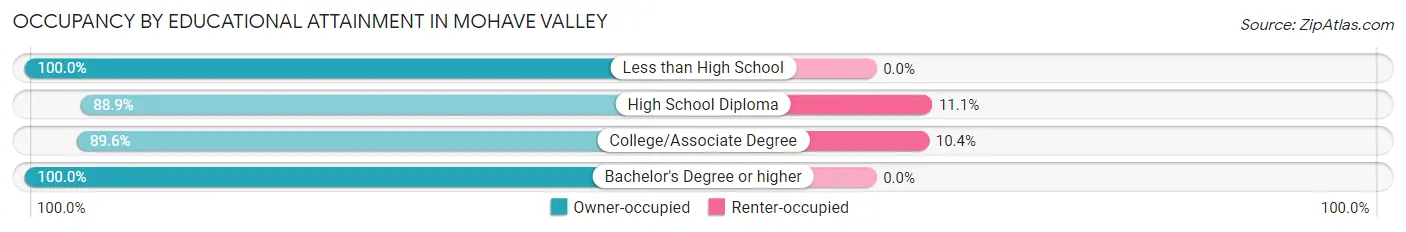
| Household Size | Owner-occupied | Renter-occupied |
| Less than High School | 183 (100.0%) | 0 (0.0%) |
| High School Diploma | 249 (88.9%) | 31 (11.1%) |
| College/Associate Degree | 567 (89.6%) | 66 (10.4%) |
| Bachelor's Degree or higher | 90 (100.0%) | 0 (0.0%) |
Occupancy by Age of Householder in Mohave Valley
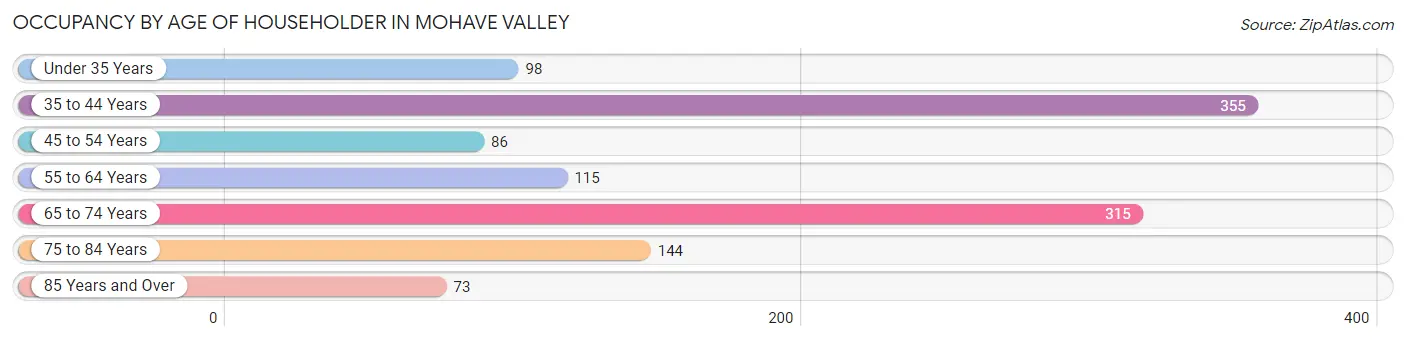
| Age Bracket | # Households | % Households |
| Under 35 Years | 98 | 8.3% |
| 35 to 44 Years | 355 | 29.9% |
| 45 to 54 Years | 86 | 7.2% |
| 55 to 64 Years | 115 | 9.7% |
| 65 to 74 Years | 315 | 26.6% |
| 75 to 84 Years | 144 | 12.1% |
| 85 Years and Over | 73 | 6.2% |
| Total | 1,186 | 100.0% |
Housing Finances in Mohave Valley
Median Income by Occupancy in Mohave Valley
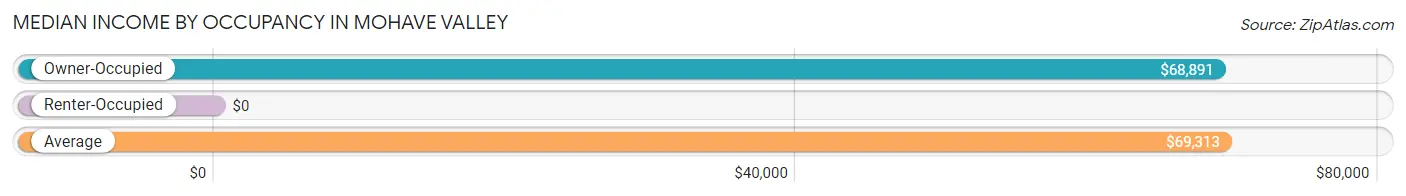
| Occupancy Type | # Households | Median Income |
| Owner-Occupied | 1,089 (91.8%) | $68,891 |
| Renter-Occupied | 97 (8.2%) | $0 |
| Average | 1,186 (100.0%) | $69,313 |
Occupancy by Householder Income Bracket in Mohave Valley
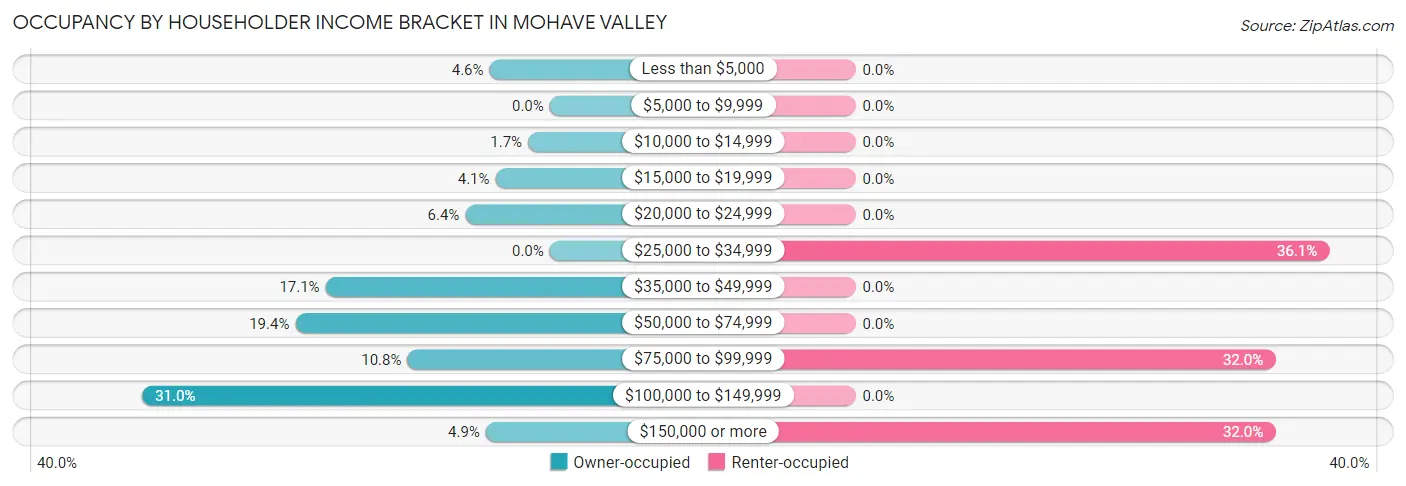
| Income Bracket | Owner-occupied | Renter-occupied |
| Less than $5,000 | 50 (4.6%) | 0 (0.0%) |
| $5,000 to $9,999 | 0 (0.0%) | 0 (0.0%) |
| $10,000 to $14,999 | 18 (1.7%) | 0 (0.0%) |
| $15,000 to $19,999 | 45 (4.1%) | 0 (0.0%) |
| $20,000 to $24,999 | 70 (6.4%) | 0 (0.0%) |
| $25,000 to $34,999 | 0 (0.0%) | 35 (36.1%) |
| $35,000 to $49,999 | 186 (17.1%) | 0 (0.0%) |
| $50,000 to $74,999 | 211 (19.4%) | 0 (0.0%) |
| $75,000 to $99,999 | 118 (10.8%) | 31 (32.0%) |
| $100,000 to $149,999 | 338 (31.0%) | 0 (0.0%) |
| $150,000 or more | 53 (4.9%) | 31 (32.0%) |
| Total | 1,089 (100.0%) | 97 (100.0%) |
Monthly Housing Cost Tiers in Mohave Valley
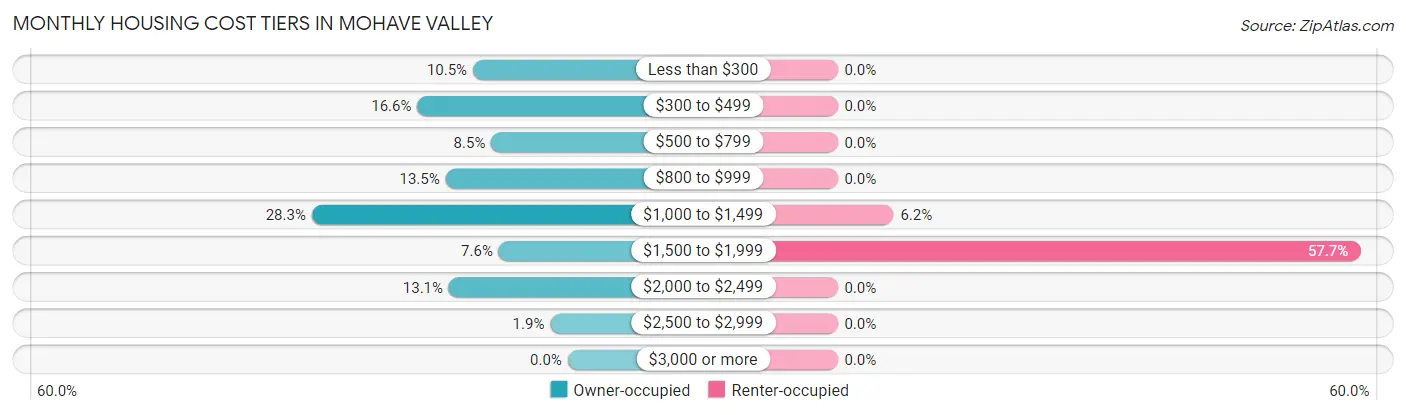
| Monthly Cost | Owner-occupied | Renter-occupied |
| Less than $300 | 114 (10.5%) | 0 (0.0%) |
| $300 to $499 | 181 (16.6%) | 0 (0.0%) |
| $500 to $799 | 92 (8.5%) | 0 (0.0%) |
| $800 to $999 | 147 (13.5%) | 0 (0.0%) |
| $1,000 to $1,499 | 308 (28.3%) | 6 (6.2%) |
| $1,500 to $1,999 | 83 (7.6%) | 56 (57.7%) |
| $2,000 to $2,499 | 143 (13.1%) | 0 (0.0%) |
| $2,500 to $2,999 | 21 (1.9%) | 0 (0.0%) |
| $3,000 or more | 0 (0.0%) | 0 (0.0%) |
| Total | 1,089 (100.0%) | 97 (100.0%) |
Physical Housing Characteristics in Mohave Valley
Housing Structures in Mohave Valley
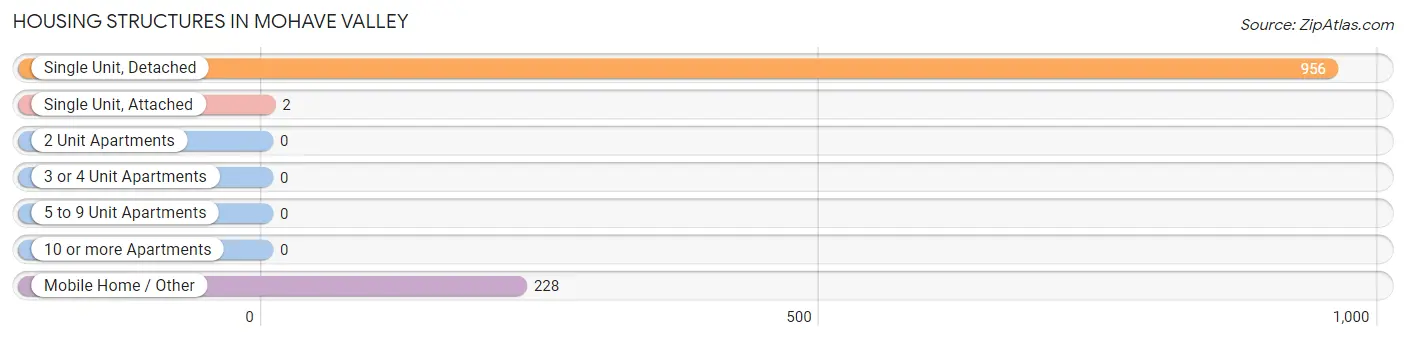
| Structure Type | # Housing Units | % Housing Units |
| Single Unit, Detached | 956 | 80.6% |
| Single Unit, Attached | 2 | 0.2% |
| 2 Unit Apartments | 0 | 0.0% |
| 3 or 4 Unit Apartments | 0 | 0.0% |
| 5 to 9 Unit Apartments | 0 | 0.0% |
| 10 or more Apartments | 0 | 0.0% |
| Mobile Home / Other | 228 | 19.2% |
| Total | 1,186 | 100.0% |
Housing Structures by Occupancy in Mohave Valley
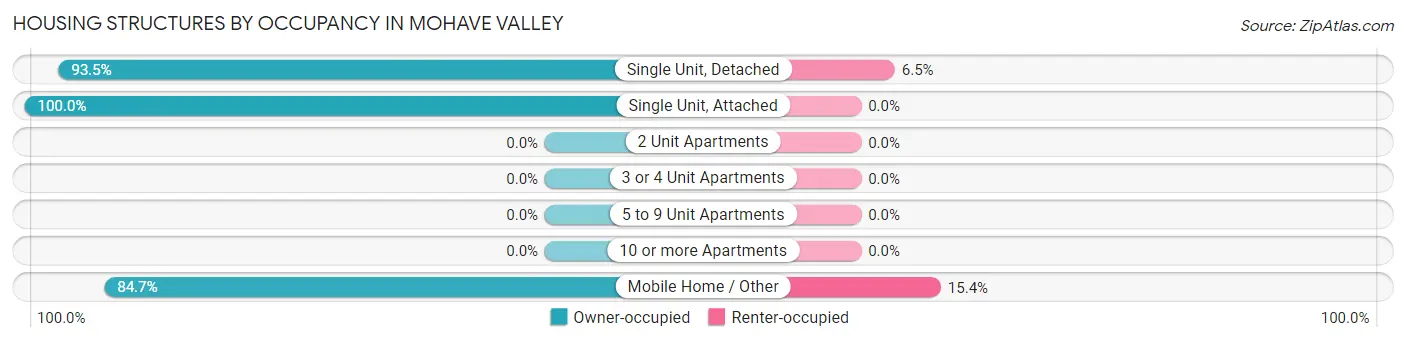
| Structure Type | Owner-occupied | Renter-occupied |
| Single Unit, Detached | 894 (93.5%) | 62 (6.5%) |
| Single Unit, Attached | 2 (100.0%) | 0 (0.0%) |
| 2 Unit Apartments | 0 (0.0%) | 0 (0.0%) |
| 3 or 4 Unit Apartments | 0 (0.0%) | 0 (0.0%) |
| 5 to 9 Unit Apartments | 0 (0.0%) | 0 (0.0%) |
| 10 or more Apartments | 0 (0.0%) | 0 (0.0%) |
| Mobile Home / Other | 193 (84.7%) | 35 (15.3%) |
| Total | 1,089 (91.8%) | 97 (8.2%) |
Housing Structures by Number of Rooms in Mohave Valley
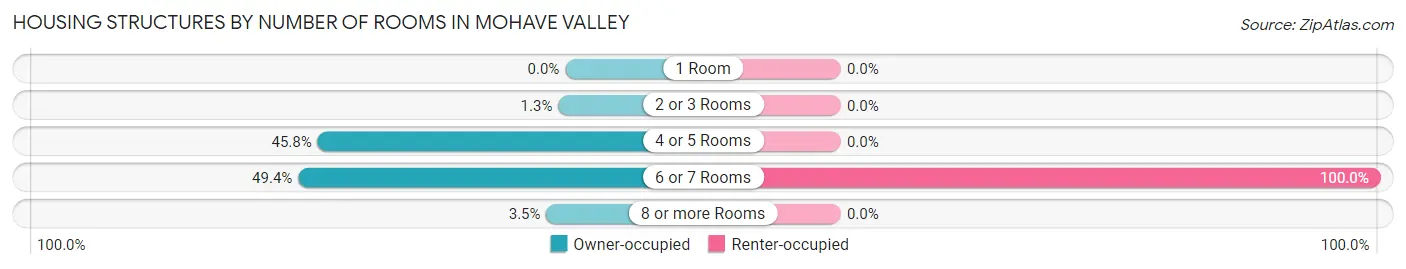
| Number of Rooms | Owner-occupied | Renter-occupied |
| 1 Room | 0 (0.0%) | 0 (0.0%) |
| 2 or 3 Rooms | 14 (1.3%) | 0 (0.0%) |
| 4 or 5 Rooms | 499 (45.8%) | 0 (0.0%) |
| 6 or 7 Rooms | 538 (49.4%) | 97 (100.0%) |
| 8 or more Rooms | 38 (3.5%) | 0 (0.0%) |
| Total | 1,089 (100.0%) | 97 (100.0%) |
Housing Structure by Heating Type in Mohave Valley
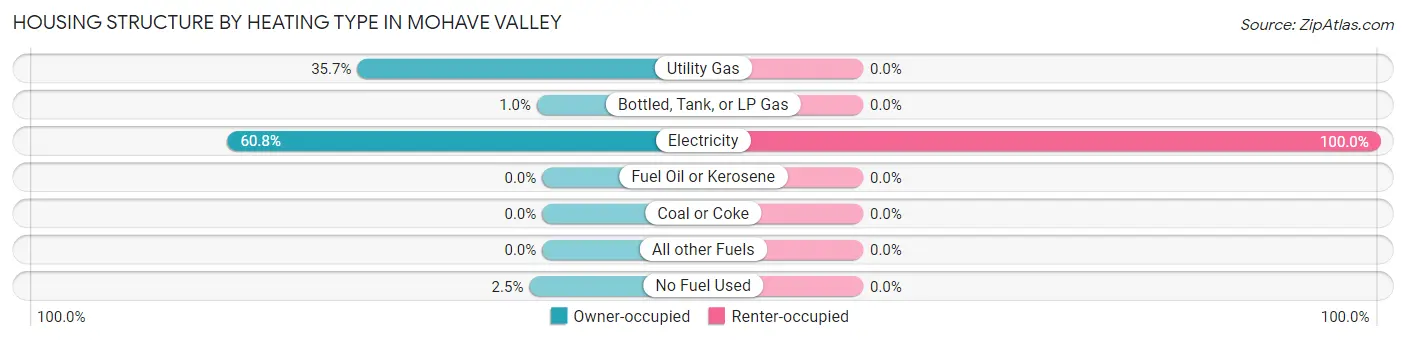
| Heating Type | Owner-occupied | Renter-occupied |
| Utility Gas | 389 (35.7%) | 0 (0.0%) |
| Bottled, Tank, or LP Gas | 11 (1.0%) | 0 (0.0%) |
| Electricity | 662 (60.8%) | 97 (100.0%) |
| Fuel Oil or Kerosene | 0 (0.0%) | 0 (0.0%) |
| Coal or Coke | 0 (0.0%) | 0 (0.0%) |
| All other Fuels | 0 (0.0%) | 0 (0.0%) |
| No Fuel Used | 27 (2.5%) | 0 (0.0%) |
| Total | 1,089 (100.0%) | 97 (100.0%) |
Household Vehicle Usage in Mohave Valley
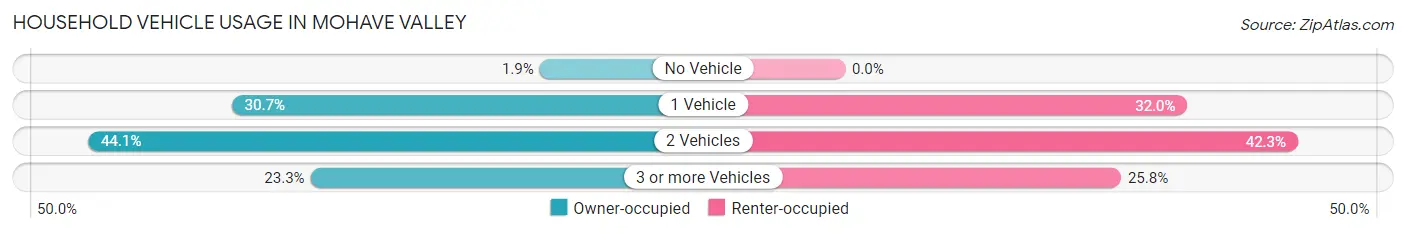
| Vehicles per Household | Owner-occupied | Renter-occupied |
| No Vehicle | 21 (1.9%) | 0 (0.0%) |
| 1 Vehicle | 334 (30.7%) | 31 (32.0%) |
| 2 Vehicles | 480 (44.1%) | 41 (42.3%) |
| 3 or more Vehicles | 254 (23.3%) | 25 (25.8%) |
| Total | 1,089 (100.0%) | 97 (100.0%) |
Real Estate & Mortgages in Mohave Valley
Real Estate and Mortgage Overview in Mohave Valley
| Characteristic | Without Mortgage | With Mortgage |
| Housing Units | 347 | 742 |
| Median Property Value | $217,100 | $257,300 |
| Median Household Income | $54,653 | $25 |
| Monthly Housing Costs | $347 | $0 |
| Real Estate Taxes | $991 | $22 |
Property Value by Mortgage Status in Mohave Valley
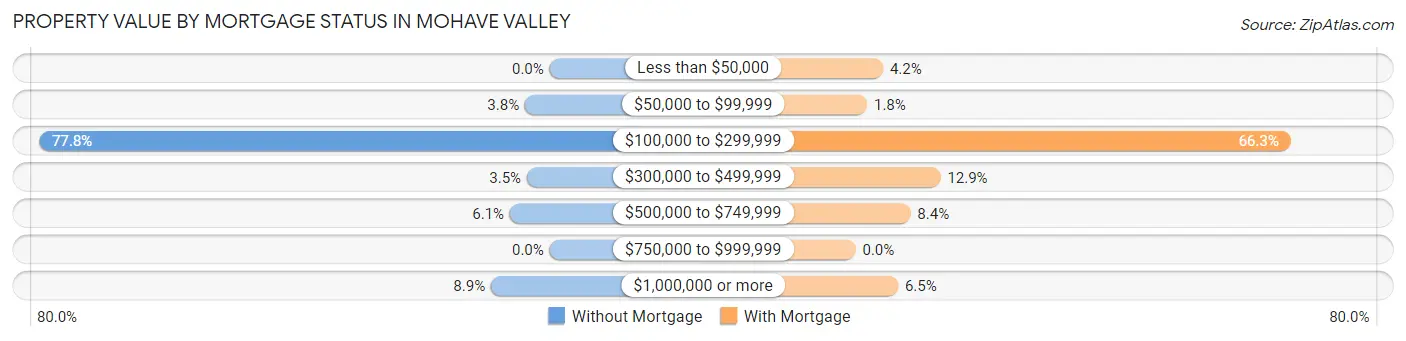
| Property Value | Without Mortgage | With Mortgage |
| Less than $50,000 | 0 (0.0%) | 31 (4.2%) |
| $50,000 to $99,999 | 13 (3.7%) | 13 (1.8%) |
| $100,000 to $299,999 | 270 (77.8%) | 492 (66.3%) |
| $300,000 to $499,999 | 12 (3.5%) | 96 (12.9%) |
| $500,000 to $749,999 | 21 (6.0%) | 62 (8.4%) |
| $750,000 to $999,999 | 0 (0.0%) | 0 (0.0%) |
| $1,000,000 or more | 31 (8.9%) | 48 (6.5%) |
| Total | 347 (100.0%) | 742 (100.0%) |
Household Income by Mortgage Status in Mohave Valley
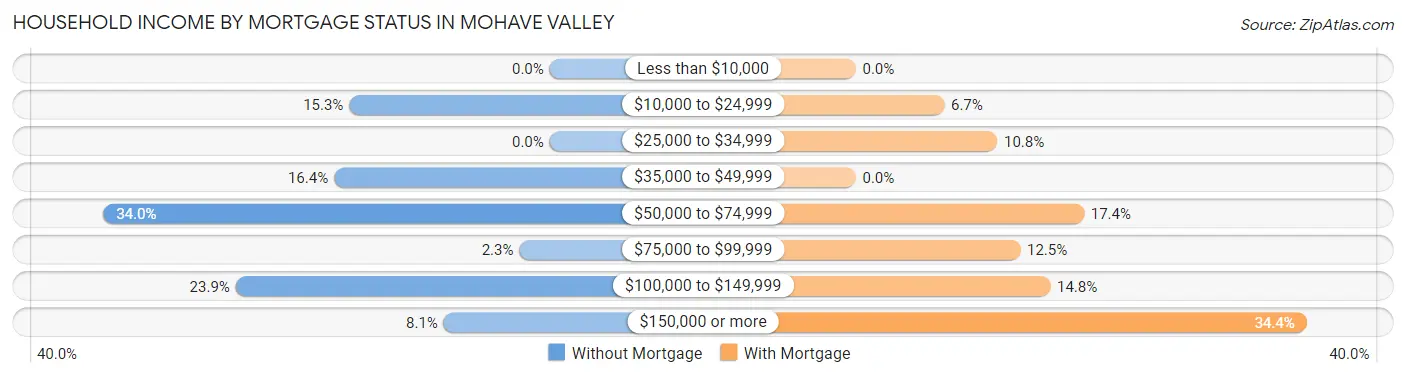
| Household Income | Without Mortgage | With Mortgage |
| Less than $10,000 | 0 (0.0%) | 0 (0.0%) |
| $10,000 to $24,999 | 53 (15.3%) | 50 (6.7%) |
| $25,000 to $34,999 | 0 (0.0%) | 80 (10.8%) |
| $35,000 to $49,999 | 57 (16.4%) | 0 (0.0%) |
| $50,000 to $74,999 | 118 (34.0%) | 129 (17.4%) |
| $75,000 to $99,999 | 8 (2.3%) | 93 (12.5%) |
| $100,000 to $149,999 | 83 (23.9%) | 110 (14.8%) |
| $150,000 or more | 28 (8.1%) | 255 (34.4%) |
| Total | 347 (100.0%) | 742 (100.0%) |
Property Value to Household Income Ratio in Mohave Valley
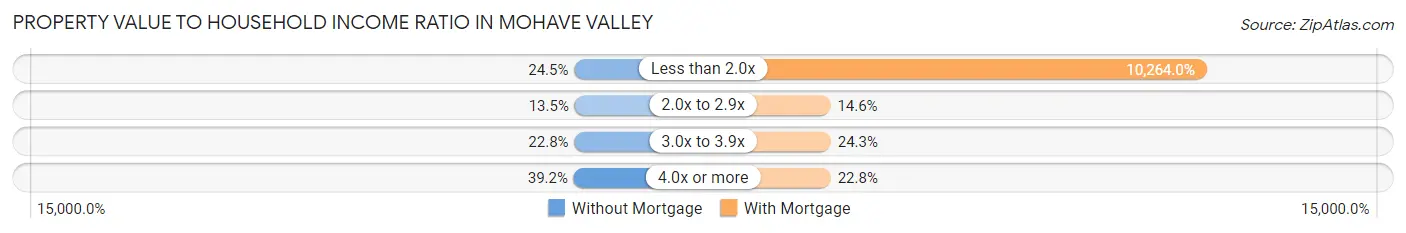
| Value-to-Income Ratio | Without Mortgage | With Mortgage |
| Less than 2.0x | 85 (24.5%) | 76,159 (10,264.0%) |
| 2.0x to 2.9x | 47 (13.5%) | 108 (14.6%) |
| 3.0x to 3.9x | 79 (22.8%) | 180 (24.3%) |
| 4.0x or more | 136 (39.2%) | 169 (22.8%) |
| Total | 347 (100.0%) | 742 (100.0%) |
Real Estate Taxes by Mortgage Status in Mohave Valley
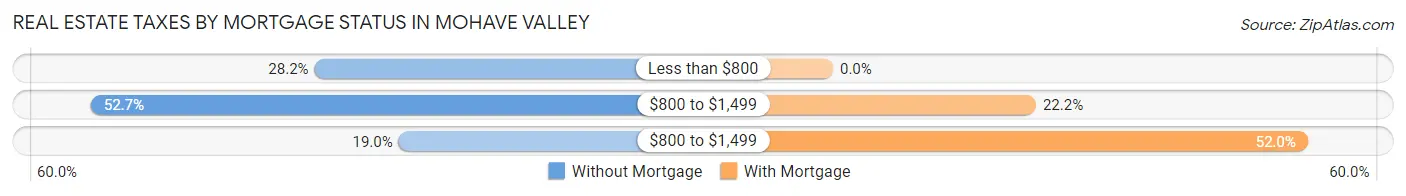
| Property Taxes | Without Mortgage | With Mortgage |
| Less than $800 | 98 (28.2%) | 0 (0.0%) |
| $800 to $1,499 | 183 (52.7%) | 165 (22.2%) |
| $800 to $1,499 | 66 (19.0%) | 386 (52.0%) |
| Total | 347 (100.0%) | 742 (100.0%) |
Health & Disability in Mohave Valley
Health Insurance Coverage by Age in Mohave Valley
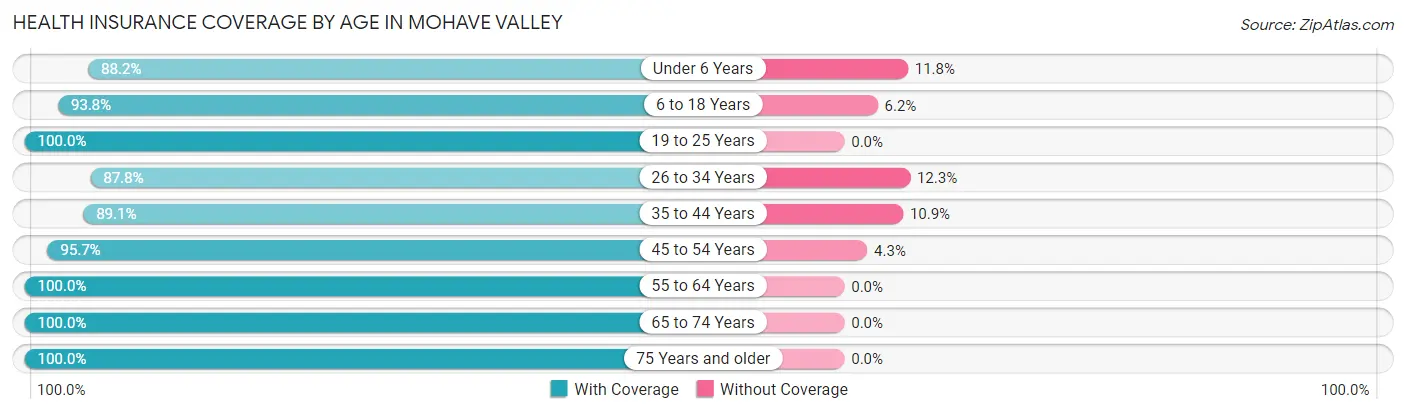
| Age Bracket | With Coverage | Without Coverage |
| Under 6 Years | 216 (88.2%) | 29 (11.8%) |
| 6 to 18 Years | 423 (93.8%) | 28 (6.2%) |
| 19 to 25 Years | 5 (100.0%) | 0 (0.0%) |
| 26 to 34 Years | 179 (87.7%) | 25 (12.2%) |
| 35 to 44 Years | 619 (89.1%) | 76 (10.9%) |
| 45 to 54 Years | 135 (95.7%) | 6 (4.3%) |
| 55 to 64 Years | 205 (100.0%) | 0 (0.0%) |
| 65 to 74 Years | 433 (100.0%) | 0 (0.0%) |
| 75 Years and older | 337 (100.0%) | 0 (0.0%) |
| Total | 2,552 (94.0%) | 164 (6.0%) |
Health Insurance Coverage by Citizenship Status in Mohave Valley
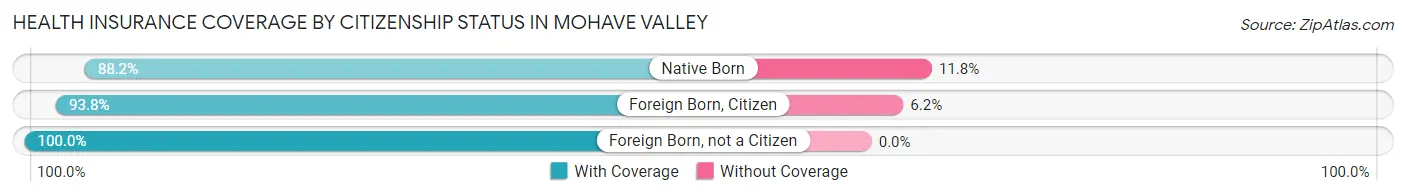
| Citizenship Status | With Coverage | Without Coverage |
| Native Born | 216 (88.2%) | 29 (11.8%) |
| Foreign Born, Citizen | 423 (93.8%) | 28 (6.2%) |
| Foreign Born, not a Citizen | 5 (100.0%) | 0 (0.0%) |
Health Insurance Coverage by Household Income in Mohave Valley
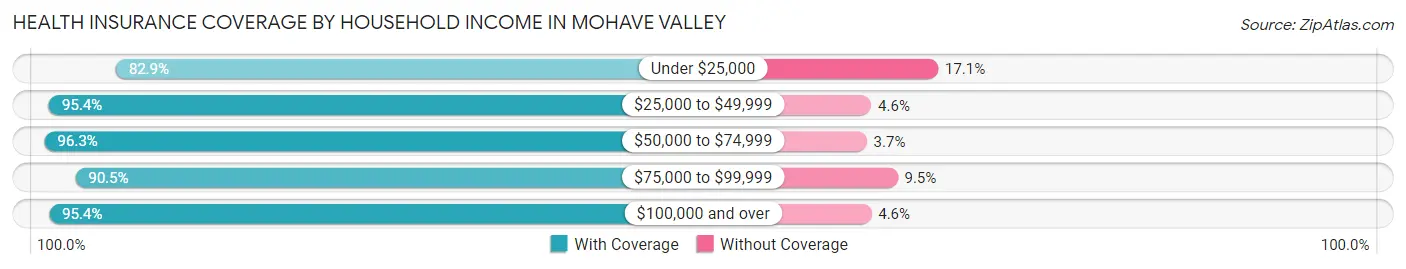
| Household Income | With Coverage | Without Coverage |
| Under $25,000 | 194 (82.9%) | 40 (17.1%) |
| $25,000 to $49,999 | 293 (95.4%) | 14 (4.6%) |
| $50,000 to $74,999 | 647 (96.3%) | 25 (3.7%) |
| $75,000 to $99,999 | 295 (90.5%) | 31 (9.5%) |
| $100,000 and over | 1,123 (95.4%) | 54 (4.6%) |
Public vs Private Health Insurance Coverage by Age in Mohave Valley
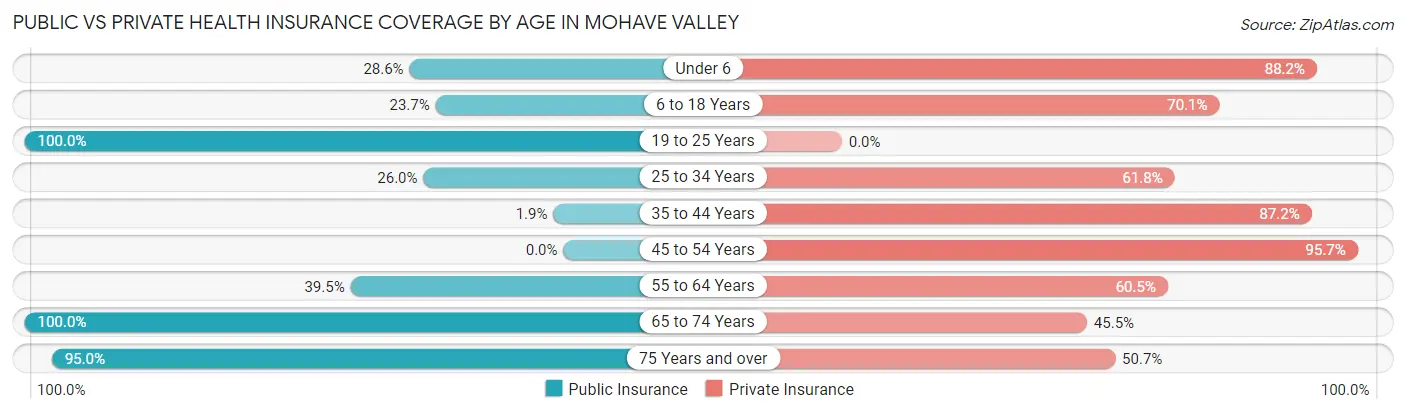
| Age Bracket | Public Insurance | Private Insurance |
| Under 6 | 70 (28.6%) | 216 (88.2%) |
| 6 to 18 Years | 107 (23.7%) | 316 (70.1%) |
| 19 to 25 Years | 5 (100.0%) | 0 (0.0%) |
| 25 to 34 Years | 53 (26.0%) | 126 (61.8%) |
| 35 to 44 Years | 13 (1.9%) | 606 (87.2%) |
| 45 to 54 Years | 0 (0.0%) | 135 (95.7%) |
| 55 to 64 Years | 81 (39.5%) | 124 (60.5%) |
| 65 to 74 Years | 433 (100.0%) | 197 (45.5%) |
| 75 Years and over | 320 (95.0%) | 171 (50.7%) |
| Total | 1,082 (39.8%) | 1,891 (69.6%) |
Disability Status by Sex by Age in Mohave Valley
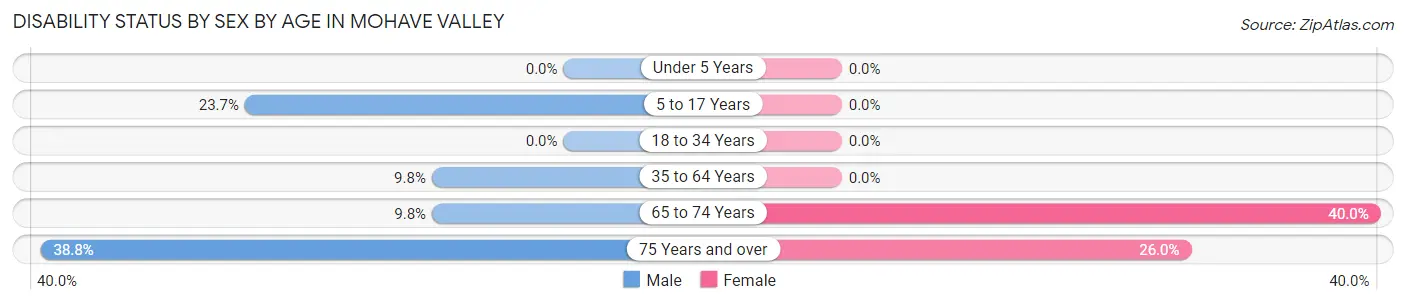
| Age Bracket | Male | Female |
| Under 5 Years | 0 (0.0%) | 0 (0.0%) |
| 5 to 17 Years | 70 (23.6%) | 0 (0.0%) |
| 18 to 34 Years | 0 (0.0%) | 0 (0.0%) |
| 35 to 64 Years | 55 (9.8%) | 0 (0.0%) |
| 65 to 74 Years | 33 (9.8%) | 38 (40.0%) |
| 75 Years and over | 59 (38.8%) | 48 (26.0%) |
Disability Class by Sex by Age in Mohave Valley
Disability Class: Hearing Difficulty
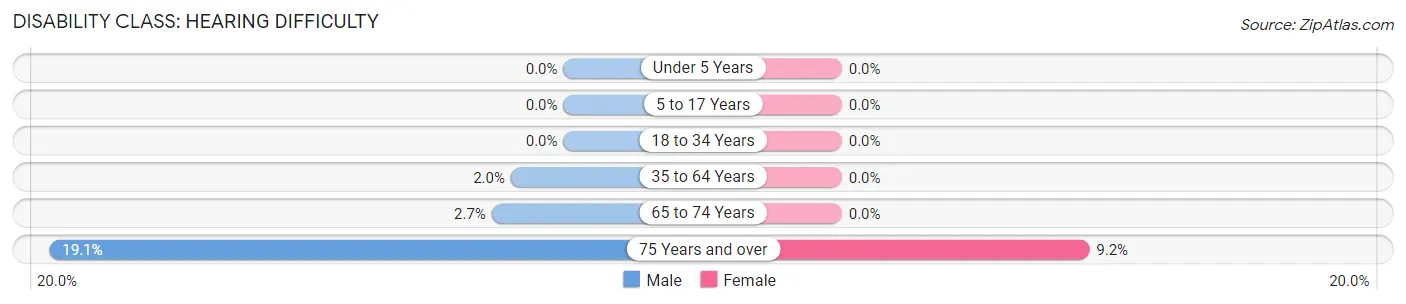
| Age Bracket | Male | Female |
| Under 5 Years | 0 (0.0%) | 0 (0.0%) |
| 5 to 17 Years | 0 (0.0%) | 0 (0.0%) |
| 18 to 34 Years | 0 (0.0%) | 0 (0.0%) |
| 35 to 64 Years | 11 (1.9%) | 0 (0.0%) |
| 65 to 74 Years | 9 (2.7%) | 0 (0.0%) |
| 75 Years and over | 29 (19.1%) | 17 (9.2%) |
Disability Class: Vision Difficulty
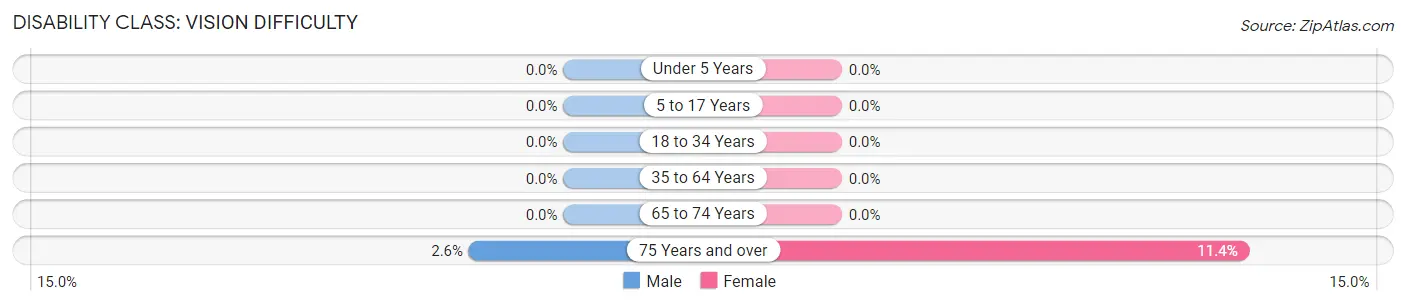
| Age Bracket | Male | Female |
| Under 5 Years | 0 (0.0%) | 0 (0.0%) |
| 5 to 17 Years | 0 (0.0%) | 0 (0.0%) |
| 18 to 34 Years | 0 (0.0%) | 0 (0.0%) |
| 35 to 64 Years | 0 (0.0%) | 0 (0.0%) |
| 65 to 74 Years | 0 (0.0%) | 0 (0.0%) |
| 75 Years and over | 4 (2.6%) | 21 (11.4%) |
Disability Class: Cognitive Difficulty
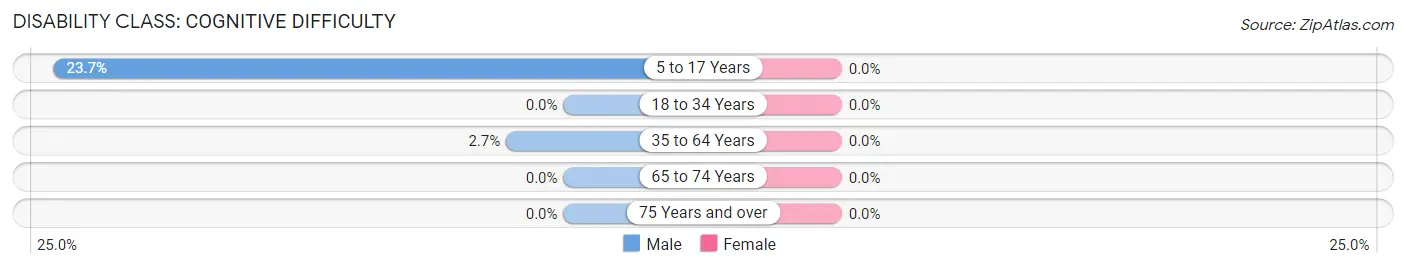
| Age Bracket | Male | Female |
| 5 to 17 Years | 70 (23.6%) | 0 (0.0%) |
| 18 to 34 Years | 0 (0.0%) | 0 (0.0%) |
| 35 to 64 Years | 15 (2.7%) | 0 (0.0%) |
| 65 to 74 Years | 0 (0.0%) | 0 (0.0%) |
| 75 Years and over | 0 (0.0%) | 0 (0.0%) |
Disability Class: Ambulatory Difficulty
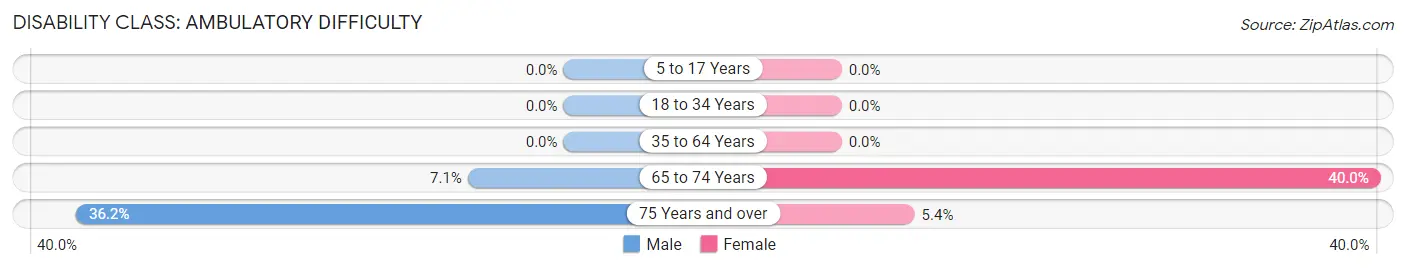
| Age Bracket | Male | Female |
| 5 to 17 Years | 0 (0.0%) | 0 (0.0%) |
| 18 to 34 Years | 0 (0.0%) | 0 (0.0%) |
| 35 to 64 Years | 0 (0.0%) | 0 (0.0%) |
| 65 to 74 Years | 24 (7.1%) | 38 (40.0%) |
| 75 Years and over | 55 (36.2%) | 10 (5.4%) |
Disability Class: Self-Care Difficulty
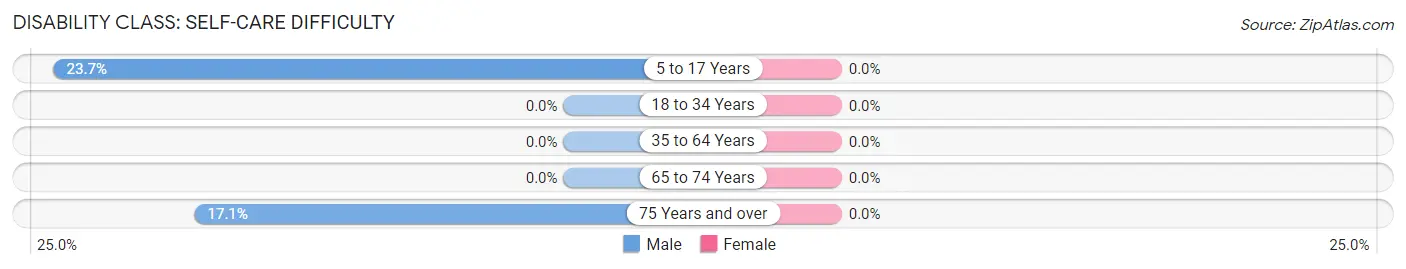
| Age Bracket | Male | Female |
| 5 to 17 Years | 70 (23.6%) | 0 (0.0%) |
| 18 to 34 Years | 0 (0.0%) | 0 (0.0%) |
| 35 to 64 Years | 0 (0.0%) | 0 (0.0%) |
| 65 to 74 Years | 0 (0.0%) | 0 (0.0%) |
| 75 Years and over | 26 (17.1%) | 0 (0.0%) |
Technology Access in Mohave Valley
Computing Device Access in Mohave Valley
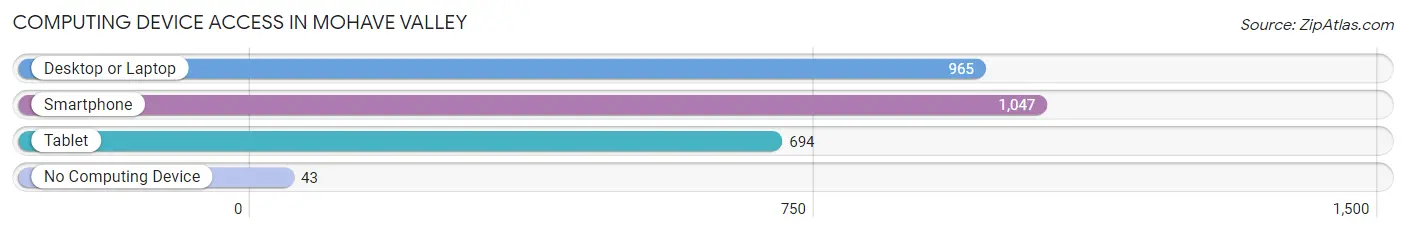
| Device Type | # Households | % Households |
| Desktop or Laptop | 965 | 81.4% |
| Smartphone | 1,047 | 88.3% |
| Tablet | 694 | 58.5% |
| No Computing Device | 43 | 3.6% |
| Total | 1,186 | 100.0% |
Internet Access in Mohave Valley
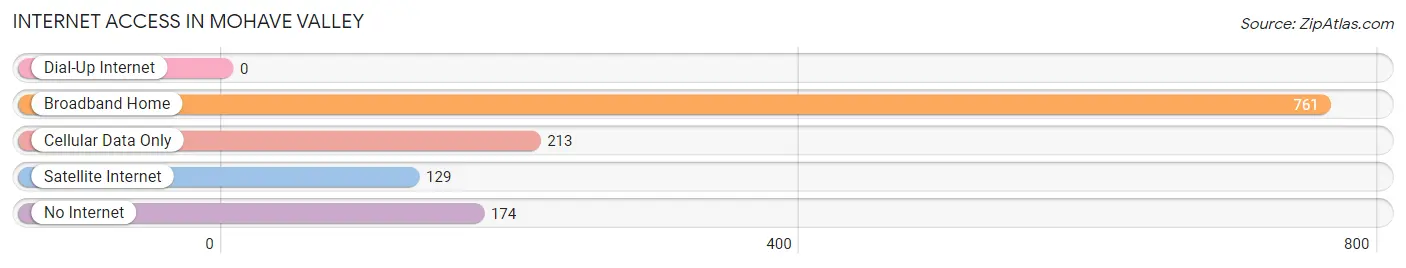
| Internet Type | # Households | % Households |
| Dial-Up Internet | 0 | 0.0% |
| Broadband Home | 761 | 64.2% |
| Cellular Data Only | 213 | 18.0% |
| Satellite Internet | 129 | 10.9% |
| No Internet | 174 | 14.7% |
| Total | 1,186 | 100.0% |
Mohave Valley Summary
Introduction
The small town of Mohave Valley, Arizona is located in the western part of the state, just south of the Colorado River. It is part of the Mohave Valley, which is a large area that includes parts of Arizona, California, and Nevada. The town is situated in a desert landscape, surrounded by mountains and the Colorado River. The area is known for its mild climate and beautiful scenery.
History
The area that is now Mohave Valley was first inhabited by the Mohave people, who were a Native American tribe that lived in the area for centuries. The first Europeans to explore the area were Spanish explorers in the late 1700s. The area was later settled by Mormon pioneers in the late 1800s. The town of Mohave Valley was officially established in 1883.
The town grew slowly over the years, and by the 1950s, it had become a popular tourist destination. The town was known for its fishing, hunting, and outdoor recreation. In the 1960s, the town began to experience a population boom as people moved to the area for its mild climate and scenic beauty.
Geography
Mohave Valley is located in the western part of Arizona, just south of the Colorado River. The town is situated in a desert landscape, surrounded by mountains and the Colorado River. The area is known for its mild climate and beautiful scenery. The town is located in the Mohave Valley, which is a large area that includes parts of Arizona, California, and Nevada.
The town is located at an elevation of 1,890 feet above sea level. The climate in the area is generally mild, with hot summers and mild winters. The average temperature in the summer is around 90 degrees Fahrenheit, and the average temperature in the winter is around 50 degrees Fahrenheit.
Economy
The economy of Mohave Valley is largely based on tourism and agriculture. The town is a popular destination for outdoor recreation, such as fishing, hunting, and camping. The area is also known for its agricultural production, including cotton, alfalfa, and melons.
The town is also home to several businesses, including restaurants, retail stores, and hotels. The town is also home to a casino, which is a popular destination for tourists and locals alike.
Demographics
As of the 2010 census, the population of Mohave Valley was 8,543. The population is largely white (83.3%), with smaller percentages of Hispanic (7.3%), Native American (3.2%), and African American (2.2%) residents. The median household income in the town is $37,917, and the median age is 44.
Conclusion
Mohave Valley, Arizona is a small town located in the western part of the state, just south of the Colorado River. The town is situated in a desert landscape, surrounded by mountains and the Colorado River. The area is known for its mild climate and beautiful scenery. The town has a long history, dating back to the Native American tribes that inhabited the area for centuries. The town is a popular destination for outdoor recreation, and its economy is largely based on tourism and agriculture. The population of the town is largely white, with smaller percentages of Hispanic, Native American, and African American residents.
Common Questions
What is Per Capita Income in Mohave Valley?
Per Capita income in Mohave Valley is $34,906.
What is the Median Family Income in Mohave Valley?
Median Family Income in Mohave Valley is $75,156.
What is the Median Household income in Mohave Valley?
Median Household Income in Mohave Valley is $69,313.
What is Income or Wage Gap in Mohave Valley?
Income or Wage Gap in Mohave Valley is 23.0%.
Women in Mohave Valley earn 77.0 cents for every dollar earned by a man.
What is Inequality or Gini Index in Mohave Valley?
Inequality or Gini Index in Mohave Valley is 0.36.
What is the Total Population of Mohave Valley?
Total Population of Mohave Valley is 2,724.
What is the Total Male Population of Mohave Valley?
Total Male Population of Mohave Valley is 1,568.
What is the Total Female Population of Mohave Valley?
Total Female Population of Mohave Valley is 1,156.
What is the Ratio of Males per 100 Females in Mohave Valley?
There are 135.64 Males per 100 Females in Mohave Valley.
What is the Ratio of Females per 100 Males in Mohave Valley?
There are 73.72 Females per 100 Males in Mohave Valley.
What is the Median Population Age in Mohave Valley?
Median Population Age in Mohave Valley is 38.9 Years.
What is the Average Family Size in Mohave Valley
Average Family Size in Mohave Valley is 2.8 People.
What is the Average Household Size in Mohave Valley
Average Household Size in Mohave Valley is 2.3 People.
How Large is the Labor Force in Mohave Valley?
There are 1,163 People in the Labor Forcein in Mohave Valley.
What is the Percentage of People in the Labor Force in Mohave Valley?
56.0% of People are in the Labor Force in Mohave Valley.
What is the Unemployment Rate in Mohave Valley?
Unemployment Rate in Mohave Valley is 4.8%.