Avra Valley, AZ Map & Demographics
Avra Valley Map
Avra Valley Overview
$28,607
PER CAPITA INCOME
$52,184
AVG FAMILY INCOME
$51,415
AVG HOUSEHOLD INCOME
7.3%
WAGE / INCOME GAP [ % ]
92.7¢/ $1
WAGE / INCOME GAP [ $ ]
0.46
INEQUALITY / GINI INDEX
6,281
TOTAL POPULATION
3,266
MALE POPULATION
3,015
FEMALE POPULATION
108.33
MALES / 100 FEMALES
92.31
FEMALES / 100 MALES
41.8
MEDIAN AGE
3.1
AVG FAMILY SIZE
2.6
AVG HOUSEHOLD SIZE
3,167
LABOR FORCE [ PEOPLE ]
64.4%
PERCENT IN LABOR FORCE
9.8%
UNEMPLOYMENT RATE
Income in Avra Valley
Income Overview in Avra Valley
Per Capita Income in Avra Valley is $28,607, while median incomes of families and households are $52,184 and $51,415 respectively.
| Characteristic | Number | Measure |
| Per Capita Income | 6,281 | $28,607 |
| Median Family Income | 1,537 | $52,184 |
| Mean Family Income | 1,537 | $83,726 |
| Median Household Income | 2,395 | $51,415 |
| Mean Household Income | 2,395 | $72,791 |
| Income Deficit | 1,537 | $0 |
| Wage / Income Gap (%) | 6,281 | 7.35% |
| Wage / Income Gap ($) | 6,281 | 92.65¢ per $1 |
| Gini / Inequality Index | 6,281 | 0.46 |
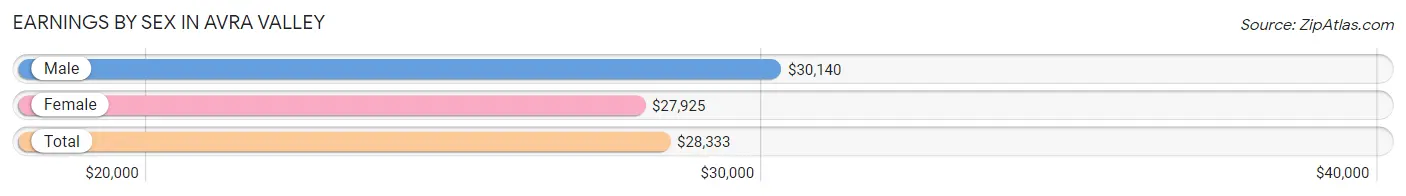
Earnings by Sex in Avra Valley
Average Earnings in Avra Valley are $28,333, $30,140 for men and $27,925 for women, a difference of 7.3%.
| Sex | Number | Average Earnings |
| Male | 1,752 (55.7%) | $30,140 |
| Female | 1,394 (44.3%) | $27,925 |
| Total | 3,146 (100.0%) | $28,333 |
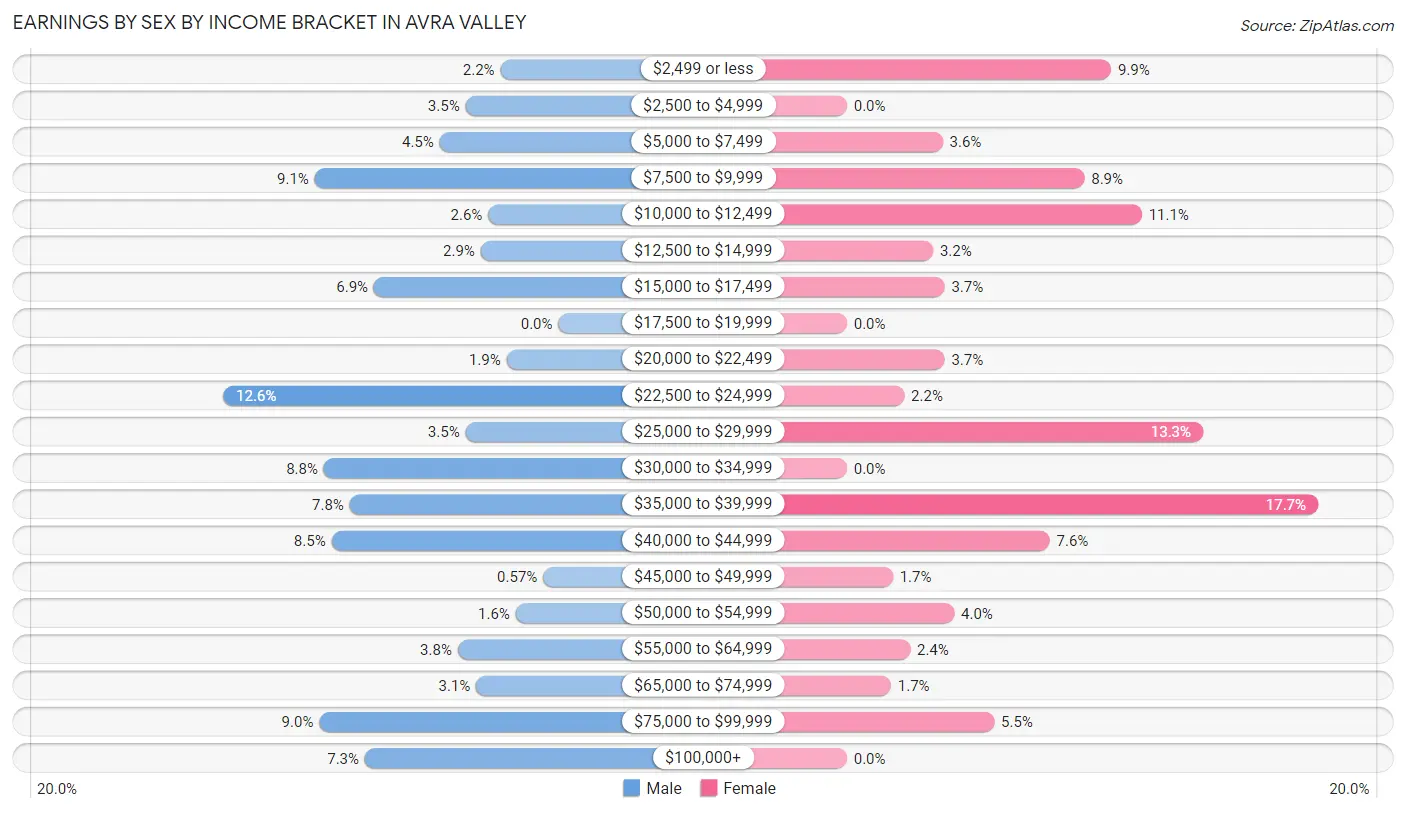
Earnings by Sex by Income Bracket in Avra Valley
The most common earnings brackets in Avra Valley are $22,500 to $24,999 for men (220 | 12.6%) and $35,000 to $39,999 for women (246 | 17.6%).
| Income | Male | Female |
| $2,499 or less | 38 (2.2%) | 138 (9.9%) |
| $2,500 to $4,999 | 61 (3.5%) | 0 (0.0%) |
| $5,000 to $7,499 | 78 (4.4%) | 50 (3.6%) |
| $7,500 to $9,999 | 160 (9.1%) | 124 (8.9%) |
| $10,000 to $12,499 | 46 (2.6%) | 154 (11.1%) |
| $12,500 to $14,999 | 51 (2.9%) | 45 (3.2%) |
| $15,000 to $17,499 | 121 (6.9%) | 51 (3.7%) |
| $17,500 to $19,999 | 0 (0.0%) | 0 (0.0%) |
| $20,000 to $22,499 | 34 (1.9%) | 51 (3.7%) |
| $22,500 to $24,999 | 220 (12.6%) | 30 (2.1%) |
| $25,000 to $29,999 | 61 (3.5%) | 186 (13.3%) |
| $30,000 to $34,999 | 154 (8.8%) | 0 (0.0%) |
| $35,000 to $39,999 | 137 (7.8%) | 246 (17.6%) |
| $40,000 to $44,999 | 149 (8.5%) | 106 (7.6%) |
| $45,000 to $49,999 | 10 (0.6%) | 24 (1.7%) |
| $50,000 to $54,999 | 28 (1.6%) | 56 (4.0%) |
| $55,000 to $64,999 | 66 (3.8%) | 33 (2.4%) |
| $65,000 to $74,999 | 54 (3.1%) | 23 (1.7%) |
| $75,000 to $99,999 | 157 (9.0%) | 77 (5.5%) |
| $100,000+ | 127 (7.2%) | 0 (0.0%) |
| Total | 1,752 (100.0%) | 1,394 (100.0%) |
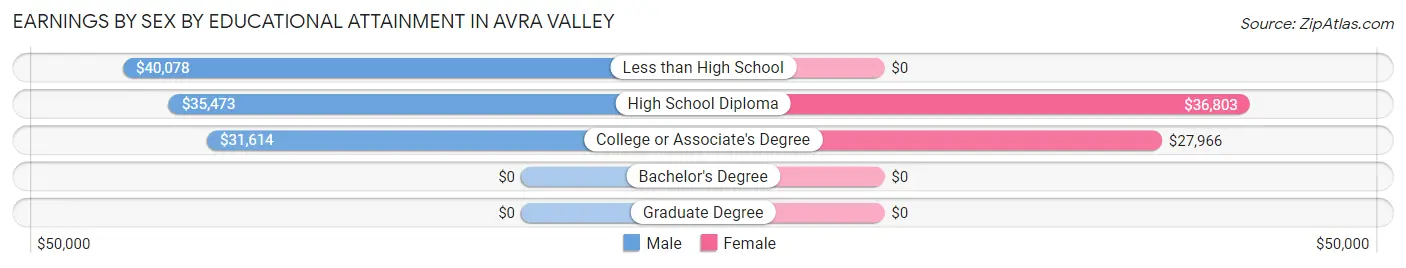
Earnings by Sex by Educational Attainment in Avra Valley
Average earnings in Avra Valley are $32,205 for men and $29,226 for women, a difference of 9.2%. Men with an educational attainment of less than high school enjoy the highest average annual earnings of $40,078, while those with college or associate's degree education earn the least with $31,614. Women with an educational attainment of high school diploma earn the most with the average annual earnings of $36,803, while those with college or associate's degree education have the smallest earnings of $27,966.
| Educational Attainment | Male Income | Female Income |
| Less than High School | $40,078 | $0 |
| High School Diploma | $35,473 | $36,803 |
| College or Associate's Degree | $31,614 | $27,966 |
| Bachelor's Degree | - | - |
| Graduate Degree | - | - |
| Total | $32,205 | $29,226 |
Family Income in Avra Valley
Family Income Brackets in Avra Valley
According to the Avra Valley family income data, there are 390 families falling into the $25,000 to $34,999 income range, which is the most common income bracket and makes up 25.4% of all families. Conversely, the less than $10,000 income bracket is the least frequent group with only 12 families (0.8%) belonging to this category.
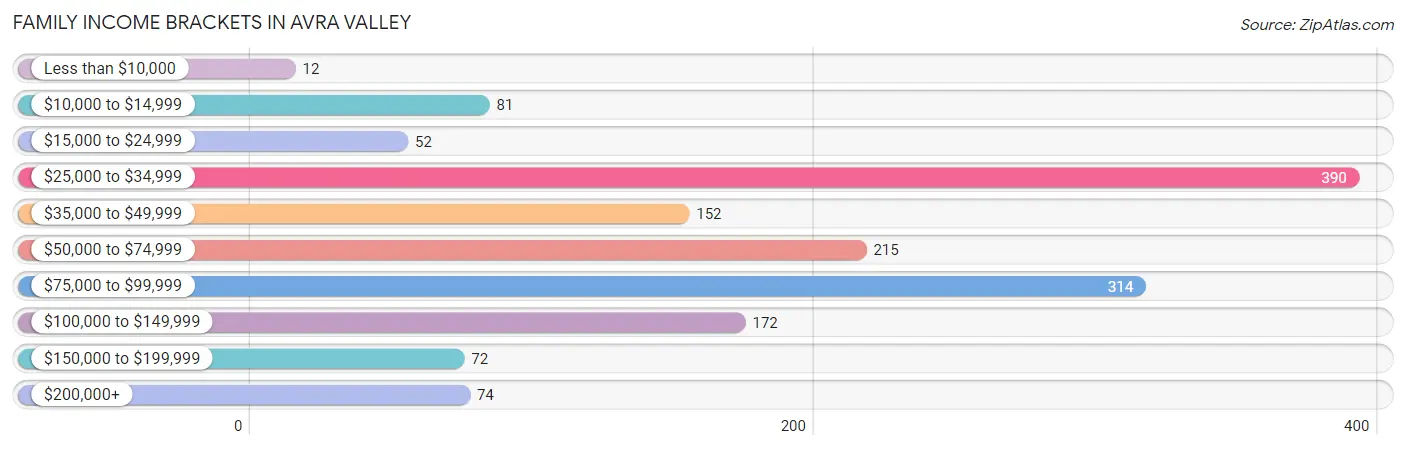
| Income Bracket | # Families | % Families |
| Less than $10,000 | 12 | 0.8% |
| $10,000 to $14,999 | 81 | 5.3% |
| $15,000 to $24,999 | 52 | 3.4% |
| $25,000 to $34,999 | 390 | 25.4% |
| $35,000 to $49,999 | 152 | 9.9% |
| $50,000 to $74,999 | 215 | 14.0% |
| $75,000 to $99,999 | 314 | 20.4% |
| $100,000 to $149,999 | 172 | 11.2% |
| $150,000 to $199,999 | 72 | 4.7% |
| $200,000+ | 74 | 4.8% |
Family Income by Famaliy Size in Avra Valley
5-person families (170 | 11.1%) account for the highest median family income in Avra Valley with $76,075 per family, while 3-person families (284 | 18.5%) have the highest median income of $24,375 per family member.
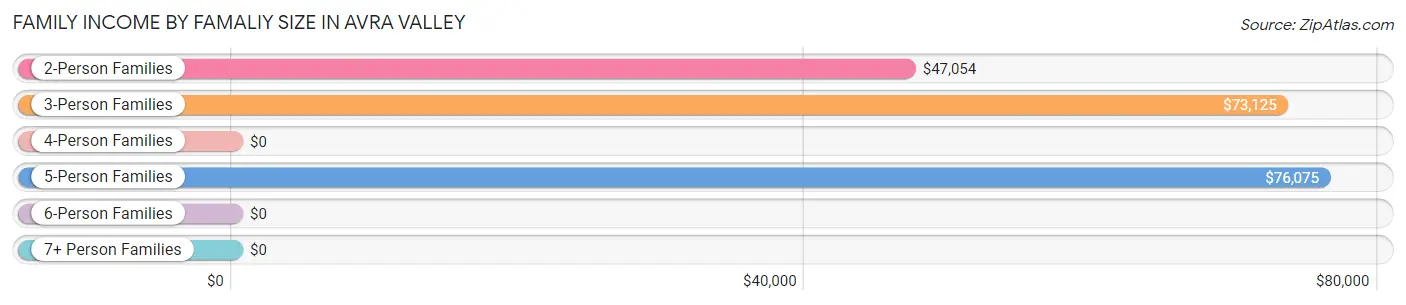
| Income Bracket | # Families | Median Income |
| 2-Person Families | 703 (45.7%) | $47,054 |
| 3-Person Families | 284 (18.5%) | $73,125 |
| 4-Person Families | 295 (19.2%) | $0 |
| 5-Person Families | 170 (11.1%) | $76,075 |
| 6-Person Families | 50 (3.3%) | $0 |
| 7+ Person Families | 35 (2.3%) | $0 |
| Total | 1,537 (100.0%) | $52,184 |
Family Income by Number of Earners in Avra Valley
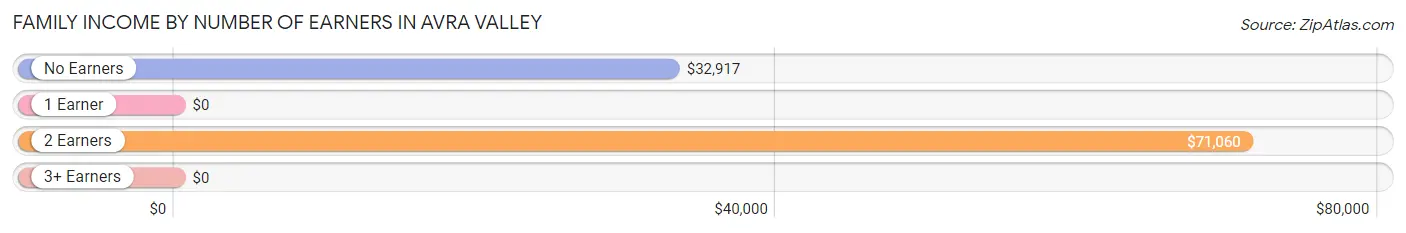
| Number of Earners | # Families | Median Income |
| No Earners | 105 (6.8%) | $32,917 |
| 1 Earner | 757 (49.2%) | $0 |
| 2 Earners | 603 (39.2%) | $71,060 |
| 3+ Earners | 72 (4.7%) | $0 |
| Total | 1,537 (100.0%) | $52,184 |
Household Income in Avra Valley
Household Income Brackets in Avra Valley
With 448 households falling in the category, the $50,000 to $74,999 income range is the most frequent in Avra Valley, accounting for 18.7% of all households. In contrast, only 53 households (2.2%) fall into the $150,000 to $199,999 income bracket, making it the least populous group.
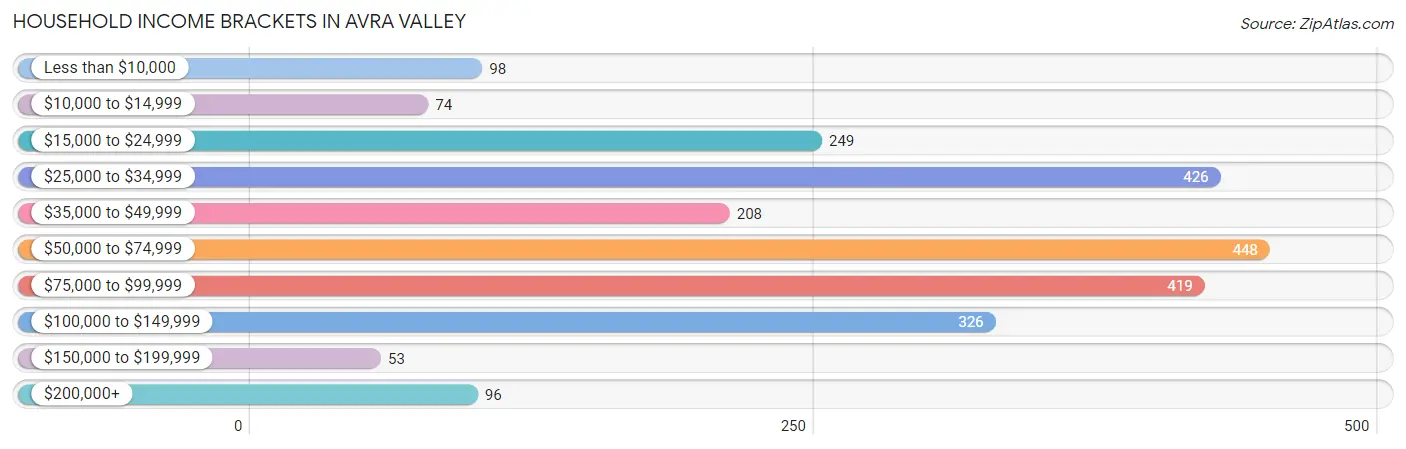
| Income Bracket | # Households | % Households |
| Less than $10,000 | 98 | 4.1% |
| $10,000 to $14,999 | 74 | 3.1% |
| $15,000 to $24,999 | 249 | 10.4% |
| $25,000 to $34,999 | 426 | 17.8% |
| $35,000 to $49,999 | 208 | 8.7% |
| $50,000 to $74,999 | 448 | 18.7% |
| $75,000 to $99,999 | 419 | 17.5% |
| $100,000 to $149,999 | 326 | 13.6% |
| $150,000 to $199,999 | 53 | 2.2% |
| $200,000+ | 96 | 4.0% |
Household Income by Householder Age in Avra Valley
The median household income in Avra Valley is $51,415, with the highest median household income of $77,132 found in the 45 to 64 years age bracket for the primary householder. A total of 1,102 households (46.0%) fall into this category. Meanwhile, the 15 to 24 years age bracket for the primary householder has the lowest median household income of $0, with 37 households (1.5%) in this group.
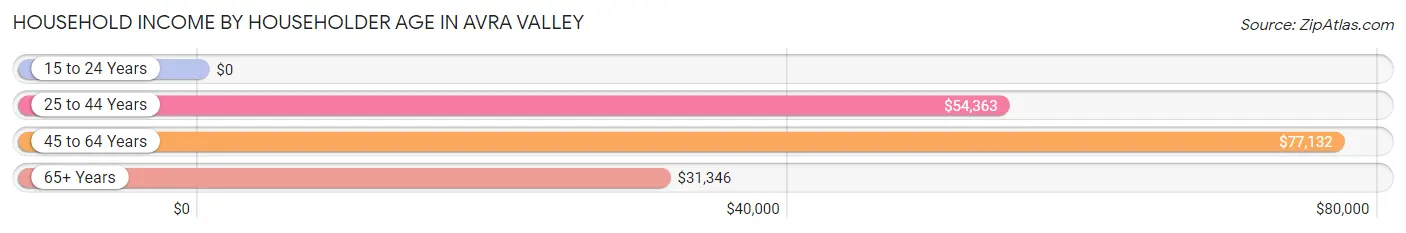
| Income Bracket | # Households | Median Income |
| 15 to 24 Years | 37 (1.5%) | $0 |
| 25 to 44 Years | 570 (23.8%) | $54,363 |
| 45 to 64 Years | 1,102 (46.0%) | $77,132 |
| 65+ Years | 686 (28.6%) | $31,346 |
| Total | 2,395 (100.0%) | $51,415 |
Poverty in Avra Valley
Income Below Poverty by Sex and Age in Avra Valley
With 20.2% poverty level for males and 20.3% for females among the residents of Avra Valley, 5 year old males and 25 to 34 year old females are the most vulnerable to poverty, with 13 males (100.0%) and 166 females (47.4%) in their respective age groups living below the poverty level.
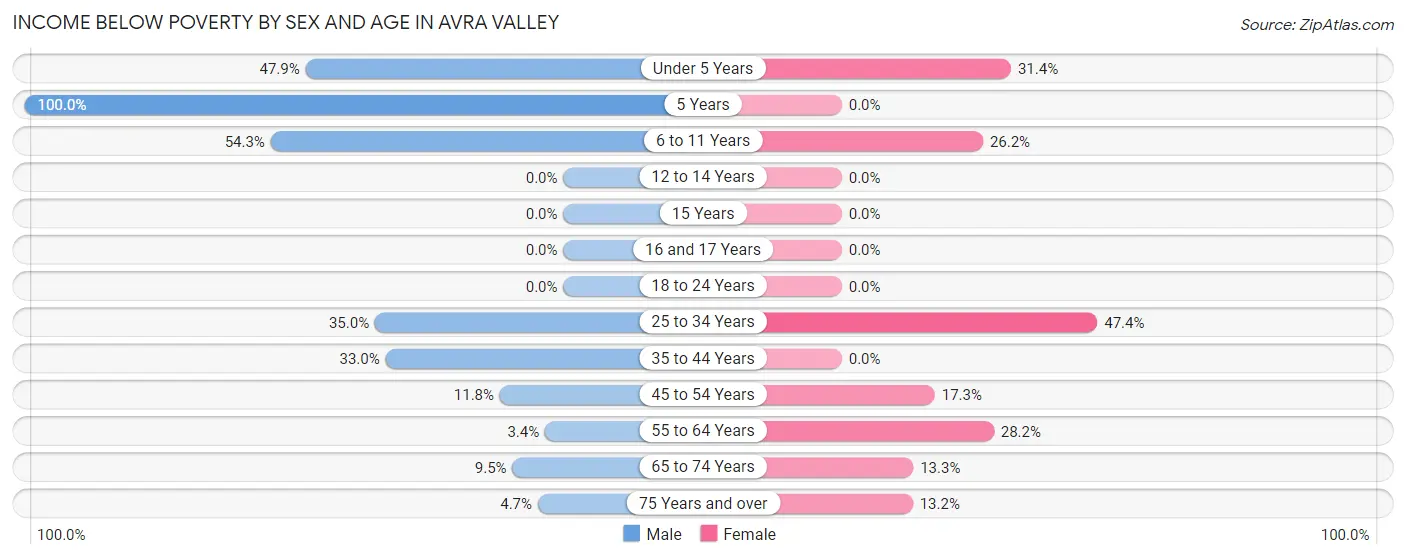
| Age Bracket | Male | Female |
| Under 5 Years | 134 (47.9%) | 76 (31.4%) |
| 5 Years | 13 (100.0%) | 0 (0.0%) |
| 6 to 11 Years | 151 (54.3%) | 98 (26.2%) |
| 12 to 14 Years | 0 (0.0%) | 0 (0.0%) |
| 15 Years | 0 (0.0%) | 0 (0.0%) |
| 16 and 17 Years | 0 (0.0%) | 0 (0.0%) |
| 18 to 24 Years | 0 (0.0%) | 0 (0.0%) |
| 25 to 34 Years | 143 (35.0%) | 166 (47.4%) |
| 35 to 44 Years | 101 (33.0%) | 0 (0.0%) |
| 45 to 54 Years | 70 (11.8%) | 73 (17.3%) |
| 55 to 64 Years | 22 (3.4%) | 121 (28.2%) |
| 65 to 74 Years | 19 (9.5%) | 57 (13.3%) |
| 75 Years and over | 8 (4.7%) | 22 (13.2%) |
| Total | 661 (20.2%) | 613 (20.3%) |
Income Above Poverty by Sex and Age in Avra Valley
According to the poverty statistics in Avra Valley, males aged 12 to 14 years and females aged 5 years are the age groups that are most secure financially, with 100.0% of males and 100.0% of females in these age groups living above the poverty line.
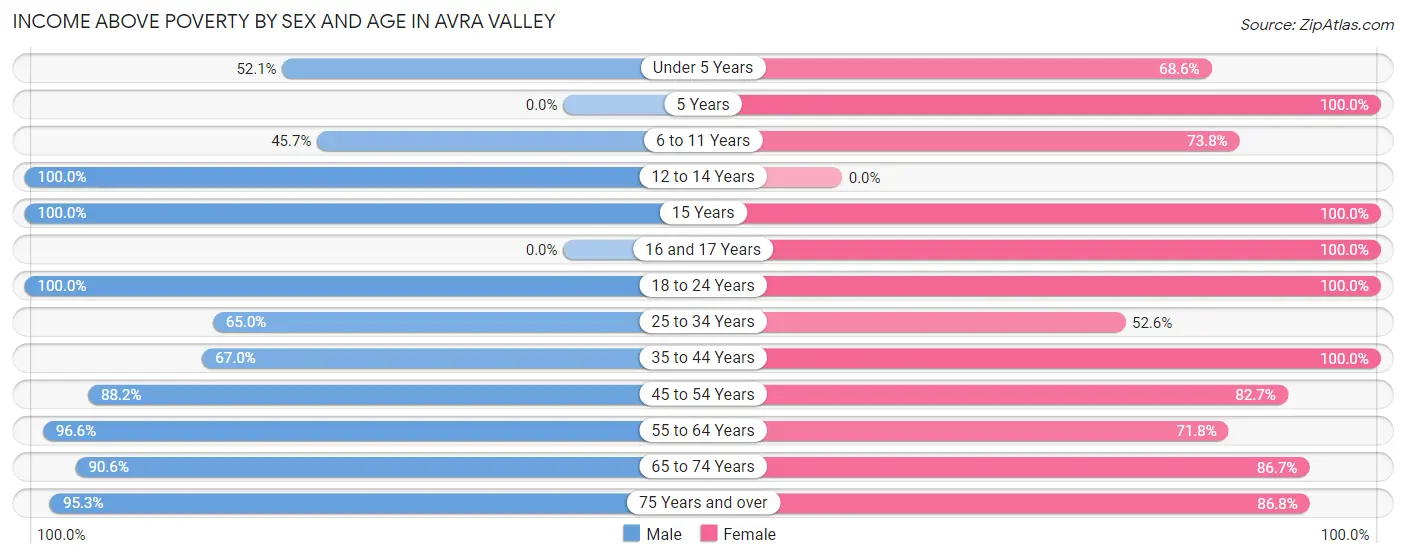
| Age Bracket | Male | Female |
| Under 5 Years | 146 (52.1%) | 166 (68.6%) |
| 5 Years | 0 (0.0%) | 19 (100.0%) |
| 6 to 11 Years | 127 (45.7%) | 276 (73.8%) |
| 12 to 14 Years | 70 (100.0%) | 0 (0.0%) |
| 15 Years | 60 (100.0%) | 28 (100.0%) |
| 16 and 17 Years | 0 (0.0%) | 58 (100.0%) |
| 18 to 24 Years | 237 (100.0%) | 334 (100.0%) |
| 25 to 34 Years | 266 (65.0%) | 184 (52.6%) |
| 35 to 44 Years | 205 (67.0%) | 161 (100.0%) |
| 45 to 54 Years | 524 (88.2%) | 350 (82.7%) |
| 55 to 64 Years | 627 (96.6%) | 308 (71.8%) |
| 65 to 74 Years | 182 (90.5%) | 373 (86.7%) |
| 75 Years and over | 161 (95.3%) | 145 (86.8%) |
| Total | 2,605 (79.8%) | 2,402 (79.7%) |
Income Below Poverty Among Married-Couple Families in Avra Valley
The poverty statistics for married-couple families in Avra Valley show that 19.0% or 199 of the total 1,046 families live below the poverty line. Families with 5 or more children have the highest poverty rate of 100.0%, comprising of 35 families. On the other hand, families with no children have the lowest poverty rate of 7.2%, which includes 41 families.
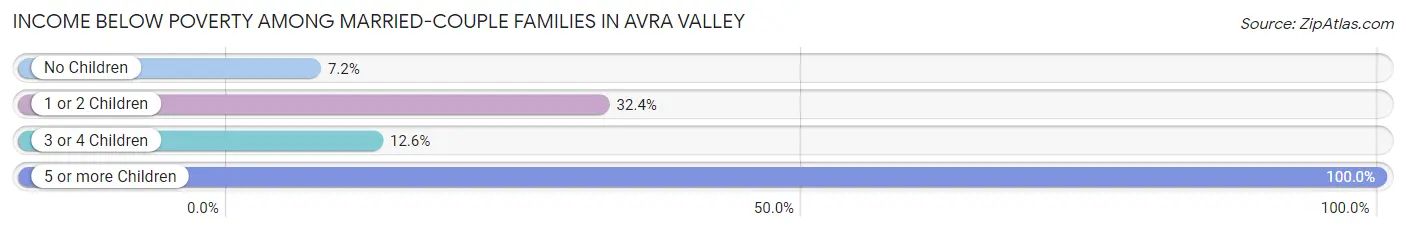
| Children | Above Poverty | Below Poverty |
| No Children | 527 (92.8%) | 41 (7.2%) |
| 1 or 2 Children | 230 (67.6%) | 110 (32.4%) |
| 3 or 4 Children | 90 (87.4%) | 13 (12.6%) |
| 5 or more Children | 0 (0.0%) | 35 (100.0%) |
| Total | 847 (81.0%) | 199 (19.0%) |
Income Below Poverty Among Single-Parent Households in Avra Valley
According to the poverty data in Avra Valley, 21.6% or 59 single-father households and 10.1% or 22 single-mother households are living below the poverty line. Among single-father households, those with 1 or 2 children have the highest poverty rate, with 51 households (22.8%) experiencing poverty. Likewise, among single-mother households, those with 1 or 2 children have the highest poverty rate, with 10 households (32.3%) falling below the poverty line.
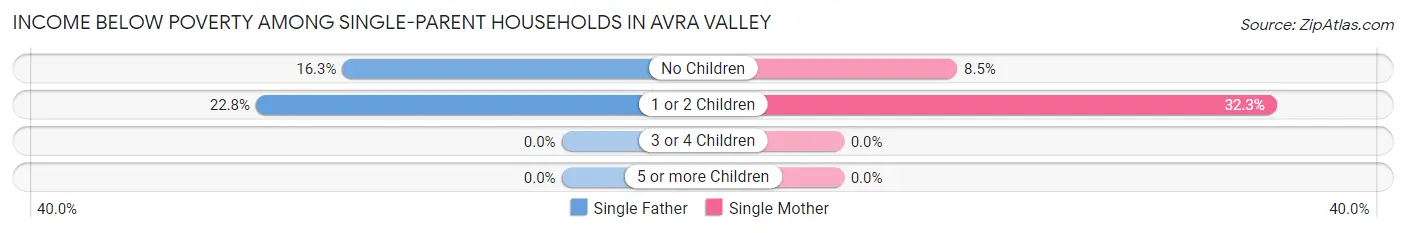
| Children | Single Father | Single Mother |
| No Children | 8 (16.3%) | 12 (8.5%) |
| 1 or 2 Children | 51 (22.8%) | 10 (32.3%) |
| 3 or 4 Children | 0 (0.0%) | 0 (0.0%) |
| 5 or more Children | 0 (0.0%) | 0 (0.0%) |
| Total | 59 (21.6%) | 22 (10.1%) |
Income Below Poverty Among Married-Couple vs Single-Parent Households in Avra Valley
The poverty data for Avra Valley shows that 199 of the married-couple family households (19.0%) and 81 of the single-parent households (16.5%) are living below the poverty level. Within the married-couple family households, those with 5 or more children have the highest poverty rate, with 35 households (100.0%) falling below the poverty line. Among the single-parent households, those with 1 or 2 children have the highest poverty rate, with 61 household (23.9%) living below poverty.
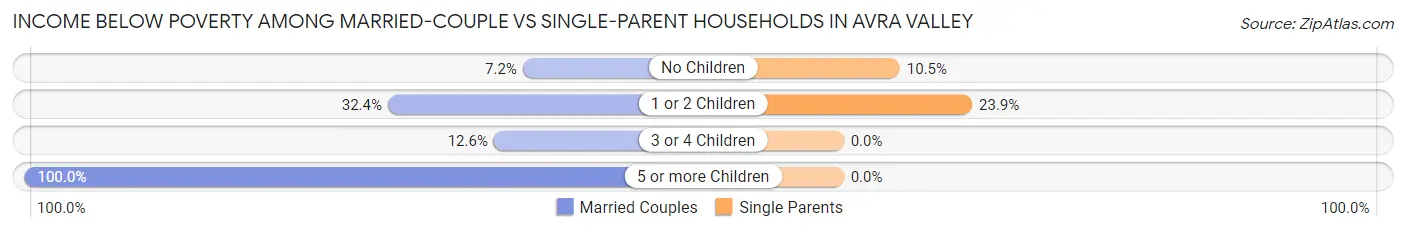
| Children | Married-Couple Families | Single-Parent Households |
| No Children | 41 (7.2%) | 20 (10.5%) |
| 1 or 2 Children | 110 (32.4%) | 61 (23.9%) |
| 3 or 4 Children | 13 (12.6%) | 0 (0.0%) |
| 5 or more Children | 35 (100.0%) | 0 (0.0%) |
| Total | 199 (19.0%) | 81 (16.5%) |
Race in Avra Valley
The most populous races in Avra Valley are White / Caucasian (5,254 | 83.7%), Hispanic or Latino (1,075 | 17.1%), and Two or more Races (650 | 10.3%).
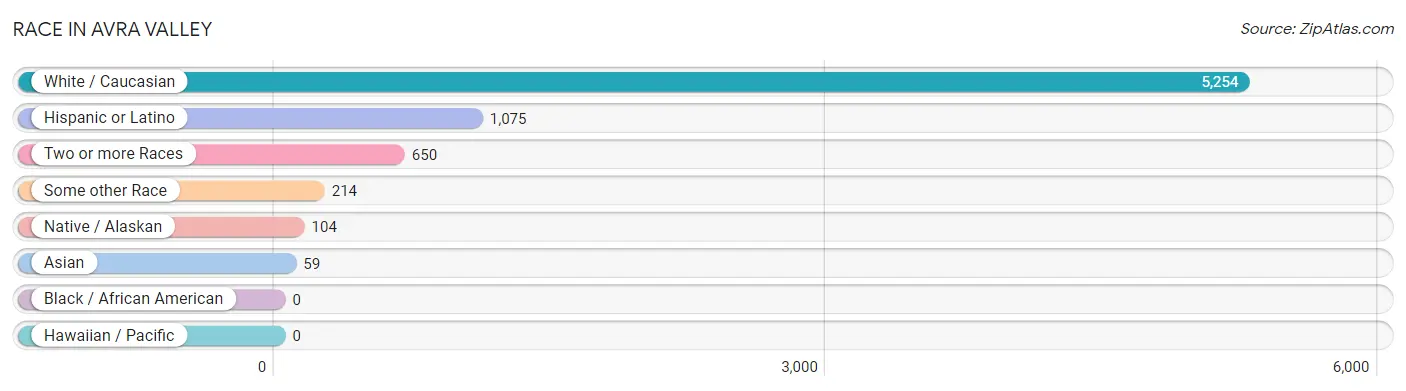
| Race | # Population | % Population |
| Asian | 59 | 0.9% |
| Black / African American | 0 | 0.0% |
| Hawaiian / Pacific | 0 | 0.0% |
| Hispanic or Latino | 1,075 | 17.1% |
| Native / Alaskan | 104 | 1.7% |
| White / Caucasian | 5,254 | 83.7% |
| Two or more Races | 650 | 10.3% |
| Some other Race | 214 | 3.4% |
| Total | 6,281 | 100.0% |
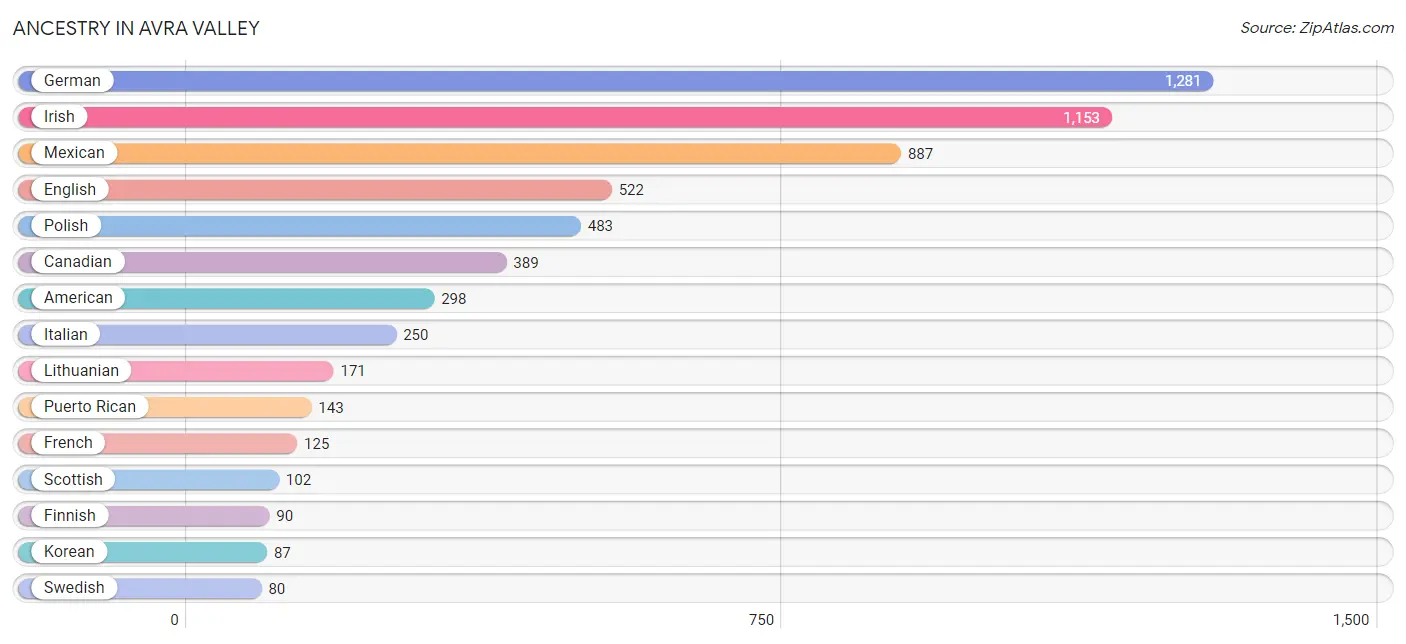
Ancestry in Avra Valley
The most populous ancestries reported in Avra Valley are German (1,281 | 20.4%), Irish (1,153 | 18.4%), Mexican (887 | 14.1%), English (522 | 8.3%), and Polish (483 | 7.7%), together accounting for 68.9% of all Avra Valley residents.
| Ancestry | # Population | % Population |
| American | 298 | 4.7% |
| British | 61 | 1.0% |
| Burmese | 27 | 0.4% |
| Canadian | 389 | 6.2% |
| Cherokee | 49 | 0.8% |
| Czechoslovakian | 15 | 0.2% |
| Danish | 72 | 1.1% |
| English | 522 | 8.3% |
| European | 23 | 0.4% |
| Finnish | 90 | 1.4% |
| French | 125 | 2.0% |
| French Canadian | 11 | 0.2% |
| German | 1,281 | 20.4% |
| Greek | 11 | 0.2% |
| Indian (Asian) | 28 | 0.4% |
| Irish | 1,153 | 18.4% |
| Italian | 250 | 4.0% |
| Korean | 87 | 1.4% |
| Lithuanian | 171 | 2.7% |
| Mexican | 887 | 14.1% |
| Native Hawaiian | 42 | 0.7% |
| Navajo | 67 | 1.1% |
| Norwegian | 41 | 0.6% |
| Polish | 483 | 7.7% |
| Portuguese | 13 | 0.2% |
| Puerto Rican | 143 | 2.3% |
| Russian | 14 | 0.2% |
| Scotch-Irish | 76 | 1.2% |
| Scottish | 102 | 1.6% |
| Seminole | 9 | 0.1% |
| Slovak | 15 | 0.2% |
| Spaniard | 45 | 0.7% |
| Swedish | 80 | 1.3% |
| Ukrainian | 50 | 0.8% |
| Yaqui | 16 | 0.3% | View All 35 Rows |
Immigrants in Avra Valley
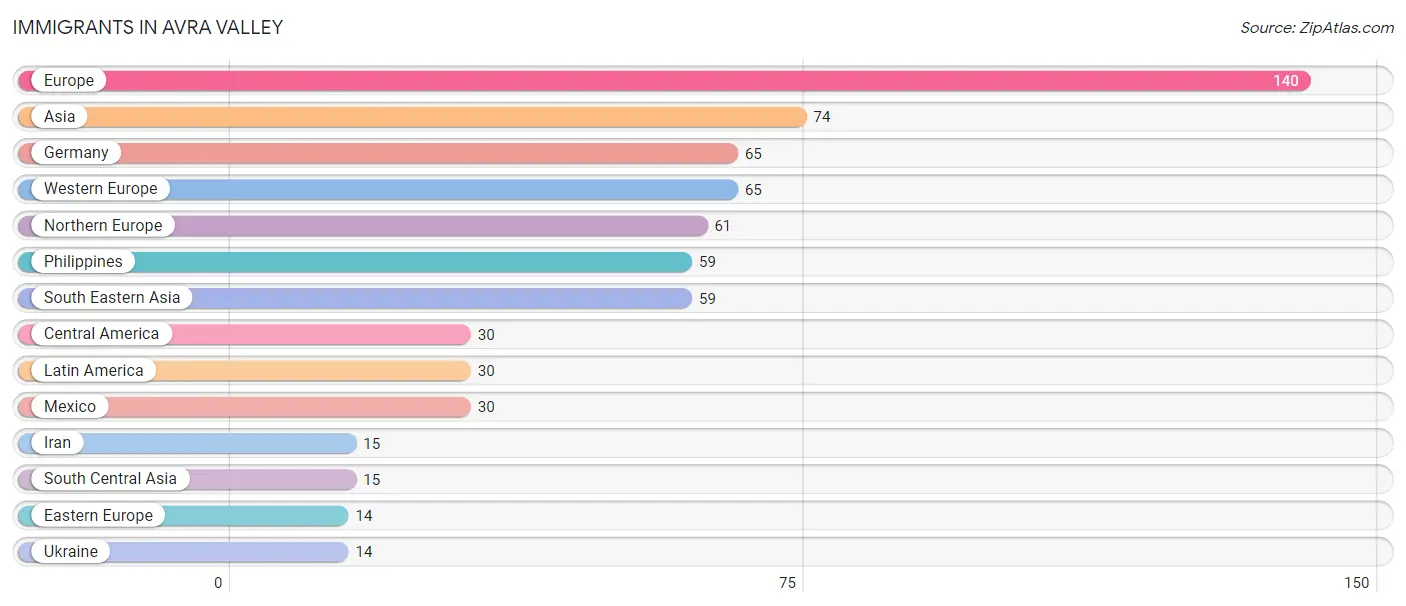
The most numerous immigrant groups reported in Avra Valley came from Europe (140 | 2.2%), Asia (74 | 1.2%), Germany (65 | 1.0%), Western Europe (65 | 1.0%), and Northern Europe (61 | 1.0%), together accounting for 6.4% of all Avra Valley residents.
| Immigration Origin | # Population | % Population |
| Asia | 74 | 1.2% |
| Central America | 30 | 0.5% |
| Eastern Europe | 14 | 0.2% |
| Europe | 140 | 2.2% |
| Germany | 65 | 1.0% |
| Iran | 15 | 0.2% |
| Latin America | 30 | 0.5% |
| Mexico | 30 | 0.5% |
| Northern Europe | 61 | 1.0% |
| Philippines | 59 | 0.9% |
| South Central Asia | 15 | 0.2% |
| South Eastern Asia | 59 | 0.9% |
| Ukraine | 14 | 0.2% |
| Western Europe | 65 | 1.0% | View All 14 Rows |
Sex and Age in Avra Valley
Sex and Age in Avra Valley
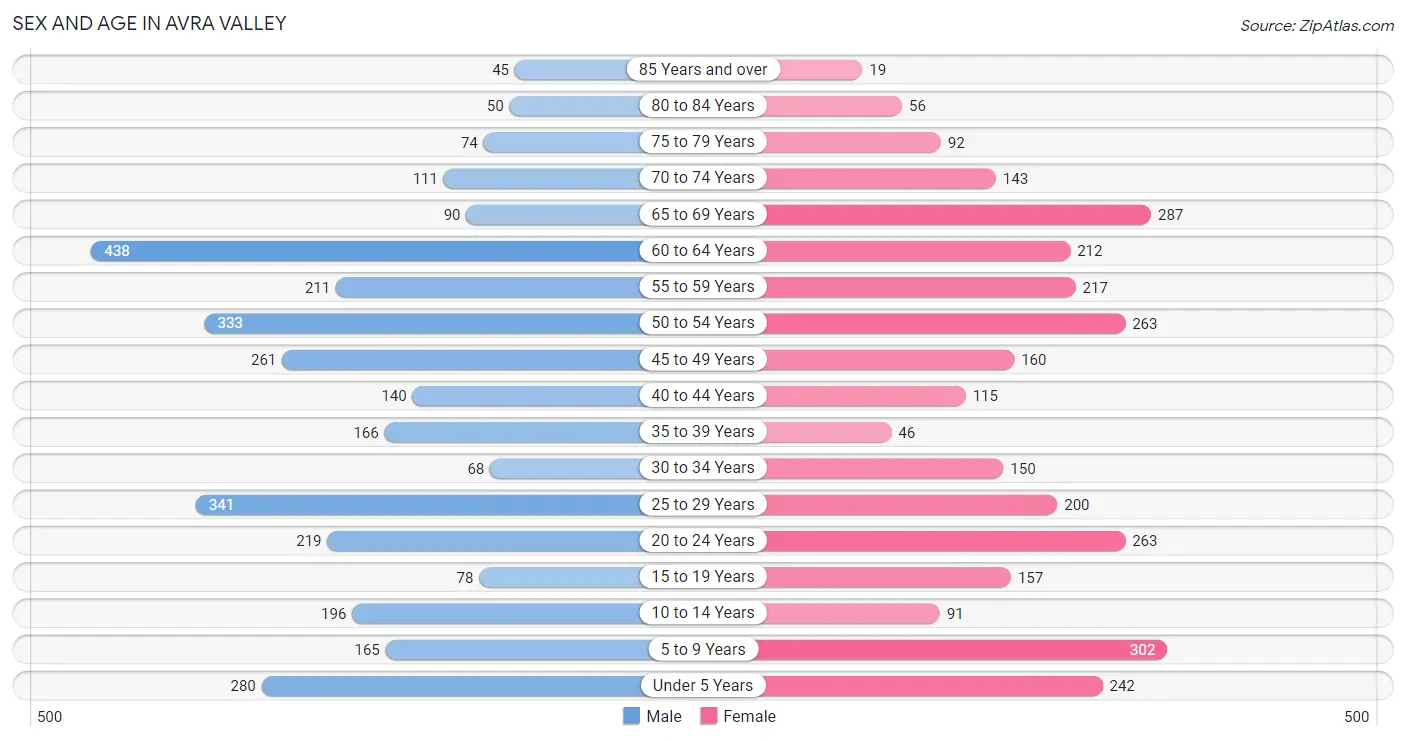
The most populous age groups in Avra Valley are 60 to 64 Years (438 | 13.4%) for men and 5 to 9 Years (302 | 10.0%) for women.
| Age Bracket | Male | Female |
| Under 5 Years | 280 (8.6%) | 242 (8.0%) |
| 5 to 9 Years | 165 (5.1%) | 302 (10.0%) |
| 10 to 14 Years | 196 (6.0%) | 91 (3.0%) |
| 15 to 19 Years | 78 (2.4%) | 157 (5.2%) |
| 20 to 24 Years | 219 (6.7%) | 263 (8.7%) |
| 25 to 29 Years | 341 (10.4%) | 200 (6.6%) |
| 30 to 34 Years | 68 (2.1%) | 150 (5.0%) |
| 35 to 39 Years | 166 (5.1%) | 46 (1.5%) |
| 40 to 44 Years | 140 (4.3%) | 115 (3.8%) |
| 45 to 49 Years | 261 (8.0%) | 160 (5.3%) |
| 50 to 54 Years | 333 (10.2%) | 263 (8.7%) |
| 55 to 59 Years | 211 (6.5%) | 217 (7.2%) |
| 60 to 64 Years | 438 (13.4%) | 212 (7.0%) |
| 65 to 69 Years | 90 (2.8%) | 287 (9.5%) |
| 70 to 74 Years | 111 (3.4%) | 143 (4.7%) |
| 75 to 79 Years | 74 (2.3%) | 92 (3.0%) |
| 80 to 84 Years | 50 (1.5%) | 56 (1.9%) |
| 85 Years and over | 45 (1.4%) | 19 (0.6%) |
| Total | 3,266 (100.0%) | 3,015 (100.0%) |
Families and Households in Avra Valley
Median Family Size in Avra Valley
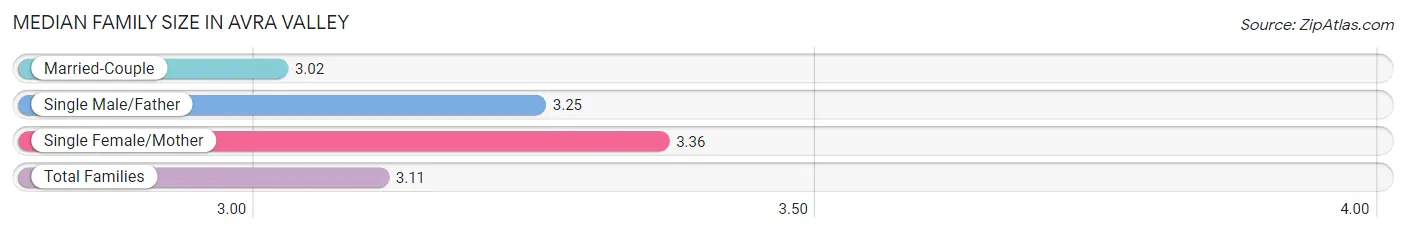
The median family size in Avra Valley is 3.11 persons per family, with single female/mother families (218 | 14.2%) accounting for the largest median family size of 3.36 persons per family. On the other hand, married-couple families (1,046 | 68.0%) represent the smallest median family size with 3.02 persons per family.
| Family Type | # Families | Family Size |
| Married-Couple | 1,046 (68.0%) | 3.02 |
| Single Male/Father | 273 (17.8%) | 3.25 |
| Single Female/Mother | 218 (14.2%) | 3.36 |
| Total Families | 1,537 (100.0%) | 3.11 |
Median Household Size in Avra Valley
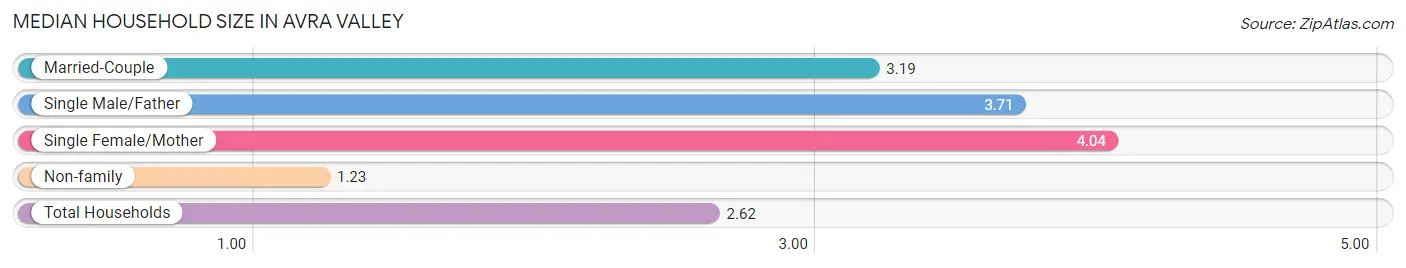
The median household size in Avra Valley is 2.62 persons per household, with single female/mother households (218 | 9.1%) accounting for the largest median household size of 4.04 persons per household. non-family households (858 | 35.8%) represent the smallest median household size with 1.23 persons per household.
| Household Type | # Households | Household Size |
| Married-Couple | 1,046 (43.7%) | 3.19 |
| Single Male/Father | 273 (11.4%) | 3.71 |
| Single Female/Mother | 218 (9.1%) | 4.04 |
| Non-family | 858 (35.8%) | 1.23 |
| Total Households | 2,395 (100.0%) | 2.62 |
Household Size by Marriage Status in Avra Valley
Out of a total of 2,395 households in Avra Valley, 1,537 (64.2%) are family households, while 858 (35.8%) are nonfamily households. The most numerous type of family households are 2-person households, comprising 616, and the most common type of nonfamily households are 1-person households, comprising 673.
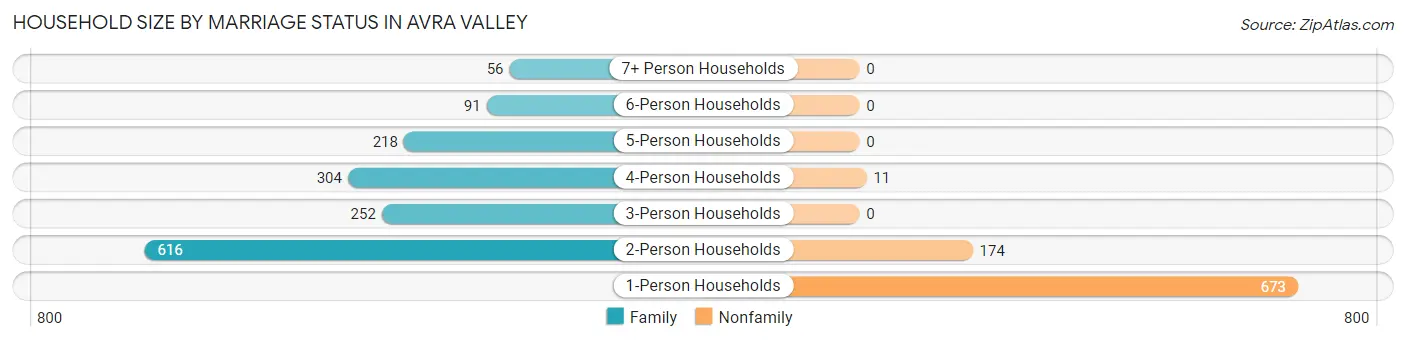
| Household Size | Family Households | Nonfamily Households |
| 1-Person Households | - | 673 (28.1%) |
| 2-Person Households | 616 (25.7%) | 174 (7.3%) |
| 3-Person Households | 252 (10.5%) | 0 (0.0%) |
| 4-Person Households | 304 (12.7%) | 11 (0.5%) |
| 5-Person Households | 218 (9.1%) | 0 (0.0%) |
| 6-Person Households | 91 (3.8%) | 0 (0.0%) |
| 7+ Person Households | 56 (2.3%) | 0 (0.0%) |
| Total | 1,537 (64.2%) | 858 (35.8%) |
Female Fertility in Avra Valley
Fertility by Age in Avra Valley
Average fertility rate in Avra Valley is 63.0 births per 1,000 women. Women in the age bracket of 20 to 34 years have the highest fertility rate with 114.0 births per 1,000 women. Women in the age bracket of 20 to 34 years acount for 100.0% of all women with births.
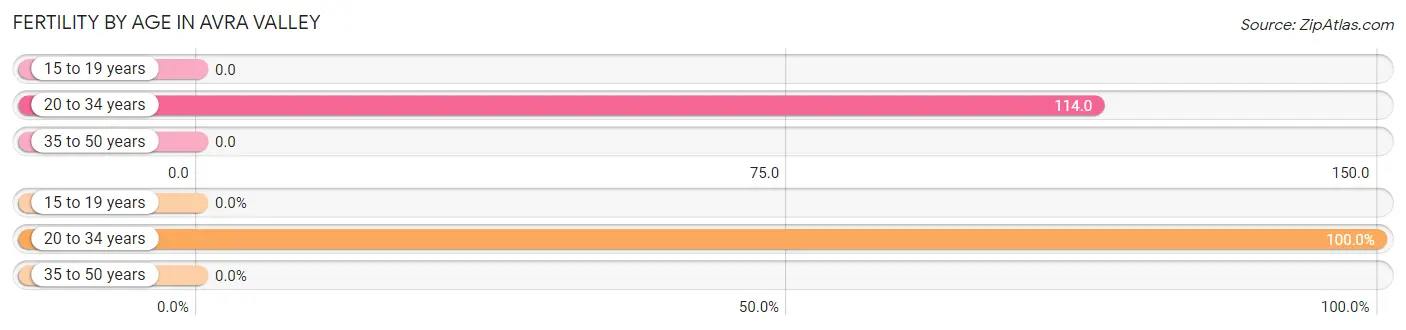
| Age Bracket | Women with Births | Births / 1,000 Women |
| 15 to 19 years | 0 (0.0%) | 0.0 |
| 20 to 34 years | 70 (100.0%) | 114.0 |
| 35 to 50 years | 0 (0.0%) | 0.0 |
| Total | 70 (100.0%) | 63.0 |
Fertility by Age by Marriage Status in Avra Valley
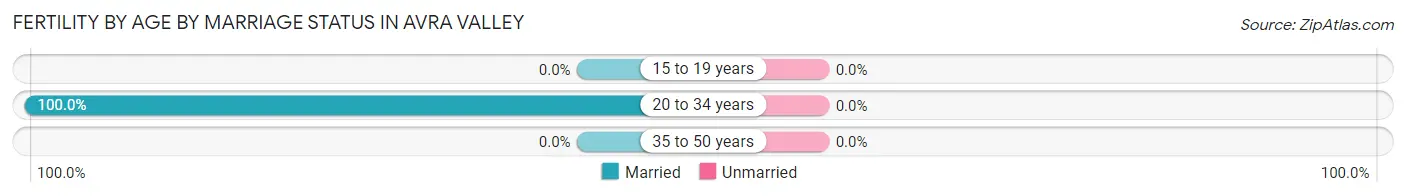
| Age Bracket | Married | Unmarried |
| 15 to 19 years | 0 (0.0%) | 0 (0.0%) |
| 20 to 34 years | 70 (100.0%) | 0 (0.0%) |
| 35 to 50 years | 0 (0.0%) | 0 (0.0%) |
| Total | 70 (100.0%) | 0 (0.0%) |
Fertility by Education in Avra Valley
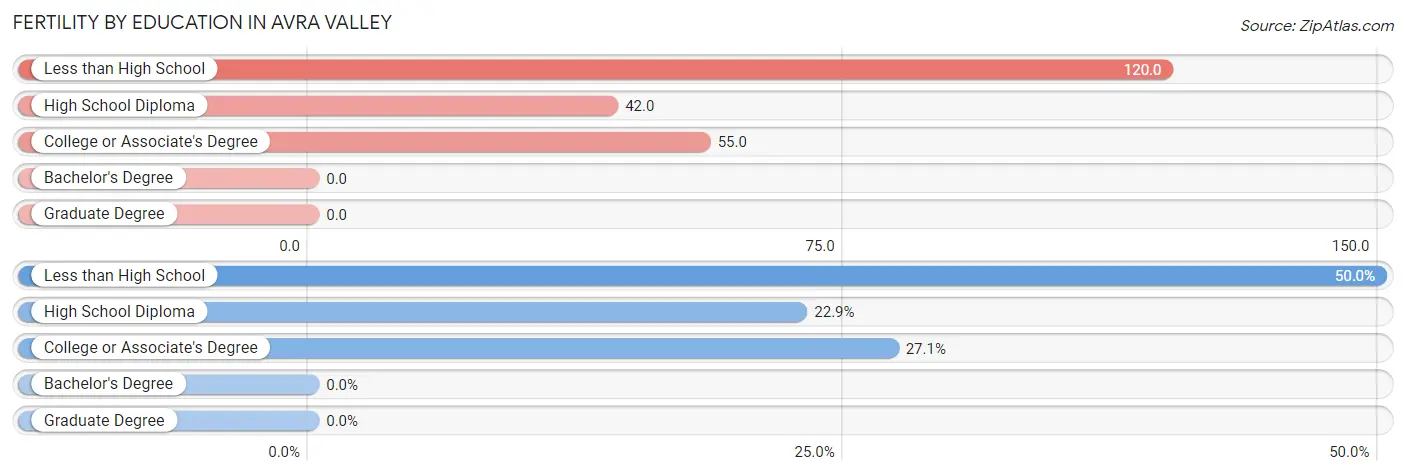
| Educational Attainment | Women with Births | Births / 1,000 Women |
| Less than High School | 35 (50.0%) | 120.0 |
| High School Diploma | 16 (22.9%) | 42.0 |
| College or Associate's Degree | 19 (27.1%) | 55.0 |
| Bachelor's Degree | 0 (0.0%) | 0.0 |
| Graduate Degree | 0 (0.0%) | 0.0 |
| Total | 70 (100.0%) | 63.0 |
Fertility by Education by Marriage Status in Avra Valley
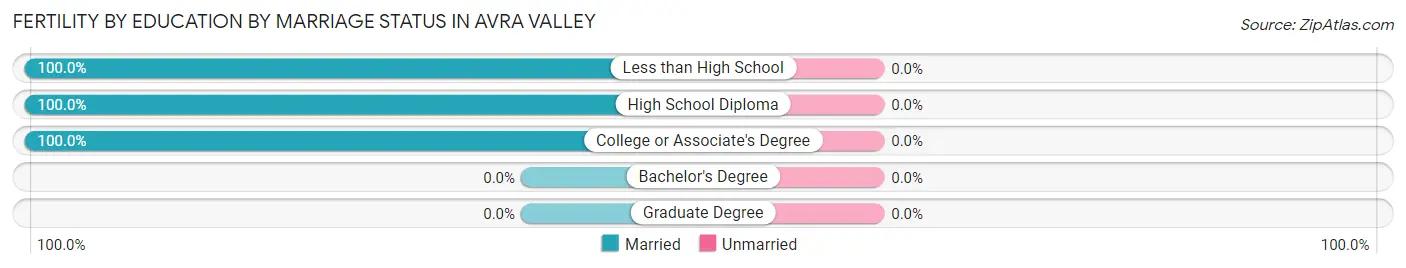
| Educational Attainment | Married | Unmarried |
| Less than High School | 35 (100.0%) | 0 (0.0%) |
| High School Diploma | 16 (100.0%) | 0 (0.0%) |
| College or Associate's Degree | 19 (100.0%) | 0 (0.0%) |
| Bachelor's Degree | 0 (0.0%) | 0 (0.0%) |
| Graduate Degree | 0 (0.0%) | 0 (0.0%) |
| Total | 70 (100.0%) | 0 (0.0%) |
Employment Characteristics in Avra Valley
Employment by Class of Employer in Avra Valley
Among the 2,859 employed individuals in Avra Valley, private company employees (2,086 | 73.0%), federal government employees (242 | 8.5%), and state government employees (173 | 6.0%) make up the most common classes of employment.
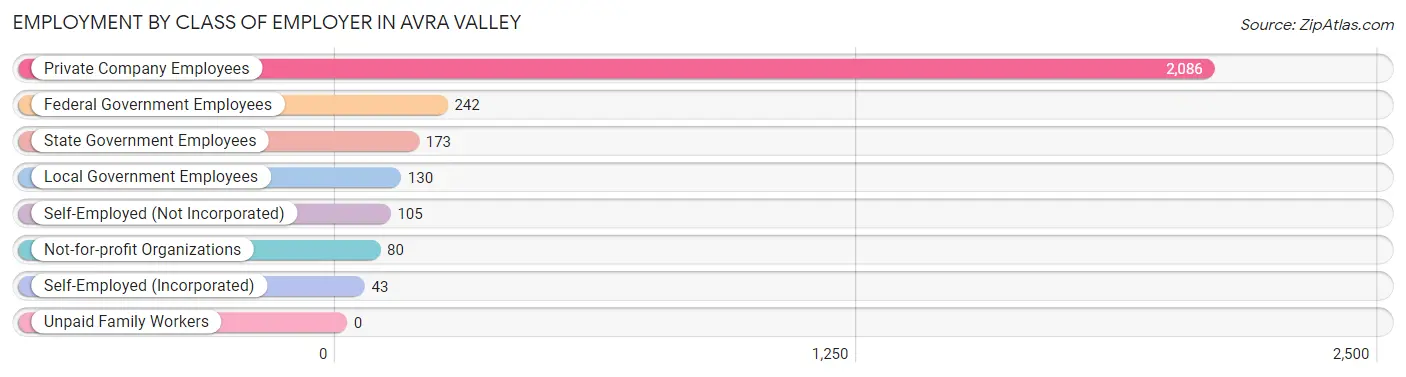
| Employer Class | # Employees | % Employees |
| Private Company Employees | 2,086 | 73.0% |
| Self-Employed (Incorporated) | 43 | 1.5% |
| Self-Employed (Not Incorporated) | 105 | 3.7% |
| Not-for-profit Organizations | 80 | 2.8% |
| Local Government Employees | 130 | 4.5% |
| State Government Employees | 173 | 6.0% |
| Federal Government Employees | 242 | 8.5% |
| Unpaid Family Workers | 0 | 0.0% |
| Total | 2,859 | 100.0% |
Employment Status by Age in Avra Valley
According to the labor force statistics for Avra Valley, out of the total population over 16 years of age (4,917), 64.4% or 3,167 individuals are in the labor force, with 9.8% or 310 of them unemployed. The age group with the highest labor force participation rate is 20 to 24 years, with 100.0% or 482 individuals in the labor force. Within the labor force, the 16 to 19 years age range has the highest percentage of unemployed individuals, with 37.7% or 29 of them being unemployed.
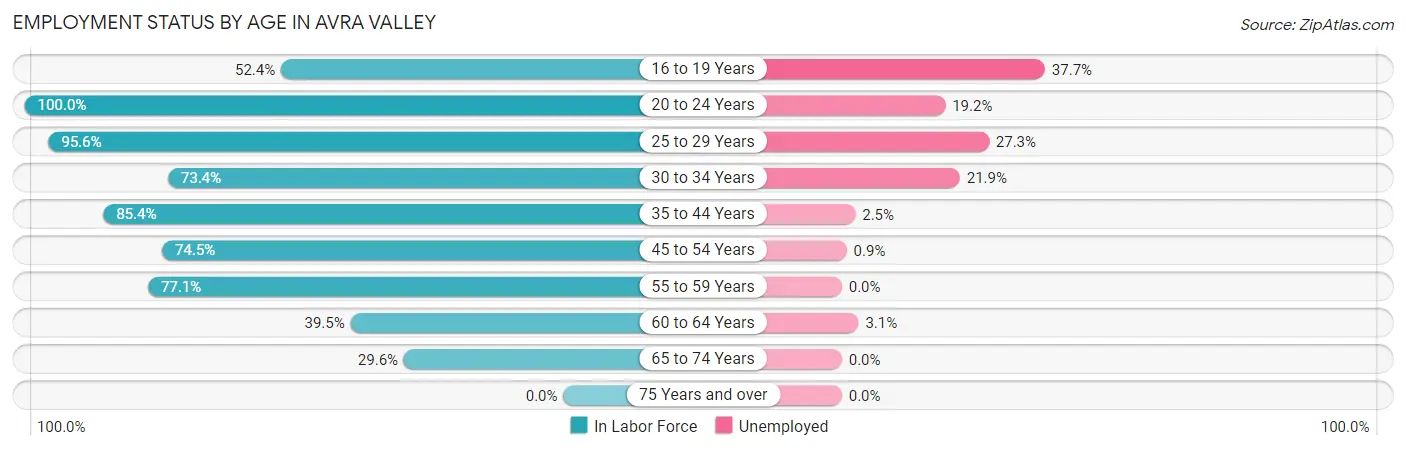
| Age Bracket | In Labor Force | Unemployed |
| 16 to 19 Years | 77 (52.4%) | 29 (37.7%) |
| 20 to 24 Years | 482 (100.0%) | 93 (19.2%) |
| 25 to 29 Years | 517 (95.6%) | 141 (27.3%) |
| 30 to 34 Years | 160 (73.4%) | 35 (21.9%) |
| 35 to 44 Years | 399 (85.4%) | 10 (2.5%) |
| 45 to 54 Years | 758 (74.5%) | 7 (0.9%) |
| 55 to 59 Years | 330 (77.1%) | 0 (0.0%) |
| 60 to 64 Years | 257 (39.5%) | 8 (3.1%) |
| 65 to 74 Years | 187 (29.6%) | 0 (0.0%) |
| 75 Years and over | 0 (0.0%) | 0 (0.0%) |
| Total | 3,167 (64.4%) | 310 (9.8%) |
Employment Status by Educational Attainment in Avra Valley
According to labor force statistics for Avra Valley, 72.9% of individuals (2,421) out of the total population between 25 and 64 years of age (3,321) are in the labor force, with 8.3% or 201 of them being unemployed. The group with the highest labor force participation rate are those with the educational attainment of bachelor's degree or higher, with 80.0% or 320 individuals in the labor force. Within the labor force, individuals with less than high school education have the highest percentage of unemployment, with 18.1% or 45 of them being unemployed.
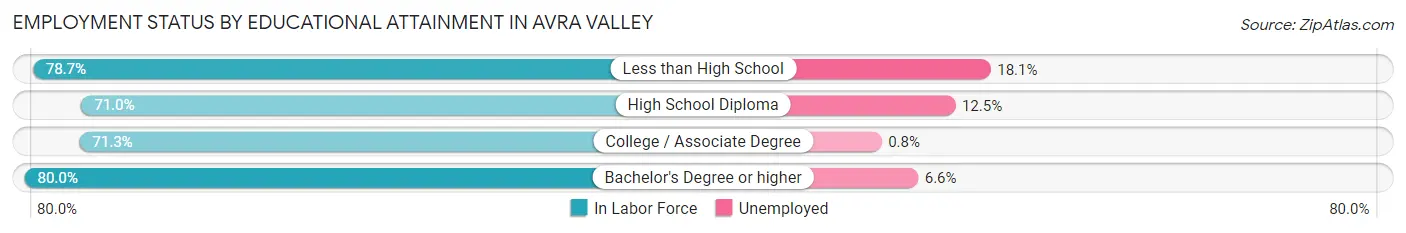
| Educational Attainment | In Labor Force | Unemployed |
| Less than High School | 248 (78.7%) | 57 (18.1%) |
| High School Diploma | 1,022 (71.0%) | 180 (12.5%) |
| College / Associate Degree | 832 (71.3%) | 9 (0.8%) |
| Bachelor's Degree or higher | 320 (80.0%) | 26 (6.6%) |
| Total | 2,421 (72.9%) | 276 (8.3%) |
Employment Occupations by Sex in Avra Valley
Management, Business, Science and Arts Occupations
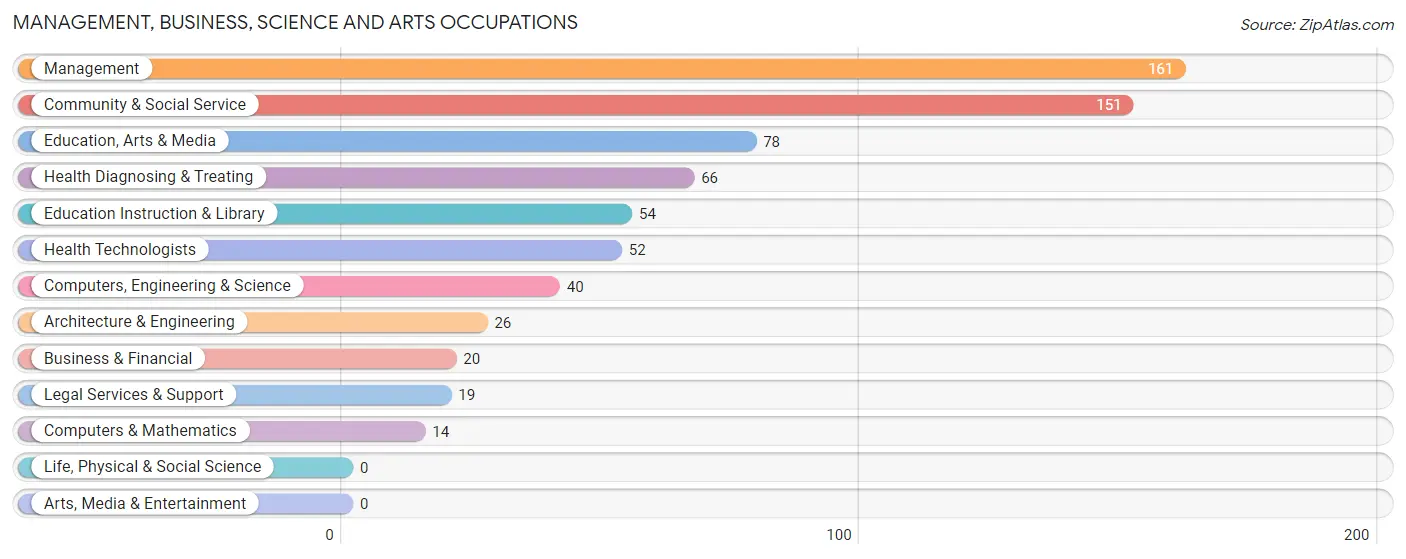
The most common Management, Business, Science and Arts occupations in Avra Valley are Management (161 | 5.9%), Community & Social Service (151 | 5.5%), Education, Arts & Media (78 | 2.9%), Health Diagnosing & Treating (66 | 2.4%), and Education Instruction & Library (54 | 2.0%).
Management, Business, Science and Arts Occupations by Sex
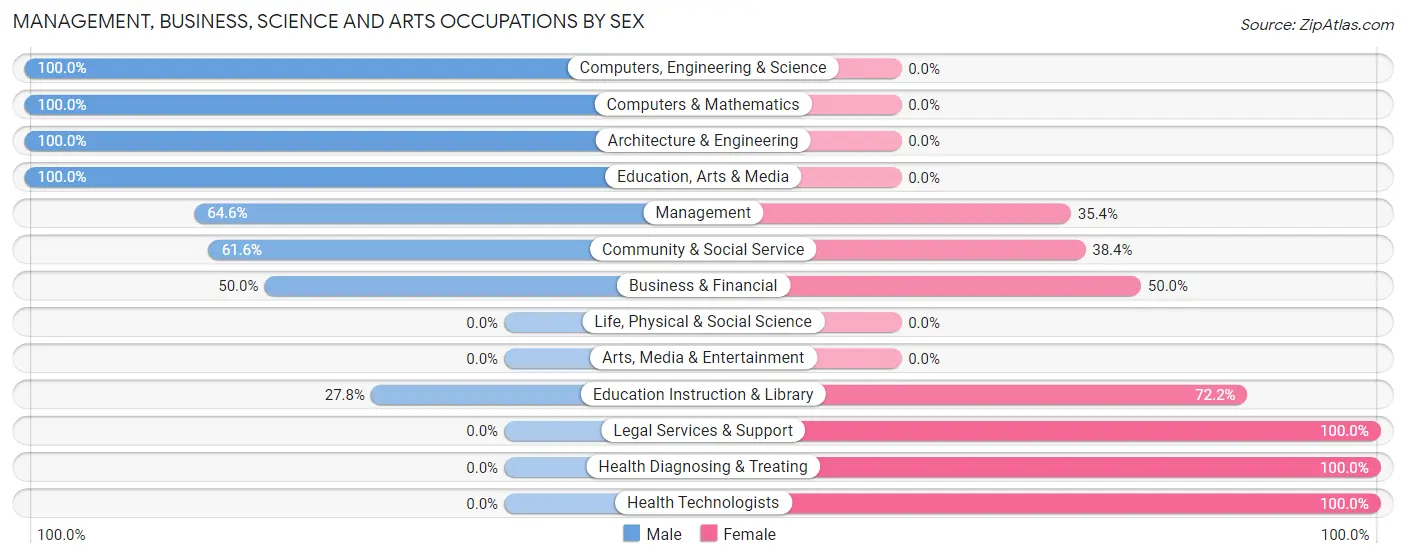
Within the Management, Business, Science and Arts occupations in Avra Valley, the most male-oriented occupations are Computers, Engineering & Science (100.0%), Computers & Mathematics (100.0%), and Architecture & Engineering (100.0%), while the most female-oriented occupations are Legal Services & Support (100.0%), Health Diagnosing & Treating (100.0%), and Health Technologists (100.0%).
| Occupation | Male | Female |
| Management | 104 (64.6%) | 57 (35.4%) |
| Business & Financial | 10 (50.0%) | 10 (50.0%) |
| Computers, Engineering & Science | 40 (100.0%) | 0 (0.0%) |
| Computers & Mathematics | 14 (100.0%) | 0 (0.0%) |
| Architecture & Engineering | 26 (100.0%) | 0 (0.0%) |
| Life, Physical & Social Science | 0 (0.0%) | 0 (0.0%) |
| Community & Social Service | 93 (61.6%) | 58 (38.4%) |
| Education, Arts & Media | 78 (100.0%) | 0 (0.0%) |
| Legal Services & Support | 0 (0.0%) | 19 (100.0%) |
| Education Instruction & Library | 15 (27.8%) | 39 (72.2%) |
| Arts, Media & Entertainment | 0 (0.0%) | 0 (0.0%) |
| Health Diagnosing & Treating | 0 (0.0%) | 66 (100.0%) |
| Health Technologists | 0 (0.0%) | 52 (100.0%) |
| Total (Category) | 247 (56.4%) | 191 (43.6%) |
| Total (Overall) | 1,470 (53.9%) | 1,259 (46.1%) |
Services Occupations
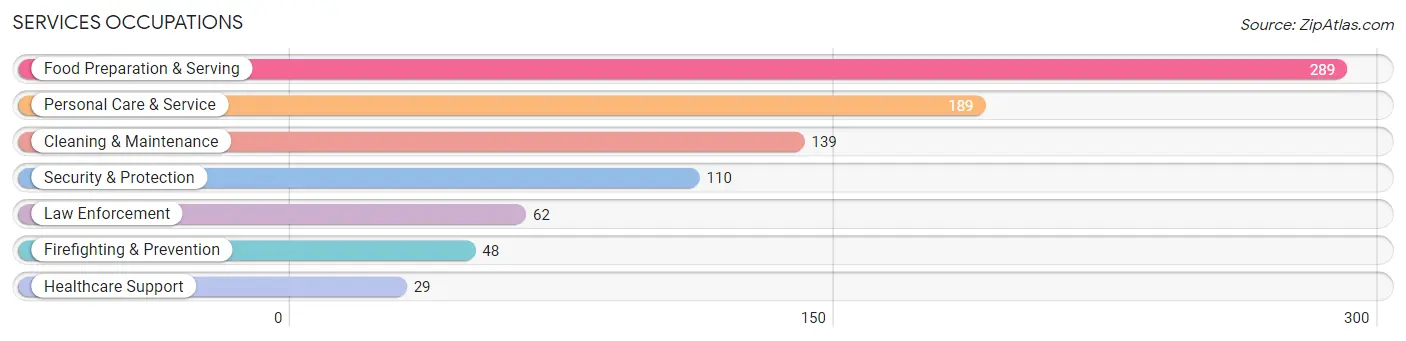
The most common Services occupations in Avra Valley are Food Preparation & Serving (289 | 10.6%), Personal Care & Service (189 | 6.9%), Cleaning & Maintenance (139 | 5.1%), Security & Protection (110 | 4.0%), and Law Enforcement (62 | 2.3%).
Services Occupations by Sex
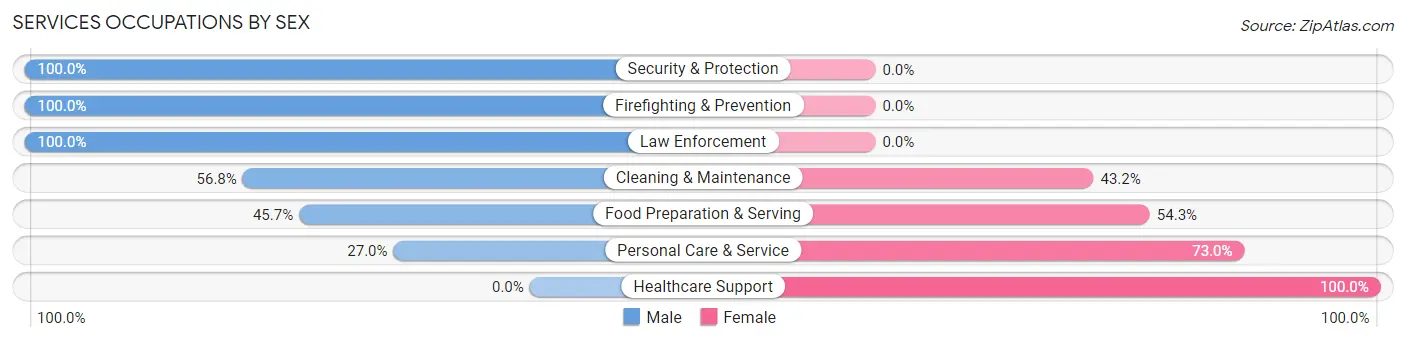
Within the Services occupations in Avra Valley, the most male-oriented occupations are Security & Protection (100.0%), Firefighting & Prevention (100.0%), and Law Enforcement (100.0%), while the most female-oriented occupations are Healthcare Support (100.0%), Personal Care & Service (73.0%), and Food Preparation & Serving (54.3%).
| Occupation | Male | Female |
| Healthcare Support | 0 (0.0%) | 29 (100.0%) |
| Security & Protection | 110 (100.0%) | 0 (0.0%) |
| Firefighting & Prevention | 48 (100.0%) | 0 (0.0%) |
| Law Enforcement | 62 (100.0%) | 0 (0.0%) |
| Food Preparation & Serving | 132 (45.7%) | 157 (54.3%) |
| Cleaning & Maintenance | 79 (56.8%) | 60 (43.2%) |
| Personal Care & Service | 51 (27.0%) | 138 (73.0%) |
| Total (Category) | 372 (49.2%) | 384 (50.8%) |
| Total (Overall) | 1,470 (53.9%) | 1,259 (46.1%) |
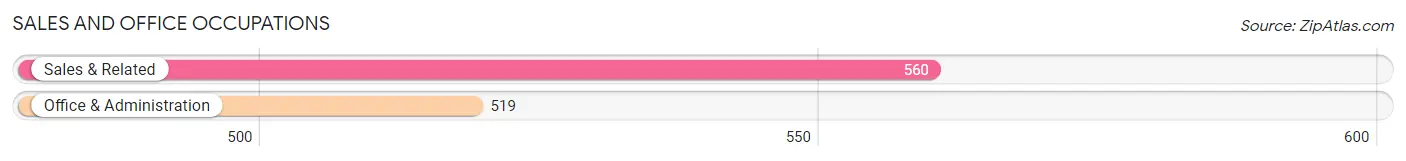
Sales and Office Occupations
The most common Sales and Office occupations in Avra Valley are Sales & Related (560 | 20.5%), and Office & Administration (519 | 19.0%).
Sales and Office Occupations by Sex
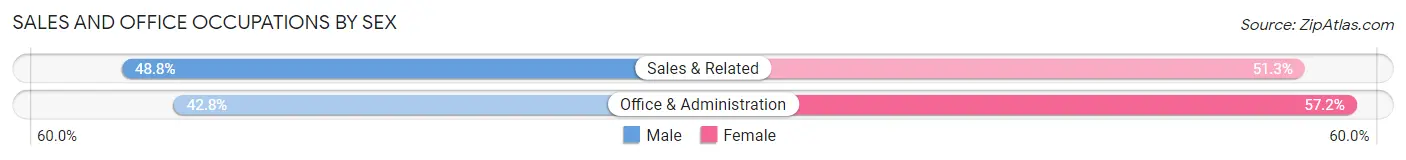
| Occupation | Male | Female |
| Sales & Related | 273 (48.7%) | 287 (51.2%) |
| Office & Administration | 222 (42.8%) | 297 (57.2%) |
| Total (Category) | 495 (45.9%) | 584 (54.1%) |
| Total (Overall) | 1,470 (53.9%) | 1,259 (46.1%) |
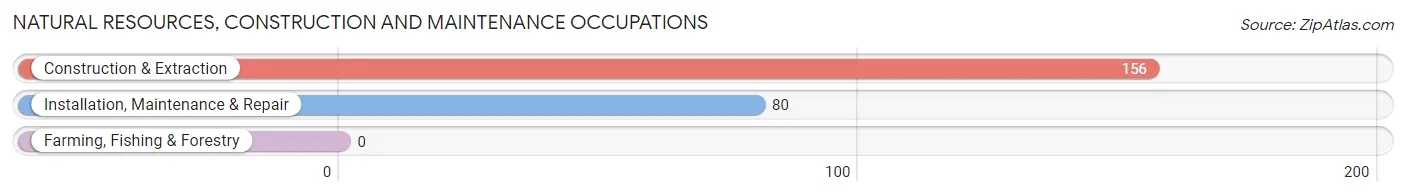
Natural Resources, Construction and Maintenance Occupations
The most common Natural Resources, Construction and Maintenance occupations in Avra Valley are Construction & Extraction (156 | 5.7%), and Installation, Maintenance & Repair (80 | 2.9%).
Natural Resources, Construction and Maintenance Occupations by Sex
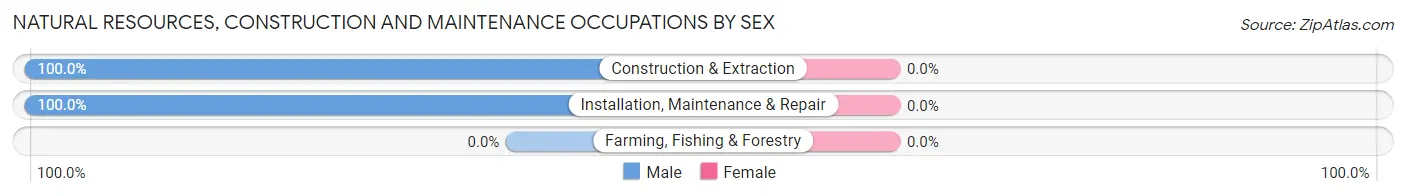
| Occupation | Male | Female |
| Farming, Fishing & Forestry | 0 (0.0%) | 0 (0.0%) |
| Construction & Extraction | 156 (100.0%) | 0 (0.0%) |
| Installation, Maintenance & Repair | 80 (100.0%) | 0 (0.0%) |
| Total (Category) | 236 (100.0%) | 0 (0.0%) |
| Total (Overall) | 1,470 (53.9%) | 1,259 (46.1%) |
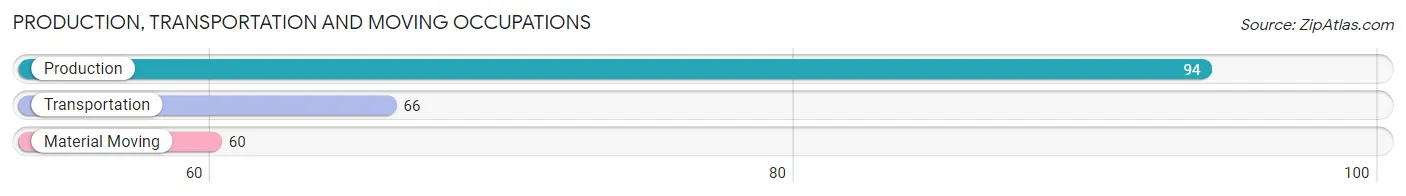
Production, Transportation and Moving Occupations
The most common Production, Transportation and Moving occupations in Avra Valley are Production (94 | 3.4%), Transportation (66 | 2.4%), and Material Moving (60 | 2.2%).
Production, Transportation and Moving Occupations by Sex
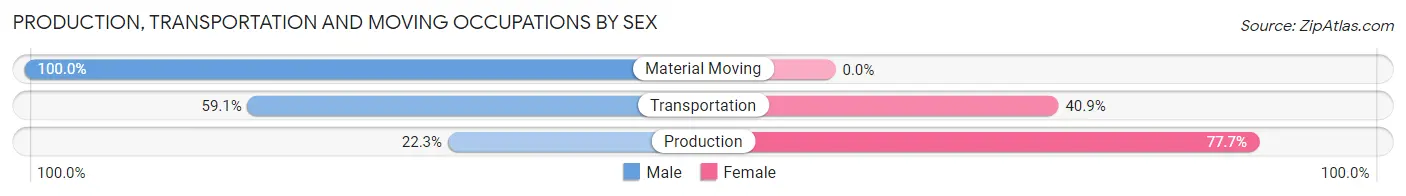
| Occupation | Male | Female |
| Production | 21 (22.3%) | 73 (77.7%) |
| Transportation | 39 (59.1%) | 27 (40.9%) |
| Material Moving | 60 (100.0%) | 0 (0.0%) |
| Total (Category) | 120 (54.5%) | 100 (45.5%) |
| Total (Overall) | 1,470 (53.9%) | 1,259 (46.1%) |
Employment Industries by Sex in Avra Valley
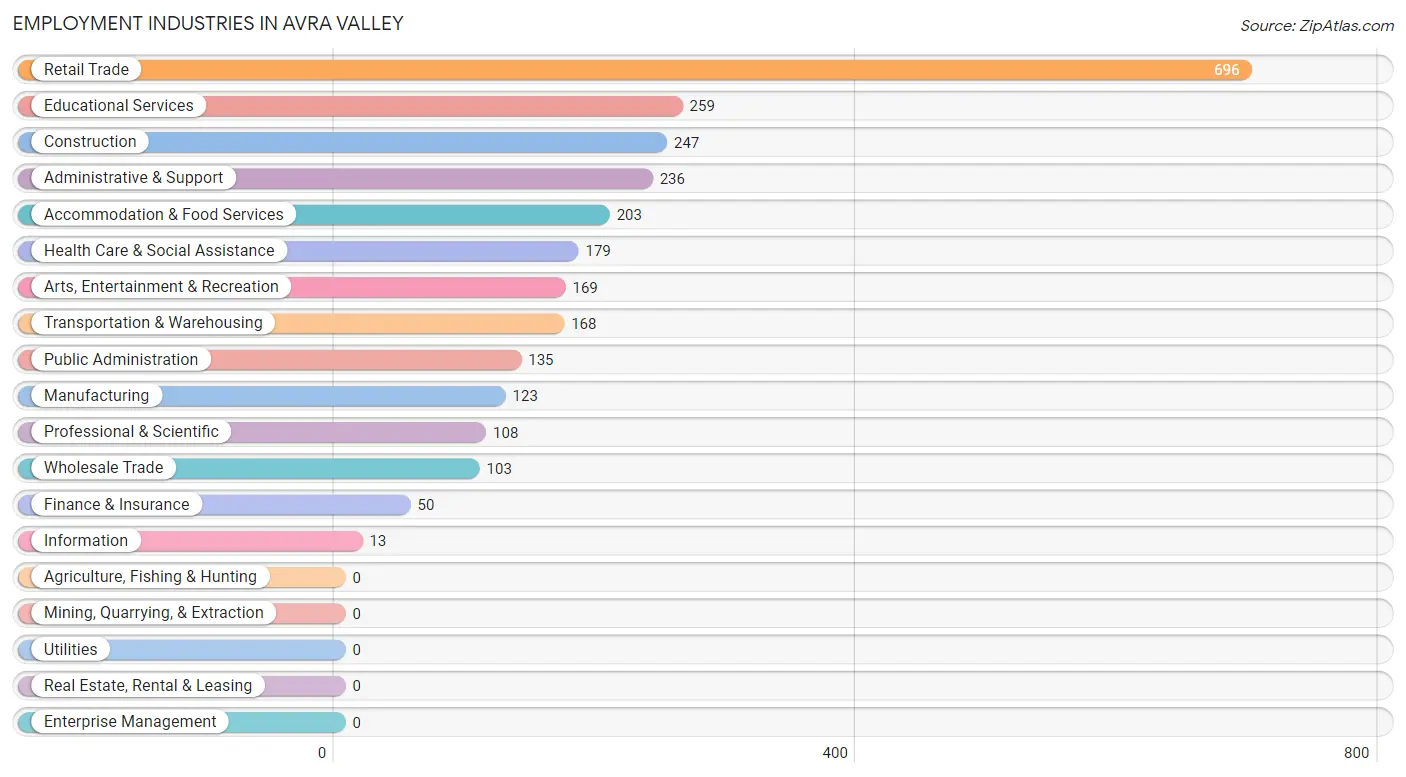
Employment Industries in Avra Valley
The major employment industries in Avra Valley include Retail Trade (696 | 25.5%), Educational Services (259 | 9.5%), Construction (247 | 9.0%), Administrative & Support (236 | 8.6%), and Accommodation & Food Services (203 | 7.4%).
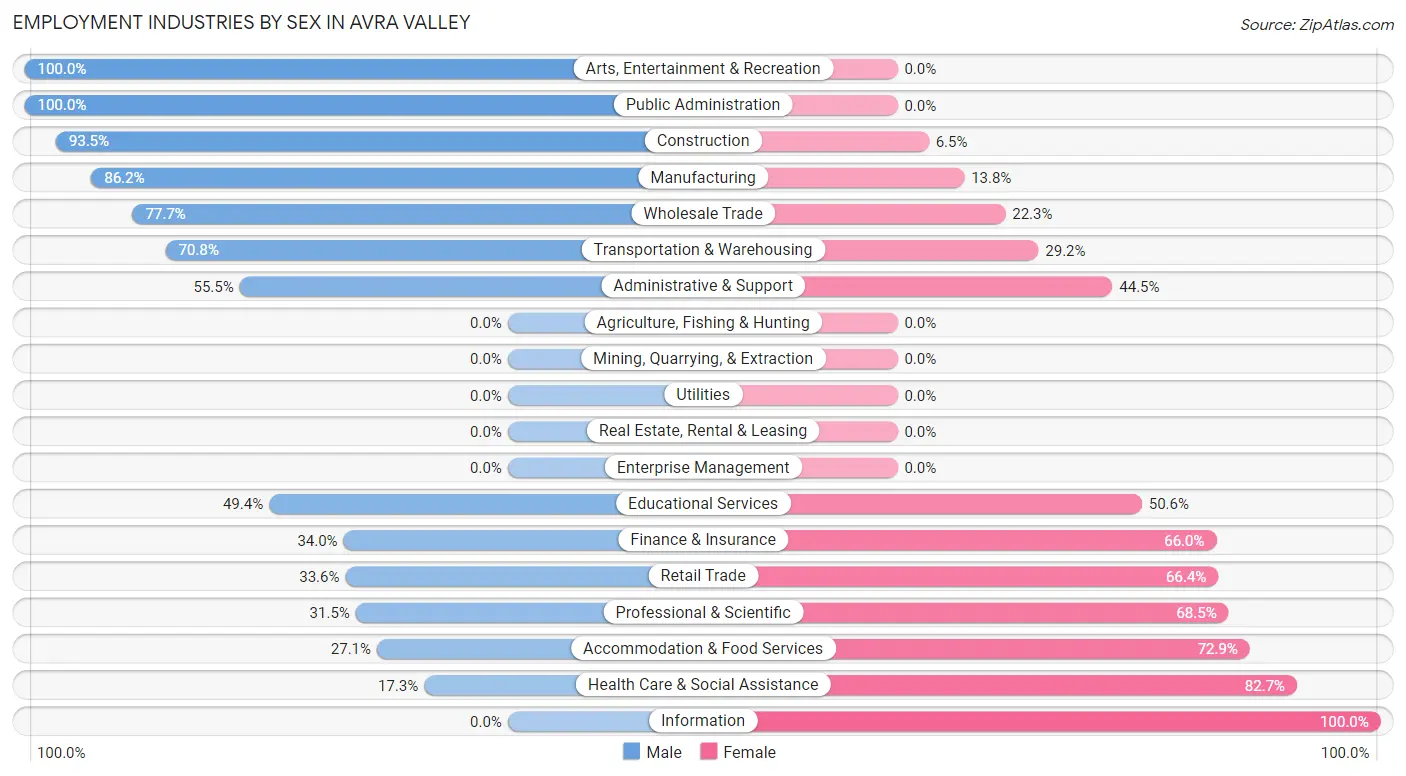
Employment Industries by Sex in Avra Valley
The Avra Valley industries that see more men than women are Arts, Entertainment & Recreation (100.0%), Public Administration (100.0%), and Construction (93.5%), whereas the industries that tend to have a higher number of women are Information (100.0%), Health Care & Social Assistance (82.7%), and Accommodation & Food Services (72.9%).
| Industry | Male | Female |
| Agriculture, Fishing & Hunting | 0 (0.0%) | 0 (0.0%) |
| Mining, Quarrying, & Extraction | 0 (0.0%) | 0 (0.0%) |
| Construction | 231 (93.5%) | 16 (6.5%) |
| Manufacturing | 106 (86.2%) | 17 (13.8%) |
| Wholesale Trade | 80 (77.7%) | 23 (22.3%) |
| Retail Trade | 234 (33.6%) | 462 (66.4%) |
| Transportation & Warehousing | 119 (70.8%) | 49 (29.2%) |
| Utilities | 0 (0.0%) | 0 (0.0%) |
| Information | 0 (0.0%) | 13 (100.0%) |
| Finance & Insurance | 17 (34.0%) | 33 (66.0%) |
| Real Estate, Rental & Leasing | 0 (0.0%) | 0 (0.0%) |
| Professional & Scientific | 34 (31.5%) | 74 (68.5%) |
| Enterprise Management | 0 (0.0%) | 0 (0.0%) |
| Administrative & Support | 131 (55.5%) | 105 (44.5%) |
| Educational Services | 128 (49.4%) | 131 (50.6%) |
| Health Care & Social Assistance | 31 (17.3%) | 148 (82.7%) |
| Arts, Entertainment & Recreation | 169 (100.0%) | 0 (0.0%) |
| Accommodation & Food Services | 55 (27.1%) | 148 (72.9%) |
| Public Administration | 135 (100.0%) | 0 (0.0%) |
| Total | 1,470 (53.9%) | 1,259 (46.1%) |
Education in Avra Valley
School Enrollment in Avra Valley
The most common levels of schooling among the 1,304 students in Avra Valley are elementary school (416 | 31.9%), college / undergraduate (319 | 24.5%), and middle school (303 | 23.2%).
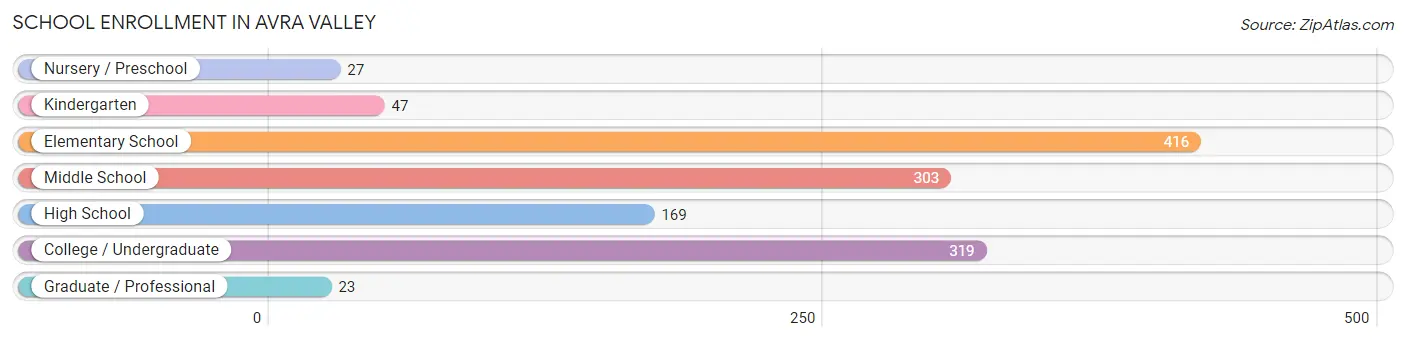
| School Level | # Students | % Students |
| Nursery / Preschool | 27 | 2.1% |
| Kindergarten | 47 | 3.6% |
| Elementary School | 416 | 31.9% |
| Middle School | 303 | 23.2% |
| High School | 169 | 13.0% |
| College / Undergraduate | 319 | 24.5% |
| Graduate / Professional | 23 | 1.8% |
| Total | 1,304 | 100.0% |
School Enrollment by Age by Funding Source in Avra Valley
Out of a total of 1,304 students who are enrolled in schools in Avra Valley, 136 (10.4%) attend a private institution, while the remaining 1,168 (89.6%) are enrolled in public schools. The age group of 3 to 4 year olds has the highest likelihood of being enrolled in private schools, with 27 (100.0% in the age bracket) enrolled. Conversely, the age group of 5 to 9 year old has the lowest likelihood of being enrolled in a private school, with 454 (100.0% in the age bracket) attending a public institution.
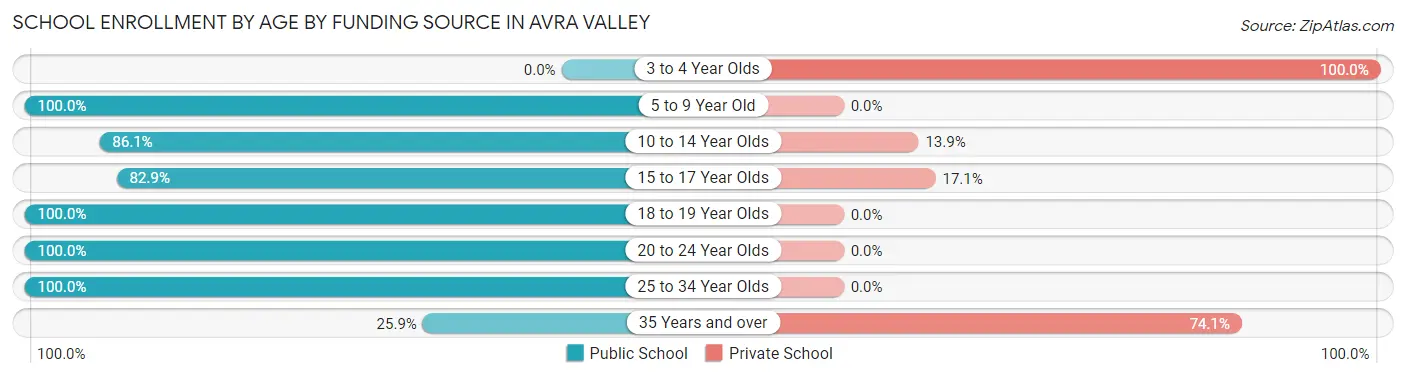
| Age Bracket | Public School | Private School |
| 3 to 4 Year Olds | 0 (0.0%) | 27 (100.0%) |
| 5 to 9 Year Old | 454 (100.0%) | 0 (0.0%) |
| 10 to 14 Year Olds | 247 (86.1%) | 40 (13.9%) |
| 15 to 17 Year Olds | 121 (82.9%) | 25 (17.1%) |
| 18 to 19 Year Olds | 48 (100.0%) | 0 (0.0%) |
| 20 to 24 Year Olds | 143 (100.0%) | 0 (0.0%) |
| 25 to 34 Year Olds | 141 (100.0%) | 0 (0.0%) |
| 35 Years and over | 15 (25.9%) | 43 (74.1%) |
| Total | 1,168 (89.6%) | 136 (10.4%) |
Educational Attainment by Field of Study in Avra Valley
Business (116 | 23.3%), literature & languages (77 | 15.5%), science & technology (63 | 12.7%), liberal arts & history (52 | 10.4%), and visual & performing arts (52 | 10.4%) are the most common fields of study among 498 individuals in Avra Valley who have obtained a bachelor's degree or higher.
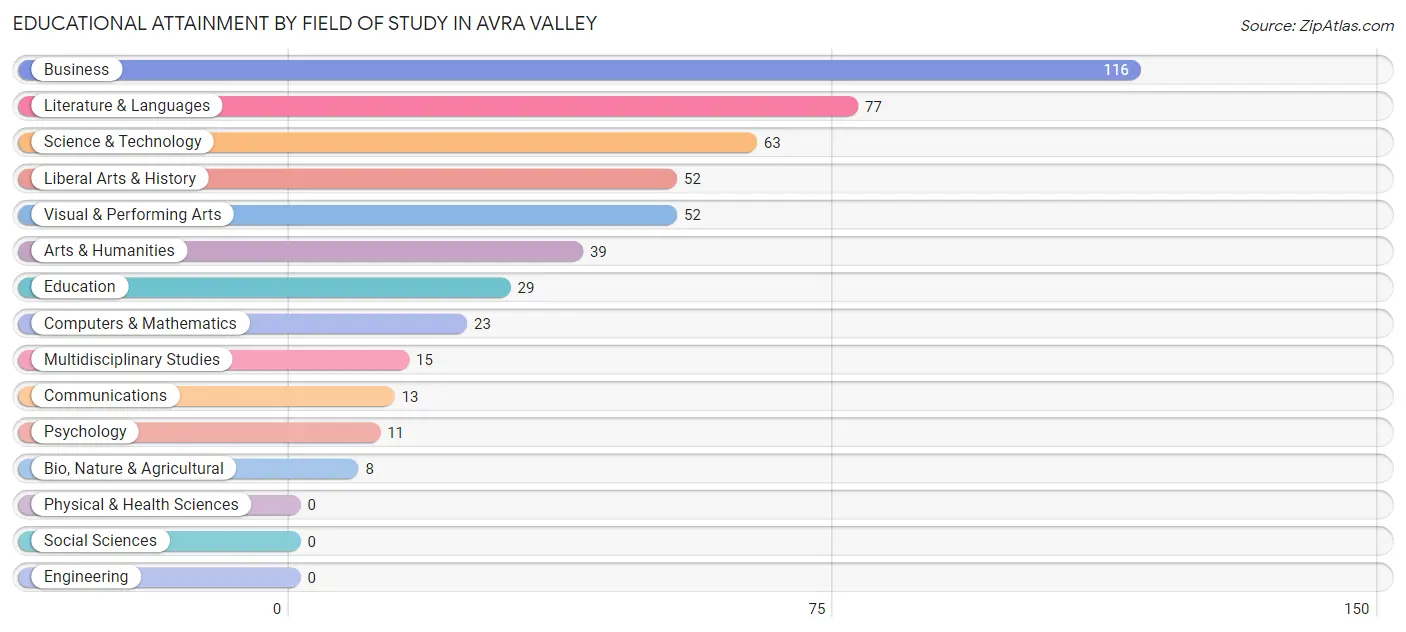
| Field of Study | # Graduates | % Graduates |
| Computers & Mathematics | 23 | 4.6% |
| Bio, Nature & Agricultural | 8 | 1.6% |
| Physical & Health Sciences | 0 | 0.0% |
| Psychology | 11 | 2.2% |
| Social Sciences | 0 | 0.0% |
| Engineering | 0 | 0.0% |
| Multidisciplinary Studies | 15 | 3.0% |
| Science & Technology | 63 | 12.7% |
| Business | 116 | 23.3% |
| Education | 29 | 5.8% |
| Literature & Languages | 77 | 15.5% |
| Liberal Arts & History | 52 | 10.4% |
| Visual & Performing Arts | 52 | 10.4% |
| Communications | 13 | 2.6% |
| Arts & Humanities | 39 | 7.8% |
| Total | 498 | 100.0% |
Transportation & Commute in Avra Valley
Vehicle Availability by Sex in Avra Valley
The most prevalent vehicle ownership categories in Avra Valley are males with 2 vehicles (527, accounting for 32.7%) and females with 2 vehicles (572, making up 42.3%).
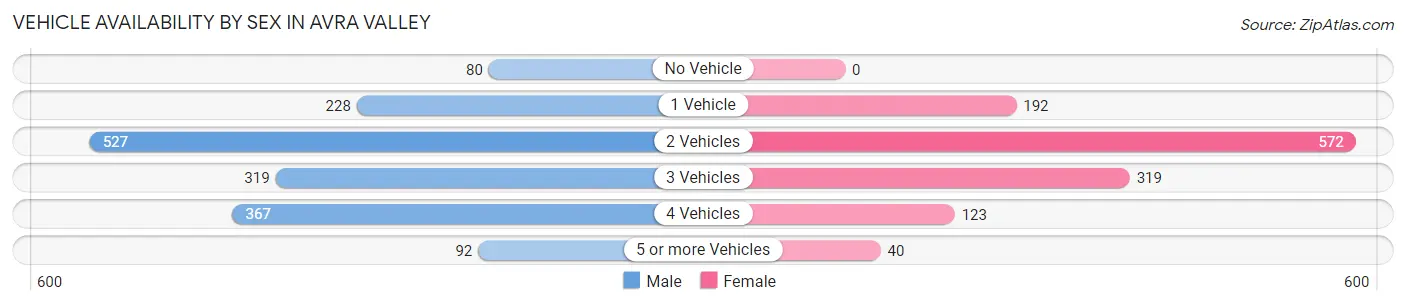
| Vehicles Available | Male | Female |
| No Vehicle | 80 (5.0%) | 0 (0.0%) |
| 1 Vehicle | 228 (14.1%) | 192 (15.4%) |
| 2 Vehicles | 527 (32.7%) | 572 (45.9%) |
| 3 Vehicles | 319 (19.8%) | 319 (25.6%) |
| 4 Vehicles | 367 (22.8%) | 123 (9.9%) |
| 5 or more Vehicles | 92 (5.7%) | 40 (3.2%) |
| Total | 1,613 (100.0%) | 1,246 (100.0%) |
Commute Time in Avra Valley
The most frequently occuring commute durations in Avra Valley are 45 to 59 minutes (755 commuters, 26.4%), 20 to 24 minutes (462 commuters, 16.2%), and 15 to 19 minutes (315 commuters, 11.0%).
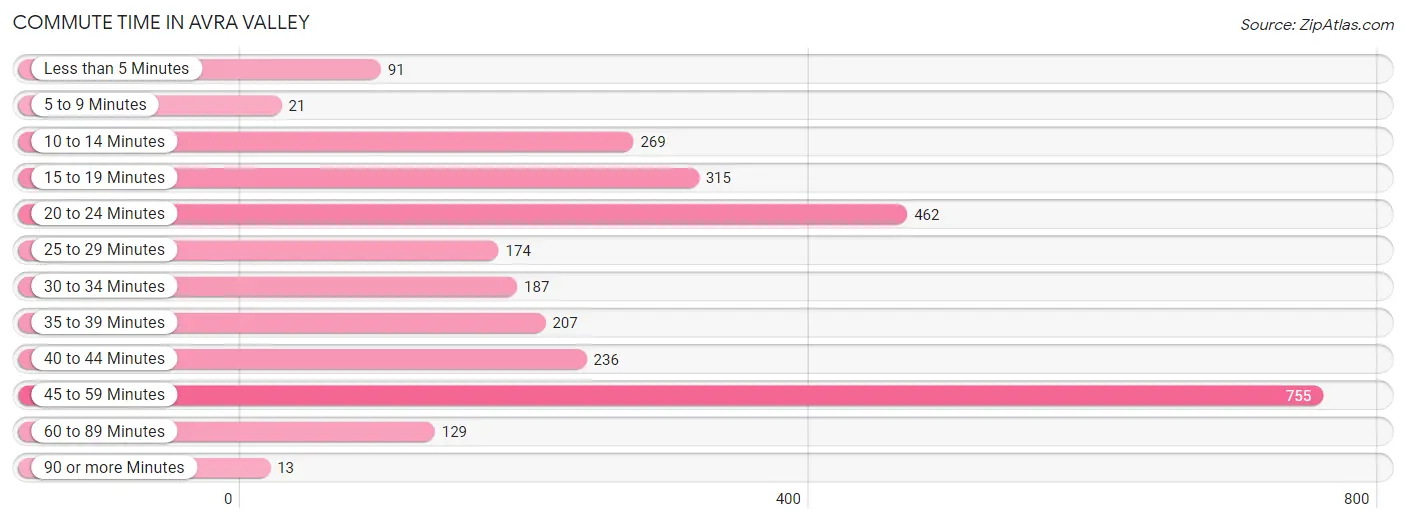
| Commute Time | # Commuters | % Commuters |
| Less than 5 Minutes | 91 | 3.2% |
| 5 to 9 Minutes | 21 | 0.7% |
| 10 to 14 Minutes | 269 | 9.4% |
| 15 to 19 Minutes | 315 | 11.0% |
| 20 to 24 Minutes | 462 | 16.2% |
| 25 to 29 Minutes | 174 | 6.1% |
| 30 to 34 Minutes | 187 | 6.5% |
| 35 to 39 Minutes | 207 | 7.2% |
| 40 to 44 Minutes | 236 | 8.3% |
| 45 to 59 Minutes | 755 | 26.4% |
| 60 to 89 Minutes | 129 | 4.5% |
| 90 or more Minutes | 13 | 0.4% |
Commute Time by Sex in Avra Valley
The most common commute times in Avra Valley are 45 to 59 minutes (497 commuters, 30.8%) for males and 45 to 59 minutes (258 commuters, 20.7%) for females.
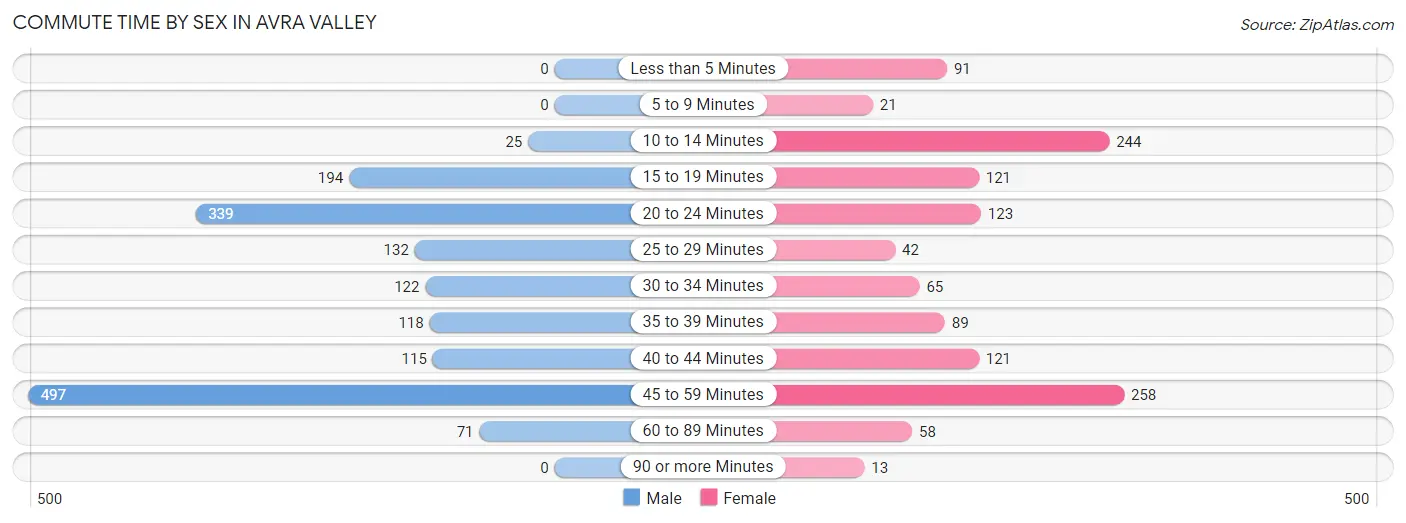
| Commute Time | Male | Female |
| Less than 5 Minutes | 0 (0.0%) | 91 (7.3%) |
| 5 to 9 Minutes | 0 (0.0%) | 21 (1.7%) |
| 10 to 14 Minutes | 25 (1.5%) | 244 (19.6%) |
| 15 to 19 Minutes | 194 (12.0%) | 121 (9.7%) |
| 20 to 24 Minutes | 339 (21.0%) | 123 (9.9%) |
| 25 to 29 Minutes | 132 (8.2%) | 42 (3.4%) |
| 30 to 34 Minutes | 122 (7.6%) | 65 (5.2%) |
| 35 to 39 Minutes | 118 (7.3%) | 89 (7.1%) |
| 40 to 44 Minutes | 115 (7.1%) | 121 (9.7%) |
| 45 to 59 Minutes | 497 (30.8%) | 258 (20.7%) |
| 60 to 89 Minutes | 71 (4.4%) | 58 (4.6%) |
| 90 or more Minutes | 0 (0.0%) | 13 (1.0%) |
Time of Departure to Work by Sex in Avra Valley
The most frequent times of departure to work in Avra Valley are 6:00 AM to 6:29 AM (443, 27.5%) for males and 7:30 AM to 7:59 AM (186, 14.9%) for females.
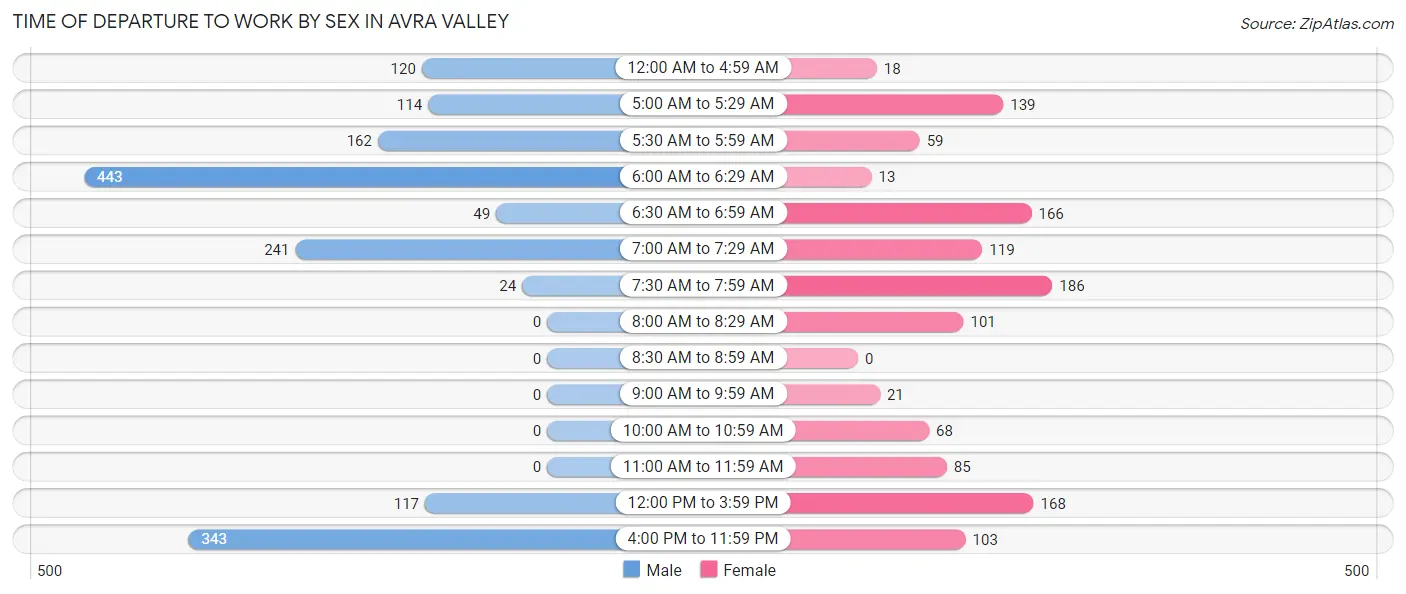
| Time of Departure | Male | Female |
| 12:00 AM to 4:59 AM | 120 (7.4%) | 18 (1.4%) |
| 5:00 AM to 5:29 AM | 114 (7.1%) | 139 (11.2%) |
| 5:30 AM to 5:59 AM | 162 (10.0%) | 59 (4.7%) |
| 6:00 AM to 6:29 AM | 443 (27.5%) | 13 (1.0%) |
| 6:30 AM to 6:59 AM | 49 (3.0%) | 166 (13.3%) |
| 7:00 AM to 7:29 AM | 241 (14.9%) | 119 (9.6%) |
| 7:30 AM to 7:59 AM | 24 (1.5%) | 186 (14.9%) |
| 8:00 AM to 8:29 AM | 0 (0.0%) | 101 (8.1%) |
| 8:30 AM to 8:59 AM | 0 (0.0%) | 0 (0.0%) |
| 9:00 AM to 9:59 AM | 0 (0.0%) | 21 (1.7%) |
| 10:00 AM to 10:59 AM | 0 (0.0%) | 68 (5.5%) |
| 11:00 AM to 11:59 AM | 0 (0.0%) | 85 (6.8%) |
| 12:00 PM to 3:59 PM | 117 (7.2%) | 168 (13.5%) |
| 4:00 PM to 11:59 PM | 343 (21.3%) | 103 (8.3%) |
| Total | 1,613 (100.0%) | 1,246 (100.0%) |
Housing Occupancy in Avra Valley
Occupancy by Ownership in Avra Valley
Of the total 2,395 dwellings in Avra Valley, owner-occupied units account for 1,778 (74.2%), while renter-occupied units make up 617 (25.8%).
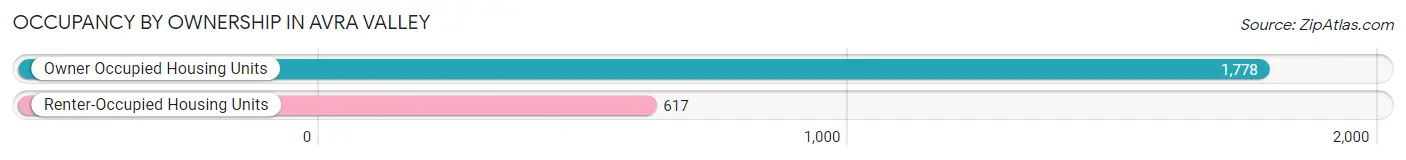
| Occupancy | # Housing Units | % Housing Units |
| Owner Occupied Housing Units | 1,778 | 74.2% |
| Renter-Occupied Housing Units | 617 | 25.8% |
| Total Occupied Housing Units | 2,395 | 100.0% |
Occupancy by Household Size in Avra Valley
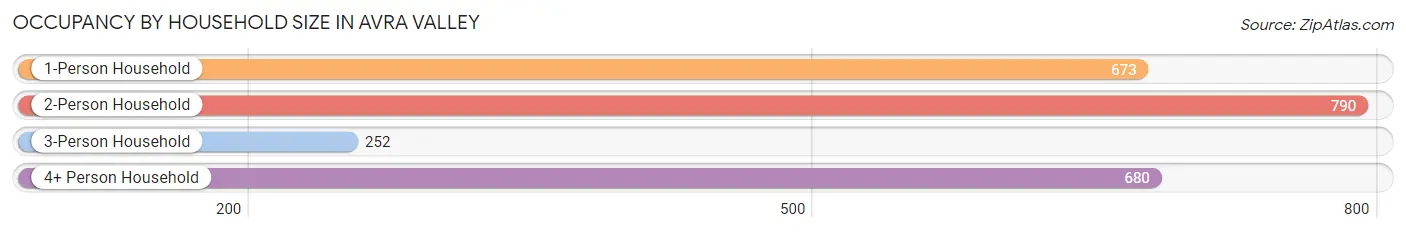
| Household Size | # Housing Units | % Housing Units |
| 1-Person Household | 673 | 28.1% |
| 2-Person Household | 790 | 33.0% |
| 3-Person Household | 252 | 10.5% |
| 4+ Person Household | 680 | 28.4% |
| Total Housing Units | 2,395 | 100.0% |
Occupancy by Ownership by Household Size in Avra Valley
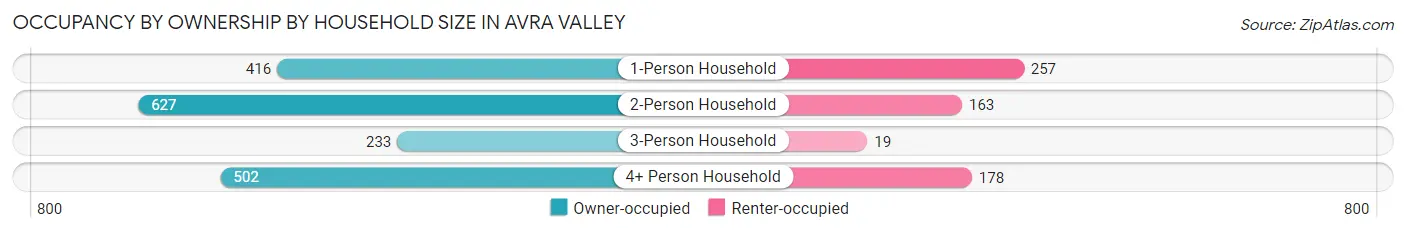
| Household Size | Owner-occupied | Renter-occupied |
| 1-Person Household | 416 (61.8%) | 257 (38.2%) |
| 2-Person Household | 627 (79.4%) | 163 (20.6%) |
| 3-Person Household | 233 (92.5%) | 19 (7.5%) |
| 4+ Person Household | 502 (73.8%) | 178 (26.2%) |
| Total Housing Units | 1,778 (74.2%) | 617 (25.8%) |
Occupancy by Educational Attainment in Avra Valley
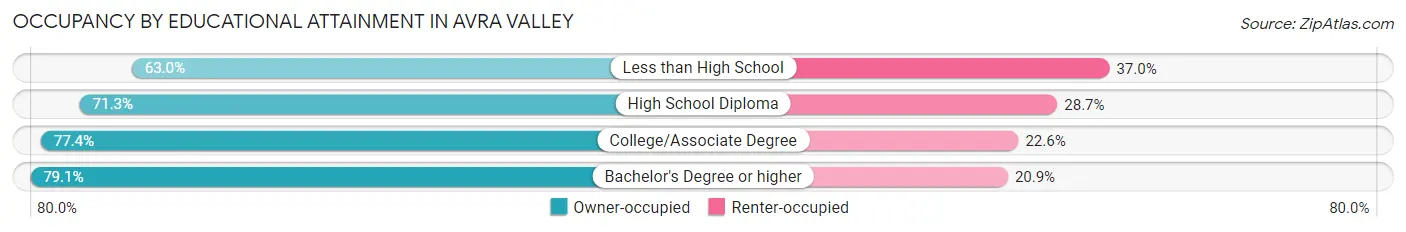
| Household Size | Owner-occupied | Renter-occupied |
| Less than High School | 80 (63.0%) | 47 (37.0%) |
| High School Diploma | 704 (71.3%) | 284 (28.7%) |
| College/Associate Degree | 854 (77.4%) | 249 (22.6%) |
| Bachelor's Degree or higher | 140 (79.1%) | 37 (20.9%) |
Occupancy by Age of Householder in Avra Valley
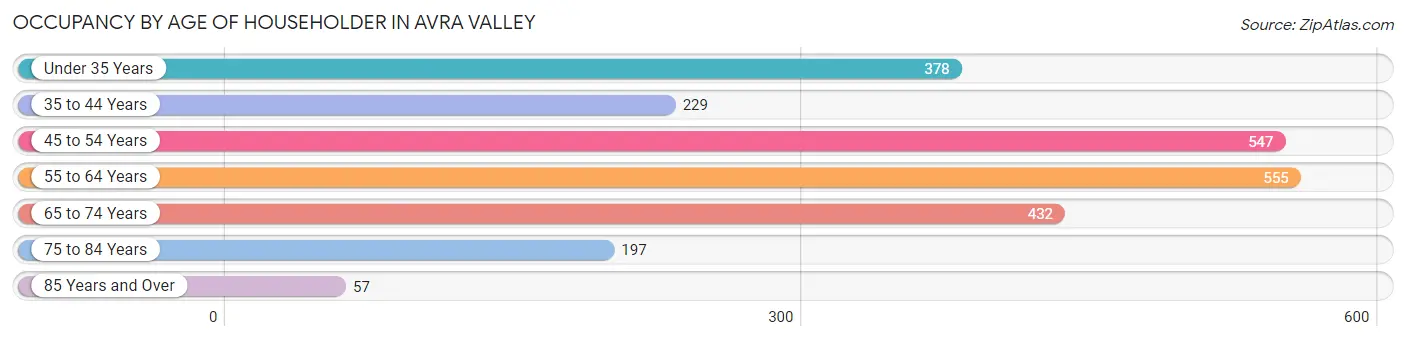
| Age Bracket | # Households | % Households |
| Under 35 Years | 378 | 15.8% |
| 35 to 44 Years | 229 | 9.6% |
| 45 to 54 Years | 547 | 22.8% |
| 55 to 64 Years | 555 | 23.2% |
| 65 to 74 Years | 432 | 18.0% |
| 75 to 84 Years | 197 | 8.2% |
| 85 Years and Over | 57 | 2.4% |
| Total | 2,395 | 100.0% |
Housing Finances in Avra Valley
Median Income by Occupancy in Avra Valley
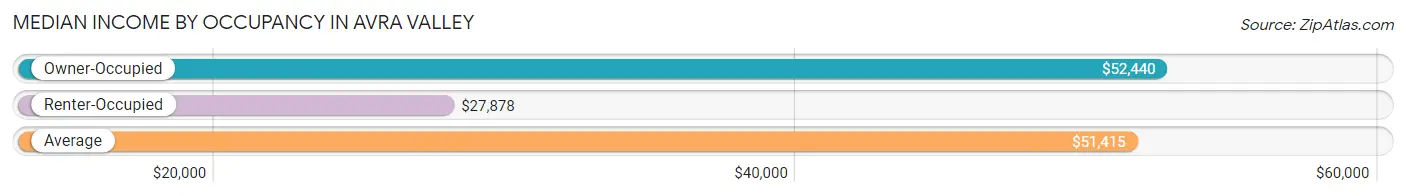
| Occupancy Type | # Households | Median Income |
| Owner-Occupied | 1,778 (74.2%) | $52,440 |
| Renter-Occupied | 617 (25.8%) | $27,878 |
| Average | 2,395 (100.0%) | $51,415 |
Occupancy by Householder Income Bracket in Avra Valley
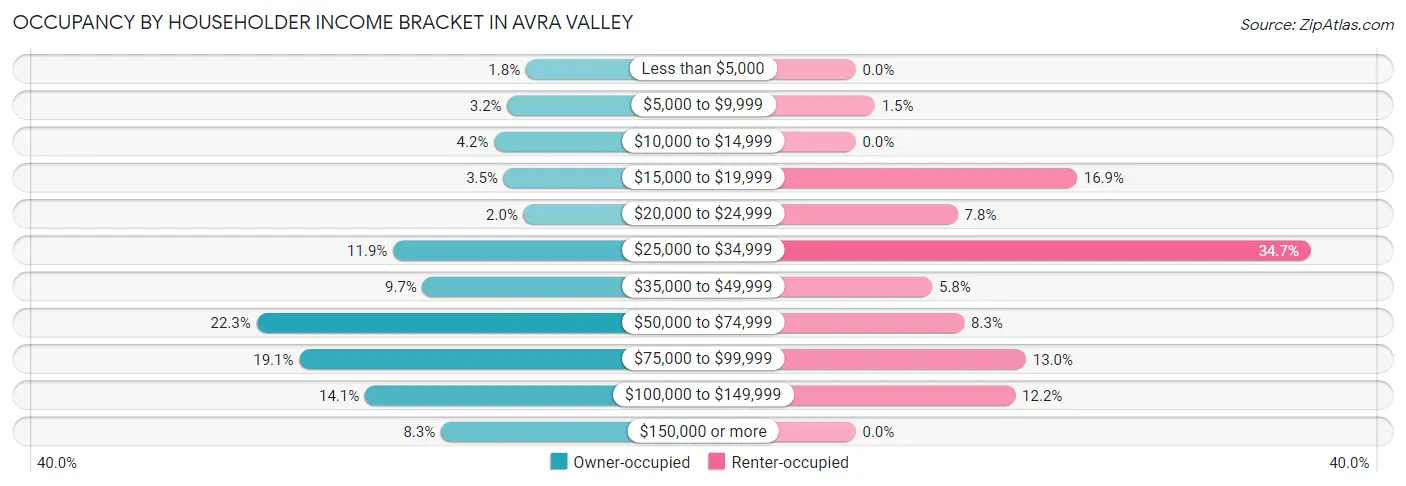
| Income Bracket | Owner-occupied | Renter-occupied |
| Less than $5,000 | 32 (1.8%) | 0 (0.0%) |
| $5,000 to $9,999 | 57 (3.2%) | 9 (1.5%) |
| $10,000 to $14,999 | 75 (4.2%) | 0 (0.0%) |
| $15,000 to $19,999 | 62 (3.5%) | 104 (16.9%) |
| $20,000 to $24,999 | 35 (2.0%) | 48 (7.8%) |
| $25,000 to $34,999 | 212 (11.9%) | 214 (34.7%) |
| $35,000 to $49,999 | 172 (9.7%) | 36 (5.8%) |
| $50,000 to $74,999 | 397 (22.3%) | 51 (8.3%) |
| $75,000 to $99,999 | 339 (19.1%) | 80 (13.0%) |
| $100,000 to $149,999 | 250 (14.1%) | 75 (12.2%) |
| $150,000 or more | 147 (8.3%) | 0 (0.0%) |
| Total | 1,778 (100.0%) | 617 (100.0%) |
Monthly Housing Cost Tiers in Avra Valley
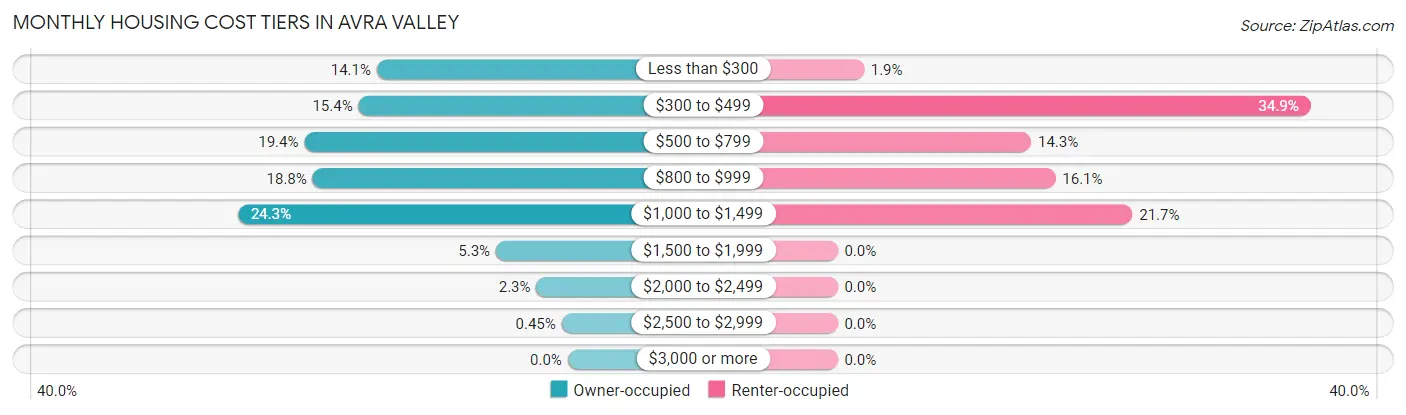
| Monthly Cost | Owner-occupied | Renter-occupied |
| Less than $300 | 250 (14.1%) | 12 (1.9%) |
| $300 to $499 | 274 (15.4%) | 215 (34.8%) |
| $500 to $799 | 345 (19.4%) | 88 (14.3%) |
| $800 to $999 | 334 (18.8%) | 99 (16.1%) |
| $1,000 to $1,499 | 432 (24.3%) | 134 (21.7%) |
| $1,500 to $1,999 | 94 (5.3%) | 0 (0.0%) |
| $2,000 to $2,499 | 41 (2.3%) | 0 (0.0%) |
| $2,500 to $2,999 | 8 (0.4%) | 0 (0.0%) |
| $3,000 or more | 0 (0.0%) | 0 (0.0%) |
| Total | 1,778 (100.0%) | 617 (100.0%) |
Physical Housing Characteristics in Avra Valley
Housing Structures in Avra Valley
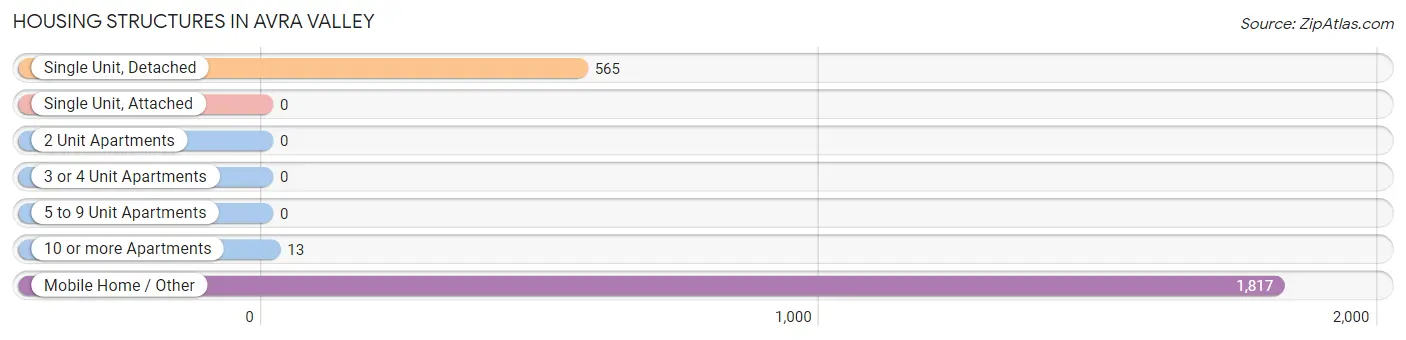
| Structure Type | # Housing Units | % Housing Units |
| Single Unit, Detached | 565 | 23.6% |
| Single Unit, Attached | 0 | 0.0% |
| 2 Unit Apartments | 0 | 0.0% |
| 3 or 4 Unit Apartments | 0 | 0.0% |
| 5 to 9 Unit Apartments | 0 | 0.0% |
| 10 or more Apartments | 13 | 0.5% |
| Mobile Home / Other | 1,817 | 75.9% |
| Total | 2,395 | 100.0% |
Housing Structures by Occupancy in Avra Valley
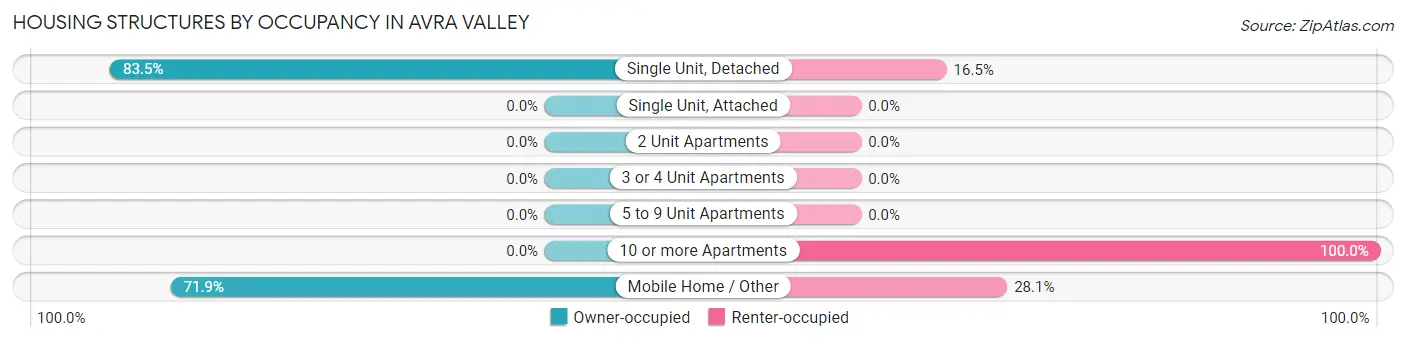
| Structure Type | Owner-occupied | Renter-occupied |
| Single Unit, Detached | 472 (83.5%) | 93 (16.5%) |
| Single Unit, Attached | 0 (0.0%) | 0 (0.0%) |
| 2 Unit Apartments | 0 (0.0%) | 0 (0.0%) |
| 3 or 4 Unit Apartments | 0 (0.0%) | 0 (0.0%) |
| 5 to 9 Unit Apartments | 0 (0.0%) | 0 (0.0%) |
| 10 or more Apartments | 0 (0.0%) | 13 (100.0%) |
| Mobile Home / Other | 1,306 (71.9%) | 511 (28.1%) |
| Total | 1,778 (74.2%) | 617 (25.8%) |
Housing Structures by Number of Rooms in Avra Valley
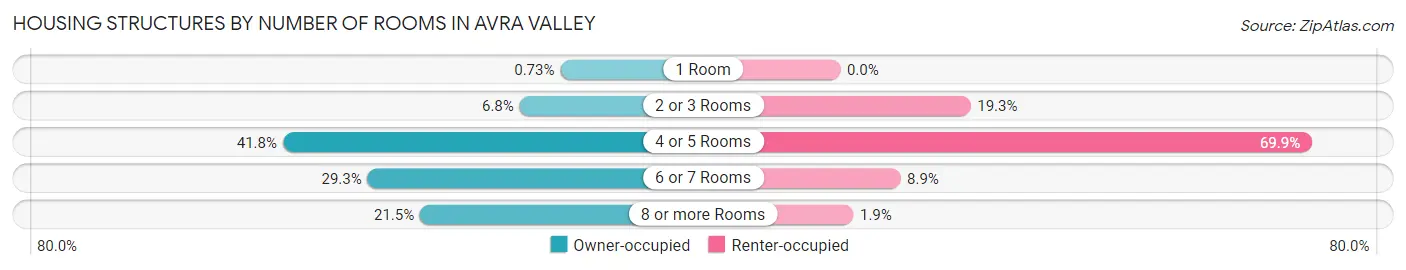
| Number of Rooms | Owner-occupied | Renter-occupied |
| 1 Room | 13 (0.7%) | 0 (0.0%) |
| 2 or 3 Rooms | 120 (6.8%) | 119 (19.3%) |
| 4 or 5 Rooms | 743 (41.8%) | 431 (69.9%) |
| 6 or 7 Rooms | 520 (29.2%) | 55 (8.9%) |
| 8 or more Rooms | 382 (21.5%) | 12 (1.9%) |
| Total | 1,778 (100.0%) | 617 (100.0%) |
Housing Structure by Heating Type in Avra Valley
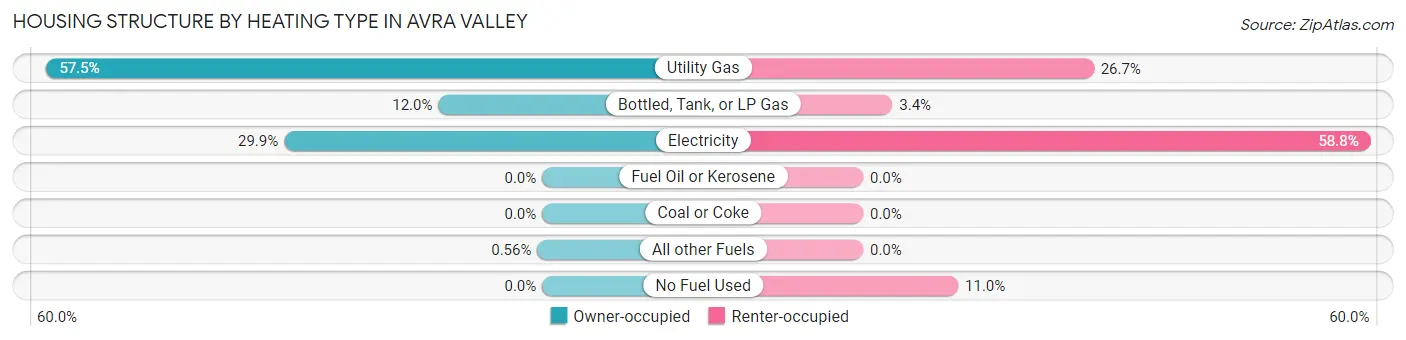
| Heating Type | Owner-occupied | Renter-occupied |
| Utility Gas | 1,022 (57.5%) | 165 (26.7%) |
| Bottled, Tank, or LP Gas | 214 (12.0%) | 21 (3.4%) |
| Electricity | 532 (29.9%) | 363 (58.8%) |
| Fuel Oil or Kerosene | 0 (0.0%) | 0 (0.0%) |
| Coal or Coke | 0 (0.0%) | 0 (0.0%) |
| All other Fuels | 10 (0.6%) | 0 (0.0%) |
| No Fuel Used | 0 (0.0%) | 68 (11.0%) |
| Total | 1,778 (100.0%) | 617 (100.0%) |
Household Vehicle Usage in Avra Valley
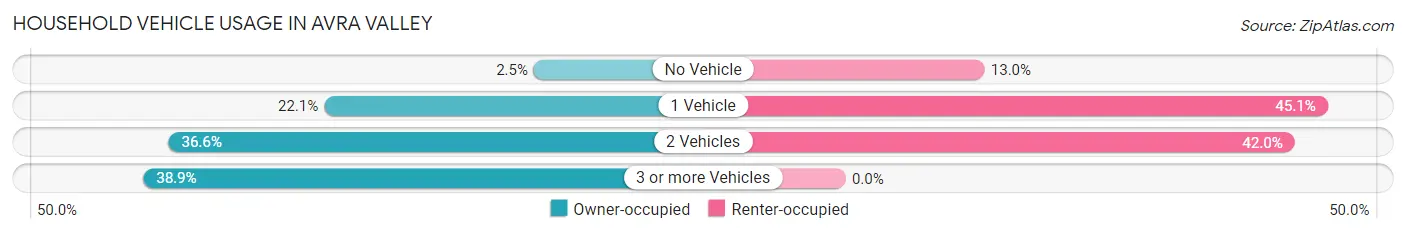
| Vehicles per Household | Owner-occupied | Renter-occupied |
| No Vehicle | 44 (2.5%) | 80 (13.0%) |
| 1 Vehicle | 392 (22.1%) | 278 (45.1%) |
| 2 Vehicles | 650 (36.6%) | 259 (42.0%) |
| 3 or more Vehicles | 692 (38.9%) | 0 (0.0%) |
| Total | 1,778 (100.0%) | 617 (100.0%) |
Real Estate & Mortgages in Avra Valley
Real Estate and Mortgage Overview in Avra Valley
| Characteristic | Without Mortgage | With Mortgage |
| Housing Units | 831 | 947 |
| Median Property Value | $117,200 | $139,200 |
| Median Household Income | $51,633 | $62 |
| Monthly Housing Costs | $399 | $0 |
| Real Estate Taxes | $1,171 | $8 |
Property Value by Mortgage Status in Avra Valley
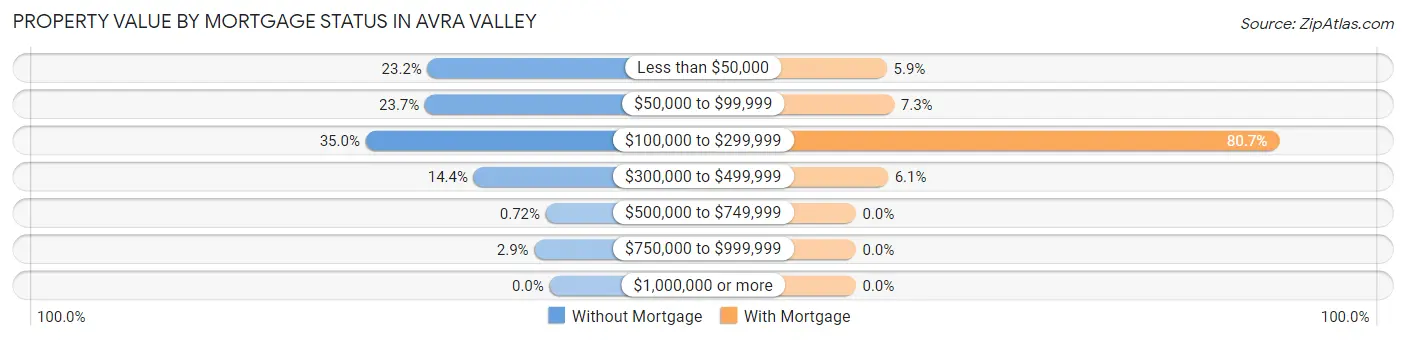
| Property Value | Without Mortgage | With Mortgage |
| Less than $50,000 | 193 (23.2%) | 56 (5.9%) |
| $50,000 to $99,999 | 197 (23.7%) | 69 (7.3%) |
| $100,000 to $299,999 | 291 (35.0%) | 764 (80.7%) |
| $300,000 to $499,999 | 120 (14.4%) | 58 (6.1%) |
| $500,000 to $749,999 | 6 (0.7%) | 0 (0.0%) |
| $750,000 to $999,999 | 24 (2.9%) | 0 (0.0%) |
| $1,000,000 or more | 0 (0.0%) | 0 (0.0%) |
| Total | 831 (100.0%) | 947 (100.0%) |
Household Income by Mortgage Status in Avra Valley
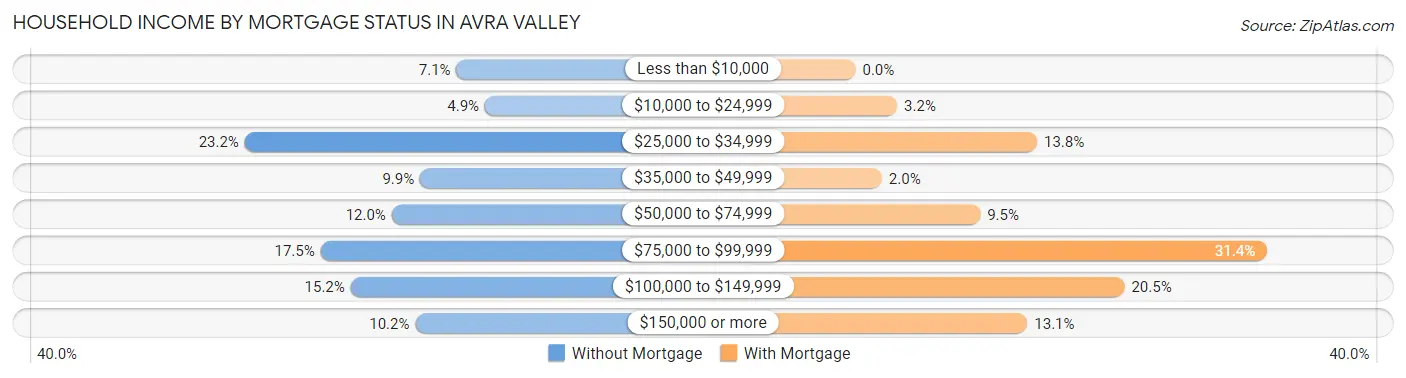
| Household Income | Without Mortgage | With Mortgage |
| Less than $10,000 | 59 (7.1%) | 0 (0.0%) |
| $10,000 to $24,999 | 41 (4.9%) | 30 (3.2%) |
| $25,000 to $34,999 | 193 (23.2%) | 131 (13.8%) |
| $35,000 to $49,999 | 82 (9.9%) | 19 (2.0%) |
| $50,000 to $74,999 | 100 (12.0%) | 90 (9.5%) |
| $75,000 to $99,999 | 145 (17.4%) | 297 (31.4%) |
| $100,000 to $149,999 | 126 (15.2%) | 194 (20.5%) |
| $150,000 or more | 85 (10.2%) | 124 (13.1%) |
| Total | 831 (100.0%) | 947 (100.0%) |
Property Value to Household Income Ratio in Avra Valley
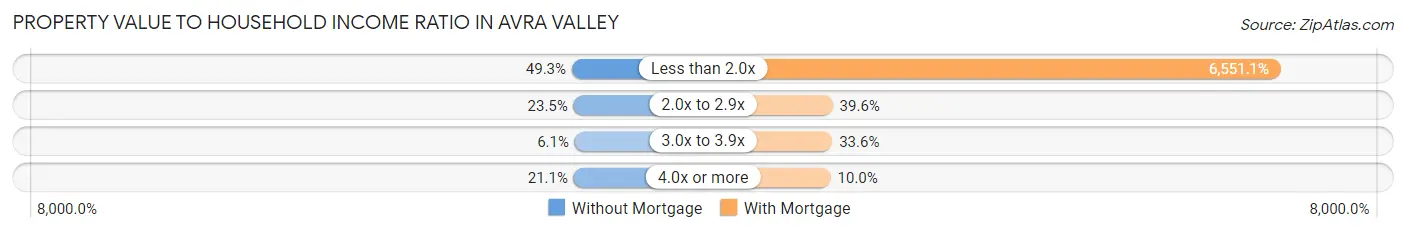
| Value-to-Income Ratio | Without Mortgage | With Mortgage |
| Less than 2.0x | 410 (49.3%) | 62,039 (6,551.1%) |
| 2.0x to 2.9x | 195 (23.5%) | 375 (39.6%) |
| 3.0x to 3.9x | 51 (6.1%) | 318 (33.6%) |
| 4.0x or more | 175 (21.1%) | 95 (10.0%) |
| Total | 831 (100.0%) | 947 (100.0%) |
Real Estate Taxes by Mortgage Status in Avra Valley
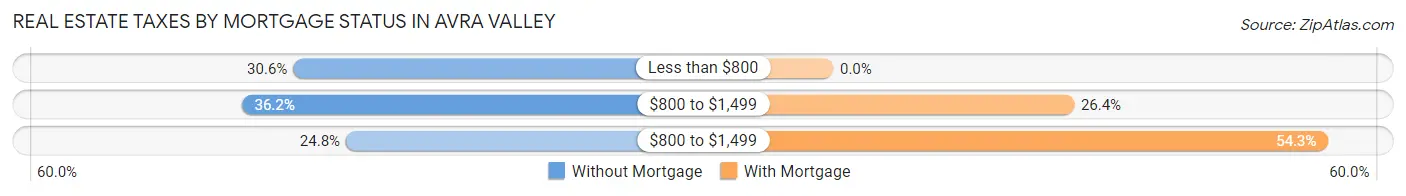
| Property Taxes | Without Mortgage | With Mortgage |
| Less than $800 | 254 (30.6%) | 0 (0.0%) |
| $800 to $1,499 | 301 (36.2%) | 250 (26.4%) |
| $800 to $1,499 | 206 (24.8%) | 514 (54.3%) |
| Total | 831 (100.0%) | 947 (100.0%) |
Health & Disability in Avra Valley
Health Insurance Coverage by Age in Avra Valley
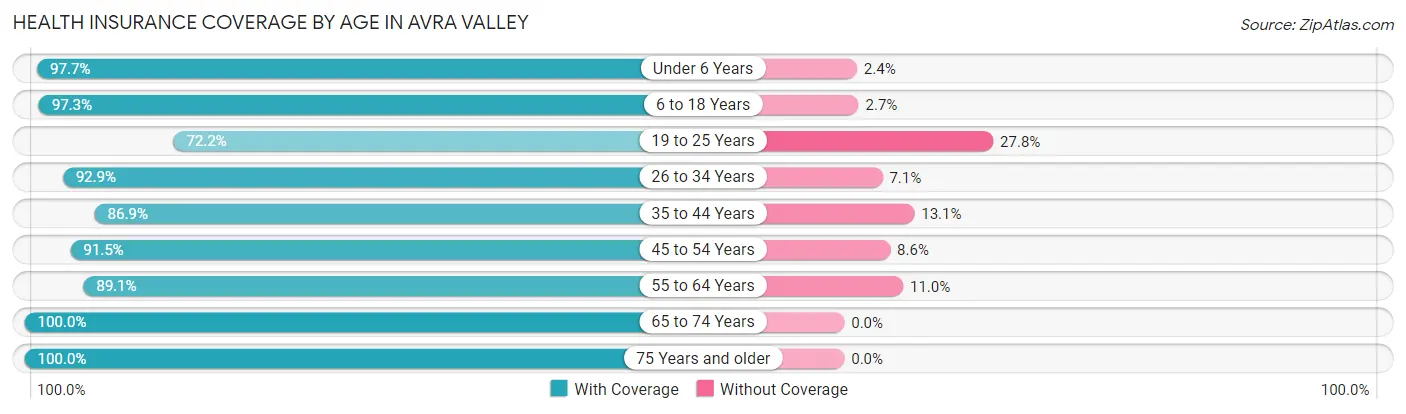
| Age Bracket | With Coverage | Without Coverage |
| Under 6 Years | 541 (97.7%) | 13 (2.4%) |
| 6 to 18 Years | 914 (97.3%) | 25 (2.7%) |
| 19 to 25 Years | 268 (72.2%) | 103 (27.8%) |
| 26 to 34 Years | 692 (92.9%) | 53 (7.1%) |
| 35 to 44 Years | 406 (86.9%) | 61 (13.1%) |
| 45 to 54 Years | 930 (91.4%) | 87 (8.6%) |
| 55 to 64 Years | 960 (89.0%) | 118 (11.0%) |
| 65 to 74 Years | 631 (100.0%) | 0 (0.0%) |
| 75 Years and older | 336 (100.0%) | 0 (0.0%) |
| Total | 5,678 (92.5%) | 460 (7.5%) |
Health Insurance Coverage by Citizenship Status in Avra Valley
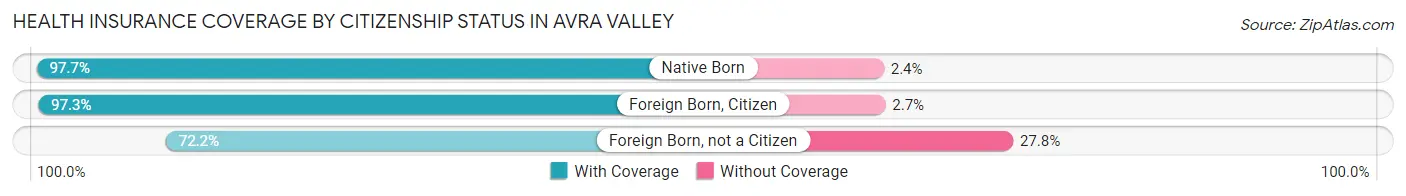
| Citizenship Status | With Coverage | Without Coverage |
| Native Born | 541 (97.7%) | 13 (2.4%) |
| Foreign Born, Citizen | 914 (97.3%) | 25 (2.7%) |
| Foreign Born, not a Citizen | 268 (72.2%) | 103 (27.8%) |
Health Insurance Coverage by Household Income in Avra Valley
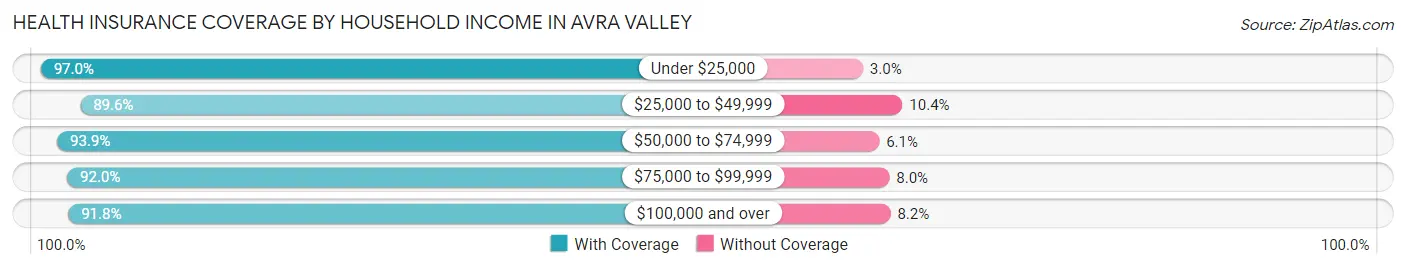
| Household Income | With Coverage | Without Coverage |
| Under $25,000 | 707 (97.0%) | 22 (3.0%) |
| $25,000 to $49,999 | 1,057 (89.6%) | 123 (10.4%) |
| $50,000 to $74,999 | 1,283 (93.9%) | 83 (6.1%) |
| $75,000 to $99,999 | 924 (92.0%) | 80 (8.0%) |
| $100,000 and over | 1,707 (91.8%) | 152 (8.2%) |
Public vs Private Health Insurance Coverage by Age in Avra Valley
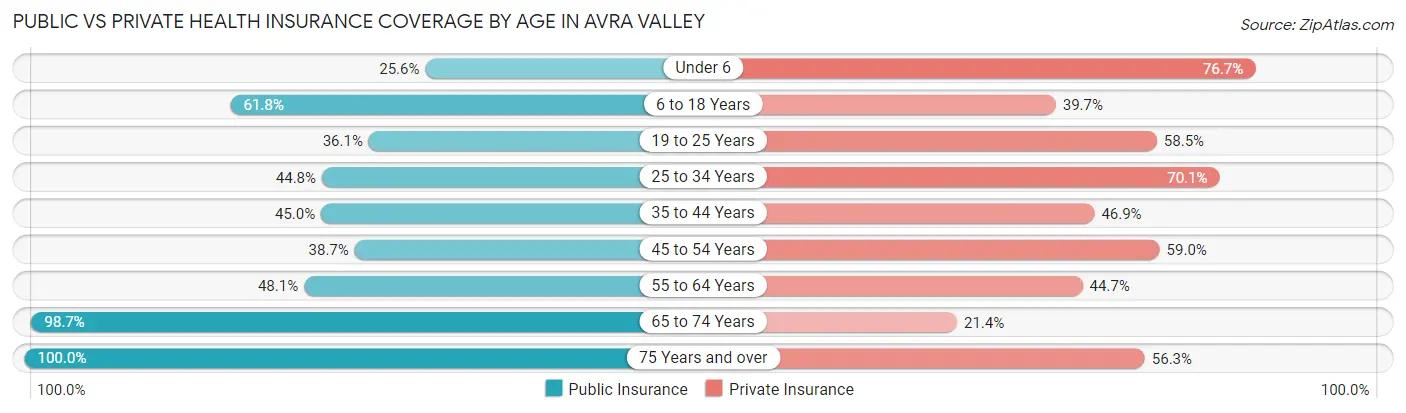
| Age Bracket | Public Insurance | Private Insurance |
| Under 6 | 142 (25.6%) | 425 (76.7%) |
| 6 to 18 Years | 580 (61.8%) | 373 (39.7%) |
| 19 to 25 Years | 134 (36.1%) | 217 (58.5%) |
| 25 to 34 Years | 334 (44.8%) | 522 (70.1%) |
| 35 to 44 Years | 210 (45.0%) | 219 (46.9%) |
| 45 to 54 Years | 394 (38.7%) | 600 (59.0%) |
| 55 to 64 Years | 519 (48.1%) | 482 (44.7%) |
| 65 to 74 Years | 623 (98.7%) | 135 (21.4%) |
| 75 Years and over | 336 (100.0%) | 189 (56.2%) |
| Total | 3,272 (53.3%) | 3,162 (51.5%) |
Disability Status by Sex by Age in Avra Valley
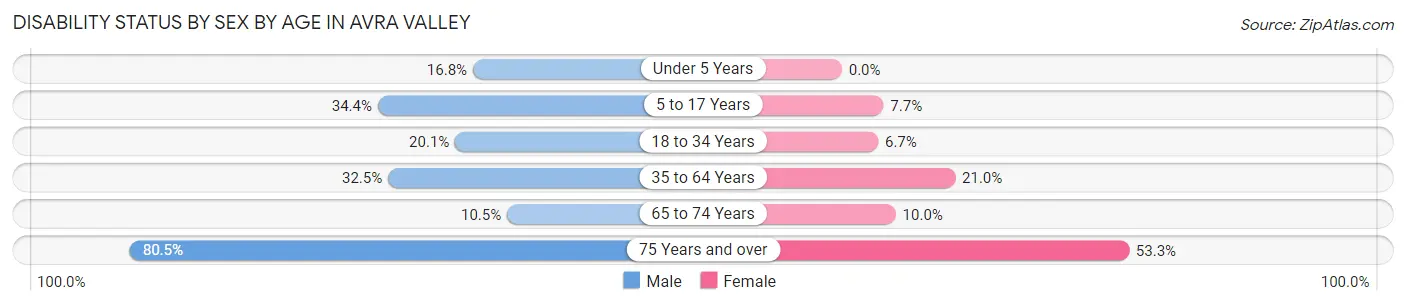
| Age Bracket | Male | Female |
| Under 5 Years | 47 (16.8%) | 0 (0.0%) |
| 5 to 17 Years | 145 (34.4%) | 37 (7.7%) |
| 18 to 34 Years | 101 (20.1%) | 46 (6.7%) |
| 35 to 64 Years | 504 (32.5%) | 213 (21.0%) |
| 65 to 74 Years | 21 (10.4%) | 43 (10.0%) |
| 75 Years and over | 136 (80.5%) | 89 (53.3%) |
Disability Class by Sex by Age in Avra Valley
Disability Class: Hearing Difficulty
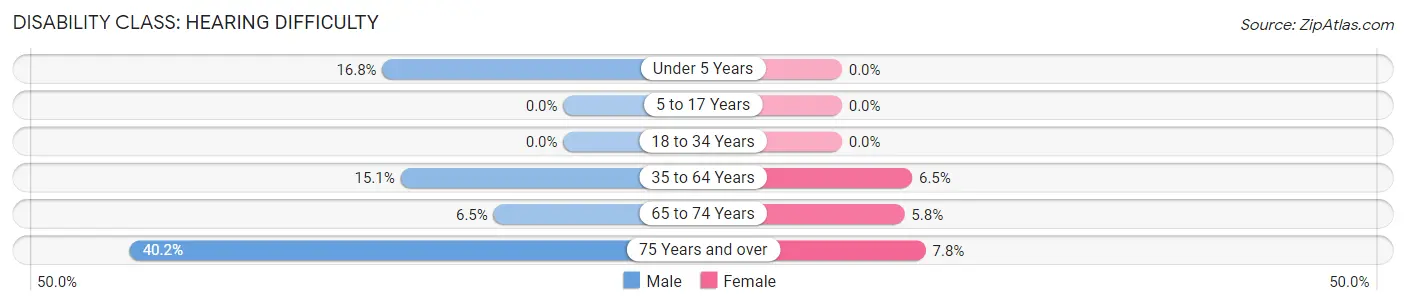
| Age Bracket | Male | Female |
| Under 5 Years | 47 (16.8%) | 0 (0.0%) |
| 5 to 17 Years | 0 (0.0%) | 0 (0.0%) |
| 18 to 34 Years | 0 (0.0%) | 0 (0.0%) |
| 35 to 64 Years | 234 (15.1%) | 66 (6.5%) |
| 65 to 74 Years | 13 (6.5%) | 25 (5.8%) |
| 75 Years and over | 68 (40.2%) | 13 (7.8%) |
Disability Class: Vision Difficulty
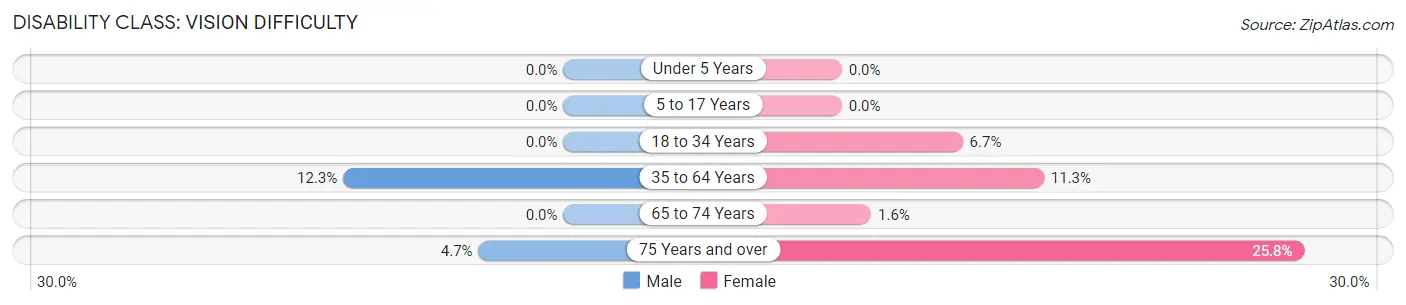
| Age Bracket | Male | Female |
| Under 5 Years | 0 (0.0%) | 0 (0.0%) |
| 5 to 17 Years | 0 (0.0%) | 0 (0.0%) |
| 18 to 34 Years | 0 (0.0%) | 46 (6.7%) |
| 35 to 64 Years | 190 (12.3%) | 114 (11.3%) |
| 65 to 74 Years | 0 (0.0%) | 7 (1.6%) |
| 75 Years and over | 8 (4.7%) | 43 (25.8%) |
Disability Class: Cognitive Difficulty
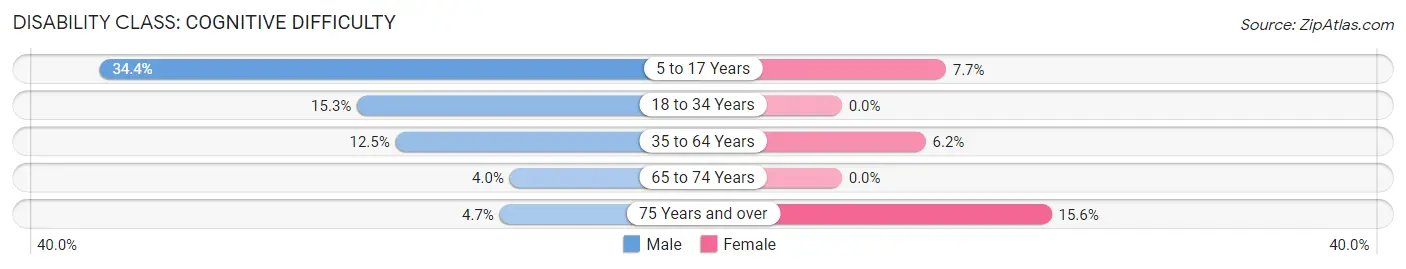
| Age Bracket | Male | Female |
| 5 to 17 Years | 145 (34.4%) | 37 (7.7%) |
| 18 to 34 Years | 77 (15.3%) | 0 (0.0%) |
| 35 to 64 Years | 193 (12.5%) | 63 (6.2%) |
| 65 to 74 Years | 8 (4.0%) | 0 (0.0%) |
| 75 Years and over | 8 (4.7%) | 26 (15.6%) |
Disability Class: Ambulatory Difficulty
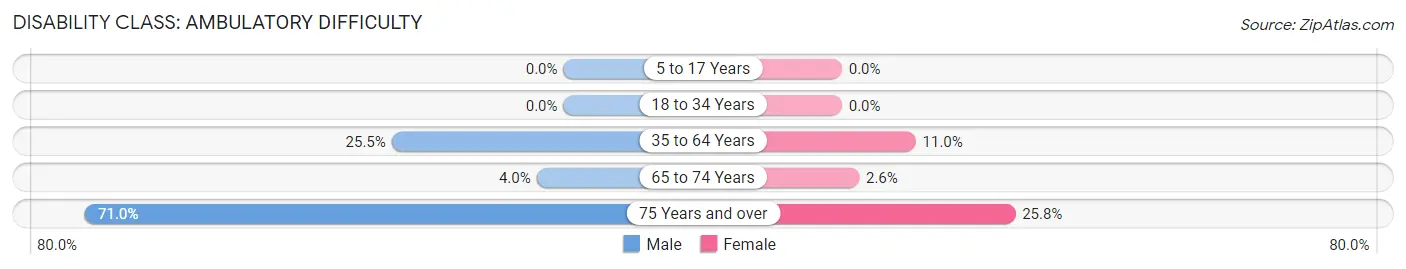
| Age Bracket | Male | Female |
| 5 to 17 Years | 0 (0.0%) | 0 (0.0%) |
| 18 to 34 Years | 0 (0.0%) | 0 (0.0%) |
| 35 to 64 Years | 395 (25.5%) | 111 (11.0%) |
| 65 to 74 Years | 8 (4.0%) | 11 (2.6%) |
| 75 Years and over | 120 (71.0%) | 43 (25.8%) |
Disability Class: Self-Care Difficulty
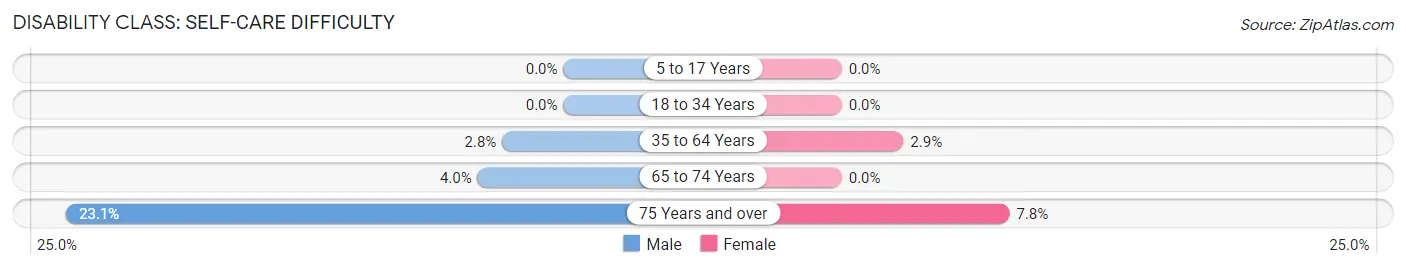
| Age Bracket | Male | Female |
| 5 to 17 Years | 0 (0.0%) | 0 (0.0%) |
| 18 to 34 Years | 0 (0.0%) | 0 (0.0%) |
| 35 to 64 Years | 44 (2.8%) | 29 (2.9%) |
| 65 to 74 Years | 8 (4.0%) | 0 (0.0%) |
| 75 Years and over | 39 (23.1%) | 13 (7.8%) |
Technology Access in Avra Valley
Computing Device Access in Avra Valley
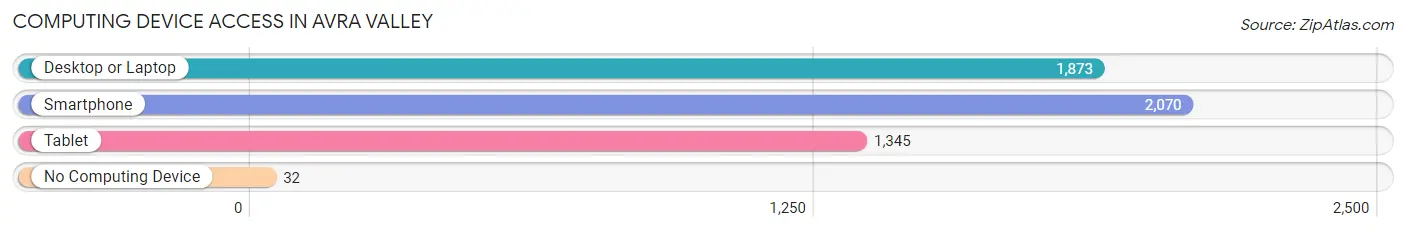
| Device Type | # Households | % Households |
| Desktop or Laptop | 1,873 | 78.2% |
| Smartphone | 2,070 | 86.4% |
| Tablet | 1,345 | 56.2% |
| No Computing Device | 32 | 1.3% |
| Total | 2,395 | 100.0% |
Internet Access in Avra Valley
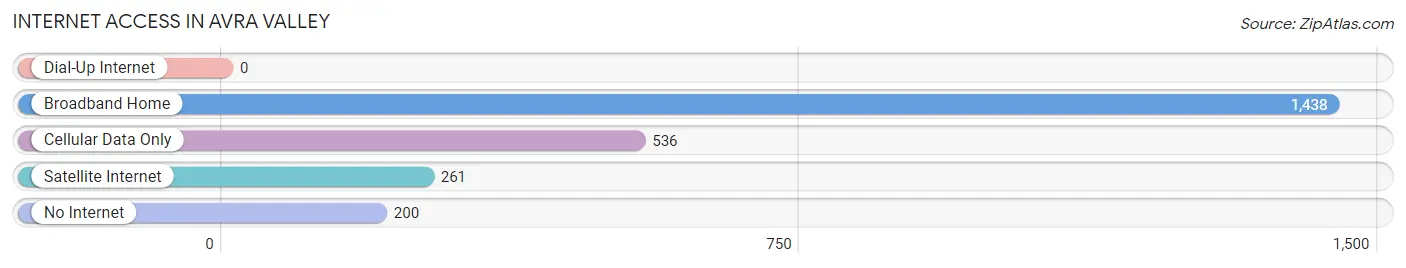
| Internet Type | # Households | % Households |
| Dial-Up Internet | 0 | 0.0% |
| Broadband Home | 1,438 | 60.0% |
| Cellular Data Only | 536 | 22.4% |
| Satellite Internet | 261 | 10.9% |
| No Internet | 200 | 8.4% |
| Total | 2,395 | 100.0% |
Avra Valley Summary
Avra Valley is a small unincorporated community located in Pima County, Arizona. It is situated in the Sonoran Desert, approximately 25 miles northwest of Tucson. The area is known for its agricultural production, including cotton, alfalfa, and other crops. The population of Avra Valley was estimated to be 1,845 in 2020.
History
Avra Valley has a long and rich history. The area was first inhabited by the Hohokam people, who lived in the area from around 300 BC to 1450 AD. The Hohokam were known for their irrigation systems, which were used to cultivate crops such as corn, beans, squash, and cotton.
The area was later settled by Spanish missionaries in the late 1700s. The Spanish established a mission in the area, which was later abandoned in 1821. After the Mexican-American War, the area became part of the United States.
In the late 1800s, the area was settled by ranchers and farmers. The area was known for its cotton production, and the town of Avra was established in 1891. The town was named after the Avra Valley, which was named after the Spanish word for “valley”.
Geography
Avra Valley is located in the Sonoran Desert, approximately 25 miles northwest of Tucson. The area is characterized by its arid climate, with hot summers and mild winters. The average annual temperature is around 70 degrees Fahrenheit.
The area is known for its agricultural production, including cotton, alfalfa, and other crops. The area is also home to a variety of wildlife, including coyotes, bobcats, and javelinas.
Economy
Avra Valley’s economy is largely based on agriculture. The area is known for its cotton production, and other crops such as alfalfa, wheat, and barley are also grown in the area. The area is also home to a variety of businesses, including restaurants, gas stations, and convenience stores.
Demographics
As of 2020, the population of Avra Valley was estimated to be 1,845. The population is largely Hispanic, with approximately 75% of the population identifying as Hispanic or Latino. The median household income in the area is $45,000, and the median age is 37.
Avra Valley is a small, unincorporated community located in Pima County, Arizona. It is situated in the Sonoran Desert, approximately 25 miles northwest of Tucson. The area is known for its agricultural production, including cotton, alfalfa, and other crops. The population of Avra Valley was estimated to be 1,845 in 2020. The area has a long and rich history, and is characterized by its arid climate and agricultural production. The economy of Avra Valley is largely based on agriculture, and the population is largely Hispanic. Avra Valley is a unique and vibrant community, and is a great place to live and work.
Common Questions
What is Per Capita Income in Avra Valley?
Per Capita income in Avra Valley is $28,607.
What is the Median Family Income in Avra Valley?
Median Family Income in Avra Valley is $52,184.
What is the Median Household income in Avra Valley?
Median Household Income in Avra Valley is $51,415.
What is Income or Wage Gap in Avra Valley?
Income or Wage Gap in Avra Valley is 7.3%.
Women in Avra Valley earn 92.7 cents for every dollar earned by a man.
What is Inequality or Gini Index in Avra Valley?
Inequality or Gini Index in Avra Valley is 0.46.
What is the Total Population of Avra Valley?
Total Population of Avra Valley is 6,281.
What is the Total Male Population of Avra Valley?
Total Male Population of Avra Valley is 3,266.
What is the Total Female Population of Avra Valley?
Total Female Population of Avra Valley is 3,015.
What is the Ratio of Males per 100 Females in Avra Valley?
There are 108.33 Males per 100 Females in Avra Valley.
What is the Ratio of Females per 100 Males in Avra Valley?
There are 92.31 Females per 100 Males in Avra Valley.
What is the Median Population Age in Avra Valley?
Median Population Age in Avra Valley is 41.8 Years.
What is the Average Family Size in Avra Valley
Average Family Size in Avra Valley is 3.1 People.
What is the Average Household Size in Avra Valley
Average Household Size in Avra Valley is 2.6 People.
How Large is the Labor Force in Avra Valley?
There are 3,167 People in the Labor Forcein in Avra Valley.
What is the Percentage of People in the Labor Force in Avra Valley?
64.4% of People are in the Labor Force in Avra Valley.
What is the Unemployment Rate in Avra Valley?
Unemployment Rate in Avra Valley is 9.8%.