Huachuca City, AZ Map & Demographics
Huachuca City Map
Huachuca City Overview
$25,041
PER CAPITA INCOME
$56,000
AVG FAMILY INCOME
$44,360
AVG HOUSEHOLD INCOME
21.7%
WAGE / INCOME GAP [ % ]
78.3¢/ $1
WAGE / INCOME GAP [ $ ]
$12,937
FAMILY INCOME DEFICIT
0.44
INEQUALITY / GINI INDEX
1,865
TOTAL POPULATION
966
MALE POPULATION
899
FEMALE POPULATION
107.45
MALES / 100 FEMALES
93.06
FEMALES / 100 MALES
42.3
MEDIAN AGE
3.1
AVG FAMILY SIZE
2.2
AVG HOUSEHOLD SIZE
823
LABOR FORCE [ PEOPLE ]
52.6%
PERCENT IN LABOR FORCE
11.0%
UNEMPLOYMENT RATE
Huachuca City Zip Codes
Huachuca City Area Codes
Income in Huachuca City
Income Overview in Huachuca City
Per Capita Income in Huachuca City is $25,041, while median incomes of families and households are $56,000 and $44,360 respectively.
| Characteristic | Number | Measure |
| Per Capita Income | 1,865 | $25,041 |
| Median Family Income | 414 | $56,000 |
| Mean Family Income | 414 | $63,702 |
| Median Household Income | 832 | $44,360 |
| Mean Household Income | 832 | $53,300 |
| Income Deficit | 414 | $12,937 |
| Wage / Income Gap (%) | 1,865 | 21.66% |
| Wage / Income Gap ($) | 1,865 | 78.34¢ per $1 |
| Gini / Inequality Index | 1,865 | 0.44 |
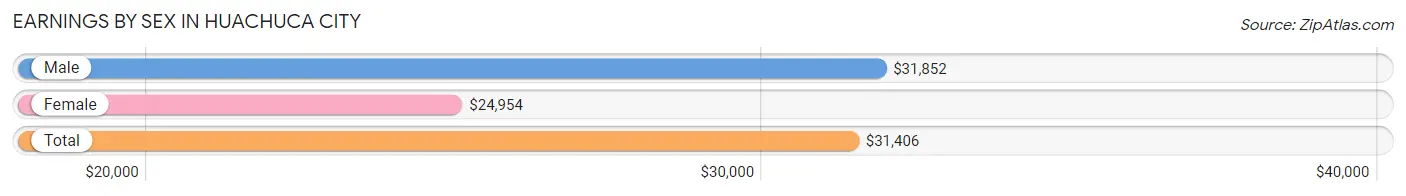
Earnings by Sex in Huachuca City
Average Earnings in Huachuca City are $31,406, $31,852 for men and $24,954 for women, a difference of 21.7%.
| Sex | Number | Average Earnings |
| Male | 466 (58.5%) | $31,852 |
| Female | 331 (41.5%) | $24,954 |
| Total | 797 (100.0%) | $31,406 |
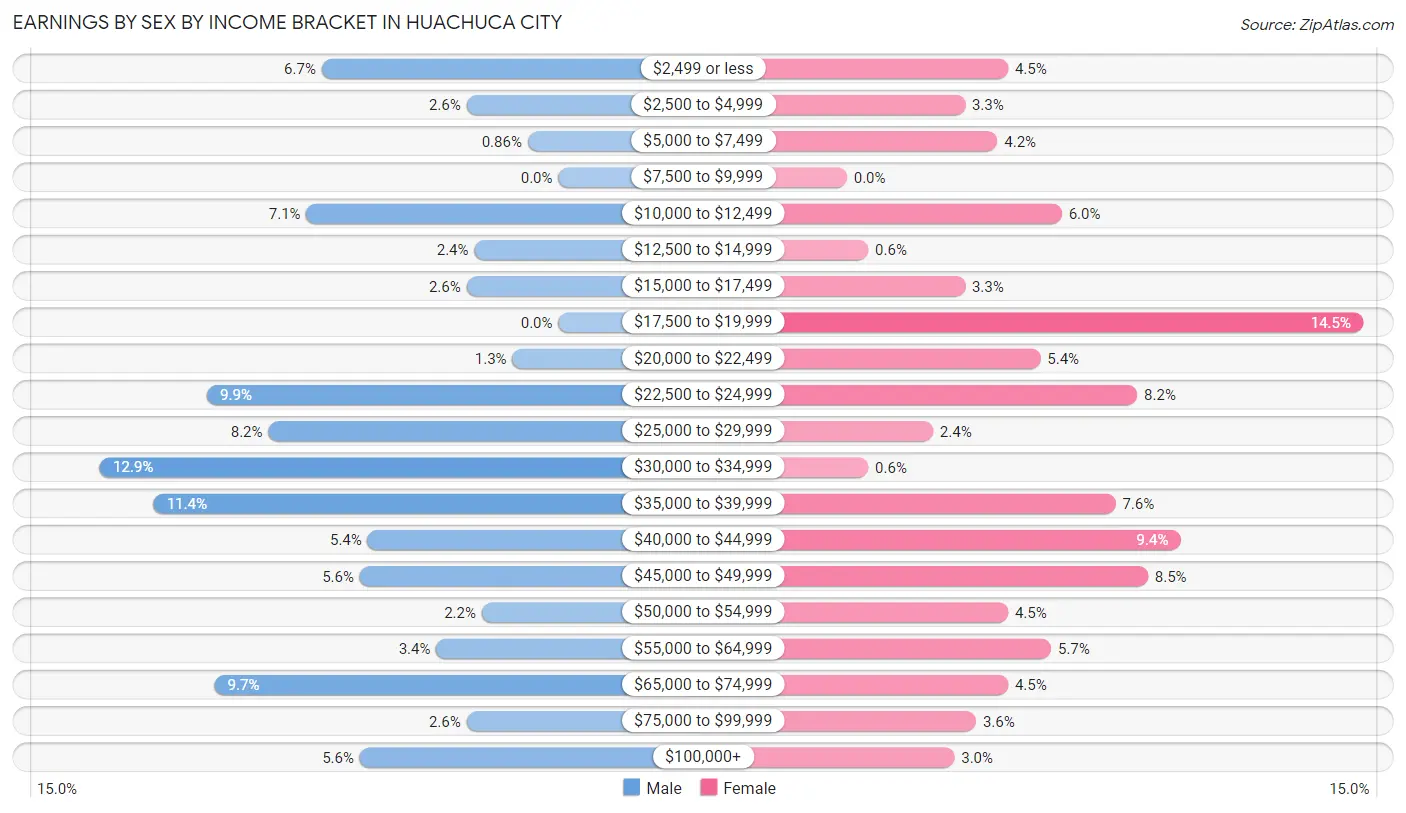
Earnings by Sex by Income Bracket in Huachuca City
The most common earnings brackets in Huachuca City are $30,000 to $34,999 for men (60 | 12.9%) and $17,500 to $19,999 for women (48 | 14.5%).
| Income | Male | Female |
| $2,499 or less | 31 (6.7%) | 15 (4.5%) |
| $2,500 to $4,999 | 12 (2.6%) | 11 (3.3%) |
| $5,000 to $7,499 | 4 (0.9%) | 14 (4.2%) |
| $7,500 to $9,999 | 0 (0.0%) | 0 (0.0%) |
| $10,000 to $12,499 | 33 (7.1%) | 20 (6.0%) |
| $12,500 to $14,999 | 11 (2.4%) | 2 (0.6%) |
| $15,000 to $17,499 | 12 (2.6%) | 11 (3.3%) |
| $17,500 to $19,999 | 0 (0.0%) | 48 (14.5%) |
| $20,000 to $22,499 | 6 (1.3%) | 18 (5.4%) |
| $22,500 to $24,999 | 46 (9.9%) | 27 (8.2%) |
| $25,000 to $29,999 | 38 (8.2%) | 8 (2.4%) |
| $30,000 to $34,999 | 60 (12.9%) | 2 (0.6%) |
| $35,000 to $39,999 | 53 (11.4%) | 25 (7.5%) |
| $40,000 to $44,999 | 25 (5.4%) | 31 (9.4%) |
| $45,000 to $49,999 | 26 (5.6%) | 28 (8.5%) |
| $50,000 to $54,999 | 10 (2.1%) | 15 (4.5%) |
| $55,000 to $64,999 | 16 (3.4%) | 19 (5.7%) |
| $65,000 to $74,999 | 45 (9.7%) | 15 (4.5%) |
| $75,000 to $99,999 | 12 (2.6%) | 12 (3.6%) |
| $100,000+ | 26 (5.6%) | 10 (3.0%) |
| Total | 466 (100.0%) | 331 (100.0%) |
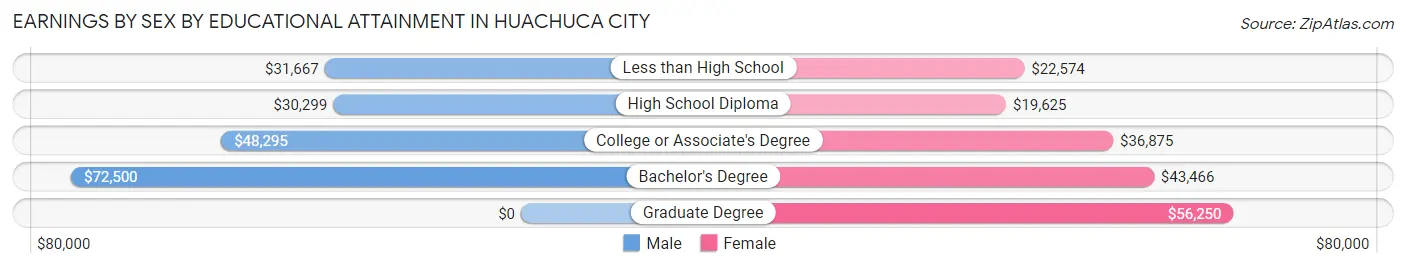
Earnings by Sex by Educational Attainment in Huachuca City
Average earnings in Huachuca City are $32,083 for men and $26,875 for women, a difference of 16.2%. Men with an educational attainment of bachelor's degree enjoy the highest average annual earnings of $72,500, while those with high school diploma education earn the least with $30,299. Women with an educational attainment of graduate degree earn the most with the average annual earnings of $56,250, while those with high school diploma education have the smallest earnings of $19,625.
| Educational Attainment | Male Income | Female Income |
| Less than High School | $31,667 | $22,574 |
| High School Diploma | $30,299 | $19,625 |
| College or Associate's Degree | $48,295 | $36,875 |
| Bachelor's Degree | $72,500 | $43,466 |
| Graduate Degree | - | - |
| Total | $32,083 | $26,875 |
Family Income in Huachuca City
Family Income Brackets in Huachuca City
According to the Huachuca City family income data, there are 99 families falling into the $35,000 to $49,999 income range, which is the most common income bracket and makes up 23.9% of all families. Conversely, the $200,000+ income bracket is the least frequent group with only 4 families (1.0%) belonging to this category.
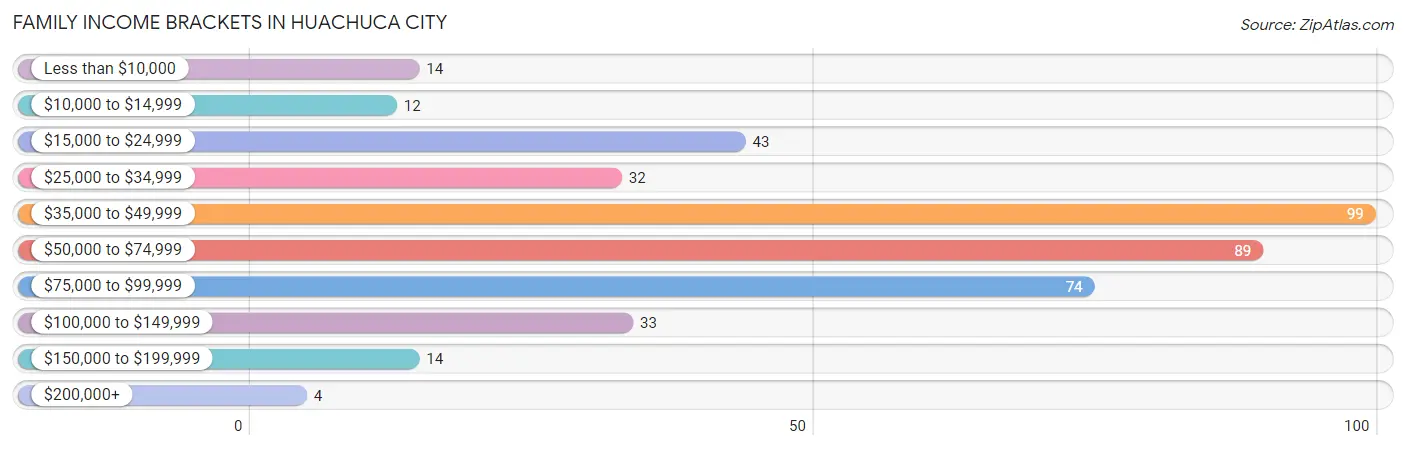
| Income Bracket | # Families | % Families |
| Less than $10,000 | 14 | 3.4% |
| $10,000 to $14,999 | 12 | 2.9% |
| $15,000 to $24,999 | 43 | 10.4% |
| $25,000 to $34,999 | 32 | 7.7% |
| $35,000 to $49,999 | 99 | 23.9% |
| $50,000 to $74,999 | 89 | 21.5% |
| $75,000 to $99,999 | 74 | 17.9% |
| $100,000 to $149,999 | 33 | 8.0% |
| $150,000 to $199,999 | 14 | 3.4% |
| $200,000+ | 4 | 1.0% |
Family Income by Famaliy Size in Huachuca City
3-person families (56 | 13.5%) account for the highest median family income in Huachuca City with $61,500 per family, while 2-person families (243 | 58.7%) have the highest median income of $30,625 per family member.
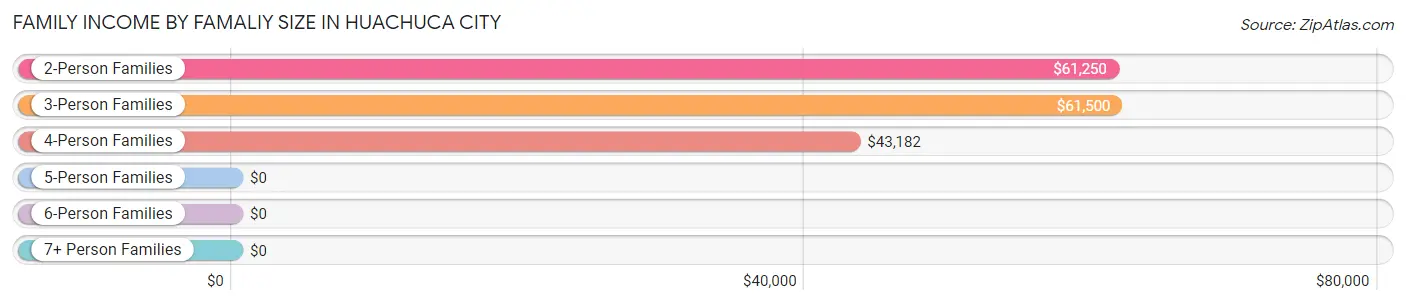
| Income Bracket | # Families | Median Income |
| 2-Person Families | 243 (58.7%) | $61,250 |
| 3-Person Families | 56 (13.5%) | $61,500 |
| 4-Person Families | 54 (13.0%) | $43,182 |
| 5-Person Families | 30 (7.2%) | $0 |
| 6-Person Families | 10 (2.4%) | $0 |
| 7+ Person Families | 21 (5.1%) | $0 |
| Total | 414 (100.0%) | $56,000 |
Family Income by Number of Earners in Huachuca City
The median family income in Huachuca City is $56,000, with families comprising 3+ earners (34) having the highest median family income of $94,524, while families with no earners (84) have the lowest median family income of $45,714, accounting for 8.2% and 20.3% of families, respectively.
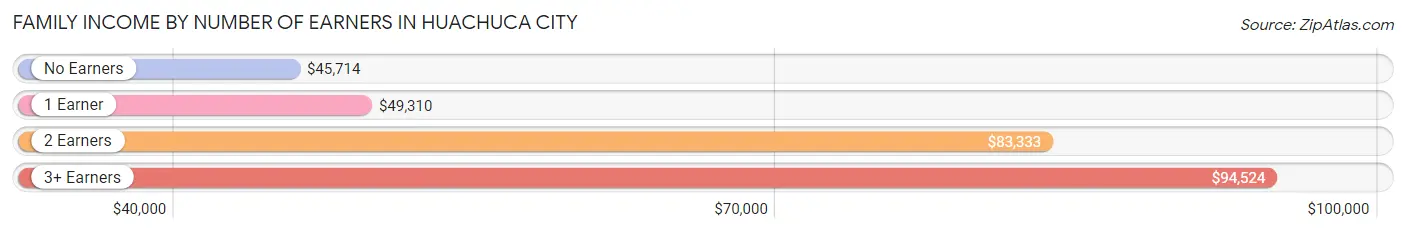
| Number of Earners | # Families | Median Income |
| No Earners | 84 (20.3%) | $45,714 |
| 1 Earner | 208 (50.2%) | $49,310 |
| 2 Earners | 88 (21.3%) | $83,333 |
| 3+ Earners | 34 (8.2%) | $94,524 |
| Total | 414 (100.0%) | $56,000 |
Household Income in Huachuca City
Household Income Brackets in Huachuca City
With 153 households falling in the category, the $35,000 to $49,999 income range is the most frequent in Huachuca City, accounting for 18.4% of all households. In contrast, only 13 households (1.6%) fall into the $200,000+ income bracket, making it the least populous group.
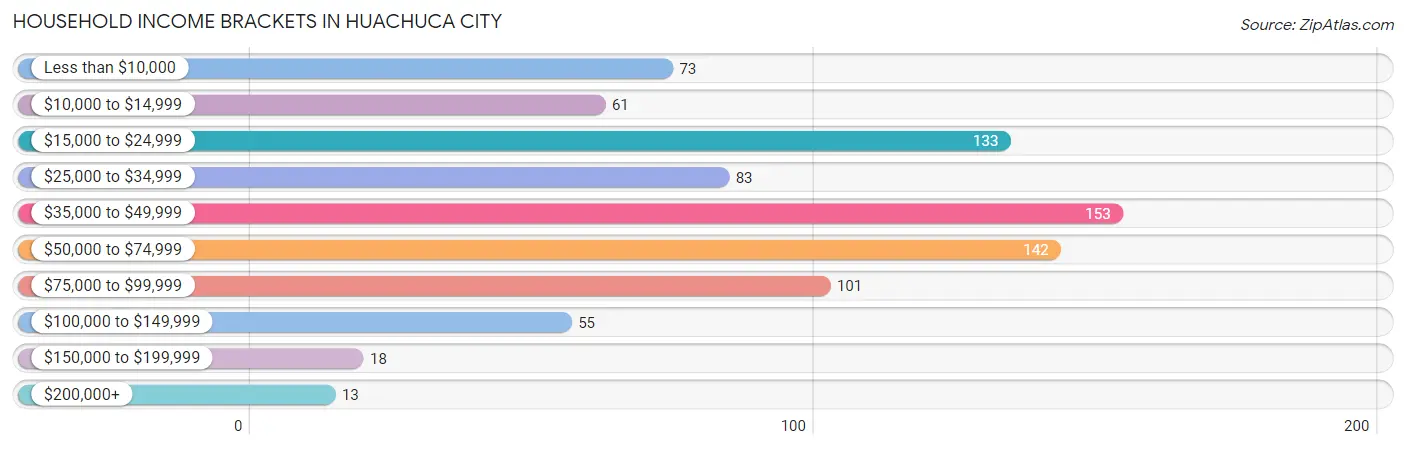
| Income Bracket | # Households | % Households |
| Less than $10,000 | 73 | 8.8% |
| $10,000 to $14,999 | 61 | 7.3% |
| $15,000 to $24,999 | 133 | 16.0% |
| $25,000 to $34,999 | 83 | 10.0% |
| $35,000 to $49,999 | 153 | 18.4% |
| $50,000 to $74,999 | 142 | 17.1% |
| $75,000 to $99,999 | 101 | 12.1% |
| $100,000 to $149,999 | 55 | 6.6% |
| $150,000 to $199,999 | 18 | 2.2% |
| $200,000+ | 13 | 1.6% |
Household Income by Householder Age in Huachuca City
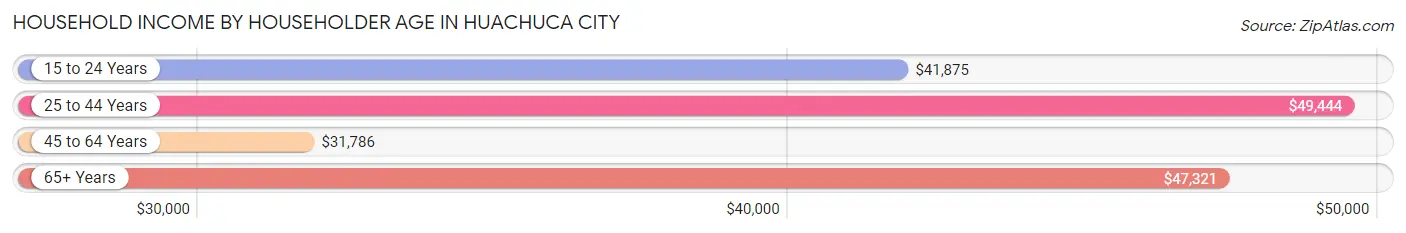
The median household income in Huachuca City is $44,360, with the highest median household income of $49,444 found in the 25 to 44 years age bracket for the primary householder. A total of 202 households (24.3%) fall into this category. Meanwhile, the 45 to 64 years age bracket for the primary householder has the lowest median household income of $31,786, with 284 households (34.1%) in this group.
| Income Bracket | # Households | Median Income |
| 15 to 24 Years | 21 (2.5%) | $41,875 |
| 25 to 44 Years | 202 (24.3%) | $49,444 |
| 45 to 64 Years | 284 (34.1%) | $31,786 |
| 65+ Years | 325 (39.1%) | $47,321 |
| Total | 832 (100.0%) | $44,360 |
Poverty in Huachuca City
Income Below Poverty by Sex and Age in Huachuca City
With 21.3% poverty level for males and 17.6% for females among the residents of Huachuca City, 5 year old males and under 5 year old females are the most vulnerable to poverty, with 6 males (46.2%) and 11 females (78.6%) in their respective age groups living below the poverty level.
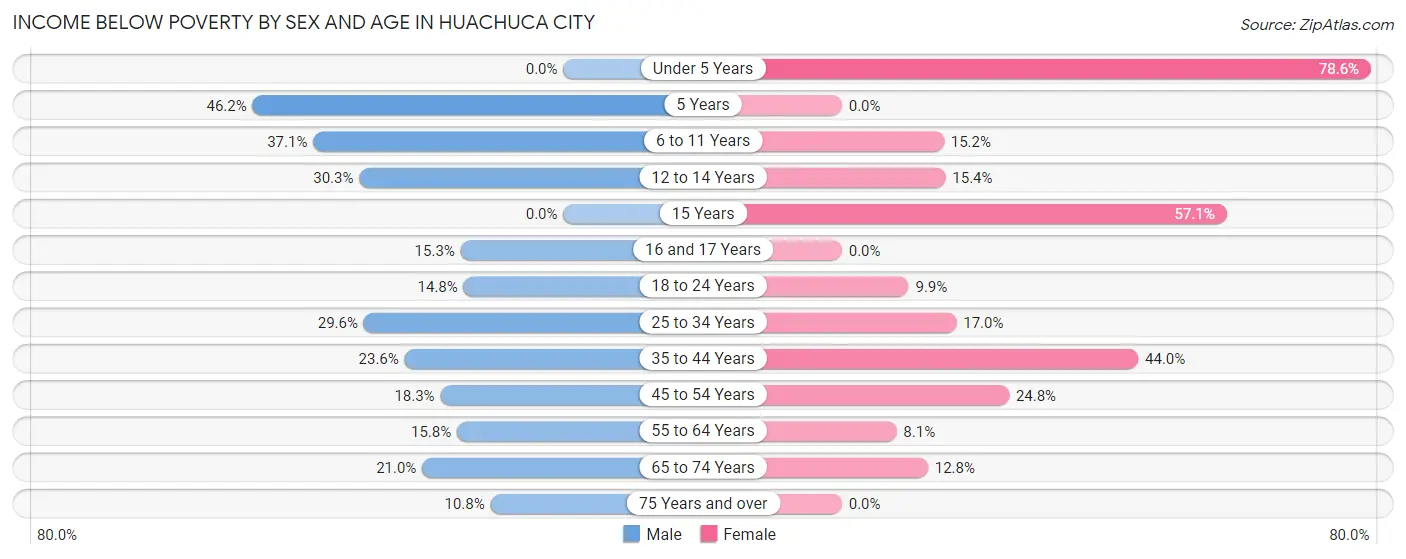
| Age Bracket | Male | Female |
| Under 5 Years | 0 (0.0%) | 11 (78.6%) |
| 5 Years | 6 (46.2%) | 0 (0.0%) |
| 6 to 11 Years | 13 (37.1%) | 15 (15.1%) |
| 12 to 14 Years | 20 (30.3%) | 8 (15.4%) |
| 15 Years | 0 (0.0%) | 4 (57.1%) |
| 16 and 17 Years | 9 (15.2%) | 0 (0.0%) |
| 18 to 24 Years | 8 (14.8%) | 11 (9.9%) |
| 25 to 34 Years | 32 (29.6%) | 17 (17.0%) |
| 35 to 44 Years | 33 (23.6%) | 33 (44.0%) |
| 45 to 54 Years | 23 (18.2%) | 35 (24.8%) |
| 55 to 64 Years | 18 (15.8%) | 6 (8.1%) |
| 65 to 74 Years | 35 (21.0%) | 18 (12.8%) |
| 75 Years and over | 8 (10.8%) | 0 (0.0%) |
| Total | 205 (21.3%) | 158 (17.6%) |
Income Above Poverty by Sex and Age in Huachuca City
According to the poverty statistics in Huachuca City, males aged under 5 years and females aged 5 years are the age groups that are most secure financially, with 100.0% of males and 100.0% of females in these age groups living above the poverty line.
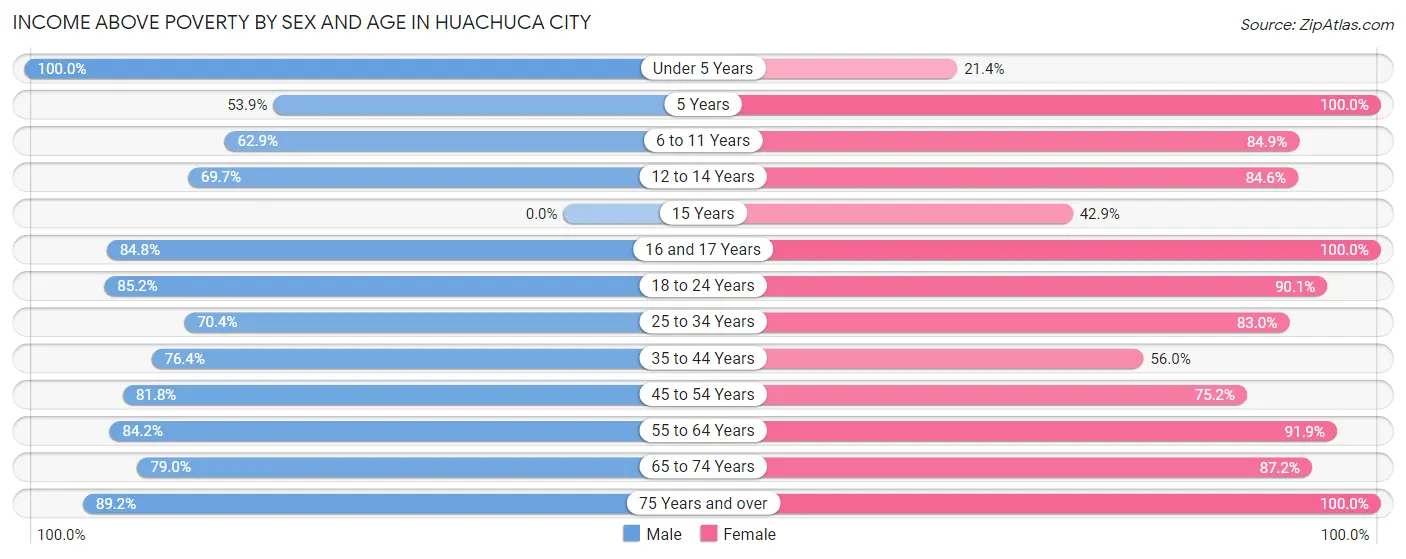
| Age Bracket | Male | Female |
| Under 5 Years | 7 (100.0%) | 3 (21.4%) |
| 5 Years | 7 (53.8%) | 5 (100.0%) |
| 6 to 11 Years | 22 (62.9%) | 84 (84.9%) |
| 12 to 14 Years | 46 (69.7%) | 44 (84.6%) |
| 15 Years | 0 (0.0%) | 3 (42.9%) |
| 16 and 17 Years | 50 (84.8%) | 9 (100.0%) |
| 18 to 24 Years | 46 (85.2%) | 100 (90.1%) |
| 25 to 34 Years | 76 (70.4%) | 83 (83.0%) |
| 35 to 44 Years | 107 (76.4%) | 42 (56.0%) |
| 45 to 54 Years | 103 (81.8%) | 106 (75.2%) |
| 55 to 64 Years | 96 (84.2%) | 68 (91.9%) |
| 65 to 74 Years | 132 (79.0%) | 123 (87.2%) |
| 75 Years and over | 66 (89.2%) | 71 (100.0%) |
| Total | 758 (78.7%) | 741 (82.4%) |
Income Below Poverty Among Married-Couple Families in Huachuca City
The poverty statistics for married-couple families in Huachuca City show that 10.1% or 27 of the total 268 families live below the poverty line. Families with 3 or 4 children have the highest poverty rate of 40.0%, comprising of 14 families. On the other hand, families with no children have the lowest poverty rate of 3.8%, which includes 7 families.
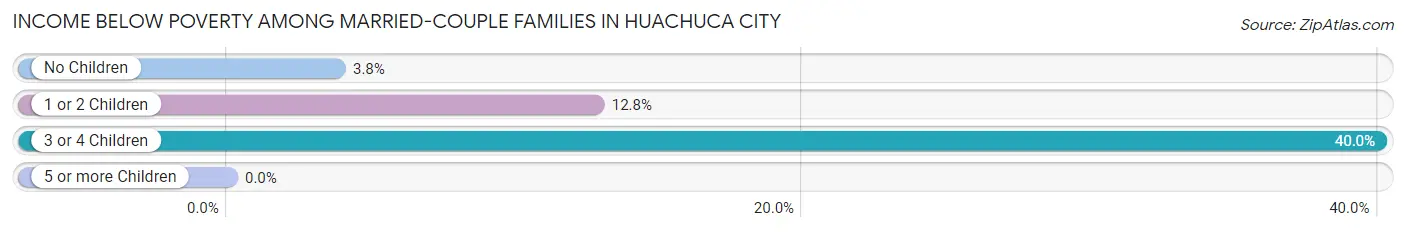
| Children | Above Poverty | Below Poverty |
| No Children | 179 (96.2%) | 7 (3.8%) |
| 1 or 2 Children | 41 (87.2%) | 6 (12.8%) |
| 3 or 4 Children | 21 (60.0%) | 14 (40.0%) |
| 5 or more Children | 0 (0.0%) | 0 (0.0%) |
| Total | 241 (89.9%) | 27 (10.1%) |
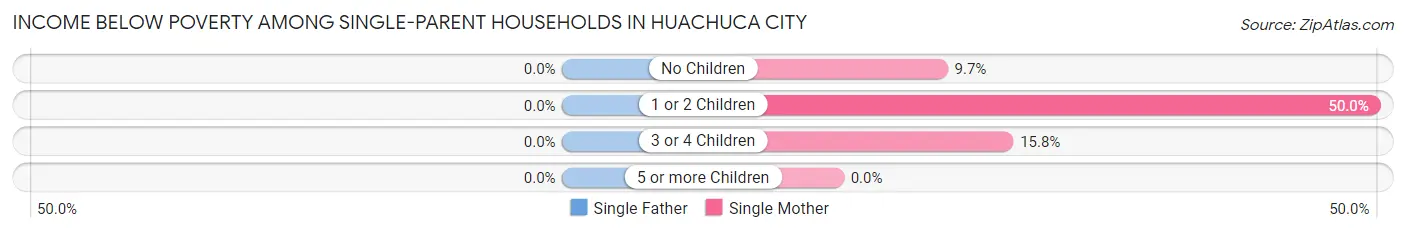
Income Below Poverty Among Single-Parent Households in Huachuca City
| Children | Single Father | Single Mother |
| No Children | 0 (0.0%) | 3 (9.7%) |
| 1 or 2 Children | 0 (0.0%) | 18 (50.0%) |
| 3 or 4 Children | 0 (0.0%) | 6 (15.8%) |
| 5 or more Children | 0 (0.0%) | 0 (0.0%) |
| Total | 0 (0.0%) | 27 (23.5%) |
Income Below Poverty Among Married-Couple vs Single-Parent Households in Huachuca City
The poverty data for Huachuca City shows that 27 of the married-couple family households (10.1%) and 27 of the single-parent households (18.5%) are living below the poverty level. Within the married-couple family households, those with 3 or 4 children have the highest poverty rate, with 14 households (40.0%) falling below the poverty line. Among the single-parent households, those with 1 or 2 children have the highest poverty rate, with 18 household (35.3%) living below poverty.
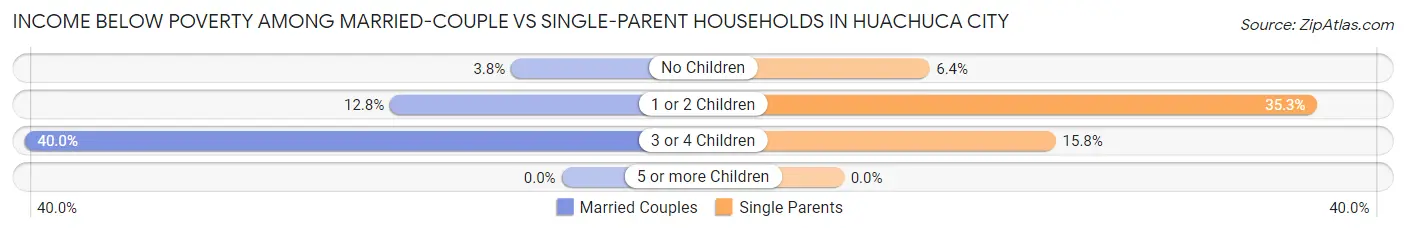
| Children | Married-Couple Families | Single-Parent Households |
| No Children | 7 (3.8%) | 3 (6.4%) |
| 1 or 2 Children | 6 (12.8%) | 18 (35.3%) |
| 3 or 4 Children | 14 (40.0%) | 6 (15.8%) |
| 5 or more Children | 0 (0.0%) | 0 (0.0%) |
| Total | 27 (10.1%) | 27 (18.5%) |
Race in Huachuca City
The most populous races in Huachuca City are White / Caucasian (1,427 | 76.5%), Hispanic or Latino (253 | 13.6%), and Two or more Races (170 | 9.1%).
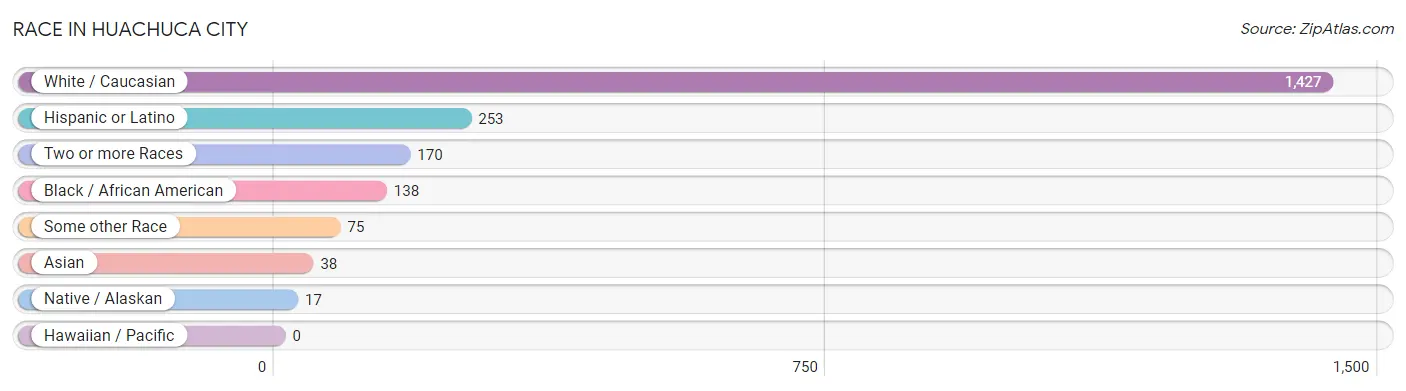
| Race | # Population | % Population |
| Asian | 38 | 2.0% |
| Black / African American | 138 | 7.4% |
| Hawaiian / Pacific | 0 | 0.0% |
| Hispanic or Latino | 253 | 13.6% |
| Native / Alaskan | 17 | 0.9% |
| White / Caucasian | 1,427 | 76.5% |
| Two or more Races | 170 | 9.1% |
| Some other Race | 75 | 4.0% |
| Total | 1,865 | 100.0% |
Ancestry in Huachuca City
The most populous ancestries reported in Huachuca City are German (524 | 28.1%), Irish (436 | 23.4%), English (179 | 9.6%), Mexican (137 | 7.3%), and Puerto Rican (84 | 4.5%), together accounting for 72.9% of all Huachuca City residents.
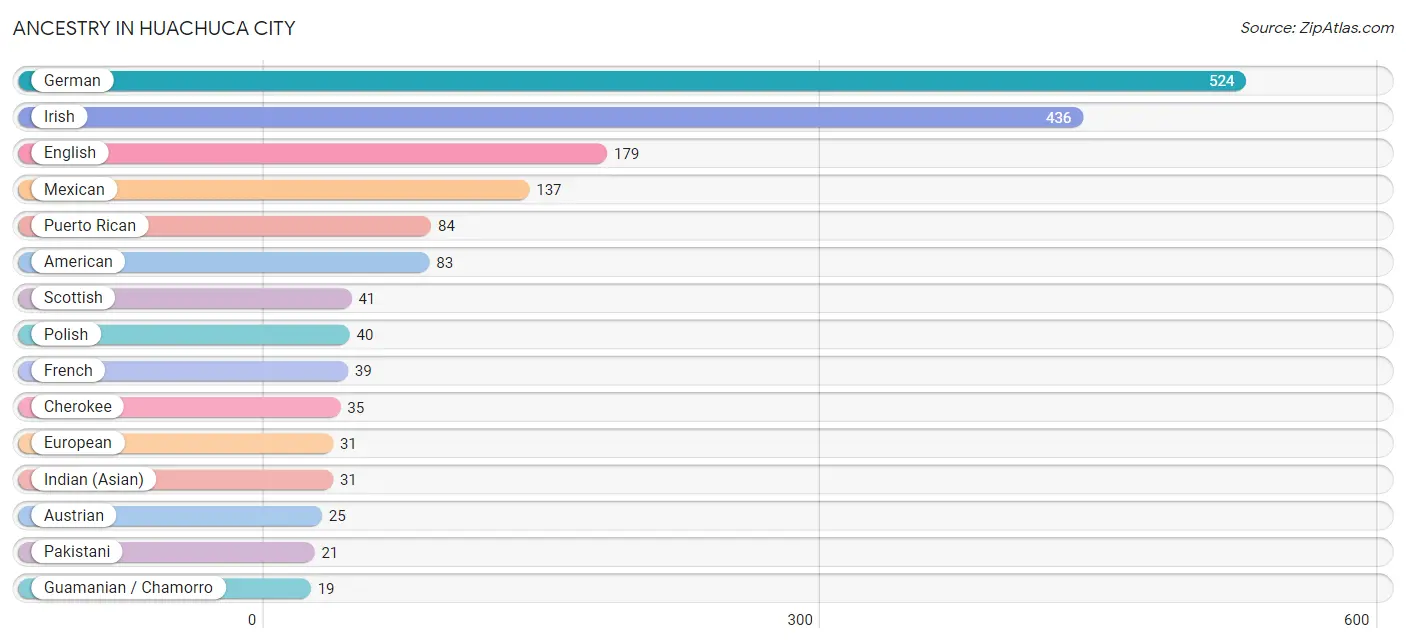
| Ancestry | # Population | % Population |
| American | 83 | 4.4% |
| Austrian | 25 | 1.3% |
| Bhutanese | 11 | 0.6% |
| British | 4 | 0.2% |
| Burmese | 8 | 0.4% |
| Cherokee | 35 | 1.9% |
| Chippewa | 8 | 0.4% |
| Danish | 4 | 0.2% |
| Dutch | 10 | 0.5% |
| English | 179 | 9.6% |
| Ethiopian | 7 | 0.4% |
| European | 31 | 1.7% |
| Finnish | 4 | 0.2% |
| French | 39 | 2.1% |
| French Canadian | 9 | 0.5% |
| German | 524 | 28.1% |
| Greek | 2 | 0.1% |
| Guamanian / Chamorro | 19 | 1.0% |
| Hopi | 3 | 0.2% |
| Hungarian | 5 | 0.3% |
| Indian (Asian) | 31 | 1.7% |
| Irish | 436 | 23.4% |
| Italian | 9 | 0.5% |
| Korean | 14 | 0.7% |
| Mexican | 137 | 7.3% |
| Native Hawaiian | 9 | 0.5% |
| Navajo | 3 | 0.2% |
| Norwegian | 14 | 0.7% |
| Pakistani | 21 | 1.1% |
| Polish | 40 | 2.1% |
| Portuguese | 7 | 0.4% |
| Puerto Rican | 84 | 4.5% |
| Russian | 13 | 0.7% |
| Scandinavian | 2 | 0.1% |
| Scotch-Irish | 18 | 1.0% |
| Scottish | 41 | 2.2% |
| Sioux | 9 | 0.5% |
| Spaniard | 6 | 0.3% |
| Subsaharan African | 7 | 0.4% |
| Swedish | 9 | 0.5% |
| Swiss | 5 | 0.3% |
| Welsh | 8 | 0.4% |
| West Indian | 5 | 0.3% |
| Yaqui | 4 | 0.2% |
| Yugoslavian | 6 | 0.3% | View All 45 Rows |
Immigrants in Huachuca City
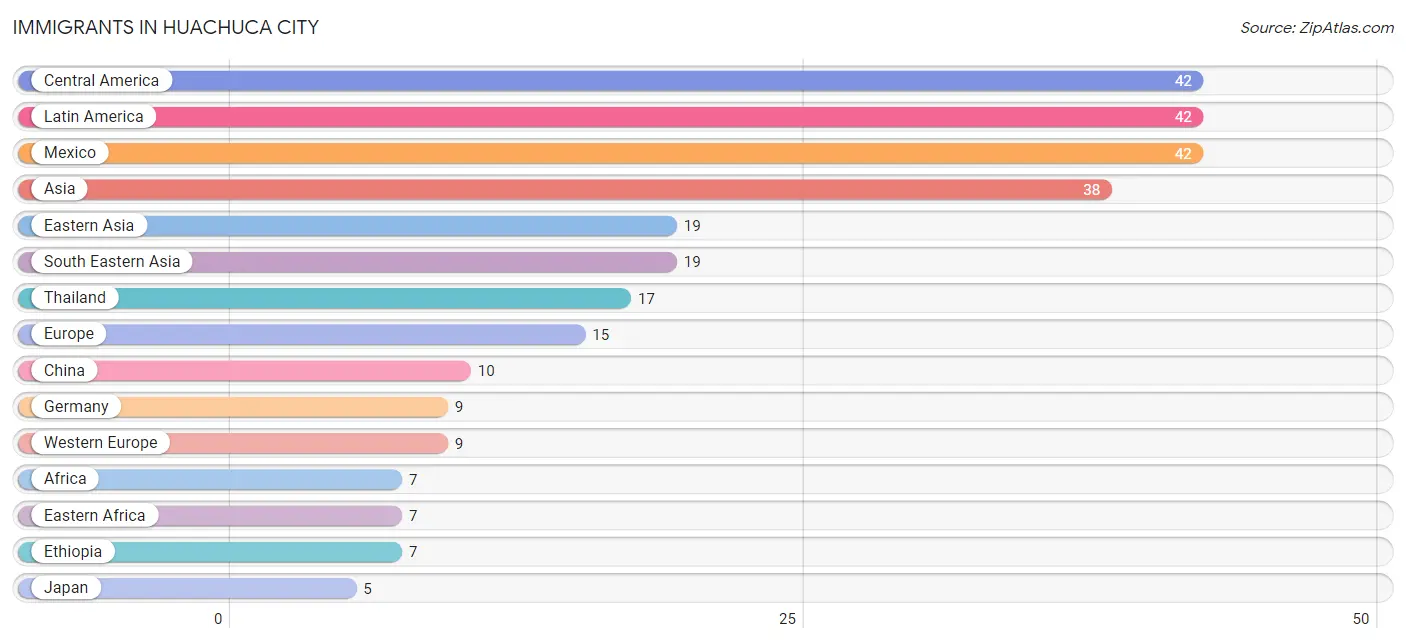
The most numerous immigrant groups reported in Huachuca City came from Central America (42 | 2.2%), Latin America (42 | 2.2%), Mexico (42 | 2.2%), Asia (38 | 2.0%), and Eastern Asia (19 | 1.0%), together accounting for 9.8% of all Huachuca City residents.
| Immigration Origin | # Population | % Population |
| Africa | 7 | 0.4% |
| Asia | 38 | 2.0% |
| Central America | 42 | 2.2% |
| China | 10 | 0.5% |
| Eastern Africa | 7 | 0.4% |
| Eastern Asia | 19 | 1.0% |
| Eastern Europe | 4 | 0.2% |
| England | 2 | 0.1% |
| Ethiopia | 7 | 0.4% |
| Europe | 15 | 0.8% |
| Germany | 9 | 0.5% |
| Japan | 5 | 0.3% |
| Korea | 4 | 0.2% |
| Latin America | 42 | 2.2% |
| Mexico | 42 | 2.2% |
| Northern Europe | 2 | 0.1% |
| Philippines | 2 | 0.1% |
| South Eastern Asia | 19 | 1.0% |
| Thailand | 17 | 0.9% |
| Ukraine | 4 | 0.2% |
| Western Europe | 9 | 0.5% | View All 21 Rows |
Sex and Age in Huachuca City
Sex and Age in Huachuca City
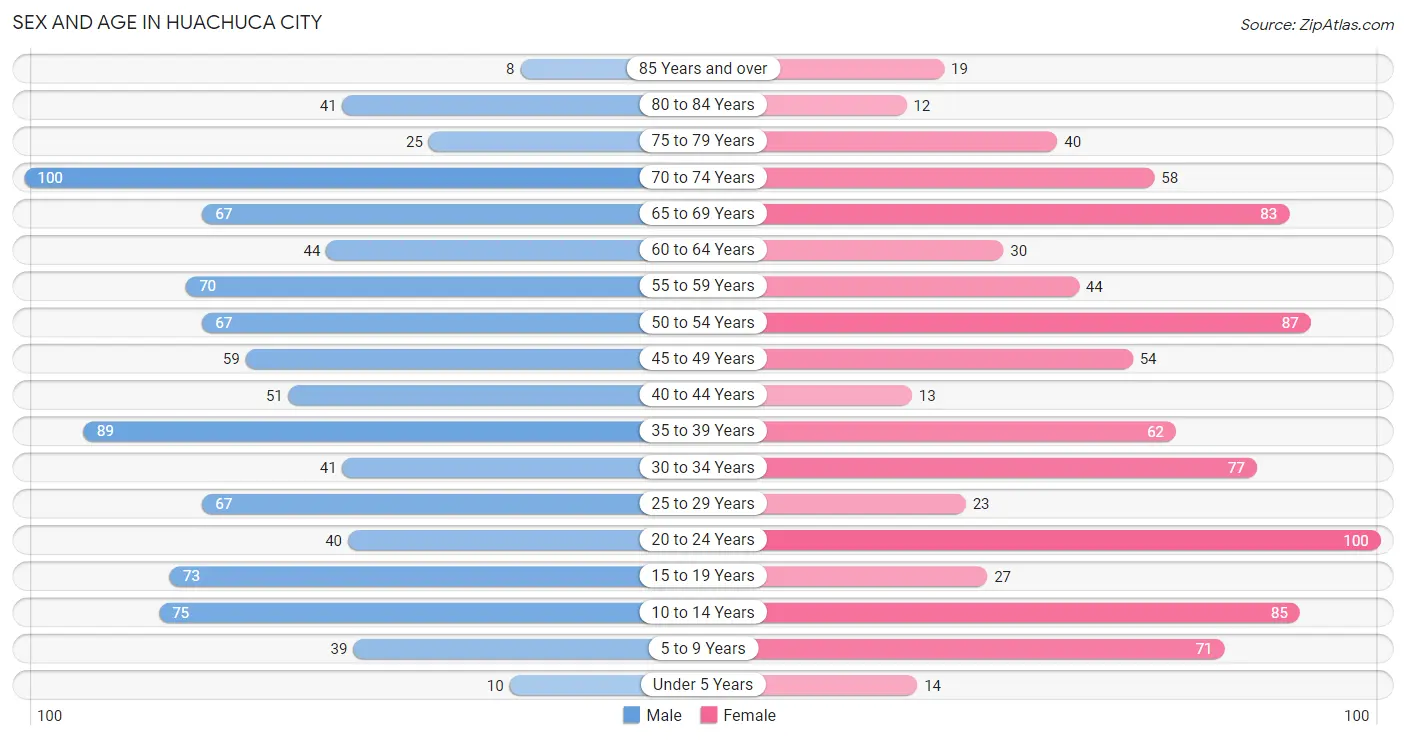
The most populous age groups in Huachuca City are 70 to 74 Years (100 | 10.3%) for men and 20 to 24 Years (100 | 11.1%) for women.
| Age Bracket | Male | Female |
| Under 5 Years | 10 (1.0%) | 14 (1.6%) |
| 5 to 9 Years | 39 (4.0%) | 71 (7.9%) |
| 10 to 14 Years | 75 (7.8%) | 85 (9.5%) |
| 15 to 19 Years | 73 (7.6%) | 27 (3.0%) |
| 20 to 24 Years | 40 (4.1%) | 100 (11.1%) |
| 25 to 29 Years | 67 (6.9%) | 23 (2.6%) |
| 30 to 34 Years | 41 (4.2%) | 77 (8.6%) |
| 35 to 39 Years | 89 (9.2%) | 62 (6.9%) |
| 40 to 44 Years | 51 (5.3%) | 13 (1.5%) |
| 45 to 49 Years | 59 (6.1%) | 54 (6.0%) |
| 50 to 54 Years | 67 (6.9%) | 87 (9.7%) |
| 55 to 59 Years | 70 (7.2%) | 44 (4.9%) |
| 60 to 64 Years | 44 (4.5%) | 30 (3.3%) |
| 65 to 69 Years | 67 (6.9%) | 83 (9.2%) |
| 70 to 74 Years | 100 (10.3%) | 58 (6.5%) |
| 75 to 79 Years | 25 (2.6%) | 40 (4.4%) |
| 80 to 84 Years | 41 (4.2%) | 12 (1.3%) |
| 85 Years and over | 8 (0.8%) | 19 (2.1%) |
| Total | 966 (100.0%) | 899 (100.0%) |
Families and Households in Huachuca City
Median Family Size in Huachuca City
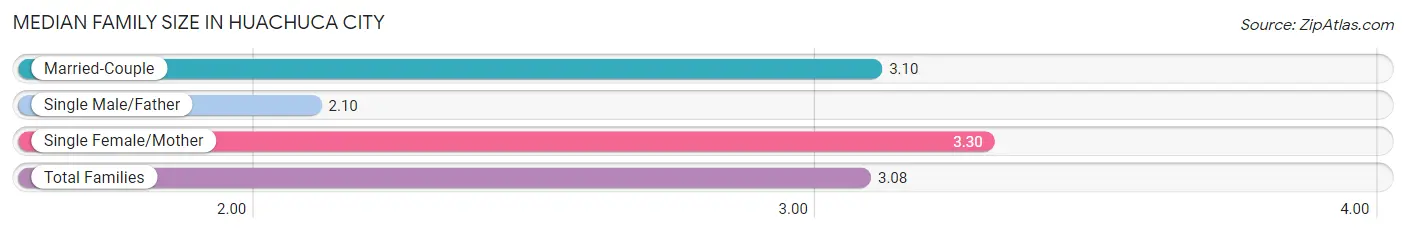
The median family size in Huachuca City is 3.08 persons per family, with single female/mother families (115 | 27.8%) accounting for the largest median family size of 3.3 persons per family. On the other hand, single male/father families (31 | 7.5%) represent the smallest median family size with 2.10 persons per family.
| Family Type | # Families | Family Size |
| Married-Couple | 268 (64.7%) | 3.10 |
| Single Male/Father | 31 (7.5%) | 2.10 |
| Single Female/Mother | 115 (27.8%) | 3.30 |
| Total Families | 414 (100.0%) | 3.08 |
Median Household Size in Huachuca City
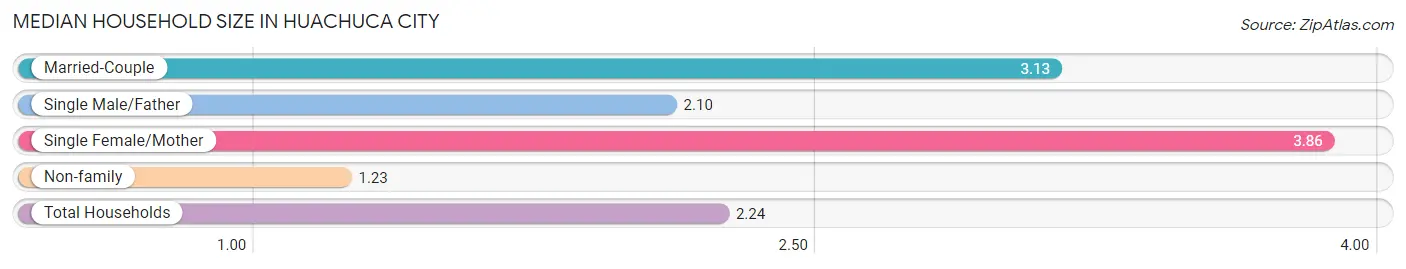
The median household size in Huachuca City is 2.24 persons per household, with single female/mother households (115 | 13.8%) accounting for the largest median household size of 3.86 persons per household. non-family households (418 | 50.2%) represent the smallest median household size with 1.23 persons per household.
| Household Type | # Households | Household Size |
| Married-Couple | 268 (32.2%) | 3.13 |
| Single Male/Father | 31 (3.7%) | 2.10 |
| Single Female/Mother | 115 (13.8%) | 3.86 |
| Non-family | 418 (50.2%) | 1.23 |
| Total Households | 832 (100.0%) | 2.24 |
Household Size by Marriage Status in Huachuca City
Out of a total of 832 households in Huachuca City, 414 (49.8%) are family households, while 418 (50.2%) are nonfamily households. The most numerous type of family households are 2-person households, comprising 221, and the most common type of nonfamily households are 1-person households, comprising 342.
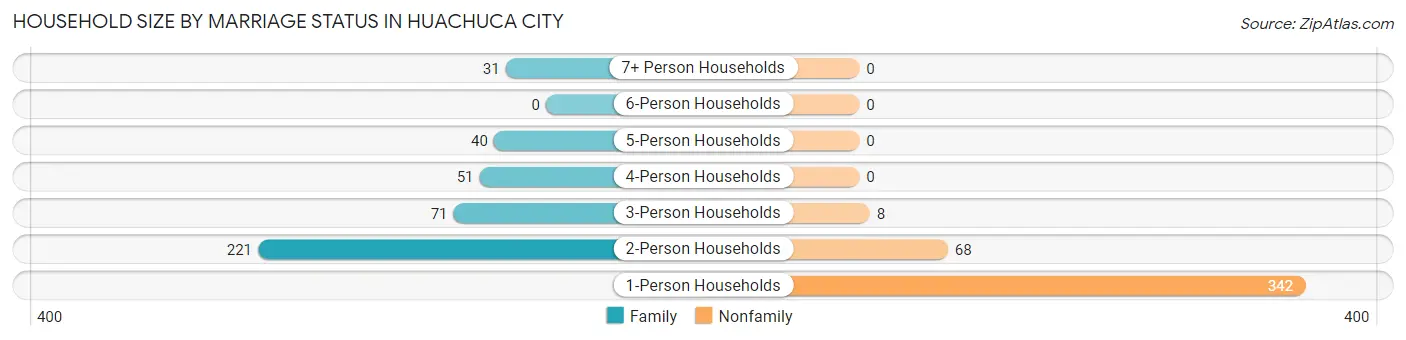
| Household Size | Family Households | Nonfamily Households |
| 1-Person Households | - | 342 (41.1%) |
| 2-Person Households | 221 (26.6%) | 68 (8.2%) |
| 3-Person Households | 71 (8.5%) | 8 (1.0%) |
| 4-Person Households | 51 (6.1%) | 0 (0.0%) |
| 5-Person Households | 40 (4.8%) | 0 (0.0%) |
| 6-Person Households | 0 (0.0%) | 0 (0.0%) |
| 7+ Person Households | 31 (3.7%) | 0 (0.0%) |
| Total | 414 (49.8%) | 418 (50.2%) |
Female Fertility in Huachuca City
Fertility by Age in Huachuca City
Average fertility rate in Huachuca City is 10.0 births per 1,000 women. Women in the age bracket of 20 to 34 years have the highest fertility rate with 20.0 births per 1,000 women. Women in the age bracket of 20 to 34 years acount for 100.0% of all women with births.
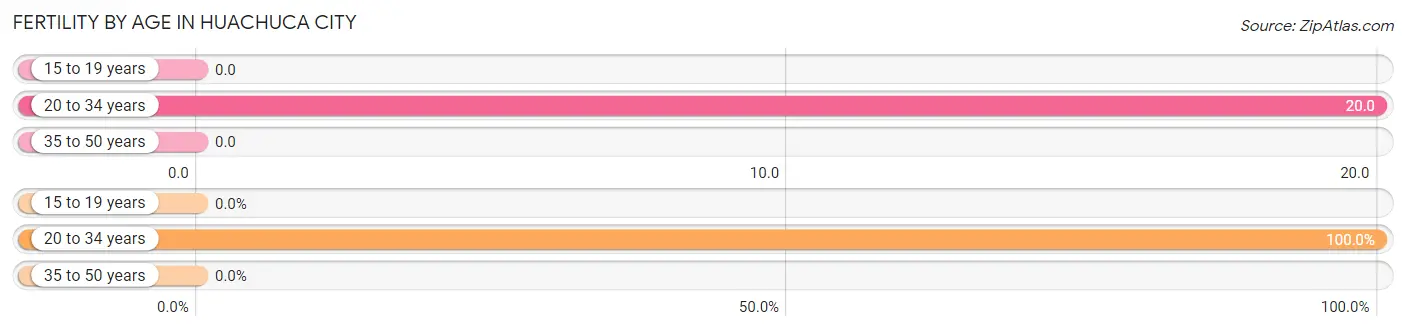
| Age Bracket | Women with Births | Births / 1,000 Women |
| 15 to 19 years | 0 (0.0%) | 0.0 |
| 20 to 34 years | 4 (100.0%) | 20.0 |
| 35 to 50 years | 0 (0.0%) | 0.0 |
| Total | 4 (100.0%) | 10.0 |
Fertility by Age by Marriage Status in Huachuca City
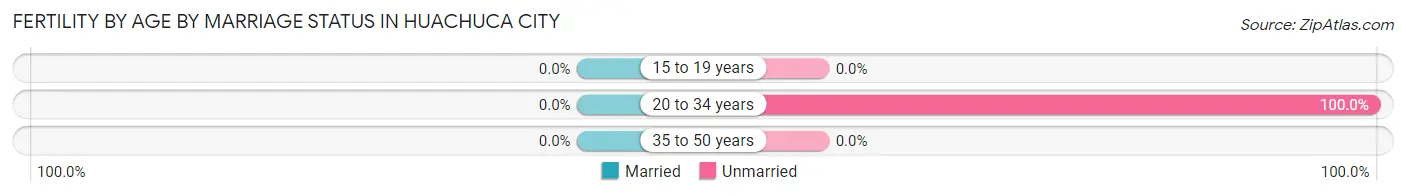
| Age Bracket | Married | Unmarried |
| 15 to 19 years | 0 (0.0%) | 0 (0.0%) |
| 20 to 34 years | 0 (0.0%) | 4 (100.0%) |
| 35 to 50 years | 0 (0.0%) | 0 (0.0%) |
| Total | 0 (0.0%) | 4 (100.0%) |
Fertility by Education in Huachuca City
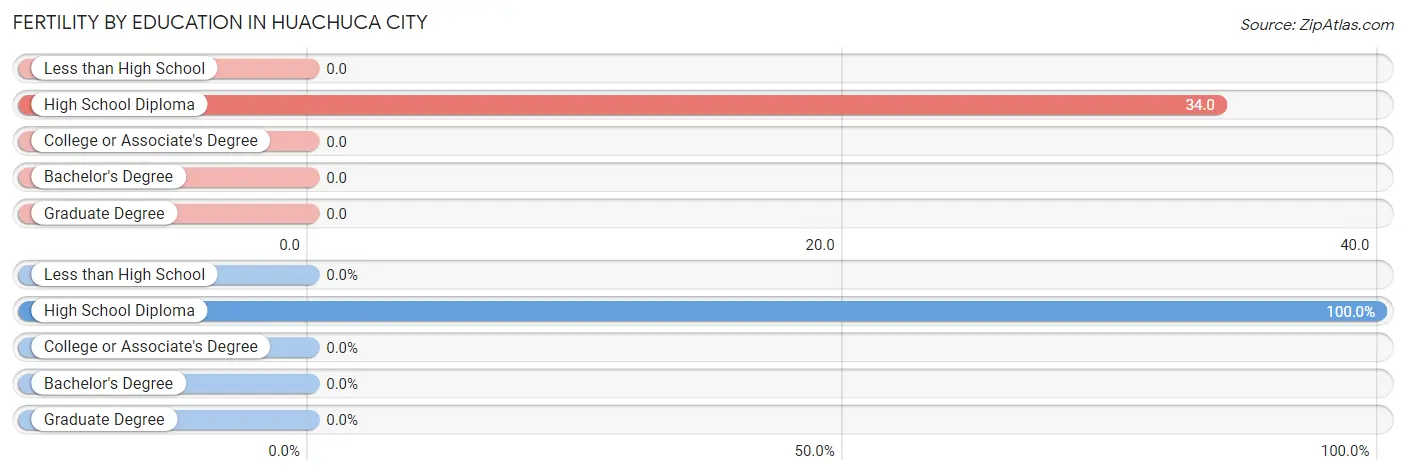
| Educational Attainment | Women with Births | Births / 1,000 Women |
| Less than High School | 0 (0.0%) | 0.0 |
| High School Diploma | 4 (100.0%) | 34.0 |
| College or Associate's Degree | 0 (0.0%) | 0.0 |
| Bachelor's Degree | 0 (0.0%) | 0.0 |
| Graduate Degree | 0 (0.0%) | 0.0 |
| Total | 4 (100.0%) | 10.0 |
Fertility by Education by Marriage Status in Huachuca City
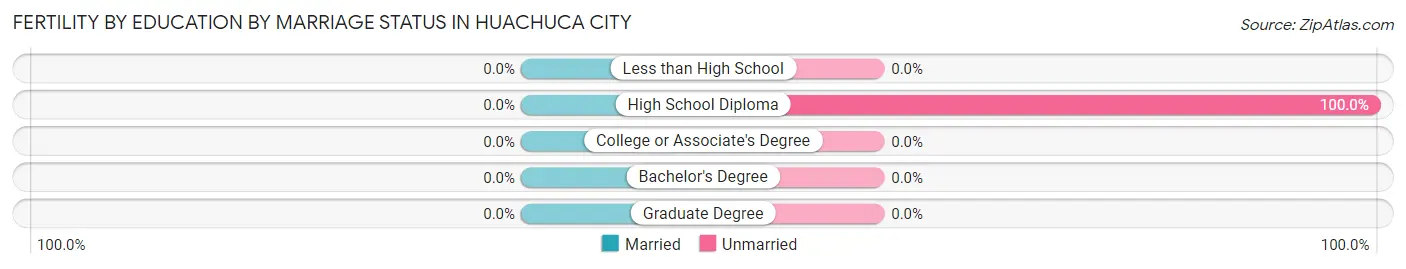
| Educational Attainment | Married | Unmarried |
| Less than High School | 0 (0.0%) | 0 (0.0%) |
| High School Diploma | 0 (0.0%) | 4 (100.0%) |
| College or Associate's Degree | 0 (0.0%) | 0 (0.0%) |
| Bachelor's Degree | 0 (0.0%) | 0 (0.0%) |
| Graduate Degree | 0 (0.0%) | 0 (0.0%) |
| Total | 0 (0.0%) | 4 (100.0%) |
Employment Characteristics in Huachuca City
Employment by Class of Employer in Huachuca City
Among the 723 employed individuals in Huachuca City, private company employees (490 | 67.8%), federal government employees (82 | 11.3%), and state government employees (55 | 7.6%) make up the most common classes of employment.
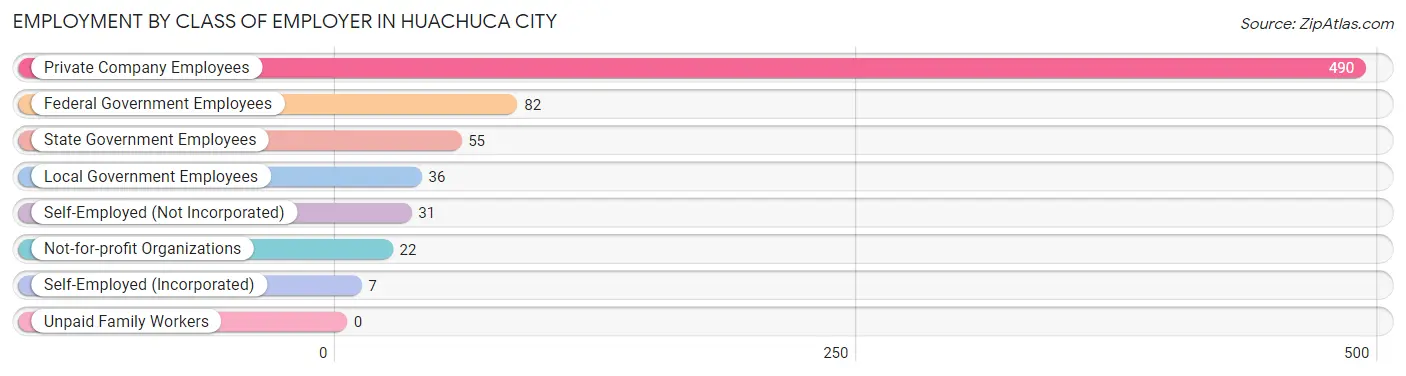
| Employer Class | # Employees | % Employees |
| Private Company Employees | 490 | 67.8% |
| Self-Employed (Incorporated) | 7 | 1.0% |
| Self-Employed (Not Incorporated) | 31 | 4.3% |
| Not-for-profit Organizations | 22 | 3.0% |
| Local Government Employees | 36 | 5.0% |
| State Government Employees | 55 | 7.6% |
| Federal Government Employees | 82 | 11.3% |
| Unpaid Family Workers | 0 | 0.0% |
| Total | 723 | 100.0% |
Employment Status by Age in Huachuca City
According to the labor force statistics for Huachuca City, out of the total population over 16 years of age (1,564), 52.6% or 823 individuals are in the labor force, with 11.0% or 91 of them unemployed. The age group with the highest labor force participation rate is 30 to 34 years, with 91.5% or 108 individuals in the labor force. Within the labor force, the 16 to 19 years age range has the highest percentage of unemployed individuals, with 42.1% or 8 of them being unemployed.
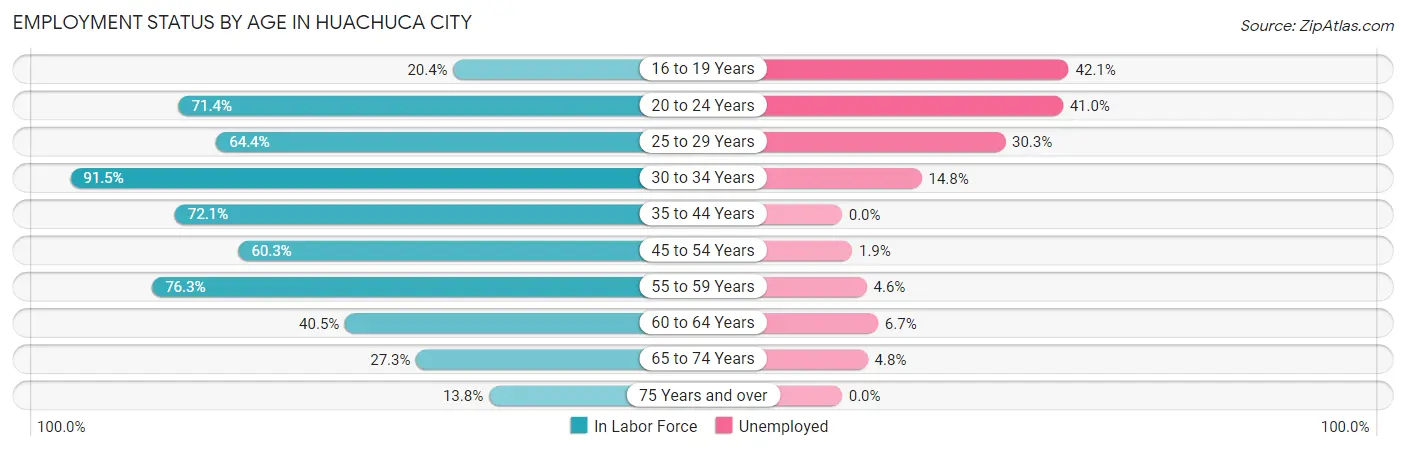
| Age Bracket | In Labor Force | Unemployed |
| 16 to 19 Years | 19 (20.4%) | 8 (42.1%) |
| 20 to 24 Years | 100 (71.4%) | 41 (41.0%) |
| 25 to 29 Years | 58 (64.4%) | 18 (30.3%) |
| 30 to 34 Years | 108 (91.5%) | 16 (14.8%) |
| 35 to 44 Years | 155 (72.1%) | 0 (0.0%) |
| 45 to 54 Years | 161 (60.3%) | 3 (1.9%) |
| 55 to 59 Years | 87 (76.3%) | 4 (4.6%) |
| 60 to 64 Years | 30 (40.5%) | 2 (6.7%) |
| 65 to 74 Years | 84 (27.3%) | 4 (4.8%) |
| 75 Years and over | 20 (13.8%) | 0 (0.0%) |
| Total | 823 (52.6%) | 91 (11.0%) |
Employment Status by Educational Attainment in Huachuca City
According to labor force statistics for Huachuca City, 68.2% of individuals (599) out of the total population between 25 and 64 years of age (878) are in the labor force, with 6.1% or 37 of them being unemployed. The group with the highest labor force participation rate are those with the educational attainment of bachelor's degree or higher, with 85.3% or 116 individuals in the labor force. Within the labor force, individuals with high school diploma education have the highest percentage of unemployment, with 10.9% or 21 of them being unemployed.
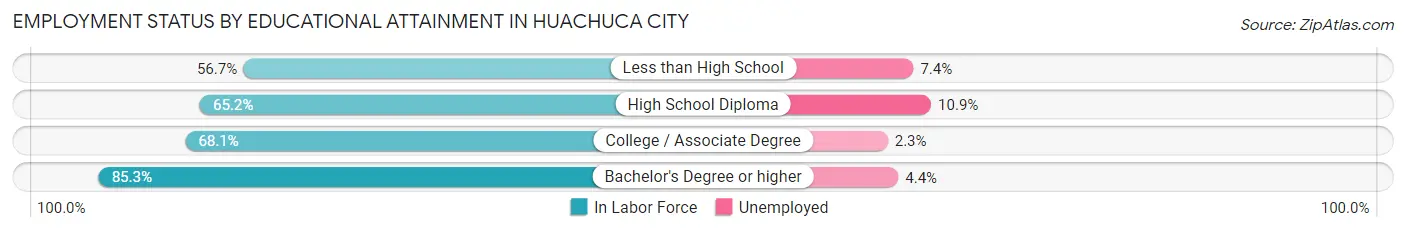
| Educational Attainment | In Labor Force | Unemployed |
| Less than High School | 68 (56.7%) | 9 (7.4%) |
| High School Diploma | 193 (65.2%) | 32 (10.9%) |
| College / Associate Degree | 222 (68.1%) | 7 (2.3%) |
| Bachelor's Degree or higher | 116 (85.3%) | 6 (4.4%) |
| Total | 599 (68.2%) | 54 (6.1%) |
Employment Occupations by Sex in Huachuca City
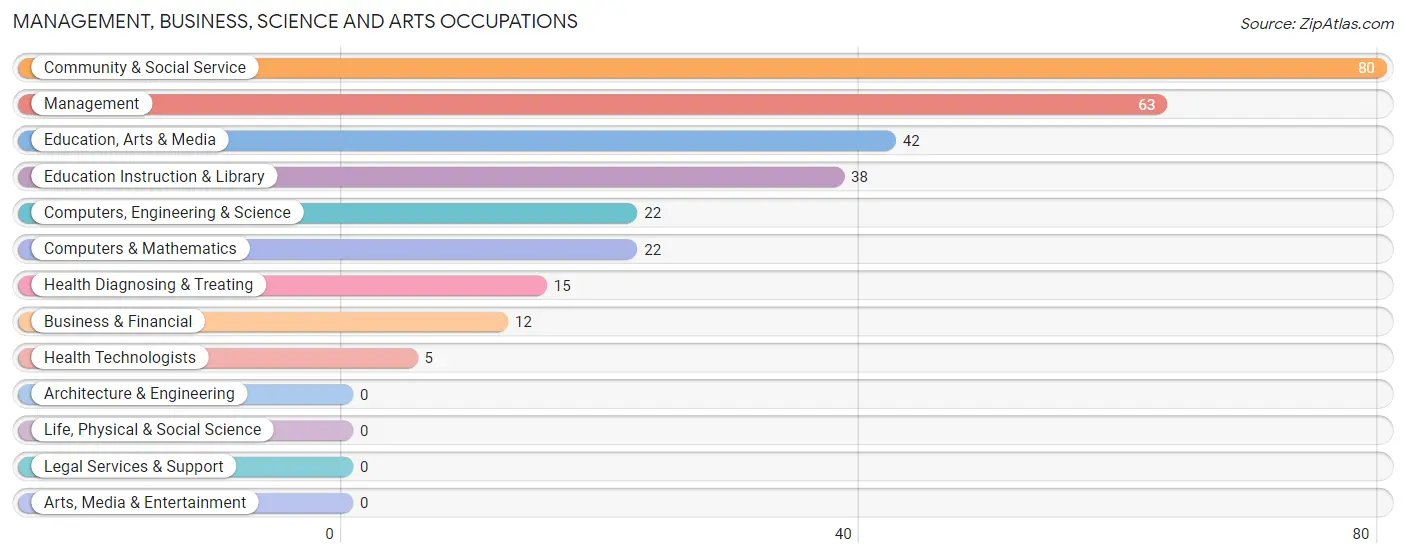
Management, Business, Science and Arts Occupations
The most common Management, Business, Science and Arts occupations in Huachuca City are Community & Social Service (80 | 11.3%), Management (63 | 8.9%), Education, Arts & Media (42 | 5.9%), Education Instruction & Library (38 | 5.4%), and Computers, Engineering & Science (22 | 3.1%).
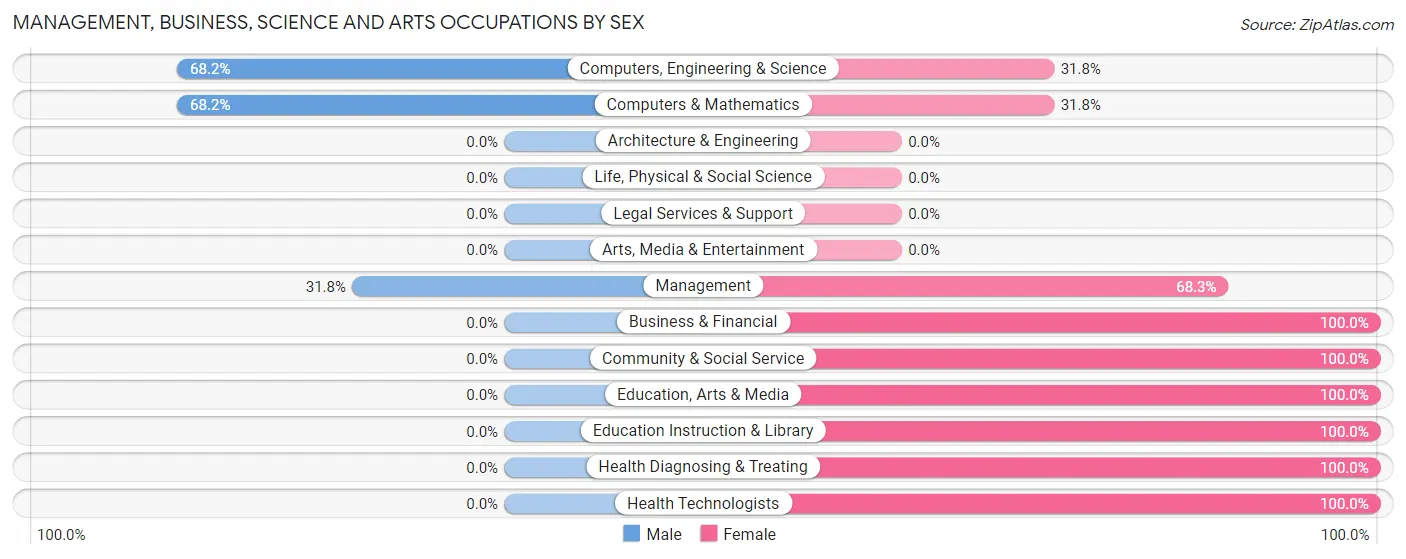
Management, Business, Science and Arts Occupations by Sex
Within the Management, Business, Science and Arts occupations in Huachuca City, the most male-oriented occupations are Computers, Engineering & Science (68.2%), Computers & Mathematics (68.2%), and Management (31.8%), while the most female-oriented occupations are Business & Financial (100.0%), Community & Social Service (100.0%), and Education, Arts & Media (100.0%).
| Occupation | Male | Female |
| Management | 20 (31.8%) | 43 (68.2%) |
| Business & Financial | 0 (0.0%) | 12 (100.0%) |
| Computers, Engineering & Science | 15 (68.2%) | 7 (31.8%) |
| Computers & Mathematics | 15 (68.2%) | 7 (31.8%) |
| Architecture & Engineering | 0 (0.0%) | 0 (0.0%) |
| Life, Physical & Social Science | 0 (0.0%) | 0 (0.0%) |
| Community & Social Service | 0 (0.0%) | 80 (100.0%) |
| Education, Arts & Media | 0 (0.0%) | 42 (100.0%) |
| Legal Services & Support | 0 (0.0%) | 0 (0.0%) |
| Education Instruction & Library | 0 (0.0%) | 38 (100.0%) |
| Arts, Media & Entertainment | 0 (0.0%) | 0 (0.0%) |
| Health Diagnosing & Treating | 0 (0.0%) | 15 (100.0%) |
| Health Technologists | 0 (0.0%) | 5 (100.0%) |
| Total (Category) | 35 (18.2%) | 157 (81.8%) |
| Total (Overall) | 407 (57.4%) | 302 (42.6%) |
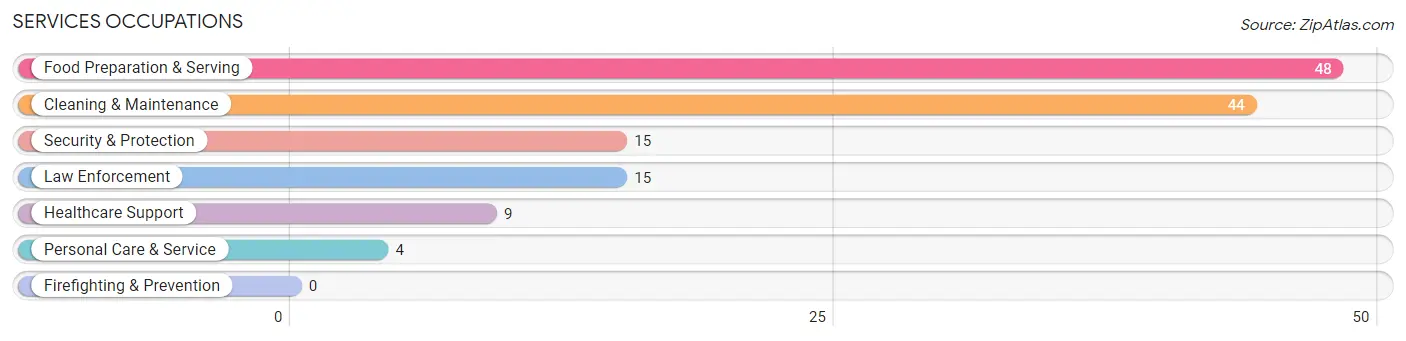
Services Occupations
The most common Services occupations in Huachuca City are Food Preparation & Serving (48 | 6.8%), Cleaning & Maintenance (44 | 6.2%), Security & Protection (15 | 2.1%), Law Enforcement (15 | 2.1%), and Healthcare Support (9 | 1.3%).
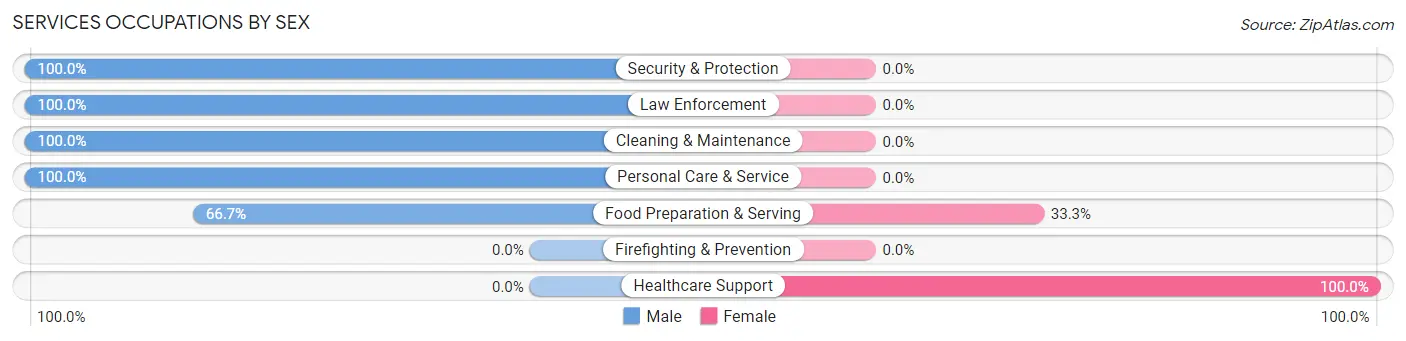
Services Occupations by Sex
Within the Services occupations in Huachuca City, the most male-oriented occupations are Security & Protection (100.0%), Law Enforcement (100.0%), and Cleaning & Maintenance (100.0%), while the most female-oriented occupations are Healthcare Support (100.0%), and Food Preparation & Serving (33.3%).
| Occupation | Male | Female |
| Healthcare Support | 0 (0.0%) | 9 (100.0%) |
| Security & Protection | 15 (100.0%) | 0 (0.0%) |
| Firefighting & Prevention | 0 (0.0%) | 0 (0.0%) |
| Law Enforcement | 15 (100.0%) | 0 (0.0%) |
| Food Preparation & Serving | 32 (66.7%) | 16 (33.3%) |
| Cleaning & Maintenance | 44 (100.0%) | 0 (0.0%) |
| Personal Care & Service | 4 (100.0%) | 0 (0.0%) |
| Total (Category) | 95 (79.2%) | 25 (20.8%) |
| Total (Overall) | 407 (57.4%) | 302 (42.6%) |
Sales and Office Occupations
The most common Sales and Office occupations in Huachuca City are Sales & Related (142 | 20.0%), and Office & Administration (71 | 10.0%).
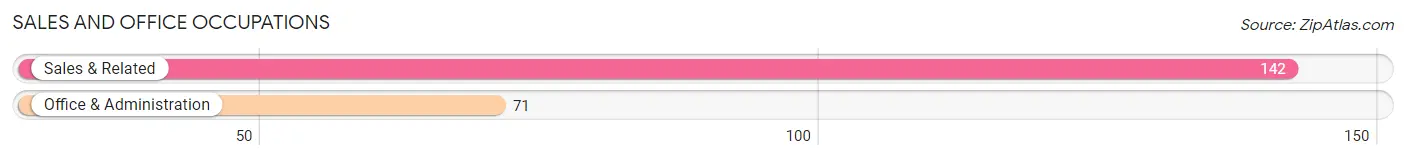
Sales and Office Occupations by Sex
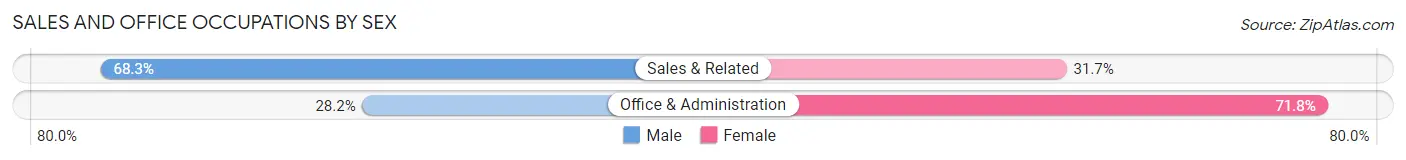
| Occupation | Male | Female |
| Sales & Related | 97 (68.3%) | 45 (31.7%) |
| Office & Administration | 20 (28.2%) | 51 (71.8%) |
| Total (Category) | 117 (54.9%) | 96 (45.1%) |
| Total (Overall) | 407 (57.4%) | 302 (42.6%) |
Natural Resources, Construction and Maintenance Occupations
The most common Natural Resources, Construction and Maintenance occupations in Huachuca City are Construction & Extraction (91 | 12.8%), and Installation, Maintenance & Repair (35 | 4.9%).
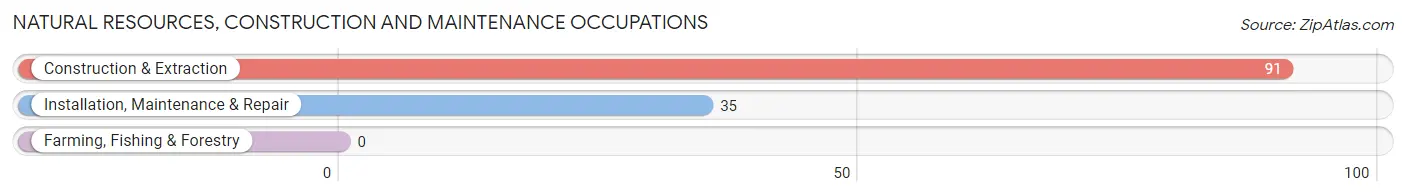
Natural Resources, Construction and Maintenance Occupations by Sex
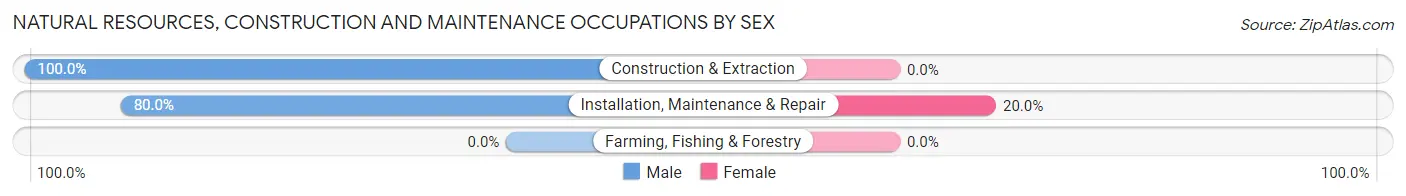
| Occupation | Male | Female |
| Farming, Fishing & Forestry | 0 (0.0%) | 0 (0.0%) |
| Construction & Extraction | 91 (100.0%) | 0 (0.0%) |
| Installation, Maintenance & Repair | 28 (80.0%) | 7 (20.0%) |
| Total (Category) | 119 (94.4%) | 7 (5.6%) |
| Total (Overall) | 407 (57.4%) | 302 (42.6%) |
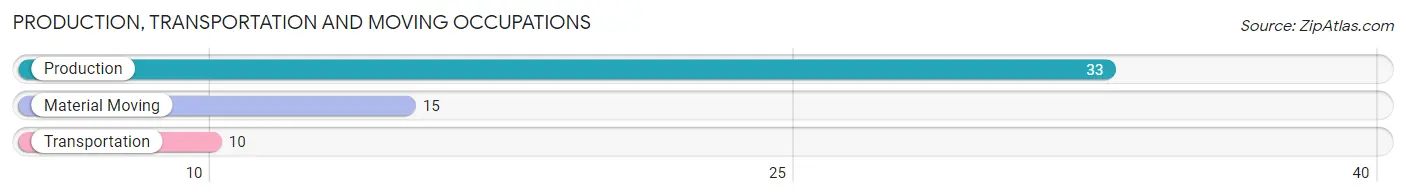
Production, Transportation and Moving Occupations
The most common Production, Transportation and Moving occupations in Huachuca City are Production (33 | 4.6%), Material Moving (15 | 2.1%), and Transportation (10 | 1.4%).
Production, Transportation and Moving Occupations by Sex
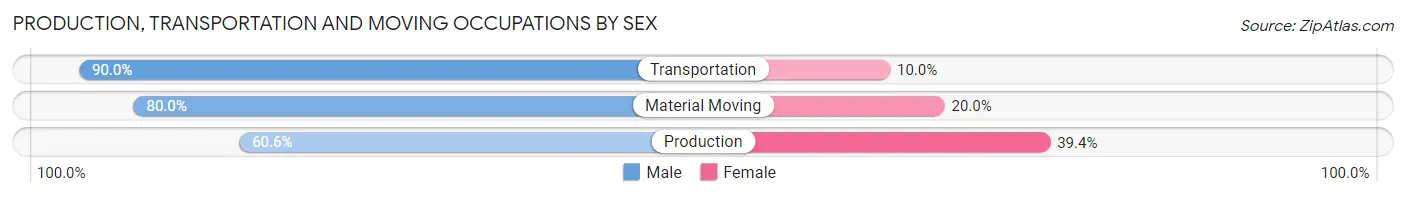
| Occupation | Male | Female |
| Production | 20 (60.6%) | 13 (39.4%) |
| Transportation | 9 (90.0%) | 1 (10.0%) |
| Material Moving | 12 (80.0%) | 3 (20.0%) |
| Total (Category) | 41 (70.7%) | 17 (29.3%) |
| Total (Overall) | 407 (57.4%) | 302 (42.6%) |
Employment Industries by Sex in Huachuca City
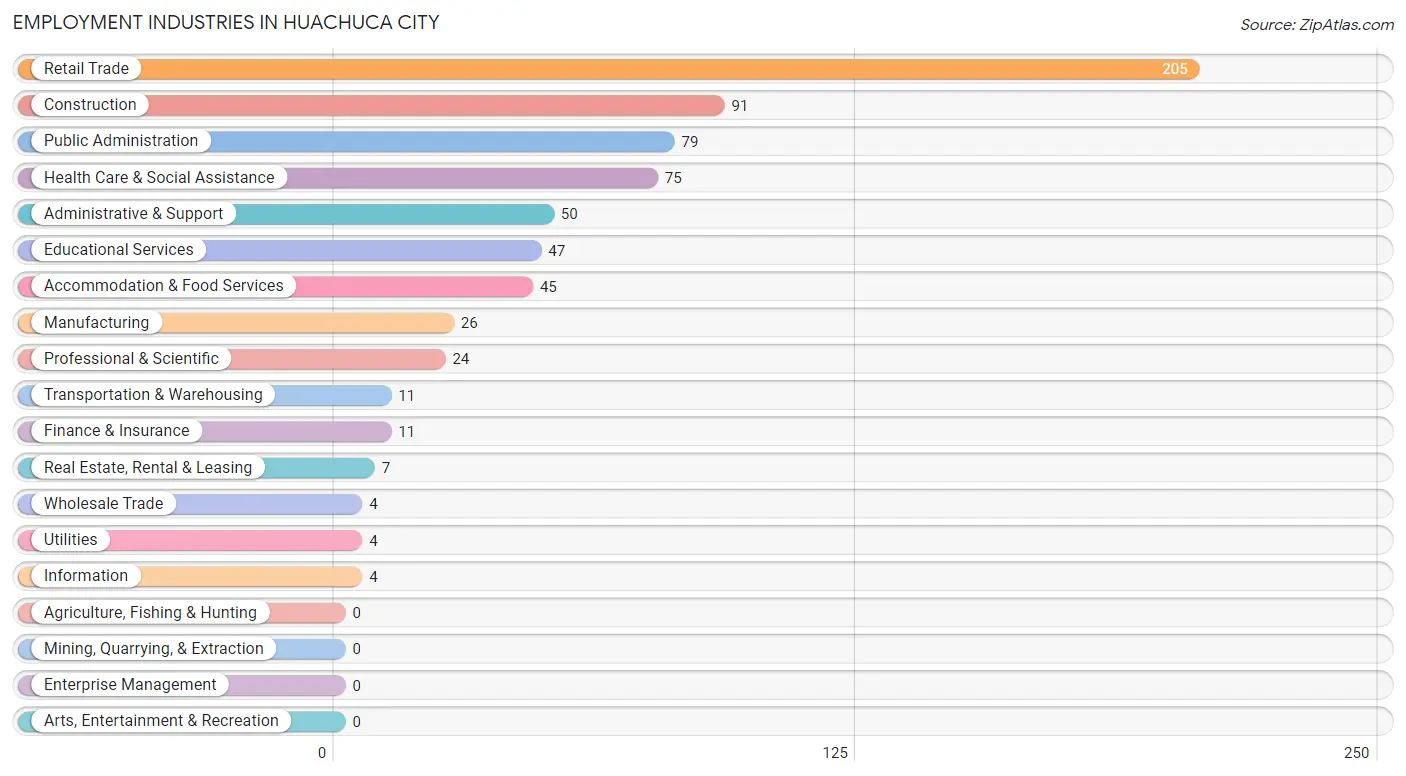
Employment Industries in Huachuca City
The major employment industries in Huachuca City include Retail Trade (205 | 28.9%), Construction (91 | 12.8%), Public Administration (79 | 11.1%), Health Care & Social Assistance (75 | 10.6%), and Administrative & Support (50 | 7.0%).
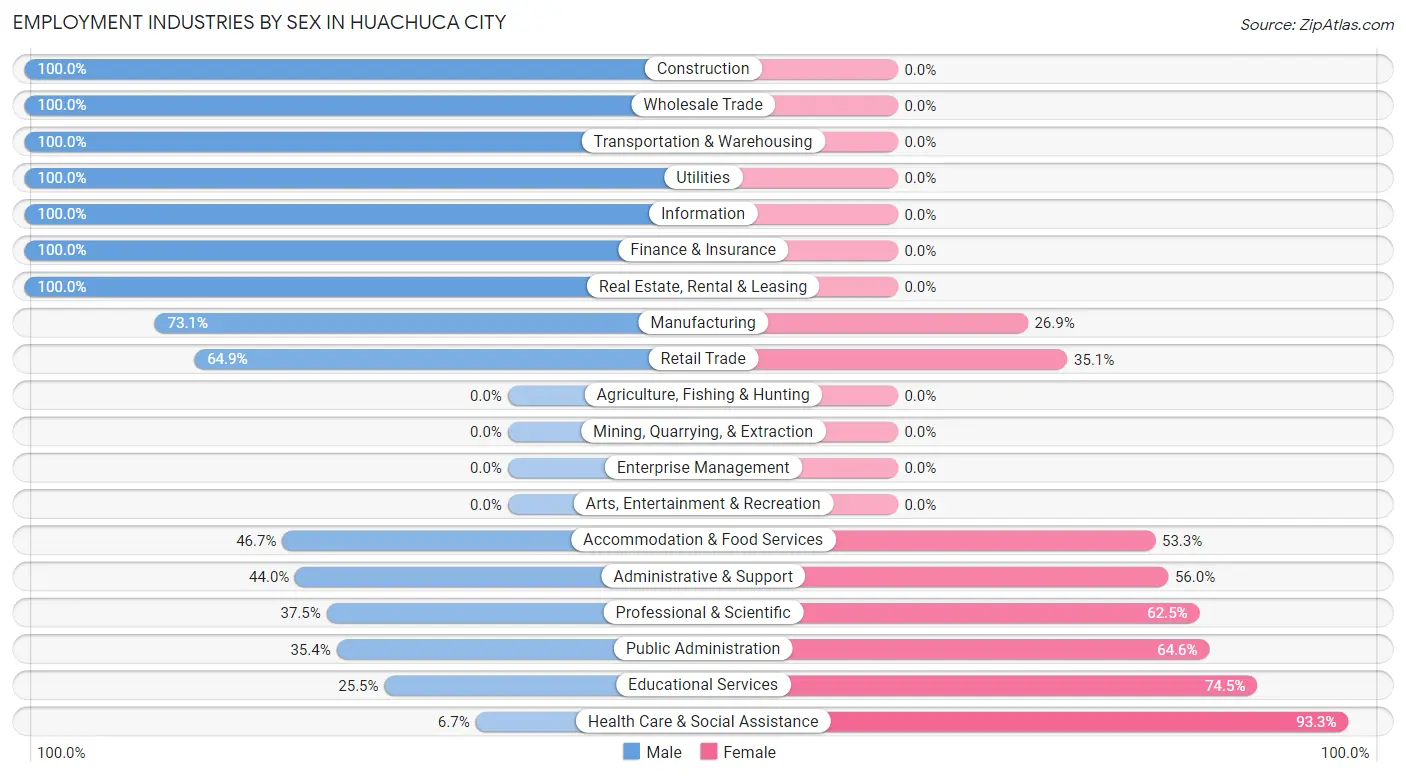
Employment Industries by Sex in Huachuca City
The Huachuca City industries that see more men than women are Construction (100.0%), Wholesale Trade (100.0%), and Transportation & Warehousing (100.0%), whereas the industries that tend to have a higher number of women are Health Care & Social Assistance (93.3%), Educational Services (74.5%), and Public Administration (64.6%).
| Industry | Male | Female |
| Agriculture, Fishing & Hunting | 0 (0.0%) | 0 (0.0%) |
| Mining, Quarrying, & Extraction | 0 (0.0%) | 0 (0.0%) |
| Construction | 91 (100.0%) | 0 (0.0%) |
| Manufacturing | 19 (73.1%) | 7 (26.9%) |
| Wholesale Trade | 4 (100.0%) | 0 (0.0%) |
| Retail Trade | 133 (64.9%) | 72 (35.1%) |
| Transportation & Warehousing | 11 (100.0%) | 0 (0.0%) |
| Utilities | 4 (100.0%) | 0 (0.0%) |
| Information | 4 (100.0%) | 0 (0.0%) |
| Finance & Insurance | 11 (100.0%) | 0 (0.0%) |
| Real Estate, Rental & Leasing | 7 (100.0%) | 0 (0.0%) |
| Professional & Scientific | 9 (37.5%) | 15 (62.5%) |
| Enterprise Management | 0 (0.0%) | 0 (0.0%) |
| Administrative & Support | 22 (44.0%) | 28 (56.0%) |
| Educational Services | 12 (25.5%) | 35 (74.5%) |
| Health Care & Social Assistance | 5 (6.7%) | 70 (93.3%) |
| Arts, Entertainment & Recreation | 0 (0.0%) | 0 (0.0%) |
| Accommodation & Food Services | 21 (46.7%) | 24 (53.3%) |
| Public Administration | 28 (35.4%) | 51 (64.6%) |
| Total | 407 (57.4%) | 302 (42.6%) |
Education in Huachuca City
School Enrollment in Huachuca City
The most common levels of schooling among the 430 students in Huachuca City are middle school (136 | 31.6%), elementary school (91 | 21.2%), and high school (84 | 19.5%).
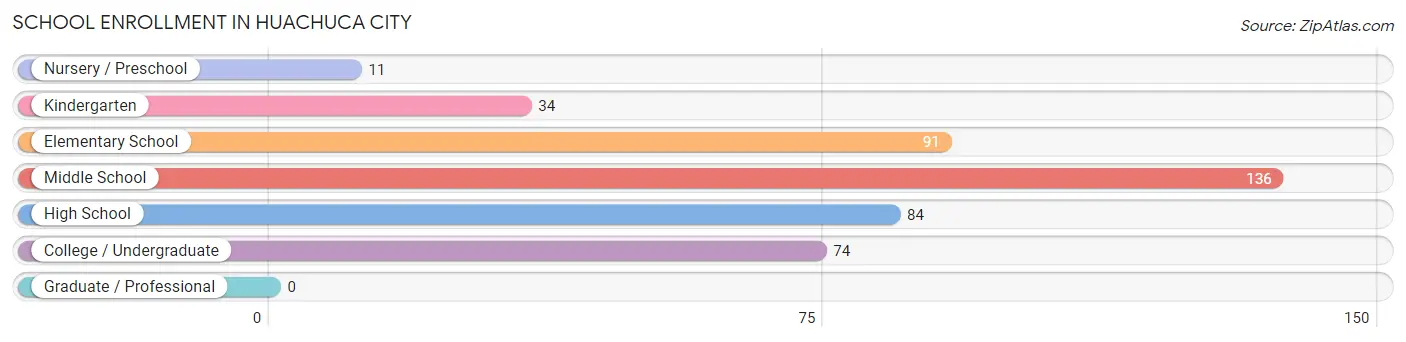
| School Level | # Students | % Students |
| Nursery / Preschool | 11 | 2.6% |
| Kindergarten | 34 | 7.9% |
| Elementary School | 91 | 21.2% |
| Middle School | 136 | 31.6% |
| High School | 84 | 19.5% |
| College / Undergraduate | 74 | 17.2% |
| Graduate / Professional | 0 | 0.0% |
| Total | 430 | 100.0% |
School Enrollment by Age by Funding Source in Huachuca City
Out of a total of 430 students who are enrolled in schools in Huachuca City, 42 (9.8%) attend a private institution, while the remaining 388 (90.2%) are enrolled in public schools. The age group of 25 to 34 year olds has the highest likelihood of being enrolled in private schools, with 7 (100.0% in the age bracket) enrolled. Conversely, the age group of 3 to 4 year olds has the lowest likelihood of being enrolled in a private school, with 11 (100.0% in the age bracket) attending a public institution.
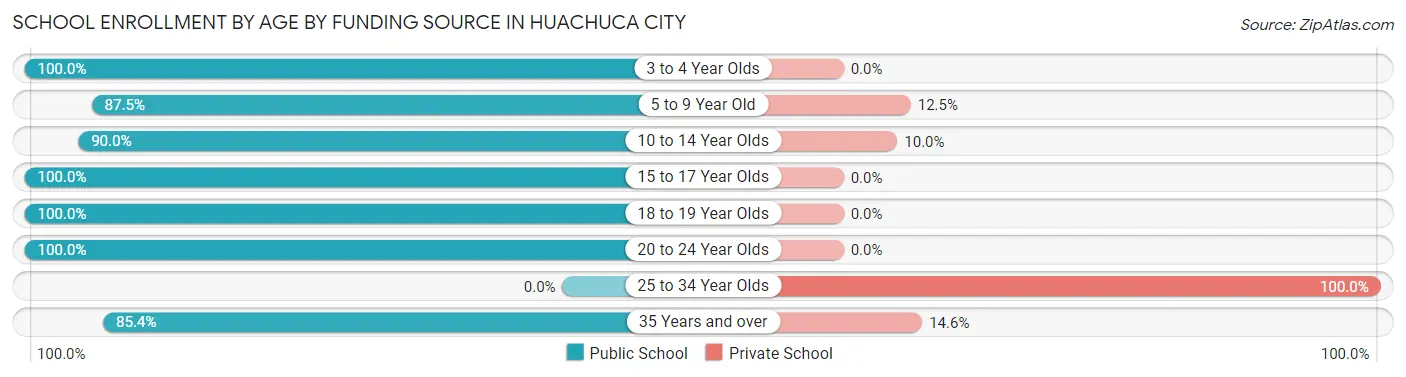
| Age Bracket | Public School | Private School |
| 3 to 4 Year Olds | 11 (100.0%) | 0 (0.0%) |
| 5 to 9 Year Old | 91 (87.5%) | 13 (12.5%) |
| 10 to 14 Year Olds | 144 (90.0%) | 16 (10.0%) |
| 15 to 17 Year Olds | 75 (100.0%) | 0 (0.0%) |
| 18 to 19 Year Olds | 6 (100.0%) | 0 (0.0%) |
| 20 to 24 Year Olds | 26 (100.0%) | 0 (0.0%) |
| 25 to 34 Year Olds | 0 (0.0%) | 7 (100.0%) |
| 35 Years and over | 35 (85.4%) | 6 (14.6%) |
| Total | 388 (90.2%) | 42 (9.8%) |
Educational Attainment by Field of Study in Huachuca City
Business (47 | 25.5%), arts & humanities (37 | 20.1%), science & technology (35 | 19.0%), education (30 | 16.3%), and liberal arts & history (14 | 7.6%) are the most common fields of study among 184 individuals in Huachuca City who have obtained a bachelor's degree or higher.
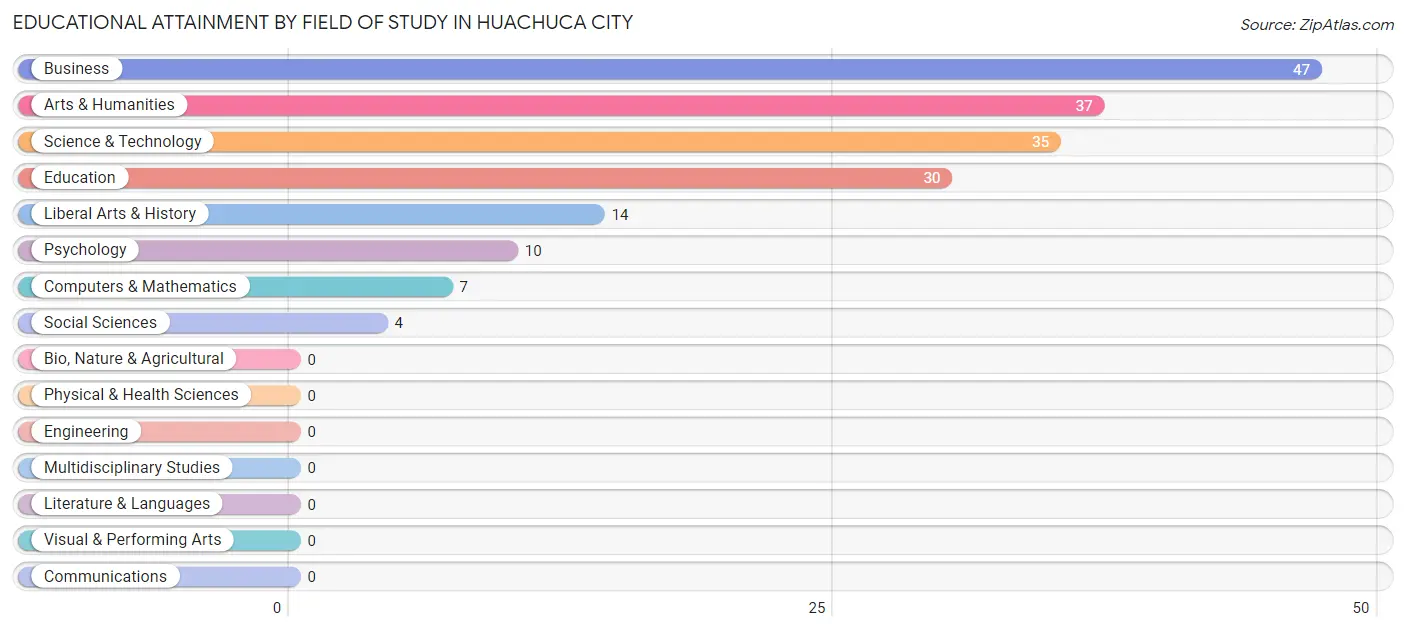
| Field of Study | # Graduates | % Graduates |
| Computers & Mathematics | 7 | 3.8% |
| Bio, Nature & Agricultural | 0 | 0.0% |
| Physical & Health Sciences | 0 | 0.0% |
| Psychology | 10 | 5.4% |
| Social Sciences | 4 | 2.2% |
| Engineering | 0 | 0.0% |
| Multidisciplinary Studies | 0 | 0.0% |
| Science & Technology | 35 | 19.0% |
| Business | 47 | 25.5% |
| Education | 30 | 16.3% |
| Literature & Languages | 0 | 0.0% |
| Liberal Arts & History | 14 | 7.6% |
| Visual & Performing Arts | 0 | 0.0% |
| Communications | 0 | 0.0% |
| Arts & Humanities | 37 | 20.1% |
| Total | 184 | 100.0% |
Transportation & Commute in Huachuca City
Vehicle Availability by Sex in Huachuca City
The most prevalent vehicle ownership categories in Huachuca City are males with 2 vehicles (181, accounting for 43.0%) and females with 2 vehicles (91, making up 60.5%).
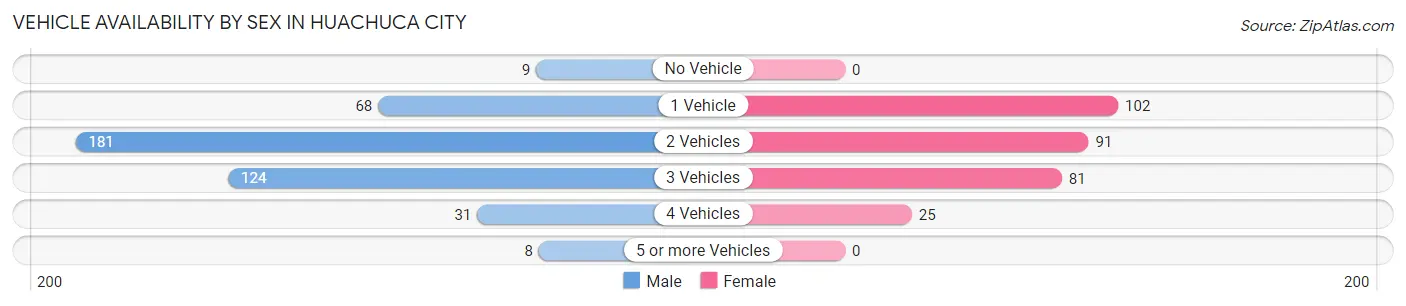
| Vehicles Available | Male | Female |
| No Vehicle | 9 (2.1%) | 0 (0.0%) |
| 1 Vehicle | 68 (16.2%) | 102 (34.1%) |
| 2 Vehicles | 181 (43.0%) | 91 (30.4%) |
| 3 Vehicles | 124 (29.4%) | 81 (27.1%) |
| 4 Vehicles | 31 (7.4%) | 25 (8.4%) |
| 5 or more Vehicles | 8 (1.9%) | 0 (0.0%) |
| Total | 421 (100.0%) | 299 (100.0%) |
Commute Time in Huachuca City
The most frequently occuring commute durations in Huachuca City are 15 to 19 minutes (235 commuters, 33.4%), 20 to 24 minutes (124 commuters, 17.6%), and 10 to 14 minutes (112 commuters, 15.9%).
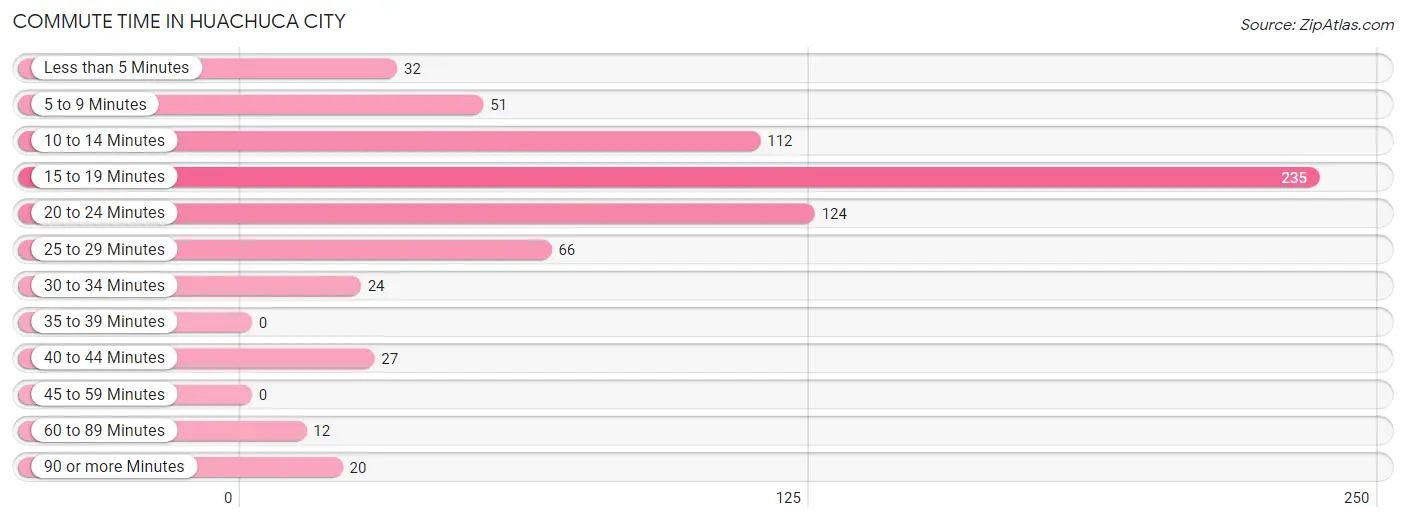
| Commute Time | # Commuters | % Commuters |
| Less than 5 Minutes | 32 | 4.5% |
| 5 to 9 Minutes | 51 | 7.2% |
| 10 to 14 Minutes | 112 | 15.9% |
| 15 to 19 Minutes | 235 | 33.4% |
| 20 to 24 Minutes | 124 | 17.6% |
| 25 to 29 Minutes | 66 | 9.4% |
| 30 to 34 Minutes | 24 | 3.4% |
| 35 to 39 Minutes | 0 | 0.0% |
| 40 to 44 Minutes | 27 | 3.8% |
| 45 to 59 Minutes | 0 | 0.0% |
| 60 to 89 Minutes | 12 | 1.7% |
| 90 or more Minutes | 20 | 2.8% |
Commute Time by Sex in Huachuca City
The most common commute times in Huachuca City are 15 to 19 minutes (166 commuters, 40.1%) for males and 20 to 24 minutes (79 commuters, 27.3%) for females.
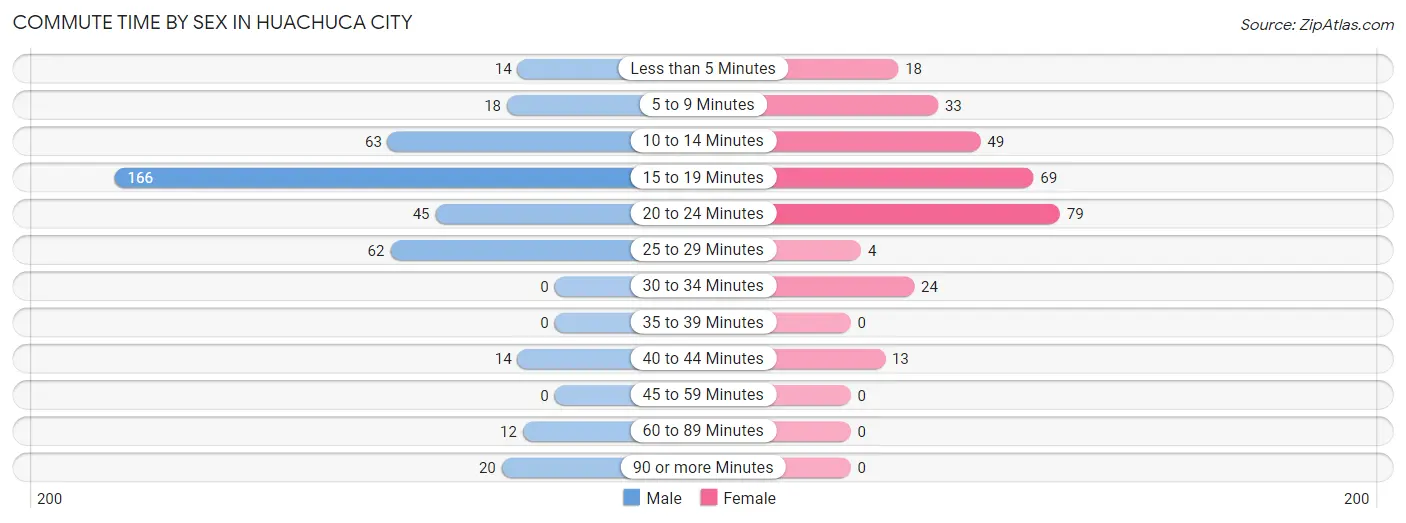
| Commute Time | Male | Female |
| Less than 5 Minutes | 14 (3.4%) | 18 (6.2%) |
| 5 to 9 Minutes | 18 (4.3%) | 33 (11.4%) |
| 10 to 14 Minutes | 63 (15.2%) | 49 (17.0%) |
| 15 to 19 Minutes | 166 (40.1%) | 69 (23.9%) |
| 20 to 24 Minutes | 45 (10.9%) | 79 (27.3%) |
| 25 to 29 Minutes | 62 (15.0%) | 4 (1.4%) |
| 30 to 34 Minutes | 0 (0.0%) | 24 (8.3%) |
| 35 to 39 Minutes | 0 (0.0%) | 0 (0.0%) |
| 40 to 44 Minutes | 14 (3.4%) | 13 (4.5%) |
| 45 to 59 Minutes | 0 (0.0%) | 0 (0.0%) |
| 60 to 89 Minutes | 12 (2.9%) | 0 (0.0%) |
| 90 or more Minutes | 20 (4.8%) | 0 (0.0%) |
Time of Departure to Work by Sex in Huachuca City
The most frequent times of departure to work in Huachuca City are 6:00 AM to 6:29 AM (85, 20.5%) for males and 7:30 AM to 7:59 AM (69, 23.9%) for females.
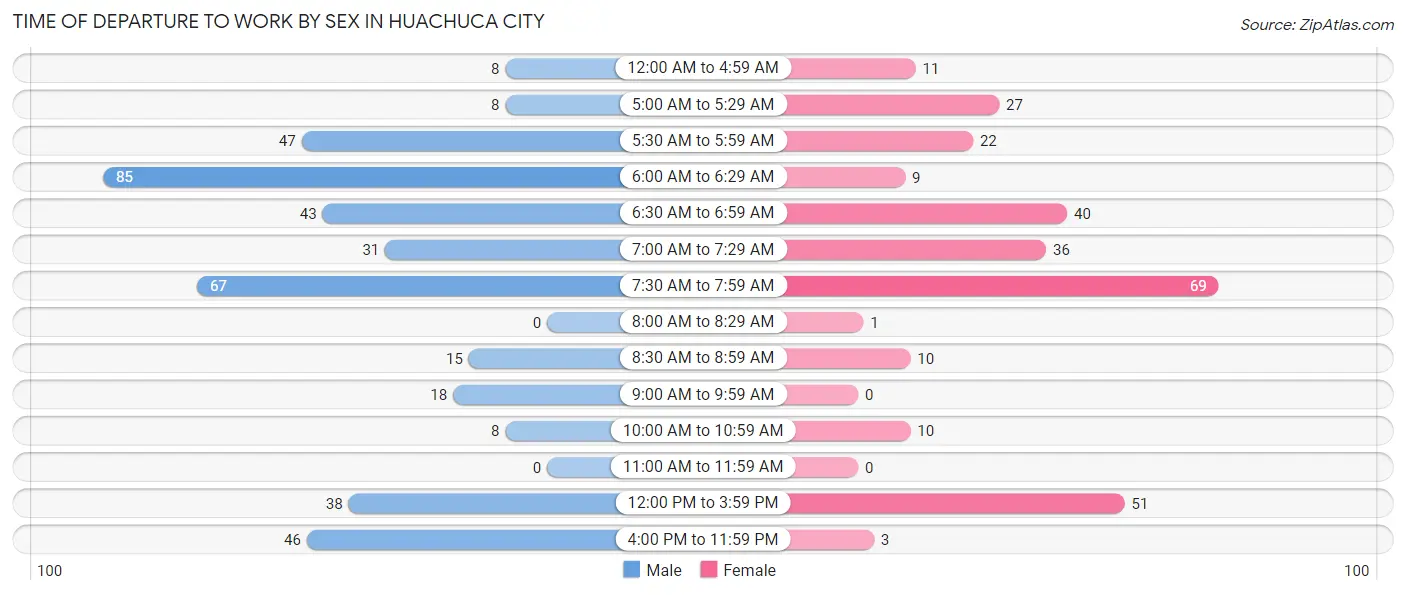
| Time of Departure | Male | Female |
| 12:00 AM to 4:59 AM | 8 (1.9%) | 11 (3.8%) |
| 5:00 AM to 5:29 AM | 8 (1.9%) | 27 (9.3%) |
| 5:30 AM to 5:59 AM | 47 (11.4%) | 22 (7.6%) |
| 6:00 AM to 6:29 AM | 85 (20.5%) | 9 (3.1%) |
| 6:30 AM to 6:59 AM | 43 (10.4%) | 40 (13.8%) |
| 7:00 AM to 7:29 AM | 31 (7.5%) | 36 (12.5%) |
| 7:30 AM to 7:59 AM | 67 (16.2%) | 69 (23.9%) |
| 8:00 AM to 8:29 AM | 0 (0.0%) | 1 (0.4%) |
| 8:30 AM to 8:59 AM | 15 (3.6%) | 10 (3.5%) |
| 9:00 AM to 9:59 AM | 18 (4.3%) | 0 (0.0%) |
| 10:00 AM to 10:59 AM | 8 (1.9%) | 10 (3.5%) |
| 11:00 AM to 11:59 AM | 0 (0.0%) | 0 (0.0%) |
| 12:00 PM to 3:59 PM | 38 (9.2%) | 51 (17.6%) |
| 4:00 PM to 11:59 PM | 46 (11.1%) | 3 (1.0%) |
| Total | 414 (100.0%) | 289 (100.0%) |
Housing Occupancy in Huachuca City
Occupancy by Ownership in Huachuca City
Of the total 832 dwellings in Huachuca City, owner-occupied units account for 485 (58.3%), while renter-occupied units make up 347 (41.7%).
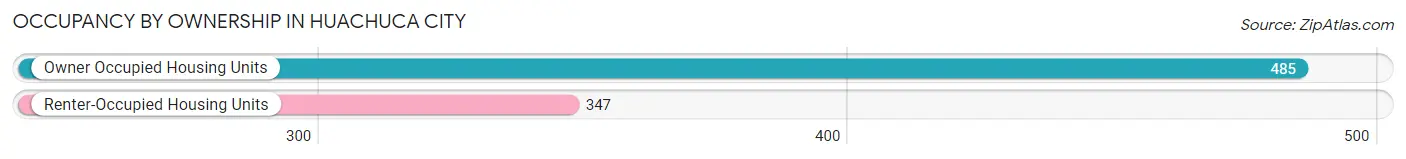
| Occupancy | # Housing Units | % Housing Units |
| Owner Occupied Housing Units | 485 | 58.3% |
| Renter-Occupied Housing Units | 347 | 41.7% |
| Total Occupied Housing Units | 832 | 100.0% |
Occupancy by Household Size in Huachuca City
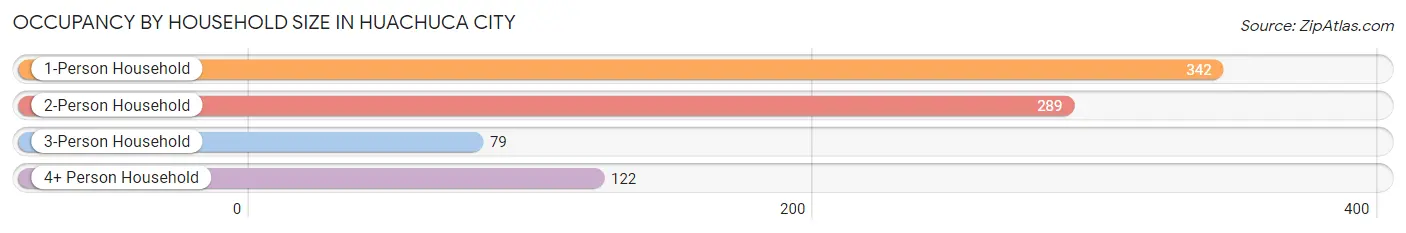
| Household Size | # Housing Units | % Housing Units |
| 1-Person Household | 342 | 41.1% |
| 2-Person Household | 289 | 34.7% |
| 3-Person Household | 79 | 9.5% |
| 4+ Person Household | 122 | 14.7% |
| Total Housing Units | 832 | 100.0% |
Occupancy by Ownership by Household Size in Huachuca City
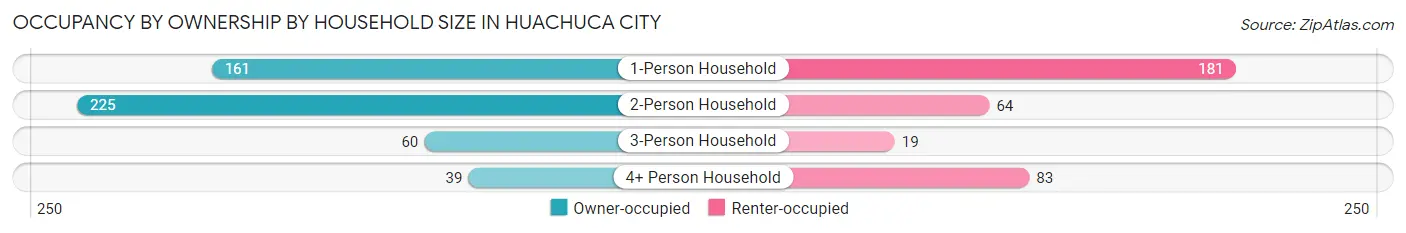
| Household Size | Owner-occupied | Renter-occupied |
| 1-Person Household | 161 (47.1%) | 181 (52.9%) |
| 2-Person Household | 225 (77.8%) | 64 (22.2%) |
| 3-Person Household | 60 (75.9%) | 19 (24.0%) |
| 4+ Person Household | 39 (32.0%) | 83 (68.0%) |
| Total Housing Units | 485 (58.3%) | 347 (41.7%) |
Occupancy by Educational Attainment in Huachuca City
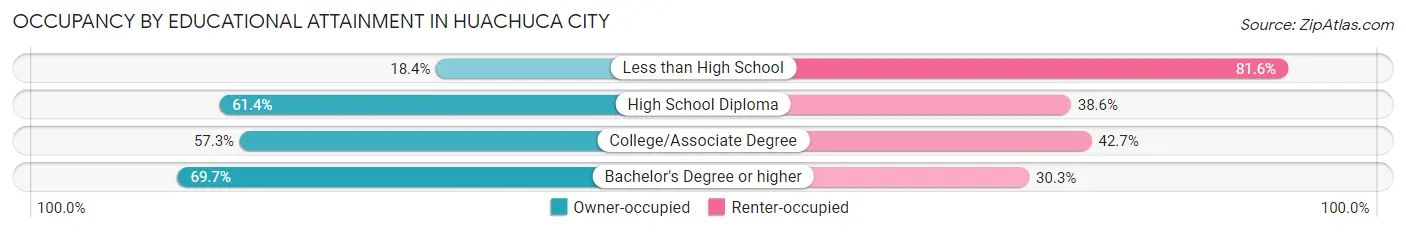
| Household Size | Owner-occupied | Renter-occupied |
| Less than High School | 9 (18.4%) | 40 (81.6%) |
| High School Diploma | 183 (61.4%) | 115 (38.6%) |
| College/Associate Degree | 208 (57.3%) | 155 (42.7%) |
| Bachelor's Degree or higher | 85 (69.7%) | 37 (30.3%) |
Occupancy by Age of Householder in Huachuca City
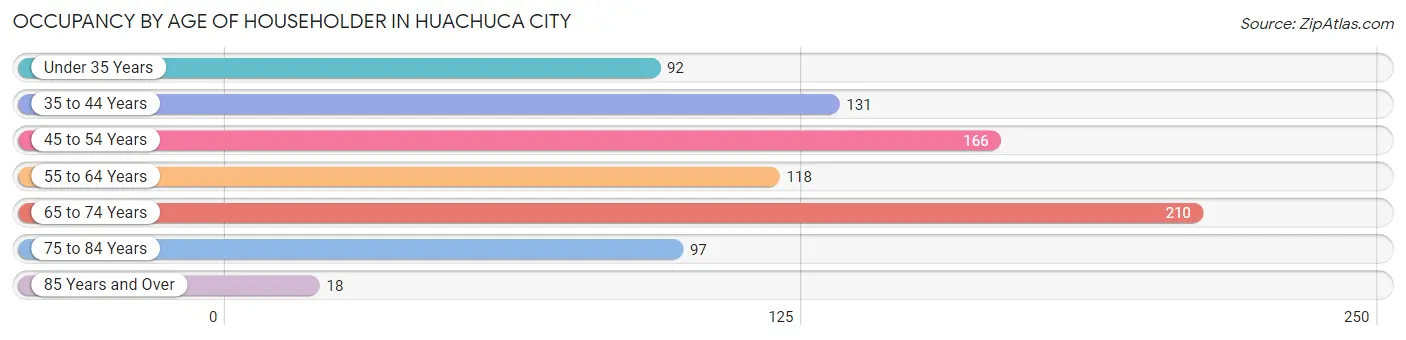
| Age Bracket | # Households | % Households |
| Under 35 Years | 92 | 11.1% |
| 35 to 44 Years | 131 | 15.8% |
| 45 to 54 Years | 166 | 20.0% |
| 55 to 64 Years | 118 | 14.2% |
| 65 to 74 Years | 210 | 25.2% |
| 75 to 84 Years | 97 | 11.7% |
| 85 Years and Over | 18 | 2.2% |
| Total | 832 | 100.0% |
Housing Finances in Huachuca City
Median Income by Occupancy in Huachuca City
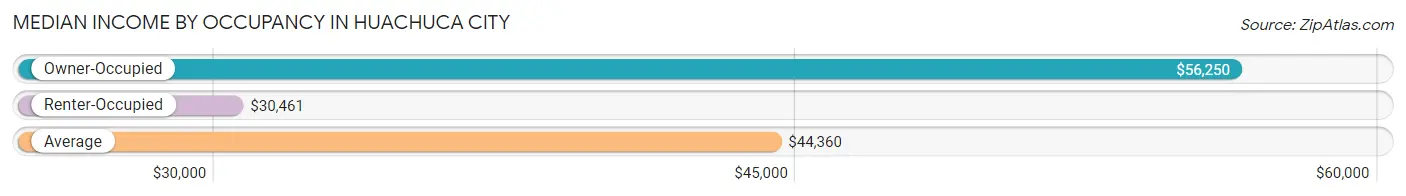
| Occupancy Type | # Households | Median Income |
| Owner-Occupied | 485 (58.3%) | $56,250 |
| Renter-Occupied | 347 (41.7%) | $30,461 |
| Average | 832 (100.0%) | $44,360 |
Occupancy by Householder Income Bracket in Huachuca City
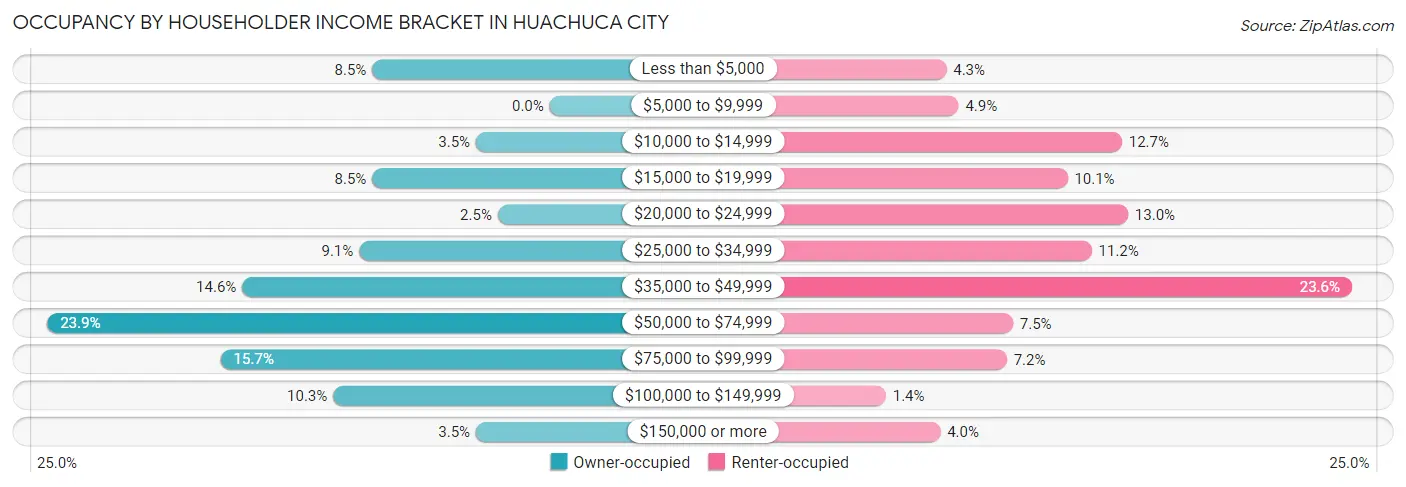
| Income Bracket | Owner-occupied | Renter-occupied |
| Less than $5,000 | 41 (8.5%) | 15 (4.3%) |
| $5,000 to $9,999 | 0 (0.0%) | 17 (4.9%) |
| $10,000 to $14,999 | 17 (3.5%) | 44 (12.7%) |
| $15,000 to $19,999 | 41 (8.5%) | 35 (10.1%) |
| $20,000 to $24,999 | 12 (2.5%) | 45 (13.0%) |
| $25,000 to $34,999 | 44 (9.1%) | 39 (11.2%) |
| $35,000 to $49,999 | 71 (14.6%) | 82 (23.6%) |
| $50,000 to $74,999 | 116 (23.9%) | 26 (7.5%) |
| $75,000 to $99,999 | 76 (15.7%) | 25 (7.2%) |
| $100,000 to $149,999 | 50 (10.3%) | 5 (1.4%) |
| $150,000 or more | 17 (3.5%) | 14 (4.0%) |
| Total | 485 (100.0%) | 347 (100.0%) |
Monthly Housing Cost Tiers in Huachuca City
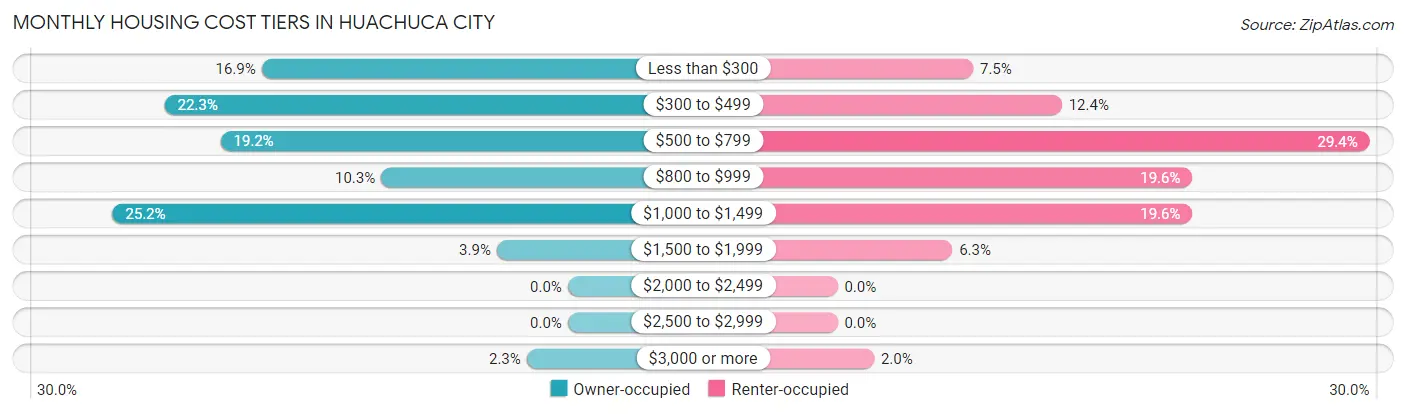
| Monthly Cost | Owner-occupied | Renter-occupied |
| Less than $300 | 82 (16.9%) | 26 (7.5%) |
| $300 to $499 | 108 (22.3%) | 43 (12.4%) |
| $500 to $799 | 93 (19.2%) | 102 (29.4%) |
| $800 to $999 | 50 (10.3%) | 68 (19.6%) |
| $1,000 to $1,499 | 122 (25.2%) | 68 (19.6%) |
| $1,500 to $1,999 | 19 (3.9%) | 22 (6.3%) |
| $2,000 to $2,499 | 0 (0.0%) | 0 (0.0%) |
| $2,500 to $2,999 | 0 (0.0%) | 0 (0.0%) |
| $3,000 or more | 11 (2.3%) | 7 (2.0%) |
| Total | 485 (100.0%) | 347 (100.0%) |
Physical Housing Characteristics in Huachuca City
Housing Structures in Huachuca City
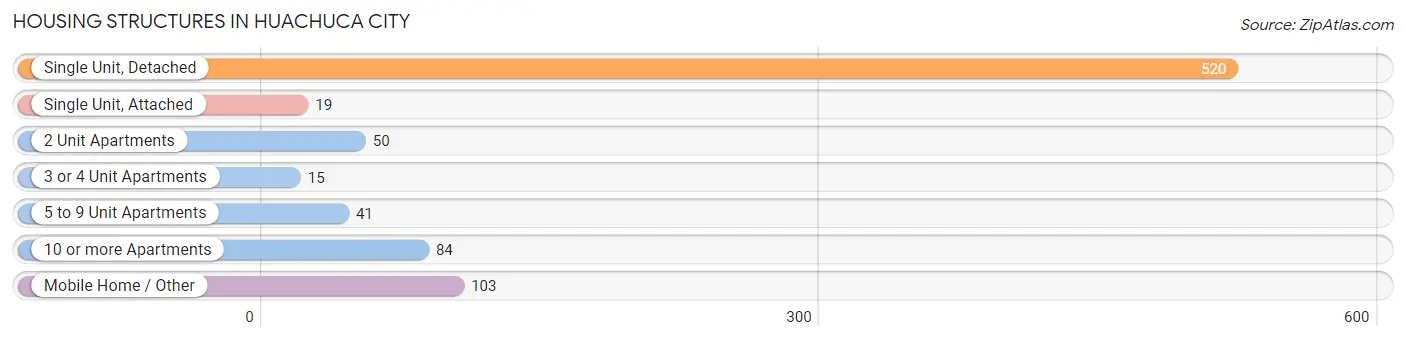
| Structure Type | # Housing Units | % Housing Units |
| Single Unit, Detached | 520 | 62.5% |
| Single Unit, Attached | 19 | 2.3% |
| 2 Unit Apartments | 50 | 6.0% |
| 3 or 4 Unit Apartments | 15 | 1.8% |
| 5 to 9 Unit Apartments | 41 | 4.9% |
| 10 or more Apartments | 84 | 10.1% |
| Mobile Home / Other | 103 | 12.4% |
| Total | 832 | 100.0% |
Housing Structures by Occupancy in Huachuca City
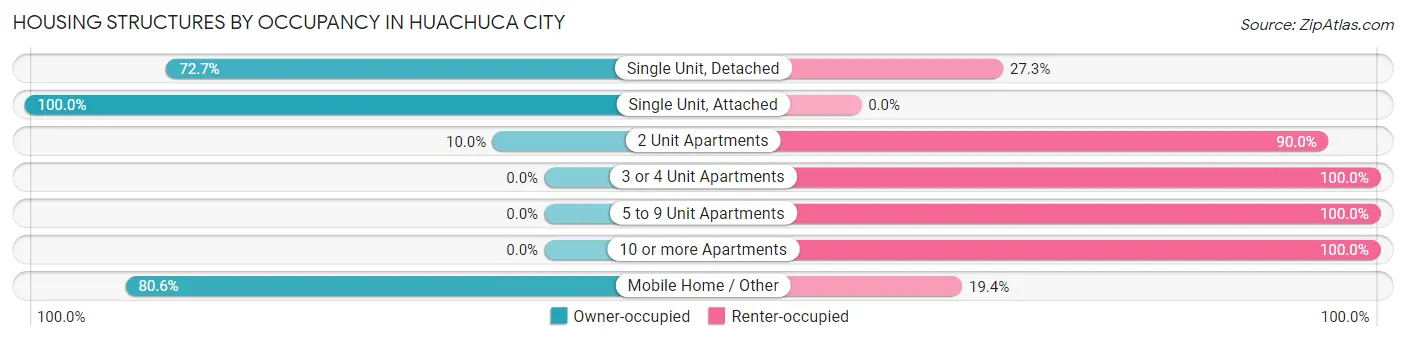
| Structure Type | Owner-occupied | Renter-occupied |
| Single Unit, Detached | 378 (72.7%) | 142 (27.3%) |
| Single Unit, Attached | 19 (100.0%) | 0 (0.0%) |
| 2 Unit Apartments | 5 (10.0%) | 45 (90.0%) |
| 3 or 4 Unit Apartments | 0 (0.0%) | 15 (100.0%) |
| 5 to 9 Unit Apartments | 0 (0.0%) | 41 (100.0%) |
| 10 or more Apartments | 0 (0.0%) | 84 (100.0%) |
| Mobile Home / Other | 83 (80.6%) | 20 (19.4%) |
| Total | 485 (58.3%) | 347 (41.7%) |
Housing Structures by Number of Rooms in Huachuca City
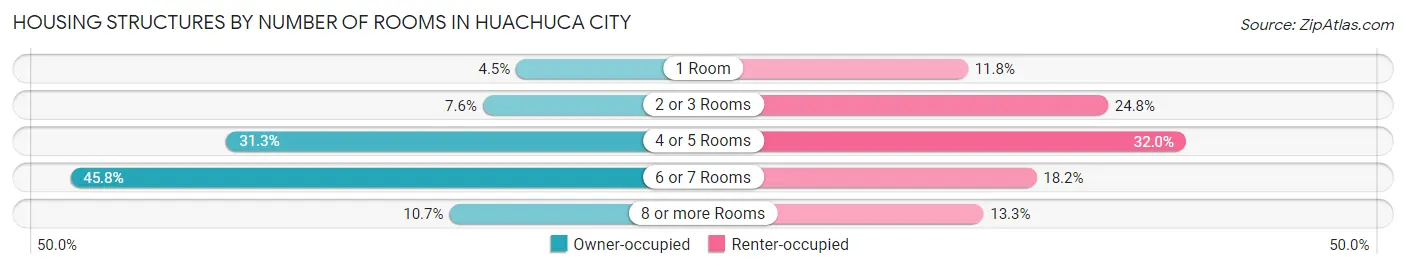
| Number of Rooms | Owner-occupied | Renter-occupied |
| 1 Room | 22 (4.5%) | 41 (11.8%) |
| 2 or 3 Rooms | 37 (7.6%) | 86 (24.8%) |
| 4 or 5 Rooms | 152 (31.3%) | 111 (32.0%) |
| 6 or 7 Rooms | 222 (45.8%) | 63 (18.2%) |
| 8 or more Rooms | 52 (10.7%) | 46 (13.3%) |
| Total | 485 (100.0%) | 347 (100.0%) |
Housing Structure by Heating Type in Huachuca City
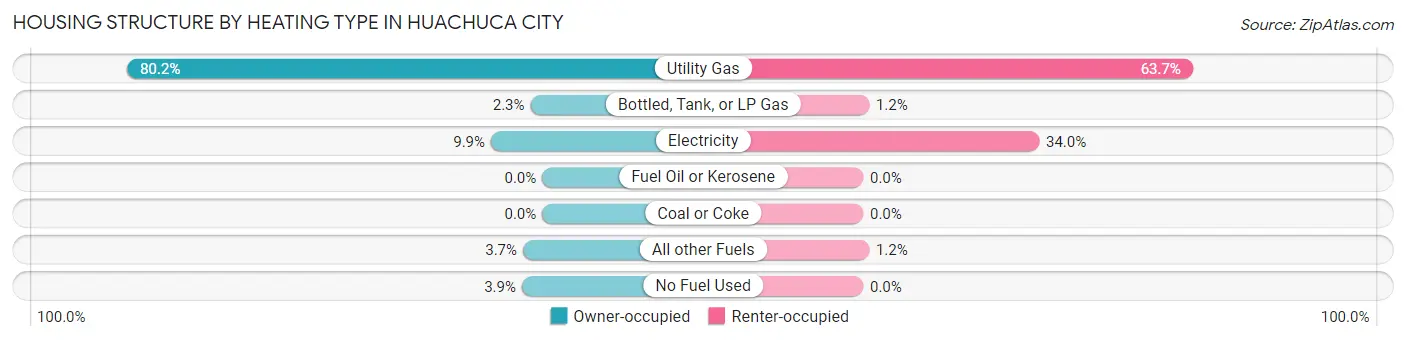
| Heating Type | Owner-occupied | Renter-occupied |
| Utility Gas | 389 (80.2%) | 221 (63.7%) |
| Bottled, Tank, or LP Gas | 11 (2.3%) | 4 (1.1%) |
| Electricity | 48 (9.9%) | 118 (34.0%) |
| Fuel Oil or Kerosene | 0 (0.0%) | 0 (0.0%) |
| Coal or Coke | 0 (0.0%) | 0 (0.0%) |
| All other Fuels | 18 (3.7%) | 4 (1.1%) |
| No Fuel Used | 19 (3.9%) | 0 (0.0%) |
| Total | 485 (100.0%) | 347 (100.0%) |
Household Vehicle Usage in Huachuca City
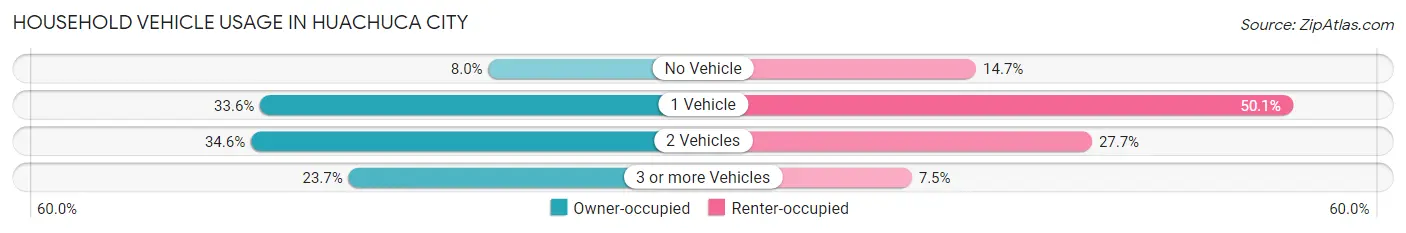
| Vehicles per Household | Owner-occupied | Renter-occupied |
| No Vehicle | 39 (8.0%) | 51 (14.7%) |
| 1 Vehicle | 163 (33.6%) | 174 (50.1%) |
| 2 Vehicles | 168 (34.6%) | 96 (27.7%) |
| 3 or more Vehicles | 115 (23.7%) | 26 (7.5%) |
| Total | 485 (100.0%) | 347 (100.0%) |
Real Estate & Mortgages in Huachuca City
Real Estate and Mortgage Overview in Huachuca City
| Characteristic | Without Mortgage | With Mortgage |
| Housing Units | 226 | 259 |
| Median Property Value | $105,700 | $117,300 |
| Median Household Income | $51,250 | $10 |
| Monthly Housing Costs | $406 | $0 |
| Real Estate Taxes | $655 | $17 |
Property Value by Mortgage Status in Huachuca City
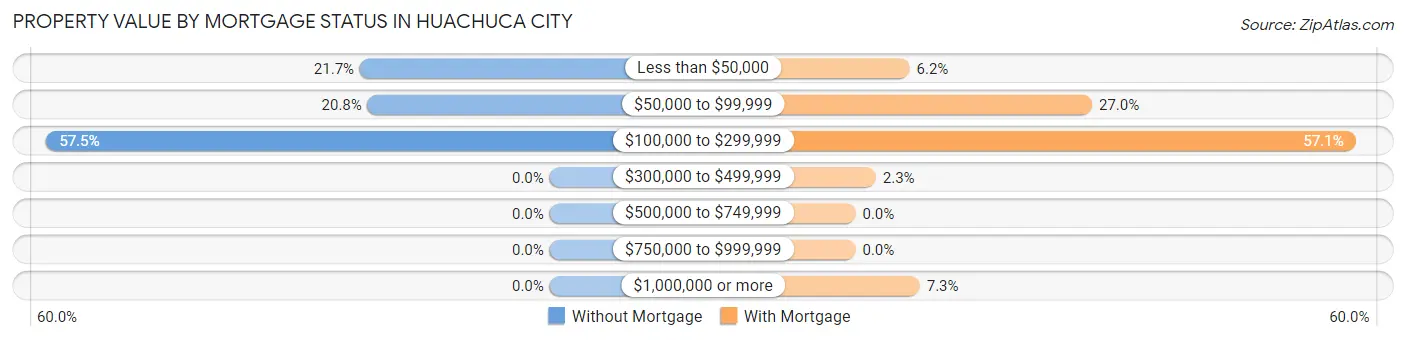
| Property Value | Without Mortgage | With Mortgage |
| Less than $50,000 | 49 (21.7%) | 16 (6.2%) |
| $50,000 to $99,999 | 47 (20.8%) | 70 (27.0%) |
| $100,000 to $299,999 | 130 (57.5%) | 148 (57.1%) |
| $300,000 to $499,999 | 0 (0.0%) | 6 (2.3%) |
| $500,000 to $749,999 | 0 (0.0%) | 0 (0.0%) |
| $750,000 to $999,999 | 0 (0.0%) | 0 (0.0%) |
| $1,000,000 or more | 0 (0.0%) | 19 (7.3%) |
| Total | 226 (100.0%) | 259 (100.0%) |
Household Income by Mortgage Status in Huachuca City
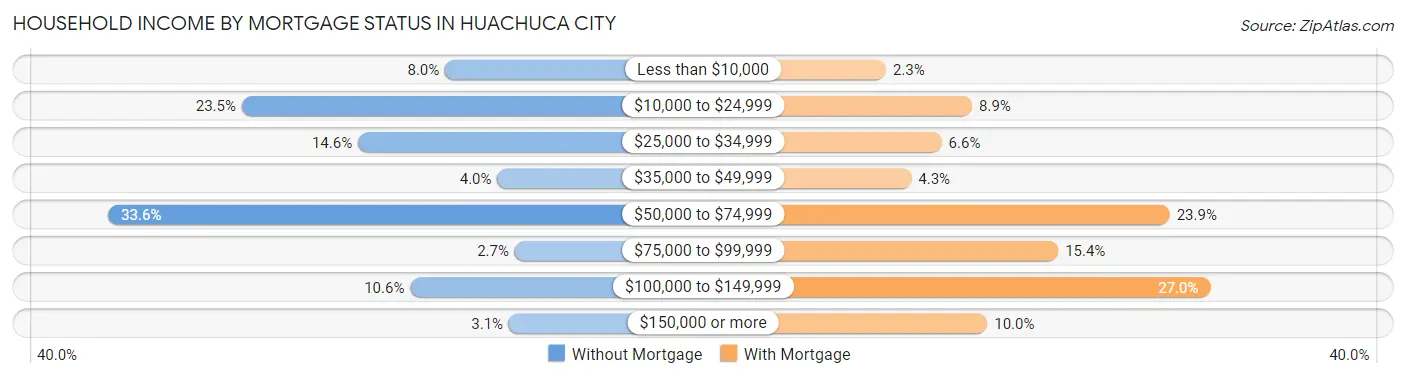
| Household Income | Without Mortgage | With Mortgage |
| Less than $10,000 | 18 (8.0%) | 6 (2.3%) |
| $10,000 to $24,999 | 53 (23.4%) | 23 (8.9%) |
| $25,000 to $34,999 | 33 (14.6%) | 17 (6.6%) |
| $35,000 to $49,999 | 9 (4.0%) | 11 (4.3%) |
| $50,000 to $74,999 | 76 (33.6%) | 62 (23.9%) |
| $75,000 to $99,999 | 6 (2.6%) | 40 (15.4%) |
| $100,000 to $149,999 | 24 (10.6%) | 70 (27.0%) |
| $150,000 or more | 7 (3.1%) | 26 (10.0%) |
| Total | 226 (100.0%) | 259 (100.0%) |
Property Value to Household Income Ratio in Huachuca City
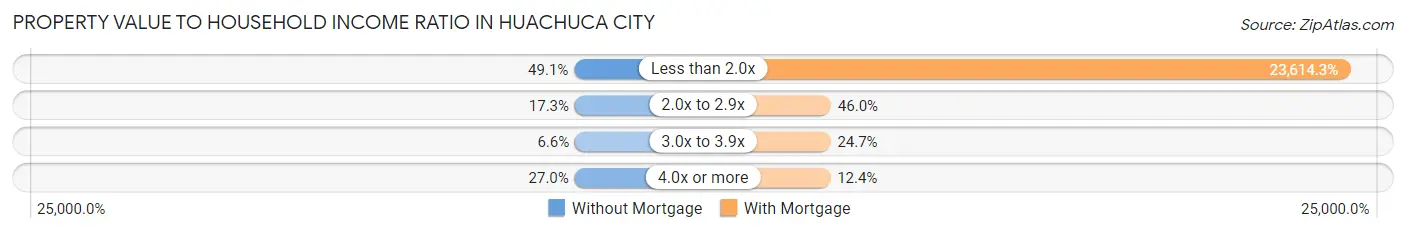
| Value-to-Income Ratio | Without Mortgage | With Mortgage |
| Less than 2.0x | 111 (49.1%) | 61,161 (23,614.3%) |
| 2.0x to 2.9x | 39 (17.3%) | 119 (46.0%) |
| 3.0x to 3.9x | 15 (6.6%) | 64 (24.7%) |
| 4.0x or more | 61 (27.0%) | 32 (12.4%) |
| Total | 226 (100.0%) | 259 (100.0%) |
Real Estate Taxes by Mortgage Status in Huachuca City
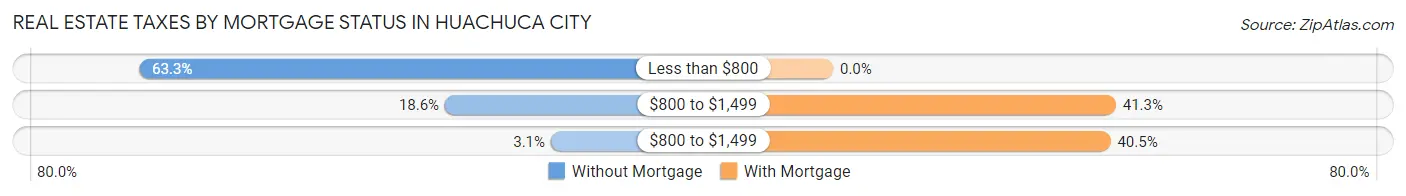
| Property Taxes | Without Mortgage | With Mortgage |
| Less than $800 | 143 (63.3%) | 0 (0.0%) |
| $800 to $1,499 | 42 (18.6%) | 107 (41.3%) |
| $800 to $1,499 | 7 (3.1%) | 105 (40.5%) |
| Total | 226 (100.0%) | 259 (100.0%) |
Health & Disability in Huachuca City
Health Insurance Coverage by Age in Huachuca City
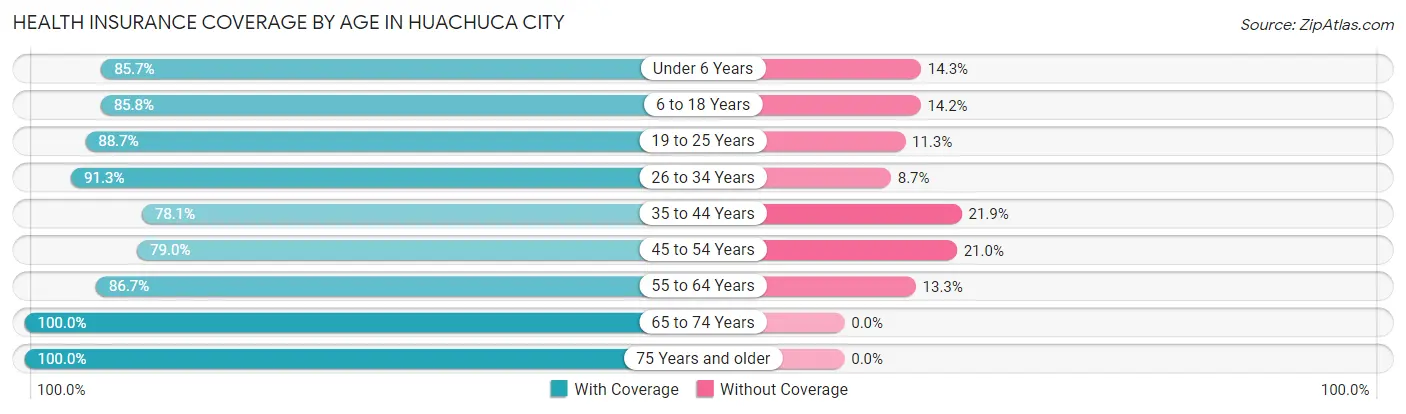
| Age Bracket | With Coverage | Without Coverage |
| Under 6 Years | 36 (85.7%) | 6 (14.3%) |
| 6 to 18 Years | 302 (85.8%) | 50 (14.2%) |
| 19 to 25 Years | 133 (88.7%) | 17 (11.3%) |
| 26 to 34 Years | 158 (91.3%) | 15 (8.7%) |
| 35 to 44 Years | 168 (78.1%) | 47 (21.9%) |
| 45 to 54 Years | 211 (79.0%) | 56 (21.0%) |
| 55 to 64 Years | 163 (86.7%) | 25 (13.3%) |
| 65 to 74 Years | 308 (100.0%) | 0 (0.0%) |
| 75 Years and older | 145 (100.0%) | 0 (0.0%) |
| Total | 1,624 (88.3%) | 216 (11.7%) |
Health Insurance Coverage by Citizenship Status in Huachuca City
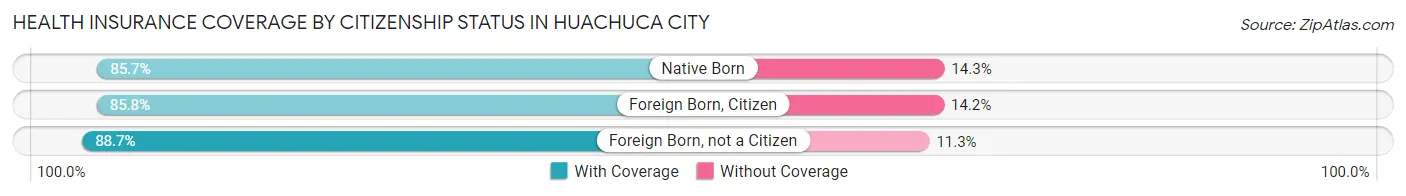
| Citizenship Status | With Coverage | Without Coverage |
| Native Born | 36 (85.7%) | 6 (14.3%) |
| Foreign Born, Citizen | 302 (85.8%) | 50 (14.2%) |
| Foreign Born, not a Citizen | 133 (88.7%) | 17 (11.3%) |
Health Insurance Coverage by Household Income in Huachuca City
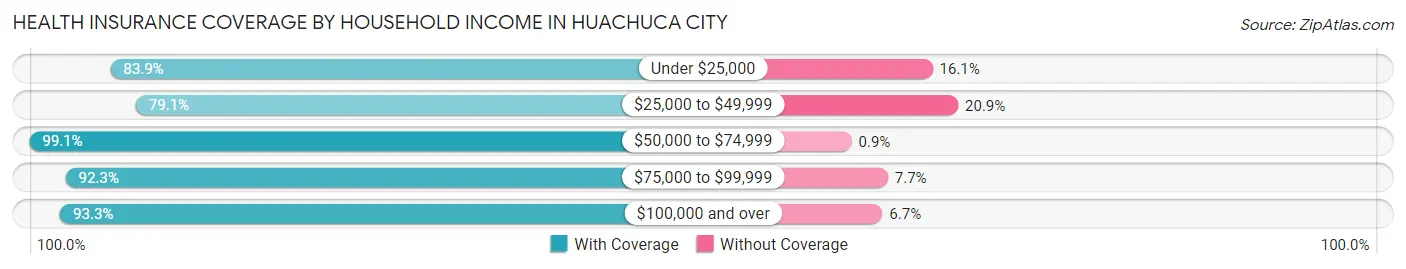
| Household Income | With Coverage | Without Coverage |
| Under $25,000 | 355 (83.9%) | 68 (16.1%) |
| $25,000 to $49,999 | 387 (79.1%) | 102 (20.9%) |
| $50,000 to $74,999 | 331 (99.1%) | 3 (0.9%) |
| $75,000 to $99,999 | 324 (92.3%) | 27 (7.7%) |
| $100,000 and over | 224 (93.3%) | 16 (6.7%) |
Public vs Private Health Insurance Coverage by Age in Huachuca City
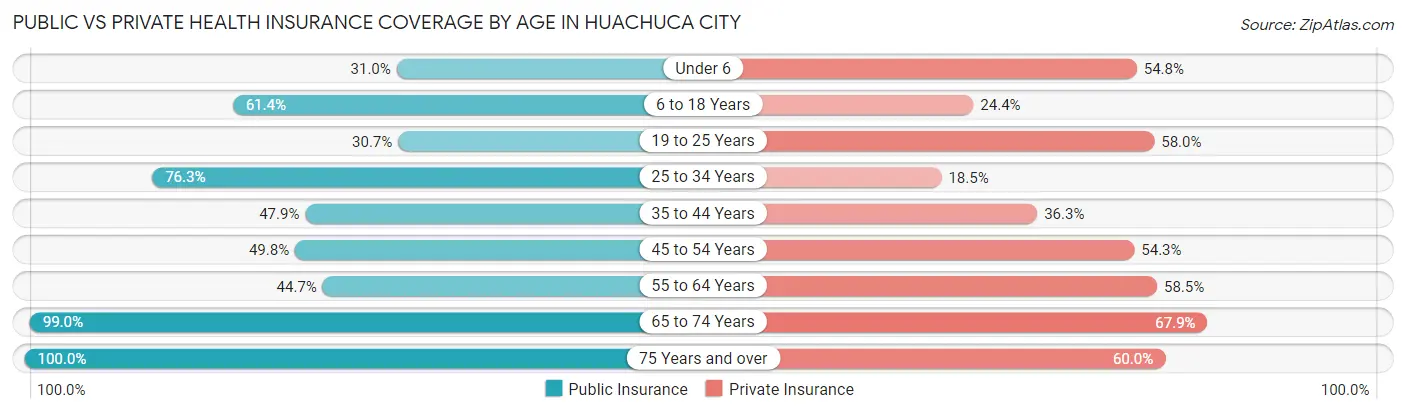
| Age Bracket | Public Insurance | Private Insurance |
| Under 6 | 13 (30.9%) | 23 (54.8%) |
| 6 to 18 Years | 216 (61.4%) | 86 (24.4%) |
| 19 to 25 Years | 46 (30.7%) | 87 (58.0%) |
| 25 to 34 Years | 132 (76.3%) | 32 (18.5%) |
| 35 to 44 Years | 103 (47.9%) | 78 (36.3%) |
| 45 to 54 Years | 133 (49.8%) | 145 (54.3%) |
| 55 to 64 Years | 84 (44.7%) | 110 (58.5%) |
| 65 to 74 Years | 305 (99.0%) | 209 (67.9%) |
| 75 Years and over | 145 (100.0%) | 87 (60.0%) |
| Total | 1,177 (64.0%) | 857 (46.6%) |
Disability Status by Sex by Age in Huachuca City
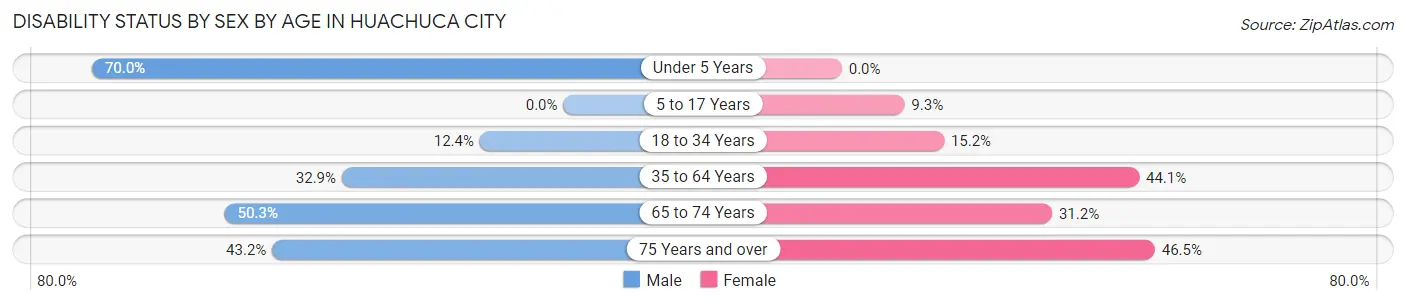
| Age Bracket | Male | Female |
| Under 5 Years | 7 (70.0%) | 0 (0.0%) |
| 5 to 17 Years | 0 (0.0%) | 16 (9.3%) |
| 18 to 34 Years | 17 (12.4%) | 32 (15.2%) |
| 35 to 64 Years | 125 (32.9%) | 128 (44.1%) |
| 65 to 74 Years | 84 (50.3%) | 44 (31.2%) |
| 75 Years and over | 32 (43.2%) | 33 (46.5%) |
Disability Class by Sex by Age in Huachuca City
Disability Class: Hearing Difficulty
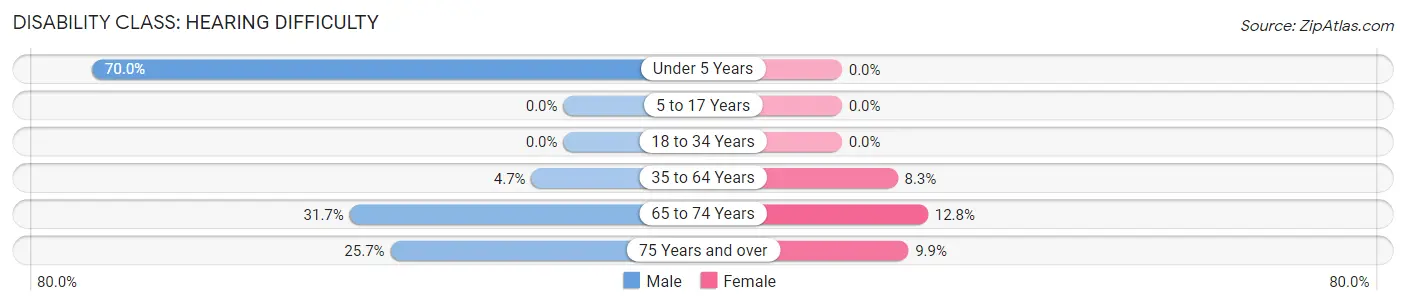
| Age Bracket | Male | Female |
| Under 5 Years | 7 (70.0%) | 0 (0.0%) |
| 5 to 17 Years | 0 (0.0%) | 0 (0.0%) |
| 18 to 34 Years | 0 (0.0%) | 0 (0.0%) |
| 35 to 64 Years | 18 (4.7%) | 24 (8.3%) |
| 65 to 74 Years | 53 (31.7%) | 18 (12.8%) |
| 75 Years and over | 19 (25.7%) | 7 (9.9%) |
Disability Class: Vision Difficulty
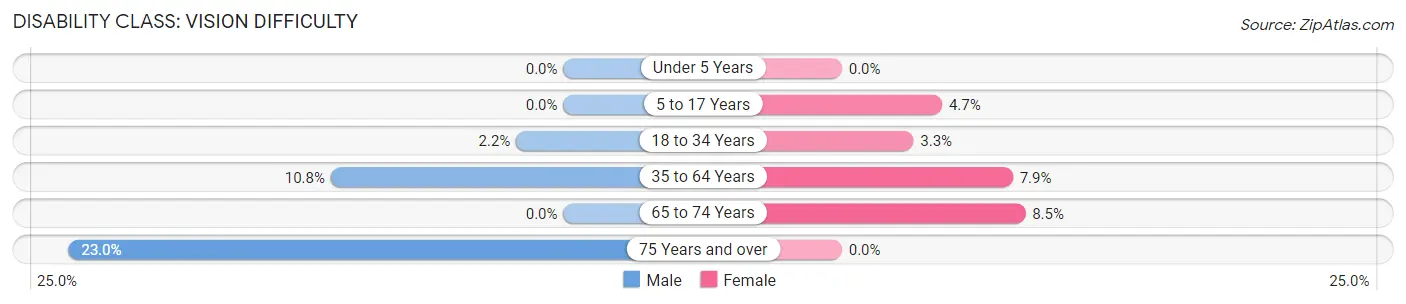
| Age Bracket | Male | Female |
| Under 5 Years | 0 (0.0%) | 0 (0.0%) |
| 5 to 17 Years | 0 (0.0%) | 8 (4.6%) |
| 18 to 34 Years | 3 (2.2%) | 7 (3.3%) |
| 35 to 64 Years | 41 (10.8%) | 23 (7.9%) |
| 65 to 74 Years | 0 (0.0%) | 12 (8.5%) |
| 75 Years and over | 17 (23.0%) | 0 (0.0%) |
Disability Class: Cognitive Difficulty
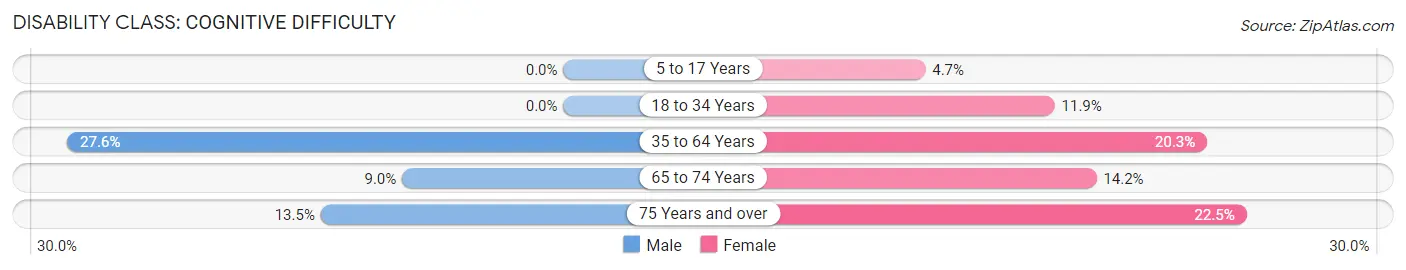
| Age Bracket | Male | Female |
| 5 to 17 Years | 0 (0.0%) | 8 (4.6%) |
| 18 to 34 Years | 0 (0.0%) | 25 (11.8%) |
| 35 to 64 Years | 105 (27.6%) | 59 (20.3%) |
| 65 to 74 Years | 15 (9.0%) | 20 (14.2%) |
| 75 Years and over | 10 (13.5%) | 16 (22.5%) |
Disability Class: Ambulatory Difficulty
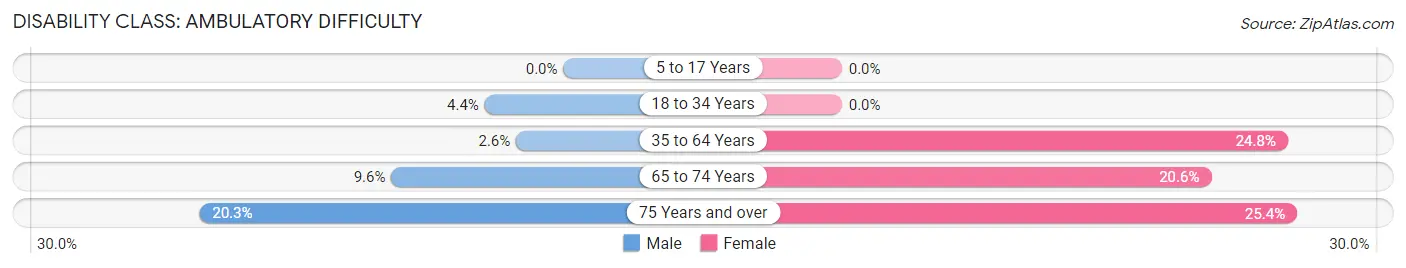
| Age Bracket | Male | Female |
| 5 to 17 Years | 0 (0.0%) | 0 (0.0%) |
| 18 to 34 Years | 6 (4.4%) | 0 (0.0%) |
| 35 to 64 Years | 10 (2.6%) | 72 (24.8%) |
| 65 to 74 Years | 16 (9.6%) | 29 (20.6%) |
| 75 Years and over | 15 (20.3%) | 18 (25.4%) |
Disability Class: Self-Care Difficulty
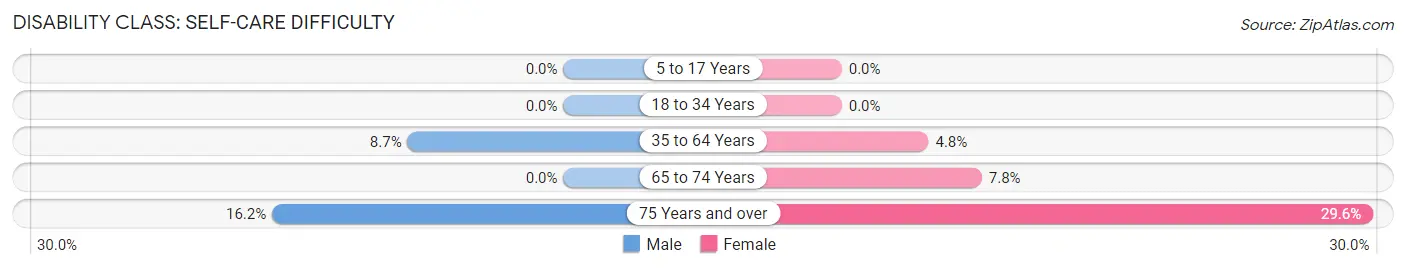
| Age Bracket | Male | Female |
| 5 to 17 Years | 0 (0.0%) | 0 (0.0%) |
| 18 to 34 Years | 0 (0.0%) | 0 (0.0%) |
| 35 to 64 Years | 33 (8.7%) | 14 (4.8%) |
| 65 to 74 Years | 0 (0.0%) | 11 (7.8%) |
| 75 Years and over | 12 (16.2%) | 21 (29.6%) |
Technology Access in Huachuca City
Computing Device Access in Huachuca City
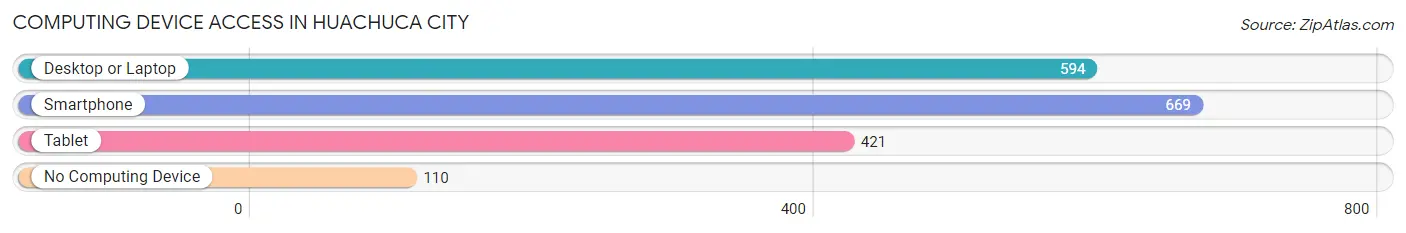
| Device Type | # Households | % Households |
| Desktop or Laptop | 594 | 71.4% |
| Smartphone | 669 | 80.4% |
| Tablet | 421 | 50.6% |
| No Computing Device | 110 | 13.2% |
| Total | 832 | 100.0% |
Internet Access in Huachuca City
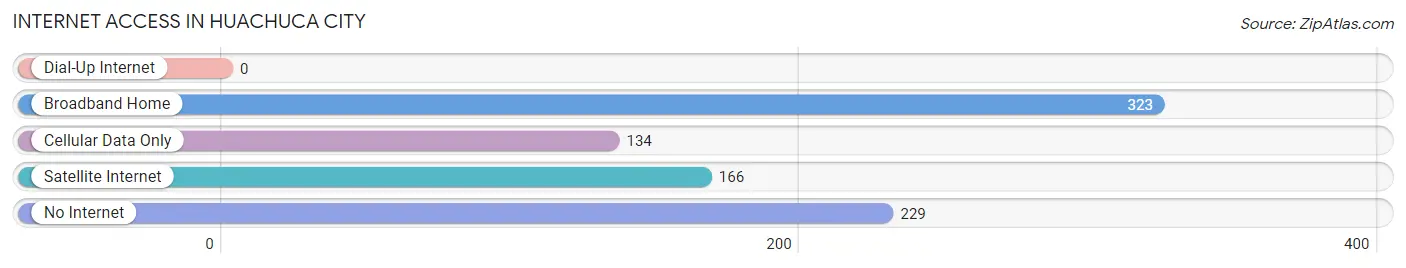
| Internet Type | # Households | % Households |
| Dial-Up Internet | 0 | 0.0% |
| Broadband Home | 323 | 38.8% |
| Cellular Data Only | 134 | 16.1% |
| Satellite Internet | 166 | 20.0% |
| No Internet | 229 | 27.5% |
| Total | 832 | 100.0% |
Huachuca City Summary
Huachuca City is a small town located in Cochise County, Arizona. It is situated in the Huachuca Mountains, approximately 15 miles east of Sierra Vista. The town was founded in the late 19th century and has a population of approximately 1,853 people as of the 2010 census.
Geography
Huachuca City is located in the Huachuca Mountains, which are part of the Coronado National Forest. The town is situated at an elevation of 4,639 feet and is surrounded by the Huachuca Mountains, which reach heights of up to 8,000 feet. The town is located in a semi-arid climate, with hot summers and mild winters. The average annual precipitation is approximately 12.5 inches.
The town is located near the San Pedro River, which is a major tributary of the Gila River. The San Pedro River is a popular destination for bird watching, fishing, and other recreational activities.
Economy
Huachuca City is a small, rural community with a limited economy. The town is home to a few small businesses, including a grocery store, a hardware store, and a few restaurants. The town is also home to a few small manufacturing companies, including a furniture manufacturer and a metal fabrication company.
The town is also home to Fort Huachuca, a U.S. Army installation. The fort is the largest employer in the area, providing jobs for approximately 8,000 people. The fort is also home to the U.S. Army Intelligence Center and the U.S. Army Network Enterprise Technology Command.
Demographics
As of the 2010 census, Huachuca City had a population of 1,853 people. The racial makeup of the town was 87.3% White, 0.7% African American, 0.7% Native American, 0.7% Asian, 0.2% Pacific Islander, 8.2% from other races, and 2.2% from two or more races. Hispanic or Latino of any race were 16.2% of the population.
The median income for a household in the town was $35,938, and the median income for a family was $41,250. The per capita income for the town was $17,845. About 11.2% of families and 14.2% of the population were below the poverty line, including 18.2% of those under age 18 and 8.3% of those age 65 or over.
History
Huachuca City was founded in the late 19th century as a mining town. The town was named after the nearby Huachuca Mountains, which were named after the Huachuca Indians, who were the original inhabitants of the area. The town was originally a small mining camp, but it grew in size and population as the mining industry in the area expanded.
In the early 20th century, the town was home to a large number of saloons and gambling halls. The town was also home to a number of brothels, which were eventually shut down by the local authorities.
In the late 20th century, the town was home to Fort Huachuca, a U.S. Army installation. The fort is the largest employer in the area, providing jobs for approximately 8,000 people. The fort is also home to the U.S. Army Intelligence Center and the U.S. Army Network Enterprise Technology Command.
Today, Huachuca City is a small, rural community with a limited economy. The town is home to a few small businesses, including a grocery store, a hardware store, and a few restaurants. The town is also home to a few small manufacturing companies, including a furniture manufacturer and a metal fabrication company. The town is also home to Fort Huachuca, a U.S. Army installation.
Common Questions
What is Per Capita Income in Huachuca City?
Per Capita income in Huachuca City is $25,041.
What is the Median Family Income in Huachuca City?
Median Family Income in Huachuca City is $56,000.
What is the Median Household income in Huachuca City?
Median Household Income in Huachuca City is $44,360.
What is Income or Wage Gap in Huachuca City?
Income or Wage Gap in Huachuca City is 21.7%.
Women in Huachuca City earn 78.3 cents for every dollar earned by a man.
What is Family Income Deficit in Huachuca City?
Family Income Deficit in Huachuca City is $12,937.
Families that are below poverty line in Huachuca City earn $12,937 less on average than the poverty threshold level.
What is Inequality or Gini Index in Huachuca City?
Inequality or Gini Index in Huachuca City is 0.44.
What is the Total Population of Huachuca City?
Total Population of Huachuca City is 1,865.
What is the Total Male Population of Huachuca City?
Total Male Population of Huachuca City is 966.
What is the Total Female Population of Huachuca City?
Total Female Population of Huachuca City is 899.
What is the Ratio of Males per 100 Females in Huachuca City?
There are 107.45 Males per 100 Females in Huachuca City.
What is the Ratio of Females per 100 Males in Huachuca City?
There are 93.06 Females per 100 Males in Huachuca City.
What is the Median Population Age in Huachuca City?
Median Population Age in Huachuca City is 42.3 Years.
What is the Average Family Size in Huachuca City
Average Family Size in Huachuca City is 3.1 People.
What is the Average Household Size in Huachuca City
Average Household Size in Huachuca City is 2.2 People.
How Large is the Labor Force in Huachuca City?
There are 823 People in the Labor Forcein in Huachuca City.
What is the Percentage of People in the Labor Force in Huachuca City?
52.6% of People are in the Labor Force in Huachuca City.
What is the Unemployment Rate in Huachuca City?
Unemployment Rate in Huachuca City is 11.0%.