Sun City, AZ Map & Demographics
Sun City Map
Sun City Overview
$40,068
PER CAPITA INCOME
$67,818
AVG FAMILY INCOME
$51,263
AVG HOUSEHOLD INCOME
6.0%
WAGE / INCOME GAP [ % ]
94.0¢/ $1
WAGE / INCOME GAP [ $ ]
0.41
INEQUALITY / GINI INDEX
37,748
TOTAL POPULATION
15,731
MALE POPULATION
22,017
FEMALE POPULATION
71.45
MALES / 100 FEMALES
139.96
FEMALES / 100 MALES
72.6
MEDIAN AGE
2.2
AVG FAMILY SIZE
1.6
AVG HOUSEHOLD SIZE
7,047
LABOR FORCE [ PEOPLE ]
18.8%
PERCENT IN LABOR FORCE
5.7%
UNEMPLOYMENT RATE
Sun City Area Codes
Income in Sun City
Income Overview in Sun City
Per Capita Income in Sun City is $40,068, while median incomes of families and households are $67,818 and $51,263 respectively.
| Characteristic | Number | Measure |
| Per Capita Income | 37,748 | $40,068 |
| Median Family Income | 11,153 | $67,818 |
| Mean Family Income | 11,153 | $81,538 |
| Median Household Income | 22,889 | $51,263 |
| Mean Household Income | 22,889 | $64,103 |
| Income Deficit | 11,153 | $0 |
| Wage / Income Gap (%) | 37,748 | 5.99% |
| Wage / Income Gap ($) | 37,748 | 94.01¢ per $1 |
| Gini / Inequality Index | 37,748 | 0.41 |
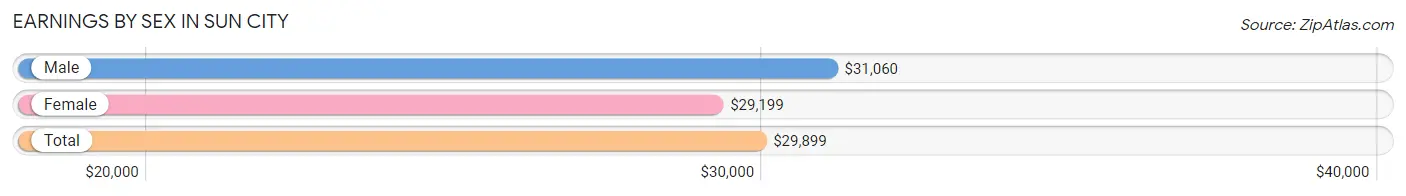
Earnings by Sex in Sun City
Average Earnings in Sun City are $29,899, $31,060 for men and $29,199 for women, a difference of 6.0%.
| Sex | Number | Average Earnings |
| Male | 3,738 (45.5%) | $31,060 |
| Female | 4,472 (54.5%) | $29,199 |
| Total | 8,210 (100.0%) | $29,899 |
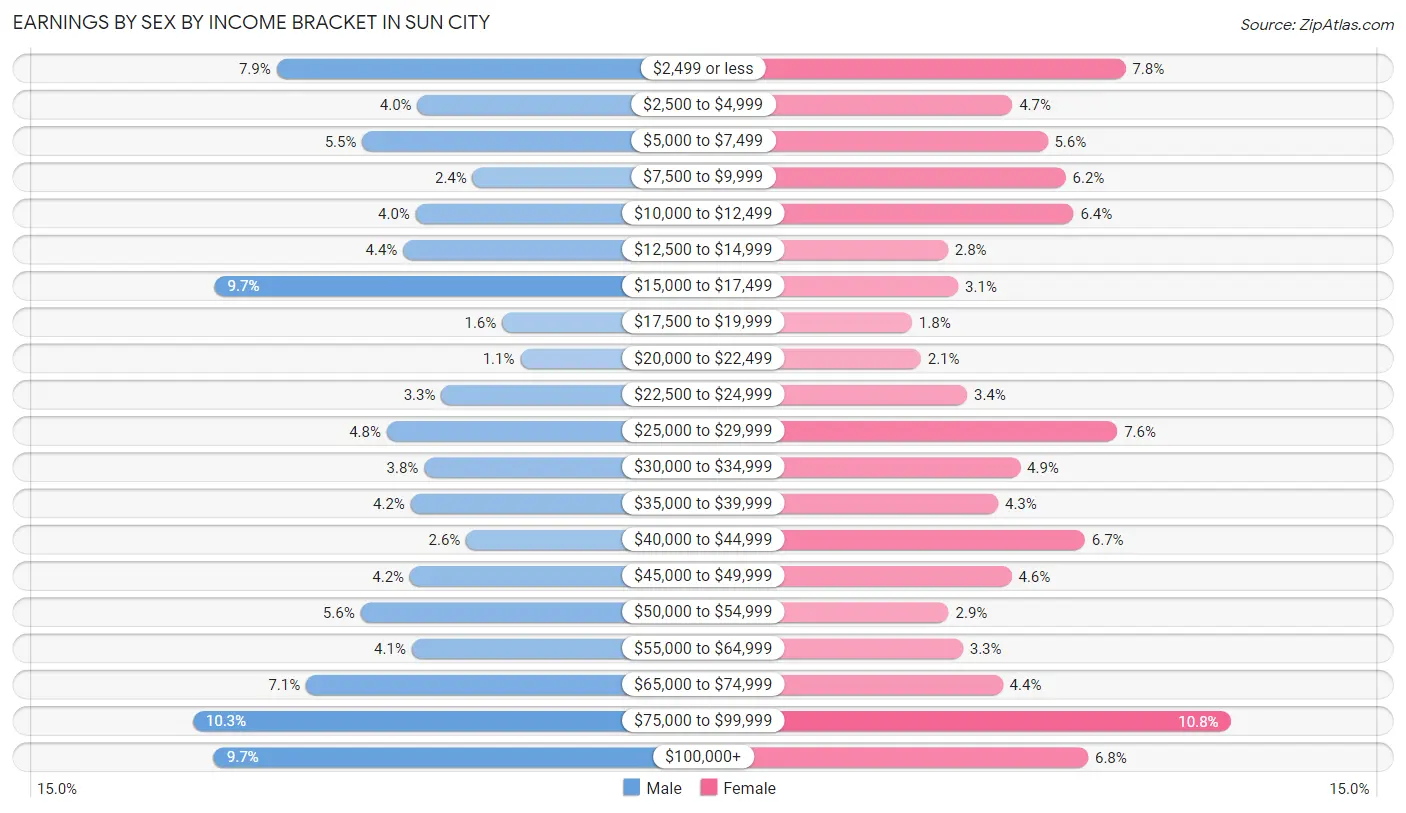
Earnings by Sex by Income Bracket in Sun City
The most common earnings brackets in Sun City are $75,000 to $99,999 for men (384 | 10.3%) and $75,000 to $99,999 for women (482 | 10.8%).
| Income | Male | Female |
| $2,499 or less | 296 (7.9%) | 350 (7.8%) |
| $2,500 to $4,999 | 148 (4.0%) | 208 (4.6%) |
| $5,000 to $7,499 | 206 (5.5%) | 252 (5.6%) |
| $7,500 to $9,999 | 90 (2.4%) | 275 (6.1%) |
| $10,000 to $12,499 | 150 (4.0%) | 285 (6.4%) |
| $12,500 to $14,999 | 163 (4.4%) | 127 (2.8%) |
| $15,000 to $17,499 | 361 (9.7%) | 140 (3.1%) |
| $17,500 to $19,999 | 59 (1.6%) | 82 (1.8%) |
| $20,000 to $22,499 | 40 (1.1%) | 93 (2.1%) |
| $22,500 to $24,999 | 123 (3.3%) | 151 (3.4%) |
| $25,000 to $29,999 | 180 (4.8%) | 340 (7.6%) |
| $30,000 to $34,999 | 141 (3.8%) | 218 (4.9%) |
| $35,000 to $39,999 | 155 (4.2%) | 190 (4.3%) |
| $40,000 to $44,999 | 97 (2.6%) | 299 (6.7%) |
| $45,000 to $49,999 | 156 (4.2%) | 207 (4.6%) |
| $50,000 to $54,999 | 208 (5.6%) | 128 (2.9%) |
| $55,000 to $64,999 | 154 (4.1%) | 146 (3.3%) |
| $65,000 to $74,999 | 265 (7.1%) | 196 (4.4%) |
| $75,000 to $99,999 | 384 (10.3%) | 482 (10.8%) |
| $100,000+ | 362 (9.7%) | 303 (6.8%) |
| Total | 3,738 (100.0%) | 4,472 (100.0%) |
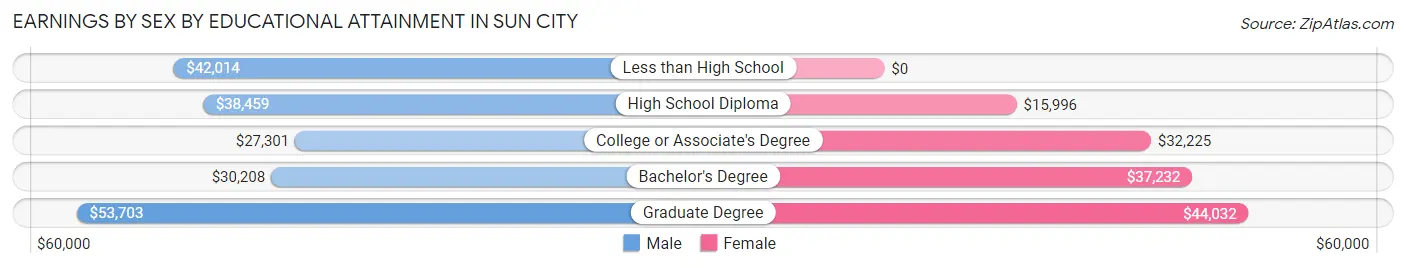
Earnings by Sex by Educational Attainment in Sun City
Average earnings in Sun City are $32,190 for men and $29,839 for women, a difference of 7.3%. Men with an educational attainment of graduate degree enjoy the highest average annual earnings of $53,703, while those with college or associate's degree education earn the least with $27,301. Women with an educational attainment of graduate degree earn the most with the average annual earnings of $44,032, while those with high school diploma education have the smallest earnings of $15,996.
| Educational Attainment | Male Income | Female Income |
| Less than High School | $42,014 | $0 |
| High School Diploma | $38,459 | $15,996 |
| College or Associate's Degree | $27,301 | $32,225 |
| Bachelor's Degree | $30,208 | $37,232 |
| Graduate Degree | $53,703 | $44,032 |
| Total | $32,190 | $29,839 |
Family Income in Sun City
Family Income Brackets in Sun City
According to the Sun City family income data, there are 3,145 families falling into the $50,000 to $74,999 income range, which is the most common income bracket and makes up 28.2% of all families. Conversely, the $10,000 to $14,999 income bracket is the least frequent group with only 67 families (0.6%) belonging to this category.
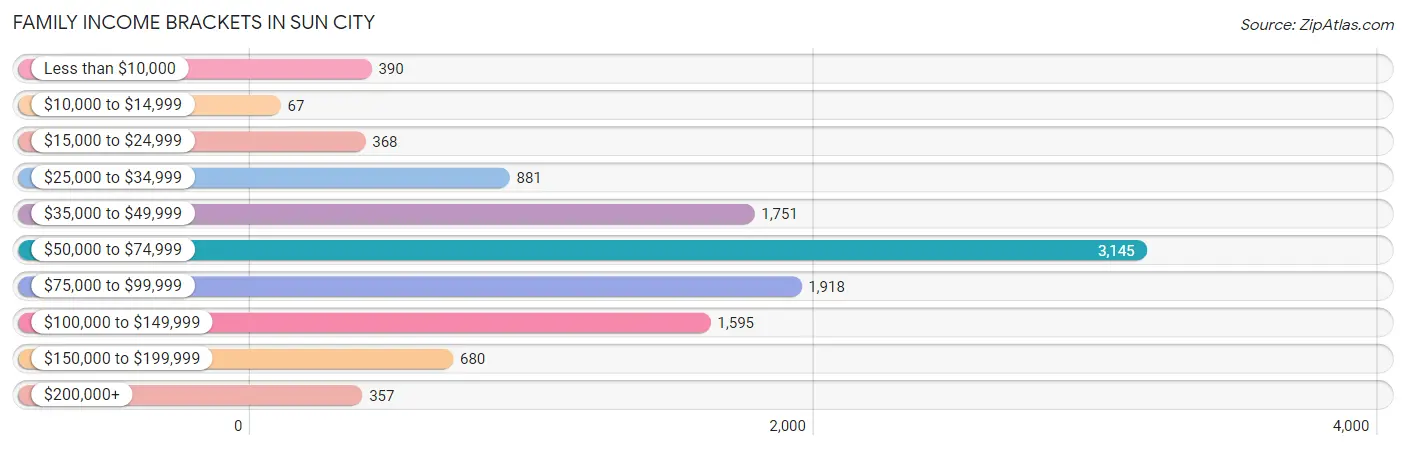
| Income Bracket | # Families | % Families |
| Less than $10,000 | 390 | 3.5% |
| $10,000 to $14,999 | 67 | 0.6% |
| $15,000 to $24,999 | 368 | 3.3% |
| $25,000 to $34,999 | 881 | 7.9% |
| $35,000 to $49,999 | 1,751 | 15.7% |
| $50,000 to $74,999 | 3,145 | 28.2% |
| $75,000 to $99,999 | 1,918 | 17.2% |
| $100,000 to $149,999 | 1,595 | 14.3% |
| $150,000 to $199,999 | 680 | 6.1% |
| $200,000+ | 357 | 3.2% |
Family Income by Famaliy Size in Sun City
4-person families (168 | 1.5%) account for the highest median family income in Sun City with $122,561 per family, while 2-person families (10,144 | 90.9%) have the highest median income of $33,664 per family member.
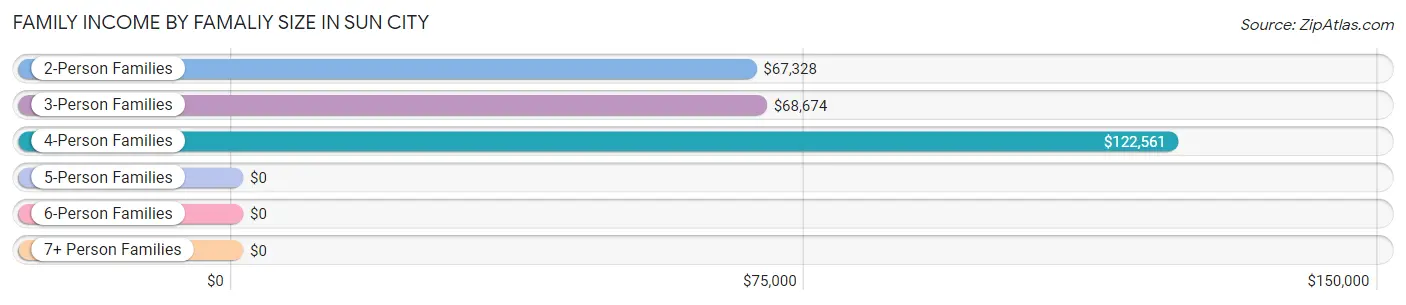
| Income Bracket | # Families | Median Income |
| 2-Person Families | 10,144 (90.9%) | $67,328 |
| 3-Person Families | 762 (6.8%) | $68,674 |
| 4-Person Families | 168 (1.5%) | $122,561 |
| 5-Person Families | 59 (0.5%) | $0 |
| 6-Person Families | 0 (0.0%) | $0 |
| 7+ Person Families | 20 (0.2%) | $0 |
| Total | 11,153 (100.0%) | $67,818 |
Family Income by Number of Earners in Sun City
The median family income in Sun City is $67,818, with families comprising 2 earners (1,136) having the highest median family income of $124,207, while families with no earners (6,945) have the lowest median family income of $62,813, accounting for 10.2% and 62.3% of families, respectively.
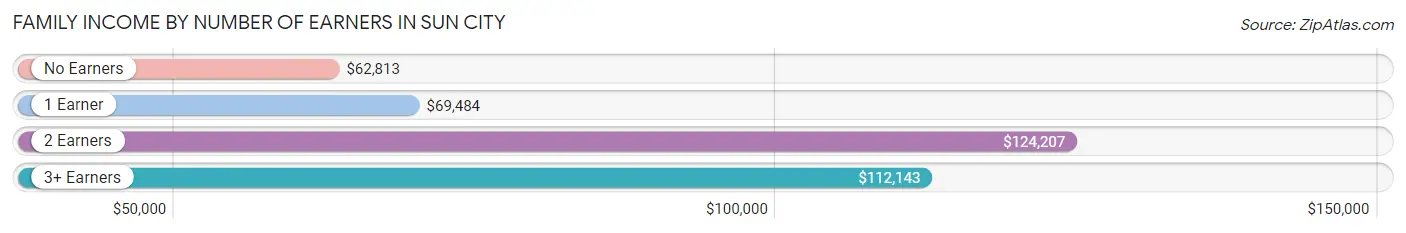
| Number of Earners | # Families | Median Income |
| No Earners | 6,945 (62.3%) | $62,813 |
| 1 Earner | 2,998 (26.9%) | $69,484 |
| 2 Earners | 1,136 (10.2%) | $124,207 |
| 3+ Earners | 74 (0.7%) | $112,143 |
| Total | 11,153 (100.0%) | $67,818 |
Household Income in Sun City
Household Income Brackets in Sun City
With 5,264 households falling in the category, the $50,000 to $74,999 income range is the most frequent in Sun City, accounting for 23.0% of all households. In contrast, only 458 households (2.0%) fall into the $200,000+ income bracket, making it the least populous group.
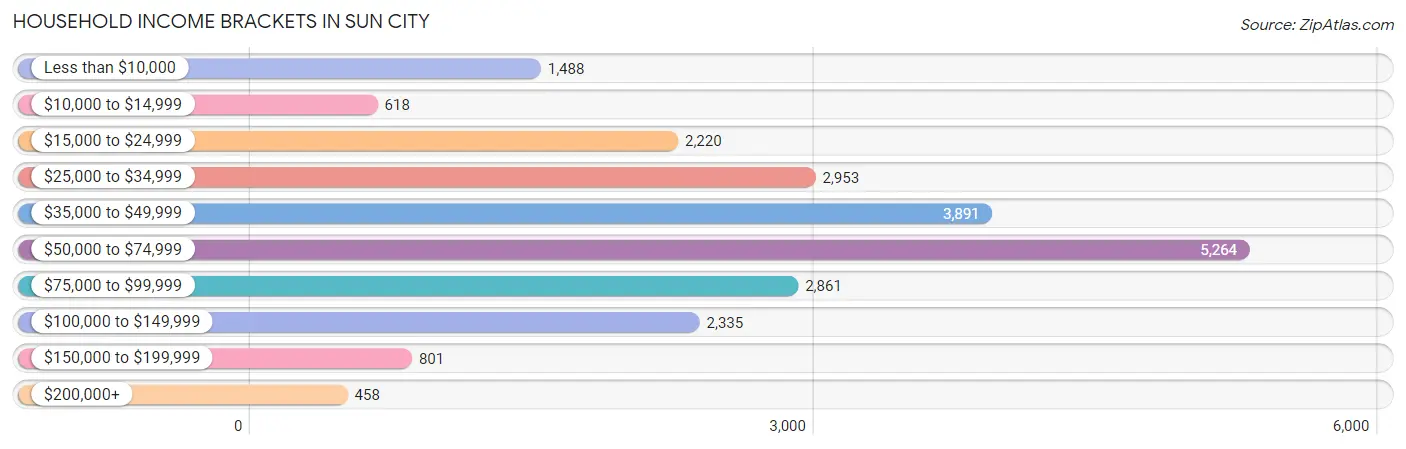
| Income Bracket | # Households | % Households |
| Less than $10,000 | 1,488 | 6.5% |
| $10,000 to $14,999 | 618 | 2.7% |
| $15,000 to $24,999 | 2,220 | 9.7% |
| $25,000 to $34,999 | 2,953 | 12.9% |
| $35,000 to $49,999 | 3,891 | 17.0% |
| $50,000 to $74,999 | 5,264 | 23.0% |
| $75,000 to $99,999 | 2,861 | 12.5% |
| $100,000 to $149,999 | 2,335 | 10.2% |
| $150,000 to $199,999 | 801 | 3.5% |
| $200,000+ | 458 | 2.0% |
Household Income by Householder Age in Sun City
The median household income in Sun City is $51,263, with the highest median household income of $66,577 found in the 45 to 64 years age bracket for the primary householder. A total of 3,788 households (16.6%) fall into this category. Meanwhile, the 15 to 24 years age bracket for the primary householder has the lowest median household income of $0, with 14 households (0.1%) in this group.
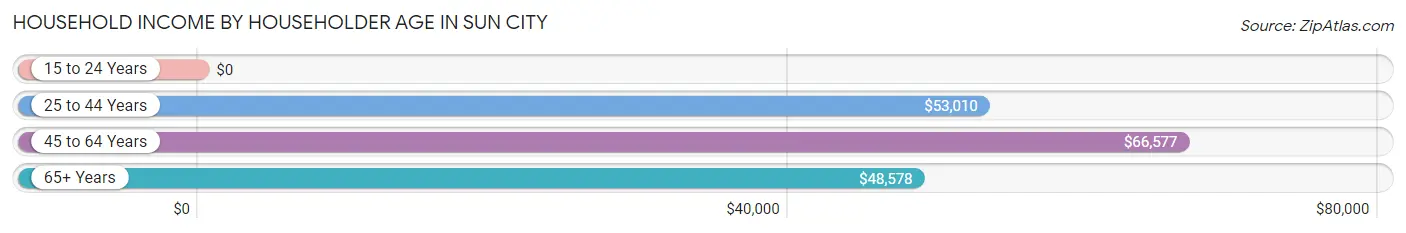
| Income Bracket | # Households | Median Income |
| 15 to 24 Years | 14 (0.1%) | $0 |
| 25 to 44 Years | 152 (0.7%) | $53,010 |
| 45 to 64 Years | 3,788 (16.6%) | $66,577 |
| 65+ Years | 18,935 (82.7%) | $48,578 |
| Total | 22,889 (100.0%) | $51,263 |
Poverty in Sun City
Income Below Poverty by Sex and Age in Sun City
With 8.3% poverty level for males and 9.7% for females among the residents of Sun City, under 5 year old males and 6 to 11 year old females are the most vulnerable to poverty, with 26 males (100.0%) and 39 females (44.8%) in their respective age groups living below the poverty level.
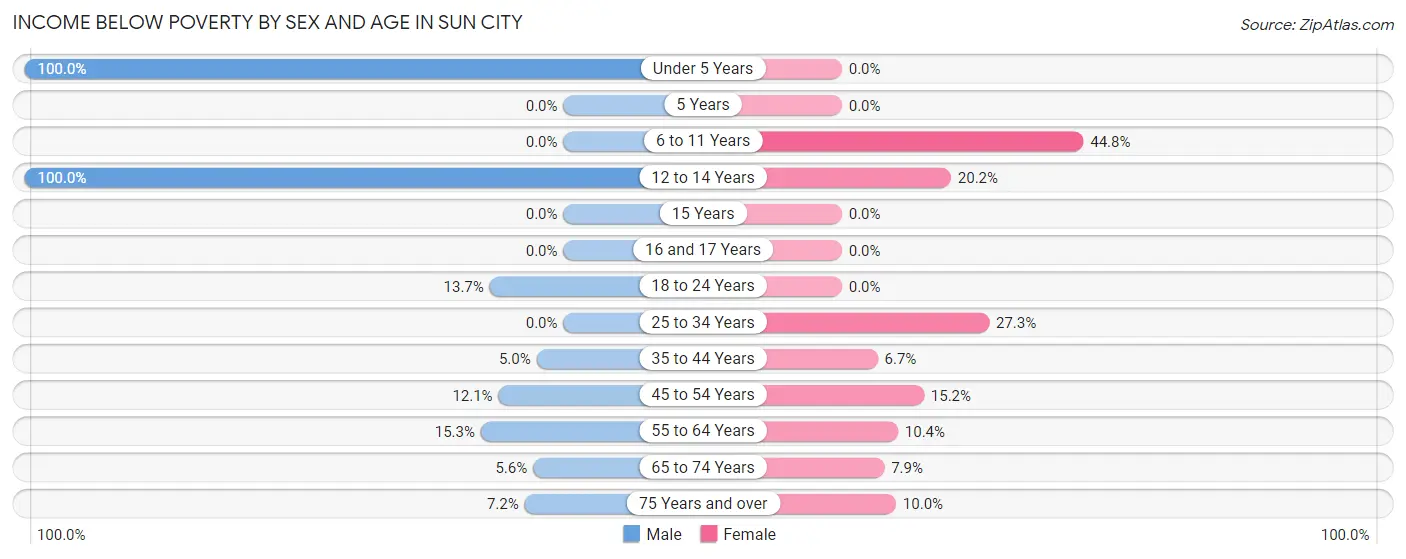
| Age Bracket | Male | Female |
| Under 5 Years | 26 (100.0%) | 0 (0.0%) |
| 5 Years | 0 (0.0%) | 0 (0.0%) |
| 6 to 11 Years | 0 (0.0%) | 39 (44.8%) |
| 12 to 14 Years | 19 (100.0%) | 17 (20.2%) |
| 15 Years | 0 (0.0%) | 0 (0.0%) |
| 16 and 17 Years | 0 (0.0%) | 0 (0.0%) |
| 18 to 24 Years | 23 (13.7%) | 0 (0.0%) |
| 25 to 34 Years | 0 (0.0%) | 44 (27.3%) |
| 35 to 44 Years | 17 (5.0%) | 23 (6.7%) |
| 45 to 54 Years | 67 (12.0%) | 101 (15.2%) |
| 55 to 64 Years | 393 (15.3%) | 382 (10.4%) |
| 65 to 74 Years | 303 (5.6%) | 608 (7.9%) |
| 75 Years and over | 446 (7.2%) | 879 (10.0%) |
| Total | 1,294 (8.3%) | 2,093 (9.7%) |
Income Above Poverty by Sex and Age in Sun City
According to the poverty statistics in Sun City, males aged 6 to 11 years and females aged 18 to 24 years are the age groups that are most secure financially, with 100.0% of males and 100.0% of females in these age groups living above the poverty line.
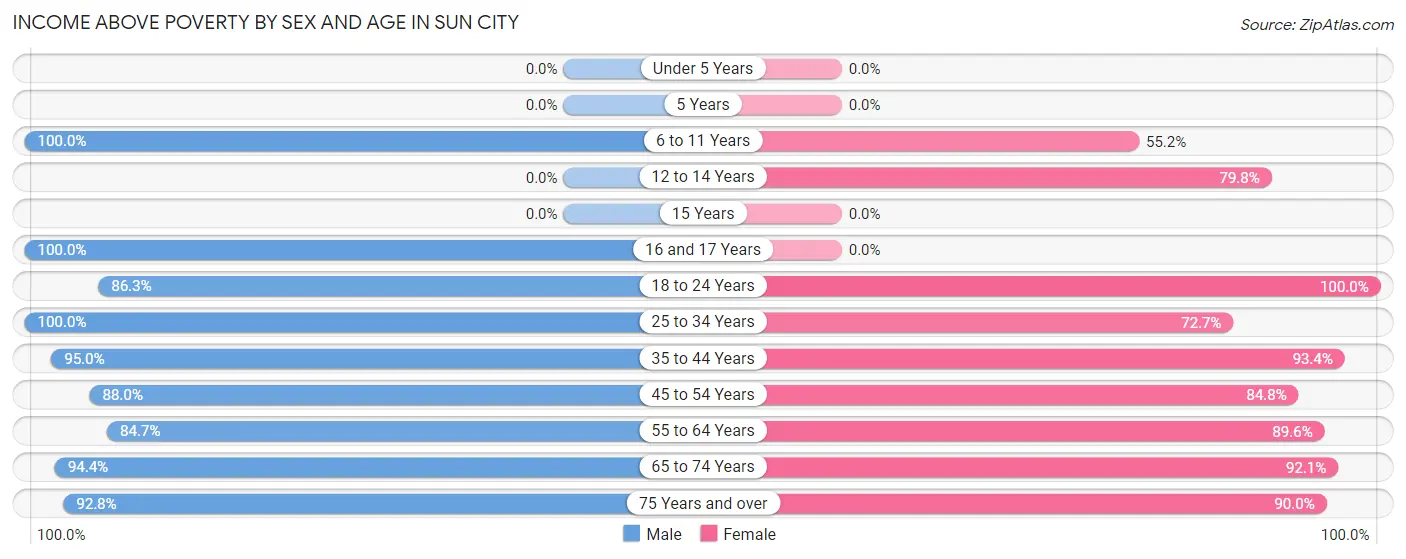
| Age Bracket | Male | Female |
| Under 5 Years | 0 (0.0%) | 0 (0.0%) |
| 5 Years | 0 (0.0%) | 0 (0.0%) |
| 6 to 11 Years | 48 (100.0%) | 48 (55.2%) |
| 12 to 14 Years | 0 (0.0%) | 67 (79.8%) |
| 15 Years | 0 (0.0%) | 0 (0.0%) |
| 16 and 17 Years | 21 (100.0%) | 0 (0.0%) |
| 18 to 24 Years | 145 (86.3%) | 185 (100.0%) |
| 25 to 34 Years | 273 (100.0%) | 117 (72.7%) |
| 35 to 44 Years | 325 (95.0%) | 323 (93.3%) |
| 45 to 54 Years | 489 (87.9%) | 562 (84.8%) |
| 55 to 64 Years | 2,173 (84.7%) | 3,288 (89.6%) |
| 65 to 74 Years | 5,080 (94.4%) | 7,105 (92.1%) |
| 75 Years and over | 5,752 (92.8%) | 7,875 (90.0%) |
| Total | 14,306 (91.7%) | 19,570 (90.3%) |
Income Below Poverty Among Married-Couple Families in Sun City
The poverty statistics for married-couple families in Sun City show that 5.6% or 549 of the total 9,832 families live below the poverty line. Families with 3 or 4 children have the highest poverty rate of 100.0%, comprising of 20 families. On the other hand, families with no children have the lowest poverty rate of 5.3%, which includes 512 families.
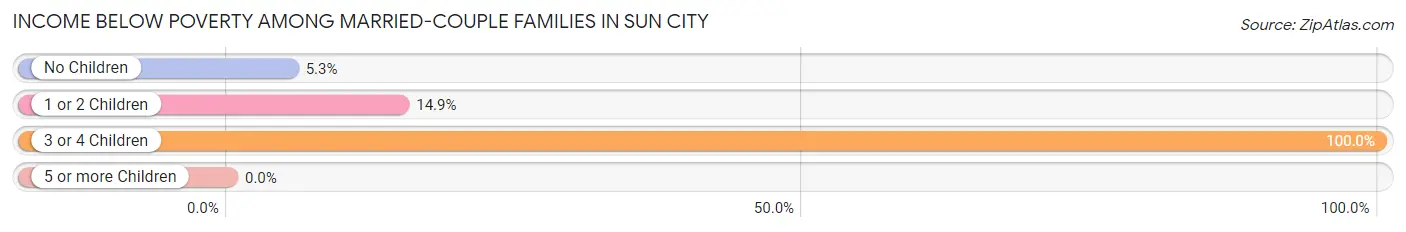
| Children | Above Poverty | Below Poverty |
| No Children | 9,186 (94.7%) | 512 (5.3%) |
| 1 or 2 Children | 97 (85.1%) | 17 (14.9%) |
| 3 or 4 Children | 0 (0.0%) | 20 (100.0%) |
| 5 or more Children | 0 (0.0%) | 0 (0.0%) |
| Total | 9,283 (94.4%) | 549 (5.6%) |
Income Below Poverty Among Single-Parent Households in Sun City
According to the poverty data in Sun City, 5.9% or 17 single-father households and 2.2% or 23 single-mother households are living below the poverty line. Among single-father households, those with 1 or 2 children have the highest poverty rate, with 17 households (53.1%) experiencing poverty. Likewise, among single-mother households, those with no children have the highest poverty rate, with 23 households (2.3%) falling below the poverty line.
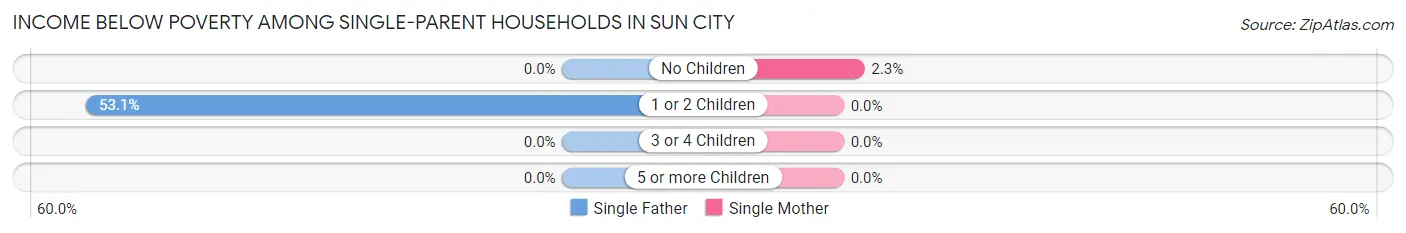
| Children | Single Father | Single Mother |
| No Children | 0 (0.0%) | 23 (2.3%) |
| 1 or 2 Children | 17 (53.1%) | 0 (0.0%) |
| 3 or 4 Children | 0 (0.0%) | 0 (0.0%) |
| 5 or more Children | 0 (0.0%) | 0 (0.0%) |
| Total | 17 (5.9%) | 23 (2.2%) |
Income Below Poverty Among Married-Couple vs Single-Parent Households in Sun City
The poverty data for Sun City shows that 549 of the married-couple family households (5.6%) and 40 of the single-parent households (3.0%) are living below the poverty level. Within the married-couple family households, those with 3 or 4 children have the highest poverty rate, with 20 households (100.0%) falling below the poverty line. Among the single-parent households, those with 1 or 2 children have the highest poverty rate, with 17 household (23.3%) living below poverty.
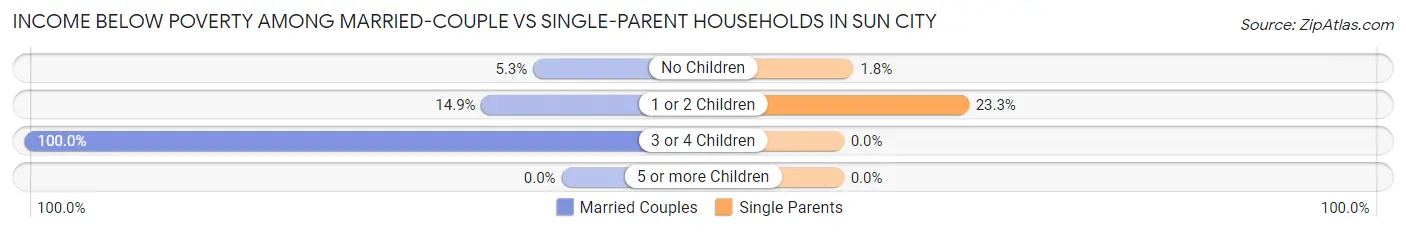
| Children | Married-Couple Families | Single-Parent Households |
| No Children | 512 (5.3%) | 23 (1.8%) |
| 1 or 2 Children | 17 (14.9%) | 17 (23.3%) |
| 3 or 4 Children | 20 (100.0%) | 0 (0.0%) |
| 5 or more Children | 0 (0.0%) | 0 (0.0%) |
| Total | 549 (5.6%) | 40 (3.0%) |
Race in Sun City
The most populous races in Sun City are White / Caucasian (34,770 | 92.1%), Hispanic or Latino (2,063 | 5.5%), and Two or more Races (1,533 | 4.1%).
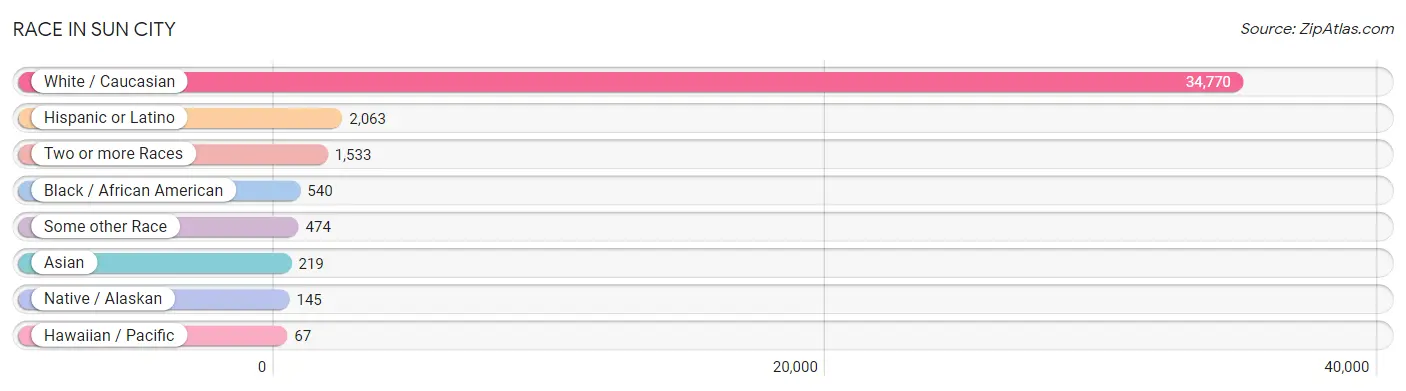
| Race | # Population | % Population |
| Asian | 219 | 0.6% |
| Black / African American | 540 | 1.4% |
| Hawaiian / Pacific | 67 | 0.2% |
| Hispanic or Latino | 2,063 | 5.5% |
| Native / Alaskan | 145 | 0.4% |
| White / Caucasian | 34,770 | 92.1% |
| Two or more Races | 1,533 | 4.1% |
| Some other Race | 474 | 1.3% |
| Total | 37,748 | 100.0% |
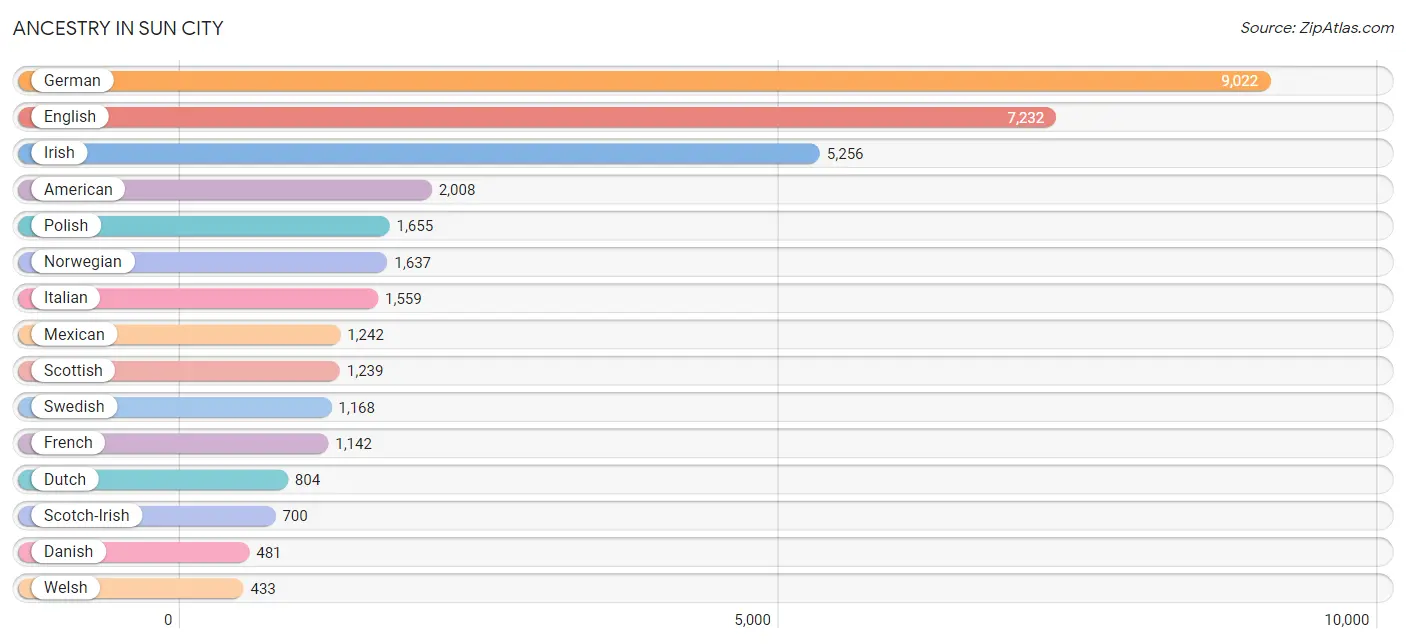
Ancestry in Sun City
The most populous ancestries reported in Sun City are German (9,022 | 23.9%), English (7,232 | 19.2%), Irish (5,256 | 13.9%), American (2,008 | 5.3%), and Polish (1,655 | 4.4%), together accounting for 66.7% of all Sun City residents.
| Ancestry | # Population | % Population |
| African | 11 | 0.0% |
| Aleut | 7 | 0.0% |
| Alsatian | 12 | 0.0% |
| American | 2,008 | 5.3% |
| Apache | 34 | 0.1% |
| Arab | 253 | 0.7% |
| Armenian | 15 | 0.0% |
| Australian | 15 | 0.0% |
| Austrian | 138 | 0.4% |
| Belgian | 87 | 0.2% |
| Bhutanese | 73 | 0.2% |
| British | 321 | 0.9% |
| Burmese | 51 | 0.1% |
| Canadian | 220 | 0.6% |
| Central American | 52 | 0.1% |
| Cherokee | 27 | 0.1% |
| Chippewa | 120 | 0.3% |
| Choctaw | 6 | 0.0% |
| Croatian | 50 | 0.1% |
| Cuban | 46 | 0.1% |
| Czech | 225 | 0.6% |
| Czechoslovakian | 118 | 0.3% |
| Danish | 481 | 1.3% |
| Dutch | 804 | 2.1% |
| Eastern European | 171 | 0.4% |
| English | 7,232 | 19.2% |
| European | 414 | 1.1% |
| Finnish | 236 | 0.6% |
| French | 1,142 | 3.0% |
| French Canadian | 404 | 1.1% |
| German | 9,022 | 23.9% |
| Greek | 148 | 0.4% |
| Guamanian / Chamorro | 16 | 0.0% |
| Haitian | 20 | 0.1% |
| Hungarian | 249 | 0.7% |
| Icelander | 15 | 0.0% |
| Indian (Asian) | 48 | 0.1% |
| Indonesian | 27 | 0.1% |
| Iraqi | 17 | 0.1% |
| Irish | 5,256 | 13.9% |
| Iroquois | 40 | 0.1% |
| Italian | 1,559 | 4.1% |
| Jordanian | 109 | 0.3% |
| Korean | 112 | 0.3% |
| Latvian | 9 | 0.0% |
| Lithuanian | 293 | 0.8% |
| Luxembourger | 11 | 0.0% |
| Macedonian | 15 | 0.0% |
| Mexican | 1,242 | 3.3% |
| Native Hawaiian | 51 | 0.1% |
| Navajo | 6 | 0.0% |
| Northern European | 167 | 0.4% |
| Norwegian | 1,637 | 4.3% |
| Panamanian | 37 | 0.1% |
| Pennsylvania German | 16 | 0.0% |
| Pima | 21 | 0.1% |
| Polish | 1,655 | 4.4% |
| Portuguese | 56 | 0.2% |
| Pueblo | 22 | 0.1% |
| Puerto Rican | 223 | 0.6% |
| Romanian | 133 | 0.4% |
| Russian | 343 | 0.9% |
| Salvadoran | 15 | 0.0% |
| Scandinavian | 117 | 0.3% |
| Scotch-Irish | 700 | 1.8% |
| Scottish | 1,239 | 3.3% |
| Serbian | 13 | 0.0% |
| Sioux | 8 | 0.0% |
| Slavic | 28 | 0.1% |
| Slovak | 138 | 0.4% |
| Slovene | 58 | 0.2% |
| South African | 9 | 0.0% |
| Spaniard | 95 | 0.3% |
| Spanish | 170 | 0.4% |
| Subsaharan African | 20 | 0.1% |
| Swedish | 1,168 | 3.1% |
| Swiss | 192 | 0.5% |
| Ukrainian | 284 | 0.7% |
| Welsh | 433 | 1.1% |
| Yugoslavian | 47 | 0.1% |
| Yup'ik | 10 | 0.0% | View All 81 Rows |
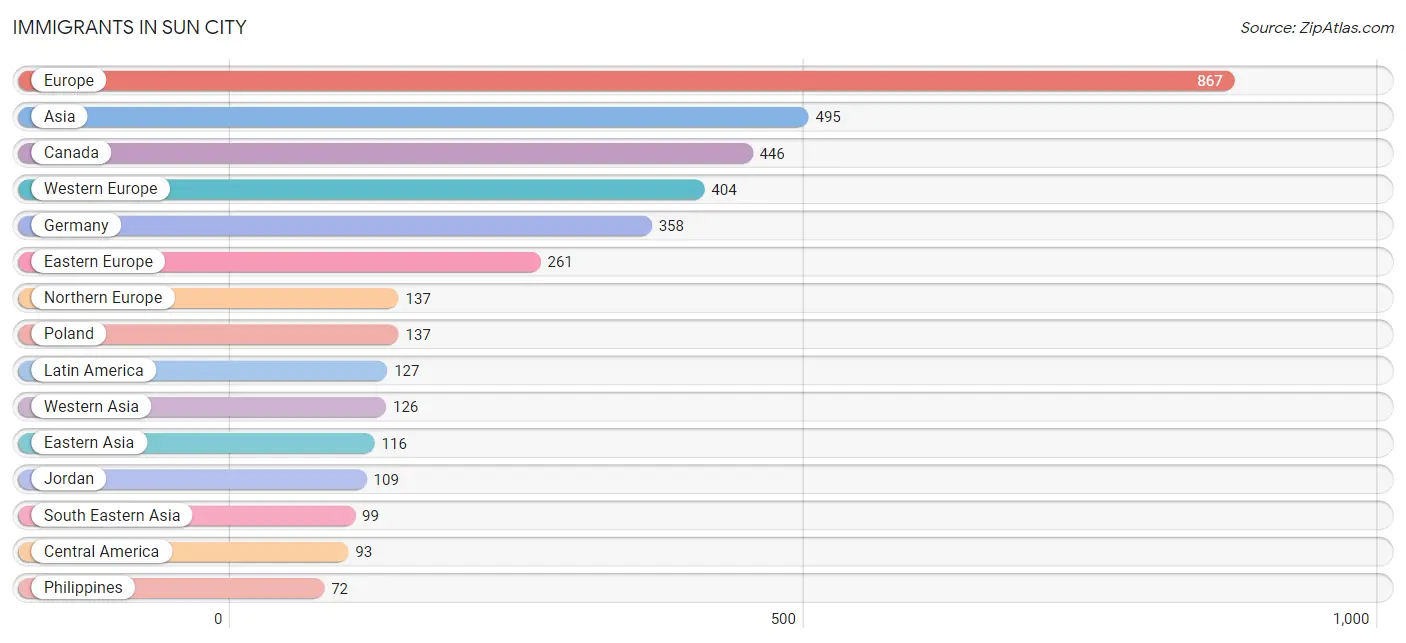
Immigrants in Sun City
The most numerous immigrant groups reported in Sun City came from Europe (867 | 2.3%), Asia (495 | 1.3%), Canada (446 | 1.2%), Western Europe (404 | 1.1%), and Germany (358 | 0.9%), together accounting for 6.8% of all Sun City residents.
| Immigration Origin | # Population | % Population |
| Africa | 28 | 0.1% |
| Argentina | 14 | 0.0% |
| Asia | 495 | 1.3% |
| Australia | 15 | 0.0% |
| Austria | 15 | 0.0% |
| Belgium | 15 | 0.0% |
| Belize | 18 | 0.1% |
| Canada | 446 | 1.2% |
| Caribbean | 20 | 0.1% |
| Central America | 93 | 0.3% |
| China | 48 | 0.1% |
| Eastern Asia | 116 | 0.3% |
| Eastern Europe | 261 | 0.7% |
| El Salvador | 15 | 0.0% |
| England | 46 | 0.1% |
| Europe | 867 | 2.3% |
| France | 16 | 0.0% |
| Germany | 358 | 0.9% |
| Haiti | 20 | 0.1% |
| Hungary | 28 | 0.1% |
| Iraq | 17 | 0.1% |
| Ireland | 17 | 0.1% |
| Italy | 65 | 0.2% |
| Japan | 17 | 0.1% |
| Jordan | 109 | 0.3% |
| Kazakhstan | 45 | 0.1% |
| Korea | 51 | 0.1% |
| Latin America | 127 | 0.3% |
| Mexico | 60 | 0.2% |
| Northern Africa | 12 | 0.0% |
| Northern Europe | 137 | 0.4% |
| Oceania | 15 | 0.0% |
| Philippines | 72 | 0.2% |
| Poland | 137 | 0.4% |
| Romania | 39 | 0.1% |
| Russia | 57 | 0.2% |
| Scotland | 8 | 0.0% |
| Senegal | 16 | 0.0% |
| South America | 14 | 0.0% |
| South Central Asia | 45 | 0.1% |
| South Eastern Asia | 99 | 0.3% |
| Southern Europe | 65 | 0.2% |
| Sweden | 18 | 0.1% |
| Taiwan | 16 | 0.0% |
| Western Africa | 16 | 0.0% |
| Western Asia | 126 | 0.3% |
| Western Europe | 404 | 1.1% | View All 47 Rows |
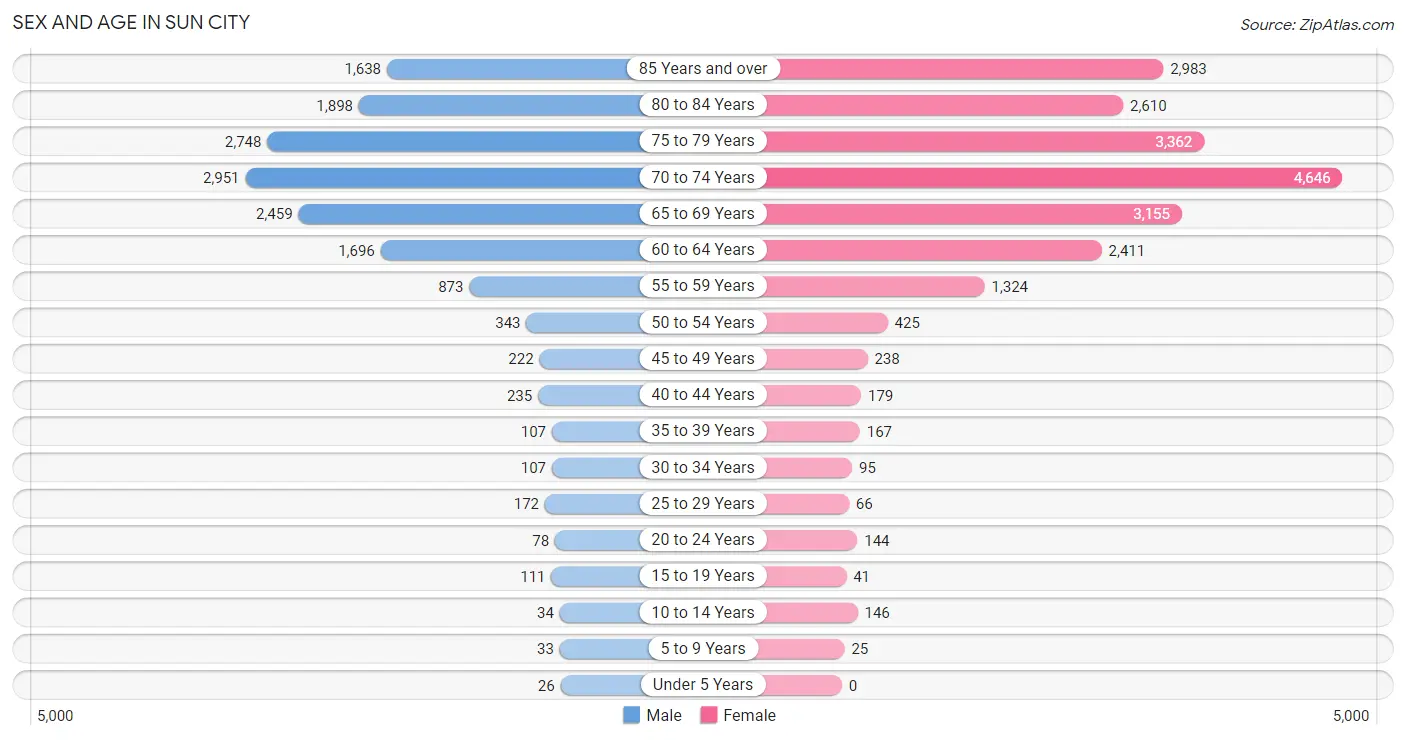
Sex and Age in Sun City
Sex and Age in Sun City
The most populous age groups in Sun City are 70 to 74 Years (2,951 | 18.8%) for men and 70 to 74 Years (4,646 | 21.1%) for women.
| Age Bracket | Male | Female |
| Under 5 Years | 26 (0.2%) | 0 (0.0%) |
| 5 to 9 Years | 33 (0.2%) | 25 (0.1%) |
| 10 to 14 Years | 34 (0.2%) | 146 (0.7%) |
| 15 to 19 Years | 111 (0.7%) | 41 (0.2%) |
| 20 to 24 Years | 78 (0.5%) | 144 (0.6%) |
| 25 to 29 Years | 172 (1.1%) | 66 (0.3%) |
| 30 to 34 Years | 107 (0.7%) | 95 (0.4%) |
| 35 to 39 Years | 107 (0.7%) | 167 (0.8%) |
| 40 to 44 Years | 235 (1.5%) | 179 (0.8%) |
| 45 to 49 Years | 222 (1.4%) | 238 (1.1%) |
| 50 to 54 Years | 343 (2.2%) | 425 (1.9%) |
| 55 to 59 Years | 873 (5.6%) | 1,324 (6.0%) |
| 60 to 64 Years | 1,696 (10.8%) | 2,411 (11.0%) |
| 65 to 69 Years | 2,459 (15.6%) | 3,155 (14.3%) |
| 70 to 74 Years | 2,951 (18.8%) | 4,646 (21.1%) |
| 75 to 79 Years | 2,748 (17.5%) | 3,362 (15.3%) |
| 80 to 84 Years | 1,898 (12.1%) | 2,610 (11.8%) |
| 85 Years and over | 1,638 (10.4%) | 2,983 (13.6%) |
| Total | 15,731 (100.0%) | 22,017 (100.0%) |
Families and Households in Sun City
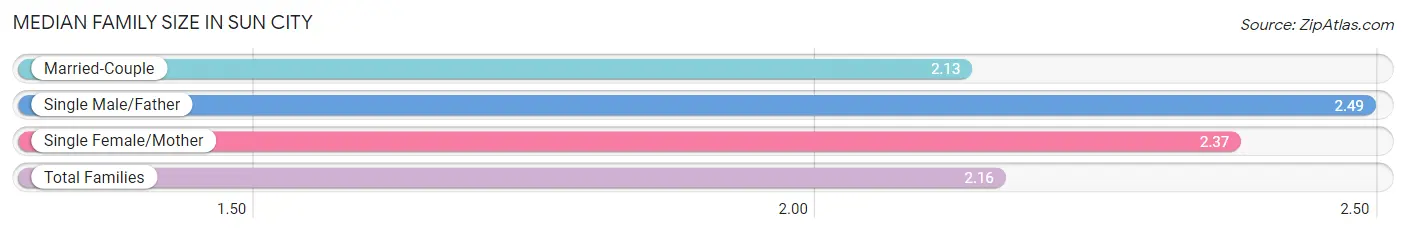
Median Family Size in Sun City
The median family size in Sun City is 2.16 persons per family, with single male/father families (288 | 2.6%) accounting for the largest median family size of 2.49 persons per family. On the other hand, married-couple families (9,832 | 88.2%) represent the smallest median family size with 2.13 persons per family.
| Family Type | # Families | Family Size |
| Married-Couple | 9,832 (88.2%) | 2.13 |
| Single Male/Father | 288 (2.6%) | 2.49 |
| Single Female/Mother | 1,033 (9.3%) | 2.37 |
| Total Families | 11,153 (100.0%) | 2.16 |
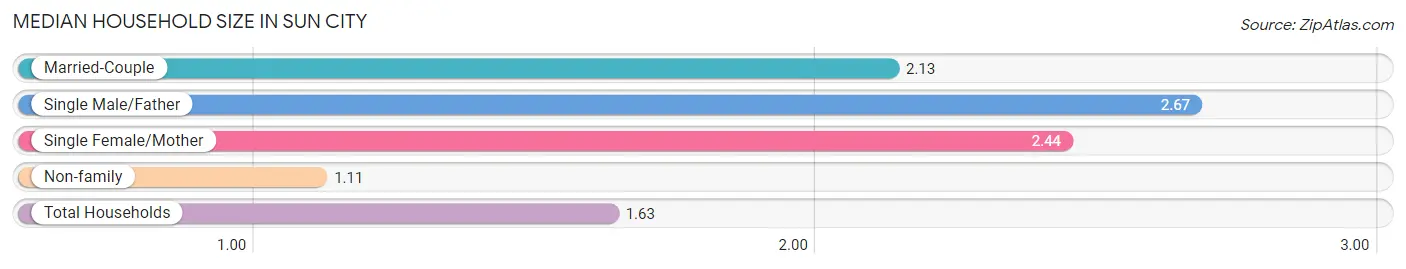
Median Household Size in Sun City
The median household size in Sun City is 1.63 persons per household, with single male/father households (288 | 1.3%) accounting for the largest median household size of 2.67 persons per household. non-family households (11,736 | 51.3%) represent the smallest median household size with 1.11 persons per household.
| Household Type | # Households | Household Size |
| Married-Couple | 9,832 (43.0%) | 2.13 |
| Single Male/Father | 288 (1.3%) | 2.67 |
| Single Female/Mother | 1,033 (4.5%) | 2.44 |
| Non-family | 11,736 (51.3%) | 1.11 |
| Total Households | 22,889 (100.0%) | 1.63 |
Household Size by Marriage Status in Sun City
Out of a total of 22,889 households in Sun City, 11,153 (48.7%) are family households, while 11,736 (51.3%) are nonfamily households. The most numerous type of family households are 2-person households, comprising 10,004, and the most common type of nonfamily households are 1-person households, comprising 10,557.
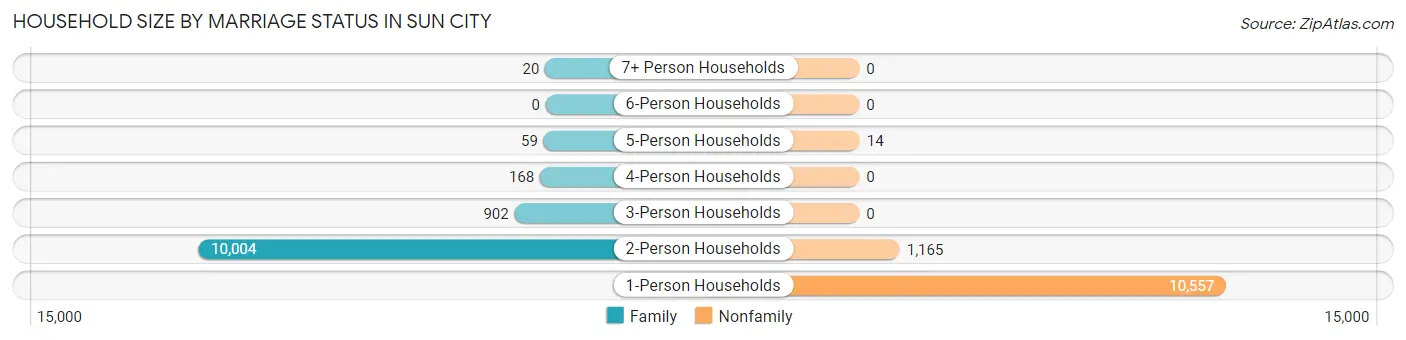
| Household Size | Family Households | Nonfamily Households |
| 1-Person Households | - | 10,557 (46.1%) |
| 2-Person Households | 10,004 (43.7%) | 1,165 (5.1%) |
| 3-Person Households | 902 (3.9%) | 0 (0.0%) |
| 4-Person Households | 168 (0.7%) | 0 (0.0%) |
| 5-Person Households | 59 (0.3%) | 14 (0.1%) |
| 6-Person Households | 0 (0.0%) | 0 (0.0%) |
| 7+ Person Households | 20 (0.1%) | 0 (0.0%) |
| Total | 11,153 (48.7%) | 11,736 (51.3%) |
Female Fertility in Sun City
Fertility by Age in Sun City
Average fertility rate in Sun City is 16.0 births per 1,000 women. Women in the age bracket of 20 to 34 years have the highest fertility rate with 56.0 births per 1,000 women. Women in the age bracket of 20 to 34 years acount for 100.0% of all women with births.
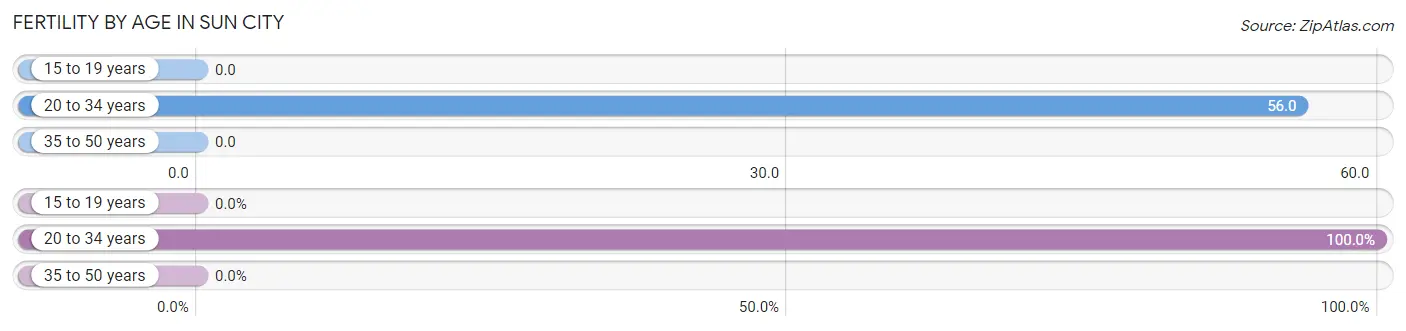
| Age Bracket | Women with Births | Births / 1,000 Women |
| 15 to 19 years | 0 (0.0%) | 0.0 |
| 20 to 34 years | 17 (100.0%) | 56.0 |
| 35 to 50 years | 0 (0.0%) | 0.0 |
| Total | 17 (100.0%) | 16.0 |
Fertility by Age by Marriage Status in Sun City
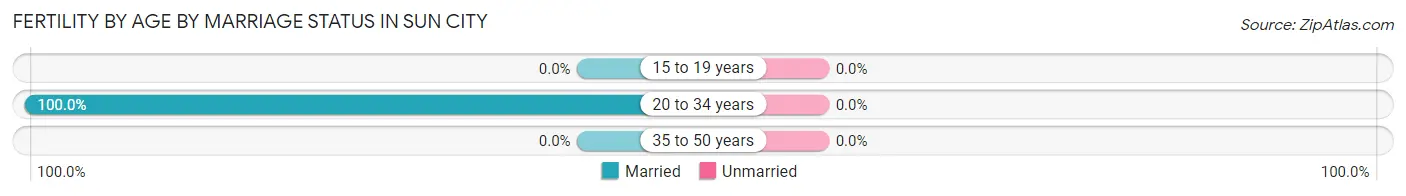
| Age Bracket | Married | Unmarried |
| 15 to 19 years | 0 (0.0%) | 0 (0.0%) |
| 20 to 34 years | 17 (100.0%) | 0 (0.0%) |
| 35 to 50 years | 0 (0.0%) | 0 (0.0%) |
| Total | 17 (100.0%) | 0 (0.0%) |
Fertility by Education in Sun City
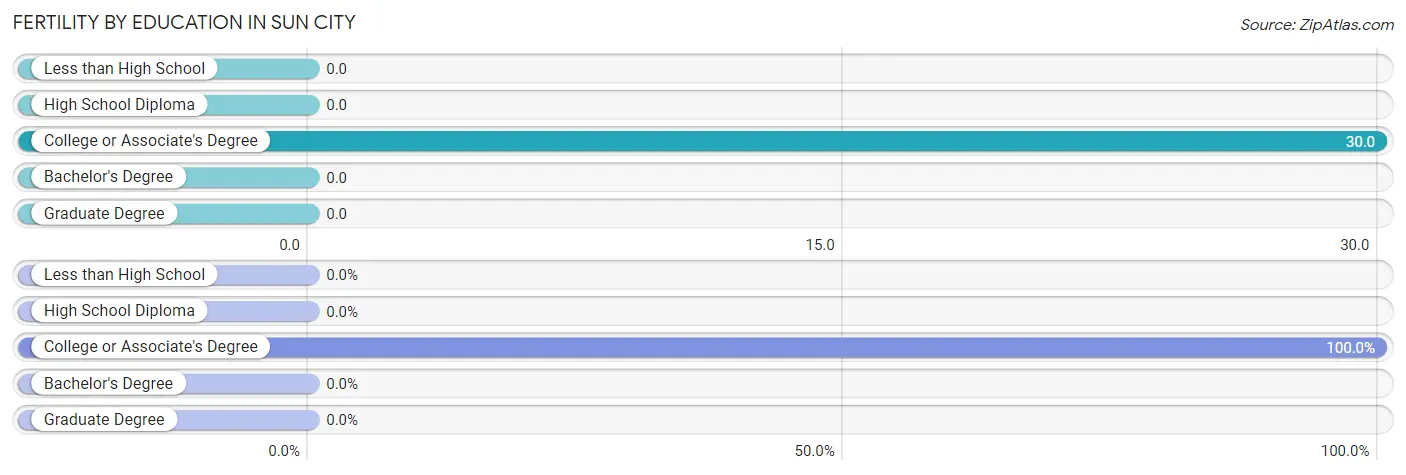
| Educational Attainment | Women with Births | Births / 1,000 Women |
| Less than High School | 0 (0.0%) | 0.0 |
| High School Diploma | 0 (0.0%) | 0.0 |
| College or Associate's Degree | 17 (100.0%) | 30.0 |
| Bachelor's Degree | 0 (0.0%) | 0.0 |
| Graduate Degree | 0 (0.0%) | 0.0 |
| Total | 17 (100.0%) | 16.0 |
Fertility by Education by Marriage Status in Sun City
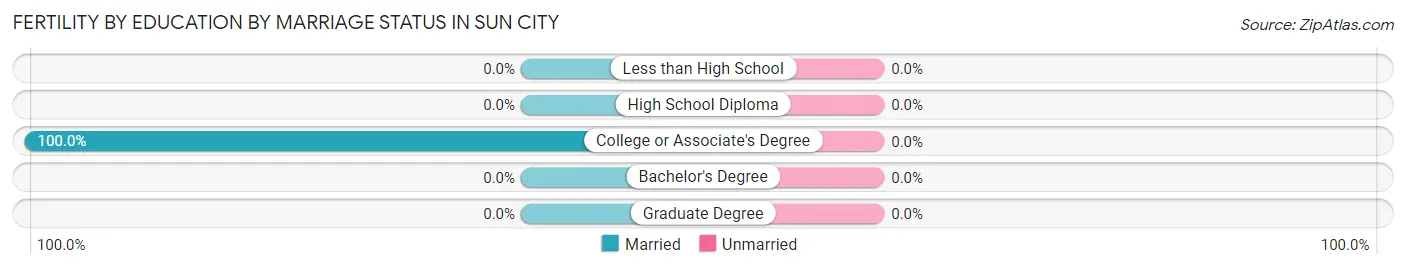
| Educational Attainment | Married | Unmarried |
| Less than High School | 0 (0.0%) | 0 (0.0%) |
| High School Diploma | 0 (0.0%) | 0 (0.0%) |
| College or Associate's Degree | 17 (100.0%) | 0 (0.0%) |
| Bachelor's Degree | 0 (0.0%) | 0 (0.0%) |
| Graduate Degree | 0 (0.0%) | 0 (0.0%) |
| Total | 17 (100.0%) | 0 (0.0%) |
Employment Characteristics in Sun City
Employment by Class of Employer in Sun City
Among the 6,462 employed individuals in Sun City, private company employees (4,380 | 67.8%), not-for-profit organizations (836 | 12.9%), and self-employed (not incorporated) (546 | 8.5%) make up the most common classes of employment.
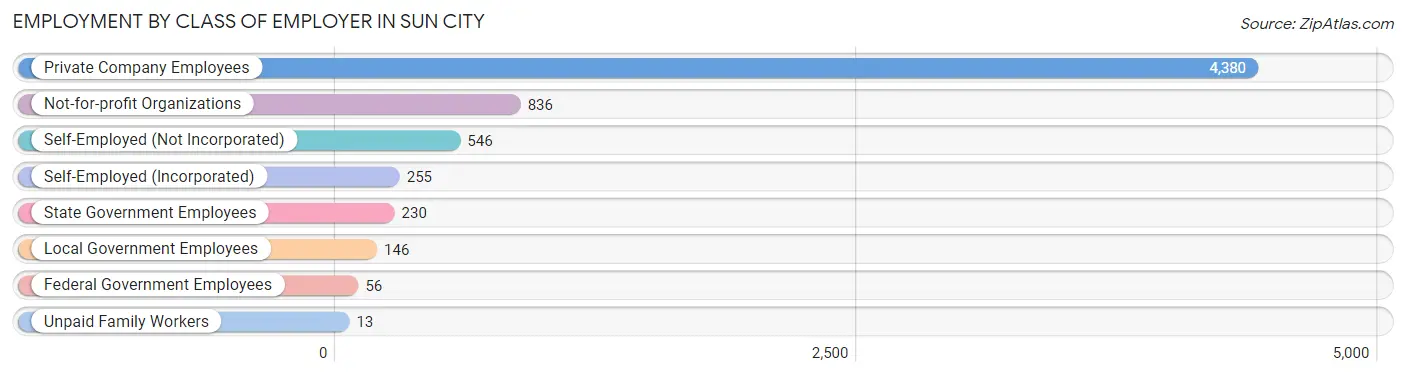
| Employer Class | # Employees | % Employees |
| Private Company Employees | 4,380 | 67.8% |
| Self-Employed (Incorporated) | 255 | 4.0% |
| Self-Employed (Not Incorporated) | 546 | 8.5% |
| Not-for-profit Organizations | 836 | 12.9% |
| Local Government Employees | 146 | 2.3% |
| State Government Employees | 230 | 3.6% |
| Federal Government Employees | 56 | 0.9% |
| Unpaid Family Workers | 13 | 0.2% |
| Total | 6,462 | 100.0% |
Employment Status by Age in Sun City
According to the labor force statistics for Sun City, out of the total population over 16 years of age (37,484), 18.8% or 7,047 individuals are in the labor force, with 5.7% or 402 of them unemployed. The age group with the highest labor force participation rate is 30 to 34 years, with 90.6% or 183 individuals in the labor force. Within the labor force, the 20 to 24 years age range has the highest percentage of unemployed individuals, with 32.7% or 50 of them being unemployed.
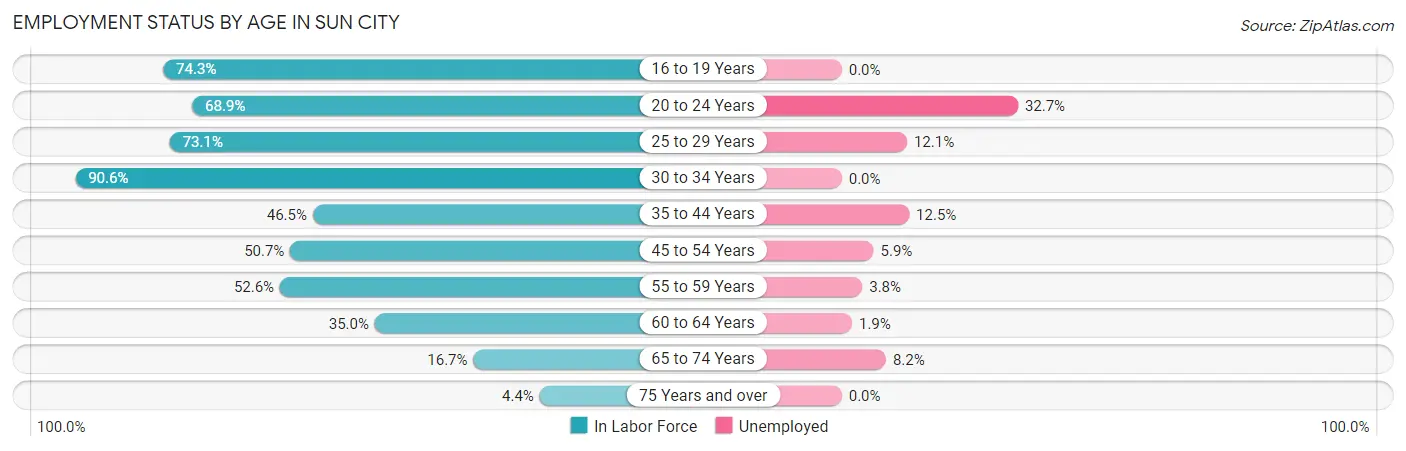
| Age Bracket | In Labor Force | Unemployed |
| 16 to 19 Years | 113 (74.3%) | 0 (0.0%) |
| 20 to 24 Years | 153 (68.9%) | 50 (32.7%) |
| 25 to 29 Years | 174 (73.1%) | 21 (12.1%) |
| 30 to 34 Years | 183 (90.6%) | 0 (0.0%) |
| 35 to 44 Years | 320 (46.5%) | 40 (12.5%) |
| 45 to 54 Years | 623 (50.7%) | 37 (5.9%) |
| 55 to 59 Years | 1,156 (52.6%) | 44 (3.8%) |
| 60 to 64 Years | 1,437 (35.0%) | 27 (1.9%) |
| 65 to 74 Years | 2,206 (16.7%) | 181 (8.2%) |
| 75 Years and over | 671 (4.4%) | 0 (0.0%) |
| Total | 7,047 (18.8%) | 402 (5.7%) |
Employment Status by Educational Attainment in Sun City
According to labor force statistics for Sun City, 44.9% of individuals (3,888) out of the total population between 25 and 64 years of age (8,660) are in the labor force, with 4.3% or 167 of them being unemployed. The group with the highest labor force participation rate are those with the educational attainment of bachelor's degree or higher, with 57.6% or 965 individuals in the labor force. Within the labor force, individuals with less than high school education have the highest percentage of unemployment, with 11.3% or 17 of them being unemployed.
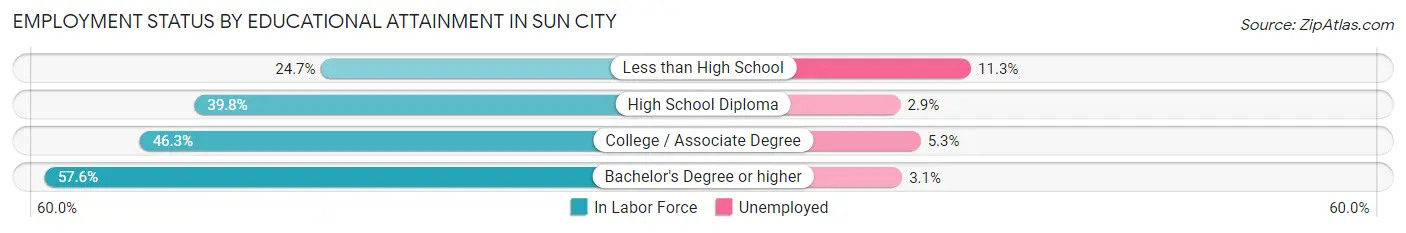
| Educational Attainment | In Labor Force | Unemployed |
| Less than High School | 151 (24.7%) | 69 (11.3%) |
| High School Diploma | 1,064 (39.8%) | 78 (2.9%) |
| College / Associate Degree | 1,713 (46.3%) | 196 (5.3%) |
| Bachelor's Degree or higher | 965 (57.6%) | 52 (3.1%) |
| Total | 3,888 (44.9%) | 372 (4.3%) |
Employment Occupations by Sex in Sun City
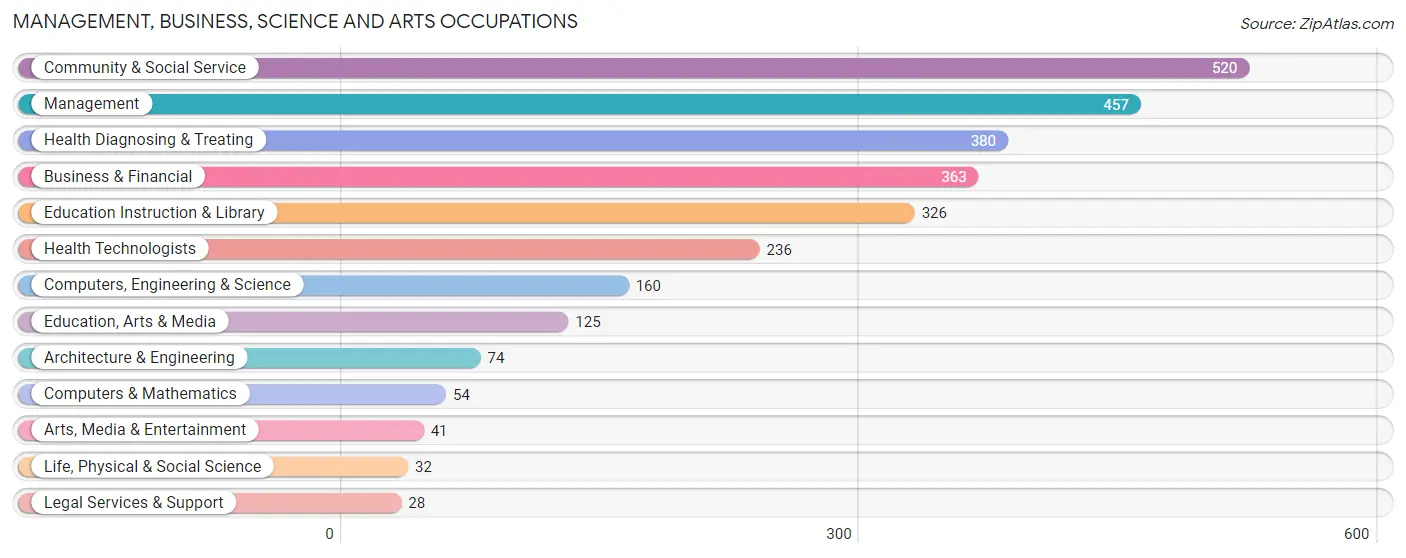
Management, Business, Science and Arts Occupations
The most common Management, Business, Science and Arts occupations in Sun City are Community & Social Service (520 | 7.8%), Management (457 | 6.9%), Health Diagnosing & Treating (380 | 5.7%), Business & Financial (363 | 5.5%), and Education Instruction & Library (326 | 4.9%).
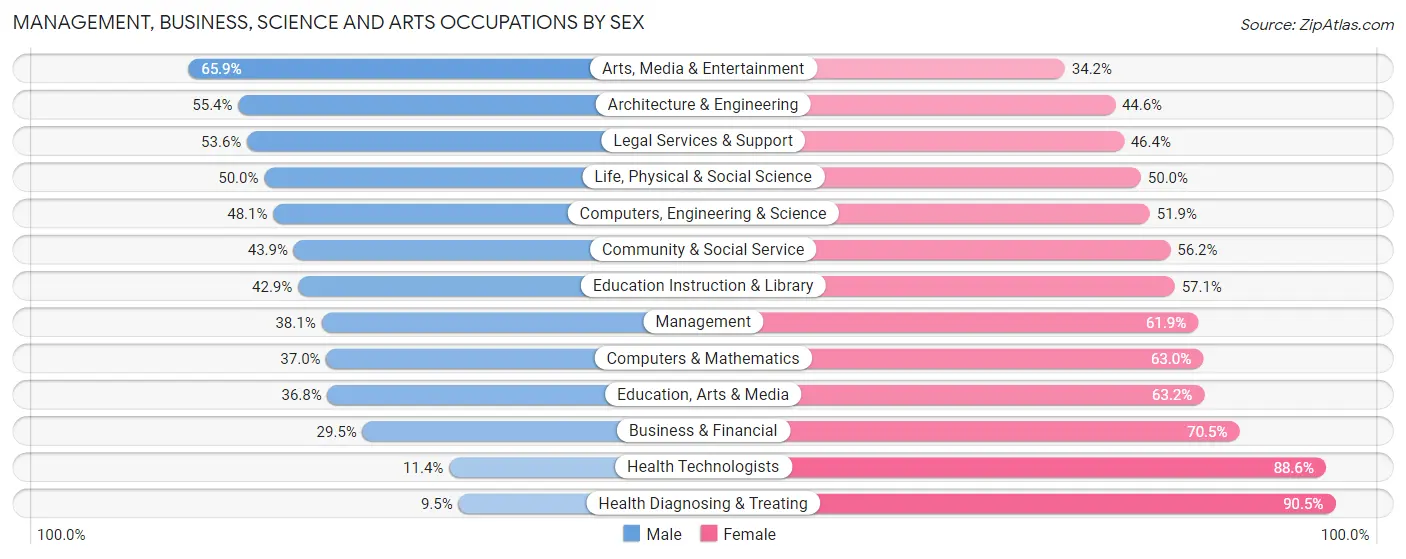
Management, Business, Science and Arts Occupations by Sex
Within the Management, Business, Science and Arts occupations in Sun City, the most male-oriented occupations are Arts, Media & Entertainment (65.8%), Architecture & Engineering (55.4%), and Legal Services & Support (53.6%), while the most female-oriented occupations are Health Diagnosing & Treating (90.5%), Health Technologists (88.6%), and Business & Financial (70.5%).
| Occupation | Male | Female |
| Management | 174 (38.1%) | 283 (61.9%) |
| Business & Financial | 107 (29.5%) | 256 (70.5%) |
| Computers, Engineering & Science | 77 (48.1%) | 83 (51.9%) |
| Computers & Mathematics | 20 (37.0%) | 34 (63.0%) |
| Architecture & Engineering | 41 (55.4%) | 33 (44.6%) |
| Life, Physical & Social Science | 16 (50.0%) | 16 (50.0%) |
| Community & Social Service | 228 (43.9%) | 292 (56.1%) |
| Education, Arts & Media | 46 (36.8%) | 79 (63.2%) |
| Legal Services & Support | 15 (53.6%) | 13 (46.4%) |
| Education Instruction & Library | 140 (42.9%) | 186 (57.1%) |
| Arts, Media & Entertainment | 27 (65.8%) | 14 (34.2%) |
| Health Diagnosing & Treating | 36 (9.5%) | 344 (90.5%) |
| Health Technologists | 27 (11.4%) | 209 (88.6%) |
| Total (Category) | 622 (33.1%) | 1,258 (66.9%) |
| Total (Overall) | 3,005 (45.3%) | 3,635 (54.7%) |
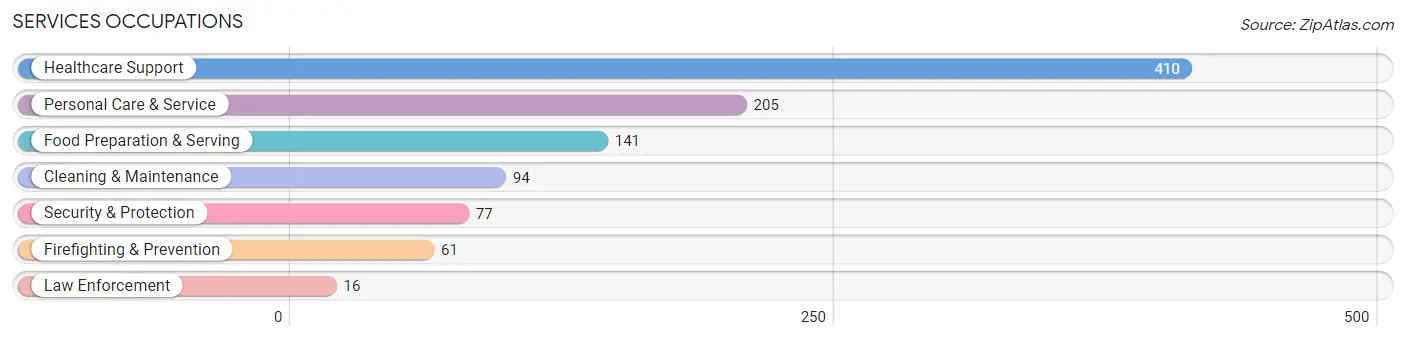
Services Occupations
The most common Services occupations in Sun City are Healthcare Support (410 | 6.2%), Personal Care & Service (205 | 3.1%), Food Preparation & Serving (141 | 2.1%), Cleaning & Maintenance (94 | 1.4%), and Security & Protection (77 | 1.2%).
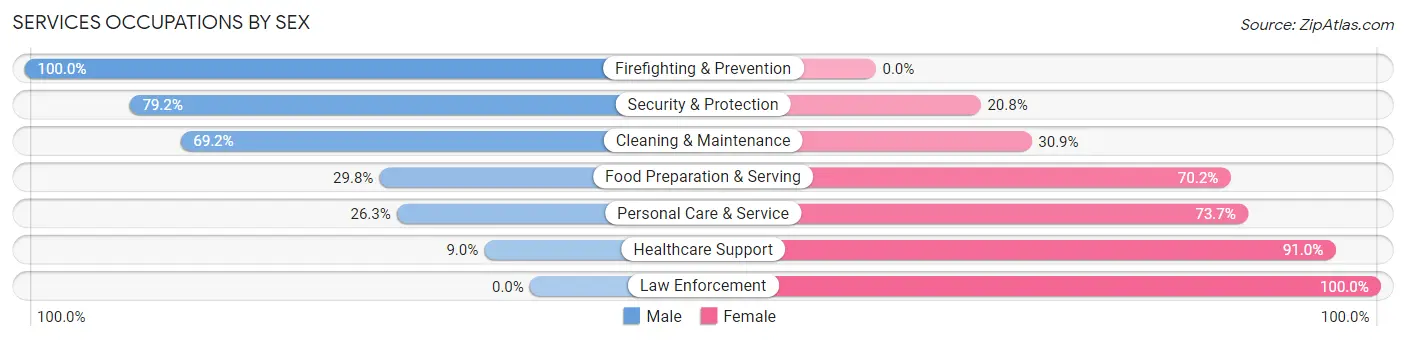
Services Occupations by Sex
Within the Services occupations in Sun City, the most male-oriented occupations are Firefighting & Prevention (100.0%), Security & Protection (79.2%), and Cleaning & Maintenance (69.2%), while the most female-oriented occupations are Law Enforcement (100.0%), Healthcare Support (91.0%), and Personal Care & Service (73.7%).
| Occupation | Male | Female |
| Healthcare Support | 37 (9.0%) | 373 (91.0%) |
| Security & Protection | 61 (79.2%) | 16 (20.8%) |
| Firefighting & Prevention | 61 (100.0%) | 0 (0.0%) |
| Law Enforcement | 0 (0.0%) | 16 (100.0%) |
| Food Preparation & Serving | 42 (29.8%) | 99 (70.2%) |
| Cleaning & Maintenance | 65 (69.2%) | 29 (30.8%) |
| Personal Care & Service | 54 (26.3%) | 151 (73.7%) |
| Total (Category) | 259 (27.9%) | 668 (72.1%) |
| Total (Overall) | 3,005 (45.3%) | 3,635 (54.7%) |
Sales and Office Occupations
The most common Sales and Office occupations in Sun City are Sales & Related (1,212 | 18.2%), and Office & Administration (1,165 | 17.5%).
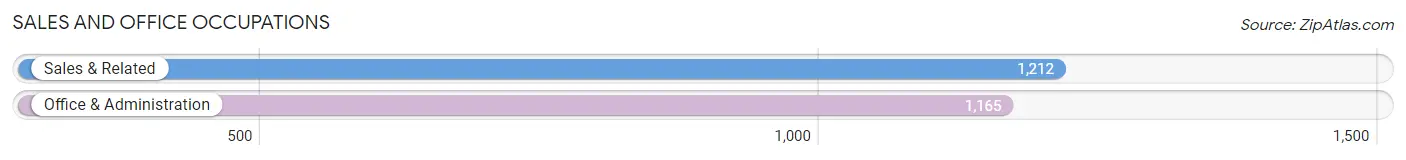
Sales and Office Occupations by Sex
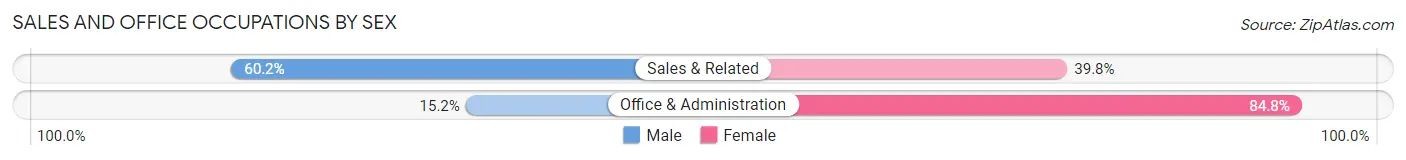
| Occupation | Male | Female |
| Sales & Related | 730 (60.2%) | 482 (39.8%) |
| Office & Administration | 177 (15.2%) | 988 (84.8%) |
| Total (Category) | 907 (38.2%) | 1,470 (61.8%) |
| Total (Overall) | 3,005 (45.3%) | 3,635 (54.7%) |
Natural Resources, Construction and Maintenance Occupations
The most common Natural Resources, Construction and Maintenance occupations in Sun City are Construction & Extraction (267 | 4.0%), Installation, Maintenance & Repair (258 | 3.9%), and Farming, Fishing & Forestry (62 | 0.9%).
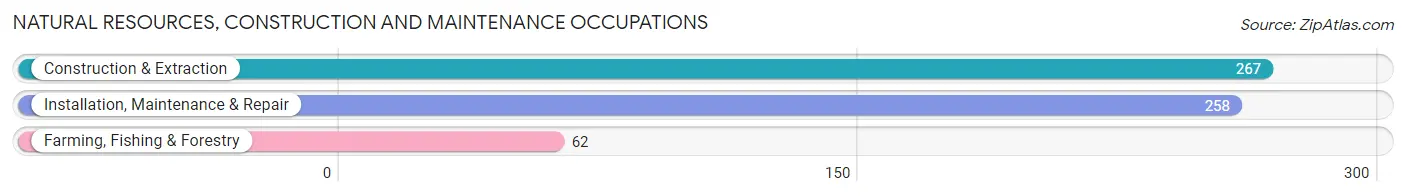
Natural Resources, Construction and Maintenance Occupations by Sex
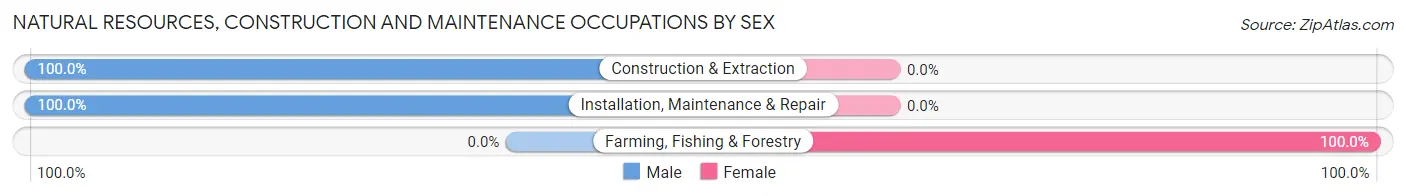
| Occupation | Male | Female |
| Farming, Fishing & Forestry | 0 (0.0%) | 62 (100.0%) |
| Construction & Extraction | 267 (100.0%) | 0 (0.0%) |
| Installation, Maintenance & Repair | 258 (100.0%) | 0 (0.0%) |
| Total (Category) | 525 (89.4%) | 62 (10.6%) |
| Total (Overall) | 3,005 (45.3%) | 3,635 (54.7%) |
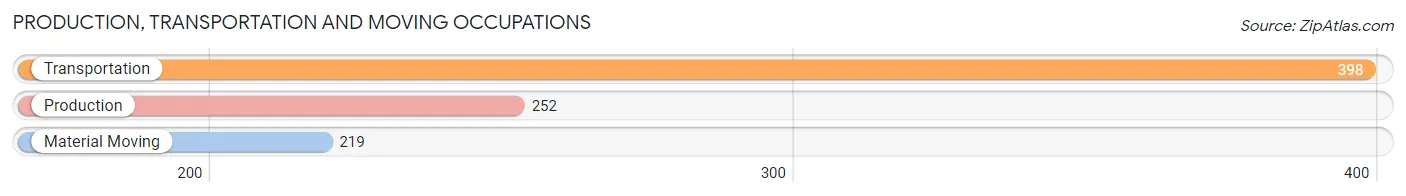
Production, Transportation and Moving Occupations
The most common Production, Transportation and Moving occupations in Sun City are Transportation (398 | 6.0%), Production (252 | 3.8%), and Material Moving (219 | 3.3%).
Production, Transportation and Moving Occupations by Sex
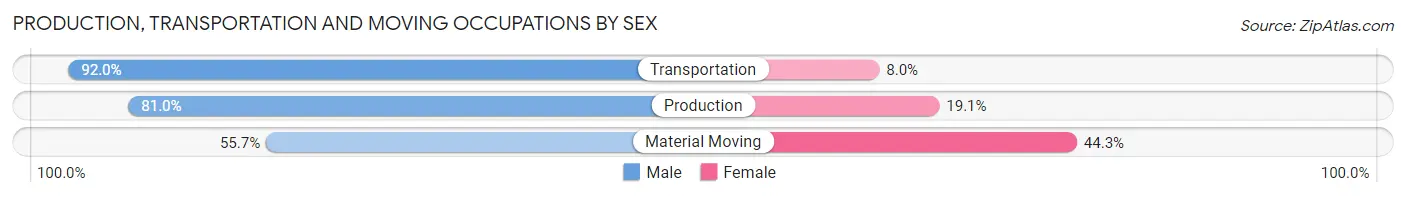
| Occupation | Male | Female |
| Production | 204 (80.9%) | 48 (19.1%) |
| Transportation | 366 (92.0%) | 32 (8.0%) |
| Material Moving | 122 (55.7%) | 97 (44.3%) |
| Total (Category) | 692 (79.6%) | 177 (20.4%) |
| Total (Overall) | 3,005 (45.3%) | 3,635 (54.7%) |
Employment Industries by Sex in Sun City
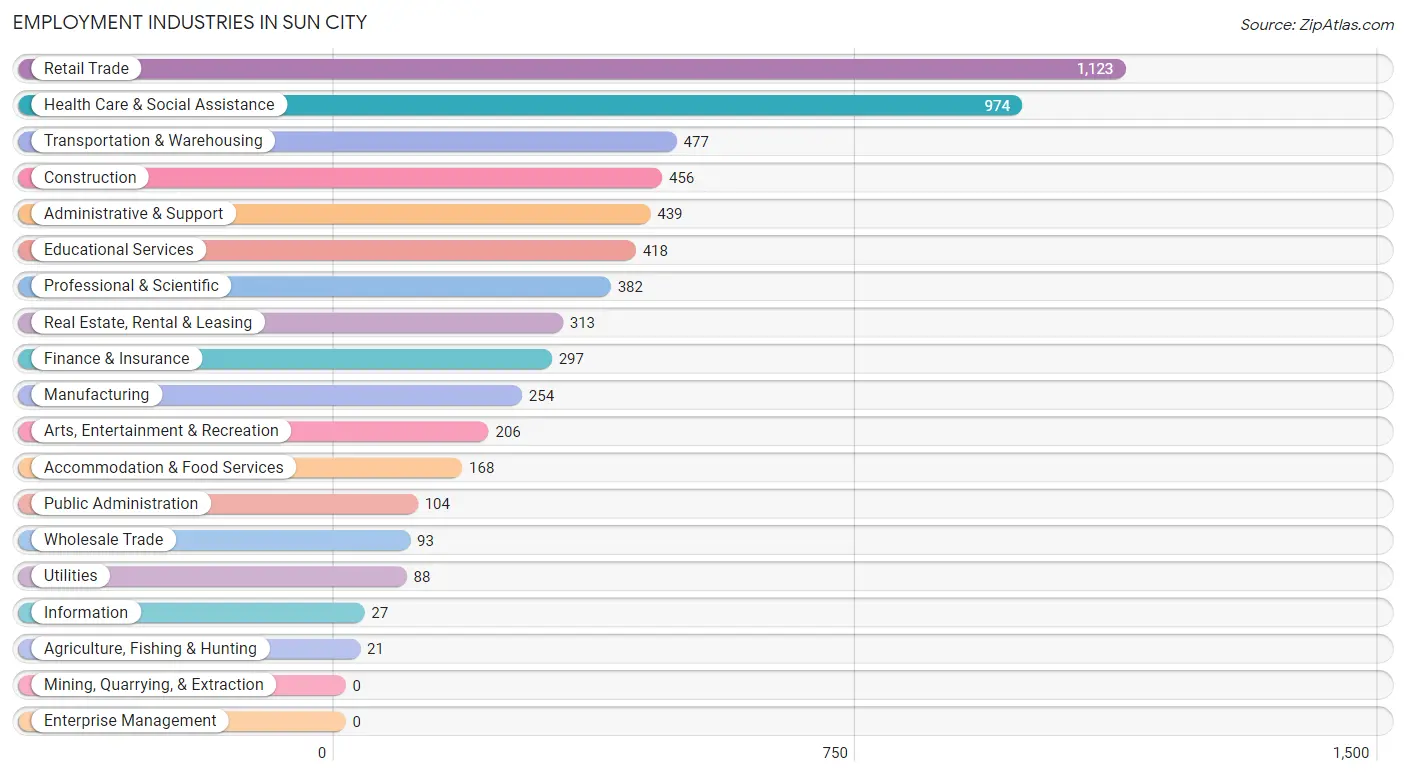
Employment Industries in Sun City
The major employment industries in Sun City include Retail Trade (1,123 | 16.9%), Health Care & Social Assistance (974 | 14.7%), Transportation & Warehousing (477 | 7.2%), Construction (456 | 6.9%), and Administrative & Support (439 | 6.6%).
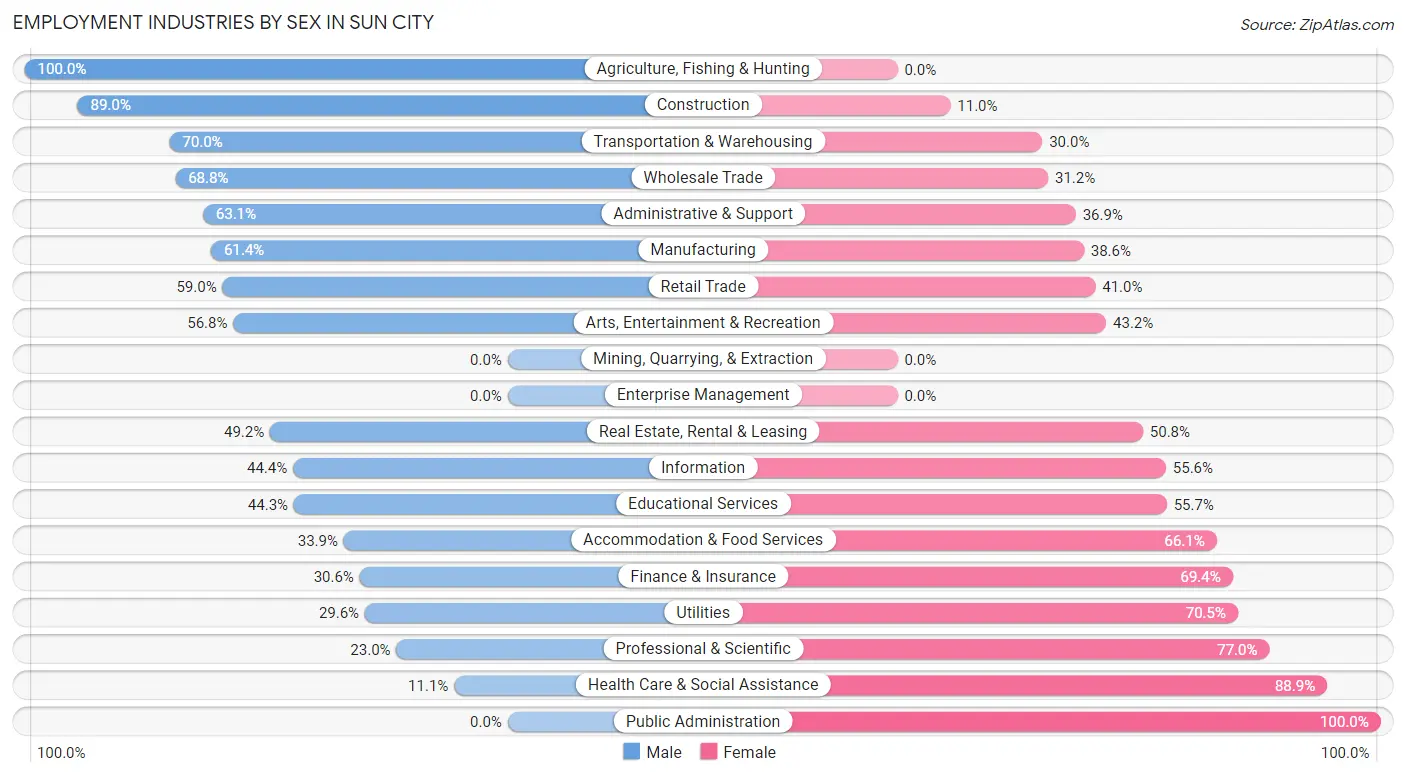
Employment Industries by Sex in Sun City
The Sun City industries that see more men than women are Agriculture, Fishing & Hunting (100.0%), Construction (89.0%), and Transportation & Warehousing (70.0%), whereas the industries that tend to have a higher number of women are Public Administration (100.0%), Health Care & Social Assistance (88.9%), and Professional & Scientific (77.0%).
| Industry | Male | Female |
| Agriculture, Fishing & Hunting | 21 (100.0%) | 0 (0.0%) |
| Mining, Quarrying, & Extraction | 0 (0.0%) | 0 (0.0%) |
| Construction | 406 (89.0%) | 50 (11.0%) |
| Manufacturing | 156 (61.4%) | 98 (38.6%) |
| Wholesale Trade | 64 (68.8%) | 29 (31.2%) |
| Retail Trade | 663 (59.0%) | 460 (41.0%) |
| Transportation & Warehousing | 334 (70.0%) | 143 (30.0%) |
| Utilities | 26 (29.5%) | 62 (70.5%) |
| Information | 12 (44.4%) | 15 (55.6%) |
| Finance & Insurance | 91 (30.6%) | 206 (69.4%) |
| Real Estate, Rental & Leasing | 154 (49.2%) | 159 (50.8%) |
| Professional & Scientific | 88 (23.0%) | 294 (77.0%) |
| Enterprise Management | 0 (0.0%) | 0 (0.0%) |
| Administrative & Support | 277 (63.1%) | 162 (36.9%) |
| Educational Services | 185 (44.3%) | 233 (55.7%) |
| Health Care & Social Assistance | 108 (11.1%) | 866 (88.9%) |
| Arts, Entertainment & Recreation | 117 (56.8%) | 89 (43.2%) |
| Accommodation & Food Services | 57 (33.9%) | 111 (66.1%) |
| Public Administration | 0 (0.0%) | 104 (100.0%) |
| Total | 3,005 (45.3%) | 3,635 (54.7%) |
Education in Sun City
School Enrollment in Sun City
The most common levels of schooling among the 532 students in Sun City are college / undergraduate (262 | 49.2%), middle school (120 | 22.6%), and elementary school (101 | 19.0%).
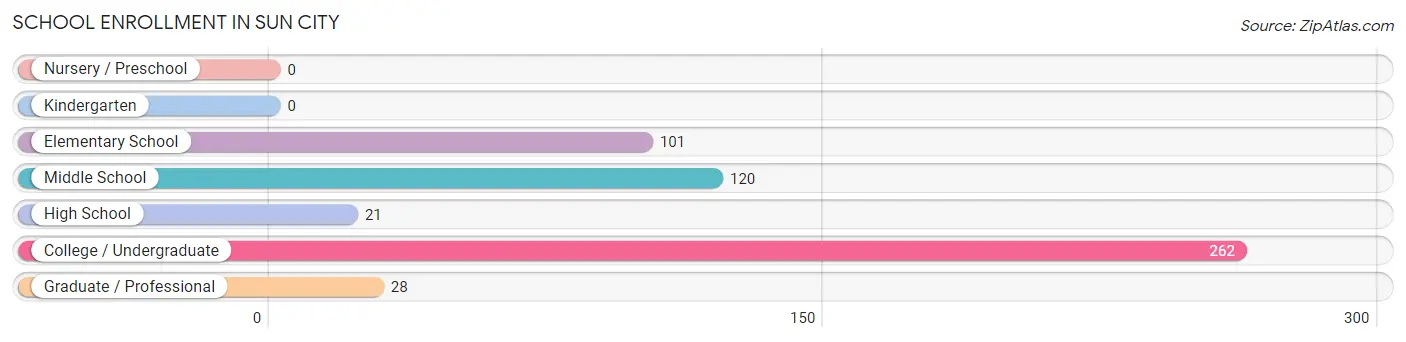
| School Level | # Students | % Students |
| Nursery / Preschool | 0 | 0.0% |
| Kindergarten | 0 | 0.0% |
| Elementary School | 101 | 19.0% |
| Middle School | 120 | 22.6% |
| High School | 21 | 4.0% |
| College / Undergraduate | 262 | 49.2% |
| Graduate / Professional | 28 | 5.3% |
| Total | 532 | 100.0% |
School Enrollment by Age by Funding Source in Sun City
Out of a total of 532 students who are enrolled in schools in Sun City, 129 (24.2%) attend a private institution, while the remaining 403 (75.8%) are enrolled in public schools. The age group of 20 to 24 year olds has the highest likelihood of being enrolled in private schools, with 50 (61.7% in the age bracket) enrolled. Conversely, the age group of 15 to 17 year olds has the lowest likelihood of being enrolled in a private school, with 21 (100.0% in the age bracket) attending a public institution.
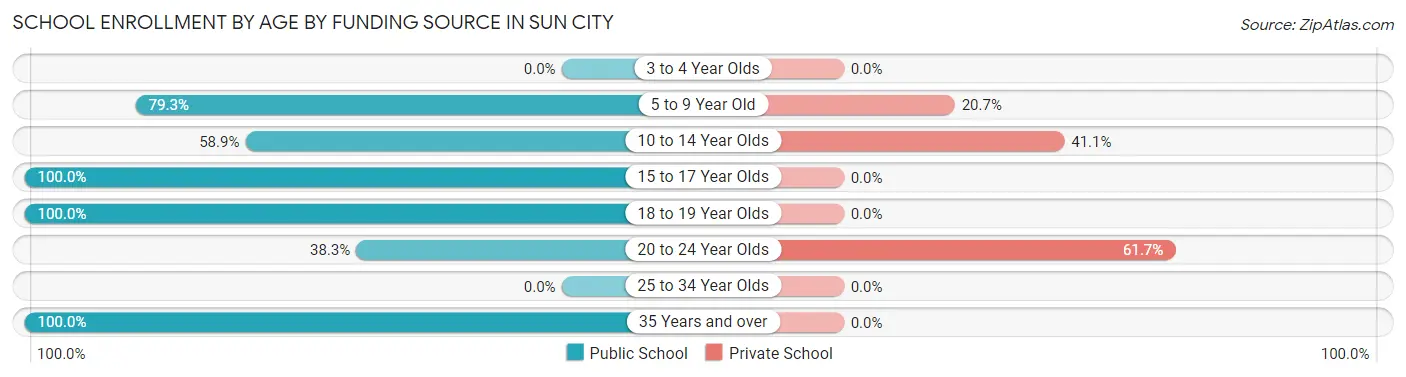
| Age Bracket | Public School | Private School |
| 3 to 4 Year Olds | 0 (0.0%) | 0 (0.0%) |
| 5 to 9 Year Old | 46 (79.3%) | 12 (20.7%) |
| 10 to 14 Year Olds | 96 (58.9%) | 67 (41.1%) |
| 15 to 17 Year Olds | 21 (100.0%) | 0 (0.0%) |
| 18 to 19 Year Olds | 41 (100.0%) | 0 (0.0%) |
| 20 to 24 Year Olds | 31 (38.3%) | 50 (61.7%) |
| 25 to 34 Year Olds | 0 (0.0%) | 0 (0.0%) |
| 35 Years and over | 168 (100.0%) | 0 (0.0%) |
| Total | 403 (75.8%) | 129 (24.2%) |
Educational Attainment by Field of Study in Sun City
Education (2,244 | 22.5%), business (2,141 | 21.5%), science & technology (1,139 | 11.4%), social sciences (705 | 7.1%), and engineering (598 | 6.0%) are the most common fields of study among 9,978 individuals in Sun City who have obtained a bachelor's degree or higher.
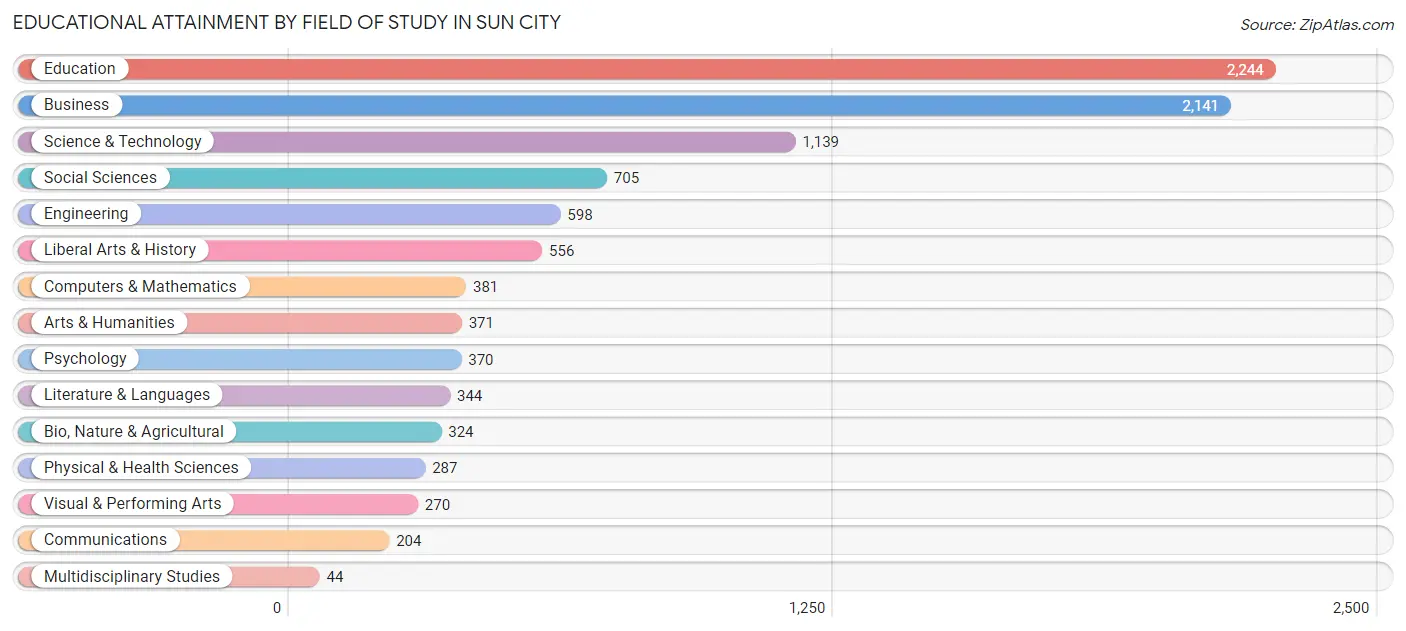
| Field of Study | # Graduates | % Graduates |
| Computers & Mathematics | 381 | 3.8% |
| Bio, Nature & Agricultural | 324 | 3.3% |
| Physical & Health Sciences | 287 | 2.9% |
| Psychology | 370 | 3.7% |
| Social Sciences | 705 | 7.1% |
| Engineering | 598 | 6.0% |
| Multidisciplinary Studies | 44 | 0.4% |
| Science & Technology | 1,139 | 11.4% |
| Business | 2,141 | 21.5% |
| Education | 2,244 | 22.5% |
| Literature & Languages | 344 | 3.5% |
| Liberal Arts & History | 556 | 5.6% |
| Visual & Performing Arts | 270 | 2.7% |
| Communications | 204 | 2.0% |
| Arts & Humanities | 371 | 3.7% |
| Total | 9,978 | 100.0% |
Transportation & Commute in Sun City
Vehicle Availability by Sex in Sun City
The most prevalent vehicle ownership categories in Sun City are males with 2 vehicles (1,358, accounting for 47.1%) and females with 2 vehicles (1,310, making up 38.0%).
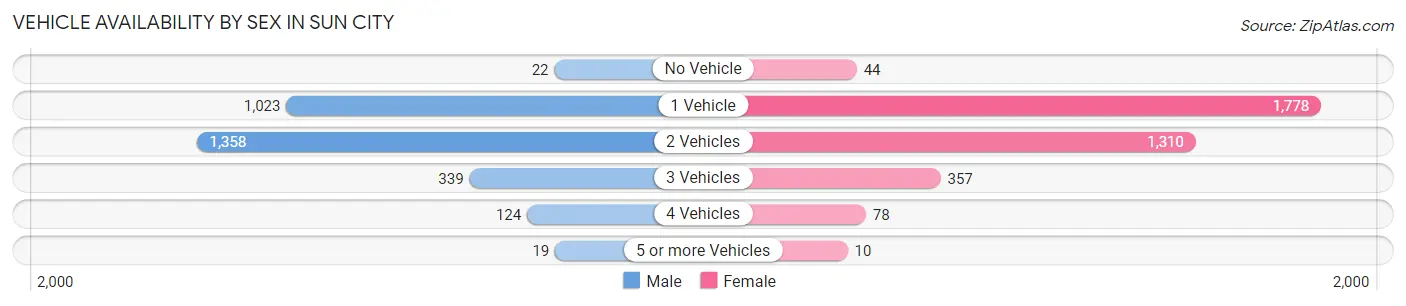
| Vehicles Available | Male | Female |
| No Vehicle | 22 (0.8%) | 44 (1.2%) |
| 1 Vehicle | 1,023 (35.5%) | 1,778 (49.7%) |
| 2 Vehicles | 1,358 (47.1%) | 1,310 (36.6%) |
| 3 Vehicles | 339 (11.7%) | 357 (10.0%) |
| 4 Vehicles | 124 (4.3%) | 78 (2.2%) |
| 5 or more Vehicles | 19 (0.7%) | 10 (0.3%) |
| Total | 2,885 (100.0%) | 3,577 (100.0%) |
Commute Time in Sun City
The most frequently occuring commute durations in Sun City are 10 to 14 minutes (888 commuters, 16.5%), 15 to 19 minutes (763 commuters, 14.2%), and 30 to 34 minutes (743 commuters, 13.8%).
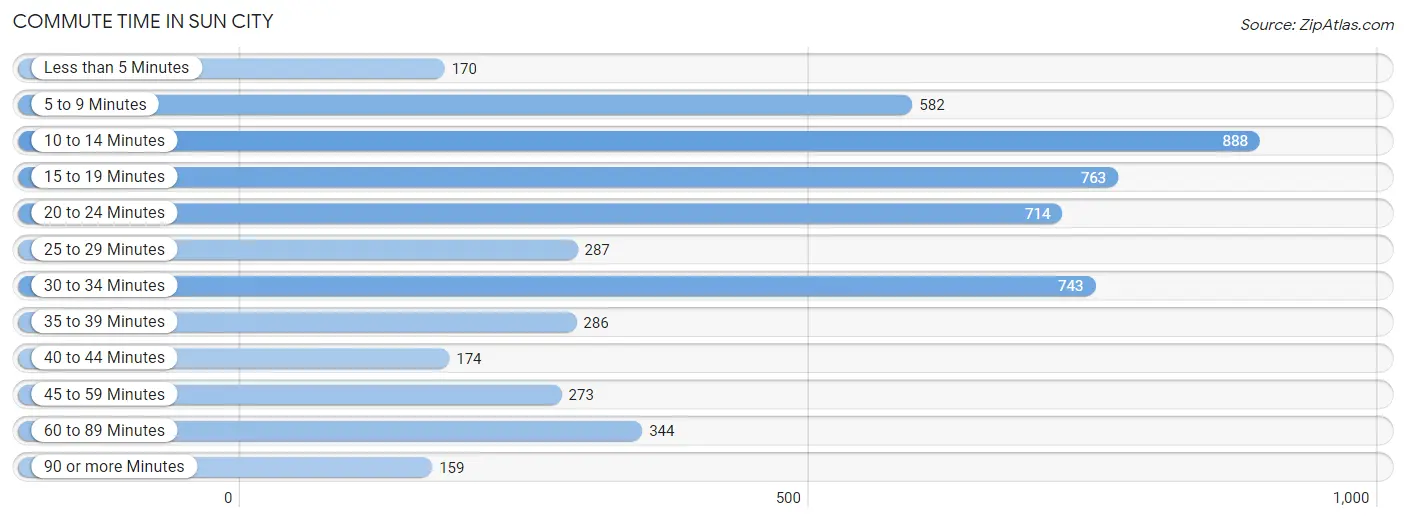
| Commute Time | # Commuters | % Commuters |
| Less than 5 Minutes | 170 | 3.2% |
| 5 to 9 Minutes | 582 | 10.8% |
| 10 to 14 Minutes | 888 | 16.5% |
| 15 to 19 Minutes | 763 | 14.2% |
| 20 to 24 Minutes | 714 | 13.3% |
| 25 to 29 Minutes | 287 | 5.3% |
| 30 to 34 Minutes | 743 | 13.8% |
| 35 to 39 Minutes | 286 | 5.3% |
| 40 to 44 Minutes | 174 | 3.2% |
| 45 to 59 Minutes | 273 | 5.1% |
| 60 to 89 Minutes | 344 | 6.4% |
| 90 or more Minutes | 159 | 2.9% |
Commute Time by Sex in Sun City
The most common commute times in Sun City are 30 to 34 minutes (526 commuters, 19.9%) for males and 10 to 14 minutes (671 commuters, 24.5%) for females.
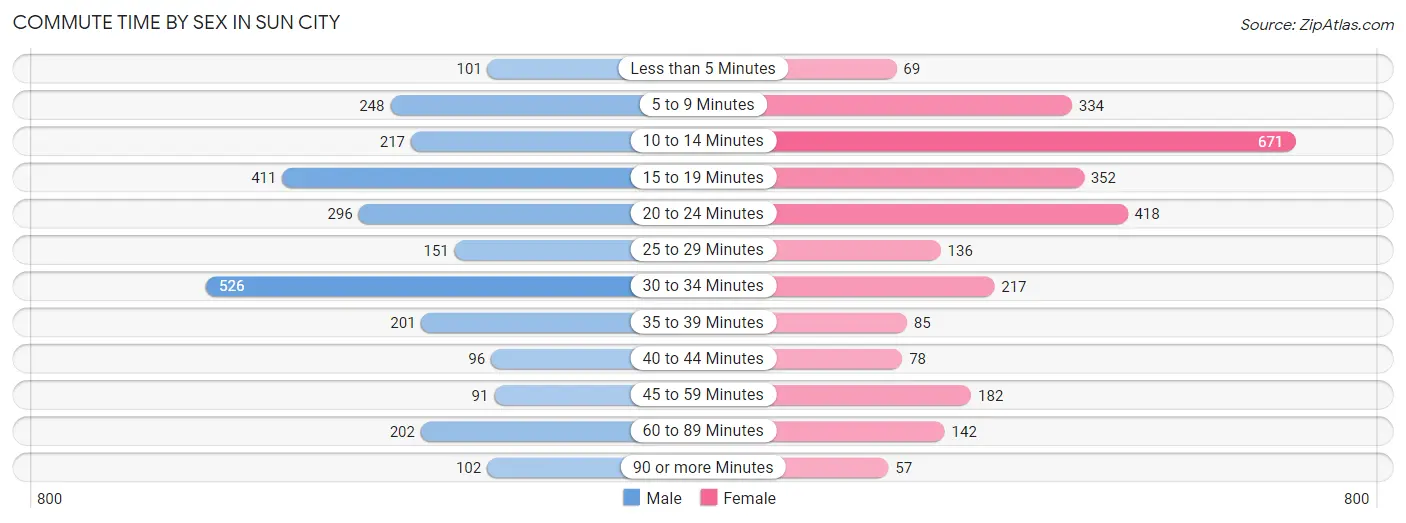
| Commute Time | Male | Female |
| Less than 5 Minutes | 101 (3.8%) | 69 (2.5%) |
| 5 to 9 Minutes | 248 (9.4%) | 334 (12.2%) |
| 10 to 14 Minutes | 217 (8.2%) | 671 (24.5%) |
| 15 to 19 Minutes | 411 (15.6%) | 352 (12.8%) |
| 20 to 24 Minutes | 296 (11.2%) | 418 (15.2%) |
| 25 to 29 Minutes | 151 (5.7%) | 136 (5.0%) |
| 30 to 34 Minutes | 526 (19.9%) | 217 (7.9%) |
| 35 to 39 Minutes | 201 (7.6%) | 85 (3.1%) |
| 40 to 44 Minutes | 96 (3.6%) | 78 (2.9%) |
| 45 to 59 Minutes | 91 (3.4%) | 182 (6.6%) |
| 60 to 89 Minutes | 202 (7.6%) | 142 (5.2%) |
| 90 or more Minutes | 102 (3.9%) | 57 (2.1%) |
Time of Departure to Work by Sex in Sun City
The most frequent times of departure to work in Sun City are 12:00 AM to 4:59 AM (448, 17.0%) for males and 8:00 AM to 8:29 AM (397, 14.5%) for females.
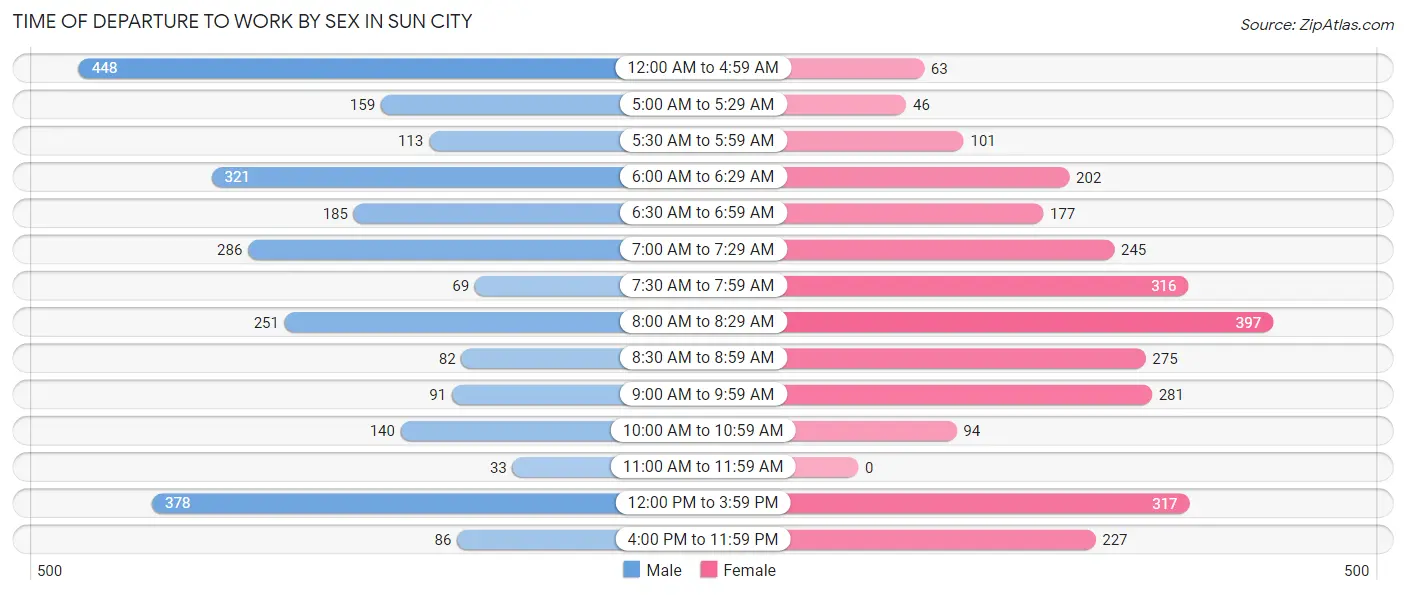
| Time of Departure | Male | Female |
| 12:00 AM to 4:59 AM | 448 (17.0%) | 63 (2.3%) |
| 5:00 AM to 5:29 AM | 159 (6.0%) | 46 (1.7%) |
| 5:30 AM to 5:59 AM | 113 (4.3%) | 101 (3.7%) |
| 6:00 AM to 6:29 AM | 321 (12.1%) | 202 (7.4%) |
| 6:30 AM to 6:59 AM | 185 (7.0%) | 177 (6.5%) |
| 7:00 AM to 7:29 AM | 286 (10.8%) | 245 (8.9%) |
| 7:30 AM to 7:59 AM | 69 (2.6%) | 316 (11.5%) |
| 8:00 AM to 8:29 AM | 251 (9.5%) | 397 (14.5%) |
| 8:30 AM to 8:59 AM | 82 (3.1%) | 275 (10.0%) |
| 9:00 AM to 9:59 AM | 91 (3.4%) | 281 (10.2%) |
| 10:00 AM to 10:59 AM | 140 (5.3%) | 94 (3.4%) |
| 11:00 AM to 11:59 AM | 33 (1.3%) | 0 (0.0%) |
| 12:00 PM to 3:59 PM | 378 (14.3%) | 317 (11.6%) |
| 4:00 PM to 11:59 PM | 86 (3.3%) | 227 (8.3%) |
| Total | 2,642 (100.0%) | 2,741 (100.0%) |
Housing Occupancy in Sun City
Occupancy by Ownership in Sun City
Of the total 22,889 dwellings in Sun City, owner-occupied units account for 19,108 (83.5%), while renter-occupied units make up 3,781 (16.5%).
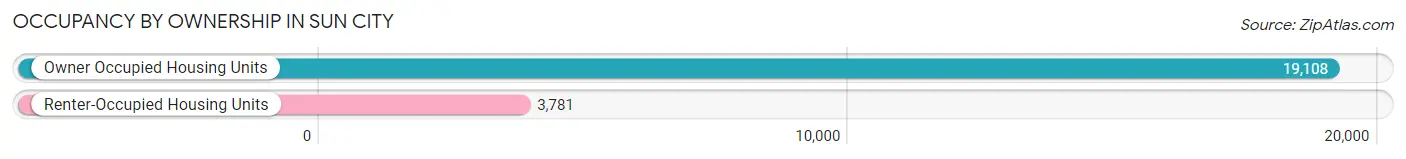
| Occupancy | # Housing Units | % Housing Units |
| Owner Occupied Housing Units | 19,108 | 83.5% |
| Renter-Occupied Housing Units | 3,781 | 16.5% |
| Total Occupied Housing Units | 22,889 | 100.0% |
Occupancy by Household Size in Sun City
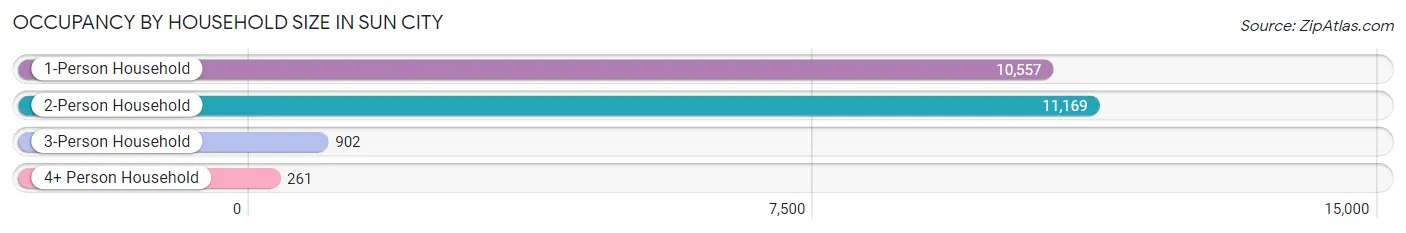
| Household Size | # Housing Units | % Housing Units |
| 1-Person Household | 10,557 | 46.1% |
| 2-Person Household | 11,169 | 48.8% |
| 3-Person Household | 902 | 3.9% |
| 4+ Person Household | 261 | 1.1% |
| Total Housing Units | 22,889 | 100.0% |
Occupancy by Ownership by Household Size in Sun City
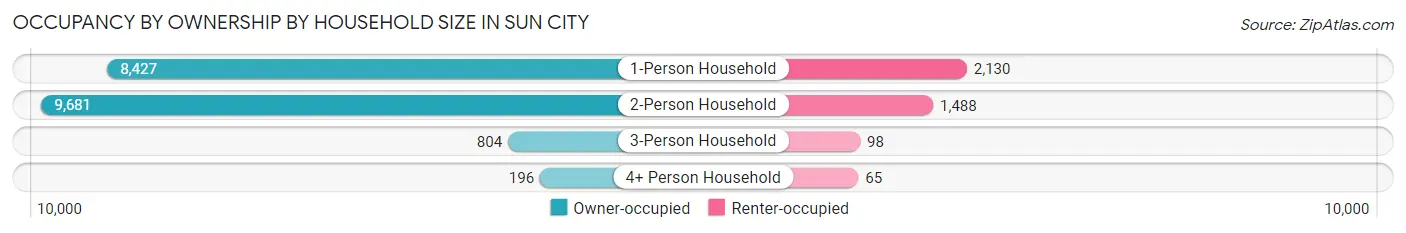
| Household Size | Owner-occupied | Renter-occupied |
| 1-Person Household | 8,427 (79.8%) | 2,130 (20.2%) |
| 2-Person Household | 9,681 (86.7%) | 1,488 (13.3%) |
| 3-Person Household | 804 (89.1%) | 98 (10.9%) |
| 4+ Person Household | 196 (75.1%) | 65 (24.9%) |
| Total Housing Units | 19,108 (83.5%) | 3,781 (16.5%) |
Occupancy by Educational Attainment in Sun City
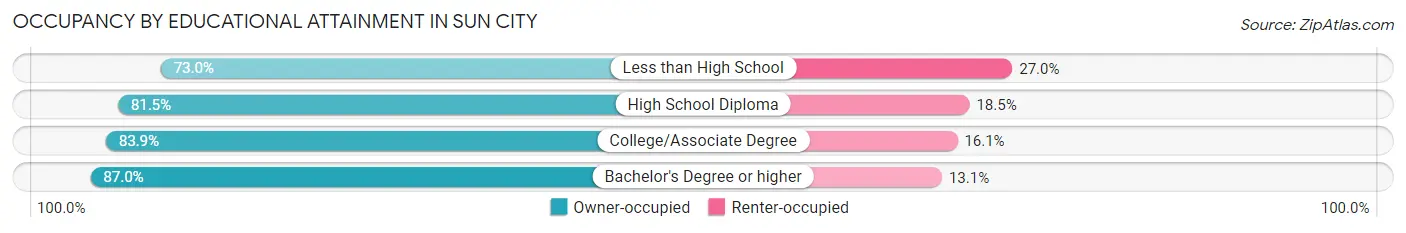
| Household Size | Owner-occupied | Renter-occupied |
| Less than High School | 890 (73.0%) | 329 (27.0%) |
| High School Diploma | 5,048 (81.5%) | 1,146 (18.5%) |
| College/Associate Degree | 7,840 (83.9%) | 1,506 (16.1%) |
| Bachelor's Degree or higher | 5,330 (87.0%) | 800 (13.1%) |
Occupancy by Age of Householder in Sun City
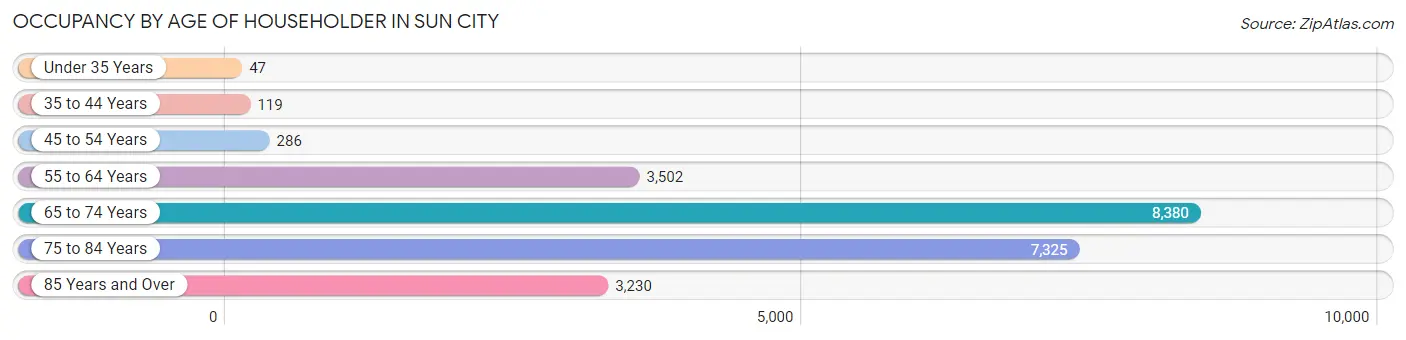
| Age Bracket | # Households | % Households |
| Under 35 Years | 47 | 0.2% |
| 35 to 44 Years | 119 | 0.5% |
| 45 to 54 Years | 286 | 1.3% |
| 55 to 64 Years | 3,502 | 15.3% |
| 65 to 74 Years | 8,380 | 36.6% |
| 75 to 84 Years | 7,325 | 32.0% |
| 85 Years and Over | 3,230 | 14.1% |
| Total | 22,889 | 100.0% |
Housing Finances in Sun City
Median Income by Occupancy in Sun City
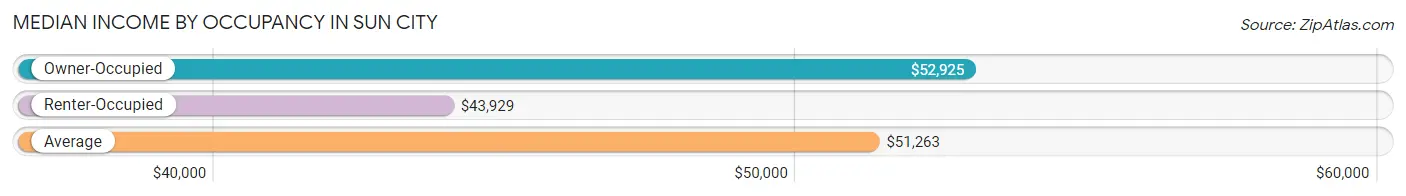
| Occupancy Type | # Households | Median Income |
| Owner-Occupied | 19,108 (83.5%) | $52,925 |
| Renter-Occupied | 3,781 (16.5%) | $43,929 |
| Average | 22,889 (100.0%) | $51,263 |
Occupancy by Householder Income Bracket in Sun City
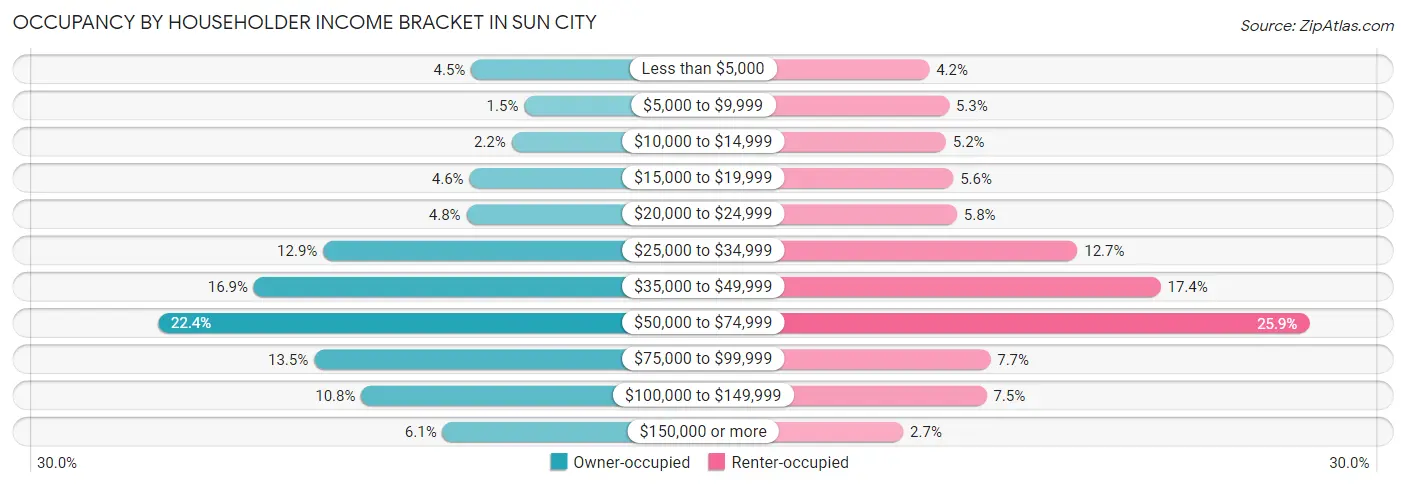
| Income Bracket | Owner-occupied | Renter-occupied |
| Less than $5,000 | 856 (4.5%) | 159 (4.2%) |
| $5,000 to $9,999 | 278 (1.5%) | 202 (5.3%) |
| $10,000 to $14,999 | 414 (2.2%) | 195 (5.2%) |
| $15,000 to $19,999 | 876 (4.6%) | 211 (5.6%) |
| $20,000 to $24,999 | 908 (4.8%) | 219 (5.8%) |
| $25,000 to $34,999 | 2,473 (12.9%) | 479 (12.7%) |
| $35,000 to $49,999 | 3,230 (16.9%) | 659 (17.4%) |
| $50,000 to $74,999 | 4,276 (22.4%) | 980 (25.9%) |
| $75,000 to $99,999 | 2,572 (13.5%) | 291 (7.7%) |
| $100,000 to $149,999 | 2,056 (10.8%) | 283 (7.5%) |
| $150,000 or more | 1,169 (6.1%) | 103 (2.7%) |
| Total | 19,108 (100.0%) | 3,781 (100.0%) |
Monthly Housing Cost Tiers in Sun City
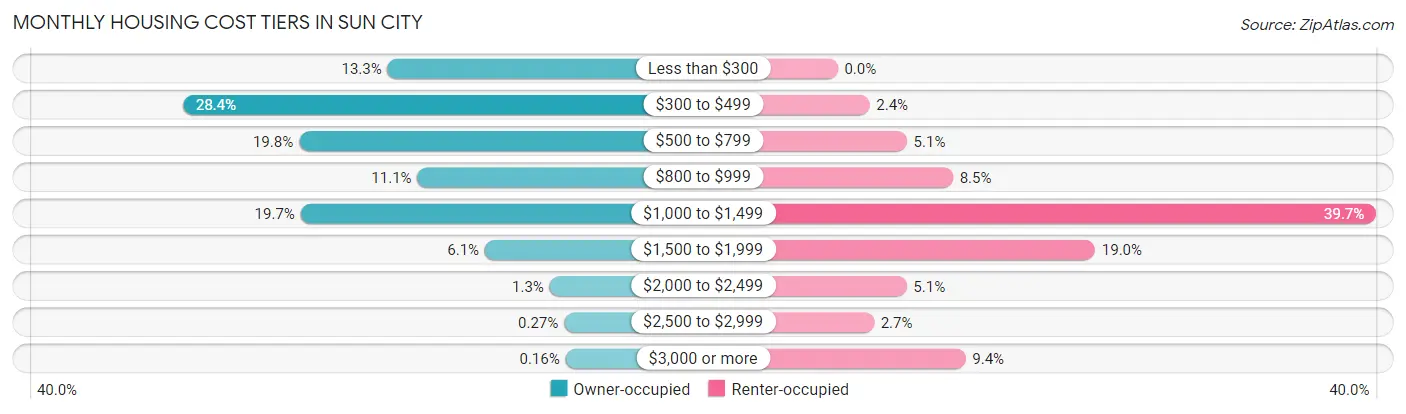
| Monthly Cost | Owner-occupied | Renter-occupied |
| Less than $300 | 2,536 (13.3%) | 0 (0.0%) |
| $300 to $499 | 5,417 (28.3%) | 89 (2.4%) |
| $500 to $799 | 3,782 (19.8%) | 193 (5.1%) |
| $800 to $999 | 2,115 (11.1%) | 321 (8.5%) |
| $1,000 to $1,499 | 3,758 (19.7%) | 1,500 (39.7%) |
| $1,500 to $1,999 | 1,165 (6.1%) | 717 (19.0%) |
| $2,000 to $2,499 | 254 (1.3%) | 192 (5.1%) |
| $2,500 to $2,999 | 51 (0.3%) | 101 (2.7%) |
| $3,000 or more | 30 (0.2%) | 356 (9.4%) |
| Total | 19,108 (100.0%) | 3,781 (100.0%) |
Physical Housing Characteristics in Sun City
Housing Structures in Sun City
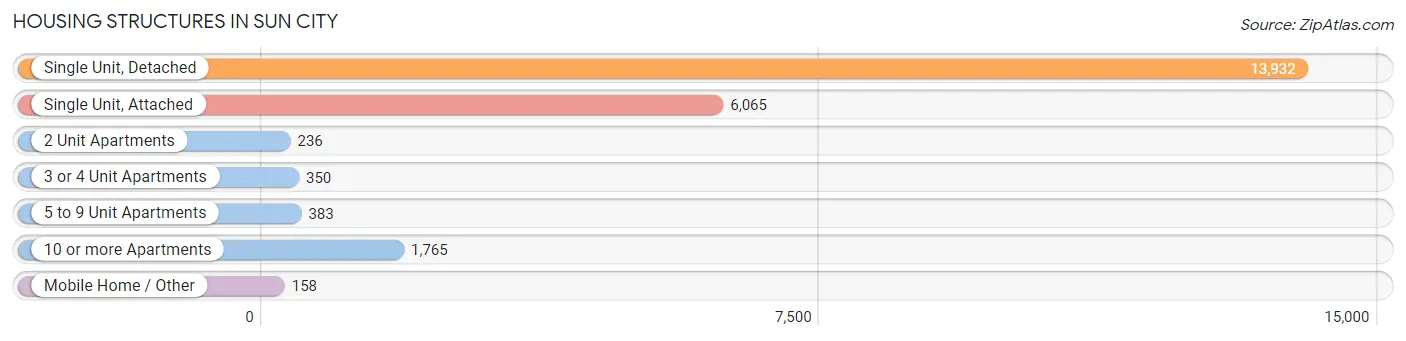
| Structure Type | # Housing Units | % Housing Units |
| Single Unit, Detached | 13,932 | 60.9% |
| Single Unit, Attached | 6,065 | 26.5% |
| 2 Unit Apartments | 236 | 1.0% |
| 3 or 4 Unit Apartments | 350 | 1.5% |
| 5 to 9 Unit Apartments | 383 | 1.7% |
| 10 or more Apartments | 1,765 | 7.7% |
| Mobile Home / Other | 158 | 0.7% |
| Total | 22,889 | 100.0% |
Housing Structures by Occupancy in Sun City
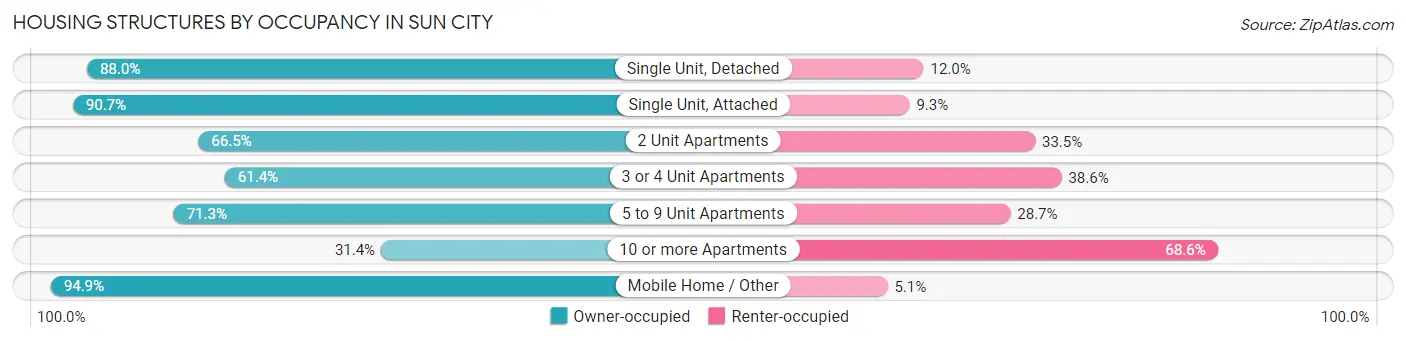
| Structure Type | Owner-occupied | Renter-occupied |
| Single Unit, Detached | 12,258 (88.0%) | 1,674 (12.0%) |
| Single Unit, Attached | 5,501 (90.7%) | 564 (9.3%) |
| 2 Unit Apartments | 157 (66.5%) | 79 (33.5%) |
| 3 or 4 Unit Apartments | 215 (61.4%) | 135 (38.6%) |
| 5 to 9 Unit Apartments | 273 (71.3%) | 110 (28.7%) |
| 10 or more Apartments | 554 (31.4%) | 1,211 (68.6%) |
| Mobile Home / Other | 150 (94.9%) | 8 (5.1%) |
| Total | 19,108 (83.5%) | 3,781 (16.5%) |
Housing Structures by Number of Rooms in Sun City
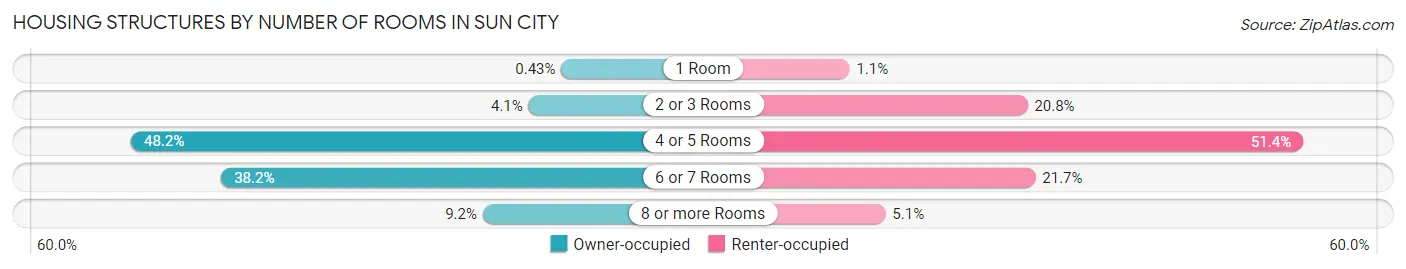
| Number of Rooms | Owner-occupied | Renter-occupied |
| 1 Room | 83 (0.4%) | 40 (1.1%) |
| 2 or 3 Rooms | 777 (4.1%) | 787 (20.8%) |
| 4 or 5 Rooms | 9,207 (48.2%) | 1,943 (51.4%) |
| 6 or 7 Rooms | 7,293 (38.2%) | 820 (21.7%) |
| 8 or more Rooms | 1,748 (9.1%) | 191 (5.1%) |
| Total | 19,108 (100.0%) | 3,781 (100.0%) |
Housing Structure by Heating Type in Sun City
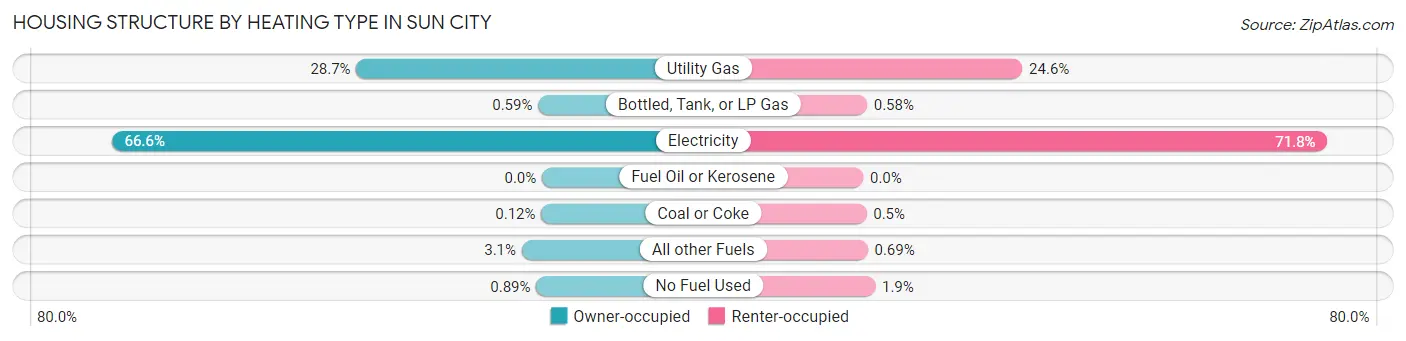
| Heating Type | Owner-occupied | Renter-occupied |
| Utility Gas | 5,484 (28.7%) | 930 (24.6%) |
| Bottled, Tank, or LP Gas | 113 (0.6%) | 22 (0.6%) |
| Electricity | 12,719 (66.6%) | 2,714 (71.8%) |
| Fuel Oil or Kerosene | 0 (0.0%) | 0 (0.0%) |
| Coal or Coke | 23 (0.1%) | 19 (0.5%) |
| All other Fuels | 598 (3.1%) | 26 (0.7%) |
| No Fuel Used | 171 (0.9%) | 70 (1.8%) |
| Total | 19,108 (100.0%) | 3,781 (100.0%) |
Household Vehicle Usage in Sun City
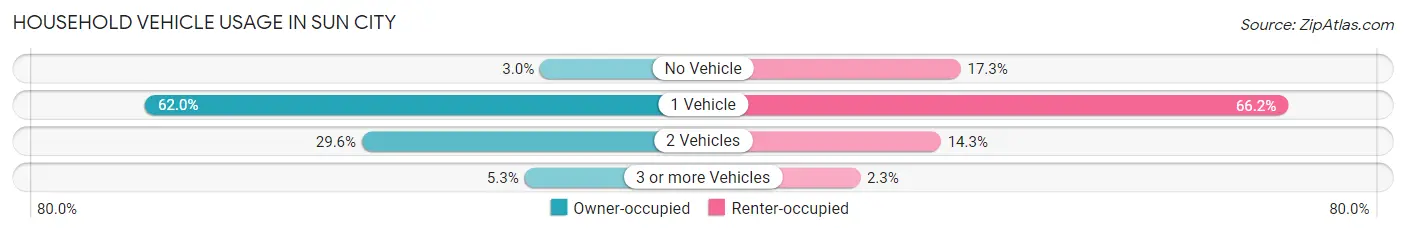
| Vehicles per Household | Owner-occupied | Renter-occupied |
| No Vehicle | 577 (3.0%) | 653 (17.3%) |
| 1 Vehicle | 11,849 (62.0%) | 2,502 (66.2%) |
| 2 Vehicles | 5,662 (29.6%) | 541 (14.3%) |
| 3 or more Vehicles | 1,020 (5.3%) | 85 (2.2%) |
| Total | 19,108 (100.0%) | 3,781 (100.0%) |
Real Estate & Mortgages in Sun City
Real Estate and Mortgage Overview in Sun City
| Characteristic | Without Mortgage | With Mortgage |
| Housing Units | 10,228 | 8,880 |
| Median Property Value | $232,300 | $235,200 |
| Median Household Income | $50,995 | $569 |
| Monthly Housing Costs | $383 | $30 |
| Real Estate Taxes | $1,011 | $204 |
Property Value by Mortgage Status in Sun City
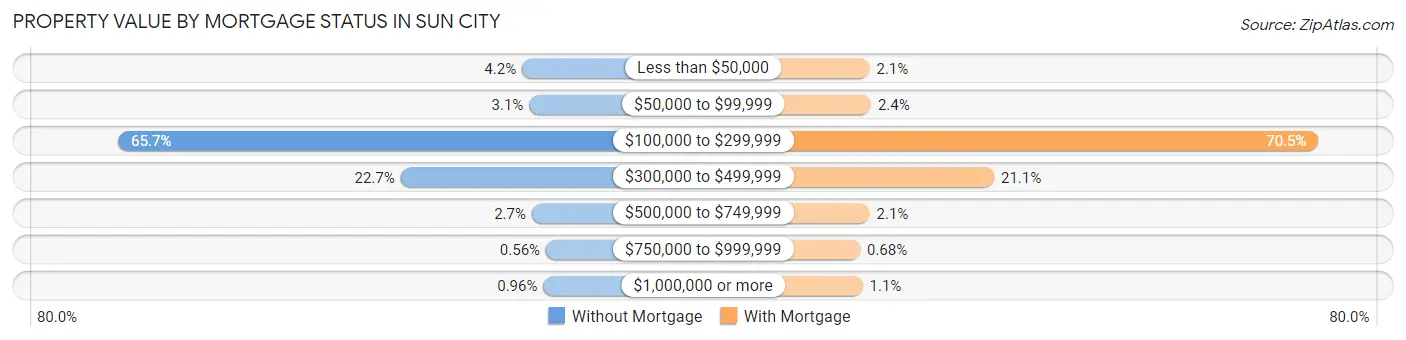
| Property Value | Without Mortgage | With Mortgage |
| Less than $50,000 | 431 (4.2%) | 189 (2.1%) |
| $50,000 to $99,999 | 318 (3.1%) | 209 (2.4%) |
| $100,000 to $299,999 | 6,724 (65.7%) | 6,262 (70.5%) |
| $300,000 to $499,999 | 2,323 (22.7%) | 1,875 (21.1%) |
| $500,000 to $749,999 | 277 (2.7%) | 190 (2.1%) |
| $750,000 to $999,999 | 57 (0.6%) | 60 (0.7%) |
| $1,000,000 or more | 98 (1.0%) | 95 (1.1%) |
| Total | 10,228 (100.0%) | 8,880 (100.0%) |
Household Income by Mortgage Status in Sun City
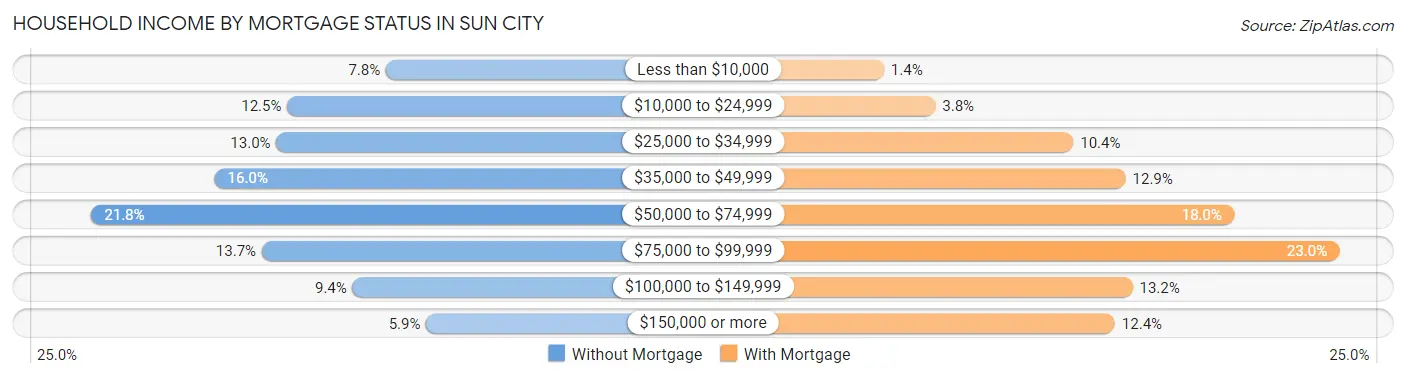
| Household Income | Without Mortgage | With Mortgage |
| Less than $10,000 | 797 (7.8%) | 120 (1.3%) |
| $10,000 to $24,999 | 1,277 (12.5%) | 337 (3.8%) |
| $25,000 to $34,999 | 1,331 (13.0%) | 921 (10.4%) |
| $35,000 to $49,999 | 1,631 (16.0%) | 1,142 (12.9%) |
| $50,000 to $74,999 | 2,232 (21.8%) | 1,599 (18.0%) |
| $75,000 to $99,999 | 1,401 (13.7%) | 2,044 (23.0%) |
| $100,000 to $149,999 | 959 (9.4%) | 1,171 (13.2%) |
| $150,000 or more | 600 (5.9%) | 1,097 (12.3%) |
| Total | 10,228 (100.0%) | 8,880 (100.0%) |
Property Value to Household Income Ratio in Sun City
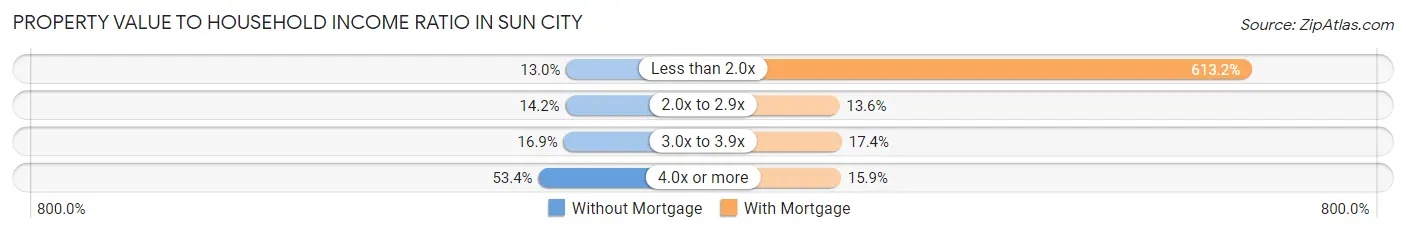
| Value-to-Income Ratio | Without Mortgage | With Mortgage |
| Less than 2.0x | 1,332 (13.0%) | 54,455 (613.2%) |
| 2.0x to 2.9x | 1,453 (14.2%) | 1,208 (13.6%) |
| 3.0x to 3.9x | 1,723 (16.9%) | 1,541 (17.3%) |
| 4.0x or more | 5,464 (53.4%) | 1,408 (15.9%) |
| Total | 10,228 (100.0%) | 8,880 (100.0%) |
Real Estate Taxes by Mortgage Status in Sun City
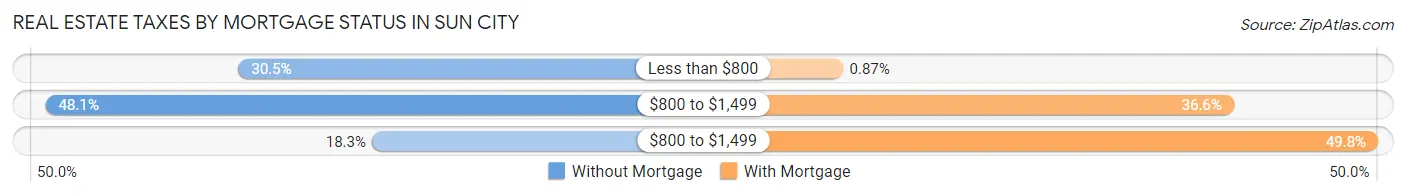
| Property Taxes | Without Mortgage | With Mortgage |
| Less than $800 | 3,117 (30.5%) | 77 (0.9%) |
| $800 to $1,499 | 4,919 (48.1%) | 3,250 (36.6%) |
| $800 to $1,499 | 1,871 (18.3%) | 4,419 (49.8%) |
| Total | 10,228 (100.0%) | 8,880 (100.0%) |
Health & Disability in Sun City
Health Insurance Coverage by Age in Sun City
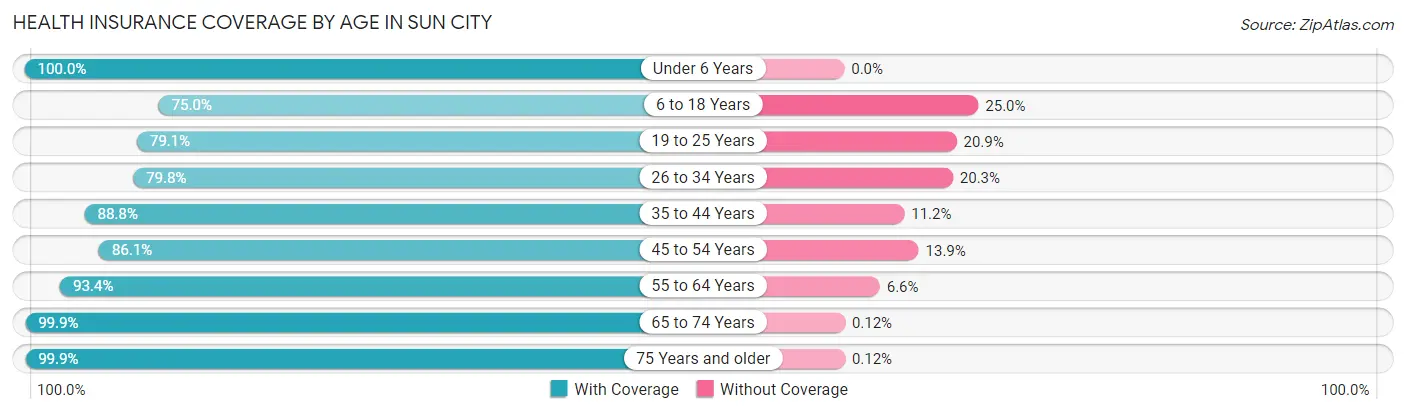
| Age Bracket | With Coverage | Without Coverage |
| Under 6 Years | 26 (100.0%) | 0 (0.0%) |
| 6 to 18 Years | 225 (75.0%) | 75 (25.0%) |
| 19 to 25 Years | 340 (79.1%) | 90 (20.9%) |
| 26 to 34 Years | 252 (79.7%) | 64 (20.3%) |
| 35 to 44 Years | 611 (88.8%) | 77 (11.2%) |
| 45 to 54 Years | 1,050 (86.1%) | 169 (13.9%) |
| 55 to 64 Years | 5,823 (93.4%) | 413 (6.6%) |
| 65 to 74 Years | 13,080 (99.9%) | 16 (0.1%) |
| 75 Years and older | 14,934 (99.9%) | 18 (0.1%) |
| Total | 36,341 (97.5%) | 922 (2.5%) |
Health Insurance Coverage by Citizenship Status in Sun City
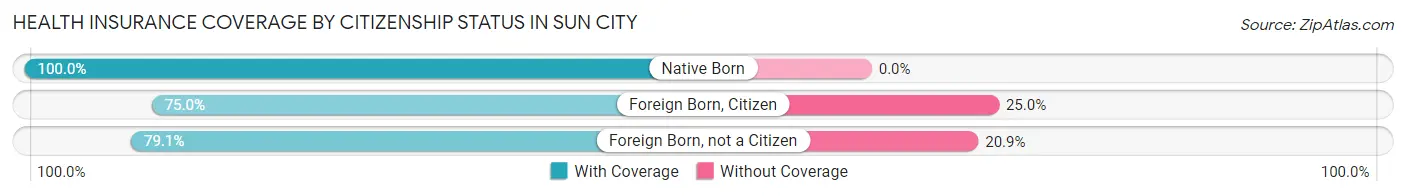
| Citizenship Status | With Coverage | Without Coverage |
| Native Born | 26 (100.0%) | 0 (0.0%) |
| Foreign Born, Citizen | 225 (75.0%) | 75 (25.0%) |
| Foreign Born, not a Citizen | 340 (79.1%) | 90 (20.9%) |
Health Insurance Coverage by Household Income in Sun City
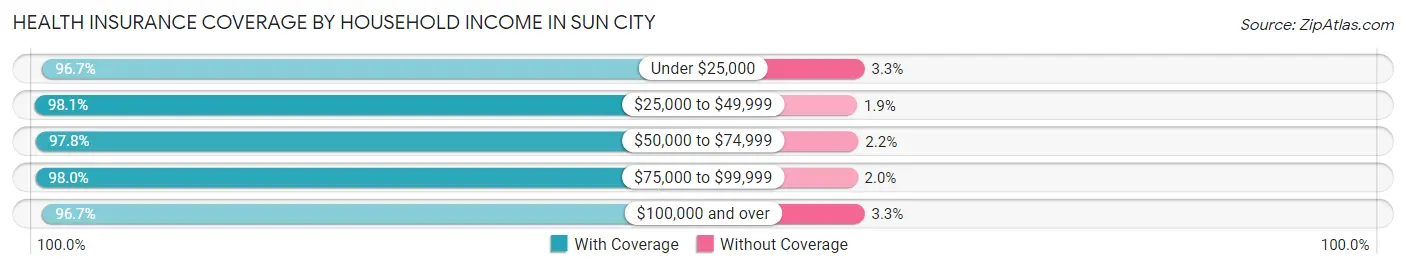
| Household Income | With Coverage | Without Coverage |
| Under $25,000 | 5,147 (96.7%) | 177 (3.3%) |
| $25,000 to $49,999 | 9,916 (98.1%) | 194 (1.9%) |
| $50,000 to $74,999 | 8,978 (97.8%) | 199 (2.2%) |
| $75,000 to $99,999 | 5,127 (98.0%) | 106 (2.0%) |
| $100,000 and over | 7,173 (96.7%) | 246 (3.3%) |
Public vs Private Health Insurance Coverage by Age in Sun City
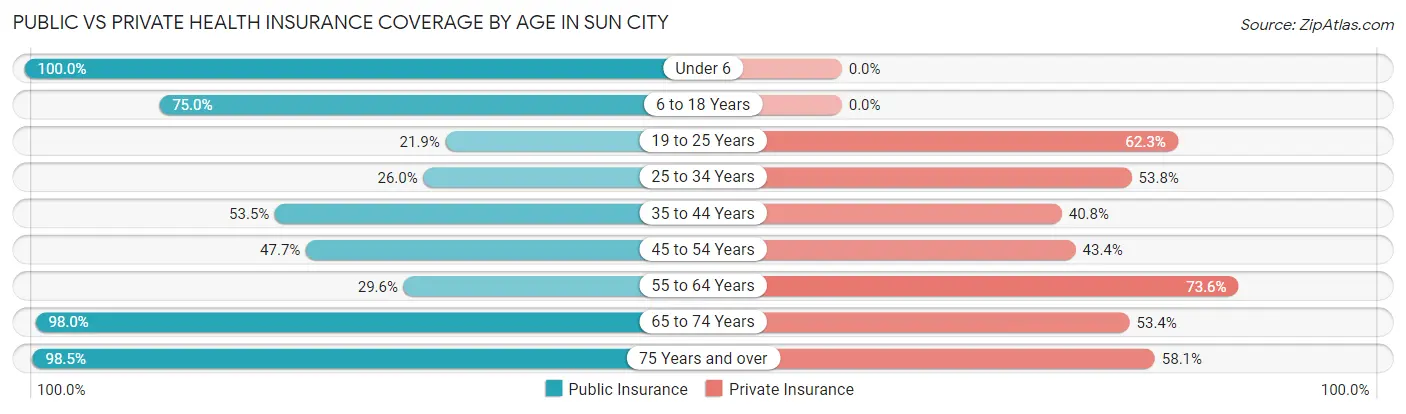
| Age Bracket | Public Insurance | Private Insurance |
| Under 6 | 26 (100.0%) | 0 (0.0%) |
| 6 to 18 Years | 225 (75.0%) | 0 (0.0%) |
| 19 to 25 Years | 94 (21.9%) | 268 (62.3%) |
| 25 to 34 Years | 82 (26.0%) | 170 (53.8%) |
| 35 to 44 Years | 368 (53.5%) | 281 (40.8%) |
| 45 to 54 Years | 582 (47.7%) | 529 (43.4%) |
| 55 to 64 Years | 1,847 (29.6%) | 4,590 (73.6%) |
| 65 to 74 Years | 12,831 (98.0%) | 6,996 (53.4%) |
| 75 Years and over | 14,730 (98.5%) | 8,688 (58.1%) |
| Total | 30,785 (82.6%) | 21,522 (57.8%) |
Disability Status by Sex by Age in Sun City
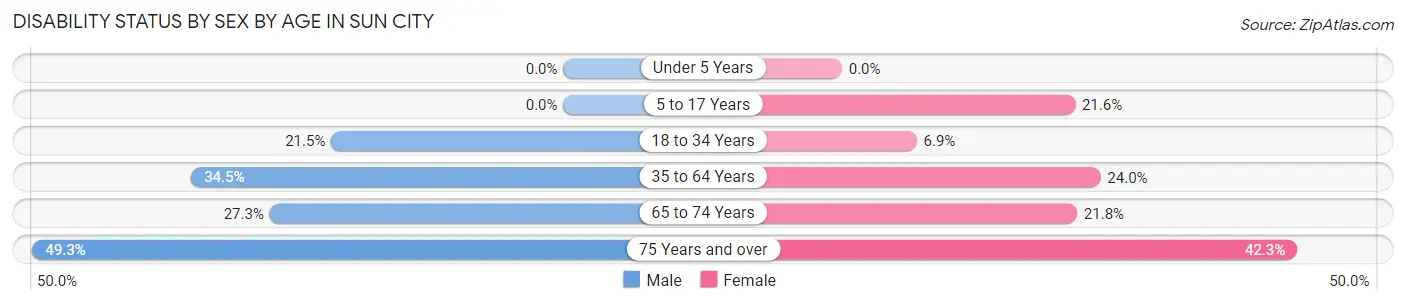
| Age Bracket | Male | Female |
| Under 5 Years | 0 (0.0%) | 0 (0.0%) |
| 5 to 17 Years | 0 (0.0%) | 37 (21.6%) |
| 18 to 34 Years | 95 (21.5%) | 24 (6.9%) |
| 35 to 64 Years | 1,196 (34.5%) | 1,123 (24.0%) |
| 65 to 74 Years | 1,467 (27.3%) | 1,683 (21.8%) |
| 75 Years and over | 3,054 (49.3%) | 3,699 (42.2%) |
Disability Class by Sex by Age in Sun City
Disability Class: Hearing Difficulty
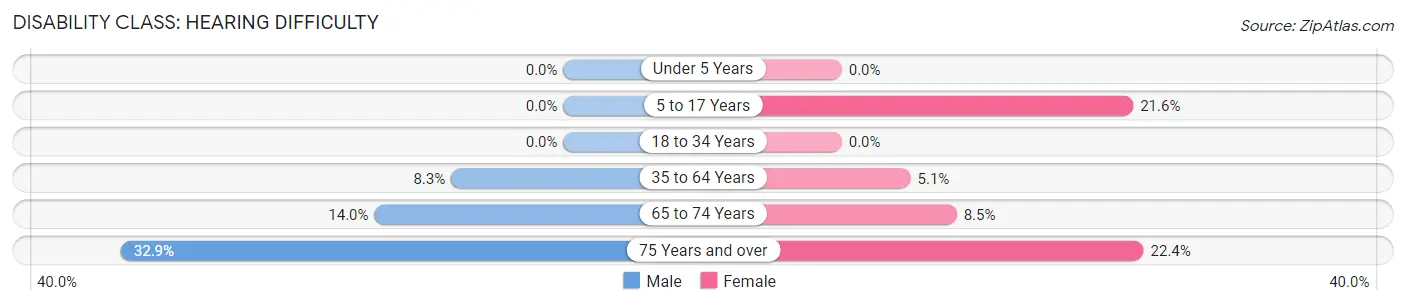
| Age Bracket | Male | Female |
| Under 5 Years | 0 (0.0%) | 0 (0.0%) |
| 5 to 17 Years | 0 (0.0%) | 37 (21.6%) |
| 18 to 34 Years | 0 (0.0%) | 0 (0.0%) |
| 35 to 64 Years | 289 (8.3%) | 239 (5.1%) |
| 65 to 74 Years | 755 (14.0%) | 658 (8.5%) |
| 75 Years and over | 2,036 (32.9%) | 1,962 (22.4%) |
Disability Class: Vision Difficulty
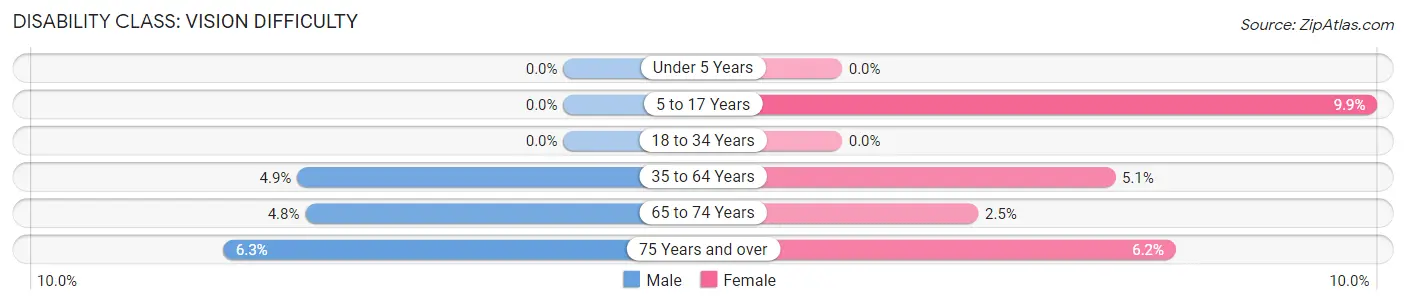
| Age Bracket | Male | Female |
| Under 5 Years | 0 (0.0%) | 0 (0.0%) |
| 5 to 17 Years | 0 (0.0%) | 17 (9.9%) |
| 18 to 34 Years | 0 (0.0%) | 0 (0.0%) |
| 35 to 64 Years | 171 (4.9%) | 237 (5.1%) |
| 65 to 74 Years | 258 (4.8%) | 195 (2.5%) |
| 75 Years and over | 392 (6.3%) | 543 (6.2%) |
Disability Class: Cognitive Difficulty
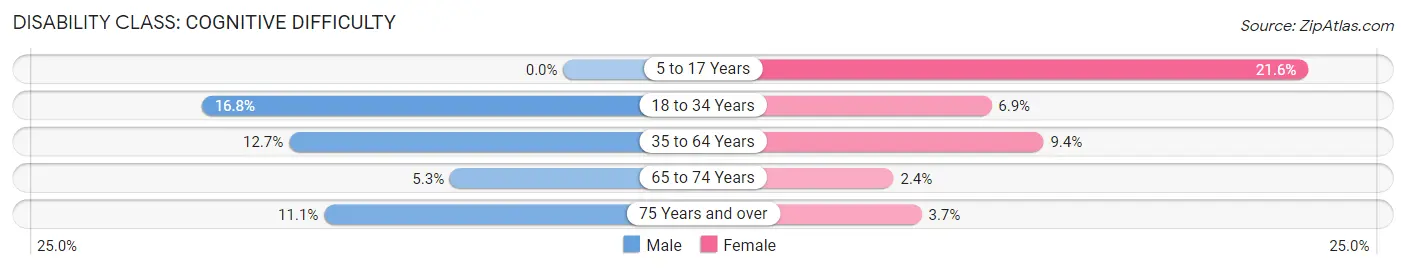
| Age Bracket | Male | Female |
| 5 to 17 Years | 0 (0.0%) | 37 (21.6%) |
| 18 to 34 Years | 74 (16.8%) | 24 (6.9%) |
| 35 to 64 Years | 441 (12.7%) | 438 (9.4%) |
| 65 to 74 Years | 283 (5.3%) | 185 (2.4%) |
| 75 Years and over | 688 (11.1%) | 324 (3.7%) |
Disability Class: Ambulatory Difficulty
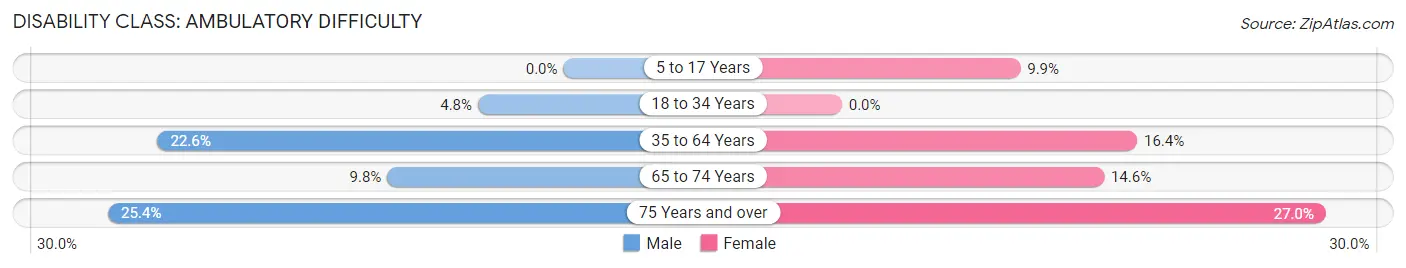
| Age Bracket | Male | Female |
| 5 to 17 Years | 0 (0.0%) | 17 (9.9%) |
| 18 to 34 Years | 21 (4.8%) | 0 (0.0%) |
| 35 to 64 Years | 783 (22.6%) | 769 (16.4%) |
| 65 to 74 Years | 528 (9.8%) | 1,126 (14.6%) |
| 75 Years and over | 1,571 (25.4%) | 2,359 (27.0%) |
Disability Class: Self-Care Difficulty
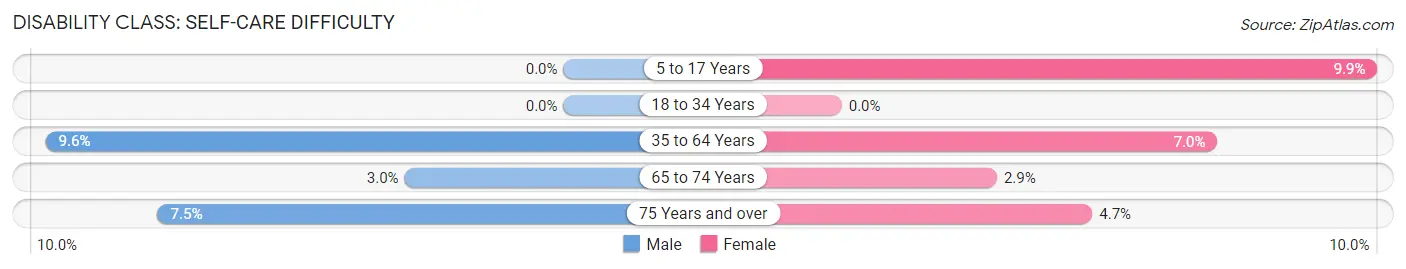
| Age Bracket | Male | Female |
| 5 to 17 Years | 0 (0.0%) | 17 (9.9%) |
| 18 to 34 Years | 0 (0.0%) | 0 (0.0%) |
| 35 to 64 Years | 333 (9.6%) | 326 (7.0%) |
| 65 to 74 Years | 159 (2.9%) | 222 (2.9%) |
| 75 Years and over | 467 (7.5%) | 407 (4.6%) |
Technology Access in Sun City
Computing Device Access in Sun City
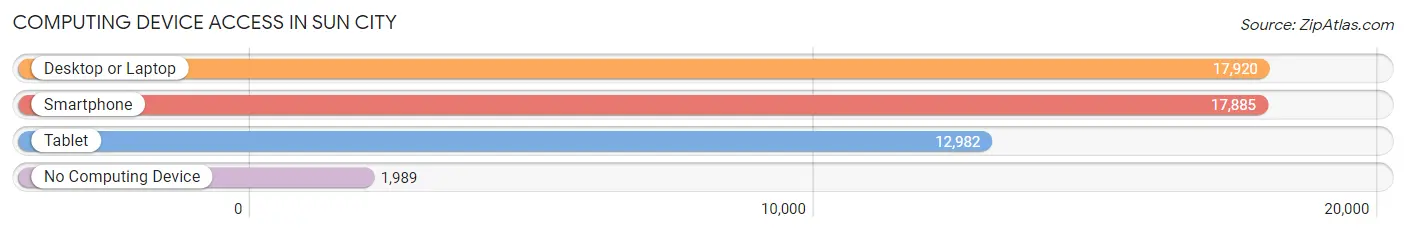
| Device Type | # Households | % Households |
| Desktop or Laptop | 17,920 | 78.3% |
| Smartphone | 17,885 | 78.1% |
| Tablet | 12,982 | 56.7% |
| No Computing Device | 1,989 | 8.7% |
| Total | 22,889 | 100.0% |
Internet Access in Sun City
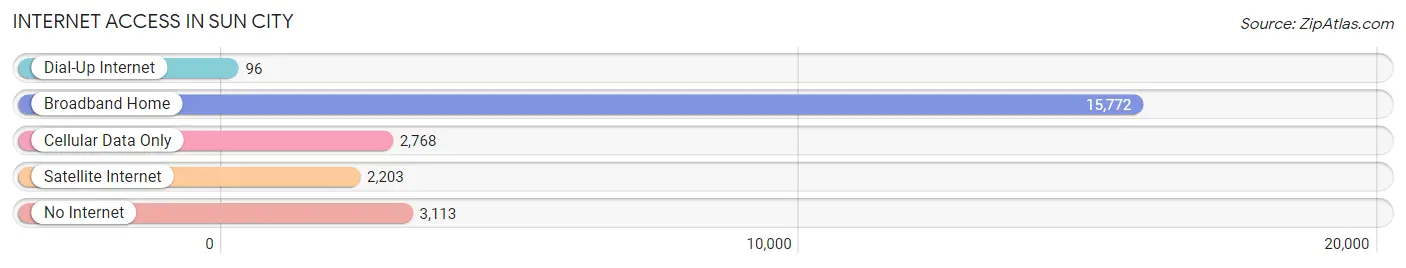
| Internet Type | # Households | % Households |
| Dial-Up Internet | 96 | 0.4% |
| Broadband Home | 15,772 | 68.9% |
| Cellular Data Only | 2,768 | 12.1% |
| Satellite Internet | 2,203 | 9.6% |
| No Internet | 3,113 | 13.6% |
| Total | 22,889 | 100.0% |
Sun City Summary
Sun City, Arizona is a census-designated place located in Maricopa County, Arizona. It is a retirement community located about 20 miles northwest of Phoenix. Sun City was the first retirement community of its kind in the United States, and it has been a popular destination for retirees since its founding in 1960.
Geography
Sun City is located in the northwest corner of Maricopa County, Arizona. It is bordered by the cities of Peoria to the north, Glendale to the east, and Surprise to the south. The city is situated in the Sonoran Desert, and the terrain is mostly flat with some rolling hills. The average elevation is 1,100 feet above sea level. The climate is hot and dry, with temperatures ranging from the mid-90s in the summer to the mid-60s in the winter.
Economy
Sun City’s economy is largely driven by its large retirement population. The city is home to several retirement communities, including Sun City West, Sun City Grand, and Sun City Festival. These communities offer a variety of amenities, including golf courses, swimming pools, and fitness centers. The city also has a number of shopping centers, restaurants, and other businesses catering to the needs of its residents.
Demographics
As of the 2010 census, Sun City had a population of 37,499. The median age was 72.7 years, and the median household income was $37,845. The racial makeup of the city was 94.3% White, 1.2% African American, 0.7% Native American, 0.7% Asian, 0.1% Pacific Islander, 1.3% from other races, and 2.0% from two or more races. Hispanic or Latino of any race were 5.2% of the population.
History
Sun City was founded in 1960 by developer Del Webb. It was the first retirement community of its kind in the United States, and it quickly became a popular destination for retirees. The city was designed to provide a safe and secure environment for its residents, and it was also designed to provide a variety of recreational activities. Sun City was incorporated in 1978, and it has since grown to become one of the largest retirement communities in the United States.
Sun City has been a popular destination for retirees for over 50 years. It is a safe and secure community with a variety of amenities and activities to keep its residents active and engaged. The city has a rich history and a vibrant economy, and it is a great place to live for those looking for a retirement destination.
Common Questions
What is Per Capita Income in Sun City?
Per Capita income in Sun City is $40,068.
What is the Median Family Income in Sun City?
Median Family Income in Sun City is $67,818.
What is the Median Household income in Sun City?
Median Household Income in Sun City is $51,263.
What is Income or Wage Gap in Sun City?
Income or Wage Gap in Sun City is 6.0%.
Women in Sun City earn 94.0 cents for every dollar earned by a man.
What is Inequality or Gini Index in Sun City?
Inequality or Gini Index in Sun City is 0.41.
What is the Total Population of Sun City?
Total Population of Sun City is 37,748.
What is the Total Male Population of Sun City?
Total Male Population of Sun City is 15,731.
What is the Total Female Population of Sun City?
Total Female Population of Sun City is 22,017.
What is the Ratio of Males per 100 Females in Sun City?
There are 71.45 Males per 100 Females in Sun City.
What is the Ratio of Females per 100 Males in Sun City?
There are 139.96 Females per 100 Males in Sun City.
What is the Median Population Age in Sun City?
Median Population Age in Sun City is 72.6 Years.
What is the Average Family Size in Sun City
Average Family Size in Sun City is 2.2 People.
What is the Average Household Size in Sun City
Average Household Size in Sun City is 1.6 People.
How Large is the Labor Force in Sun City?
There are 7,047 People in the Labor Forcein in Sun City.
What is the Percentage of People in the Labor Force in Sun City?
18.8% of People are in the Labor Force in Sun City.
What is the Unemployment Rate in Sun City?
Unemployment Rate in Sun City is 5.7%.