Bouse, AZ Map & Demographics
Bouse Map
Bouse Overview
$23,975
PER CAPITA INCOME
$46,535
AVG FAMILY INCOME
$39,279
AVG HOUSEHOLD INCOME
15.8%
WAGE / INCOME GAP [ % ]
84.2¢/ $1
WAGE / INCOME GAP [ $ ]
0.34
INEQUALITY / GINI INDEX
1,026
TOTAL POPULATION
565
MALE POPULATION
461
FEMALE POPULATION
122.56
MALES / 100 FEMALES
81.59
FEMALES / 100 MALES
75.5
MEDIAN AGE
2.1
AVG FAMILY SIZE
1.9
AVG HOUSEHOLD SIZE
152
LABOR FORCE [ PEOPLE ]
15.3%
PERCENT IN LABOR FORCE
3.9%
UNEMPLOYMENT RATE
Bouse Zip Codes
Bouse Area Codes
Income in Bouse
Income Overview in Bouse
Per Capita Income in Bouse is $23,975, while median incomes of families and households are $46,535 and $39,279 respectively.
| Characteristic | Number | Measure |
| Per Capita Income | 1,026 | $23,975 |
| Median Family Income | 422 | $46,535 |
| Mean Family Income | 422 | $52,312 |
| Median Household Income | 541 | $39,279 |
| Mean Household Income | 541 | $45,648 |
| Income Deficit | 422 | $0 |
| Wage / Income Gap (%) | 1,026 | 15.76% |
| Wage / Income Gap ($) | 1,026 | 84.24¢ per $1 |
| Gini / Inequality Index | 1,026 | 0.34 |
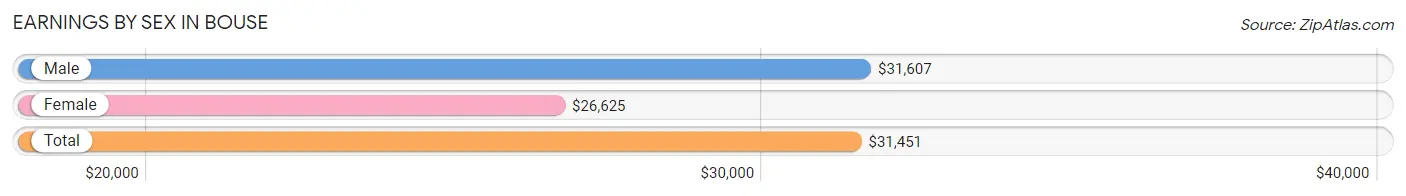
Earnings by Sex in Bouse
Average Earnings in Bouse are $31,451, $31,607 for men and $26,625 for women, a difference of 15.8%.
| Sex | Number | Average Earnings |
| Male | 112 (65.5%) | $31,607 |
| Female | 59 (34.5%) | $26,625 |
| Total | 171 (100.0%) | $31,451 |
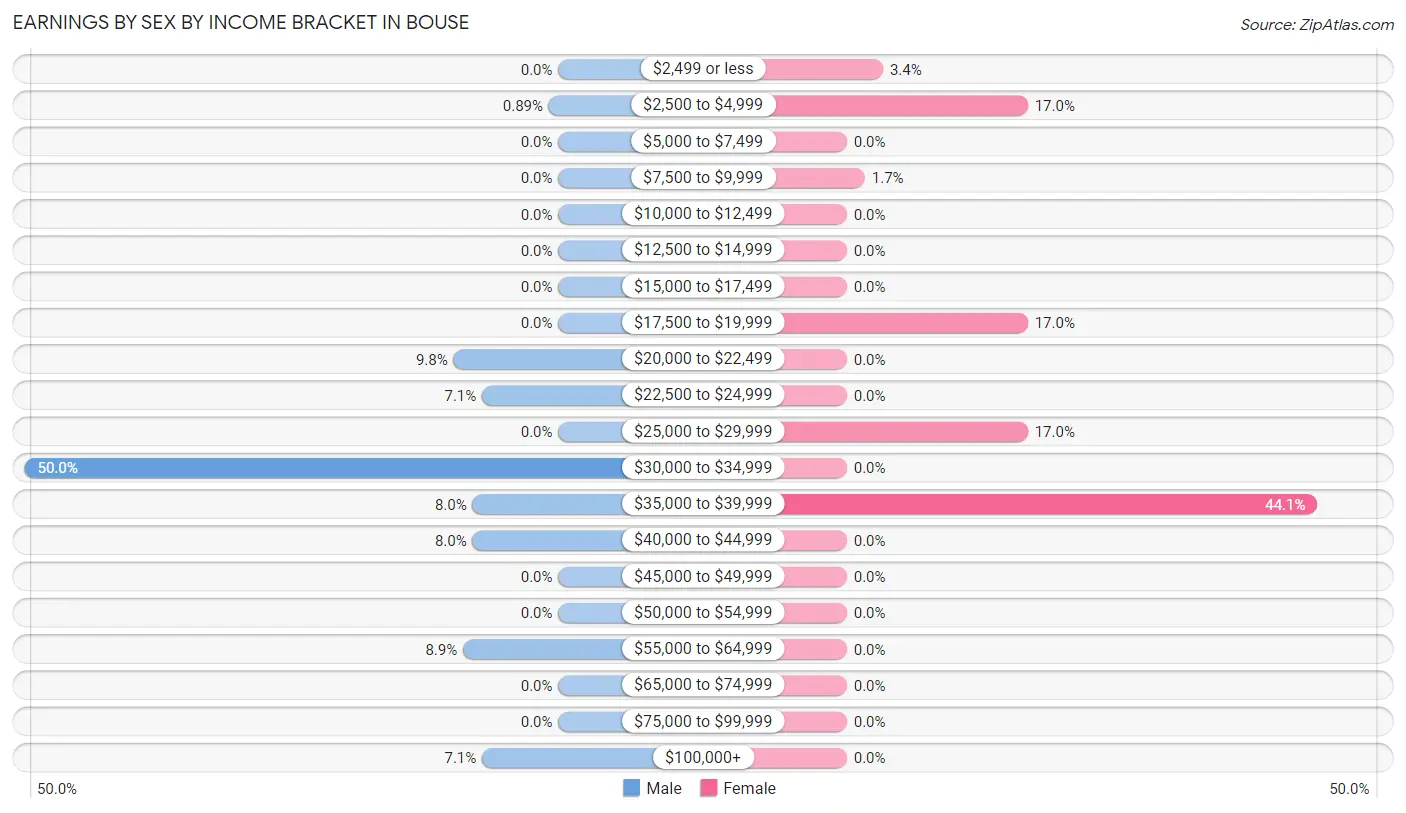
Earnings by Sex by Income Bracket in Bouse
The most common earnings brackets in Bouse are $30,000 to $34,999 for men (56 | 50.0%) and $35,000 to $39,999 for women (26 | 44.1%).
| Income | Male | Female |
| $2,499 or less | 0 (0.0%) | 2 (3.4%) |
| $2,500 to $4,999 | 1 (0.9%) | 10 (17.0%) |
| $5,000 to $7,499 | 0 (0.0%) | 0 (0.0%) |
| $7,500 to $9,999 | 0 (0.0%) | 1 (1.7%) |
| $10,000 to $12,499 | 0 (0.0%) | 0 (0.0%) |
| $12,500 to $14,999 | 0 (0.0%) | 0 (0.0%) |
| $15,000 to $17,499 | 0 (0.0%) | 0 (0.0%) |
| $17,500 to $19,999 | 0 (0.0%) | 10 (17.0%) |
| $20,000 to $22,499 | 11 (9.8%) | 0 (0.0%) |
| $22,500 to $24,999 | 8 (7.1%) | 0 (0.0%) |
| $25,000 to $29,999 | 0 (0.0%) | 10 (17.0%) |
| $30,000 to $34,999 | 56 (50.0%) | 0 (0.0%) |
| $35,000 to $39,999 | 9 (8.0%) | 26 (44.1%) |
| $40,000 to $44,999 | 9 (8.0%) | 0 (0.0%) |
| $45,000 to $49,999 | 0 (0.0%) | 0 (0.0%) |
| $50,000 to $54,999 | 0 (0.0%) | 0 (0.0%) |
| $55,000 to $64,999 | 10 (8.9%) | 0 (0.0%) |
| $65,000 to $74,999 | 0 (0.0%) | 0 (0.0%) |
| $75,000 to $99,999 | 0 (0.0%) | 0 (0.0%) |
| $100,000+ | 8 (7.1%) | 0 (0.0%) |
| Total | 112 (100.0%) | 59 (100.0%) |
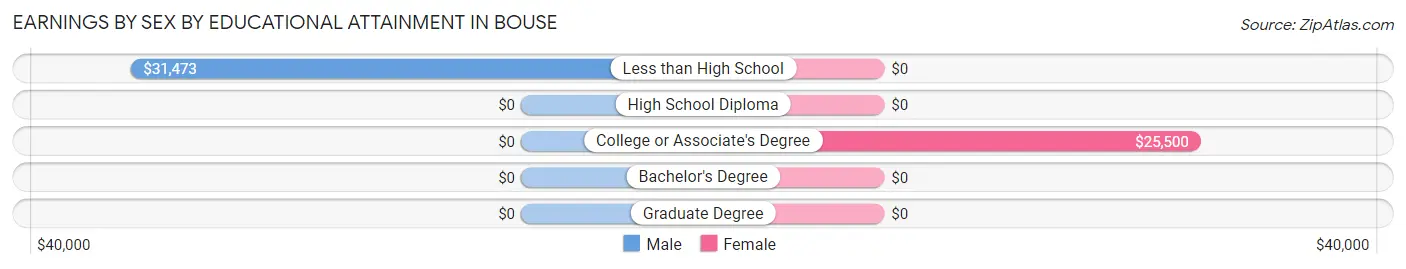
Earnings by Sex by Educational Attainment in Bouse
Average earnings in Bouse are $31,629 for men and $26,625 for women, a difference of 15.8%. Men with an educational attainment of less than high school enjoy the highest average annual earnings of $31,473, while those with less than high school education earn the least with $31,473. Women with an educational attainment of college or associate's degree earn the most with the average annual earnings of $25,500, while those with college or associate's degree education have the smallest earnings of $25,500.
| Educational Attainment | Male Income | Female Income |
| Less than High School | $31,473 | $0 |
| High School Diploma | - | - |
| College or Associate's Degree | - | - |
| Bachelor's Degree | - | - |
| Graduate Degree | - | - |
| Total | $31,629 | $26,625 |
Family Income in Bouse
Family Income Brackets in Bouse
According to the Bouse family income data, there are 130 families falling into the $25,000 to $34,999 income range, which is the most common income bracket and makes up 30.8% of all families.
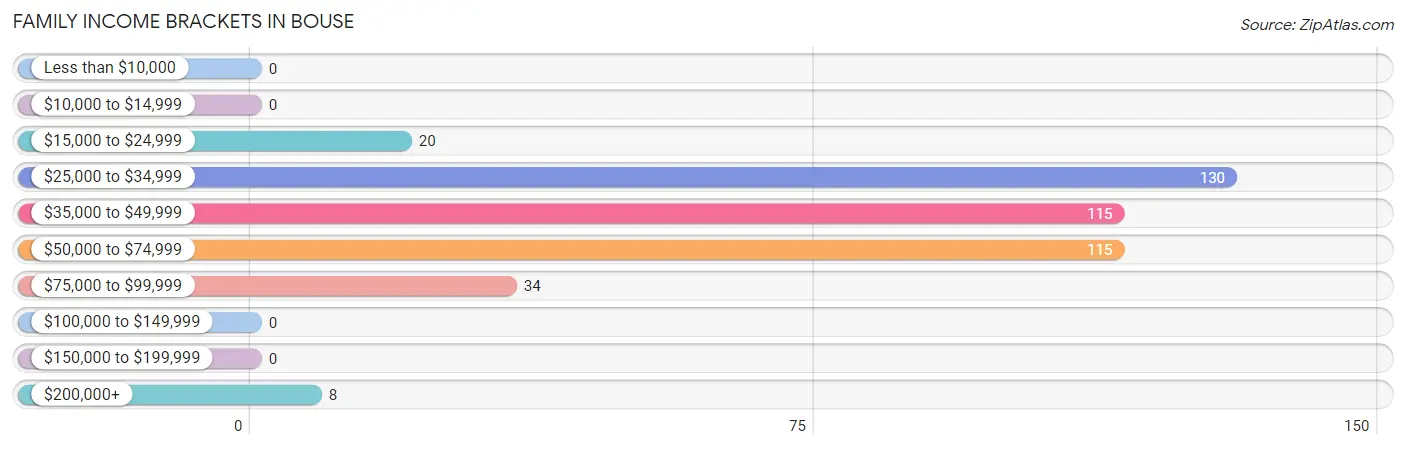
| Income Bracket | # Families | % Families |
| Less than $10,000 | 0 | 0.0% |
| $10,000 to $14,999 | 0 | 0.0% |
| $15,000 to $24,999 | 20 | 4.7% |
| $25,000 to $34,999 | 130 | 30.8% |
| $35,000 to $49,999 | 115 | 27.3% |
| $50,000 to $74,999 | 115 | 27.3% |
| $75,000 to $99,999 | 34 | 8.1% |
| $100,000 to $149,999 | 0 | 0.0% |
| $150,000 to $199,999 | 0 | 0.0% |
| $200,000+ | 8 | 1.9% |
Family Income by Famaliy Size in Bouse
2-person families (367 | 87.0%) account for the highest median family income in Bouse with $45,768 per family, while 2-person families (367 | 87.0%) have the highest median income of $22,884 per family member.
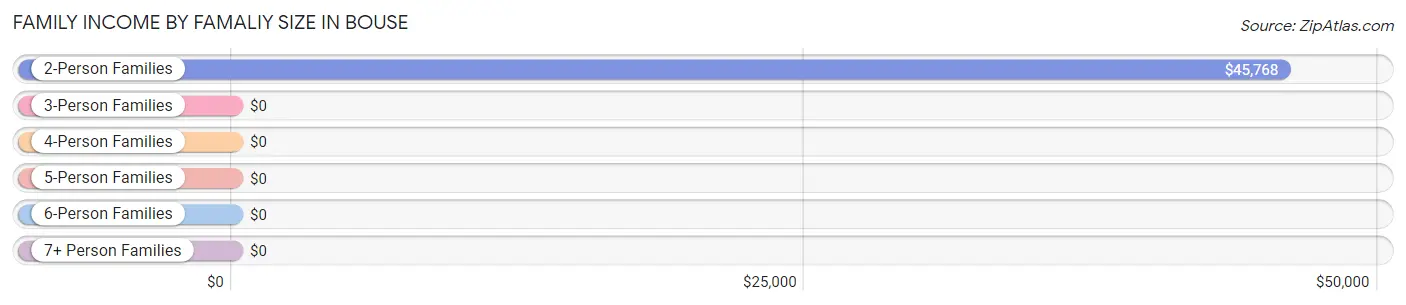
| Income Bracket | # Families | Median Income |
| 2-Person Families | 367 (87.0%) | $45,768 |
| 3-Person Families | 22 (5.2%) | $0 |
| 4-Person Families | 0 (0.0%) | $0 |
| 5-Person Families | 10 (2.4%) | $0 |
| 6-Person Families | 23 (5.4%) | $0 |
| 7+ Person Families | 0 (0.0%) | $0 |
| Total | 422 (100.0%) | $46,535 |
Family Income by Number of Earners in Bouse
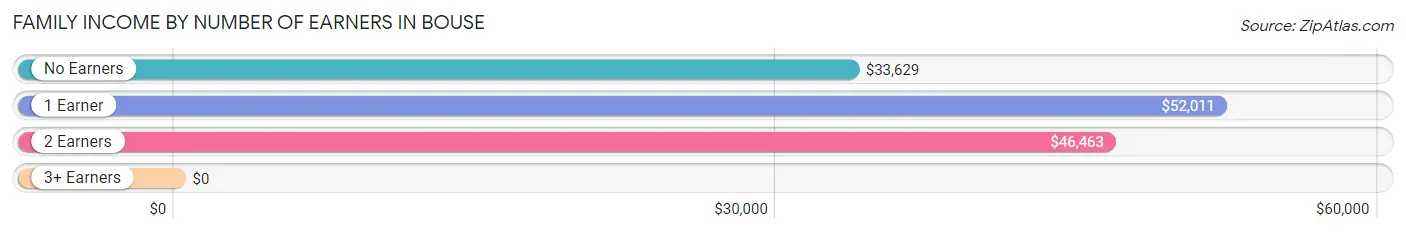
| Number of Earners | # Families | Median Income |
| No Earners | 246 (58.3%) | $33,629 |
| 1 Earner | 101 (23.9%) | $52,011 |
| 2 Earners | 75 (17.8%) | $46,463 |
| 3+ Earners | 0 (0.0%) | $0 |
| Total | 422 (100.0%) | $46,535 |
Household Income in Bouse
Household Income Brackets in Bouse
With 132 households falling in the category, the $50,000 to $74,999 income range is the most frequent in Bouse, accounting for 24.4% of all households.
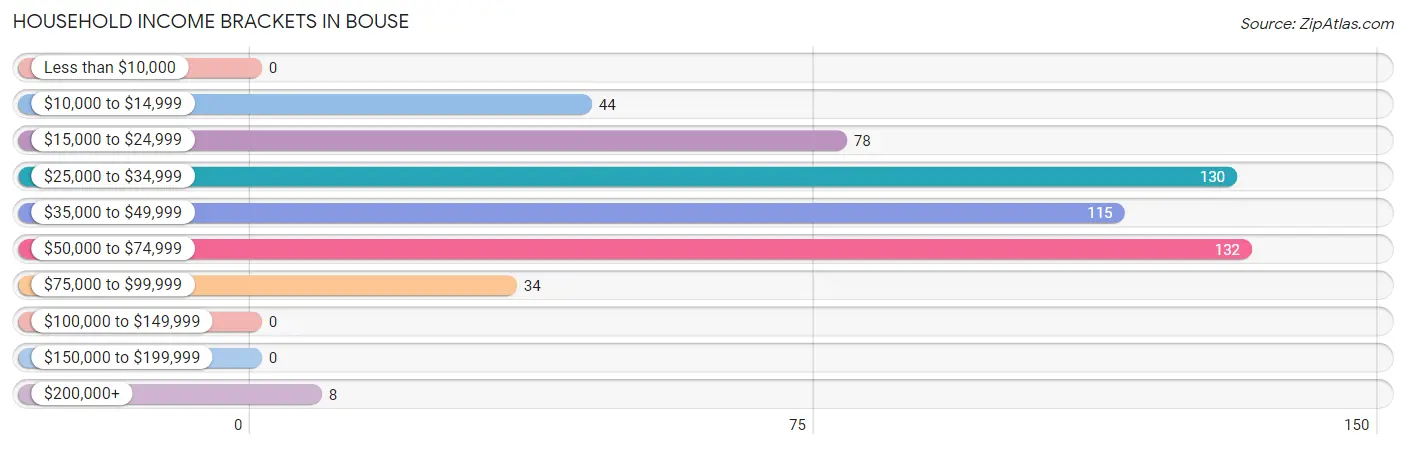
| Income Bracket | # Households | % Households |
| Less than $10,000 | 0 | 0.0% |
| $10,000 to $14,999 | 44 | 8.1% |
| $15,000 to $24,999 | 78 | 14.4% |
| $25,000 to $34,999 | 130 | 24.0% |
| $35,000 to $49,999 | 115 | 21.3% |
| $50,000 to $74,999 | 132 | 24.4% |
| $75,000 to $99,999 | 34 | 6.3% |
| $100,000 to $149,999 | 0 | 0.0% |
| $150,000 to $199,999 | 0 | 0.0% |
| $200,000+ | 8 | 1.5% |
Household Income by Householder Age in Bouse
The median household income in Bouse is $39,279, with the highest median household income of $57,778 found in the 45 to 64 years age bracket for the primary householder. A total of 64 households (11.8%) fall into this category.
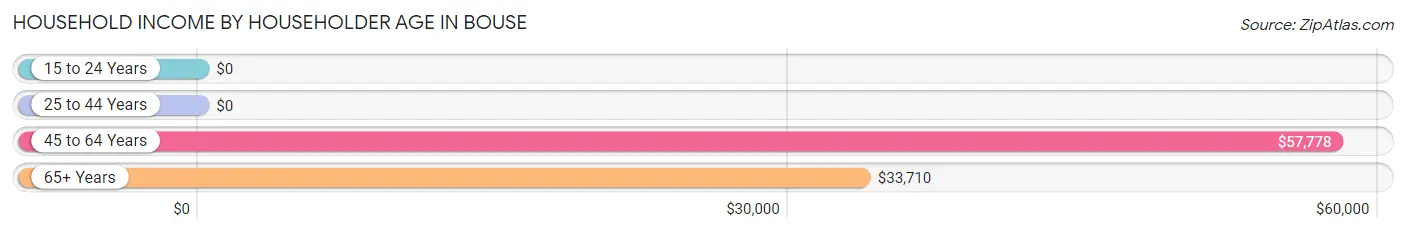
| Income Bracket | # Households | Median Income |
| 15 to 24 Years | 0 (0.0%) | $0 |
| 25 to 44 Years | 47 (8.7%) | $0 |
| 45 to 64 Years | 64 (11.8%) | $57,778 |
| 65+ Years | 430 (79.5%) | $33,710 |
| Total | 541 (100.0%) | $39,279 |
Poverty in Bouse
Income Below Poverty by Sex and Age in Bouse
With 6.6% poverty level for males and 7.2% for females among the residents of Bouse, 35 to 44 year old males and 6 to 11 year old females are the most vulnerable to poverty, with 1 males (100.0%) and 8 females (100.0%) in their respective age groups living below the poverty level.
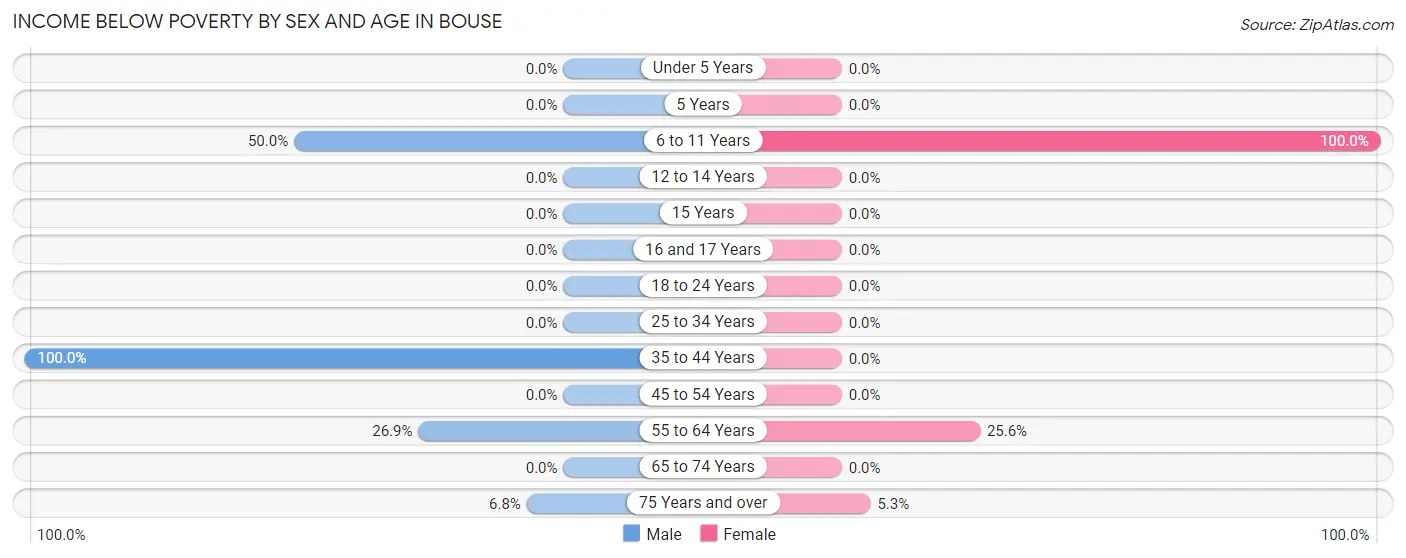
| Age Bracket | Male | Female |
| Under 5 Years | 0 (0.0%) | 0 (0.0%) |
| 5 Years | 0 (0.0%) | 0 (0.0%) |
| 6 to 11 Years | 7 (50.0%) | 8 (100.0%) |
| 12 to 14 Years | 0 (0.0%) | 0 (0.0%) |
| 15 Years | 0 (0.0%) | 0 (0.0%) |
| 16 and 17 Years | 0 (0.0%) | 0 (0.0%) |
| 18 to 24 Years | 0 (0.0%) | 0 (0.0%) |
| 25 to 34 Years | 0 (0.0%) | 0 (0.0%) |
| 35 to 44 Years | 1 (100.0%) | 0 (0.0%) |
| 45 to 54 Years | 0 (0.0%) | 0 (0.0%) |
| 55 to 64 Years | 7 (26.9%) | 10 (25.6%) |
| 65 to 74 Years | 0 (0.0%) | 0 (0.0%) |
| 75 Years and over | 22 (6.8%) | 15 (5.3%) |
| Total | 37 (6.6%) | 33 (7.2%) |
Income Above Poverty by Sex and Age in Bouse
According to the poverty statistics in Bouse, males aged under 5 years and females aged 35 to 44 years are the age groups that are most secure financially, with 100.0% of males and 100.0% of females in these age groups living above the poverty line.
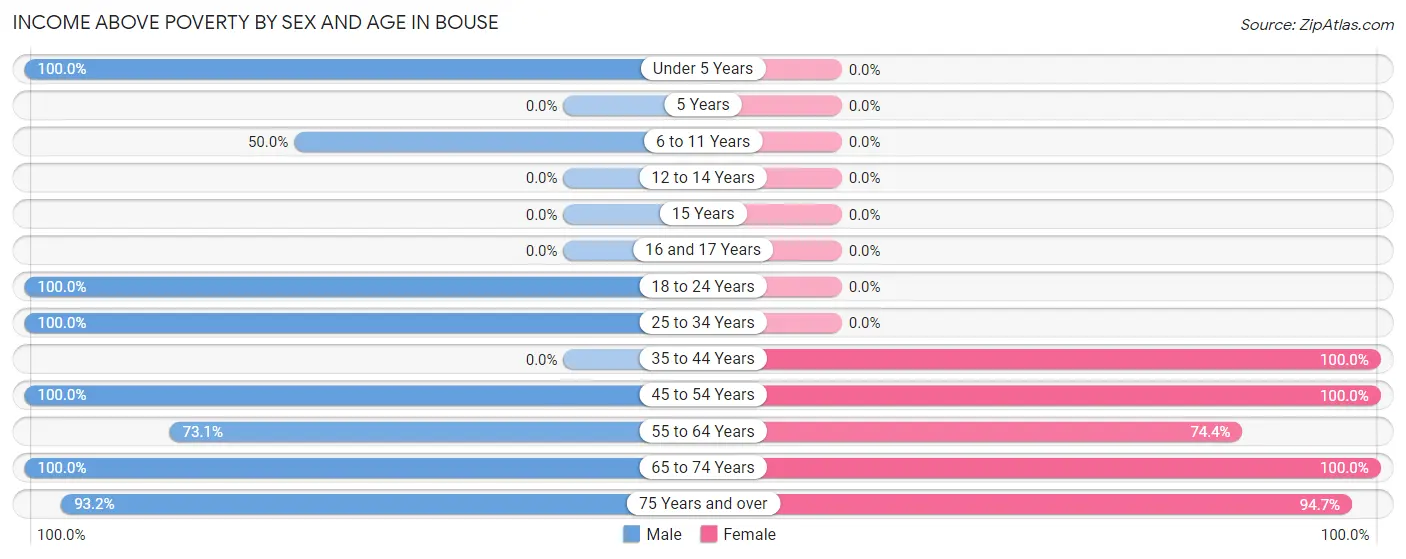
| Age Bracket | Male | Female |
| Under 5 Years | 13 (100.0%) | 0 (0.0%) |
| 5 Years | 0 (0.0%) | 0 (0.0%) |
| 6 to 11 Years | 7 (50.0%) | 0 (0.0%) |
| 12 to 14 Years | 0 (0.0%) | 0 (0.0%) |
| 15 Years | 0 (0.0%) | 0 (0.0%) |
| 16 and 17 Years | 0 (0.0%) | 0 (0.0%) |
| 18 to 24 Years | 1 (100.0%) | 0 (0.0%) |
| 25 to 34 Years | 49 (100.0%) | 0 (0.0%) |
| 35 to 44 Years | 0 (0.0%) | 10 (100.0%) |
| 45 to 54 Years | 18 (100.0%) | 23 (100.0%) |
| 55 to 64 Years | 19 (73.1%) | 29 (74.4%) |
| 65 to 74 Years | 120 (100.0%) | 99 (100.0%) |
| 75 Years and over | 301 (93.2%) | 267 (94.7%) |
| Total | 528 (93.4%) | 428 (92.8%) |
Income Below Poverty Among Married-Couple Families in Bouse
The poverty statistics for married-couple families in Bouse show that 2.7% or 10 of the total 375 families live below the poverty line. Families with 1 or 2 children have the highest poverty rate of 30.3%, comprising of 10 families. On the other hand, families with no children have the lowest poverty rate of 0.0%, which includes 0 families.
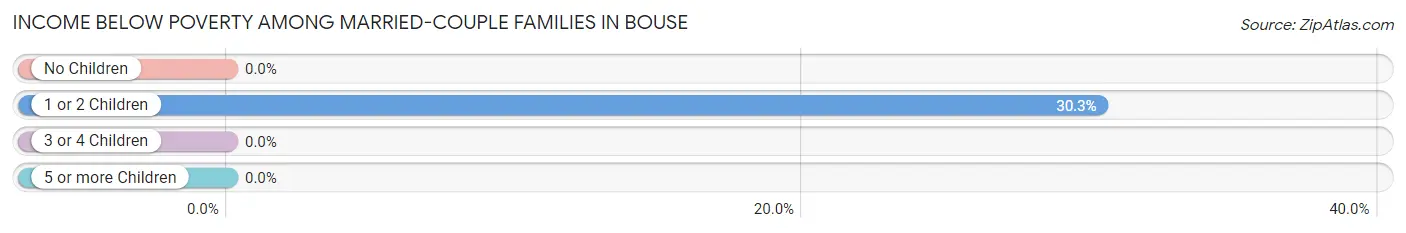
| Children | Above Poverty | Below Poverty |
| No Children | 342 (100.0%) | 0 (0.0%) |
| 1 or 2 Children | 23 (69.7%) | 10 (30.3%) |
| 3 or 4 Children | 0 (0.0%) | 0 (0.0%) |
| 5 or more Children | 0 (0.0%) | 0 (0.0%) |
| Total | 365 (97.3%) | 10 (2.7%) |
Income Below Poverty Among Single-Parent Households in Bouse
| Children | Single Father | Single Mother |
| No Children | 0 (0.0%) | 0 (0.0%) |
| 1 or 2 Children | 0 (0.0%) | 0 (0.0%) |
| 3 or 4 Children | 0 (0.0%) | 0 (0.0%) |
| 5 or more Children | 0 (0.0%) | 0 (0.0%) |
| Total | 0 (0.0%) | 0 (0.0%) |
Income Below Poverty Among Married-Couple vs Single-Parent Households in Bouse
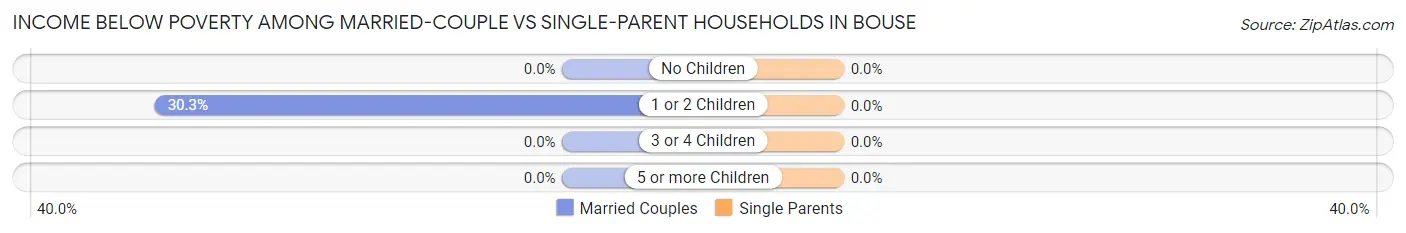
| Children | Married-Couple Families | Single-Parent Households |
| No Children | 0 (0.0%) | 0 (0.0%) |
| 1 or 2 Children | 10 (30.3%) | 0 (0.0%) |
| 3 or 4 Children | 0 (0.0%) | 0 (0.0%) |
| 5 or more Children | 0 (0.0%) | 0 (0.0%) |
| Total | 10 (2.7%) | 0 (0.0%) |
Race in Bouse
The most populous races in Bouse are White / Caucasian (976 | 95.1%), and Two or more Races (50 | 4.9%).
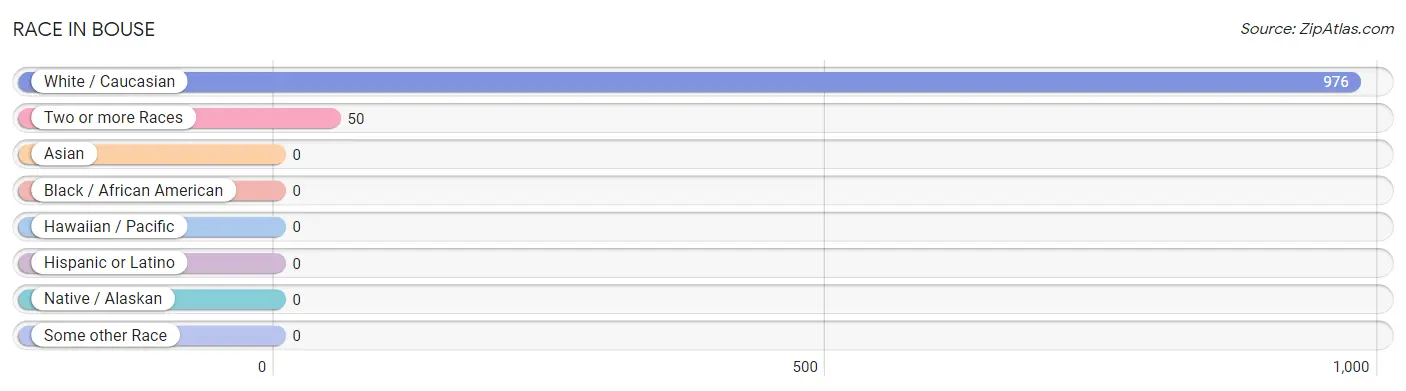
| Race | # Population | % Population |
| Asian | 0 | 0.0% |
| Black / African American | 0 | 0.0% |
| Hawaiian / Pacific | 0 | 0.0% |
| Hispanic or Latino | 0 | 0.0% |
| Native / Alaskan | 0 | 0.0% |
| White / Caucasian | 976 | 95.1% |
| Two or more Races | 50 | 4.9% |
| Some other Race | 0 | 0.0% |
| Total | 1,026 | 100.0% |
Ancestry in Bouse
The most populous ancestries reported in Bouse are German (252 | 24.6%), Irish (159 | 15.5%), English (75 | 7.3%), French (47 | 4.6%), and Norwegian (45 | 4.4%), together accounting for 56.3% of all Bouse residents.
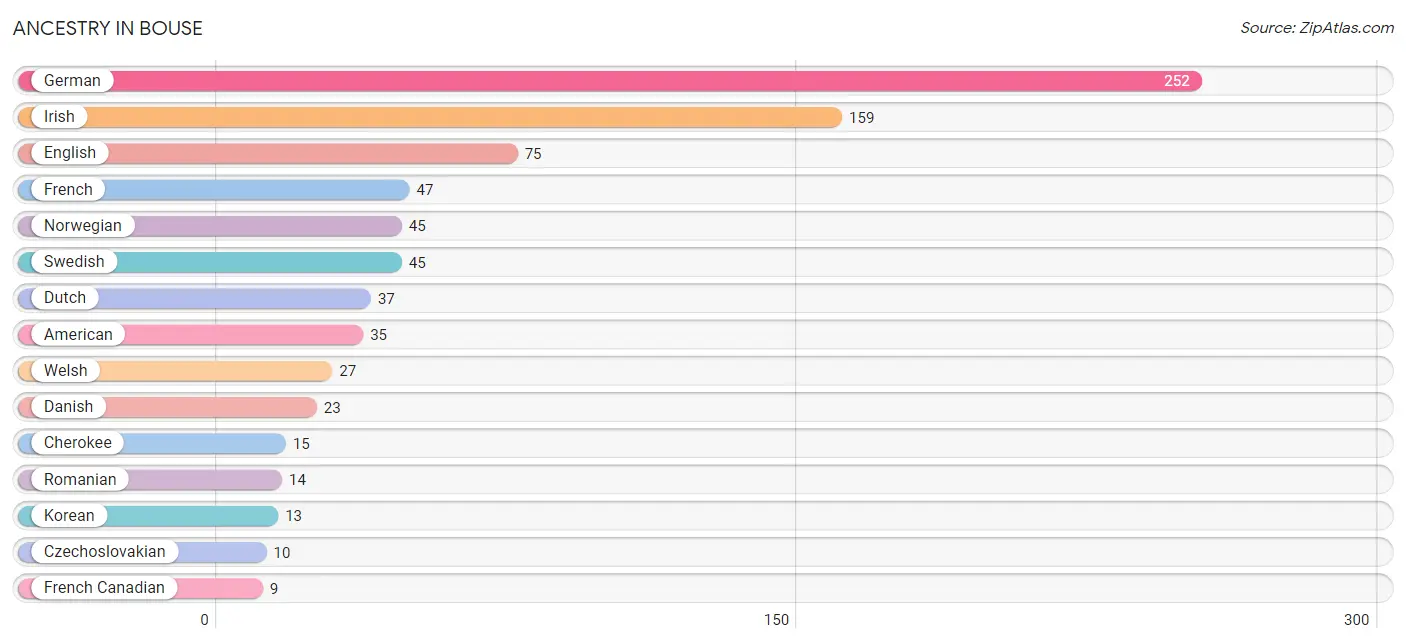
| Ancestry | # Population | % Population |
| American | 35 | 3.4% |
| Australian | 8 | 0.8% |
| Cherokee | 15 | 1.5% |
| Czechoslovakian | 10 | 1.0% |
| Danish | 23 | 2.2% |
| Dutch | 37 | 3.6% |
| English | 75 | 7.3% |
| Finnish | 8 | 0.8% |
| French | 47 | 4.6% |
| French Canadian | 9 | 0.9% |
| German | 252 | 24.6% |
| Irish | 159 | 15.5% |
| Italian | 9 | 0.9% |
| Korean | 13 | 1.3% |
| Norwegian | 45 | 4.4% |
| Romanian | 14 | 1.4% |
| Swedish | 45 | 4.4% |
| Welsh | 27 | 2.6% | View All 18 Rows |
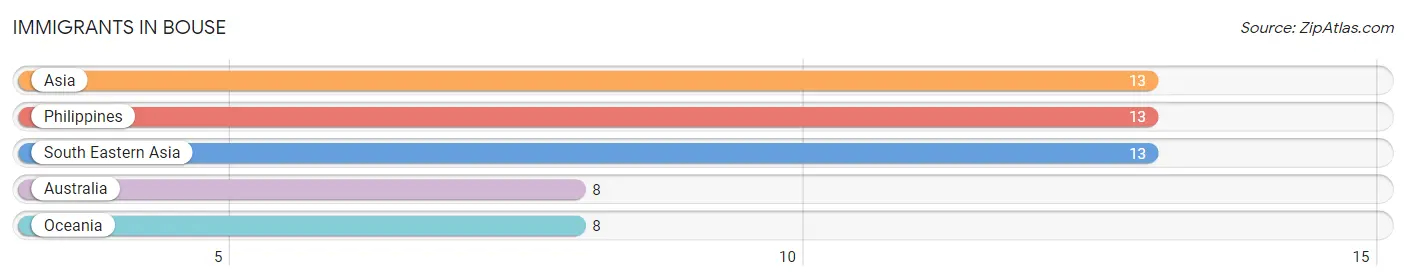
Immigrants in Bouse
The most numerous immigrant groups reported in Bouse came from Asia (13 | 1.3%), Philippines (13 | 1.3%), South Eastern Asia (13 | 1.3%), Australia (8 | 0.8%), and Oceania (8 | 0.8%), together accounting for 5.4% of all Bouse residents.
| Immigration Origin | # Population | % Population |
| Asia | 13 | 1.3% |
| Australia | 8 | 0.8% |
| Oceania | 8 | 0.8% |
| Philippines | 13 | 1.3% |
| South Eastern Asia | 13 | 1.3% | View All 5 Rows |
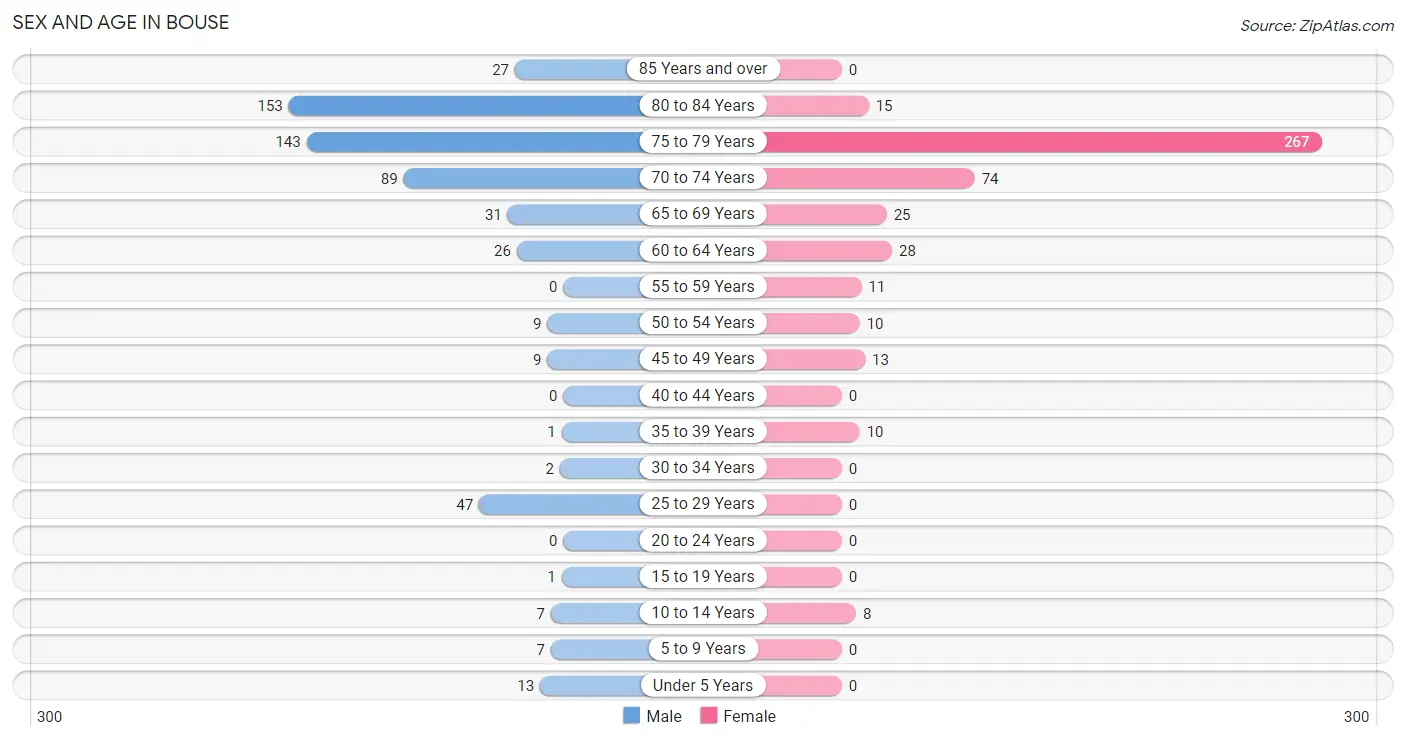
Sex and Age in Bouse
Sex and Age in Bouse
The most populous age groups in Bouse are 80 to 84 Years (153 | 27.1%) for men and 75 to 79 Years (267 | 57.9%) for women.
| Age Bracket | Male | Female |
| Under 5 Years | 13 (2.3%) | 0 (0.0%) |
| 5 to 9 Years | 7 (1.2%) | 0 (0.0%) |
| 10 to 14 Years | 7 (1.2%) | 8 (1.7%) |
| 15 to 19 Years | 1 (0.2%) | 0 (0.0%) |
| 20 to 24 Years | 0 (0.0%) | 0 (0.0%) |
| 25 to 29 Years | 47 (8.3%) | 0 (0.0%) |
| 30 to 34 Years | 2 (0.4%) | 0 (0.0%) |
| 35 to 39 Years | 1 (0.2%) | 10 (2.2%) |
| 40 to 44 Years | 0 (0.0%) | 0 (0.0%) |
| 45 to 49 Years | 9 (1.6%) | 13 (2.8%) |
| 50 to 54 Years | 9 (1.6%) | 10 (2.2%) |
| 55 to 59 Years | 0 (0.0%) | 11 (2.4%) |
| 60 to 64 Years | 26 (4.6%) | 28 (6.1%) |
| 65 to 69 Years | 31 (5.5%) | 25 (5.4%) |
| 70 to 74 Years | 89 (15.8%) | 74 (16.1%) |
| 75 to 79 Years | 143 (25.3%) | 267 (57.9%) |
| 80 to 84 Years | 153 (27.1%) | 15 (3.3%) |
| 85 Years and over | 27 (4.8%) | 0 (0.0%) |
| Total | 565 (100.0%) | 461 (100.0%) |
Families and Households in Bouse
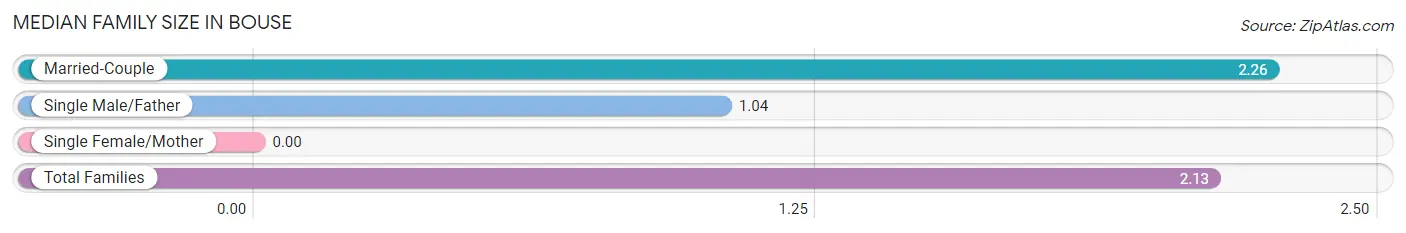
Median Family Size in Bouse
| Family Type | # Families | Family Size |
| Married-Couple | 375 (88.9%) | 2.26 |
| Single Male/Father | 47 (11.1%) | 1.04 |
| Single Female/Mother | 0 (0.0%) | - |
| Total Families | 422 (100.0%) | 2.13 |
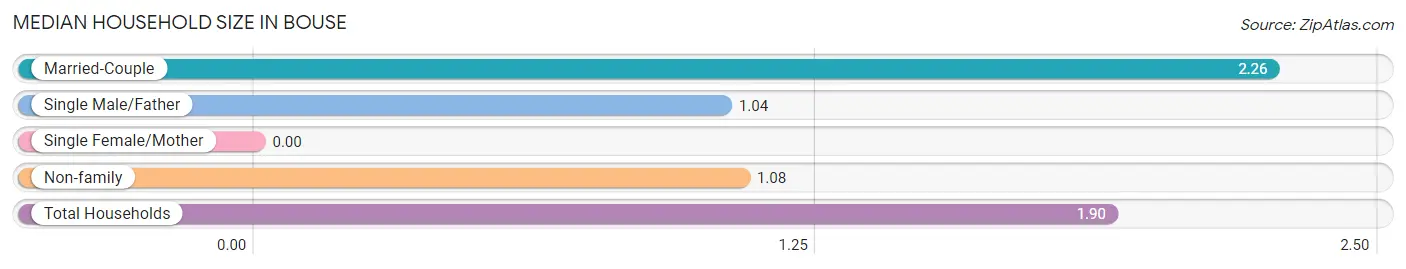
Median Household Size in Bouse
| Household Type | # Households | Household Size |
| Married-Couple | 375 (69.3%) | 2.26 |
| Single Male/Father | 47 (8.7%) | 1.04 |
| Single Female/Mother | 0 (0.0%) | - |
| Non-family | 119 (22.0%) | 1.08 |
| Total Households | 541 (100.0%) | 1.90 |
Household Size by Marriage Status in Bouse
Out of a total of 541 households in Bouse, 422 (78.0%) are family households, while 119 (22.0%) are nonfamily households. The most numerous type of family households are 2-person households, comprising 367, and the most common type of nonfamily households are 1-person households, comprising 110.
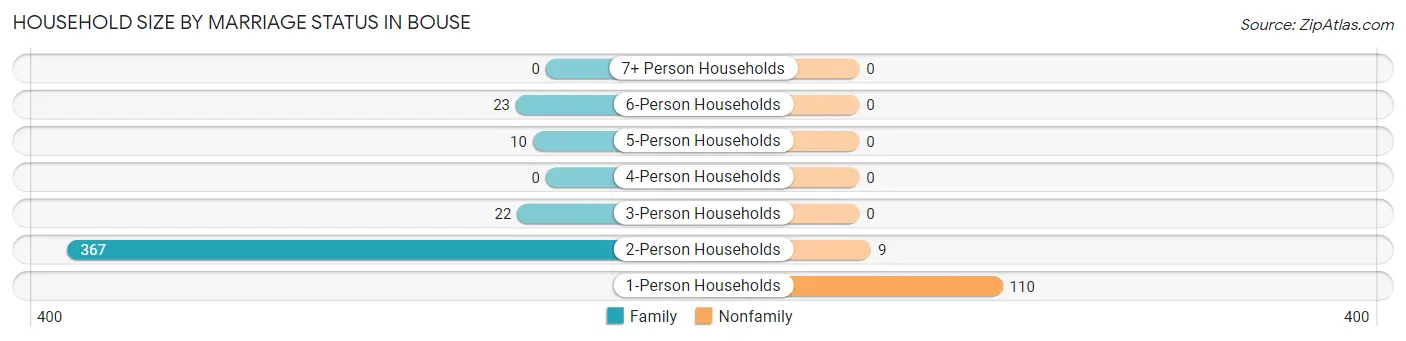
| Household Size | Family Households | Nonfamily Households |
| 1-Person Households | - | 110 (20.3%) |
| 2-Person Households | 367 (67.8%) | 9 (1.7%) |
| 3-Person Households | 22 (4.1%) | 0 (0.0%) |
| 4-Person Households | 0 (0.0%) | 0 (0.0%) |
| 5-Person Households | 10 (1.8%) | 0 (0.0%) |
| 6-Person Households | 23 (4.3%) | 0 (0.0%) |
| 7+ Person Households | 0 (0.0%) | 0 (0.0%) |
| Total | 422 (78.0%) | 119 (22.0%) |
Female Fertility in Bouse
Fertility by Age in Bouse
| Age Bracket | Women with Births | Births / 1,000 Women |
| 15 to 19 years | 0 (0.0%) | 0.0 |
| 20 to 34 years | 0 (0.0%) | 0.0 |
| 35 to 50 years | 0 (0.0%) | 0.0 |
| Total | 0 (0.0%) | 0.0 |
Fertility by Age by Marriage Status in Bouse
| Age Bracket | Married | Unmarried |
| 15 to 19 years | 0 (0.0%) | 0 (0.0%) |
| 20 to 34 years | 0 (0.0%) | 0 (0.0%) |
| 35 to 50 years | 0 (0.0%) | 0 (0.0%) |
| Total | 0 (0.0%) | 0 (0.0%) |
Fertility by Education in Bouse
| Educational Attainment | Women with Births | Births / 1,000 Women |
| Less than High School | 0 (0.0%) | 0.0 |
| High School Diploma | 0 (0.0%) | 0.0 |
| College or Associate's Degree | 0 (0.0%) | 0.0 |
| Bachelor's Degree | 0 (0.0%) | 0.0 |
| Graduate Degree | 0 (0.0%) | 0.0 |
| Total | 0 (0.0%) | 0.0 |
Fertility by Education by Marriage Status in Bouse
| Educational Attainment | Married | Unmarried |
| Less than High School | 0 (0.0%) | 0 (0.0%) |
| High School Diploma | 0 (0.0%) | 0 (0.0%) |
| College or Associate's Degree | 0 (0.0%) | 0 (0.0%) |
| Bachelor's Degree | 0 (0.0%) | 0 (0.0%) |
| Graduate Degree | 0 (0.0%) | 0 (0.0%) |
| Total | 0 (0.0%) | 0 (0.0%) |
Employment Characteristics in Bouse
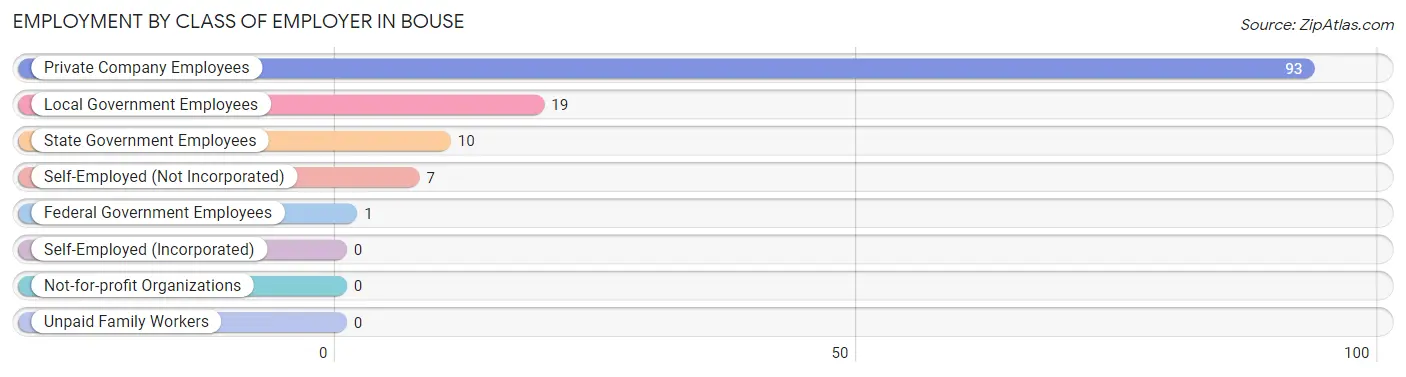
Employment by Class of Employer in Bouse
Among the 130 employed individuals in Bouse, private company employees (93 | 71.5%), local government employees (19 | 14.6%), and state government employees (10 | 7.7%) make up the most common classes of employment.
| Employer Class | # Employees | % Employees |
| Private Company Employees | 93 | 71.5% |
| Self-Employed (Incorporated) | 0 | 0.0% |
| Self-Employed (Not Incorporated) | 7 | 5.4% |
| Not-for-profit Organizations | 0 | 0.0% |
| Local Government Employees | 19 | 14.6% |
| State Government Employees | 10 | 7.7% |
| Federal Government Employees | 1 | 0.8% |
| Unpaid Family Workers | 0 | 0.0% |
| Total | 130 | 100.0% |
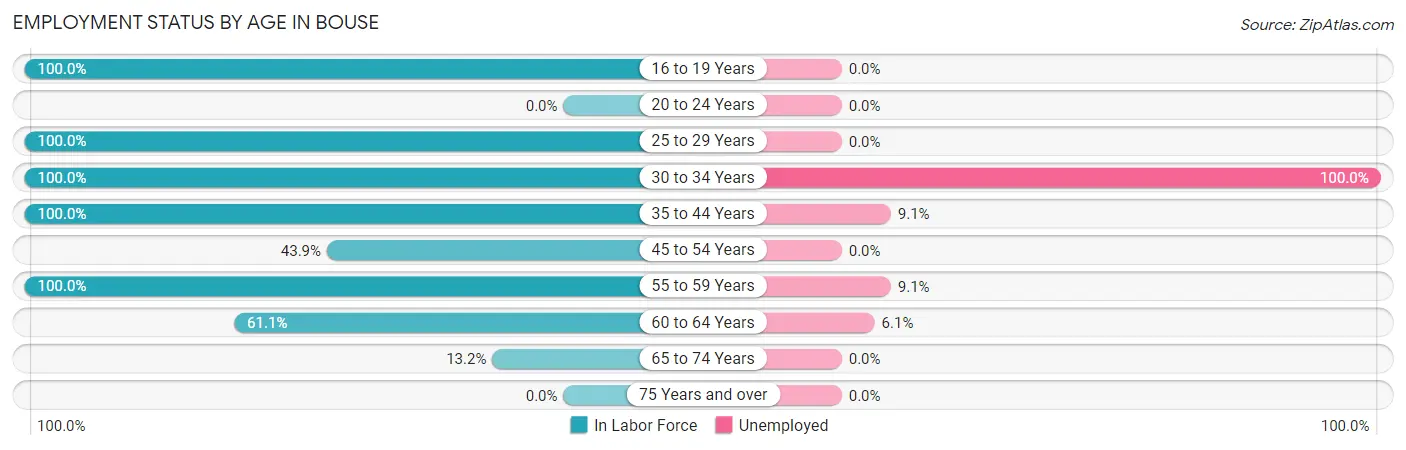
Employment Status by Age in Bouse
According to the labor force statistics for Bouse, out of the total population over 16 years of age (991), 15.3% or 152 individuals are in the labor force, with 3.9% or 6 of them unemployed. The age group with the highest labor force participation rate is 16 to 19 years, with 100.0% or 1 individuals in the labor force. Within the labor force, the 30 to 34 years age range has the highest percentage of unemployed individuals, with 100.0% or 2 of them being unemployed.
| Age Bracket | In Labor Force | Unemployed |
| 16 to 19 Years | 1 (100.0%) | 0 (0.0%) |
| 20 to 24 Years | 0 (0.0%) | 0 (0.0%) |
| 25 to 29 Years | 47 (100.0%) | 0 (0.0%) |
| 30 to 34 Years | 2 (100.0%) | 2 (100.0%) |
| 35 to 44 Years | 11 (100.0%) | 1 (9.1%) |
| 45 to 54 Years | 18 (43.9%) | 0 (0.0%) |
| 55 to 59 Years | 11 (100.0%) | 1 (9.1%) |
| 60 to 64 Years | 33 (61.1%) | 2 (6.1%) |
| 65 to 74 Years | 29 (13.2%) | 0 (0.0%) |
| 75 Years and over | 0 (0.0%) | 0 (0.0%) |
| Total | 152 (15.3%) | 6 (3.9%) |
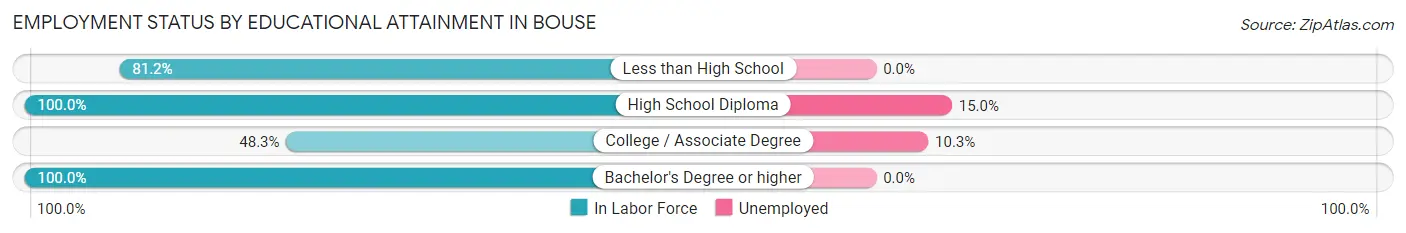
Employment Status by Educational Attainment in Bouse
According to labor force statistics for Bouse, 73.5% of individuals (122) out of the total population between 25 and 64 years of age (166) are in the labor force, with 4.9% or 6 of them being unemployed. The group with the highest labor force participation rate are those with the educational attainment of high school diploma, with 100.0% or 20 individuals in the labor force. Within the labor force, individuals with high school diploma education have the highest percentage of unemployment, with 15.0% or 3 of them being unemployed.
| Educational Attainment | In Labor Force | Unemployed |
| Less than High School | 56 (81.2%) | 0 (0.0%) |
| High School Diploma | 20 (100.0%) | 3 (15.0%) |
| College / Associate Degree | 29 (48.3%) | 6 (10.3%) |
| Bachelor's Degree or higher | 17 (100.0%) | 0 (0.0%) |
| Total | 122 (73.5%) | 8 (4.9%) |
Employment Occupations by Sex in Bouse
Management, Business, Science and Arts Occupations
The most common Management, Business, Science and Arts occupations in Bouse are Management (24 | 16.4%), Community & Social Service (20 | 13.7%), Health Diagnosing & Treating (16 | 11.0%), Education Instruction & Library (10 | 6.9%), and Arts, Media & Entertainment (10 | 6.9%).
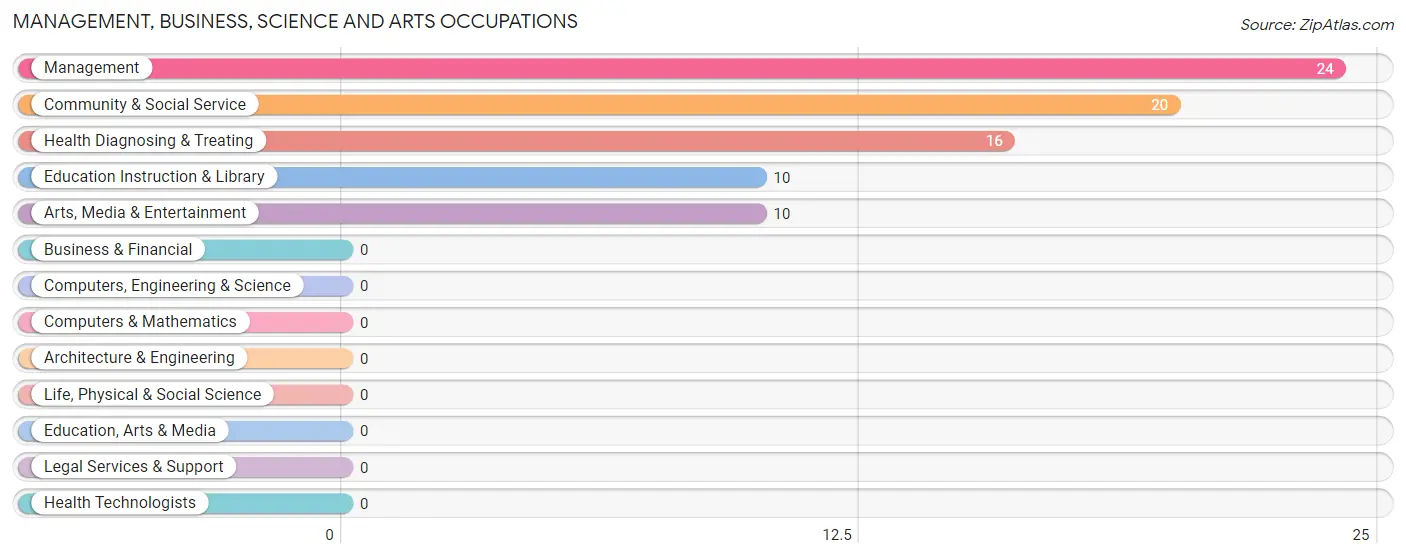
Management, Business, Science and Arts Occupations by Sex
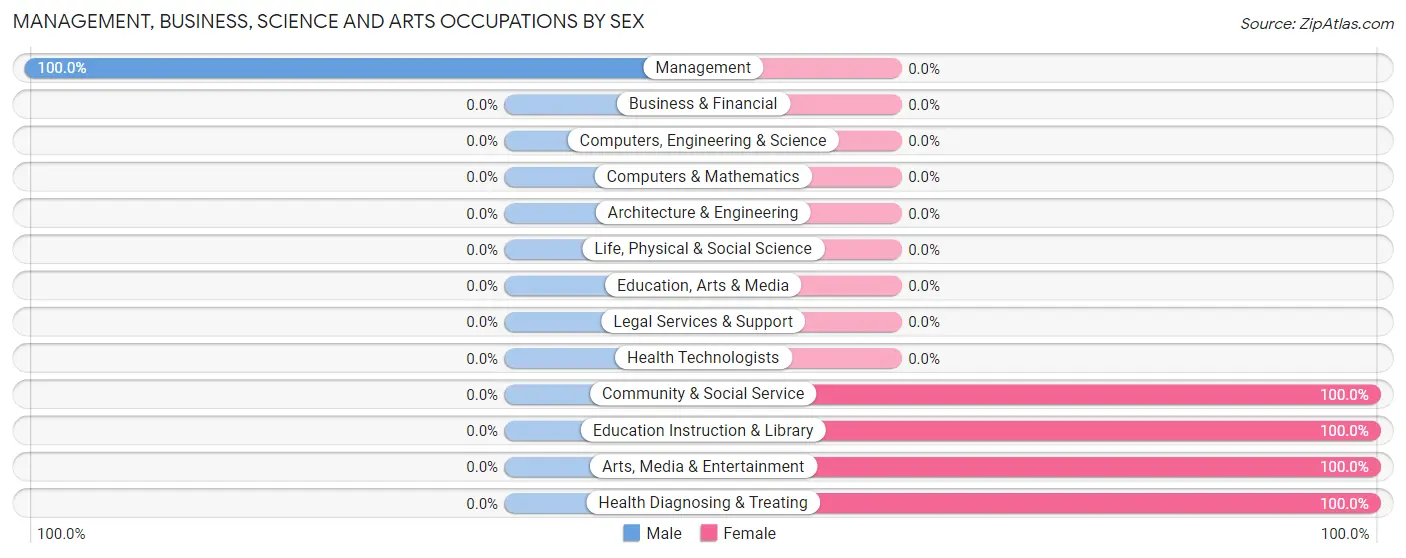
| Occupation | Male | Female |
| Management | 24 (100.0%) | 0 (0.0%) |
| Business & Financial | 0 (0.0%) | 0 (0.0%) |
| Computers, Engineering & Science | 0 (0.0%) | 0 (0.0%) |
| Computers & Mathematics | 0 (0.0%) | 0 (0.0%) |
| Architecture & Engineering | 0 (0.0%) | 0 (0.0%) |
| Life, Physical & Social Science | 0 (0.0%) | 0 (0.0%) |
| Community & Social Service | 0 (0.0%) | 20 (100.0%) |
| Education, Arts & Media | 0 (0.0%) | 0 (0.0%) |
| Legal Services & Support | 0 (0.0%) | 0 (0.0%) |
| Education Instruction & Library | 0 (0.0%) | 10 (100.0%) |
| Arts, Media & Entertainment | 0 (0.0%) | 10 (100.0%) |
| Health Diagnosing & Treating | 0 (0.0%) | 16 (100.0%) |
| Health Technologists | 0 (0.0%) | 0 (0.0%) |
| Total (Category) | 24 (40.0%) | 36 (60.0%) |
| Total (Overall) | 100 (68.5%) | 46 (31.5%) |
Services Occupations
The most common Services occupations in Bouse are Cleaning & Maintenance (56 | 38.4%), and Food Preparation & Serving (1 | 0.7%).
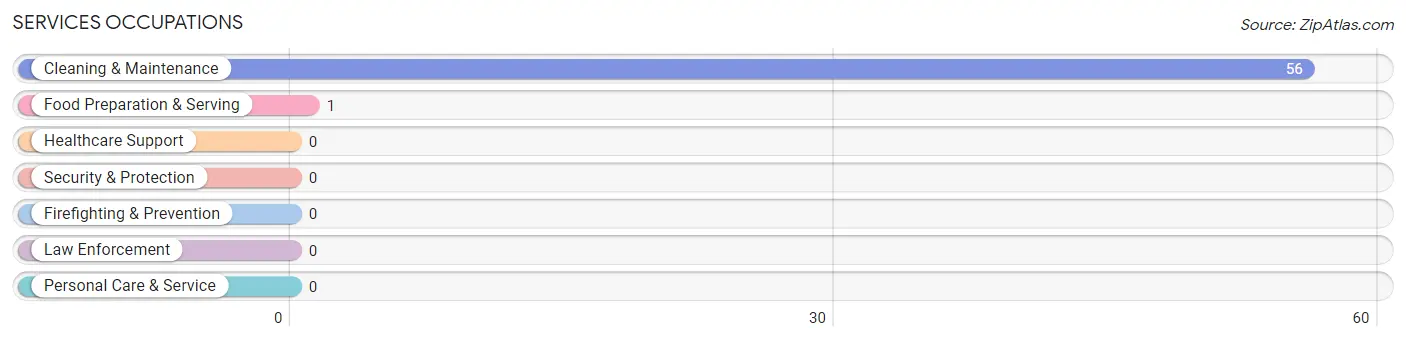
Services Occupations by Sex
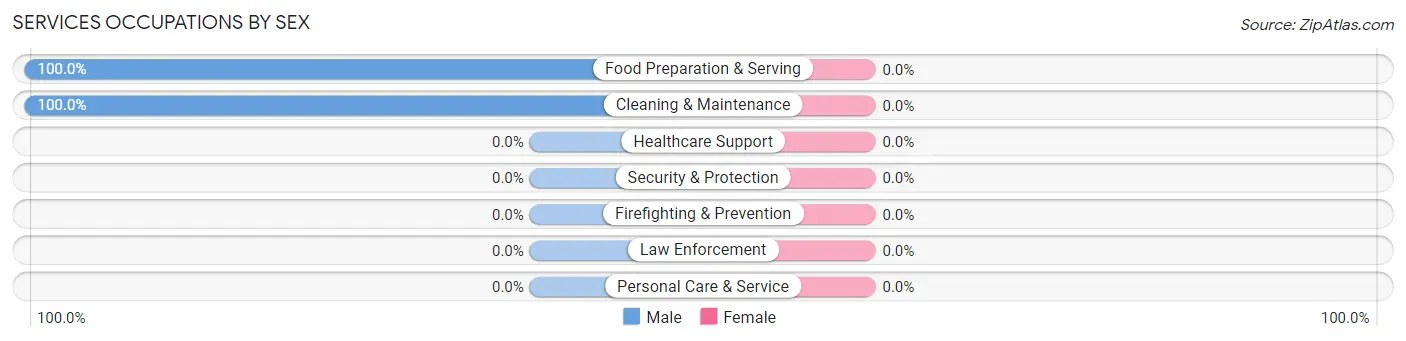
| Occupation | Male | Female |
| Healthcare Support | 0 (0.0%) | 0 (0.0%) |
| Security & Protection | 0 (0.0%) | 0 (0.0%) |
| Firefighting & Prevention | 0 (0.0%) | 0 (0.0%) |
| Law Enforcement | 0 (0.0%) | 0 (0.0%) |
| Food Preparation & Serving | 1 (100.0%) | 0 (0.0%) |
| Cleaning & Maintenance | 56 (100.0%) | 0 (0.0%) |
| Personal Care & Service | 0 (0.0%) | 0 (0.0%) |
| Total (Category) | 57 (100.0%) | 0 (0.0%) |
| Total (Overall) | 100 (68.5%) | 46 (31.5%) |
Sales and Office Occupations
Sales and Office Occupations by Sex
| Occupation | Male | Female |
| Sales & Related | 0 (0.0%) | 0 (0.0%) |
| Office & Administration | 0 (0.0%) | 0 (0.0%) |
| Total (Category) | 0 (0.0%) | 0 (0.0%) |
| Total (Overall) | 100 (68.5%) | 46 (31.5%) |
Natural Resources, Construction and Maintenance Occupations
The most common Natural Resources, Construction and Maintenance occupations in Bouse are , and Construction & Extraction (19 | 13.0%).
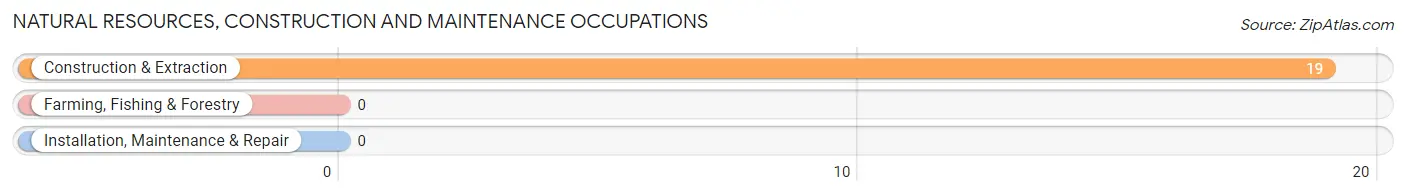
Natural Resources, Construction and Maintenance Occupations by Sex
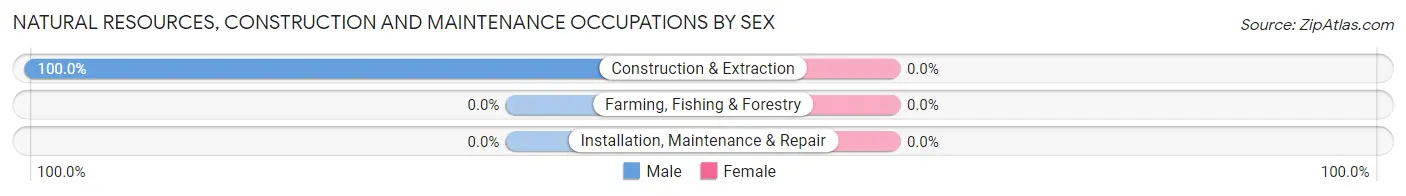
| Occupation | Male | Female |
| Farming, Fishing & Forestry | 0 (0.0%) | 0 (0.0%) |
| Construction & Extraction | 19 (100.0%) | 0 (0.0%) |
| Installation, Maintenance & Repair | 0 (0.0%) | 0 (0.0%) |
| Total (Category) | 19 (100.0%) | 0 (0.0%) |
| Total (Overall) | 100 (68.5%) | 46 (31.5%) |
Production, Transportation and Moving Occupations
The most common Production, Transportation and Moving occupations in Bouse are , and Production (10 | 6.9%).
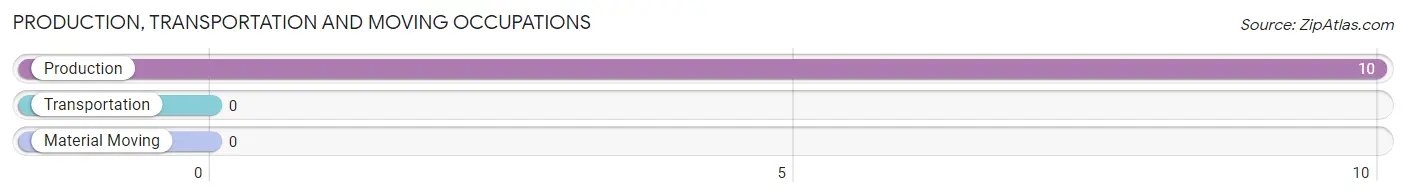
Production, Transportation and Moving Occupations by Sex
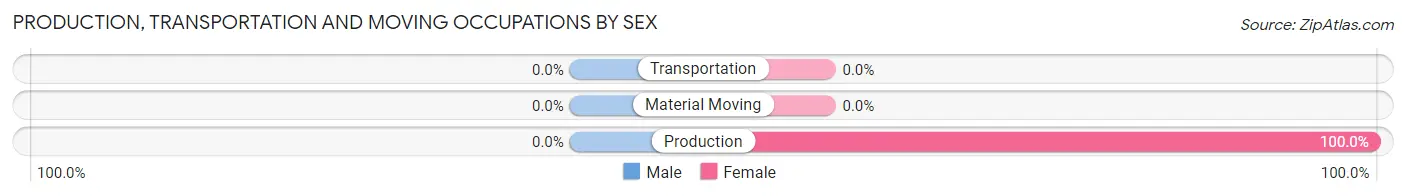
| Occupation | Male | Female |
| Production | 0 (0.0%) | 10 (100.0%) |
| Transportation | 0 (0.0%) | 0 (0.0%) |
| Material Moving | 0 (0.0%) | 0 (0.0%) |
| Total (Category) | 0 (0.0%) | 10 (100.0%) |
| Total (Overall) | 100 (68.5%) | 46 (31.5%) |
Employment Industries by Sex in Bouse
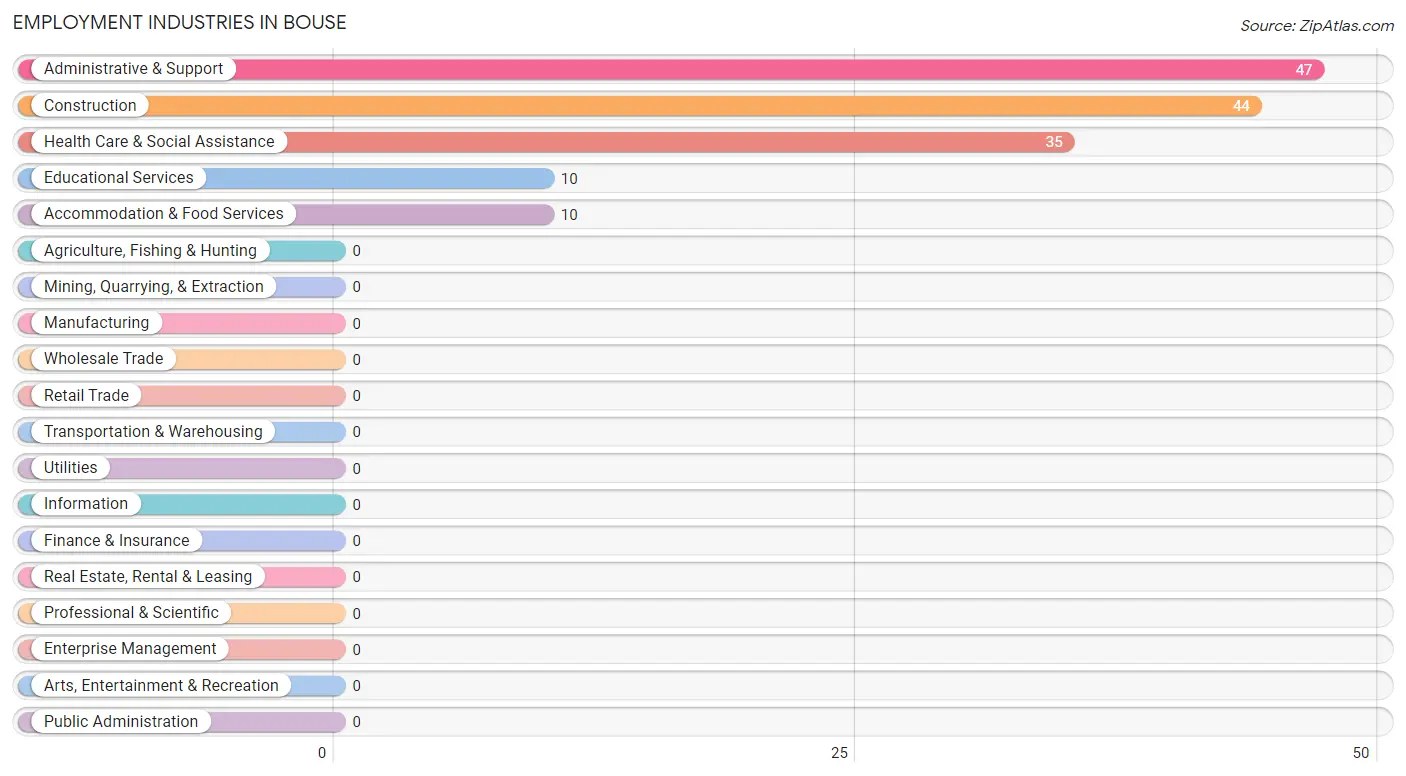
Employment Industries in Bouse
The major employment industries in Bouse include Administrative & Support (47 | 32.2%), Construction (44 | 30.1%), Health Care & Social Assistance (35 | 24.0%), Educational Services (10 | 6.9%), and Accommodation & Food Services (10 | 6.9%).
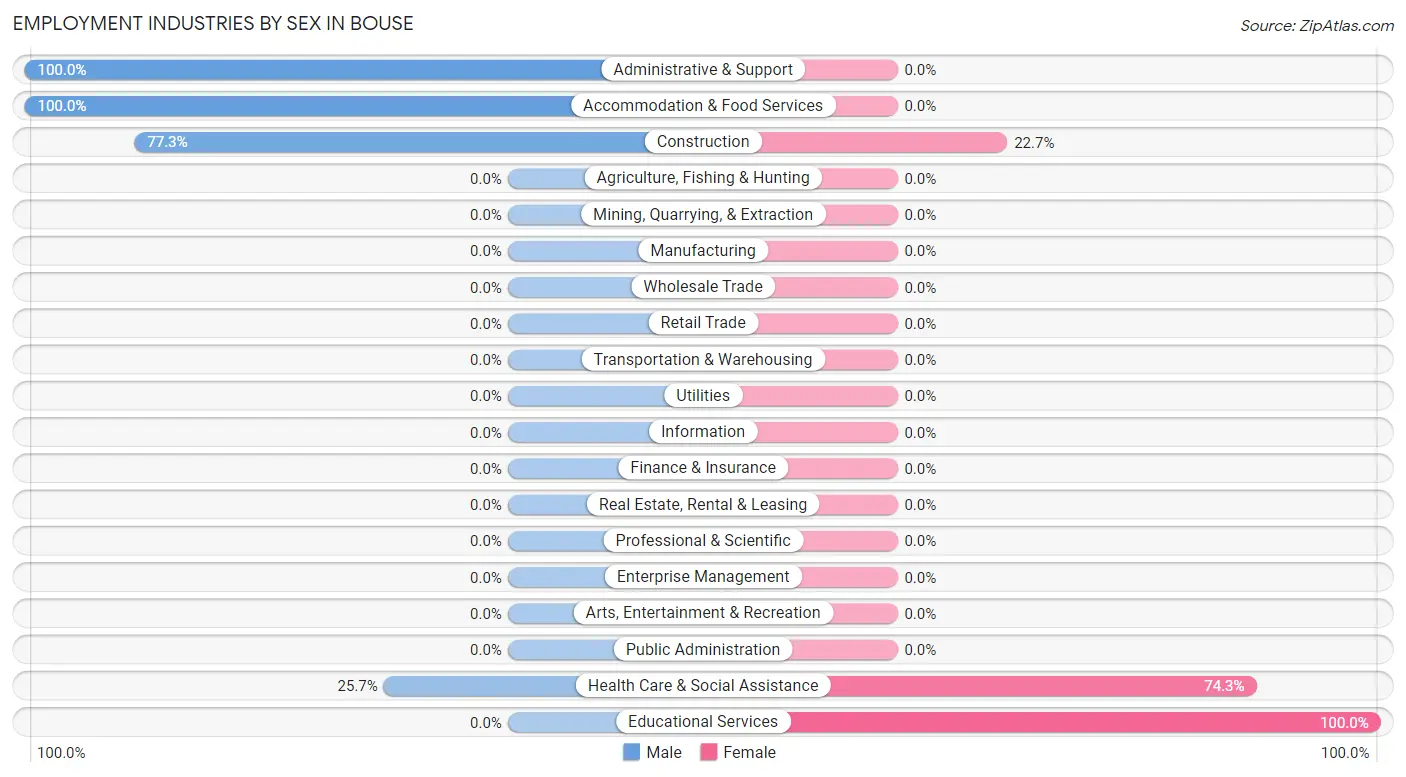
Employment Industries by Sex in Bouse
The Bouse industries that see more men than women are Administrative & Support (100.0%), Accommodation & Food Services (100.0%), and Construction (77.3%), whereas the industries that tend to have a higher number of women are Educational Services (100.0%), Health Care & Social Assistance (74.3%), and Construction (22.7%).
| Industry | Male | Female |
| Agriculture, Fishing & Hunting | 0 (0.0%) | 0 (0.0%) |
| Mining, Quarrying, & Extraction | 0 (0.0%) | 0 (0.0%) |
| Construction | 34 (77.3%) | 10 (22.7%) |
| Manufacturing | 0 (0.0%) | 0 (0.0%) |
| Wholesale Trade | 0 (0.0%) | 0 (0.0%) |
| Retail Trade | 0 (0.0%) | 0 (0.0%) |
| Transportation & Warehousing | 0 (0.0%) | 0 (0.0%) |
| Utilities | 0 (0.0%) | 0 (0.0%) |
| Information | 0 (0.0%) | 0 (0.0%) |
| Finance & Insurance | 0 (0.0%) | 0 (0.0%) |
| Real Estate, Rental & Leasing | 0 (0.0%) | 0 (0.0%) |
| Professional & Scientific | 0 (0.0%) | 0 (0.0%) |
| Enterprise Management | 0 (0.0%) | 0 (0.0%) |
| Administrative & Support | 47 (100.0%) | 0 (0.0%) |
| Educational Services | 0 (0.0%) | 10 (100.0%) |
| Health Care & Social Assistance | 9 (25.7%) | 26 (74.3%) |
| Arts, Entertainment & Recreation | 0 (0.0%) | 0 (0.0%) |
| Accommodation & Food Services | 10 (100.0%) | 0 (0.0%) |
| Public Administration | 0 (0.0%) | 0 (0.0%) |
| Total | 100 (68.5%) | 46 (31.5%) |
Education in Bouse
School Enrollment in Bouse
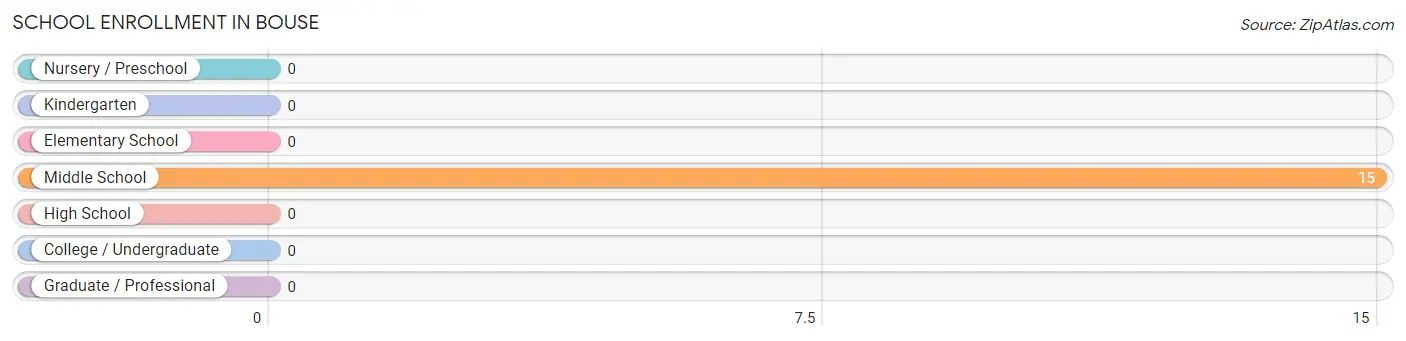
| School Level | # Students | % Students |
| Nursery / Preschool | 0 | 0.0% |
| Kindergarten | 0 | 0.0% |
| Elementary School | 0 | 0.0% |
| Middle School | 15 | 100.0% |
| High School | 0 | 0.0% |
| College / Undergraduate | 0 | 0.0% |
| Graduate / Professional | 0 | 0.0% |
| Total | 15 | 100.0% |
School Enrollment by Age by Funding Source in Bouse
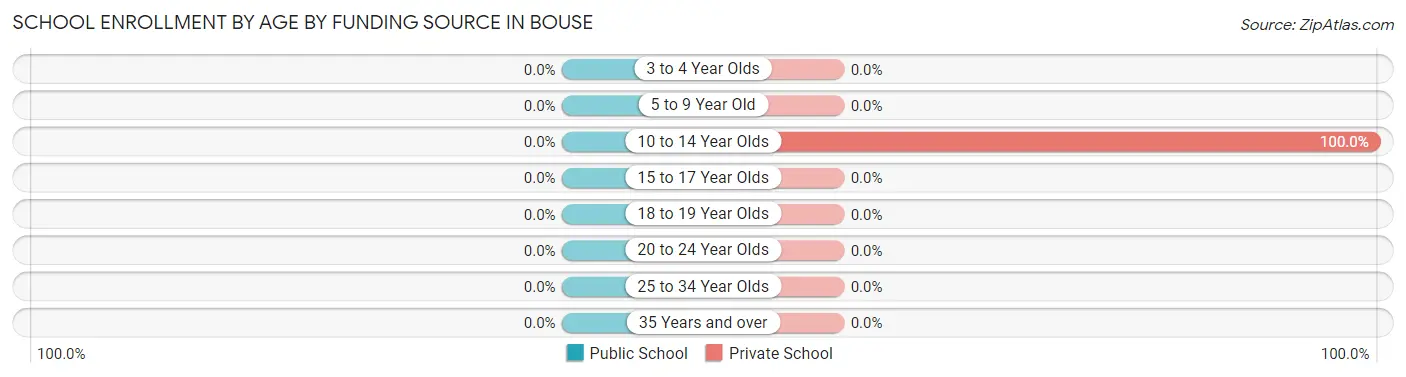
| Age Bracket | Public School | Private School |
| 3 to 4 Year Olds | 0 (0.0%) | 0 (0.0%) |
| 5 to 9 Year Old | 0 (0.0%) | 0 (0.0%) |
| 10 to 14 Year Olds | 0 (0.0%) | 15 (100.0%) |
| 15 to 17 Year Olds | 0 (0.0%) | 0 (0.0%) |
| 18 to 19 Year Olds | 0 (0.0%) | 0 (0.0%) |
| 20 to 24 Year Olds | 0 (0.0%) | 0 (0.0%) |
| 25 to 34 Year Olds | 0 (0.0%) | 0 (0.0%) |
| 35 Years and over | 0 (0.0%) | 0 (0.0%) |
| Total | 0 (0.0%) | 15 (100.0%) |
Educational Attainment by Field of Study in Bouse
Science & technology (9 | 52.9%), and business (8 | 47.1%) are the most common fields of study among 17 individuals in Bouse who have obtained a bachelor's degree or higher.
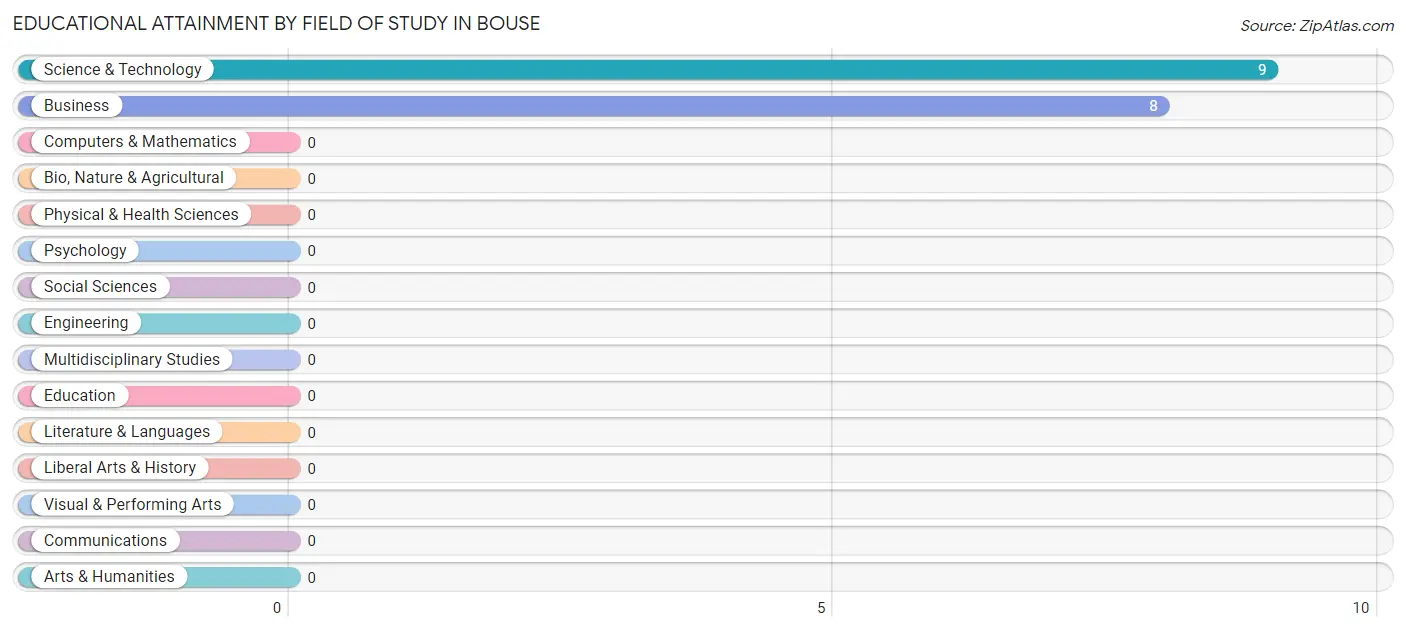
| Field of Study | # Graduates | % Graduates |
| Computers & Mathematics | 0 | 0.0% |
| Bio, Nature & Agricultural | 0 | 0.0% |
| Physical & Health Sciences | 0 | 0.0% |
| Psychology | 0 | 0.0% |
| Social Sciences | 0 | 0.0% |
| Engineering | 0 | 0.0% |
| Multidisciplinary Studies | 0 | 0.0% |
| Science & Technology | 9 | 52.9% |
| Business | 8 | 47.1% |
| Education | 0 | 0.0% |
| Literature & Languages | 0 | 0.0% |
| Liberal Arts & History | 0 | 0.0% |
| Visual & Performing Arts | 0 | 0.0% |
| Communications | 0 | 0.0% |
| Arts & Humanities | 0 | 0.0% |
| Total | 17 | 100.0% |
Transportation & Commute in Bouse
Vehicle Availability by Sex in Bouse
The most prevalent vehicle ownership categories in Bouse are males with 2 vehicles (74, accounting for 74.0%) and females with 2 vehicles (10, making up 246.7%).
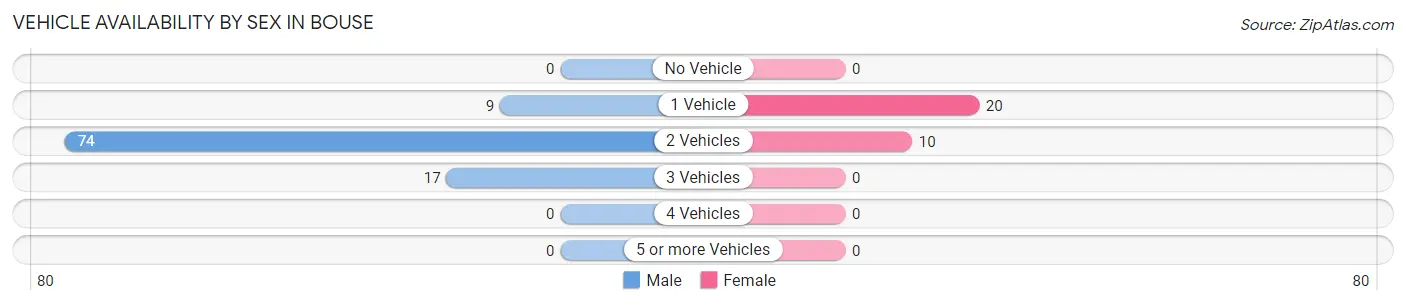
| Vehicles Available | Male | Female |
| No Vehicle | 0 (0.0%) | 0 (0.0%) |
| 1 Vehicle | 9 (9.0%) | 20 (66.7%) |
| 2 Vehicles | 74 (74.0%) | 10 (33.3%) |
| 3 Vehicles | 17 (17.0%) | 0 (0.0%) |
| 4 Vehicles | 0 (0.0%) | 0 (0.0%) |
| 5 or more Vehicles | 0 (0.0%) | 0 (0.0%) |
| Total | 100 (100.0%) | 30 (100.0%) |
Commute Time in Bouse
The most frequently occuring commute durations in Bouse are 5 to 9 minutes (47 commuters, 42.0%), less than 5 minutes (35 commuters, 31.2%), and 20 to 24 minutes (29 commuters, 25.9%).
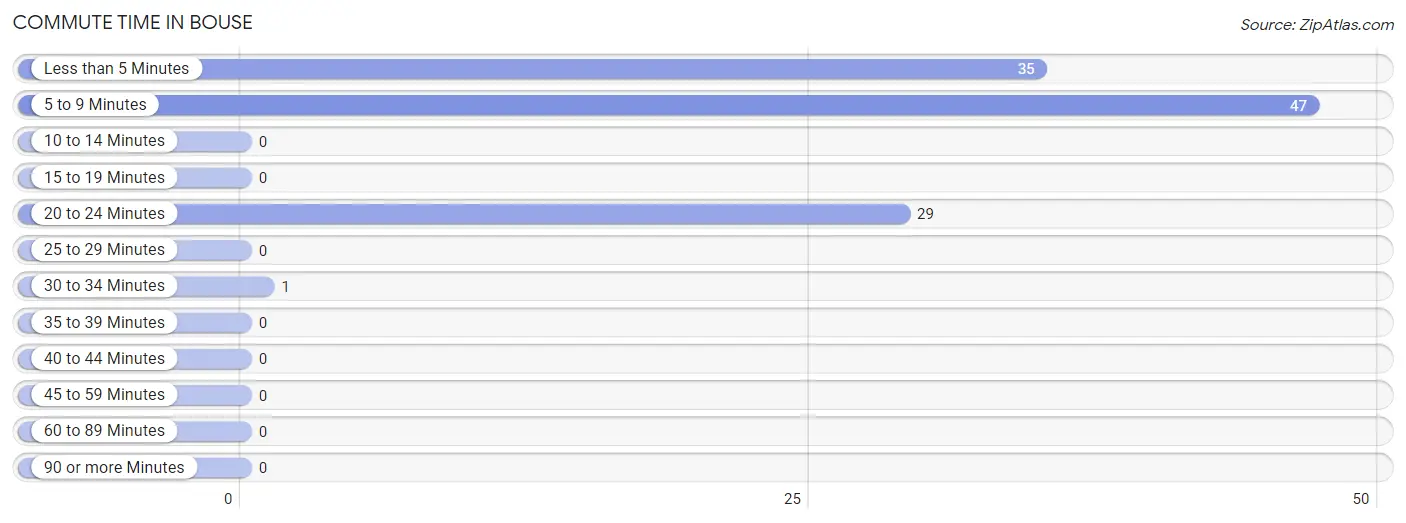
| Commute Time | # Commuters | % Commuters |
| Less than 5 Minutes | 35 | 31.2% |
| 5 to 9 Minutes | 47 | 42.0% |
| 10 to 14 Minutes | 0 | 0.0% |
| 15 to 19 Minutes | 0 | 0.0% |
| 20 to 24 Minutes | 29 | 25.9% |
| 25 to 29 Minutes | 0 | 0.0% |
| 30 to 34 Minutes | 1 | 0.9% |
| 35 to 39 Minutes | 0 | 0.0% |
| 40 to 44 Minutes | 0 | 0.0% |
| 45 to 59 Minutes | 0 | 0.0% |
| 60 to 89 Minutes | 0 | 0.0% |
| 90 or more Minutes | 0 | 0.0% |
Commute Time by Sex in Bouse
The most common commute times in Bouse are 5 to 9 minutes (47 commuters, 51.1%) for males and less than 5 minutes (10 commuters, 50.0%) for females.

| Commute Time | Male | Female |
| Less than 5 Minutes | 25 (27.2%) | 10 (50.0%) |
| 5 to 9 Minutes | 47 (51.1%) | 0 (0.0%) |
| 10 to 14 Minutes | 0 (0.0%) | 0 (0.0%) |
| 15 to 19 Minutes | 0 (0.0%) | 0 (0.0%) |
| 20 to 24 Minutes | 19 (20.6%) | 10 (50.0%) |
| 25 to 29 Minutes | 0 (0.0%) | 0 (0.0%) |
| 30 to 34 Minutes | 1 (1.1%) | 0 (0.0%) |
| 35 to 39 Minutes | 0 (0.0%) | 0 (0.0%) |
| 40 to 44 Minutes | 0 (0.0%) | 0 (0.0%) |
| 45 to 59 Minutes | 0 (0.0%) | 0 (0.0%) |
| 60 to 89 Minutes | 0 (0.0%) | 0 (0.0%) |
| 90 or more Minutes | 0 (0.0%) | 0 (0.0%) |
Time of Departure to Work by Sex in Bouse
The most frequent times of departure to work in Bouse are 6:30 AM to 6:59 AM (47, 51.1%) for males and 12:00 AM to 4:59 AM (10, 50.0%) for females.
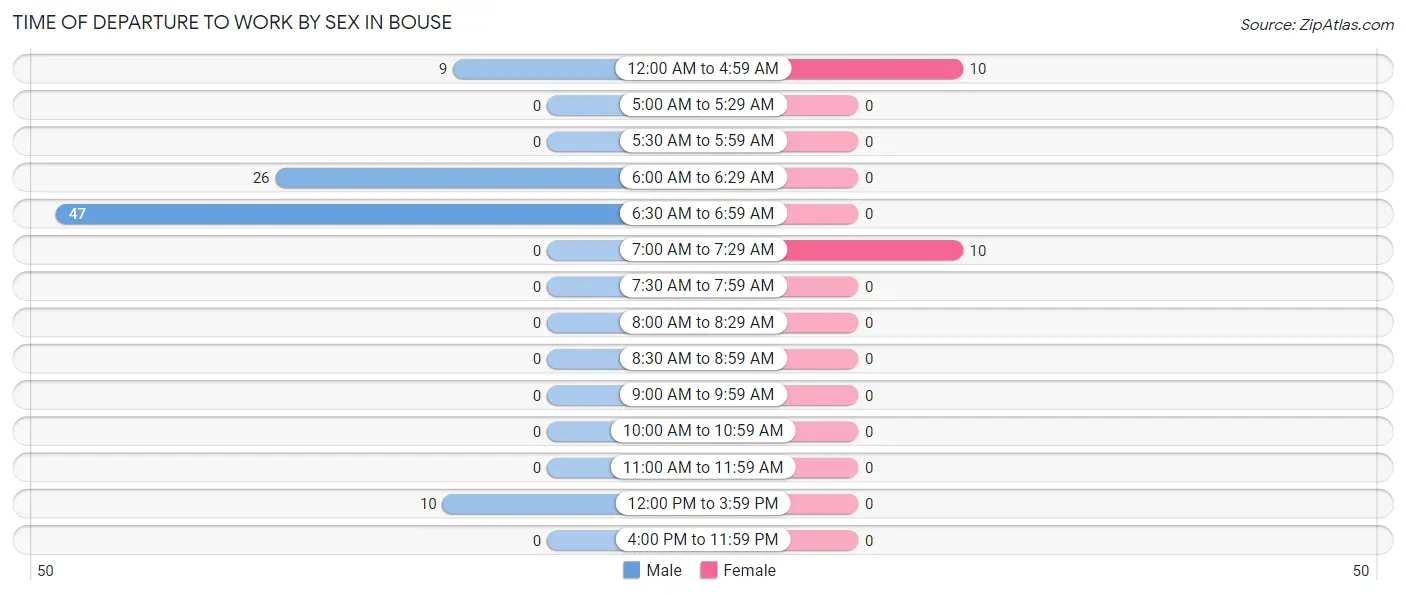
| Time of Departure | Male | Female |
| 12:00 AM to 4:59 AM | 9 (9.8%) | 10 (50.0%) |
| 5:00 AM to 5:29 AM | 0 (0.0%) | 0 (0.0%) |
| 5:30 AM to 5:59 AM | 0 (0.0%) | 0 (0.0%) |
| 6:00 AM to 6:29 AM | 26 (28.3%) | 0 (0.0%) |
| 6:30 AM to 6:59 AM | 47 (51.1%) | 0 (0.0%) |
| 7:00 AM to 7:29 AM | 0 (0.0%) | 10 (50.0%) |
| 7:30 AM to 7:59 AM | 0 (0.0%) | 0 (0.0%) |
| 8:00 AM to 8:29 AM | 0 (0.0%) | 0 (0.0%) |
| 8:30 AM to 8:59 AM | 0 (0.0%) | 0 (0.0%) |
| 9:00 AM to 9:59 AM | 0 (0.0%) | 0 (0.0%) |
| 10:00 AM to 10:59 AM | 0 (0.0%) | 0 (0.0%) |
| 11:00 AM to 11:59 AM | 0 (0.0%) | 0 (0.0%) |
| 12:00 PM to 3:59 PM | 10 (10.9%) | 0 (0.0%) |
| 4:00 PM to 11:59 PM | 0 (0.0%) | 0 (0.0%) |
| Total | 92 (100.0%) | 20 (100.0%) |
Housing Occupancy in Bouse
Occupancy by Ownership in Bouse
Of the total 541 dwellings in Bouse, owner-occupied units account for 532 (98.3%), while renter-occupied units make up 9 (1.7%).
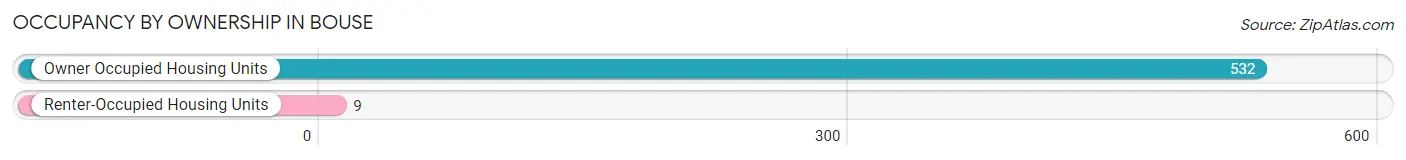
| Occupancy | # Housing Units | % Housing Units |
| Owner Occupied Housing Units | 532 | 98.3% |
| Renter-Occupied Housing Units | 9 | 1.7% |
| Total Occupied Housing Units | 541 | 100.0% |
Occupancy by Household Size in Bouse
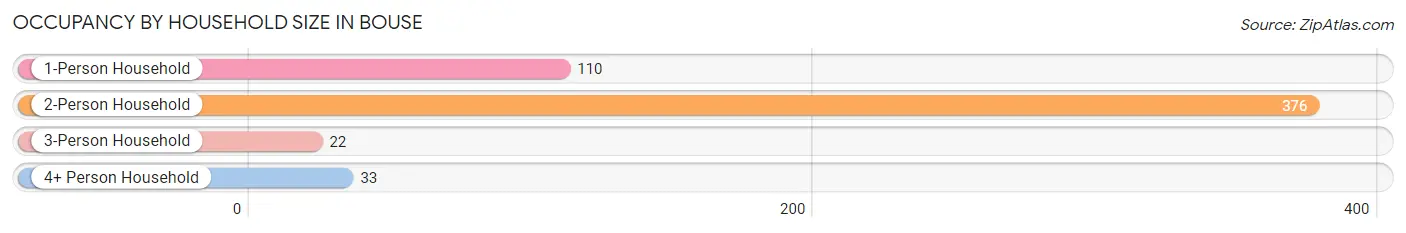
| Household Size | # Housing Units | % Housing Units |
| 1-Person Household | 110 | 20.3% |
| 2-Person Household | 376 | 69.5% |
| 3-Person Household | 22 | 4.1% |
| 4+ Person Household | 33 | 6.1% |
| Total Housing Units | 541 | 100.0% |
Occupancy by Ownership by Household Size in Bouse
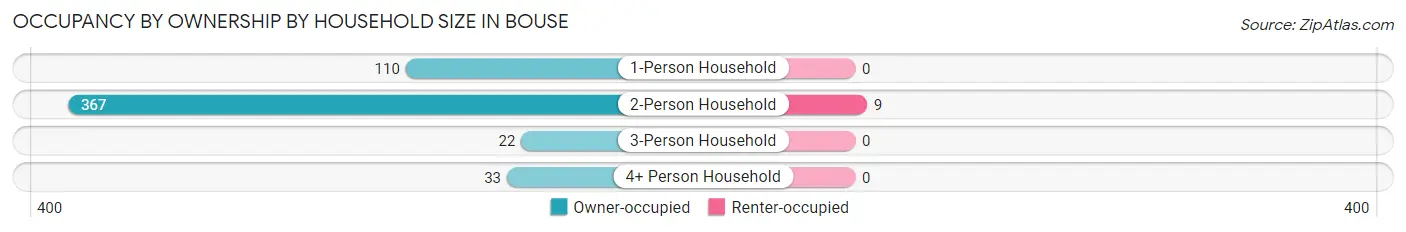
| Household Size | Owner-occupied | Renter-occupied |
| 1-Person Household | 110 (100.0%) | 0 (0.0%) |
| 2-Person Household | 367 (97.6%) | 9 (2.4%) |
| 3-Person Household | 22 (100.0%) | 0 (0.0%) |
| 4+ Person Household | 33 (100.0%) | 0 (0.0%) |
| Total Housing Units | 532 (98.3%) | 9 (1.7%) |
Occupancy by Educational Attainment in Bouse
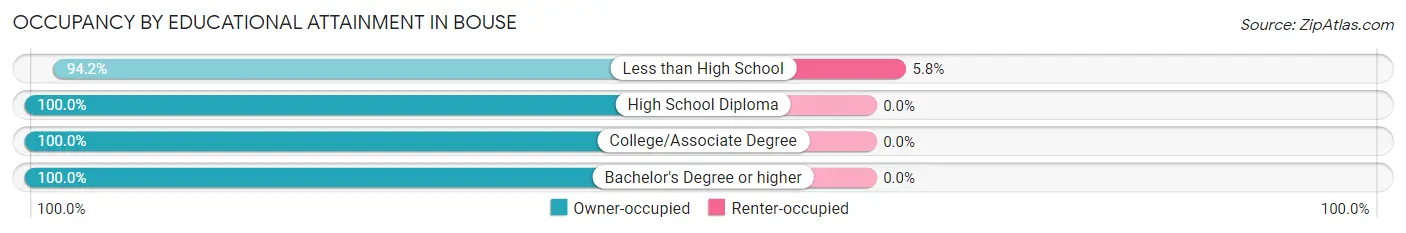
| Household Size | Owner-occupied | Renter-occupied |
| Less than High School | 146 (94.2%) | 9 (5.8%) |
| High School Diploma | 192 (100.0%) | 0 (0.0%) |
| College/Associate Degree | 186 (100.0%) | 0 (0.0%) |
| Bachelor's Degree or higher | 8 (100.0%) | 0 (0.0%) |
Occupancy by Age of Householder in Bouse
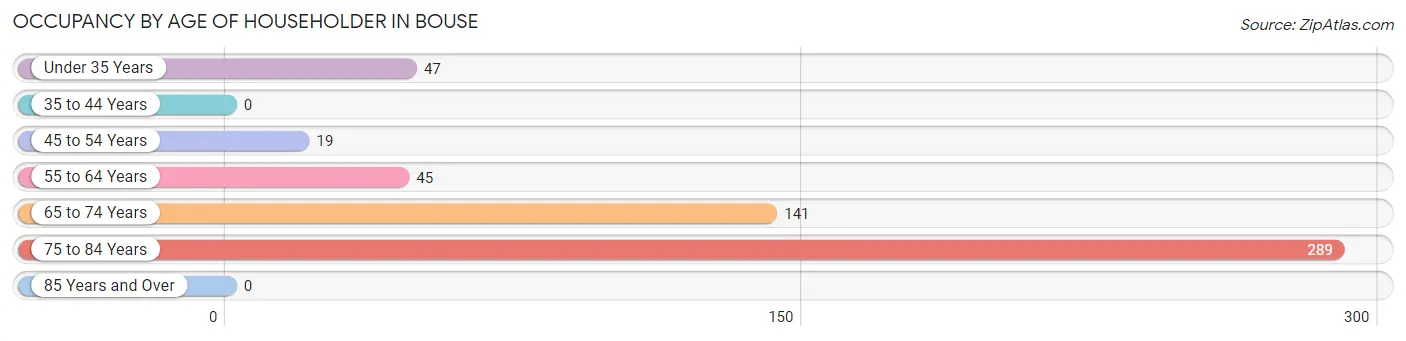
| Age Bracket | # Households | % Households |
| Under 35 Years | 47 | 8.7% |
| 35 to 44 Years | 0 | 0.0% |
| 45 to 54 Years | 19 | 3.5% |
| 55 to 64 Years | 45 | 8.3% |
| 65 to 74 Years | 141 | 26.1% |
| 75 to 84 Years | 289 | 53.4% |
| 85 Years and Over | 0 | 0.0% |
| Total | 541 | 100.0% |
Housing Finances in Bouse
Median Income by Occupancy in Bouse
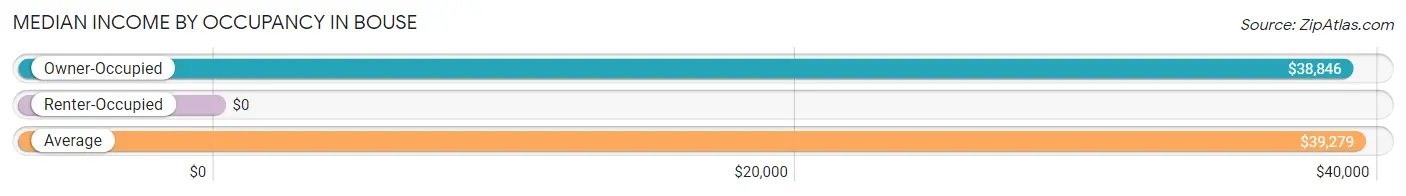
| Occupancy Type | # Households | Median Income |
| Owner-Occupied | 532 (98.3%) | $38,846 |
| Renter-Occupied | 9 (1.7%) | $0 |
| Average | 541 (100.0%) | $39,279 |
Occupancy by Householder Income Bracket in Bouse
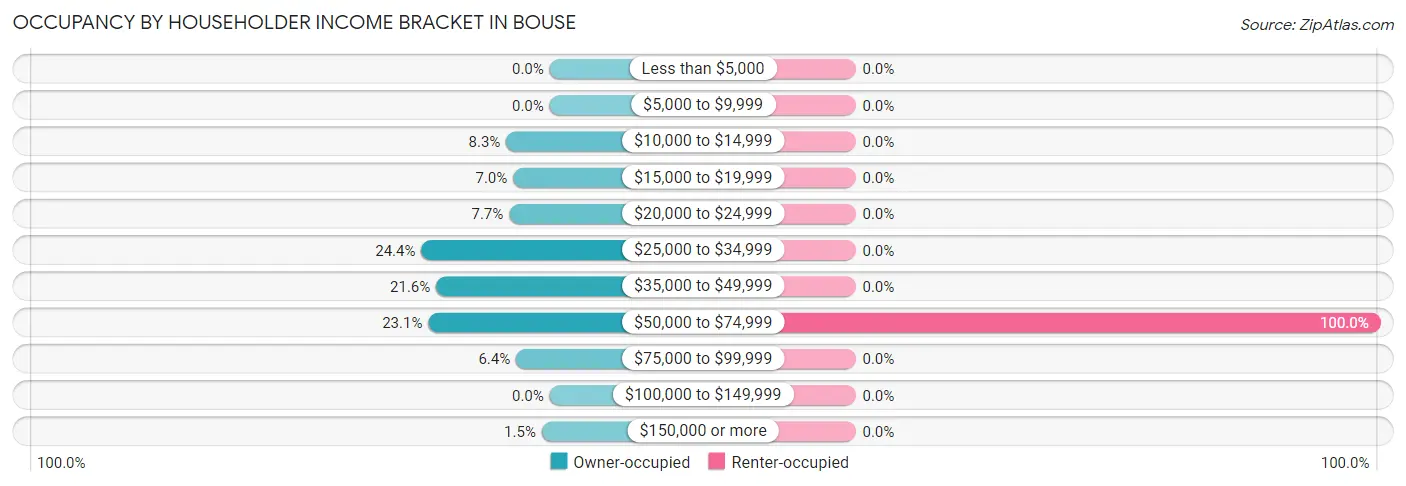
| Income Bracket | Owner-occupied | Renter-occupied |
| Less than $5,000 | 0 (0.0%) | 0 (0.0%) |
| $5,000 to $9,999 | 0 (0.0%) | 0 (0.0%) |
| $10,000 to $14,999 | 44 (8.3%) | 0 (0.0%) |
| $15,000 to $19,999 | 37 (7.0%) | 0 (0.0%) |
| $20,000 to $24,999 | 41 (7.7%) | 0 (0.0%) |
| $25,000 to $34,999 | 130 (24.4%) | 0 (0.0%) |
| $35,000 to $49,999 | 115 (21.6%) | 0 (0.0%) |
| $50,000 to $74,999 | 123 (23.1%) | 9 (100.0%) |
| $75,000 to $99,999 | 34 (6.4%) | 0 (0.0%) |
| $100,000 to $149,999 | 0 (0.0%) | 0 (0.0%) |
| $150,000 or more | 8 (1.5%) | 0 (0.0%) |
| Total | 532 (100.0%) | 9 (100.0%) |
Monthly Housing Cost Tiers in Bouse
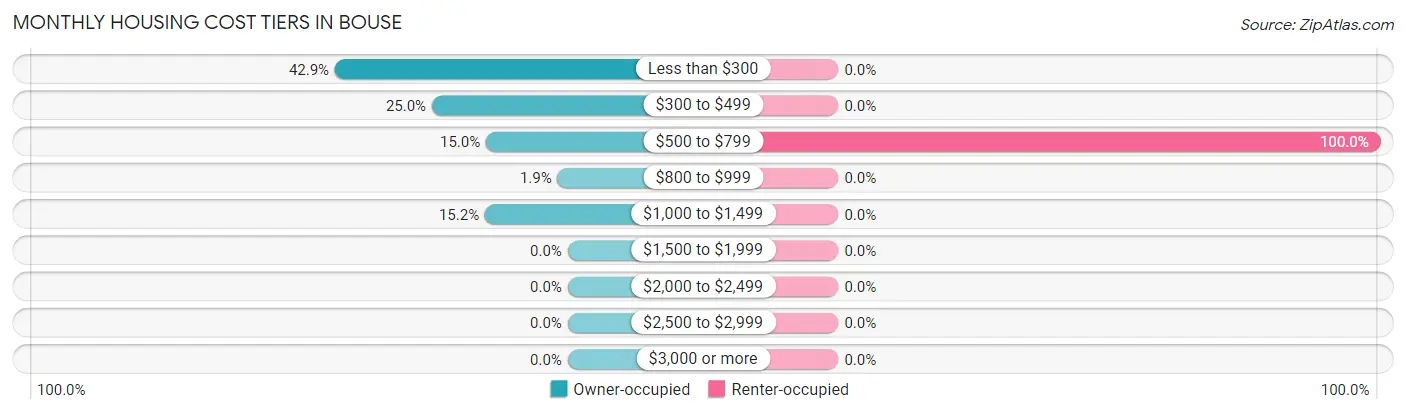
| Monthly Cost | Owner-occupied | Renter-occupied |
| Less than $300 | 228 (42.9%) | 0 (0.0%) |
| $300 to $499 | 133 (25.0%) | 0 (0.0%) |
| $500 to $799 | 80 (15.0%) | 9 (100.0%) |
| $800 to $999 | 10 (1.9%) | 0 (0.0%) |
| $1,000 to $1,499 | 81 (15.2%) | 0 (0.0%) |
| $1,500 to $1,999 | 0 (0.0%) | 0 (0.0%) |
| $2,000 to $2,499 | 0 (0.0%) | 0 (0.0%) |
| $2,500 to $2,999 | 0 (0.0%) | 0 (0.0%) |
| $3,000 or more | 0 (0.0%) | 0 (0.0%) |
| Total | 532 (100.0%) | 9 (100.0%) |
Physical Housing Characteristics in Bouse
Housing Structures in Bouse
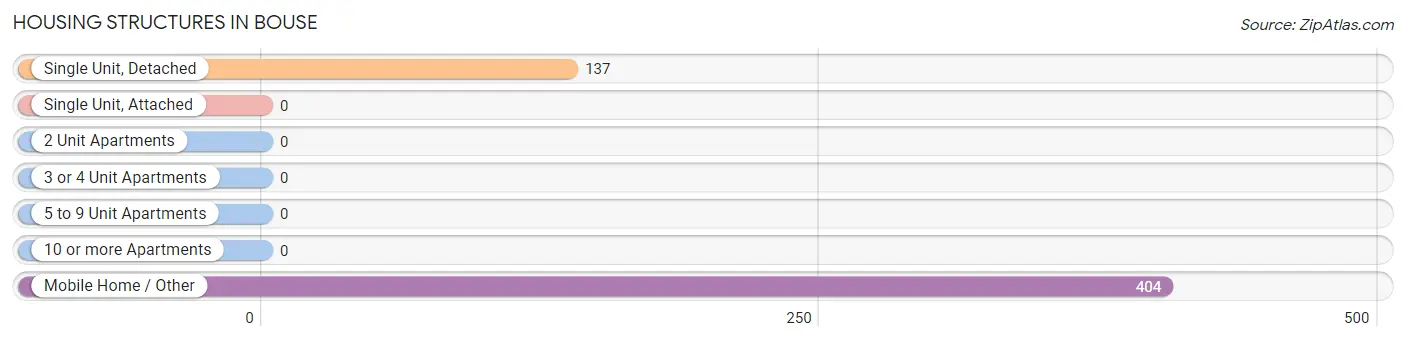
| Structure Type | # Housing Units | % Housing Units |
| Single Unit, Detached | 137 | 25.3% |
| Single Unit, Attached | 0 | 0.0% |
| 2 Unit Apartments | 0 | 0.0% |
| 3 or 4 Unit Apartments | 0 | 0.0% |
| 5 to 9 Unit Apartments | 0 | 0.0% |
| 10 or more Apartments | 0 | 0.0% |
| Mobile Home / Other | 404 | 74.7% |
| Total | 541 | 100.0% |
Housing Structures by Occupancy in Bouse
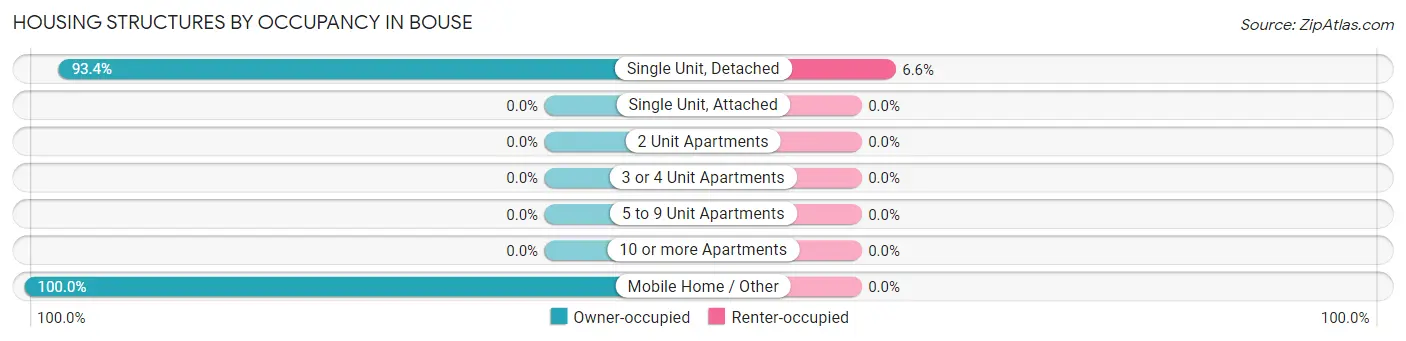
| Structure Type | Owner-occupied | Renter-occupied |
| Single Unit, Detached | 128 (93.4%) | 9 (6.6%) |
| Single Unit, Attached | 0 (0.0%) | 0 (0.0%) |
| 2 Unit Apartments | 0 (0.0%) | 0 (0.0%) |
| 3 or 4 Unit Apartments | 0 (0.0%) | 0 (0.0%) |
| 5 to 9 Unit Apartments | 0 (0.0%) | 0 (0.0%) |
| 10 or more Apartments | 0 (0.0%) | 0 (0.0%) |
| Mobile Home / Other | 404 (100.0%) | 0 (0.0%) |
| Total | 532 (98.3%) | 9 (1.7%) |
Housing Structures by Number of Rooms in Bouse
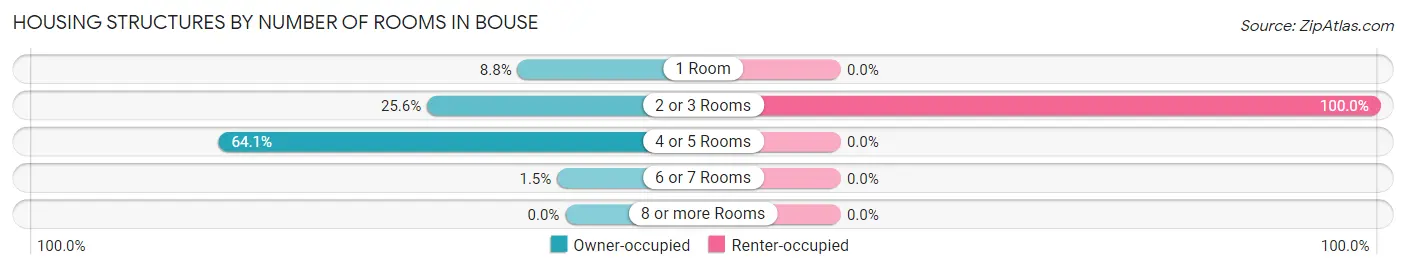
| Number of Rooms | Owner-occupied | Renter-occupied |
| 1 Room | 47 (8.8%) | 0 (0.0%) |
| 2 or 3 Rooms | 136 (25.6%) | 9 (100.0%) |
| 4 or 5 Rooms | 341 (64.1%) | 0 (0.0%) |
| 6 or 7 Rooms | 8 (1.5%) | 0 (0.0%) |
| 8 or more Rooms | 0 (0.0%) | 0 (0.0%) |
| Total | 532 (100.0%) | 9 (100.0%) |
Housing Structure by Heating Type in Bouse
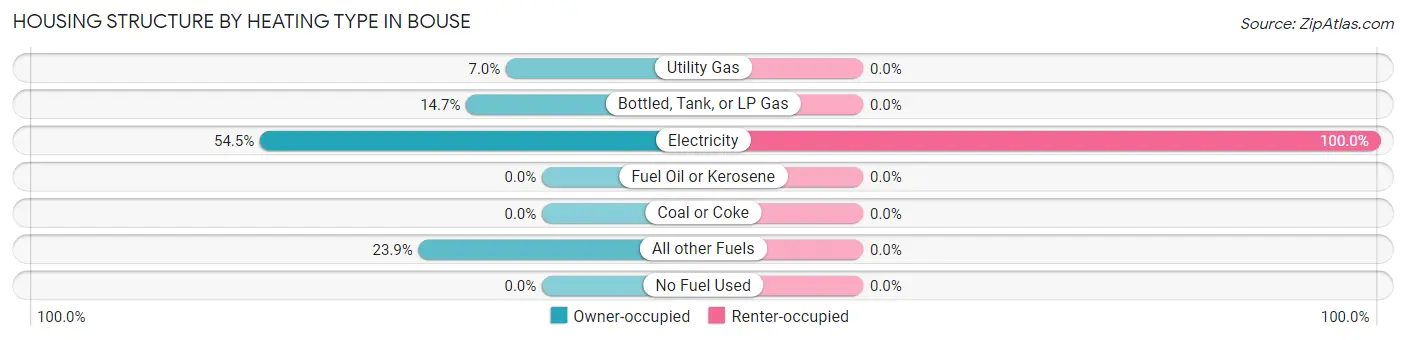
| Heating Type | Owner-occupied | Renter-occupied |
| Utility Gas | 37 (7.0%) | 0 (0.0%) |
| Bottled, Tank, or LP Gas | 78 (14.7%) | 0 (0.0%) |
| Electricity | 290 (54.5%) | 9 (100.0%) |
| Fuel Oil or Kerosene | 0 (0.0%) | 0 (0.0%) |
| Coal or Coke | 0 (0.0%) | 0 (0.0%) |
| All other Fuels | 127 (23.9%) | 0 (0.0%) |
| No Fuel Used | 0 (0.0%) | 0 (0.0%) |
| Total | 532 (100.0%) | 9 (100.0%) |
Household Vehicle Usage in Bouse

| Vehicles per Household | Owner-occupied | Renter-occupied |
| No Vehicle | 22 (4.1%) | 0 (0.0%) |
| 1 Vehicle | 75 (14.1%) | 9 (100.0%) |
| 2 Vehicles | 253 (47.6%) | 0 (0.0%) |
| 3 or more Vehicles | 182 (34.2%) | 0 (0.0%) |
| Total | 532 (100.0%) | 9 (100.0%) |
Real Estate & Mortgages in Bouse
Real Estate and Mortgage Overview in Bouse
| Characteristic | Without Mortgage | With Mortgage |
| Housing Units | 449 | 83 |
| Median Property Value | $142,300 | $104,300 |
| Median Household Income | $45,022 | $0 |
| Monthly Housing Costs | $296 | $0 |
| Real Estate Taxes | $892 | $11 |
Property Value by Mortgage Status in Bouse
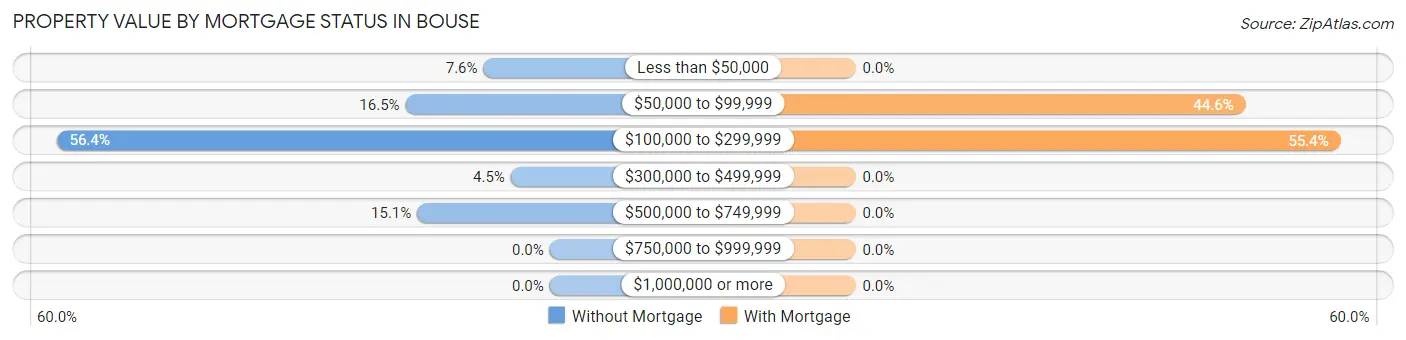
| Property Value | Without Mortgage | With Mortgage |
| Less than $50,000 | 34 (7.6%) | 0 (0.0%) |
| $50,000 to $99,999 | 74 (16.5%) | 37 (44.6%) |
| $100,000 to $299,999 | 253 (56.4%) | 46 (55.4%) |
| $300,000 to $499,999 | 20 (4.4%) | 0 (0.0%) |
| $500,000 to $749,999 | 68 (15.1%) | 0 (0.0%) |
| $750,000 to $999,999 | 0 (0.0%) | 0 (0.0%) |
| $1,000,000 or more | 0 (0.0%) | 0 (0.0%) |
| Total | 449 (100.0%) | 83 (100.0%) |
Household Income by Mortgage Status in Bouse
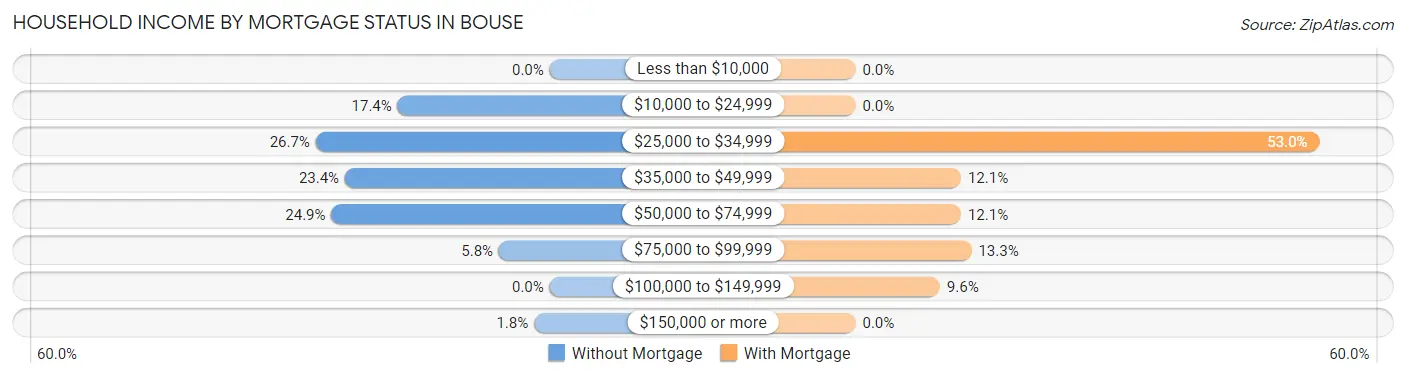
| Household Income | Without Mortgage | With Mortgage |
| Less than $10,000 | 0 (0.0%) | 0 (0.0%) |
| $10,000 to $24,999 | 78 (17.4%) | 0 (0.0%) |
| $25,000 to $34,999 | 120 (26.7%) | 44 (53.0%) |
| $35,000 to $49,999 | 105 (23.4%) | 10 (12.0%) |
| $50,000 to $74,999 | 112 (24.9%) | 10 (12.0%) |
| $75,000 to $99,999 | 26 (5.8%) | 11 (13.3%) |
| $100,000 to $149,999 | 0 (0.0%) | 8 (9.6%) |
| $150,000 or more | 8 (1.8%) | 0 (0.0%) |
| Total | 449 (100.0%) | 83 (100.0%) |
Property Value to Household Income Ratio in Bouse
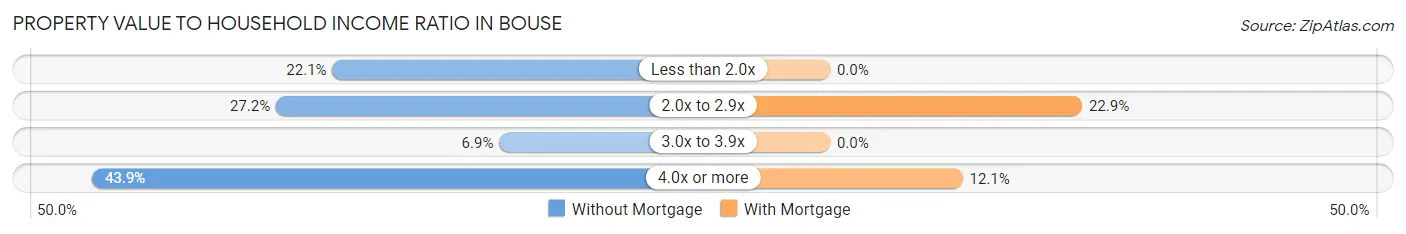
| Value-to-Income Ratio | Without Mortgage | With Mortgage |
| Less than 2.0x | 99 (22.1%) | 0 (0.0%) |
| 2.0x to 2.9x | 122 (27.2%) | 19 (22.9%) |
| 3.0x to 3.9x | 31 (6.9%) | 0 (0.0%) |
| 4.0x or more | 197 (43.9%) | 10 (12.0%) |
| Total | 449 (100.0%) | 83 (100.0%) |
Real Estate Taxes by Mortgage Status in Bouse
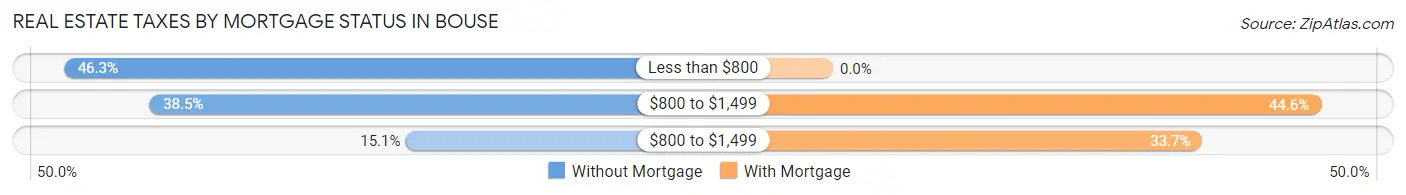
| Property Taxes | Without Mortgage | With Mortgage |
| Less than $800 | 208 (46.3%) | 0 (0.0%) |
| $800 to $1,499 | 173 (38.5%) | 37 (44.6%) |
| $800 to $1,499 | 68 (15.1%) | 28 (33.7%) |
| Total | 449 (100.0%) | 83 (100.0%) |
Health & Disability in Bouse
Health Insurance Coverage by Age in Bouse
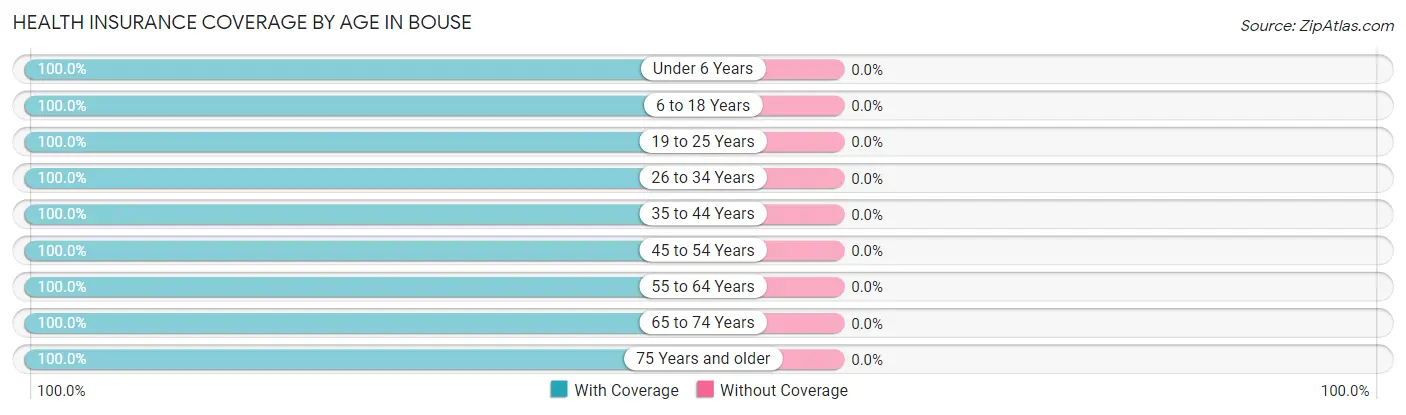
| Age Bracket | With Coverage | Without Coverage |
| Under 6 Years | 13 (100.0%) | 0 (0.0%) |
| 6 to 18 Years | 22 (100.0%) | 0 (0.0%) |
| 19 to 25 Years | 1 (100.0%) | 0 (0.0%) |
| 26 to 34 Years | 49 (100.0%) | 0 (0.0%) |
| 35 to 44 Years | 11 (100.0%) | 0 (0.0%) |
| 45 to 54 Years | 41 (100.0%) | 0 (0.0%) |
| 55 to 64 Years | 65 (100.0%) | 0 (0.0%) |
| 65 to 74 Years | 219 (100.0%) | 0 (0.0%) |
| 75 Years and older | 605 (100.0%) | 0 (0.0%) |
| Total | 1,026 (100.0%) | 0 (0.0%) |
Health Insurance Coverage by Citizenship Status in Bouse
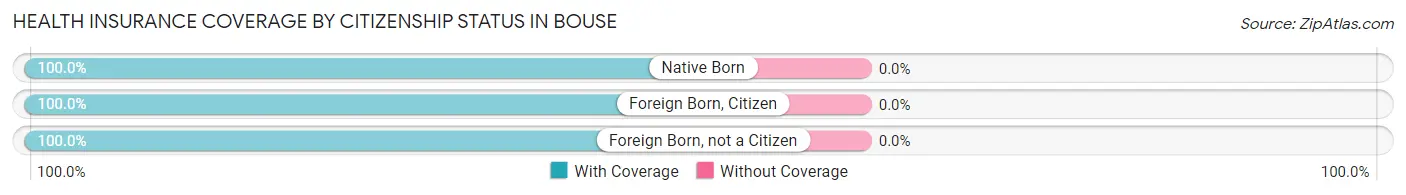
| Citizenship Status | With Coverage | Without Coverage |
| Native Born | 13 (100.0%) | 0 (0.0%) |
| Foreign Born, Citizen | 22 (100.0%) | 0 (0.0%) |
| Foreign Born, not a Citizen | 1 (100.0%) | 0 (0.0%) |
Health Insurance Coverage by Household Income in Bouse
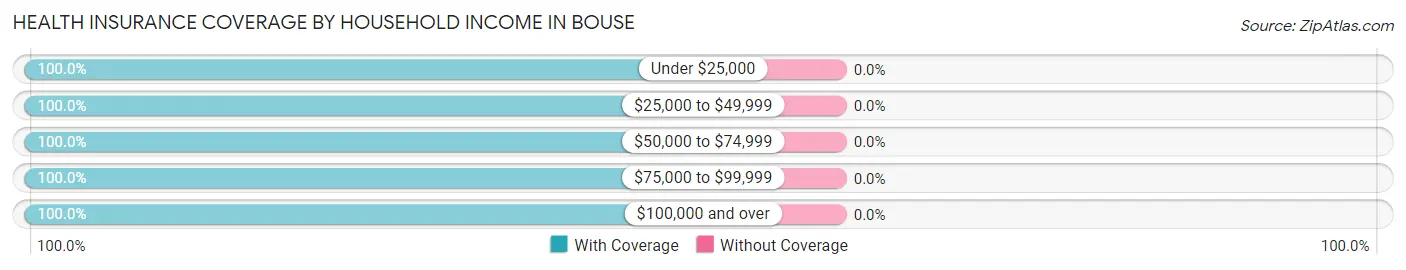
| Household Income | With Coverage | Without Coverage |
| Under $25,000 | 141 (100.0%) | 0 (0.0%) |
| $25,000 to $49,999 | 491 (100.0%) | 0 (0.0%) |
| $50,000 to $74,999 | 297 (100.0%) | 0 (0.0%) |
| $75,000 to $99,999 | 79 (100.0%) | 0 (0.0%) |
| $100,000 and over | 18 (100.0%) | 0 (0.0%) |
Public vs Private Health Insurance Coverage by Age in Bouse
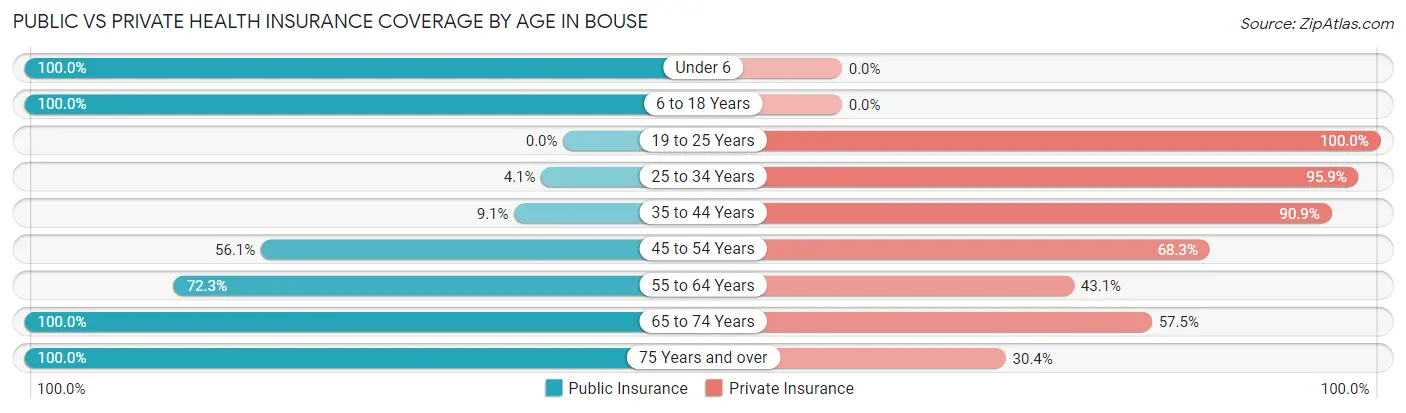
| Age Bracket | Public Insurance | Private Insurance |
| Under 6 | 13 (100.0%) | 0 (0.0%) |
| 6 to 18 Years | 22 (100.0%) | 0 (0.0%) |
| 19 to 25 Years | 0 (0.0%) | 1 (100.0%) |
| 25 to 34 Years | 2 (4.1%) | 47 (95.9%) |
| 35 to 44 Years | 1 (9.1%) | 10 (90.9%) |
| 45 to 54 Years | 23 (56.1%) | 28 (68.3%) |
| 55 to 64 Years | 47 (72.3%) | 28 (43.1%) |
| 65 to 74 Years | 219 (100.0%) | 126 (57.5%) |
| 75 Years and over | 605 (100.0%) | 184 (30.4%) |
| Total | 932 (90.8%) | 424 (41.3%) |
Disability Status by Sex by Age in Bouse
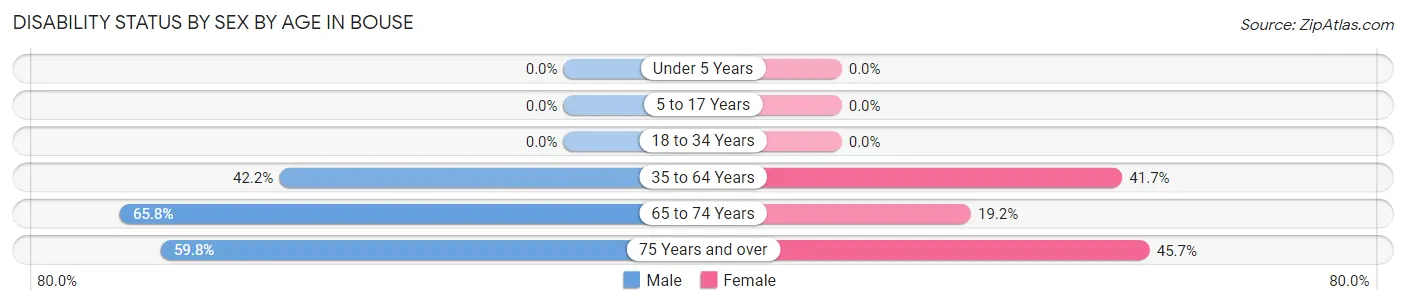
| Age Bracket | Male | Female |
| Under 5 Years | 0 (0.0%) | 0 (0.0%) |
| 5 to 17 Years | 0 (0.0%) | 0 (0.0%) |
| 18 to 34 Years | 0 (0.0%) | 0 (0.0%) |
| 35 to 64 Years | 19 (42.2%) | 30 (41.7%) |
| 65 to 74 Years | 79 (65.8%) | 19 (19.2%) |
| 75 Years and over | 193 (59.8%) | 129 (45.7%) |
Disability Class by Sex by Age in Bouse
Disability Class: Hearing Difficulty
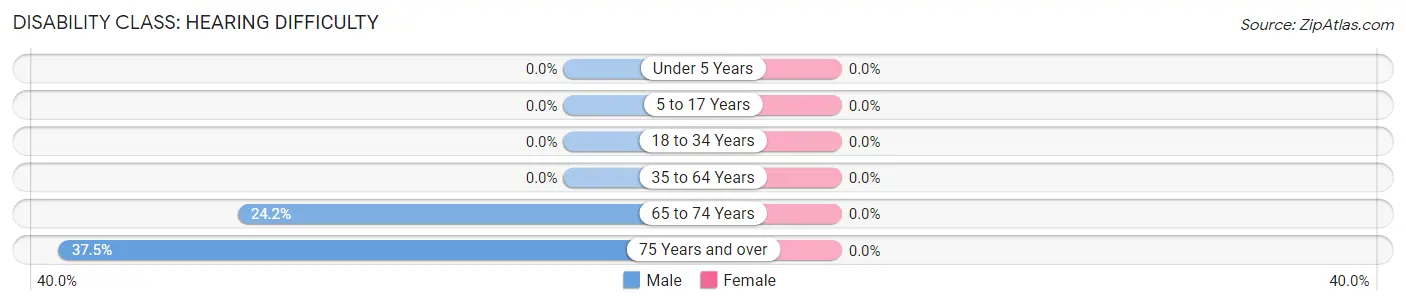
| Age Bracket | Male | Female |
| Under 5 Years | 0 (0.0%) | 0 (0.0%) |
| 5 to 17 Years | 0 (0.0%) | 0 (0.0%) |
| 18 to 34 Years | 0 (0.0%) | 0 (0.0%) |
| 35 to 64 Years | 0 (0.0%) | 0 (0.0%) |
| 65 to 74 Years | 29 (24.2%) | 0 (0.0%) |
| 75 Years and over | 121 (37.5%) | 0 (0.0%) |
Disability Class: Vision Difficulty
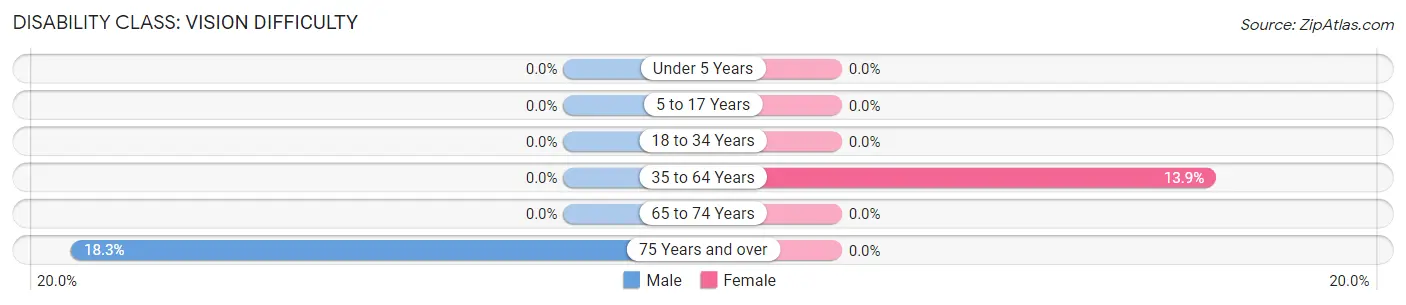
| Age Bracket | Male | Female |
| Under 5 Years | 0 (0.0%) | 0 (0.0%) |
| 5 to 17 Years | 0 (0.0%) | 0 (0.0%) |
| 18 to 34 Years | 0 (0.0%) | 0 (0.0%) |
| 35 to 64 Years | 0 (0.0%) | 10 (13.9%) |
| 65 to 74 Years | 0 (0.0%) | 0 (0.0%) |
| 75 Years and over | 59 (18.3%) | 0 (0.0%) |
Disability Class: Cognitive Difficulty
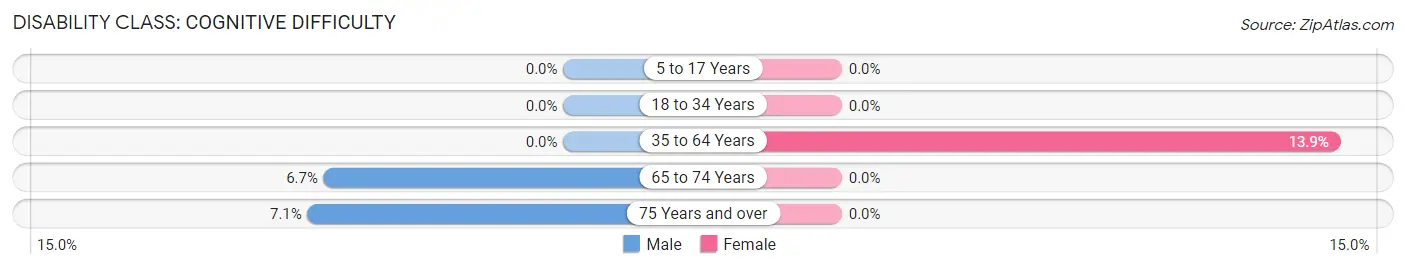
| Age Bracket | Male | Female |
| 5 to 17 Years | 0 (0.0%) | 0 (0.0%) |
| 18 to 34 Years | 0 (0.0%) | 0 (0.0%) |
| 35 to 64 Years | 0 (0.0%) | 10 (13.9%) |
| 65 to 74 Years | 8 (6.7%) | 0 (0.0%) |
| 75 Years and over | 23 (7.1%) | 0 (0.0%) |
Disability Class: Ambulatory Difficulty
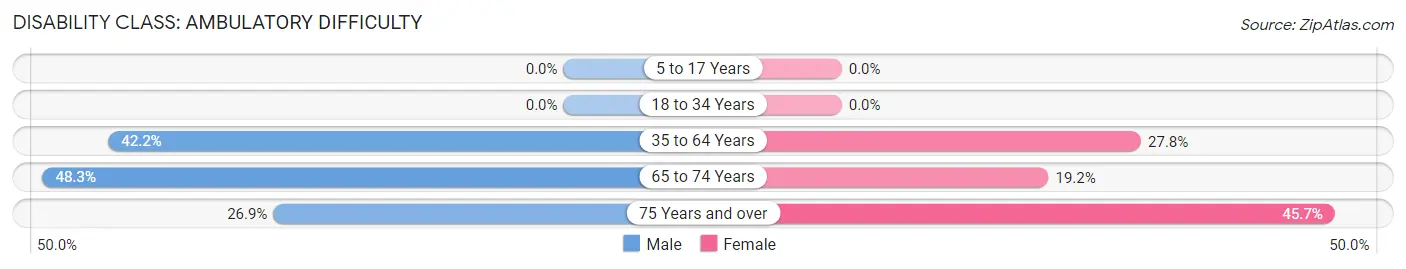
| Age Bracket | Male | Female |
| 5 to 17 Years | 0 (0.0%) | 0 (0.0%) |
| 18 to 34 Years | 0 (0.0%) | 0 (0.0%) |
| 35 to 64 Years | 19 (42.2%) | 20 (27.8%) |
| 65 to 74 Years | 58 (48.3%) | 19 (19.2%) |
| 75 Years and over | 87 (26.9%) | 129 (45.7%) |
Disability Class: Self-Care Difficulty
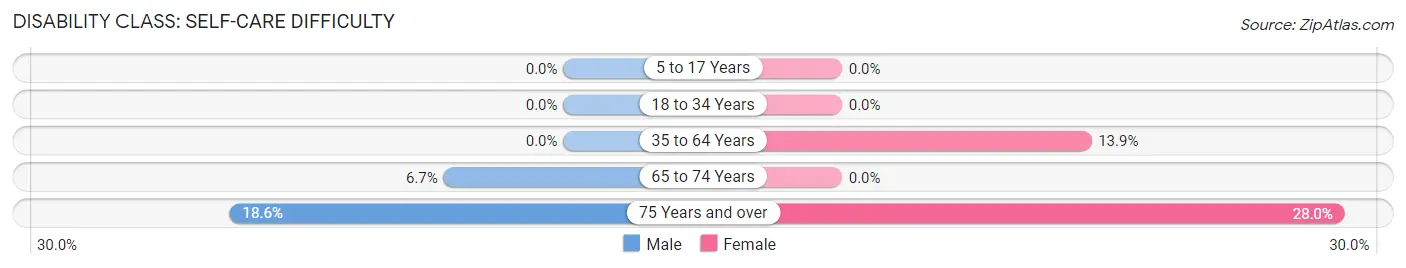
| Age Bracket | Male | Female |
| 5 to 17 Years | 0 (0.0%) | 0 (0.0%) |
| 18 to 34 Years | 0 (0.0%) | 0 (0.0%) |
| 35 to 64 Years | 0 (0.0%) | 10 (13.9%) |
| 65 to 74 Years | 8 (6.7%) | 0 (0.0%) |
| 75 Years and over | 60 (18.6%) | 79 (28.0%) |
Technology Access in Bouse
Computing Device Access in Bouse
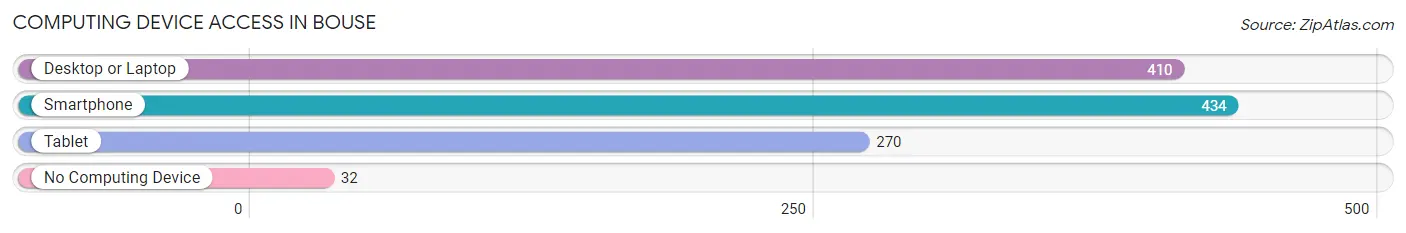
| Device Type | # Households | % Households |
| Desktop or Laptop | 410 | 75.8% |
| Smartphone | 434 | 80.2% |
| Tablet | 270 | 49.9% |
| No Computing Device | 32 | 5.9% |
| Total | 541 | 100.0% |
Internet Access in Bouse
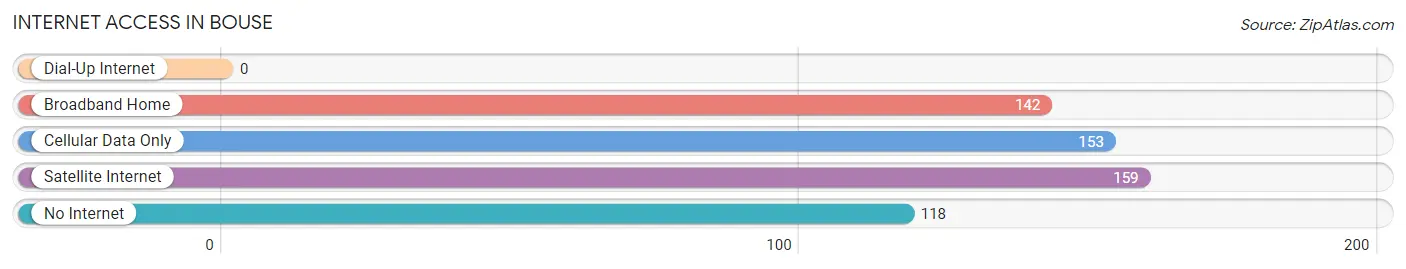
| Internet Type | # Households | % Households |
| Dial-Up Internet | 0 | 0.0% |
| Broadband Home | 142 | 26.3% |
| Cellular Data Only | 153 | 28.3% |
| Satellite Internet | 159 | 29.4% |
| No Internet | 118 | 21.8% |
| Total | 541 | 100.0% |
Bouse Summary
Bouse, Arizona is a small town located in La Paz County in the western part of the state. It is situated on the Colorado River, about 40 miles east of Parker and about 30 miles south of Quartzsite. The town was founded in 1877 by a group of miners who were searching for gold in the area. The town was named after a prospector named William Bouse, who was one of the first to discover gold in the area.
Geography
Bouse is located in the Sonoran Desert, which is characterized by hot, dry summers and mild winters. The town is situated at an elevation of 1,845 feet above sea level. The terrain is mostly flat, with some hills and mountains in the surrounding area. The town is located in the Colorado River Valley, which is a major agricultural area. The Colorado River provides irrigation for the area, and the town is surrounded by farmland.
Economy
The economy of Bouse is largely based on agriculture. The town is home to several farms, which produce a variety of crops, including cotton, alfalfa, and wheat. The town also has a few small businesses, including a gas station, a grocery store, and a few restaurants.
Demographics
As of the 2010 census, the population of Bouse was 1,845. The population is predominantly white, with a small Hispanic population. The median household income is $31,250, and the median age is 44. The town has a high rate of poverty, with nearly one-third of the population living below the poverty line.
Conclusion
Bouse, Arizona is a small town located in La Paz County in the western part of the state. It is situated on the Colorado River, and is surrounded by farmland. The economy of the town is largely based on agriculture, and the population is predominantly white. The town has a high rate of poverty, with nearly one-third of the population living below the poverty line. Despite its small size, Bouse is an important part of the local economy and provides a unique way of life for its residents.
Common Questions
What is Per Capita Income in Bouse?
Per Capita income in Bouse is $23,975.
What is the Median Family Income in Bouse?
Median Family Income in Bouse is $46,535.
What is the Median Household income in Bouse?
Median Household Income in Bouse is $39,279.
What is Income or Wage Gap in Bouse?
Income or Wage Gap in Bouse is 15.8%.
Women in Bouse earn 84.2 cents for every dollar earned by a man.
What is Inequality or Gini Index in Bouse?
Inequality or Gini Index in Bouse is 0.34.
What is the Total Population of Bouse?
Total Population of Bouse is 1,026.
What is the Total Male Population of Bouse?
Total Male Population of Bouse is 565.
What is the Total Female Population of Bouse?
Total Female Population of Bouse is 461.
What is the Ratio of Males per 100 Females in Bouse?
There are 122.56 Males per 100 Females in Bouse.
What is the Ratio of Females per 100 Males in Bouse?
There are 81.59 Females per 100 Males in Bouse.
What is the Median Population Age in Bouse?
Median Population Age in Bouse is 75.5 Years.
What is the Average Family Size in Bouse
Average Family Size in Bouse is 2.1 People.
What is the Average Household Size in Bouse
Average Household Size in Bouse is 1.9 People.
How Large is the Labor Force in Bouse?
There are 152 People in the Labor Forcein in Bouse.
What is the Percentage of People in the Labor Force in Bouse?
15.3% of People are in the Labor Force in Bouse.
What is the Unemployment Rate in Bouse?
Unemployment Rate in Bouse is 3.9%.