Sierra Vista, AZ Map & Demographics
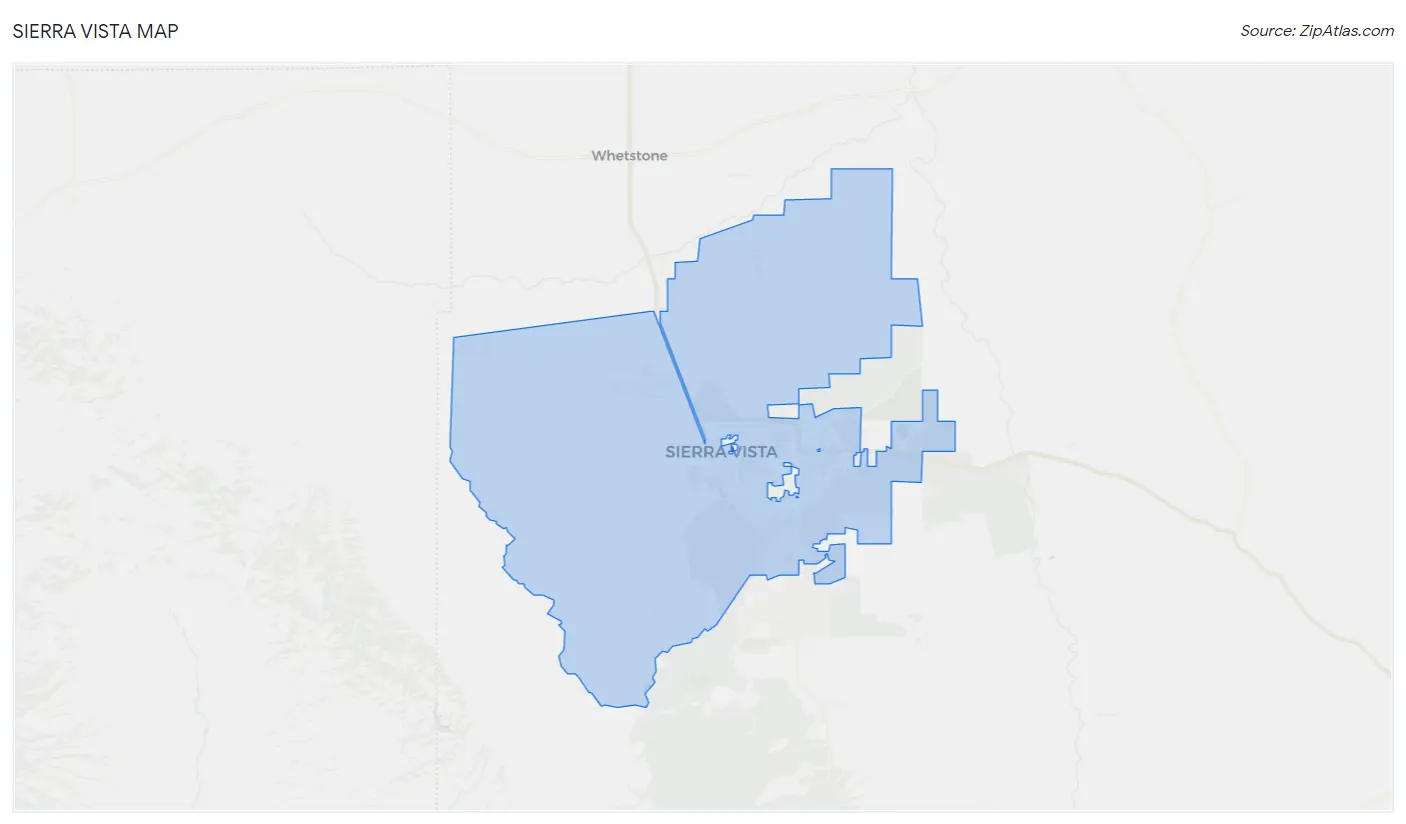
Sierra Vista Map
Sierra Vista Overview
$37,671
PER CAPITA INCOME
$87,754
AVG FAMILY INCOME
$70,899
AVG HOUSEHOLD INCOME
33.1%
WAGE / INCOME GAP [ % ]
66.9¢/ $1
WAGE / INCOME GAP [ $ ]
$11,853
FAMILY INCOME DEFICIT
0.42
INEQUALITY / GINI INDEX
45,212
TOTAL POPULATION
22,858
MALE POPULATION
22,354
FEMALE POPULATION
102.25
MALES / 100 FEMALES
97.80
FEMALES / 100 MALES
37.0
MEDIAN AGE
3.0
AVG FAMILY SIZE
2.4
AVG HOUSEHOLD SIZE
21,267
LABOR FORCE [ PEOPLE ]
58.8%
PERCENT IN LABOR FORCE
5.7%
UNEMPLOYMENT RATE
Sierra Vista Area Codes
Income in Sierra Vista
Income Overview in Sierra Vista
Per Capita Income in Sierra Vista is $37,671, while median incomes of families and households are $87,754 and $70,899 respectively.
| Characteristic | Number | Measure |
| Per Capita Income | 45,212 | $37,671 |
| Median Family Income | 11,479 | $87,754 |
| Mean Family Income | 11,479 | $100,820 |
| Median Household Income | 18,382 | $70,899 |
| Mean Household Income | 18,382 | $88,006 |
| Income Deficit | 11,479 | $11,853 |
| Wage / Income Gap (%) | 45,212 | 33.13% |
| Wage / Income Gap ($) | 45,212 | 66.87¢ per $1 |
| Gini / Inequality Index | 45,212 | 0.42 |
Earnings by Sex in Sierra Vista
Average Earnings in Sierra Vista are $41,213, $52,462 for men and $35,080 for women, a difference of 33.1%.
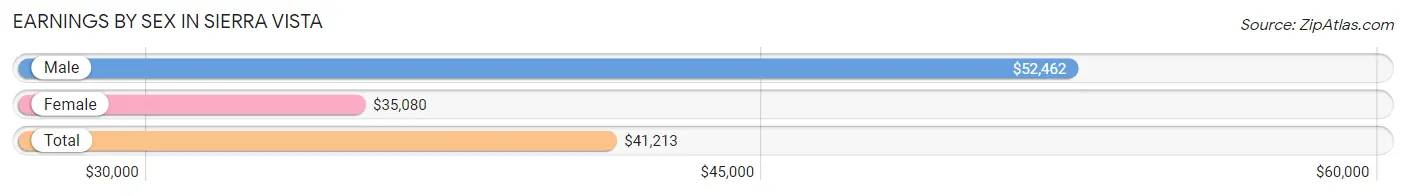
| Sex | Number | Average Earnings |
| Male | 12,700 (56.9%) | $52,462 |
| Female | 9,639 (43.1%) | $35,080 |
| Total | 22,339 (100.0%) | $41,213 |
Earnings by Sex by Income Bracket in Sierra Vista
The most common earnings brackets in Sierra Vista are $100,000+ for men (2,054 | 16.2%) and $35,000 to $39,999 for women (858 | 8.9%).
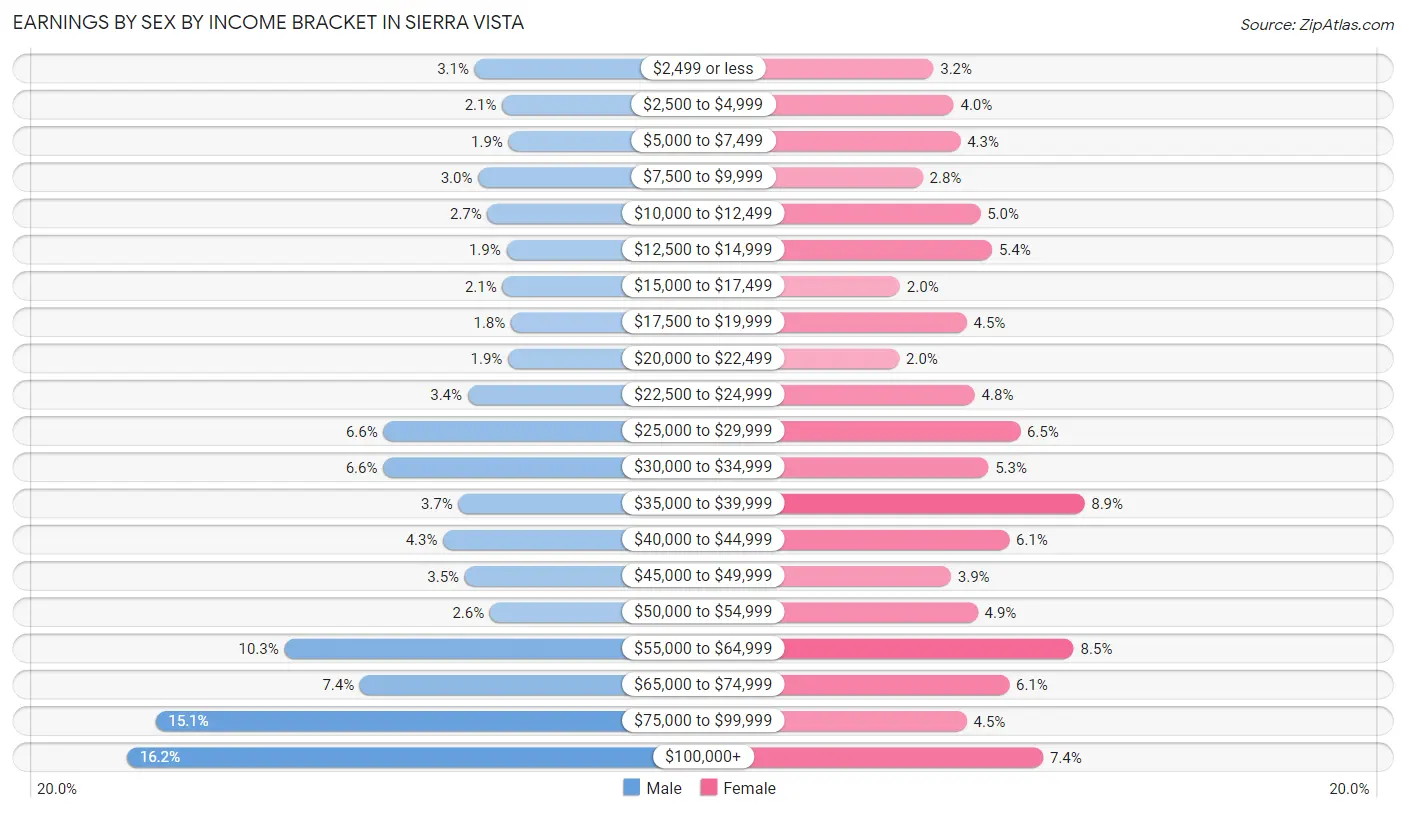
| Income | Male | Female |
| $2,499 or less | 398 (3.1%) | 312 (3.2%) |
| $2,500 to $4,999 | 267 (2.1%) | 386 (4.0%) |
| $5,000 to $7,499 | 236 (1.9%) | 410 (4.3%) |
| $7,500 to $9,999 | 381 (3.0%) | 274 (2.8%) |
| $10,000 to $12,499 | 337 (2.6%) | 482 (5.0%) |
| $12,500 to $14,999 | 247 (1.9%) | 524 (5.4%) |
| $15,000 to $17,499 | 265 (2.1%) | 192 (2.0%) |
| $17,500 to $19,999 | 225 (1.8%) | 433 (4.5%) |
| $20,000 to $22,499 | 239 (1.9%) | 189 (2.0%) |
| $22,500 to $24,999 | 430 (3.4%) | 462 (4.8%) |
| $25,000 to $29,999 | 832 (6.6%) | 626 (6.5%) |
| $30,000 to $34,999 | 833 (6.6%) | 511 (5.3%) |
| $35,000 to $39,999 | 475 (3.7%) | 858 (8.9%) |
| $40,000 to $44,999 | 547 (4.3%) | 586 (6.1%) |
| $45,000 to $49,999 | 445 (3.5%) | 376 (3.9%) |
| $50,000 to $54,999 | 325 (2.6%) | 472 (4.9%) |
| $55,000 to $64,999 | 1,303 (10.3%) | 819 (8.5%) |
| $65,000 to $74,999 | 943 (7.4%) | 586 (6.1%) |
| $75,000 to $99,999 | 1,918 (15.1%) | 433 (4.5%) |
| $100,000+ | 2,054 (16.2%) | 708 (7.3%) |
| Total | 12,700 (100.0%) | 9,639 (100.0%) |
Earnings by Sex by Educational Attainment in Sierra Vista
Average earnings in Sierra Vista are $62,899 for men and $36,955 for women, a difference of 41.2%. Men with an educational attainment of graduate degree enjoy the highest average annual earnings of $98,750, while those with less than high school education earn the least with $23,421. Women with an educational attainment of graduate degree earn the most with the average annual earnings of $62,798, while those with high school diploma education have the smallest earnings of $26,440.
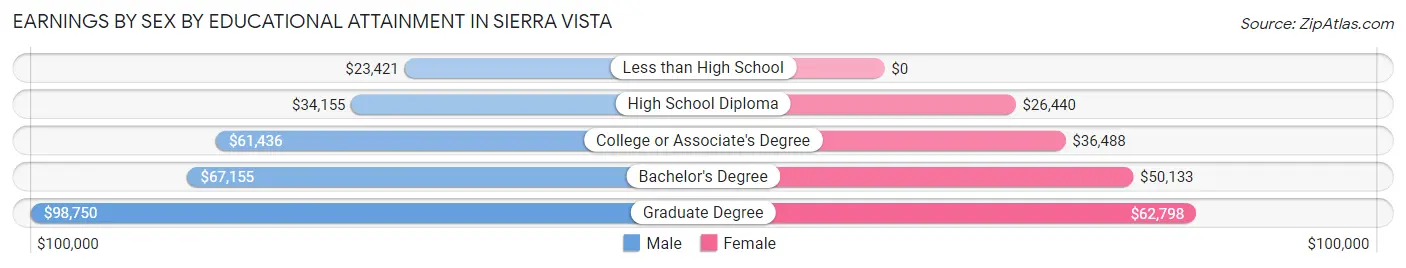
| Educational Attainment | Male Income | Female Income |
| Less than High School | $23,421 | $0 |
| High School Diploma | $34,155 | $26,440 |
| College or Associate's Degree | $61,436 | $36,488 |
| Bachelor's Degree | $67,155 | $50,133 |
| Graduate Degree | $98,750 | $62,798 |
| Total | $62,899 | $36,955 |
Family Income in Sierra Vista
Family Income Brackets in Sierra Vista
According to the Sierra Vista family income data, there are 2,479 families falling into the $100,000 to $149,999 income range, which is the most common income bracket and makes up 21.6% of all families. Conversely, the $10,000 to $14,999 income bracket is the least frequent group with only 264 families (2.3%) belonging to this category.
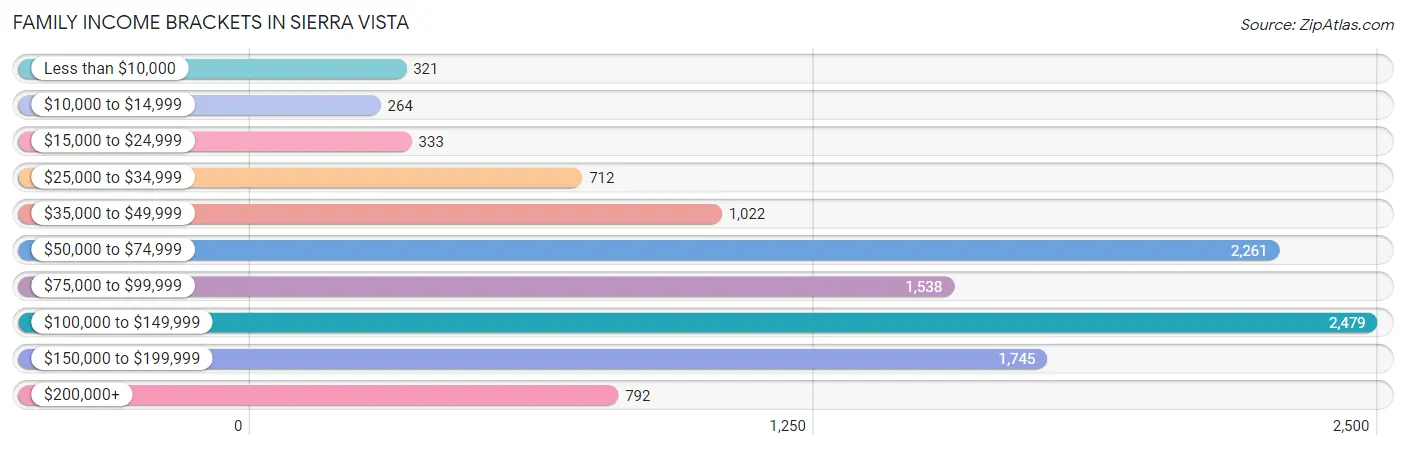
| Income Bracket | # Families | % Families |
| Less than $10,000 | 321 | 2.8% |
| $10,000 to $14,999 | 264 | 2.3% |
| $15,000 to $24,999 | 333 | 2.9% |
| $25,000 to $34,999 | 712 | 6.2% |
| $35,000 to $49,999 | 1,022 | 8.9% |
| $50,000 to $74,999 | 2,261 | 19.7% |
| $75,000 to $99,999 | 1,538 | 13.4% |
| $100,000 to $149,999 | 2,479 | 21.6% |
| $150,000 to $199,999 | 1,745 | 15.2% |
| $200,000+ | 792 | 6.9% |
Family Income by Famaliy Size in Sierra Vista
5-person families (1,170 | 10.2%) account for the highest median family income in Sierra Vista with $113,500 per family, while 2-person families (6,101 | 53.1%) have the highest median income of $40,811 per family member.
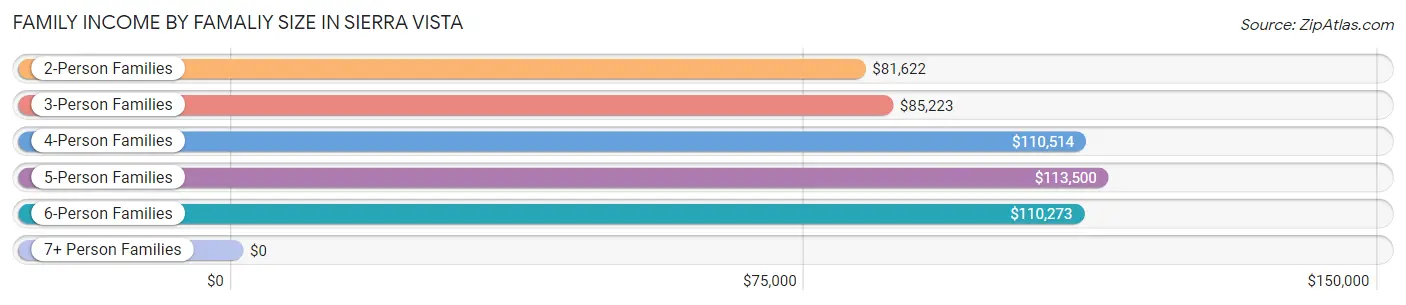
| Income Bracket | # Families | Median Income |
| 2-Person Families | 6,101 (53.1%) | $81,622 |
| 3-Person Families | 2,114 (18.4%) | $85,223 |
| 4-Person Families | 1,670 (14.5%) | $110,514 |
| 5-Person Families | 1,170 (10.2%) | $113,500 |
| 6-Person Families | 357 (3.1%) | $110,273 |
| 7+ Person Families | 67 (0.6%) | $0 |
| Total | 11,479 (100.0%) | $87,754 |
Family Income by Number of Earners in Sierra Vista
The median family income in Sierra Vista is $87,754, with families comprising 3+ earners (813) having the highest median family income of $121,838, while families with no earners (2,061) have the lowest median family income of $61,120, accounting for 7.1% and 17.9% of families, respectively.
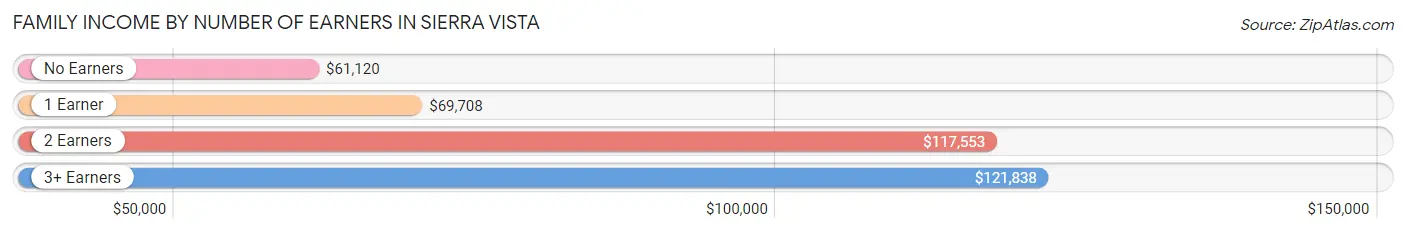
| Number of Earners | # Families | Median Income |
| No Earners | 2,061 (17.9%) | $61,120 |
| 1 Earner | 4,298 (37.4%) | $69,708 |
| 2 Earners | 4,307 (37.5%) | $117,553 |
| 3+ Earners | 813 (7.1%) | $121,838 |
| Total | 11,479 (100.0%) | $87,754 |
Household Income in Sierra Vista
Household Income Brackets in Sierra Vista
With 3,566 households falling in the category, the $100,000 to $149,999 income range is the most frequent in Sierra Vista, accounting for 19.4% of all households. In contrast, only 717 households (3.9%) fall into the $10,000 to $14,999 income bracket, making it the least populous group.
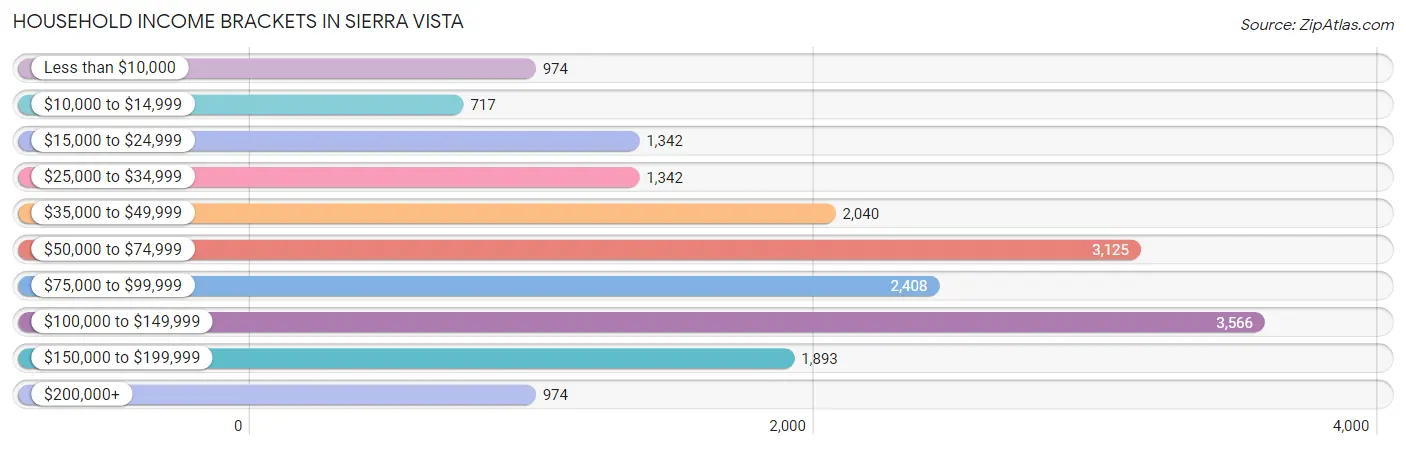
| Income Bracket | # Households | % Households |
| Less than $10,000 | 974 | 5.3% |
| $10,000 to $14,999 | 717 | 3.9% |
| $15,000 to $24,999 | 1,342 | 7.3% |
| $25,000 to $34,999 | 1,342 | 7.3% |
| $35,000 to $49,999 | 2,040 | 11.1% |
| $50,000 to $74,999 | 3,125 | 17.0% |
| $75,000 to $99,999 | 2,408 | 13.1% |
| $100,000 to $149,999 | 3,566 | 19.4% |
| $150,000 to $199,999 | 1,893 | 10.3% |
| $200,000+ | 974 | 5.3% |
Household Income by Householder Age in Sierra Vista
The median household income in Sierra Vista is $70,899, with the highest median household income of $104,460 found in the 45 to 64 years age bracket for the primary householder. A total of 5,557 households (30.2%) fall into this category. Meanwhile, the 15 to 24 years age bracket for the primary householder has the lowest median household income of $43,438, with 515 households (2.8%) in this group.
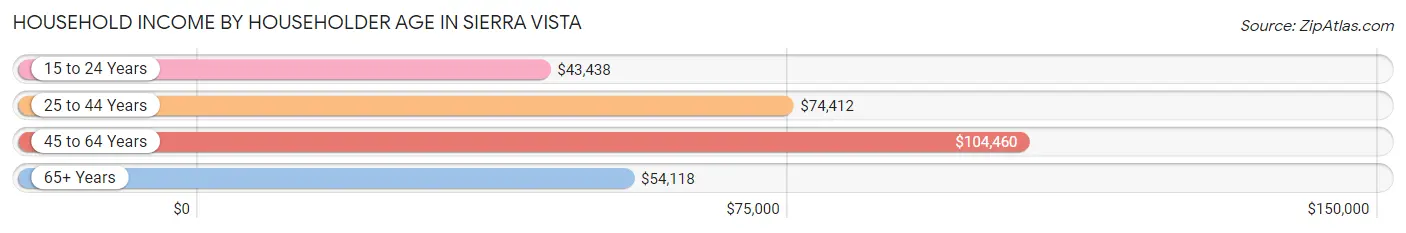
| Income Bracket | # Households | Median Income |
| 15 to 24 Years | 515 (2.8%) | $43,438 |
| 25 to 44 Years | 6,532 (35.5%) | $74,412 |
| 45 to 64 Years | 5,557 (30.2%) | $104,460 |
| 65+ Years | 5,778 (31.4%) | $54,118 |
| Total | 18,382 (100.0%) | $70,899 |
Poverty in Sierra Vista
Income Below Poverty by Sex and Age in Sierra Vista
With 8.6% poverty level for males and 13.0% for females among the residents of Sierra Vista, 18 to 24 year old males and 15 year old females are the most vulnerable to poverty, with 259 males (15.6%) and 49 females (25.0%) in their respective age groups living below the poverty level.
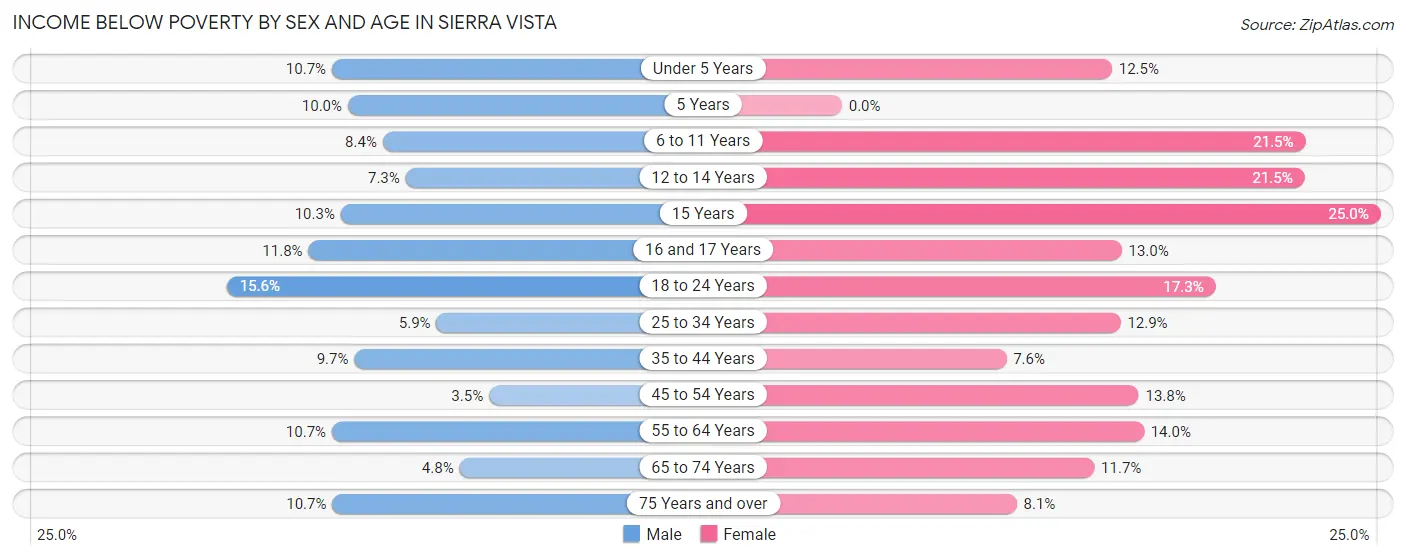
| Age Bracket | Male | Female |
| Under 5 Years | 151 (10.7%) | 153 (12.5%) |
| 5 Years | 41 (10.0%) | 0 (0.0%) |
| 6 to 11 Years | 137 (8.4%) | 380 (21.5%) |
| 12 to 14 Years | 62 (7.3%) | 161 (21.5%) |
| 15 Years | 31 (10.3%) | 49 (25.0%) |
| 16 and 17 Years | 55 (11.8%) | 78 (13.0%) |
| 18 to 24 Years | 259 (15.6%) | 243 (17.3%) |
| 25 to 34 Years | 196 (5.9%) | 388 (12.9%) |
| 35 to 44 Years | 297 (9.7%) | 206 (7.6%) |
| 45 to 54 Years | 78 (3.5%) | 315 (13.8%) |
| 55 to 64 Years | 253 (10.7%) | 342 (14.0%) |
| 65 to 74 Years | 91 (4.8%) | 325 (11.7%) |
| 75 Years and over | 166 (10.7%) | 200 (8.1%) |
| Total | 1,817 (8.6%) | 2,840 (13.0%) |
Income Above Poverty by Sex and Age in Sierra Vista
According to the poverty statistics in Sierra Vista, males aged 45 to 54 years and females aged 5 years are the age groups that are most secure financially, with 96.6% of males and 100.0% of females in these age groups living above the poverty line.
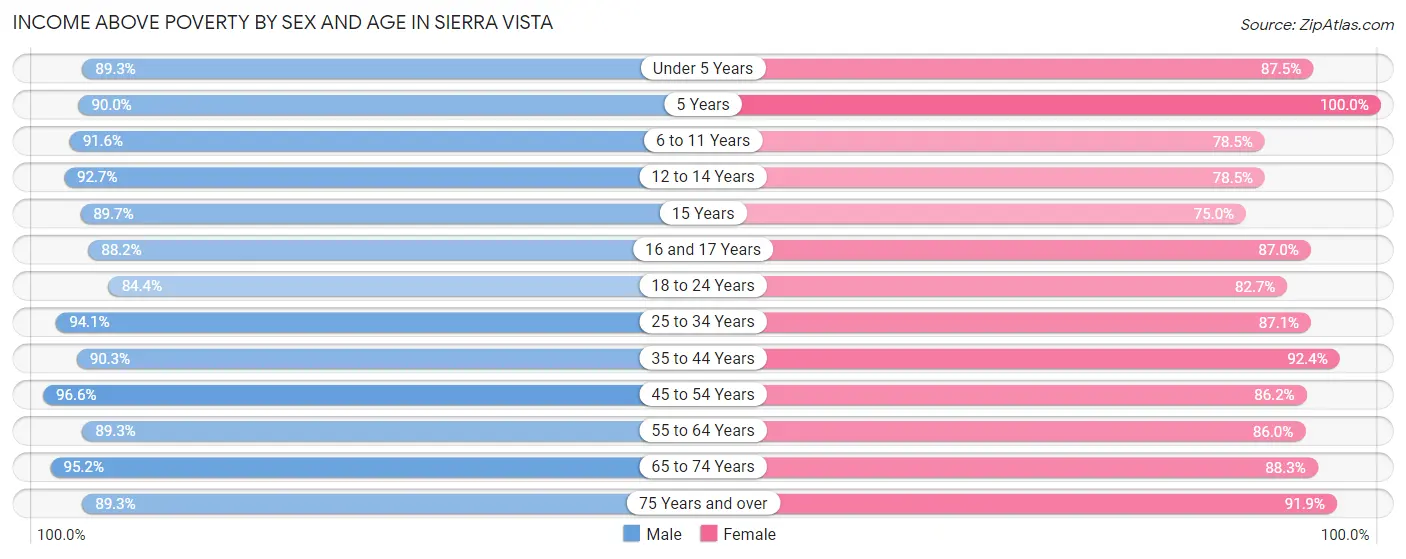
| Age Bracket | Male | Female |
| Under 5 Years | 1,255 (89.3%) | 1,068 (87.5%) |
| 5 Years | 369 (90.0%) | 221 (100.0%) |
| 6 to 11 Years | 1,497 (91.6%) | 1,387 (78.5%) |
| 12 to 14 Years | 785 (92.7%) | 589 (78.5%) |
| 15 Years | 269 (89.7%) | 147 (75.0%) |
| 16 and 17 Years | 410 (88.2%) | 523 (87.0%) |
| 18 to 24 Years | 1,399 (84.4%) | 1,158 (82.7%) |
| 25 to 34 Years | 3,133 (94.1%) | 2,613 (87.1%) |
| 35 to 44 Years | 2,766 (90.3%) | 2,493 (92.4%) |
| 45 to 54 Years | 2,180 (96.6%) | 1,973 (86.2%) |
| 55 to 64 Years | 2,103 (89.3%) | 2,099 (86.0%) |
| 65 to 74 Years | 1,797 (95.2%) | 2,451 (88.3%) |
| 75 Years and over | 1,382 (89.3%) | 2,266 (91.9%) |
| Total | 19,345 (91.4%) | 18,988 (87.0%) |
Income Below Poverty Among Married-Couple Families in Sierra Vista
The poverty statistics for married-couple families in Sierra Vista show that 2.5% or 218 of the total 8,744 families live below the poverty line. Families with 1 or 2 children have the highest poverty rate of 3.9%, comprising of 93 families. On the other hand, families with 5 or more children have the lowest poverty rate of 0.0%, which includes 0 families.
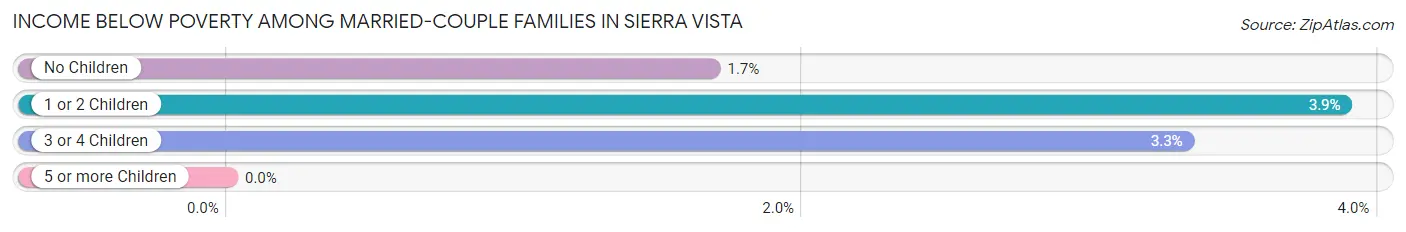
| Children | Above Poverty | Below Poverty |
| No Children | 5,136 (98.3%) | 88 (1.7%) |
| 1 or 2 Children | 2,302 (96.1%) | 93 (3.9%) |
| 3 or 4 Children | 1,075 (96.7%) | 37 (3.3%) |
| 5 or more Children | 13 (100.0%) | 0 (0.0%) |
| Total | 8,526 (97.5%) | 218 (2.5%) |
Income Below Poverty Among Single-Parent Households in Sierra Vista
According to the poverty data in Sierra Vista, 17.1% or 139 single-father households and 22.3% or 429 single-mother households are living below the poverty line. Among single-father households, those with 1 or 2 children have the highest poverty rate, with 125 households (24.7%) experiencing poverty. Likewise, among single-mother households, those with 5 or more children have the highest poverty rate, with 32 households (100.0%) falling below the poverty line.
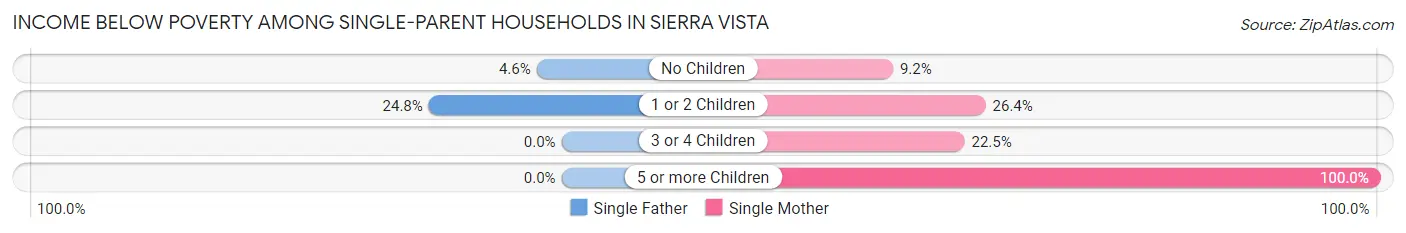
| Children | Single Father | Single Mother |
| No Children | 14 (4.6%) | 49 (9.2%) |
| 1 or 2 Children | 125 (24.7%) | 289 (26.4%) |
| 3 or 4 Children | 0 (0.0%) | 59 (22.5%) |
| 5 or more Children | 0 (0.0%) | 32 (100.0%) |
| Total | 139 (17.1%) | 429 (22.3%) |
Income Below Poverty Among Married-Couple vs Single-Parent Households in Sierra Vista
The poverty data for Sierra Vista shows that 218 of the married-couple family households (2.5%) and 568 of the single-parent households (20.8%) are living below the poverty level. Within the married-couple family households, those with 1 or 2 children have the highest poverty rate, with 93 households (3.9%) falling below the poverty line. Among the single-parent households, those with 5 or more children have the highest poverty rate, with 32 household (100.0%) living below poverty.
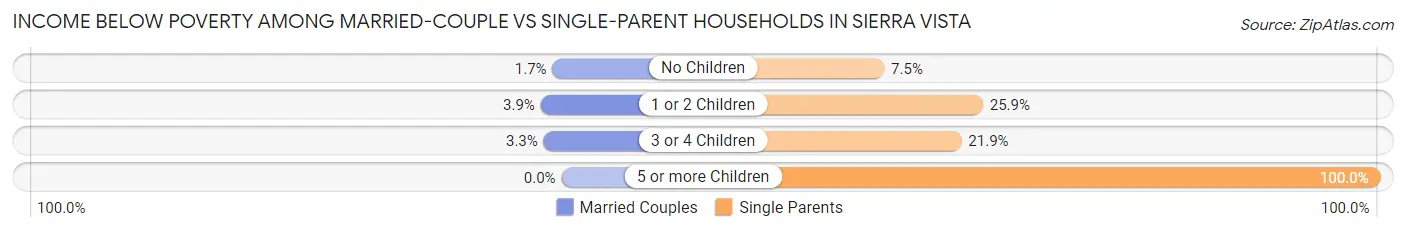
| Children | Married-Couple Families | Single-Parent Households |
| No Children | 88 (1.7%) | 63 (7.5%) |
| 1 or 2 Children | 93 (3.9%) | 414 (25.9%) |
| 3 or 4 Children | 37 (3.3%) | 59 (21.9%) |
| 5 or more Children | 0 (0.0%) | 32 (100.0%) |
| Total | 218 (2.5%) | 568 (20.8%) |
Race in Sierra Vista
The most populous races in Sierra Vista are White / Caucasian (30,736 | 68.0%), Hispanic or Latino (11,117 | 24.6%), and Two or more Races (6,891 | 15.2%).
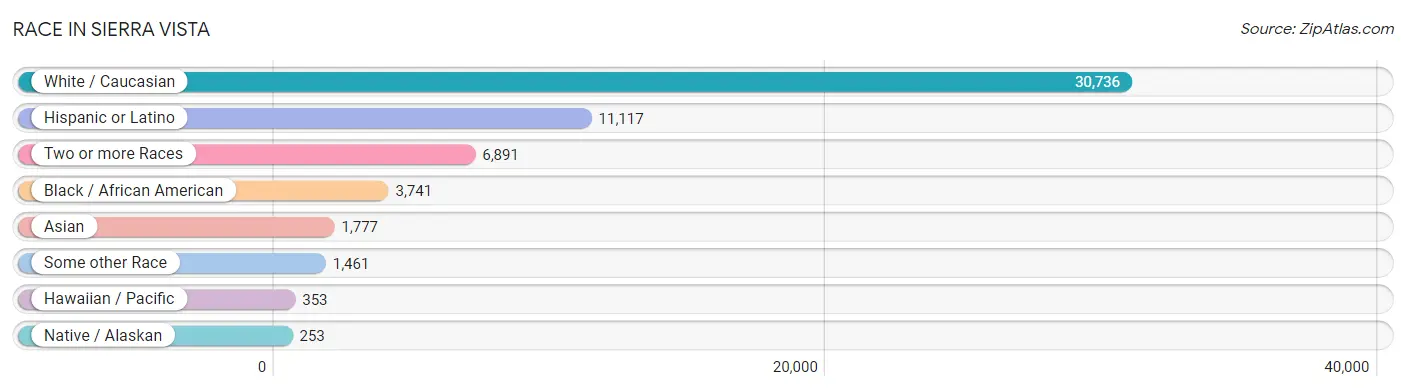
| Race | # Population | % Population |
| Asian | 1,777 | 3.9% |
| Black / African American | 3,741 | 8.3% |
| Hawaiian / Pacific | 353 | 0.8% |
| Hispanic or Latino | 11,117 | 24.6% |
| Native / Alaskan | 253 | 0.6% |
| White / Caucasian | 30,736 | 68.0% |
| Two or more Races | 6,891 | 15.2% |
| Some other Race | 1,461 | 3.2% |
| Total | 45,212 | 100.0% |
Ancestry in Sierra Vista
The most populous ancestries reported in Sierra Vista are Mexican (8,633 | 19.1%), German (6,713 | 14.8%), Irish (4,319 | 9.6%), English (4,193 | 9.3%), and Italian (1,864 | 4.1%), together accounting for 56.9% of all Sierra Vista residents.

| Ancestry | # Population | % Population |
| African | 294 | 0.6% |
| American | 1,580 | 3.5% |
| Apache | 25 | 0.1% |
| Arab | 144 | 0.3% |
| Argentinean | 94 | 0.2% |
| Armenian | 11 | 0.0% |
| Australian | 39 | 0.1% |
| Austrian | 170 | 0.4% |
| Bangladeshi | 12 | 0.0% |
| Basque | 4 | 0.0% |
| Bhutanese | 358 | 0.8% |
| Blackfeet | 42 | 0.1% |
| British | 242 | 0.5% |
| Bulgarian | 53 | 0.1% |
| Burmese | 1,135 | 2.5% |
| Cambodian | 44 | 0.1% |
| Canadian | 132 | 0.3% |
| Central American | 621 | 1.4% |
| Central American Indian | 12 | 0.0% |
| Cherokee | 168 | 0.4% |
| Chinese | 84 | 0.2% |
| Choctaw | 14 | 0.0% |
| Colombian | 37 | 0.1% |
| Costa Rican | 69 | 0.2% |
| Croatian | 14 | 0.0% |
| Crow | 9 | 0.0% |
| Cuban | 189 | 0.4% |
| Czech | 70 | 0.2% |
| Czechoslovakian | 46 | 0.1% |
| Danish | 213 | 0.5% |
| Dominican | 100 | 0.2% |
| Dutch | 393 | 0.9% |
| Eastern European | 133 | 0.3% |
| Ecuadorian | 127 | 0.3% |
| English | 4,193 | 9.3% |
| European | 1,542 | 3.4% |
| Filipino | 36 | 0.1% |
| Finnish | 43 | 0.1% |
| French | 916 | 2.0% |
| French Canadian | 317 | 0.7% |
| German | 6,713 | 14.8% |
| Greek | 111 | 0.3% |
| Guamanian / Chamorro | 89 | 0.2% |
| Guatemalan | 308 | 0.7% |
| Guyanese | 49 | 0.1% |
| Haitian | 11 | 0.0% |
| Honduran | 22 | 0.1% |
| Hopi | 139 | 0.3% |
| Hungarian | 32 | 0.1% |
| Indian (Asian) | 205 | 0.4% |
| Indonesian | 9 | 0.0% |
| Iranian | 44 | 0.1% |
| Irish | 4,319 | 9.6% |
| Italian | 1,864 | 4.1% |
| Jamaican | 62 | 0.1% |
| Japanese | 99 | 0.2% |
| Korean | 835 | 1.8% |
| Laotian | 52 | 0.1% |
| Latvian | 31 | 0.1% |
| Lebanese | 48 | 0.1% |
| Lithuanian | 58 | 0.1% |
| Luxembourger | 9 | 0.0% |
| Malaysian | 10 | 0.0% |
| Mexican | 8,633 | 19.1% |
| Mexican American Indian | 59 | 0.1% |
| Moroccan | 69 | 0.2% |
| Native Hawaiian | 376 | 0.8% |
| Navajo | 166 | 0.4% |
| Nicaraguan | 24 | 0.1% |
| Nigerian | 75 | 0.2% |
| Northern European | 244 | 0.5% |
| Norwegian | 612 | 1.3% |
| Osage | 7 | 0.0% |
| Pakistani | 52 | 0.1% |
| Panamanian | 100 | 0.2% |
| Pennsylvania German | 19 | 0.0% |
| Peruvian | 39 | 0.1% |
| Polish | 1,232 | 2.7% |
| Portuguese | 22 | 0.1% |
| Potawatomi | 37 | 0.1% |
| Puerto Rican | 716 | 1.6% |
| Romanian | 86 | 0.2% |
| Russian | 181 | 0.4% |
| Salvadoran | 98 | 0.2% |
| Scandinavian | 128 | 0.3% |
| Scotch-Irish | 395 | 0.9% |
| Scottish | 700 | 1.5% |
| Sioux | 52 | 0.1% |
| Slovak | 118 | 0.3% |
| Slovene | 13 | 0.0% |
| South American | 297 | 0.7% |
| South American Indian | 42 | 0.1% |
| Spaniard | 173 | 0.4% |
| Spanish | 139 | 0.3% |
| Spanish American Indian | 7 | 0.0% |
| Sri Lankan | 239 | 0.5% |
| Subsaharan African | 376 | 0.8% |
| Swedish | 537 | 1.2% |
| Swiss | 82 | 0.2% |
| Syrian | 18 | 0.0% |
| Tlingit-Haida | 59 | 0.1% |
| Trinidadian and Tobagonian | 15 | 0.0% |
| Ukrainian | 113 | 0.3% |
| Vietnamese | 52 | 0.1% |
| Welsh | 396 | 0.9% |
| Yaqui | 17 | 0.0% |
| Yuman | 20 | 0.0% |
| Yup'ik | 25 | 0.1% | View All 108 Rows |
Immigrants in Sierra Vista
The most numerous immigrant groups reported in Sierra Vista came from Latin America (1,809 | 4.0%), Central America (1,637 | 3.6%), Asia (1,400 | 3.1%), Mexico (1,260 | 2.8%), and Europe (675 | 1.5%), together accounting for 15.0% of all Sierra Vista residents.
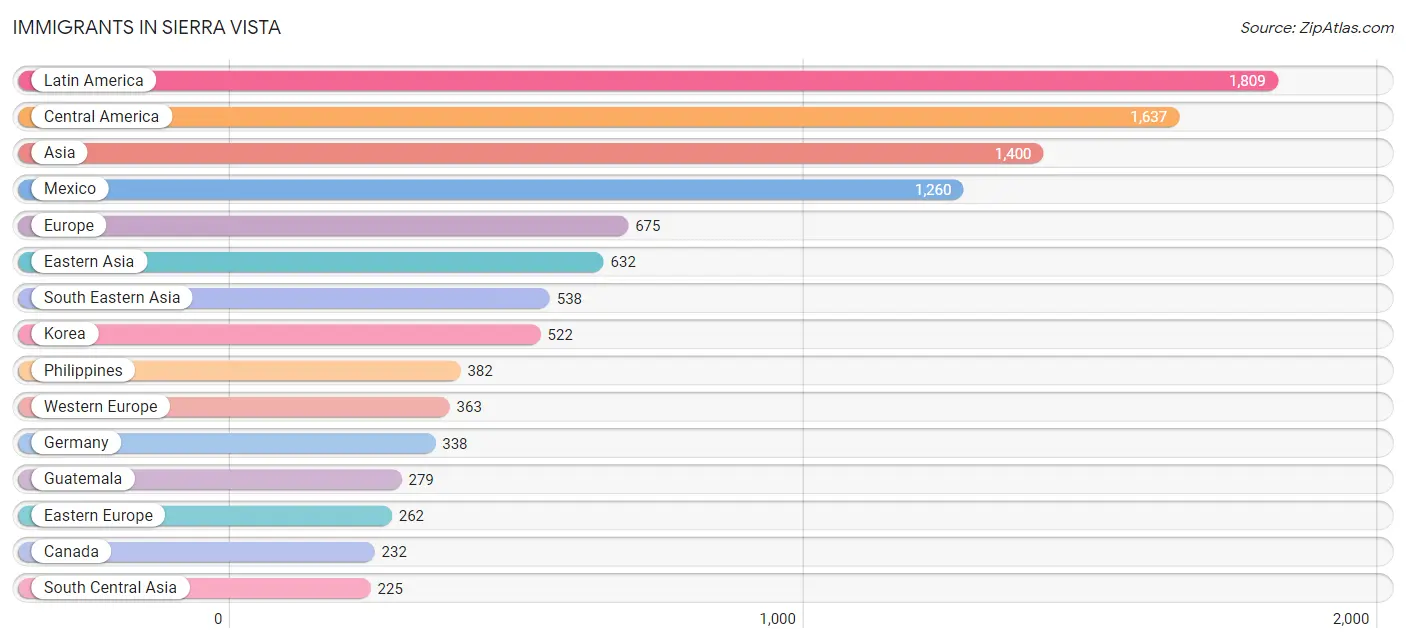
| Immigration Origin | # Population | % Population |
| Africa | 111 | 0.3% |
| Argentina | 30 | 0.1% |
| Asia | 1,400 | 3.1% |
| Australia | 27 | 0.1% |
| Austria | 14 | 0.0% |
| Bangladesh | 37 | 0.1% |
| Bolivia | 1 | 0.0% |
| Brazil | 6 | 0.0% |
| Bulgaria | 42 | 0.1% |
| Canada | 232 | 0.5% |
| Caribbean | 42 | 0.1% |
| Central America | 1,637 | 3.6% |
| China | 72 | 0.2% |
| Colombia | 10 | 0.0% |
| Costa Rica | 13 | 0.0% |
| Czechoslovakia | 14 | 0.0% |
| Dominican Republic | 35 | 0.1% |
| Eastern Asia | 632 | 1.4% |
| Eastern Europe | 262 | 0.6% |
| Ecuador | 17 | 0.0% |
| El Salvador | 51 | 0.1% |
| England | 22 | 0.1% |
| Europe | 675 | 1.5% |
| France | 11 | 0.0% |
| Germany | 338 | 0.7% |
| Guatemala | 279 | 0.6% |
| Guyana | 13 | 0.0% |
| Haiti | 7 | 0.0% |
| Hong Kong | 24 | 0.1% |
| Hungary | 5 | 0.0% |
| Indonesia | 8 | 0.0% |
| Iran | 151 | 0.3% |
| Japan | 38 | 0.1% |
| Korea | 522 | 1.1% |
| Kuwait | 5 | 0.0% |
| Latin America | 1,809 | 4.0% |
| Mexico | 1,260 | 2.8% |
| Middle Africa | 20 | 0.0% |
| Morocco | 80 | 0.2% |
| Nepal | 37 | 0.1% |
| Nigeria | 2 | 0.0% |
| Northern Africa | 89 | 0.2% |
| Northern Europe | 33 | 0.1% |
| Oceania | 27 | 0.1% |
| Panama | 34 | 0.1% |
| Peru | 14 | 0.0% |
| Philippines | 382 | 0.8% |
| Poland | 167 | 0.4% |
| Romania | 21 | 0.1% |
| Russia | 13 | 0.0% |
| South America | 130 | 0.3% |
| South Central Asia | 225 | 0.5% |
| South Eastern Asia | 538 | 1.2% |
| Southern Europe | 17 | 0.0% |
| Spain | 17 | 0.0% |
| Thailand | 5 | 0.0% |
| Vietnam | 142 | 0.3% |
| Western Africa | 2 | 0.0% |
| Western Asia | 5 | 0.0% |
| Western Europe | 363 | 0.8% |
| Zaire | 20 | 0.0% | View All 61 Rows |
Sex and Age in Sierra Vista
Sex and Age in Sierra Vista
The most populous age groups in Sierra Vista are 25 to 29 Years (1,941 | 8.5%) for men and 30 to 34 Years (1,772 | 7.9%) for women.
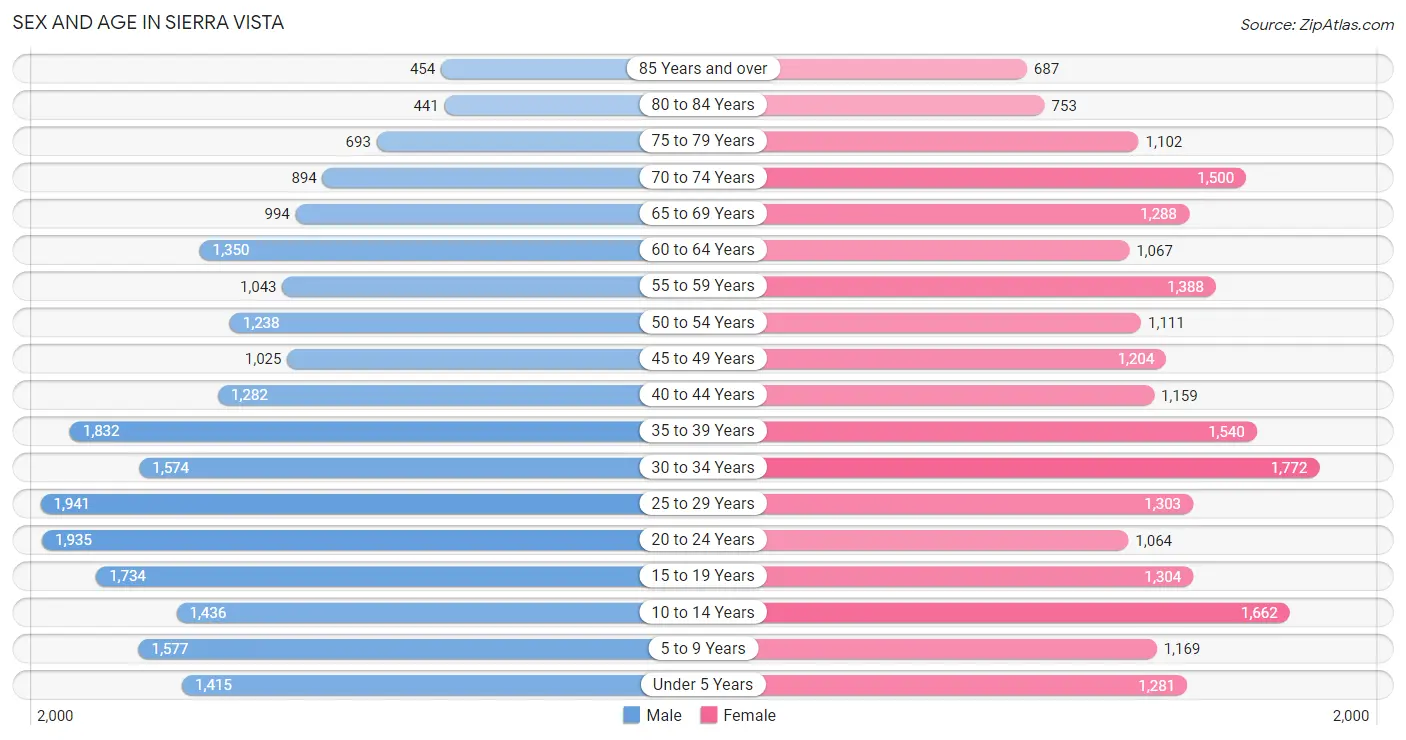
| Age Bracket | Male | Female |
| Under 5 Years | 1,415 (6.2%) | 1,281 (5.7%) |
| 5 to 9 Years | 1,577 (6.9%) | 1,169 (5.2%) |
| 10 to 14 Years | 1,436 (6.3%) | 1,662 (7.4%) |
| 15 to 19 Years | 1,734 (7.6%) | 1,304 (5.8%) |
| 20 to 24 Years | 1,935 (8.5%) | 1,064 (4.8%) |
| 25 to 29 Years | 1,941 (8.5%) | 1,303 (5.8%) |
| 30 to 34 Years | 1,574 (6.9%) | 1,772 (7.9%) |
| 35 to 39 Years | 1,832 (8.0%) | 1,540 (6.9%) |
| 40 to 44 Years | 1,282 (5.6%) | 1,159 (5.2%) |
| 45 to 49 Years | 1,025 (4.5%) | 1,204 (5.4%) |
| 50 to 54 Years | 1,238 (5.4%) | 1,111 (5.0%) |
| 55 to 59 Years | 1,043 (4.6%) | 1,388 (6.2%) |
| 60 to 64 Years | 1,350 (5.9%) | 1,067 (4.8%) |
| 65 to 69 Years | 994 (4.3%) | 1,288 (5.8%) |
| 70 to 74 Years | 894 (3.9%) | 1,500 (6.7%) |
| 75 to 79 Years | 693 (3.0%) | 1,102 (4.9%) |
| 80 to 84 Years | 441 (1.9%) | 753 (3.4%) |
| 85 Years and over | 454 (2.0%) | 687 (3.1%) |
| Total | 22,858 (100.0%) | 22,354 (100.0%) |
Families and Households in Sierra Vista
Median Family Size in Sierra Vista
The median family size in Sierra Vista is 2.95 persons per family, with single female/mother families (1,921 | 16.7%) accounting for the largest median family size of 3.11 persons per family. On the other hand, single male/father families (814 | 7.1%) represent the smallest median family size with 2.64 persons per family.
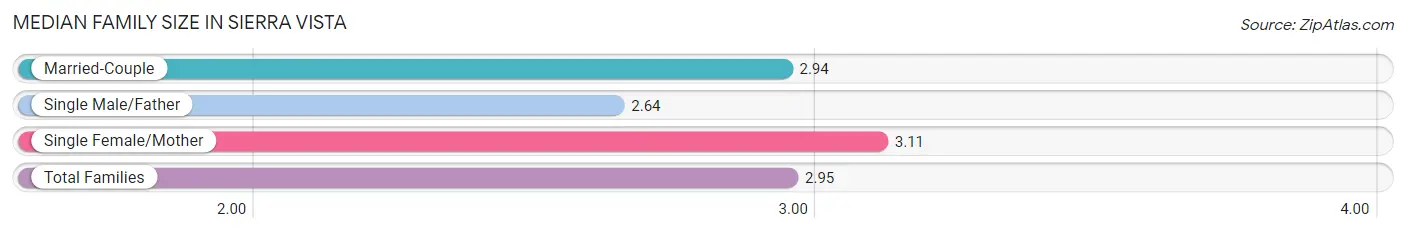
| Family Type | # Families | Family Size |
| Married-Couple | 8,744 (76.2%) | 2.94 |
| Single Male/Father | 814 (7.1%) | 2.64 |
| Single Female/Mother | 1,921 (16.7%) | 3.11 |
| Total Families | 11,479 (100.0%) | 2.95 |
Median Household Size in Sierra Vista
The median household size in Sierra Vista is 2.35 persons per household, with single female/mother households (1,921 | 10.4%) accounting for the largest median household size of 3.35 persons per household. non-family households (6,903 | 37.6%) represent the smallest median household size with 1.22 persons per household.
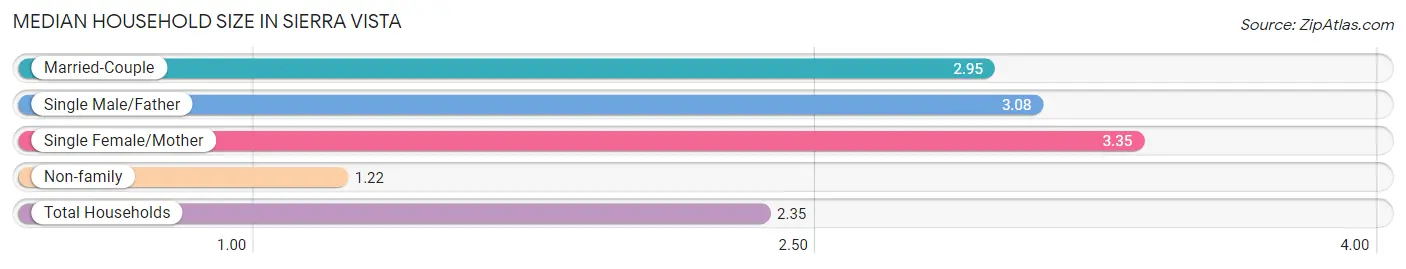
| Household Type | # Households | Household Size |
| Married-Couple | 8,744 (47.6%) | 2.95 |
| Single Male/Father | 814 (4.4%) | 3.08 |
| Single Female/Mother | 1,921 (10.4%) | 3.35 |
| Non-family | 6,903 (37.6%) | 1.22 |
| Total Households | 18,382 (100.0%) | 2.35 |
Household Size by Marriage Status in Sierra Vista
Out of a total of 18,382 households in Sierra Vista, 11,479 (62.5%) are family households, while 6,903 (37.6%) are nonfamily households. The most numerous type of family households are 2-person households, comprising 5,548, and the most common type of nonfamily households are 1-person households, comprising 5,923.
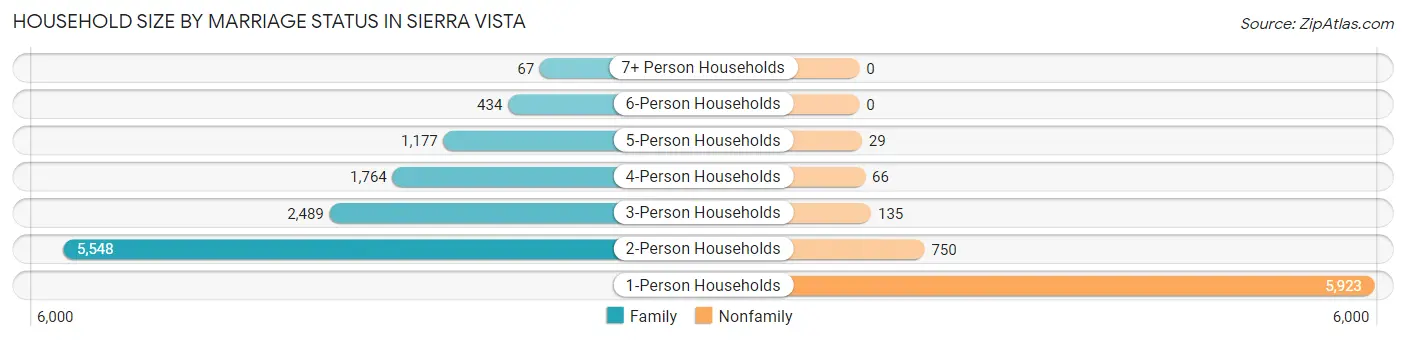
| Household Size | Family Households | Nonfamily Households |
| 1-Person Households | - | 5,923 (32.2%) |
| 2-Person Households | 5,548 (30.2%) | 750 (4.1%) |
| 3-Person Households | 2,489 (13.5%) | 135 (0.7%) |
| 4-Person Households | 1,764 (9.6%) | 66 (0.4%) |
| 5-Person Households | 1,177 (6.4%) | 29 (0.2%) |
| 6-Person Households | 434 (2.4%) | 0 (0.0%) |
| 7+ Person Households | 67 (0.4%) | 0 (0.0%) |
| Total | 11,479 (62.5%) | 6,903 (37.6%) |
Female Fertility in Sierra Vista
Fertility by Age in Sierra Vista
Average fertility rate in Sierra Vista is 64.0 births per 1,000 women. Women in the age bracket of 20 to 34 years have the highest fertility rate with 122.0 births per 1,000 women. Women in the age bracket of 20 to 34 years acount for 82.7% of all women with births.
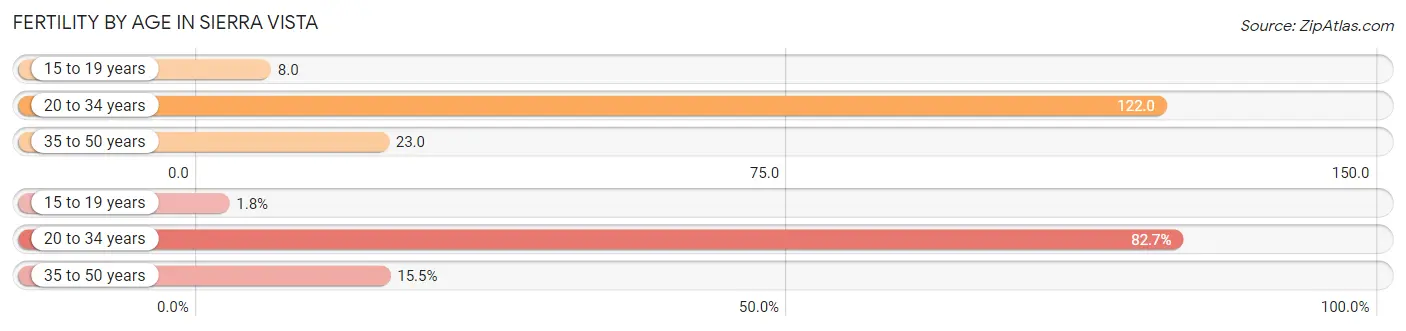
| Age Bracket | Women with Births | Births / 1,000 Women |
| 15 to 19 years | 11 (1.8%) | 8.0 |
| 20 to 34 years | 503 (82.7%) | 122.0 |
| 35 to 50 years | 94 (15.5%) | 23.0 |
| Total | 608 (100.0%) | 64.0 |
Fertility by Age by Marriage Status in Sierra Vista
95.6% of women with births (608) in Sierra Vista are married. The highest percentage of unmarried women with births falls into 15 to 19 years age bracket with 100.0% of them unmarried at the time of birth, while the lowest percentage of unmarried women with births belong to 35 to 50 years age bracket with 0.0% of them unmarried.
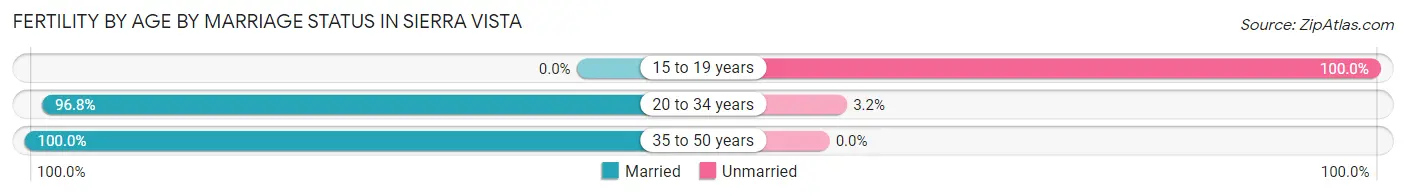
| Age Bracket | Married | Unmarried |
| 15 to 19 years | 0 (0.0%) | 11 (100.0%) |
| 20 to 34 years | 487 (96.8%) | 16 (3.2%) |
| 35 to 50 years | 94 (100.0%) | 0 (0.0%) |
| Total | 581 (95.6%) | 27 (4.4%) |
Fertility by Education in Sierra Vista
Average fertility rate in Sierra Vista is 64.0 births per 1,000 women. Women with the education attainment of graduate degree have the highest fertility rate of 134.0 births per 1,000 women, while women with the education attainment of high school diploma have the lowest fertility at 23.0 births per 1,000 women. Women with the education attainment of college or associate's degree represent 29.9% of all women with births.
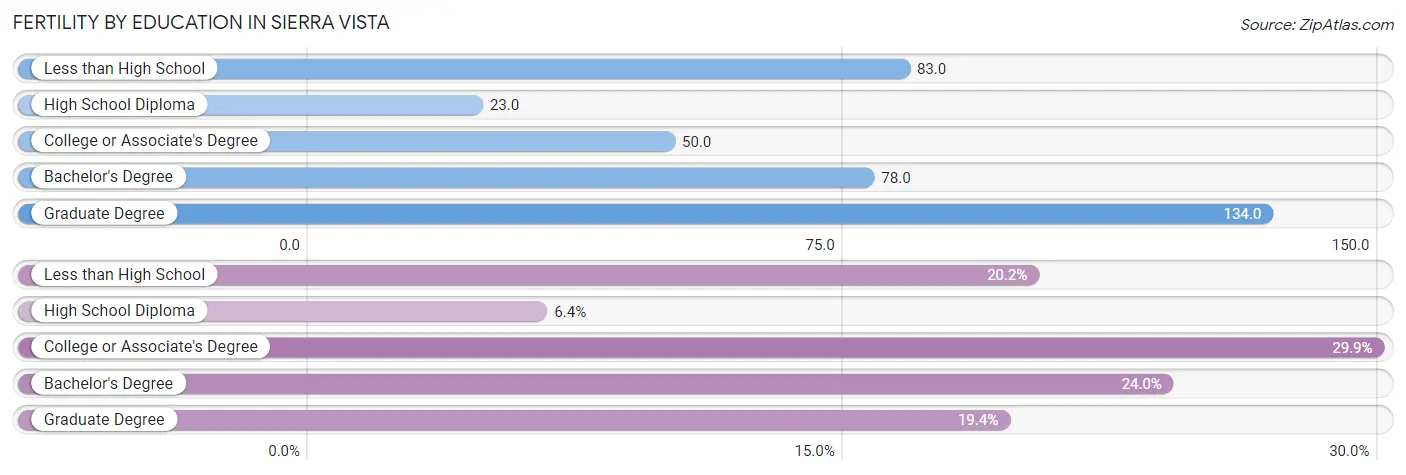
| Educational Attainment | Women with Births | Births / 1,000 Women |
| Less than High School | 123 (20.2%) | 83.0 |
| High School Diploma | 39 (6.4%) | 23.0 |
| College or Associate's Degree | 182 (29.9%) | 50.0 |
| Bachelor's Degree | 146 (24.0%) | 78.0 |
| Graduate Degree | 118 (19.4%) | 134.0 |
| Total | 608 (100.0%) | 64.0 |
Fertility by Education by Marriage Status in Sierra Vista
4.4% of women with births in Sierra Vista are unmarried. Women with the educational attainment of high school diploma are most likely to be married with 100.0% of them married at childbirth, while women with the educational attainment of less than high school are least likely to be married with 13.0% of them unmarried at childbirth.
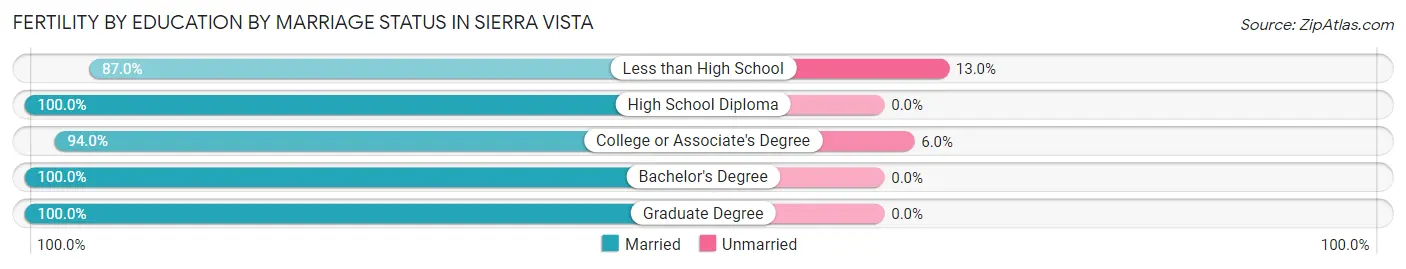
| Educational Attainment | Married | Unmarried |
| Less than High School | 107 (87.0%) | 16 (13.0%) |
| High School Diploma | 39 (100.0%) | 0 (0.0%) |
| College or Associate's Degree | 171 (94.0%) | 11 (6.0%) |
| Bachelor's Degree | 146 (100.0%) | 0 (0.0%) |
| Graduate Degree | 118 (100.0%) | 0 (0.0%) |
| Total | 581 (95.6%) | 27 (4.4%) |
Employment Characteristics in Sierra Vista
Employment by Class of Employer in Sierra Vista
Among the 19,918 employed individuals in Sierra Vista, private company employees (9,167 | 46.0%), federal government employees (6,808 | 34.2%), and not-for-profit organizations (1,135 | 5.7%) make up the most common classes of employment.
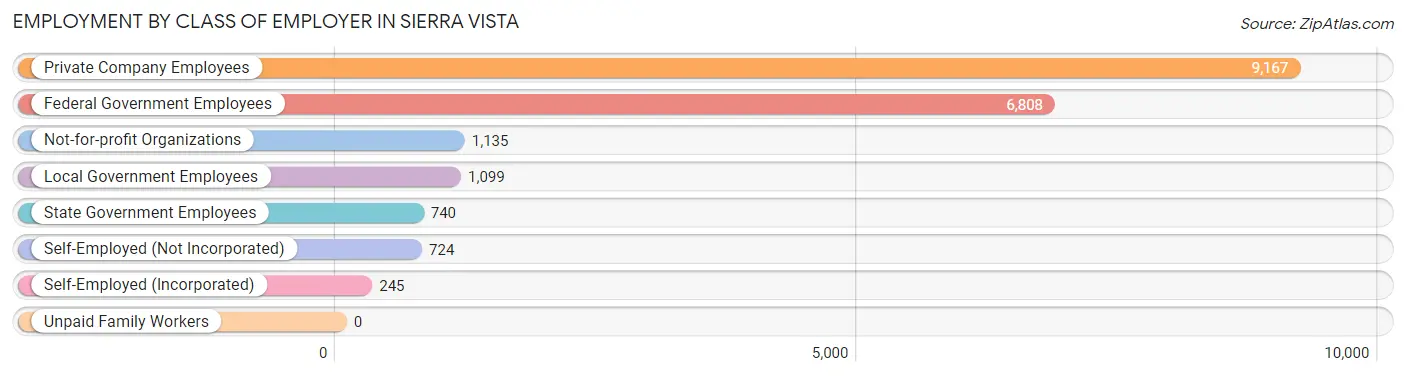
| Employer Class | # Employees | % Employees |
| Private Company Employees | 9,167 | 46.0% |
| Self-Employed (Incorporated) | 245 | 1.2% |
| Self-Employed (Not Incorporated) | 724 | 3.6% |
| Not-for-profit Organizations | 1,135 | 5.7% |
| Local Government Employees | 1,099 | 5.5% |
| State Government Employees | 740 | 3.7% |
| Federal Government Employees | 6,808 | 34.2% |
| Unpaid Family Workers | 0 | 0.0% |
| Total | 19,918 | 100.0% |
Employment Status by Age in Sierra Vista
According to the labor force statistics for Sierra Vista, out of the total population over 16 years of age (36,169), 58.8% or 21,267 individuals are in the labor force, with 5.7% or 1,212 of them unemployed. The age group with the highest labor force participation rate is 25 to 29 years, with 91.3% or 2,962 individuals in the labor force. Within the labor force, the 25 to 29 years age range has the highest percentage of unemployed individuals, with 12.1% or 358 of them being unemployed.
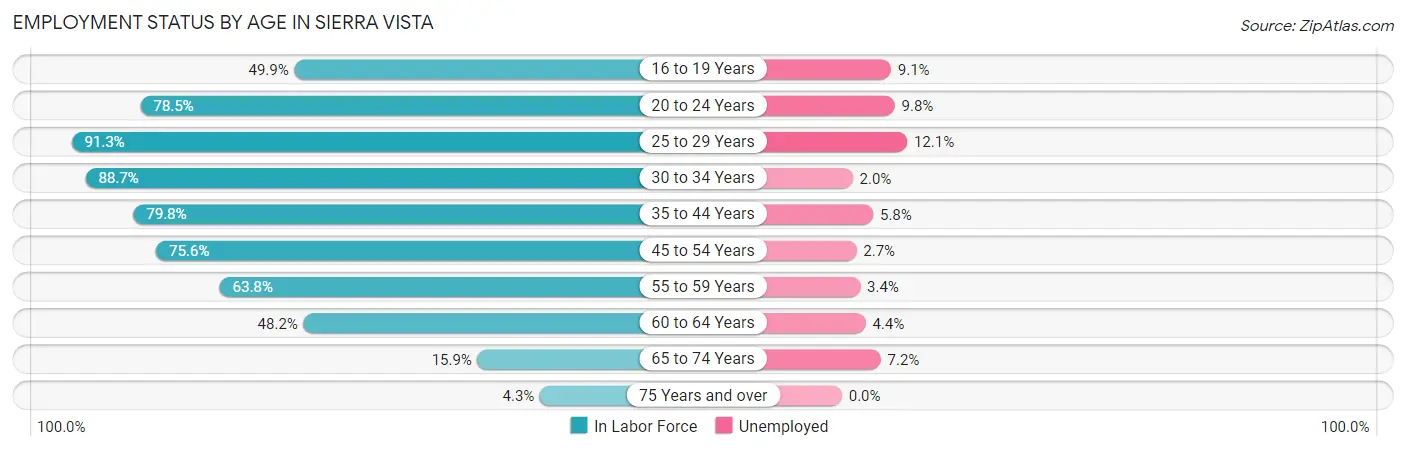
| Age Bracket | In Labor Force | Unemployed |
| 16 to 19 Years | 1,265 (49.9%) | 115 (9.1%) |
| 20 to 24 Years | 2,354 (78.5%) | 231 (9.8%) |
| 25 to 29 Years | 2,962 (91.3%) | 358 (12.1%) |
| 30 to 34 Years | 2,968 (88.7%) | 59 (2.0%) |
| 35 to 44 Years | 4,639 (79.8%) | 269 (5.8%) |
| 45 to 54 Years | 3,461 (75.6%) | 93 (2.7%) |
| 55 to 59 Years | 1,551 (63.8%) | 53 (3.4%) |
| 60 to 64 Years | 1,165 (48.2%) | 51 (4.4%) |
| 65 to 74 Years | 743 (15.9%) | 53 (7.2%) |
| 75 Years and over | 178 (4.3%) | 0 (0.0%) |
| Total | 21,267 (58.8%) | 1,212 (5.7%) |
Employment Status by Educational Attainment in Sierra Vista
According to labor force statistics for Sierra Vista, 76.7% of individuals (16,743) out of the total population between 25 and 64 years of age (21,829) are in the labor force, with 5.0% or 837 of them being unemployed. The group with the highest labor force participation rate are those with the educational attainment of bachelor's degree or higher, with 85.8% or 6,410 individuals in the labor force. Within the labor force, individuals with high school diploma education have the highest percentage of unemployment, with 14.5% or 389 of them being unemployed.
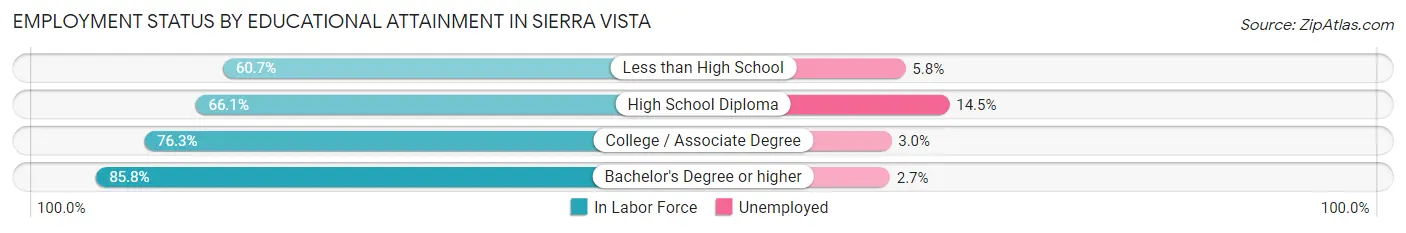
| Educational Attainment | In Labor Force | Unemployed |
| Less than High School | 830 (60.7%) | 79 (5.8%) |
| High School Diploma | 2,685 (66.1%) | 589 (14.5%) |
| College / Associate Degree | 6,812 (76.3%) | 268 (3.0%) |
| Bachelor's Degree or higher | 6,410 (85.8%) | 202 (2.7%) |
| Total | 16,743 (76.7%) | 1,091 (5.0%) |
Employment Occupations by Sex in Sierra Vista
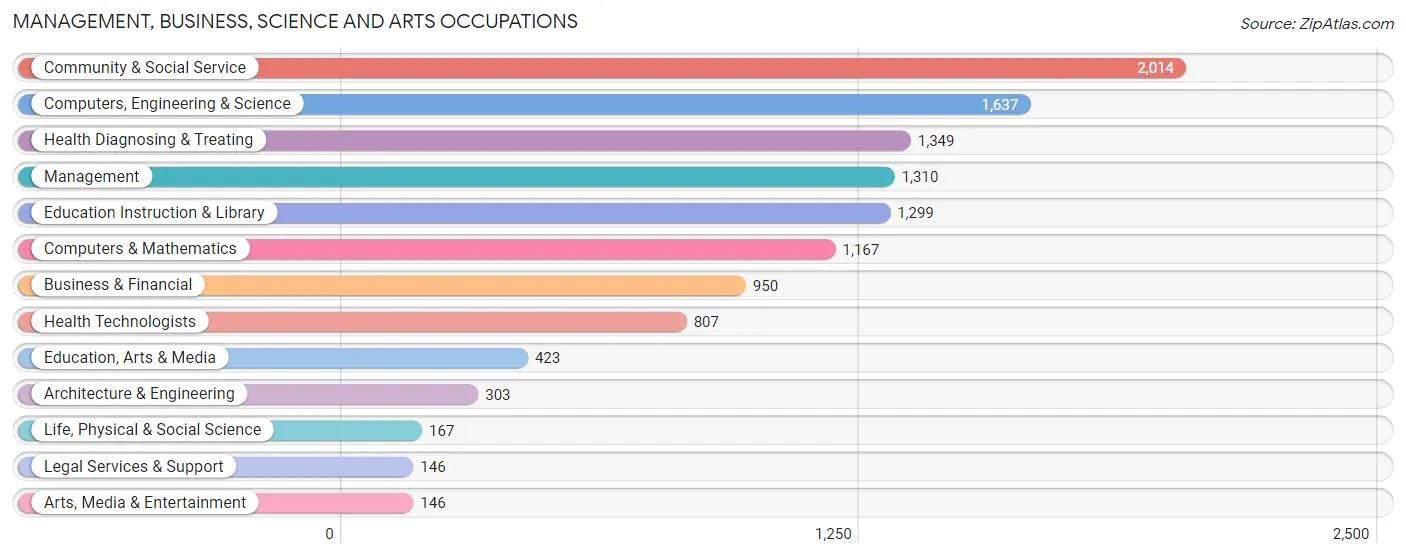
Management, Business, Science and Arts Occupations
The most common Management, Business, Science and Arts occupations in Sierra Vista are Community & Social Service (2,014 | 12.1%), Computers, Engineering & Science (1,637 | 9.8%), Health Diagnosing & Treating (1,349 | 8.1%), Management (1,310 | 7.8%), and Education Instruction & Library (1,299 | 7.8%).
Management, Business, Science and Arts Occupations by Sex
Within the Management, Business, Science and Arts occupations in Sierra Vista, the most male-oriented occupations are Computers & Mathematics (81.6%), Computers, Engineering & Science (80.9%), and Life, Physical & Social Science (80.8%), while the most female-oriented occupations are Legal Services & Support (93.8%), Health Diagnosing & Treating (69.5%), and Health Technologists (66.3%).
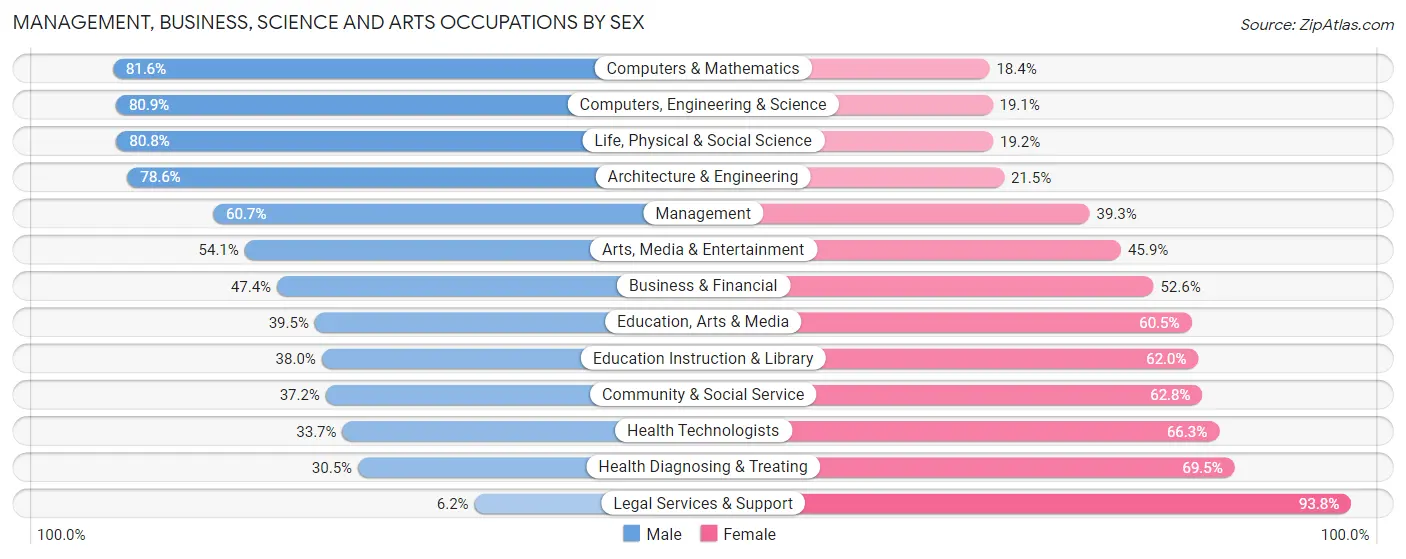
| Occupation | Male | Female |
| Management | 795 (60.7%) | 515 (39.3%) |
| Business & Financial | 450 (47.4%) | 500 (52.6%) |
| Computers, Engineering & Science | 1,325 (80.9%) | 312 (19.1%) |
| Computers & Mathematics | 952 (81.6%) | 215 (18.4%) |
| Architecture & Engineering | 238 (78.5%) | 65 (21.4%) |
| Life, Physical & Social Science | 135 (80.8%) | 32 (19.2%) |
| Community & Social Service | 749 (37.2%) | 1,265 (62.8%) |
| Education, Arts & Media | 167 (39.5%) | 256 (60.5%) |
| Legal Services & Support | 9 (6.2%) | 137 (93.8%) |
| Education Instruction & Library | 494 (38.0%) | 805 (62.0%) |
| Arts, Media & Entertainment | 79 (54.1%) | 67 (45.9%) |
| Health Diagnosing & Treating | 411 (30.5%) | 938 (69.5%) |
| Health Technologists | 272 (33.7%) | 535 (66.3%) |
| Total (Category) | 3,730 (51.4%) | 3,530 (48.6%) |
| Total (Overall) | 8,661 (51.9%) | 8,040 (48.1%) |
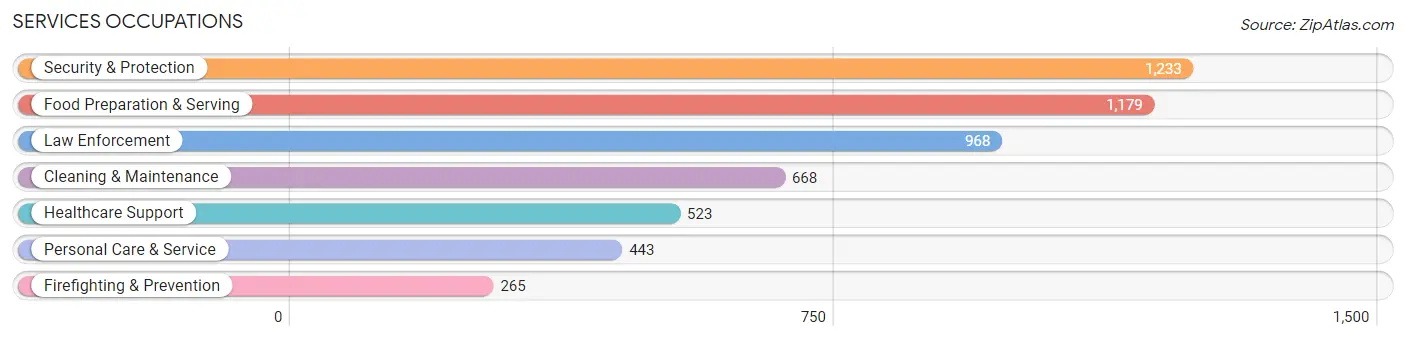
Services Occupations
The most common Services occupations in Sierra Vista are Security & Protection (1,233 | 7.4%), Food Preparation & Serving (1,179 | 7.1%), Law Enforcement (968 | 5.8%), Cleaning & Maintenance (668 | 4.0%), and Healthcare Support (523 | 3.1%).
Services Occupations by Sex
Within the Services occupations in Sierra Vista, the most male-oriented occupations are Law Enforcement (94.9%), Security & Protection (90.5%), and Firefighting & Prevention (74.3%), while the most female-oriented occupations are Healthcare Support (78.6%), Personal Care & Service (74.9%), and Food Preparation & Serving (56.2%).
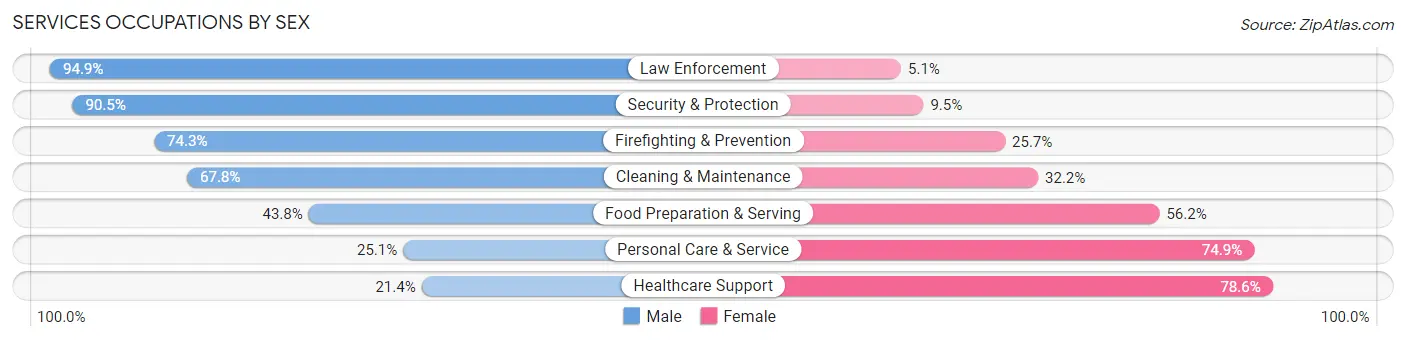
| Occupation | Male | Female |
| Healthcare Support | 112 (21.4%) | 411 (78.6%) |
| Security & Protection | 1,116 (90.5%) | 117 (9.5%) |
| Firefighting & Prevention | 197 (74.3%) | 68 (25.7%) |
| Law Enforcement | 919 (94.9%) | 49 (5.1%) |
| Food Preparation & Serving | 516 (43.8%) | 663 (56.2%) |
| Cleaning & Maintenance | 453 (67.8%) | 215 (32.2%) |
| Personal Care & Service | 111 (25.1%) | 332 (74.9%) |
| Total (Category) | 2,308 (57.0%) | 1,738 (43.0%) |
| Total (Overall) | 8,661 (51.9%) | 8,040 (48.1%) |
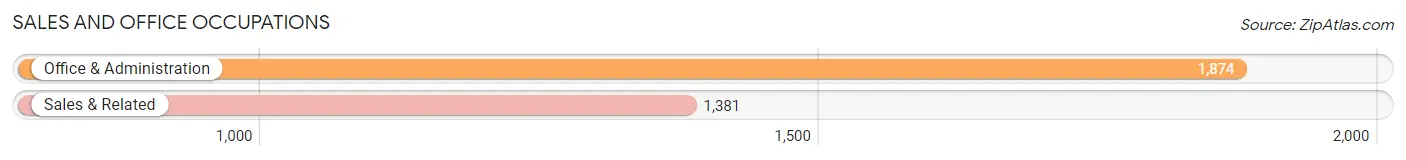
Sales and Office Occupations
The most common Sales and Office occupations in Sierra Vista are Office & Administration (1,874 | 11.2%), and Sales & Related (1,381 | 8.3%).
Sales and Office Occupations by Sex
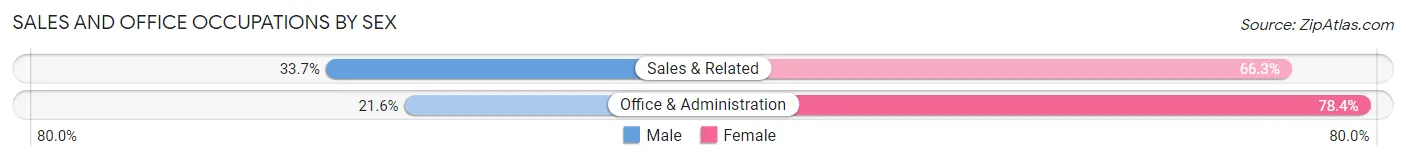
| Occupation | Male | Female |
| Sales & Related | 465 (33.7%) | 916 (66.3%) |
| Office & Administration | 404 (21.6%) | 1,470 (78.4%) |
| Total (Category) | 869 (26.7%) | 2,386 (73.3%) |
| Total (Overall) | 8,661 (51.9%) | 8,040 (48.1%) |
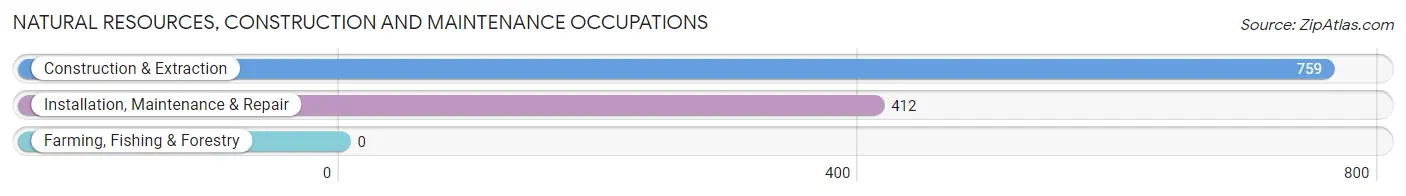
Natural Resources, Construction and Maintenance Occupations
The most common Natural Resources, Construction and Maintenance occupations in Sierra Vista are Construction & Extraction (759 | 4.5%), and Installation, Maintenance & Repair (412 | 2.5%).
Natural Resources, Construction and Maintenance Occupations by Sex
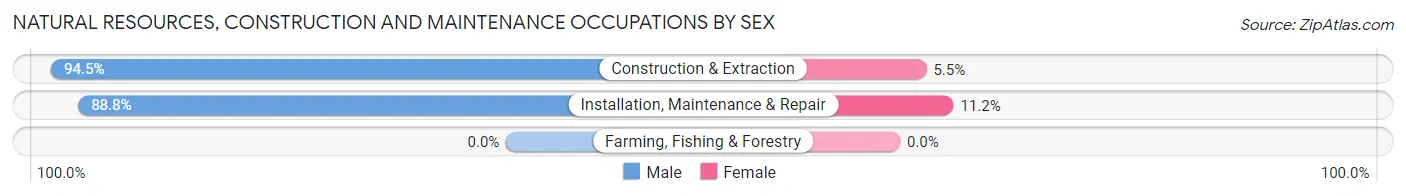
| Occupation | Male | Female |
| Farming, Fishing & Forestry | 0 (0.0%) | 0 (0.0%) |
| Construction & Extraction | 717 (94.5%) | 42 (5.5%) |
| Installation, Maintenance & Repair | 366 (88.8%) | 46 (11.2%) |
| Total (Category) | 1,083 (92.5%) | 88 (7.5%) |
| Total (Overall) | 8,661 (51.9%) | 8,040 (48.1%) |
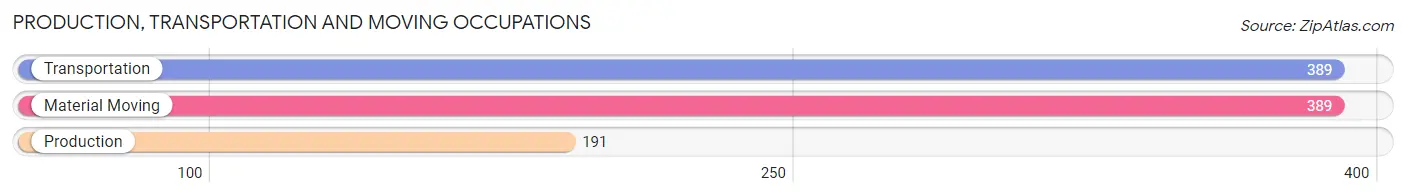
Production, Transportation and Moving Occupations
The most common Production, Transportation and Moving occupations in Sierra Vista are Transportation (389 | 2.3%), Material Moving (389 | 2.3%), and Production (191 | 1.1%).
Production, Transportation and Moving Occupations by Sex
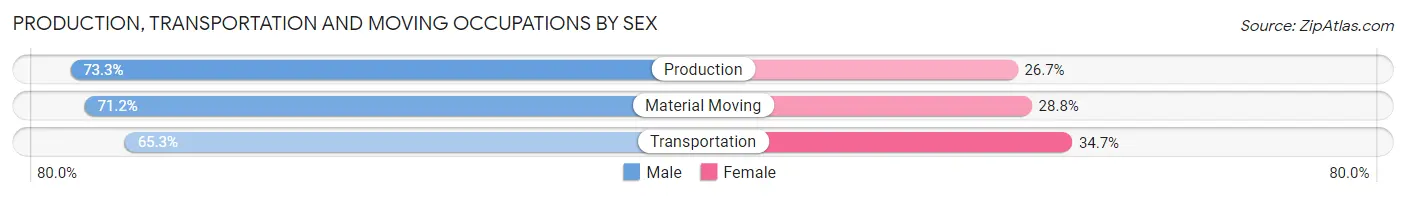
| Occupation | Male | Female |
| Production | 140 (73.3%) | 51 (26.7%) |
| Transportation | 254 (65.3%) | 135 (34.7%) |
| Material Moving | 277 (71.2%) | 112 (28.8%) |
| Total (Category) | 671 (69.3%) | 298 (30.7%) |
| Total (Overall) | 8,661 (51.9%) | 8,040 (48.1%) |
Employment Industries by Sex in Sierra Vista
Employment Industries in Sierra Vista
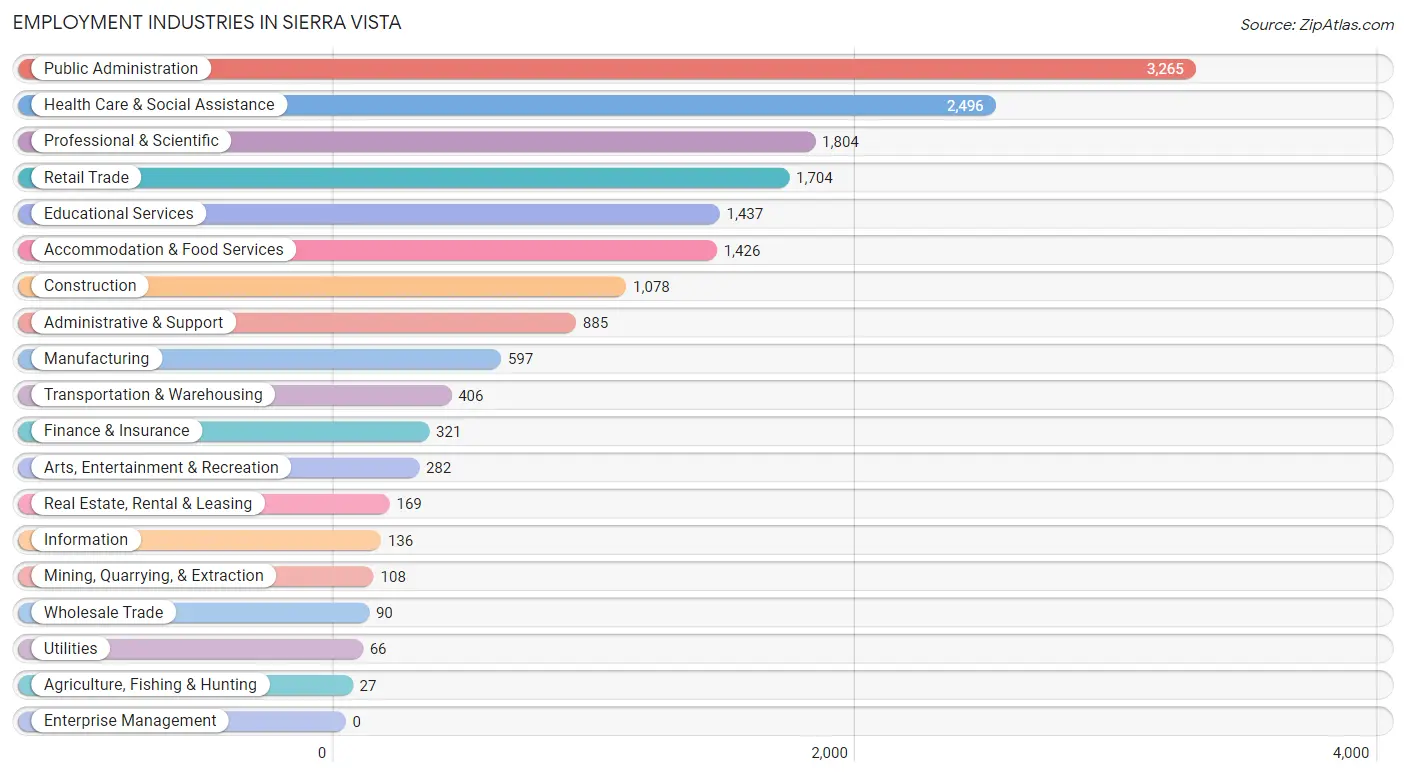
The major employment industries in Sierra Vista include Public Administration (3,265 | 19.6%), Health Care & Social Assistance (2,496 | 14.9%), Professional & Scientific (1,804 | 10.8%), Retail Trade (1,704 | 10.2%), and Educational Services (1,437 | 8.6%).
Employment Industries by Sex in Sierra Vista
The Sierra Vista industries that see more men than women are Agriculture, Fishing & Hunting (100.0%), Construction (84.1%), and Wholesale Trade (83.3%), whereas the industries that tend to have a higher number of women are Health Care & Social Assistance (75.4%), Finance & Insurance (74.8%), and Educational Services (69.3%).
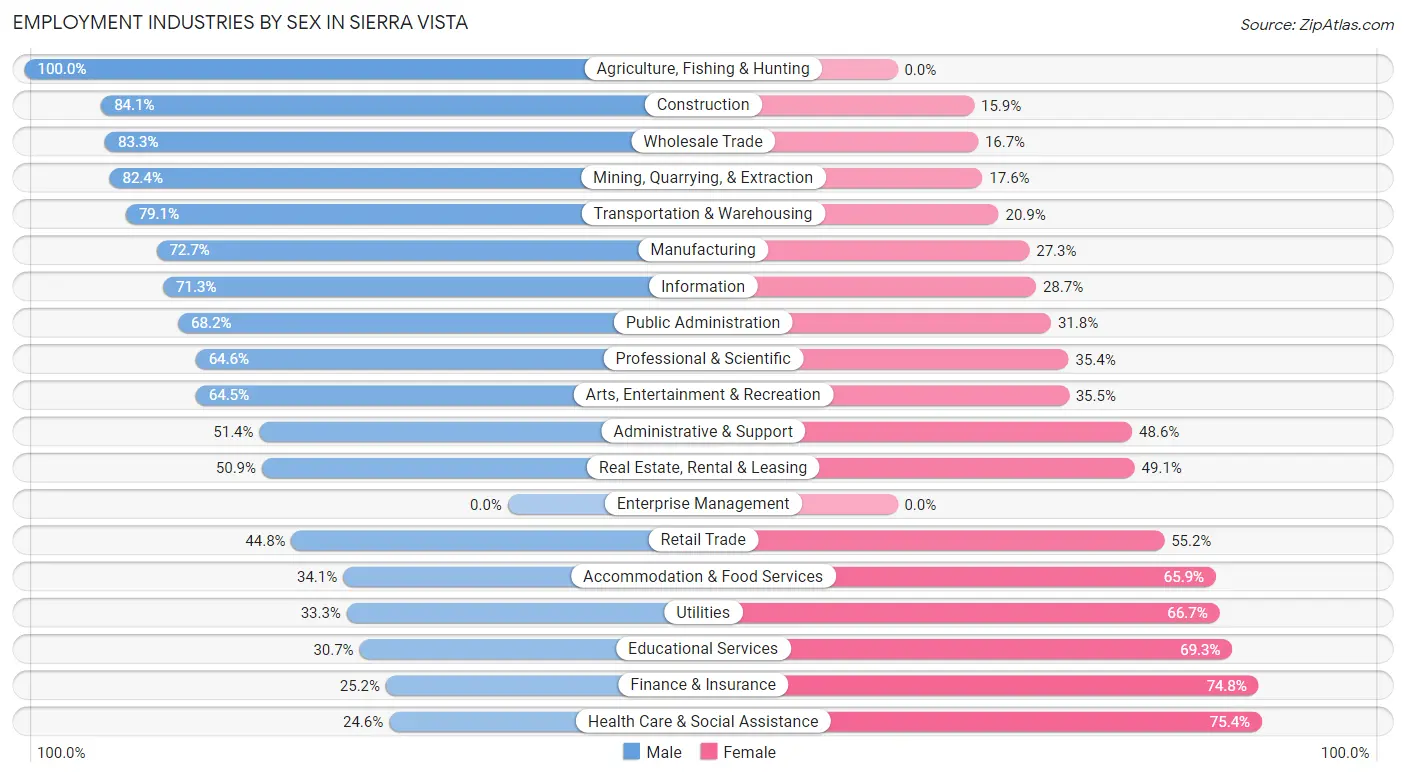
| Industry | Male | Female |
| Agriculture, Fishing & Hunting | 27 (100.0%) | 0 (0.0%) |
| Mining, Quarrying, & Extraction | 89 (82.4%) | 19 (17.6%) |
| Construction | 907 (84.1%) | 171 (15.9%) |
| Manufacturing | 434 (72.7%) | 163 (27.3%) |
| Wholesale Trade | 75 (83.3%) | 15 (16.7%) |
| Retail Trade | 763 (44.8%) | 941 (55.2%) |
| Transportation & Warehousing | 321 (79.1%) | 85 (20.9%) |
| Utilities | 22 (33.3%) | 44 (66.7%) |
| Information | 97 (71.3%) | 39 (28.7%) |
| Finance & Insurance | 81 (25.2%) | 240 (74.8%) |
| Real Estate, Rental & Leasing | 86 (50.9%) | 83 (49.1%) |
| Professional & Scientific | 1,165 (64.6%) | 639 (35.4%) |
| Enterprise Management | 0 (0.0%) | 0 (0.0%) |
| Administrative & Support | 455 (51.4%) | 430 (48.6%) |
| Educational Services | 441 (30.7%) | 996 (69.3%) |
| Health Care & Social Assistance | 613 (24.6%) | 1,883 (75.4%) |
| Arts, Entertainment & Recreation | 182 (64.5%) | 100 (35.5%) |
| Accommodation & Food Services | 486 (34.1%) | 940 (65.9%) |
| Public Administration | 2,227 (68.2%) | 1,038 (31.8%) |
| Total | 8,661 (51.9%) | 8,040 (48.1%) |
Education in Sierra Vista
School Enrollment in Sierra Vista
The most common levels of schooling among the 11,683 students in Sierra Vista are college / undergraduate (2,731 | 23.4%), middle school (2,500 | 21.4%), and elementary school (2,256 | 19.3%).
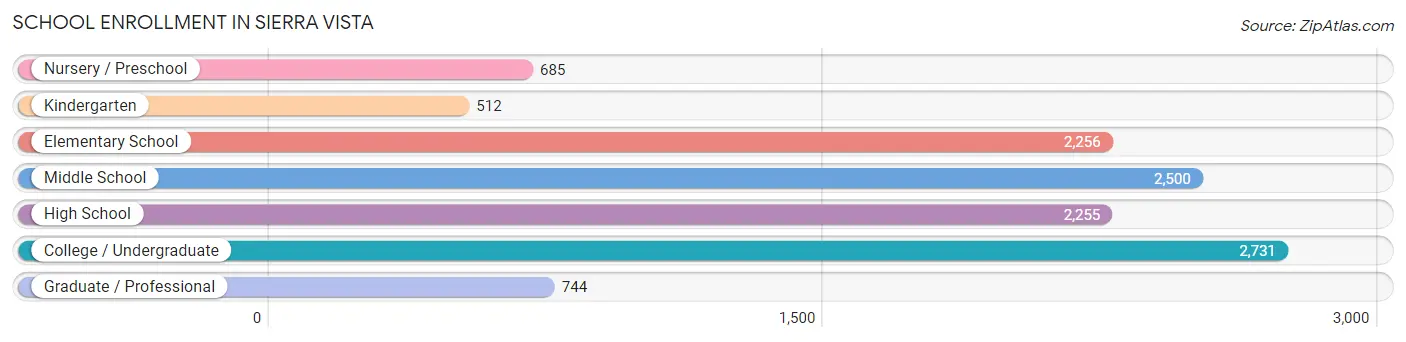
| School Level | # Students | % Students |
| Nursery / Preschool | 685 | 5.9% |
| Kindergarten | 512 | 4.4% |
| Elementary School | 2,256 | 19.3% |
| Middle School | 2,500 | 21.4% |
| High School | 2,255 | 19.3% |
| College / Undergraduate | 2,731 | 23.4% |
| Graduate / Professional | 744 | 6.4% |
| Total | 11,683 | 100.0% |
School Enrollment by Age by Funding Source in Sierra Vista
Out of a total of 11,683 students who are enrolled in schools in Sierra Vista, 1,729 (14.8%) attend a private institution, while the remaining 9,954 (85.2%) are enrolled in public schools. The age group of 3 to 4 year olds has the highest likelihood of being enrolled in private schools, with 187 (34.6% in the age bracket) enrolled. Conversely, the age group of 18 to 19 year olds has the lowest likelihood of being enrolled in a private school, with 780 (95.7% in the age bracket) attending a public institution.
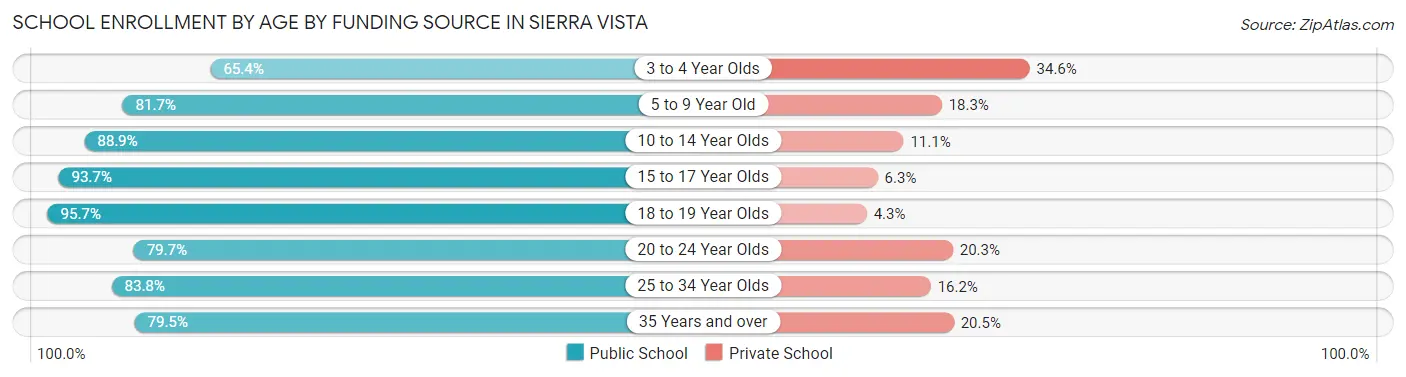
| Age Bracket | Public School | Private School |
| 3 to 4 Year Olds | 353 (65.4%) | 187 (34.6%) |
| 5 to 9 Year Old | 2,118 (81.7%) | 473 (18.3%) |
| 10 to 14 Year Olds | 2,721 (88.9%) | 341 (11.1%) |
| 15 to 17 Year Olds | 1,392 (93.7%) | 94 (6.3%) |
| 18 to 19 Year Olds | 780 (95.7%) | 35 (4.3%) |
| 20 to 24 Year Olds | 533 (79.7%) | 136 (20.3%) |
| 25 to 34 Year Olds | 1,106 (83.8%) | 214 (16.2%) |
| 35 Years and over | 954 (79.5%) | 246 (20.5%) |
| Total | 9,954 (85.2%) | 1,729 (14.8%) |
Educational Attainment by Field of Study in Sierra Vista
Business (2,138 | 19.7%), arts & humanities (1,030 | 9.5%), science & technology (1,000 | 9.2%), education (943 | 8.7%), and liberal arts & history (776 | 7.2%) are the most common fields of study among 10,838 individuals in Sierra Vista who have obtained a bachelor's degree or higher.
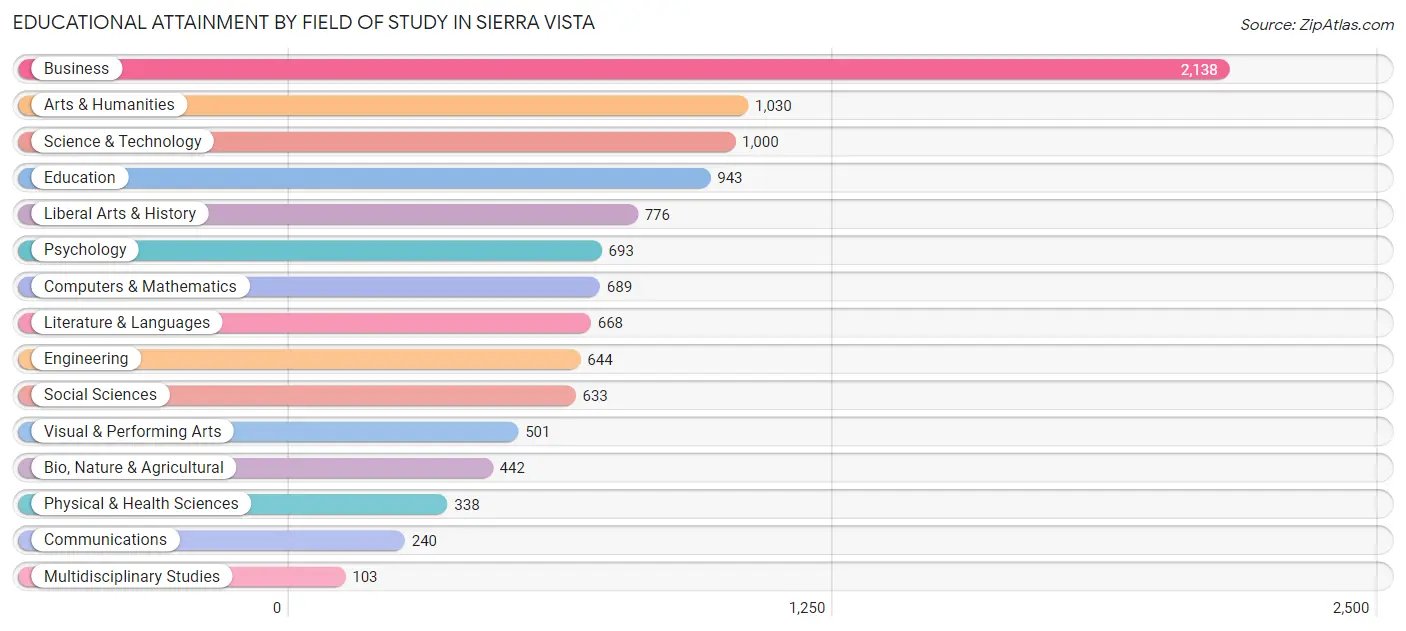
| Field of Study | # Graduates | % Graduates |
| Computers & Mathematics | 689 | 6.4% |
| Bio, Nature & Agricultural | 442 | 4.1% |
| Physical & Health Sciences | 338 | 3.1% |
| Psychology | 693 | 6.4% |
| Social Sciences | 633 | 5.8% |
| Engineering | 644 | 5.9% |
| Multidisciplinary Studies | 103 | 0.9% |
| Science & Technology | 1,000 | 9.2% |
| Business | 2,138 | 19.7% |
| Education | 943 | 8.7% |
| Literature & Languages | 668 | 6.2% |
| Liberal Arts & History | 776 | 7.2% |
| Visual & Performing Arts | 501 | 4.6% |
| Communications | 240 | 2.2% |
| Arts & Humanities | 1,030 | 9.5% |
| Total | 10,838 | 100.0% |
Transportation & Commute in Sierra Vista
Vehicle Availability by Sex in Sierra Vista
The most prevalent vehicle ownership categories in Sierra Vista are males with 2 vehicles (4,592, accounting for 45.3%) and females with 2 vehicles (3,143, making up 56.6%).
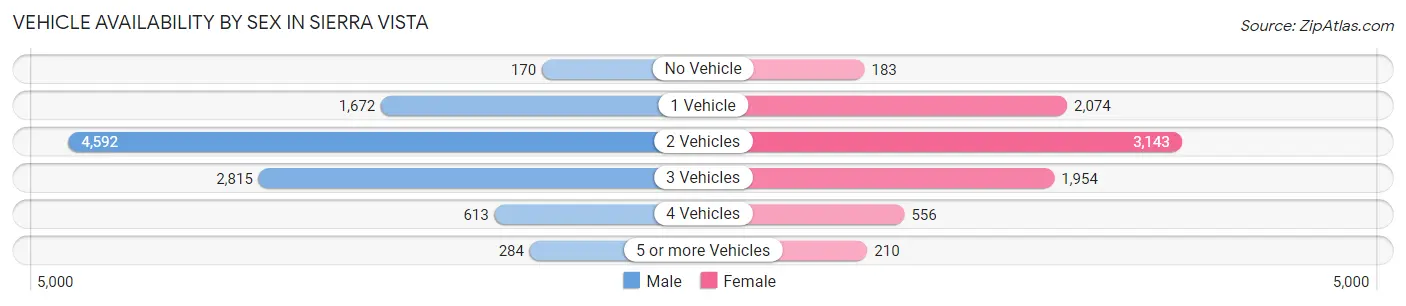
| Vehicles Available | Male | Female |
| No Vehicle | 170 (1.7%) | 183 (2.2%) |
| 1 Vehicle | 1,672 (16.5%) | 2,074 (25.5%) |
| 2 Vehicles | 4,592 (45.3%) | 3,143 (38.7%) |
| 3 Vehicles | 2,815 (27.7%) | 1,954 (24.1%) |
| 4 Vehicles | 613 (6.0%) | 556 (6.9%) |
| 5 or more Vehicles | 284 (2.8%) | 210 (2.6%) |
| Total | 10,146 (100.0%) | 8,120 (100.0%) |
Commute Time in Sierra Vista
The most frequently occuring commute durations in Sierra Vista are 10 to 14 minutes (4,614 commuters, 25.4%), 5 to 9 minutes (3,819 commuters, 21.0%), and 15 to 19 minutes (3,601 commuters, 19.8%).
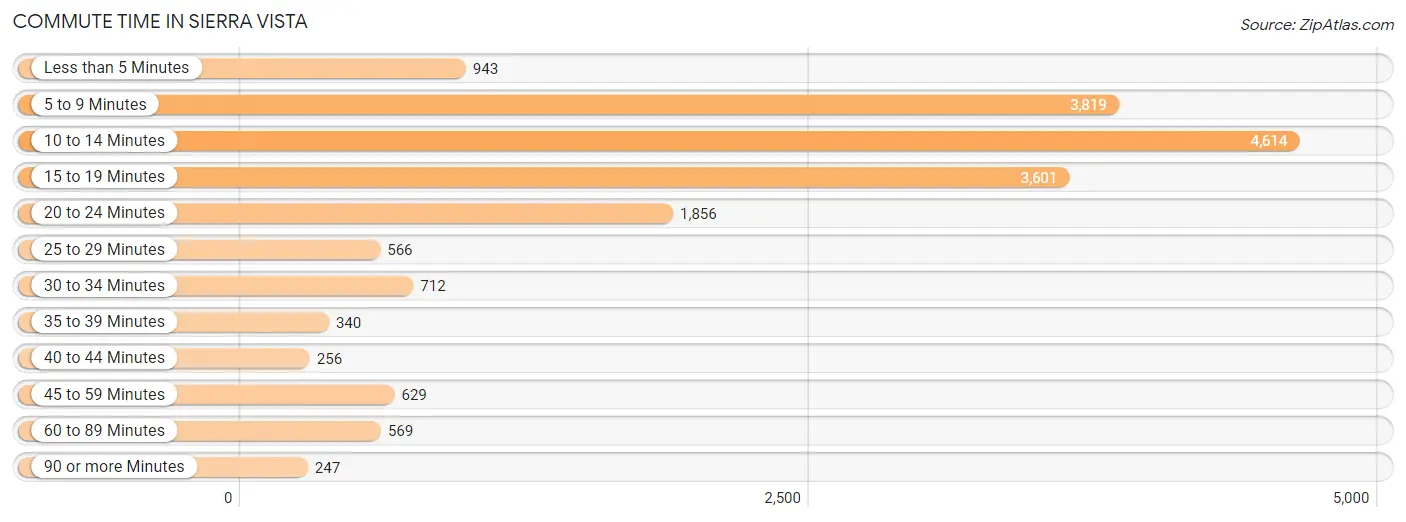
| Commute Time | # Commuters | % Commuters |
| Less than 5 Minutes | 943 | 5.2% |
| 5 to 9 Minutes | 3,819 | 21.0% |
| 10 to 14 Minutes | 4,614 | 25.4% |
| 15 to 19 Minutes | 3,601 | 19.8% |
| 20 to 24 Minutes | 1,856 | 10.2% |
| 25 to 29 Minutes | 566 | 3.1% |
| 30 to 34 Minutes | 712 | 3.9% |
| 35 to 39 Minutes | 340 | 1.9% |
| 40 to 44 Minutes | 256 | 1.4% |
| 45 to 59 Minutes | 629 | 3.5% |
| 60 to 89 Minutes | 569 | 3.1% |
| 90 or more Minutes | 247 | 1.4% |
Commute Time by Sex in Sierra Vista
The most common commute times in Sierra Vista are 10 to 14 minutes (2,256 commuters, 21.3%) for males and 10 to 14 minutes (2,358 commuters, 31.1%) for females.
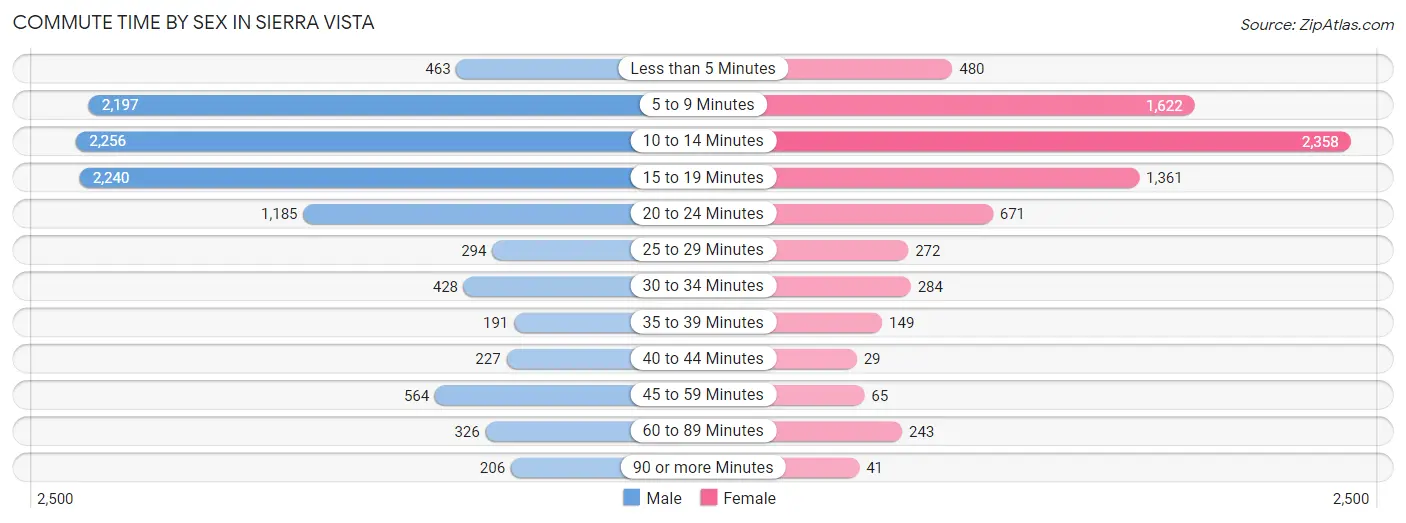
| Commute Time | Male | Female |
| Less than 5 Minutes | 463 (4.4%) | 480 (6.3%) |
| 5 to 9 Minutes | 2,197 (20.8%) | 1,622 (21.4%) |
| 10 to 14 Minutes | 2,256 (21.3%) | 2,358 (31.1%) |
| 15 to 19 Minutes | 2,240 (21.2%) | 1,361 (18.0%) |
| 20 to 24 Minutes | 1,185 (11.2%) | 671 (8.9%) |
| 25 to 29 Minutes | 294 (2.8%) | 272 (3.6%) |
| 30 to 34 Minutes | 428 (4.1%) | 284 (3.7%) |
| 35 to 39 Minutes | 191 (1.8%) | 149 (2.0%) |
| 40 to 44 Minutes | 227 (2.1%) | 29 (0.4%) |
| 45 to 59 Minutes | 564 (5.3%) | 65 (0.9%) |
| 60 to 89 Minutes | 326 (3.1%) | 243 (3.2%) |
| 90 or more Minutes | 206 (1.9%) | 41 (0.5%) |
Time of Departure to Work by Sex in Sierra Vista
The most frequent times of departure to work in Sierra Vista are 7:00 AM to 7:29 AM (1,344, 12.7%) for males and 7:30 AM to 7:59 AM (1,543, 20.4%) for females.
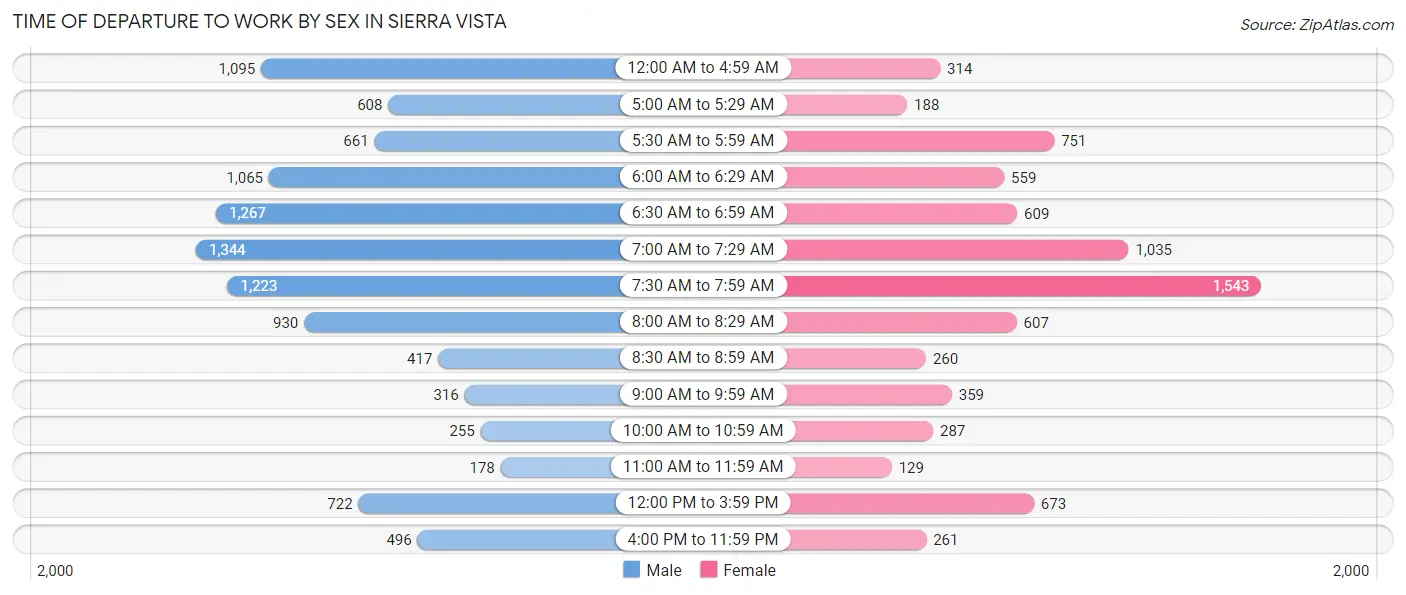
| Time of Departure | Male | Female |
| 12:00 AM to 4:59 AM | 1,095 (10.3%) | 314 (4.2%) |
| 5:00 AM to 5:29 AM | 608 (5.8%) | 188 (2.5%) |
| 5:30 AM to 5:59 AM | 661 (6.2%) | 751 (9.9%) |
| 6:00 AM to 6:29 AM | 1,065 (10.1%) | 559 (7.4%) |
| 6:30 AM to 6:59 AM | 1,267 (12.0%) | 609 (8.0%) |
| 7:00 AM to 7:29 AM | 1,344 (12.7%) | 1,035 (13.7%) |
| 7:30 AM to 7:59 AM | 1,223 (11.6%) | 1,543 (20.4%) |
| 8:00 AM to 8:29 AM | 930 (8.8%) | 607 (8.0%) |
| 8:30 AM to 8:59 AM | 417 (3.9%) | 260 (3.4%) |
| 9:00 AM to 9:59 AM | 316 (3.0%) | 359 (4.7%) |
| 10:00 AM to 10:59 AM | 255 (2.4%) | 287 (3.8%) |
| 11:00 AM to 11:59 AM | 178 (1.7%) | 129 (1.7%) |
| 12:00 PM to 3:59 PM | 722 (6.8%) | 673 (8.9%) |
| 4:00 PM to 11:59 PM | 496 (4.7%) | 261 (3.5%) |
| Total | 10,577 (100.0%) | 7,575 (100.0%) |
Housing Occupancy in Sierra Vista
Occupancy by Ownership in Sierra Vista
Of the total 18,382 dwellings in Sierra Vista, owner-occupied units account for 11,307 (61.5%), while renter-occupied units make up 7,075 (38.5%).
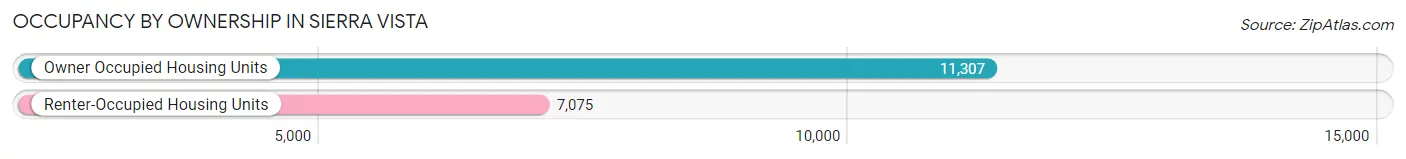
| Occupancy | # Housing Units | % Housing Units |
| Owner Occupied Housing Units | 11,307 | 61.5% |
| Renter-Occupied Housing Units | 7,075 | 38.5% |
| Total Occupied Housing Units | 18,382 | 100.0% |
Occupancy by Household Size in Sierra Vista
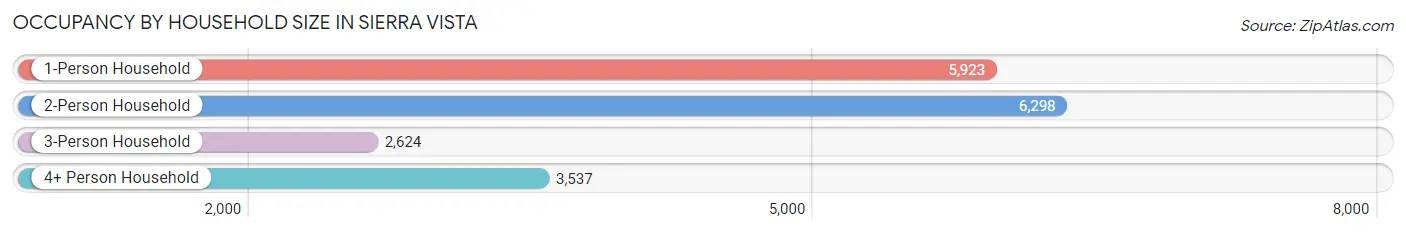
| Household Size | # Housing Units | % Housing Units |
| 1-Person Household | 5,923 | 32.2% |
| 2-Person Household | 6,298 | 34.3% |
| 3-Person Household | 2,624 | 14.3% |
| 4+ Person Household | 3,537 | 19.2% |
| Total Housing Units | 18,382 | 100.0% |
Occupancy by Ownership by Household Size in Sierra Vista
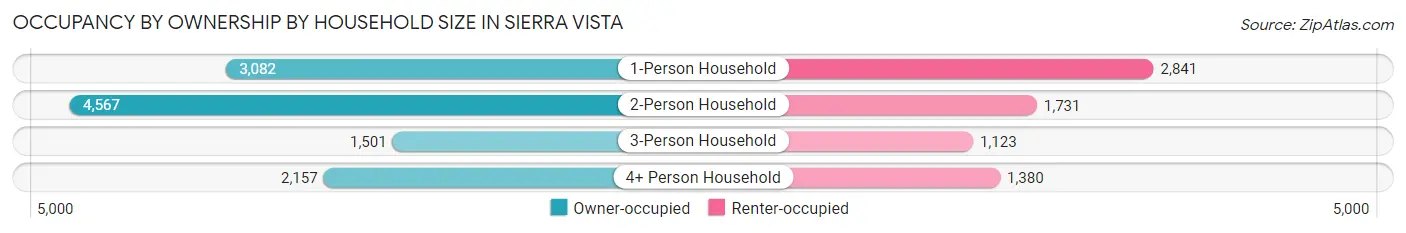
| Household Size | Owner-occupied | Renter-occupied |
| 1-Person Household | 3,082 (52.0%) | 2,841 (48.0%) |
| 2-Person Household | 4,567 (72.5%) | 1,731 (27.5%) |
| 3-Person Household | 1,501 (57.2%) | 1,123 (42.8%) |
| 4+ Person Household | 2,157 (61.0%) | 1,380 (39.0%) |
| Total Housing Units | 11,307 (61.5%) | 7,075 (38.5%) |
Occupancy by Educational Attainment in Sierra Vista
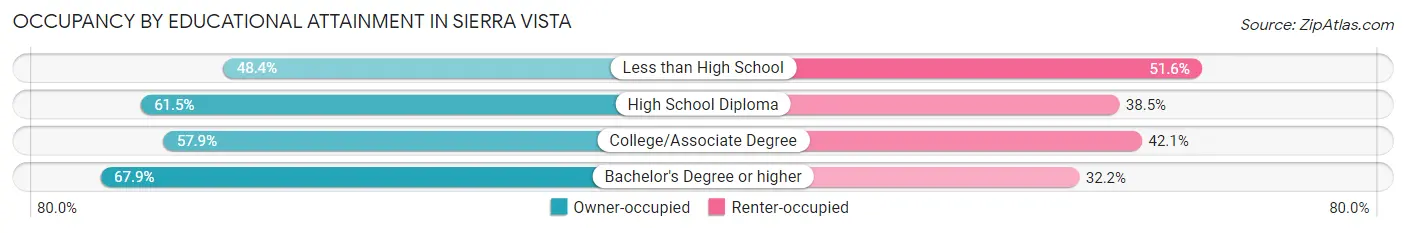
| Household Size | Owner-occupied | Renter-occupied |
| Less than High School | 467 (48.4%) | 498 (51.6%) |
| High School Diploma | 1,960 (61.5%) | 1,227 (38.5%) |
| College/Associate Degree | 4,512 (57.9%) | 3,280 (42.1%) |
| Bachelor's Degree or higher | 4,368 (67.8%) | 2,070 (32.2%) |
Occupancy by Age of Householder in Sierra Vista
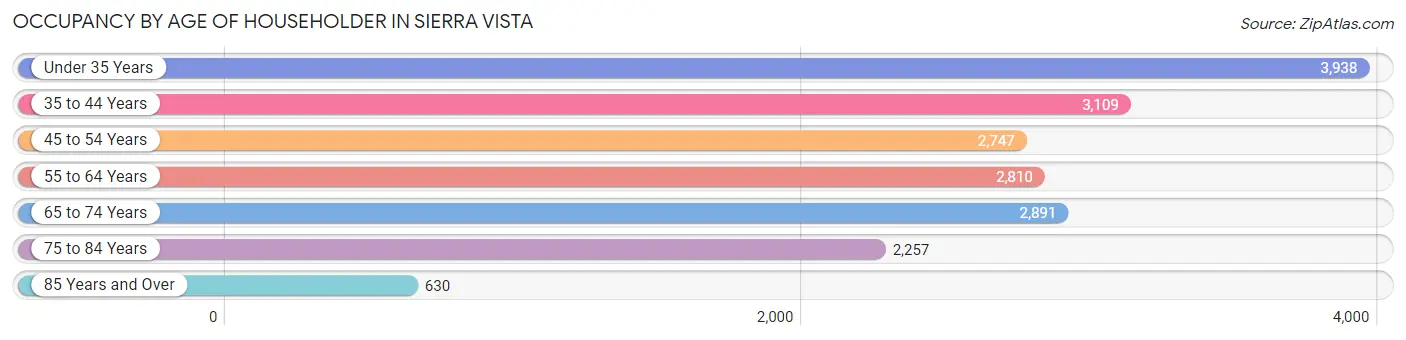
| Age Bracket | # Households | % Households |
| Under 35 Years | 3,938 | 21.4% |
| 35 to 44 Years | 3,109 | 16.9% |
| 45 to 54 Years | 2,747 | 14.9% |
| 55 to 64 Years | 2,810 | 15.3% |
| 65 to 74 Years | 2,891 | 15.7% |
| 75 to 84 Years | 2,257 | 12.3% |
| 85 Years and Over | 630 | 3.4% |
| Total | 18,382 | 100.0% |
Housing Finances in Sierra Vista
Median Income by Occupancy in Sierra Vista
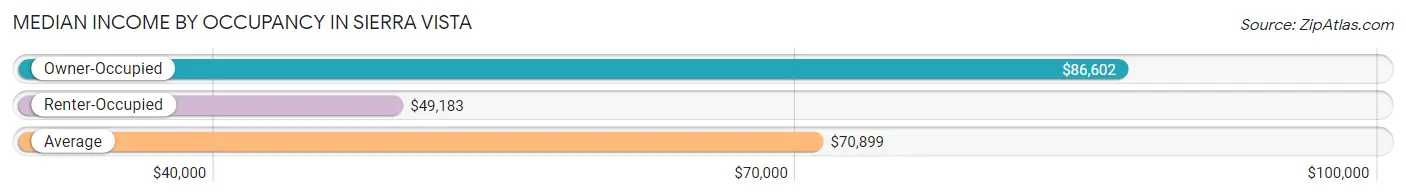
| Occupancy Type | # Households | Median Income |
| Owner-Occupied | 11,307 (61.5%) | $86,602 |
| Renter-Occupied | 7,075 (38.5%) | $49,183 |
| Average | 18,382 (100.0%) | $70,899 |
Occupancy by Householder Income Bracket in Sierra Vista
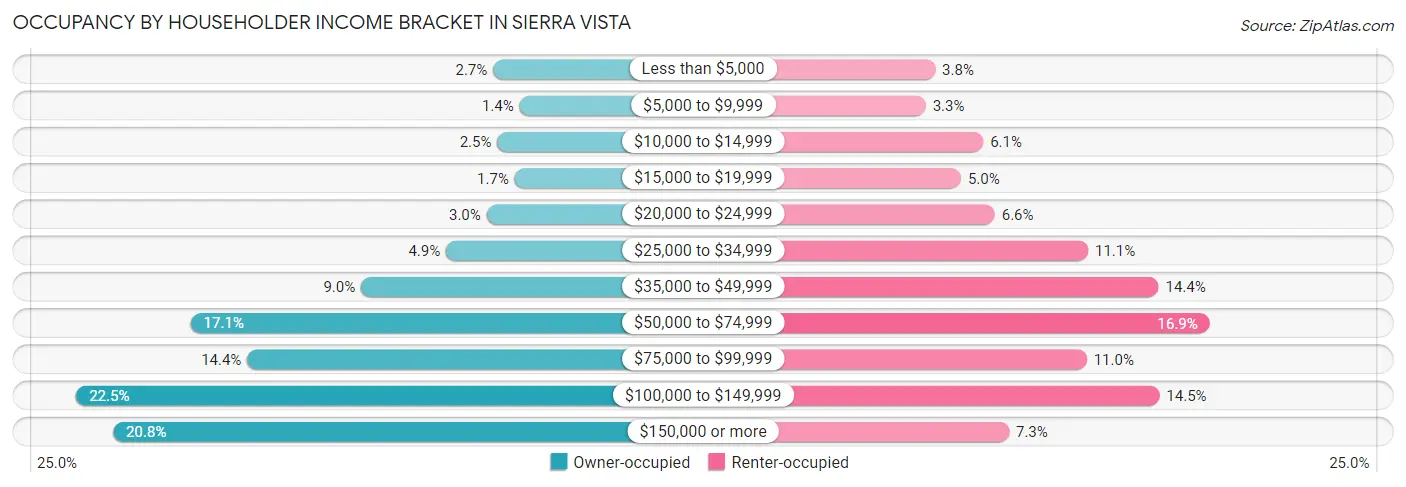
| Income Bracket | Owner-occupied | Renter-occupied |
| Less than $5,000 | 304 (2.7%) | 268 (3.8%) |
| $5,000 to $9,999 | 162 (1.4%) | 236 (3.3%) |
| $10,000 to $14,999 | 281 (2.5%) | 430 (6.1%) |
| $15,000 to $19,999 | 188 (1.7%) | 355 (5.0%) |
| $20,000 to $24,999 | 339 (3.0%) | 469 (6.6%) |
| $25,000 to $34,999 | 558 (4.9%) | 783 (11.1%) |
| $35,000 to $49,999 | 1,015 (9.0%) | 1,021 (14.4%) |
| $50,000 to $74,999 | 1,932 (17.1%) | 1,193 (16.9%) |
| $75,000 to $99,999 | 1,628 (14.4%) | 779 (11.0%) |
| $100,000 to $149,999 | 2,549 (22.5%) | 1,024 (14.5%) |
| $150,000 or more | 2,351 (20.8%) | 517 (7.3%) |
| Total | 11,307 (100.0%) | 7,075 (100.0%) |
Monthly Housing Cost Tiers in Sierra Vista
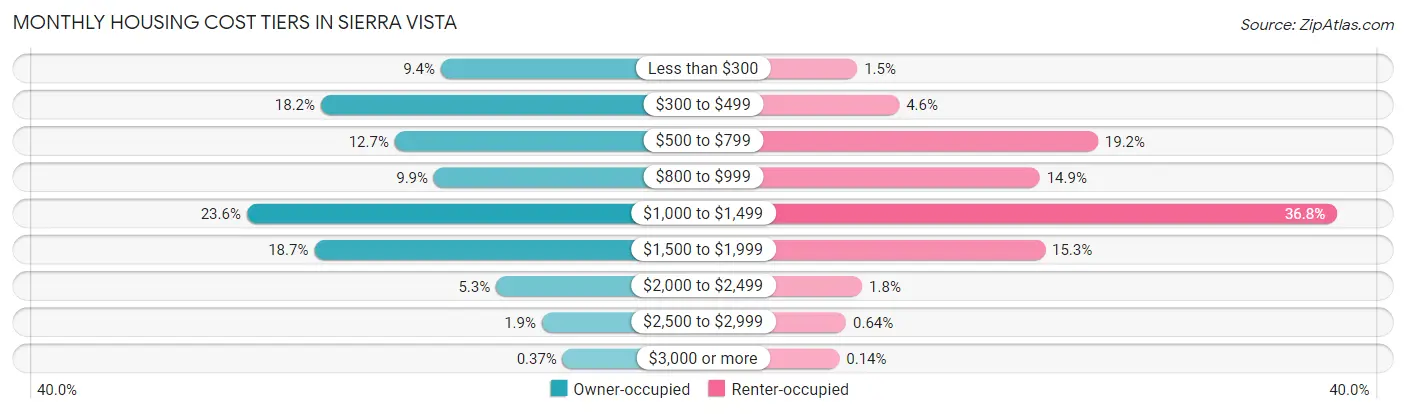
| Monthly Cost | Owner-occupied | Renter-occupied |
| Less than $300 | 1,057 (9.3%) | 103 (1.5%) |
| $300 to $499 | 2,056 (18.2%) | 322 (4.5%) |
| $500 to $799 | 1,440 (12.7%) | 1,357 (19.2%) |
| $800 to $999 | 1,115 (9.9%) | 1,054 (14.9%) |
| $1,000 to $1,499 | 2,673 (23.6%) | 2,603 (36.8%) |
| $1,500 to $1,999 | 2,111 (18.7%) | 1,082 (15.3%) |
| $2,000 to $2,499 | 597 (5.3%) | 129 (1.8%) |
| $2,500 to $2,999 | 216 (1.9%) | 45 (0.6%) |
| $3,000 or more | 42 (0.4%) | 10 (0.1%) |
| Total | 11,307 (100.0%) | 7,075 (100.0%) |
Physical Housing Characteristics in Sierra Vista
Housing Structures in Sierra Vista
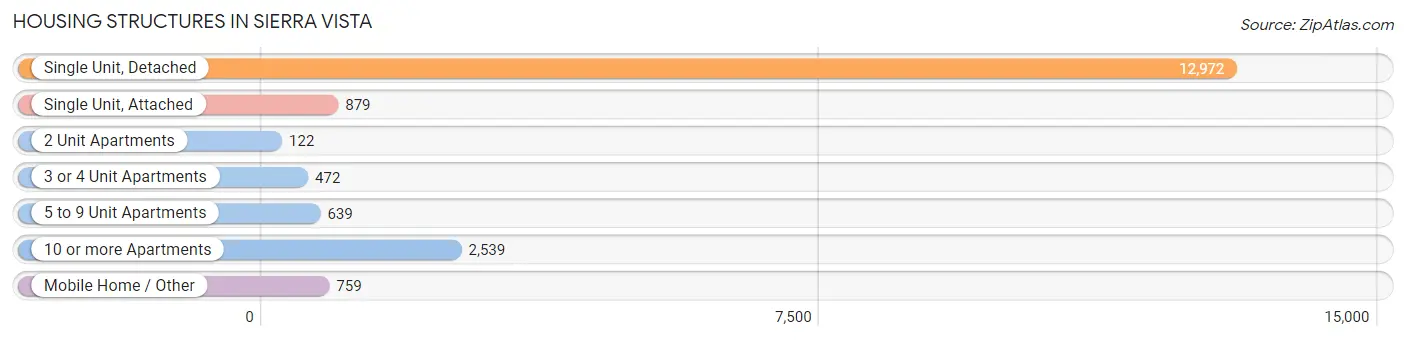
| Structure Type | # Housing Units | % Housing Units |
| Single Unit, Detached | 12,972 | 70.6% |
| Single Unit, Attached | 879 | 4.8% |
| 2 Unit Apartments | 122 | 0.7% |
| 3 or 4 Unit Apartments | 472 | 2.6% |
| 5 to 9 Unit Apartments | 639 | 3.5% |
| 10 or more Apartments | 2,539 | 13.8% |
| Mobile Home / Other | 759 | 4.1% |
| Total | 18,382 | 100.0% |
Housing Structures by Occupancy in Sierra Vista
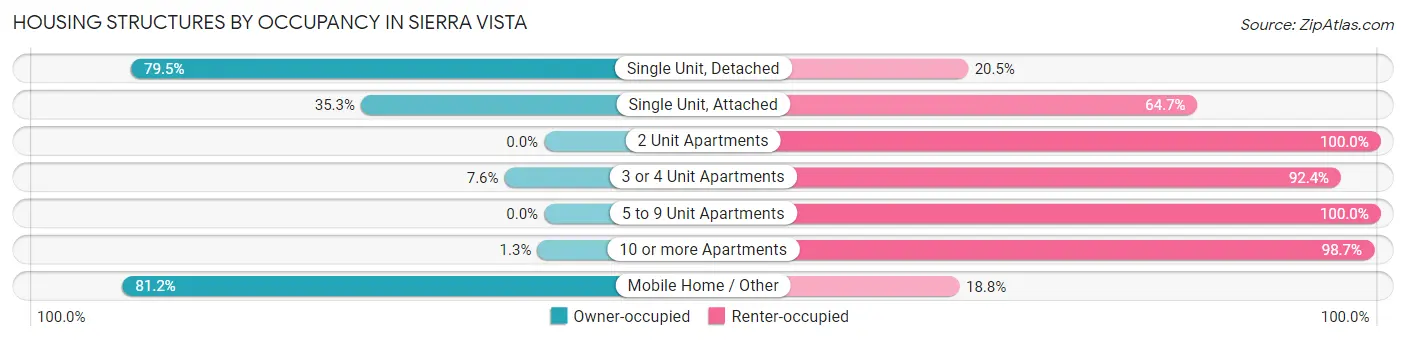
| Structure Type | Owner-occupied | Renter-occupied |
| Single Unit, Detached | 10,312 (79.5%) | 2,660 (20.5%) |
| Single Unit, Attached | 310 (35.3%) | 569 (64.7%) |
| 2 Unit Apartments | 0 (0.0%) | 122 (100.0%) |
| 3 or 4 Unit Apartments | 36 (7.6%) | 436 (92.4%) |
| 5 to 9 Unit Apartments | 0 (0.0%) | 639 (100.0%) |
| 10 or more Apartments | 33 (1.3%) | 2,506 (98.7%) |
| Mobile Home / Other | 616 (81.2%) | 143 (18.8%) |
| Total | 11,307 (61.5%) | 7,075 (38.5%) |
Housing Structures by Number of Rooms in Sierra Vista
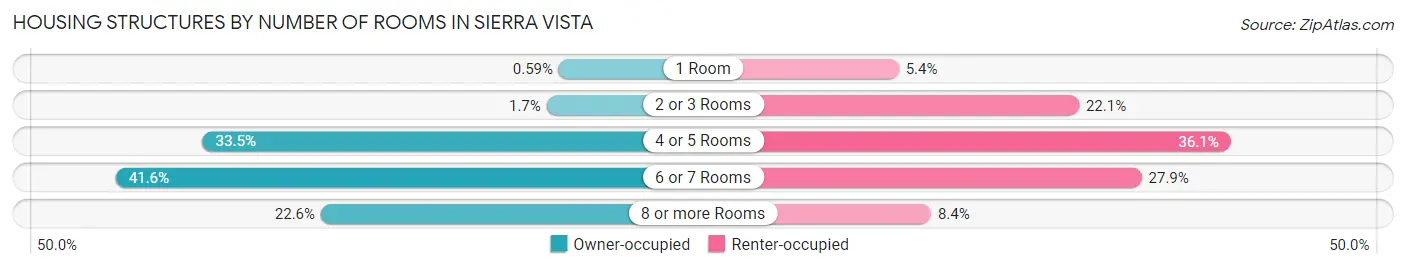
| Number of Rooms | Owner-occupied | Renter-occupied |
| 1 Room | 67 (0.6%) | 385 (5.4%) |
| 2 or 3 Rooms | 195 (1.7%) | 1,564 (22.1%) |
| 4 or 5 Rooms | 3,791 (33.5%) | 2,556 (36.1%) |
| 6 or 7 Rooms | 4,699 (41.6%) | 1,974 (27.9%) |
| 8 or more Rooms | 2,555 (22.6%) | 596 (8.4%) |
| Total | 11,307 (100.0%) | 7,075 (100.0%) |
Housing Structure by Heating Type in Sierra Vista
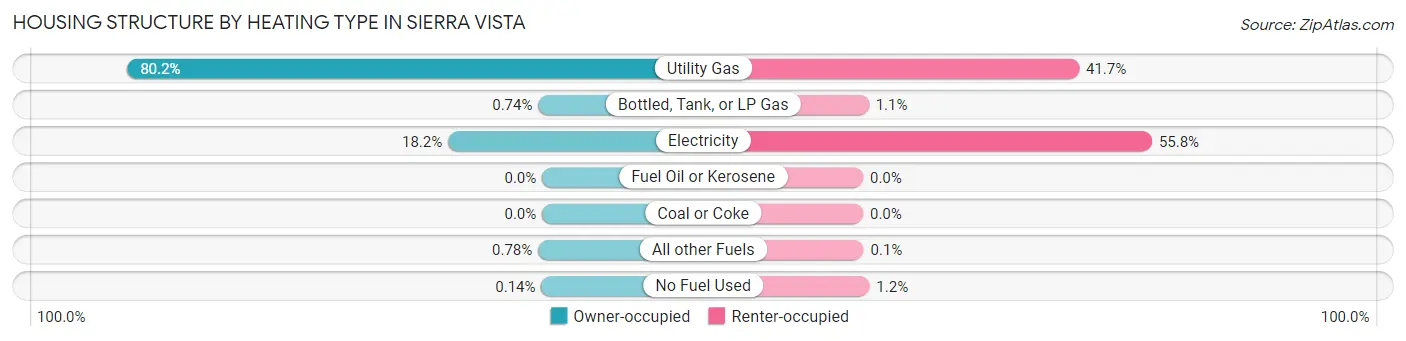
| Heating Type | Owner-occupied | Renter-occupied |
| Utility Gas | 9,065 (80.2%) | 2,953 (41.7%) |
| Bottled, Tank, or LP Gas | 84 (0.7%) | 78 (1.1%) |
| Electricity | 2,054 (18.2%) | 3,950 (55.8%) |
| Fuel Oil or Kerosene | 0 (0.0%) | 0 (0.0%) |
| Coal or Coke | 0 (0.0%) | 0 (0.0%) |
| All other Fuels | 88 (0.8%) | 7 (0.1%) |
| No Fuel Used | 16 (0.1%) | 87 (1.2%) |
| Total | 11,307 (100.0%) | 7,075 (100.0%) |
Household Vehicle Usage in Sierra Vista
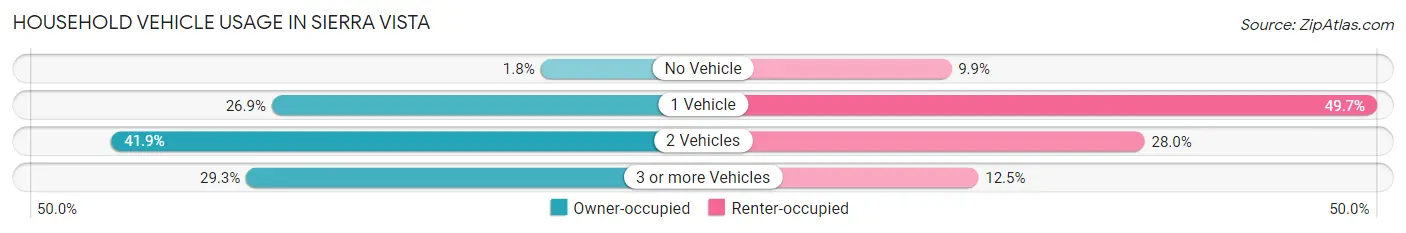
| Vehicles per Household | Owner-occupied | Renter-occupied |
| No Vehicle | 208 (1.8%) | 702 (9.9%) |
| 1 Vehicle | 3,045 (26.9%) | 3,513 (49.6%) |
| 2 Vehicles | 4,738 (41.9%) | 1,979 (28.0%) |
| 3 or more Vehicles | 3,316 (29.3%) | 881 (12.4%) |
| Total | 11,307 (100.0%) | 7,075 (100.0%) |
Real Estate & Mortgages in Sierra Vista
Real Estate and Mortgage Overview in Sierra Vista
| Characteristic | Without Mortgage | With Mortgage |
| Housing Units | 4,339 | 6,968 |
| Median Property Value | $200,700 | $224,200 |
| Median Household Income | $61,620 | $1,735 |
| Monthly Housing Costs | $399 | $21 |
| Real Estate Taxes | $1,377 | $97 |
Property Value by Mortgage Status in Sierra Vista
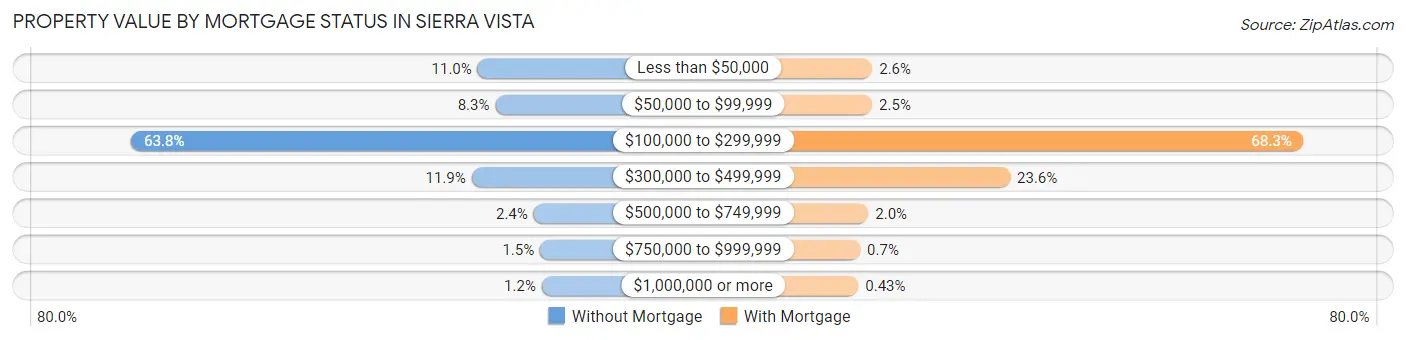
| Property Value | Without Mortgage | With Mortgage |
| Less than $50,000 | 476 (11.0%) | 178 (2.5%) |
| $50,000 to $99,999 | 359 (8.3%) | 176 (2.5%) |
| $100,000 to $299,999 | 2,767 (63.8%) | 4,758 (68.3%) |
| $300,000 to $499,999 | 516 (11.9%) | 1,641 (23.5%) |
| $500,000 to $749,999 | 106 (2.4%) | 136 (1.9%) |
| $750,000 to $999,999 | 63 (1.5%) | 49 (0.7%) |
| $1,000,000 or more | 52 (1.2%) | 30 (0.4%) |
| Total | 4,339 (100.0%) | 6,968 (100.0%) |
Household Income by Mortgage Status in Sierra Vista
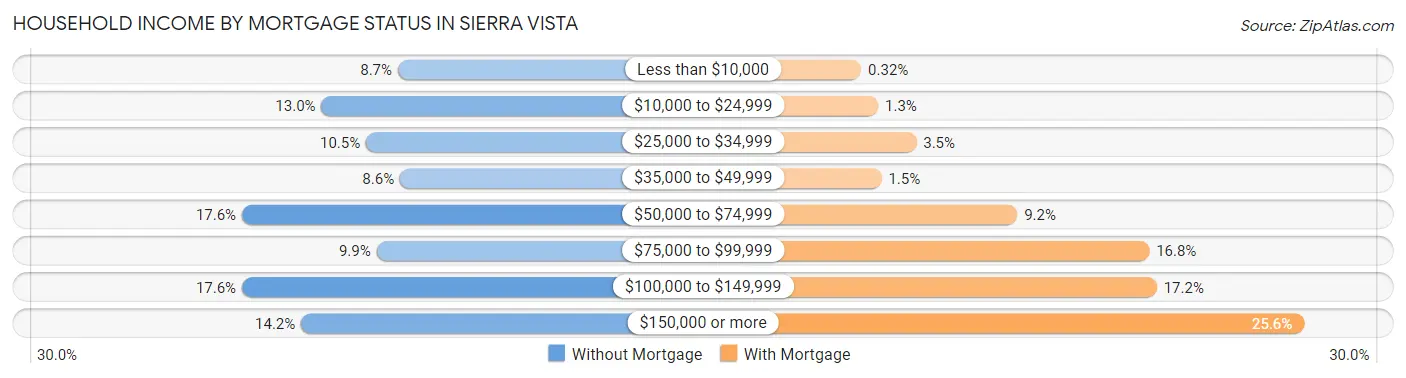
| Household Income | Without Mortgage | With Mortgage |
| Less than $10,000 | 376 (8.7%) | 22 (0.3%) |
| $10,000 to $24,999 | 566 (13.0%) | 90 (1.3%) |
| $25,000 to $34,999 | 455 (10.5%) | 242 (3.5%) |
| $35,000 to $49,999 | 371 (8.6%) | 103 (1.5%) |
| $50,000 to $74,999 | 763 (17.6%) | 644 (9.2%) |
| $75,000 to $99,999 | 429 (9.9%) | 1,169 (16.8%) |
| $100,000 to $149,999 | 763 (17.6%) | 1,199 (17.2%) |
| $150,000 or more | 616 (14.2%) | 1,786 (25.6%) |
| Total | 4,339 (100.0%) | 6,968 (100.0%) |
Property Value to Household Income Ratio in Sierra Vista
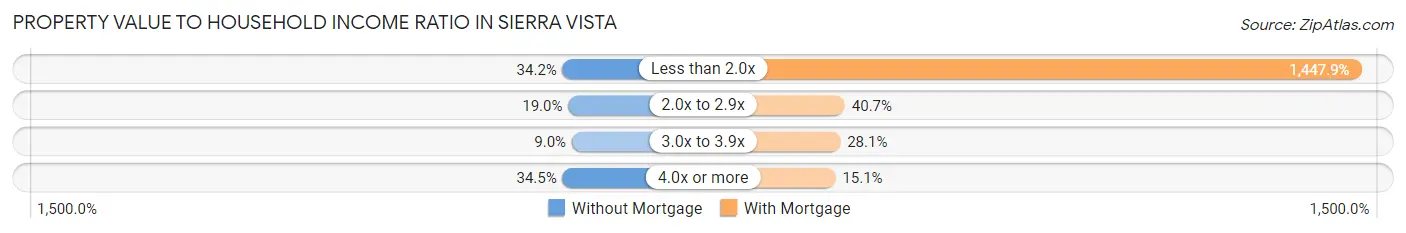
| Value-to-Income Ratio | Without Mortgage | With Mortgage |
| Less than 2.0x | 1,483 (34.2%) | 100,889 (1,447.9%) |
| 2.0x to 2.9x | 824 (19.0%) | 2,835 (40.7%) |
| 3.0x to 3.9x | 390 (9.0%) | 1,960 (28.1%) |
| 4.0x or more | 1,495 (34.4%) | 1,050 (15.1%) |
| Total | 4,339 (100.0%) | 6,968 (100.0%) |
Real Estate Taxes by Mortgage Status in Sierra Vista
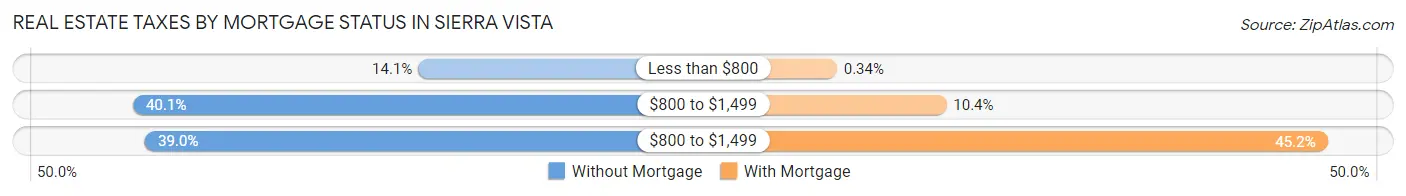
| Property Taxes | Without Mortgage | With Mortgage |
| Less than $800 | 610 (14.1%) | 24 (0.3%) |
| $800 to $1,499 | 1,740 (40.1%) | 721 (10.3%) |
| $800 to $1,499 | 1,692 (39.0%) | 3,146 (45.2%) |
| Total | 4,339 (100.0%) | 6,968 (100.0%) |
Health & Disability in Sierra Vista
Health Insurance Coverage by Age in Sierra Vista
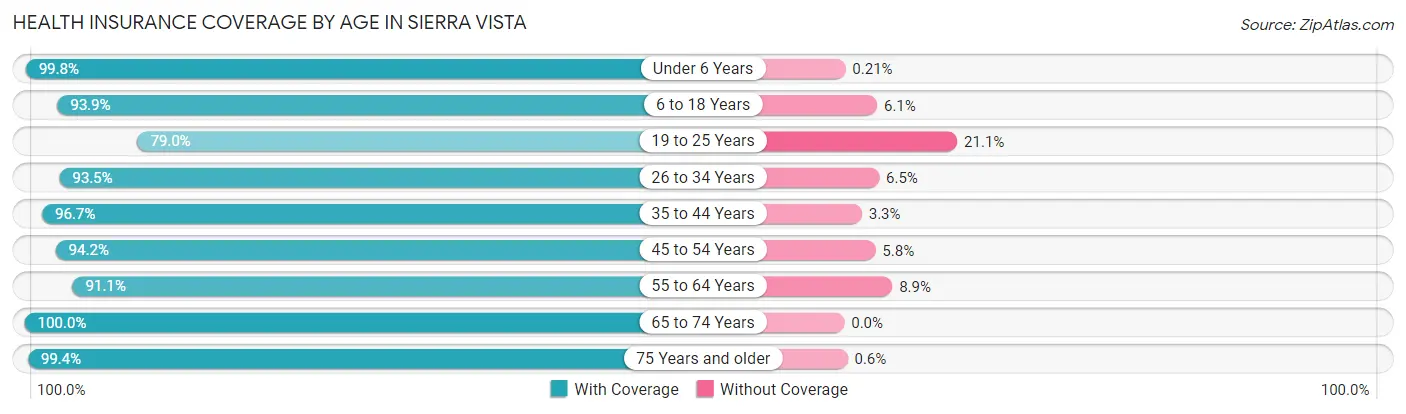
| Age Bracket | With Coverage | Without Coverage |
| Under 6 Years | 3,390 (99.8%) | 7 (0.2%) |
| 6 to 18 Years | 6,873 (93.9%) | 447 (6.1%) |
| 19 to 25 Years | 2,397 (78.9%) | 639 (21.0%) |
| 26 to 34 Years | 4,280 (93.5%) | 297 (6.5%) |
| 35 to 44 Years | 4,986 (96.7%) | 168 (3.3%) |
| 45 to 54 Years | 4,111 (94.2%) | 253 (5.8%) |
| 55 to 64 Years | 4,339 (91.1%) | 426 (8.9%) |
| 65 to 74 Years | 4,664 (100.0%) | 0 (0.0%) |
| 75 Years and older | 3,990 (99.4%) | 24 (0.6%) |
| Total | 39,030 (94.5%) | 2,261 (5.5%) |
Health Insurance Coverage by Citizenship Status in Sierra Vista
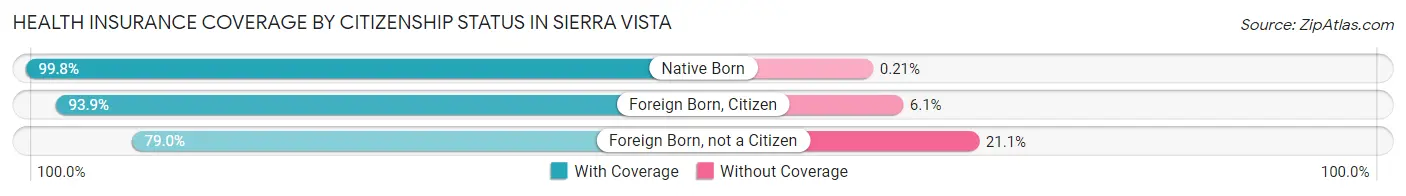
| Citizenship Status | With Coverage | Without Coverage |
| Native Born | 3,390 (99.8%) | 7 (0.2%) |
| Foreign Born, Citizen | 6,873 (93.9%) | 447 (6.1%) |
| Foreign Born, not a Citizen | 2,397 (78.9%) | 639 (21.0%) |
Health Insurance Coverage by Household Income in Sierra Vista
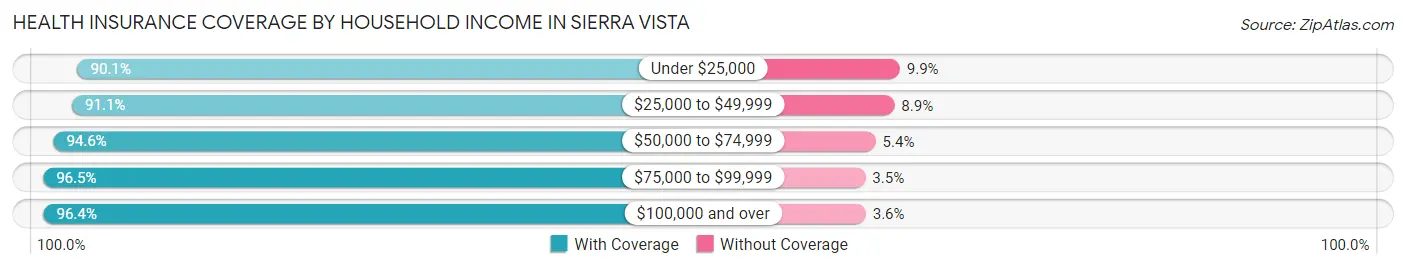
| Household Income | With Coverage | Without Coverage |
| Under $25,000 | 4,313 (90.1%) | 476 (9.9%) |
| $25,000 to $49,999 | 6,139 (91.1%) | 601 (8.9%) |
| $50,000 to $74,999 | 6,400 (94.6%) | 366 (5.4%) |
| $75,000 to $99,999 | 5,730 (96.5%) | 207 (3.5%) |
| $100,000 and over | 16,350 (96.4%) | 603 (3.6%) |
Public vs Private Health Insurance Coverage by Age in Sierra Vista
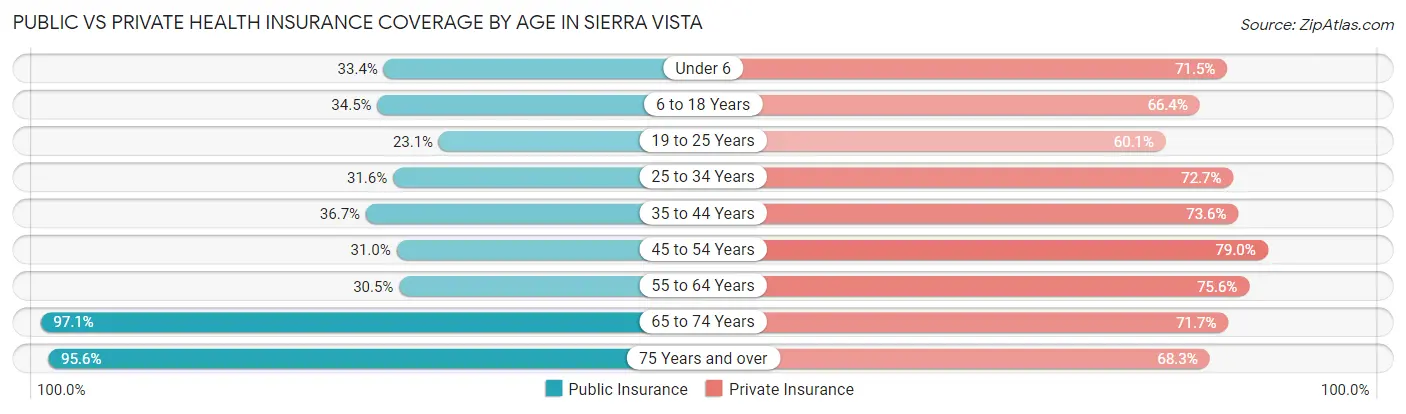
| Age Bracket | Public Insurance | Private Insurance |
| Under 6 | 1,133 (33.4%) | 2,430 (71.5%) |
| 6 to 18 Years | 2,526 (34.5%) | 4,863 (66.4%) |
| 19 to 25 Years | 701 (23.1%) | 1,826 (60.1%) |
| 25 to 34 Years | 1,447 (31.6%) | 3,326 (72.7%) |
| 35 to 44 Years | 1,889 (36.6%) | 3,793 (73.6%) |
| 45 to 54 Years | 1,351 (31.0%) | 3,449 (79.0%) |
| 55 to 64 Years | 1,452 (30.5%) | 3,603 (75.6%) |
| 65 to 74 Years | 4,527 (97.1%) | 3,345 (71.7%) |
| 75 Years and over | 3,839 (95.6%) | 2,740 (68.3%) |
| Total | 18,865 (45.7%) | 29,375 (71.1%) |
Disability Status by Sex by Age in Sierra Vista
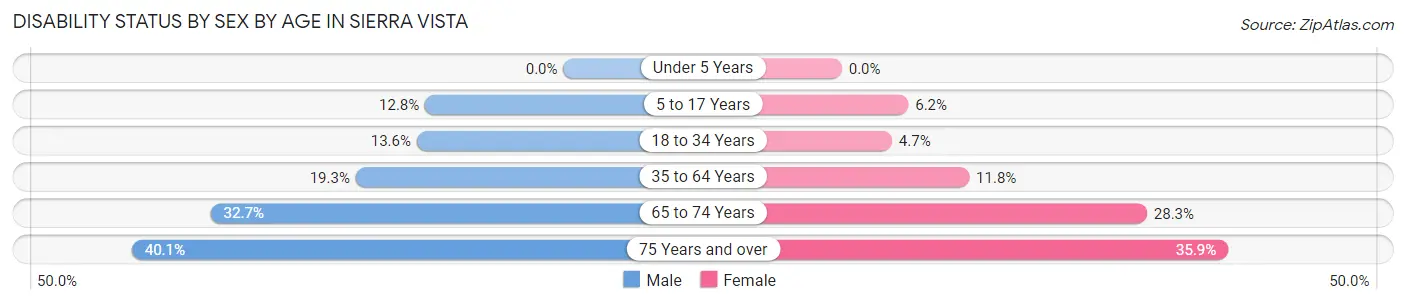
| Age Bracket | Male | Female |
| Under 5 Years | 0 (0.0%) | 0 (0.0%) |
| 5 to 17 Years | 483 (12.8%) | 224 (6.2%) |
| 18 to 34 Years | 551 (13.6%) | 195 (4.6%) |
| 35 to 64 Years | 1,332 (19.3%) | 871 (11.8%) |
| 65 to 74 Years | 618 (32.7%) | 786 (28.3%) |
| 75 Years and over | 620 (40.1%) | 884 (35.8%) |
Disability Class by Sex by Age in Sierra Vista
Disability Class: Hearing Difficulty
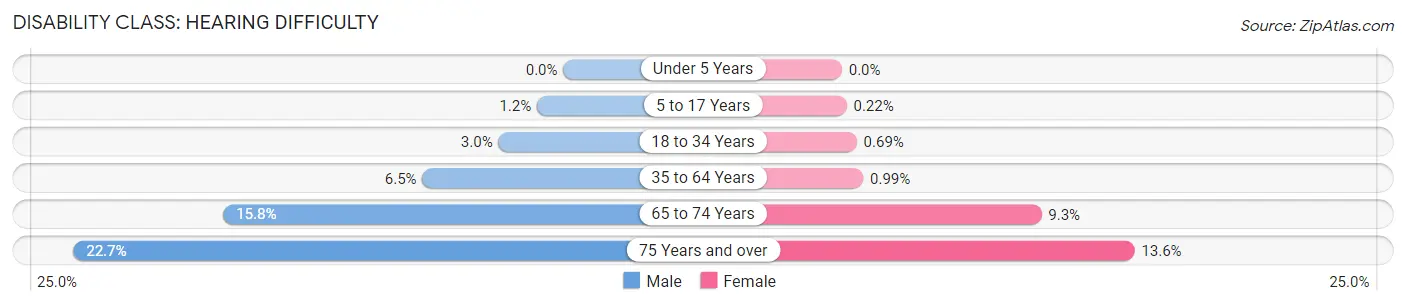
| Age Bracket | Male | Female |
| Under 5 Years | 0 (0.0%) | 0 (0.0%) |
| 5 to 17 Years | 46 (1.2%) | 8 (0.2%) |
| 18 to 34 Years | 122 (3.0%) | 29 (0.7%) |
| 35 to 64 Years | 452 (6.5%) | 73 (1.0%) |
| 65 to 74 Years | 298 (15.8%) | 257 (9.3%) |
| 75 Years and over | 352 (22.7%) | 335 (13.6%) |
Disability Class: Vision Difficulty
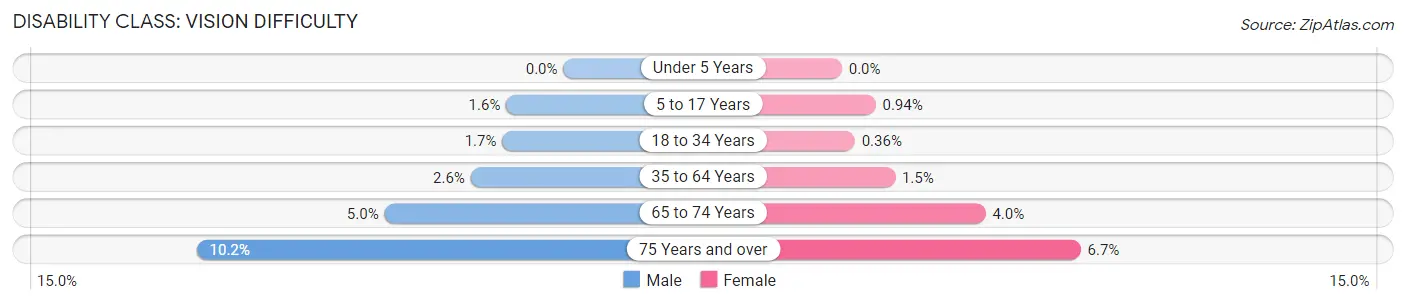
| Age Bracket | Male | Female |
| Under 5 Years | 0 (0.0%) | 0 (0.0%) |
| 5 to 17 Years | 60 (1.6%) | 34 (0.9%) |
| 18 to 34 Years | 69 (1.7%) | 15 (0.4%) |
| 35 to 64 Years | 178 (2.6%) | 109 (1.5%) |
| 65 to 74 Years | 94 (5.0%) | 111 (4.0%) |
| 75 Years and over | 158 (10.2%) | 164 (6.7%) |
Disability Class: Cognitive Difficulty
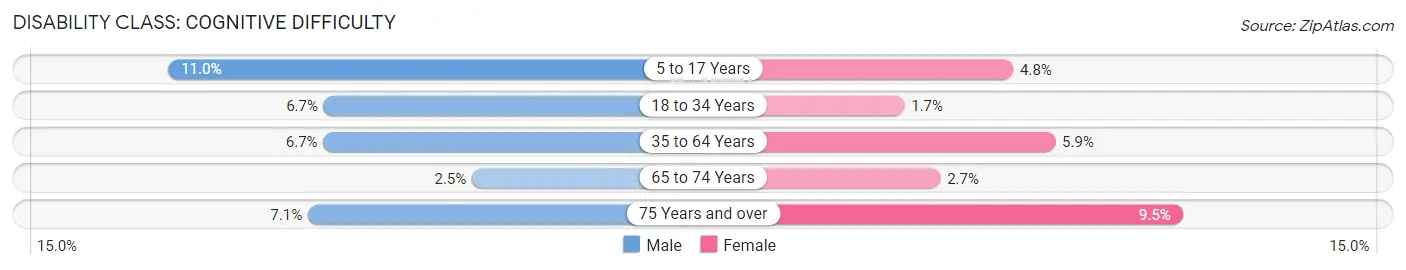
| Age Bracket | Male | Female |
| 5 to 17 Years | 414 (11.0%) | 173 (4.8%) |
| 18 to 34 Years | 270 (6.7%) | 73 (1.7%) |
| 35 to 64 Years | 462 (6.7%) | 438 (5.9%) |
| 65 to 74 Years | 48 (2.5%) | 76 (2.7%) |
| 75 Years and over | 110 (7.1%) | 234 (9.5%) |
Disability Class: Ambulatory Difficulty
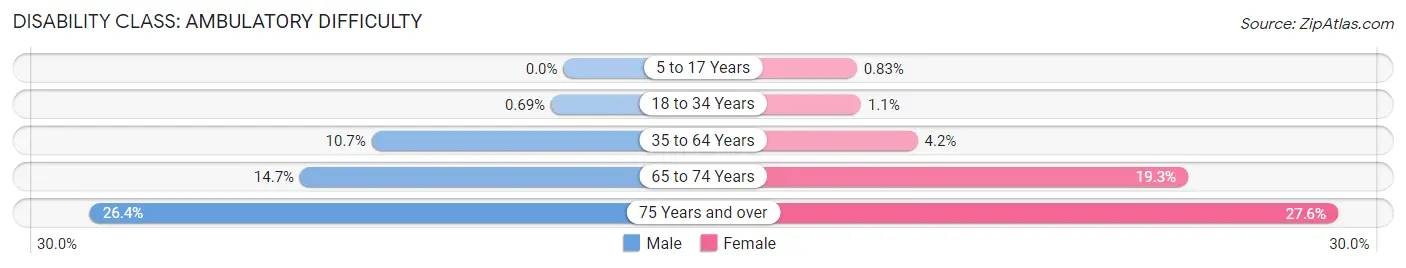
| Age Bracket | Male | Female |
| 5 to 17 Years | 0 (0.0%) | 30 (0.8%) |
| 18 to 34 Years | 28 (0.7%) | 45 (1.1%) |
| 35 to 64 Years | 738 (10.7%) | 311 (4.2%) |
| 65 to 74 Years | 277 (14.7%) | 535 (19.3%) |
| 75 Years and over | 408 (26.4%) | 681 (27.6%) |
Disability Class: Self-Care Difficulty
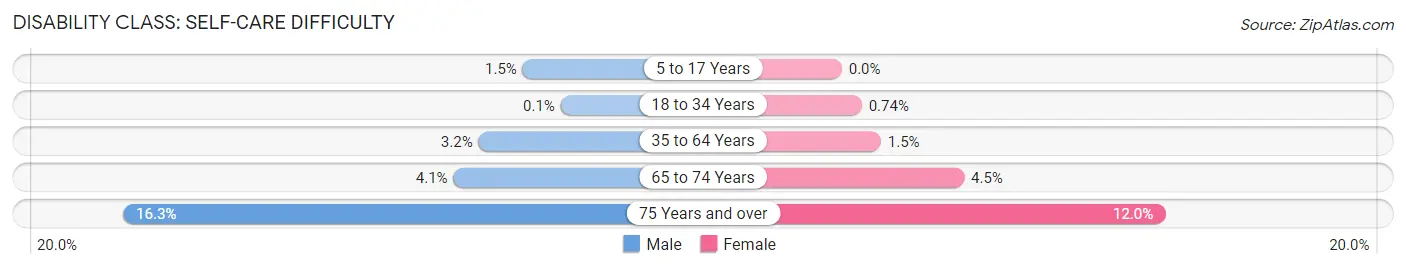
| Age Bracket | Male | Female |
| 5 to 17 Years | 57 (1.5%) | 0 (0.0%) |
| 18 to 34 Years | 4 (0.1%) | 31 (0.7%) |
| 35 to 64 Years | 218 (3.2%) | 107 (1.5%) |
| 65 to 74 Years | 77 (4.1%) | 126 (4.5%) |
| 75 Years and over | 253 (16.3%) | 296 (12.0%) |
Technology Access in Sierra Vista
Computing Device Access in Sierra Vista
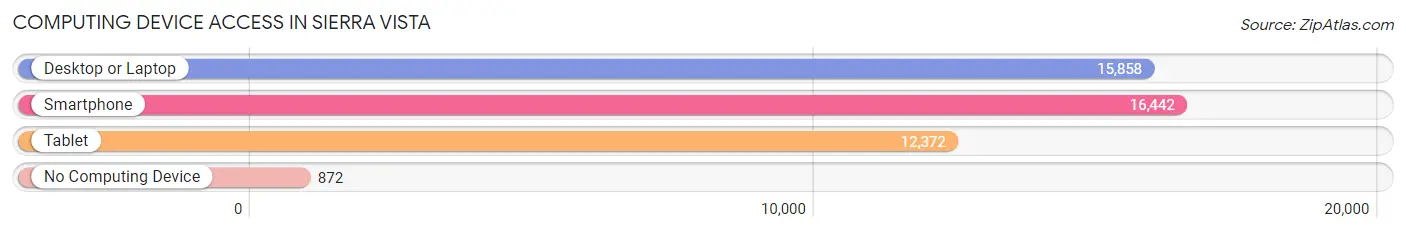
| Device Type | # Households | % Households |
| Desktop or Laptop | 15,858 | 86.3% |
| Smartphone | 16,442 | 89.4% |
| Tablet | 12,372 | 67.3% |
| No Computing Device | 872 | 4.7% |
| Total | 18,382 | 100.0% |
Internet Access in Sierra Vista
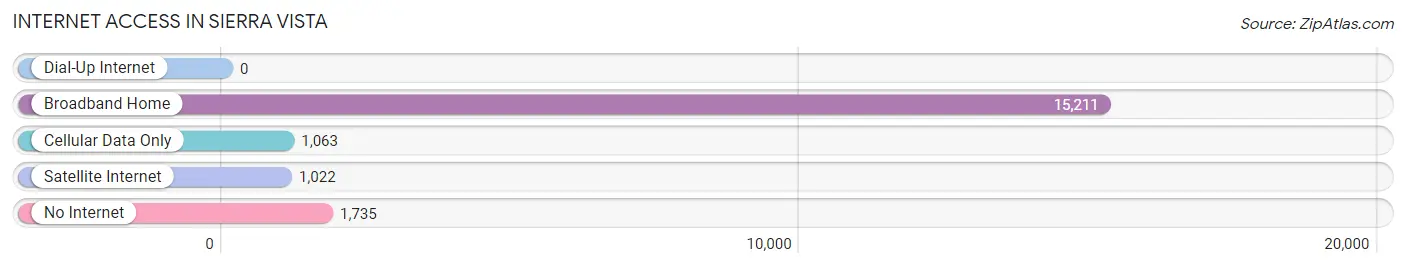
| Internet Type | # Households | % Households |
| Dial-Up Internet | 0 | 0.0% |
| Broadband Home | 15,211 | 82.8% |
| Cellular Data Only | 1,063 | 5.8% |
| Satellite Internet | 1,022 | 5.6% |
| No Internet | 1,735 | 9.4% |
| Total | 18,382 | 100.0% |
Sierra Vista Summary
Sierra Vista is a city located in Cochise County, Arizona, United States. It is situated in the Huachuca Mountains, about 75 miles southeast of Tucson. As of the 2010 census, the population of Sierra Vista was 43,888. The city is part of the Sierra Vista-Douglas Metropolitan Area, with a population of 131,346 in 2010.
Geography
Sierra Vista is located in the southeastern corner of Arizona, in the Upper San Pedro River Valley. It is situated in the Huachuca Mountains, about 75 miles southeast of Tucson. The city is surrounded by the Coronado National Forest, and is located near the San Pedro Riparian National Conservation Area. The city is located at an elevation of 4,620 feet above sea level.
Climate
Sierra Vista has a semi-arid climate, with hot summers and mild winters. The average high temperature in July is 97°F, and the average low temperature in January is 37°F. The average annual precipitation is 16.5 inches.
History
Sierra Vista was founded in 1881 as a military fort, Fort Huachuca. The fort was established to protect settlers from Apache raids. In the early 1900s, the fort was used as a base for the Buffalo Soldiers, an all-black regiment of the U.S. Army. In the 1950s, the fort was used as a base for the U.S. Air Force.
In the 1960s, the fort was closed and the land was sold to developers. The city of Sierra Vista was incorporated in 1956. In the 1970s, the city began to grow rapidly, and by the 1980s, it had become a major center for tourism and retirement.
Economy
Sierra Vista is a major center for tourism and retirement. The city is home to several military installations, including Fort Huachuca, Davis-Monthan Air Force Base, and the Sierra Vista Army Airfield. The city is also home to several major employers, including Raytheon Missile Systems, Walmart, and the University of Arizona South.
Demographics
As of the 2010 census, the population of Sierra Vista was 43,888. The racial makeup of the city was 75.3% White, 4.2% African American, 1.2% Native American, 1.7% Asian, 0.2% Pacific Islander, 14.3% from other races, and 3.2% from two or more races. Hispanic or Latino of any race were 33.2% of the population.
The median income for a household in the city was $41,919, and the median income for a family was $50,919. The per capita income for the city was $20,919. About 11.3% of families and 15.2% of the population were below the poverty line, including 22.2% of those under age 18 and 8.2% of those age 65 or over.
Common Questions
What is Per Capita Income in Sierra Vista?
Per Capita income in Sierra Vista is $37,671.
What is the Median Family Income in Sierra Vista?
Median Family Income in Sierra Vista is $87,754.
What is the Median Household income in Sierra Vista?
Median Household Income in Sierra Vista is $70,899.
What is Income or Wage Gap in Sierra Vista?
Income or Wage Gap in Sierra Vista is 33.1%.
Women in Sierra Vista earn 66.9 cents for every dollar earned by a man.
What is Family Income Deficit in Sierra Vista?
Family Income Deficit in Sierra Vista is $11,853.
Families that are below poverty line in Sierra Vista earn $11,853 less on average than the poverty threshold level.
What is Inequality or Gini Index in Sierra Vista?
Inequality or Gini Index in Sierra Vista is 0.42.
What is the Total Population of Sierra Vista?
Total Population of Sierra Vista is 45,212.
What is the Total Male Population of Sierra Vista?
Total Male Population of Sierra Vista is 22,858.
What is the Total Female Population of Sierra Vista?
Total Female Population of Sierra Vista is 22,354.
What is the Ratio of Males per 100 Females in Sierra Vista?
There are 102.25 Males per 100 Females in Sierra Vista.
What is the Ratio of Females per 100 Males in Sierra Vista?
There are 97.80 Females per 100 Males in Sierra Vista.
What is the Median Population Age in Sierra Vista?
Median Population Age in Sierra Vista is 37.0 Years.
What is the Average Family Size in Sierra Vista
Average Family Size in Sierra Vista is 3.0 People.
What is the Average Household Size in Sierra Vista
Average Household Size in Sierra Vista is 2.4 People.
How Large is the Labor Force in Sierra Vista?
There are 21,267 People in the Labor Forcein in Sierra Vista.
What is the Percentage of People in the Labor Force in Sierra Vista?
58.8% of People are in the Labor Force in Sierra Vista.
What is the Unemployment Rate in Sierra Vista?
Unemployment Rate in Sierra Vista is 5.7%.