El Mirage, AZ Map & Demographics
El Mirage Map
El Mirage Overview
$26,087
PER CAPITA INCOME
$70,768
AVG FAMILY INCOME
$72,134
AVG HOUSEHOLD INCOME
12.5%
WAGE / INCOME GAP [ % ]
87.5¢/ $1
WAGE / INCOME GAP [ $ ]
$13,709
FAMILY INCOME DEFICIT
0.36
INEQUALITY / GINI INDEX
35,652
TOTAL POPULATION
17,392
MALE POPULATION
18,260
FEMALE POPULATION
95.25
MALES / 100 FEMALES
104.99
FEMALES / 100 MALES
31.9
MEDIAN AGE
3.4
AVG FAMILY SIZE
3.2
AVG HOUSEHOLD SIZE
18,442
LABOR FORCE [ PEOPLE ]
68.6%
PERCENT IN LABOR FORCE
5.9%
UNEMPLOYMENT RATE
El Mirage Zip Codes
El Mirage Area Codes
Income in El Mirage
Income Overview in El Mirage
Per Capita Income in El Mirage is $26,087, while median incomes of families and households are $70,768 and $72,134 respectively.
| Characteristic | Number | Measure |
| Per Capita Income | 35,652 | $26,087 |
| Median Family Income | 8,900 | $70,768 |
| Mean Family Income | 8,900 | $81,638 |
| Median Household Income | 11,130 | $72,134 |
| Mean Household Income | 11,130 | $81,149 |
| Income Deficit | 8,900 | $13,709 |
| Wage / Income Gap (%) | 35,652 | 12.52% |
| Wage / Income Gap ($) | 35,652 | 87.48¢ per $1 |
| Gini / Inequality Index | 35,652 | 0.36 |
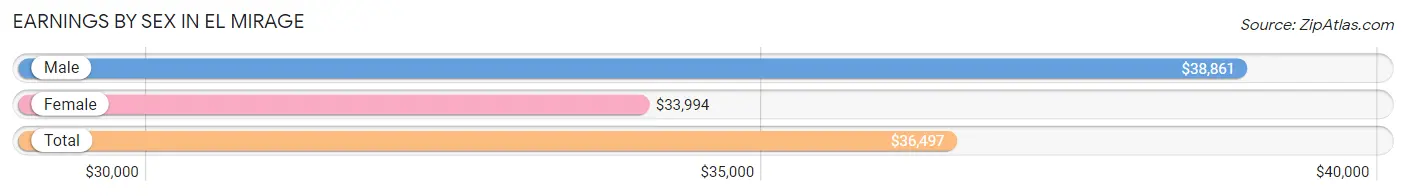
Earnings by Sex in El Mirage
Average Earnings in El Mirage are $36,497, $38,861 for men and $33,994 for women, a difference of 12.5%.
| Sex | Number | Average Earnings |
| Male | 9,569 (51.3%) | $38,861 |
| Female | 9,070 (48.7%) | $33,994 |
| Total | 18,639 (100.0%) | $36,497 |
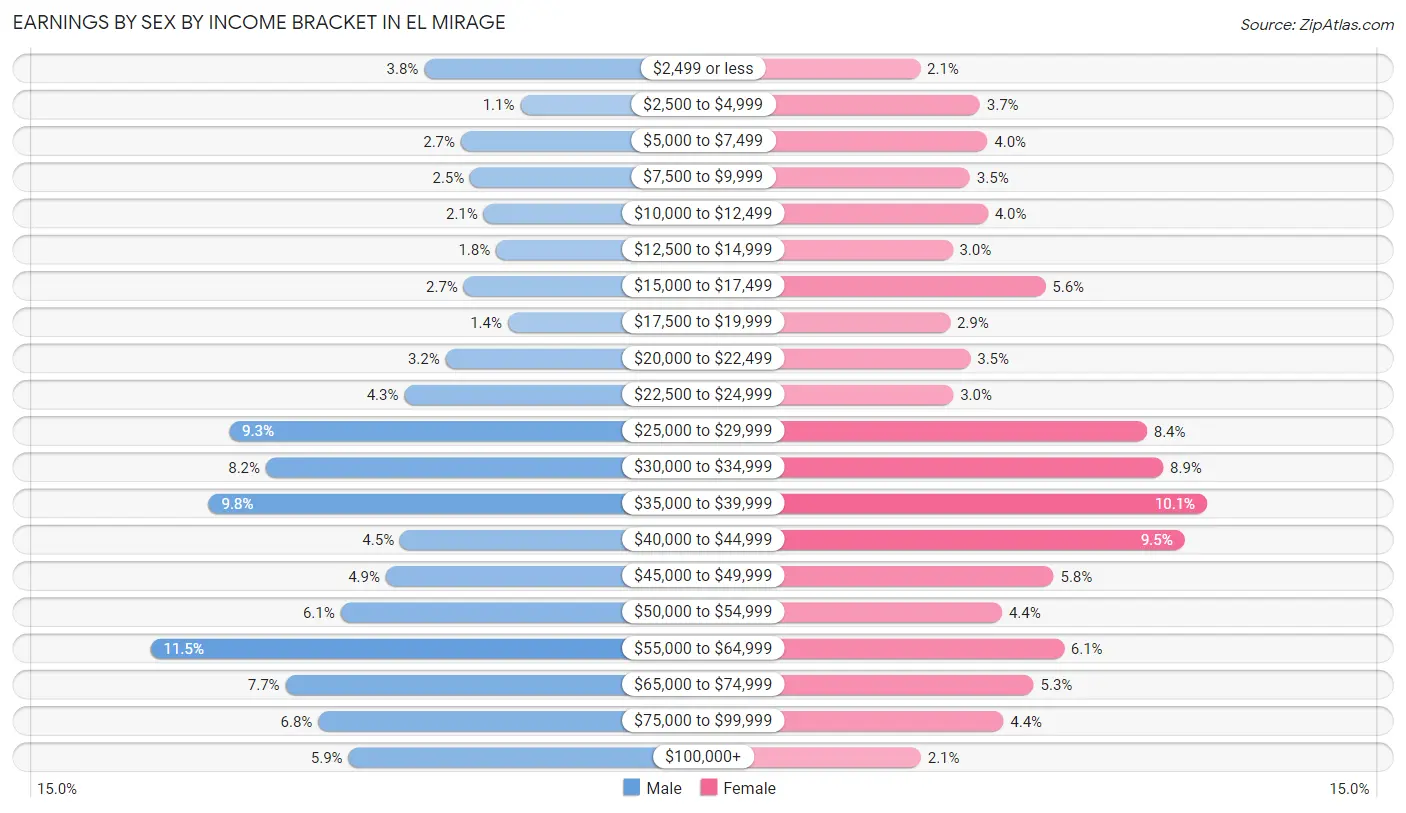
Earnings by Sex by Income Bracket in El Mirage
The most common earnings brackets in El Mirage are $55,000 to $64,999 for men (1,097 | 11.5%) and $35,000 to $39,999 for women (918 | 10.1%).
| Income | Male | Female |
| $2,499 or less | 361 (3.8%) | 187 (2.1%) |
| $2,500 to $4,999 | 102 (1.1%) | 339 (3.7%) |
| $5,000 to $7,499 | 262 (2.7%) | 358 (4.0%) |
| $7,500 to $9,999 | 237 (2.5%) | 314 (3.5%) |
| $10,000 to $12,499 | 201 (2.1%) | 359 (4.0%) |
| $12,500 to $14,999 | 167 (1.8%) | 269 (3.0%) |
| $15,000 to $17,499 | 255 (2.7%) | 506 (5.6%) |
| $17,500 to $19,999 | 136 (1.4%) | 263 (2.9%) |
| $20,000 to $22,499 | 303 (3.2%) | 315 (3.5%) |
| $22,500 to $24,999 | 414 (4.3%) | 271 (3.0%) |
| $25,000 to $29,999 | 885 (9.2%) | 765 (8.4%) |
| $30,000 to $34,999 | 787 (8.2%) | 806 (8.9%) |
| $35,000 to $39,999 | 941 (9.8%) | 918 (10.1%) |
| $40,000 to $44,999 | 426 (4.4%) | 861 (9.5%) |
| $45,000 to $49,999 | 464 (4.9%) | 527 (5.8%) |
| $50,000 to $54,999 | 586 (6.1%) | 395 (4.4%) |
| $55,000 to $64,999 | 1,097 (11.5%) | 553 (6.1%) |
| $65,000 to $74,999 | 734 (7.7%) | 476 (5.2%) |
| $75,000 to $99,999 | 646 (6.8%) | 399 (4.4%) |
| $100,000+ | 565 (5.9%) | 189 (2.1%) |
| Total | 9,569 (100.0%) | 9,070 (100.0%) |
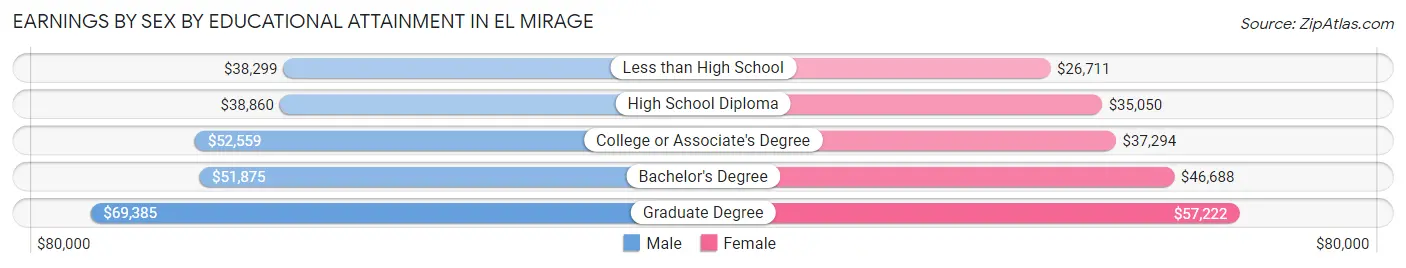
Earnings by Sex by Educational Attainment in El Mirage
Average earnings in El Mirage are $43,696 for men and $37,479 for women, a difference of 14.2%. Men with an educational attainment of graduate degree enjoy the highest average annual earnings of $69,385, while those with less than high school education earn the least with $38,299. Women with an educational attainment of graduate degree earn the most with the average annual earnings of $57,222, while those with less than high school education have the smallest earnings of $26,711.
| Educational Attainment | Male Income | Female Income |
| Less than High School | $38,299 | $26,711 |
| High School Diploma | $38,860 | $35,050 |
| College or Associate's Degree | $52,559 | $37,294 |
| Bachelor's Degree | $51,875 | $46,688 |
| Graduate Degree | $69,385 | $57,222 |
| Total | $43,696 | $37,479 |
Family Income in El Mirage
Family Income Brackets in El Mirage
According to the El Mirage family income data, there are 1,931 families falling into the $50,000 to $74,999 income range, which is the most common income bracket and makes up 21.7% of all families. Conversely, the $10,000 to $14,999 income bracket is the least frequent group with only 169 families (1.9%) belonging to this category.
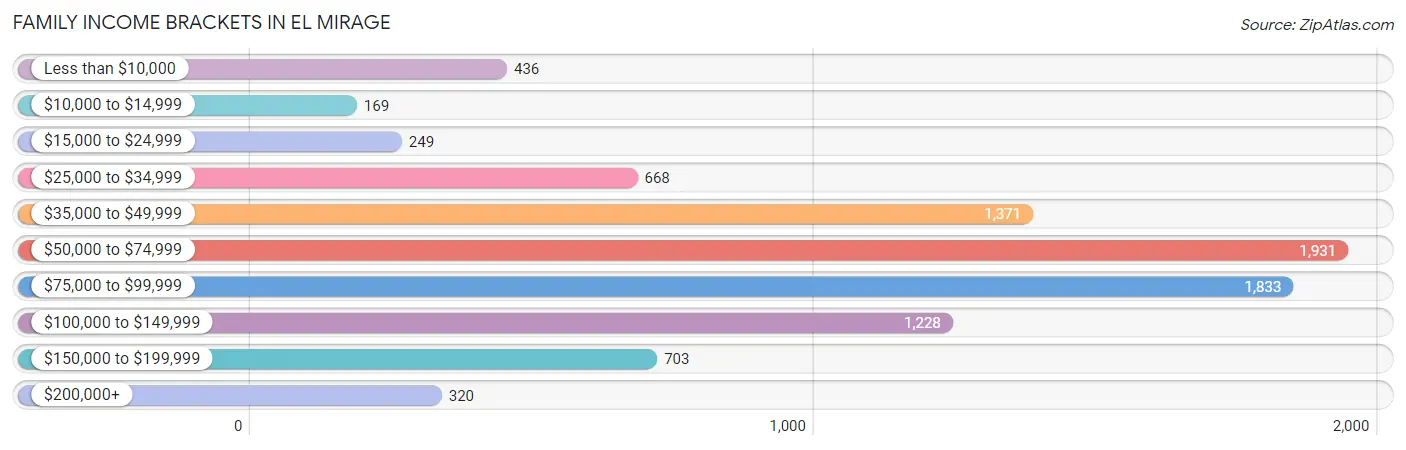
| Income Bracket | # Families | % Families |
| Less than $10,000 | 436 | 4.9% |
| $10,000 to $14,999 | 169 | 1.9% |
| $15,000 to $24,999 | 249 | 2.8% |
| $25,000 to $34,999 | 668 | 7.5% |
| $35,000 to $49,999 | 1,371 | 15.4% |
| $50,000 to $74,999 | 1,931 | 21.7% |
| $75,000 to $99,999 | 1,833 | 20.6% |
| $100,000 to $149,999 | 1,228 | 13.8% |
| $150,000 to $199,999 | 703 | 7.9% |
| $200,000+ | 320 | 3.6% |
Family Income by Famaliy Size in El Mirage
7+ person families (168 | 1.9%) account for the highest median family income in El Mirage with $133,750 per family, while 2-person families (2,855 | 32.1%) have the highest median income of $30,748 per family member.
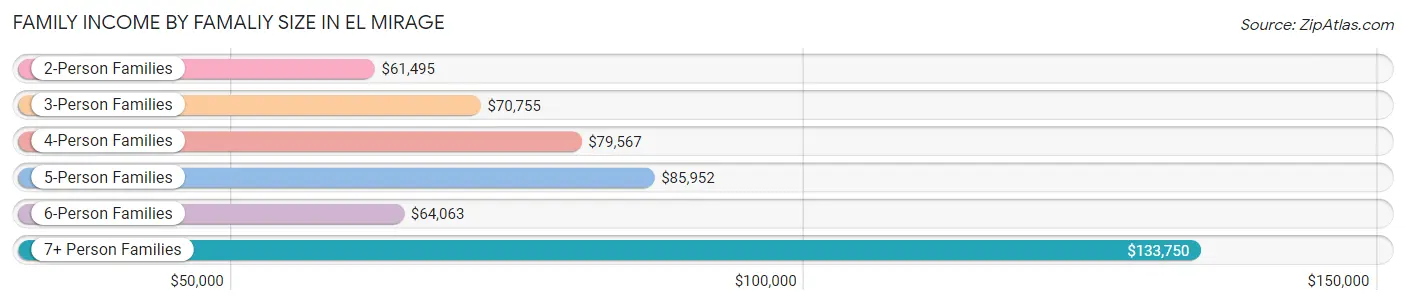
| Income Bracket | # Families | Median Income |
| 2-Person Families | 2,855 (32.1%) | $61,495 |
| 3-Person Families | 2,345 (26.4%) | $70,755 |
| 4-Person Families | 1,857 (20.9%) | $79,567 |
| 5-Person Families | 892 (10.0%) | $85,952 |
| 6-Person Families | 783 (8.8%) | $64,063 |
| 7+ Person Families | 168 (1.9%) | $133,750 |
| Total | 8,900 (100.0%) | $70,768 |
Family Income by Number of Earners in El Mirage
The median family income in El Mirage is $70,768, with families comprising 3+ earners (1,275) having the highest median family income of $134,315, while families with no earners (1,038) have the lowest median family income of $38,188, accounting for 14.3% and 11.7% of families, respectively.
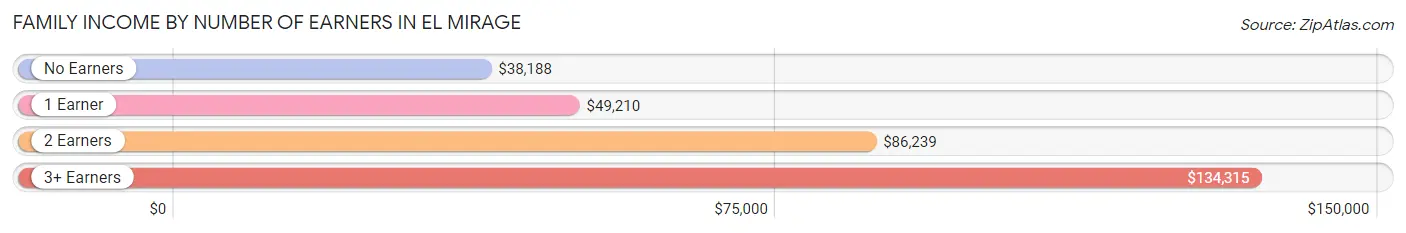
| Number of Earners | # Families | Median Income |
| No Earners | 1,038 (11.7%) | $38,188 |
| 1 Earner | 3,063 (34.4%) | $49,210 |
| 2 Earners | 3,524 (39.6%) | $86,239 |
| 3+ Earners | 1,275 (14.3%) | $134,315 |
| Total | 8,900 (100.0%) | $70,768 |
Household Income in El Mirage
Household Income Brackets in El Mirage
With 2,382 households falling in the category, the $75,000 to $99,999 income range is the most frequent in El Mirage, accounting for 21.4% of all households. In contrast, only 278 households (2.5%) fall into the $10,000 to $14,999 income bracket, making it the least populous group.
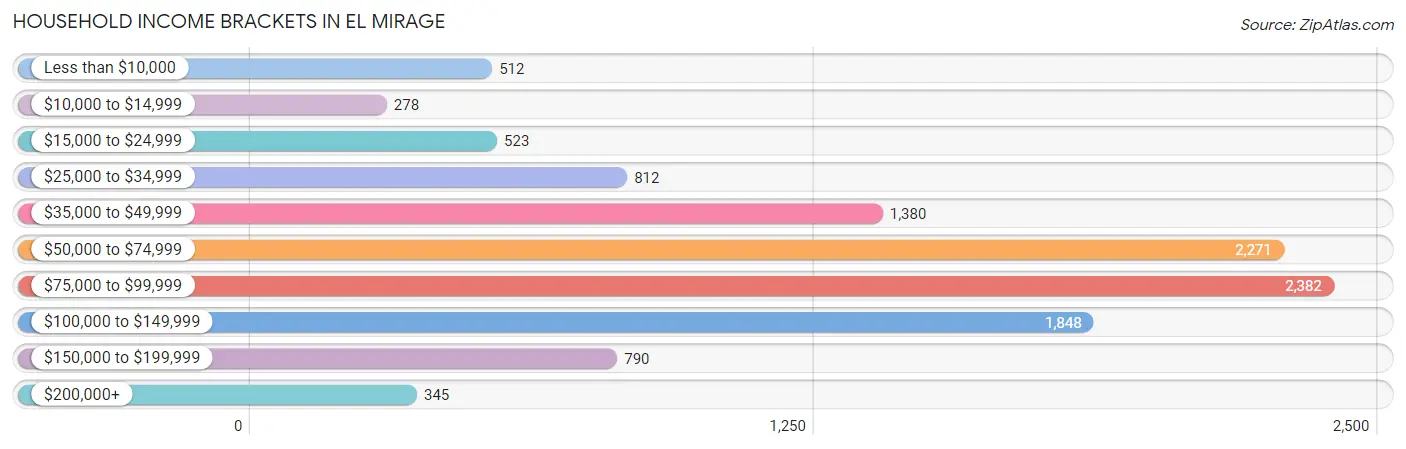
| Income Bracket | # Households | % Households |
| Less than $10,000 | 512 | 4.6% |
| $10,000 to $14,999 | 278 | 2.5% |
| $15,000 to $24,999 | 523 | 4.7% |
| $25,000 to $34,999 | 812 | 7.3% |
| $35,000 to $49,999 | 1,380 | 12.4% |
| $50,000 to $74,999 | 2,271 | 20.4% |
| $75,000 to $99,999 | 2,382 | 21.4% |
| $100,000 to $149,999 | 1,848 | 16.6% |
| $150,000 to $199,999 | 790 | 7.1% |
| $200,000+ | 345 | 3.1% |
Household Income by Householder Age in El Mirage
The median household income in El Mirage is $72,134, with the highest median household income of $79,150 found in the 45 to 64 years age bracket for the primary householder. A total of 3,622 households (32.5%) fall into this category. Meanwhile, the 65+ years age bracket for the primary householder has the lowest median household income of $52,364, with 2,030 households (18.2%) in this group.
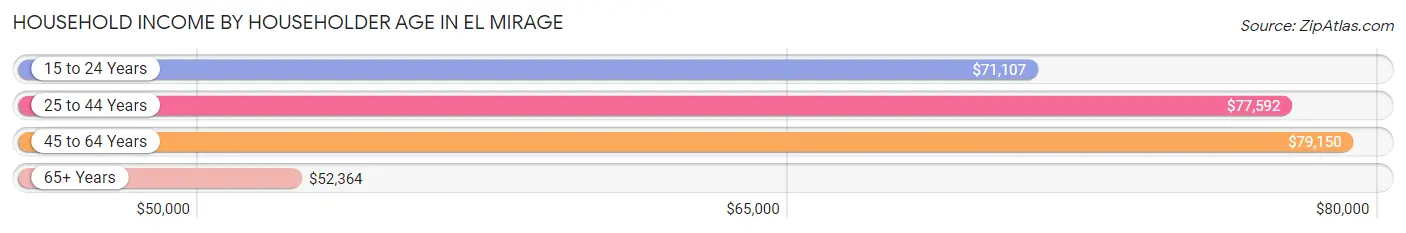
| Income Bracket | # Households | Median Income |
| 15 to 24 Years | 439 (3.9%) | $71,107 |
| 25 to 44 Years | 5,039 (45.3%) | $77,592 |
| 45 to 64 Years | 3,622 (32.5%) | $79,150 |
| 65+ Years | 2,030 (18.2%) | $52,364 |
| Total | 11,130 (100.0%) | $72,134 |
Poverty in El Mirage
Income Below Poverty by Sex and Age in El Mirage
With 14.3% poverty level for males and 12.5% for females among the residents of El Mirage, 75 year old and over males and 75 year old and over females are the most vulnerable to poverty, with 227 males (30.2%) and 189 females (21.5%) in their respective age groups living below the poverty level.
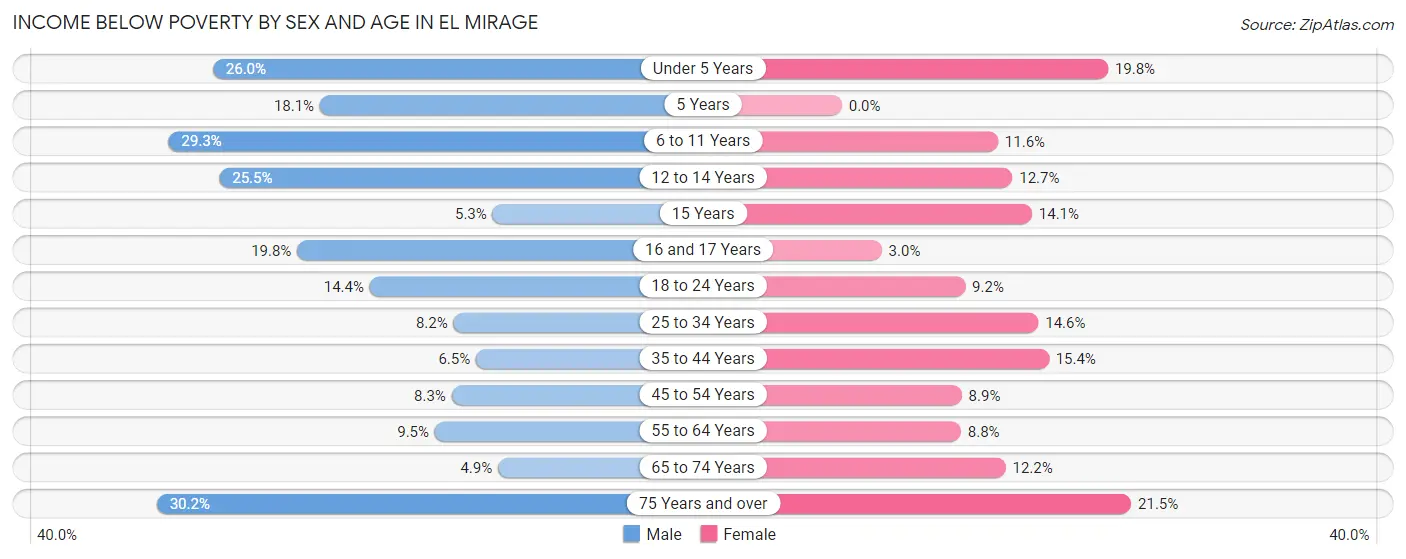
| Age Bracket | Male | Female |
| Under 5 Years | 419 (26.0%) | 198 (19.8%) |
| 5 Years | 43 (18.1%) | 0 (0.0%) |
| 6 to 11 Years | 458 (29.3%) | 222 (11.6%) |
| 12 to 14 Years | 211 (25.5%) | 98 (12.7%) |
| 15 Years | 17 (5.2%) | 35 (14.1%) |
| 16 and 17 Years | 83 (19.8%) | 16 (3.0%) |
| 18 to 24 Years | 287 (14.4%) | 193 (9.2%) |
| 25 to 34 Years | 228 (8.2%) | 428 (14.6%) |
| 35 to 44 Years | 160 (6.5%) | 425 (15.4%) |
| 45 to 54 Years | 152 (8.3%) | 174 (8.9%) |
| 55 to 64 Years | 148 (9.5%) | 167 (8.8%) |
| 65 to 74 Years | 48 (4.9%) | 122 (12.2%) |
| 75 Years and over | 227 (30.2%) | 189 (21.5%) |
| Total | 2,481 (14.3%) | 2,267 (12.5%) |
Income Above Poverty by Sex and Age in El Mirage
According to the poverty statistics in El Mirage, males aged 65 to 74 years and females aged 5 years are the age groups that are most secure financially, with 95.2% of males and 100.0% of females in these age groups living above the poverty line.
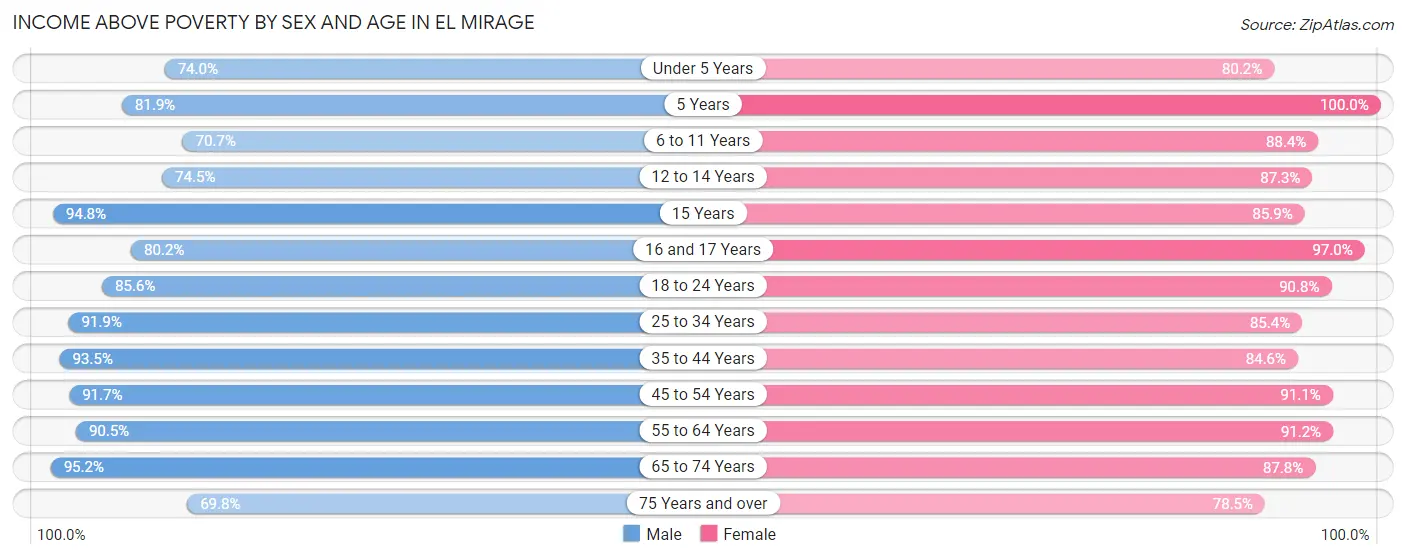
| Age Bracket | Male | Female |
| Under 5 Years | 1,191 (74.0%) | 804 (80.2%) |
| 5 Years | 195 (81.9%) | 122 (100.0%) |
| 6 to 11 Years | 1,104 (70.7%) | 1,694 (88.4%) |
| 12 to 14 Years | 615 (74.5%) | 676 (87.3%) |
| 15 Years | 307 (94.8%) | 213 (85.9%) |
| 16 and 17 Years | 337 (80.2%) | 524 (97.0%) |
| 18 to 24 Years | 1,710 (85.6%) | 1,913 (90.8%) |
| 25 to 34 Years | 2,569 (91.8%) | 2,505 (85.4%) |
| 35 to 44 Years | 2,311 (93.5%) | 2,342 (84.6%) |
| 45 to 54 Years | 1,681 (91.7%) | 1,780 (91.1%) |
| 55 to 64 Years | 1,404 (90.5%) | 1,722 (91.2%) |
| 65 to 74 Years | 942 (95.2%) | 881 (87.8%) |
| 75 Years and over | 525 (69.8%) | 691 (78.5%) |
| Total | 14,891 (85.7%) | 15,867 (87.5%) |
Income Below Poverty Among Married-Couple Families in El Mirage
The poverty statistics for married-couple families in El Mirage show that 7.3% or 411 of the total 5,608 families live below the poverty line. Families with 5 or more children have the highest poverty rate of 68.8%, comprising of 22 families. On the other hand, families with no children have the lowest poverty rate of 2.4%, which includes 64 families.
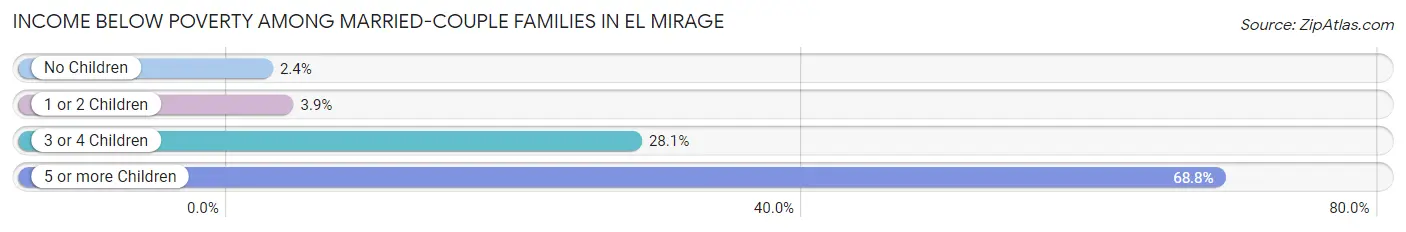
| Children | Above Poverty | Below Poverty |
| No Children | 2,573 (97.6%) | 64 (2.4%) |
| 1 or 2 Children | 1,988 (96.1%) | 80 (3.9%) |
| 3 or 4 Children | 626 (71.9%) | 245 (28.1%) |
| 5 or more Children | 10 (31.2%) | 22 (68.8%) |
| Total | 5,197 (92.7%) | 411 (7.3%) |
Income Below Poverty Among Single-Parent Households in El Mirage
According to the poverty data in El Mirage, 21.3% or 229 single-father households and 16.1% or 356 single-mother households are living below the poverty line. Among single-father households, those with 1 or 2 children have the highest poverty rate, with 159 households (30.0%) experiencing poverty. Likewise, among single-mother households, those with 5 or more children have the highest poverty rate, with 8 households (100.0%) falling below the poverty line.
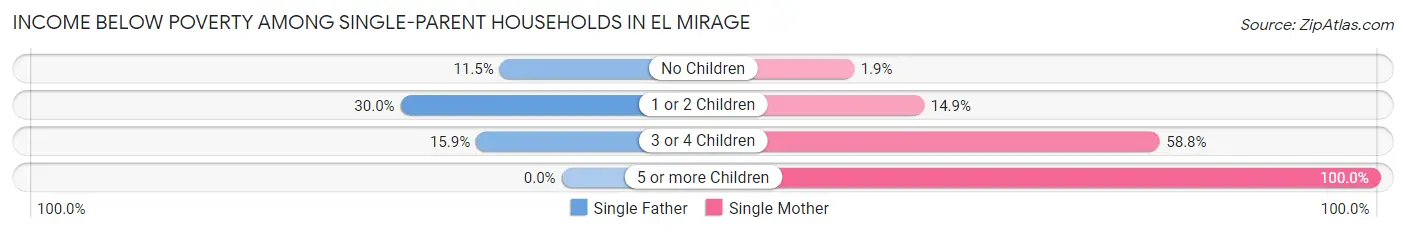
| Children | Single Father | Single Mother |
| No Children | 45 (11.5%) | 12 (1.9%) |
| 1 or 2 Children | 159 (30.0%) | 199 (14.9%) |
| 3 or 4 Children | 25 (15.9%) | 137 (58.8%) |
| 5 or more Children | 0 (0.0%) | 8 (100.0%) |
| Total | 229 (21.3%) | 356 (16.1%) |
Income Below Poverty Among Married-Couple vs Single-Parent Households in El Mirage
The poverty data for El Mirage shows that 411 of the married-couple family households (7.3%) and 585 of the single-parent households (17.8%) are living below the poverty level. Within the married-couple family households, those with 5 or more children have the highest poverty rate, with 22 households (68.8%) falling below the poverty line. Among the single-parent households, those with 5 or more children have the highest poverty rate, with 8 household (100.0%) living below poverty.
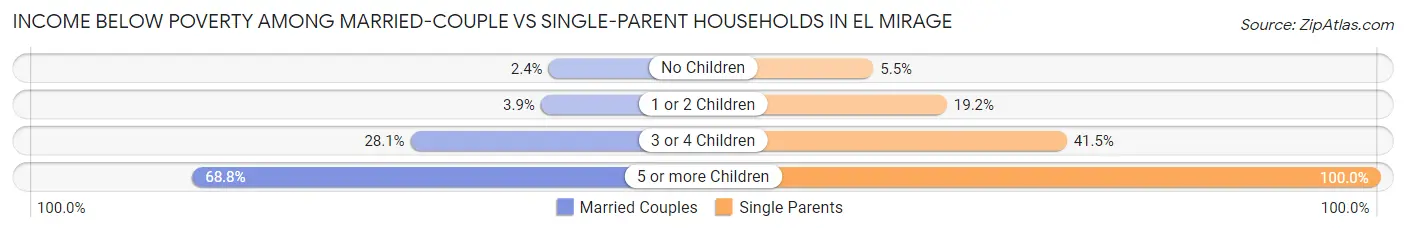
| Children | Married-Couple Families | Single-Parent Households |
| No Children | 64 (2.4%) | 57 (5.5%) |
| 1 or 2 Children | 80 (3.9%) | 358 (19.2%) |
| 3 or 4 Children | 245 (28.1%) | 162 (41.5%) |
| 5 or more Children | 22 (68.8%) | 8 (100.0%) |
| Total | 411 (7.3%) | 585 (17.8%) |
Race in El Mirage
The most populous races in El Mirage are White / Caucasian (17,889 | 50.2%), Hispanic or Latino (17,567 | 49.3%), and Two or more Races (8,684 | 24.4%).
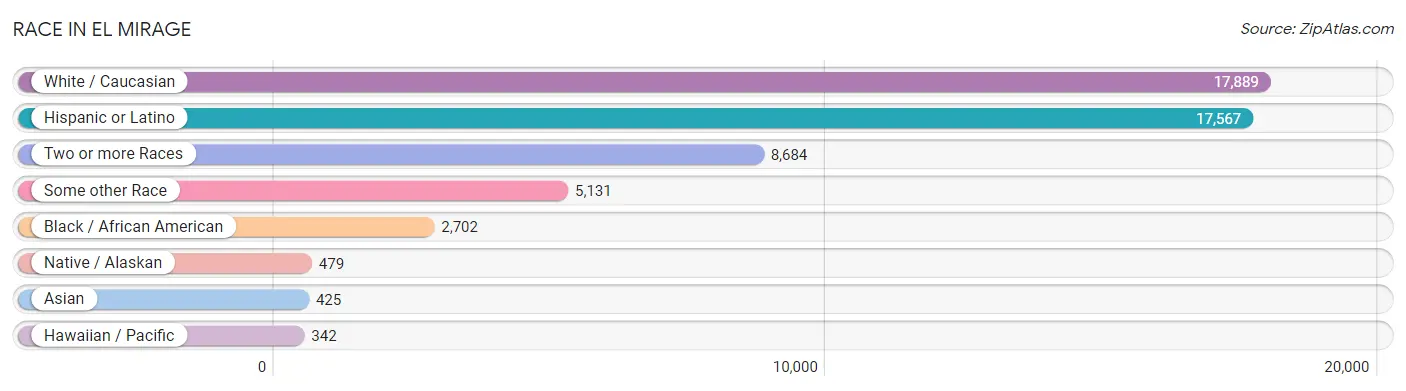
| Race | # Population | % Population |
| Asian | 425 | 1.2% |
| Black / African American | 2,702 | 7.6% |
| Hawaiian / Pacific | 342 | 1.0% |
| Hispanic or Latino | 17,567 | 49.3% |
| Native / Alaskan | 479 | 1.3% |
| White / Caucasian | 17,889 | 50.2% |
| Two or more Races | 8,684 | 24.4% |
| Some other Race | 5,131 | 14.4% |
| Total | 35,652 | 100.0% |
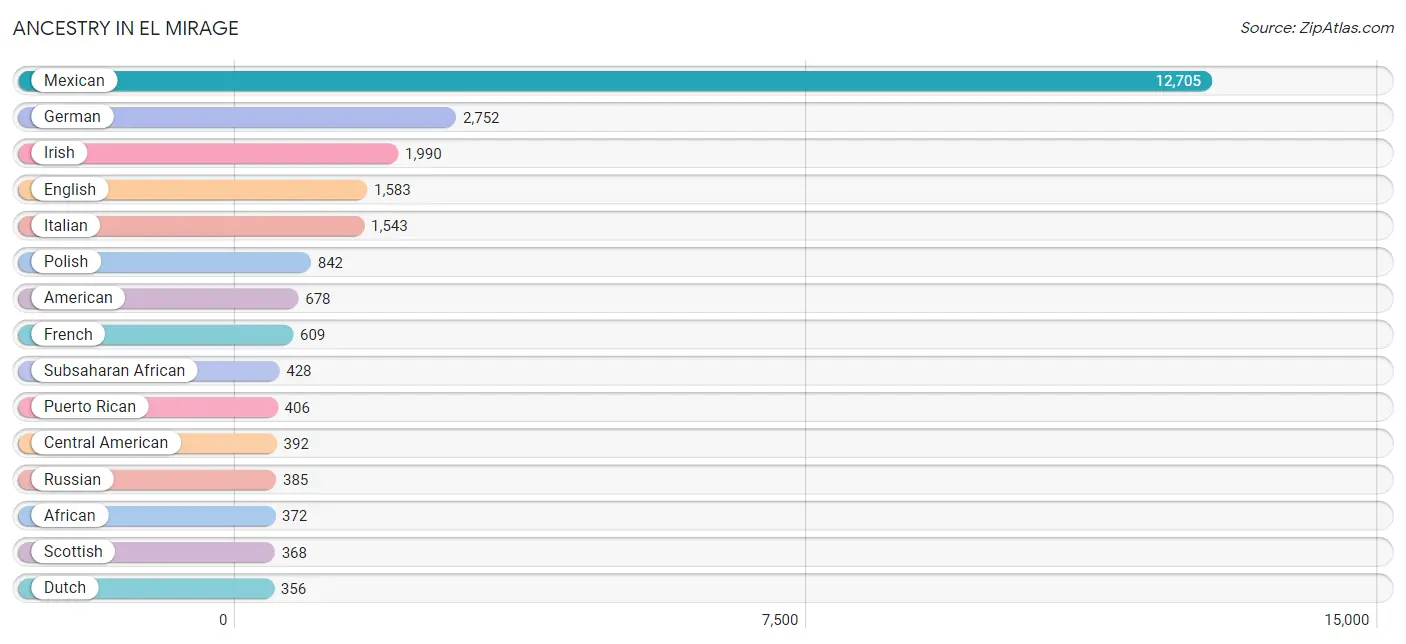
Ancestry in El Mirage
The most populous ancestries reported in El Mirage are Mexican (12,705 | 35.6%), German (2,752 | 7.7%), Irish (1,990 | 5.6%), English (1,583 | 4.4%), and Italian (1,543 | 4.3%), together accounting for 57.7% of all El Mirage residents.
| Ancestry | # Population | % Population |
| African | 372 | 1.0% |
| Alaska Native | 11 | 0.0% |
| American | 678 | 1.9% |
| Apache | 6 | 0.0% |
| Arab | 301 | 0.8% |
| Armenian | 7 | 0.0% |
| Assyrian / Chaldean / Syriac | 149 | 0.4% |
| Basque | 15 | 0.0% |
| Belgian | 5 | 0.0% |
| Bhutanese | 53 | 0.2% |
| Blackfeet | 5 | 0.0% |
| Brazilian | 5 | 0.0% |
| British | 52 | 0.2% |
| Burmese | 92 | 0.3% |
| Canadian | 59 | 0.2% |
| Central American | 392 | 1.1% |
| Central American Indian | 32 | 0.1% |
| Cherokee | 64 | 0.2% |
| Choctaw | 52 | 0.2% |
| Colombian | 14 | 0.0% |
| Croatian | 8 | 0.0% |
| Cuban | 65 | 0.2% |
| Czech | 151 | 0.4% |
| Czechoslovakian | 6 | 0.0% |
| Danish | 40 | 0.1% |
| Dutch | 356 | 1.0% |
| Eastern European | 39 | 0.1% |
| Ecuadorian | 13 | 0.0% |
| Egyptian | 32 | 0.1% |
| English | 1,583 | 4.4% |
| European | 233 | 0.6% |
| Filipino | 16 | 0.0% |
| Finnish | 36 | 0.1% |
| French | 609 | 1.7% |
| French Canadian | 54 | 0.2% |
| German | 2,752 | 7.7% |
| Ghanaian | 5 | 0.0% |
| Greek | 258 | 0.7% |
| Guamanian / Chamorro | 140 | 0.4% |
| Guatemalan | 44 | 0.1% |
| Guyanese | 19 | 0.1% |
| Haitian | 5 | 0.0% |
| Honduran | 22 | 0.1% |
| Hungarian | 8 | 0.0% |
| Icelander | 14 | 0.0% |
| Indian (Asian) | 112 | 0.3% |
| Iraqi | 120 | 0.3% |
| Irish | 1,990 | 5.6% |
| Italian | 1,543 | 4.3% |
| Jamaican | 17 | 0.1% |
| Korean | 137 | 0.4% |
| Laotian | 42 | 0.1% |
| Lithuanian | 6 | 0.0% |
| Mexican | 12,705 | 35.6% |
| Mexican American Indian | 70 | 0.2% |
| Native Hawaiian | 49 | 0.1% |
| Navajo | 196 | 0.5% |
| Nicaraguan | 7 | 0.0% |
| Nigerian | 43 | 0.1% |
| Northern European | 6 | 0.0% |
| Norwegian | 166 | 0.5% |
| Pakistani | 22 | 0.1% |
| Panamanian | 142 | 0.4% |
| Pennsylvania German | 17 | 0.1% |
| Peruvian | 21 | 0.1% |
| Polish | 842 | 2.4% |
| Portuguese | 62 | 0.2% |
| Puerto Rican | 406 | 1.1% |
| Romanian | 82 | 0.2% |
| Russian | 385 | 1.1% |
| Salvadoran | 177 | 0.5% |
| Samoan | 221 | 0.6% |
| Scandinavian | 63 | 0.2% |
| Scotch-Irish | 184 | 0.5% |
| Scottish | 368 | 1.0% |
| Slovene | 5 | 0.0% |
| South African | 5 | 0.0% |
| South American | 48 | 0.1% |
| Spaniard | 110 | 0.3% |
| Spanish | 152 | 0.4% |
| Sri Lankan | 84 | 0.2% |
| Subsaharan African | 428 | 1.2% |
| Swedish | 141 | 0.4% |
| Swiss | 5 | 0.0% |
| Syrian | 87 | 0.2% |
| Thai | 212 | 0.6% |
| Turkish | 9 | 0.0% |
| Ugandan | 3 | 0.0% |
| Welsh | 155 | 0.4% |
| Yaqui | 148 | 0.4% |
| Yugoslavian | 61 | 0.2% |
| Yuman | 124 | 0.4% | View All 92 Rows |
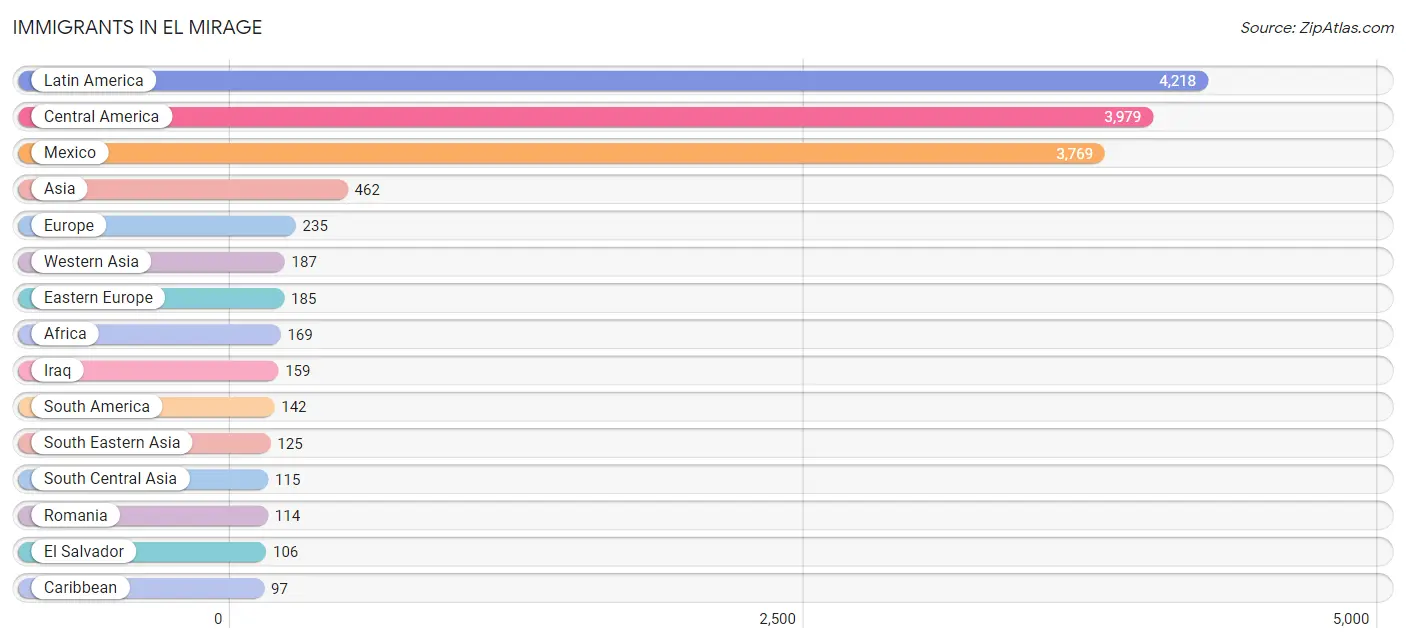
Immigrants in El Mirage
The most numerous immigrant groups reported in El Mirage came from Latin America (4,218 | 11.8%), Central America (3,979 | 11.2%), Mexico (3,769 | 10.6%), Asia (462 | 1.3%), and Europe (235 | 0.7%), together accounting for 35.5% of all El Mirage residents.
| Immigration Origin | # Population | % Population |
| Afghanistan | 8 | 0.0% |
| Africa | 169 | 0.5% |
| Argentina | 52 | 0.2% |
| Asia | 462 | 1.3% |
| Bahamas | 18 | 0.1% |
| Bosnia and Herzegovina | 49 | 0.1% |
| Brazil | 69 | 0.2% |
| Canada | 71 | 0.2% |
| Caribbean | 97 | 0.3% |
| Central America | 3,979 | 11.2% |
| China | 16 | 0.0% |
| Eastern Africa | 3 | 0.0% |
| Eastern Asia | 35 | 0.1% |
| Eastern Europe | 185 | 0.5% |
| Egypt | 46 | 0.1% |
| El Salvador | 106 | 0.3% |
| England | 6 | 0.0% |
| Europe | 235 | 0.7% |
| Germany | 34 | 0.1% |
| Ghana | 5 | 0.0% |
| Guatemala | 24 | 0.1% |
| Haiti | 5 | 0.0% |
| Honduras | 22 | 0.1% |
| India | 88 | 0.3% |
| Iran | 7 | 0.0% |
| Iraq | 159 | 0.4% |
| Jamaica | 74 | 0.2% |
| Korea | 19 | 0.1% |
| Kuwait | 3 | 0.0% |
| Latin America | 4,218 | 11.8% |
| Lebanon | 25 | 0.1% |
| Mexico | 3,769 | 10.6% |
| Nigeria | 32 | 0.1% |
| Northern Africa | 46 | 0.1% |
| Northern Europe | 6 | 0.0% |
| Oceania | 7 | 0.0% |
| Panama | 58 | 0.2% |
| Peru | 21 | 0.1% |
| Philippines | 81 | 0.2% |
| Poland | 22 | 0.1% |
| Romania | 114 | 0.3% |
| South America | 142 | 0.4% |
| South Central Asia | 115 | 0.3% |
| South Eastern Asia | 125 | 0.4% |
| Sri Lanka | 12 | 0.0% |
| Switzerland | 10 | 0.0% |
| Taiwan | 16 | 0.0% |
| Thailand | 10 | 0.0% |
| Uganda | 3 | 0.0% |
| Vietnam | 34 | 0.1% |
| Western Africa | 37 | 0.1% |
| Western Asia | 187 | 0.5% |
| Western Europe | 44 | 0.1% | View All 53 Rows |
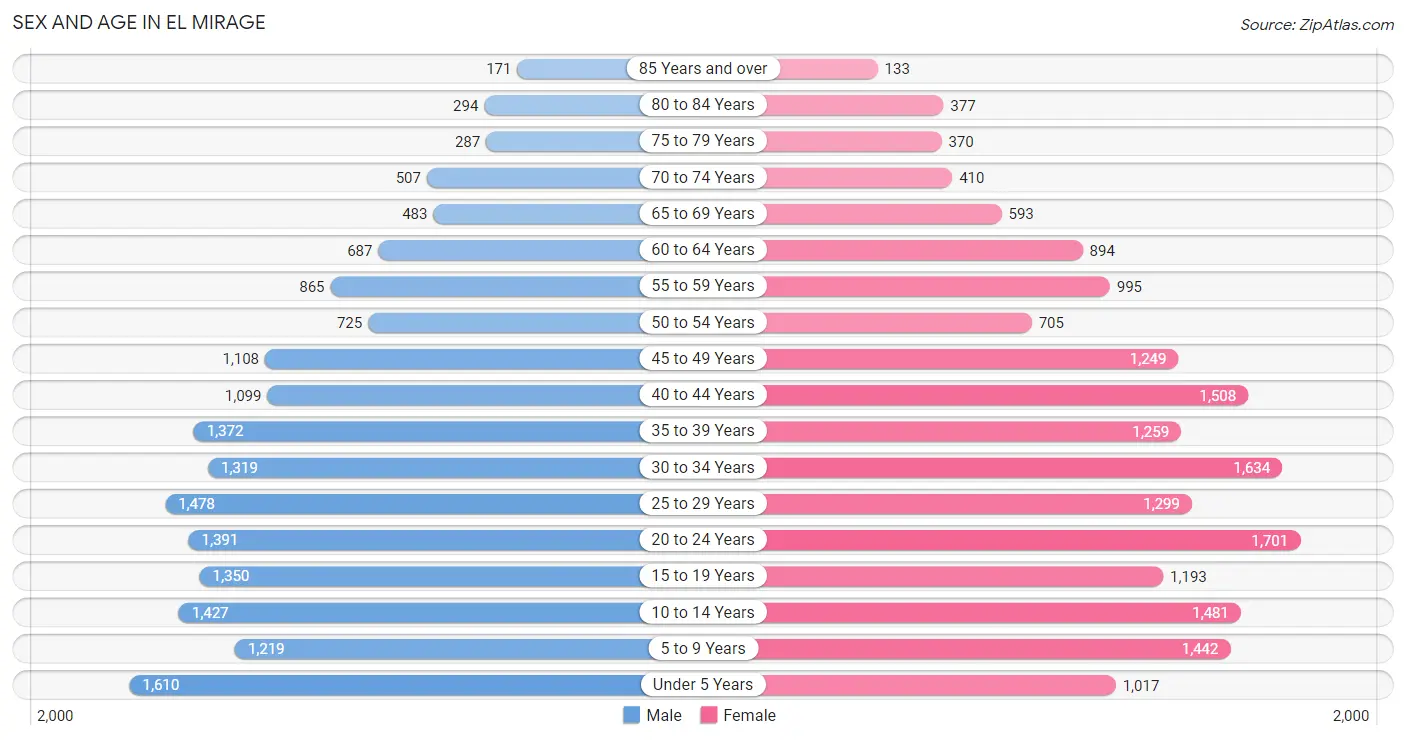
Sex and Age in El Mirage
Sex and Age in El Mirage
The most populous age groups in El Mirage are Under 5 Years (1,610 | 9.3%) for men and 20 to 24 Years (1,701 | 9.3%) for women.
| Age Bracket | Male | Female |
| Under 5 Years | 1,610 (9.3%) | 1,017 (5.6%) |
| 5 to 9 Years | 1,219 (7.0%) | 1,442 (7.9%) |
| 10 to 14 Years | 1,427 (8.2%) | 1,481 (8.1%) |
| 15 to 19 Years | 1,350 (7.8%) | 1,193 (6.5%) |
| 20 to 24 Years | 1,391 (8.0%) | 1,701 (9.3%) |
| 25 to 29 Years | 1,478 (8.5%) | 1,299 (7.1%) |
| 30 to 34 Years | 1,319 (7.6%) | 1,634 (8.9%) |
| 35 to 39 Years | 1,372 (7.9%) | 1,259 (6.9%) |
| 40 to 44 Years | 1,099 (6.3%) | 1,508 (8.3%) |
| 45 to 49 Years | 1,108 (6.4%) | 1,249 (6.8%) |
| 50 to 54 Years | 725 (4.2%) | 705 (3.9%) |
| 55 to 59 Years | 865 (5.0%) | 995 (5.4%) |
| 60 to 64 Years | 687 (4.0%) | 894 (4.9%) |
| 65 to 69 Years | 483 (2.8%) | 593 (3.3%) |
| 70 to 74 Years | 507 (2.9%) | 410 (2.2%) |
| 75 to 79 Years | 287 (1.7%) | 370 (2.0%) |
| 80 to 84 Years | 294 (1.7%) | 377 (2.1%) |
| 85 Years and over | 171 (1.0%) | 133 (0.7%) |
| Total | 17,392 (100.0%) | 18,260 (100.0%) |
Families and Households in El Mirage
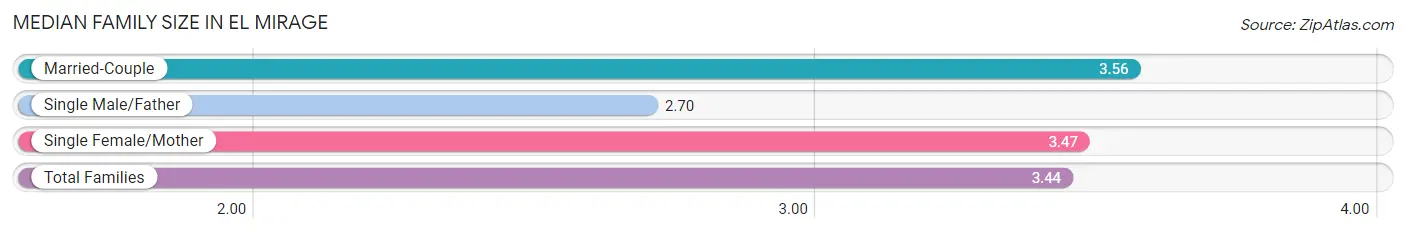
Median Family Size in El Mirage
The median family size in El Mirage is 3.44 persons per family, with married-couple families (5,608 | 63.0%) accounting for the largest median family size of 3.56 persons per family. On the other hand, single male/father families (1,077 | 12.1%) represent the smallest median family size with 2.70 persons per family.
| Family Type | # Families | Family Size |
| Married-Couple | 5,608 (63.0%) | 3.56 |
| Single Male/Father | 1,077 (12.1%) | 2.70 |
| Single Female/Mother | 2,215 (24.9%) | 3.47 |
| Total Families | 8,900 (100.0%) | 3.44 |
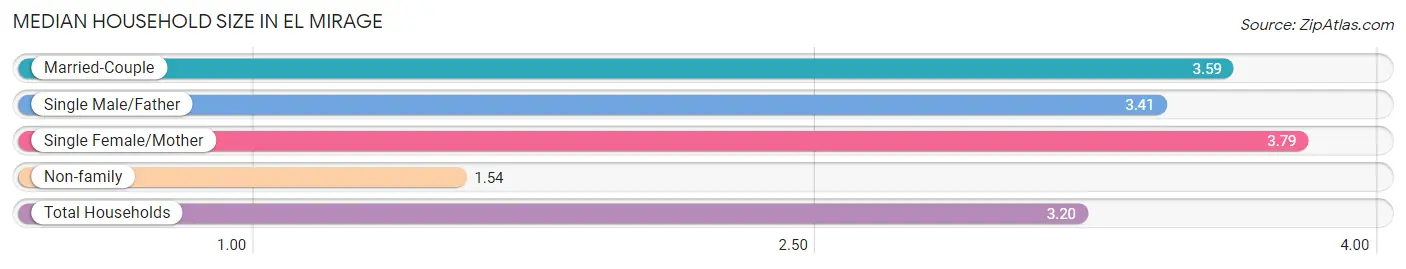
Median Household Size in El Mirage
The median household size in El Mirage is 3.20 persons per household, with single female/mother households (2,215 | 19.9%) accounting for the largest median household size of 3.79 persons per household. non-family households (2,230 | 20.0%) represent the smallest median household size with 1.54 persons per household.
| Household Type | # Households | Household Size |
| Married-Couple | 5,608 (50.4%) | 3.59 |
| Single Male/Father | 1,077 (9.7%) | 3.41 |
| Single Female/Mother | 2,215 (19.9%) | 3.79 |
| Non-family | 2,230 (20.0%) | 1.54 |
| Total Households | 11,130 (100.0%) | 3.20 |
Household Size by Marriage Status in El Mirage
Out of a total of 11,130 households in El Mirage, 8,900 (80.0%) are family households, while 2,230 (20.0%) are nonfamily households. The most numerous type of family households are 2-person households, comprising 2,454, and the most common type of nonfamily households are 1-person households, comprising 1,521.
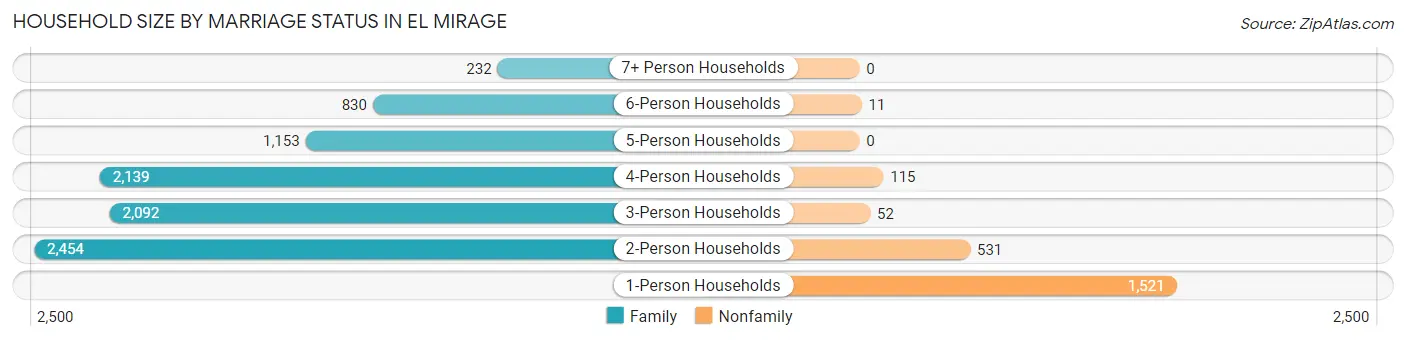
| Household Size | Family Households | Nonfamily Households |
| 1-Person Households | - | 1,521 (13.7%) |
| 2-Person Households | 2,454 (22.1%) | 531 (4.8%) |
| 3-Person Households | 2,092 (18.8%) | 52 (0.5%) |
| 4-Person Households | 2,139 (19.2%) | 115 (1.0%) |
| 5-Person Households | 1,153 (10.4%) | 0 (0.0%) |
| 6-Person Households | 830 (7.5%) | 11 (0.1%) |
| 7+ Person Households | 232 (2.1%) | 0 (0.0%) |
| Total | 8,900 (80.0%) | 2,230 (20.0%) |
Female Fertility in El Mirage
Fertility by Age in El Mirage
Average fertility rate in El Mirage is 51.0 births per 1,000 women. Women in the age bracket of 20 to 34 years have the highest fertility rate with 89.0 births per 1,000 women. Women in the age bracket of 20 to 34 years acount for 81.0% of all women with births.
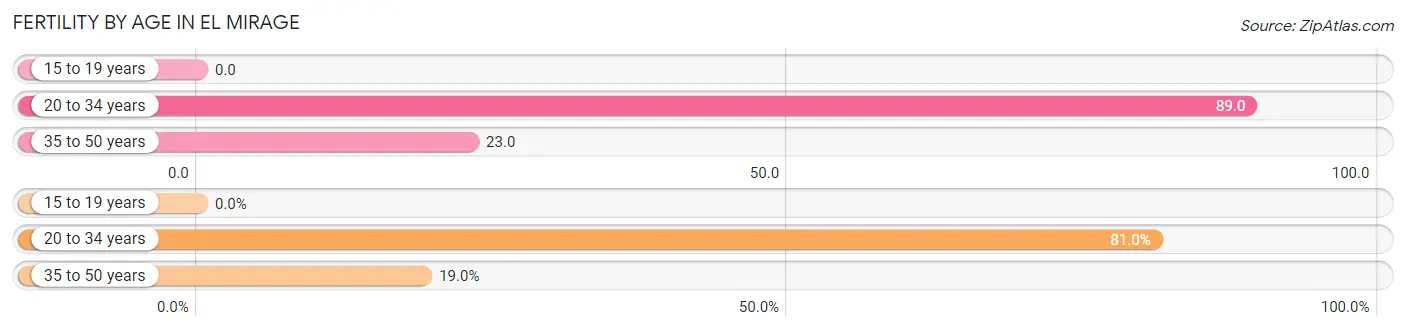
| Age Bracket | Women with Births | Births / 1,000 Women |
| 15 to 19 years | 0 (0.0%) | 0.0 |
| 20 to 34 years | 413 (81.0%) | 89.0 |
| 35 to 50 years | 97 (19.0%) | 23.0 |
| Total | 510 (100.0%) | 51.0 |
Fertility by Age by Marriage Status in El Mirage
59.8% of women with births (510) in El Mirage are married. The highest percentage of unmarried women with births falls into 20 to 34 years age bracket with 42.9% of them unmarried at the time of birth, while the lowest percentage of unmarried women with births belong to 35 to 50 years age bracket with 28.9% of them unmarried.
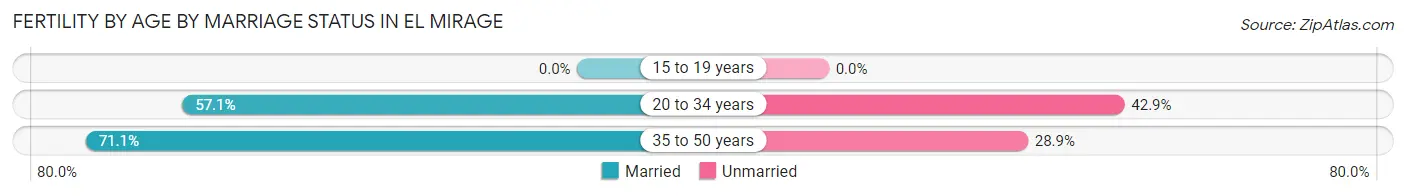
| Age Bracket | Married | Unmarried |
| 15 to 19 years | 0 (0.0%) | 0 (0.0%) |
| 20 to 34 years | 236 (57.1%) | 177 (42.9%) |
| 35 to 50 years | 69 (71.1%) | 28 (28.9%) |
| Total | 305 (59.8%) | 205 (40.2%) |
Fertility by Education in El Mirage
Average fertility rate in El Mirage is 51.0 births per 1,000 women. Women with the education attainment of graduate degree have the highest fertility rate of 108.0 births per 1,000 women, while women with the education attainment of less than high school have the lowest fertility at 18.0 births per 1,000 women. Women with the education attainment of college or associate's degree represent 42.0% of all women with births.
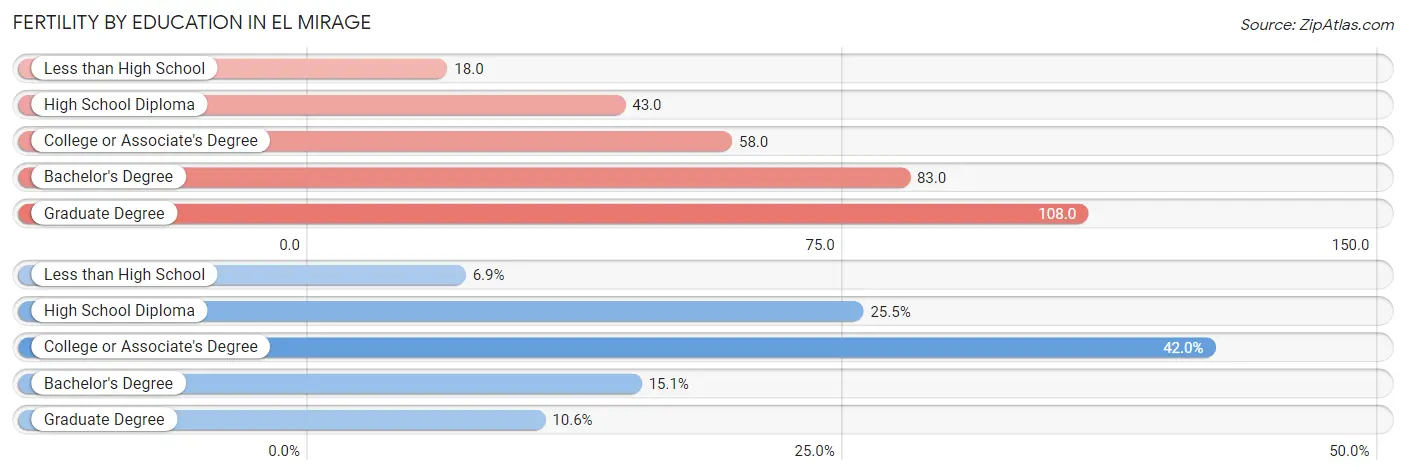
| Educational Attainment | Women with Births | Births / 1,000 Women |
| Less than High School | 35 (6.9%) | 18.0 |
| High School Diploma | 130 (25.5%) | 43.0 |
| College or Associate's Degree | 214 (42.0%) | 58.0 |
| Bachelor's Degree | 77 (15.1%) | 83.0 |
| Graduate Degree | 54 (10.6%) | 108.0 |
| Total | 510 (100.0%) | 51.0 |
Fertility by Education by Marriage Status in El Mirage
40.2% of women with births in El Mirage are unmarried. Women with the educational attainment of graduate degree are most likely to be married with 100.0% of them married at childbirth, while women with the educational attainment of less than high school are least likely to be married with 100.0% of them unmarried at childbirth.
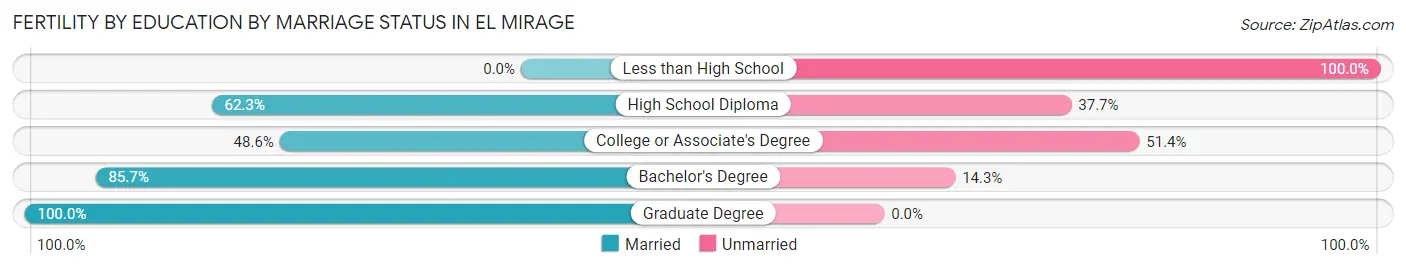
| Educational Attainment | Married | Unmarried |
| Less than High School | 0 (0.0%) | 35 (100.0%) |
| High School Diploma | 81 (62.3%) | 49 (37.7%) |
| College or Associate's Degree | 104 (48.6%) | 110 (51.4%) |
| Bachelor's Degree | 66 (85.7%) | 11 (14.3%) |
| Graduate Degree | 54 (100.0%) | 0 (0.0%) |
| Total | 305 (59.8%) | 205 (40.2%) |
Employment Characteristics in El Mirage
Employment by Class of Employer in El Mirage
Among the 17,117 employed individuals in El Mirage, private company employees (12,587 | 73.5%), local government employees (1,310 | 7.6%), and not-for-profit organizations (1,088 | 6.4%) make up the most common classes of employment.
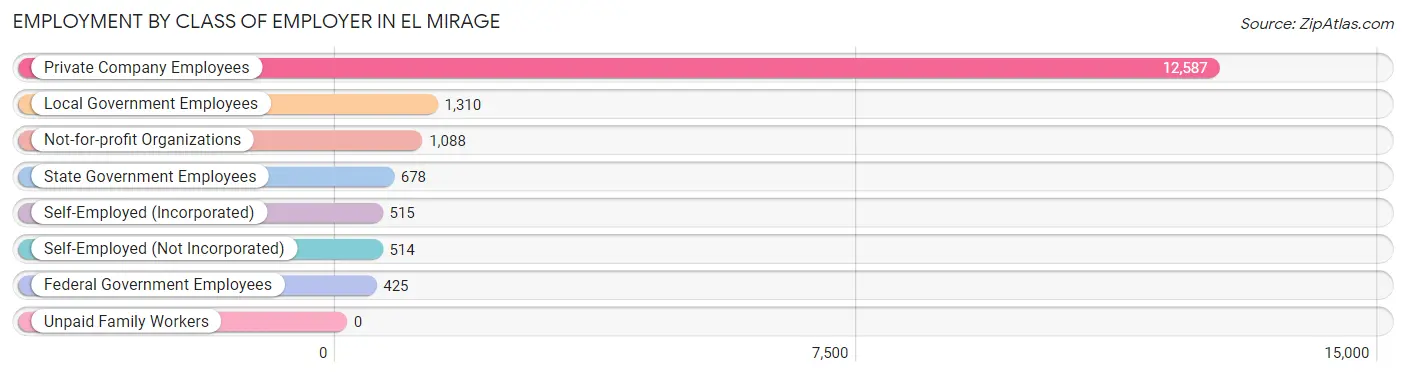
| Employer Class | # Employees | % Employees |
| Private Company Employees | 12,587 | 73.5% |
| Self-Employed (Incorporated) | 515 | 3.0% |
| Self-Employed (Not Incorporated) | 514 | 3.0% |
| Not-for-profit Organizations | 1,088 | 6.4% |
| Local Government Employees | 1,310 | 7.6% |
| State Government Employees | 678 | 4.0% |
| Federal Government Employees | 425 | 2.5% |
| Unpaid Family Workers | 0 | 0.0% |
| Total | 17,117 | 100.0% |
Employment Status by Age in El Mirage
According to the labor force statistics for El Mirage, out of the total population over 16 years of age (26,884), 68.6% or 18,442 individuals are in the labor force, with 5.9% or 1,088 of them unemployed. The age group with the highest labor force participation rate is 30 to 34 years, with 90.5% or 2,672 individuals in the labor force. Within the labor force, the 16 to 19 years age range has the highest percentage of unemployed individuals, with 13.0% or 126 of them being unemployed.
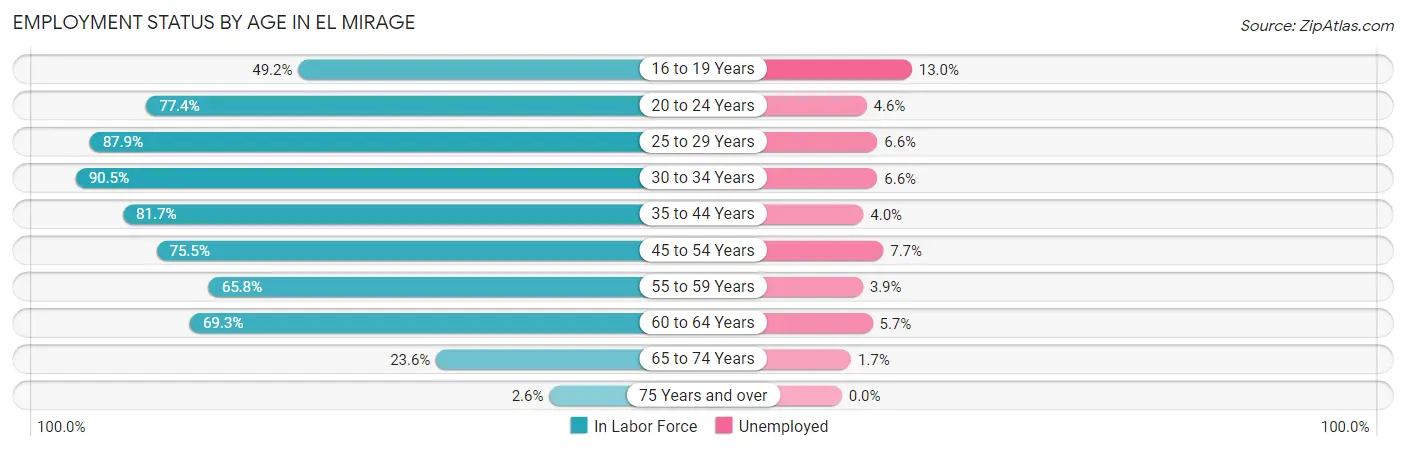
| Age Bracket | In Labor Force | Unemployed |
| 16 to 19 Years | 970 (49.2%) | 126 (13.0%) |
| 20 to 24 Years | 2,393 (77.4%) | 110 (4.6%) |
| 25 to 29 Years | 2,441 (87.9%) | 161 (6.6%) |
| 30 to 34 Years | 2,672 (90.5%) | 176 (6.6%) |
| 35 to 44 Years | 4,279 (81.7%) | 171 (4.0%) |
| 45 to 54 Years | 2,859 (75.5%) | 220 (7.7%) |
| 55 to 59 Years | 1,224 (65.8%) | 48 (3.9%) |
| 60 to 64 Years | 1,096 (69.3%) | 62 (5.7%) |
| 65 to 74 Years | 470 (23.6%) | 8 (1.7%) |
| 75 Years and over | 42 (2.6%) | 0 (0.0%) |
| Total | 18,442 (68.6%) | 1,088 (5.9%) |
Employment Status by Educational Attainment in El Mirage
According to labor force statistics for El Mirage, 80.1% of individuals (14,575) out of the total population between 25 and 64 years of age (18,196) are in the labor force, with 5.7% or 831 of them being unemployed. The group with the highest labor force participation rate are those with the educational attainment of college / associate degree, with 86.0% or 5,620 individuals in the labor force. Within the labor force, individuals with less than high school education have the highest percentage of unemployment, with 9.9% or 220 of them being unemployed.
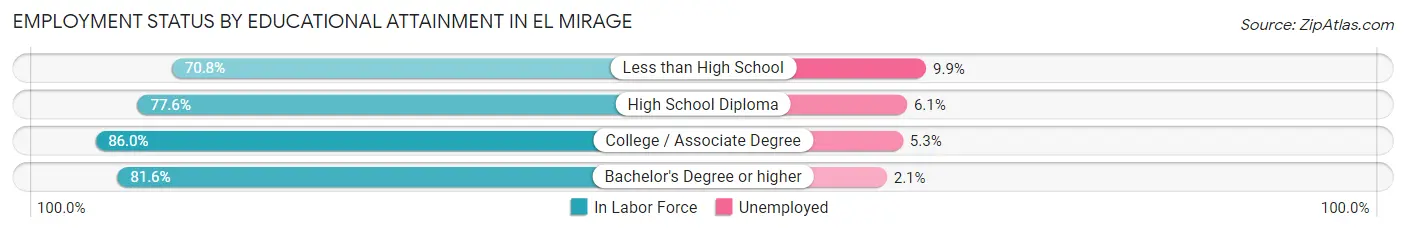
| Educational Attainment | In Labor Force | Unemployed |
| Less than High School | 2,220 (70.8%) | 310 (9.9%) |
| High School Diploma | 4,435 (77.6%) | 349 (6.1%) |
| College / Associate Degree | 5,620 (86.0%) | 346 (5.3%) |
| Bachelor's Degree or higher | 2,293 (81.6%) | 59 (2.1%) |
| Total | 14,575 (80.1%) | 1,037 (5.7%) |
Employment Occupations by Sex in El Mirage
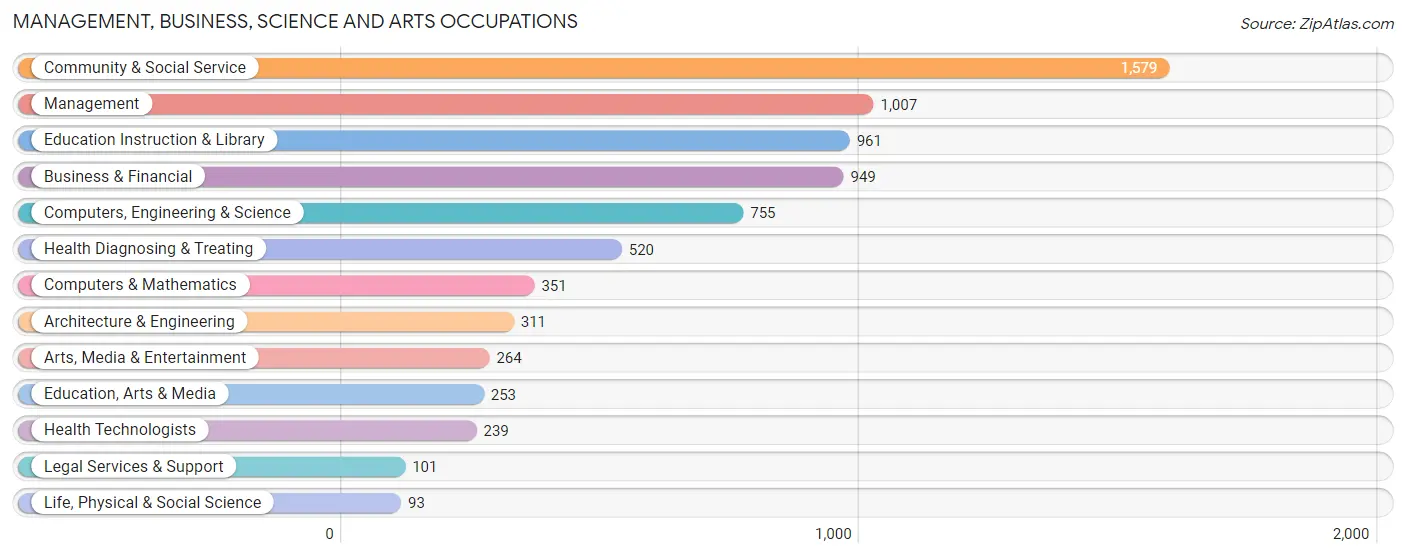
Management, Business, Science and Arts Occupations
The most common Management, Business, Science and Arts occupations in El Mirage are Community & Social Service (1,579 | 9.1%), Management (1,007 | 5.8%), Education Instruction & Library (961 | 5.6%), Business & Financial (949 | 5.5%), and Computers, Engineering & Science (755 | 4.4%).
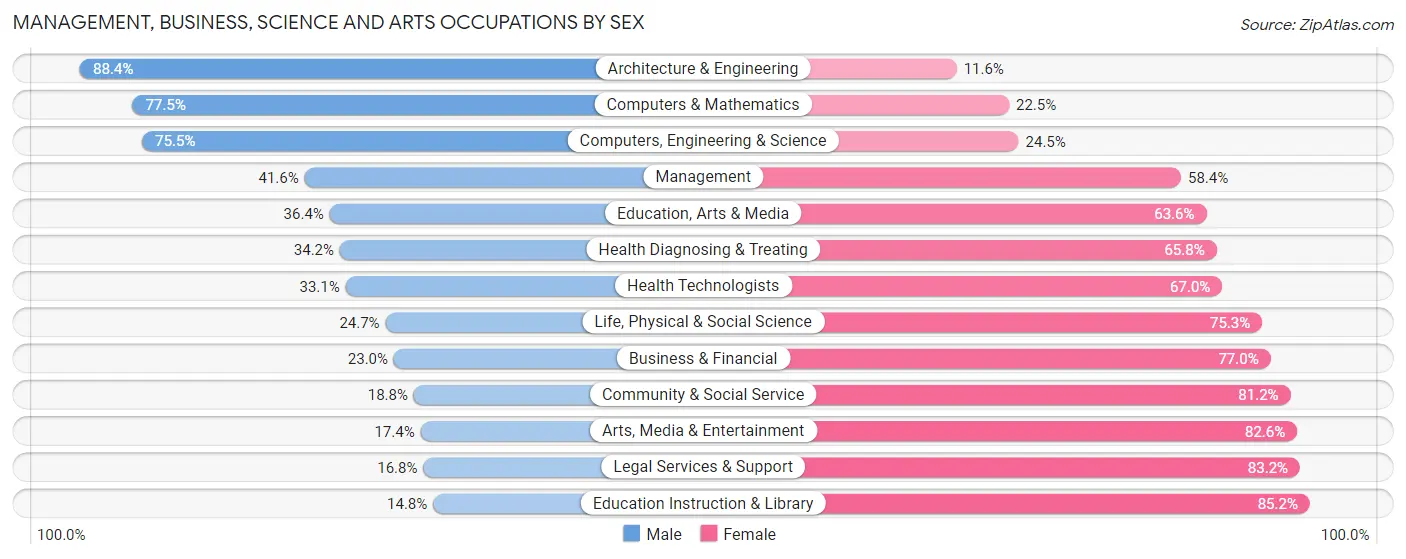
Management, Business, Science and Arts Occupations by Sex
Within the Management, Business, Science and Arts occupations in El Mirage, the most male-oriented occupations are Architecture & Engineering (88.4%), Computers & Mathematics (77.5%), and Computers, Engineering & Science (75.5%), while the most female-oriented occupations are Education Instruction & Library (85.2%), Legal Services & Support (83.2%), and Arts, Media & Entertainment (82.6%).
| Occupation | Male | Female |
| Management | 419 (41.6%) | 588 (58.4%) |
| Business & Financial | 218 (23.0%) | 731 (77.0%) |
| Computers, Engineering & Science | 570 (75.5%) | 185 (24.5%) |
| Computers & Mathematics | 272 (77.5%) | 79 (22.5%) |
| Architecture & Engineering | 275 (88.4%) | 36 (11.6%) |
| Life, Physical & Social Science | 23 (24.7%) | 70 (75.3%) |
| Community & Social Service | 297 (18.8%) | 1,282 (81.2%) |
| Education, Arts & Media | 92 (36.4%) | 161 (63.6%) |
| Legal Services & Support | 17 (16.8%) | 84 (83.2%) |
| Education Instruction & Library | 142 (14.8%) | 819 (85.2%) |
| Arts, Media & Entertainment | 46 (17.4%) | 218 (82.6%) |
| Health Diagnosing & Treating | 178 (34.2%) | 342 (65.8%) |
| Health Technologists | 79 (33.1%) | 160 (66.9%) |
| Total (Category) | 1,682 (35.0%) | 3,128 (65.0%) |
| Total (Overall) | 8,880 (51.4%) | 8,403 (48.6%) |
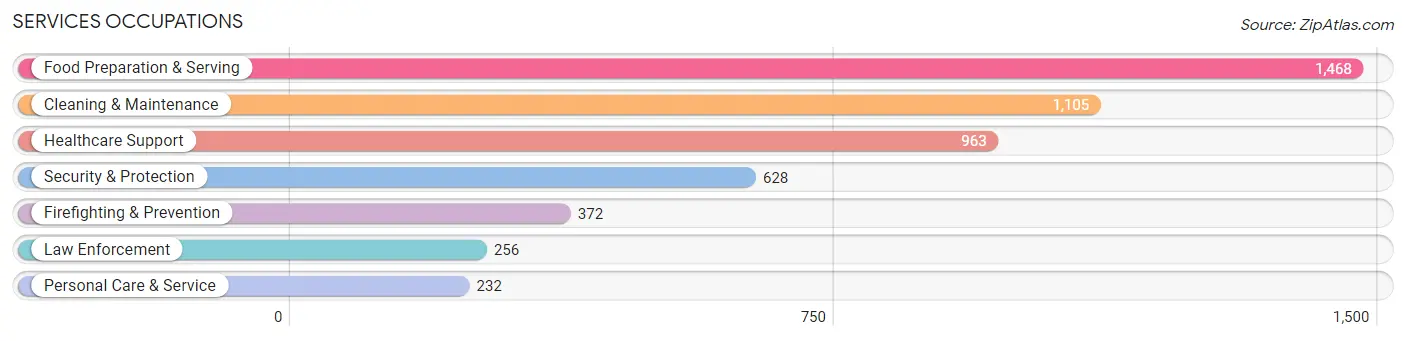
Services Occupations
The most common Services occupations in El Mirage are Food Preparation & Serving (1,468 | 8.5%), Cleaning & Maintenance (1,105 | 6.4%), Healthcare Support (963 | 5.6%), Security & Protection (628 | 3.6%), and Firefighting & Prevention (372 | 2.1%).
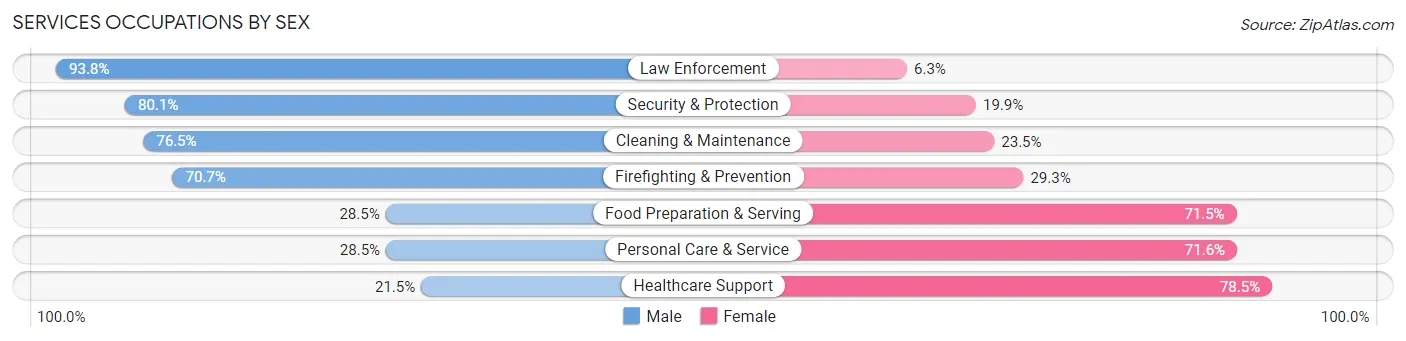
Services Occupations by Sex
Within the Services occupations in El Mirage, the most male-oriented occupations are Law Enforcement (93.8%), Security & Protection (80.1%), and Cleaning & Maintenance (76.5%), while the most female-oriented occupations are Healthcare Support (78.5%), Personal Care & Service (71.6%), and Food Preparation & Serving (71.5%).
| Occupation | Male | Female |
| Healthcare Support | 207 (21.5%) | 756 (78.5%) |
| Security & Protection | 503 (80.1%) | 125 (19.9%) |
| Firefighting & Prevention | 263 (70.7%) | 109 (29.3%) |
| Law Enforcement | 240 (93.8%) | 16 (6.2%) |
| Food Preparation & Serving | 419 (28.5%) | 1,049 (71.5%) |
| Cleaning & Maintenance | 845 (76.5%) | 260 (23.5%) |
| Personal Care & Service | 66 (28.4%) | 166 (71.6%) |
| Total (Category) | 2,040 (46.4%) | 2,356 (53.6%) |
| Total (Overall) | 8,880 (51.4%) | 8,403 (48.6%) |
Sales and Office Occupations
The most common Sales and Office occupations in El Mirage are Office & Administration (2,058 | 11.9%), and Sales & Related (1,915 | 11.1%).

Sales and Office Occupations by Sex
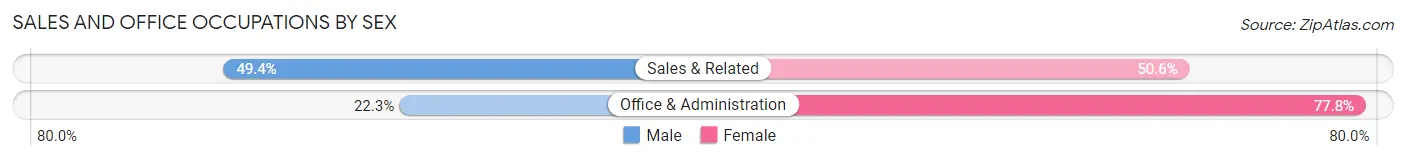
| Occupation | Male | Female |
| Sales & Related | 946 (49.4%) | 969 (50.6%) |
| Office & Administration | 458 (22.3%) | 1,600 (77.7%) |
| Total (Category) | 1,404 (35.3%) | 2,569 (64.7%) |
| Total (Overall) | 8,880 (51.4%) | 8,403 (48.6%) |
Natural Resources, Construction and Maintenance Occupations
The most common Natural Resources, Construction and Maintenance occupations in El Mirage are Construction & Extraction (1,119 | 6.5%), Installation, Maintenance & Repair (685 | 4.0%), and Farming, Fishing & Forestry (24 | 0.1%).

Natural Resources, Construction and Maintenance Occupations by Sex
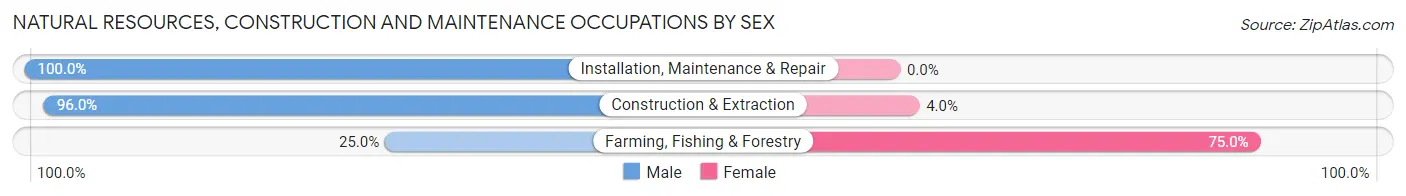
| Occupation | Male | Female |
| Farming, Fishing & Forestry | 6 (25.0%) | 18 (75.0%) |
| Construction & Extraction | 1,074 (96.0%) | 45 (4.0%) |
| Installation, Maintenance & Repair | 685 (100.0%) | 0 (0.0%) |
| Total (Category) | 1,765 (96.6%) | 63 (3.5%) |
| Total (Overall) | 8,880 (51.4%) | 8,403 (48.6%) |
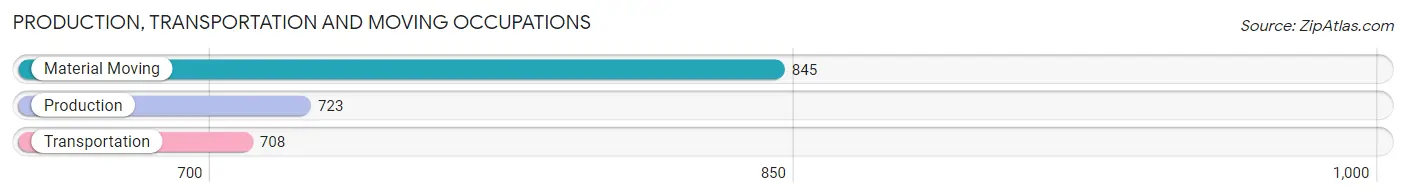
Production, Transportation and Moving Occupations
The most common Production, Transportation and Moving occupations in El Mirage are Material Moving (845 | 4.9%), Production (723 | 4.2%), and Transportation (708 | 4.1%).
Production, Transportation and Moving Occupations by Sex
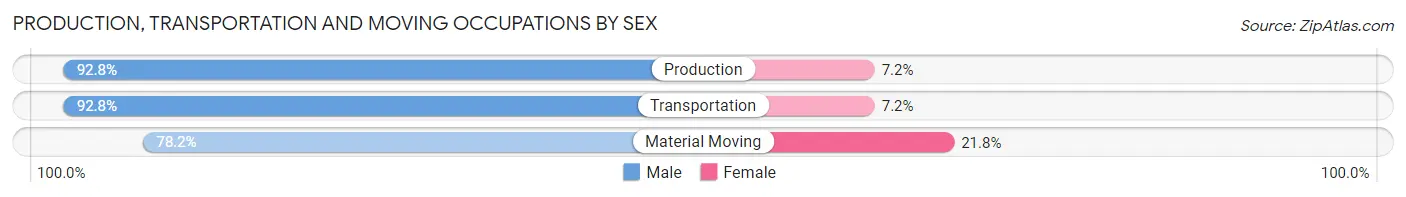
| Occupation | Male | Female |
| Production | 671 (92.8%) | 52 (7.2%) |
| Transportation | 657 (92.8%) | 51 (7.2%) |
| Material Moving | 661 (78.2%) | 184 (21.8%) |
| Total (Category) | 1,989 (87.4%) | 287 (12.6%) |
| Total (Overall) | 8,880 (51.4%) | 8,403 (48.6%) |
Employment Industries by Sex in El Mirage
Employment Industries in El Mirage
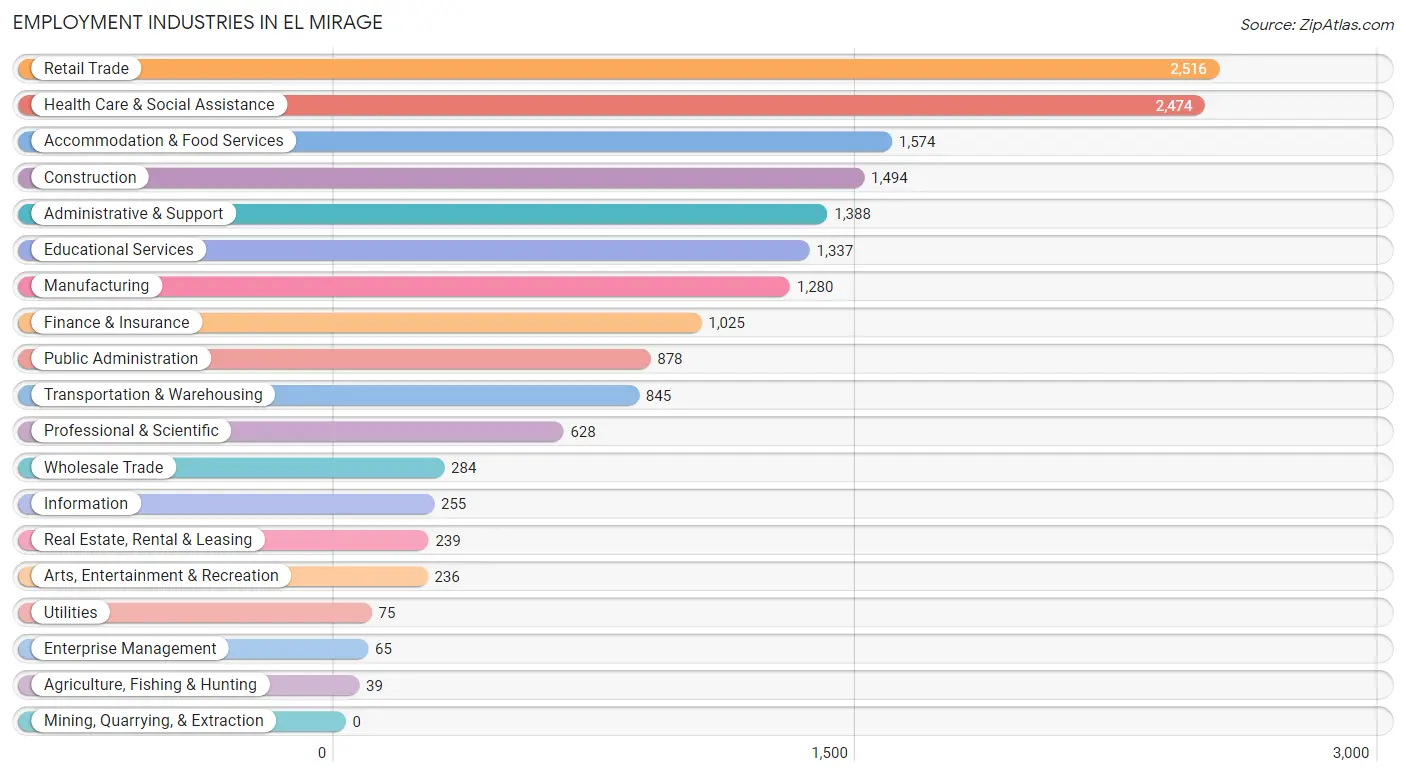
The major employment industries in El Mirage include Retail Trade (2,516 | 14.6%), Health Care & Social Assistance (2,474 | 14.3%), Accommodation & Food Services (1,574 | 9.1%), Construction (1,494 | 8.6%), and Administrative & Support (1,388 | 8.0%).
Employment Industries by Sex in El Mirage
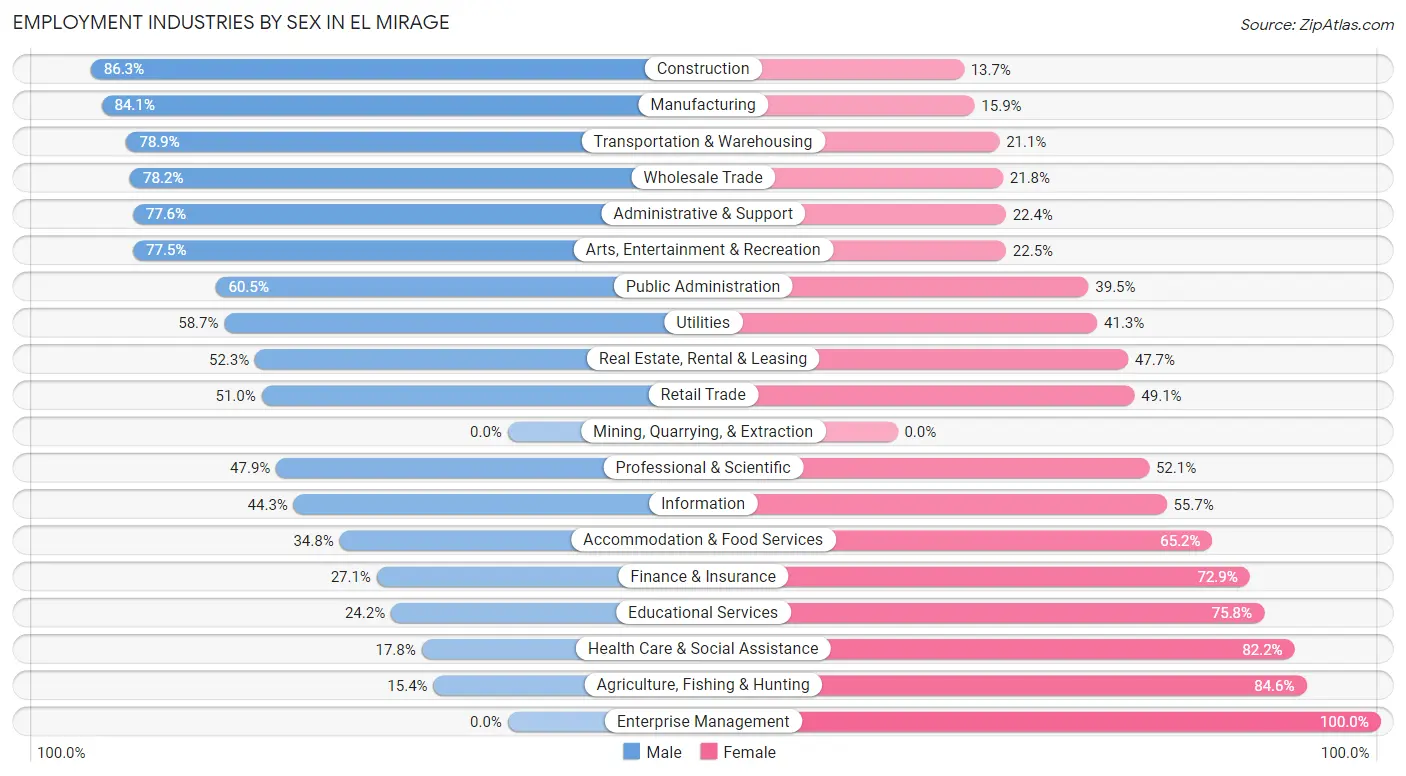
The El Mirage industries that see more men than women are Construction (86.3%), Manufacturing (84.1%), and Transportation & Warehousing (78.9%), whereas the industries that tend to have a higher number of women are Enterprise Management (100.0%), Agriculture, Fishing & Hunting (84.6%), and Health Care & Social Assistance (82.2%).
| Industry | Male | Female |
| Agriculture, Fishing & Hunting | 6 (15.4%) | 33 (84.6%) |
| Mining, Quarrying, & Extraction | 0 (0.0%) | 0 (0.0%) |
| Construction | 1,289 (86.3%) | 205 (13.7%) |
| Manufacturing | 1,076 (84.1%) | 204 (15.9%) |
| Wholesale Trade | 222 (78.2%) | 62 (21.8%) |
| Retail Trade | 1,282 (50.9%) | 1,234 (49.0%) |
| Transportation & Warehousing | 667 (78.9%) | 178 (21.1%) |
| Utilities | 44 (58.7%) | 31 (41.3%) |
| Information | 113 (44.3%) | 142 (55.7%) |
| Finance & Insurance | 278 (27.1%) | 747 (72.9%) |
| Real Estate, Rental & Leasing | 125 (52.3%) | 114 (47.7%) |
| Professional & Scientific | 301 (47.9%) | 327 (52.1%) |
| Enterprise Management | 0 (0.0%) | 65 (100.0%) |
| Administrative & Support | 1,077 (77.6%) | 311 (22.4%) |
| Educational Services | 323 (24.2%) | 1,014 (75.8%) |
| Health Care & Social Assistance | 441 (17.8%) | 2,033 (82.2%) |
| Arts, Entertainment & Recreation | 183 (77.5%) | 53 (22.5%) |
| Accommodation & Food Services | 548 (34.8%) | 1,026 (65.2%) |
| Public Administration | 531 (60.5%) | 347 (39.5%) |
| Total | 8,880 (51.4%) | 8,403 (48.6%) |
Education in El Mirage
School Enrollment in El Mirage
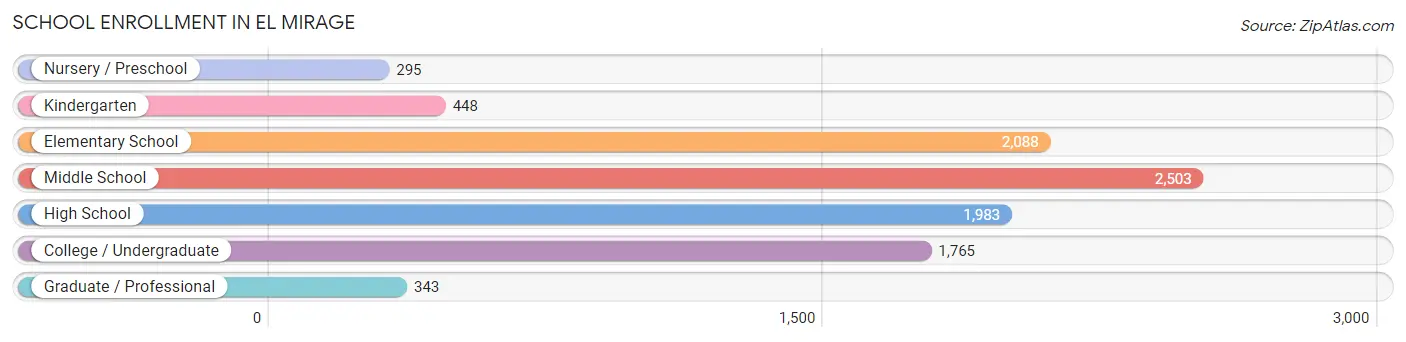
The most common levels of schooling among the 9,425 students in El Mirage are middle school (2,503 | 26.6%), elementary school (2,088 | 22.2%), and high school (1,983 | 21.0%).
| School Level | # Students | % Students |
| Nursery / Preschool | 295 | 3.1% |
| Kindergarten | 448 | 4.8% |
| Elementary School | 2,088 | 22.2% |
| Middle School | 2,503 | 26.6% |
| High School | 1,983 | 21.0% |
| College / Undergraduate | 1,765 | 18.7% |
| Graduate / Professional | 343 | 3.6% |
| Total | 9,425 | 100.0% |
School Enrollment by Age by Funding Source in El Mirage
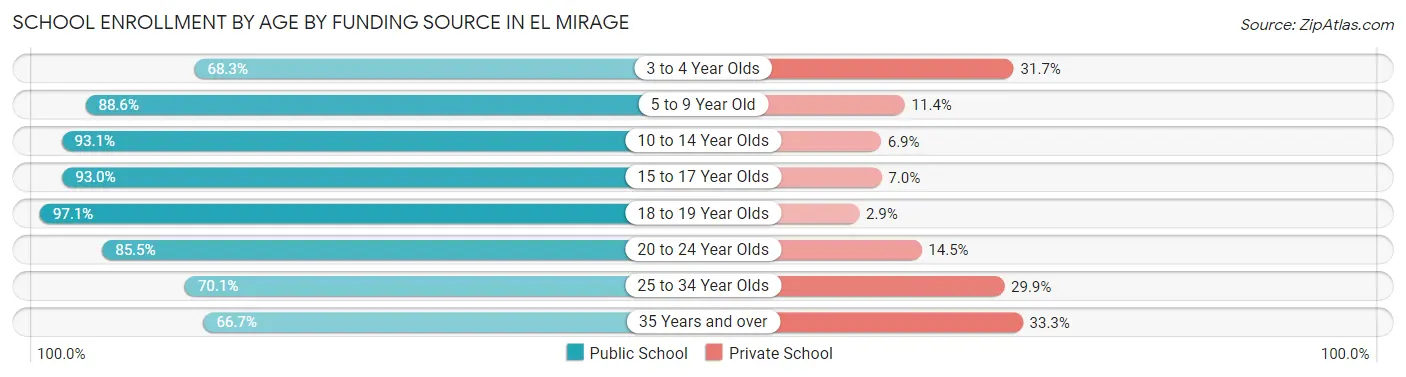
Out of a total of 9,425 students who are enrolled in schools in El Mirage, 1,112 (11.8%) attend a private institution, while the remaining 8,313 (88.2%) are enrolled in public schools. The age group of 35 years and over has the highest likelihood of being enrolled in private schools, with 113 (33.3% in the age bracket) enrolled. Conversely, the age group of 18 to 19 year olds has the lowest likelihood of being enrolled in a private school, with 475 (97.1% in the age bracket) attending a public institution.
| Age Bracket | Public School | Private School |
| 3 to 4 Year Olds | 177 (68.3%) | 82 (31.7%) |
| 5 to 9 Year Old | 2,217 (88.6%) | 284 (11.4%) |
| 10 to 14 Year Olds | 2,696 (93.1%) | 200 (6.9%) |
| 15 to 17 Year Olds | 1,335 (93.0%) | 101 (7.0%) |
| 18 to 19 Year Olds | 475 (97.1%) | 14 (2.9%) |
| 20 to 24 Year Olds | 709 (85.5%) | 120 (14.5%) |
| 25 to 34 Year Olds | 474 (70.1%) | 202 (29.9%) |
| 35 Years and over | 226 (66.7%) | 113 (33.3%) |
| Total | 8,313 (88.2%) | 1,112 (11.8%) |
Educational Attainment by Field of Study in El Mirage
Business (748 | 20.8%), education (507 | 14.1%), arts & humanities (481 | 13.4%), science & technology (477 | 13.3%), and communications (234 | 6.5%) are the most common fields of study among 3,599 individuals in El Mirage who have obtained a bachelor's degree or higher.
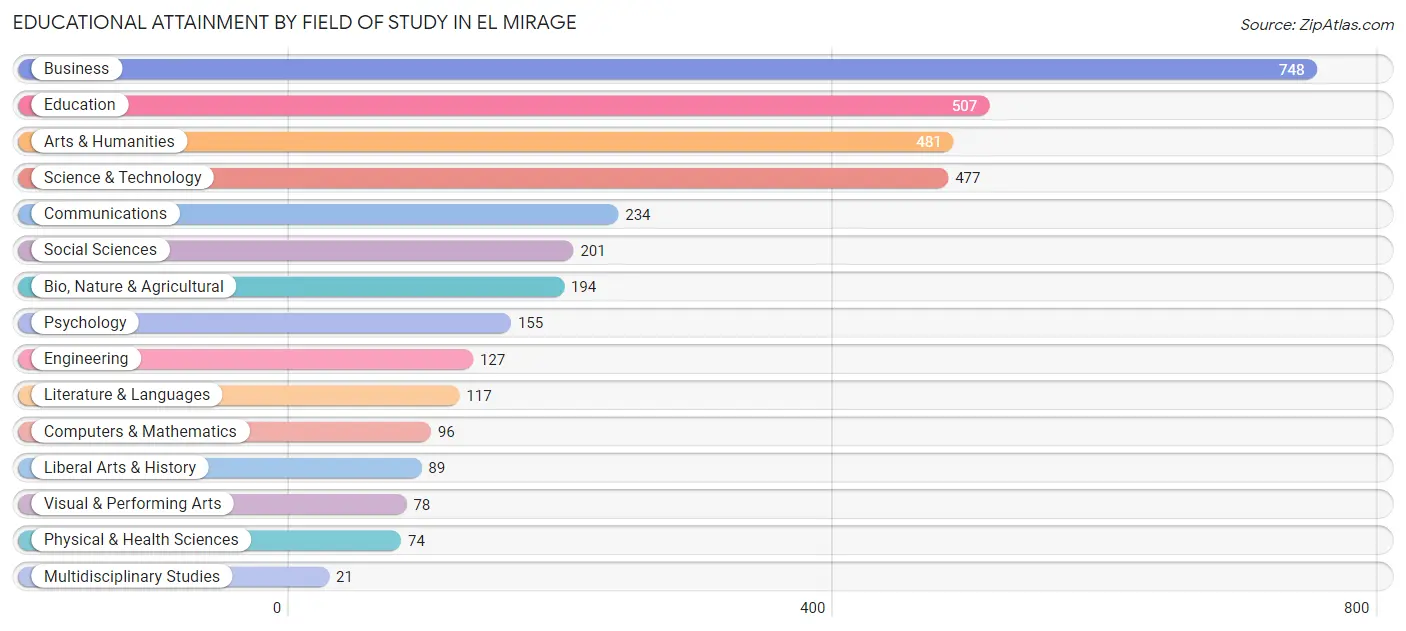
| Field of Study | # Graduates | % Graduates |
| Computers & Mathematics | 96 | 2.7% |
| Bio, Nature & Agricultural | 194 | 5.4% |
| Physical & Health Sciences | 74 | 2.1% |
| Psychology | 155 | 4.3% |
| Social Sciences | 201 | 5.6% |
| Engineering | 127 | 3.5% |
| Multidisciplinary Studies | 21 | 0.6% |
| Science & Technology | 477 | 13.3% |
| Business | 748 | 20.8% |
| Education | 507 | 14.1% |
| Literature & Languages | 117 | 3.3% |
| Liberal Arts & History | 89 | 2.5% |
| Visual & Performing Arts | 78 | 2.2% |
| Communications | 234 | 6.5% |
| Arts & Humanities | 481 | 13.4% |
| Total | 3,599 | 100.0% |
Transportation & Commute in El Mirage
Vehicle Availability by Sex in El Mirage
The most prevalent vehicle ownership categories in El Mirage are males with 2 vehicles (3,648, accounting for 41.0%) and females with 2 vehicles (3,455, making up 44.4%).
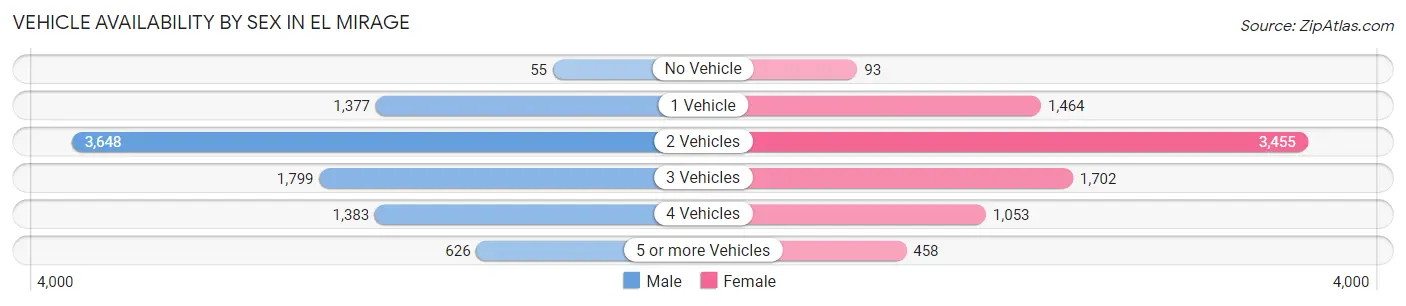
| Vehicles Available | Male | Female |
| No Vehicle | 55 (0.6%) | 93 (1.1%) |
| 1 Vehicle | 1,377 (15.5%) | 1,464 (17.8%) |
| 2 Vehicles | 3,648 (41.0%) | 3,455 (42.0%) |
| 3 Vehicles | 1,799 (20.2%) | 1,702 (20.7%) |
| 4 Vehicles | 1,383 (15.6%) | 1,053 (12.8%) |
| 5 or more Vehicles | 626 (7.0%) | 458 (5.6%) |
| Total | 8,888 (100.0%) | 8,225 (100.0%) |
Commute Time in El Mirage
The most frequently occuring commute durations in El Mirage are 30 to 34 minutes (2,981 commuters, 19.7%), 15 to 19 minutes (2,122 commuters, 14.0%), and 45 to 59 minutes (1,936 commuters, 12.8%).
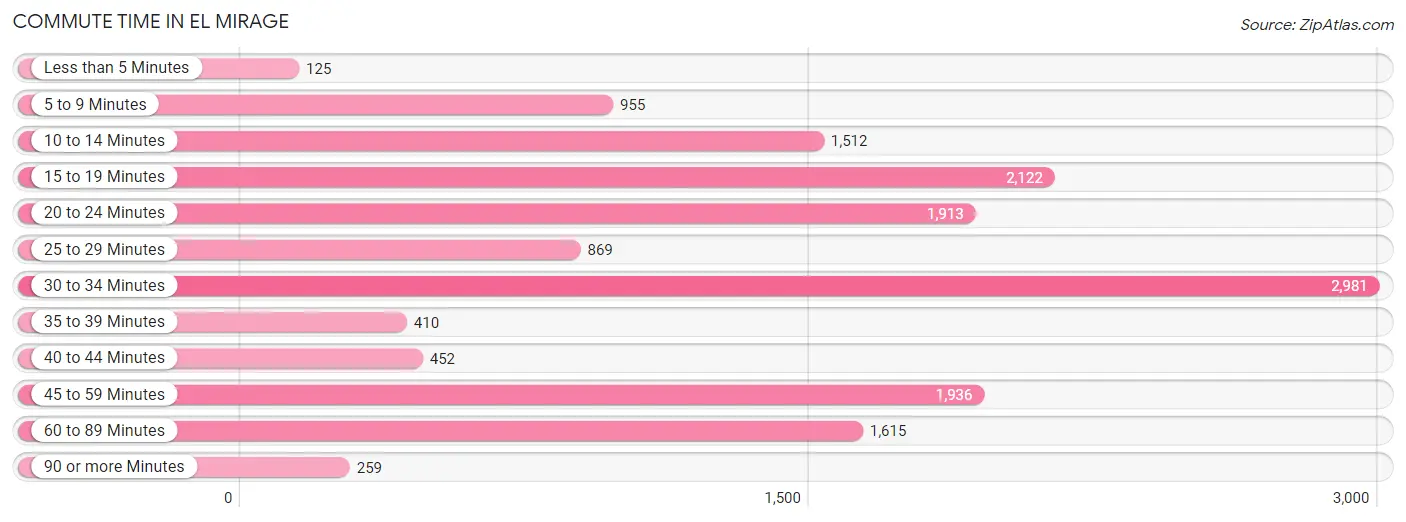
| Commute Time | # Commuters | % Commuters |
| Less than 5 Minutes | 125 | 0.8% |
| 5 to 9 Minutes | 955 | 6.3% |
| 10 to 14 Minutes | 1,512 | 10.0% |
| 15 to 19 Minutes | 2,122 | 14.0% |
| 20 to 24 Minutes | 1,913 | 12.6% |
| 25 to 29 Minutes | 869 | 5.7% |
| 30 to 34 Minutes | 2,981 | 19.7% |
| 35 to 39 Minutes | 410 | 2.7% |
| 40 to 44 Minutes | 452 | 3.0% |
| 45 to 59 Minutes | 1,936 | 12.8% |
| 60 to 89 Minutes | 1,615 | 10.7% |
| 90 or more Minutes | 259 | 1.7% |
Commute Time by Sex in El Mirage
The most common commute times in El Mirage are 30 to 34 minutes (1,737 commuters, 21.2%) for males and 30 to 34 minutes (1,244 commuters, 17.9%) for females.
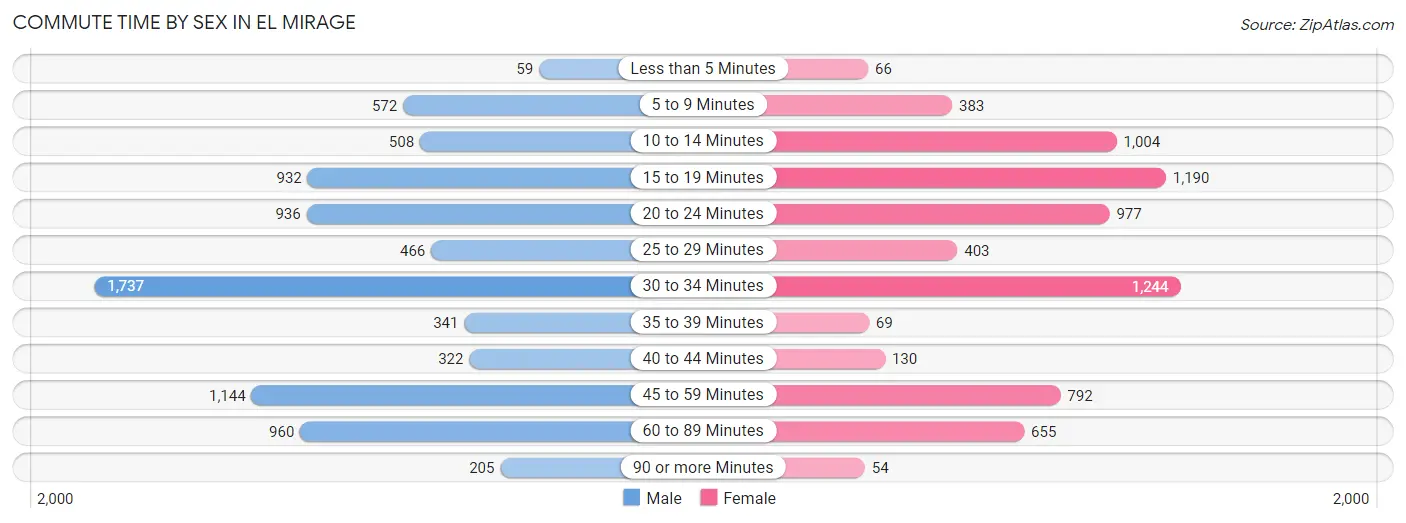
| Commute Time | Male | Female |
| Less than 5 Minutes | 59 (0.7%) | 66 (0.9%) |
| 5 to 9 Minutes | 572 (7.0%) | 383 (5.5%) |
| 10 to 14 Minutes | 508 (6.2%) | 1,004 (14.4%) |
| 15 to 19 Minutes | 932 (11.4%) | 1,190 (17.1%) |
| 20 to 24 Minutes | 936 (11.4%) | 977 (14.0%) |
| 25 to 29 Minutes | 466 (5.7%) | 403 (5.8%) |
| 30 to 34 Minutes | 1,737 (21.2%) | 1,244 (17.9%) |
| 35 to 39 Minutes | 341 (4.2%) | 69 (1.0%) |
| 40 to 44 Minutes | 322 (3.9%) | 130 (1.9%) |
| 45 to 59 Minutes | 1,144 (14.0%) | 792 (11.4%) |
| 60 to 89 Minutes | 960 (11.7%) | 655 (9.4%) |
| 90 or more Minutes | 205 (2.5%) | 54 (0.8%) |
Time of Departure to Work by Sex in El Mirage
The most frequent times of departure to work in El Mirage are 12:00 AM to 4:59 AM (1,430, 17.5%) for males and 7:00 AM to 7:29 AM (1,254, 18.0%) for females.
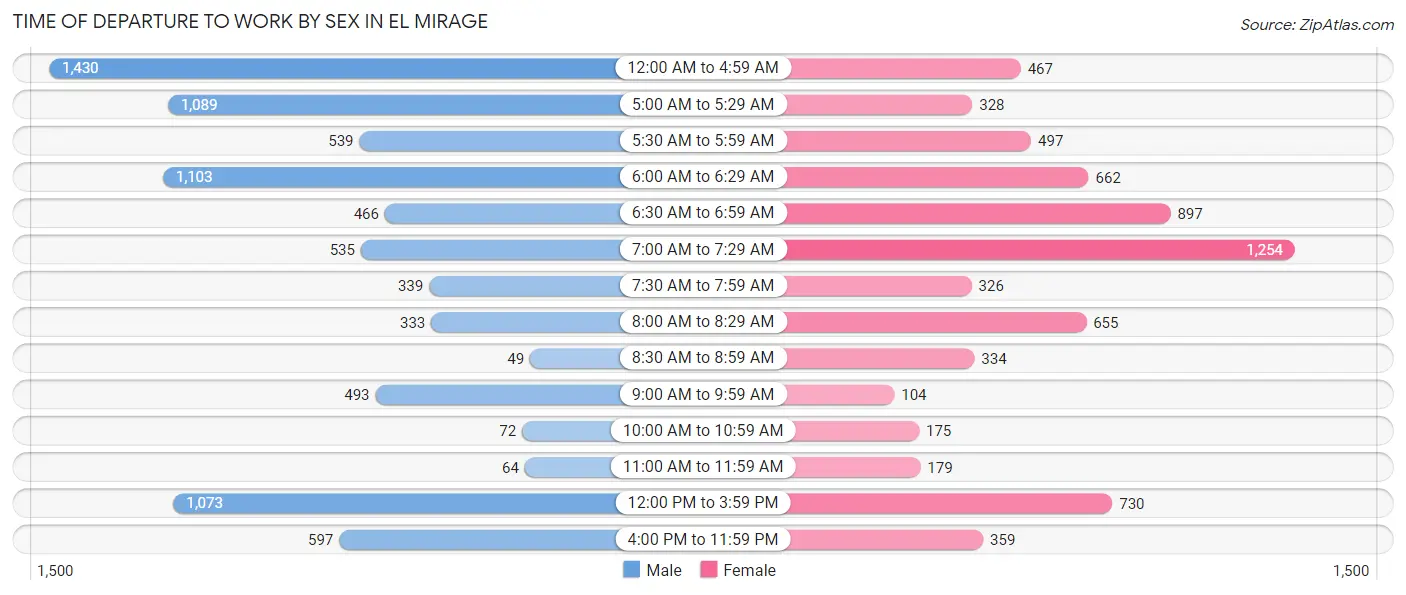
| Time of Departure | Male | Female |
| 12:00 AM to 4:59 AM | 1,430 (17.5%) | 467 (6.7%) |
| 5:00 AM to 5:29 AM | 1,089 (13.3%) | 328 (4.7%) |
| 5:30 AM to 5:59 AM | 539 (6.6%) | 497 (7.1%) |
| 6:00 AM to 6:29 AM | 1,103 (13.5%) | 662 (9.5%) |
| 6:30 AM to 6:59 AM | 466 (5.7%) | 897 (12.9%) |
| 7:00 AM to 7:29 AM | 535 (6.5%) | 1,254 (18.0%) |
| 7:30 AM to 7:59 AM | 339 (4.1%) | 326 (4.7%) |
| 8:00 AM to 8:29 AM | 333 (4.1%) | 655 (9.4%) |
| 8:30 AM to 8:59 AM | 49 (0.6%) | 334 (4.8%) |
| 9:00 AM to 9:59 AM | 493 (6.0%) | 104 (1.5%) |
| 10:00 AM to 10:59 AM | 72 (0.9%) | 175 (2.5%) |
| 11:00 AM to 11:59 AM | 64 (0.8%) | 179 (2.6%) |
| 12:00 PM to 3:59 PM | 1,073 (13.1%) | 730 (10.5%) |
| 4:00 PM to 11:59 PM | 597 (7.3%) | 359 (5.1%) |
| Total | 8,182 (100.0%) | 6,967 (100.0%) |
Housing Occupancy in El Mirage
Occupancy by Ownership in El Mirage
Of the total 11,130 dwellings in El Mirage, owner-occupied units account for 7,635 (68.6%), while renter-occupied units make up 3,495 (31.4%).
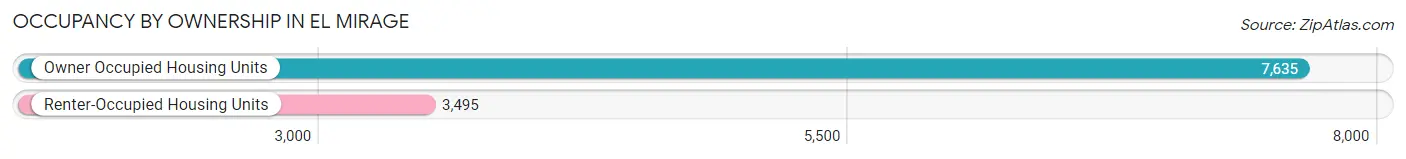
| Occupancy | # Housing Units | % Housing Units |
| Owner Occupied Housing Units | 7,635 | 68.6% |
| Renter-Occupied Housing Units | 3,495 | 31.4% |
| Total Occupied Housing Units | 11,130 | 100.0% |
Occupancy by Household Size in El Mirage
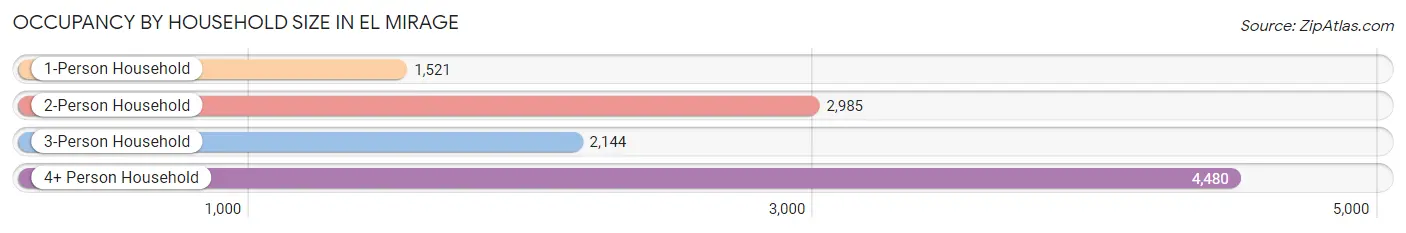
| Household Size | # Housing Units | % Housing Units |
| 1-Person Household | 1,521 | 13.7% |
| 2-Person Household | 2,985 | 26.8% |
| 3-Person Household | 2,144 | 19.3% |
| 4+ Person Household | 4,480 | 40.3% |
| Total Housing Units | 11,130 | 100.0% |
Occupancy by Ownership by Household Size in El Mirage
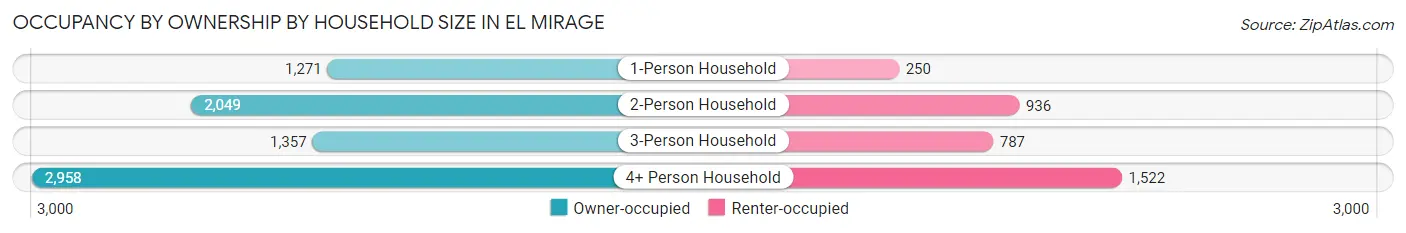
| Household Size | Owner-occupied | Renter-occupied |
| 1-Person Household | 1,271 (83.6%) | 250 (16.4%) |
| 2-Person Household | 2,049 (68.6%) | 936 (31.4%) |
| 3-Person Household | 1,357 (63.3%) | 787 (36.7%) |
| 4+ Person Household | 2,958 (66.0%) | 1,522 (34.0%) |
| Total Housing Units | 7,635 (68.6%) | 3,495 (31.4%) |
Occupancy by Educational Attainment in El Mirage
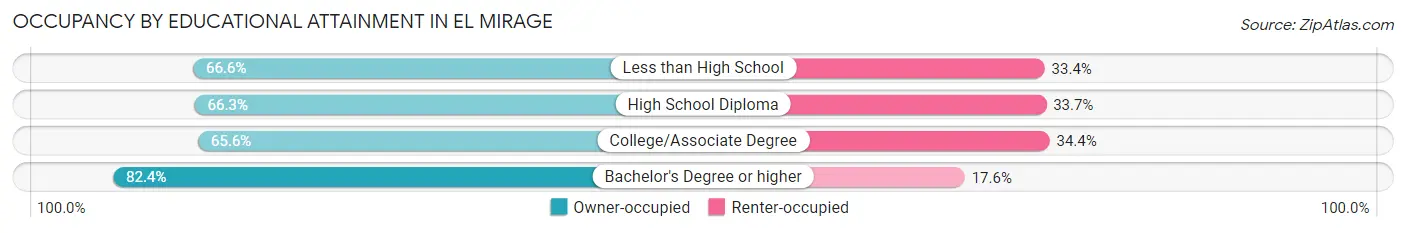
| Household Size | Owner-occupied | Renter-occupied |
| Less than High School | 1,140 (66.6%) | 572 (33.4%) |
| High School Diploma | 2,204 (66.3%) | 1,121 (33.7%) |
| College/Associate Degree | 2,859 (65.6%) | 1,497 (34.4%) |
| Bachelor's Degree or higher | 1,432 (82.4%) | 305 (17.6%) |
Occupancy by Age of Householder in El Mirage
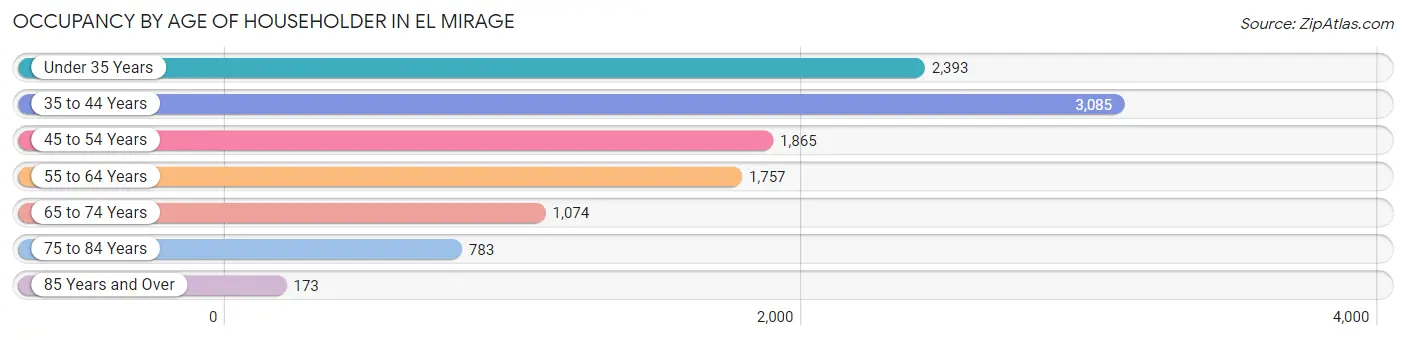
| Age Bracket | # Households | % Households |
| Under 35 Years | 2,393 | 21.5% |
| 35 to 44 Years | 3,085 | 27.7% |
| 45 to 54 Years | 1,865 | 16.8% |
| 55 to 64 Years | 1,757 | 15.8% |
| 65 to 74 Years | 1,074 | 9.7% |
| 75 to 84 Years | 783 | 7.0% |
| 85 Years and Over | 173 | 1.5% |
| Total | 11,130 | 100.0% |
Housing Finances in El Mirage
Median Income by Occupancy in El Mirage
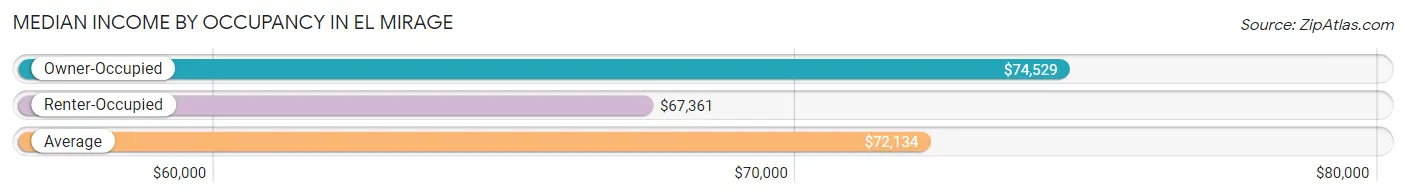
| Occupancy Type | # Households | Median Income |
| Owner-Occupied | 7,635 (68.6%) | $74,529 |
| Renter-Occupied | 3,495 (31.4%) | $67,361 |
| Average | 11,130 (100.0%) | $72,134 |
Occupancy by Householder Income Bracket in El Mirage
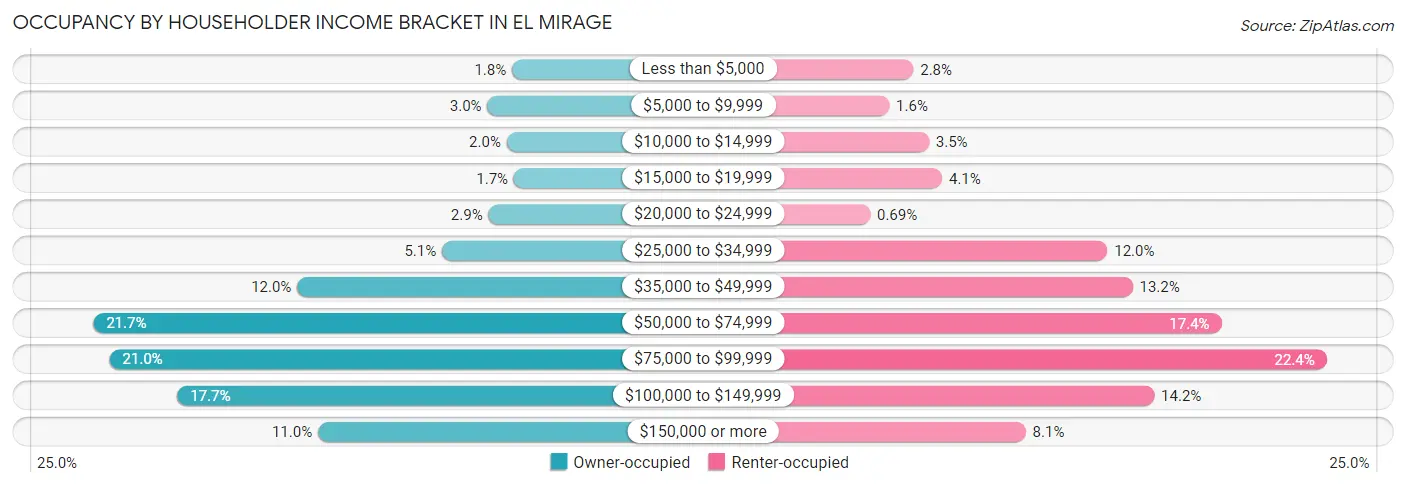
| Income Bracket | Owner-occupied | Renter-occupied |
| Less than $5,000 | 137 (1.8%) | 96 (2.8%) |
| $5,000 to $9,999 | 226 (3.0%) | 56 (1.6%) |
| $10,000 to $14,999 | 156 (2.0%) | 122 (3.5%) |
| $15,000 to $19,999 | 130 (1.7%) | 144 (4.1%) |
| $20,000 to $24,999 | 222 (2.9%) | 24 (0.7%) |
| $25,000 to $34,999 | 391 (5.1%) | 419 (12.0%) |
| $35,000 to $49,999 | 918 (12.0%) | 461 (13.2%) |
| $50,000 to $74,999 | 1,659 (21.7%) | 609 (17.4%) |
| $75,000 to $99,999 | 1,600 (21.0%) | 784 (22.4%) |
| $100,000 to $149,999 | 1,354 (17.7%) | 497 (14.2%) |
| $150,000 or more | 842 (11.0%) | 283 (8.1%) |
| Total | 7,635 (100.0%) | 3,495 (100.0%) |
Monthly Housing Cost Tiers in El Mirage
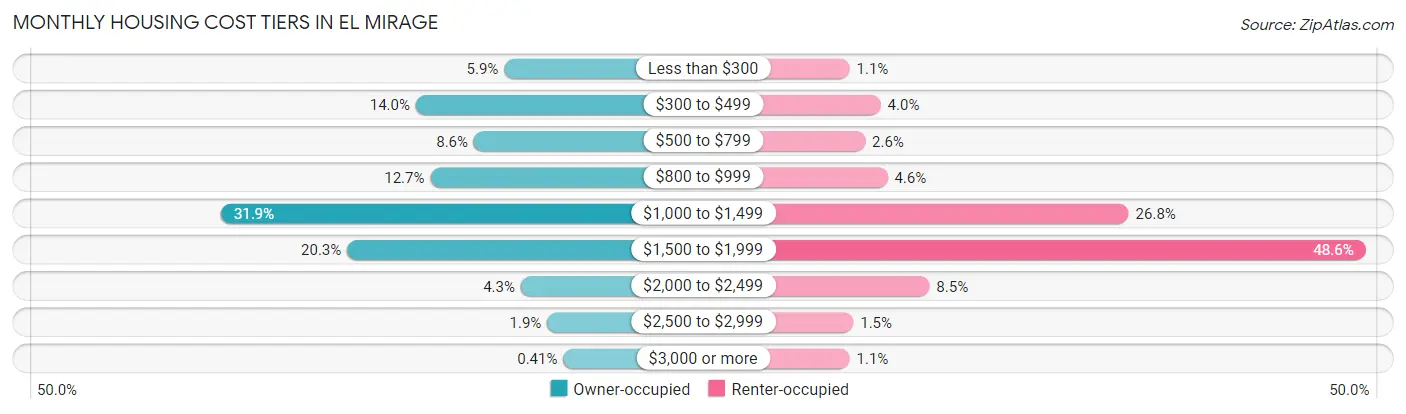
| Monthly Cost | Owner-occupied | Renter-occupied |
| Less than $300 | 447 (5.9%) | 39 (1.1%) |
| $300 to $499 | 1,068 (14.0%) | 139 (4.0%) |
| $500 to $799 | 660 (8.6%) | 89 (2.5%) |
| $800 to $999 | 966 (12.7%) | 161 (4.6%) |
| $1,000 to $1,499 | 2,438 (31.9%) | 937 (26.8%) |
| $1,500 to $1,999 | 1,551 (20.3%) | 1,699 (48.6%) |
| $2,000 to $2,499 | 330 (4.3%) | 296 (8.5%) |
| $2,500 to $2,999 | 144 (1.9%) | 51 (1.5%) |
| $3,000 or more | 31 (0.4%) | 39 (1.1%) |
| Total | 7,635 (100.0%) | 3,495 (100.0%) |
Physical Housing Characteristics in El Mirage
Housing Structures in El Mirage
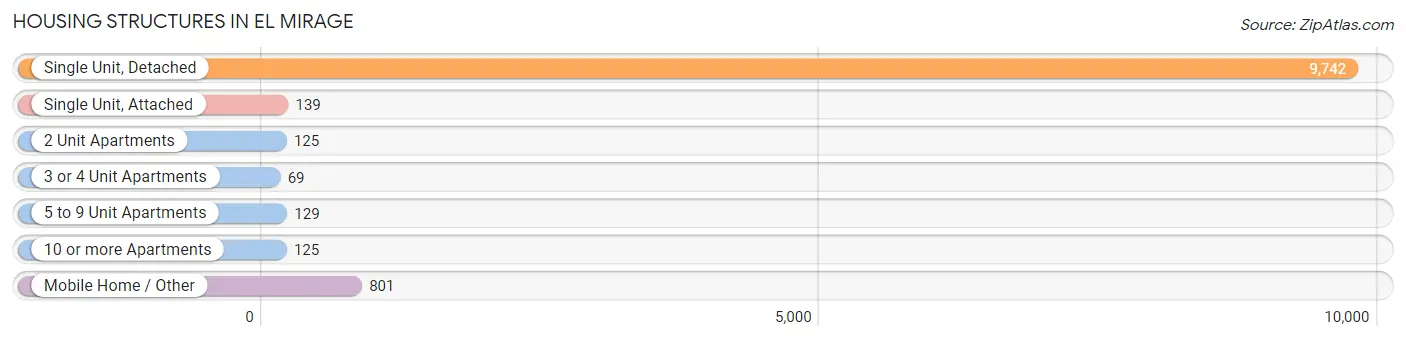
| Structure Type | # Housing Units | % Housing Units |
| Single Unit, Detached | 9,742 | 87.5% |
| Single Unit, Attached | 139 | 1.3% |
| 2 Unit Apartments | 125 | 1.1% |
| 3 or 4 Unit Apartments | 69 | 0.6% |
| 5 to 9 Unit Apartments | 129 | 1.2% |
| 10 or more Apartments | 125 | 1.1% |
| Mobile Home / Other | 801 | 7.2% |
| Total | 11,130 | 100.0% |
Housing Structures by Occupancy in El Mirage
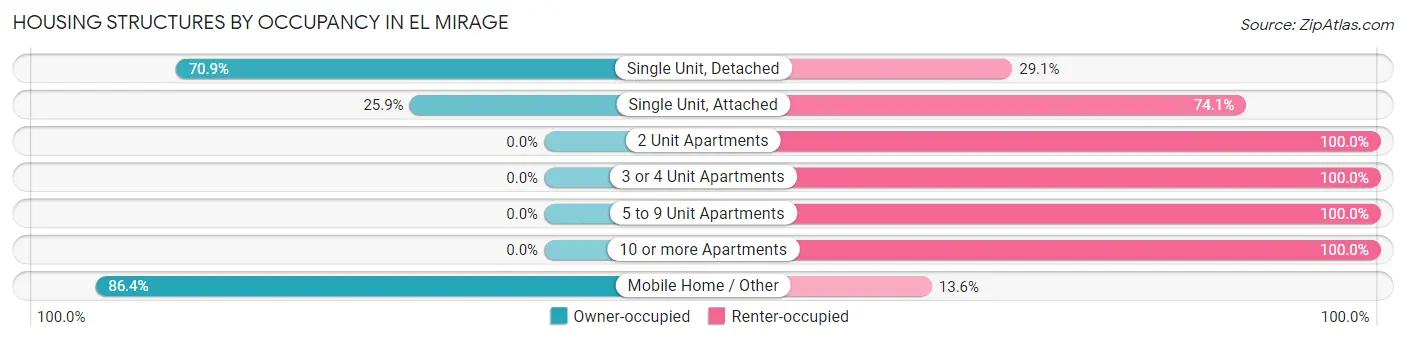
| Structure Type | Owner-occupied | Renter-occupied |
| Single Unit, Detached | 6,907 (70.9%) | 2,835 (29.1%) |
| Single Unit, Attached | 36 (25.9%) | 103 (74.1%) |
| 2 Unit Apartments | 0 (0.0%) | 125 (100.0%) |
| 3 or 4 Unit Apartments | 0 (0.0%) | 69 (100.0%) |
| 5 to 9 Unit Apartments | 0 (0.0%) | 129 (100.0%) |
| 10 or more Apartments | 0 (0.0%) | 125 (100.0%) |
| Mobile Home / Other | 692 (86.4%) | 109 (13.6%) |
| Total | 7,635 (68.6%) | 3,495 (31.4%) |
Housing Structures by Number of Rooms in El Mirage
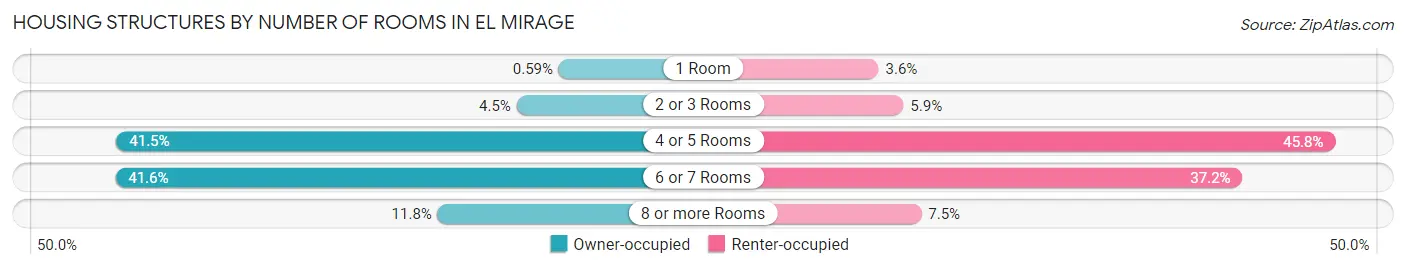
| Number of Rooms | Owner-occupied | Renter-occupied |
| 1 Room | 45 (0.6%) | 125 (3.6%) |
| 2 or 3 Rooms | 343 (4.5%) | 205 (5.9%) |
| 4 or 5 Rooms | 3,169 (41.5%) | 1,601 (45.8%) |
| 6 or 7 Rooms | 3,177 (41.6%) | 1,301 (37.2%) |
| 8 or more Rooms | 901 (11.8%) | 263 (7.5%) |
| Total | 7,635 (100.0%) | 3,495 (100.0%) |
Housing Structure by Heating Type in El Mirage
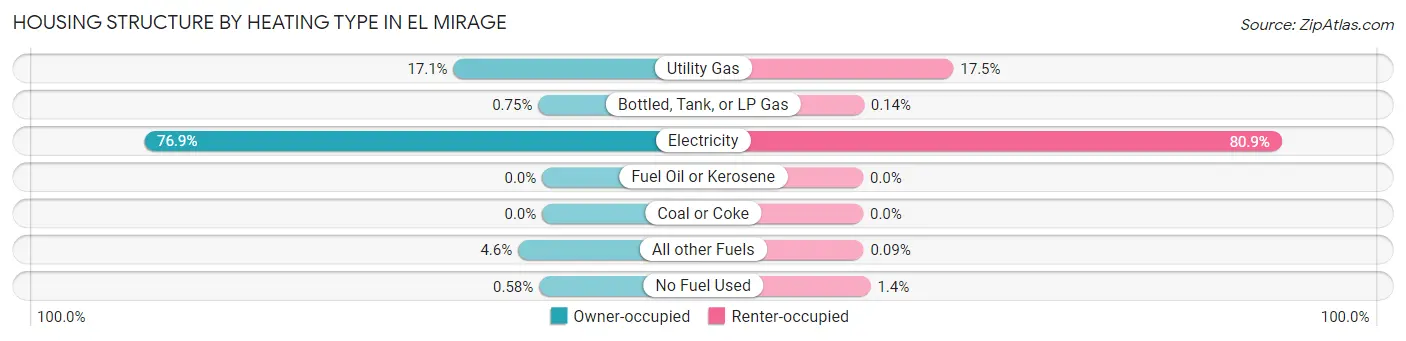
| Heating Type | Owner-occupied | Renter-occupied |
| Utility Gas | 1,308 (17.1%) | 610 (17.4%) |
| Bottled, Tank, or LP Gas | 57 (0.7%) | 5 (0.1%) |
| Electricity | 5,872 (76.9%) | 2,827 (80.9%) |
| Fuel Oil or Kerosene | 0 (0.0%) | 0 (0.0%) |
| Coal or Coke | 0 (0.0%) | 0 (0.0%) |
| All other Fuels | 354 (4.6%) | 3 (0.1%) |
| No Fuel Used | 44 (0.6%) | 50 (1.4%) |
| Total | 7,635 (100.0%) | 3,495 (100.0%) |
Household Vehicle Usage in El Mirage
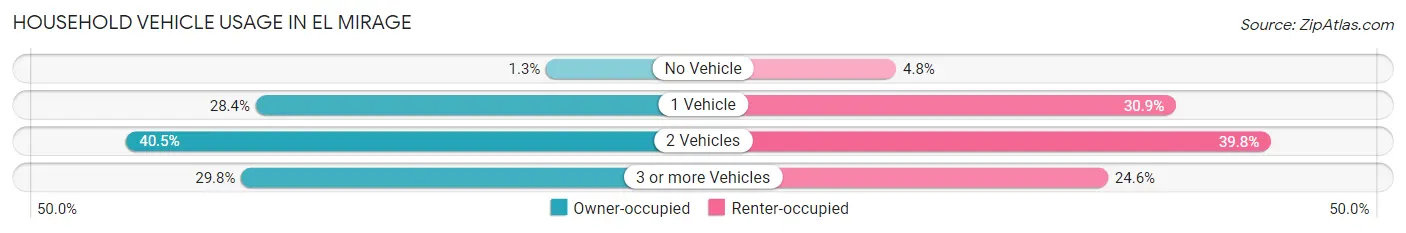
| Vehicles per Household | Owner-occupied | Renter-occupied |
| No Vehicle | 100 (1.3%) | 167 (4.8%) |
| 1 Vehicle | 2,170 (28.4%) | 1,080 (30.9%) |
| 2 Vehicles | 3,092 (40.5%) | 1,390 (39.8%) |
| 3 or more Vehicles | 2,273 (29.8%) | 858 (24.5%) |
| Total | 7,635 (100.0%) | 3,495 (100.0%) |
Real Estate & Mortgages in El Mirage
Real Estate and Mortgage Overview in El Mirage
| Characteristic | Without Mortgage | With Mortgage |
| Housing Units | 2,454 | 5,181 |
| Median Property Value | $221,100 | $257,000 |
| Median Household Income | $62,660 | $657 |
| Monthly Housing Costs | $459 | $31 |
| Real Estate Taxes | $903 | $253 |
Property Value by Mortgage Status in El Mirage
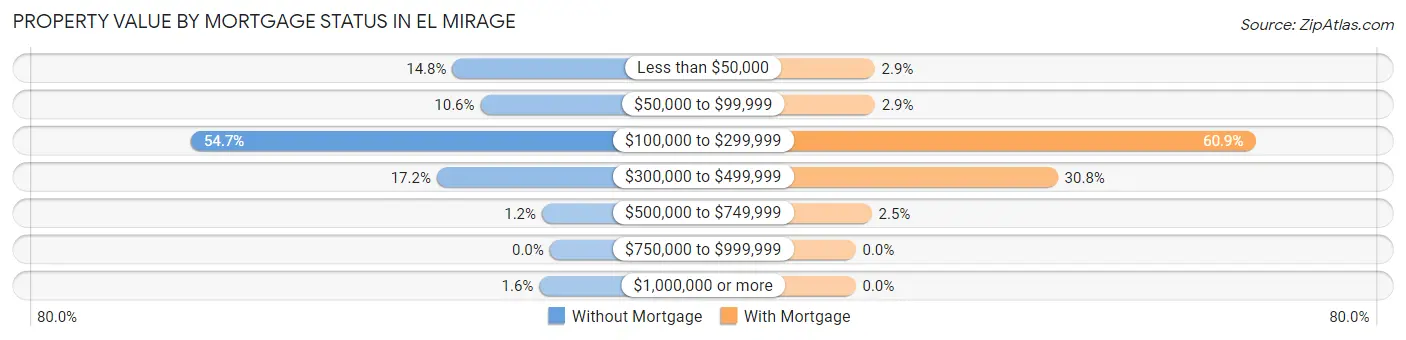
| Property Value | Without Mortgage | With Mortgage |
| Less than $50,000 | 364 (14.8%) | 150 (2.9%) |
| $50,000 to $99,999 | 259 (10.5%) | 152 (2.9%) |
| $100,000 to $299,999 | 1,341 (54.6%) | 3,156 (60.9%) |
| $300,000 to $499,999 | 422 (17.2%) | 1,596 (30.8%) |
| $500,000 to $749,999 | 29 (1.2%) | 127 (2.5%) |
| $750,000 to $999,999 | 0 (0.0%) | 0 (0.0%) |
| $1,000,000 or more | 39 (1.6%) | 0 (0.0%) |
| Total | 2,454 (100.0%) | 5,181 (100.0%) |
Household Income by Mortgage Status in El Mirage
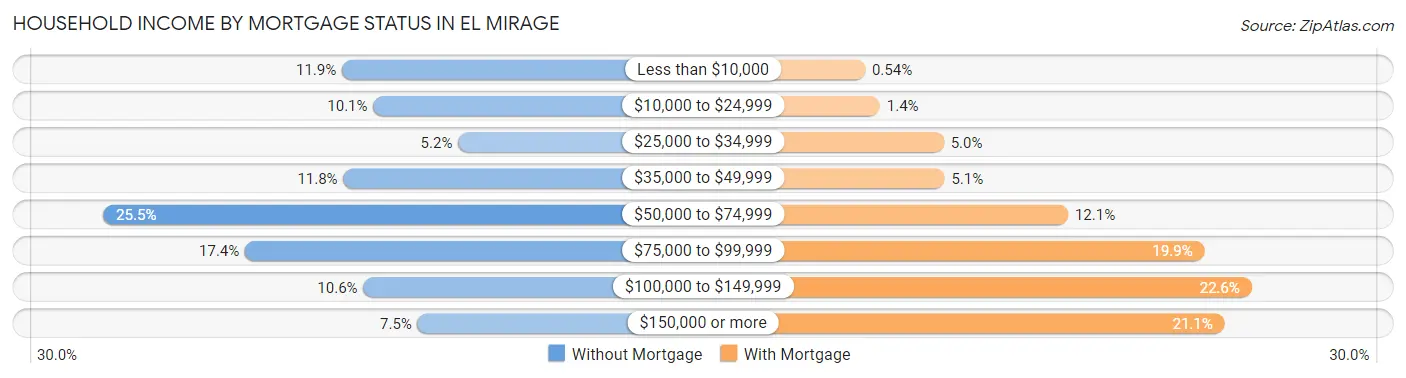
| Household Income | Without Mortgage | With Mortgage |
| Less than $10,000 | 291 (11.9%) | 28 (0.5%) |
| $10,000 to $24,999 | 247 (10.1%) | 72 (1.4%) |
| $25,000 to $34,999 | 128 (5.2%) | 261 (5.0%) |
| $35,000 to $49,999 | 289 (11.8%) | 263 (5.1%) |
| $50,000 to $74,999 | 626 (25.5%) | 629 (12.1%) |
| $75,000 to $99,999 | 427 (17.4%) | 1,033 (19.9%) |
| $100,000 to $149,999 | 261 (10.6%) | 1,173 (22.6%) |
| $150,000 or more | 185 (7.5%) | 1,093 (21.1%) |
| Total | 2,454 (100.0%) | 5,181 (100.0%) |
Property Value to Household Income Ratio in El Mirage
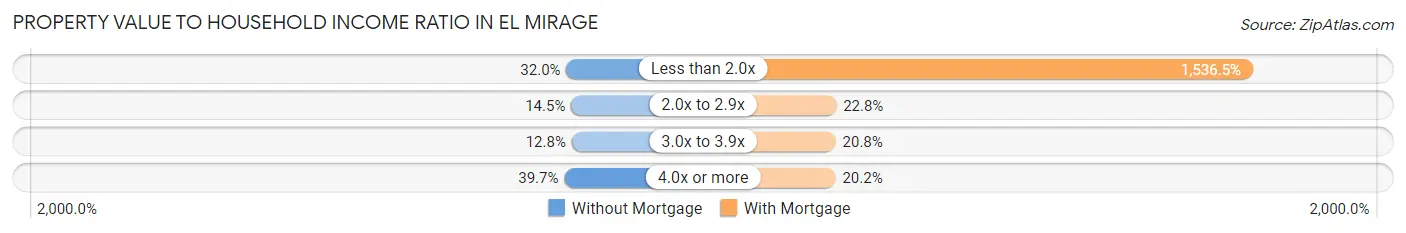
| Value-to-Income Ratio | Without Mortgage | With Mortgage |
| Less than 2.0x | 785 (32.0%) | 79,604 (1,536.5%) |
| 2.0x to 2.9x | 356 (14.5%) | 1,181 (22.8%) |
| 3.0x to 3.9x | 313 (12.8%) | 1,076 (20.8%) |
| 4.0x or more | 974 (39.7%) | 1,048 (20.2%) |
| Total | 2,454 (100.0%) | 5,181 (100.0%) |
Real Estate Taxes by Mortgage Status in El Mirage
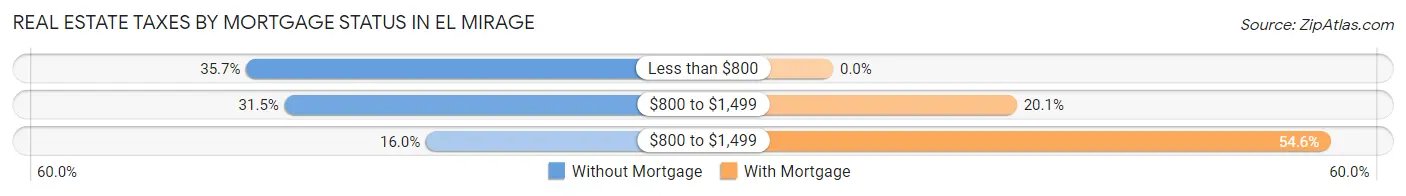
| Property Taxes | Without Mortgage | With Mortgage |
| Less than $800 | 876 (35.7%) | 0 (0.0%) |
| $800 to $1,499 | 773 (31.5%) | 1,043 (20.1%) |
| $800 to $1,499 | 393 (16.0%) | 2,828 (54.6%) |
| Total | 2,454 (100.0%) | 5,181 (100.0%) |
Health & Disability in El Mirage
Health Insurance Coverage by Age in El Mirage
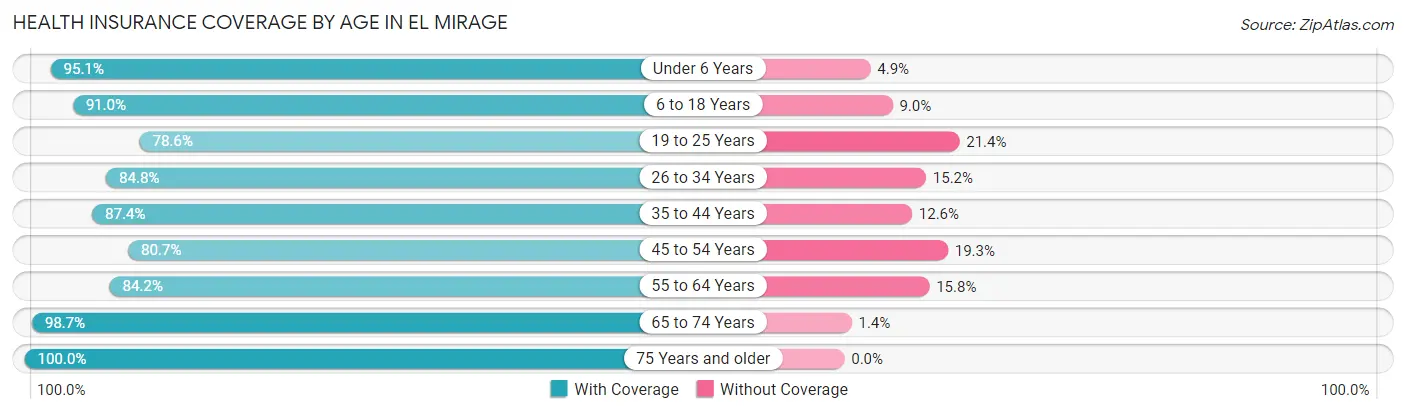
| Age Bracket | With Coverage | Without Coverage |
| Under 6 Years | 2,857 (95.1%) | 146 (4.9%) |
| 6 to 18 Years | 6,540 (91.0%) | 645 (9.0%) |
| 19 to 25 Years | 3,341 (78.6%) | 912 (21.4%) |
| 26 to 34 Years | 4,275 (84.8%) | 767 (15.2%) |
| 35 to 44 Years | 4,572 (87.4%) | 659 (12.6%) |
| 45 to 54 Years | 3,056 (80.7%) | 731 (19.3%) |
| 55 to 64 Years | 2,896 (84.2%) | 545 (15.8%) |
| 65 to 74 Years | 1,966 (98.7%) | 27 (1.3%) |
| 75 Years and older | 1,632 (100.0%) | 0 (0.0%) |
| Total | 31,135 (87.5%) | 4,432 (12.5%) |
Health Insurance Coverage by Citizenship Status in El Mirage

| Citizenship Status | With Coverage | Without Coverage |
| Native Born | 2,857 (95.1%) | 146 (4.9%) |
| Foreign Born, Citizen | 6,540 (91.0%) | 645 (9.0%) |
| Foreign Born, not a Citizen | 3,341 (78.6%) | 912 (21.4%) |
Health Insurance Coverage by Household Income in El Mirage
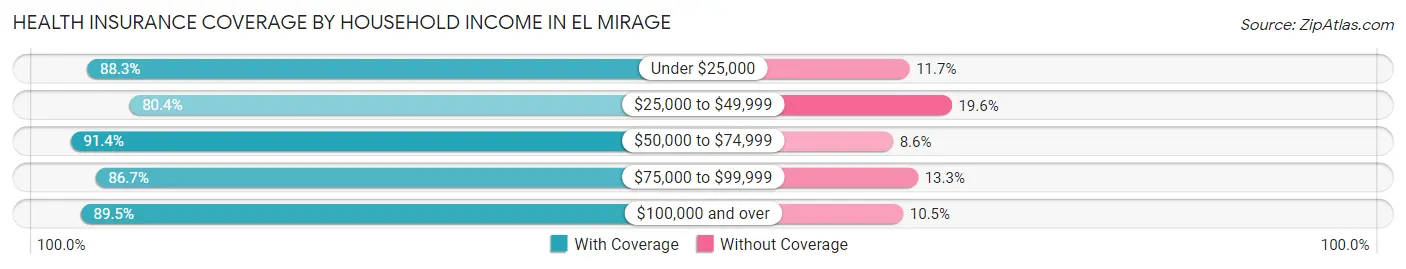
| Household Income | With Coverage | Without Coverage |
| Under $25,000 | 2,581 (88.3%) | 342 (11.7%) |
| $25,000 to $49,999 | 5,078 (80.4%) | 1,239 (19.6%) |
| $50,000 to $74,999 | 6,378 (91.4%) | 600 (8.6%) |
| $75,000 to $99,999 | 6,801 (86.7%) | 1,042 (13.3%) |
| $100,000 and over | 10,287 (89.5%) | 1,207 (10.5%) |
Public vs Private Health Insurance Coverage by Age in El Mirage
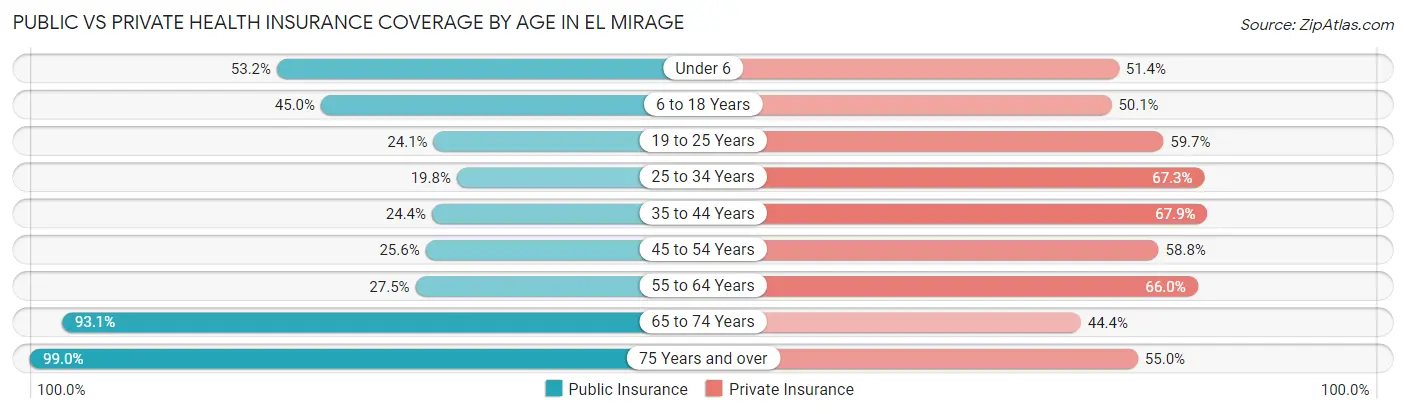
| Age Bracket | Public Insurance | Private Insurance |
| Under 6 | 1,597 (53.2%) | 1,544 (51.4%) |
| 6 to 18 Years | 3,234 (45.0%) | 3,596 (50.0%) |
| 19 to 25 Years | 1,026 (24.1%) | 2,538 (59.7%) |
| 25 to 34 Years | 998 (19.8%) | 3,393 (67.3%) |
| 35 to 44 Years | 1,277 (24.4%) | 3,550 (67.9%) |
| 45 to 54 Years | 969 (25.6%) | 2,227 (58.8%) |
| 55 to 64 Years | 945 (27.5%) | 2,272 (66.0%) |
| 65 to 74 Years | 1,855 (93.1%) | 884 (44.4%) |
| 75 Years and over | 1,615 (99.0%) | 897 (55.0%) |
| Total | 13,516 (38.0%) | 20,901 (58.8%) |
Disability Status by Sex by Age in El Mirage
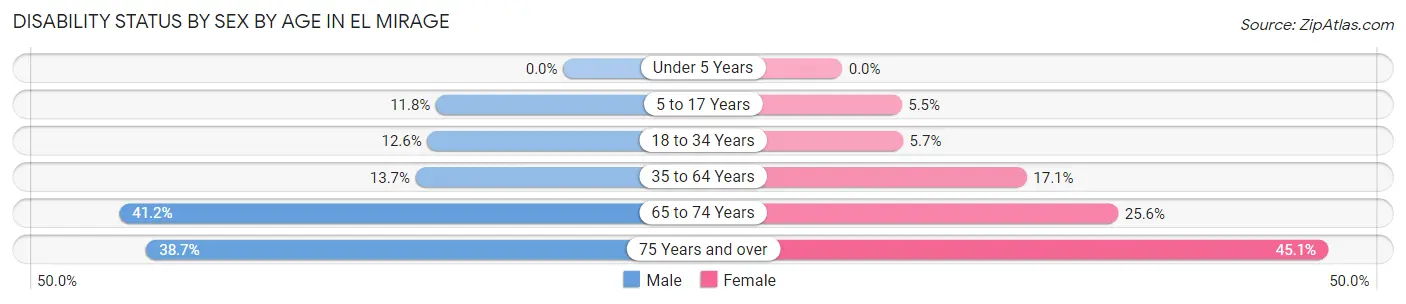
| Age Bracket | Male | Female |
| Under 5 Years | 0 (0.0%) | 0 (0.0%) |
| 5 to 17 Years | 400 (11.8%) | 205 (5.5%) |
| 18 to 34 Years | 596 (12.6%) | 284 (5.7%) |
| 35 to 64 Years | 801 (13.7%) | 1,132 (17.1%) |
| 65 to 74 Years | 408 (41.2%) | 257 (25.6%) |
| 75 Years and over | 291 (38.7%) | 397 (45.1%) |
Disability Class by Sex by Age in El Mirage
Disability Class: Hearing Difficulty
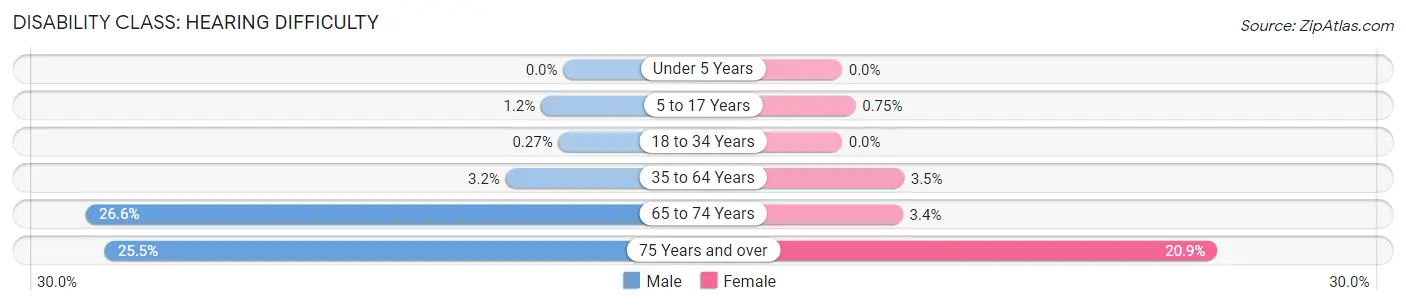
| Age Bracket | Male | Female |
| Under 5 Years | 0 (0.0%) | 0 (0.0%) |
| 5 to 17 Years | 42 (1.2%) | 28 (0.7%) |
| 18 to 34 Years | 13 (0.3%) | 0 (0.0%) |
| 35 to 64 Years | 188 (3.2%) | 228 (3.5%) |
| 65 to 74 Years | 263 (26.6%) | 34 (3.4%) |
| 75 Years and over | 192 (25.5%) | 184 (20.9%) |
Disability Class: Vision Difficulty
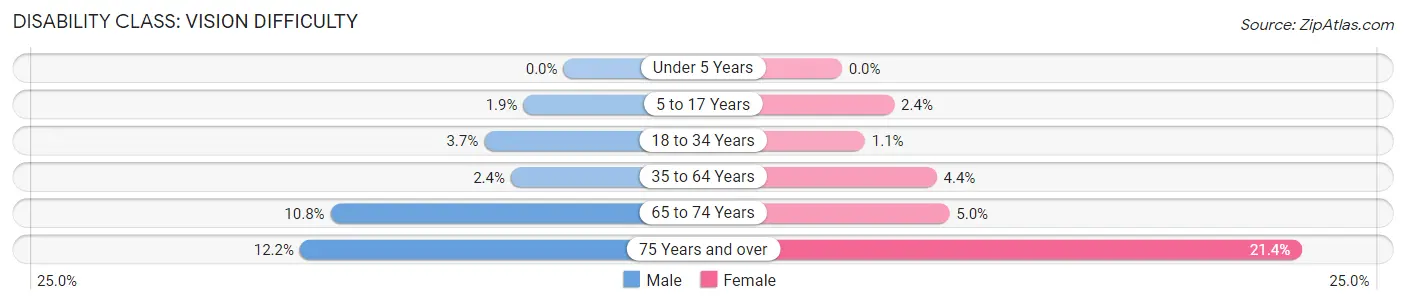
| Age Bracket | Male | Female |
| Under 5 Years | 0 (0.0%) | 0 (0.0%) |
| 5 to 17 Years | 63 (1.9%) | 90 (2.4%) |
| 18 to 34 Years | 174 (3.7%) | 54 (1.1%) |
| 35 to 64 Years | 143 (2.4%) | 291 (4.4%) |
| 65 to 74 Years | 107 (10.8%) | 50 (5.0%) |
| 75 Years and over | 92 (12.2%) | 188 (21.4%) |
Disability Class: Cognitive Difficulty
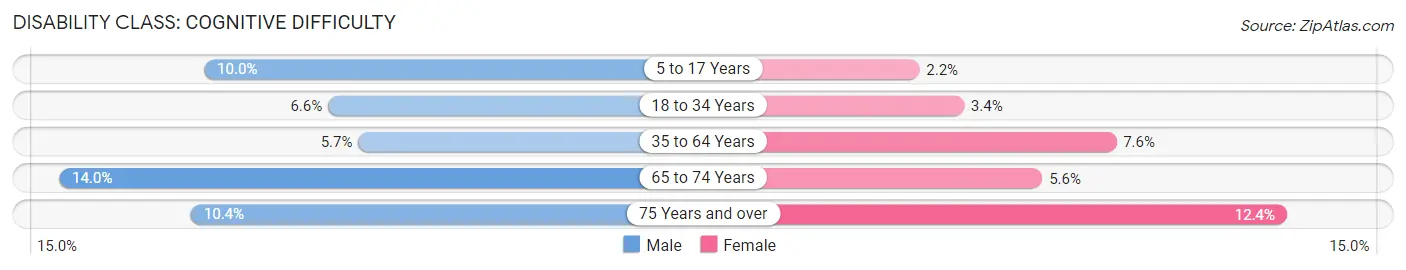
| Age Bracket | Male | Female |
| 5 to 17 Years | 339 (10.0%) | 80 (2.2%) |
| 18 to 34 Years | 310 (6.6%) | 171 (3.4%) |
| 35 to 64 Years | 334 (5.7%) | 505 (7.6%) |
| 65 to 74 Years | 139 (14.0%) | 56 (5.6%) |
| 75 Years and over | 78 (10.4%) | 109 (12.4%) |
Disability Class: Ambulatory Difficulty
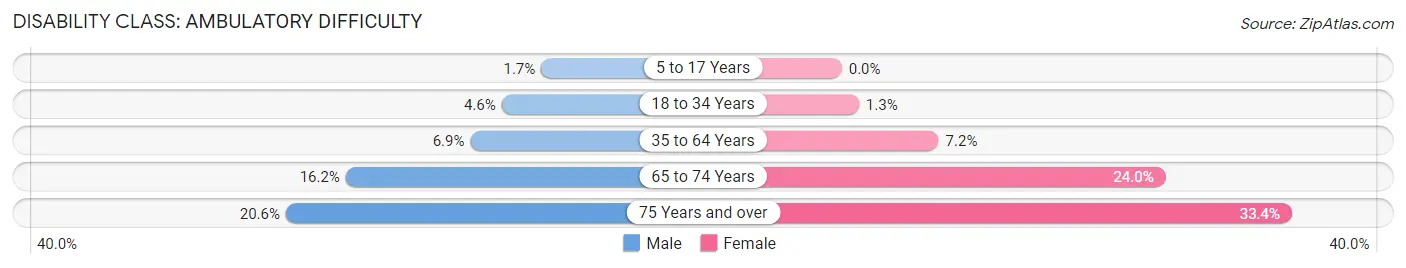
| Age Bracket | Male | Female |
| 5 to 17 Years | 56 (1.7%) | 0 (0.0%) |
| 18 to 34 Years | 217 (4.6%) | 64 (1.3%) |
| 35 to 64 Years | 404 (6.9%) | 475 (7.2%) |
| 65 to 74 Years | 160 (16.2%) | 241 (24.0%) |
| 75 Years and over | 155 (20.6%) | 294 (33.4%) |
Disability Class: Self-Care Difficulty
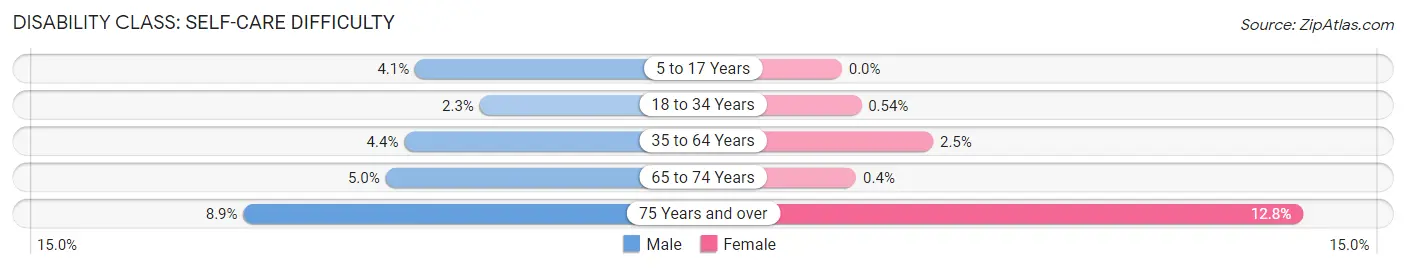
| Age Bracket | Male | Female |
| 5 to 17 Years | 140 (4.1%) | 0 (0.0%) |
| 18 to 34 Years | 110 (2.3%) | 27 (0.5%) |
| 35 to 64 Years | 259 (4.4%) | 168 (2.5%) |
| 65 to 74 Years | 49 (5.0%) | 4 (0.4%) |
| 75 Years and over | 67 (8.9%) | 113 (12.8%) |
Technology Access in El Mirage
Computing Device Access in El Mirage
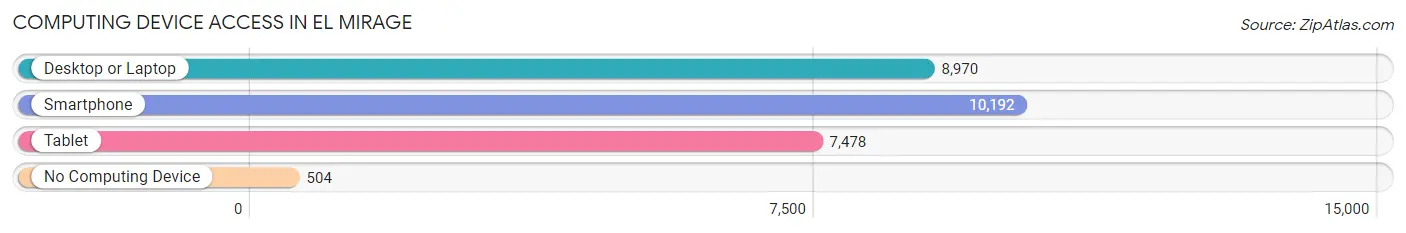
| Device Type | # Households | % Households |
| Desktop or Laptop | 8,970 | 80.6% |
| Smartphone | 10,192 | 91.6% |
| Tablet | 7,478 | 67.2% |
| No Computing Device | 504 | 4.5% |
| Total | 11,130 | 100.0% |
Internet Access in El Mirage
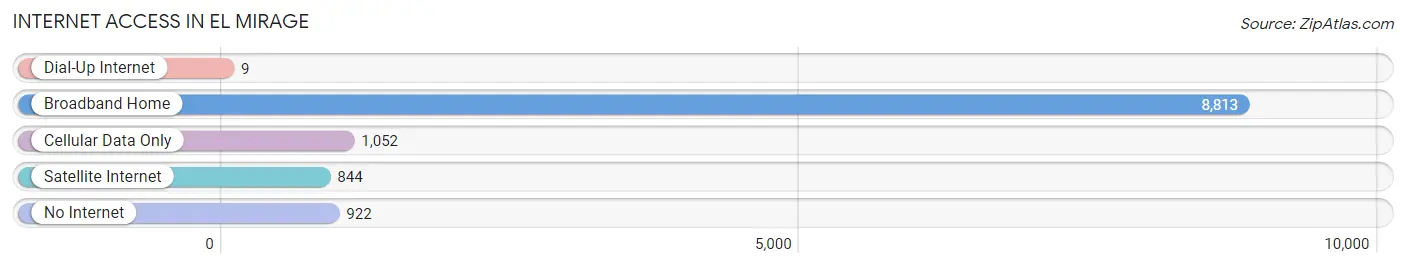
| Internet Type | # Households | % Households |
| Dial-Up Internet | 9 | 0.1% |
| Broadband Home | 8,813 | 79.2% |
| Cellular Data Only | 1,052 | 9.5% |
| Satellite Internet | 844 | 7.6% |
| No Internet | 922 | 8.3% |
| Total | 11,130 | 100.0% |
El Mirage Summary
History
El Mirage is a city located in Maricopa County, Arizona. It is situated in the northwest corner of the Phoenix metropolitan area, and is part of the Phoenix-Mesa-Scottsdale Metropolitan Statistical Area. The city was incorporated in 1951, and has a population of approximately 33,000 people.
El Mirage was originally inhabited by the Hohokam people, who were a Native American tribe that lived in the area from around 300 BC to 1450 AD. The Hohokam were known for their irrigation systems, which were used to cultivate crops such as corn, beans, squash, and cotton.
In the late 1800s, the area was settled by ranchers and farmers, who used the land for cattle grazing and farming. The area was known as “Rancho El Mirage”, and was owned by the family of William J. Murphy. In the early 1900s, the area was divided into smaller parcels and sold to homesteaders.
In 1951, the city of El Mirage was officially incorporated. The city was named after the nearby El Mirage Lake, which was created by the damming of the Agua Fria River.
Geography
El Mirage is located in the northwest corner of the Phoenix metropolitan area, and is part of the Phoenix-Mesa-Scottsdale Metropolitan Statistical Area. The city is situated in the Sonoran Desert, and is bordered by the cities of Surprise to the north, Glendale to the east, and Peoria to the south.
The city has a total area of 16.2 square miles, of which 16.1 square miles is land and 0.1 square miles is water. The city is located at an elevation of 1,082 feet above sea level.
Economy
The economy of El Mirage is largely based on the service industry, with many residents employed in retail, hospitality, and healthcare. The city is also home to several manufacturing and industrial businesses, including a large solar panel manufacturing plant.
The city is also home to Luke Air Force Base, which is located just outside of the city limits. The base is the largest employer in the city, and provides jobs for thousands of people.
Demographics
As of the 2010 census, El Mirage had a population of 33,065 people. The racial makeup of the city was 73.3% White, 5.2% African American, 0.9% Native American, 1.7% Asian, 0.1% Pacific Islander, 15.2% from other races, and 3.6% from two or more races. Hispanic or Latino of any race were 33.2% of the population.
The median household income in El Mirage was $41,945, and the median family income was $45,945. The per capita income for the city was $17,845. About 17.2% of families and 20.7% of the population were below the poverty line, including 28.3% of those under age 18 and 8.2% of those age 65 or over.
Common Questions
What is Per Capita Income in El Mirage?
Per Capita income in El Mirage is $26,087.
What is the Median Family Income in El Mirage?
Median Family Income in El Mirage is $70,768.
What is the Median Household income in El Mirage?
Median Household Income in El Mirage is $72,134.
What is Income or Wage Gap in El Mirage?
Income or Wage Gap in El Mirage is 12.5%.
Women in El Mirage earn 87.5 cents for every dollar earned by a man.
What is Family Income Deficit in El Mirage?
Family Income Deficit in El Mirage is $13,709.
Families that are below poverty line in El Mirage earn $13,709 less on average than the poverty threshold level.
What is Inequality or Gini Index in El Mirage?
Inequality or Gini Index in El Mirage is 0.36.
What is the Total Population of El Mirage?
Total Population of El Mirage is 35,652.
What is the Total Male Population of El Mirage?
Total Male Population of El Mirage is 17,392.
What is the Total Female Population of El Mirage?
Total Female Population of El Mirage is 18,260.
What is the Ratio of Males per 100 Females in El Mirage?
There are 95.25 Males per 100 Females in El Mirage.
What is the Ratio of Females per 100 Males in El Mirage?
There are 104.99 Females per 100 Males in El Mirage.
What is the Median Population Age in El Mirage?
Median Population Age in El Mirage is 31.9 Years.
What is the Average Family Size in El Mirage
Average Family Size in El Mirage is 3.4 People.
What is the Average Household Size in El Mirage
Average Household Size in El Mirage is 3.2 People.
How Large is the Labor Force in El Mirage?
There are 18,442 People in the Labor Forcein in El Mirage.
What is the Percentage of People in the Labor Force in El Mirage?
68.6% of People are in the Labor Force in El Mirage.
What is the Unemployment Rate in El Mirage?
Unemployment Rate in El Mirage is 5.9%.