Thatcher, AZ Map & Demographics
Thatcher Map
Thatcher Overview
$27,582
PER CAPITA INCOME
$82,303
AVG FAMILY INCOME
$71,591
AVG HOUSEHOLD INCOME
69.4%
WAGE / INCOME GAP [ % ]
30.6¢/ $1
WAGE / INCOME GAP [ $ ]
0.38
INEQUALITY / GINI INDEX
5,281
TOTAL POPULATION
2,715
MALE POPULATION
2,566
FEMALE POPULATION
105.81
MALES / 100 FEMALES
94.51
FEMALES / 100 MALES
27.7
MEDIAN AGE
3.3
AVG FAMILY SIZE
2.8
AVG HOUSEHOLD SIZE
2,325
LABOR FORCE [ PEOPLE ]
56.6%
PERCENT IN LABOR FORCE
5.6%
UNEMPLOYMENT RATE
Thatcher Zip Codes
Thatcher Area Codes
Income in Thatcher
Income Overview in Thatcher
Per Capita Income in Thatcher is $27,582, while median incomes of families and households are $82,303 and $71,591 respectively.
| Characteristic | Number | Measure |
| Per Capita Income | 5,281 | $27,582 |
| Median Family Income | 1,280 | $82,303 |
| Mean Family Income | 1,280 | $88,168 |
| Median Household Income | 1,790 | $71,591 |
| Mean Household Income | 1,790 | $81,945 |
| Income Deficit | 1,280 | $0 |
| Wage / Income Gap (%) | 5,281 | 69.43% |
| Wage / Income Gap ($) | 5,281 | 30.57¢ per $1 |
| Gini / Inequality Index | 5,281 | 0.38 |
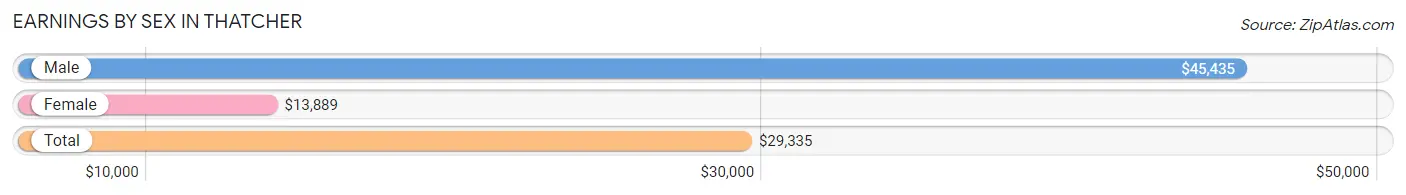
Earnings by Sex in Thatcher
Average Earnings in Thatcher are $29,335, $45,435 for men and $13,889 for women, a difference of 69.4%.
| Sex | Number | Average Earnings |
| Male | 1,414 (57.1%) | $45,435 |
| Female | 1,064 (42.9%) | $13,889 |
| Total | 2,478 (100.0%) | $29,335 |
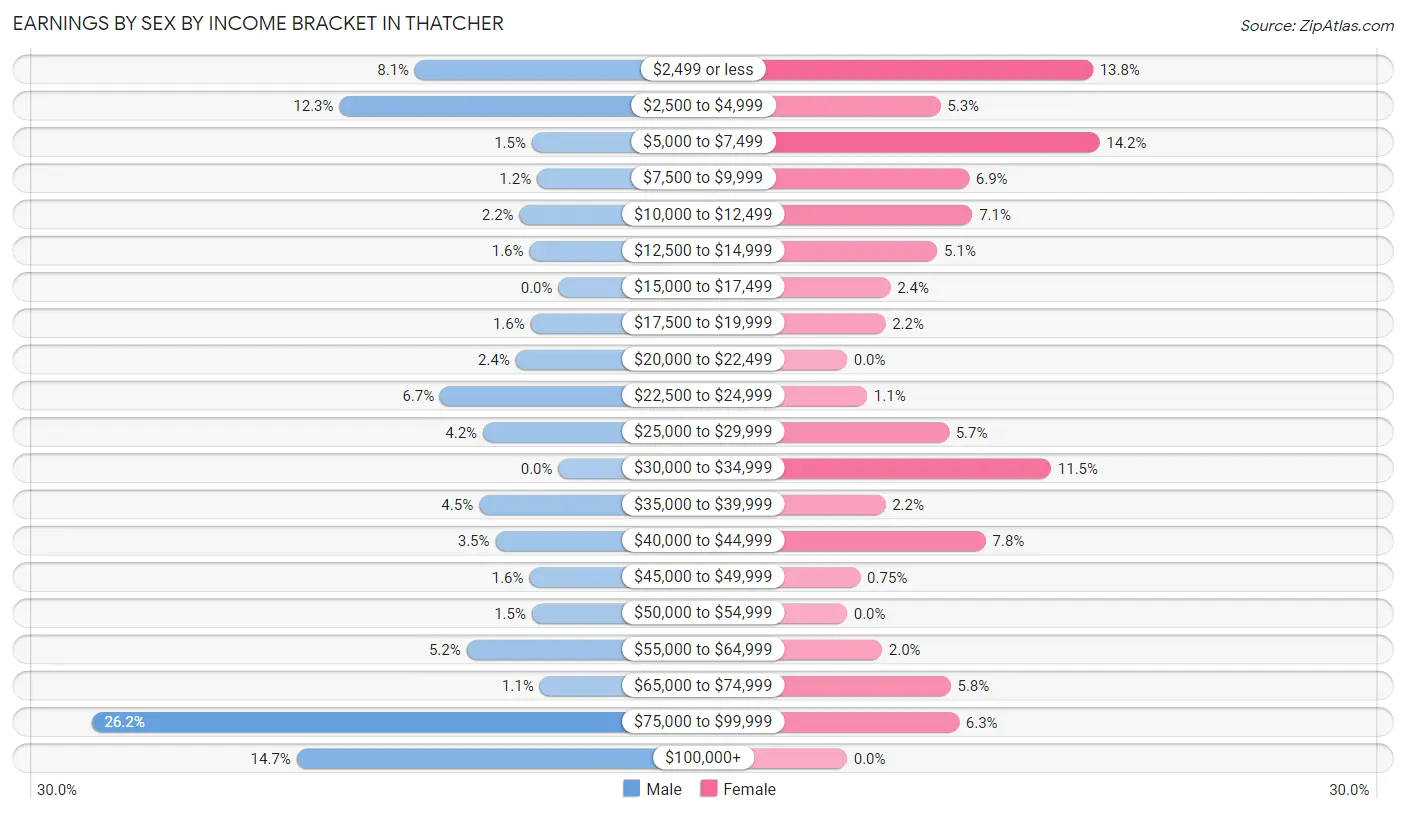
Earnings by Sex by Income Bracket in Thatcher
The most common earnings brackets in Thatcher are $75,000 to $99,999 for men (371 | 26.2%) and $5,000 to $7,499 for women (151 | 14.2%).
| Income | Male | Female |
| $2,499 or less | 114 (8.1%) | 147 (13.8%) |
| $2,500 to $4,999 | 174 (12.3%) | 56 (5.3%) |
| $5,000 to $7,499 | 21 (1.5%) | 151 (14.2%) |
| $7,500 to $9,999 | 17 (1.2%) | 73 (6.9%) |
| $10,000 to $12,499 | 31 (2.2%) | 75 (7.0%) |
| $12,500 to $14,999 | 23 (1.6%) | 54 (5.1%) |
| $15,000 to $17,499 | 0 (0.0%) | 26 (2.4%) |
| $17,500 to $19,999 | 22 (1.6%) | 23 (2.2%) |
| $20,000 to $22,499 | 34 (2.4%) | 0 (0.0%) |
| $22,500 to $24,999 | 94 (6.7%) | 12 (1.1%) |
| $25,000 to $29,999 | 60 (4.2%) | 61 (5.7%) |
| $30,000 to $34,999 | 0 (0.0%) | 122 (11.5%) |
| $35,000 to $39,999 | 63 (4.5%) | 23 (2.2%) |
| $40,000 to $44,999 | 50 (3.5%) | 83 (7.8%) |
| $45,000 to $49,999 | 23 (1.6%) | 8 (0.7%) |
| $50,000 to $54,999 | 21 (1.5%) | 0 (0.0%) |
| $55,000 to $64,999 | 73 (5.2%) | 21 (2.0%) |
| $65,000 to $74,999 | 15 (1.1%) | 62 (5.8%) |
| $75,000 to $99,999 | 371 (26.2%) | 67 (6.3%) |
| $100,000+ | 208 (14.7%) | 0 (0.0%) |
| Total | 1,414 (100.0%) | 1,064 (100.0%) |
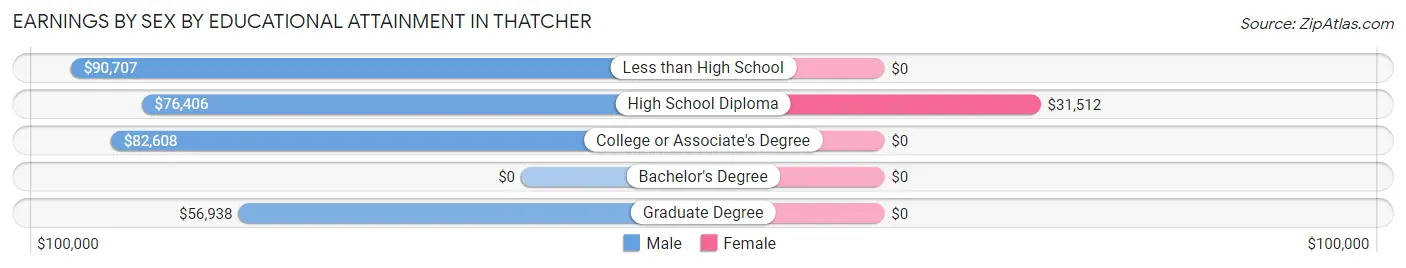
Earnings by Sex by Educational Attainment in Thatcher
Average earnings in Thatcher are $80,493 for men and $30,387 for women, a difference of 62.3%. Men with an educational attainment of less than high school enjoy the highest average annual earnings of $90,707, while those with graduate degree education earn the least with $56,938. Women with an educational attainment of high school diploma earn the most with the average annual earnings of $31,512, while those with high school diploma education have the smallest earnings of $31,512.
| Educational Attainment | Male Income | Female Income |
| Less than High School | $90,707 | $0 |
| High School Diploma | $76,406 | $31,512 |
| College or Associate's Degree | $82,608 | $0 |
| Bachelor's Degree | - | - |
| Graduate Degree | $56,938 | $0 |
| Total | $80,493 | $30,387 |
Family Income in Thatcher
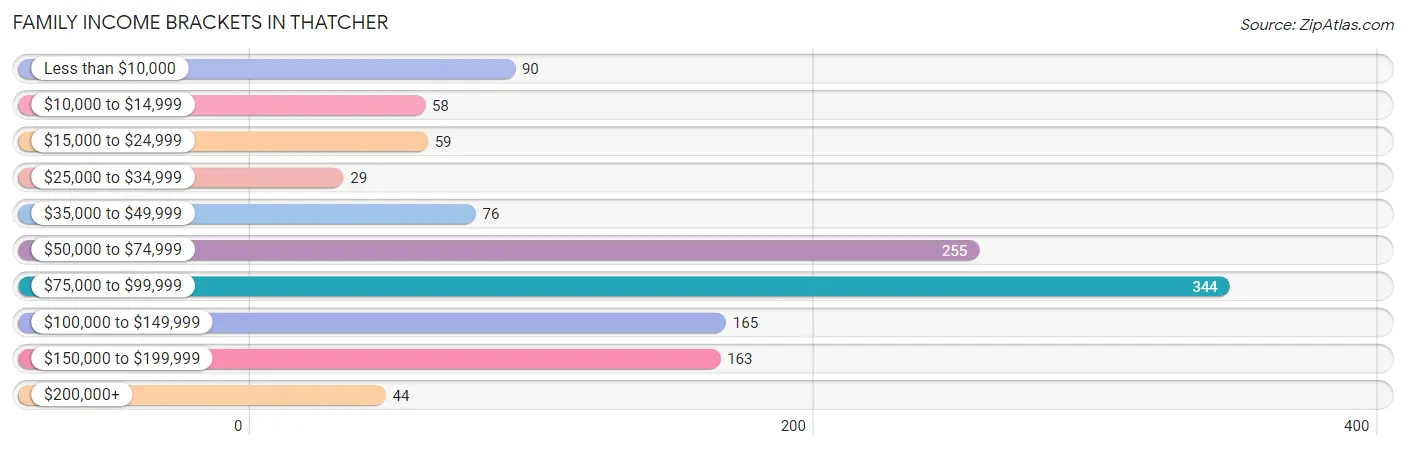
Family Income Brackets in Thatcher
According to the Thatcher family income data, there are 344 families falling into the $75,000 to $99,999 income range, which is the most common income bracket and makes up 26.9% of all families. Conversely, the $25,000 to $34,999 income bracket is the least frequent group with only 29 families (2.3%) belonging to this category.
| Income Bracket | # Families | % Families |
| Less than $10,000 | 90 | 7.0% |
| $10,000 to $14,999 | 58 | 4.5% |
| $15,000 to $24,999 | 59 | 4.6% |
| $25,000 to $34,999 | 29 | 2.3% |
| $35,000 to $49,999 | 76 | 5.9% |
| $50,000 to $74,999 | 255 | 19.9% |
| $75,000 to $99,999 | 344 | 26.9% |
| $100,000 to $149,999 | 165 | 12.9% |
| $150,000 to $199,999 | 163 | 12.7% |
| $200,000+ | 44 | 3.4% |
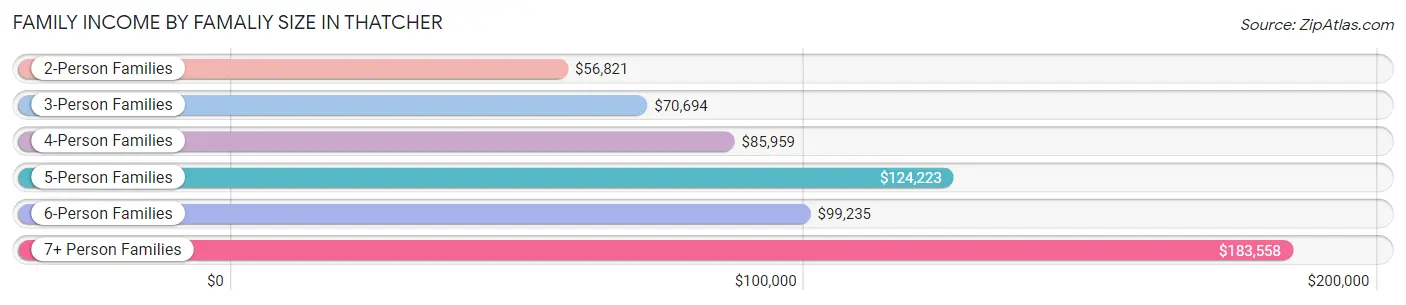
Family Income by Famaliy Size in Thatcher
7+ person families (45 | 3.5%) account for the highest median family income in Thatcher with $183,558 per family, while 2-person families (612 | 47.8%) have the highest median income of $28,410 per family member.
| Income Bracket | # Families | Median Income |
| 2-Person Families | 612 (47.8%) | $56,821 |
| 3-Person Families | 173 (13.5%) | $70,694 |
| 4-Person Families | 197 (15.4%) | $85,959 |
| 5-Person Families | 105 (8.2%) | $124,223 |
| 6-Person Families | 148 (11.6%) | $99,235 |
| 7+ Person Families | 45 (3.5%) | $183,558 |
| Total | 1,280 (100.0%) | $82,303 |
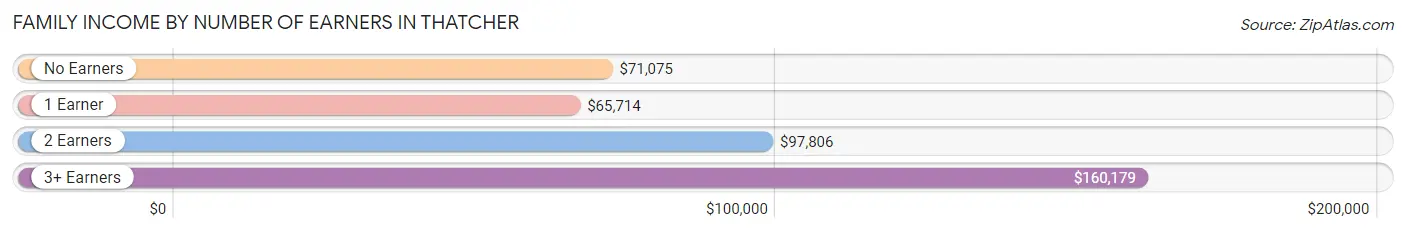
Family Income by Number of Earners in Thatcher
The median family income in Thatcher is $82,303, with families comprising 3+ earners (55) having the highest median family income of $160,179, while families with 1 earner (562) have the lowest median family income of $65,714, accounting for 4.3% and 43.9% of families, respectively.
| Number of Earners | # Families | Median Income |
| No Earners | 159 (12.4%) | $71,075 |
| 1 Earner | 562 (43.9%) | $65,714 |
| 2 Earners | 504 (39.4%) | $97,806 |
| 3+ Earners | 55 (4.3%) | $160,179 |
| Total | 1,280 (100.0%) | $82,303 |
Household Income in Thatcher
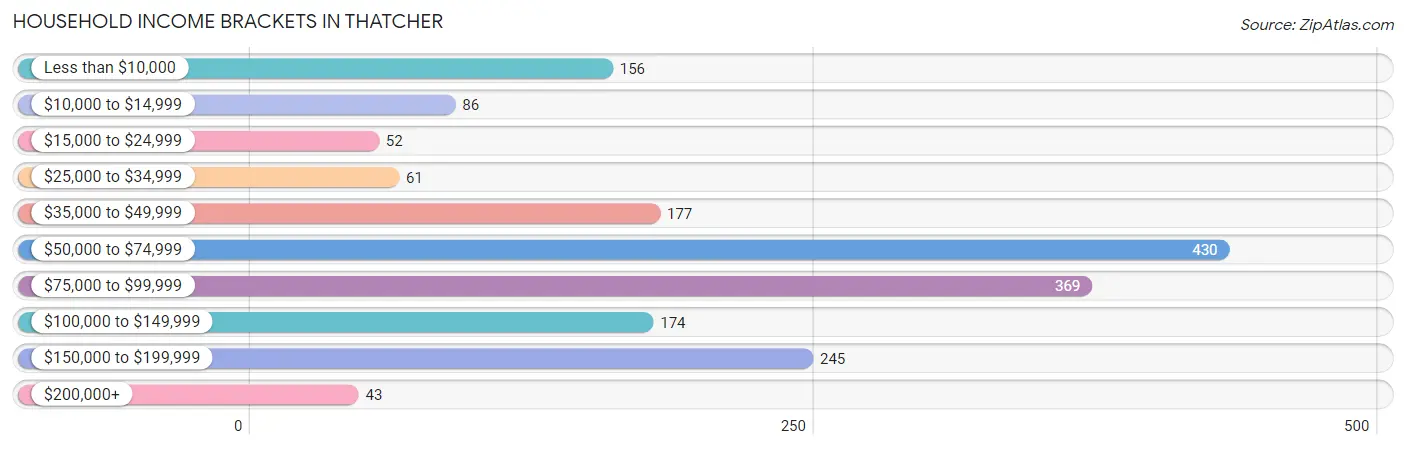
Household Income Brackets in Thatcher
With 430 households falling in the category, the $50,000 to $74,999 income range is the most frequent in Thatcher, accounting for 24.0% of all households. In contrast, only 43 households (2.4%) fall into the $200,000+ income bracket, making it the least populous group.
| Income Bracket | # Households | % Households |
| Less than $10,000 | 156 | 8.7% |
| $10,000 to $14,999 | 86 | 4.8% |
| $15,000 to $24,999 | 52 | 2.9% |
| $25,000 to $34,999 | 61 | 3.4% |
| $35,000 to $49,999 | 177 | 9.9% |
| $50,000 to $74,999 | 430 | 24.0% |
| $75,000 to $99,999 | 369 | 20.6% |
| $100,000 to $149,999 | 174 | 9.7% |
| $150,000 to $199,999 | 245 | 13.7% |
| $200,000+ | 43 | 2.4% |
Household Income by Householder Age in Thatcher
The median household income in Thatcher is $71,591, with the highest median household income of $97,577 found in the 25 to 44 years age bracket for the primary householder. A total of 696 households (38.9%) fall into this category. Meanwhile, the 15 to 24 years age bracket for the primary householder has the lowest median household income of $0, with 161 households (9.0%) in this group.
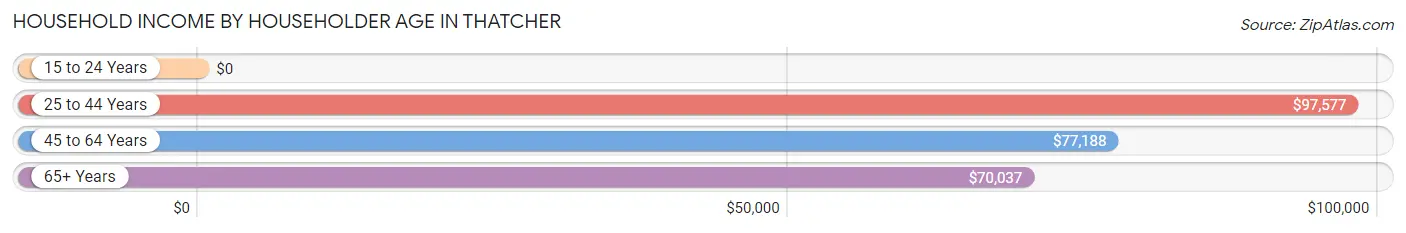
| Income Bracket | # Households | Median Income |
| 15 to 24 Years | 161 (9.0%) | $0 |
| 25 to 44 Years | 696 (38.9%) | $97,577 |
| 45 to 64 Years | 456 (25.5%) | $77,188 |
| 65+ Years | 477 (26.7%) | $70,037 |
| Total | 1,790 (100.0%) | $71,591 |
Poverty in Thatcher
Income Below Poverty by Sex and Age in Thatcher
With 12.2% poverty level for males and 17.3% for females among the residents of Thatcher, 18 to 24 year old males and 18 to 24 year old females are the most vulnerable to poverty, with 160 males (48.3%) and 172 females (48.7%) in their respective age groups living below the poverty level.
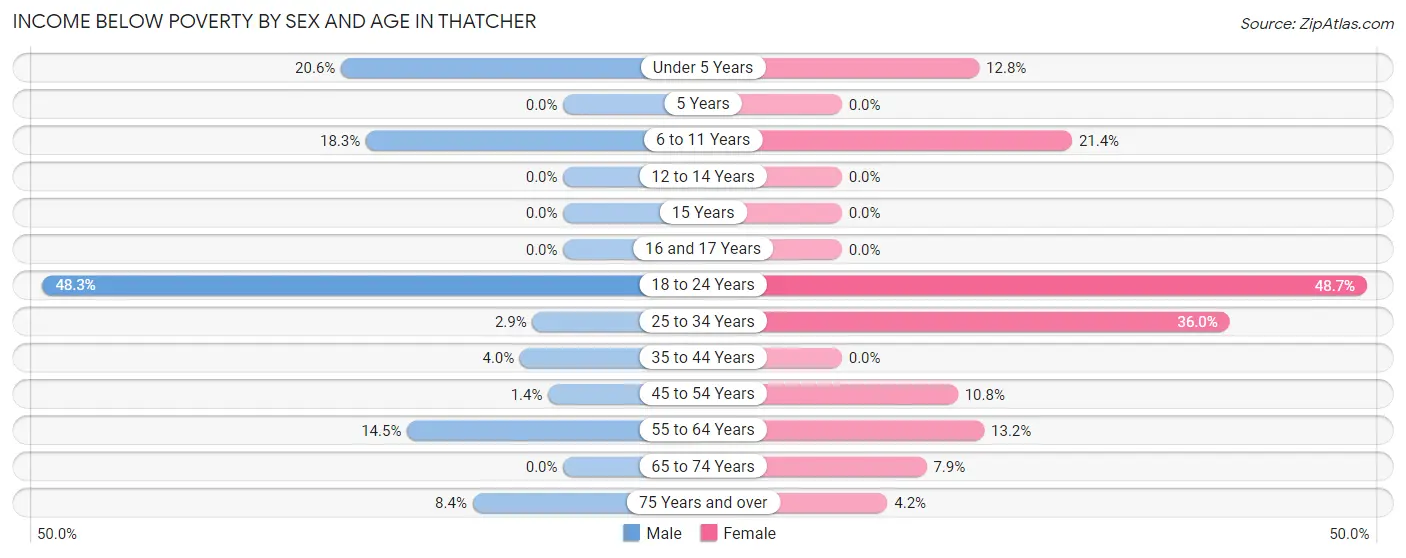
| Age Bracket | Male | Female |
| Under 5 Years | 20 (20.6%) | 13 (12.8%) |
| 5 Years | 0 (0.0%) | 0 (0.0%) |
| 6 to 11 Years | 76 (18.3%) | 44 (21.4%) |
| 12 to 14 Years | 0 (0.0%) | 0 (0.0%) |
| 15 Years | 0 (0.0%) | 0 (0.0%) |
| 16 and 17 Years | 0 (0.0%) | 0 (0.0%) |
| 18 to 24 Years | 160 (48.3%) | 172 (48.7%) |
| 25 to 34 Years | 9 (2.9%) | 113 (36.0%) |
| 35 to 44 Years | 11 (4.0%) | 0 (0.0%) |
| 45 to 54 Years | 3 (1.4%) | 24 (10.8%) |
| 55 to 64 Years | 31 (14.5%) | 35 (13.2%) |
| 65 to 74 Years | 0 (0.0%) | 22 (7.9%) |
| 75 Years and over | 9 (8.4%) | 8 (4.2%) |
| Total | 319 (12.2%) | 431 (17.3%) |
Income Above Poverty by Sex and Age in Thatcher
According to the poverty statistics in Thatcher, males aged 5 years and females aged 12 to 14 years are the age groups that are most secure financially, with 100.0% of males and 100.0% of females in these age groups living above the poverty line.
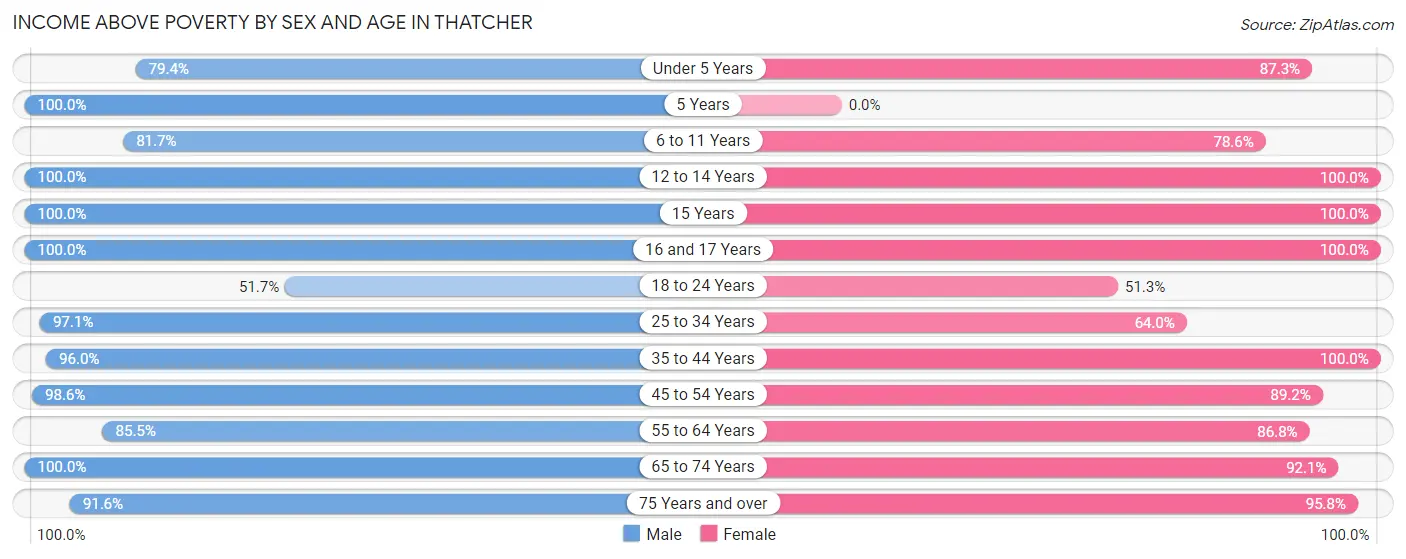
| Age Bracket | Male | Female |
| Under 5 Years | 77 (79.4%) | 89 (87.3%) |
| 5 Years | 28 (100.0%) | 0 (0.0%) |
| 6 to 11 Years | 339 (81.7%) | 162 (78.6%) |
| 12 to 14 Years | 158 (100.0%) | 96 (100.0%) |
| 15 Years | 25 (100.0%) | 44 (100.0%) |
| 16 and 17 Years | 166 (100.0%) | 101 (100.0%) |
| 18 to 24 Years | 171 (51.7%) | 181 (51.3%) |
| 25 to 34 Years | 306 (97.1%) | 201 (64.0%) |
| 35 to 44 Years | 263 (96.0%) | 319 (100.0%) |
| 45 to 54 Years | 211 (98.6%) | 199 (89.2%) |
| 55 to 64 Years | 183 (85.5%) | 230 (86.8%) |
| 65 to 74 Years | 265 (100.0%) | 258 (92.1%) |
| 75 Years and over | 98 (91.6%) | 181 (95.8%) |
| Total | 2,290 (87.8%) | 2,061 (82.7%) |
Income Below Poverty Among Married-Couple Families in Thatcher
The poverty statistics for married-couple families in Thatcher show that 7.3% or 73 of the total 1,001 families live below the poverty line. Families with no children have the highest poverty rate of 10.8%, comprising of 56 families. On the other hand, families with 5 or more children have the lowest poverty rate of 0.0%, which includes 0 families.
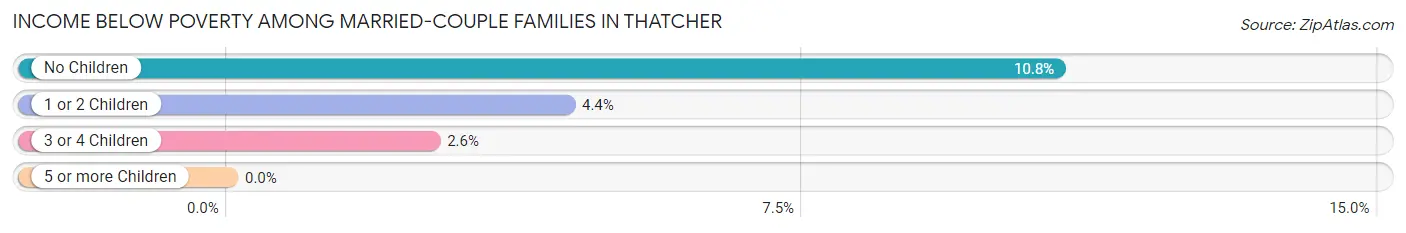
| Children | Above Poverty | Below Poverty |
| No Children | 462 (89.2%) | 56 (10.8%) |
| 1 or 2 Children | 239 (95.6%) | 11 (4.4%) |
| 3 or 4 Children | 221 (97.4%) | 6 (2.6%) |
| 5 or more Children | 6 (100.0%) | 0 (0.0%) |
| Total | 928 (92.7%) | 73 (7.3%) |
Income Below Poverty Among Single-Parent Households in Thatcher
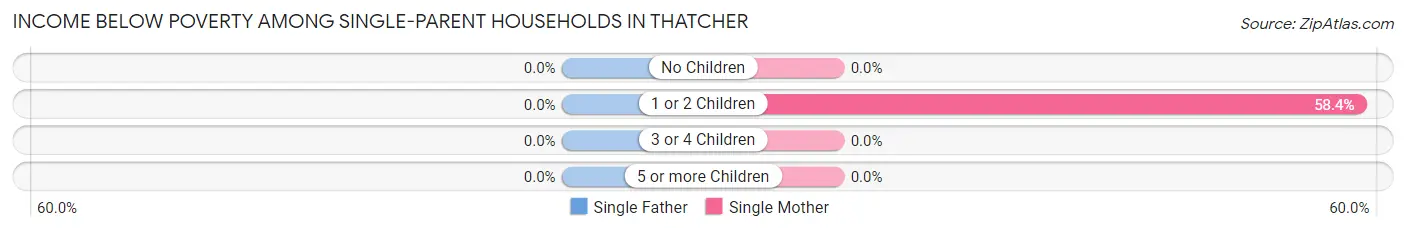
| Children | Single Father | Single Mother |
| No Children | 0 (0.0%) | 0 (0.0%) |
| 1 or 2 Children | 0 (0.0%) | 73 (58.4%) |
| 3 or 4 Children | 0 (0.0%) | 0 (0.0%) |
| 5 or more Children | 0 (0.0%) | 0 (0.0%) |
| Total | 0 (0.0%) | 73 (32.6%) |
Income Below Poverty Among Married-Couple vs Single-Parent Households in Thatcher
The poverty data for Thatcher shows that 73 of the married-couple family households (7.3%) and 73 of the single-parent households (26.2%) are living below the poverty level. Within the married-couple family households, those with no children have the highest poverty rate, with 56 households (10.8%) falling below the poverty line. Among the single-parent households, those with 1 or 2 children have the highest poverty rate, with 73 household (42.4%) living below poverty.
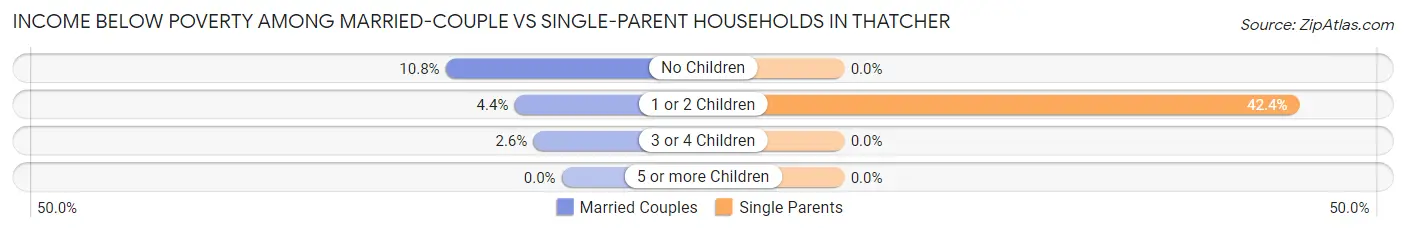
| Children | Married-Couple Families | Single-Parent Households |
| No Children | 56 (10.8%) | 0 (0.0%) |
| 1 or 2 Children | 11 (4.4%) | 73 (42.4%) |
| 3 or 4 Children | 6 (2.6%) | 0 (0.0%) |
| 5 or more Children | 0 (0.0%) | 0 (0.0%) |
| Total | 73 (7.3%) | 73 (26.2%) |
Race in Thatcher
The most populous races in Thatcher are White / Caucasian (4,809 | 91.1%), Hispanic or Latino (885 | 16.8%), and Two or more Races (294 | 5.6%).
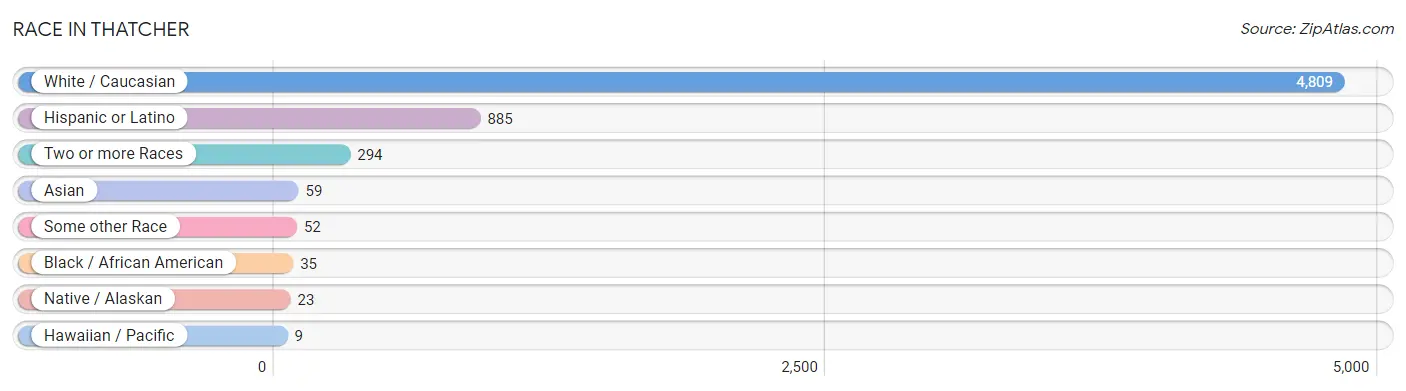
| Race | # Population | % Population |
| Asian | 59 | 1.1% |
| Black / African American | 35 | 0.7% |
| Hawaiian / Pacific | 9 | 0.2% |
| Hispanic or Latino | 885 | 16.8% |
| Native / Alaskan | 23 | 0.4% |
| White / Caucasian | 4,809 | 91.1% |
| Two or more Races | 294 | 5.6% |
| Some other Race | 52 | 1.0% |
| Total | 5,281 | 100.0% |
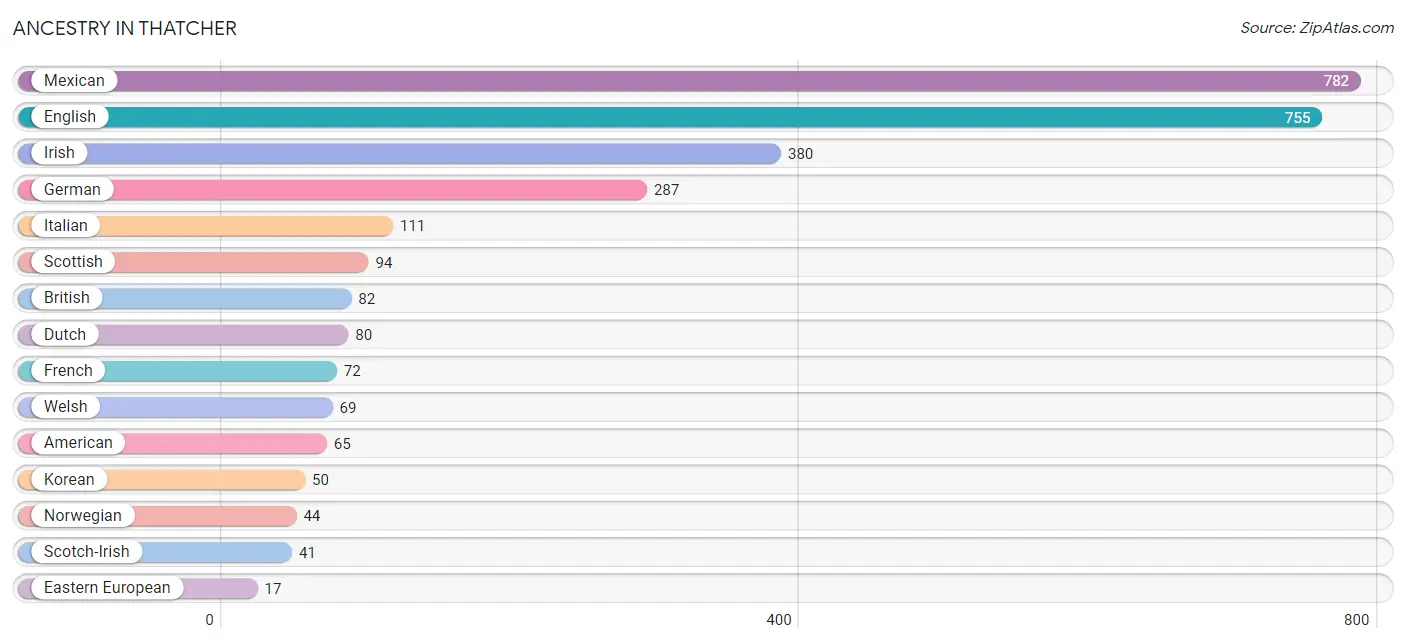
Ancestry in Thatcher
The most populous ancestries reported in Thatcher are Mexican (782 | 14.8%), English (755 | 14.3%), Irish (380 | 7.2%), German (287 | 5.4%), and Italian (111 | 2.1%), together accounting for 43.8% of all Thatcher residents.
| Ancestry | # Population | % Population |
| American | 65 | 1.2% |
| Apache | 7 | 0.1% |
| Australian | 4 | 0.1% |
| British | 82 | 1.5% |
| Canadian | 11 | 0.2% |
| Celtic | 13 | 0.3% |
| Cherokee | 7 | 0.1% |
| Danish | 10 | 0.2% |
| Dutch | 80 | 1.5% |
| Eastern European | 17 | 0.3% |
| English | 755 | 14.3% |
| European | 12 | 0.2% |
| French | 72 | 1.4% |
| French Canadian | 5 | 0.1% |
| German | 287 | 5.4% |
| Guamanian / Chamorro | 9 | 0.2% |
| Irish | 380 | 7.2% |
| Italian | 111 | 2.1% |
| Korean | 50 | 0.9% |
| Mexican | 782 | 14.8% |
| Mexican American Indian | 14 | 0.3% |
| Norwegian | 44 | 0.8% |
| Russian | 16 | 0.3% |
| Scotch-Irish | 41 | 0.8% |
| Scottish | 94 | 1.8% |
| Slovak | 4 | 0.1% |
| Spaniard | 14 | 0.3% |
| Swedish | 9 | 0.2% |
| Swiss | 14 | 0.3% |
| Thai | 9 | 0.2% |
| Welsh | 69 | 1.3% |
| Yaqui | 7 | 0.1% | View All 32 Rows |
Immigrants in Thatcher
The most numerous immigrant groups reported in Thatcher came from Asia (59 | 1.1%), Central America (53 | 1.0%), Latin America (53 | 1.0%), Mexico (53 | 1.0%), and Philippines (50 | 0.9%), together accounting for 5.1% of all Thatcher residents.
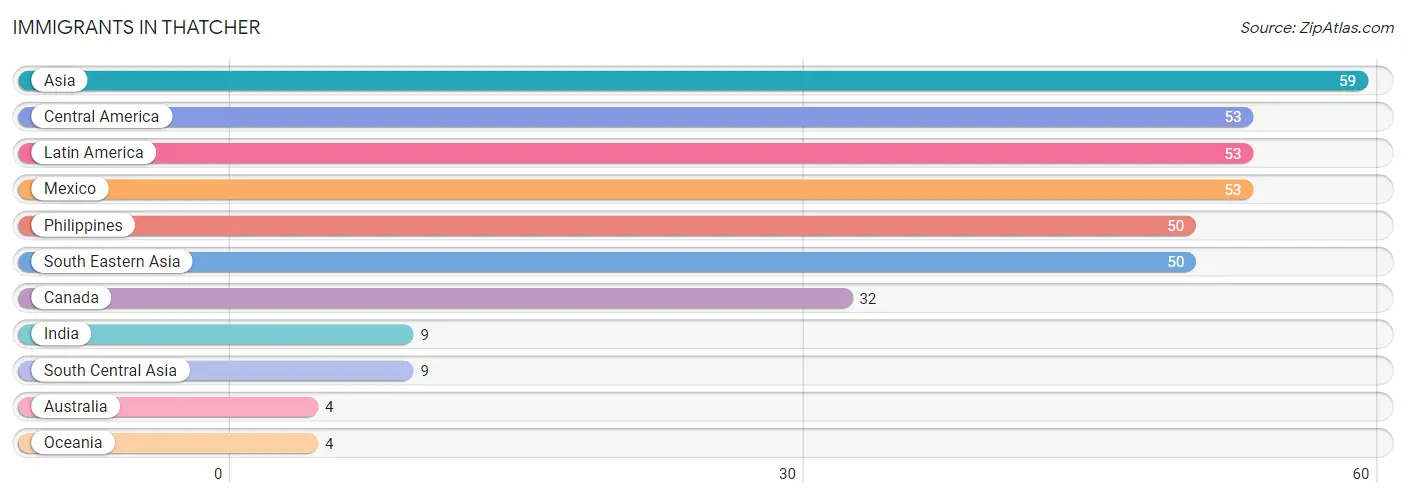
| Immigration Origin | # Population | % Population |
| Asia | 59 | 1.1% |
| Australia | 4 | 0.1% |
| Canada | 32 | 0.6% |
| Central America | 53 | 1.0% |
| India | 9 | 0.2% |
| Latin America | 53 | 1.0% |
| Mexico | 53 | 1.0% |
| Oceania | 4 | 0.1% |
| Philippines | 50 | 0.9% |
| South Central Asia | 9 | 0.2% |
| South Eastern Asia | 50 | 0.9% | View All 11 Rows |
Sex and Age in Thatcher
Sex and Age in Thatcher
The most populous age groups in Thatcher are 10 to 14 Years (445 | 16.4%) for men and 15 to 19 Years (360 | 14.0%) for women.
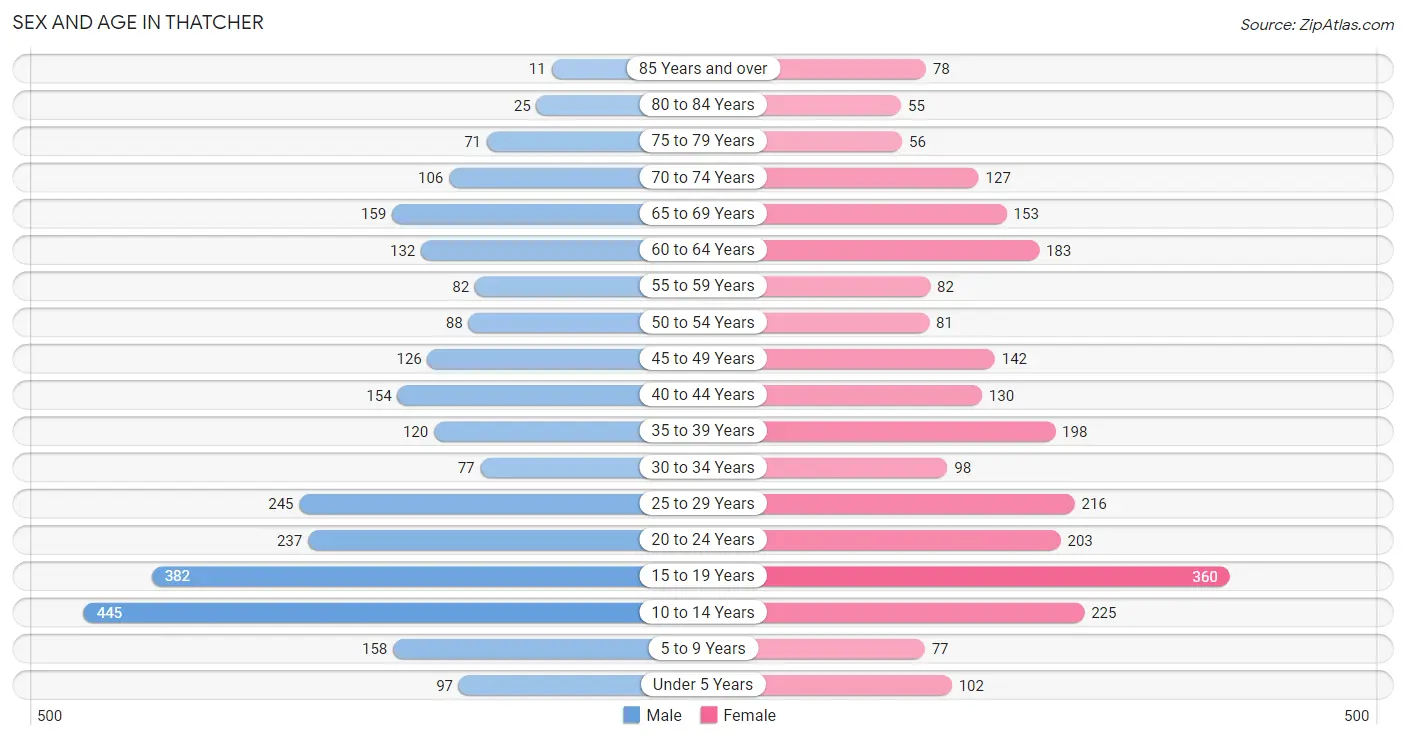
| Age Bracket | Male | Female |
| Under 5 Years | 97 (3.6%) | 102 (4.0%) |
| 5 to 9 Years | 158 (5.8%) | 77 (3.0%) |
| 10 to 14 Years | 445 (16.4%) | 225 (8.8%) |
| 15 to 19 Years | 382 (14.1%) | 360 (14.0%) |
| 20 to 24 Years | 237 (8.7%) | 203 (7.9%) |
| 25 to 29 Years | 245 (9.0%) | 216 (8.4%) |
| 30 to 34 Years | 77 (2.8%) | 98 (3.8%) |
| 35 to 39 Years | 120 (4.4%) | 198 (7.7%) |
| 40 to 44 Years | 154 (5.7%) | 130 (5.1%) |
| 45 to 49 Years | 126 (4.6%) | 142 (5.5%) |
| 50 to 54 Years | 88 (3.2%) | 81 (3.2%) |
| 55 to 59 Years | 82 (3.0%) | 82 (3.2%) |
| 60 to 64 Years | 132 (4.9%) | 183 (7.1%) |
| 65 to 69 Years | 159 (5.9%) | 153 (6.0%) |
| 70 to 74 Years | 106 (3.9%) | 127 (5.0%) |
| 75 to 79 Years | 71 (2.6%) | 56 (2.2%) |
| 80 to 84 Years | 25 (0.9%) | 55 (2.1%) |
| 85 Years and over | 11 (0.4%) | 78 (3.0%) |
| Total | 2,715 (100.0%) | 2,566 (100.0%) |
Families and Households in Thatcher
Median Family Size in Thatcher
The median family size in Thatcher is 3.26 persons per family, with married-couple families (1,001 | 78.2%) accounting for the largest median family size of 3.4 persons per family. On the other hand, single male/father families (55 | 4.3%) represent the smallest median family size with 2.22 persons per family.
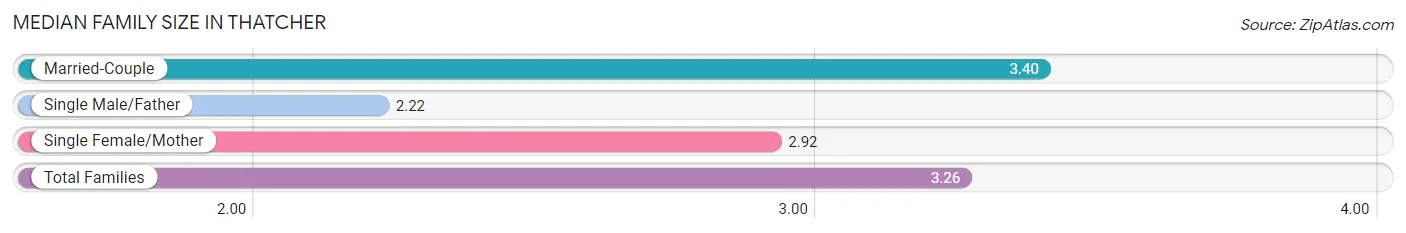
| Family Type | # Families | Family Size |
| Married-Couple | 1,001 (78.2%) | 3.40 |
| Single Male/Father | 55 (4.3%) | 2.22 |
| Single Female/Mother | 224 (17.5%) | 2.92 |
| Total Families | 1,280 (100.0%) | 3.26 |
Median Household Size in Thatcher
The median household size in Thatcher is 2.84 persons per household, with married-couple households (1,001 | 55.9%) accounting for the largest median household size of 3.43 persons per household. non-family households (510 | 28.5%) represent the smallest median household size with 1.44 persons per household.
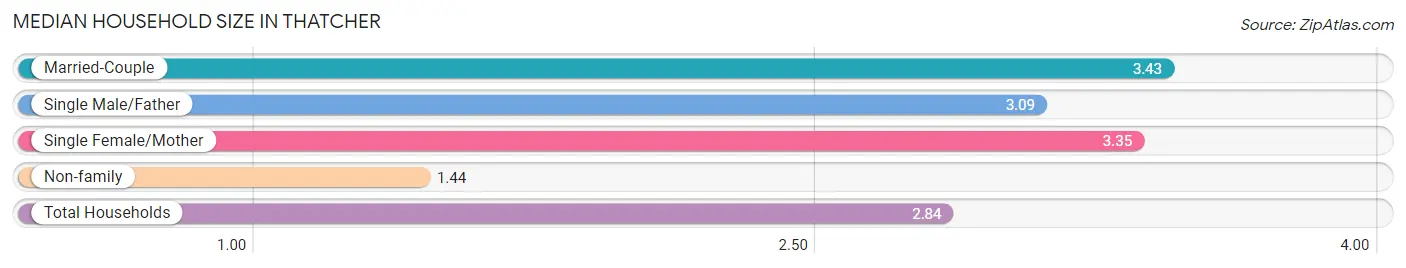
| Household Type | # Households | Household Size |
| Married-Couple | 1,001 (55.9%) | 3.43 |
| Single Male/Father | 55 (3.1%) | 3.09 |
| Single Female/Mother | 224 (12.5%) | 3.35 |
| Non-family | 510 (28.5%) | 1.44 |
| Total Households | 1,790 (100.0%) | 2.84 |
Household Size by Marriage Status in Thatcher
Out of a total of 1,790 households in Thatcher, 1,280 (71.5%) are family households, while 510 (28.5%) are nonfamily households. The most numerous type of family households are 2-person households, comprising 565, and the most common type of nonfamily households are 1-person households, comprising 350.
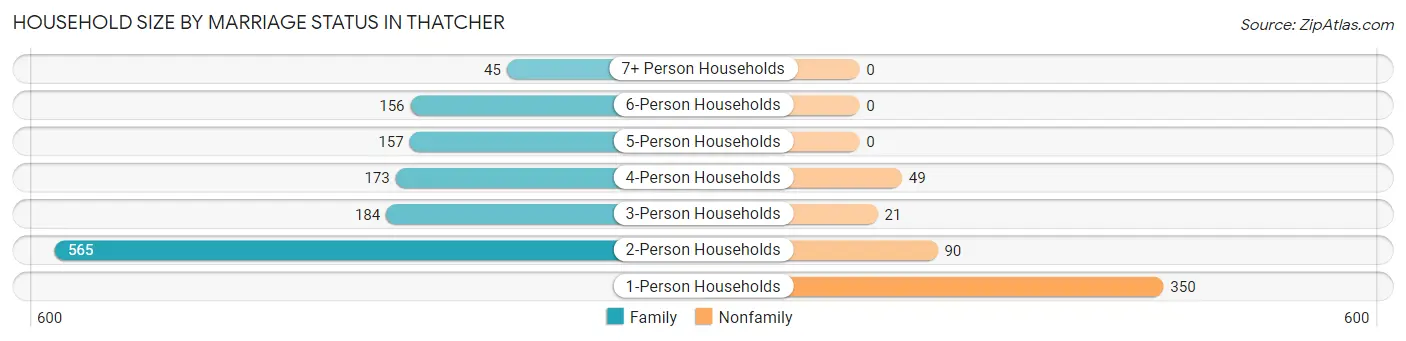
| Household Size | Family Households | Nonfamily Households |
| 1-Person Households | - | 350 (19.6%) |
| 2-Person Households | 565 (31.6%) | 90 (5.0%) |
| 3-Person Households | 184 (10.3%) | 21 (1.2%) |
| 4-Person Households | 173 (9.7%) | 49 (2.7%) |
| 5-Person Households | 157 (8.8%) | 0 (0.0%) |
| 6-Person Households | 156 (8.7%) | 0 (0.0%) |
| 7+ Person Households | 45 (2.5%) | 0 (0.0%) |
| Total | 1,280 (71.5%) | 510 (28.5%) |
Female Fertility in Thatcher
Fertility by Age in Thatcher
Average fertility rate in Thatcher is 52.0 births per 1,000 women. Women in the age bracket of 20 to 34 years have the highest fertility rate with 137.0 births per 1,000 women. Women in the age bracket of 20 to 34 years acount for 100.0% of all women with births.
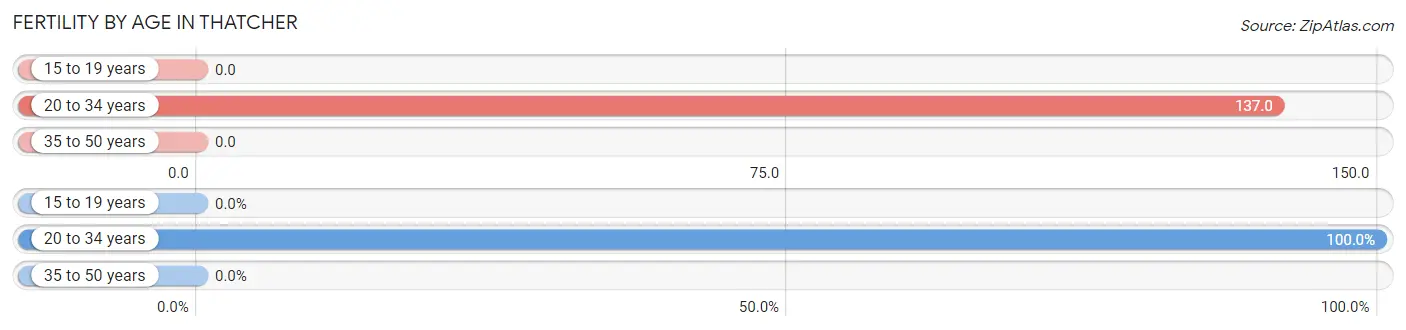
| Age Bracket | Women with Births | Births / 1,000 Women |
| 15 to 19 years | 0 (0.0%) | 0.0 |
| 20 to 34 years | 71 (100.0%) | 137.0 |
| 35 to 50 years | 0 (0.0%) | 0.0 |
| Total | 71 (100.0%) | 52.0 |
Fertility by Age by Marriage Status in Thatcher
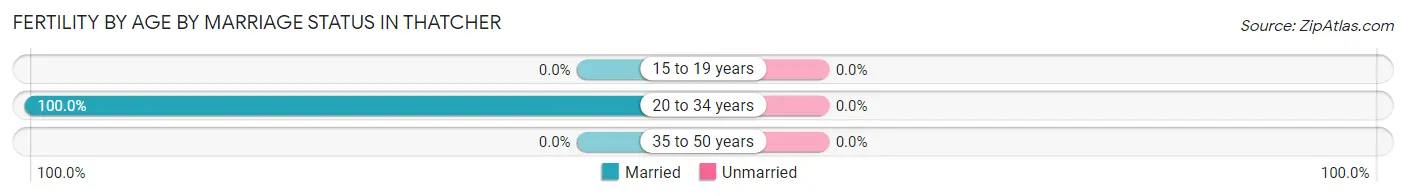
| Age Bracket | Married | Unmarried |
| 15 to 19 years | 0 (0.0%) | 0 (0.0%) |
| 20 to 34 years | 71 (100.0%) | 0 (0.0%) |
| 35 to 50 years | 0 (0.0%) | 0 (0.0%) |
| Total | 71 (100.0%) | 0 (0.0%) |
Fertility by Education in Thatcher
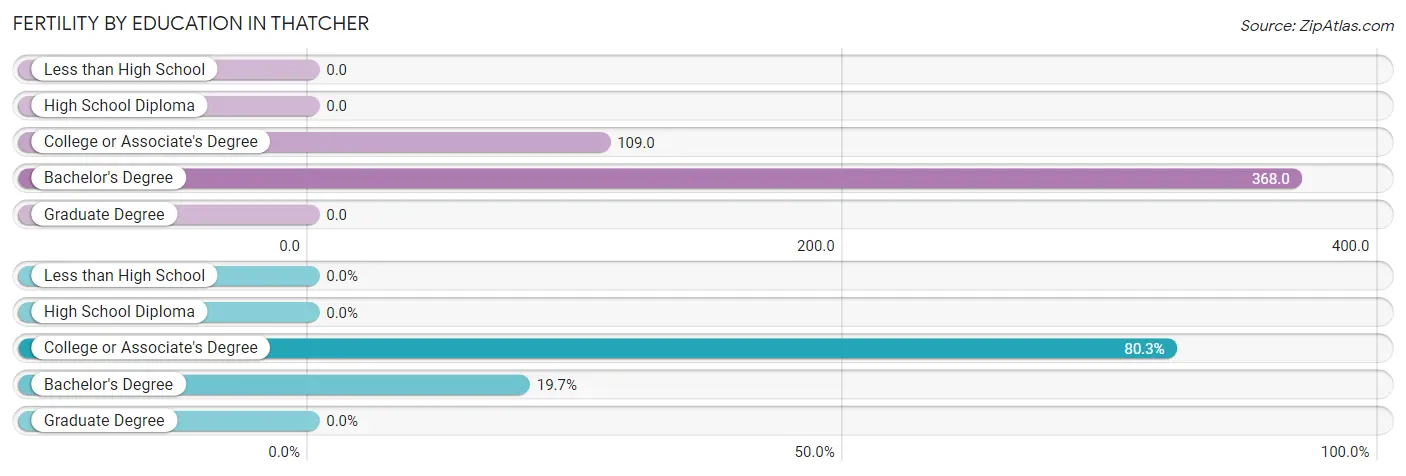
| Educational Attainment | Women with Births | Births / 1,000 Women |
| Less than High School | 0 (0.0%) | 0.0 |
| High School Diploma | 0 (0.0%) | 0.0 |
| College or Associate's Degree | 57 (80.3%) | 109.0 |
| Bachelor's Degree | 14 (19.7%) | 368.0 |
| Graduate Degree | 0 (0.0%) | 0.0 |
| Total | 71 (100.0%) | 52.0 |
Fertility by Education by Marriage Status in Thatcher
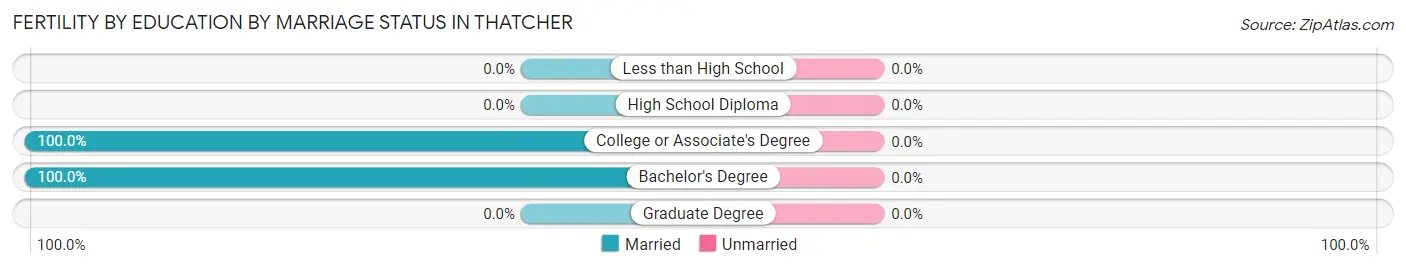
| Educational Attainment | Married | Unmarried |
| Less than High School | 0 (0.0%) | 0 (0.0%) |
| High School Diploma | 0 (0.0%) | 0 (0.0%) |
| College or Associate's Degree | 57 (100.0%) | 0 (0.0%) |
| Bachelor's Degree | 14 (100.0%) | 0 (0.0%) |
| Graduate Degree | 0 (0.0%) | 0 (0.0%) |
| Total | 71 (100.0%) | 0 (0.0%) |
Employment Characteristics in Thatcher
Employment by Class of Employer in Thatcher
Among the 2,129 employed individuals in Thatcher, private company employees (1,395 | 65.5%), local government employees (205 | 9.6%), and state government employees (181 | 8.5%) make up the most common classes of employment.
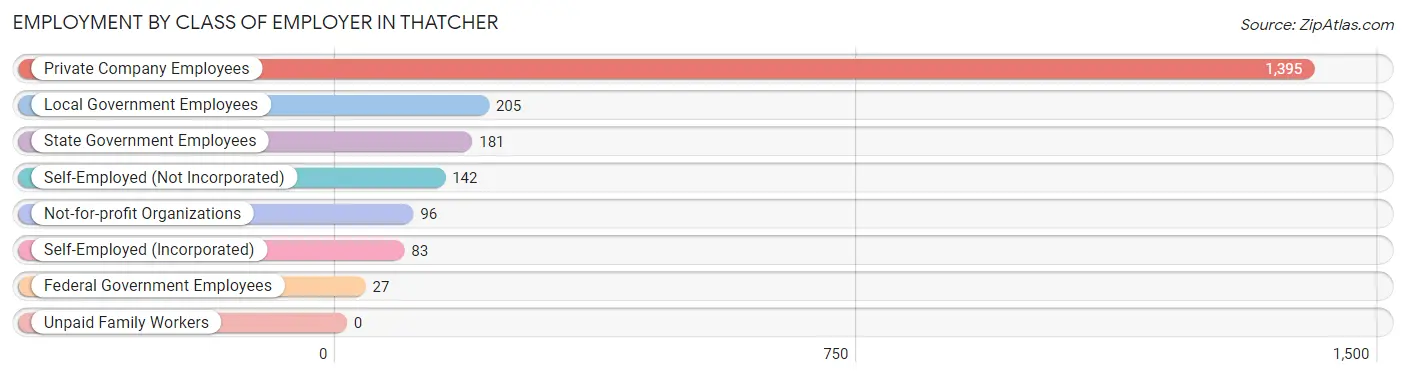
| Employer Class | # Employees | % Employees |
| Private Company Employees | 1,395 | 65.5% |
| Self-Employed (Incorporated) | 83 | 3.9% |
| Self-Employed (Not Incorporated) | 142 | 6.7% |
| Not-for-profit Organizations | 96 | 4.5% |
| Local Government Employees | 205 | 9.6% |
| State Government Employees | 181 | 8.5% |
| Federal Government Employees | 27 | 1.3% |
| Unpaid Family Workers | 0 | 0.0% |
| Total | 2,129 | 100.0% |
Employment Status by Age in Thatcher
According to the labor force statistics for Thatcher, out of the total population over 16 years of age (4,107), 56.6% or 2,325 individuals are in the labor force, with 5.6% or 130 of them unemployed. The age group with the highest labor force participation rate is 25 to 29 years, with 90.9% or 419 individuals in the labor force. Within the labor force, the 20 to 24 years age range has the highest percentage of unemployed individuals, with 7.9% or 27 of them being unemployed.
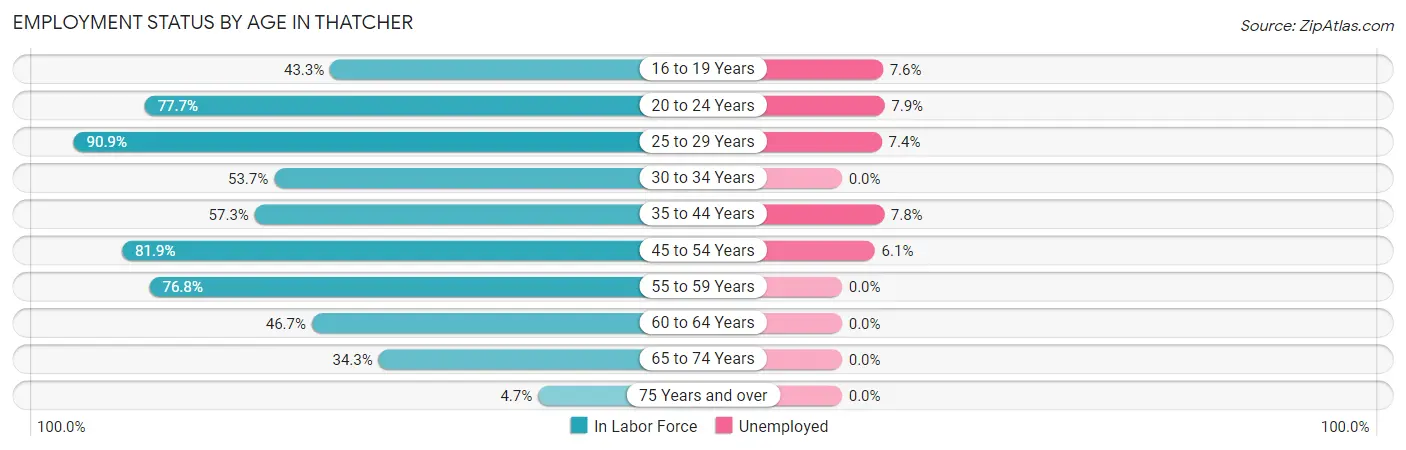
| Age Bracket | In Labor Force | Unemployed |
| 16 to 19 Years | 291 (43.3%) | 22 (7.6%) |
| 20 to 24 Years | 342 (77.7%) | 27 (7.9%) |
| 25 to 29 Years | 419 (90.9%) | 31 (7.4%) |
| 30 to 34 Years | 94 (53.7%) | 0 (0.0%) |
| 35 to 44 Years | 345 (57.3%) | 27 (7.8%) |
| 45 to 54 Years | 358 (81.9%) | 22 (6.1%) |
| 55 to 59 Years | 126 (76.8%) | 0 (0.0%) |
| 60 to 64 Years | 147 (46.7%) | 0 (0.0%) |
| 65 to 74 Years | 187 (34.3%) | 0 (0.0%) |
| 75 Years and over | 14 (4.7%) | 0 (0.0%) |
| Total | 2,325 (56.6%) | 130 (5.6%) |
Employment Status by Educational Attainment in Thatcher
According to labor force statistics for Thatcher, 69.1% of individuals (1,488) out of the total population between 25 and 64 years of age (2,154) are in the labor force, with 5.4% or 80 of them being unemployed. The group with the highest labor force participation rate are those with the educational attainment of high school diploma, with 79.9% or 393 individuals in the labor force. Within the labor force, individuals with less than high school education have the highest percentage of unemployment, with 19.7% or 27 of them being unemployed.
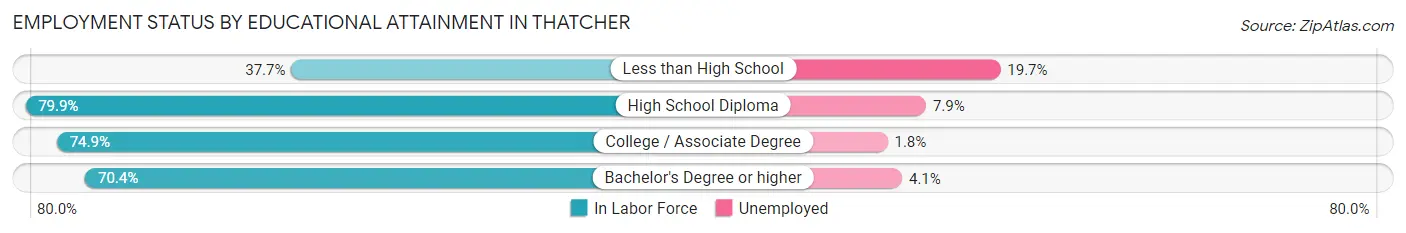
| Educational Attainment | In Labor Force | Unemployed |
| Less than High School | 137 (37.7%) | 72 (19.7%) |
| High School Diploma | 393 (79.9%) | 39 (7.9%) |
| College / Associate Degree | 740 (74.9%) | 18 (1.8%) |
| Bachelor's Degree or higher | 219 (70.4%) | 13 (4.1%) |
| Total | 1,488 (69.1%) | 116 (5.4%) |
Employment Occupations by Sex in Thatcher
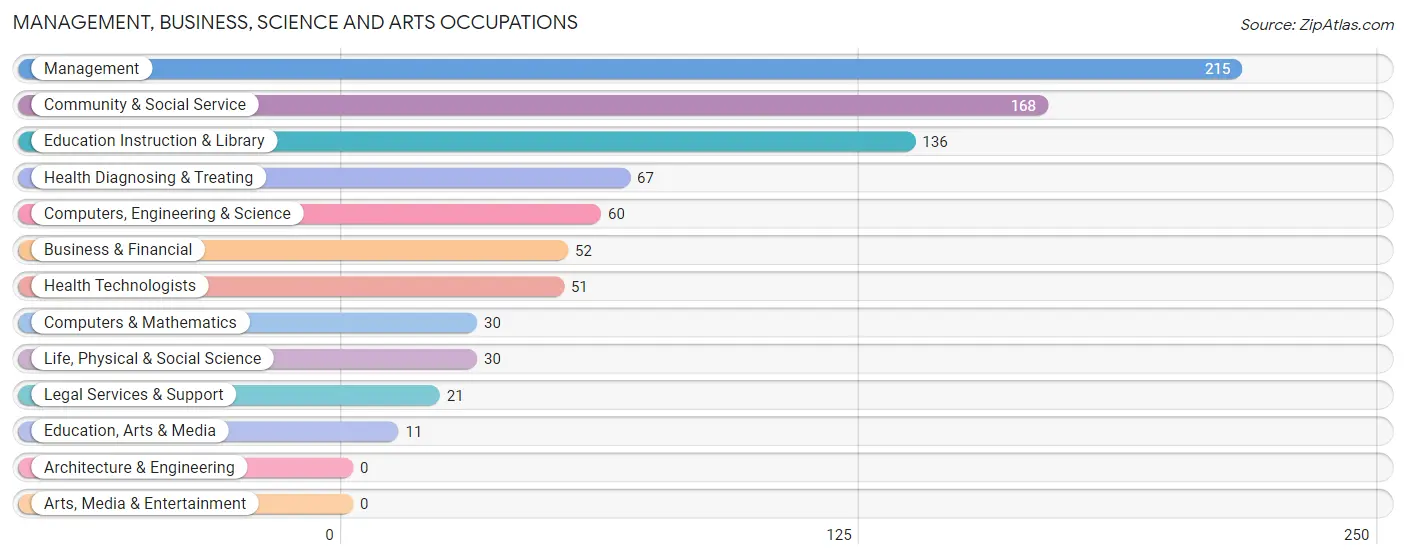
Management, Business, Science and Arts Occupations
The most common Management, Business, Science and Arts occupations in Thatcher are Management (215 | 9.8%), Community & Social Service (168 | 7.7%), Education Instruction & Library (136 | 6.2%), Health Diagnosing & Treating (67 | 3.0%), and Computers, Engineering & Science (60 | 2.7%).
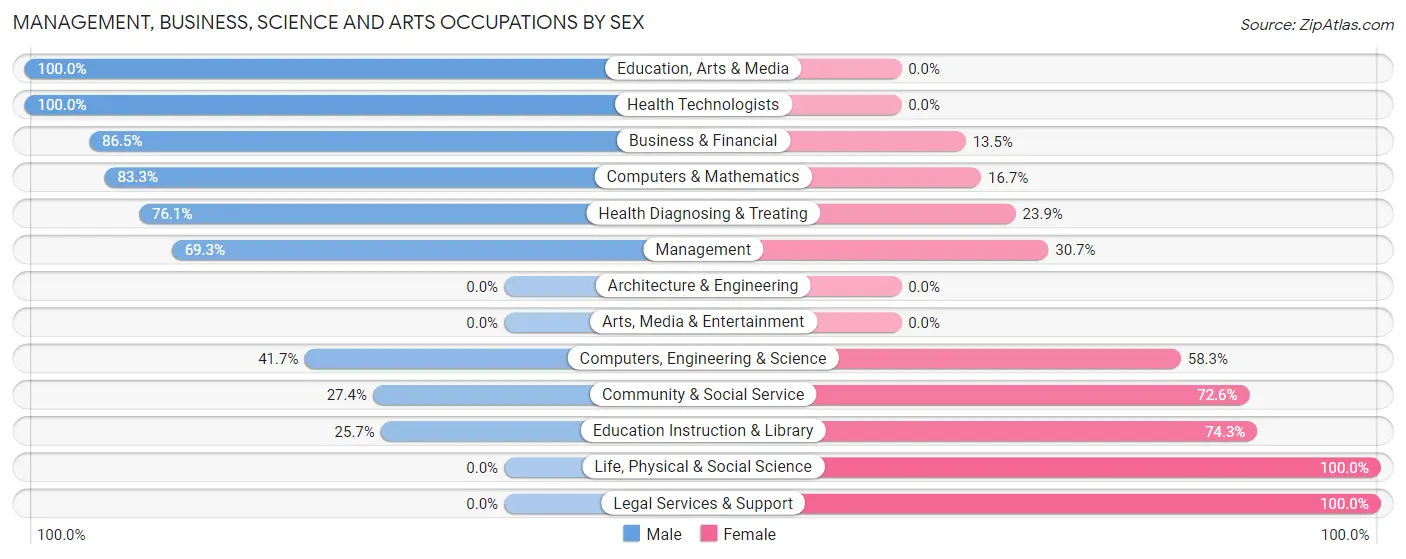
Management, Business, Science and Arts Occupations by Sex
Within the Management, Business, Science and Arts occupations in Thatcher, the most male-oriented occupations are Education, Arts & Media (100.0%), Health Technologists (100.0%), and Business & Financial (86.5%), while the most female-oriented occupations are Life, Physical & Social Science (100.0%), Legal Services & Support (100.0%), and Education Instruction & Library (74.3%).
| Occupation | Male | Female |
| Management | 149 (69.3%) | 66 (30.7%) |
| Business & Financial | 45 (86.5%) | 7 (13.5%) |
| Computers, Engineering & Science | 25 (41.7%) | 35 (58.3%) |
| Computers & Mathematics | 25 (83.3%) | 5 (16.7%) |
| Architecture & Engineering | 0 (0.0%) | 0 (0.0%) |
| Life, Physical & Social Science | 0 (0.0%) | 30 (100.0%) |
| Community & Social Service | 46 (27.4%) | 122 (72.6%) |
| Education, Arts & Media | 11 (100.0%) | 0 (0.0%) |
| Legal Services & Support | 0 (0.0%) | 21 (100.0%) |
| Education Instruction & Library | 35 (25.7%) | 101 (74.3%) |
| Arts, Media & Entertainment | 0 (0.0%) | 0 (0.0%) |
| Health Diagnosing & Treating | 51 (76.1%) | 16 (23.9%) |
| Health Technologists | 51 (100.0%) | 0 (0.0%) |
| Total (Category) | 316 (56.2%) | 246 (43.8%) |
| Total (Overall) | 1,264 (57.6%) | 930 (42.4%) |
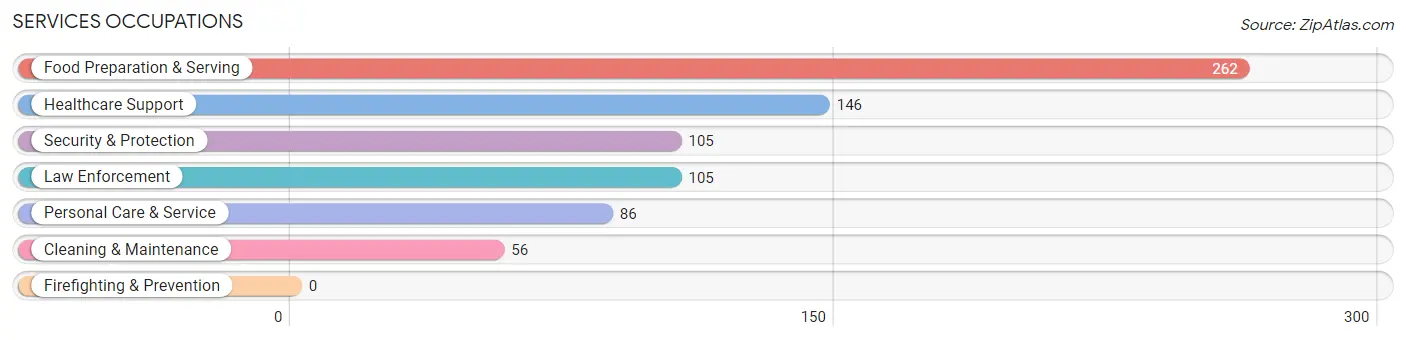
Services Occupations
The most common Services occupations in Thatcher are Food Preparation & Serving (262 | 11.9%), Healthcare Support (146 | 6.7%), Security & Protection (105 | 4.8%), Law Enforcement (105 | 4.8%), and Personal Care & Service (86 | 3.9%).
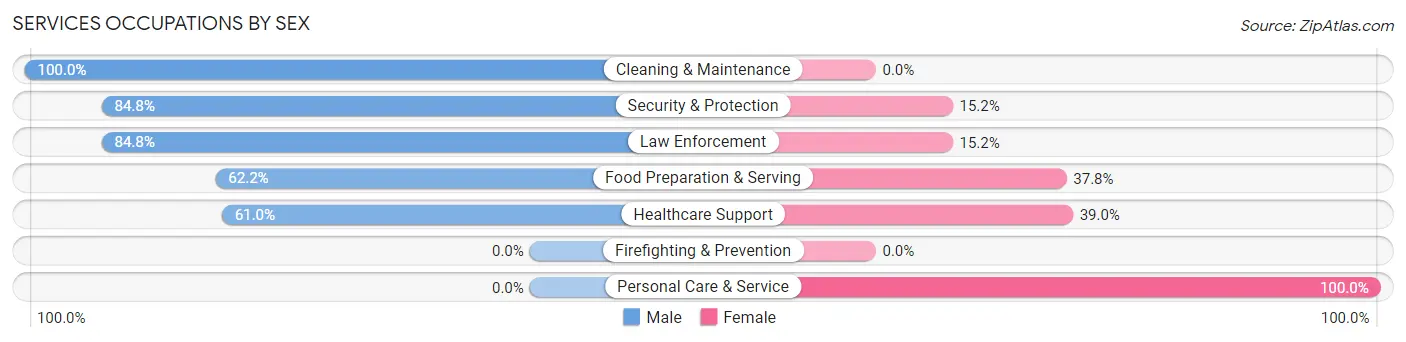
Services Occupations by Sex
Within the Services occupations in Thatcher, the most male-oriented occupations are Cleaning & Maintenance (100.0%), Security & Protection (84.8%), and Law Enforcement (84.8%), while the most female-oriented occupations are Personal Care & Service (100.0%), Healthcare Support (39.0%), and Food Preparation & Serving (37.8%).
| Occupation | Male | Female |
| Healthcare Support | 89 (61.0%) | 57 (39.0%) |
| Security & Protection | 89 (84.8%) | 16 (15.2%) |
| Firefighting & Prevention | 0 (0.0%) | 0 (0.0%) |
| Law Enforcement | 89 (84.8%) | 16 (15.2%) |
| Food Preparation & Serving | 163 (62.2%) | 99 (37.8%) |
| Cleaning & Maintenance | 56 (100.0%) | 0 (0.0%) |
| Personal Care & Service | 0 (0.0%) | 86 (100.0%) |
| Total (Category) | 397 (60.6%) | 258 (39.4%) |
| Total (Overall) | 1,264 (57.6%) | 930 (42.4%) |
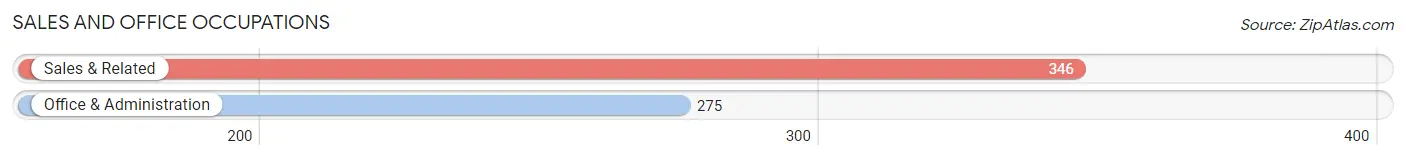
Sales and Office Occupations
The most common Sales and Office occupations in Thatcher are Sales & Related (346 | 15.8%), and Office & Administration (275 | 12.5%).
Sales and Office Occupations by Sex
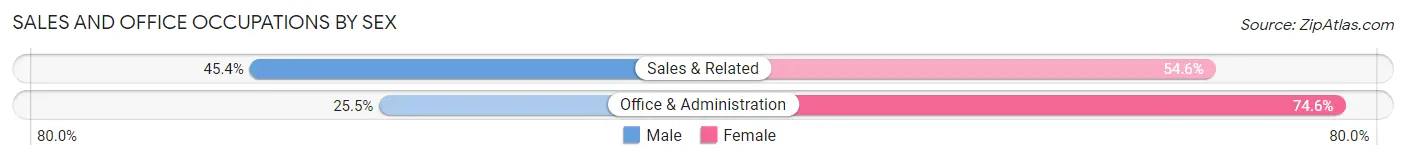
| Occupation | Male | Female |
| Sales & Related | 157 (45.4%) | 189 (54.6%) |
| Office & Administration | 70 (25.5%) | 205 (74.6%) |
| Total (Category) | 227 (36.5%) | 394 (63.4%) |
| Total (Overall) | 1,264 (57.6%) | 930 (42.4%) |
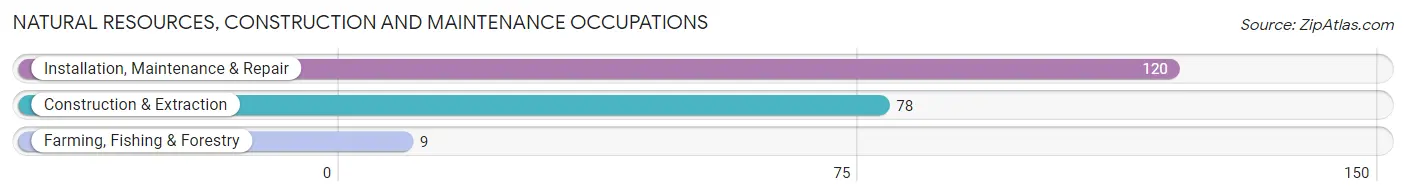
Natural Resources, Construction and Maintenance Occupations
The most common Natural Resources, Construction and Maintenance occupations in Thatcher are Installation, Maintenance & Repair (120 | 5.5%), Construction & Extraction (78 | 3.6%), and Farming, Fishing & Forestry (9 | 0.4%).
Natural Resources, Construction and Maintenance Occupations by Sex
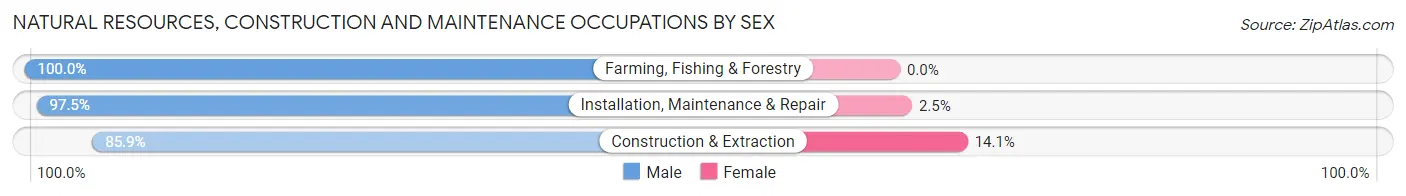
| Occupation | Male | Female |
| Farming, Fishing & Forestry | 9 (100.0%) | 0 (0.0%) |
| Construction & Extraction | 67 (85.9%) | 11 (14.1%) |
| Installation, Maintenance & Repair | 117 (97.5%) | 3 (2.5%) |
| Total (Category) | 193 (93.2%) | 14 (6.8%) |
| Total (Overall) | 1,264 (57.6%) | 930 (42.4%) |
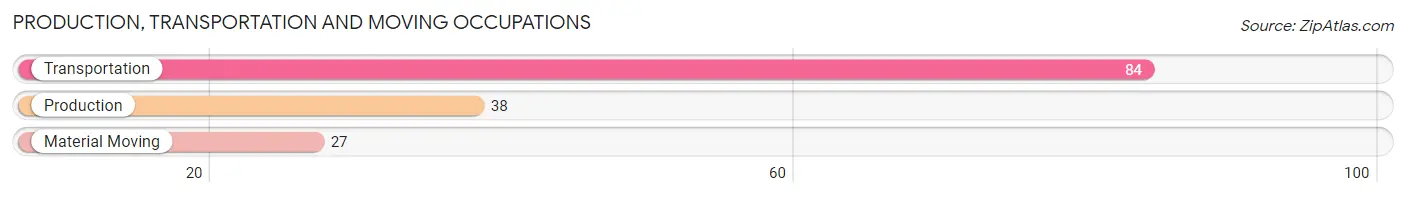
Production, Transportation and Moving Occupations
The most common Production, Transportation and Moving occupations in Thatcher are Transportation (84 | 3.8%), Production (38 | 1.7%), and Material Moving (27 | 1.2%).
Production, Transportation and Moving Occupations by Sex
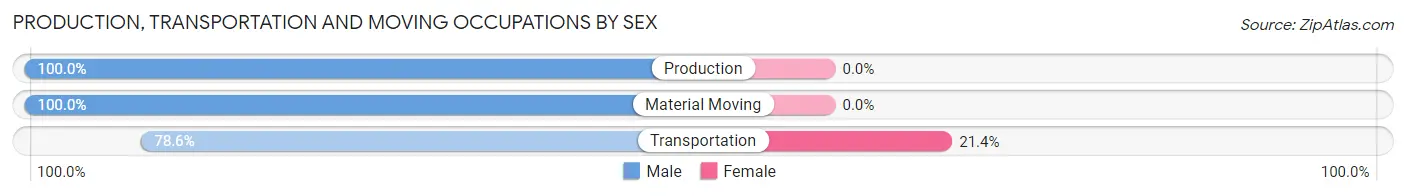
| Occupation | Male | Female |
| Production | 38 (100.0%) | 0 (0.0%) |
| Transportation | 66 (78.6%) | 18 (21.4%) |
| Material Moving | 27 (100.0%) | 0 (0.0%) |
| Total (Category) | 131 (87.9%) | 18 (12.1%) |
| Total (Overall) | 1,264 (57.6%) | 930 (42.4%) |
Employment Industries by Sex in Thatcher
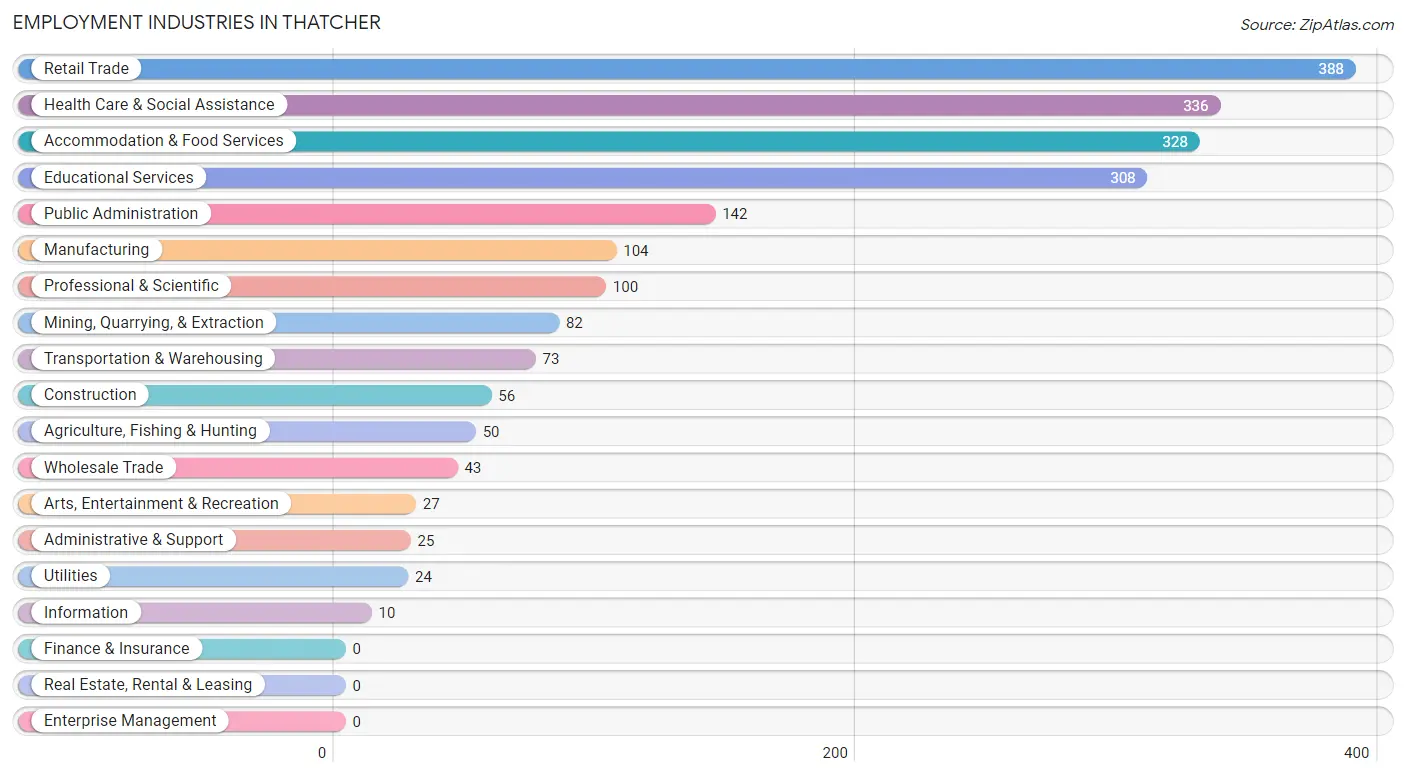
Employment Industries in Thatcher
The major employment industries in Thatcher include Retail Trade (388 | 17.7%), Health Care & Social Assistance (336 | 15.3%), Accommodation & Food Services (328 | 14.9%), Educational Services (308 | 14.0%), and Public Administration (142 | 6.5%).
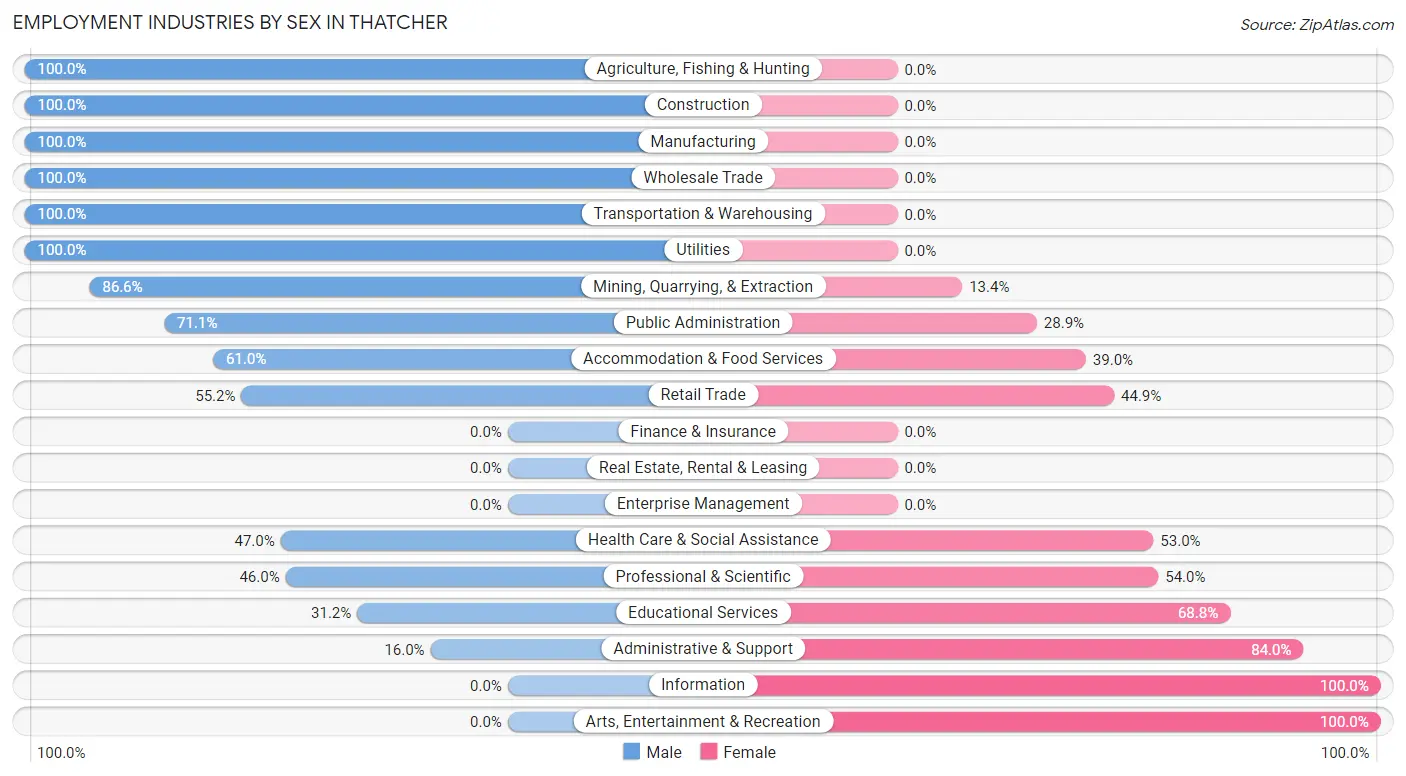
Employment Industries by Sex in Thatcher
The Thatcher industries that see more men than women are Agriculture, Fishing & Hunting (100.0%), Construction (100.0%), and Manufacturing (100.0%), whereas the industries that tend to have a higher number of women are Information (100.0%), Arts, Entertainment & Recreation (100.0%), and Administrative & Support (84.0%).
| Industry | Male | Female |
| Agriculture, Fishing & Hunting | 50 (100.0%) | 0 (0.0%) |
| Mining, Quarrying, & Extraction | 71 (86.6%) | 11 (13.4%) |
| Construction | 56 (100.0%) | 0 (0.0%) |
| Manufacturing | 104 (100.0%) | 0 (0.0%) |
| Wholesale Trade | 43 (100.0%) | 0 (0.0%) |
| Retail Trade | 214 (55.1%) | 174 (44.9%) |
| Transportation & Warehousing | 73 (100.0%) | 0 (0.0%) |
| Utilities | 24 (100.0%) | 0 (0.0%) |
| Information | 0 (0.0%) | 10 (100.0%) |
| Finance & Insurance | 0 (0.0%) | 0 (0.0%) |
| Real Estate, Rental & Leasing | 0 (0.0%) | 0 (0.0%) |
| Professional & Scientific | 46 (46.0%) | 54 (54.0%) |
| Enterprise Management | 0 (0.0%) | 0 (0.0%) |
| Administrative & Support | 4 (16.0%) | 21 (84.0%) |
| Educational Services | 96 (31.2%) | 212 (68.8%) |
| Health Care & Social Assistance | 158 (47.0%) | 178 (53.0%) |
| Arts, Entertainment & Recreation | 0 (0.0%) | 27 (100.0%) |
| Accommodation & Food Services | 200 (61.0%) | 128 (39.0%) |
| Public Administration | 101 (71.1%) | 41 (28.9%) |
| Total | 1,264 (57.6%) | 930 (42.4%) |
Education in Thatcher
School Enrollment in Thatcher
The most common levels of schooling among the 1,993 students in Thatcher are college / undergraduate (610 | 30.6%), middle school (501 | 25.1%), and high school (409 | 20.5%).
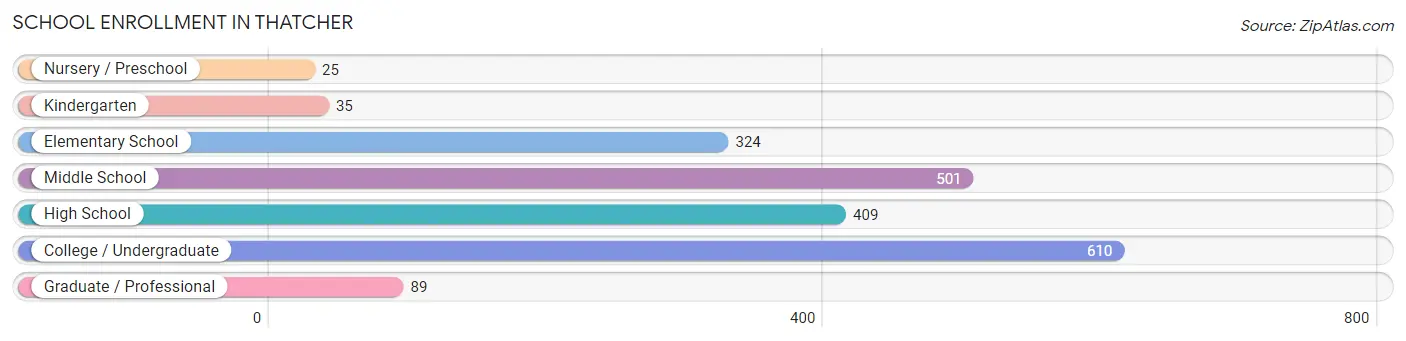
| School Level | # Students | % Students |
| Nursery / Preschool | 25 | 1.3% |
| Kindergarten | 35 | 1.8% |
| Elementary School | 324 | 16.3% |
| Middle School | 501 | 25.1% |
| High School | 409 | 20.5% |
| College / Undergraduate | 610 | 30.6% |
| Graduate / Professional | 89 | 4.5% |
| Total | 1,993 | 100.0% |
School Enrollment by Age by Funding Source in Thatcher
Out of a total of 1,993 students who are enrolled in schools in Thatcher, 345 (17.3%) attend a private institution, while the remaining 1,648 (82.7%) are enrolled in public schools. The age group of 3 to 4 year olds has the highest likelihood of being enrolled in private schools, with 15 (60.0% in the age bracket) enrolled. Conversely, the age group of 20 to 24 year olds has the lowest likelihood of being enrolled in a private school, with 230 (100.0% in the age bracket) attending a public institution.
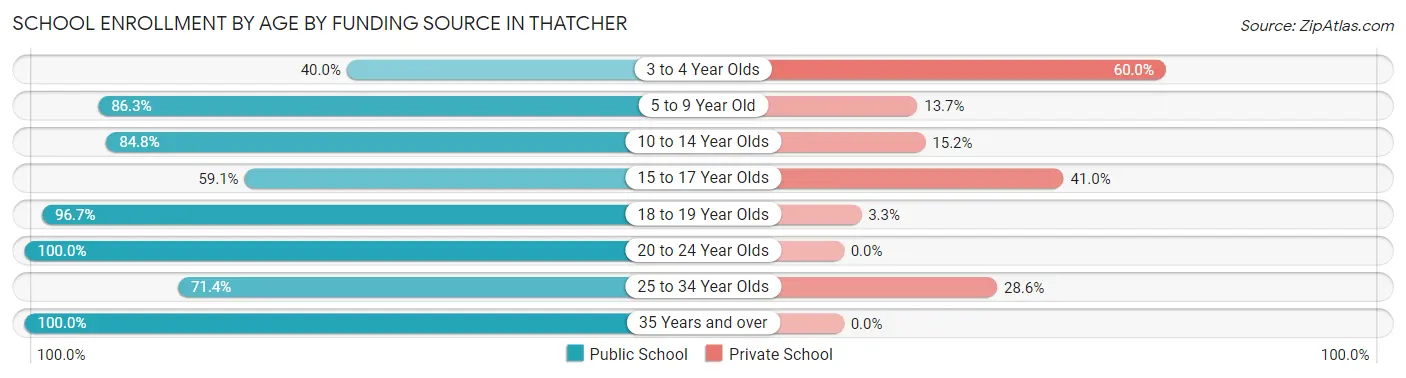
| Age Bracket | Public School | Private School |
| 3 to 4 Year Olds | 10 (40.0%) | 15 (60.0%) |
| 5 to 9 Year Old | 195 (86.3%) | 31 (13.7%) |
| 10 to 14 Year Olds | 568 (84.8%) | 102 (15.2%) |
| 15 to 17 Year Olds | 199 (59.1%) | 138 (40.9%) |
| 18 to 19 Year Olds | 267 (96.7%) | 9 (3.3%) |
| 20 to 24 Year Olds | 230 (100.0%) | 0 (0.0%) |
| 25 to 34 Year Olds | 125 (71.4%) | 50 (28.6%) |
| 35 Years and over | 54 (100.0%) | 0 (0.0%) |
| Total | 1,648 (82.7%) | 345 (17.3%) |
Educational Attainment by Field of Study in Thatcher
Education (147 | 27.0%), science & technology (104 | 19.1%), engineering (74 | 13.6%), bio, nature & agricultural (45 | 8.3%), and psychology (45 | 8.3%) are the most common fields of study among 544 individuals in Thatcher who have obtained a bachelor's degree or higher.
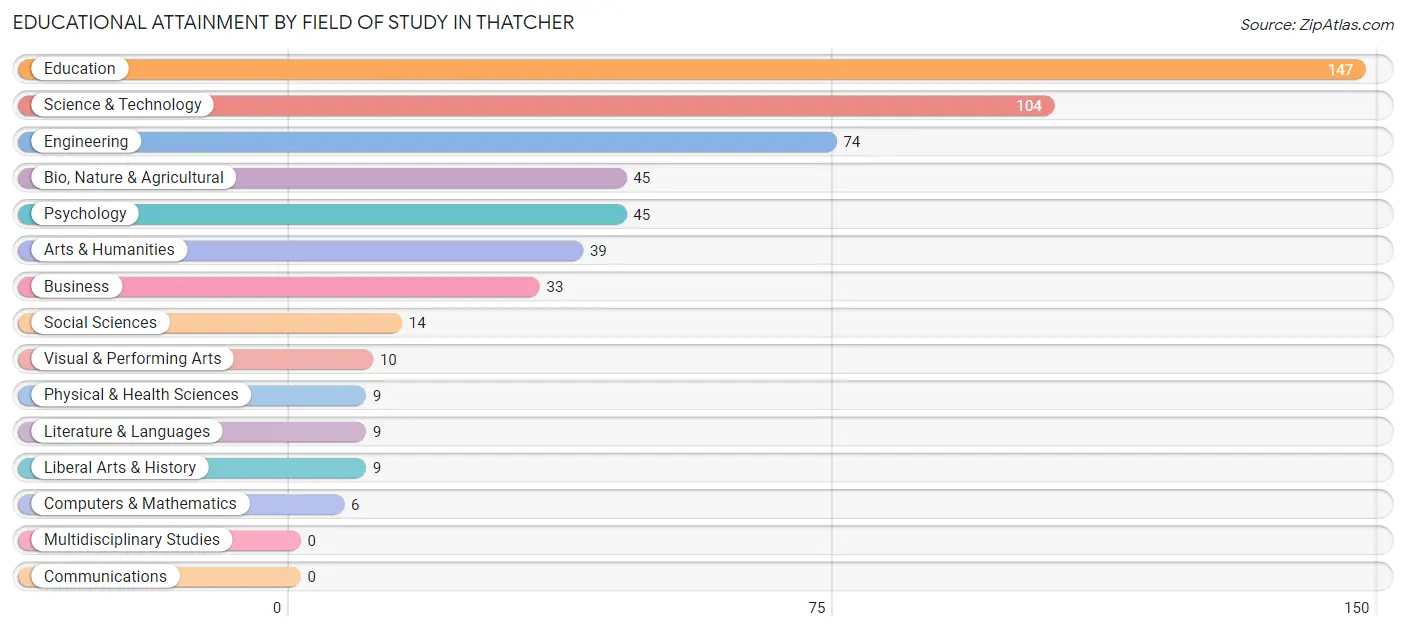
| Field of Study | # Graduates | % Graduates |
| Computers & Mathematics | 6 | 1.1% |
| Bio, Nature & Agricultural | 45 | 8.3% |
| Physical & Health Sciences | 9 | 1.7% |
| Psychology | 45 | 8.3% |
| Social Sciences | 14 | 2.6% |
| Engineering | 74 | 13.6% |
| Multidisciplinary Studies | 0 | 0.0% |
| Science & Technology | 104 | 19.1% |
| Business | 33 | 6.1% |
| Education | 147 | 27.0% |
| Literature & Languages | 9 | 1.7% |
| Liberal Arts & History | 9 | 1.7% |
| Visual & Performing Arts | 10 | 1.8% |
| Communications | 0 | 0.0% |
| Arts & Humanities | 39 | 7.2% |
| Total | 544 | 100.0% |
Transportation & Commute in Thatcher
Vehicle Availability by Sex in Thatcher
The most prevalent vehicle ownership categories in Thatcher are males with 2 vehicles (455, accounting for 37.0%) and females with 2 vehicles (308, making up 52.2%).
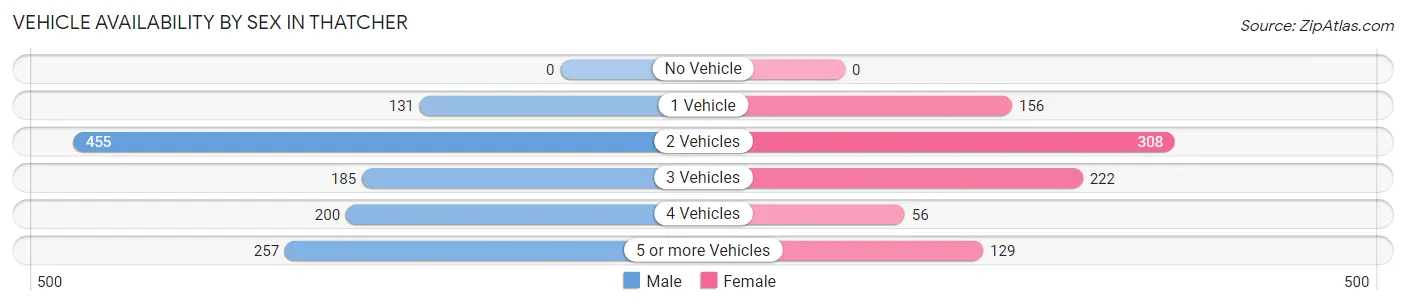
| Vehicles Available | Male | Female |
| No Vehicle | 0 (0.0%) | 0 (0.0%) |
| 1 Vehicle | 131 (10.7%) | 156 (17.9%) |
| 2 Vehicles | 455 (37.0%) | 308 (35.4%) |
| 3 Vehicles | 185 (15.1%) | 222 (25.5%) |
| 4 Vehicles | 200 (16.3%) | 56 (6.4%) |
| 5 or more Vehicles | 257 (20.9%) | 129 (14.8%) |
| Total | 1,228 (100.0%) | 871 (100.0%) |
Commute Time in Thatcher
The most frequently occuring commute durations in Thatcher are 10 to 14 minutes (689 commuters, 34.0%), 5 to 9 minutes (368 commuters, 18.1%), and less than 5 minutes (245 commuters, 12.1%).
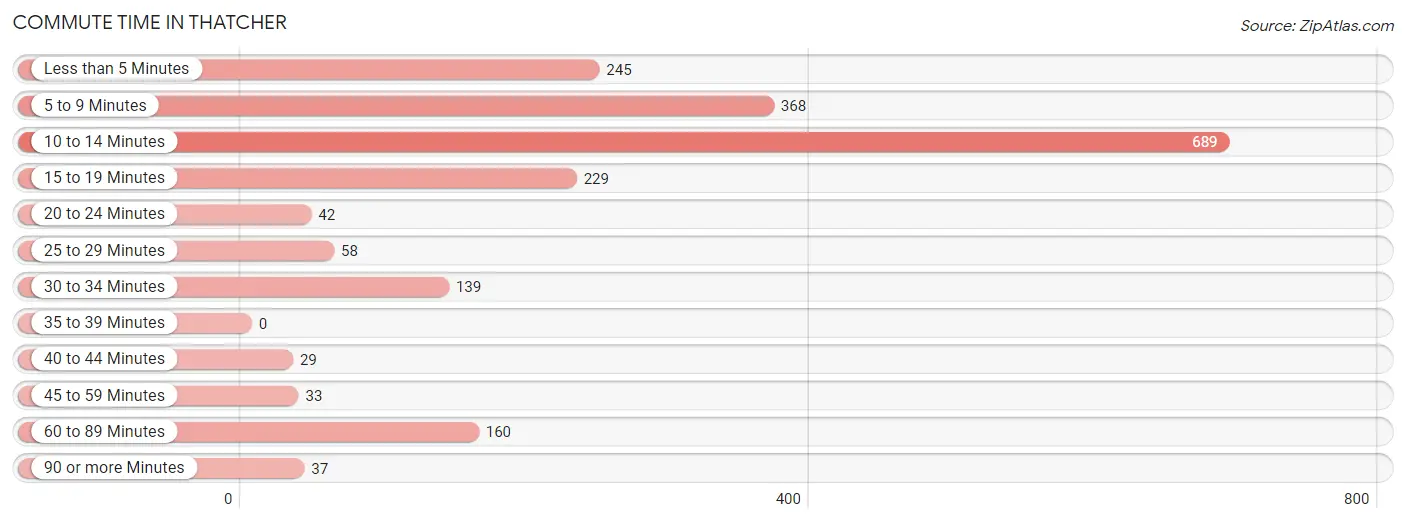
| Commute Time | # Commuters | % Commuters |
| Less than 5 Minutes | 245 | 12.1% |
| 5 to 9 Minutes | 368 | 18.1% |
| 10 to 14 Minutes | 689 | 34.0% |
| 15 to 19 Minutes | 229 | 11.3% |
| 20 to 24 Minutes | 42 | 2.1% |
| 25 to 29 Minutes | 58 | 2.9% |
| 30 to 34 Minutes | 139 | 6.9% |
| 35 to 39 Minutes | 0 | 0.0% |
| 40 to 44 Minutes | 29 | 1.4% |
| 45 to 59 Minutes | 33 | 1.6% |
| 60 to 89 Minutes | 160 | 7.9% |
| 90 or more Minutes | 37 | 1.8% |
Commute Time by Sex in Thatcher
The most common commute times in Thatcher are 10 to 14 minutes (392 commuters, 32.1%) for males and 10 to 14 minutes (297 commuters, 36.8%) for females.
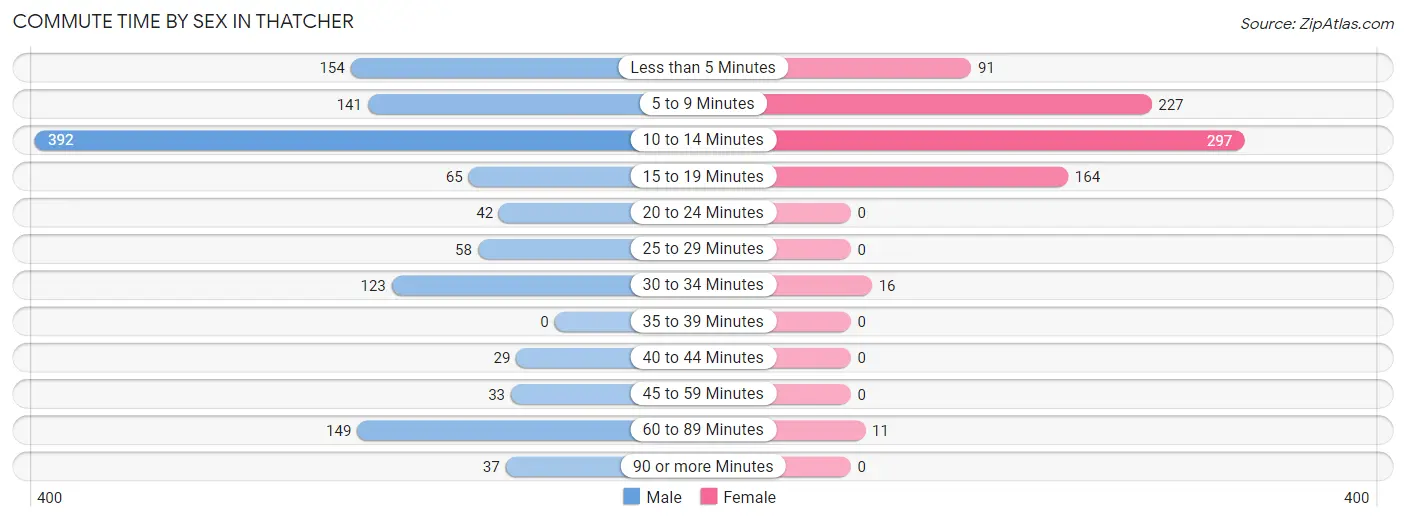
| Commute Time | Male | Female |
| Less than 5 Minutes | 154 (12.6%) | 91 (11.3%) |
| 5 to 9 Minutes | 141 (11.5%) | 227 (28.2%) |
| 10 to 14 Minutes | 392 (32.1%) | 297 (36.8%) |
| 15 to 19 Minutes | 65 (5.3%) | 164 (20.3%) |
| 20 to 24 Minutes | 42 (3.4%) | 0 (0.0%) |
| 25 to 29 Minutes | 58 (4.7%) | 0 (0.0%) |
| 30 to 34 Minutes | 123 (10.1%) | 16 (2.0%) |
| 35 to 39 Minutes | 0 (0.0%) | 0 (0.0%) |
| 40 to 44 Minutes | 29 (2.4%) | 0 (0.0%) |
| 45 to 59 Minutes | 33 (2.7%) | 0 (0.0%) |
| 60 to 89 Minutes | 149 (12.2%) | 11 (1.4%) |
| 90 or more Minutes | 37 (3.0%) | 0 (0.0%) |
Time of Departure to Work by Sex in Thatcher
The most frequent times of departure to work in Thatcher are 12:00 AM to 4:59 AM (464, 37.9%) for males and 7:30 AM to 7:59 AM (382, 47.4%) for females.
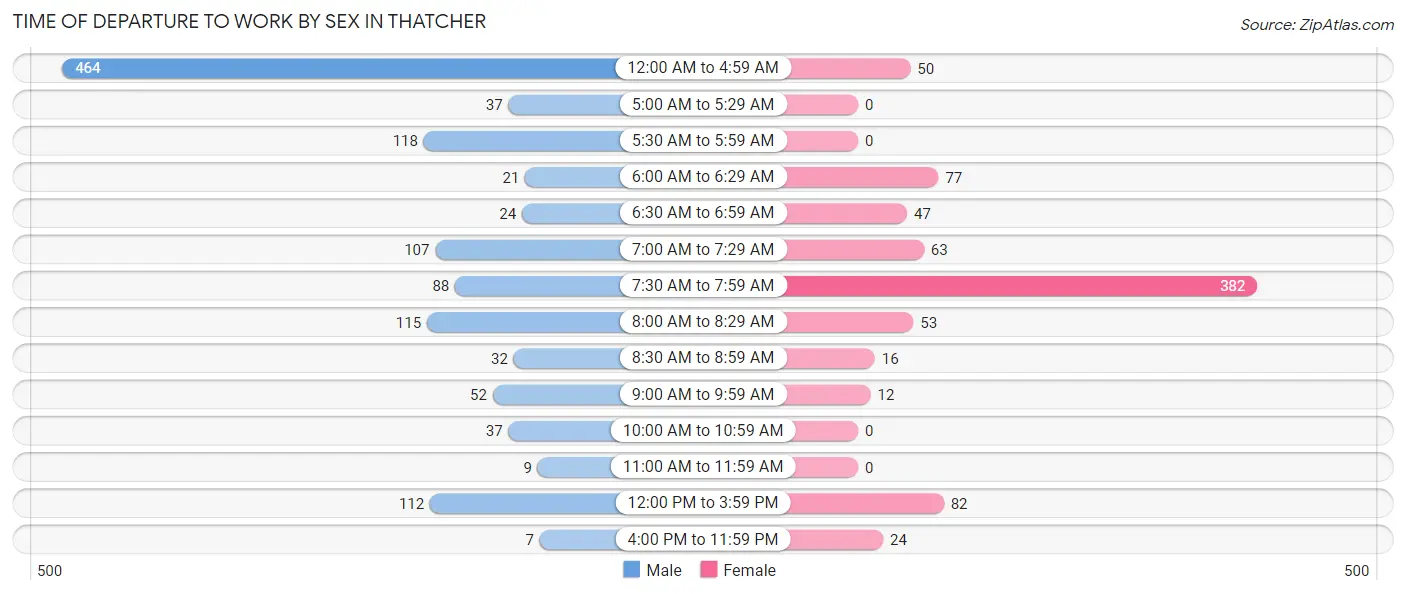
| Time of Departure | Male | Female |
| 12:00 AM to 4:59 AM | 464 (37.9%) | 50 (6.2%) |
| 5:00 AM to 5:29 AM | 37 (3.0%) | 0 (0.0%) |
| 5:30 AM to 5:59 AM | 118 (9.7%) | 0 (0.0%) |
| 6:00 AM to 6:29 AM | 21 (1.7%) | 77 (9.6%) |
| 6:30 AM to 6:59 AM | 24 (2.0%) | 47 (5.8%) |
| 7:00 AM to 7:29 AM | 107 (8.7%) | 63 (7.8%) |
| 7:30 AM to 7:59 AM | 88 (7.2%) | 382 (47.4%) |
| 8:00 AM to 8:29 AM | 115 (9.4%) | 53 (6.6%) |
| 8:30 AM to 8:59 AM | 32 (2.6%) | 16 (2.0%) |
| 9:00 AM to 9:59 AM | 52 (4.3%) | 12 (1.5%) |
| 10:00 AM to 10:59 AM | 37 (3.0%) | 0 (0.0%) |
| 11:00 AM to 11:59 AM | 9 (0.7%) | 0 (0.0%) |
| 12:00 PM to 3:59 PM | 112 (9.2%) | 82 (10.2%) |
| 4:00 PM to 11:59 PM | 7 (0.6%) | 24 (3.0%) |
| Total | 1,223 (100.0%) | 806 (100.0%) |
Housing Occupancy in Thatcher
Occupancy by Ownership in Thatcher
Of the total 1,790 dwellings in Thatcher, owner-occupied units account for 1,254 (70.1%), while renter-occupied units make up 536 (29.9%).
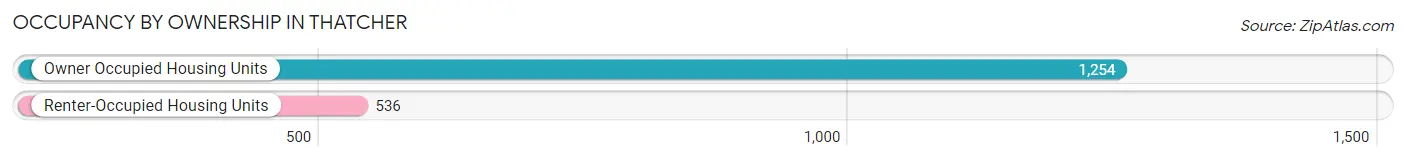
| Occupancy | # Housing Units | % Housing Units |
| Owner Occupied Housing Units | 1,254 | 70.1% |
| Renter-Occupied Housing Units | 536 | 29.9% |
| Total Occupied Housing Units | 1,790 | 100.0% |
Occupancy by Household Size in Thatcher
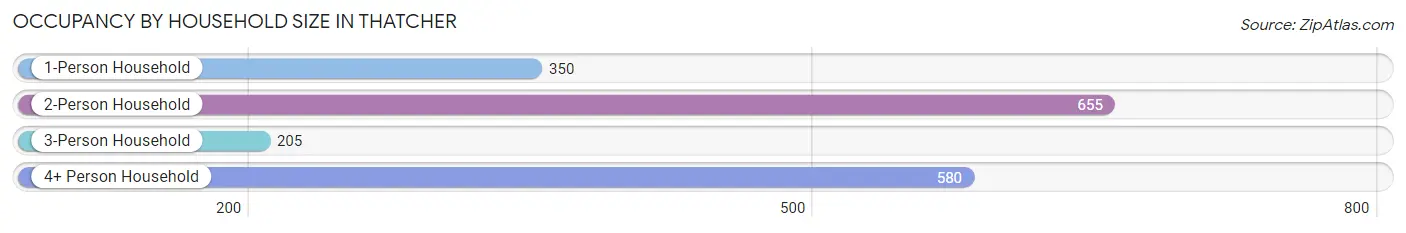
| Household Size | # Housing Units | % Housing Units |
| 1-Person Household | 350 | 19.6% |
| 2-Person Household | 655 | 36.6% |
| 3-Person Household | 205 | 11.5% |
| 4+ Person Household | 580 | 32.4% |
| Total Housing Units | 1,790 | 100.0% |
Occupancy by Ownership by Household Size in Thatcher
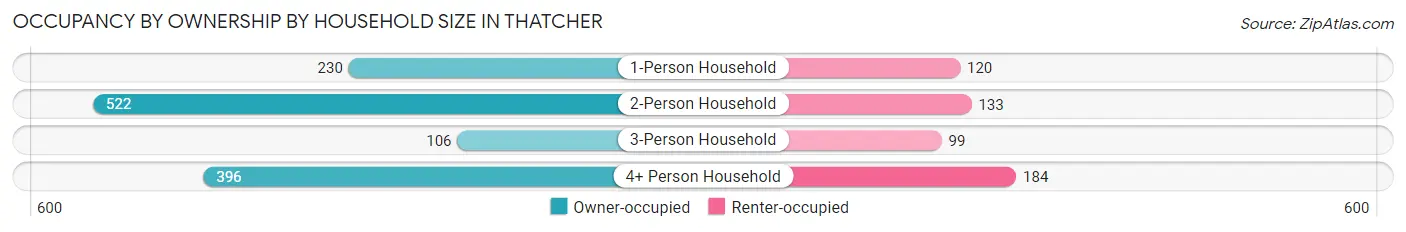
| Household Size | Owner-occupied | Renter-occupied |
| 1-Person Household | 230 (65.7%) | 120 (34.3%) |
| 2-Person Household | 522 (79.7%) | 133 (20.3%) |
| 3-Person Household | 106 (51.7%) | 99 (48.3%) |
| 4+ Person Household | 396 (68.3%) | 184 (31.7%) |
| Total Housing Units | 1,254 (70.1%) | 536 (29.9%) |
Occupancy by Educational Attainment in Thatcher
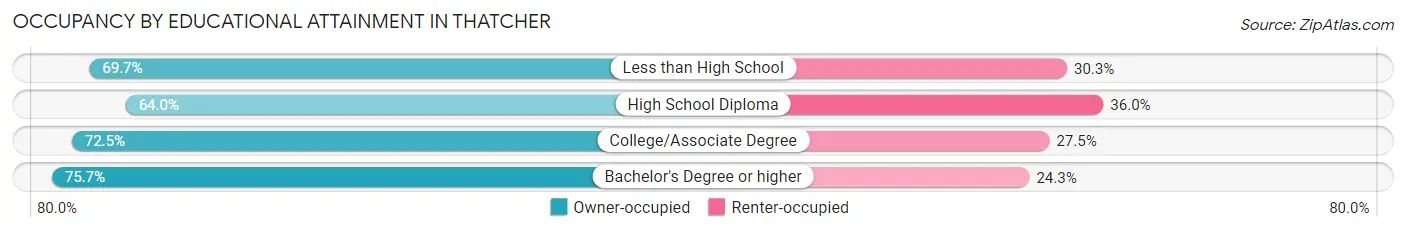
| Household Size | Owner-occupied | Renter-occupied |
| Less than High School | 175 (69.7%) | 76 (30.3%) |
| High School Diploma | 346 (64.0%) | 195 (36.0%) |
| College/Associate Degree | 509 (72.5%) | 193 (27.5%) |
| Bachelor's Degree or higher | 224 (75.7%) | 72 (24.3%) |
Occupancy by Age of Householder in Thatcher
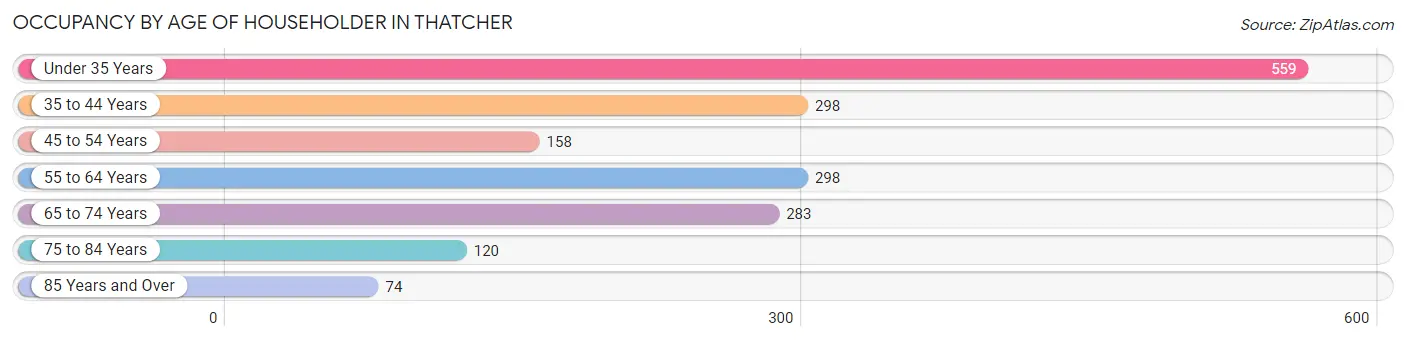
| Age Bracket | # Households | % Households |
| Under 35 Years | 559 | 31.2% |
| 35 to 44 Years | 298 | 16.7% |
| 45 to 54 Years | 158 | 8.8% |
| 55 to 64 Years | 298 | 16.7% |
| 65 to 74 Years | 283 | 15.8% |
| 75 to 84 Years | 120 | 6.7% |
| 85 Years and Over | 74 | 4.1% |
| Total | 1,790 | 100.0% |
Housing Finances in Thatcher
Median Income by Occupancy in Thatcher
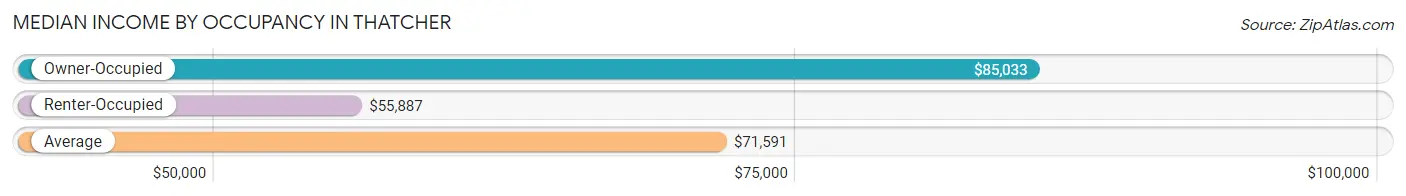
| Occupancy Type | # Households | Median Income |
| Owner-Occupied | 1,254 (70.1%) | $85,033 |
| Renter-Occupied | 536 (29.9%) | $55,887 |
| Average | 1,790 (100.0%) | $71,591 |
Occupancy by Householder Income Bracket in Thatcher
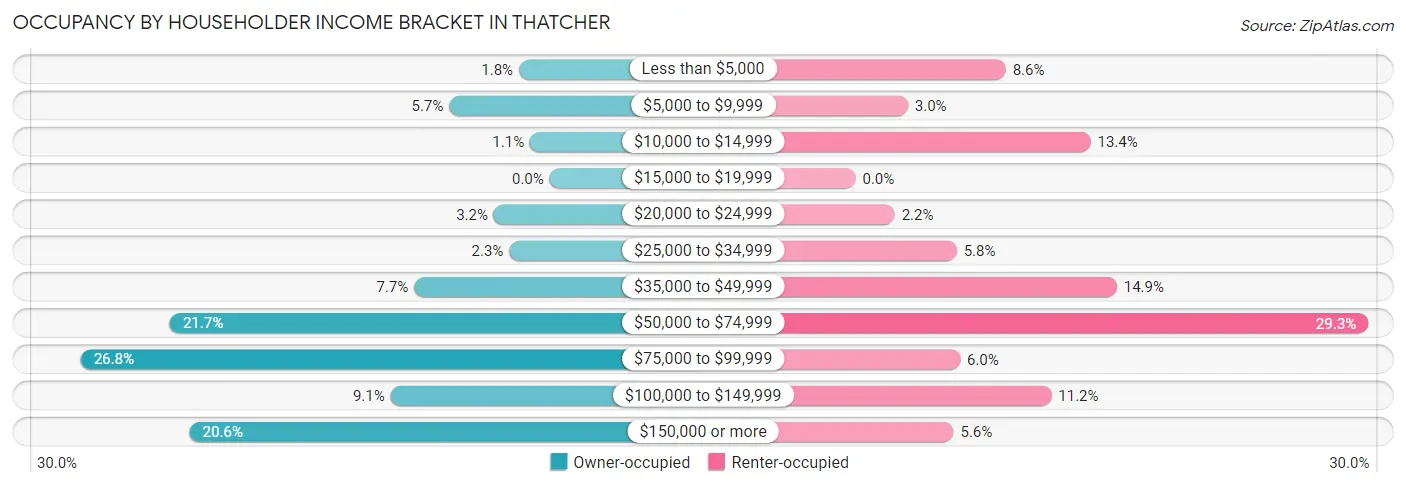
| Income Bracket | Owner-occupied | Renter-occupied |
| Less than $5,000 | 22 (1.8%) | 46 (8.6%) |
| $5,000 to $9,999 | 72 (5.7%) | 16 (3.0%) |
| $10,000 to $14,999 | 14 (1.1%) | 72 (13.4%) |
| $15,000 to $19,999 | 0 (0.0%) | 0 (0.0%) |
| $20,000 to $24,999 | 40 (3.2%) | 12 (2.2%) |
| $25,000 to $34,999 | 29 (2.3%) | 31 (5.8%) |
| $35,000 to $49,999 | 97 (7.7%) | 80 (14.9%) |
| $50,000 to $74,999 | 272 (21.7%) | 157 (29.3%) |
| $75,000 to $99,999 | 336 (26.8%) | 32 (6.0%) |
| $100,000 to $149,999 | 114 (9.1%) | 60 (11.2%) |
| $150,000 or more | 258 (20.6%) | 30 (5.6%) |
| Total | 1,254 (100.0%) | 536 (100.0%) |
Monthly Housing Cost Tiers in Thatcher
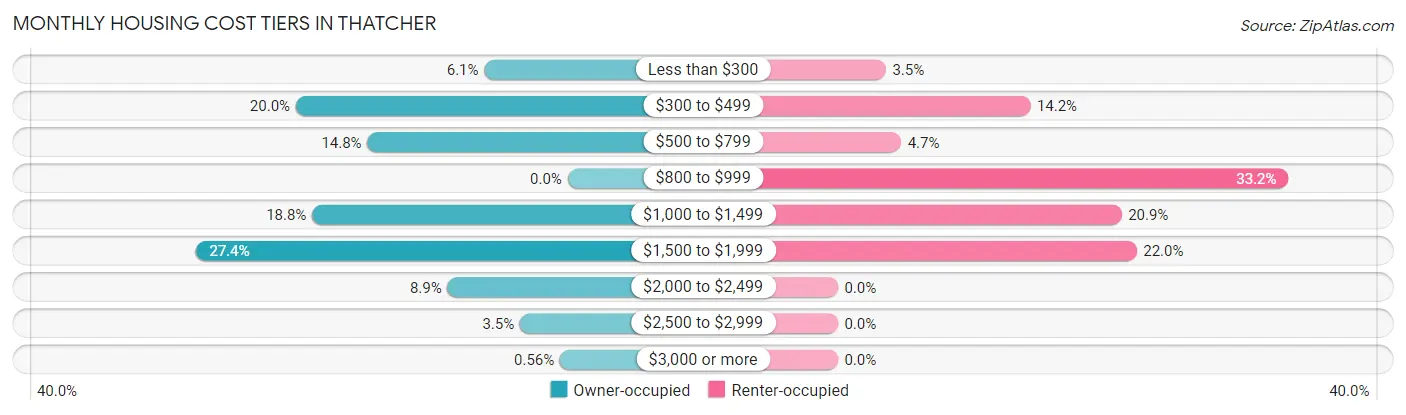
| Monthly Cost | Owner-occupied | Renter-occupied |
| Less than $300 | 77 (6.1%) | 19 (3.5%) |
| $300 to $499 | 251 (20.0%) | 76 (14.2%) |
| $500 to $799 | 185 (14.7%) | 25 (4.7%) |
| $800 to $999 | 0 (0.0%) | 178 (33.2%) |
| $1,000 to $1,499 | 236 (18.8%) | 112 (20.9%) |
| $1,500 to $1,999 | 343 (27.4%) | 118 (22.0%) |
| $2,000 to $2,499 | 111 (8.8%) | 0 (0.0%) |
| $2,500 to $2,999 | 44 (3.5%) | 0 (0.0%) |
| $3,000 or more | 7 (0.6%) | 0 (0.0%) |
| Total | 1,254 (100.0%) | 536 (100.0%) |
Physical Housing Characteristics in Thatcher
Housing Structures in Thatcher
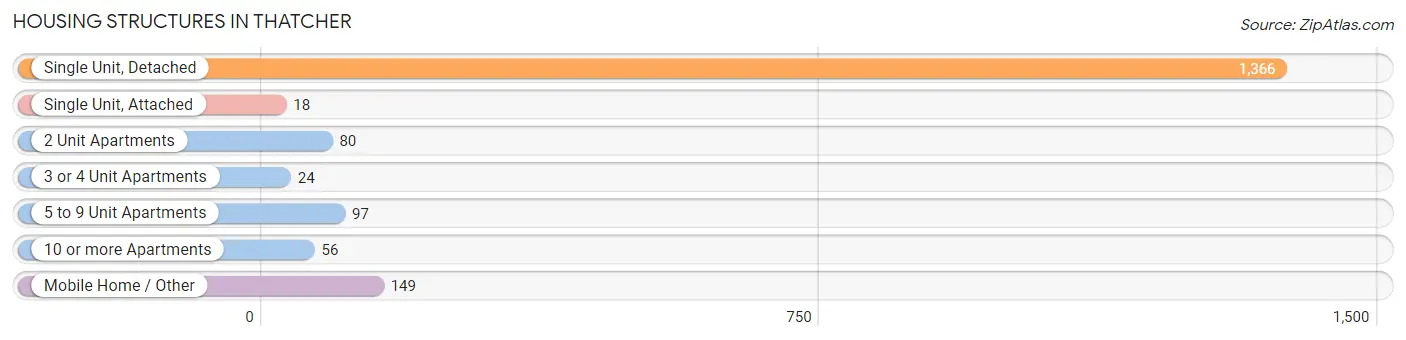
| Structure Type | # Housing Units | % Housing Units |
| Single Unit, Detached | 1,366 | 76.3% |
| Single Unit, Attached | 18 | 1.0% |
| 2 Unit Apartments | 80 | 4.5% |
| 3 or 4 Unit Apartments | 24 | 1.3% |
| 5 to 9 Unit Apartments | 97 | 5.4% |
| 10 or more Apartments | 56 | 3.1% |
| Mobile Home / Other | 149 | 8.3% |
| Total | 1,790 | 100.0% |
Housing Structures by Occupancy in Thatcher
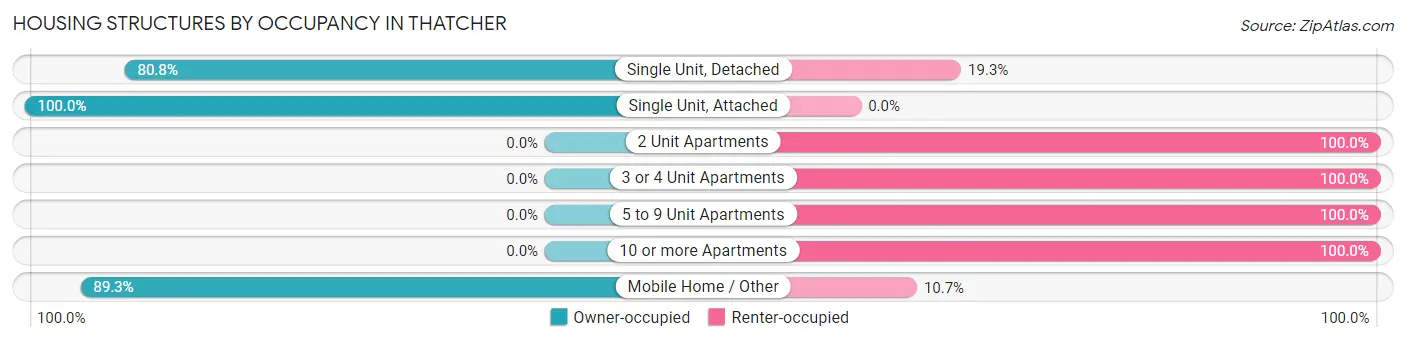
| Structure Type | Owner-occupied | Renter-occupied |
| Single Unit, Detached | 1,103 (80.7%) | 263 (19.3%) |
| Single Unit, Attached | 18 (100.0%) | 0 (0.0%) |
| 2 Unit Apartments | 0 (0.0%) | 80 (100.0%) |
| 3 or 4 Unit Apartments | 0 (0.0%) | 24 (100.0%) |
| 5 to 9 Unit Apartments | 0 (0.0%) | 97 (100.0%) |
| 10 or more Apartments | 0 (0.0%) | 56 (100.0%) |
| Mobile Home / Other | 133 (89.3%) | 16 (10.7%) |
| Total | 1,254 (70.1%) | 536 (29.9%) |
Housing Structures by Number of Rooms in Thatcher
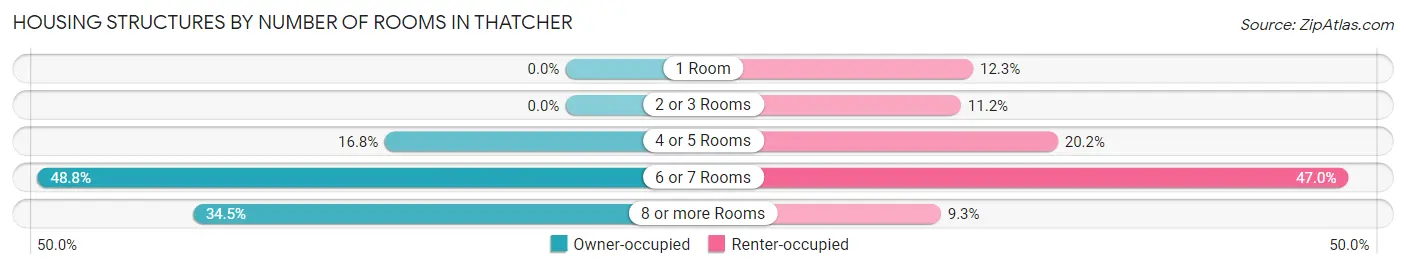
| Number of Rooms | Owner-occupied | Renter-occupied |
| 1 Room | 0 (0.0%) | 66 (12.3%) |
| 2 or 3 Rooms | 0 (0.0%) | 60 (11.2%) |
| 4 or 5 Rooms | 210 (16.8%) | 108 (20.2%) |
| 6 or 7 Rooms | 612 (48.8%) | 252 (47.0%) |
| 8 or more Rooms | 432 (34.4%) | 50 (9.3%) |
| Total | 1,254 (100.0%) | 536 (100.0%) |
Housing Structure by Heating Type in Thatcher
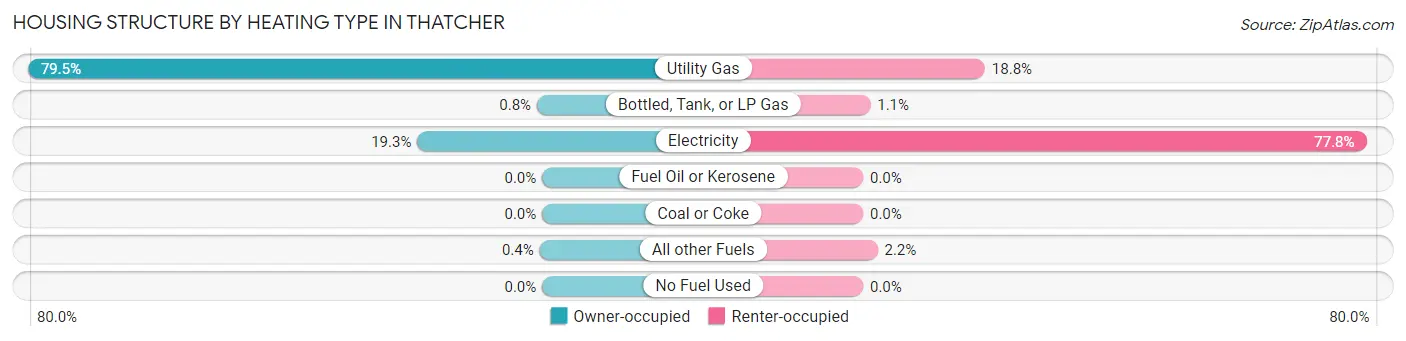
| Heating Type | Owner-occupied | Renter-occupied |
| Utility Gas | 997 (79.5%) | 101 (18.8%) |
| Bottled, Tank, or LP Gas | 10 (0.8%) | 6 (1.1%) |
| Electricity | 242 (19.3%) | 417 (77.8%) |
| Fuel Oil or Kerosene | 0 (0.0%) | 0 (0.0%) |
| Coal or Coke | 0 (0.0%) | 0 (0.0%) |
| All other Fuels | 5 (0.4%) | 12 (2.2%) |
| No Fuel Used | 0 (0.0%) | 0 (0.0%) |
| Total | 1,254 (100.0%) | 536 (100.0%) |
Household Vehicle Usage in Thatcher
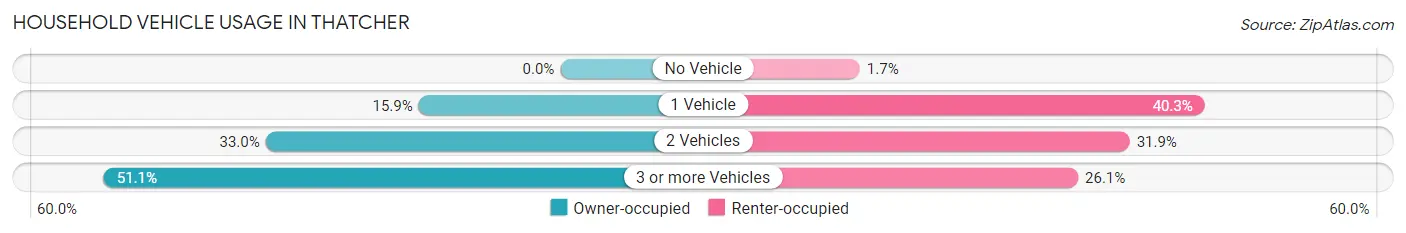
| Vehicles per Household | Owner-occupied | Renter-occupied |
| No Vehicle | 0 (0.0%) | 9 (1.7%) |
| 1 Vehicle | 199 (15.9%) | 216 (40.3%) |
| 2 Vehicles | 414 (33.0%) | 171 (31.9%) |
| 3 or more Vehicles | 641 (51.1%) | 140 (26.1%) |
| Total | 1,254 (100.0%) | 536 (100.0%) |
Real Estate & Mortgages in Thatcher
Real Estate and Mortgage Overview in Thatcher
| Characteristic | Without Mortgage | With Mortgage |
| Housing Units | 485 | 769 |
| Median Property Value | $188,500 | $269,300 |
| Median Household Income | $64,531 | $232 |
| Monthly Housing Costs | $443 | $7 |
| Real Estate Taxes | $1,652 | $12 |
Property Value by Mortgage Status in Thatcher
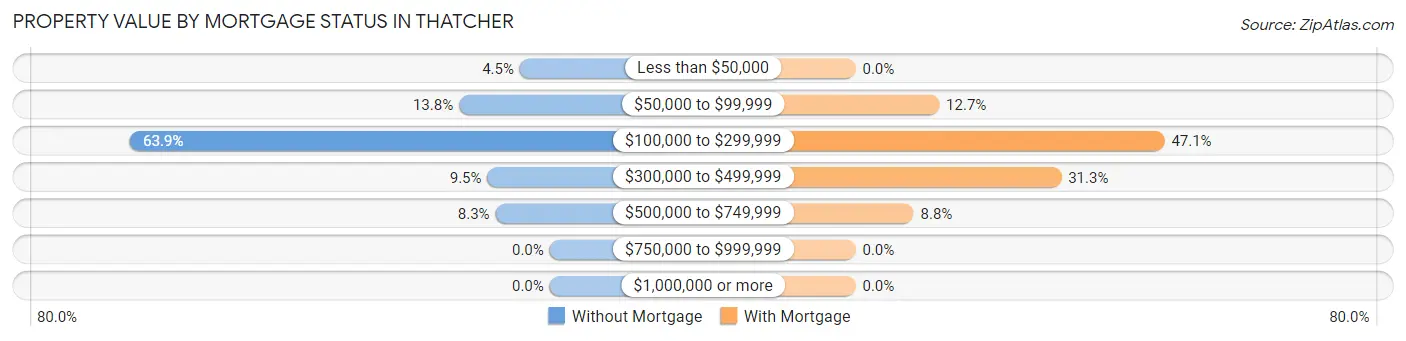
| Property Value | Without Mortgage | With Mortgage |
| Less than $50,000 | 22 (4.5%) | 0 (0.0%) |
| $50,000 to $99,999 | 67 (13.8%) | 98 (12.7%) |
| $100,000 to $299,999 | 310 (63.9%) | 362 (47.1%) |
| $300,000 to $499,999 | 46 (9.5%) | 241 (31.3%) |
| $500,000 to $749,999 | 40 (8.3%) | 68 (8.8%) |
| $750,000 to $999,999 | 0 (0.0%) | 0 (0.0%) |
| $1,000,000 or more | 0 (0.0%) | 0 (0.0%) |
| Total | 485 (100.0%) | 769 (100.0%) |
Household Income by Mortgage Status in Thatcher
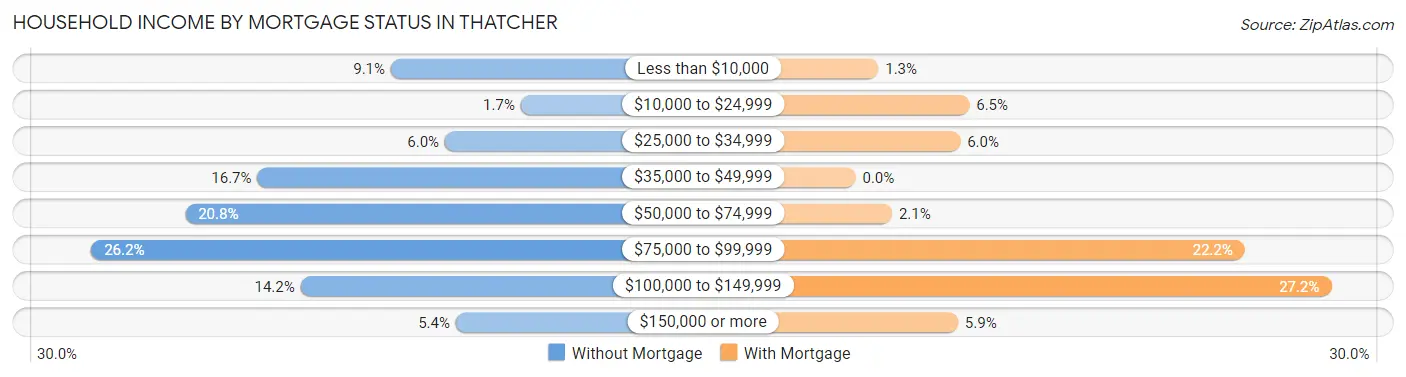
| Household Income | Without Mortgage | With Mortgage |
| Less than $10,000 | 44 (9.1%) | 10 (1.3%) |
| $10,000 to $24,999 | 8 (1.7%) | 50 (6.5%) |
| $25,000 to $34,999 | 29 (6.0%) | 46 (6.0%) |
| $35,000 to $49,999 | 81 (16.7%) | 0 (0.0%) |
| $50,000 to $74,999 | 101 (20.8%) | 16 (2.1%) |
| $75,000 to $99,999 | 127 (26.2%) | 171 (22.2%) |
| $100,000 to $149,999 | 69 (14.2%) | 209 (27.2%) |
| $150,000 or more | 26 (5.4%) | 45 (5.9%) |
| Total | 485 (100.0%) | 769 (100.0%) |
Property Value to Household Income Ratio in Thatcher
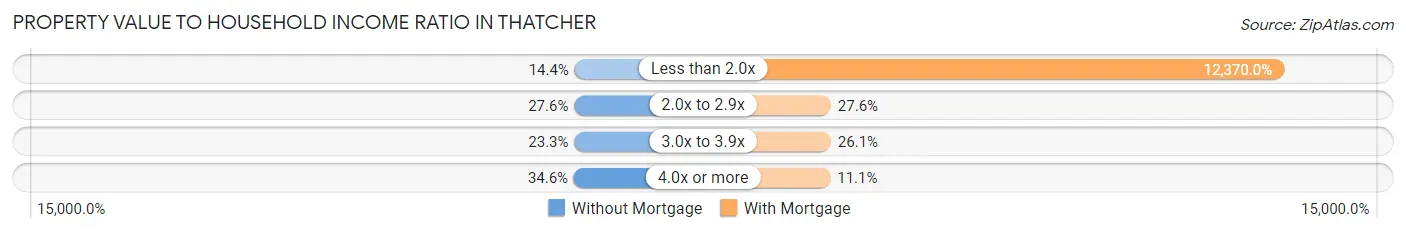
| Value-to-Income Ratio | Without Mortgage | With Mortgage |
| Less than 2.0x | 70 (14.4%) | 95,125 (12,370.0%) |
| 2.0x to 2.9x | 134 (27.6%) | 212 (27.6%) |
| 3.0x to 3.9x | 113 (23.3%) | 201 (26.1%) |
| 4.0x or more | 168 (34.6%) | 85 (11.1%) |
| Total | 485 (100.0%) | 769 (100.0%) |
Real Estate Taxes by Mortgage Status in Thatcher
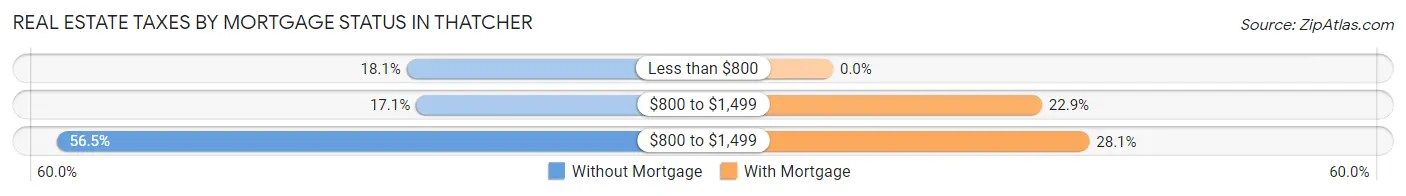
| Property Taxes | Without Mortgage | With Mortgage |
| Less than $800 | 88 (18.1%) | 0 (0.0%) |
| $800 to $1,499 | 83 (17.1%) | 176 (22.9%) |
| $800 to $1,499 | 274 (56.5%) | 216 (28.1%) |
| Total | 485 (100.0%) | 769 (100.0%) |
Health & Disability in Thatcher
Health Insurance Coverage by Age in Thatcher
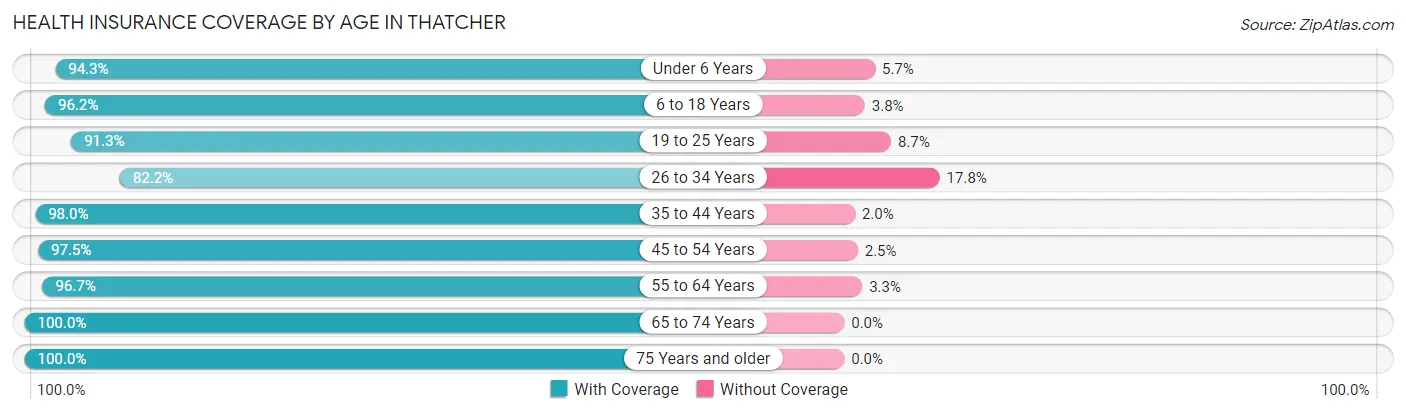
| Age Bracket | With Coverage | Without Coverage |
| Under 6 Years | 214 (94.3%) | 13 (5.7%) |
| 6 to 18 Years | 1,356 (96.2%) | 54 (3.8%) |
| 19 to 25 Years | 693 (91.3%) | 66 (8.7%) |
| 26 to 34 Years | 430 (82.2%) | 93 (17.8%) |
| 35 to 44 Years | 590 (98.0%) | 12 (2.0%) |
| 45 to 54 Years | 426 (97.5%) | 11 (2.5%) |
| 55 to 64 Years | 463 (96.7%) | 16 (3.3%) |
| 65 to 74 Years | 545 (100.0%) | 0 (0.0%) |
| 75 Years and older | 296 (100.0%) | 0 (0.0%) |
| Total | 5,013 (95.0%) | 265 (5.0%) |
Health Insurance Coverage by Citizenship Status in Thatcher
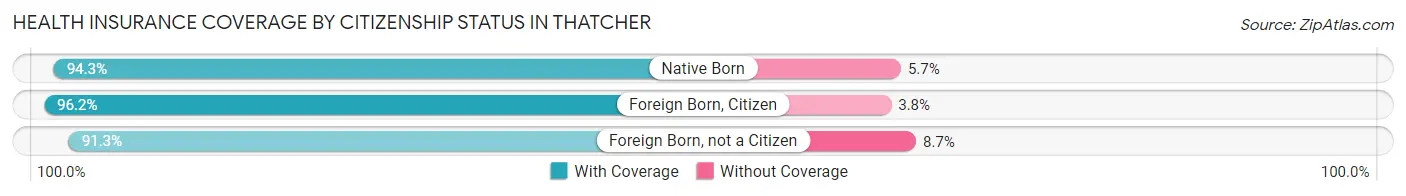
| Citizenship Status | With Coverage | Without Coverage |
| Native Born | 214 (94.3%) | 13 (5.7%) |
| Foreign Born, Citizen | 1,356 (96.2%) | 54 (3.8%) |
| Foreign Born, not a Citizen | 693 (91.3%) | 66 (8.7%) |
Health Insurance Coverage by Household Income in Thatcher
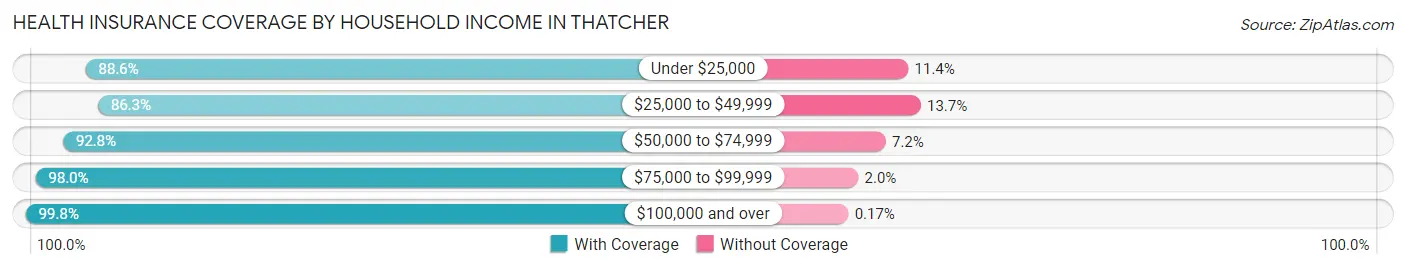
| Household Income | With Coverage | Without Coverage |
| Under $25,000 | 498 (88.6%) | 64 (11.4%) |
| $25,000 to $49,999 | 371 (86.3%) | 59 (13.7%) |
| $50,000 to $74,999 | 1,024 (92.8%) | 79 (7.2%) |
| $75,000 to $99,999 | 1,213 (98.0%) | 25 (2.0%) |
| $100,000 and over | 1,752 (99.8%) | 3 (0.2%) |
Public vs Private Health Insurance Coverage by Age in Thatcher
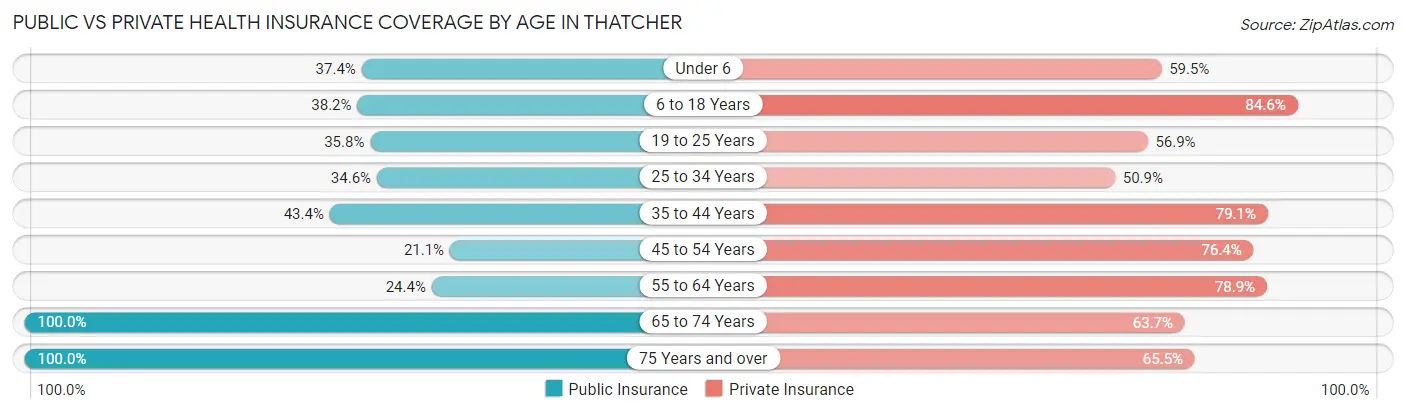
| Age Bracket | Public Insurance | Private Insurance |
| Under 6 | 85 (37.4%) | 135 (59.5%) |
| 6 to 18 Years | 539 (38.2%) | 1,193 (84.6%) |
| 19 to 25 Years | 272 (35.8%) | 432 (56.9%) |
| 25 to 34 Years | 181 (34.6%) | 266 (50.9%) |
| 35 to 44 Years | 261 (43.4%) | 476 (79.1%) |
| 45 to 54 Years | 92 (21.0%) | 334 (76.4%) |
| 55 to 64 Years | 117 (24.4%) | 378 (78.9%) |
| 65 to 74 Years | 545 (100.0%) | 347 (63.7%) |
| 75 Years and over | 296 (100.0%) | 194 (65.5%) |
| Total | 2,388 (45.2%) | 3,755 (71.1%) |
Disability Status by Sex by Age in Thatcher
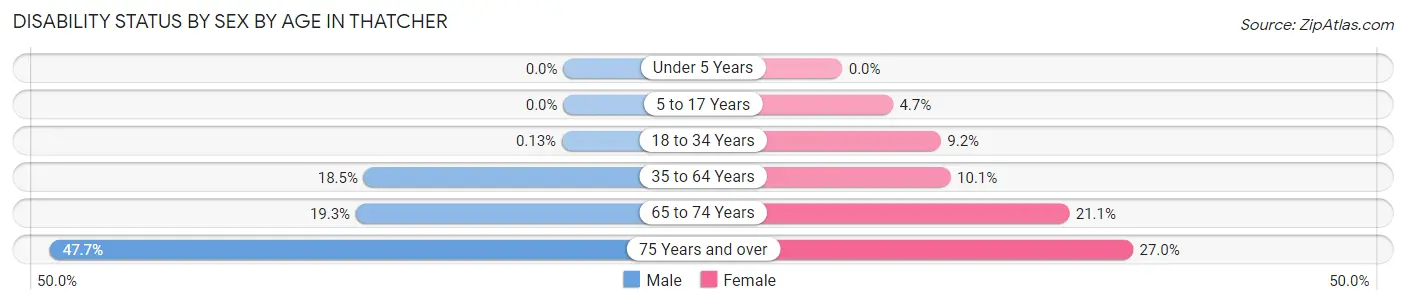
| Age Bracket | Male | Female |
| Under 5 Years | 0 (0.0%) | 0 (0.0%) |
| 5 to 17 Years | 0 (0.0%) | 21 (4.7%) |
| 18 to 34 Years | 1 (0.1%) | 67 (9.1%) |
| 35 to 64 Years | 130 (18.5%) | 82 (10.1%) |
| 65 to 74 Years | 51 (19.3%) | 59 (21.1%) |
| 75 Years and over | 51 (47.7%) | 51 (27.0%) |
Disability Class by Sex by Age in Thatcher
Disability Class: Hearing Difficulty
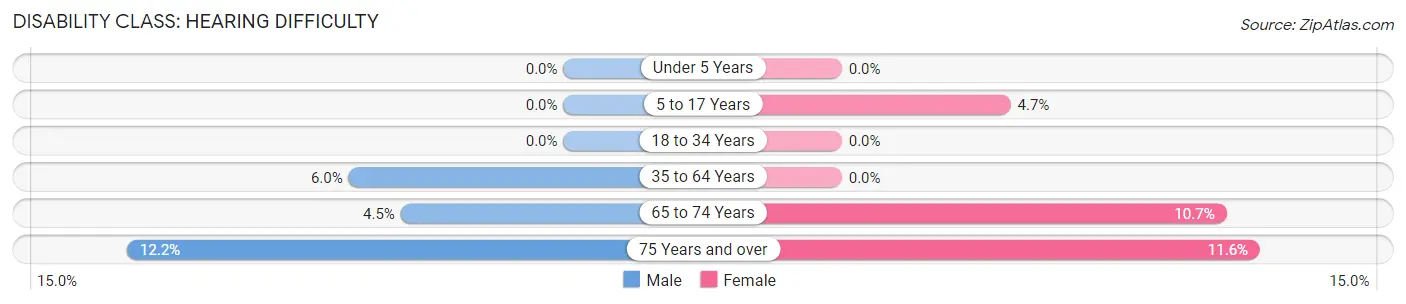
| Age Bracket | Male | Female |
| Under 5 Years | 0 (0.0%) | 0 (0.0%) |
| 5 to 17 Years | 0 (0.0%) | 21 (4.7%) |
| 18 to 34 Years | 0 (0.0%) | 0 (0.0%) |
| 35 to 64 Years | 42 (6.0%) | 0 (0.0%) |
| 65 to 74 Years | 12 (4.5%) | 30 (10.7%) |
| 75 Years and over | 13 (12.1%) | 22 (11.6%) |
Disability Class: Vision Difficulty
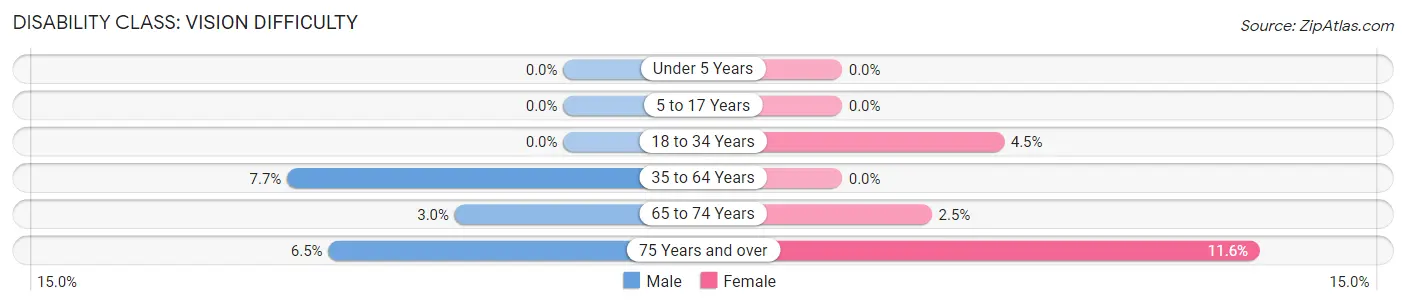
| Age Bracket | Male | Female |
| Under 5 Years | 0 (0.0%) | 0 (0.0%) |
| 5 to 17 Years | 0 (0.0%) | 0 (0.0%) |
| 18 to 34 Years | 0 (0.0%) | 33 (4.5%) |
| 35 to 64 Years | 54 (7.7%) | 0 (0.0%) |
| 65 to 74 Years | 8 (3.0%) | 7 (2.5%) |
| 75 Years and over | 7 (6.5%) | 22 (11.6%) |
Disability Class: Cognitive Difficulty
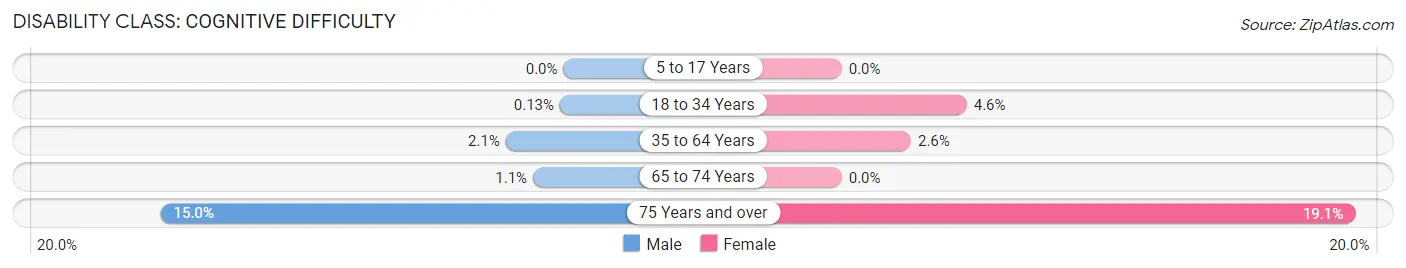
| Age Bracket | Male | Female |
| 5 to 17 Years | 0 (0.0%) | 0 (0.0%) |
| 18 to 34 Years | 1 (0.1%) | 34 (4.6%) |
| 35 to 64 Years | 15 (2.1%) | 21 (2.6%) |
| 65 to 74 Years | 3 (1.1%) | 0 (0.0%) |
| 75 Years and over | 16 (14.9%) | 36 (19.1%) |
Disability Class: Ambulatory Difficulty
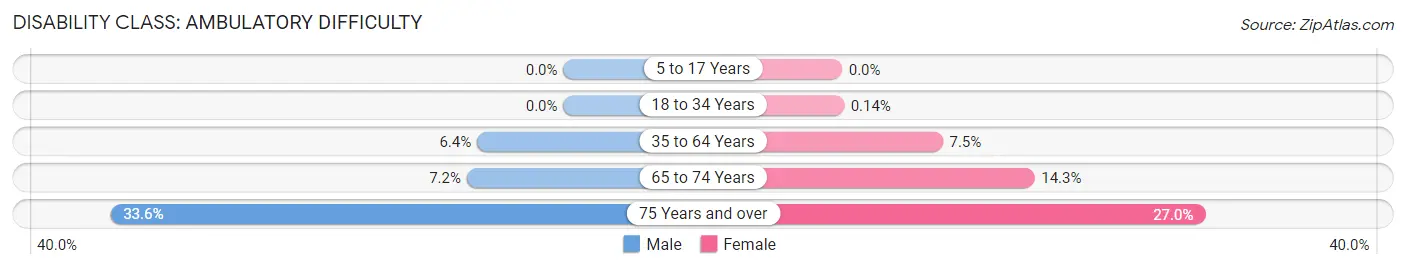
| Age Bracket | Male | Female |
| 5 to 17 Years | 0 (0.0%) | 0 (0.0%) |
| 18 to 34 Years | 0 (0.0%) | 1 (0.1%) |
| 35 to 64 Years | 45 (6.4%) | 61 (7.5%) |
| 65 to 74 Years | 19 (7.2%) | 40 (14.3%) |
| 75 Years and over | 36 (33.6%) | 51 (27.0%) |
Disability Class: Self-Care Difficulty
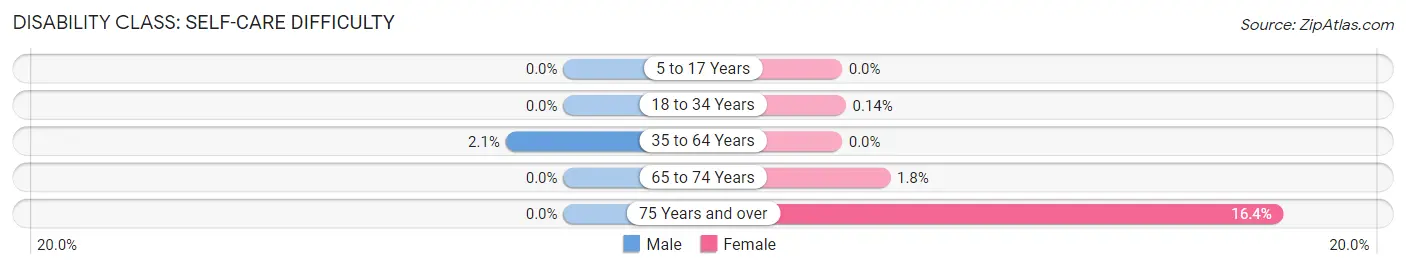
| Age Bracket | Male | Female |
| 5 to 17 Years | 0 (0.0%) | 0 (0.0%) |
| 18 to 34 Years | 0 (0.0%) | 1 (0.1%) |
| 35 to 64 Years | 15 (2.1%) | 0 (0.0%) |
| 65 to 74 Years | 0 (0.0%) | 5 (1.8%) |
| 75 Years and over | 0 (0.0%) | 31 (16.4%) |
Technology Access in Thatcher
Computing Device Access in Thatcher
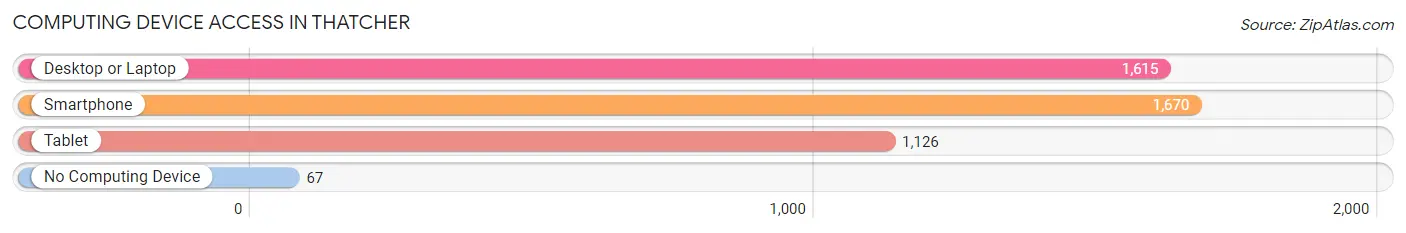
| Device Type | # Households | % Households |
| Desktop or Laptop | 1,615 | 90.2% |
| Smartphone | 1,670 | 93.3% |
| Tablet | 1,126 | 62.9% |
| No Computing Device | 67 | 3.7% |
| Total | 1,790 | 100.0% |
Internet Access in Thatcher
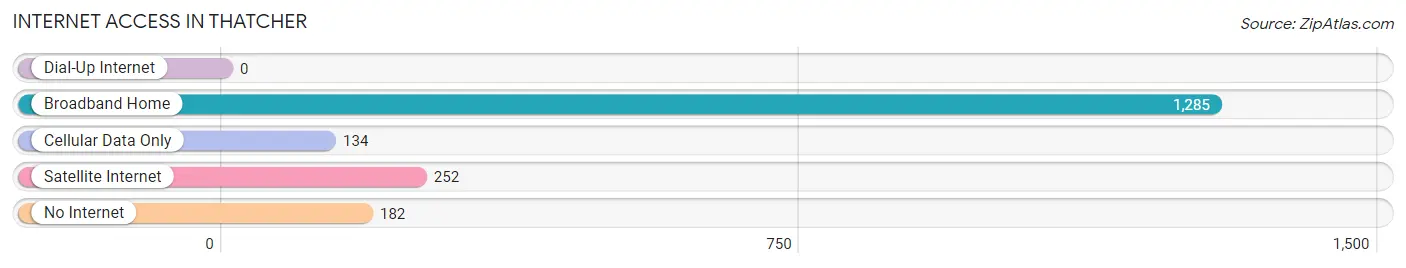
| Internet Type | # Households | % Households |
| Dial-Up Internet | 0 | 0.0% |
| Broadband Home | 1,285 | 71.8% |
| Cellular Data Only | 134 | 7.5% |
| Satellite Internet | 252 | 14.1% |
| No Internet | 182 | 10.2% |
| Total | 1,790 | 100.0% |
Thatcher Summary
Thatcher is a small town located in Graham County, Arizona. It is situated in the Gila Valley, which is part of the Sonoran Desert. The town is located about 20 miles south of Safford, the county seat. Thatcher has a population of approximately 5,000 people and is the largest town in Graham County.
History
Thatcher was founded in 1883 by a group of Mormon settlers from Utah. The town was named after William B. Thatcher, a prominent Mormon leader. The settlers were attracted to the area due to its fertile soil and mild climate. The town quickly grew and by the early 1900s, it had become a major agricultural center.
The town was incorporated in 1910 and the first mayor was elected in 1911. During the early years, the town was primarily an agricultural center, with cotton, alfalfa, and grain being the main crops. In the 1920s, the town began to diversify its economy with the opening of a canning factory and a brickyard.
Geography
Thatcher is located in the Gila Valley, which is part of the Sonoran Desert. The town is situated at an elevation of 3,890 feet and is surrounded by the Coronado National Forest. The town is located about 20 miles south of Safford, the county seat.
The climate in Thatcher is semi-arid, with hot summers and mild winters. The average annual temperature is 68 degrees Fahrenheit. The average annual precipitation is 11.5 inches.
Economy
Thatcher’s economy is primarily based on agriculture. The town is home to several large farms that produce cotton, alfalfa, and grain. The town also has a canning factory and a brickyard.
The town is also home to several small businesses, including restaurants, retail stores, and service providers. The town is also home to Eastern Arizona College, which provides educational opportunities to the local community.
Demographics
As of the 2010 census, the population of Thatcher was 5,098. The racial makeup of the town was 87.3% White, 0.7% African American, 0.9% Native American, 0.3% Asian, 0.1% Pacific Islander, 8.7% from other races, and 2.0% from two or more races. Hispanic or Latino of any race were 16.3% of the population.
The median income for a household in Thatcher was $30,938, and the median income for a family was $36,250. The per capita income for the town was $14,945. About 17.2% of families and 21.2% of the population were below the poverty line, including 28.3% of those under age 18 and 11.2% of those age 65 or over.
Conclusion
Thatcher is a small town located in Graham County, Arizona. It is situated in the Gila Valley, which is part of the Sonoran Desert. The town was founded in 1883 by a group of Mormon settlers and has since grown to become the largest town in Graham County. The town’s economy is primarily based on agriculture, with cotton, alfalfa, and grain being the main crops. The town is also home to several small businesses, including restaurants, retail stores, and service providers. The population of Thatcher was 5,098 as of the 2010 census.
Common Questions
What is Per Capita Income in Thatcher?
Per Capita income in Thatcher is $27,582.
What is the Median Family Income in Thatcher?
Median Family Income in Thatcher is $82,303.
What is the Median Household income in Thatcher?
Median Household Income in Thatcher is $71,591.
What is Income or Wage Gap in Thatcher?
Income or Wage Gap in Thatcher is 69.4%.
Women in Thatcher earn 30.6 cents for every dollar earned by a man.
What is Inequality or Gini Index in Thatcher?
Inequality or Gini Index in Thatcher is 0.38.
What is the Total Population of Thatcher?
Total Population of Thatcher is 5,281.
What is the Total Male Population of Thatcher?
Total Male Population of Thatcher is 2,715.
What is the Total Female Population of Thatcher?
Total Female Population of Thatcher is 2,566.
What is the Ratio of Males per 100 Females in Thatcher?
There are 105.81 Males per 100 Females in Thatcher.
What is the Ratio of Females per 100 Males in Thatcher?
There are 94.51 Females per 100 Males in Thatcher.
What is the Median Population Age in Thatcher?
Median Population Age in Thatcher is 27.7 Years.
What is the Average Family Size in Thatcher
Average Family Size in Thatcher is 3.3 People.
What is the Average Household Size in Thatcher
Average Household Size in Thatcher is 2.8 People.
How Large is the Labor Force in Thatcher?
There are 2,325 People in the Labor Forcein in Thatcher.
What is the Percentage of People in the Labor Force in Thatcher?
56.6% of People are in the Labor Force in Thatcher.
What is the Unemployment Rate in Thatcher?
Unemployment Rate in Thatcher is 5.6%.