Queen Creek, AZ Map & Demographics
Queen Creek Map
Queen Creek Overview
$46,808
PER CAPITA INCOME
$131,868
AVG FAMILY INCOME
$127,182
AVG HOUSEHOLD INCOME
44.2%
WAGE / INCOME GAP [ % ]
55.8¢/ $1
WAGE / INCOME GAP [ $ ]
$14,360
FAMILY INCOME DEFICIT
0.37
INEQUALITY / GINI INDEX
61,788
TOTAL POPULATION
30,190
MALE POPULATION
31,598
FEMALE POPULATION
95.54
MALES / 100 FEMALES
104.66
FEMALES / 100 MALES
36.7
MEDIAN AGE
3.5
AVG FAMILY SIZE
3.2
AVG HOUSEHOLD SIZE
30,249
LABOR FORCE [ PEOPLE ]
67.0%
PERCENT IN LABOR FORCE
4.3%
UNEMPLOYMENT RATE
Queen Creek Zip Codes
Income in Queen Creek
Income Overview in Queen Creek
Per Capita Income in Queen Creek is $46,808, while median incomes of families and households are $131,868 and $127,182 respectively.
| Characteristic | Number | Measure |
| Per Capita Income | 61,788 | $46,808 |
| Median Family Income | 16,403 | $131,868 |
| Mean Family Income | 16,403 | $155,311 |
| Median Household Income | 18,954 | $127,182 |
| Mean Household Income | 18,954 | $151,614 |
| Income Deficit | 16,403 | $14,360 |
| Wage / Income Gap (%) | 61,788 | 44.15% |
| Wage / Income Gap ($) | 61,788 | 55.85¢ per $1 |
| Gini / Inequality Index | 61,788 | 0.37 |
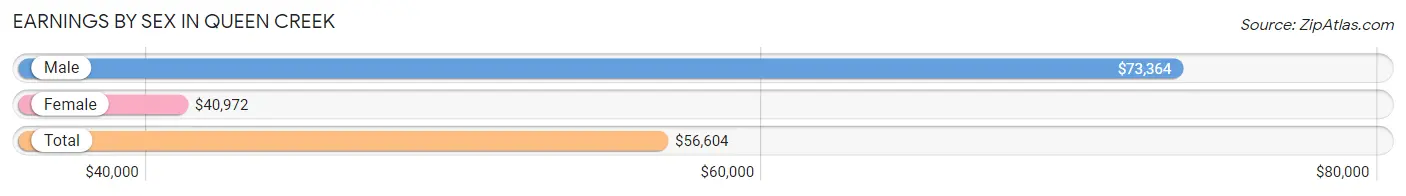
Earnings by Sex in Queen Creek
Average Earnings in Queen Creek are $56,604, $73,364 for men and $40,972 for women, a difference of 44.2%.
| Sex | Number | Average Earnings |
| Male | 16,922 (53.6%) | $73,364 |
| Female | 14,672 (46.4%) | $40,972 |
| Total | 31,594 (100.0%) | $56,604 |
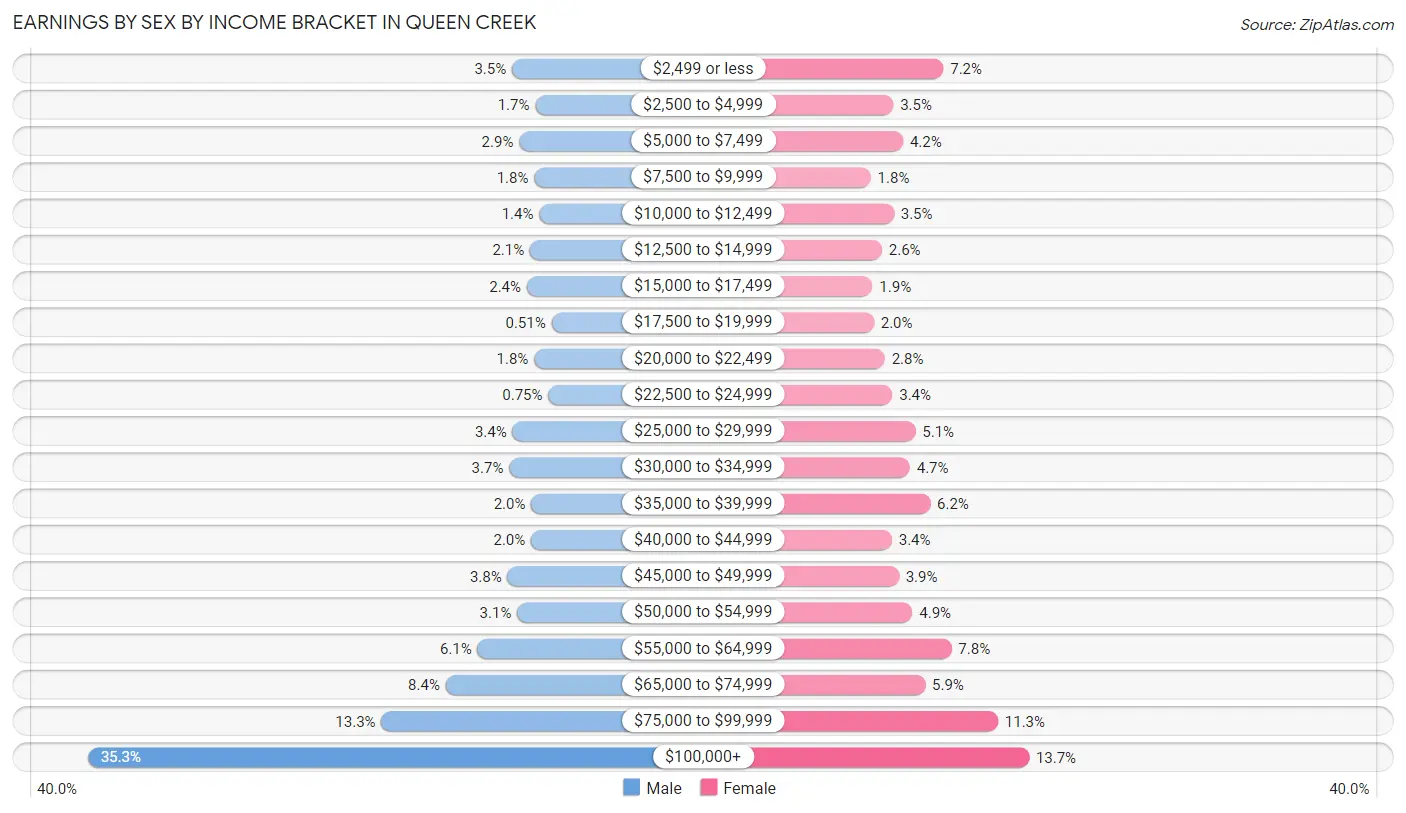
Earnings by Sex by Income Bracket in Queen Creek
The most common earnings brackets in Queen Creek are $100,000+ for men (5,969 | 35.3%) and $100,000+ for women (2,002 | 13.7%).
| Income | Male | Female |
| $2,499 or less | 587 (3.5%) | 1,061 (7.2%) |
| $2,500 to $4,999 | 292 (1.7%) | 510 (3.5%) |
| $5,000 to $7,499 | 495 (2.9%) | 618 (4.2%) |
| $7,500 to $9,999 | 304 (1.8%) | 262 (1.8%) |
| $10,000 to $12,499 | 242 (1.4%) | 517 (3.5%) |
| $12,500 to $14,999 | 358 (2.1%) | 386 (2.6%) |
| $15,000 to $17,499 | 400 (2.4%) | 282 (1.9%) |
| $17,500 to $19,999 | 86 (0.5%) | 296 (2.0%) |
| $20,000 to $22,499 | 306 (1.8%) | 417 (2.8%) |
| $22,500 to $24,999 | 127 (0.7%) | 501 (3.4%) |
| $25,000 to $29,999 | 581 (3.4%) | 754 (5.1%) |
| $30,000 to $34,999 | 623 (3.7%) | 693 (4.7%) |
| $35,000 to $39,999 | 343 (2.0%) | 915 (6.2%) |
| $40,000 to $44,999 | 346 (2.0%) | 494 (3.4%) |
| $45,000 to $49,999 | 644 (3.8%) | 571 (3.9%) |
| $50,000 to $54,999 | 522 (3.1%) | 720 (4.9%) |
| $55,000 to $64,999 | 1,024 (6.0%) | 1,151 (7.8%) |
| $65,000 to $74,999 | 1,429 (8.4%) | 861 (5.9%) |
| $75,000 to $99,999 | 2,244 (13.3%) | 1,661 (11.3%) |
| $100,000+ | 5,969 (35.3%) | 2,002 (13.7%) |
| Total | 16,922 (100.0%) | 14,672 (100.0%) |
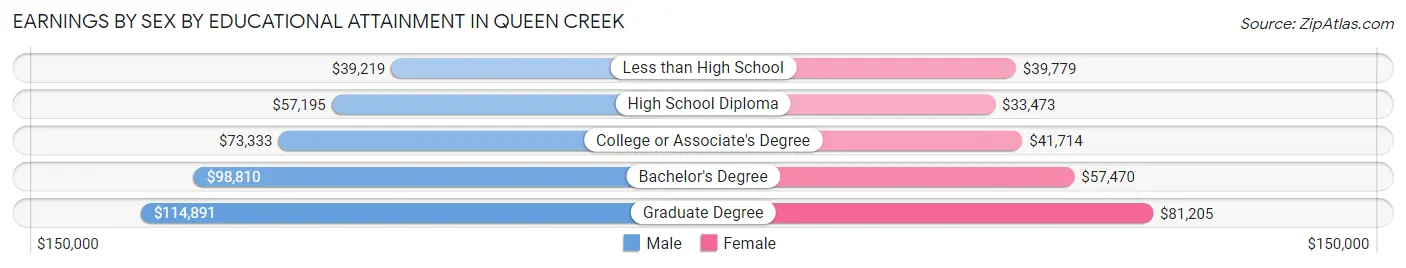
Earnings by Sex by Educational Attainment in Queen Creek
Average earnings in Queen Creek are $85,803 for men and $49,634 for women, a difference of 42.1%. Men with an educational attainment of graduate degree enjoy the highest average annual earnings of $114,891, while those with less than high school education earn the least with $39,219. Women with an educational attainment of graduate degree earn the most with the average annual earnings of $81,205, while those with high school diploma education have the smallest earnings of $33,473.
| Educational Attainment | Male Income | Female Income |
| Less than High School | $39,219 | $39,779 |
| High School Diploma | $57,195 | $33,473 |
| College or Associate's Degree | $73,333 | $41,714 |
| Bachelor's Degree | $98,810 | $57,470 |
| Graduate Degree | $114,891 | $81,205 |
| Total | $85,803 | $49,634 |
Family Income in Queen Creek
Family Income Brackets in Queen Creek
According to the Queen Creek family income data, there are 4,396 families falling into the $100,000 to $149,999 income range, which is the most common income bracket and makes up 26.8% of all families. Conversely, the $10,000 to $14,999 income bracket is the least frequent group with only 66 families (0.4%) belonging to this category.
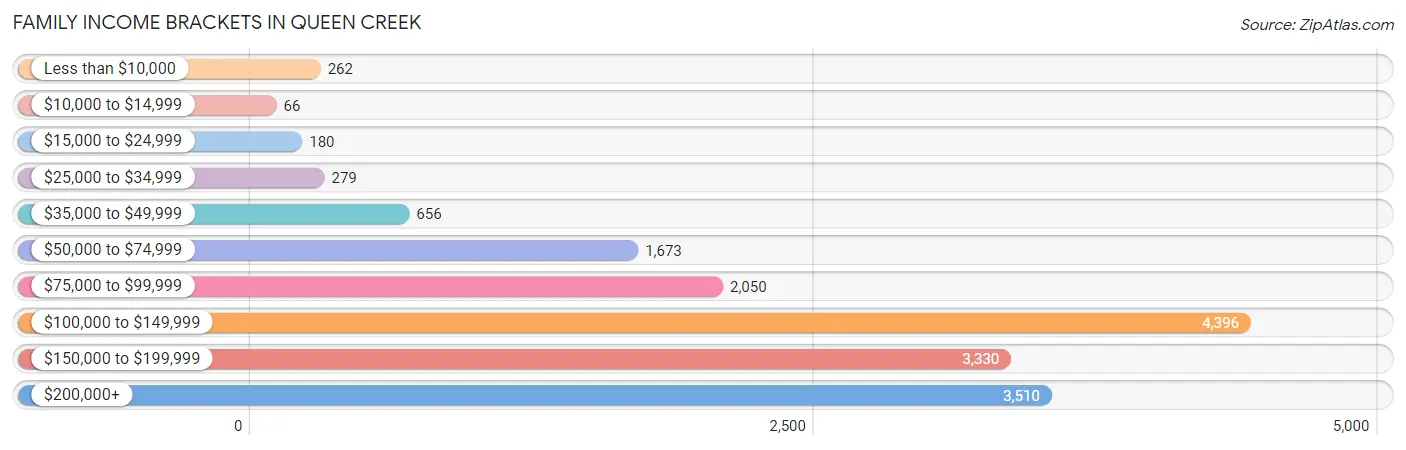
| Income Bracket | # Families | % Families |
| Less than $10,000 | 262 | 1.6% |
| $10,000 to $14,999 | 66 | 0.4% |
| $15,000 to $24,999 | 180 | 1.1% |
| $25,000 to $34,999 | 279 | 1.7% |
| $35,000 to $49,999 | 656 | 4.0% |
| $50,000 to $74,999 | 1,673 | 10.2% |
| $75,000 to $99,999 | 2,050 | 12.5% |
| $100,000 to $149,999 | 4,396 | 26.8% |
| $150,000 to $199,999 | 3,330 | 20.3% |
| $200,000+ | 3,510 | 21.4% |
Family Income by Famaliy Size in Queen Creek
7+ person families (577 | 3.5%) account for the highest median family income in Queen Creek with $184,358 per family, while 2-person families (5,608 | 34.2%) have the highest median income of $55,894 per family member.
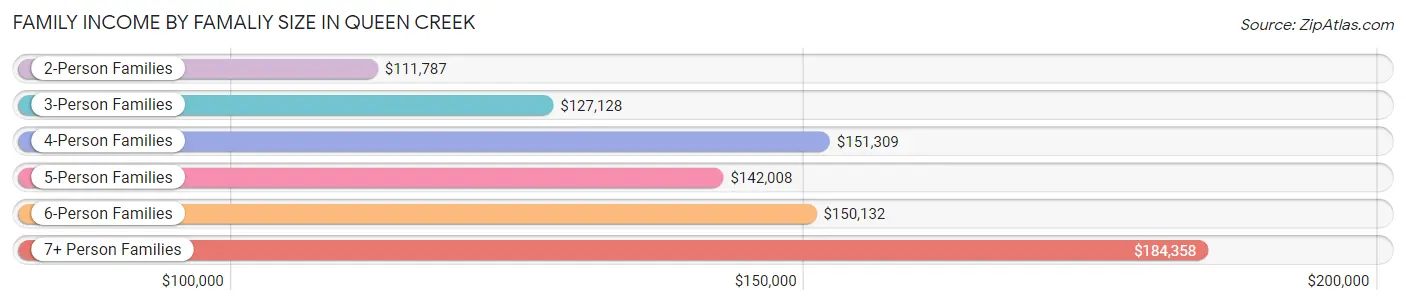
| Income Bracket | # Families | Median Income |
| 2-Person Families | 5,608 (34.2%) | $111,787 |
| 3-Person Families | 3,416 (20.8%) | $127,128 |
| 4-Person Families | 3,995 (24.4%) | $151,309 |
| 5-Person Families | 1,835 (11.2%) | $142,008 |
| 6-Person Families | 972 (5.9%) | $150,132 |
| 7+ Person Families | 577 (3.5%) | $184,358 |
| Total | 16,403 (100.0%) | $131,868 |
Family Income by Number of Earners in Queen Creek
The median family income in Queen Creek is $131,868, with families comprising 3+ earners (2,618) having the highest median family income of $184,097, while families with no earners (1,883) have the lowest median family income of $82,048, accounting for 16.0% and 11.5% of families, respectively.
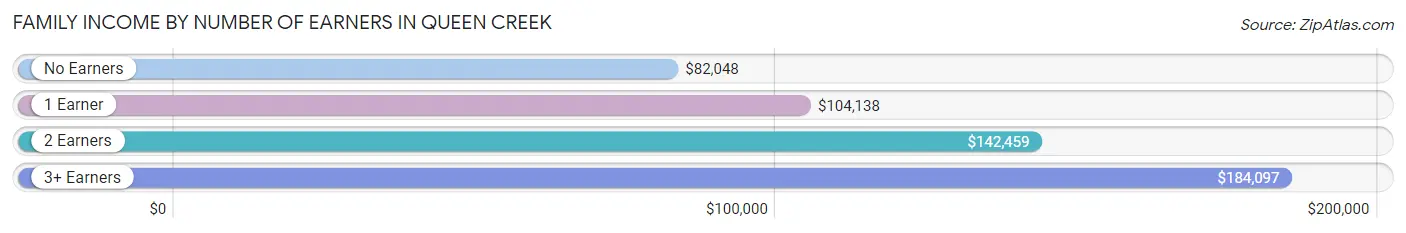
| Number of Earners | # Families | Median Income |
| No Earners | 1,883 (11.5%) | $82,048 |
| 1 Earner | 4,597 (28.0%) | $104,138 |
| 2 Earners | 7,305 (44.5%) | $142,459 |
| 3+ Earners | 2,618 (16.0%) | $184,097 |
| Total | 16,403 (100.0%) | $131,868 |
Household Income in Queen Creek
Household Income Brackets in Queen Creek
With 4,890 households falling in the category, the $100,000 to $149,999 income range is the most frequent in Queen Creek, accounting for 25.8% of all households. In contrast, only 152 households (0.8%) fall into the $10,000 to $14,999 income bracket, making it the least populous group.
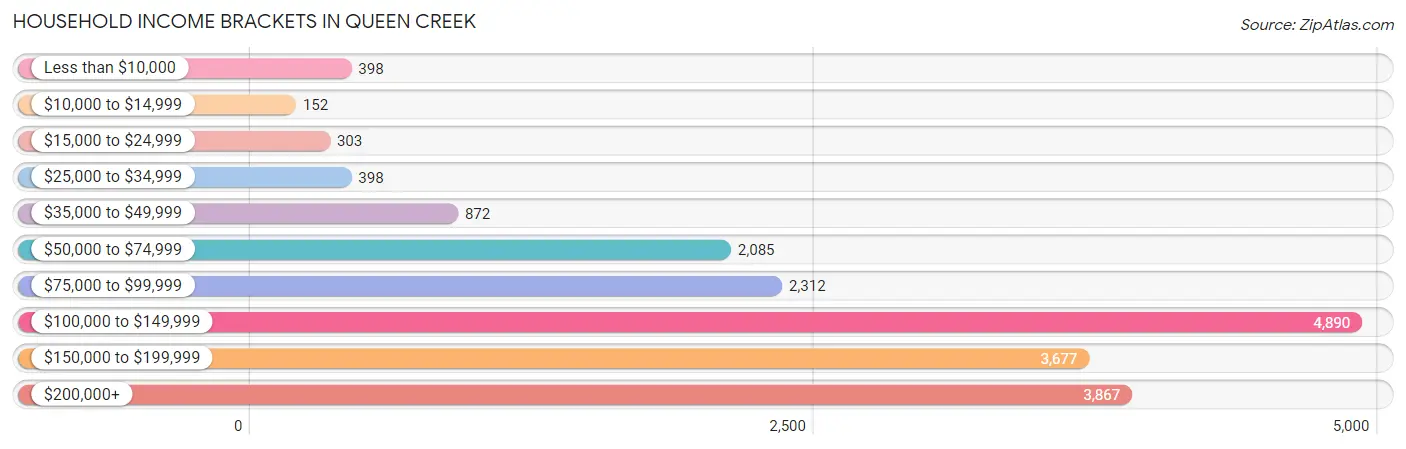
| Income Bracket | # Households | % Households |
| Less than $10,000 | 398 | 2.1% |
| $10,000 to $14,999 | 152 | 0.8% |
| $15,000 to $24,999 | 303 | 1.6% |
| $25,000 to $34,999 | 398 | 2.1% |
| $35,000 to $49,999 | 872 | 4.6% |
| $50,000 to $74,999 | 2,085 | 11.0% |
| $75,000 to $99,999 | 2,312 | 12.2% |
| $100,000 to $149,999 | 4,890 | 25.8% |
| $150,000 to $199,999 | 3,677 | 19.4% |
| $200,000+ | 3,867 | 20.4% |
Household Income by Householder Age in Queen Creek
The median household income in Queen Creek is $127,182, with the highest median household income of $151,875 found in the 45 to 64 years age bracket for the primary householder. A total of 8,114 households (42.8%) fall into this category. Meanwhile, the 15 to 24 years age bracket for the primary householder has the lowest median household income of $58,542, with 297 households (1.6%) in this group.
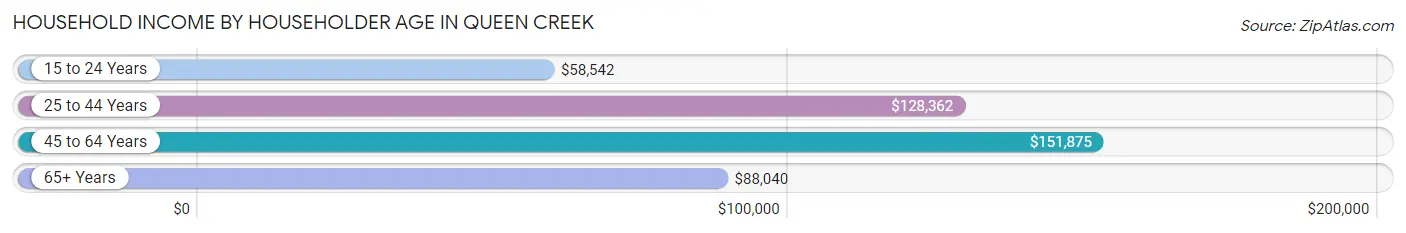
| Income Bracket | # Households | Median Income |
| 15 to 24 Years | 297 (1.6%) | $58,542 |
| 25 to 44 Years | 6,876 (36.3%) | $128,362 |
| 45 to 64 Years | 8,114 (42.8%) | $151,875 |
| 65+ Years | 3,667 (19.4%) | $88,040 |
| Total | 18,954 (100.0%) | $127,182 |
Poverty in Queen Creek
Income Below Poverty by Sex and Age in Queen Creek
With 3.4% poverty level for males and 4.5% for females among the residents of Queen Creek, 5 year old males and 75 year old and over females are the most vulnerable to poverty, with 46 males (6.9%) and 234 females (14.3%) in their respective age groups living below the poverty level.
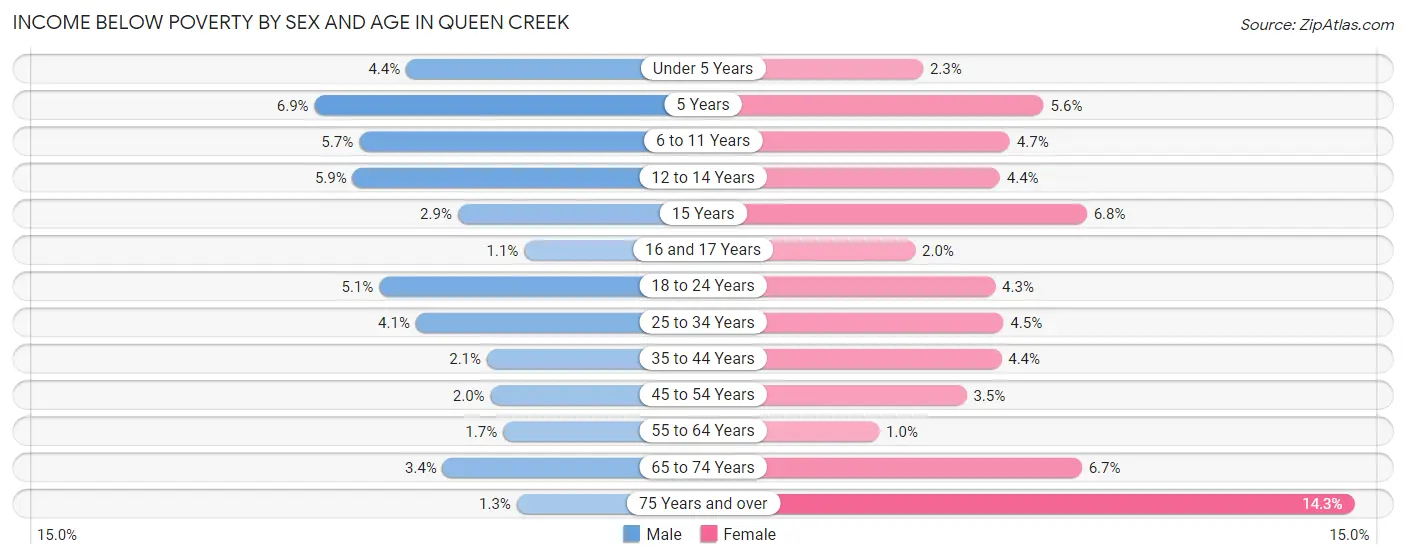
| Age Bracket | Male | Female |
| Under 5 Years | 85 (4.4%) | 44 (2.3%) |
| 5 Years | 46 (6.9%) | 27 (5.6%) |
| 6 to 11 Years | 181 (5.7%) | 155 (4.7%) |
| 12 to 14 Years | 121 (5.9%) | 76 (4.4%) |
| 15 Years | 15 (2.9%) | 49 (6.8%) |
| 16 and 17 Years | 12 (1.1%) | 26 (2.0%) |
| 18 to 24 Years | 120 (5.1%) | 89 (4.3%) |
| 25 to 34 Years | 108 (4.1%) | 148 (4.5%) |
| 35 to 44 Years | 93 (2.1%) | 219 (4.4%) |
| 45 to 54 Years | 90 (2.0%) | 143 (3.5%) |
| 55 to 64 Years | 57 (1.7%) | 34 (1.0%) |
| 65 to 74 Years | 74 (3.4%) | 182 (6.7%) |
| 75 Years and over | 16 (1.3%) | 234 (14.3%) |
| Total | 1,018 (3.4%) | 1,426 (4.5%) |
Income Above Poverty by Sex and Age in Queen Creek
According to the poverty statistics in Queen Creek, males aged 16 and 17 years and females aged 55 to 64 years are the age groups that are most secure financially, with 98.9% of males and 99.0% of females in these age groups living above the poverty line.
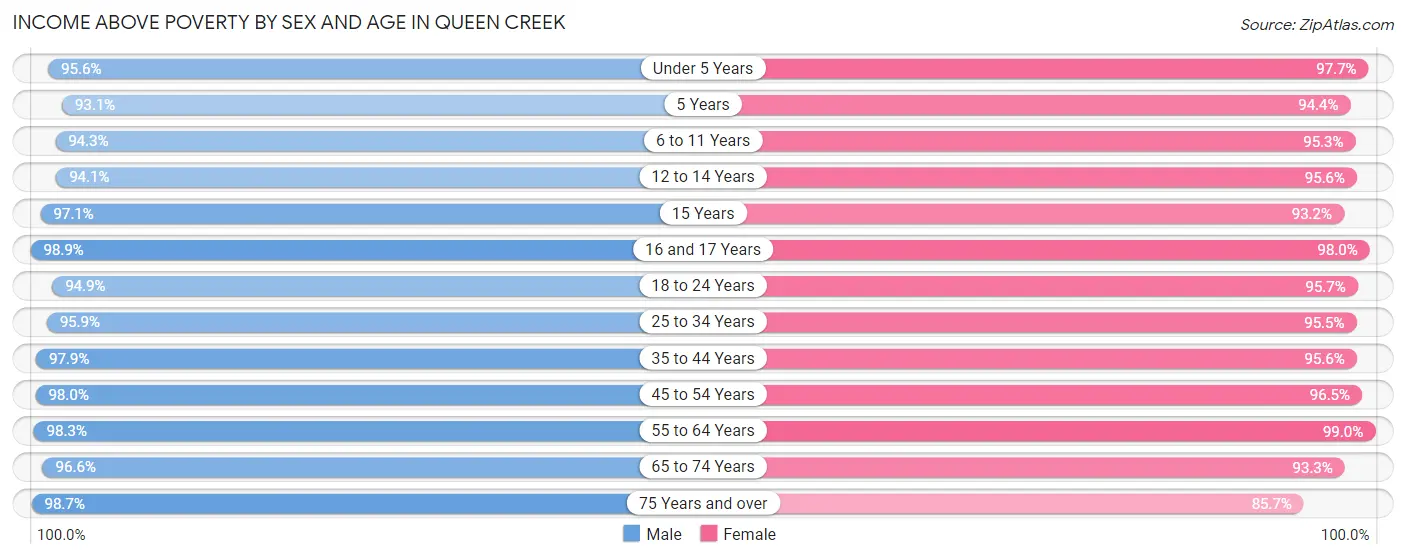
| Age Bracket | Male | Female |
| Under 5 Years | 1,856 (95.6%) | 1,902 (97.7%) |
| 5 Years | 618 (93.1%) | 453 (94.4%) |
| 6 to 11 Years | 3,001 (94.3%) | 3,156 (95.3%) |
| 12 to 14 Years | 1,942 (94.1%) | 1,652 (95.6%) |
| 15 Years | 495 (97.1%) | 670 (93.2%) |
| 16 and 17 Years | 1,090 (98.9%) | 1,250 (98.0%) |
| 18 to 24 Years | 2,217 (94.9%) | 1,996 (95.7%) |
| 25 to 34 Years | 2,519 (95.9%) | 3,138 (95.5%) |
| 35 to 44 Years | 4,277 (97.9%) | 4,711 (95.6%) |
| 45 to 54 Years | 4,347 (98.0%) | 3,982 (96.5%) |
| 55 to 64 Years | 3,332 (98.3%) | 3,248 (99.0%) |
| 65 to 74 Years | 2,129 (96.6%) | 2,544 (93.3%) |
| 75 Years and over | 1,217 (98.7%) | 1,406 (85.7%) |
| Total | 29,040 (96.6%) | 30,108 (95.5%) |
Income Below Poverty Among Married-Couple Families in Queen Creek
The poverty statistics for married-couple families in Queen Creek show that 1.5% or 209 of the total 14,251 families live below the poverty line. Families with 1 or 2 children have the highest poverty rate of 2.6%, comprising of 134 families. On the other hand, families with 5 or more children have the lowest poverty rate of 0.0%, which includes 0 families.
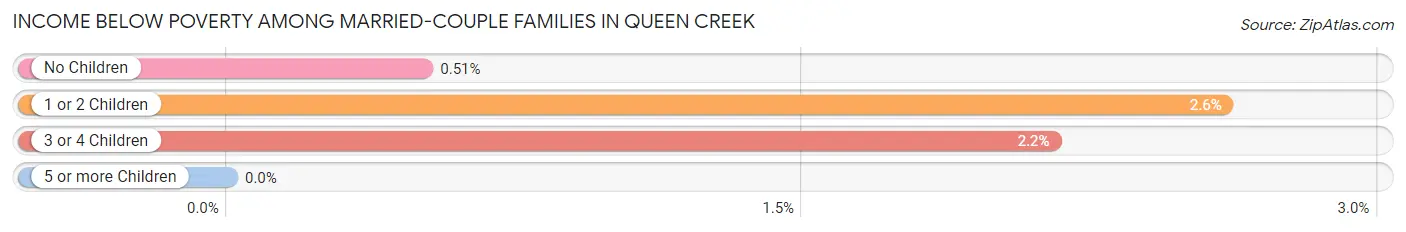
| Children | Above Poverty | Below Poverty |
| No Children | 6,845 (99.5%) | 35 (0.5%) |
| 1 or 2 Children | 5,016 (97.4%) | 134 (2.6%) |
| 3 or 4 Children | 1,819 (97.9%) | 40 (2.1%) |
| 5 or more Children | 362 (100.0%) | 0 (0.0%) |
| Total | 14,042 (98.5%) | 209 (1.5%) |
Income Below Poverty Among Single-Parent Households in Queen Creek
According to the poverty data in Queen Creek, 8.0% or 46 single-father households and 13.6% or 215 single-mother households are living below the poverty line. Among single-father households, those with 1 or 2 children have the highest poverty rate, with 46 households (12.0%) experiencing poverty. Likewise, among single-mother households, those with 1 or 2 children have the highest poverty rate, with 215 households (24.2%) falling below the poverty line.
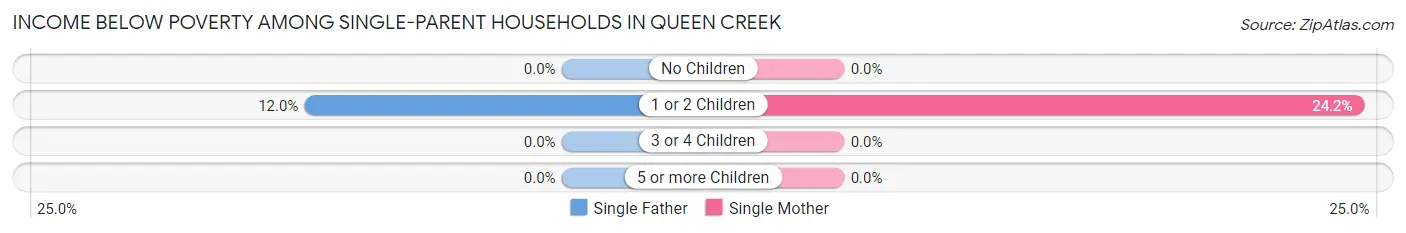
| Children | Single Father | Single Mother |
| No Children | 0 (0.0%) | 0 (0.0%) |
| 1 or 2 Children | 46 (12.0%) | 215 (24.2%) |
| 3 or 4 Children | 0 (0.0%) | 0 (0.0%) |
| 5 or more Children | 0 (0.0%) | 0 (0.0%) |
| Total | 46 (8.0%) | 215 (13.6%) |
Income Below Poverty Among Married-Couple vs Single-Parent Households in Queen Creek
The poverty data for Queen Creek shows that 209 of the married-couple family households (1.5%) and 261 of the single-parent households (12.1%) are living below the poverty level. Within the married-couple family households, those with 1 or 2 children have the highest poverty rate, with 134 households (2.6%) falling below the poverty line. Among the single-parent households, those with 1 or 2 children have the highest poverty rate, with 261 household (20.5%) living below poverty.
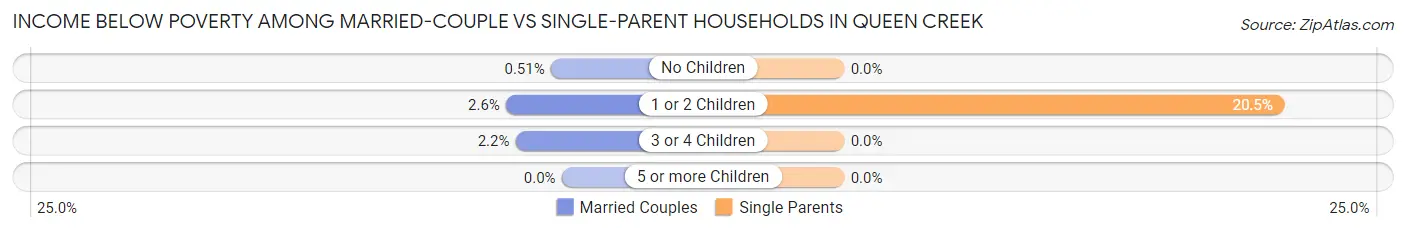
| Children | Married-Couple Families | Single-Parent Households |
| No Children | 35 (0.5%) | 0 (0.0%) |
| 1 or 2 Children | 134 (2.6%) | 261 (20.5%) |
| 3 or 4 Children | 40 (2.1%) | 0 (0.0%) |
| 5 or more Children | 0 (0.0%) | 0 (0.0%) |
| Total | 209 (1.5%) | 261 (12.1%) |
Race in Queen Creek
The most populous races in Queen Creek are White / Caucasian (48,634 | 78.7%), Hispanic or Latino (10,180 | 16.5%), and Two or more Races (6,679 | 10.8%).
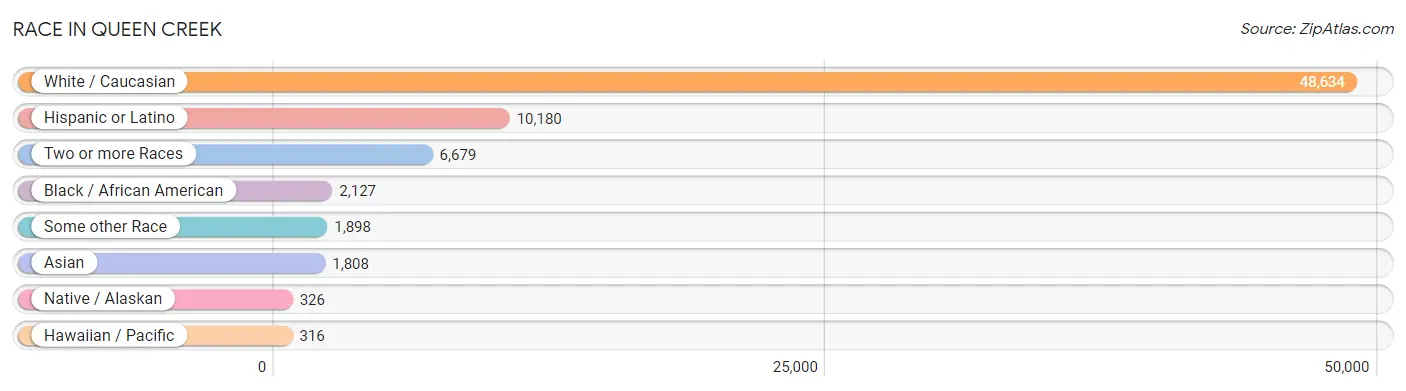
| Race | # Population | % Population |
| Asian | 1,808 | 2.9% |
| Black / African American | 2,127 | 3.4% |
| Hawaiian / Pacific | 316 | 0.5% |
| Hispanic or Latino | 10,180 | 16.5% |
| Native / Alaskan | 326 | 0.5% |
| White / Caucasian | 48,634 | 78.7% |
| Two or more Races | 6,679 | 10.8% |
| Some other Race | 1,898 | 3.1% |
| Total | 61,788 | 100.0% |
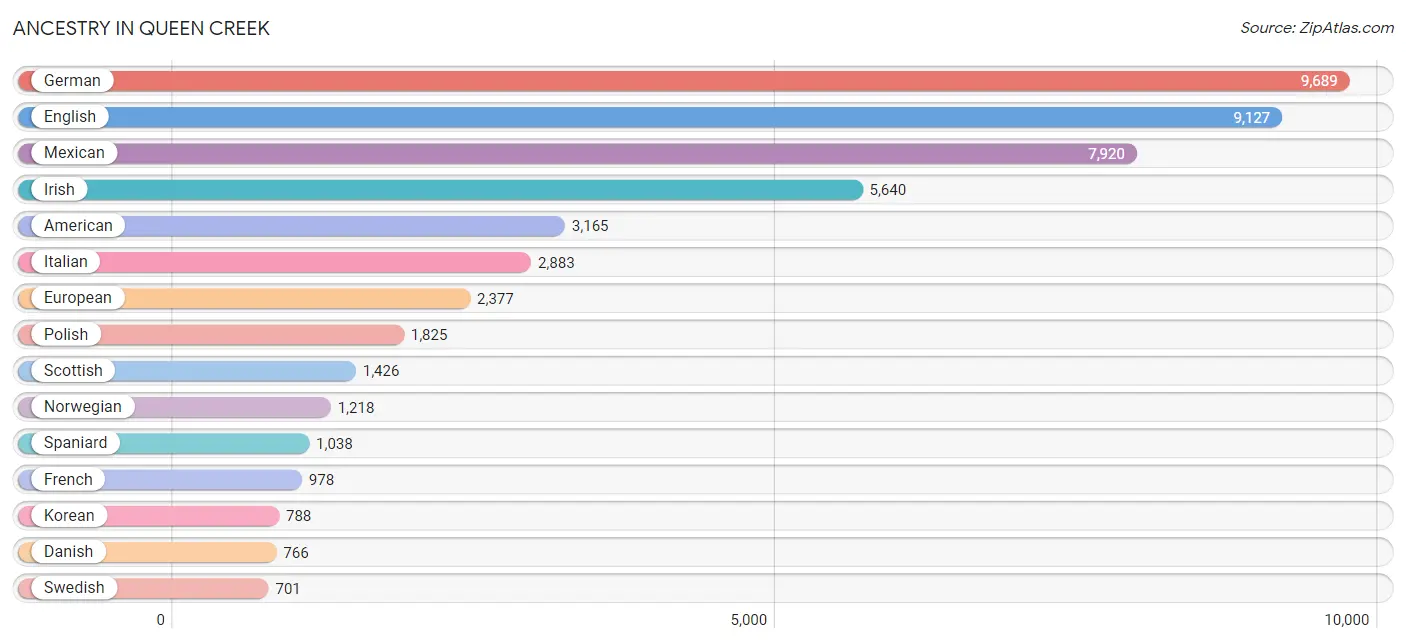
Ancestry in Queen Creek
The most populous ancestries reported in Queen Creek are German (9,689 | 15.7%), English (9,127 | 14.8%), Mexican (7,920 | 12.8%), Irish (5,640 | 9.1%), and American (3,165 | 5.1%), together accounting for 57.5% of all Queen Creek residents.
| Ancestry | # Population | % Population |
| African | 297 | 0.5% |
| Albanian | 8 | 0.0% |
| American | 3,165 | 5.1% |
| Apache | 28 | 0.1% |
| Arab | 205 | 0.3% |
| Armenian | 29 | 0.1% |
| Assyrian / Chaldean / Syriac | 55 | 0.1% |
| Austrian | 71 | 0.1% |
| Basque | 23 | 0.0% |
| Belgian | 105 | 0.2% |
| Bhutanese | 679 | 1.1% |
| Blackfeet | 5 | 0.0% |
| British | 385 | 0.6% |
| Burmese | 331 | 0.5% |
| Canadian | 261 | 0.4% |
| Central American | 266 | 0.4% |
| Cherokee | 118 | 0.2% |
| Chickasaw | 52 | 0.1% |
| Chippewa | 37 | 0.1% |
| Colombian | 175 | 0.3% |
| Comanche | 8 | 0.0% |
| Creek | 10 | 0.0% |
| Croatian | 53 | 0.1% |
| Cuban | 60 | 0.1% |
| Czech | 53 | 0.1% |
| Czechoslovakian | 133 | 0.2% |
| Danish | 766 | 1.2% |
| Delaware | 17 | 0.0% |
| Dominican | 27 | 0.0% |
| Dutch | 350 | 0.6% |
| Eastern European | 124 | 0.2% |
| Ecuadorian | 41 | 0.1% |
| Egyptian | 103 | 0.2% |
| English | 9,127 | 14.8% |
| European | 2,377 | 3.8% |
| Finnish | 237 | 0.4% |
| French | 978 | 1.6% |
| French Canadian | 234 | 0.4% |
| German | 9,689 | 15.7% |
| Greek | 439 | 0.7% |
| Guatemalan | 80 | 0.1% |
| Hungarian | 434 | 0.7% |
| Indian (Asian) | 449 | 0.7% |
| Irish | 5,640 | 9.1% |
| Iroquois | 3 | 0.0% |
| Israeli | 7 | 0.0% |
| Italian | 2,883 | 4.7% |
| Jamaican | 116 | 0.2% |
| Japanese | 320 | 0.5% |
| Korean | 788 | 1.3% |
| Laotian | 41 | 0.1% |
| Lebanese | 125 | 0.2% |
| Liberian | 35 | 0.1% |
| Lithuanian | 94 | 0.2% |
| Mexican | 7,920 | 12.8% |
| Mexican American Indian | 7 | 0.0% |
| Mongolian | 11 | 0.0% |
| Native Hawaiian | 543 | 0.9% |
| Navajo | 103 | 0.2% |
| Nicaraguan | 108 | 0.2% |
| Nigerian | 4 | 0.0% |
| Northern European | 239 | 0.4% |
| Norwegian | 1,218 | 2.0% |
| Ottawa | 11 | 0.0% |
| Pakistani | 71 | 0.1% |
| Pennsylvania German | 17 | 0.0% |
| Peruvian | 13 | 0.0% |
| Polish | 1,825 | 2.9% |
| Portuguese | 46 | 0.1% |
| Potawatomi | 25 | 0.0% |
| Puerto Rican | 239 | 0.4% |
| Romanian | 51 | 0.1% |
| Russian | 263 | 0.4% |
| Salvadoran | 78 | 0.1% |
| Scandinavian | 185 | 0.3% |
| Scotch-Irish | 491 | 0.8% |
| Scottish | 1,426 | 2.3% |
| Serbian | 50 | 0.1% |
| Slavic | 11 | 0.0% |
| Slovak | 66 | 0.1% |
| South African | 12 | 0.0% |
| South American | 248 | 0.4% |
| Spaniard | 1,038 | 1.7% |
| Spanish | 118 | 0.2% |
| Spanish American | 48 | 0.1% |
| Sri Lankan | 258 | 0.4% |
| Subsaharan African | 348 | 0.6% |
| Swedish | 701 | 1.1% |
| Swiss | 319 | 0.5% |
| Syrian | 13 | 0.0% |
| Thai | 248 | 0.4% |
| Tongan | 64 | 0.1% |
| Ukrainian | 51 | 0.1% |
| Uruguayan | 19 | 0.0% |
| Vietnamese | 37 | 0.1% |
| Welsh | 522 | 0.8% |
| West Indian | 7 | 0.0% |
| Yuman | 377 | 0.6% | View All 98 Rows |
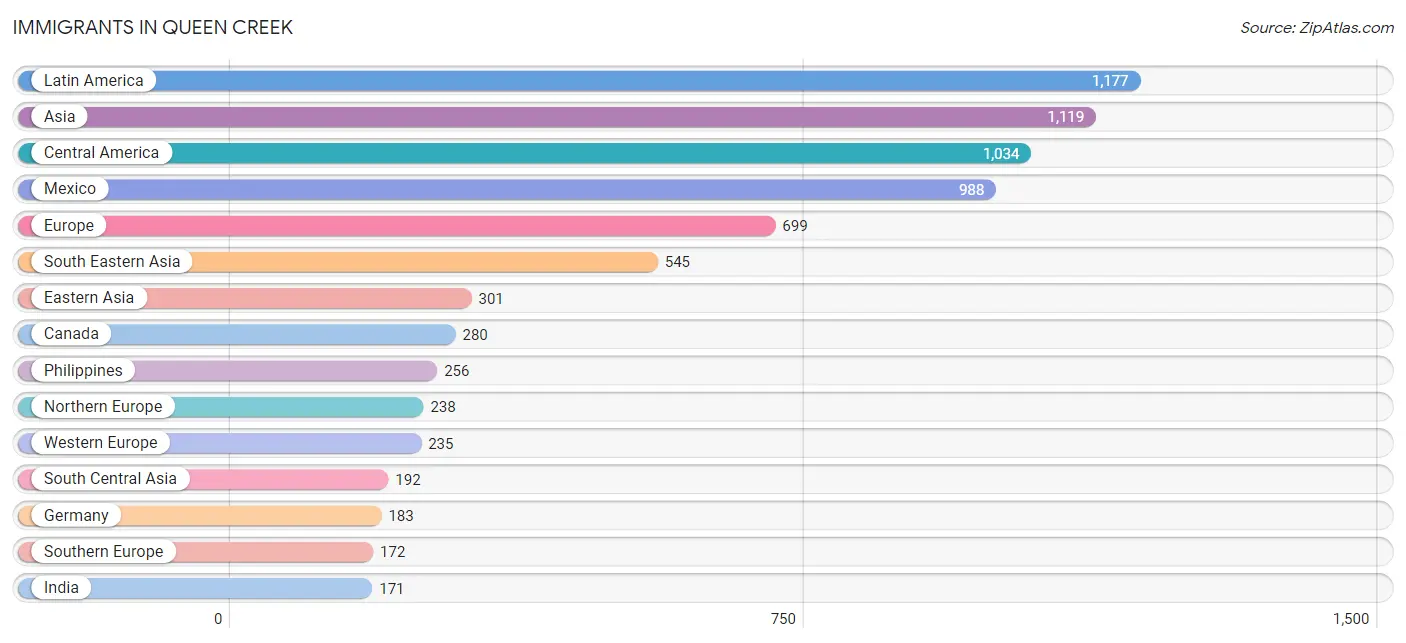
Immigrants in Queen Creek
The most numerous immigrant groups reported in Queen Creek came from Latin America (1,177 | 1.9%), Asia (1,119 | 1.8%), Central America (1,034 | 1.7%), Mexico (988 | 1.6%), and Europe (699 | 1.1%), together accounting for 8.1% of all Queen Creek residents.
| Immigration Origin | # Population | % Population |
| Africa | 158 | 0.3% |
| Armenia | 34 | 0.1% |
| Asia | 1,119 | 1.8% |
| Bangladesh | 13 | 0.0% |
| Belgium | 12 | 0.0% |
| Cambodia | 16 | 0.0% |
| Canada | 280 | 0.4% |
| Caribbean | 66 | 0.1% |
| Central America | 1,034 | 1.7% |
| China | 89 | 0.1% |
| Colombia | 25 | 0.0% |
| Cuba | 24 | 0.0% |
| Dominican Republic | 12 | 0.0% |
| Eastern Asia | 301 | 0.5% |
| Eastern Europe | 54 | 0.1% |
| Ecuador | 21 | 0.0% |
| Egypt | 21 | 0.0% |
| El Salvador | 32 | 0.1% |
| England | 128 | 0.2% |
| Europe | 699 | 1.1% |
| Fiji | 26 | 0.0% |
| France | 40 | 0.1% |
| Germany | 183 | 0.3% |
| Greece | 79 | 0.1% |
| Hong Kong | 19 | 0.0% |
| India | 171 | 0.3% |
| Indonesia | 41 | 0.1% |
| Iran | 8 | 0.0% |
| Iraq | 9 | 0.0% |
| Ireland | 37 | 0.1% |
| Israel | 7 | 0.0% |
| Italy | 16 | 0.0% |
| Jamaica | 30 | 0.1% |
| Japan | 62 | 0.1% |
| Korea | 150 | 0.2% |
| Kuwait | 9 | 0.0% |
| Laos | 27 | 0.0% |
| Latin America | 1,177 | 1.9% |
| Lebanon | 22 | 0.0% |
| Liberia | 46 | 0.1% |
| Malaysia | 29 | 0.1% |
| Mexico | 988 | 1.6% |
| Morocco | 7 | 0.0% |
| Nicaragua | 14 | 0.0% |
| Nigeria | 64 | 0.1% |
| Northern Africa | 43 | 0.1% |
| Northern Europe | 238 | 0.4% |
| Oceania | 26 | 0.0% |
| Peru | 31 | 0.1% |
| Philippines | 256 | 0.4% |
| Poland | 10 | 0.0% |
| Russia | 44 | 0.1% |
| South Africa | 5 | 0.0% |
| South America | 77 | 0.1% |
| South Central Asia | 192 | 0.3% |
| South Eastern Asia | 545 | 0.9% |
| Southern Europe | 172 | 0.3% |
| Spain | 77 | 0.1% |
| Taiwan | 16 | 0.0% |
| Thailand | 17 | 0.0% |
| Vietnam | 159 | 0.3% |
| Western Africa | 110 | 0.2% |
| Western Asia | 81 | 0.1% |
| Western Europe | 235 | 0.4% | View All 64 Rows |
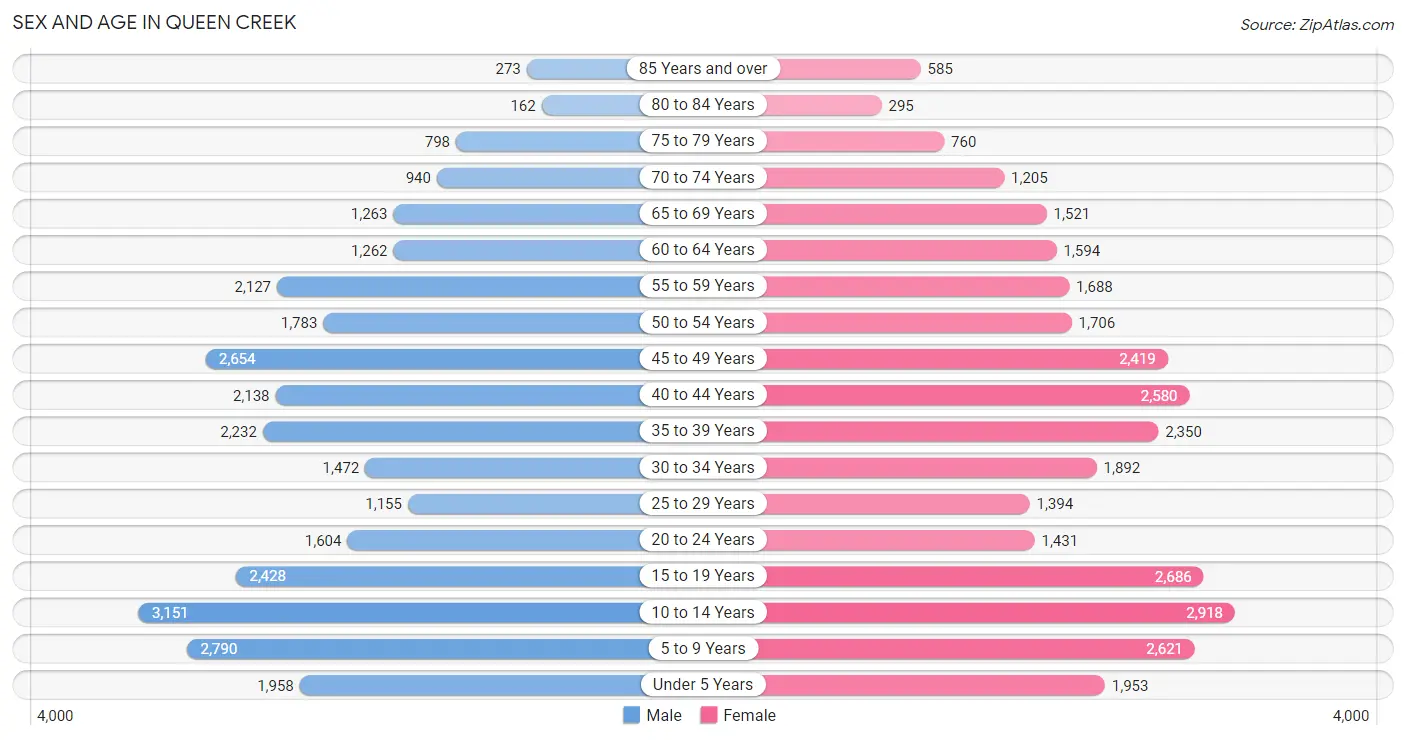
Sex and Age in Queen Creek
Sex and Age in Queen Creek
The most populous age groups in Queen Creek are 10 to 14 Years (3,151 | 10.4%) for men and 10 to 14 Years (2,918 | 9.2%) for women.
| Age Bracket | Male | Female |
| Under 5 Years | 1,958 (6.5%) | 1,953 (6.2%) |
| 5 to 9 Years | 2,790 (9.2%) | 2,621 (8.3%) |
| 10 to 14 Years | 3,151 (10.4%) | 2,918 (9.2%) |
| 15 to 19 Years | 2,428 (8.0%) | 2,686 (8.5%) |
| 20 to 24 Years | 1,604 (5.3%) | 1,431 (4.5%) |
| 25 to 29 Years | 1,155 (3.8%) | 1,394 (4.4%) |
| 30 to 34 Years | 1,472 (4.9%) | 1,892 (6.0%) |
| 35 to 39 Years | 2,232 (7.4%) | 2,350 (7.4%) |
| 40 to 44 Years | 2,138 (7.1%) | 2,580 (8.2%) |
| 45 to 49 Years | 2,654 (8.8%) | 2,419 (7.7%) |
| 50 to 54 Years | 1,783 (5.9%) | 1,706 (5.4%) |
| 55 to 59 Years | 2,127 (7.0%) | 1,688 (5.3%) |
| 60 to 64 Years | 1,262 (4.2%) | 1,594 (5.0%) |
| 65 to 69 Years | 1,263 (4.2%) | 1,521 (4.8%) |
| 70 to 74 Years | 940 (3.1%) | 1,205 (3.8%) |
| 75 to 79 Years | 798 (2.6%) | 760 (2.4%) |
| 80 to 84 Years | 162 (0.5%) | 295 (0.9%) |
| 85 Years and over | 273 (0.9%) | 585 (1.8%) |
| Total | 30,190 (100.0%) | 31,598 (100.0%) |
Families and Households in Queen Creek
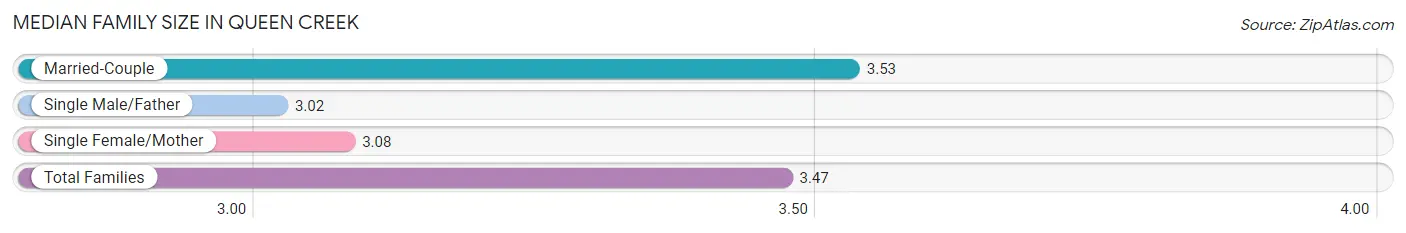
Median Family Size in Queen Creek
The median family size in Queen Creek is 3.47 persons per family, with married-couple families (14,251 | 86.9%) accounting for the largest median family size of 3.53 persons per family. On the other hand, single male/father families (575 | 3.5%) represent the smallest median family size with 3.02 persons per family.
| Family Type | # Families | Family Size |
| Married-Couple | 14,251 (86.9%) | 3.53 |
| Single Male/Father | 575 (3.5%) | 3.02 |
| Single Female/Mother | 1,577 (9.6%) | 3.08 |
| Total Families | 16,403 (100.0%) | 3.47 |
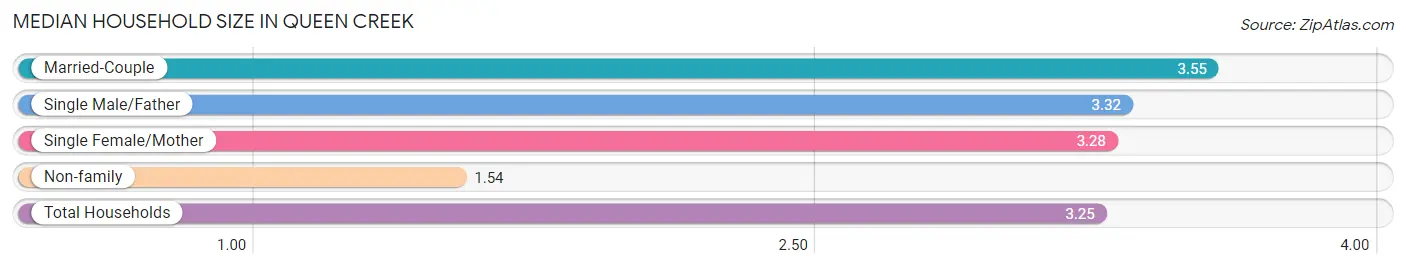
Median Household Size in Queen Creek
The median household size in Queen Creek is 3.25 persons per household, with married-couple households (14,251 | 75.2%) accounting for the largest median household size of 3.55 persons per household. non-family households (2,551 | 13.5%) represent the smallest median household size with 1.54 persons per household.
| Household Type | # Households | Household Size |
| Married-Couple | 14,251 (75.2%) | 3.55 |
| Single Male/Father | 575 (3.0%) | 3.32 |
| Single Female/Mother | 1,577 (8.3%) | 3.28 |
| Non-family | 2,551 (13.5%) | 1.54 |
| Total Households | 18,954 (100.0%) | 3.25 |
Household Size by Marriage Status in Queen Creek
Out of a total of 18,954 households in Queen Creek, 16,403 (86.5%) are family households, while 2,551 (13.5%) are nonfamily households. The most numerous type of family households are 2-person households, comprising 5,403, and the most common type of nonfamily households are 1-person households, comprising 1,678.
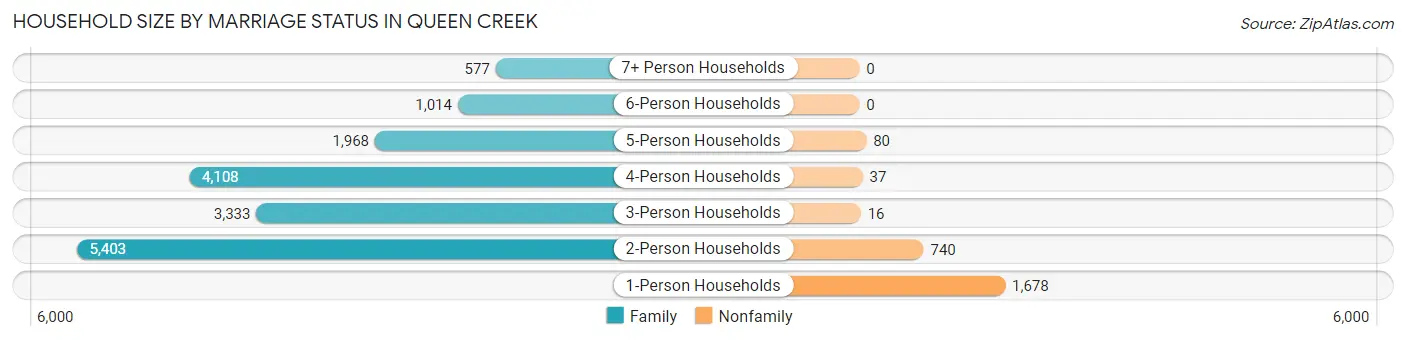
| Household Size | Family Households | Nonfamily Households |
| 1-Person Households | - | 1,678 (8.8%) |
| 2-Person Households | 5,403 (28.5%) | 740 (3.9%) |
| 3-Person Households | 3,333 (17.6%) | 16 (0.1%) |
| 4-Person Households | 4,108 (21.7%) | 37 (0.2%) |
| 5-Person Households | 1,968 (10.4%) | 80 (0.4%) |
| 6-Person Households | 1,014 (5.3%) | 0 (0.0%) |
| 7+ Person Households | 577 (3.0%) | 0 (0.0%) |
| Total | 16,403 (86.5%) | 2,551 (13.5%) |
Female Fertility in Queen Creek
Fertility by Age in Queen Creek
Average fertility rate in Queen Creek is 53.0 births per 1,000 women. Women in the age bracket of 20 to 34 years have the highest fertility rate with 101.0 births per 1,000 women. Women in the age bracket of 20 to 34 years acount for 59.7% of all women with births.
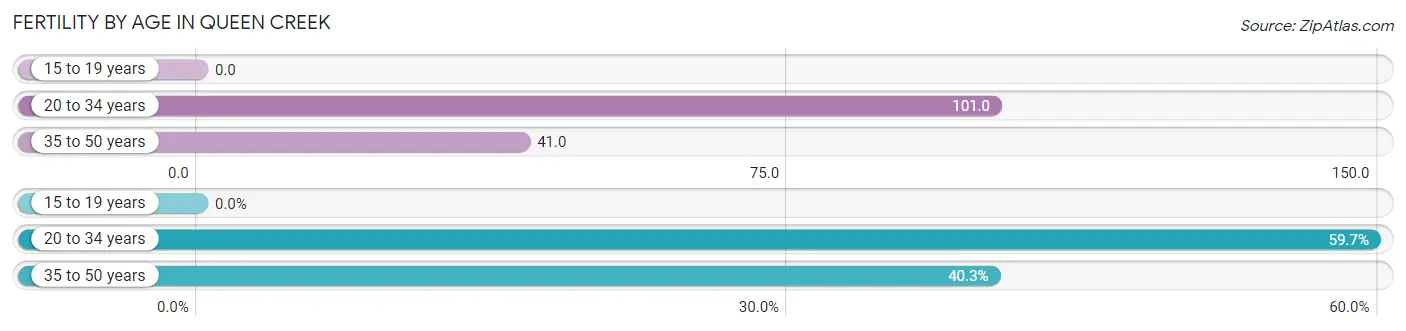
| Age Bracket | Women with Births | Births / 1,000 Women |
| 15 to 19 years | 0 (0.0%) | 0.0 |
| 20 to 34 years | 478 (59.7%) | 101.0 |
| 35 to 50 years | 323 (40.3%) | 41.0 |
| Total | 801 (100.0%) | 53.0 |
Fertility by Age by Marriage Status in Queen Creek
84.8% of women with births (801) in Queen Creek are married. The highest percentage of unmarried women with births falls into 35 to 50 years age bracket with 34.7% of them unmarried at the time of birth, while the lowest percentage of unmarried women with births belong to 20 to 34 years age bracket with 2.1% of them unmarried.
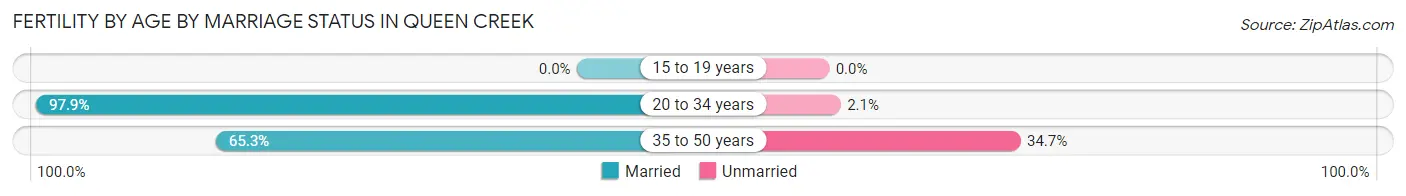
| Age Bracket | Married | Unmarried |
| 15 to 19 years | 0 (0.0%) | 0 (0.0%) |
| 20 to 34 years | 468 (97.9%) | 10 (2.1%) |
| 35 to 50 years | 211 (65.3%) | 112 (34.7%) |
| Total | 679 (84.8%) | 122 (15.2%) |
Fertility by Education in Queen Creek
Average fertility rate in Queen Creek is 53.0 births per 1,000 women. Women with the education attainment of graduate degree have the highest fertility rate of 109.0 births per 1,000 women, while women with the education attainment of less than high school have the lowest fertility at 2.0 births per 1,000 women. Women with the education attainment of college or associate's degree represent 30.7% of all women with births.
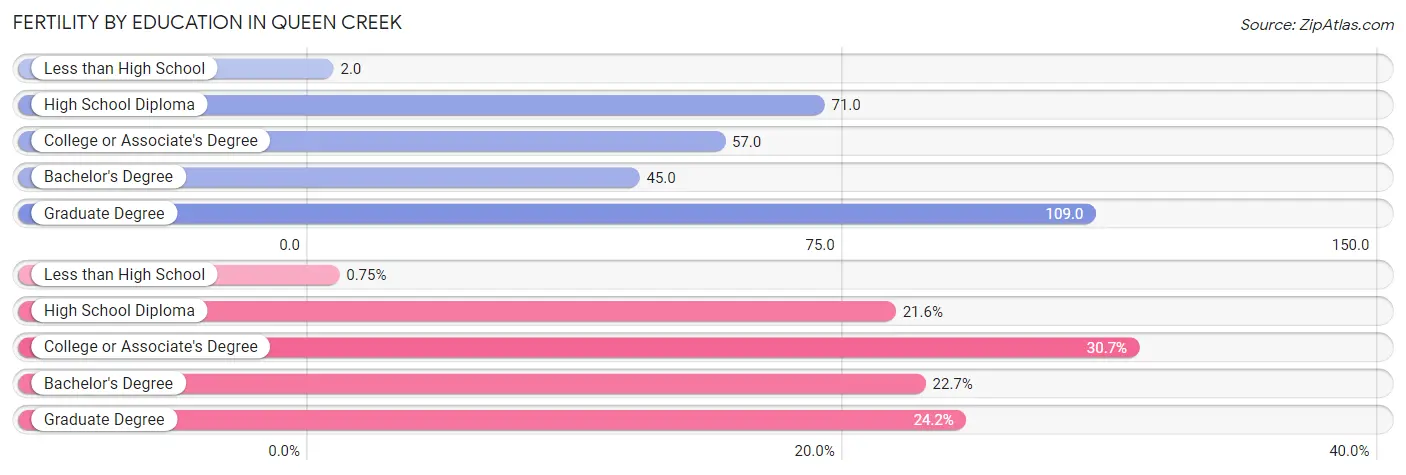
| Educational Attainment | Women with Births | Births / 1,000 Women |
| Less than High School | 6 (0.7%) | 2.0 |
| High School Diploma | 173 (21.6%) | 71.0 |
| College or Associate's Degree | 246 (30.7%) | 57.0 |
| Bachelor's Degree | 182 (22.7%) | 45.0 |
| Graduate Degree | 194 (24.2%) | 109.0 |
| Total | 801 (100.0%) | 53.0 |
Fertility by Education by Marriage Status in Queen Creek
15.2% of women with births in Queen Creek are unmarried. Women with the educational attainment of less than high school are most likely to be married with 100.0% of them married at childbirth, while women with the educational attainment of high school diploma are least likely to be married with 57.2% of them unmarried at childbirth.
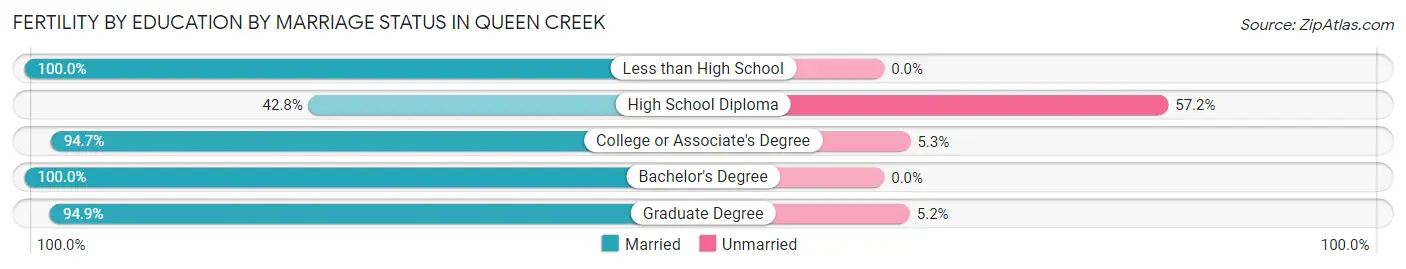
| Educational Attainment | Married | Unmarried |
| Less than High School | 6 (100.0%) | 0 (0.0%) |
| High School Diploma | 74 (42.8%) | 99 (57.2%) |
| College or Associate's Degree | 233 (94.7%) | 13 (5.3%) |
| Bachelor's Degree | 182 (100.0%) | 0 (0.0%) |
| Graduate Degree | 184 (94.9%) | 10 (5.1%) |
| Total | 679 (84.8%) | 122 (15.2%) |
Employment Characteristics in Queen Creek
Employment by Class of Employer in Queen Creek
Among the 28,627 employed individuals in Queen Creek, private company employees (19,502 | 68.1%), local government employees (2,102 | 7.3%), and not-for-profit organizations (1,959 | 6.8%) make up the most common classes of employment.
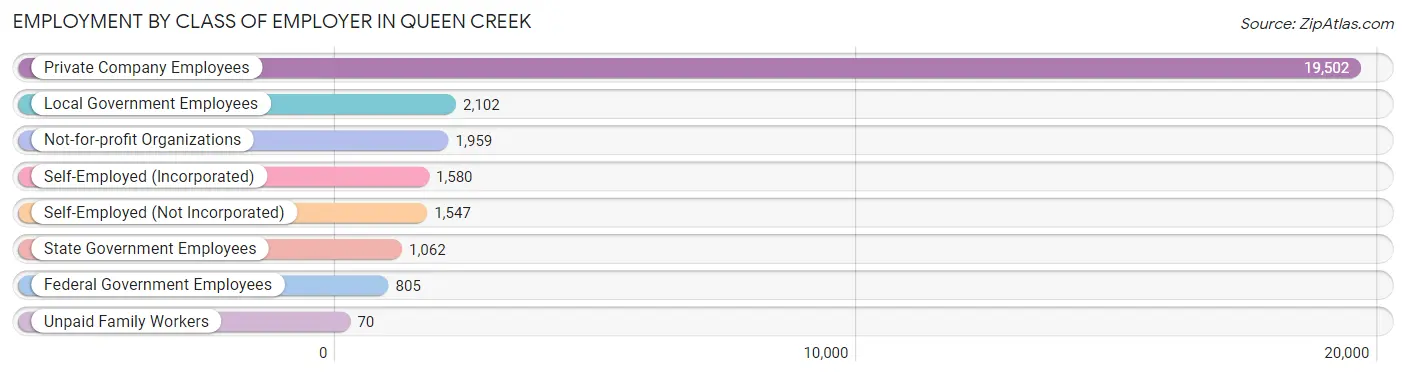
| Employer Class | # Employees | % Employees |
| Private Company Employees | 19,502 | 68.1% |
| Self-Employed (Incorporated) | 1,580 | 5.5% |
| Self-Employed (Not Incorporated) | 1,547 | 5.4% |
| Not-for-profit Organizations | 1,959 | 6.8% |
| Local Government Employees | 2,102 | 7.3% |
| State Government Employees | 1,062 | 3.7% |
| Federal Government Employees | 805 | 2.8% |
| Unpaid Family Workers | 70 | 0.2% |
| Total | 28,627 | 100.0% |
Employment Status by Age in Queen Creek
According to the labor force statistics for Queen Creek, out of the total population over 16 years of age (45,148), 67.0% or 30,249 individuals are in the labor force, with 4.3% or 1,301 of them unemployed. The age group with the highest labor force participation rate is 45 to 54 years, with 87.4% or 7,483 individuals in the labor force. Within the labor force, the 16 to 19 years age range has the highest percentage of unemployed individuals, with 19.2% or 323 of them being unemployed.
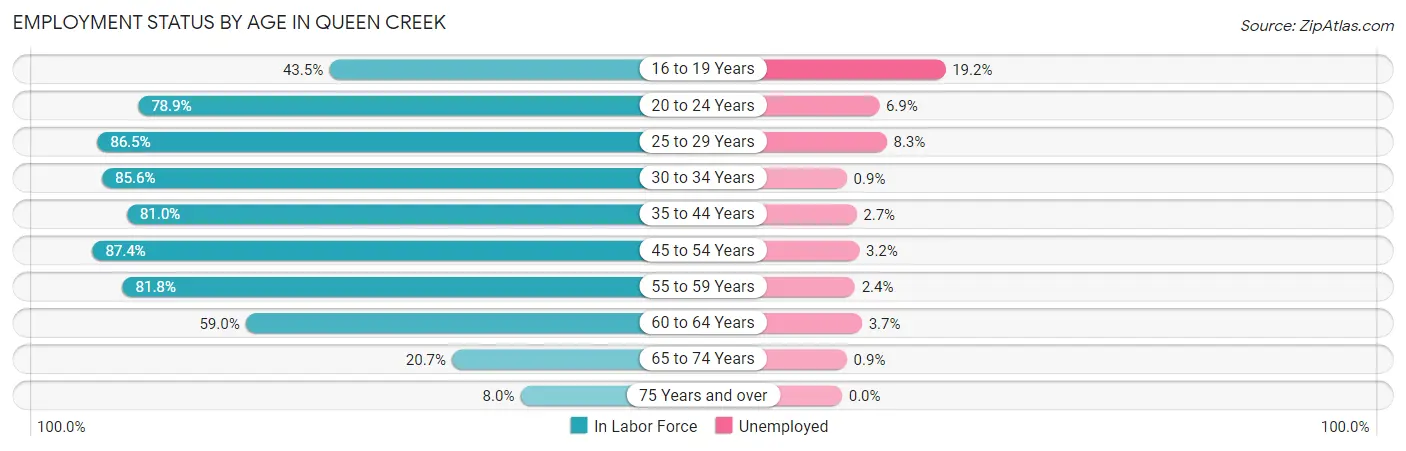
| Age Bracket | In Labor Force | Unemployed |
| 16 to 19 Years | 1,681 (43.5%) | 323 (19.2%) |
| 20 to 24 Years | 2,395 (78.9%) | 165 (6.9%) |
| 25 to 29 Years | 2,205 (86.5%) | 183 (8.3%) |
| 30 to 34 Years | 2,880 (85.6%) | 26 (0.9%) |
| 35 to 44 Years | 7,533 (81.0%) | 203 (2.7%) |
| 45 to 54 Years | 7,483 (87.4%) | 239 (3.2%) |
| 55 to 59 Years | 3,121 (81.8%) | 75 (2.4%) |
| 60 to 64 Years | 1,685 (59.0%) | 62 (3.7%) |
| 65 to 74 Years | 1,020 (20.7%) | 9 (0.9%) |
| 75 Years and over | 230 (8.0%) | 0 (0.0%) |
| Total | 30,249 (67.0%) | 1,301 (4.3%) |
Employment Status by Educational Attainment in Queen Creek
According to labor force statistics for Queen Creek, 81.8% of individuals (24,905) out of the total population between 25 and 64 years of age (30,446) are in the labor force, with 3.2% or 797 of them being unemployed. The group with the highest labor force participation rate are those with the educational attainment of less than high school, with 86.4% or 591 individuals in the labor force. Within the labor force, individuals with high school diploma education have the highest percentage of unemployment, with 5.8% or 256 of them being unemployed.
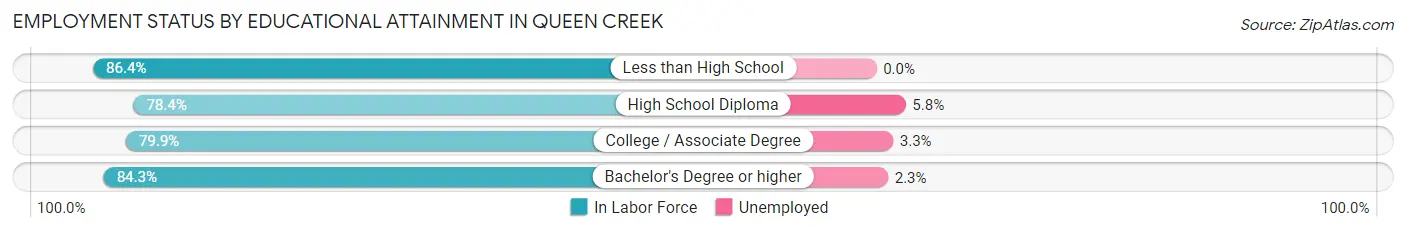
| Educational Attainment | In Labor Force | Unemployed |
| Less than High School | 591 (86.4%) | 0 (0.0%) |
| High School Diploma | 4,412 (78.4%) | 326 (5.8%) |
| College / Associate Degree | 8,038 (79.9%) | 332 (3.3%) |
| Bachelor's Degree or higher | 11,864 (84.3%) | 324 (2.3%) |
| Total | 24,905 (81.8%) | 974 (3.2%) |
Employment Occupations by Sex in Queen Creek
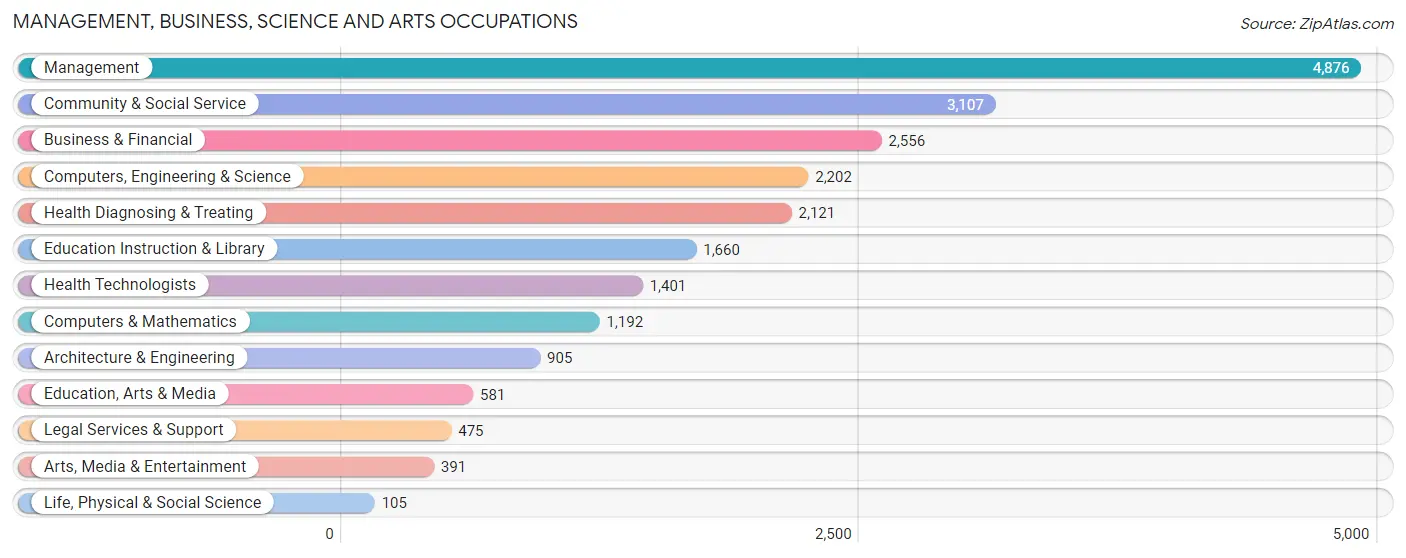
Management, Business, Science and Arts Occupations
The most common Management, Business, Science and Arts occupations in Queen Creek are Management (4,876 | 16.9%), Community & Social Service (3,107 | 10.7%), Business & Financial (2,556 | 8.8%), Computers, Engineering & Science (2,202 | 7.6%), and Health Diagnosing & Treating (2,121 | 7.3%).
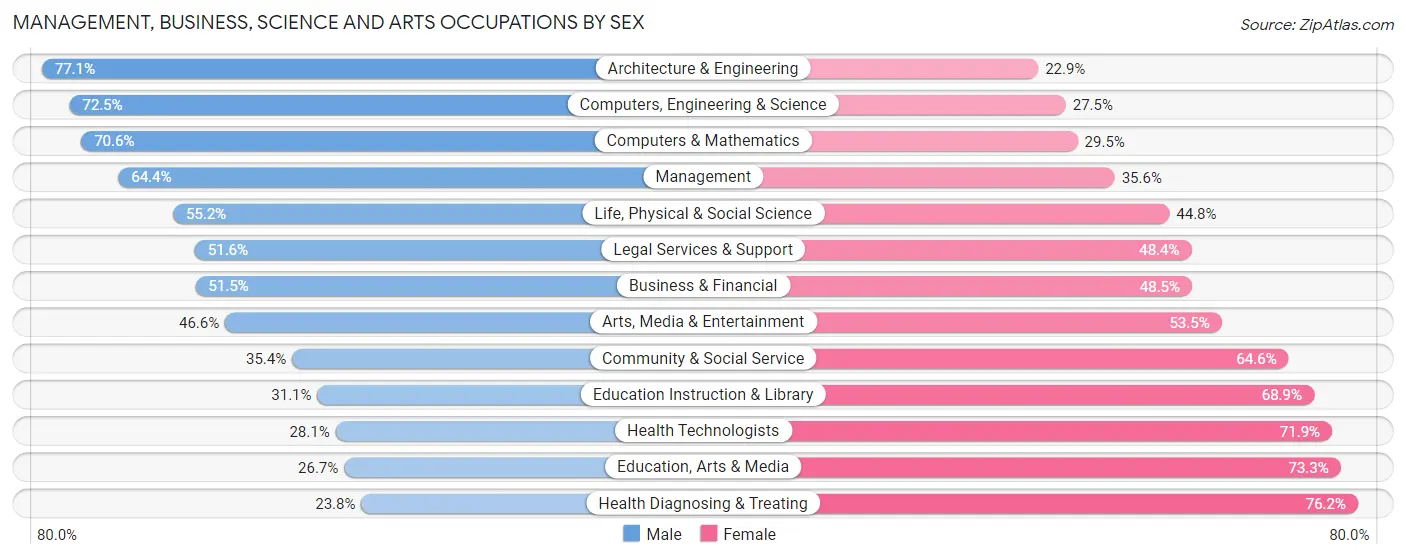
Management, Business, Science and Arts Occupations by Sex
Within the Management, Business, Science and Arts occupations in Queen Creek, the most male-oriented occupations are Architecture & Engineering (77.1%), Computers, Engineering & Science (72.5%), and Computers & Mathematics (70.6%), while the most female-oriented occupations are Health Diagnosing & Treating (76.2%), Education, Arts & Media (73.3%), and Health Technologists (71.9%).
| Occupation | Male | Female |
| Management | 3,138 (64.4%) | 1,738 (35.6%) |
| Business & Financial | 1,316 (51.5%) | 1,240 (48.5%) |
| Computers, Engineering & Science | 1,597 (72.5%) | 605 (27.5%) |
| Computers & Mathematics | 841 (70.6%) | 351 (29.4%) |
| Architecture & Engineering | 698 (77.1%) | 207 (22.9%) |
| Life, Physical & Social Science | 58 (55.2%) | 47 (44.8%) |
| Community & Social Service | 1,099 (35.4%) | 2,008 (64.6%) |
| Education, Arts & Media | 155 (26.7%) | 426 (73.3%) |
| Legal Services & Support | 245 (51.6%) | 230 (48.4%) |
| Education Instruction & Library | 517 (31.1%) | 1,143 (68.9%) |
| Arts, Media & Entertainment | 182 (46.6%) | 209 (53.4%) |
| Health Diagnosing & Treating | 505 (23.8%) | 1,616 (76.2%) |
| Health Technologists | 394 (28.1%) | 1,007 (71.9%) |
| Total (Category) | 7,655 (51.5%) | 7,207 (48.5%) |
| Total (Overall) | 15,844 (54.8%) | 13,075 (45.2%) |
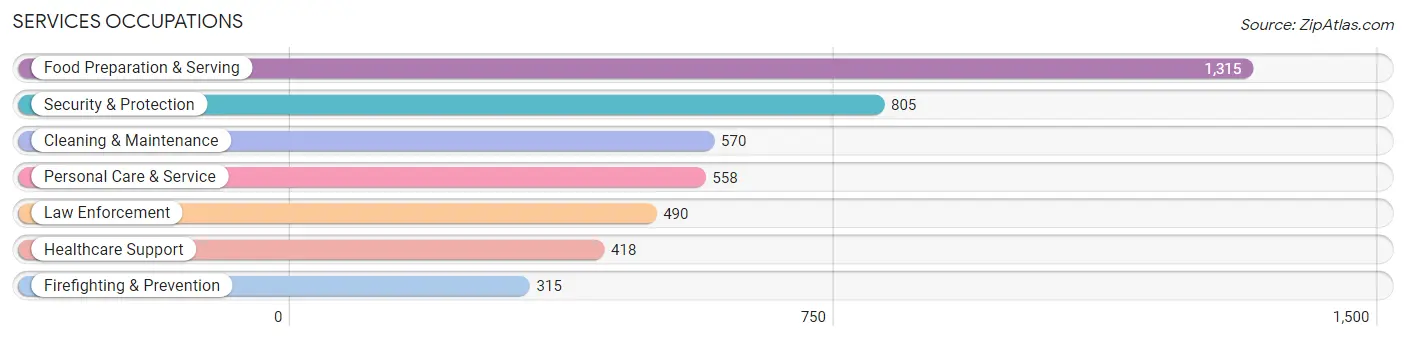
Services Occupations
The most common Services occupations in Queen Creek are Food Preparation & Serving (1,315 | 4.5%), Security & Protection (805 | 2.8%), Cleaning & Maintenance (570 | 2.0%), Personal Care & Service (558 | 1.9%), and Law Enforcement (490 | 1.7%).
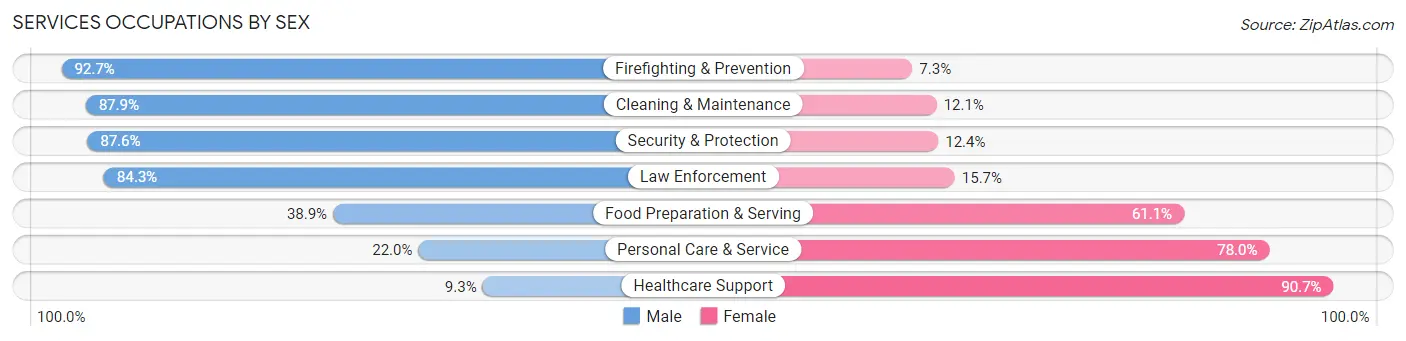
Services Occupations by Sex
Within the Services occupations in Queen Creek, the most male-oriented occupations are Firefighting & Prevention (92.7%), Cleaning & Maintenance (87.9%), and Security & Protection (87.6%), while the most female-oriented occupations are Healthcare Support (90.7%), Personal Care & Service (78.0%), and Food Preparation & Serving (61.1%).
| Occupation | Male | Female |
| Healthcare Support | 39 (9.3%) | 379 (90.7%) |
| Security & Protection | 705 (87.6%) | 100 (12.4%) |
| Firefighting & Prevention | 292 (92.7%) | 23 (7.3%) |
| Law Enforcement | 413 (84.3%) | 77 (15.7%) |
| Food Preparation & Serving | 512 (38.9%) | 803 (61.1%) |
| Cleaning & Maintenance | 501 (87.9%) | 69 (12.1%) |
| Personal Care & Service | 123 (22.0%) | 435 (78.0%) |
| Total (Category) | 1,880 (51.3%) | 1,786 (48.7%) |
| Total (Overall) | 15,844 (54.8%) | 13,075 (45.2%) |
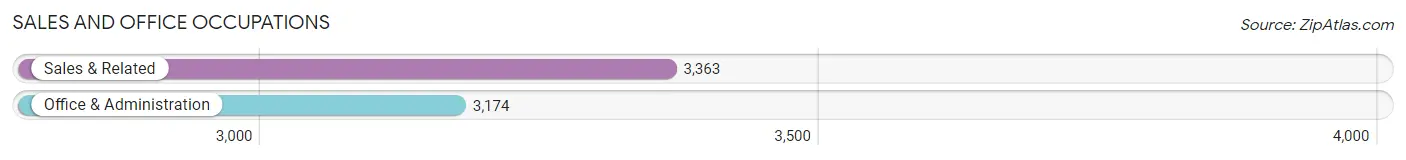
Sales and Office Occupations
The most common Sales and Office occupations in Queen Creek are Sales & Related (3,363 | 11.6%), and Office & Administration (3,174 | 11.0%).
Sales and Office Occupations by Sex
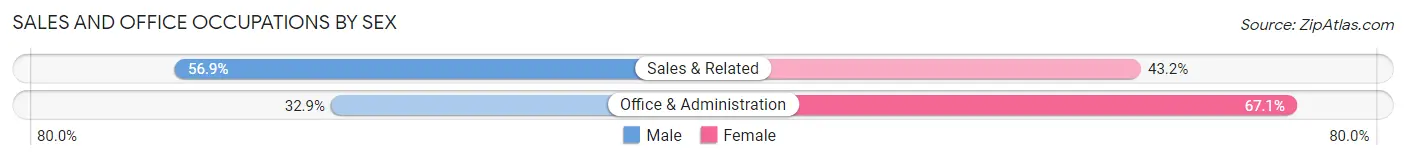
| Occupation | Male | Female |
| Sales & Related | 1,912 (56.9%) | 1,451 (43.1%) |
| Office & Administration | 1,044 (32.9%) | 2,130 (67.1%) |
| Total (Category) | 2,956 (45.2%) | 3,581 (54.8%) |
| Total (Overall) | 15,844 (54.8%) | 13,075 (45.2%) |
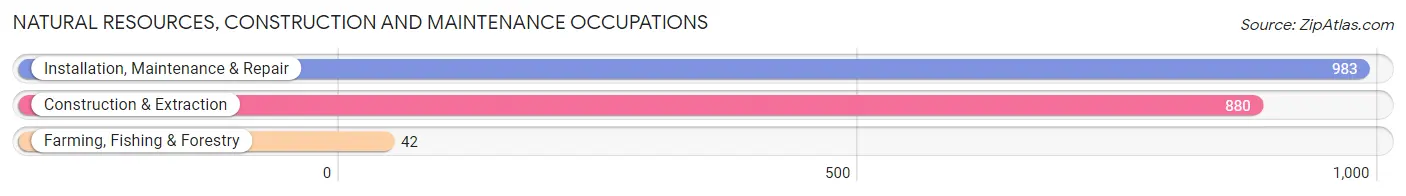
Natural Resources, Construction and Maintenance Occupations
The most common Natural Resources, Construction and Maintenance occupations in Queen Creek are Installation, Maintenance & Repair (983 | 3.4%), Construction & Extraction (880 | 3.0%), and Farming, Fishing & Forestry (42 | 0.2%).
Natural Resources, Construction and Maintenance Occupations by Sex
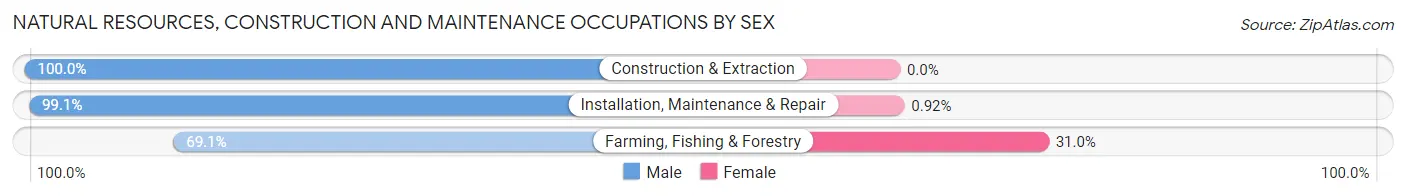
| Occupation | Male | Female |
| Farming, Fishing & Forestry | 29 (69.1%) | 13 (30.9%) |
| Construction & Extraction | 880 (100.0%) | 0 (0.0%) |
| Installation, Maintenance & Repair | 974 (99.1%) | 9 (0.9%) |
| Total (Category) | 1,883 (98.9%) | 22 (1.1%) |
| Total (Overall) | 15,844 (54.8%) | 13,075 (45.2%) |
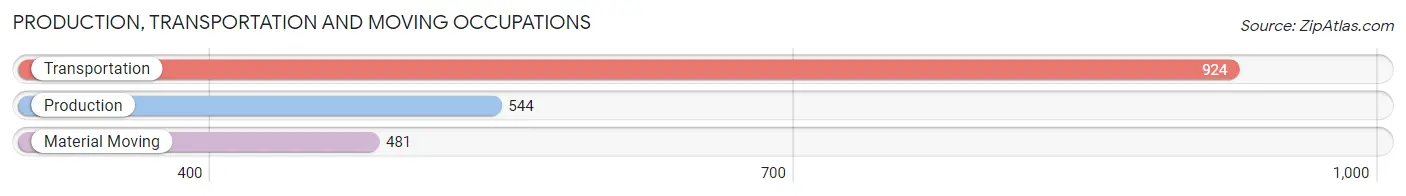
Production, Transportation and Moving Occupations
The most common Production, Transportation and Moving occupations in Queen Creek are Transportation (924 | 3.2%), Production (544 | 1.9%), and Material Moving (481 | 1.7%).
Production, Transportation and Moving Occupations by Sex
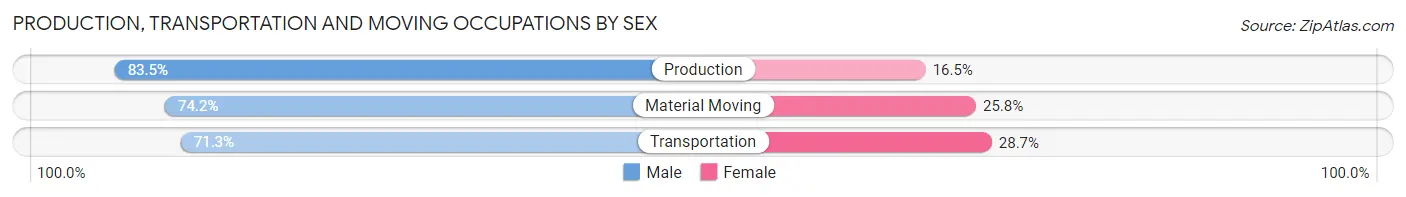
| Occupation | Male | Female |
| Production | 454 (83.5%) | 90 (16.5%) |
| Transportation | 659 (71.3%) | 265 (28.7%) |
| Material Moving | 357 (74.2%) | 124 (25.8%) |
| Total (Category) | 1,470 (75.4%) | 479 (24.6%) |
| Total (Overall) | 15,844 (54.8%) | 13,075 (45.2%) |
Employment Industries by Sex in Queen Creek
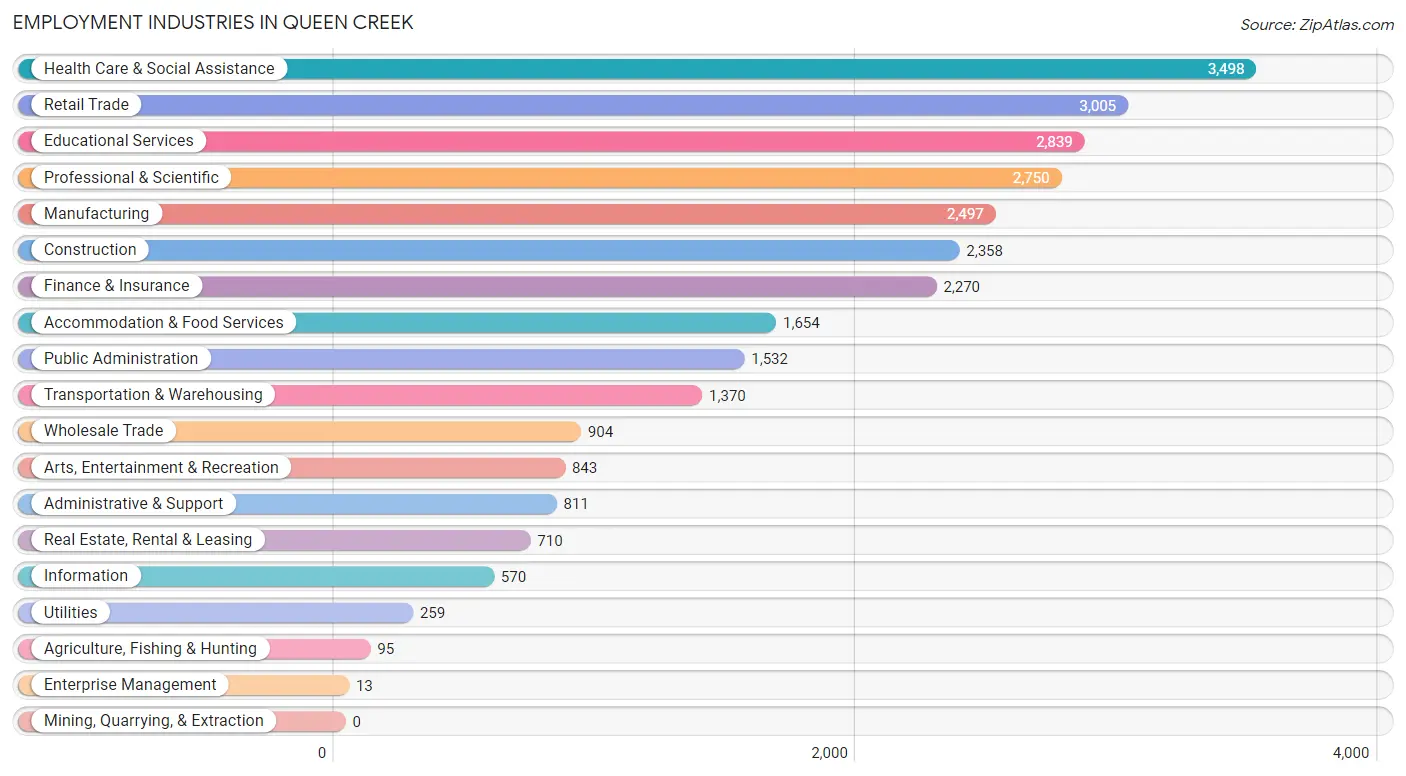
Employment Industries in Queen Creek
The major employment industries in Queen Creek include Health Care & Social Assistance (3,498 | 12.1%), Retail Trade (3,005 | 10.4%), Educational Services (2,839 | 9.8%), Professional & Scientific (2,750 | 9.5%), and Manufacturing (2,497 | 8.6%).
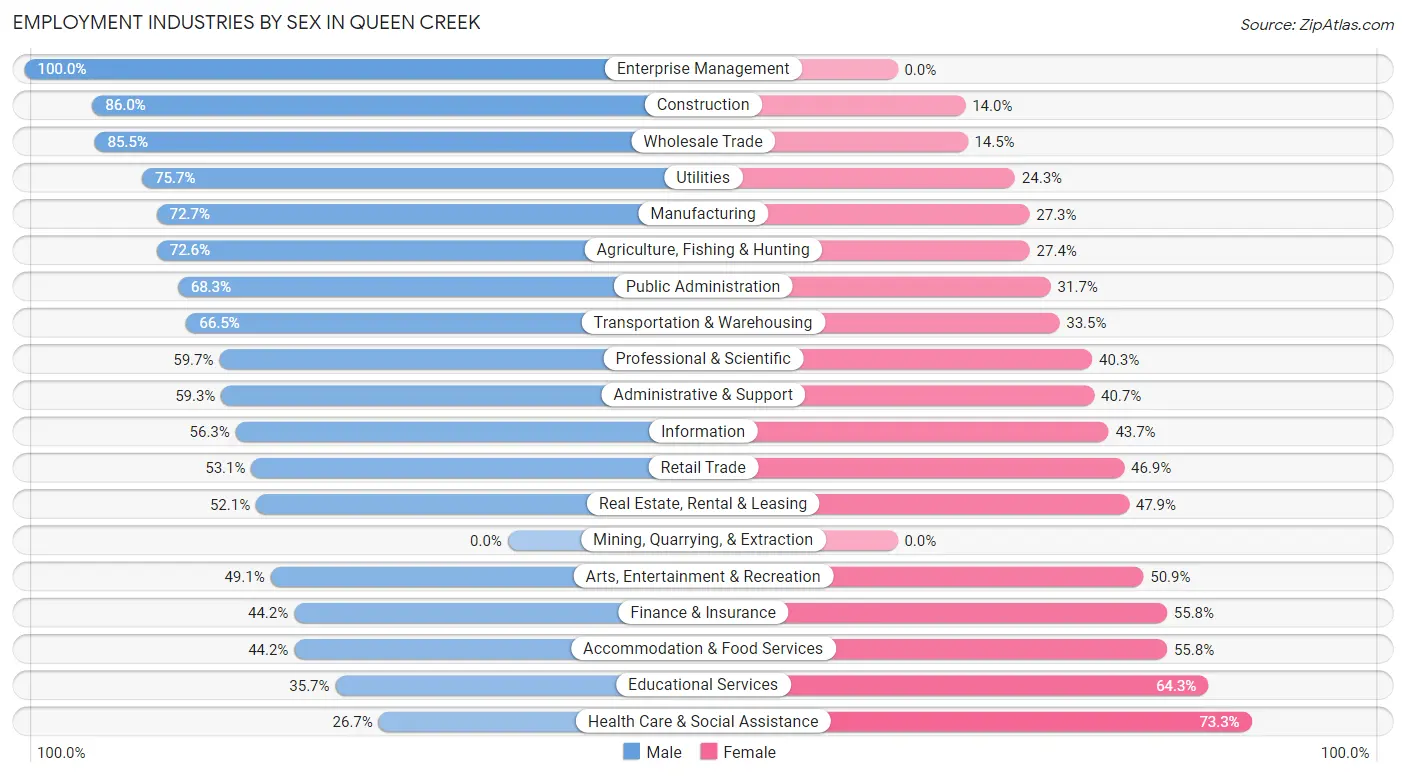
Employment Industries by Sex in Queen Creek
The Queen Creek industries that see more men than women are Enterprise Management (100.0%), Construction (86.0%), and Wholesale Trade (85.5%), whereas the industries that tend to have a higher number of women are Health Care & Social Assistance (73.3%), Educational Services (64.3%), and Accommodation & Food Services (55.8%).
| Industry | Male | Female |
| Agriculture, Fishing & Hunting | 69 (72.6%) | 26 (27.4%) |
| Mining, Quarrying, & Extraction | 0 (0.0%) | 0 (0.0%) |
| Construction | 2,027 (86.0%) | 331 (14.0%) |
| Manufacturing | 1,815 (72.7%) | 682 (27.3%) |
| Wholesale Trade | 773 (85.5%) | 131 (14.5%) |
| Retail Trade | 1,595 (53.1%) | 1,410 (46.9%) |
| Transportation & Warehousing | 911 (66.5%) | 459 (33.5%) |
| Utilities | 196 (75.7%) | 63 (24.3%) |
| Information | 321 (56.3%) | 249 (43.7%) |
| Finance & Insurance | 1,004 (44.2%) | 1,266 (55.8%) |
| Real Estate, Rental & Leasing | 370 (52.1%) | 340 (47.9%) |
| Professional & Scientific | 1,642 (59.7%) | 1,108 (40.3%) |
| Enterprise Management | 13 (100.0%) | 0 (0.0%) |
| Administrative & Support | 481 (59.3%) | 330 (40.7%) |
| Educational Services | 1,013 (35.7%) | 1,826 (64.3%) |
| Health Care & Social Assistance | 935 (26.7%) | 2,563 (73.3%) |
| Arts, Entertainment & Recreation | 414 (49.1%) | 429 (50.9%) |
| Accommodation & Food Services | 731 (44.2%) | 923 (55.8%) |
| Public Administration | 1,046 (68.3%) | 486 (31.7%) |
| Total | 15,844 (54.8%) | 13,075 (45.2%) |
Education in Queen Creek
School Enrollment in Queen Creek
The most common levels of schooling among the 18,846 students in Queen Creek are middle school (4,866 | 25.8%), high school (4,297 | 22.8%), and elementary school (4,034 | 21.4%).
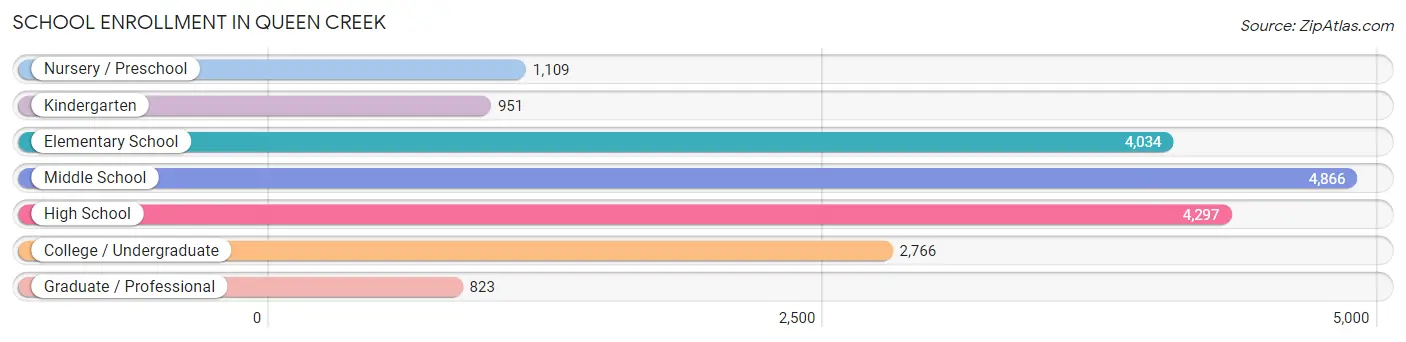
| School Level | # Students | % Students |
| Nursery / Preschool | 1,109 | 5.9% |
| Kindergarten | 951 | 5.1% |
| Elementary School | 4,034 | 21.4% |
| Middle School | 4,866 | 25.8% |
| High School | 4,297 | 22.8% |
| College / Undergraduate | 2,766 | 14.7% |
| Graduate / Professional | 823 | 4.4% |
| Total | 18,846 | 100.0% |
School Enrollment by Age by Funding Source in Queen Creek
Out of a total of 18,846 students who are enrolled in schools in Queen Creek, 3,034 (16.1%) attend a private institution, while the remaining 15,812 (83.9%) are enrolled in public schools. The age group of 35 years and over has the highest likelihood of being enrolled in private schools, with 497 (54.4% in the age bracket) enrolled. Conversely, the age group of 15 to 17 year olds has the lowest likelihood of being enrolled in a private school, with 3,281 (93.7% in the age bracket) attending a public institution.
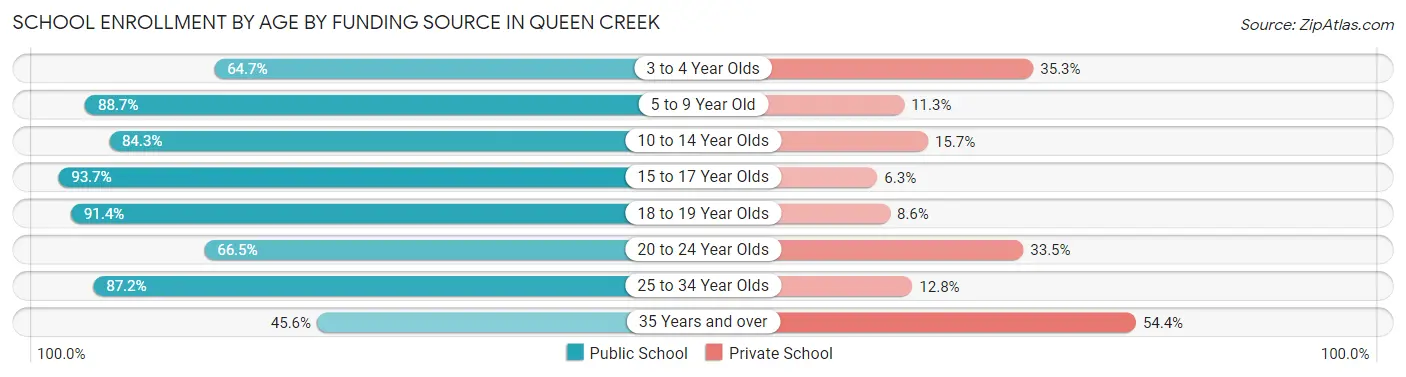
| Age Bracket | Public School | Private School |
| 3 to 4 Year Olds | 487 (64.7%) | 266 (35.3%) |
| 5 to 9 Year Old | 4,365 (88.7%) | 555 (11.3%) |
| 10 to 14 Year Olds | 4,826 (84.3%) | 900 (15.7%) |
| 15 to 17 Year Olds | 3,281 (93.7%) | 220 (6.3%) |
| 18 to 19 Year Olds | 995 (91.4%) | 94 (8.6%) |
| 20 to 24 Year Olds | 815 (66.5%) | 410 (33.5%) |
| 25 to 34 Year Olds | 627 (87.2%) | 92 (12.8%) |
| 35 Years and over | 416 (45.6%) | 497 (54.4%) |
| Total | 15,812 (83.9%) | 3,034 (16.1%) |
Educational Attainment by Field of Study in Queen Creek
Business (4,061 | 22.6%), education (2,241 | 12.5%), science & technology (1,951 | 10.9%), arts & humanities (1,668 | 9.3%), and engineering (1,379 | 7.7%) are the most common fields of study among 17,965 individuals in Queen Creek who have obtained a bachelor's degree or higher.
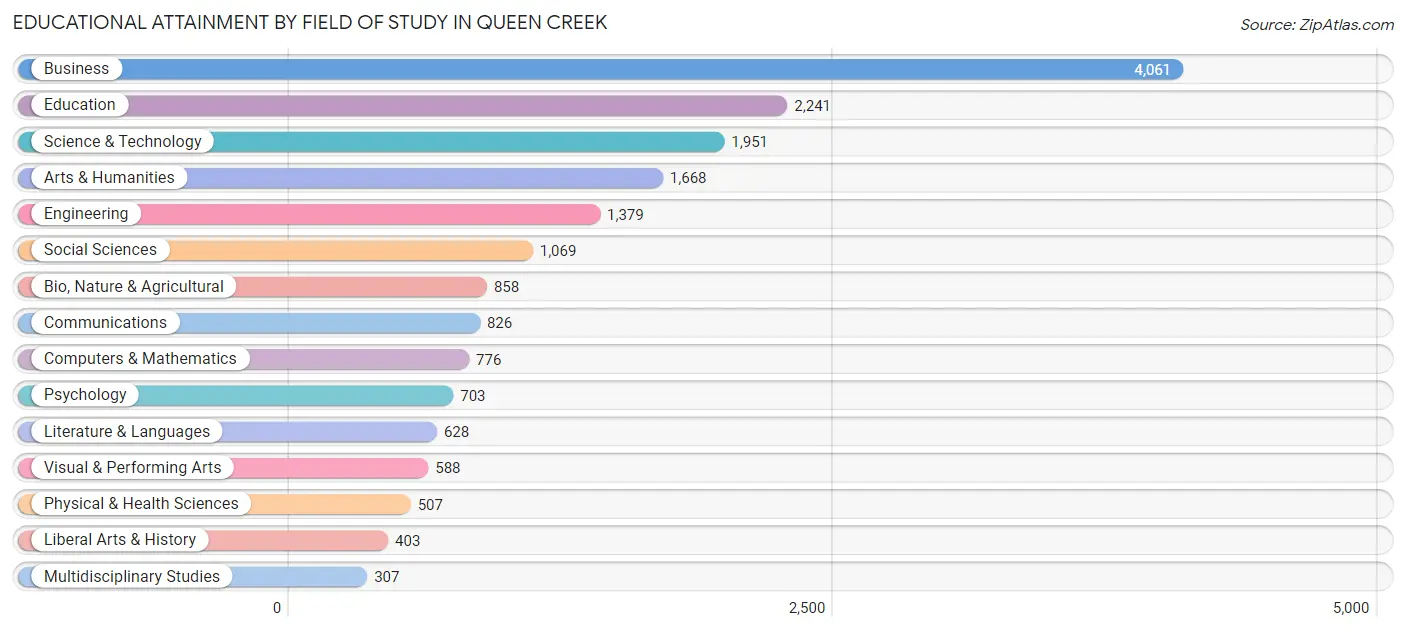
| Field of Study | # Graduates | % Graduates |
| Computers & Mathematics | 776 | 4.3% |
| Bio, Nature & Agricultural | 858 | 4.8% |
| Physical & Health Sciences | 507 | 2.8% |
| Psychology | 703 | 3.9% |
| Social Sciences | 1,069 | 5.9% |
| Engineering | 1,379 | 7.7% |
| Multidisciplinary Studies | 307 | 1.7% |
| Science & Technology | 1,951 | 10.9% |
| Business | 4,061 | 22.6% |
| Education | 2,241 | 12.5% |
| Literature & Languages | 628 | 3.5% |
| Liberal Arts & History | 403 | 2.2% |
| Visual & Performing Arts | 588 | 3.3% |
| Communications | 826 | 4.6% |
| Arts & Humanities | 1,668 | 9.3% |
| Total | 17,965 | 100.0% |
Transportation & Commute in Queen Creek
Vehicle Availability by Sex in Queen Creek
The most prevalent vehicle ownership categories in Queen Creek are males with 2 vehicles (7,221, accounting for 46.1%) and females with 2 vehicles (5,520, making up 55.7%).
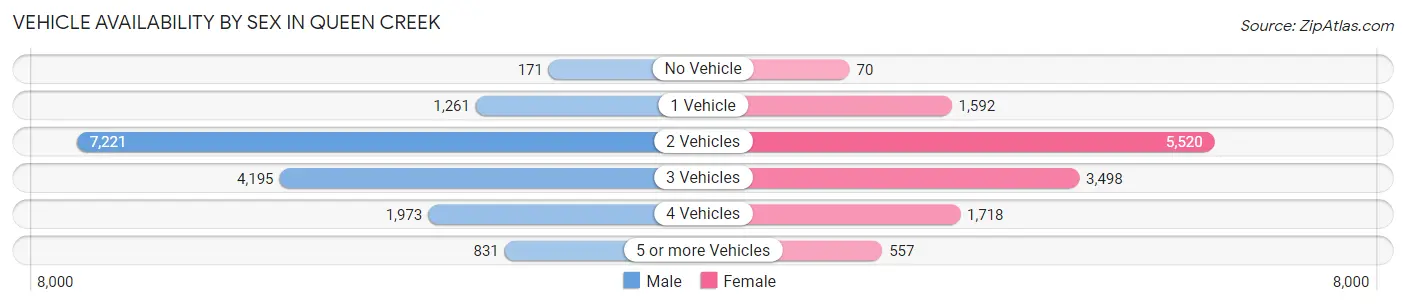
| Vehicles Available | Male | Female |
| No Vehicle | 171 (1.1%) | 70 (0.5%) |
| 1 Vehicle | 1,261 (8.1%) | 1,592 (12.3%) |
| 2 Vehicles | 7,221 (46.1%) | 5,520 (42.6%) |
| 3 Vehicles | 4,195 (26.8%) | 3,498 (27.0%) |
| 4 Vehicles | 1,973 (12.6%) | 1,718 (13.3%) |
| 5 or more Vehicles | 831 (5.3%) | 557 (4.3%) |
| Total | 15,652 (100.0%) | 12,955 (100.0%) |
Commute Time in Queen Creek
The most frequently occuring commute durations in Queen Creek are 45 to 59 minutes (3,923 commuters, 17.2%), 30 to 34 minutes (3,496 commuters, 15.3%), and 40 to 44 minutes (2,280 commuters, 10.0%).
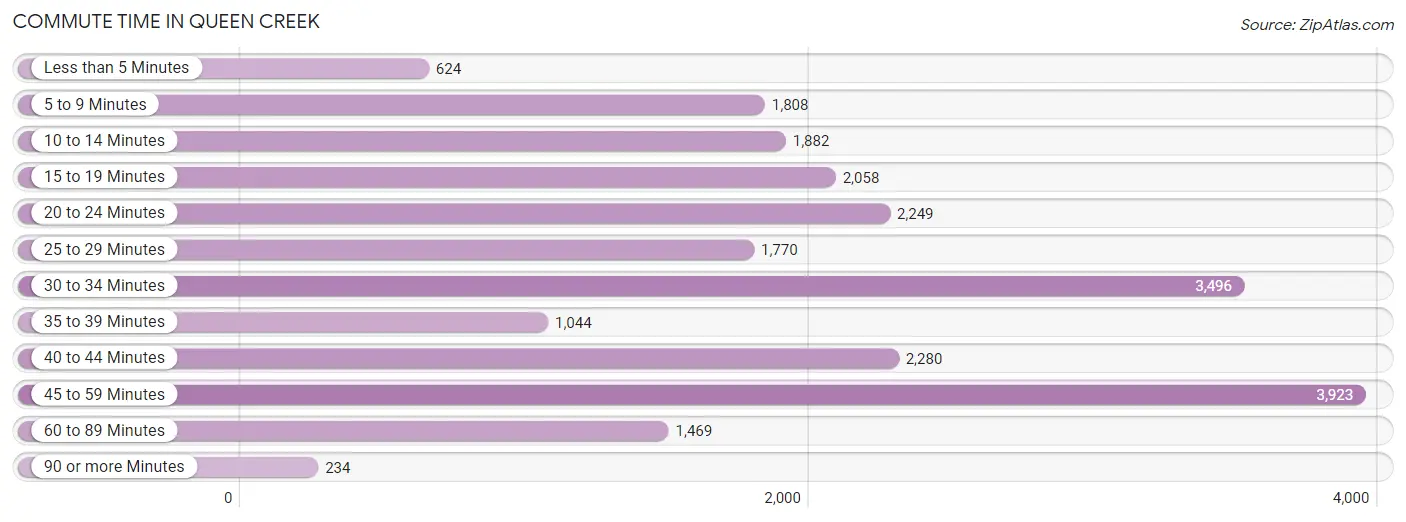
| Commute Time | # Commuters | % Commuters |
| Less than 5 Minutes | 624 | 2.7% |
| 5 to 9 Minutes | 1,808 | 7.9% |
| 10 to 14 Minutes | 1,882 | 8.2% |
| 15 to 19 Minutes | 2,058 | 9.0% |
| 20 to 24 Minutes | 2,249 | 9.9% |
| 25 to 29 Minutes | 1,770 | 7.7% |
| 30 to 34 Minutes | 3,496 | 15.3% |
| 35 to 39 Minutes | 1,044 | 4.6% |
| 40 to 44 Minutes | 2,280 | 10.0% |
| 45 to 59 Minutes | 3,923 | 17.2% |
| 60 to 89 Minutes | 1,469 | 6.4% |
| 90 or more Minutes | 234 | 1.0% |
Commute Time by Sex in Queen Creek
The most common commute times in Queen Creek are 45 to 59 minutes (2,160 commuters, 17.1%) for males and 45 to 59 minutes (1,763 commuters, 17.3%) for females.
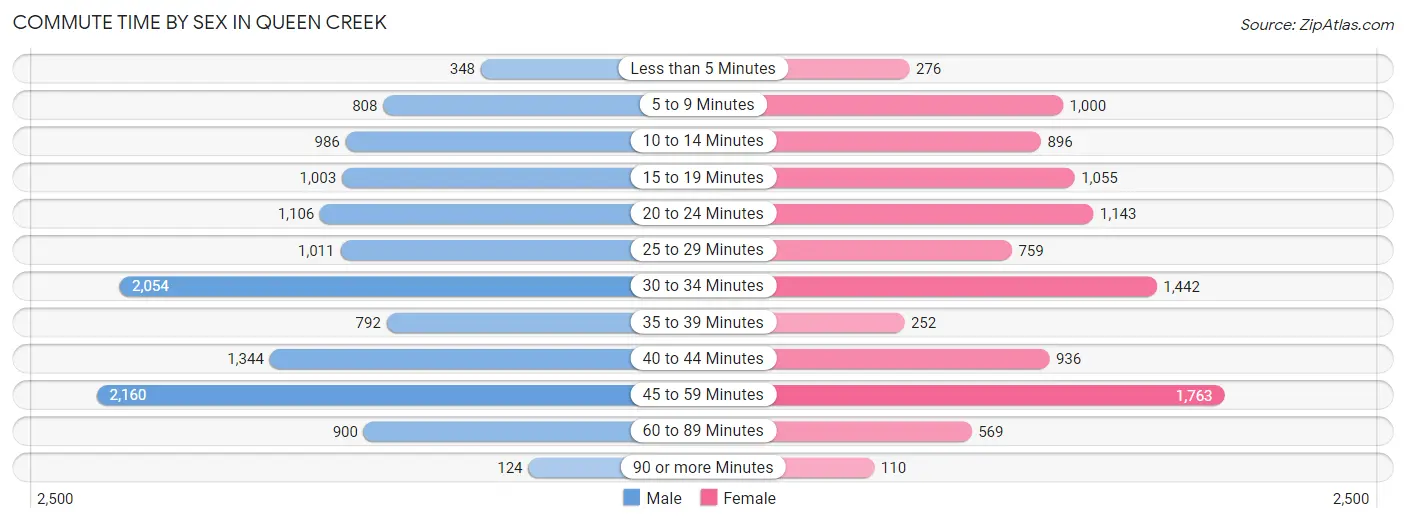
| Commute Time | Male | Female |
| Less than 5 Minutes | 348 (2.8%) | 276 (2.7%) |
| 5 to 9 Minutes | 808 (6.4%) | 1,000 (9.8%) |
| 10 to 14 Minutes | 986 (7.8%) | 896 (8.8%) |
| 15 to 19 Minutes | 1,003 (7.9%) | 1,055 (10.3%) |
| 20 to 24 Minutes | 1,106 (8.7%) | 1,143 (11.2%) |
| 25 to 29 Minutes | 1,011 (8.0%) | 759 (7.4%) |
| 30 to 34 Minutes | 2,054 (16.3%) | 1,442 (14.1%) |
| 35 to 39 Minutes | 792 (6.3%) | 252 (2.5%) |
| 40 to 44 Minutes | 1,344 (10.6%) | 936 (9.2%) |
| 45 to 59 Minutes | 2,160 (17.1%) | 1,763 (17.3%) |
| 60 to 89 Minutes | 900 (7.1%) | 569 (5.6%) |
| 90 or more Minutes | 124 (1.0%) | 110 (1.1%) |
Time of Departure to Work by Sex in Queen Creek
The most frequent times of departure to work in Queen Creek are 6:00 AM to 6:29 AM (1,908, 15.1%) for males and 7:00 AM to 7:29 AM (2,075, 20.3%) for females.
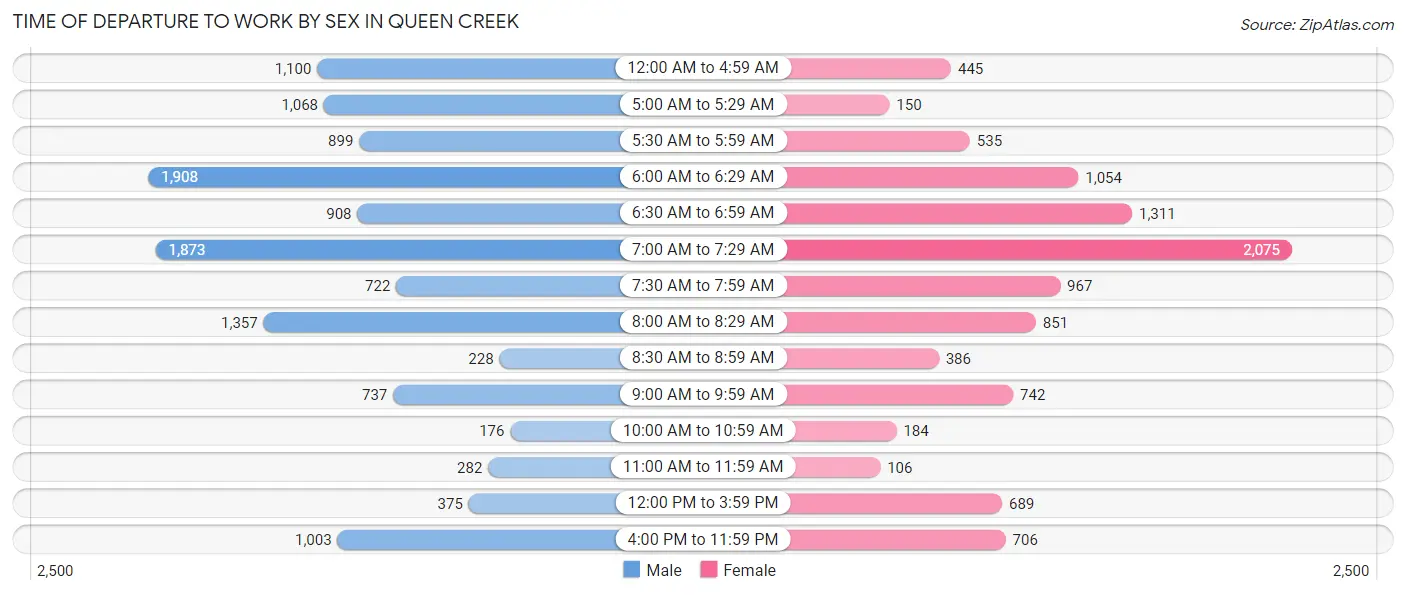
| Time of Departure | Male | Female |
| 12:00 AM to 4:59 AM | 1,100 (8.7%) | 445 (4.4%) |
| 5:00 AM to 5:29 AM | 1,068 (8.5%) | 150 (1.5%) |
| 5:30 AM to 5:59 AM | 899 (7.1%) | 535 (5.2%) |
| 6:00 AM to 6:29 AM | 1,908 (15.1%) | 1,054 (10.3%) |
| 6:30 AM to 6:59 AM | 908 (7.2%) | 1,311 (12.9%) |
| 7:00 AM to 7:29 AM | 1,873 (14.8%) | 2,075 (20.3%) |
| 7:30 AM to 7:59 AM | 722 (5.7%) | 967 (9.5%) |
| 8:00 AM to 8:29 AM | 1,357 (10.7%) | 851 (8.3%) |
| 8:30 AM to 8:59 AM | 228 (1.8%) | 386 (3.8%) |
| 9:00 AM to 9:59 AM | 737 (5.8%) | 742 (7.3%) |
| 10:00 AM to 10:59 AM | 176 (1.4%) | 184 (1.8%) |
| 11:00 AM to 11:59 AM | 282 (2.2%) | 106 (1.0%) |
| 12:00 PM to 3:59 PM | 375 (3.0%) | 689 (6.8%) |
| 4:00 PM to 11:59 PM | 1,003 (7.9%) | 706 (6.9%) |
| Total | 12,636 (100.0%) | 10,201 (100.0%) |
Housing Occupancy in Queen Creek
Occupancy by Ownership in Queen Creek
Of the total 18,954 dwellings in Queen Creek, owner-occupied units account for 16,801 (88.6%), while renter-occupied units make up 2,153 (11.4%).
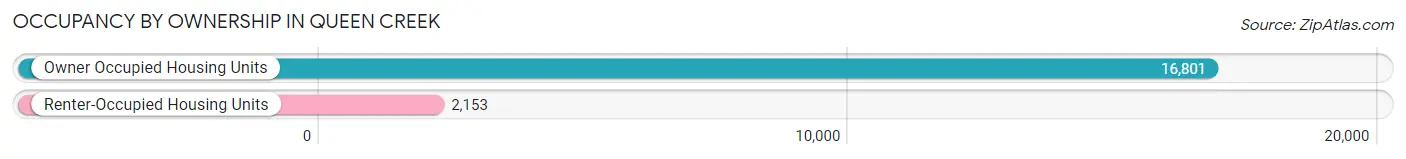
| Occupancy | # Housing Units | % Housing Units |
| Owner Occupied Housing Units | 16,801 | 88.6% |
| Renter-Occupied Housing Units | 2,153 | 11.4% |
| Total Occupied Housing Units | 18,954 | 100.0% |
Occupancy by Household Size in Queen Creek
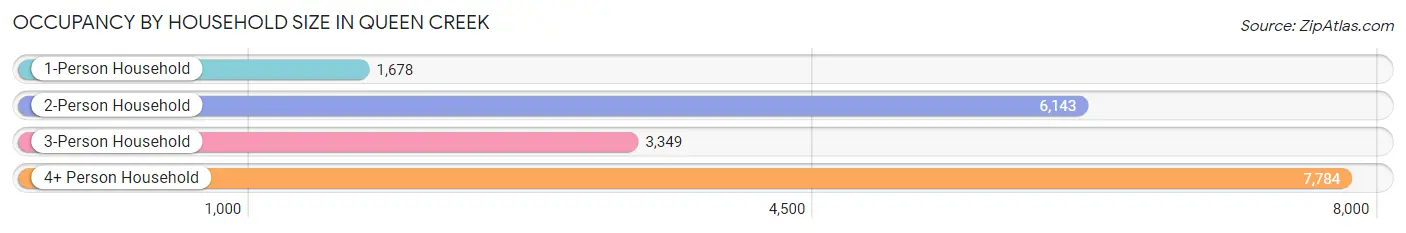
| Household Size | # Housing Units | % Housing Units |
| 1-Person Household | 1,678 | 8.8% |
| 2-Person Household | 6,143 | 32.4% |
| 3-Person Household | 3,349 | 17.7% |
| 4+ Person Household | 7,784 | 41.1% |
| Total Housing Units | 18,954 | 100.0% |
Occupancy by Ownership by Household Size in Queen Creek
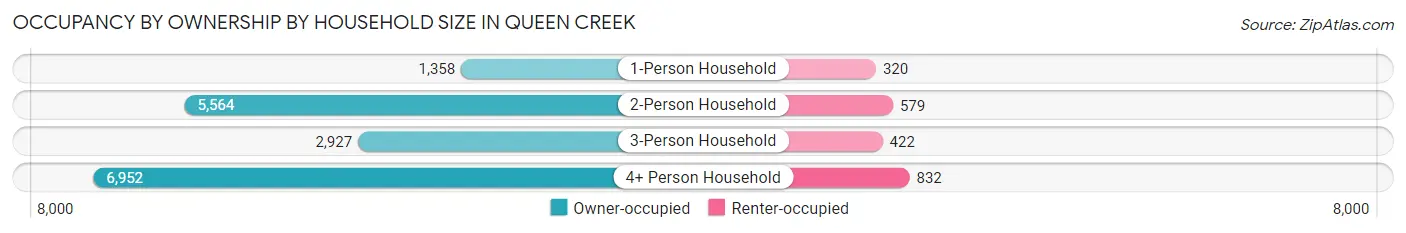
| Household Size | Owner-occupied | Renter-occupied |
| 1-Person Household | 1,358 (80.9%) | 320 (19.1%) |
| 2-Person Household | 5,564 (90.6%) | 579 (9.4%) |
| 3-Person Household | 2,927 (87.4%) | 422 (12.6%) |
| 4+ Person Household | 6,952 (89.3%) | 832 (10.7%) |
| Total Housing Units | 16,801 (88.6%) | 2,153 (11.4%) |
Occupancy by Educational Attainment in Queen Creek
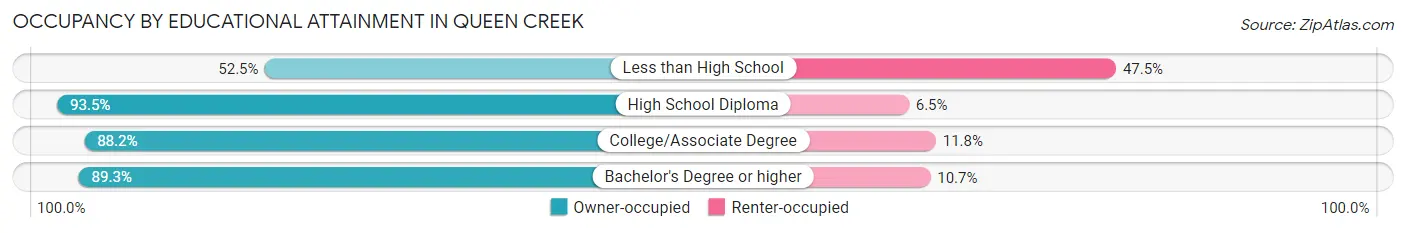
| Household Size | Owner-occupied | Renter-occupied |
| Less than High School | 267 (52.5%) | 242 (47.5%) |
| High School Diploma | 2,925 (93.5%) | 202 (6.5%) |
| College/Associate Degree | 5,256 (88.2%) | 705 (11.8%) |
| Bachelor's Degree or higher | 8,353 (89.3%) | 1,004 (10.7%) |
Occupancy by Age of Householder in Queen Creek
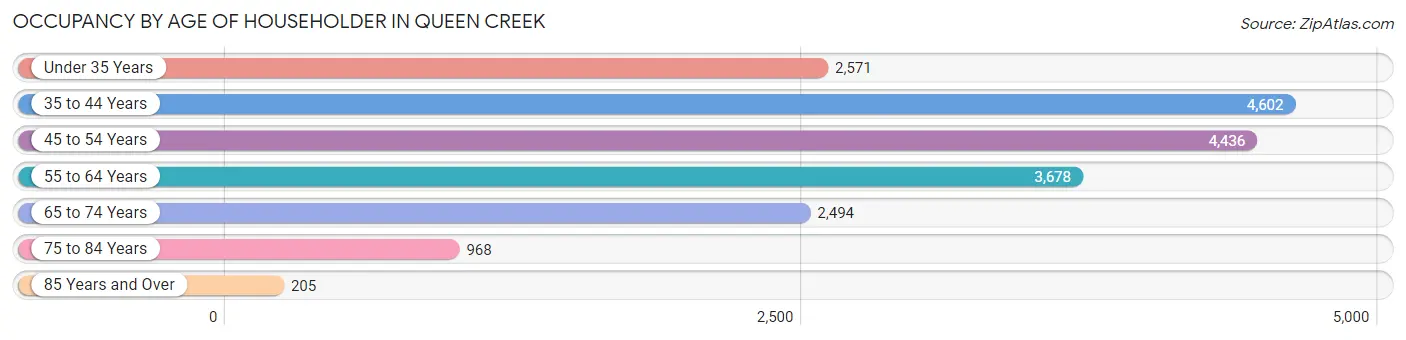
| Age Bracket | # Households | % Households |
| Under 35 Years | 2,571 | 13.6% |
| 35 to 44 Years | 4,602 | 24.3% |
| 45 to 54 Years | 4,436 | 23.4% |
| 55 to 64 Years | 3,678 | 19.4% |
| 65 to 74 Years | 2,494 | 13.2% |
| 75 to 84 Years | 968 | 5.1% |
| 85 Years and Over | 205 | 1.1% |
| Total | 18,954 | 100.0% |
Housing Finances in Queen Creek
Median Income by Occupancy in Queen Creek
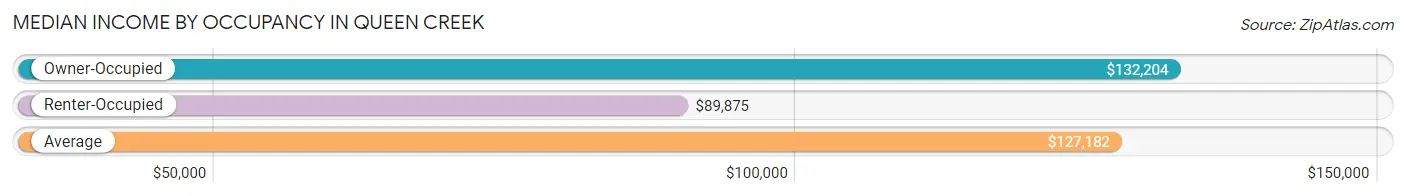
| Occupancy Type | # Households | Median Income |
| Owner-Occupied | 16,801 (88.6%) | $132,204 |
| Renter-Occupied | 2,153 (11.4%) | $89,875 |
| Average | 18,954 (100.0%) | $127,182 |
Occupancy by Householder Income Bracket in Queen Creek
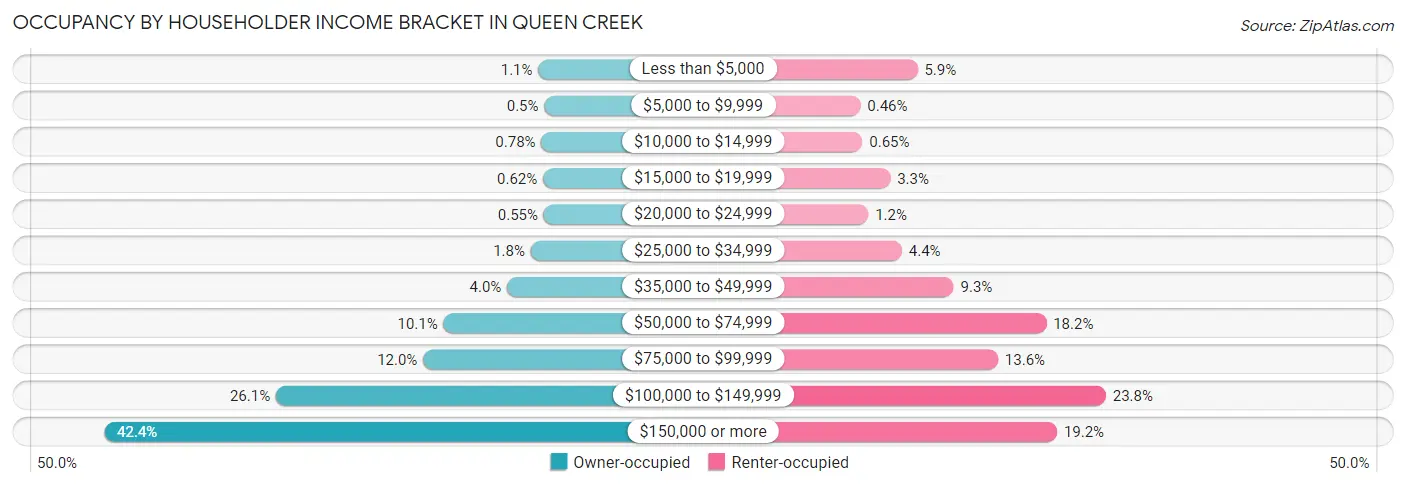
| Income Bracket | Owner-occupied | Renter-occupied |
| Less than $5,000 | 180 (1.1%) | 127 (5.9%) |
| $5,000 to $9,999 | 84 (0.5%) | 10 (0.5%) |
| $10,000 to $14,999 | 131 (0.8%) | 14 (0.6%) |
| $15,000 to $19,999 | 105 (0.6%) | 71 (3.3%) |
| $20,000 to $24,999 | 93 (0.5%) | 26 (1.2%) |
| $25,000 to $34,999 | 300 (1.8%) | 95 (4.4%) |
| $35,000 to $49,999 | 678 (4.0%) | 201 (9.3%) |
| $50,000 to $74,999 | 1,697 (10.1%) | 391 (18.2%) |
| $75,000 to $99,999 | 2,023 (12.0%) | 292 (13.6%) |
| $100,000 to $149,999 | 4,379 (26.1%) | 513 (23.8%) |
| $150,000 or more | 7,131 (42.4%) | 413 (19.2%) |
| Total | 16,801 (100.0%) | 2,153 (100.0%) |
Monthly Housing Cost Tiers in Queen Creek
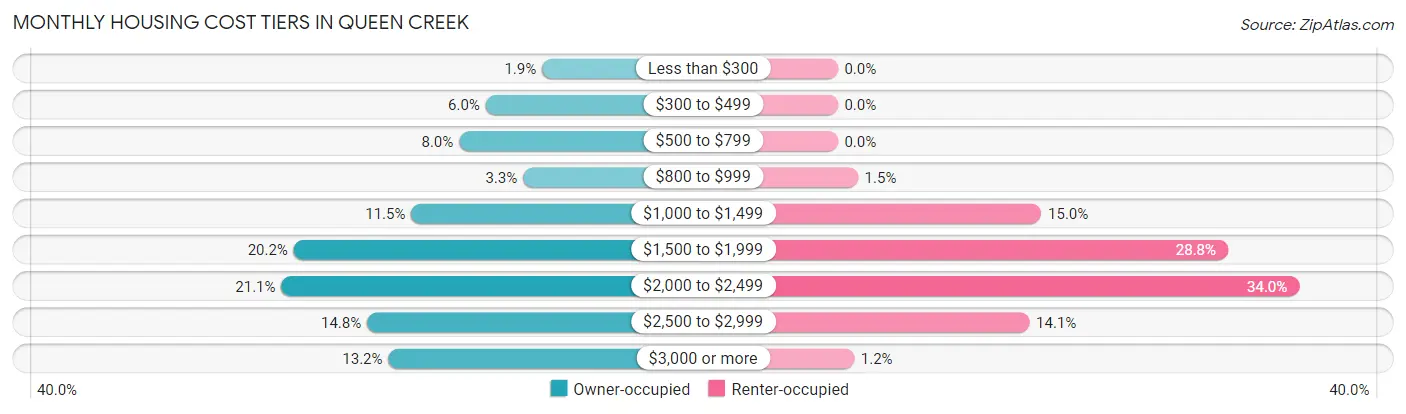
| Monthly Cost | Owner-occupied | Renter-occupied |
| Less than $300 | 318 (1.9%) | 0 (0.0%) |
| $300 to $499 | 1,014 (6.0%) | 0 (0.0%) |
| $500 to $799 | 1,344 (8.0%) | 0 (0.0%) |
| $800 to $999 | 552 (3.3%) | 32 (1.5%) |
| $1,000 to $1,499 | 1,936 (11.5%) | 323 (15.0%) |
| $1,500 to $1,999 | 3,390 (20.2%) | 619 (28.7%) |
| $2,000 to $2,499 | 3,544 (21.1%) | 732 (34.0%) |
| $2,500 to $2,999 | 2,484 (14.8%) | 304 (14.1%) |
| $3,000 or more | 2,219 (13.2%) | 26 (1.2%) |
| Total | 16,801 (100.0%) | 2,153 (100.0%) |
Physical Housing Characteristics in Queen Creek
Housing Structures in Queen Creek
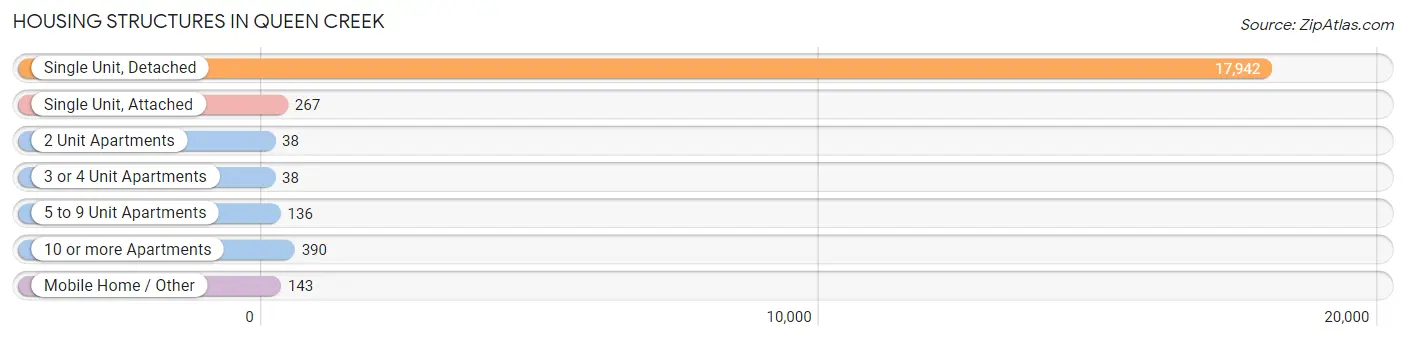
| Structure Type | # Housing Units | % Housing Units |
| Single Unit, Detached | 17,942 | 94.7% |
| Single Unit, Attached | 267 | 1.4% |
| 2 Unit Apartments | 38 | 0.2% |
| 3 or 4 Unit Apartments | 38 | 0.2% |
| 5 to 9 Unit Apartments | 136 | 0.7% |
| 10 or more Apartments | 390 | 2.1% |
| Mobile Home / Other | 143 | 0.7% |
| Total | 18,954 | 100.0% |
Housing Structures by Occupancy in Queen Creek
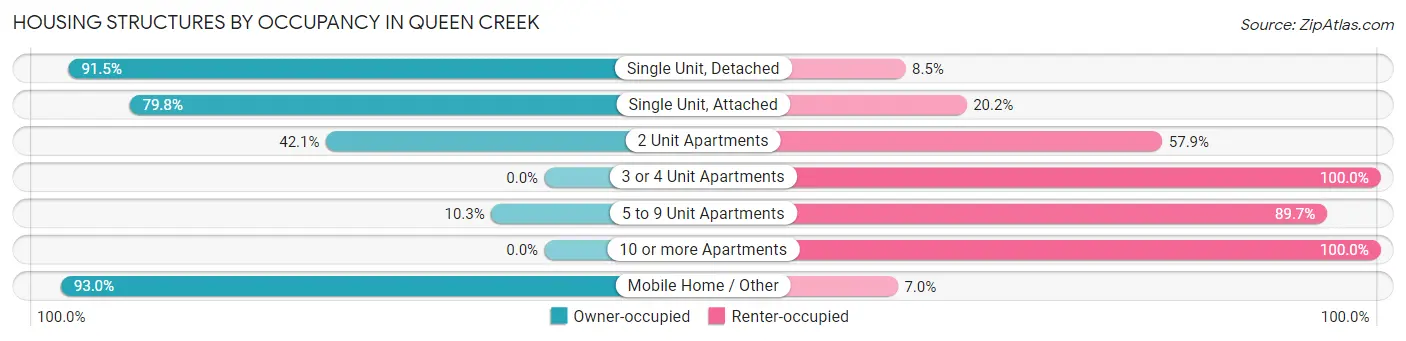
| Structure Type | Owner-occupied | Renter-occupied |
| Single Unit, Detached | 16,425 (91.5%) | 1,517 (8.5%) |
| Single Unit, Attached | 213 (79.8%) | 54 (20.2%) |
| 2 Unit Apartments | 16 (42.1%) | 22 (57.9%) |
| 3 or 4 Unit Apartments | 0 (0.0%) | 38 (100.0%) |
| 5 to 9 Unit Apartments | 14 (10.3%) | 122 (89.7%) |
| 10 or more Apartments | 0 (0.0%) | 390 (100.0%) |
| Mobile Home / Other | 133 (93.0%) | 10 (7.0%) |
| Total | 16,801 (88.6%) | 2,153 (11.4%) |
Housing Structures by Number of Rooms in Queen Creek
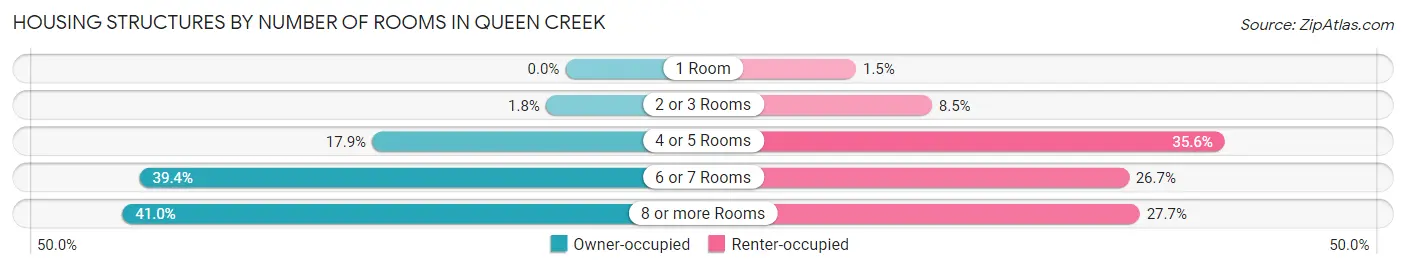
| Number of Rooms | Owner-occupied | Renter-occupied |
| 1 Room | 0 (0.0%) | 32 (1.5%) |
| 2 or 3 Rooms | 304 (1.8%) | 183 (8.5%) |
| 4 or 5 Rooms | 3,004 (17.9%) | 766 (35.6%) |
| 6 or 7 Rooms | 6,613 (39.4%) | 575 (26.7%) |
| 8 or more Rooms | 6,880 (40.9%) | 597 (27.7%) |
| Total | 16,801 (100.0%) | 2,153 (100.0%) |
Housing Structure by Heating Type in Queen Creek
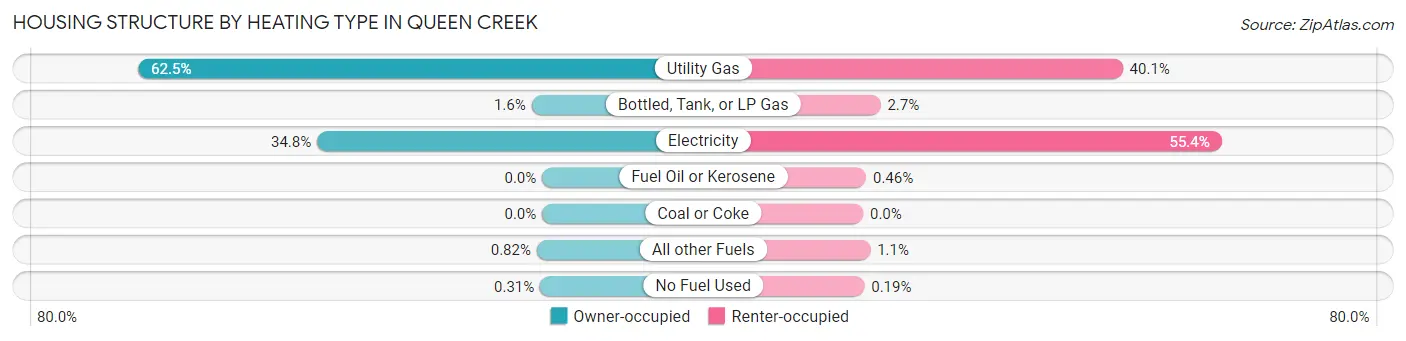
| Heating Type | Owner-occupied | Renter-occupied |
| Utility Gas | 10,492 (62.5%) | 864 (40.1%) |
| Bottled, Tank, or LP Gas | 274 (1.6%) | 58 (2.7%) |
| Electricity | 5,845 (34.8%) | 1,193 (55.4%) |
| Fuel Oil or Kerosene | 0 (0.0%) | 10 (0.5%) |
| Coal or Coke | 0 (0.0%) | 0 (0.0%) |
| All other Fuels | 138 (0.8%) | 24 (1.1%) |
| No Fuel Used | 52 (0.3%) | 4 (0.2%) |
| Total | 16,801 (100.0%) | 2,153 (100.0%) |
Household Vehicle Usage in Queen Creek
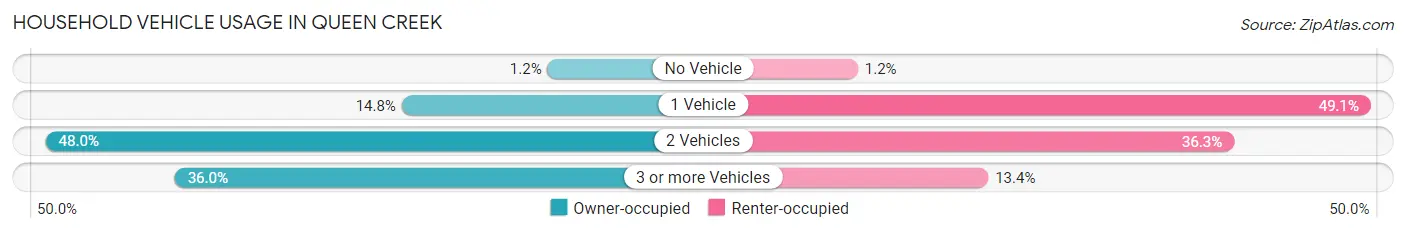
| Vehicles per Household | Owner-occupied | Renter-occupied |
| No Vehicle | 200 (1.2%) | 26 (1.2%) |
| 1 Vehicle | 2,487 (14.8%) | 1,057 (49.1%) |
| 2 Vehicles | 8,069 (48.0%) | 782 (36.3%) |
| 3 or more Vehicles | 6,045 (36.0%) | 288 (13.4%) |
| Total | 16,801 (100.0%) | 2,153 (100.0%) |
Real Estate & Mortgages in Queen Creek
Real Estate and Mortgage Overview in Queen Creek
| Characteristic | Without Mortgage | With Mortgage |
| Housing Units | 2,887 | 13,914 |
| Median Property Value | $547,200 | $487,000 |
| Median Household Income | $102,987 | $6,290 |
| Monthly Housing Costs | $588 | $2,206 |
| Real Estate Taxes | $2,960 | $600 |
Property Value by Mortgage Status in Queen Creek
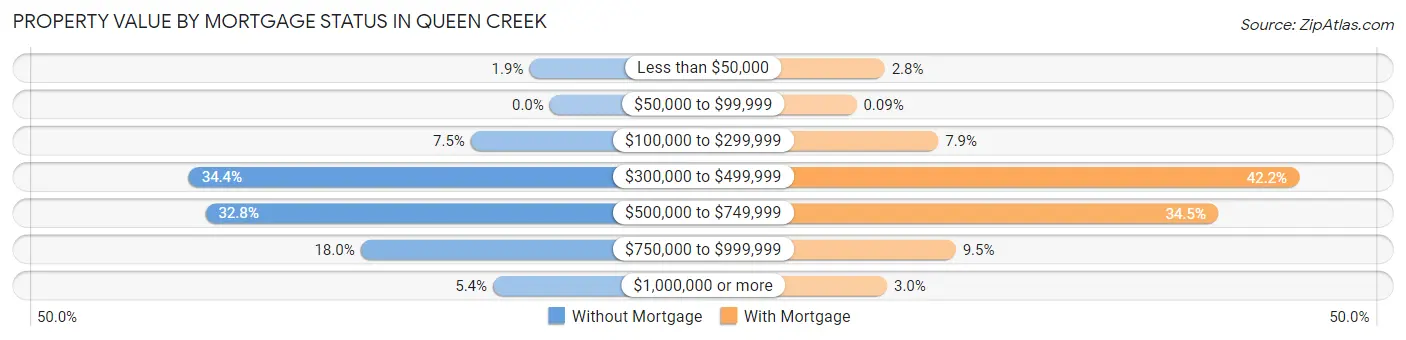
| Property Value | Without Mortgage | With Mortgage |
| Less than $50,000 | 56 (1.9%) | 387 (2.8%) |
| $50,000 to $99,999 | 0 (0.0%) | 12 (0.1%) |
| $100,000 to $299,999 | 217 (7.5%) | 1,096 (7.9%) |
| $300,000 to $499,999 | 992 (34.4%) | 5,875 (42.2%) |
| $500,000 to $749,999 | 946 (32.8%) | 4,799 (34.5%) |
| $750,000 to $999,999 | 520 (18.0%) | 1,327 (9.5%) |
| $1,000,000 or more | 156 (5.4%) | 418 (3.0%) |
| Total | 2,887 (100.0%) | 13,914 (100.0%) |
Household Income by Mortgage Status in Queen Creek
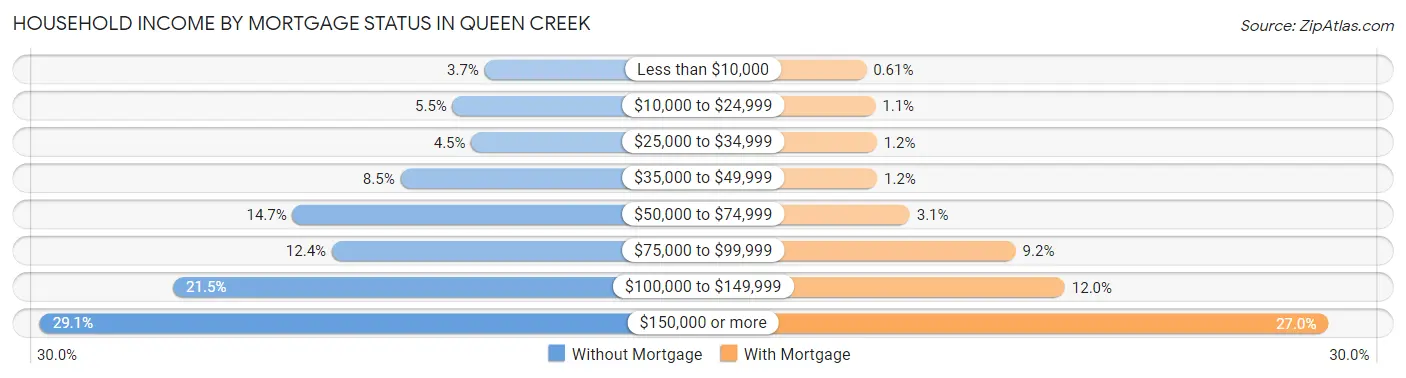
| Household Income | Without Mortgage | With Mortgage |
| Less than $10,000 | 107 (3.7%) | 85 (0.6%) |
| $10,000 to $24,999 | 160 (5.5%) | 157 (1.1%) |
| $25,000 to $34,999 | 129 (4.5%) | 169 (1.2%) |
| $35,000 to $49,999 | 246 (8.5%) | 171 (1.2%) |
| $50,000 to $74,999 | 424 (14.7%) | 432 (3.1%) |
| $75,000 to $99,999 | 359 (12.4%) | 1,273 (9.1%) |
| $100,000 to $149,999 | 621 (21.5%) | 1,664 (12.0%) |
| $150,000 or more | 841 (29.1%) | 3,758 (27.0%) |
| Total | 2,887 (100.0%) | 13,914 (100.0%) |
Property Value to Household Income Ratio in Queen Creek
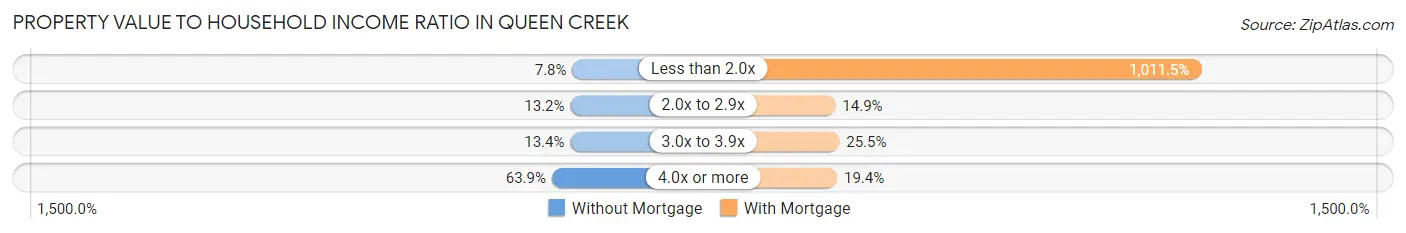
| Value-to-Income Ratio | Without Mortgage | With Mortgage |
| Less than 2.0x | 224 (7.8%) | 140,741 (1,011.5%) |
| 2.0x to 2.9x | 382 (13.2%) | 2,074 (14.9%) |
| 3.0x to 3.9x | 388 (13.4%) | 3,551 (25.5%) |
| 4.0x or more | 1,846 (63.9%) | 2,703 (19.4%) |
| Total | 2,887 (100.0%) | 13,914 (100.0%) |
Real Estate Taxes by Mortgage Status in Queen Creek
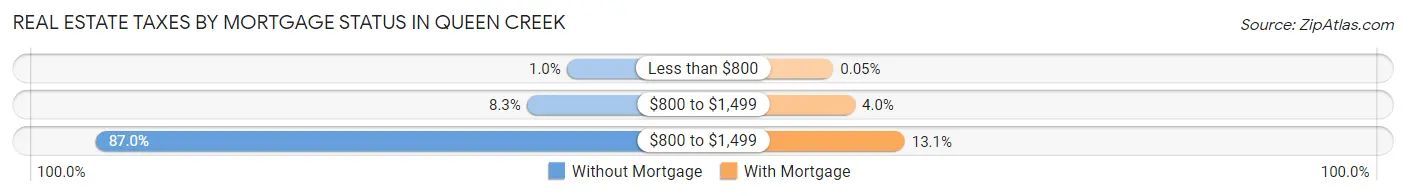
| Property Taxes | Without Mortgage | With Mortgage |
| Less than $800 | 29 (1.0%) | 7 (0.1%) |
| $800 to $1,499 | 240 (8.3%) | 561 (4.0%) |
| $800 to $1,499 | 2,512 (87.0%) | 1,823 (13.1%) |
| Total | 2,887 (100.0%) | 13,914 (100.0%) |
Health & Disability in Queen Creek
Health Insurance Coverage by Age in Queen Creek
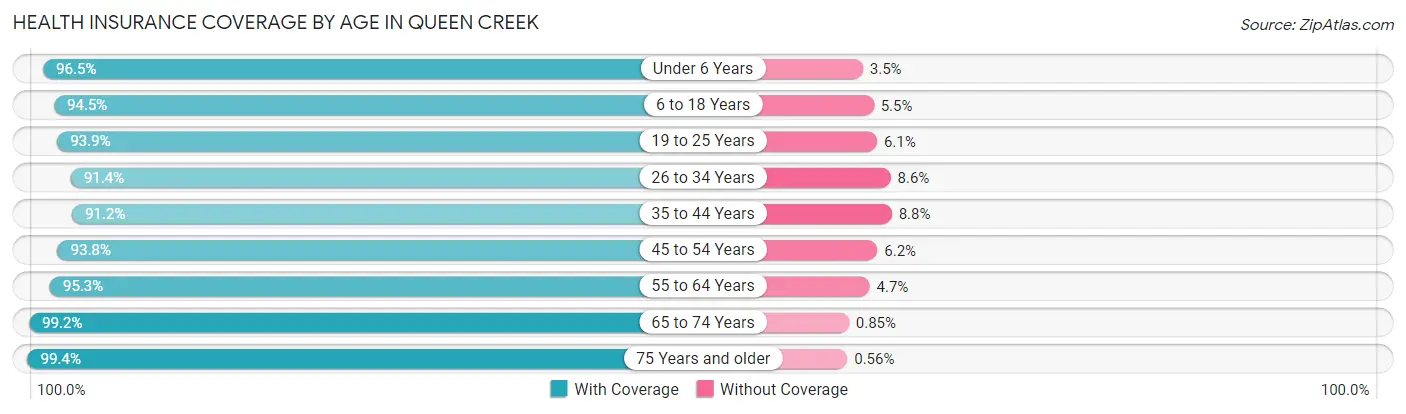
| Age Bracket | With Coverage | Without Coverage |
| Under 6 Years | 4,880 (96.5%) | 175 (3.5%) |
| 6 to 18 Years | 13,774 (94.5%) | 799 (5.5%) |
| 19 to 25 Years | 4,118 (93.9%) | 267 (6.1%) |
| 26 to 34 Years | 4,848 (91.4%) | 458 (8.6%) |
| 35 to 44 Years | 8,458 (91.2%) | 820 (8.8%) |
| 45 to 54 Years | 8,035 (93.8%) | 527 (6.2%) |
| 55 to 64 Years | 6,356 (95.3%) | 315 (4.7%) |
| 65 to 74 Years | 4,887 (99.2%) | 42 (0.9%) |
| 75 Years and older | 2,857 (99.4%) | 16 (0.6%) |
| Total | 58,213 (94.5%) | 3,419 (5.6%) |
Health Insurance Coverage by Citizenship Status in Queen Creek
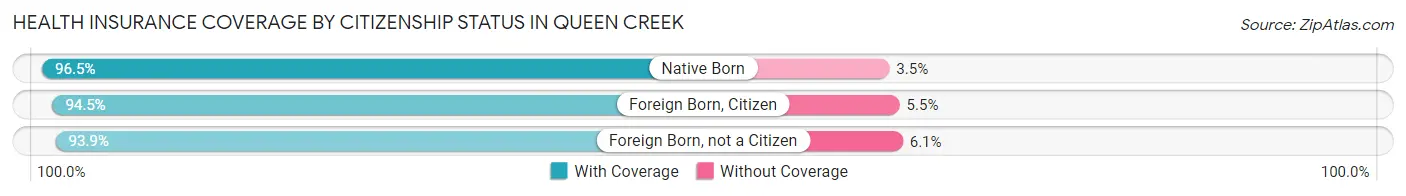
| Citizenship Status | With Coverage | Without Coverage |
| Native Born | 4,880 (96.5%) | 175 (3.5%) |
| Foreign Born, Citizen | 13,774 (94.5%) | 799 (5.5%) |
| Foreign Born, not a Citizen | 4,118 (93.9%) | 267 (6.1%) |
Health Insurance Coverage by Household Income in Queen Creek
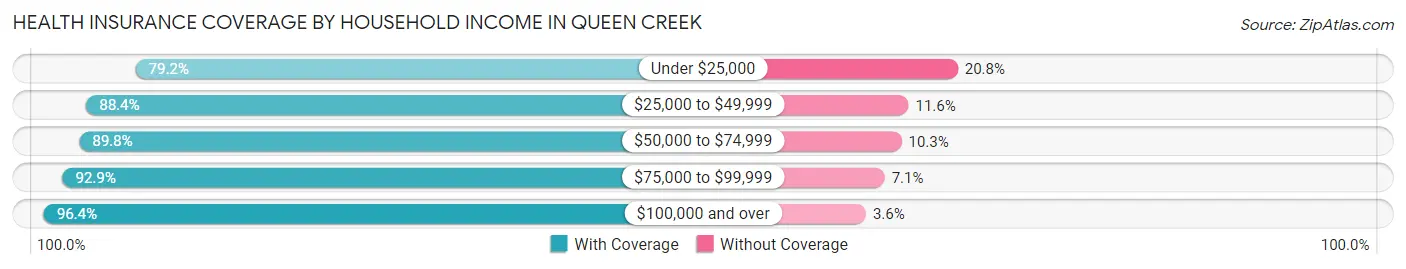
| Household Income | With Coverage | Without Coverage |
| Under $25,000 | 1,637 (79.2%) | 430 (20.8%) |
| $25,000 to $49,999 | 2,247 (88.4%) | 294 (11.6%) |
| $50,000 to $74,999 | 5,208 (89.7%) | 595 (10.2%) |
| $75,000 to $99,999 | 6,621 (92.9%) | 506 (7.1%) |
| $100,000 and over | 42,463 (96.4%) | 1,584 (3.6%) |
Public vs Private Health Insurance Coverage by Age in Queen Creek
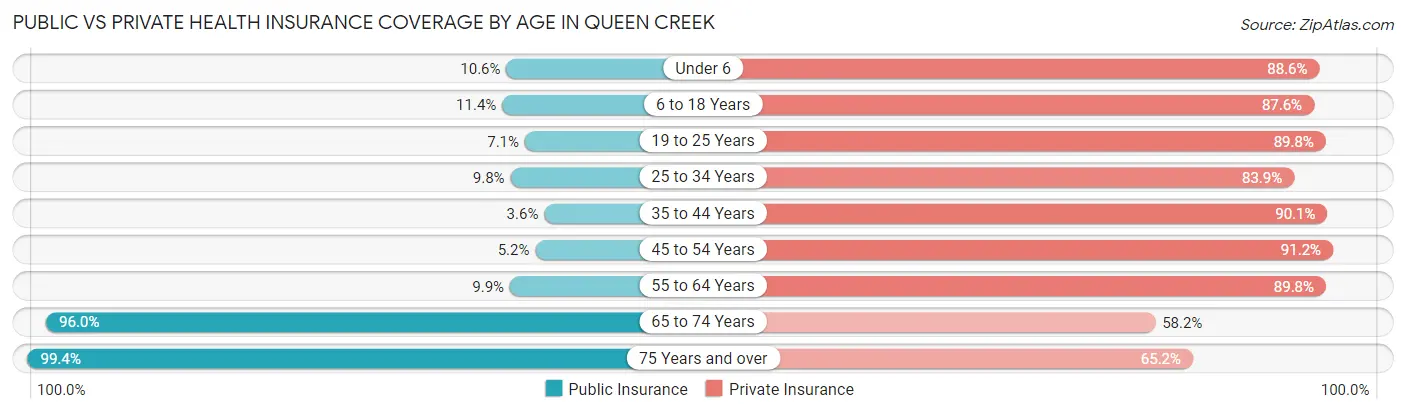
| Age Bracket | Public Insurance | Private Insurance |
| Under 6 | 535 (10.6%) | 4,481 (88.6%) |
| 6 to 18 Years | 1,656 (11.4%) | 12,771 (87.6%) |
| 19 to 25 Years | 313 (7.1%) | 3,938 (89.8%) |
| 25 to 34 Years | 521 (9.8%) | 4,454 (83.9%) |
| 35 to 44 Years | 329 (3.5%) | 8,361 (90.1%) |
| 45 to 54 Years | 446 (5.2%) | 7,804 (91.1%) |
| 55 to 64 Years | 662 (9.9%) | 5,993 (89.8%) |
| 65 to 74 Years | 4,732 (96.0%) | 2,867 (58.2%) |
| 75 Years and over | 2,857 (99.4%) | 1,872 (65.2%) |
| Total | 12,051 (19.6%) | 52,541 (85.3%) |
Disability Status by Sex by Age in Queen Creek
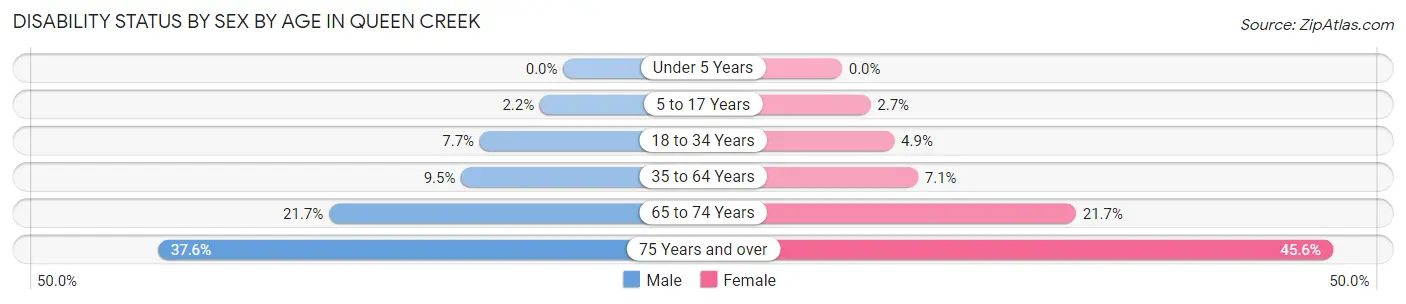
| Age Bracket | Male | Female |
| Under 5 Years | 0 (0.0%) | 0 (0.0%) |
| 5 to 17 Years | 163 (2.2%) | 200 (2.6%) |
| 18 to 34 Years | 384 (7.7%) | 261 (4.9%) |
| 35 to 64 Years | 1,155 (9.5%) | 869 (7.1%) |
| 65 to 74 Years | 479 (21.7%) | 592 (21.7%) |
| 75 Years and over | 464 (37.6%) | 747 (45.6%) |
Disability Class by Sex by Age in Queen Creek
Disability Class: Hearing Difficulty
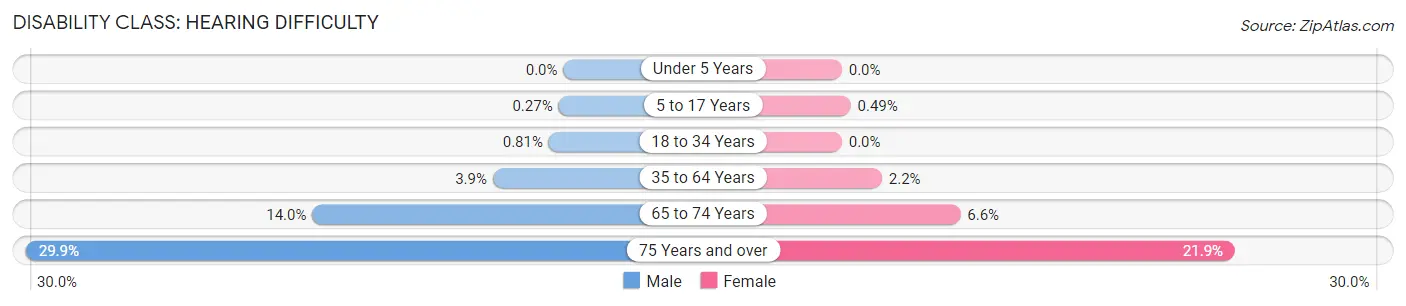
| Age Bracket | Male | Female |
| Under 5 Years | 0 (0.0%) | 0 (0.0%) |
| 5 to 17 Years | 20 (0.3%) | 37 (0.5%) |
| 18 to 34 Years | 40 (0.8%) | 0 (0.0%) |
| 35 to 64 Years | 479 (3.9%) | 275 (2.2%) |
| 65 to 74 Years | 308 (14.0%) | 180 (6.6%) |
| 75 Years and over | 369 (29.9%) | 359 (21.9%) |
Disability Class: Vision Difficulty
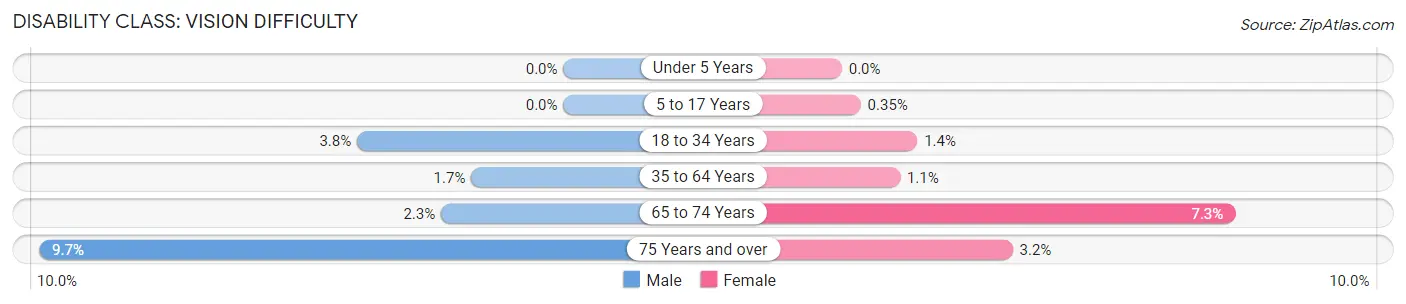
| Age Bracket | Male | Female |
| Under 5 Years | 0 (0.0%) | 0 (0.0%) |
| 5 to 17 Years | 0 (0.0%) | 26 (0.4%) |
| 18 to 34 Years | 190 (3.8%) | 75 (1.4%) |
| 35 to 64 Years | 208 (1.7%) | 133 (1.1%) |
| 65 to 74 Years | 50 (2.3%) | 199 (7.3%) |
| 75 Years and over | 120 (9.7%) | 52 (3.2%) |
Disability Class: Cognitive Difficulty
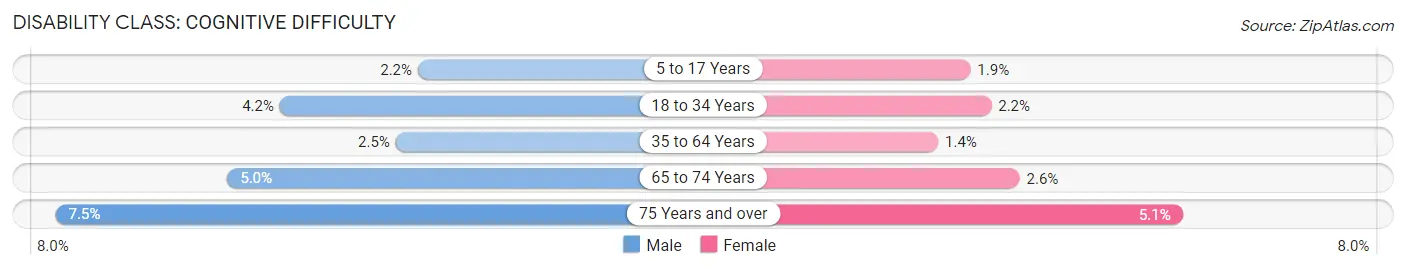
| Age Bracket | Male | Female |
| 5 to 17 Years | 163 (2.2%) | 144 (1.9%) |
| 18 to 34 Years | 209 (4.2%) | 119 (2.2%) |
| 35 to 64 Years | 304 (2.5%) | 176 (1.4%) |
| 65 to 74 Years | 110 (5.0%) | 72 (2.6%) |
| 75 Years and over | 93 (7.5%) | 83 (5.1%) |
Disability Class: Ambulatory Difficulty
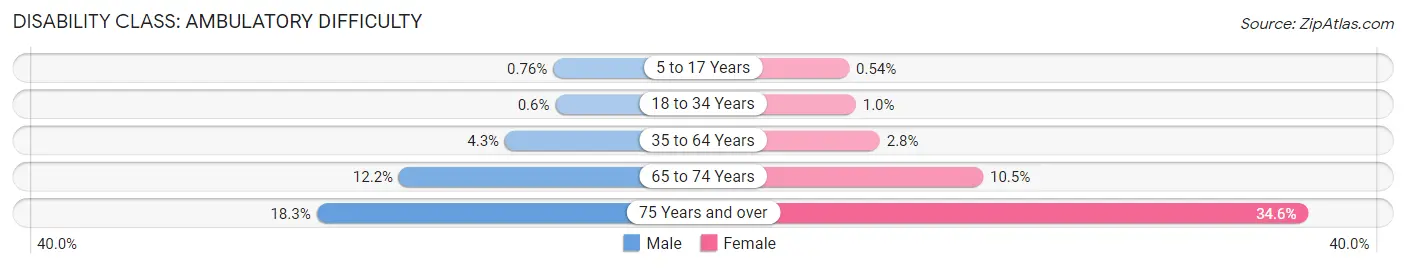
| Age Bracket | Male | Female |
| 5 to 17 Years | 57 (0.8%) | 41 (0.5%) |
| 18 to 34 Years | 30 (0.6%) | 56 (1.0%) |
| 35 to 64 Years | 529 (4.3%) | 347 (2.8%) |
| 65 to 74 Years | 269 (12.2%) | 286 (10.5%) |
| 75 Years and over | 226 (18.3%) | 568 (34.6%) |
Disability Class: Self-Care Difficulty
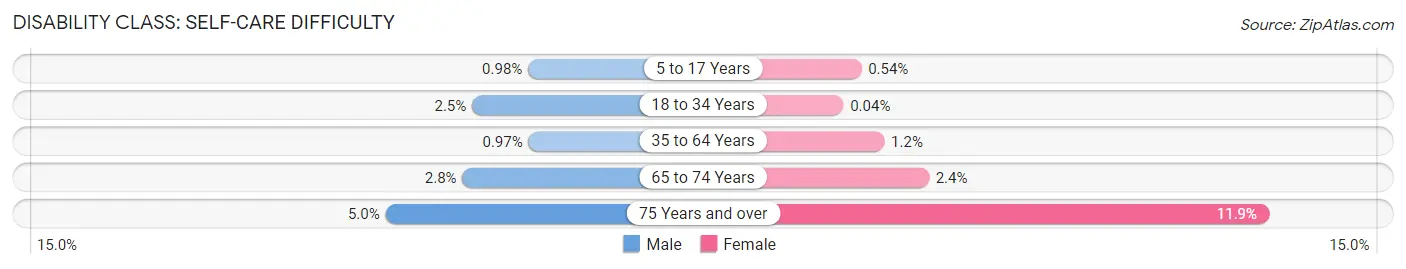
| Age Bracket | Male | Female |
| 5 to 17 Years | 74 (1.0%) | 41 (0.5%) |
| 18 to 34 Years | 126 (2.5%) | 2 (0.0%) |
| 35 to 64 Years | 118 (1.0%) | 145 (1.2%) |
| 65 to 74 Years | 62 (2.8%) | 66 (2.4%) |
| 75 Years and over | 61 (5.0%) | 195 (11.9%) |
Technology Access in Queen Creek
Computing Device Access in Queen Creek
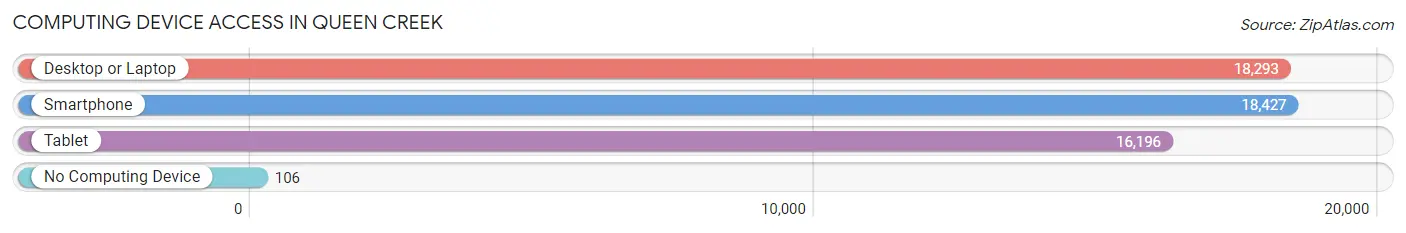
| Device Type | # Households | % Households |
| Desktop or Laptop | 18,293 | 96.5% |
| Smartphone | 18,427 | 97.2% |
| Tablet | 16,196 | 85.5% |
| No Computing Device | 106 | 0.6% |
| Total | 18,954 | 100.0% |
Internet Access in Queen Creek
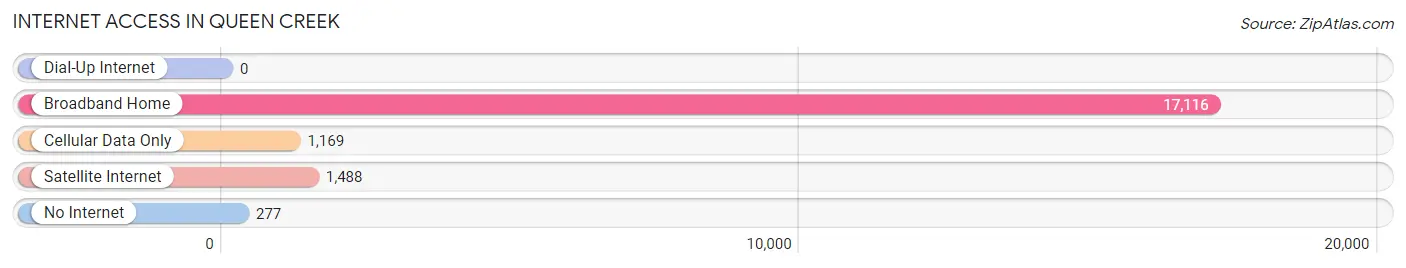
| Internet Type | # Households | % Households |
| Dial-Up Internet | 0 | 0.0% |
| Broadband Home | 17,116 | 90.3% |
| Cellular Data Only | 1,169 | 6.2% |
| Satellite Internet | 1,488 | 7.9% |
| No Internet | 277 | 1.5% |
| Total | 18,954 | 100.0% |
Queen Creek Summary
History
Queen Creek is a town located in Maricopa County, Arizona. It is situated in the southeastern part of the state, about 25 miles southeast of Phoenix. The town was founded in 1989 and incorporated in 1989. Prior to its incorporation, the area was known as Rittenhouse.
Queen Creek was originally inhabited by the Hohokam people, who were a Native American tribe that lived in the area for centuries. The Hohokam were known for their irrigation systems, which were used to cultivate crops such as corn, beans, squash, and cotton. The Hohokam were eventually displaced by the Apache and Pima tribes, who also used the area for farming.
In the late 1800s, the area was settled by ranchers and farmers, who established the town of Rittenhouse. The town was named after the Rittenhouse family, who were among the first settlers in the area. The town was later renamed Queen Creek in honor of Queen Victoria, who visited the area in 1887.
Geography
Queen Creek is located in the Sonoran Desert, which is characterized by hot, dry summers and mild winters. The town is situated at an elevation of 1,845 feet above sea level. The town is located in the foothills of the San Tan Mountains, which are part of the larger Sonoran Desert mountain range.
The town is located in the Salt River Valley, which is a major agricultural area in Arizona. The town is bordered by the towns of Gilbert, Chandler, and Mesa. The town is also located near the Gila River, which is a major tributary of the Colorado River.
Economy
Queen Creek is a rapidly growing town, with a population of over 30,000 people. The town is home to a variety of businesses, including retail stores, restaurants, and professional services. The town is also home to several industrial parks, which are home to a variety of manufacturing and technology companies.
The town is also home to several agricultural operations, including farms, ranches, and nurseries. The town is also home to several wineries, which produce a variety of wines.
Demographics
As of the 2010 census, Queen Creek had a population of 26,361 people. The racial makeup of the town was 79.3% White, 4.2% African American, 0.7% Native American, 2.3% Asian, 0.2% Pacific Islander, 11.2% from other races, and 2.3% from two or more races. Hispanic or Latino of any race were 22.3% of the population.
The median income for a household in the town was $67,857, and the median income for a family was $76,945. The per capita income for the town was $27,945. About 6.2% of families and 8.3% of the population were below the poverty line, including 11.2% of those under age 18 and 5.2% of those age 65 or over.
Common Questions
What is Per Capita Income in Queen Creek?
Per Capita income in Queen Creek is $46,808.
What is the Median Family Income in Queen Creek?
Median Family Income in Queen Creek is $131,868.
What is the Median Household income in Queen Creek?
Median Household Income in Queen Creek is $127,182.
What is Income or Wage Gap in Queen Creek?
Income or Wage Gap in Queen Creek is 44.2%.
Women in Queen Creek earn 55.8 cents for every dollar earned by a man.
What is Family Income Deficit in Queen Creek?
Family Income Deficit in Queen Creek is $14,360.
Families that are below poverty line in Queen Creek earn $14,360 less on average than the poverty threshold level.
What is Inequality or Gini Index in Queen Creek?
Inequality or Gini Index in Queen Creek is 0.37.
What is the Total Population of Queen Creek?
Total Population of Queen Creek is 61,788.
What is the Total Male Population of Queen Creek?
Total Male Population of Queen Creek is 30,190.
What is the Total Female Population of Queen Creek?
Total Female Population of Queen Creek is 31,598.
What is the Ratio of Males per 100 Females in Queen Creek?
There are 95.54 Males per 100 Females in Queen Creek.
What is the Ratio of Females per 100 Males in Queen Creek?
There are 104.66 Females per 100 Males in Queen Creek.
What is the Median Population Age in Queen Creek?
Median Population Age in Queen Creek is 36.7 Years.
What is the Average Family Size in Queen Creek
Average Family Size in Queen Creek is 3.5 People.
What is the Average Household Size in Queen Creek
Average Household Size in Queen Creek is 3.2 People.
How Large is the Labor Force in Queen Creek?
There are 30,249 People in the Labor Forcein in Queen Creek.
What is the Percentage of People in the Labor Force in Queen Creek?
67.0% of People are in the Labor Force in Queen Creek.
What is the Unemployment Rate in Queen Creek?
Unemployment Rate in Queen Creek is 4.3%.