Show Low, AZ Map & Demographics
Show Low Map
Show Low Overview
$30,745
PER CAPITA INCOME
$65,625
AVG FAMILY INCOME
$57,406
AVG HOUSEHOLD INCOME
11.2%
WAGE / INCOME GAP [ % ]
88.8¢/ $1
WAGE / INCOME GAP [ $ ]
$9,759
FAMILY INCOME DEFICIT
0.43
INEQUALITY / GINI INDEX
11,767
TOTAL POPULATION
5,789
MALE POPULATION
5,978
FEMALE POPULATION
96.84
MALES / 100 FEMALES
103.26
FEMALES / 100 MALES
43.6
MEDIAN AGE
2.9
AVG FAMILY SIZE
2.4
AVG HOUSEHOLD SIZE
4,742
LABOR FORCE [ PEOPLE ]
50.2%
PERCENT IN LABOR FORCE
6.5%
UNEMPLOYMENT RATE
Show Low Area Codes
Income in Show Low
Income Overview in Show Low
Per Capita Income in Show Low is $30,745, while median incomes of families and households are $65,625 and $57,406 respectively.
| Characteristic | Number | Measure |
| Per Capita Income | 11,767 | $30,745 |
| Median Family Income | 3,256 | $65,625 |
| Mean Family Income | 3,256 | $85,217 |
| Median Household Income | 4,806 | $57,406 |
| Mean Household Income | 4,806 | $74,576 |
| Income Deficit | 3,256 | $9,759 |
| Wage / Income Gap (%) | 11,767 | 11.25% |
| Wage / Income Gap ($) | 11,767 | 88.75¢ per $1 |
| Gini / Inequality Index | 11,767 | 0.43 |
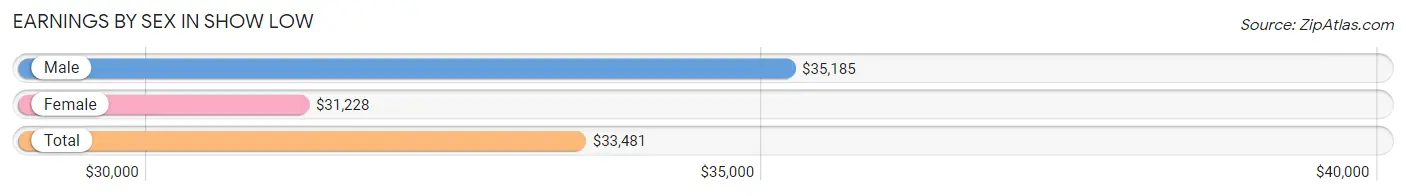
Earnings by Sex in Show Low
Average Earnings in Show Low are $33,481, $35,185 for men and $31,228 for women, a difference of 11.3%.
| Sex | Number | Average Earnings |
| Male | 2,682 (54.4%) | $35,185 |
| Female | 2,249 (45.6%) | $31,228 |
| Total | 4,931 (100.0%) | $33,481 |
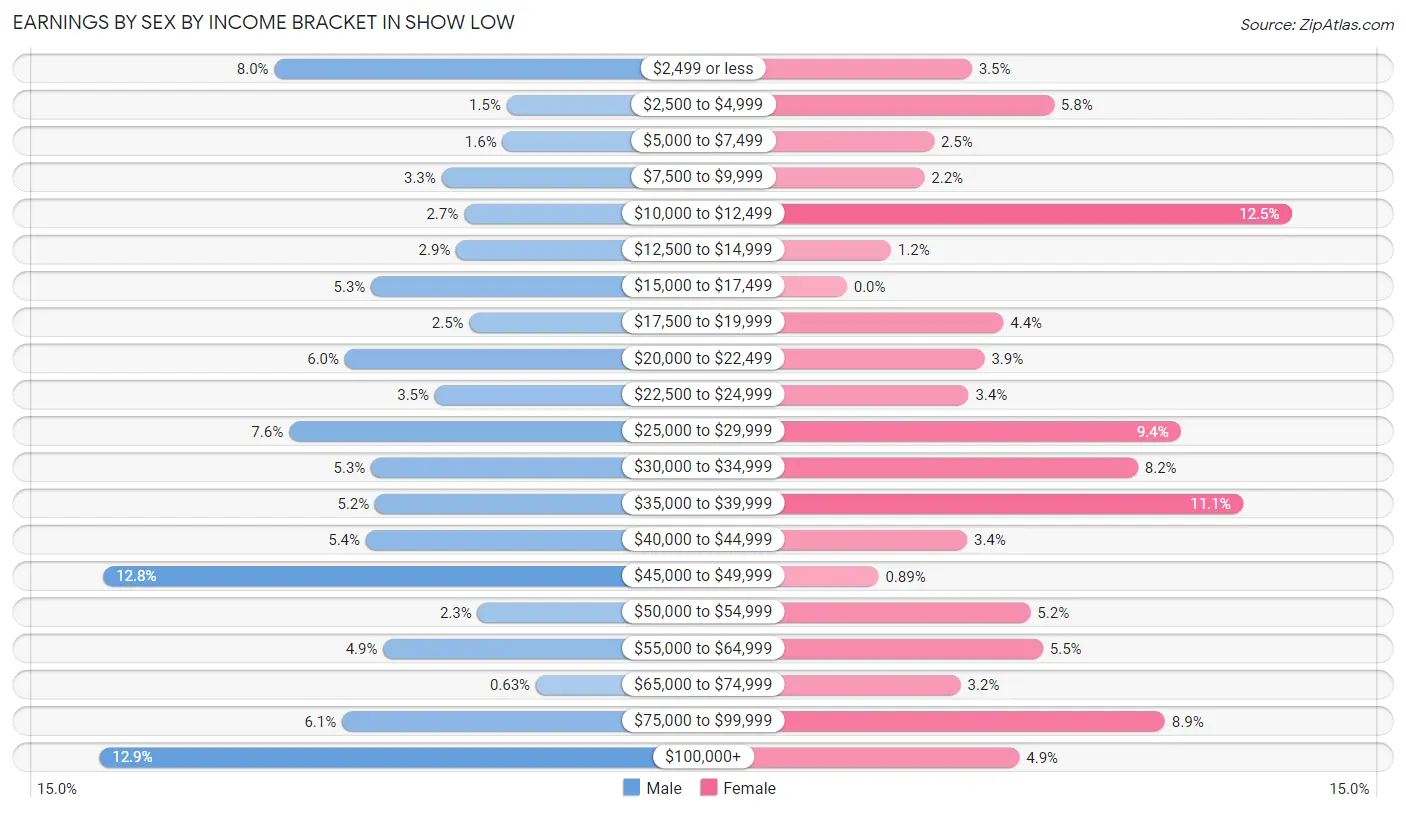
Earnings by Sex by Income Bracket in Show Low
The most common earnings brackets in Show Low are $100,000+ for men (346 | 12.9%) and $10,000 to $12,499 for women (281 | 12.5%).
| Income | Male | Female |
| $2,499 or less | 214 (8.0%) | 79 (3.5%) |
| $2,500 to $4,999 | 39 (1.5%) | 131 (5.8%) |
| $5,000 to $7,499 | 42 (1.6%) | 55 (2.5%) |
| $7,500 to $9,999 | 88 (3.3%) | 49 (2.2%) |
| $10,000 to $12,499 | 71 (2.6%) | 281 (12.5%) |
| $12,500 to $14,999 | 77 (2.9%) | 28 (1.2%) |
| $15,000 to $17,499 | 141 (5.3%) | 0 (0.0%) |
| $17,500 to $19,999 | 67 (2.5%) | 99 (4.4%) |
| $20,000 to $22,499 | 161 (6.0%) | 87 (3.9%) |
| $22,500 to $24,999 | 93 (3.5%) | 77 (3.4%) |
| $25,000 to $29,999 | 203 (7.6%) | 211 (9.4%) |
| $30,000 to $34,999 | 141 (5.3%) | 184 (8.2%) |
| $35,000 to $39,999 | 138 (5.1%) | 250 (11.1%) |
| $40,000 to $44,999 | 145 (5.4%) | 76 (3.4%) |
| $45,000 to $49,999 | 343 (12.8%) | 20 (0.9%) |
| $50,000 to $54,999 | 61 (2.3%) | 116 (5.2%) |
| $55,000 to $64,999 | 132 (4.9%) | 124 (5.5%) |
| $65,000 to $74,999 | 17 (0.6%) | 72 (3.2%) |
| $75,000 to $99,999 | 163 (6.1%) | 201 (8.9%) |
| $100,000+ | 346 (12.9%) | 109 (4.9%) |
| Total | 2,682 (100.0%) | 2,249 (100.0%) |
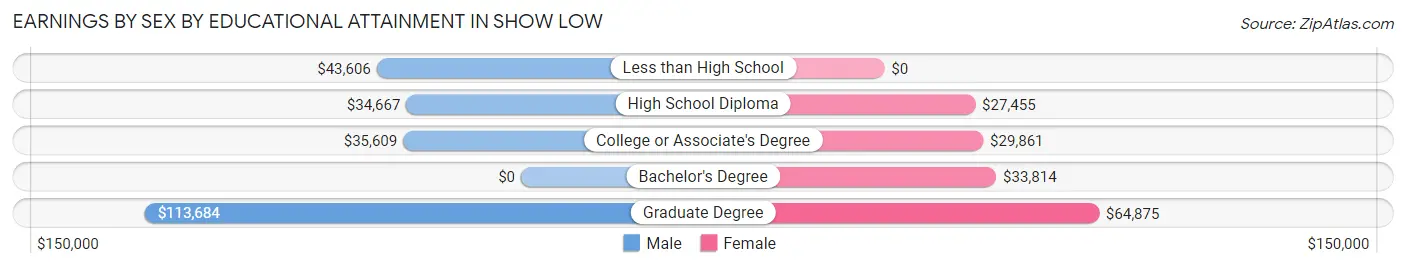
Earnings by Sex by Educational Attainment in Show Low
Average earnings in Show Low are $39,805 for men and $33,578 for women, a difference of 15.6%. Men with an educational attainment of graduate degree enjoy the highest average annual earnings of $113,684, while those with high school diploma education earn the least with $34,667. Women with an educational attainment of graduate degree earn the most with the average annual earnings of $64,875, while those with high school diploma education have the smallest earnings of $27,455.
| Educational Attainment | Male Income | Female Income |
| Less than High School | $43,606 | $0 |
| High School Diploma | $34,667 | $27,455 |
| College or Associate's Degree | $35,609 | $29,861 |
| Bachelor's Degree | - | - |
| Graduate Degree | $113,684 | $64,875 |
| Total | $39,805 | $33,578 |
Family Income in Show Low
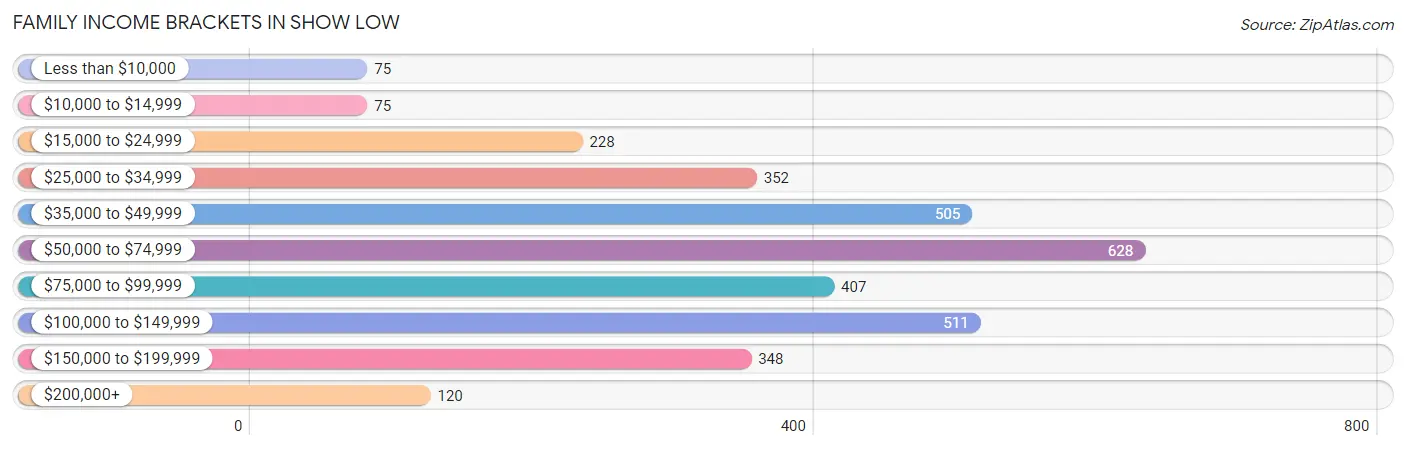
Family Income Brackets in Show Low
According to the Show Low family income data, there are 628 families falling into the $50,000 to $74,999 income range, which is the most common income bracket and makes up 19.3% of all families. Conversely, the less than $10,000 income bracket is the least frequent group with only 75 families (2.3%) belonging to this category.
| Income Bracket | # Families | % Families |
| Less than $10,000 | 75 | 2.3% |
| $10,000 to $14,999 | 75 | 2.3% |
| $15,000 to $24,999 | 228 | 7.0% |
| $25,000 to $34,999 | 352 | 10.8% |
| $35,000 to $49,999 | 505 | 15.5% |
| $50,000 to $74,999 | 628 | 19.3% |
| $75,000 to $99,999 | 407 | 12.5% |
| $100,000 to $149,999 | 511 | 15.7% |
| $150,000 to $199,999 | 348 | 10.7% |
| $200,000+ | 120 | 3.7% |
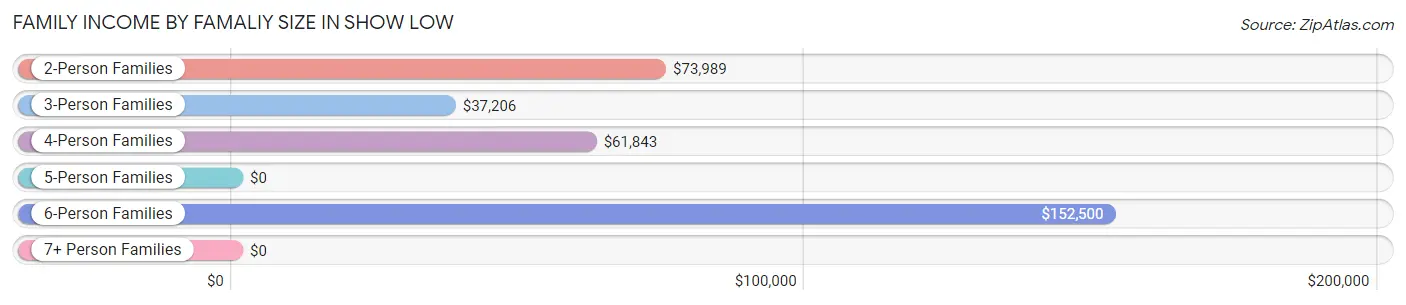
Family Income by Famaliy Size in Show Low
6-person families (92 | 2.8%) account for the highest median family income in Show Low with $152,500 per family, while 2-person families (1,910 | 58.7%) have the highest median income of $36,994 per family member.
| Income Bracket | # Families | Median Income |
| 2-Person Families | 1,910 (58.7%) | $73,989 |
| 3-Person Families | 648 (19.9%) | $37,206 |
| 4-Person Families | 389 (11.9%) | $61,843 |
| 5-Person Families | 161 (4.9%) | $0 |
| 6-Person Families | 92 (2.8%) | $152,500 |
| 7+ Person Families | 56 (1.7%) | $0 |
| Total | 3,256 (100.0%) | $65,625 |
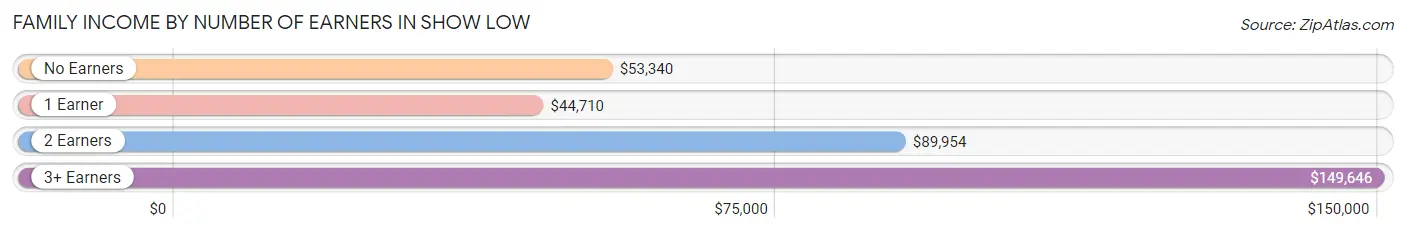
Family Income by Number of Earners in Show Low
The median family income in Show Low is $65,625, with families comprising 3+ earners (165) having the highest median family income of $149,646, while families with 1 earner (1,109) have the lowest median family income of $44,710, accounting for 5.1% and 34.1% of families, respectively.
| Number of Earners | # Families | Median Income |
| No Earners | 1,019 (31.3%) | $53,340 |
| 1 Earner | 1,109 (34.1%) | $44,710 |
| 2 Earners | 963 (29.6%) | $89,954 |
| 3+ Earners | 165 (5.1%) | $149,646 |
| Total | 3,256 (100.0%) | $65,625 |
Household Income in Show Low
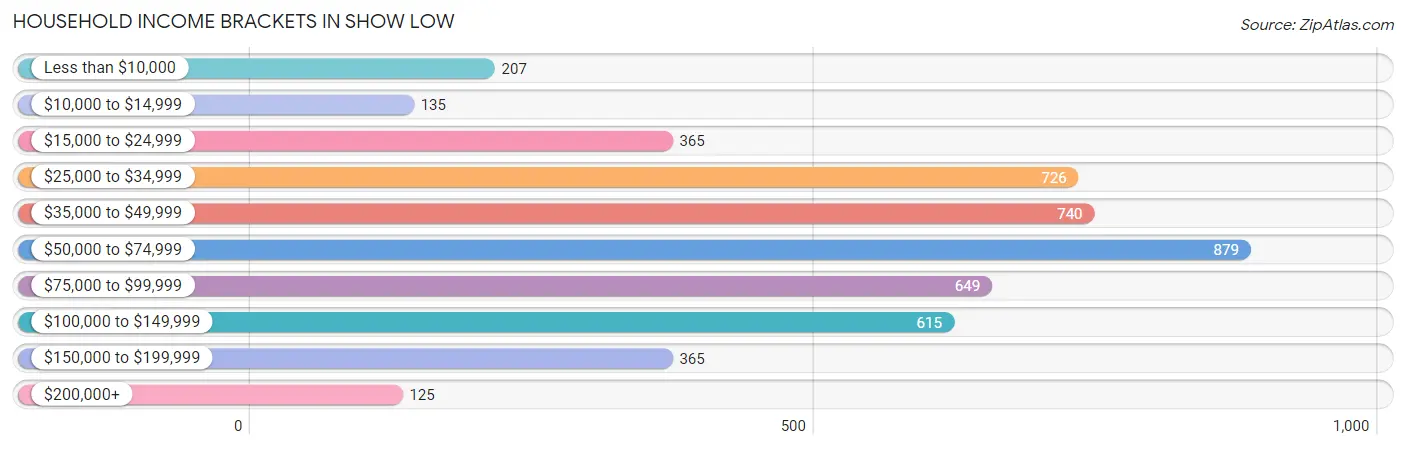
Household Income Brackets in Show Low
With 879 households falling in the category, the $50,000 to $74,999 income range is the most frequent in Show Low, accounting for 18.3% of all households. In contrast, only 125 households (2.6%) fall into the $200,000+ income bracket, making it the least populous group.
| Income Bracket | # Households | % Households |
| Less than $10,000 | 207 | 4.3% |
| $10,000 to $14,999 | 135 | 2.8% |
| $15,000 to $24,999 | 365 | 7.6% |
| $25,000 to $34,999 | 726 | 15.1% |
| $35,000 to $49,999 | 740 | 15.4% |
| $50,000 to $74,999 | 879 | 18.3% |
| $75,000 to $99,999 | 649 | 13.5% |
| $100,000 to $149,999 | 615 | 12.8% |
| $150,000 to $199,999 | 365 | 7.6% |
| $200,000+ | 125 | 2.6% |
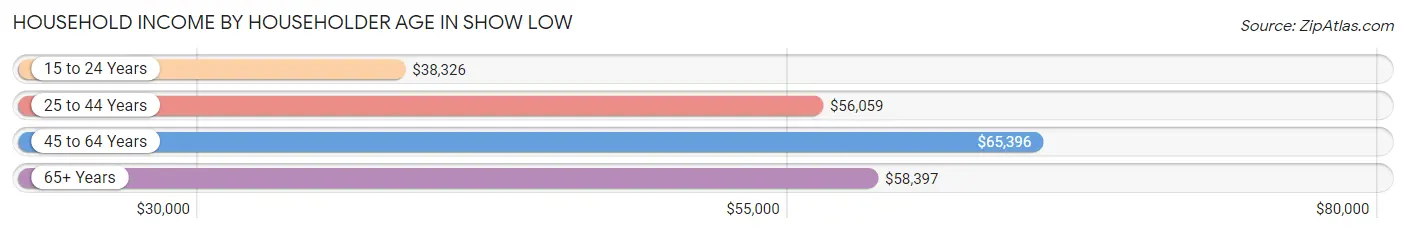
Household Income by Householder Age in Show Low
The median household income in Show Low is $57,406, with the highest median household income of $65,396 found in the 45 to 64 years age bracket for the primary householder. A total of 1,567 households (32.6%) fall into this category. Meanwhile, the 15 to 24 years age bracket for the primary householder has the lowest median household income of $38,326, with 215 households (4.5%) in this group.
| Income Bracket | # Households | Median Income |
| 15 to 24 Years | 215 (4.5%) | $38,326 |
| 25 to 44 Years | 1,146 (23.8%) | $56,059 |
| 45 to 64 Years | 1,567 (32.6%) | $65,396 |
| 65+ Years | 1,878 (39.1%) | $58,397 |
| Total | 4,806 (100.0%) | $57,406 |
Poverty in Show Low
Income Below Poverty by Sex and Age in Show Low
With 11.5% poverty level for males and 13.6% for females among the residents of Show Low, 12 to 14 year old males and 35 to 44 year old females are the most vulnerable to poverty, with 84 males (51.5%) and 170 females (27.2%) in their respective age groups living below the poverty level.
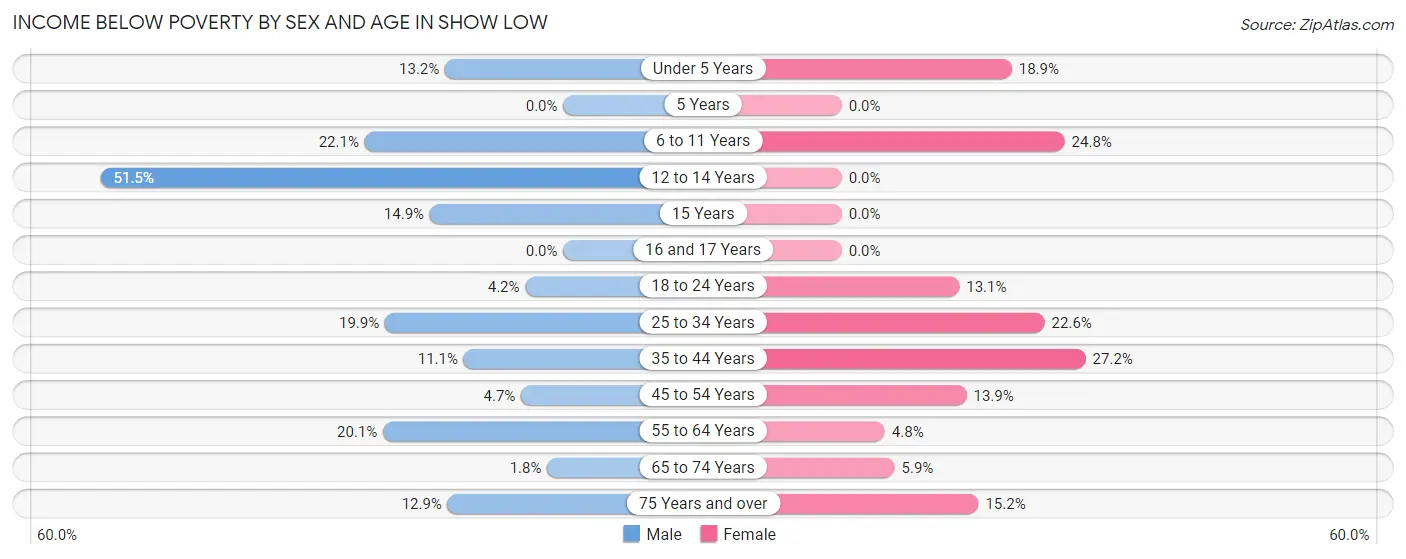
| Age Bracket | Male | Female |
| Under 5 Years | 54 (13.2%) | 74 (18.9%) |
| 5 Years | 0 (0.0%) | 0 (0.0%) |
| 6 to 11 Years | 98 (22.1%) | 102 (24.8%) |
| 12 to 14 Years | 84 (51.5%) | 0 (0.0%) |
| 15 Years | 11 (14.9%) | 0 (0.0%) |
| 16 and 17 Years | 0 (0.0%) | 0 (0.0%) |
| 18 to 24 Years | 26 (4.2%) | 61 (13.1%) |
| 25 to 34 Years | 87 (19.9%) | 152 (22.6%) |
| 35 to 44 Years | 74 (11.1%) | 170 (27.2%) |
| 45 to 54 Years | 31 (4.7%) | 81 (13.9%) |
| 55 to 64 Years | 116 (20.1%) | 39 (4.8%) |
| 65 to 74 Years | 18 (1.8%) | 65 (5.9%) |
| 75 Years and over | 64 (12.9%) | 58 (15.2%) |
| Total | 663 (11.5%) | 802 (13.6%) |
Income Above Poverty by Sex and Age in Show Low
According to the poverty statistics in Show Low, males aged 5 years and females aged 12 to 14 years are the age groups that are most secure financially, with 100.0% of males and 100.0% of females in these age groups living above the poverty line.
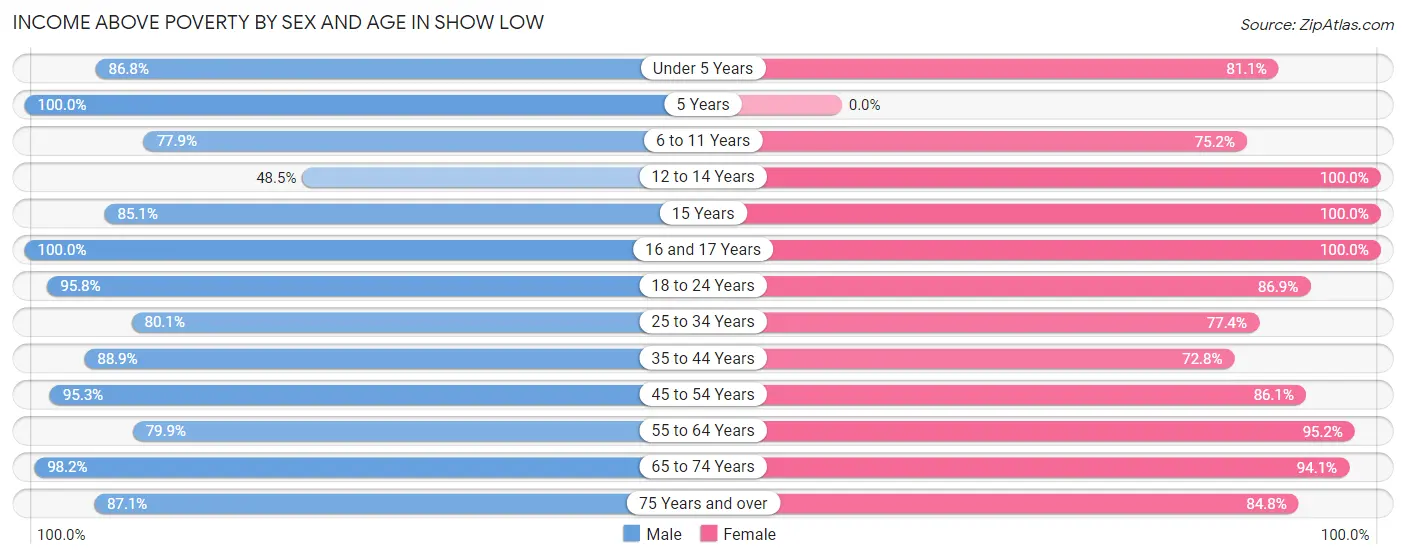
| Age Bracket | Male | Female |
| Under 5 Years | 356 (86.8%) | 317 (81.1%) |
| 5 Years | 100 (100.0%) | 0 (0.0%) |
| 6 to 11 Years | 345 (77.9%) | 309 (75.2%) |
| 12 to 14 Years | 79 (48.5%) | 232 (100.0%) |
| 15 Years | 63 (85.1%) | 57 (100.0%) |
| 16 and 17 Years | 107 (100.0%) | 177 (100.0%) |
| 18 to 24 Years | 588 (95.8%) | 405 (86.9%) |
| 25 to 34 Years | 351 (80.1%) | 521 (77.4%) |
| 35 to 44 Years | 593 (88.9%) | 456 (72.8%) |
| 45 to 54 Years | 629 (95.3%) | 502 (86.1%) |
| 55 to 64 Years | 462 (79.9%) | 773 (95.2%) |
| 65 to 74 Years | 986 (98.2%) | 1,041 (94.1%) |
| 75 Years and over | 433 (87.1%) | 323 (84.8%) |
| Total | 5,092 (88.5%) | 5,113 (86.4%) |
Income Below Poverty Among Married-Couple Families in Show Low
The poverty statistics for married-couple families in Show Low show that 3.3% or 83 of the total 2,508 families live below the poverty line. Families with 1 or 2 children have the highest poverty rate of 4.3%, comprising of 23 families. On the other hand, families with no children have the lowest poverty rate of 2.9%, which includes 52 families.
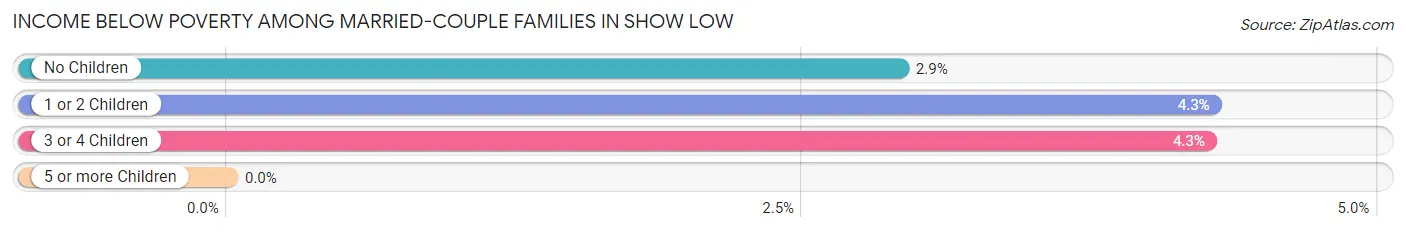
| Children | Above Poverty | Below Poverty |
| No Children | 1,730 (97.1%) | 52 (2.9%) |
| 1 or 2 Children | 515 (95.7%) | 23 (4.3%) |
| 3 or 4 Children | 180 (95.7%) | 8 (4.3%) |
| 5 or more Children | 0 (0.0%) | 0 (0.0%) |
| Total | 2,425 (96.7%) | 83 (3.3%) |
Income Below Poverty Among Single-Parent Households in Show Low
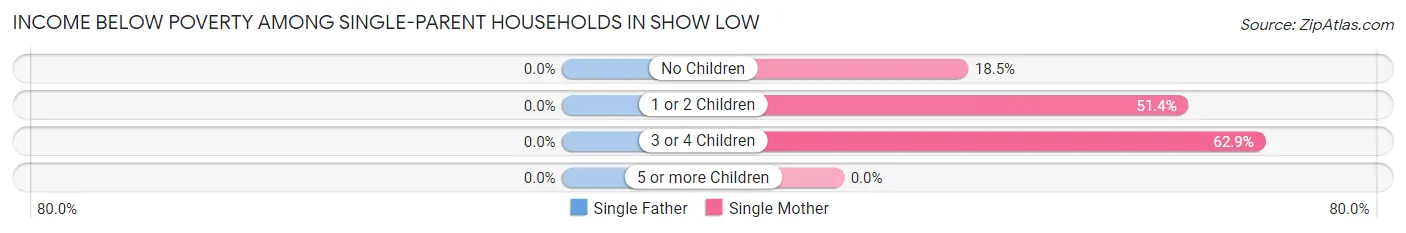
| Children | Single Father | Single Mother |
| No Children | 0 (0.0%) | 20 (18.5%) |
| 1 or 2 Children | 0 (0.0%) | 166 (51.4%) |
| 3 or 4 Children | 0 (0.0%) | 22 (62.9%) |
| 5 or more Children | 0 (0.0%) | 0 (0.0%) |
| Total | 0 (0.0%) | 208 (44.6%) |
Income Below Poverty Among Married-Couple vs Single-Parent Households in Show Low
The poverty data for Show Low shows that 83 of the married-couple family households (3.3%) and 208 of the single-parent households (27.8%) are living below the poverty level. Within the married-couple family households, those with 1 or 2 children have the highest poverty rate, with 23 households (4.3%) falling below the poverty line. Among the single-parent households, those with 3 or 4 children have the highest poverty rate, with 22 household (62.9%) living below poverty.
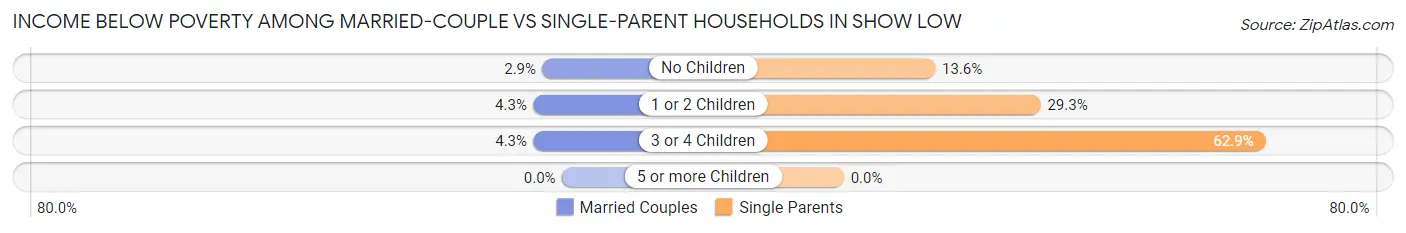
| Children | Married-Couple Families | Single-Parent Households |
| No Children | 52 (2.9%) | 20 (13.6%) |
| 1 or 2 Children | 23 (4.3%) | 166 (29.3%) |
| 3 or 4 Children | 8 (4.3%) | 22 (62.9%) |
| 5 or more Children | 0 (0.0%) | 0 (0.0%) |
| Total | 83 (3.3%) | 208 (27.8%) |
Race in Show Low
The most populous races in Show Low are White / Caucasian (9,909 | 84.2%), Hispanic or Latino (2,138 | 18.2%), and Two or more Races (1,039 | 8.8%).
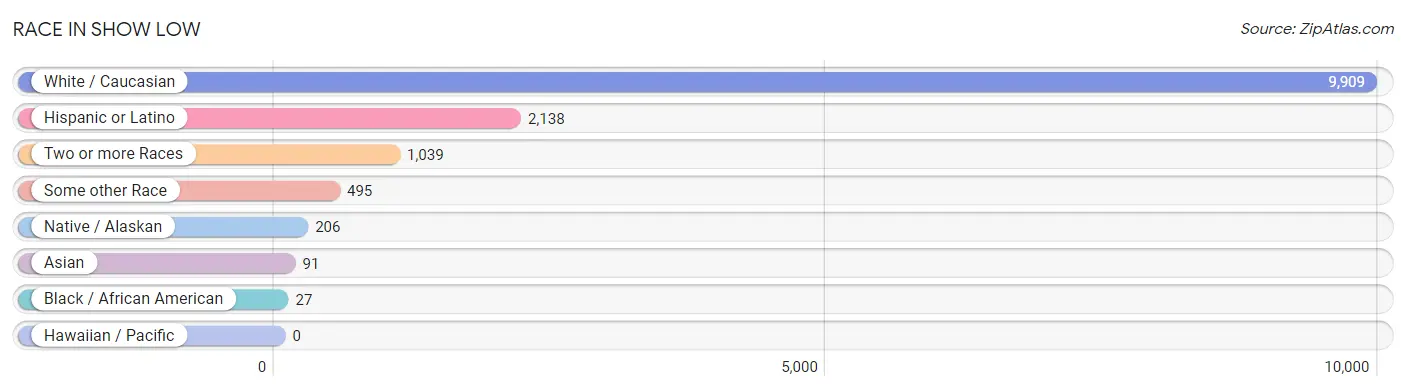
| Race | # Population | % Population |
| Asian | 91 | 0.8% |
| Black / African American | 27 | 0.2% |
| Hawaiian / Pacific | 0 | 0.0% |
| Hispanic or Latino | 2,138 | 18.2% |
| Native / Alaskan | 206 | 1.8% |
| White / Caucasian | 9,909 | 84.2% |
| Two or more Races | 1,039 | 8.8% |
| Some other Race | 495 | 4.2% |
| Total | 11,767 | 100.0% |
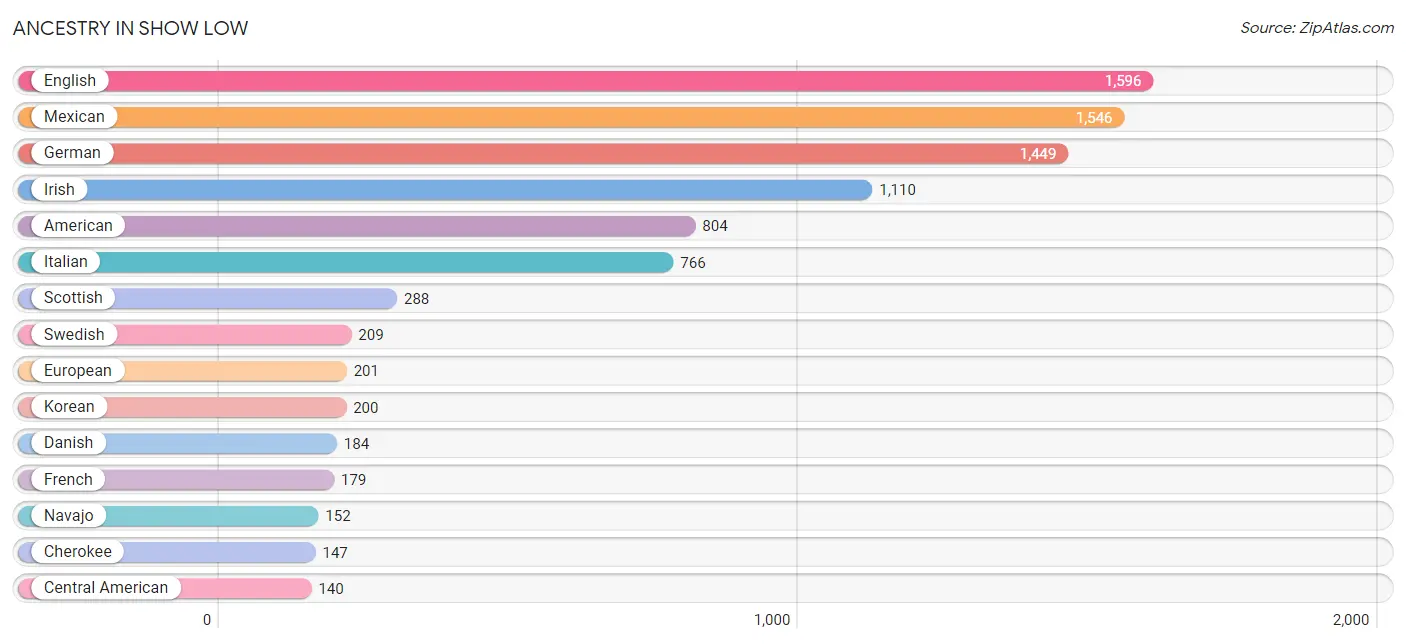
Ancestry in Show Low
The most populous ancestries reported in Show Low are English (1,596 | 13.6%), Mexican (1,546 | 13.1%), German (1,449 | 12.3%), Irish (1,110 | 9.4%), and American (804 | 6.8%), together accounting for 55.3% of all Show Low residents.
| Ancestry | # Population | % Population |
| African | 10 | 0.1% |
| American | 804 | 6.8% |
| Apache | 46 | 0.4% |
| Arab | 15 | 0.1% |
| Austrian | 5 | 0.0% |
| British | 67 | 0.6% |
| Canadian | 15 | 0.1% |
| Central American | 140 | 1.2% |
| Central American Indian | 17 | 0.1% |
| Cherokee | 147 | 1.3% |
| Chilean | 3 | 0.0% |
| Choctaw | 28 | 0.2% |
| Costa Rican | 11 | 0.1% |
| Cuban | 11 | 0.1% |
| Czech | 36 | 0.3% |
| Czechoslovakian | 8 | 0.1% |
| Danish | 184 | 1.6% |
| Dominican | 24 | 0.2% |
| Dutch | 85 | 0.7% |
| Eastern European | 22 | 0.2% |
| English | 1,596 | 13.6% |
| European | 201 | 1.7% |
| Finnish | 10 | 0.1% |
| French | 179 | 1.5% |
| French Canadian | 13 | 0.1% |
| German | 1,449 | 12.3% |
| Greek | 24 | 0.2% |
| Guatemalan | 31 | 0.3% |
| Hungarian | 67 | 0.6% |
| Indian (Asian) | 38 | 0.3% |
| Irish | 1,110 | 9.4% |
| Italian | 766 | 6.5% |
| Korean | 200 | 1.7% |
| Lebanese | 15 | 0.1% |
| Lithuanian | 7 | 0.1% |
| Mexican | 1,546 | 13.1% |
| Mexican American Indian | 15 | 0.1% |
| Navajo | 152 | 1.3% |
| Northern European | 9 | 0.1% |
| Norwegian | 82 | 0.7% |
| Peruvian | 14 | 0.1% |
| Polish | 108 | 0.9% |
| Portuguese | 24 | 0.2% |
| Russian | 56 | 0.5% |
| Scandinavian | 79 | 0.7% |
| Scotch-Irish | 109 | 0.9% |
| Scottish | 288 | 2.5% |
| Slovak | 17 | 0.1% |
| South American | 17 | 0.1% |
| Spaniard | 59 | 0.5% |
| Spanish | 131 | 1.1% |
| Subsaharan African | 10 | 0.1% |
| Swedish | 209 | 1.8% |
| Swiss | 5 | 0.0% |
| Thai | 12 | 0.1% |
| Ukrainian | 18 | 0.2% |
| Welsh | 45 | 0.4% |
| Yugoslavian | 8 | 0.1% | View All 58 Rows |
Immigrants in Show Low
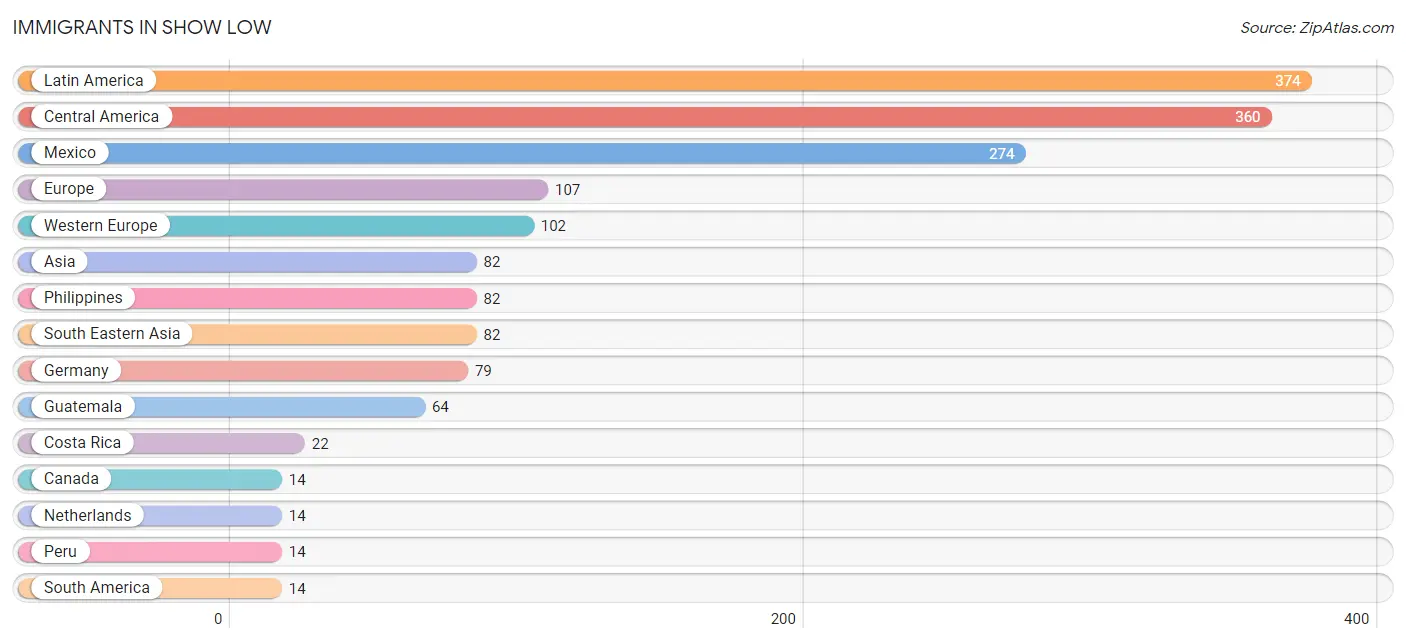
The most numerous immigrant groups reported in Show Low came from Latin America (374 | 3.2%), Central America (360 | 3.1%), Mexico (274 | 2.3%), Europe (107 | 0.9%), and Western Europe (102 | 0.9%), together accounting for 10.3% of all Show Low residents.
| Immigration Origin | # Population | % Population |
| Asia | 82 | 0.7% |
| Canada | 14 | 0.1% |
| Central America | 360 | 3.1% |
| Costa Rica | 22 | 0.2% |
| Eastern Europe | 5 | 0.0% |
| Europe | 107 | 0.9% |
| France | 9 | 0.1% |
| Germany | 79 | 0.7% |
| Guatemala | 64 | 0.5% |
| Latin America | 374 | 3.2% |
| Mexico | 274 | 2.3% |
| Netherlands | 14 | 0.1% |
| Peru | 14 | 0.1% |
| Philippines | 82 | 0.7% |
| Serbia | 5 | 0.0% |
| South America | 14 | 0.1% |
| South Eastern Asia | 82 | 0.7% |
| Western Europe | 102 | 0.9% | View All 18 Rows |
Sex and Age in Show Low
Sex and Age in Show Low
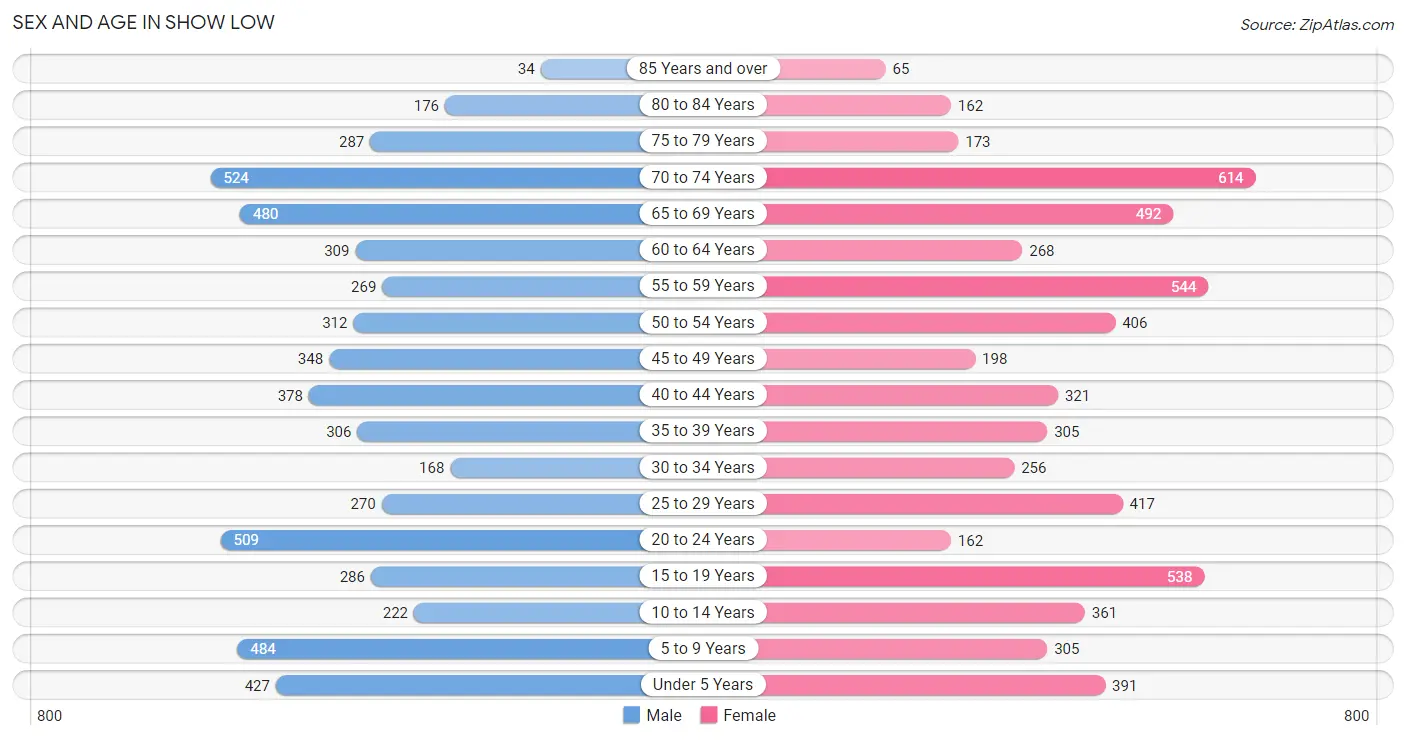
The most populous age groups in Show Low are 70 to 74 Years (524 | 9.0%) for men and 70 to 74 Years (614 | 10.3%) for women.
| Age Bracket | Male | Female |
| Under 5 Years | 427 (7.4%) | 391 (6.5%) |
| 5 to 9 Years | 484 (8.4%) | 305 (5.1%) |
| 10 to 14 Years | 222 (3.8%) | 361 (6.0%) |
| 15 to 19 Years | 286 (4.9%) | 538 (9.0%) |
| 20 to 24 Years | 509 (8.8%) | 162 (2.7%) |
| 25 to 29 Years | 270 (4.7%) | 417 (7.0%) |
| 30 to 34 Years | 168 (2.9%) | 256 (4.3%) |
| 35 to 39 Years | 306 (5.3%) | 305 (5.1%) |
| 40 to 44 Years | 378 (6.5%) | 321 (5.4%) |
| 45 to 49 Years | 348 (6.0%) | 198 (3.3%) |
| 50 to 54 Years | 312 (5.4%) | 406 (6.8%) |
| 55 to 59 Years | 269 (4.6%) | 544 (9.1%) |
| 60 to 64 Years | 309 (5.3%) | 268 (4.5%) |
| 65 to 69 Years | 480 (8.3%) | 492 (8.2%) |
| 70 to 74 Years | 524 (9.0%) | 614 (10.3%) |
| 75 to 79 Years | 287 (5.0%) | 173 (2.9%) |
| 80 to 84 Years | 176 (3.0%) | 162 (2.7%) |
| 85 Years and over | 34 (0.6%) | 65 (1.1%) |
| Total | 5,789 (100.0%) | 5,978 (100.0%) |
Families and Households in Show Low
Median Family Size in Show Low
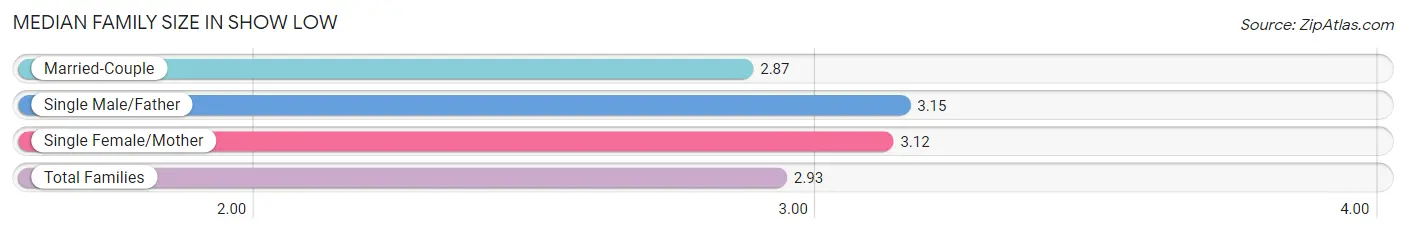
The median family size in Show Low is 2.93 persons per family, with single male/father families (282 | 8.7%) accounting for the largest median family size of 3.15 persons per family. On the other hand, married-couple families (2,508 | 77.0%) represent the smallest median family size with 2.87 persons per family.
| Family Type | # Families | Family Size |
| Married-Couple | 2,508 (77.0%) | 2.87 |
| Single Male/Father | 282 (8.7%) | 3.15 |
| Single Female/Mother | 466 (14.3%) | 3.12 |
| Total Families | 3,256 (100.0%) | 2.93 |
Median Household Size in Show Low
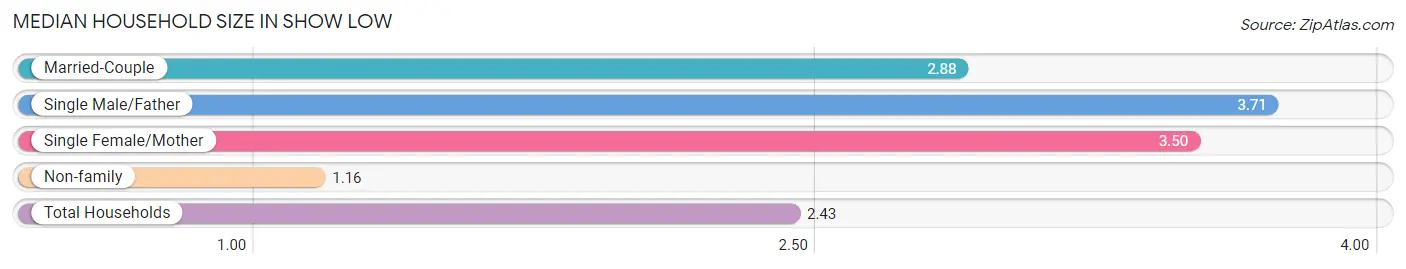
The median household size in Show Low is 2.43 persons per household, with single male/father households (282 | 5.9%) accounting for the largest median household size of 3.71 persons per household. non-family households (1,550 | 32.3%) represent the smallest median household size with 1.16 persons per household.
| Household Type | # Households | Household Size |
| Married-Couple | 2,508 (52.2%) | 2.88 |
| Single Male/Father | 282 (5.9%) | 3.71 |
| Single Female/Mother | 466 (9.7%) | 3.50 |
| Non-family | 1,550 (32.3%) | 1.16 |
| Total Households | 4,806 (100.0%) | 2.43 |
Household Size by Marriage Status in Show Low
Out of a total of 4,806 households in Show Low, 3,256 (67.7%) are family households, while 1,550 (32.3%) are nonfamily households. The most numerous type of family households are 2-person households, comprising 1,764, and the most common type of nonfamily households are 1-person households, comprising 1,309.
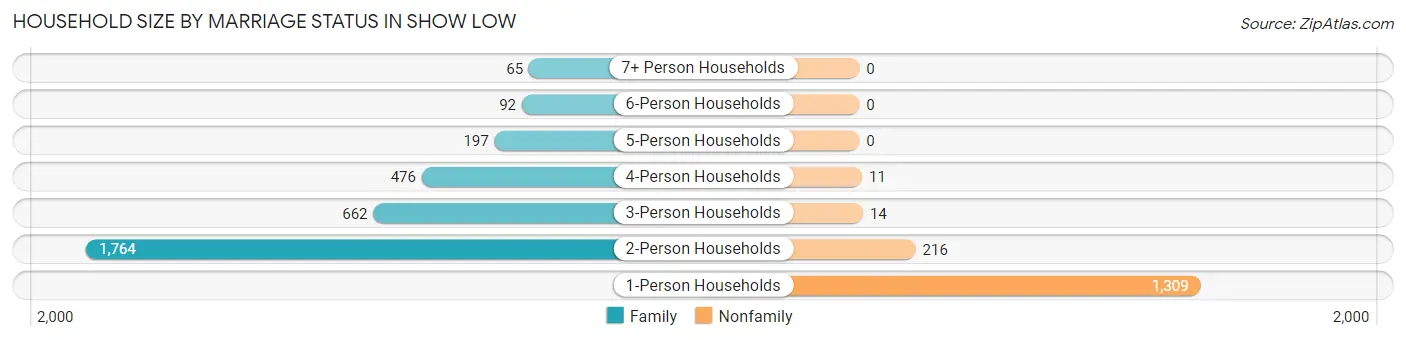
| Household Size | Family Households | Nonfamily Households |
| 1-Person Households | - | 1,309 (27.2%) |
| 2-Person Households | 1,764 (36.7%) | 216 (4.5%) |
| 3-Person Households | 662 (13.8%) | 14 (0.3%) |
| 4-Person Households | 476 (9.9%) | 11 (0.2%) |
| 5-Person Households | 197 (4.1%) | 0 (0.0%) |
| 6-Person Households | 92 (1.9%) | 0 (0.0%) |
| 7+ Person Households | 65 (1.3%) | 0 (0.0%) |
| Total | 3,256 (67.7%) | 1,550 (32.3%) |
Female Fertility in Show Low
Fertility by Age in Show Low
Average fertility rate in Show Low is 22.0 births per 1,000 women. Women in the age bracket of 20 to 34 years have the highest fertility rate with 48.0 births per 1,000 women. Women in the age bracket of 20 to 34 years acount for 81.6% of all women with births.
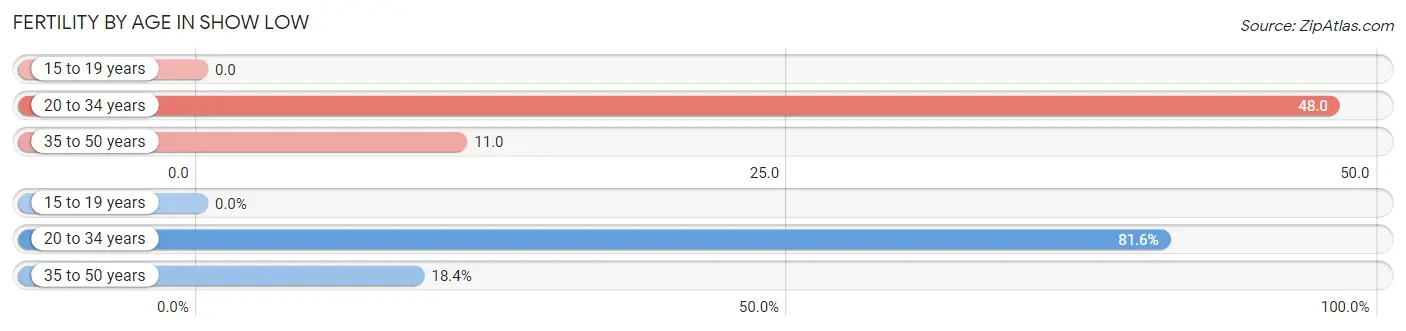
| Age Bracket | Women with Births | Births / 1,000 Women |
| 15 to 19 years | 0 (0.0%) | 0.0 |
| 20 to 34 years | 40 (81.6%) | 48.0 |
| 35 to 50 years | 9 (18.4%) | 11.0 |
| Total | 49 (100.0%) | 22.0 |
Fertility by Age by Marriage Status in Show Low
75.5% of women with births (49) in Show Low are married. The highest percentage of unmarried women with births falls into 20 to 34 years age bracket with 30.0% of them unmarried at the time of birth, while the lowest percentage of unmarried women with births belong to 35 to 50 years age bracket with 0.0% of them unmarried.
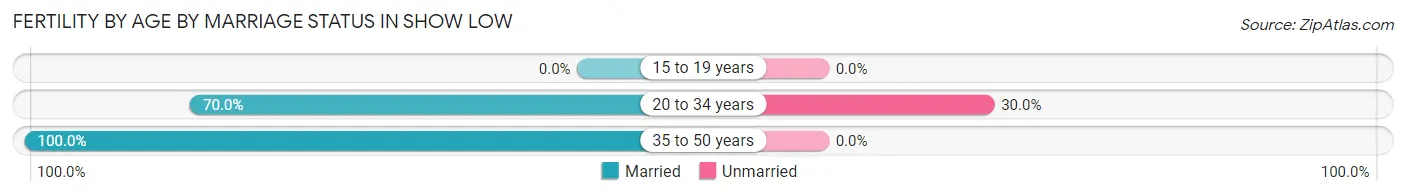
| Age Bracket | Married | Unmarried |
| 15 to 19 years | 0 (0.0%) | 0 (0.0%) |
| 20 to 34 years | 28 (70.0%) | 12 (30.0%) |
| 35 to 50 years | 9 (100.0%) | 0 (0.0%) |
| Total | 37 (75.5%) | 12 (24.5%) |
Fertility by Education in Show Low
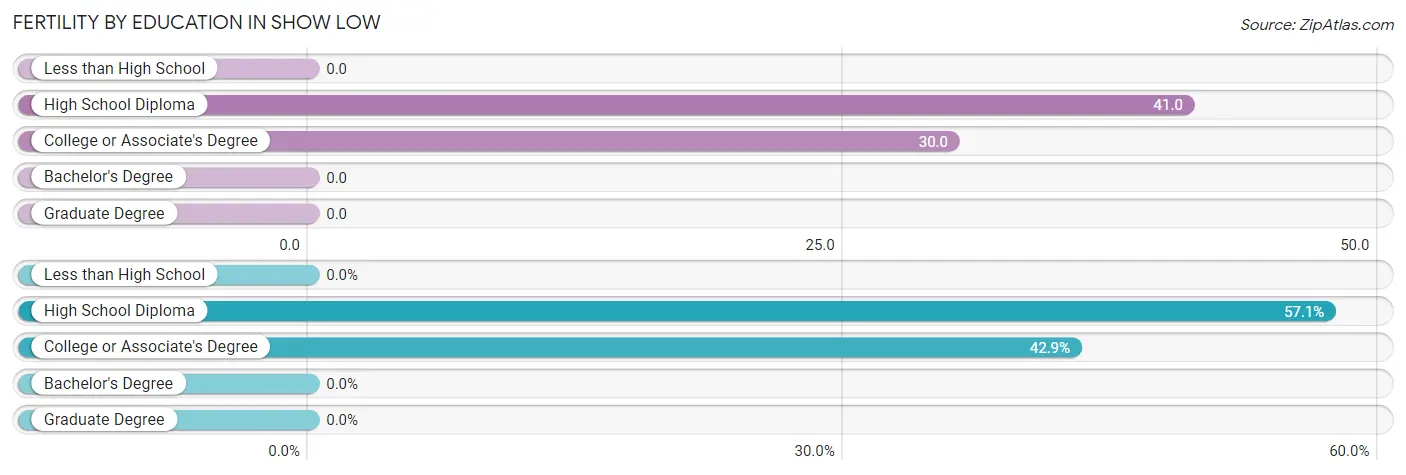
| Educational Attainment | Women with Births | Births / 1,000 Women |
| Less than High School | 0 (0.0%) | 0.0 |
| High School Diploma | 28 (57.1%) | 41.0 |
| College or Associate's Degree | 21 (42.9%) | 30.0 |
| Bachelor's Degree | 0 (0.0%) | 0.0 |
| Graduate Degree | 0 (0.0%) | 0.0 |
| Total | 49 (100.0%) | 22.0 |
Fertility by Education by Marriage Status in Show Low
24.5% of women with births in Show Low are unmarried. Women with the educational attainment of high school diploma are most likely to be married with 100.0% of them married at childbirth, while women with the educational attainment of college or associate's degree are least likely to be married with 57.1% of them unmarried at childbirth.
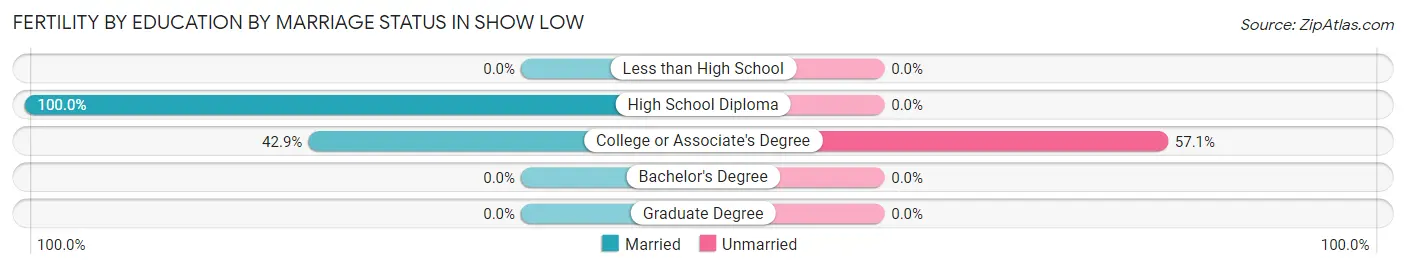
| Educational Attainment | Married | Unmarried |
| Less than High School | 0 (0.0%) | 0 (0.0%) |
| High School Diploma | 28 (100.0%) | 0 (0.0%) |
| College or Associate's Degree | 9 (42.9%) | 12 (57.1%) |
| Bachelor's Degree | 0 (0.0%) | 0 (0.0%) |
| Graduate Degree | 0 (0.0%) | 0 (0.0%) |
| Total | 37 (75.5%) | 12 (24.5%) |
Employment Characteristics in Show Low
Employment by Class of Employer in Show Low
Among the 4,413 employed individuals in Show Low, private company employees (3,014 | 68.3%), not-for-profit organizations (343 | 7.8%), and local government employees (342 | 7.7%) make up the most common classes of employment.
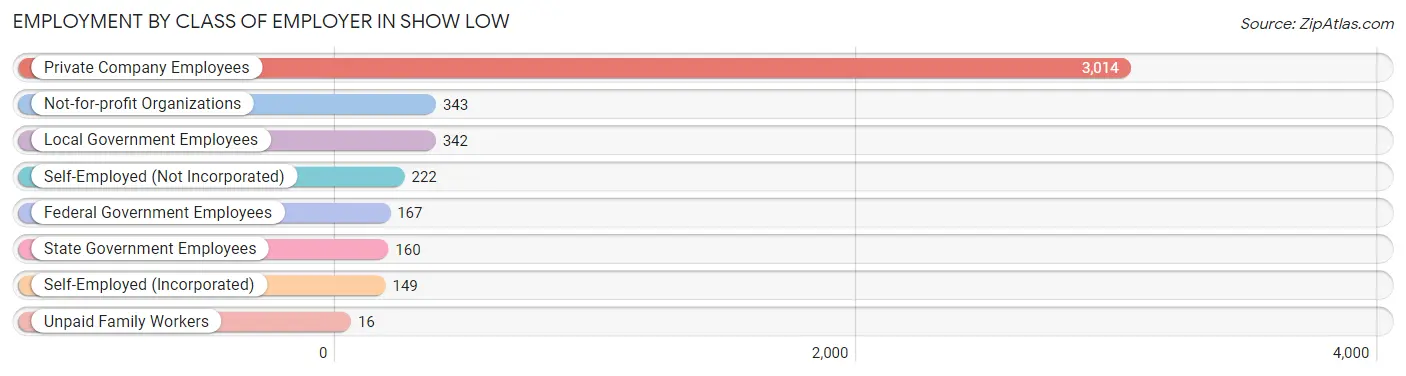
| Employer Class | # Employees | % Employees |
| Private Company Employees | 3,014 | 68.3% |
| Self-Employed (Incorporated) | 149 | 3.4% |
| Self-Employed (Not Incorporated) | 222 | 5.0% |
| Not-for-profit Organizations | 343 | 7.8% |
| Local Government Employees | 342 | 7.7% |
| State Government Employees | 160 | 3.6% |
| Federal Government Employees | 167 | 3.8% |
| Unpaid Family Workers | 16 | 0.4% |
| Total | 4,413 | 100.0% |
Employment Status by Age in Show Low
According to the labor force statistics for Show Low, out of the total population over 16 years of age (9,446), 50.2% or 4,742 individuals are in the labor force, with 6.5% or 308 of them unemployed. The age group with the highest labor force participation rate is 25 to 29 years, with 92.4% or 635 individuals in the labor force. Within the labor force, the 16 to 19 years age range has the highest percentage of unemployed individuals, with 13.8% or 30 of them being unemployed.
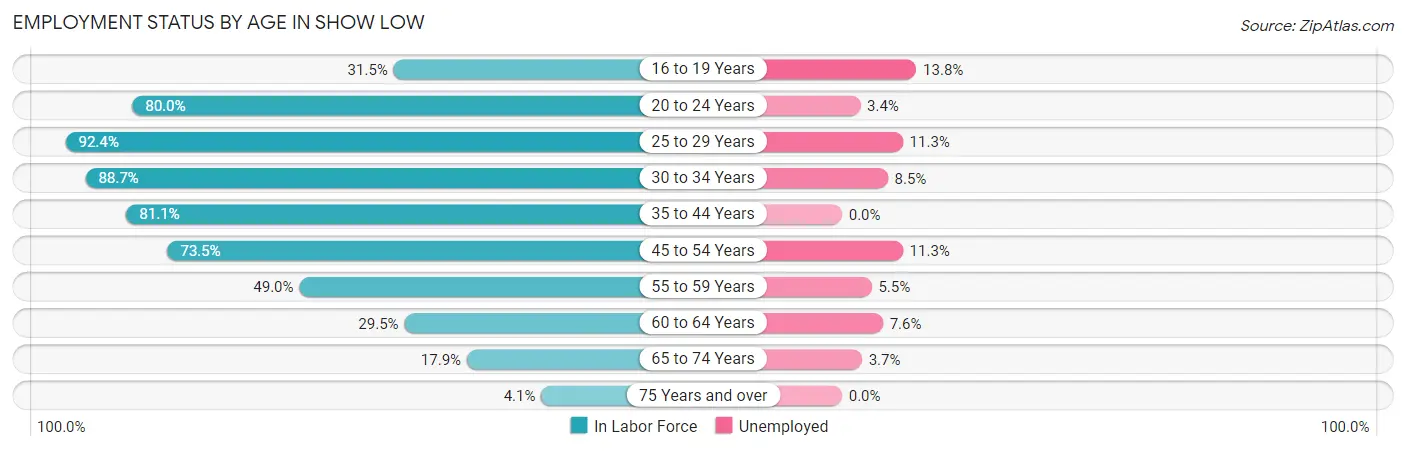
| Age Bracket | In Labor Force | Unemployed |
| 16 to 19 Years | 218 (31.5%) | 30 (13.8%) |
| 20 to 24 Years | 537 (80.0%) | 18 (3.4%) |
| 25 to 29 Years | 635 (92.4%) | 72 (11.3%) |
| 30 to 34 Years | 376 (88.7%) | 32 (8.5%) |
| 35 to 44 Years | 1,062 (81.1%) | 0 (0.0%) |
| 45 to 54 Years | 929 (73.5%) | 105 (11.3%) |
| 55 to 59 Years | 398 (49.0%) | 22 (5.5%) |
| 60 to 64 Years | 170 (29.5%) | 13 (7.6%) |
| 65 to 74 Years | 378 (17.9%) | 14 (3.7%) |
| 75 Years and over | 37 (4.1%) | 0 (0.0%) |
| Total | 4,742 (50.2%) | 308 (6.5%) |
Employment Status by Educational Attainment in Show Low
According to labor force statistics for Show Low, 70.3% of individuals (3,568) out of the total population between 25 and 64 years of age (5,075) are in the labor force, with 6.8% or 243 of them being unemployed. The group with the highest labor force participation rate are those with the educational attainment of high school diploma, with 74.0% or 1,116 individuals in the labor force. Within the labor force, individuals with college / associate degree education have the highest percentage of unemployment, with 10.9% or 155 of them being unemployed.
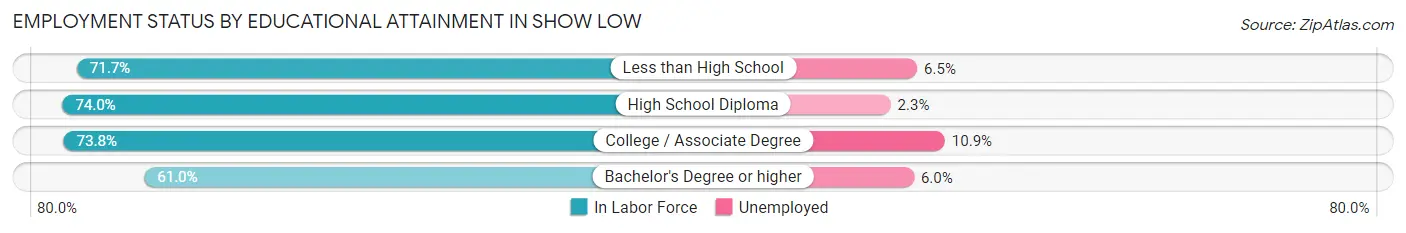
| Educational Attainment | In Labor Force | Unemployed |
| Less than High School | 215 (71.7%) | 20 (6.5%) |
| High School Diploma | 1,116 (74.0%) | 35 (2.3%) |
| College / Associate Degree | 1,419 (73.8%) | 210 (10.9%) |
| Bachelor's Degree or higher | 820 (61.0%) | 81 (6.0%) |
| Total | 3,568 (70.3%) | 345 (6.8%) |
Employment Occupations by Sex in Show Low
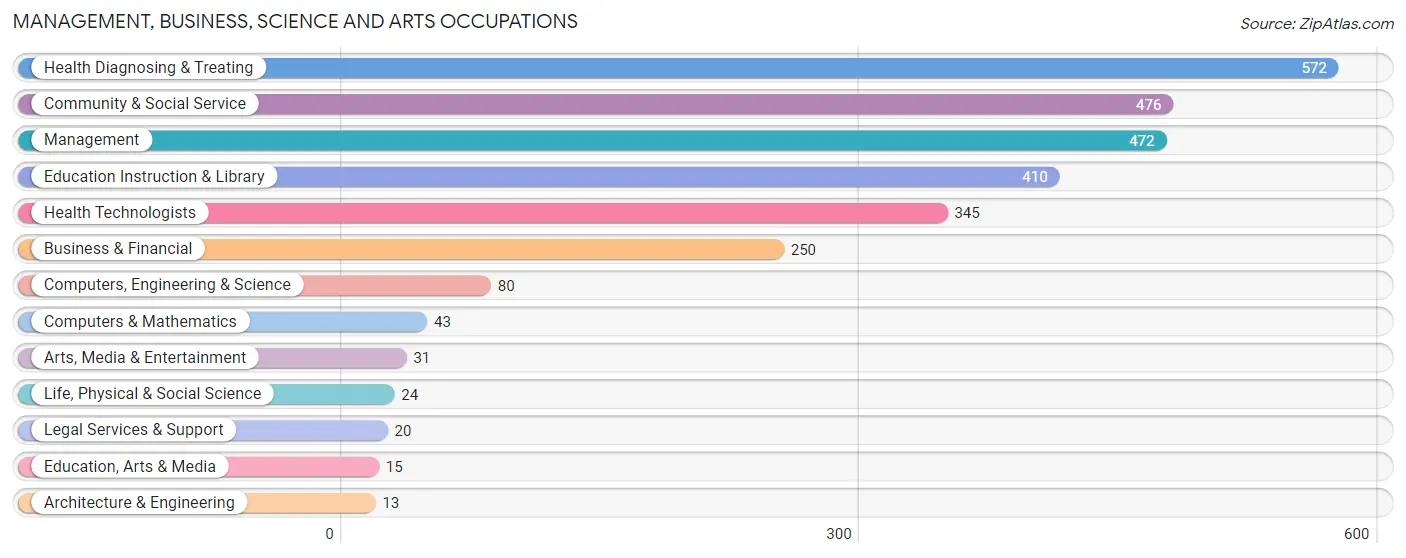
Management, Business, Science and Arts Occupations
The most common Management, Business, Science and Arts occupations in Show Low are Health Diagnosing & Treating (572 | 12.9%), Community & Social Service (476 | 10.7%), Management (472 | 10.6%), Education Instruction & Library (410 | 9.2%), and Health Technologists (345 | 7.8%).
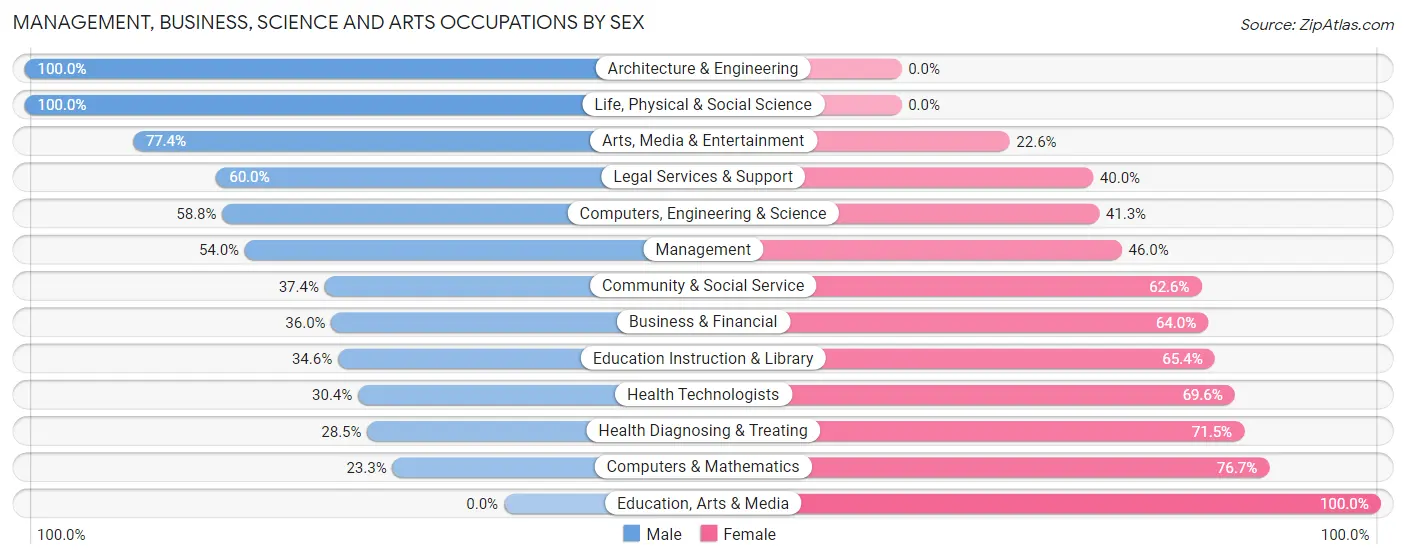
Management, Business, Science and Arts Occupations by Sex
Within the Management, Business, Science and Arts occupations in Show Low, the most male-oriented occupations are Architecture & Engineering (100.0%), Life, Physical & Social Science (100.0%), and Arts, Media & Entertainment (77.4%), while the most female-oriented occupations are Education, Arts & Media (100.0%), Computers & Mathematics (76.7%), and Health Diagnosing & Treating (71.5%).
| Occupation | Male | Female |
| Management | 255 (54.0%) | 217 (46.0%) |
| Business & Financial | 90 (36.0%) | 160 (64.0%) |
| Computers, Engineering & Science | 47 (58.8%) | 33 (41.2%) |
| Computers & Mathematics | 10 (23.3%) | 33 (76.7%) |
| Architecture & Engineering | 13 (100.0%) | 0 (0.0%) |
| Life, Physical & Social Science | 24 (100.0%) | 0 (0.0%) |
| Community & Social Service | 178 (37.4%) | 298 (62.6%) |
| Education, Arts & Media | 0 (0.0%) | 15 (100.0%) |
| Legal Services & Support | 12 (60.0%) | 8 (40.0%) |
| Education Instruction & Library | 142 (34.6%) | 268 (65.4%) |
| Arts, Media & Entertainment | 24 (77.4%) | 7 (22.6%) |
| Health Diagnosing & Treating | 163 (28.5%) | 409 (71.5%) |
| Health Technologists | 105 (30.4%) | 240 (69.6%) |
| Total (Category) | 733 (39.6%) | 1,117 (60.4%) |
| Total (Overall) | 2,387 (53.8%) | 2,046 (46.2%) |
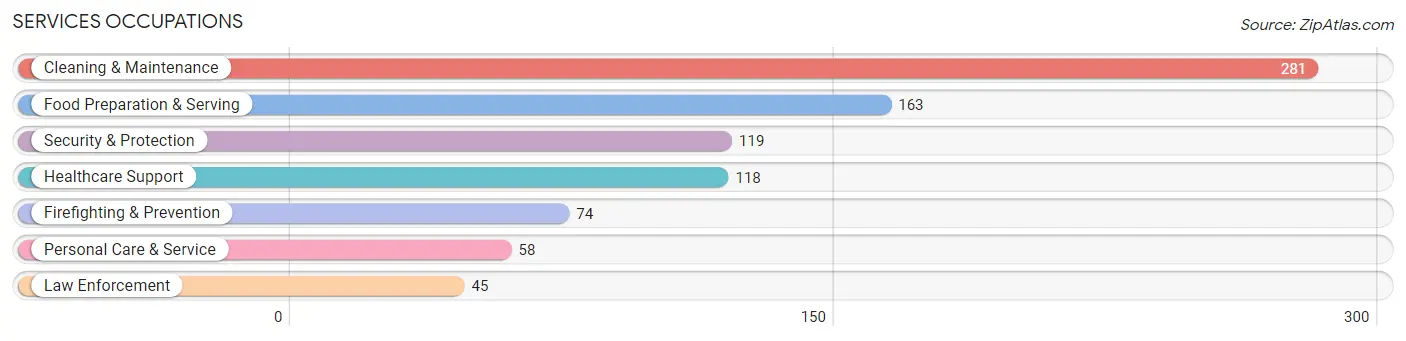
Services Occupations
The most common Services occupations in Show Low are Cleaning & Maintenance (281 | 6.3%), Food Preparation & Serving (163 | 3.7%), Security & Protection (119 | 2.7%), Healthcare Support (118 | 2.7%), and Firefighting & Prevention (74 | 1.7%).
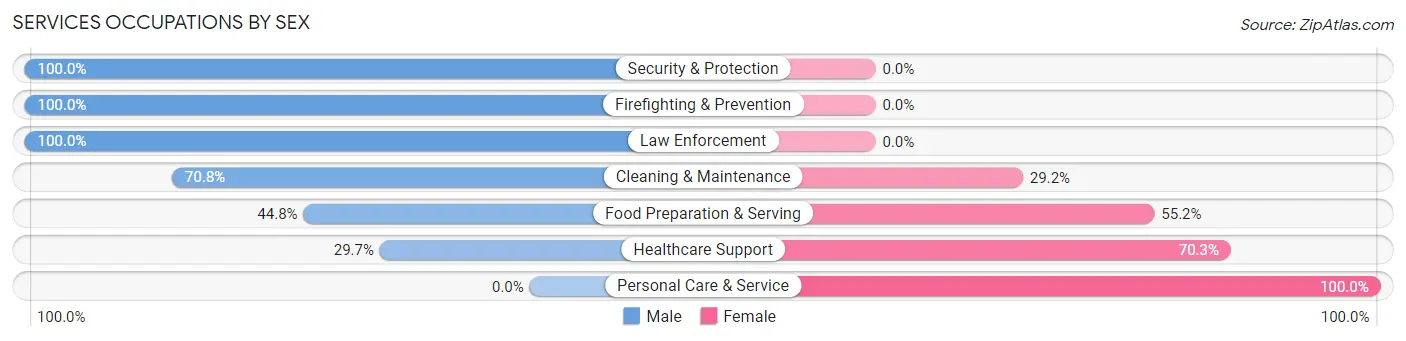
Services Occupations by Sex
Within the Services occupations in Show Low, the most male-oriented occupations are Security & Protection (100.0%), Firefighting & Prevention (100.0%), and Law Enforcement (100.0%), while the most female-oriented occupations are Personal Care & Service (100.0%), Healthcare Support (70.3%), and Food Preparation & Serving (55.2%).
| Occupation | Male | Female |
| Healthcare Support | 35 (29.7%) | 83 (70.3%) |
| Security & Protection | 119 (100.0%) | 0 (0.0%) |
| Firefighting & Prevention | 74 (100.0%) | 0 (0.0%) |
| Law Enforcement | 45 (100.0%) | 0 (0.0%) |
| Food Preparation & Serving | 73 (44.8%) | 90 (55.2%) |
| Cleaning & Maintenance | 199 (70.8%) | 82 (29.2%) |
| Personal Care & Service | 0 (0.0%) | 58 (100.0%) |
| Total (Category) | 426 (57.7%) | 313 (42.3%) |
| Total (Overall) | 2,387 (53.8%) | 2,046 (46.2%) |
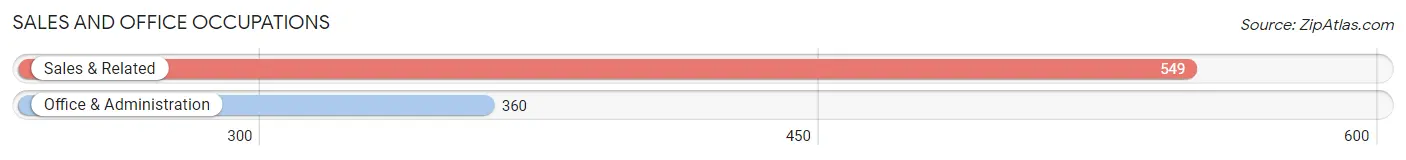
Sales and Office Occupations
The most common Sales and Office occupations in Show Low are Sales & Related (549 | 12.4%), and Office & Administration (360 | 8.1%).
Sales and Office Occupations by Sex
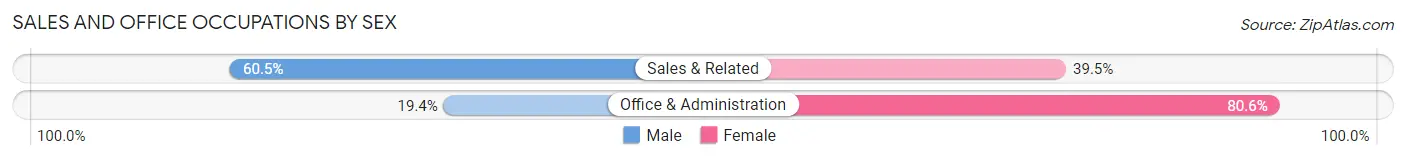
| Occupation | Male | Female |
| Sales & Related | 332 (60.5%) | 217 (39.5%) |
| Office & Administration | 70 (19.4%) | 290 (80.6%) |
| Total (Category) | 402 (44.2%) | 507 (55.8%) |
| Total (Overall) | 2,387 (53.8%) | 2,046 (46.2%) |
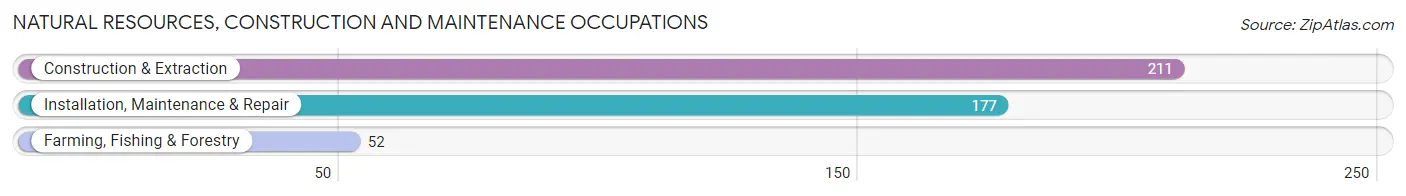
Natural Resources, Construction and Maintenance Occupations
The most common Natural Resources, Construction and Maintenance occupations in Show Low are Construction & Extraction (211 | 4.8%), Installation, Maintenance & Repair (177 | 4.0%), and Farming, Fishing & Forestry (52 | 1.2%).
Natural Resources, Construction and Maintenance Occupations by Sex
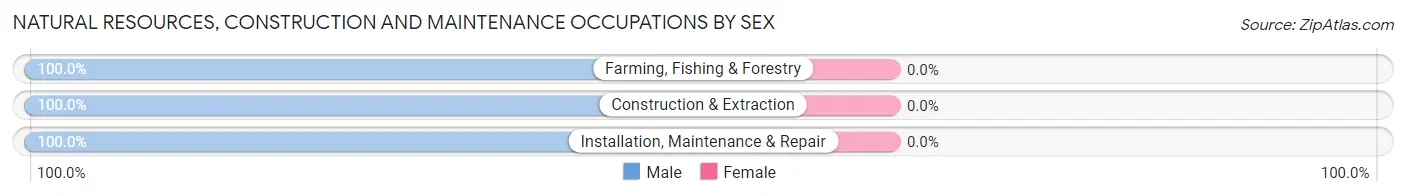
| Occupation | Male | Female |
| Farming, Fishing & Forestry | 52 (100.0%) | 0 (0.0%) |
| Construction & Extraction | 211 (100.0%) | 0 (0.0%) |
| Installation, Maintenance & Repair | 177 (100.0%) | 0 (0.0%) |
| Total (Category) | 440 (100.0%) | 0 (0.0%) |
| Total (Overall) | 2,387 (53.8%) | 2,046 (46.2%) |
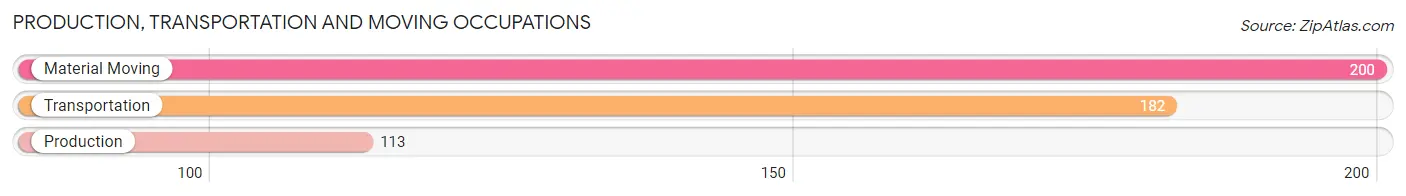
Production, Transportation and Moving Occupations
The most common Production, Transportation and Moving occupations in Show Low are Material Moving (200 | 4.5%), Transportation (182 | 4.1%), and Production (113 | 2.5%).
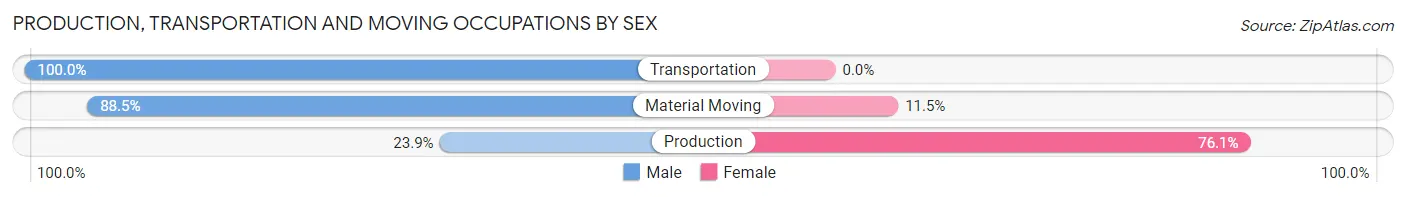
Production, Transportation and Moving Occupations by Sex
| Occupation | Male | Female |
| Production | 27 (23.9%) | 86 (76.1%) |
| Transportation | 182 (100.0%) | 0 (0.0%) |
| Material Moving | 177 (88.5%) | 23 (11.5%) |
| Total (Category) | 386 (78.0%) | 109 (22.0%) |
| Total (Overall) | 2,387 (53.8%) | 2,046 (46.2%) |
Employment Industries by Sex in Show Low
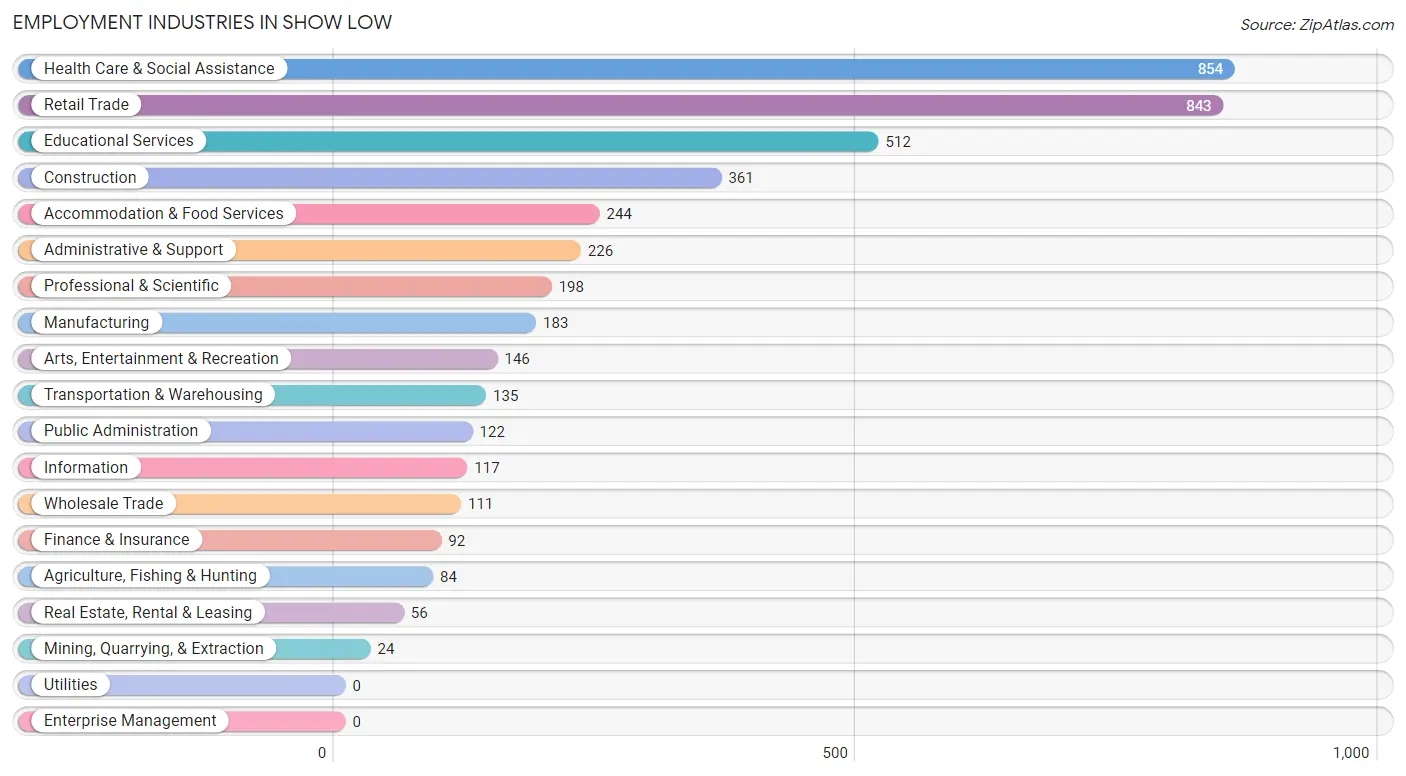
Employment Industries in Show Low
The major employment industries in Show Low include Health Care & Social Assistance (854 | 19.3%), Retail Trade (843 | 19.0%), Educational Services (512 | 11.6%), Construction (361 | 8.1%), and Accommodation & Food Services (244 | 5.5%).
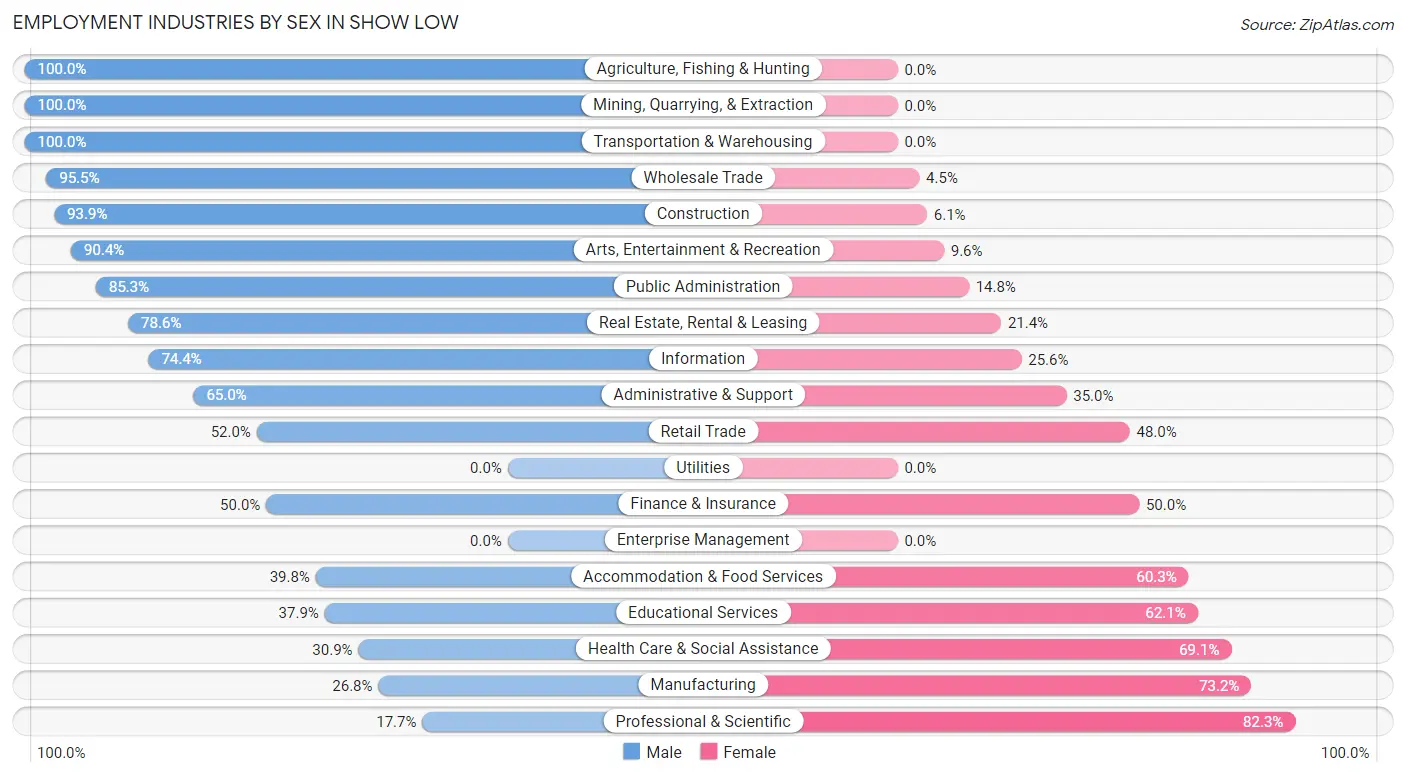
Employment Industries by Sex in Show Low
The Show Low industries that see more men than women are Agriculture, Fishing & Hunting (100.0%), Mining, Quarrying, & Extraction (100.0%), and Transportation & Warehousing (100.0%), whereas the industries that tend to have a higher number of women are Professional & Scientific (82.3%), Manufacturing (73.2%), and Health Care & Social Assistance (69.1%).
| Industry | Male | Female |
| Agriculture, Fishing & Hunting | 84 (100.0%) | 0 (0.0%) |
| Mining, Quarrying, & Extraction | 24 (100.0%) | 0 (0.0%) |
| Construction | 339 (93.9%) | 22 (6.1%) |
| Manufacturing | 49 (26.8%) | 134 (73.2%) |
| Wholesale Trade | 106 (95.5%) | 5 (4.5%) |
| Retail Trade | 438 (52.0%) | 405 (48.0%) |
| Transportation & Warehousing | 135 (100.0%) | 0 (0.0%) |
| Utilities | 0 (0.0%) | 0 (0.0%) |
| Information | 87 (74.4%) | 30 (25.6%) |
| Finance & Insurance | 46 (50.0%) | 46 (50.0%) |
| Real Estate, Rental & Leasing | 44 (78.6%) | 12 (21.4%) |
| Professional & Scientific | 35 (17.7%) | 163 (82.3%) |
| Enterprise Management | 0 (0.0%) | 0 (0.0%) |
| Administrative & Support | 147 (65.0%) | 79 (35.0%) |
| Educational Services | 194 (37.9%) | 318 (62.1%) |
| Health Care & Social Assistance | 264 (30.9%) | 590 (69.1%) |
| Arts, Entertainment & Recreation | 132 (90.4%) | 14 (9.6%) |
| Accommodation & Food Services | 97 (39.8%) | 147 (60.3%) |
| Public Administration | 104 (85.3%) | 18 (14.7%) |
| Total | 2,387 (53.8%) | 2,046 (46.2%) |
Education in Show Low
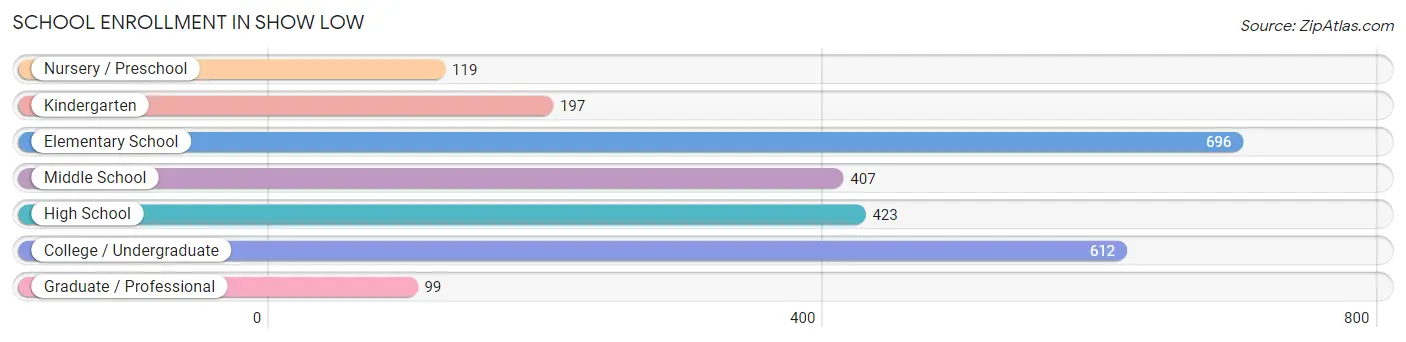
School Enrollment in Show Low
The most common levels of schooling among the 2,553 students in Show Low are elementary school (696 | 27.3%), college / undergraduate (612 | 24.0%), and high school (423 | 16.6%).
| School Level | # Students | % Students |
| Nursery / Preschool | 119 | 4.7% |
| Kindergarten | 197 | 7.7% |
| Elementary School | 696 | 27.3% |
| Middle School | 407 | 15.9% |
| High School | 423 | 16.6% |
| College / Undergraduate | 612 | 24.0% |
| Graduate / Professional | 99 | 3.9% |
| Total | 2,553 | 100.0% |
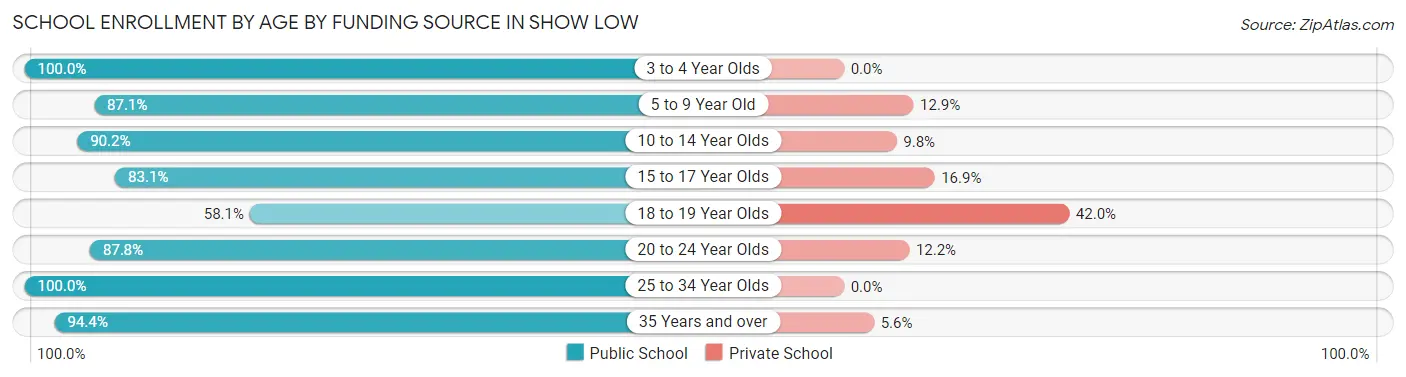
School Enrollment by Age by Funding Source in Show Low
Out of a total of 2,553 students who are enrolled in schools in Show Low, 322 (12.6%) attend a private institution, while the remaining 2,231 (87.4%) are enrolled in public schools. The age group of 18 to 19 year olds has the highest likelihood of being enrolled in private schools, with 73 (41.9% in the age bracket) enrolled. Conversely, the age group of 3 to 4 year olds has the lowest likelihood of being enrolled in a private school, with 119 (100.0% in the age bracket) attending a public institution.
| Age Bracket | Public School | Private School |
| 3 to 4 Year Olds | 119 (100.0%) | 0 (0.0%) |
| 5 to 9 Year Old | 687 (87.1%) | 102 (12.9%) |
| 10 to 14 Year Olds | 469 (90.2%) | 51 (9.8%) |
| 15 to 17 Year Olds | 345 (83.1%) | 70 (16.9%) |
| 18 to 19 Year Olds | 101 (58.1%) | 73 (41.9%) |
| 20 to 24 Year Olds | 130 (87.8%) | 18 (12.2%) |
| 25 to 34 Year Olds | 245 (100.0%) | 0 (0.0%) |
| 35 Years and over | 135 (94.4%) | 8 (5.6%) |
| Total | 2,231 (87.4%) | 322 (12.6%) |
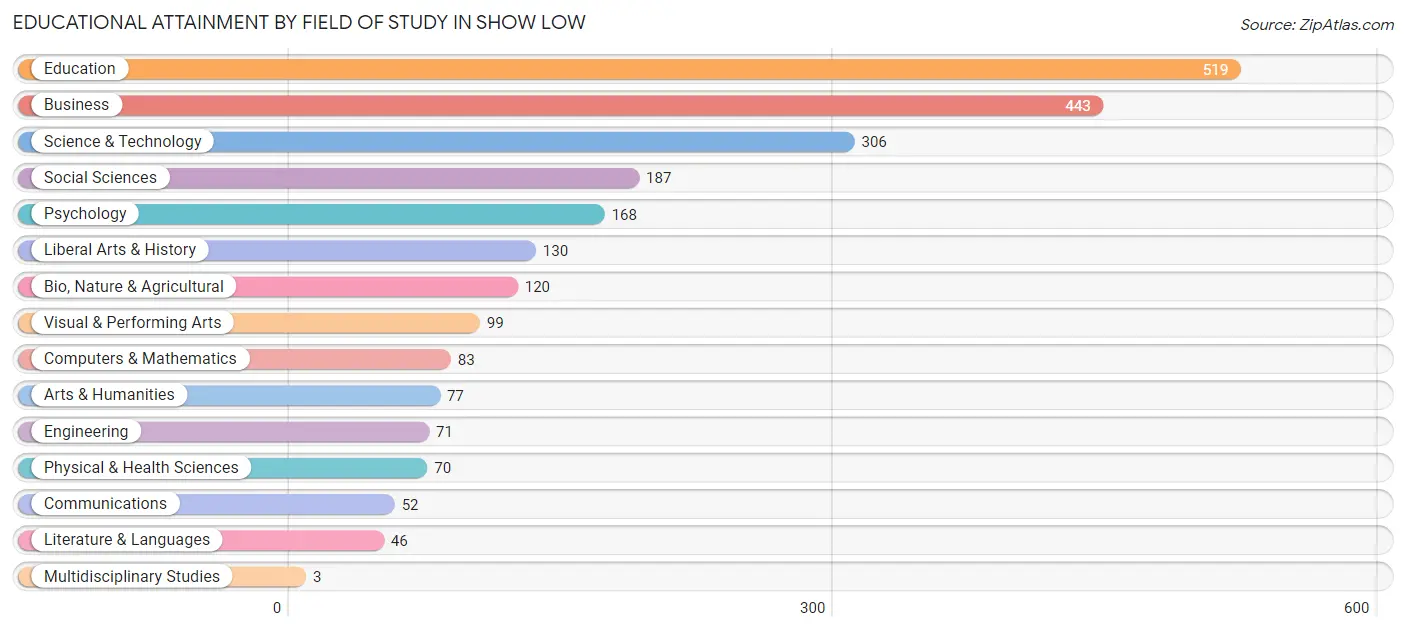
Educational Attainment by Field of Study in Show Low
Education (519 | 21.9%), business (443 | 18.7%), science & technology (306 | 12.9%), social sciences (187 | 7.9%), and psychology (168 | 7.1%) are the most common fields of study among 2,374 individuals in Show Low who have obtained a bachelor's degree or higher.
| Field of Study | # Graduates | % Graduates |
| Computers & Mathematics | 83 | 3.5% |
| Bio, Nature & Agricultural | 120 | 5.1% |
| Physical & Health Sciences | 70 | 2.9% |
| Psychology | 168 | 7.1% |
| Social Sciences | 187 | 7.9% |
| Engineering | 71 | 3.0% |
| Multidisciplinary Studies | 3 | 0.1% |
| Science & Technology | 306 | 12.9% |
| Business | 443 | 18.7% |
| Education | 519 | 21.9% |
| Literature & Languages | 46 | 1.9% |
| Liberal Arts & History | 130 | 5.5% |
| Visual & Performing Arts | 99 | 4.2% |
| Communications | 52 | 2.2% |
| Arts & Humanities | 77 | 3.2% |
| Total | 2,374 | 100.0% |
Transportation & Commute in Show Low
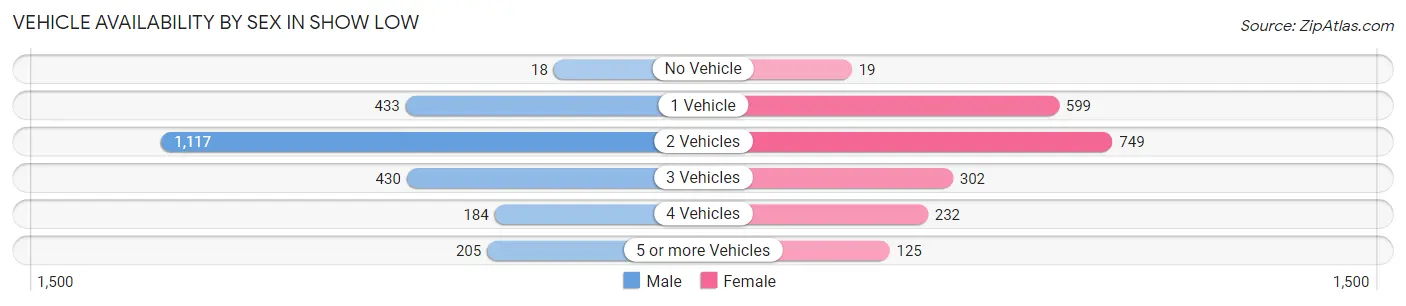
Vehicle Availability by Sex in Show Low
The most prevalent vehicle ownership categories in Show Low are males with 2 vehicles (1,117, accounting for 46.8%) and females with 2 vehicles (749, making up 55.1%).
| Vehicles Available | Male | Female |
| No Vehicle | 18 (0.7%) | 19 (0.9%) |
| 1 Vehicle | 433 (18.1%) | 599 (29.6%) |
| 2 Vehicles | 1,117 (46.8%) | 749 (37.0%) |
| 3 Vehicles | 430 (18.0%) | 302 (14.9%) |
| 4 Vehicles | 184 (7.7%) | 232 (11.5%) |
| 5 or more Vehicles | 205 (8.6%) | 125 (6.2%) |
| Total | 2,387 (100.0%) | 2,026 (100.0%) |
Commute Time in Show Low
The most frequently occuring commute durations in Show Low are 10 to 14 minutes (1,070 commuters, 26.1%), 5 to 9 minutes (829 commuters, 20.2%), and 30 to 34 minutes (718 commuters, 17.5%).
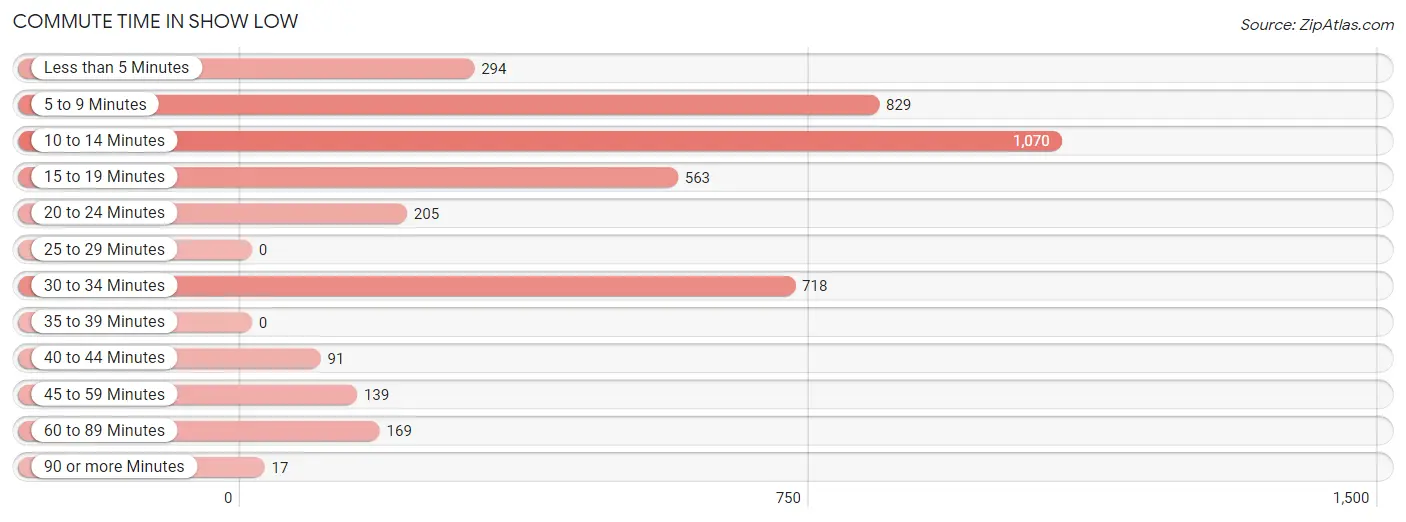
| Commute Time | # Commuters | % Commuters |
| Less than 5 Minutes | 294 | 7.2% |
| 5 to 9 Minutes | 829 | 20.2% |
| 10 to 14 Minutes | 1,070 | 26.1% |
| 15 to 19 Minutes | 563 | 13.8% |
| 20 to 24 Minutes | 205 | 5.0% |
| 25 to 29 Minutes | 0 | 0.0% |
| 30 to 34 Minutes | 718 | 17.5% |
| 35 to 39 Minutes | 0 | 0.0% |
| 40 to 44 Minutes | 91 | 2.2% |
| 45 to 59 Minutes | 139 | 3.4% |
| 60 to 89 Minutes | 169 | 4.1% |
| 90 or more Minutes | 17 | 0.4% |
Commute Time by Sex in Show Low
The most common commute times in Show Low are 5 to 9 minutes (525 commuters, 23.5%) for males and 10 to 14 minutes (580 commuters, 31.1%) for females.
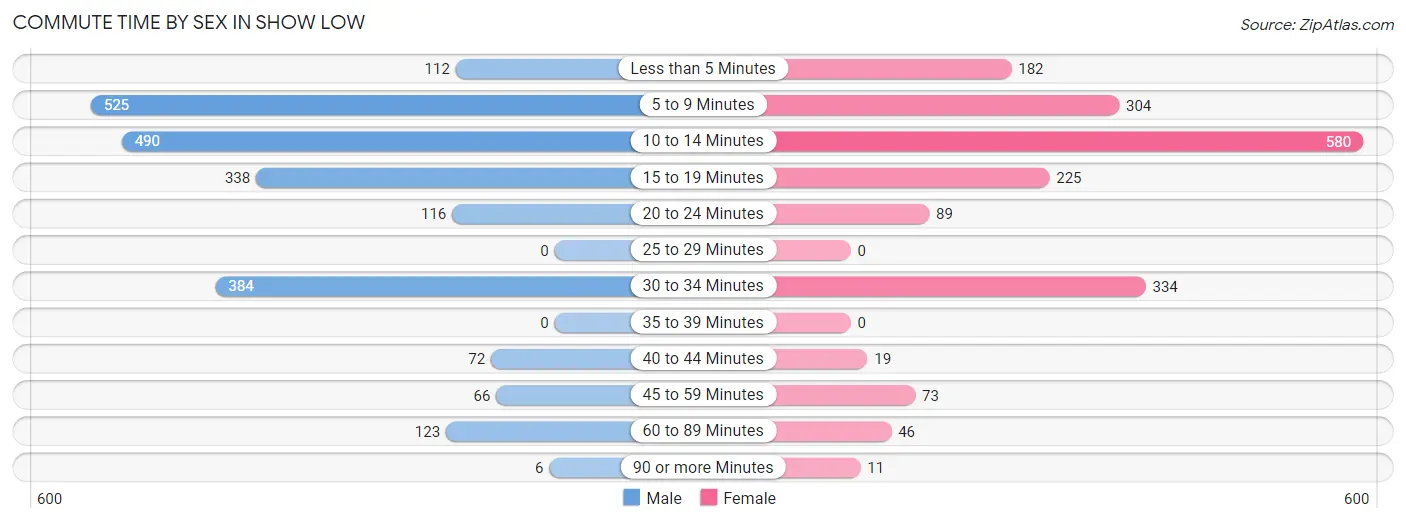
| Commute Time | Male | Female |
| Less than 5 Minutes | 112 (5.0%) | 182 (9.8%) |
| 5 to 9 Minutes | 525 (23.5%) | 304 (16.3%) |
| 10 to 14 Minutes | 490 (22.0%) | 580 (31.1%) |
| 15 to 19 Minutes | 338 (15.1%) | 225 (12.1%) |
| 20 to 24 Minutes | 116 (5.2%) | 89 (4.8%) |
| 25 to 29 Minutes | 0 (0.0%) | 0 (0.0%) |
| 30 to 34 Minutes | 384 (17.2%) | 334 (17.9%) |
| 35 to 39 Minutes | 0 (0.0%) | 0 (0.0%) |
| 40 to 44 Minutes | 72 (3.2%) | 19 (1.0%) |
| 45 to 59 Minutes | 66 (3.0%) | 73 (3.9%) |
| 60 to 89 Minutes | 123 (5.5%) | 46 (2.5%) |
| 90 or more Minutes | 6 (0.3%) | 11 (0.6%) |
Time of Departure to Work by Sex in Show Low
The most frequent times of departure to work in Show Low are 7:00 AM to 7:29 AM (472, 21.1%) for males and 7:30 AM to 7:59 AM (552, 29.6%) for females.
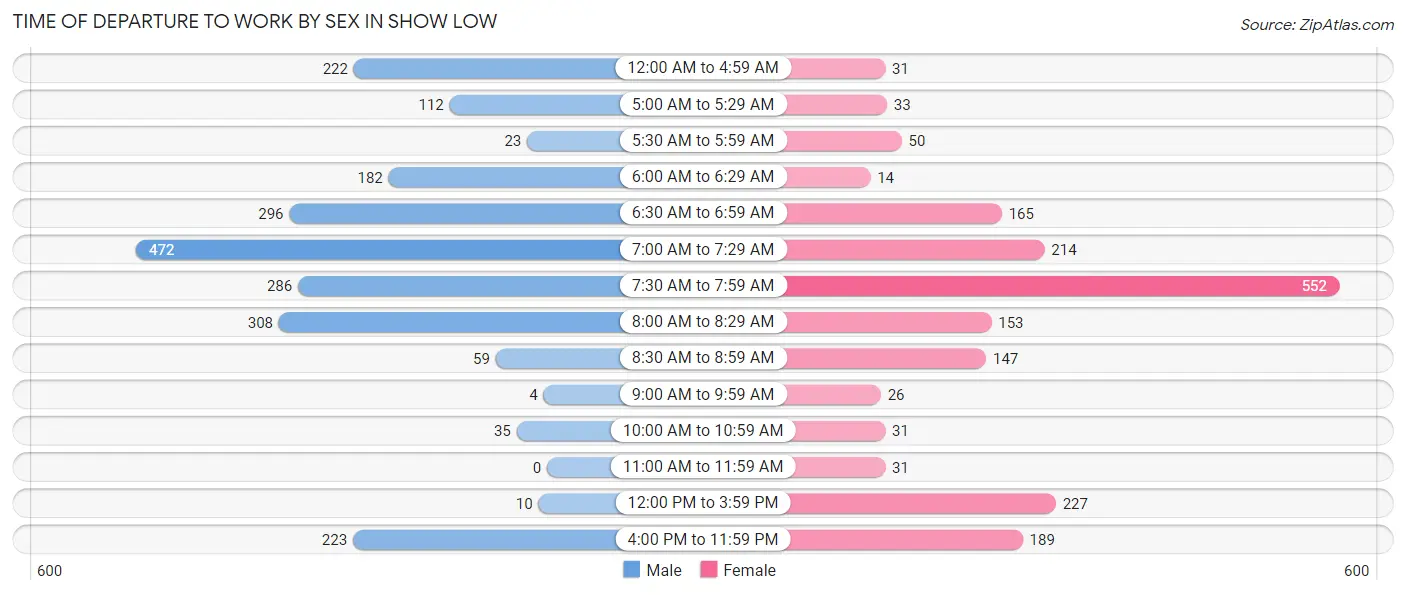
| Time of Departure | Male | Female |
| 12:00 AM to 4:59 AM | 222 (10.0%) | 31 (1.7%) |
| 5:00 AM to 5:29 AM | 112 (5.0%) | 33 (1.8%) |
| 5:30 AM to 5:59 AM | 23 (1.0%) | 50 (2.7%) |
| 6:00 AM to 6:29 AM | 182 (8.2%) | 14 (0.7%) |
| 6:30 AM to 6:59 AM | 296 (13.3%) | 165 (8.9%) |
| 7:00 AM to 7:29 AM | 472 (21.1%) | 214 (11.5%) |
| 7:30 AM to 7:59 AM | 286 (12.8%) | 552 (29.6%) |
| 8:00 AM to 8:29 AM | 308 (13.8%) | 153 (8.2%) |
| 8:30 AM to 8:59 AM | 59 (2.6%) | 147 (7.9%) |
| 9:00 AM to 9:59 AM | 4 (0.2%) | 26 (1.4%) |
| 10:00 AM to 10:59 AM | 35 (1.6%) | 31 (1.7%) |
| 11:00 AM to 11:59 AM | 0 (0.0%) | 31 (1.7%) |
| 12:00 PM to 3:59 PM | 10 (0.4%) | 227 (12.2%) |
| 4:00 PM to 11:59 PM | 223 (10.0%) | 189 (10.1%) |
| Total | 2,232 (100.0%) | 1,863 (100.0%) |
Housing Occupancy in Show Low
Occupancy by Ownership in Show Low
Of the total 4,806 dwellings in Show Low, owner-occupied units account for 3,265 (67.9%), while renter-occupied units make up 1,541 (32.1%).
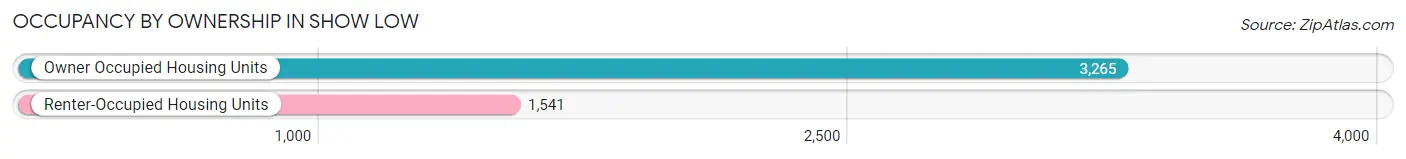
| Occupancy | # Housing Units | % Housing Units |
| Owner Occupied Housing Units | 3,265 | 67.9% |
| Renter-Occupied Housing Units | 1,541 | 32.1% |
| Total Occupied Housing Units | 4,806 | 100.0% |
Occupancy by Household Size in Show Low
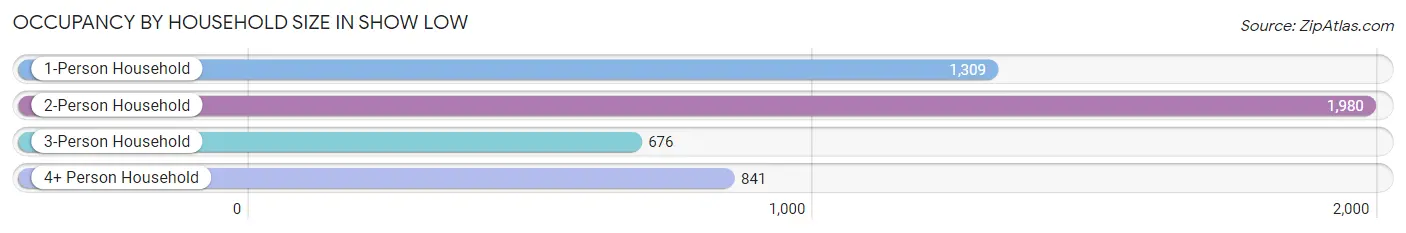
| Household Size | # Housing Units | % Housing Units |
| 1-Person Household | 1,309 | 27.2% |
| 2-Person Household | 1,980 | 41.2% |
| 3-Person Household | 676 | 14.1% |
| 4+ Person Household | 841 | 17.5% |
| Total Housing Units | 4,806 | 100.0% |
Occupancy by Ownership by Household Size in Show Low
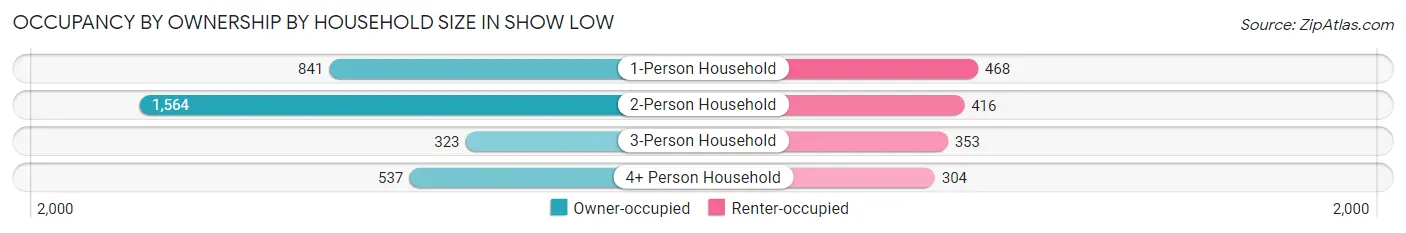
| Household Size | Owner-occupied | Renter-occupied |
| 1-Person Household | 841 (64.2%) | 468 (35.7%) |
| 2-Person Household | 1,564 (79.0%) | 416 (21.0%) |
| 3-Person Household | 323 (47.8%) | 353 (52.2%) |
| 4+ Person Household | 537 (63.8%) | 304 (36.1%) |
| Total Housing Units | 3,265 (67.9%) | 1,541 (32.1%) |
Occupancy by Educational Attainment in Show Low
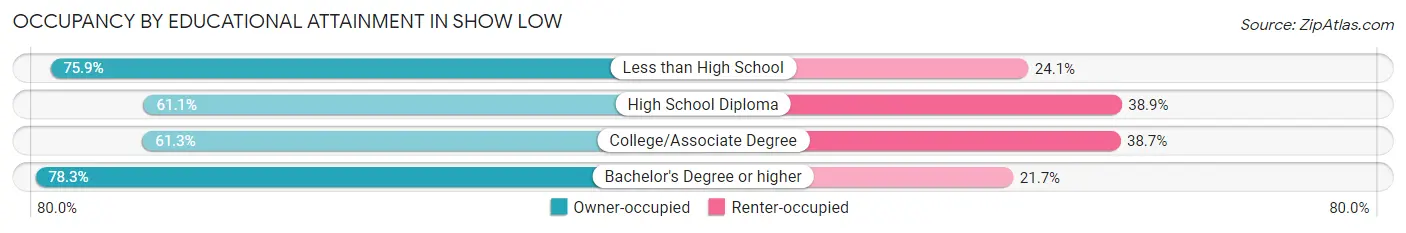
| Household Size | Owner-occupied | Renter-occupied |
| Less than High School | 164 (75.9%) | 52 (24.1%) |
| High School Diploma | 624 (61.1%) | 397 (38.9%) |
| College/Associate Degree | 1,148 (61.3%) | 724 (38.7%) |
| Bachelor's Degree or higher | 1,329 (78.3%) | 368 (21.7%) |
Occupancy by Age of Householder in Show Low
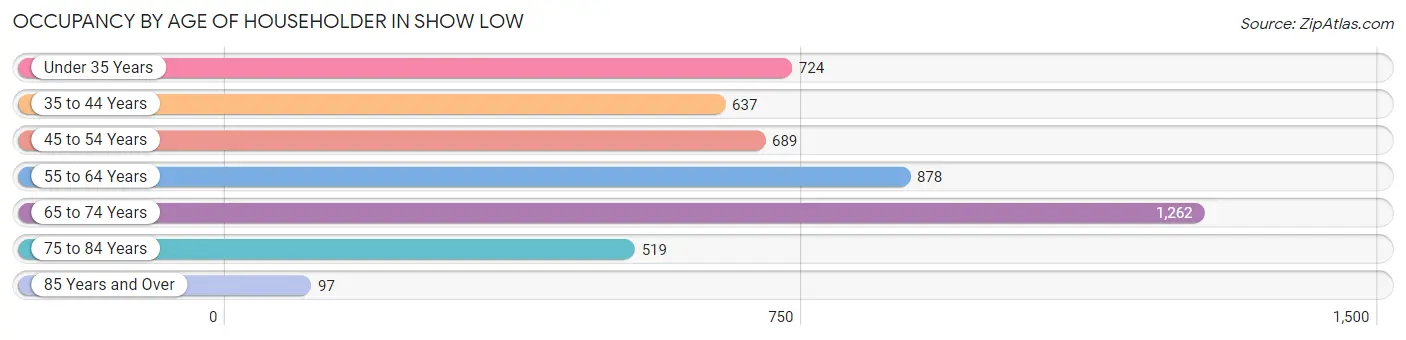
| Age Bracket | # Households | % Households |
| Under 35 Years | 724 | 15.1% |
| 35 to 44 Years | 637 | 13.3% |
| 45 to 54 Years | 689 | 14.3% |
| 55 to 64 Years | 878 | 18.3% |
| 65 to 74 Years | 1,262 | 26.3% |
| 75 to 84 Years | 519 | 10.8% |
| 85 Years and Over | 97 | 2.0% |
| Total | 4,806 | 100.0% |
Housing Finances in Show Low
Median Income by Occupancy in Show Low
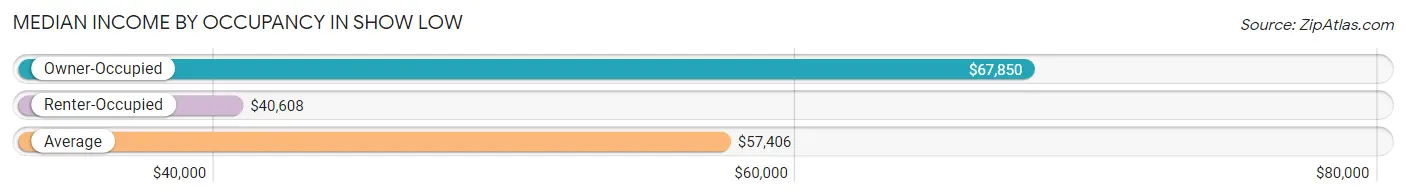
| Occupancy Type | # Households | Median Income |
| Owner-Occupied | 3,265 (67.9%) | $67,850 |
| Renter-Occupied | 1,541 (32.1%) | $40,608 |
| Average | 4,806 (100.0%) | $57,406 |
Occupancy by Householder Income Bracket in Show Low
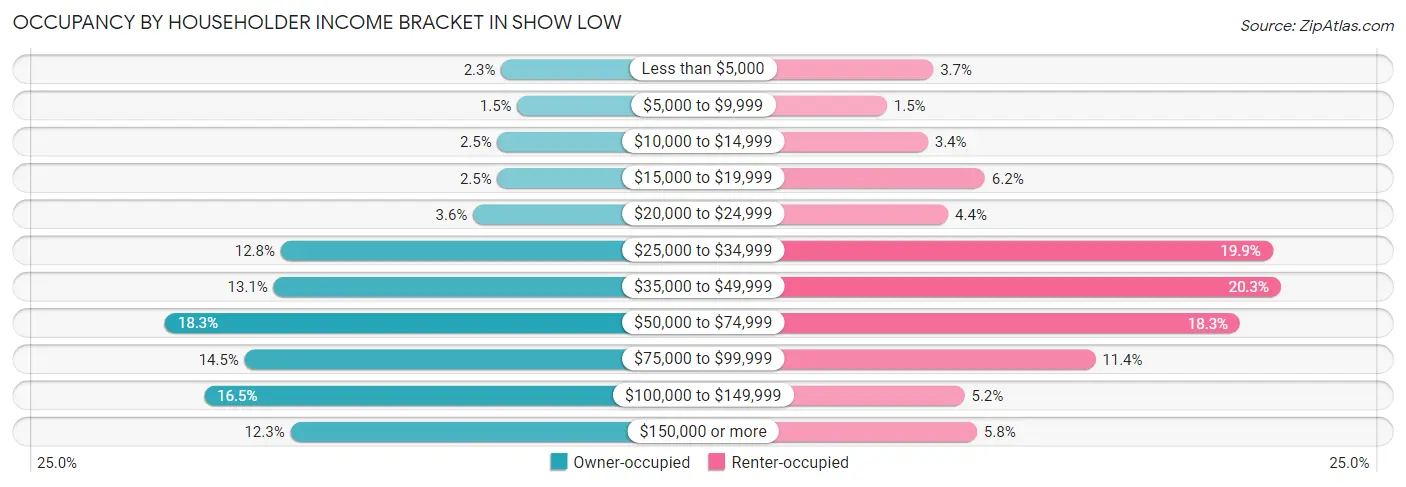
| Income Bracket | Owner-occupied | Renter-occupied |
| Less than $5,000 | 75 (2.3%) | 57 (3.7%) |
| $5,000 to $9,999 | 50 (1.5%) | 23 (1.5%) |
| $10,000 to $14,999 | 81 (2.5%) | 53 (3.4%) |
| $15,000 to $19,999 | 81 (2.5%) | 95 (6.2%) |
| $20,000 to $24,999 | 119 (3.6%) | 68 (4.4%) |
| $25,000 to $34,999 | 418 (12.8%) | 306 (19.9%) |
| $35,000 to $49,999 | 429 (13.1%) | 312 (20.3%) |
| $50,000 to $74,999 | 598 (18.3%) | 282 (18.3%) |
| $75,000 to $99,999 | 474 (14.5%) | 176 (11.4%) |
| $100,000 to $149,999 | 537 (16.5%) | 80 (5.2%) |
| $150,000 or more | 403 (12.3%) | 89 (5.8%) |
| Total | 3,265 (100.0%) | 1,541 (100.0%) |
Monthly Housing Cost Tiers in Show Low
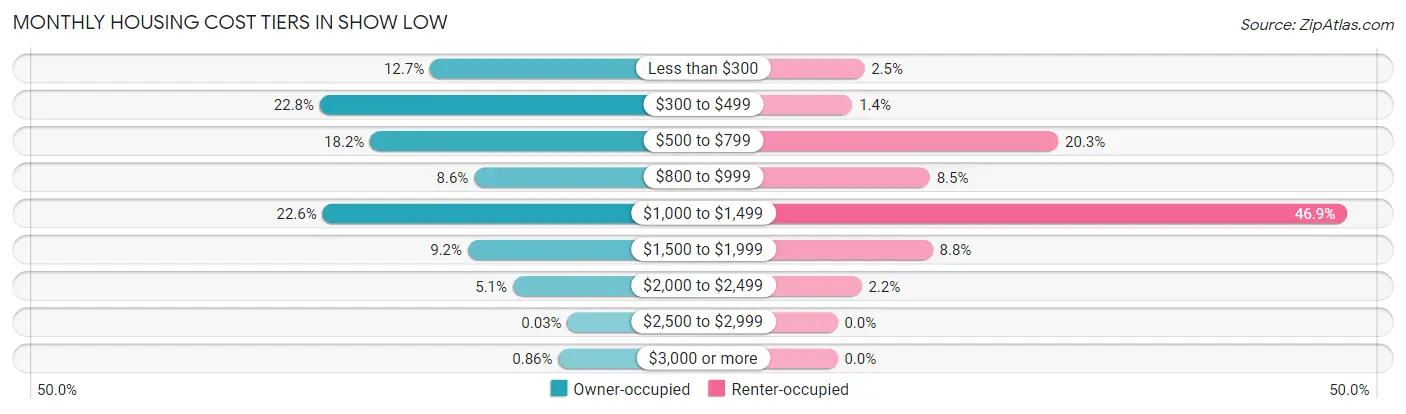
| Monthly Cost | Owner-occupied | Renter-occupied |
| Less than $300 | 414 (12.7%) | 38 (2.5%) |
| $300 to $499 | 745 (22.8%) | 21 (1.4%) |
| $500 to $799 | 594 (18.2%) | 313 (20.3%) |
| $800 to $999 | 281 (8.6%) | 131 (8.5%) |
| $1,000 to $1,499 | 737 (22.6%) | 723 (46.9%) |
| $1,500 to $1,999 | 300 (9.2%) | 135 (8.8%) |
| $2,000 to $2,499 | 165 (5.1%) | 34 (2.2%) |
| $2,500 to $2,999 | 1 (0.0%) | 0 (0.0%) |
| $3,000 or more | 28 (0.9%) | 0 (0.0%) |
| Total | 3,265 (100.0%) | 1,541 (100.0%) |
Physical Housing Characteristics in Show Low
Housing Structures in Show Low
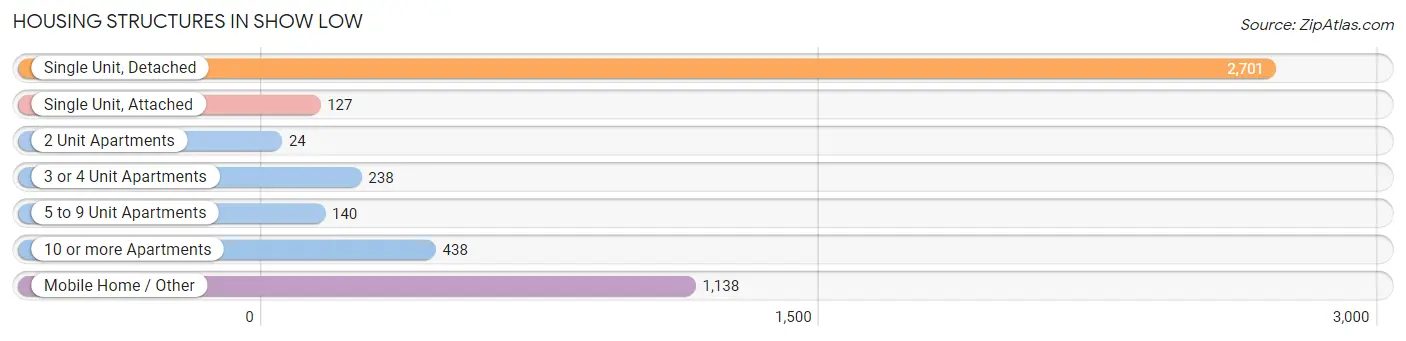
| Structure Type | # Housing Units | % Housing Units |
| Single Unit, Detached | 2,701 | 56.2% |
| Single Unit, Attached | 127 | 2.6% |
| 2 Unit Apartments | 24 | 0.5% |
| 3 or 4 Unit Apartments | 238 | 5.0% |
| 5 to 9 Unit Apartments | 140 | 2.9% |
| 10 or more Apartments | 438 | 9.1% |
| Mobile Home / Other | 1,138 | 23.7% |
| Total | 4,806 | 100.0% |
Housing Structures by Occupancy in Show Low
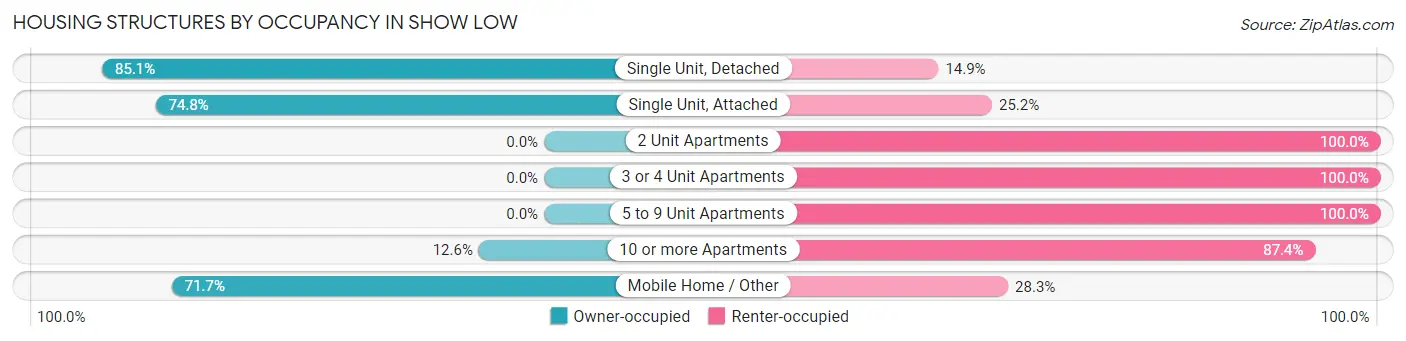
| Structure Type | Owner-occupied | Renter-occupied |
| Single Unit, Detached | 2,299 (85.1%) | 402 (14.9%) |
| Single Unit, Attached | 95 (74.8%) | 32 (25.2%) |
| 2 Unit Apartments | 0 (0.0%) | 24 (100.0%) |
| 3 or 4 Unit Apartments | 0 (0.0%) | 238 (100.0%) |
| 5 to 9 Unit Apartments | 0 (0.0%) | 140 (100.0%) |
| 10 or more Apartments | 55 (12.6%) | 383 (87.4%) |
| Mobile Home / Other | 816 (71.7%) | 322 (28.3%) |
| Total | 3,265 (67.9%) | 1,541 (32.1%) |
Housing Structures by Number of Rooms in Show Low
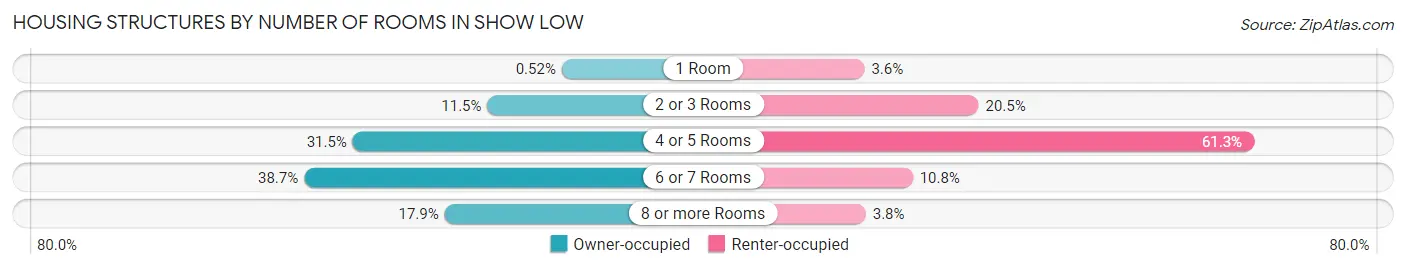
| Number of Rooms | Owner-occupied | Renter-occupied |
| 1 Room | 17 (0.5%) | 56 (3.6%) |
| 2 or 3 Rooms | 376 (11.5%) | 316 (20.5%) |
| 4 or 5 Rooms | 1,027 (31.5%) | 944 (61.3%) |
| 6 or 7 Rooms | 1,262 (38.7%) | 166 (10.8%) |
| 8 or more Rooms | 583 (17.9%) | 59 (3.8%) |
| Total | 3,265 (100.0%) | 1,541 (100.0%) |
Housing Structure by Heating Type in Show Low
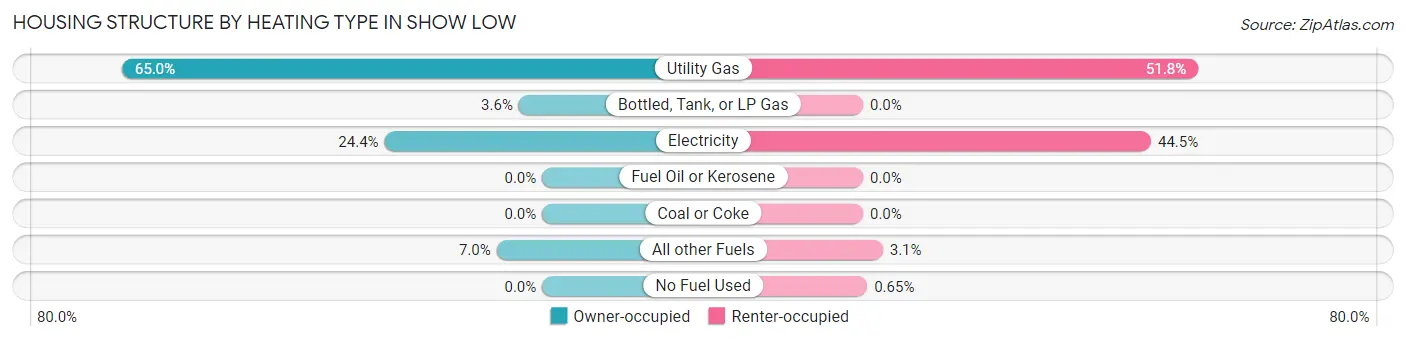
| Heating Type | Owner-occupied | Renter-occupied |
| Utility Gas | 2,121 (65.0%) | 798 (51.8%) |
| Bottled, Tank, or LP Gas | 118 (3.6%) | 0 (0.0%) |
| Electricity | 796 (24.4%) | 686 (44.5%) |
| Fuel Oil or Kerosene | 0 (0.0%) | 0 (0.0%) |
| Coal or Coke | 0 (0.0%) | 0 (0.0%) |
| All other Fuels | 230 (7.0%) | 47 (3.0%) |
| No Fuel Used | 0 (0.0%) | 10 (0.6%) |
| Total | 3,265 (100.0%) | 1,541 (100.0%) |
Household Vehicle Usage in Show Low
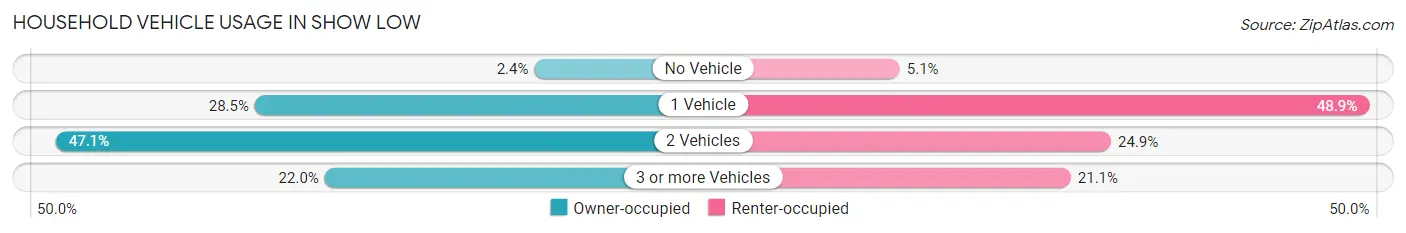
| Vehicles per Household | Owner-occupied | Renter-occupied |
| No Vehicle | 79 (2.4%) | 79 (5.1%) |
| 1 Vehicle | 931 (28.5%) | 754 (48.9%) |
| 2 Vehicles | 1,537 (47.1%) | 383 (24.8%) |
| 3 or more Vehicles | 718 (22.0%) | 325 (21.1%) |
| Total | 3,265 (100.0%) | 1,541 (100.0%) |
Real Estate & Mortgages in Show Low
Real Estate and Mortgage Overview in Show Low
| Characteristic | Without Mortgage | With Mortgage |
| Housing Units | 1,765 | 1,500 |
| Median Property Value | $216,800 | $267,700 |
| Median Household Income | $60,636 | $199 |
| Monthly Housing Costs | $403 | $28 |
| Real Estate Taxes | $1,188 | $36 |
Property Value by Mortgage Status in Show Low
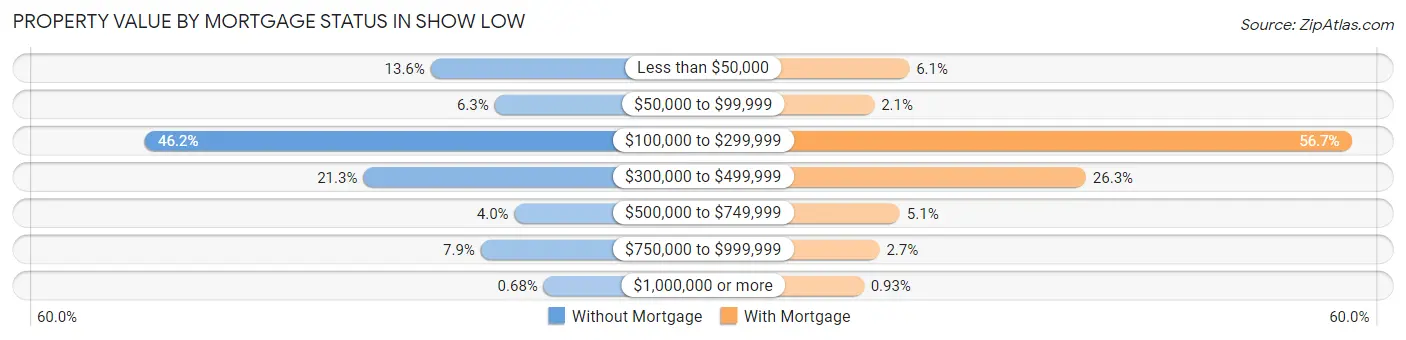
| Property Value | Without Mortgage | With Mortgage |
| Less than $50,000 | 240 (13.6%) | 92 (6.1%) |
| $50,000 to $99,999 | 111 (6.3%) | 32 (2.1%) |
| $100,000 to $299,999 | 816 (46.2%) | 850 (56.7%) |
| $300,000 to $499,999 | 376 (21.3%) | 395 (26.3%) |
| $500,000 to $749,999 | 71 (4.0%) | 76 (5.1%) |
| $750,000 to $999,999 | 139 (7.9%) | 41 (2.7%) |
| $1,000,000 or more | 12 (0.7%) | 14 (0.9%) |
| Total | 1,765 (100.0%) | 1,500 (100.0%) |
Household Income by Mortgage Status in Show Low
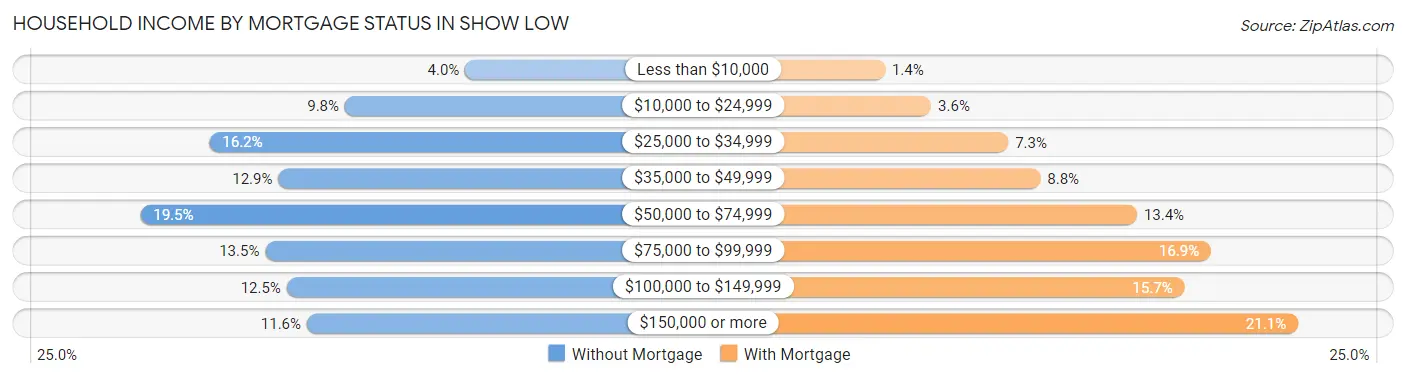
| Household Income | Without Mortgage | With Mortgage |
| Less than $10,000 | 71 (4.0%) | 21 (1.4%) |
| $10,000 to $24,999 | 172 (9.8%) | 54 (3.6%) |
| $25,000 to $34,999 | 286 (16.2%) | 109 (7.3%) |
| $35,000 to $49,999 | 228 (12.9%) | 132 (8.8%) |
| $50,000 to $74,999 | 344 (19.5%) | 201 (13.4%) |
| $75,000 to $99,999 | 239 (13.5%) | 254 (16.9%) |
| $100,000 to $149,999 | 221 (12.5%) | 235 (15.7%) |
| $150,000 or more | 204 (11.6%) | 316 (21.1%) |
| Total | 1,765 (100.0%) | 1,500 (100.0%) |
Property Value to Household Income Ratio in Show Low
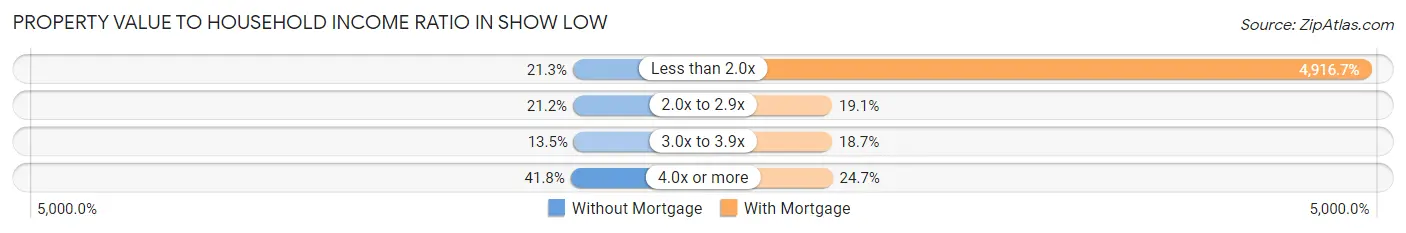
| Value-to-Income Ratio | Without Mortgage | With Mortgage |
| Less than 2.0x | 376 (21.3%) | 73,750 (4,916.7%) |
| 2.0x to 2.9x | 374 (21.2%) | 286 (19.1%) |
| 3.0x to 3.9x | 239 (13.5%) | 280 (18.7%) |
| 4.0x or more | 737 (41.8%) | 370 (24.7%) |
| Total | 1,765 (100.0%) | 1,500 (100.0%) |
Real Estate Taxes by Mortgage Status in Show Low
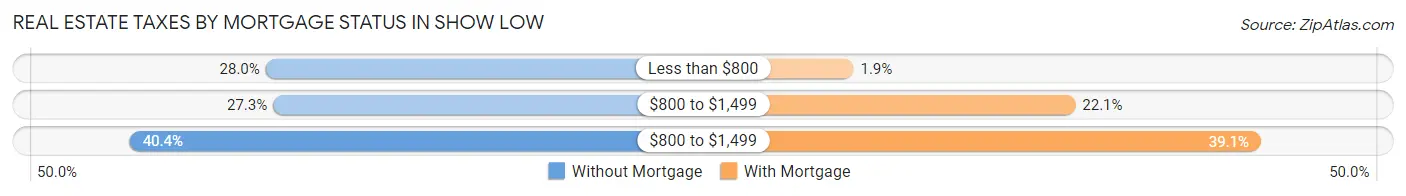
| Property Taxes | Without Mortgage | With Mortgage |
| Less than $800 | 494 (28.0%) | 28 (1.9%) |
| $800 to $1,499 | 482 (27.3%) | 332 (22.1%) |
| $800 to $1,499 | 713 (40.4%) | 586 (39.1%) |
| Total | 1,765 (100.0%) | 1,500 (100.0%) |
Health & Disability in Show Low
Health Insurance Coverage by Age in Show Low
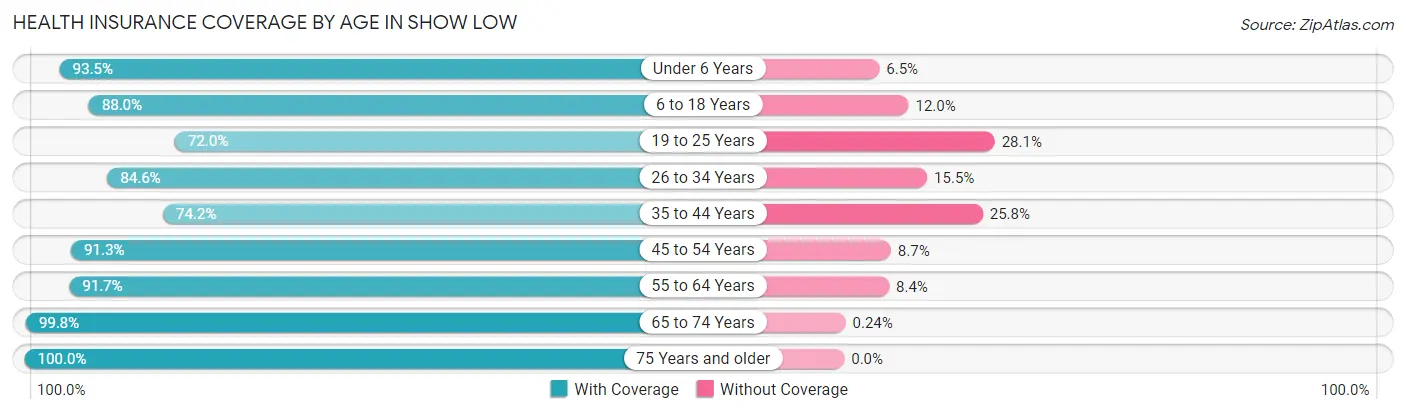
| Age Bracket | With Coverage | Without Coverage |
| Under 6 Years | 858 (93.5%) | 60 (6.5%) |
| 6 to 18 Years | 1,564 (88.0%) | 213 (12.0%) |
| 19 to 25 Years | 813 (72.0%) | 317 (28.1%) |
| 26 to 34 Years | 821 (84.6%) | 150 (15.4%) |
| 35 to 44 Years | 959 (74.2%) | 334 (25.8%) |
| 45 to 54 Years | 1,135 (91.3%) | 108 (8.7%) |
| 55 to 64 Years | 1,274 (91.6%) | 116 (8.4%) |
| 65 to 74 Years | 2,105 (99.8%) | 5 (0.2%) |
| 75 Years and older | 878 (100.0%) | 0 (0.0%) |
| Total | 10,407 (88.9%) | 1,303 (11.1%) |
Health Insurance Coverage by Citizenship Status in Show Low
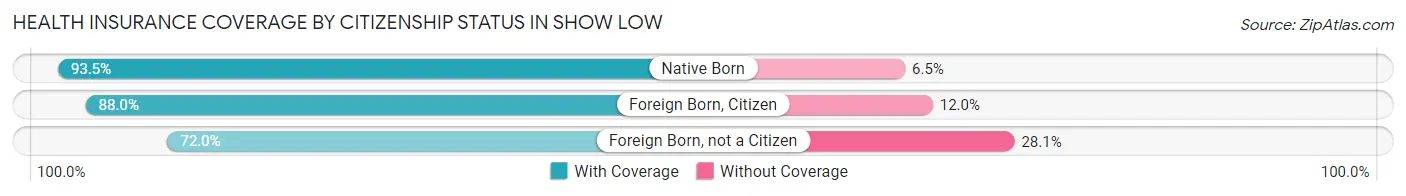
| Citizenship Status | With Coverage | Without Coverage |
| Native Born | 858 (93.5%) | 60 (6.5%) |
| Foreign Born, Citizen | 1,564 (88.0%) | 213 (12.0%) |
| Foreign Born, not a Citizen | 813 (72.0%) | 317 (28.1%) |
Health Insurance Coverage by Household Income in Show Low
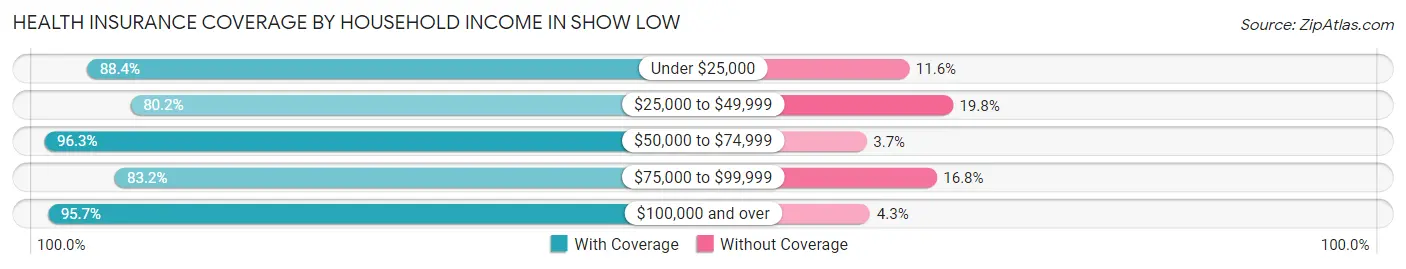
| Household Income | With Coverage | Without Coverage |
| Under $25,000 | 1,040 (88.4%) | 137 (11.6%) |
| $25,000 to $49,999 | 2,819 (80.2%) | 696 (19.8%) |
| $50,000 to $74,999 | 2,419 (96.3%) | 92 (3.7%) |
| $75,000 to $99,999 | 1,225 (83.2%) | 247 (16.8%) |
| $100,000 and over | 2,892 (95.7%) | 131 (4.3%) |
Public vs Private Health Insurance Coverage by Age in Show Low
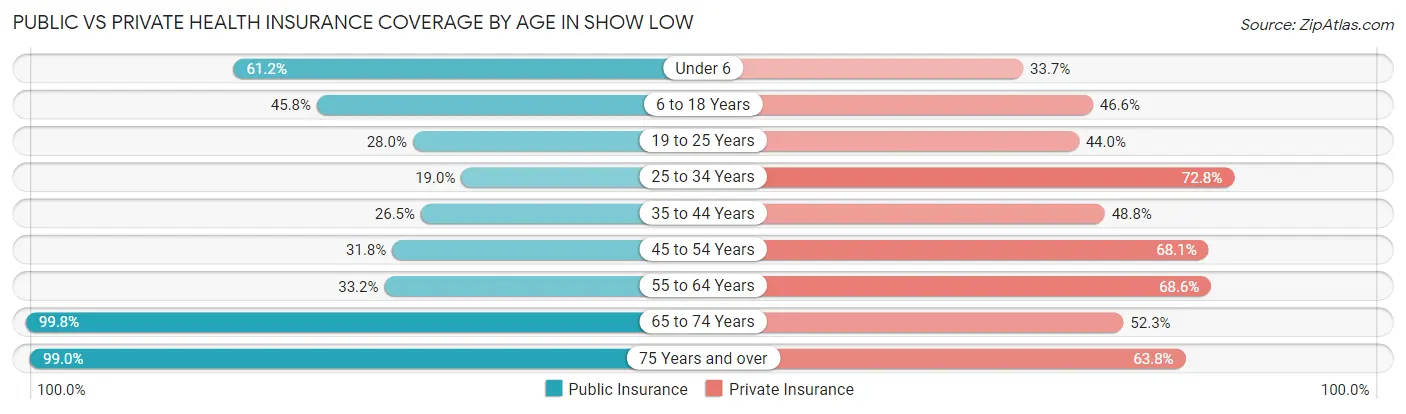
| Age Bracket | Public Insurance | Private Insurance |
| Under 6 | 562 (61.2%) | 309 (33.7%) |
| 6 to 18 Years | 813 (45.8%) | 828 (46.6%) |
| 19 to 25 Years | 316 (28.0%) | 497 (44.0%) |
| 25 to 34 Years | 184 (19.0%) | 707 (72.8%) |
| 35 to 44 Years | 342 (26.5%) | 631 (48.8%) |
| 45 to 54 Years | 395 (31.8%) | 846 (68.1%) |
| 55 to 64 Years | 462 (33.2%) | 953 (68.6%) |
| 65 to 74 Years | 2,105 (99.8%) | 1,103 (52.3%) |
| 75 Years and over | 869 (99.0%) | 560 (63.8%) |
| Total | 6,048 (51.6%) | 6,434 (54.9%) |
Disability Status by Sex by Age in Show Low
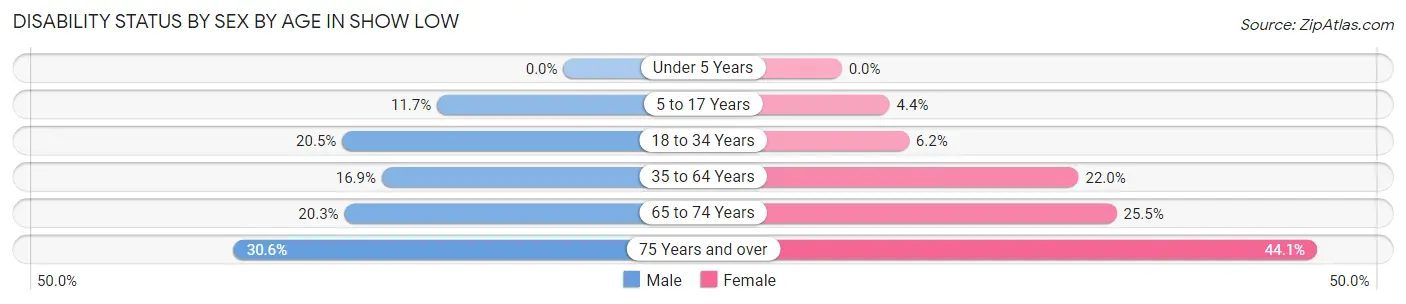
| Age Bracket | Male | Female |
| Under 5 Years | 0 (0.0%) | 0 (0.0%) |
| 5 to 17 Years | 104 (11.7%) | 40 (4.4%) |
| 18 to 34 Years | 216 (20.5%) | 71 (6.2%) |
| 35 to 64 Years | 321 (16.9%) | 444 (22.0%) |
| 65 to 74 Years | 204 (20.3%) | 282 (25.5%) |
| 75 Years and over | 152 (30.6%) | 168 (44.1%) |
Disability Class by Sex by Age in Show Low
Disability Class: Hearing Difficulty
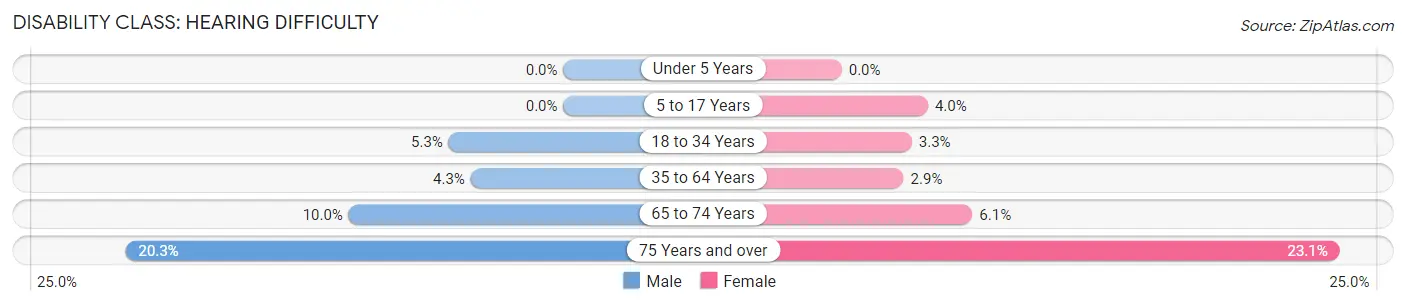
| Age Bracket | Male | Female |
| Under 5 Years | 0 (0.0%) | 0 (0.0%) |
| 5 to 17 Years | 0 (0.0%) | 36 (4.0%) |
| 18 to 34 Years | 56 (5.3%) | 37 (3.3%) |
| 35 to 64 Years | 82 (4.3%) | 58 (2.9%) |
| 65 to 74 Years | 100 (10.0%) | 67 (6.1%) |
| 75 Years and over | 101 (20.3%) | 88 (23.1%) |
Disability Class: Vision Difficulty
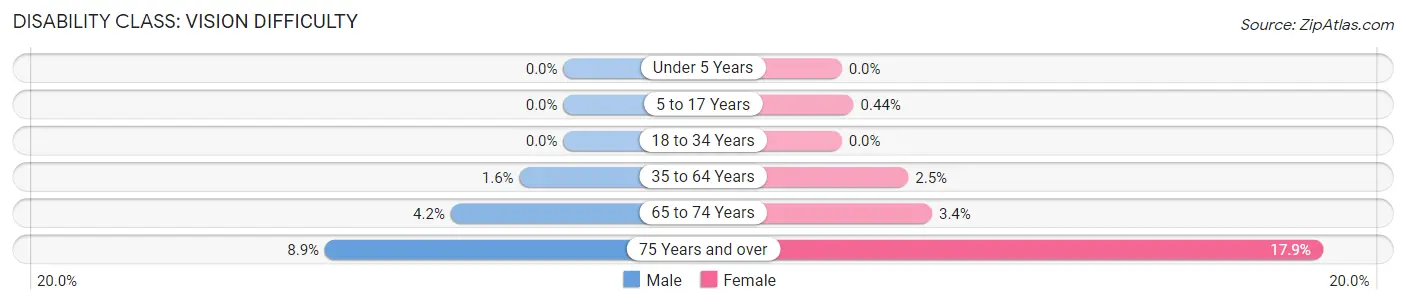
| Age Bracket | Male | Female |
| Under 5 Years | 0 (0.0%) | 0 (0.0%) |
| 5 to 17 Years | 0 (0.0%) | 4 (0.4%) |
| 18 to 34 Years | 0 (0.0%) | 0 (0.0%) |
| 35 to 64 Years | 31 (1.6%) | 50 (2.5%) |
| 65 to 74 Years | 42 (4.2%) | 37 (3.4%) |
| 75 Years and over | 44 (8.8%) | 68 (17.8%) |
Disability Class: Cognitive Difficulty
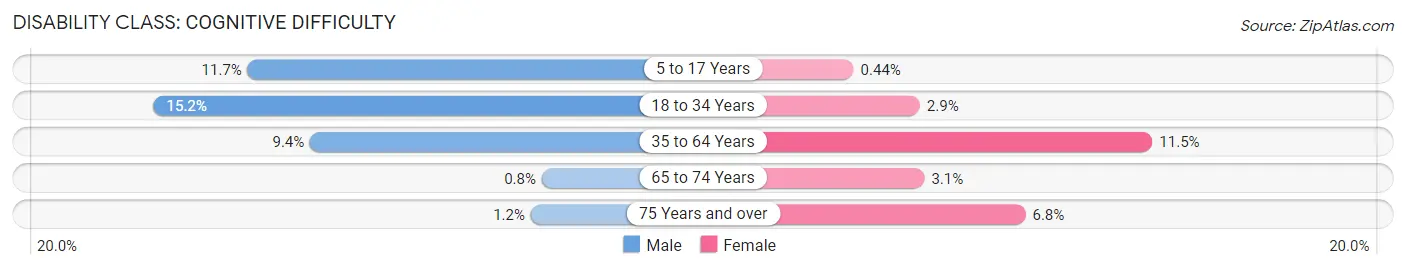
| Age Bracket | Male | Female |
| 5 to 17 Years | 104 (11.7%) | 4 (0.4%) |
| 18 to 34 Years | 160 (15.2%) | 33 (2.9%) |
| 35 to 64 Years | 179 (9.4%) | 233 (11.5%) |
| 65 to 74 Years | 8 (0.8%) | 34 (3.1%) |
| 75 Years and over | 6 (1.2%) | 26 (6.8%) |
Disability Class: Ambulatory Difficulty
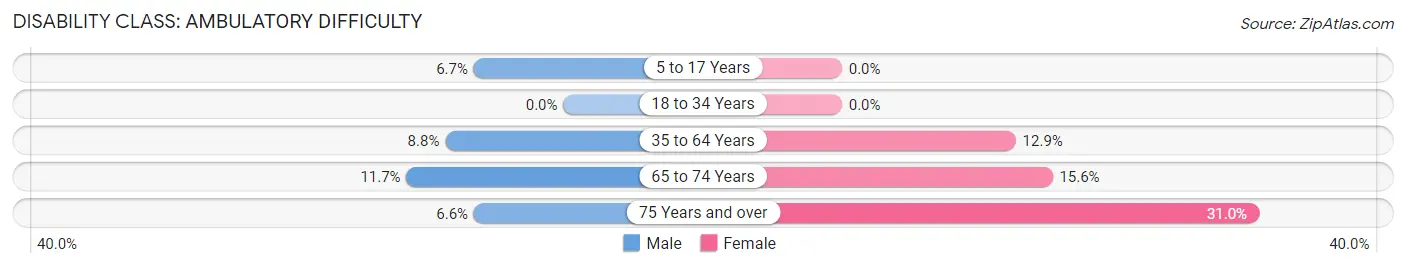
| Age Bracket | Male | Female |
| 5 to 17 Years | 59 (6.7%) | 0 (0.0%) |
| 18 to 34 Years | 0 (0.0%) | 0 (0.0%) |
| 35 to 64 Years | 167 (8.8%) | 261 (12.9%) |
| 65 to 74 Years | 117 (11.7%) | 173 (15.6%) |
| 75 Years and over | 33 (6.6%) | 118 (31.0%) |
Disability Class: Self-Care Difficulty
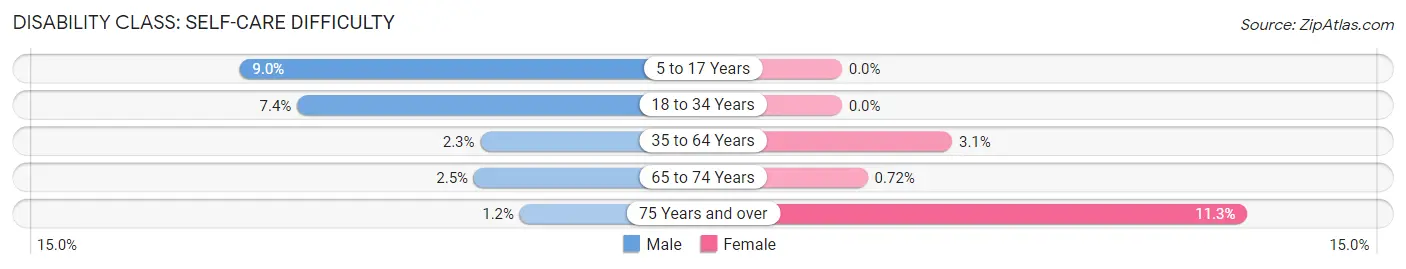
| Age Bracket | Male | Female |
| 5 to 17 Years | 80 (9.0%) | 0 (0.0%) |
| 18 to 34 Years | 78 (7.4%) | 0 (0.0%) |
| 35 to 64 Years | 44 (2.3%) | 62 (3.1%) |
| 65 to 74 Years | 25 (2.5%) | 8 (0.7%) |
| 75 Years and over | 6 (1.2%) | 43 (11.3%) |
Technology Access in Show Low
Computing Device Access in Show Low
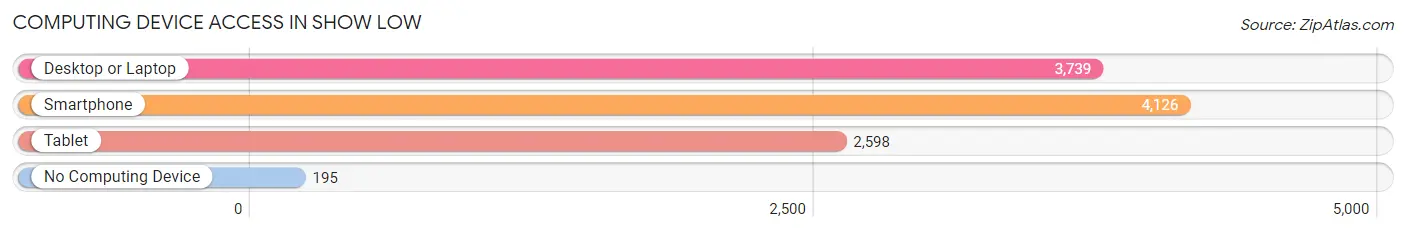
| Device Type | # Households | % Households |
| Desktop or Laptop | 3,739 | 77.8% |
| Smartphone | 4,126 | 85.9% |
| Tablet | 2,598 | 54.1% |
| No Computing Device | 195 | 4.1% |
| Total | 4,806 | 100.0% |
Internet Access in Show Low
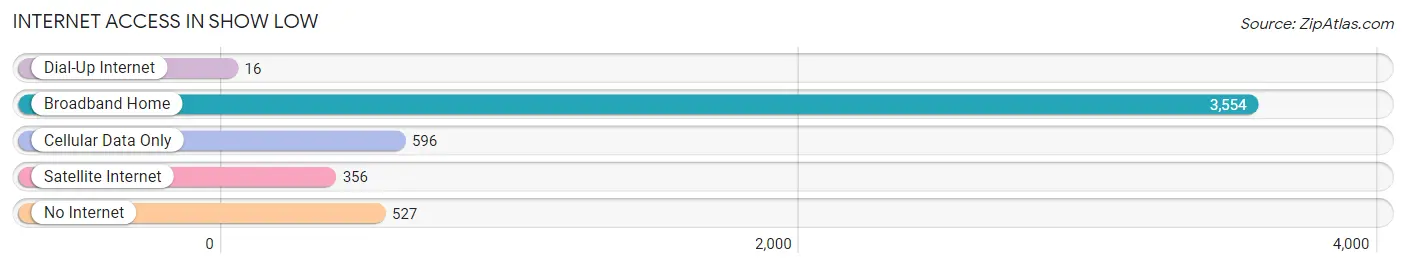
| Internet Type | # Households | % Households |
| Dial-Up Internet | 16 | 0.3% |
| Broadband Home | 3,554 | 74.0% |
| Cellular Data Only | 596 | 12.4% |
| Satellite Internet | 356 | 7.4% |
| No Internet | 527 | 11.0% |
| Total | 4,806 | 100.0% |
Show Low Summary
Show Low is a city located in Navajo County, Arizona, United States. It is situated at the junction of U.S. Route 60 and State Route 260, approximately 180 miles (290 km) northeast of Phoenix. The city was founded in 1870 by Corydon Cooley and his wife, Martha, who named it after a game of poker. The city has a population of 10,660 as of the 2010 census.
History
The area that is now Show Low was originally inhabited by the Apache and Navajo tribes. The first non-Native American settlers arrived in the area in the late 1860s. Corydon Cooley and his wife, Martha, were among the first settlers, arriving in 1870. The Cooleys named the settlement after a game of poker in which Martha won the hand with the phrase, “Show low, you lose.”
The town was officially incorporated in 1953. In the early 1960s, Show Low was a popular destination for retirees from the Midwest. The city experienced rapid growth in the 1970s and 1980s, and by the 1990s, it had become a popular tourist destination.
Geography
Show Low is located in the White Mountains region of Arizona, at an elevation of 6,400 feet (1,950 m). The city is situated at the junction of U.S. Route 60 and State Route 260, approximately 180 miles (290 km) northeast of Phoenix.
The city is surrounded by the Apache-Sitgreaves National Forest, which covers an area of 2.3 million acres (930,000 ha). The forest is home to a variety of wildlife, including elk, deer, black bear, and mountain lions.
The climate in Show Low is semi-arid, with hot summers and cold winters. The average annual temperature is 54°F (12°C), and the average annual precipitation is 17.5 inches (44 cm).
Economy
Show Low’s economy is largely based on tourism and retirement. The city is home to several resorts, golf courses, and other recreational facilities. The city is also home to a number of manufacturing and service businesses.
The city’s largest employer is the Show Low Unified School District, which employs over 1,000 people. Other major employers include the White Mountain Apache Tribe, the Show Low Regional Medical Center, and the Show Low Police Department.
Demographics
As of the 2010 census, Show Low had a population of 10,660. The racial makeup of the city was 79.2% White, 0.7% African American, 8.2% Native American, 0.7% Asian, 0.1% Pacific Islander, 8.2% from other races, and 2.9% from two or more races. Hispanic or Latino of any race were 16.7% of the population.
The median income for a household in Show Low was $37,917, and the median income for a family was $45,917. The per capita income for the city was $20,917. About 14.2% of families and 17.7% of the population were below the poverty line, including 25.2% of those under age 18 and 8.2% of those age 65 or over.
Show Low is served by the Show Low Unified School District, which includes four elementary schools, one middle school, and one high school. The city is also home to Northland Pioneer College, a two-year community college.
Common Questions
What is Per Capita Income in Show Low?
Per Capita income in Show Low is $30,745.
What is the Median Family Income in Show Low?
Median Family Income in Show Low is $65,625.
What is the Median Household income in Show Low?
Median Household Income in Show Low is $57,406.
What is Income or Wage Gap in Show Low?
Income or Wage Gap in Show Low is 11.2%.
Women in Show Low earn 88.8 cents for every dollar earned by a man.
What is Family Income Deficit in Show Low?
Family Income Deficit in Show Low is $9,759.
Families that are below poverty line in Show Low earn $9,759 less on average than the poverty threshold level.
What is Inequality or Gini Index in Show Low?
Inequality or Gini Index in Show Low is 0.43.
What is the Total Population of Show Low?
Total Population of Show Low is 11,767.
What is the Total Male Population of Show Low?
Total Male Population of Show Low is 5,789.
What is the Total Female Population of Show Low?
Total Female Population of Show Low is 5,978.
What is the Ratio of Males per 100 Females in Show Low?
There are 96.84 Males per 100 Females in Show Low.
What is the Ratio of Females per 100 Males in Show Low?
There are 103.26 Females per 100 Males in Show Low.
What is the Median Population Age in Show Low?
Median Population Age in Show Low is 43.6 Years.
What is the Average Family Size in Show Low
Average Family Size in Show Low is 2.9 People.
What is the Average Household Size in Show Low
Average Household Size in Show Low is 2.4 People.
How Large is the Labor Force in Show Low?
There are 4,742 People in the Labor Forcein in Show Low.
What is the Percentage of People in the Labor Force in Show Low?
50.2% of People are in the Labor Force in Show Low.
What is the Unemployment Rate in Show Low?
Unemployment Rate in Show Low is 6.5%.