Parker, AZ Map & Demographics
Parker Map
Parker Overview
$31,607
PER CAPITA INCOME
$74,375
AVG FAMILY INCOME
$67,566
AVG HOUSEHOLD INCOME
16.1%
WAGE / INCOME GAP [ % ]
83.9¢/ $1
WAGE / INCOME GAP [ $ ]
0.37
INEQUALITY / GINI INDEX
3,357
TOTAL POPULATION
1,740
MALE POPULATION
1,617
FEMALE POPULATION
107.61
MALES / 100 FEMALES
92.93
FEMALES / 100 MALES
38.1
MEDIAN AGE
2.7
AVG FAMILY SIZE
2.4
AVG HOUSEHOLD SIZE
1,720
LABOR FORCE [ PEOPLE ]
66.4%
PERCENT IN LABOR FORCE
4.3%
UNEMPLOYMENT RATE
Parker Zip Codes
Parker Area Codes
Income in Parker
Income Overview in Parker
Per Capita Income in Parker is $31,607, while median incomes of families and households are $74,375 and $67,566 respectively.
| Characteristic | Number | Measure |
| Per Capita Income | 3,357 | $31,607 |
| Median Family Income | 1,012 | $74,375 |
| Mean Family Income | 1,012 | $89,514 |
| Median Household Income | 1,395 | $67,566 |
| Mean Household Income | 1,395 | $78,634 |
| Income Deficit | 1,012 | $0 |
| Wage / Income Gap (%) | 3,357 | 16.06% |
| Wage / Income Gap ($) | 3,357 | 83.94¢ per $1 |
| Gini / Inequality Index | 3,357 | 0.37 |
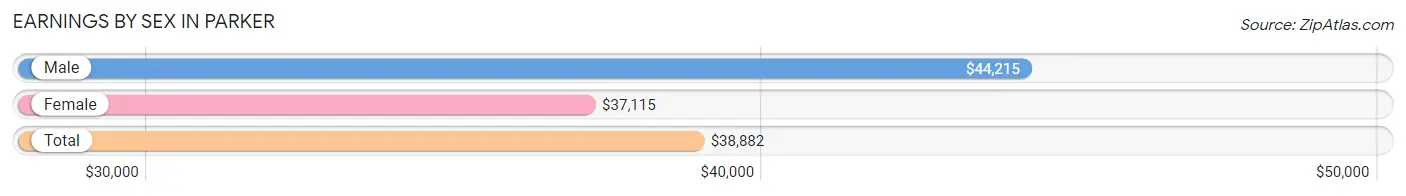
Earnings by Sex in Parker
Average Earnings in Parker are $38,882, $44,215 for men and $37,115 for women, a difference of 16.1%.
| Sex | Number | Average Earnings |
| Male | 991 (54.2%) | $44,215 |
| Female | 838 (45.8%) | $37,115 |
| Total | 1,829 (100.0%) | $38,882 |
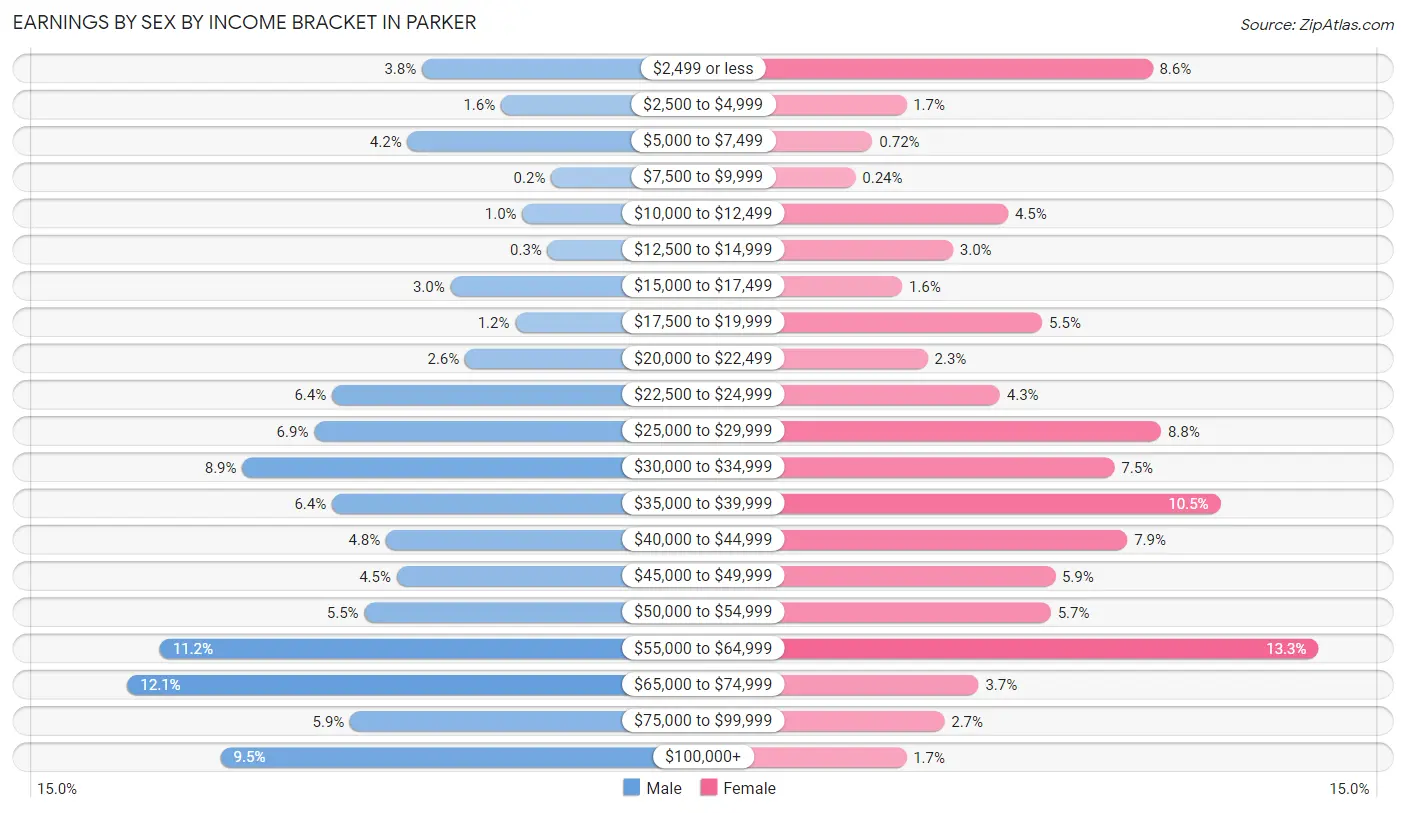
Earnings by Sex by Income Bracket in Parker
The most common earnings brackets in Parker are $65,000 to $74,999 for men (120 | 12.1%) and $55,000 to $64,999 for women (111 | 13.3%).
| Income | Male | Female |
| $2,499 or less | 38 (3.8%) | 72 (8.6%) |
| $2,500 to $4,999 | 16 (1.6%) | 14 (1.7%) |
| $5,000 to $7,499 | 42 (4.2%) | 6 (0.7%) |
| $7,500 to $9,999 | 2 (0.2%) | 2 (0.2%) |
| $10,000 to $12,499 | 10 (1.0%) | 38 (4.5%) |
| $12,500 to $14,999 | 3 (0.3%) | 25 (3.0%) |
| $15,000 to $17,499 | 30 (3.0%) | 13 (1.5%) |
| $17,500 to $19,999 | 12 (1.2%) | 46 (5.5%) |
| $20,000 to $22,499 | 26 (2.6%) | 19 (2.3%) |
| $22,500 to $24,999 | 63 (6.4%) | 36 (4.3%) |
| $25,000 to $29,999 | 68 (6.9%) | 74 (8.8%) |
| $30,000 to $34,999 | 88 (8.9%) | 63 (7.5%) |
| $35,000 to $39,999 | 63 (6.4%) | 88 (10.5%) |
| $40,000 to $44,999 | 48 (4.8%) | 66 (7.9%) |
| $45,000 to $49,999 | 45 (4.5%) | 49 (5.9%) |
| $50,000 to $54,999 | 54 (5.4%) | 48 (5.7%) |
| $55,000 to $64,999 | 111 (11.2%) | 111 (13.3%) |
| $65,000 to $74,999 | 120 (12.1%) | 31 (3.7%) |
| $75,000 to $99,999 | 58 (5.9%) | 23 (2.7%) |
| $100,000+ | 94 (9.5%) | 14 (1.7%) |
| Total | 991 (100.0%) | 838 (100.0%) |
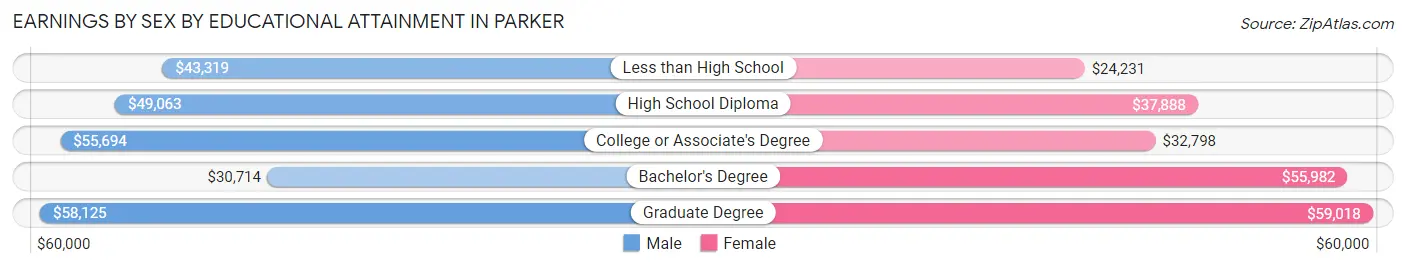
Earnings by Sex by Educational Attainment in Parker
Average earnings in Parker are $45,898 for men and $38,815 for women, a difference of 15.4%. Men with an educational attainment of graduate degree enjoy the highest average annual earnings of $58,125, while those with bachelor's degree education earn the least with $30,714. Women with an educational attainment of graduate degree earn the most with the average annual earnings of $59,018, while those with less than high school education have the smallest earnings of $24,231.
| Educational Attainment | Male Income | Female Income |
| Less than High School | $43,319 | $24,231 |
| High School Diploma | $49,063 | $37,888 |
| College or Associate's Degree | $55,694 | $32,798 |
| Bachelor's Degree | $30,714 | $55,982 |
| Graduate Degree | $58,125 | $59,018 |
| Total | $45,898 | $38,815 |
Family Income in Parker
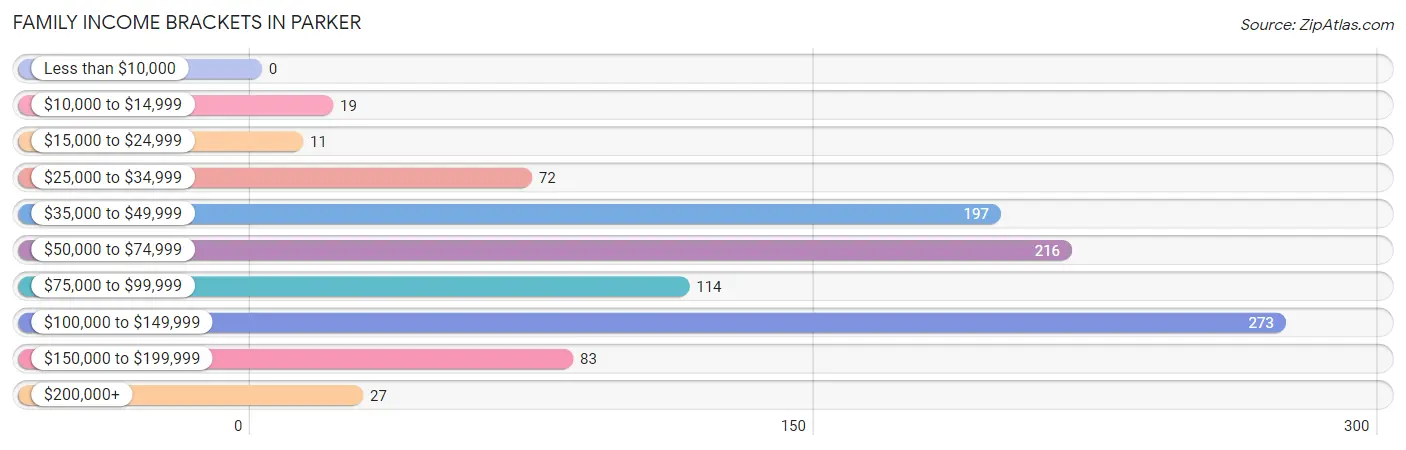
Family Income Brackets in Parker
According to the Parker family income data, there are 273 families falling into the $100,000 to $149,999 income range, which is the most common income bracket and makes up 27.0% of all families.
| Income Bracket | # Families | % Families |
| Less than $10,000 | 0 | 0.0% |
| $10,000 to $14,999 | 19 | 1.9% |
| $15,000 to $24,999 | 11 | 1.1% |
| $25,000 to $34,999 | 72 | 7.1% |
| $35,000 to $49,999 | 197 | 19.5% |
| $50,000 to $74,999 | 216 | 21.3% |
| $75,000 to $99,999 | 114 | 11.3% |
| $100,000 to $149,999 | 273 | 27.0% |
| $150,000 to $199,999 | 83 | 8.2% |
| $200,000+ | 27 | 2.7% |
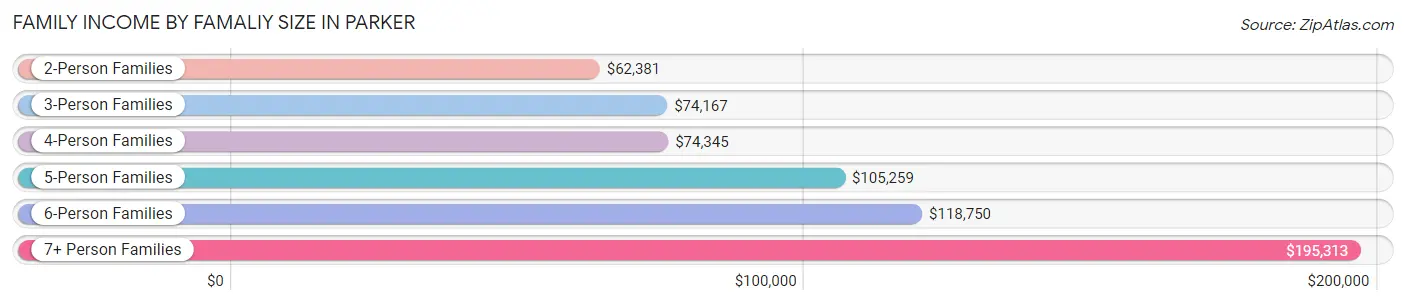
Family Income by Famaliy Size in Parker
7+ person families (28 | 2.8%) account for the highest median family income in Parker with $195,313 per family, while 2-person families (304 | 30.0%) have the highest median income of $31,190 per family member.
| Income Bracket | # Families | Median Income |
| 2-Person Families | 304 (30.0%) | $62,381 |
| 3-Person Families | 294 (29.0%) | $74,167 |
| 4-Person Families | 185 (18.3%) | $74,345 |
| 5-Person Families | 76 (7.5%) | $105,259 |
| 6-Person Families | 125 (12.3%) | $118,750 |
| 7+ Person Families | 28 (2.8%) | $195,313 |
| Total | 1,012 (100.0%) | $74,375 |
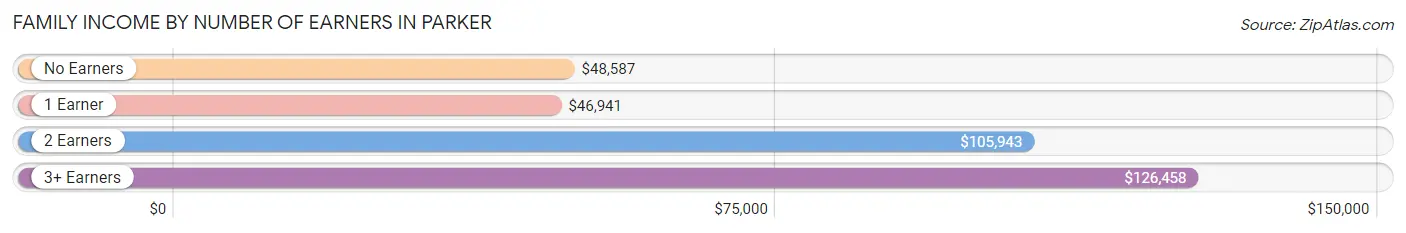
Family Income by Number of Earners in Parker
The median family income in Parker is $74,375, with families comprising 3+ earners (133) having the highest median family income of $126,458, while families with 1 earner (305) have the lowest median family income of $46,941, accounting for 13.1% and 30.1% of families, respectively.
| Number of Earners | # Families | Median Income |
| No Earners | 114 (11.3%) | $48,587 |
| 1 Earner | 305 (30.1%) | $46,941 |
| 2 Earners | 460 (45.5%) | $105,943 |
| 3+ Earners | 133 (13.1%) | $126,458 |
| Total | 1,012 (100.0%) | $74,375 |
Household Income in Parker
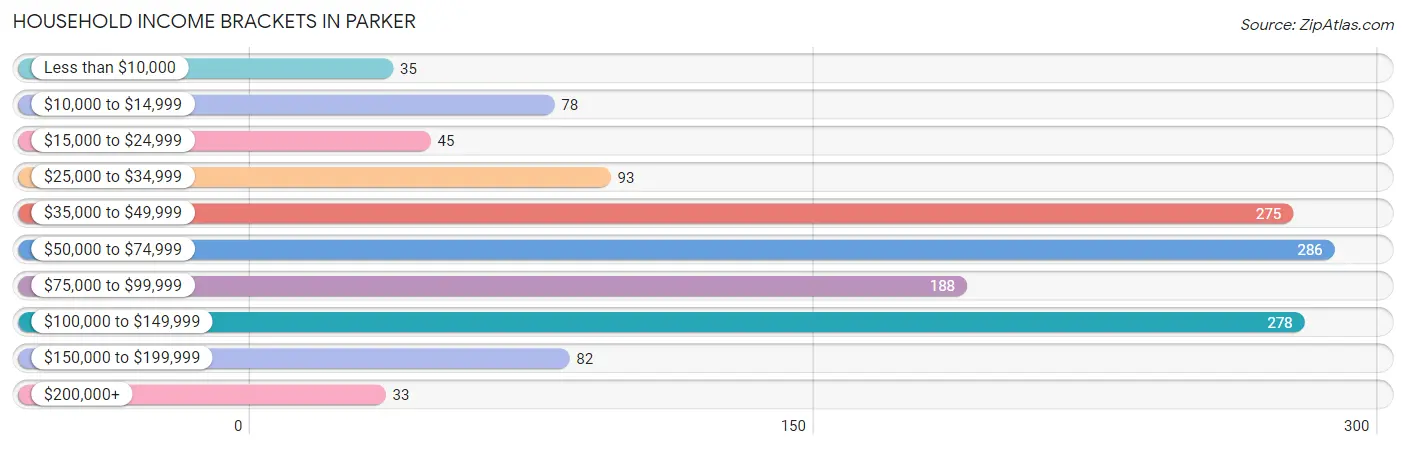
Household Income Brackets in Parker
With 286 households falling in the category, the $50,000 to $74,999 income range is the most frequent in Parker, accounting for 20.5% of all households. In contrast, only 33 households (2.4%) fall into the $200,000+ income bracket, making it the least populous group.
| Income Bracket | # Households | % Households |
| Less than $10,000 | 35 | 2.5% |
| $10,000 to $14,999 | 78 | 5.6% |
| $15,000 to $24,999 | 45 | 3.2% |
| $25,000 to $34,999 | 93 | 6.7% |
| $35,000 to $49,999 | 275 | 19.7% |
| $50,000 to $74,999 | 286 | 20.5% |
| $75,000 to $99,999 | 188 | 13.5% |
| $100,000 to $149,999 | 278 | 19.9% |
| $150,000 to $199,999 | 82 | 5.9% |
| $200,000+ | 33 | 2.4% |
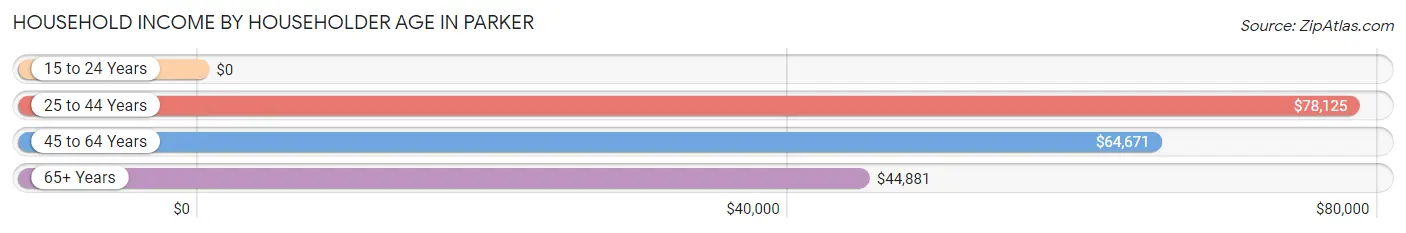
Household Income by Householder Age in Parker
The median household income in Parker is $67,566, with the highest median household income of $78,125 found in the 25 to 44 years age bracket for the primary householder. A total of 494 households (35.4%) fall into this category. Meanwhile, the 15 to 24 years age bracket for the primary householder has the lowest median household income of $0, with 84 households (6.0%) in this group.
| Income Bracket | # Households | Median Income |
| 15 to 24 Years | 84 (6.0%) | $0 |
| 25 to 44 Years | 494 (35.4%) | $78,125 |
| 45 to 64 Years | 477 (34.2%) | $64,671 |
| 65+ Years | 340 (24.4%) | $44,881 |
| Total | 1,395 (100.0%) | $67,566 |
Poverty in Parker
Income Below Poverty by Sex and Age in Parker
With 6.0% poverty level for males and 9.5% for females among the residents of Parker, 15 year old males and 18 to 24 year old females are the most vulnerable to poverty, with 6 males (17.6%) and 32 females (26.2%) in their respective age groups living below the poverty level.
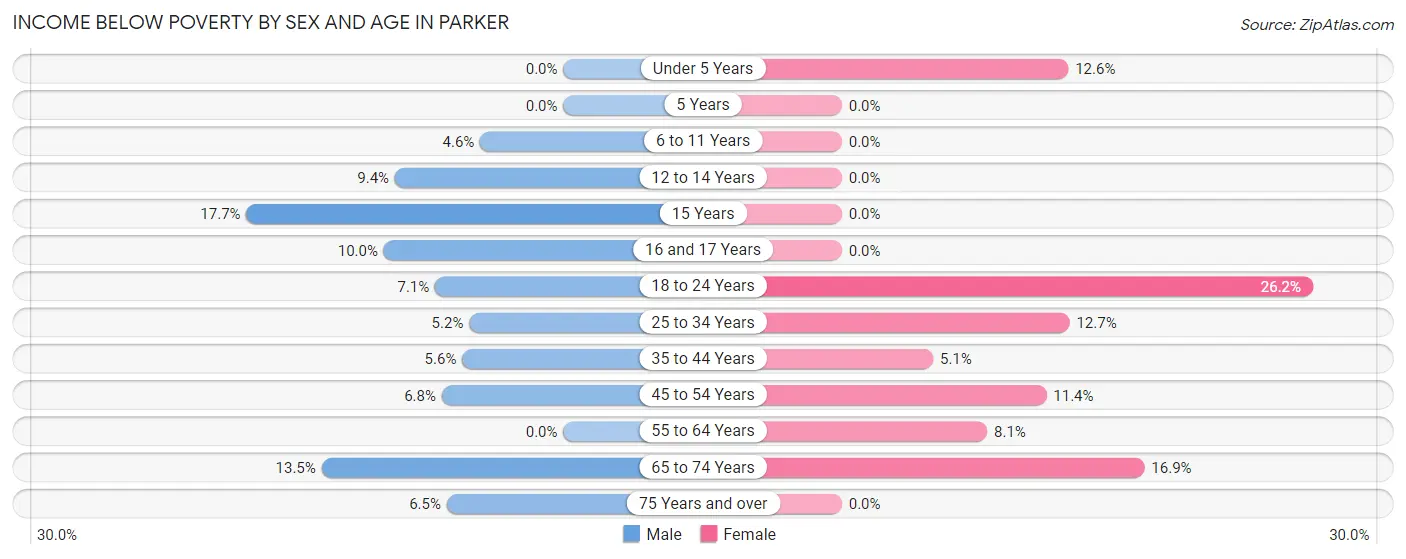
| Age Bracket | Male | Female |
| Under 5 Years | 0 (0.0%) | 15 (12.6%) |
| 5 Years | 0 (0.0%) | 0 (0.0%) |
| 6 to 11 Years | 5 (4.6%) | 0 (0.0%) |
| 12 to 14 Years | 9 (9.4%) | 0 (0.0%) |
| 15 Years | 6 (17.6%) | 0 (0.0%) |
| 16 and 17 Years | 7 (10.0%) | 0 (0.0%) |
| 18 to 24 Years | 5 (7.1%) | 32 (26.2%) |
| 25 to 34 Years | 13 (5.2%) | 26 (12.7%) |
| 35 to 44 Years | 12 (5.6%) | 12 (5.1%) |
| 45 to 54 Years | 13 (6.8%) | 23 (11.4%) |
| 55 to 64 Years | 0 (0.0%) | 14 (8.1%) |
| 65 to 74 Years | 21 (13.5%) | 31 (16.9%) |
| 75 Years and over | 5 (6.5%) | 0 (0.0%) |
| Total | 96 (6.0%) | 153 (9.5%) |
Income Above Poverty by Sex and Age in Parker
According to the poverty statistics in Parker, males aged under 5 years and females aged 5 years are the age groups that are most secure financially, with 100.0% of males and 100.0% of females in these age groups living above the poverty line.
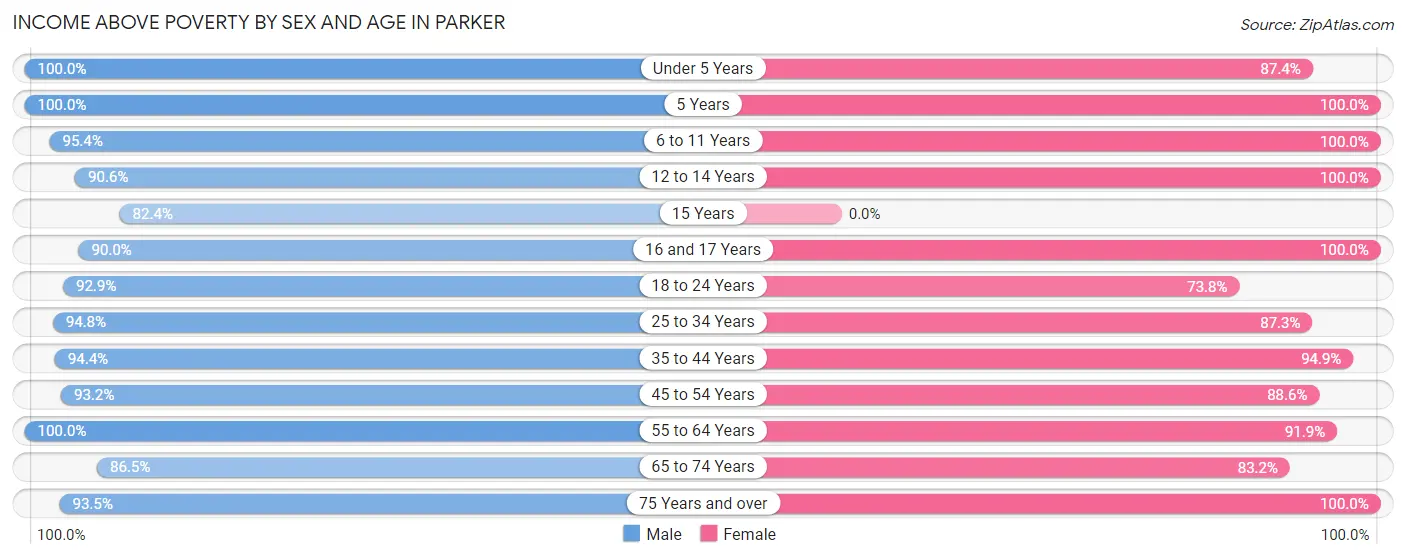
| Age Bracket | Male | Female |
| Under 5 Years | 120 (100.0%) | 104 (87.4%) |
| 5 Years | 8 (100.0%) | 43 (100.0%) |
| 6 to 11 Years | 103 (95.4%) | 105 (100.0%) |
| 12 to 14 Years | 87 (90.6%) | 68 (100.0%) |
| 15 Years | 28 (82.4%) | 0 (0.0%) |
| 16 and 17 Years | 63 (90.0%) | 32 (100.0%) |
| 18 to 24 Years | 65 (92.9%) | 90 (73.8%) |
| 25 to 34 Years | 235 (94.8%) | 179 (87.3%) |
| 35 to 44 Years | 201 (94.4%) | 224 (94.9%) |
| 45 to 54 Years | 179 (93.2%) | 179 (88.6%) |
| 55 to 64 Years | 206 (100.0%) | 159 (91.9%) |
| 65 to 74 Years | 135 (86.5%) | 153 (83.2%) |
| 75 Years and over | 72 (93.5%) | 124 (100.0%) |
| Total | 1,502 (94.0%) | 1,460 (90.5%) |
Income Below Poverty Among Married-Couple Families in Parker
The poverty statistics for married-couple families in Parker show that 2.6% or 18 of the total 690 families live below the poverty line. Families with 3 or 4 children have the highest poverty rate of 12.5%, comprising of 14 families. On the other hand, families with 1 or 2 children have the lowest poverty rate of 0.0%, which includes 0 families.
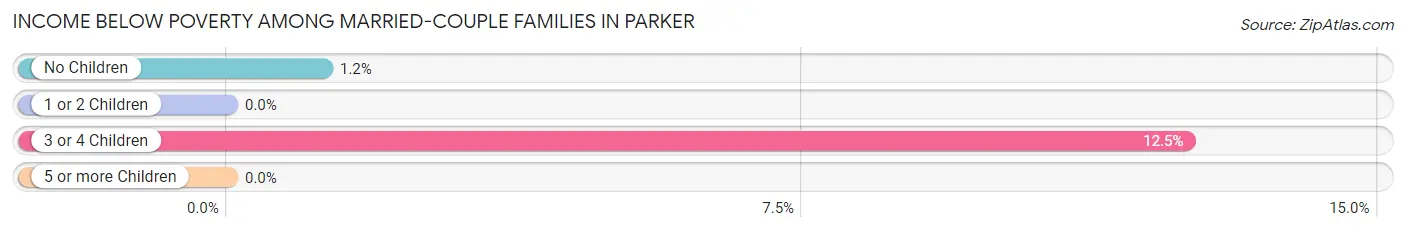
| Children | Above Poverty | Below Poverty |
| No Children | 319 (98.8%) | 4 (1.2%) |
| 1 or 2 Children | 255 (100.0%) | 0 (0.0%) |
| 3 or 4 Children | 98 (87.5%) | 14 (12.5%) |
| 5 or more Children | 0 (0.0%) | 0 (0.0%) |
| Total | 672 (97.4%) | 18 (2.6%) |
Income Below Poverty Among Single-Parent Households in Parker
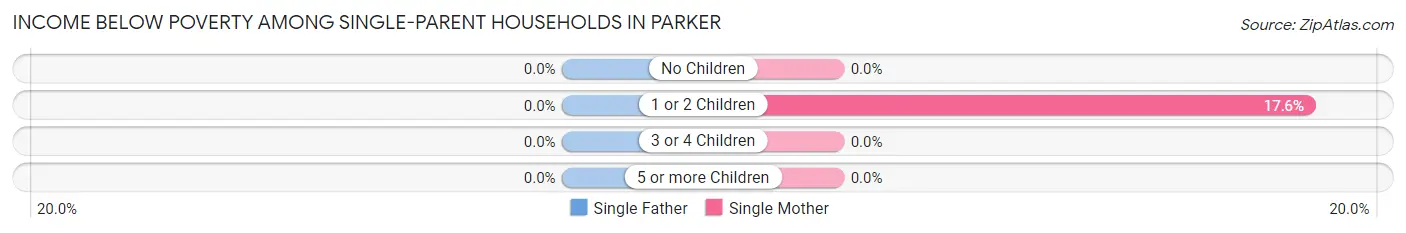
| Children | Single Father | Single Mother |
| No Children | 0 (0.0%) | 0 (0.0%) |
| 1 or 2 Children | 0 (0.0%) | 19 (17.6%) |
| 3 or 4 Children | 0 (0.0%) | 0 (0.0%) |
| 5 or more Children | 0 (0.0%) | 0 (0.0%) |
| Total | 0 (0.0%) | 19 (9.4%) |
Income Below Poverty Among Married-Couple vs Single-Parent Households in Parker
The poverty data for Parker shows that 18 of the married-couple family households (2.6%) and 19 of the single-parent households (5.9%) are living below the poverty level. Within the married-couple family households, those with 3 or 4 children have the highest poverty rate, with 14 households (12.5%) falling below the poverty line. Among the single-parent households, those with 1 or 2 children have the highest poverty rate, with 19 household (11.0%) living below poverty.
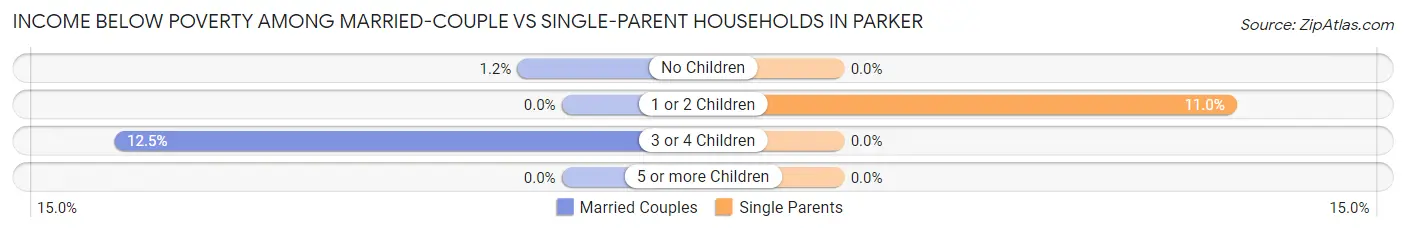
| Children | Married-Couple Families | Single-Parent Households |
| No Children | 4 (1.2%) | 0 (0.0%) |
| 1 or 2 Children | 0 (0.0%) | 19 (11.0%) |
| 3 or 4 Children | 14 (12.5%) | 0 (0.0%) |
| 5 or more Children | 0 (0.0%) | 0 (0.0%) |
| Total | 18 (2.6%) | 19 (5.9%) |
Race in Parker
The most populous races in Parker are Hispanic or Latino (1,701 | 50.7%), White / Caucasian (1,221 | 36.4%), and Two or more Races (922 | 27.5%).
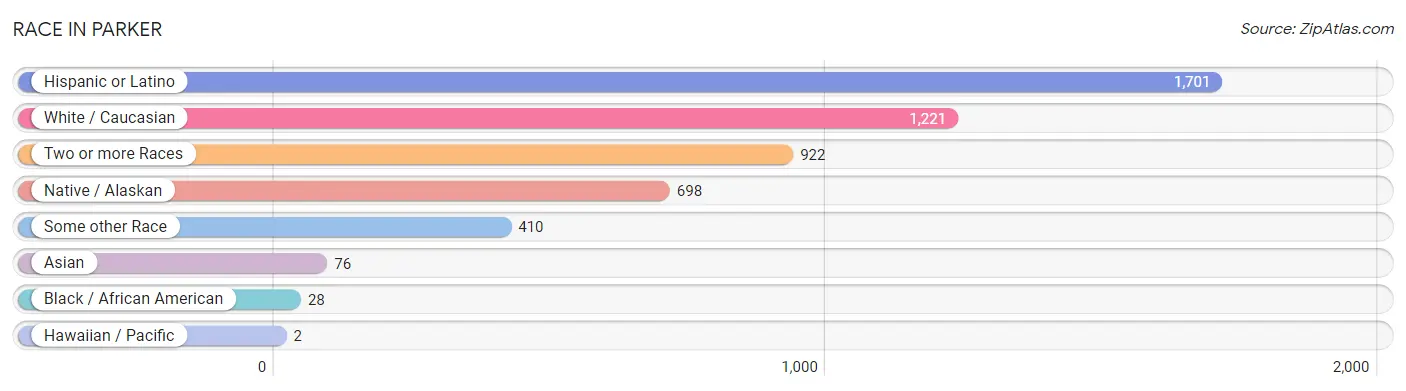
| Race | # Population | % Population |
| Asian | 76 | 2.3% |
| Black / African American | 28 | 0.8% |
| Hawaiian / Pacific | 2 | 0.1% |
| Hispanic or Latino | 1,701 | 50.7% |
| Native / Alaskan | 698 | 20.8% |
| White / Caucasian | 1,221 | 36.4% |
| Two or more Races | 922 | 27.5% |
| Some other Race | 410 | 12.2% |
| Total | 3,357 | 100.0% |
Ancestry in Parker
The most populous ancestries reported in Parker are Mexican (1,550 | 46.2%), English (232 | 6.9%), German (211 | 6.3%), Irish (129 | 3.8%), and American (93 | 2.8%), together accounting for 66.0% of all Parker residents.

| Ancestry | # Population | % Population |
| American | 93 | 2.8% |
| Argentinean | 25 | 0.7% |
| Basque | 2 | 0.1% |
| British | 3 | 0.1% |
| Central American | 7 | 0.2% |
| Central American Indian | 14 | 0.4% |
| Creek | 13 | 0.4% |
| Czech | 3 | 0.1% |
| Danish | 3 | 0.1% |
| English | 232 | 6.9% |
| European | 22 | 0.7% |
| French | 24 | 0.7% |
| German | 211 | 6.3% |
| Guamanian / Chamorro | 2 | 0.1% |
| Guatemalan | 7 | 0.2% |
| Hopi | 45 | 1.3% |
| Irish | 129 | 3.8% |
| Italian | 42 | 1.3% |
| Korean | 19 | 0.6% |
| Mexican | 1,550 | 46.2% |
| Mexican American Indian | 73 | 2.2% |
| Navajo | 35 | 1.0% |
| Norwegian | 19 | 0.6% |
| Pima | 9 | 0.3% |
| Puerto Rican | 23 | 0.7% |
| Scotch-Irish | 32 | 0.9% |
| Scottish | 48 | 1.4% |
| South American | 25 | 0.7% |
| South American Indian | 6 | 0.2% |
| Spanish | 4 | 0.1% |
| Swedish | 37 | 1.1% |
| Swiss | 1 | 0.0% |
| Thai | 60 | 1.8% |
| Welsh | 9 | 0.3% |
| Yugoslavian | 1 | 0.0% |
| Yuman | 28 | 0.8% | View All 36 Rows |
Immigrants in Parker
The most numerous immigrant groups reported in Parker came from Latin America (477 | 14.2%), Central America (464 | 13.8%), Mexico (464 | 13.8%), Asia (73 | 2.2%), and India (60 | 1.8%), together accounting for 45.8% of all Parker residents.
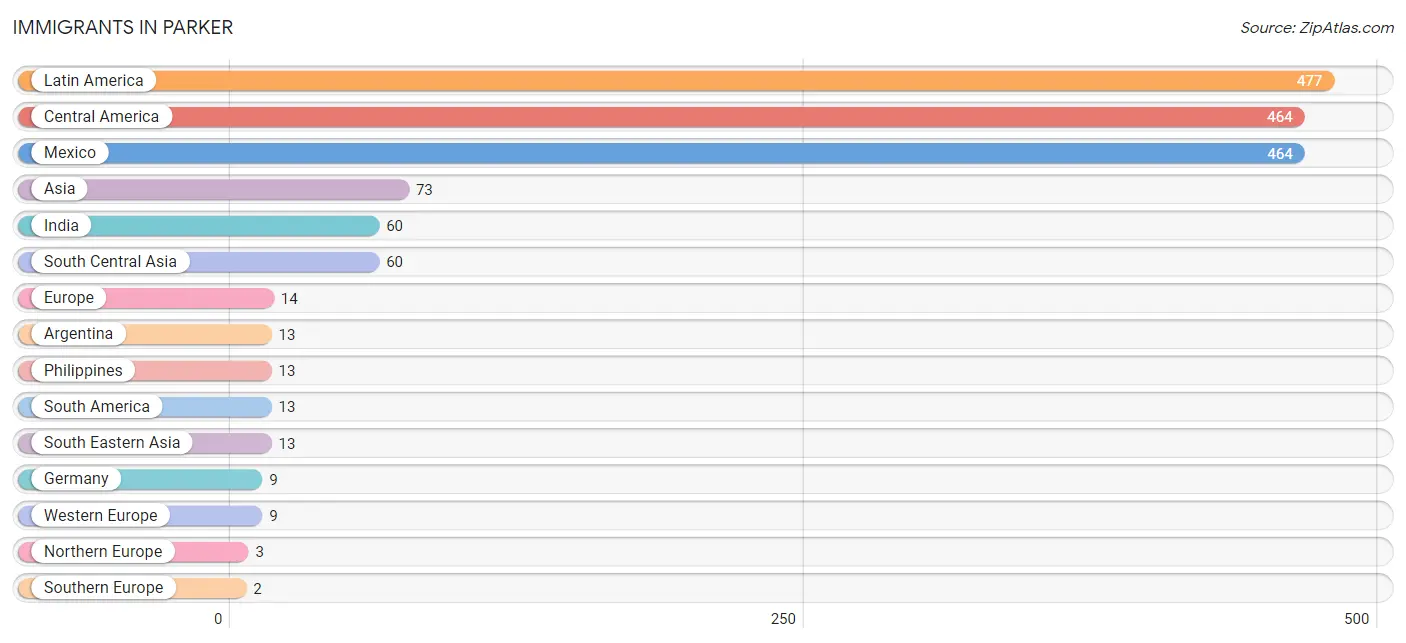
| Immigration Origin | # Population | % Population |
| Argentina | 13 | 0.4% |
| Asia | 73 | 2.2% |
| Central America | 464 | 13.8% |
| Europe | 14 | 0.4% |
| Germany | 9 | 0.3% |
| India | 60 | 1.8% |
| Latin America | 477 | 14.2% |
| Mexico | 464 | 13.8% |
| Northern Europe | 3 | 0.1% |
| Philippines | 13 | 0.4% |
| South America | 13 | 0.4% |
| South Central Asia | 60 | 1.8% |
| South Eastern Asia | 13 | 0.4% |
| Southern Europe | 2 | 0.1% |
| Spain | 2 | 0.1% |
| Western Europe | 9 | 0.3% | View All 16 Rows |
Sex and Age in Parker
Sex and Age in Parker
The most populous age groups in Parker are 25 to 29 Years (187 | 10.7%) for men and 40 to 44 Years (141 | 8.7%) for women.
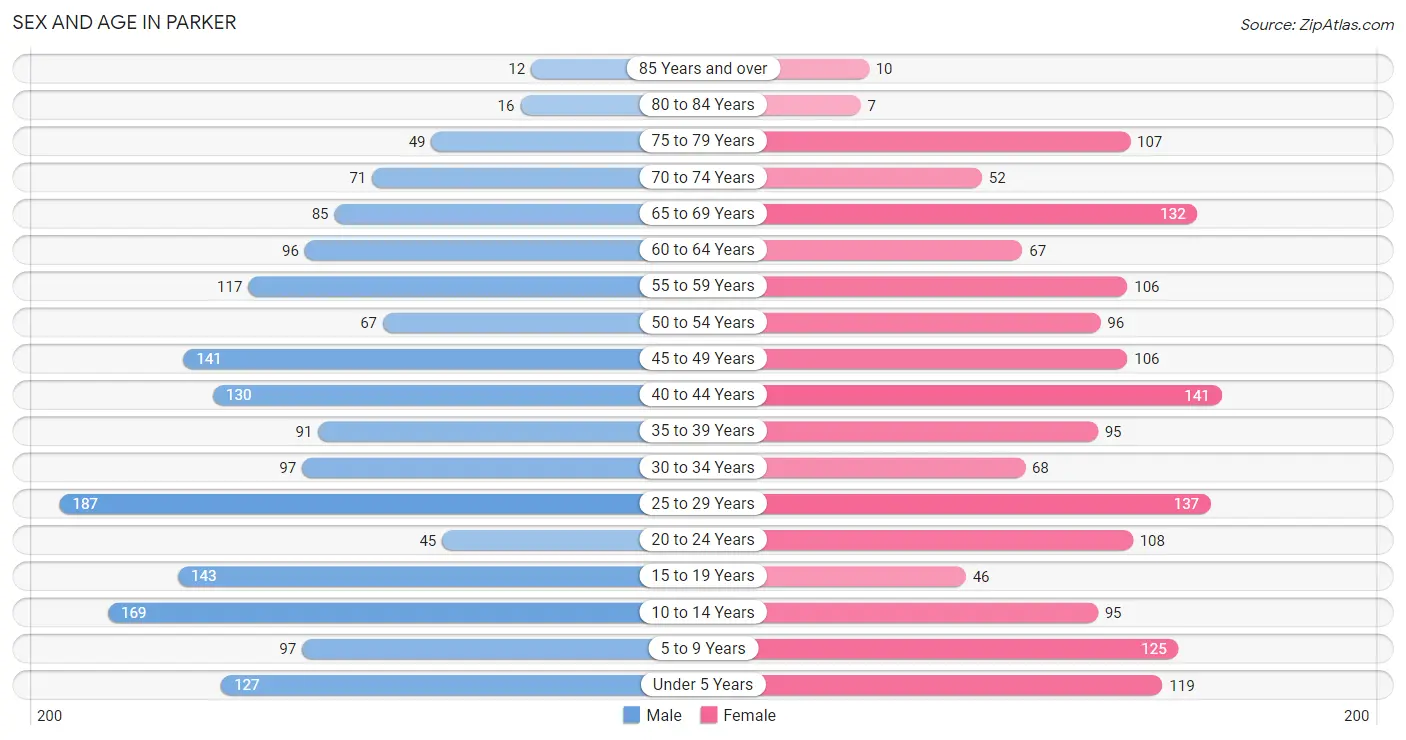
| Age Bracket | Male | Female |
| Under 5 Years | 127 (7.3%) | 119 (7.4%) |
| 5 to 9 Years | 97 (5.6%) | 125 (7.7%) |
| 10 to 14 Years | 169 (9.7%) | 95 (5.9%) |
| 15 to 19 Years | 143 (8.2%) | 46 (2.8%) |
| 20 to 24 Years | 45 (2.6%) | 108 (6.7%) |
| 25 to 29 Years | 187 (10.7%) | 137 (8.5%) |
| 30 to 34 Years | 97 (5.6%) | 68 (4.2%) |
| 35 to 39 Years | 91 (5.2%) | 95 (5.9%) |
| 40 to 44 Years | 130 (7.5%) | 141 (8.7%) |
| 45 to 49 Years | 141 (8.1%) | 106 (6.6%) |
| 50 to 54 Years | 67 (3.8%) | 96 (5.9%) |
| 55 to 59 Years | 117 (6.7%) | 106 (6.6%) |
| 60 to 64 Years | 96 (5.5%) | 67 (4.1%) |
| 65 to 69 Years | 85 (4.9%) | 132 (8.2%) |
| 70 to 74 Years | 71 (4.1%) | 52 (3.2%) |
| 75 to 79 Years | 49 (2.8%) | 107 (6.6%) |
| 80 to 84 Years | 16 (0.9%) | 7 (0.4%) |
| 85 Years and over | 12 (0.7%) | 10 (0.6%) |
| Total | 1,740 (100.0%) | 1,617 (100.0%) |
Families and Households in Parker
Median Family Size in Parker
The median family size in Parker is 2.66 persons per family, with married-couple families (690 | 68.2%) accounting for the largest median family size of 2.96 persons per family. On the other hand, single male/father families (120 | 11.9%) represent the smallest median family size with 2.00 persons per family.
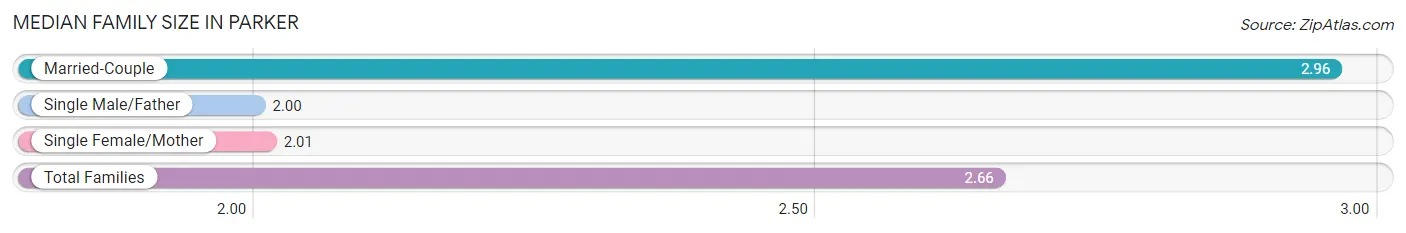
| Family Type | # Families | Family Size |
| Married-Couple | 690 (68.2%) | 2.96 |
| Single Male/Father | 120 (11.9%) | 2.00 |
| Single Female/Mother | 202 (20.0%) | 2.01 |
| Total Families | 1,012 (100.0%) | 2.66 |
Median Household Size in Parker
The median household size in Parker is 2.35 persons per household, with married-couple households (690 | 49.5%) accounting for the largest median household size of 3.06 persons per household. non-family households (383 | 27.5%) represent the smallest median household size with 1.14 persons per household.
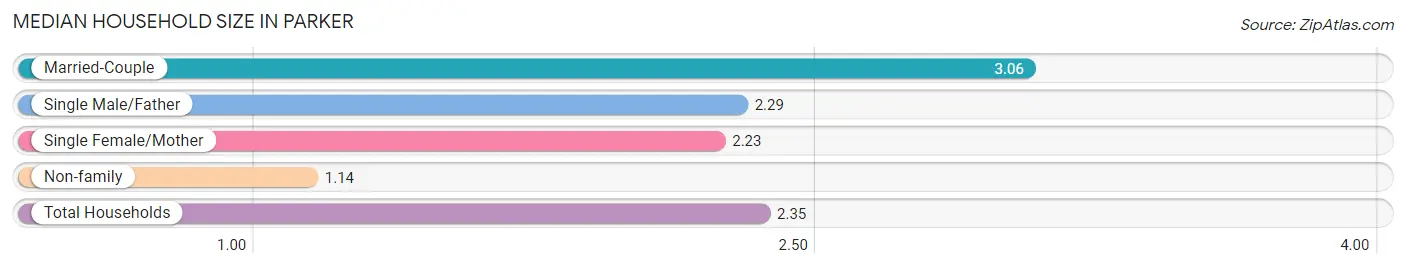
| Household Type | # Households | Household Size |
| Married-Couple | 690 (49.5%) | 3.06 |
| Single Male/Father | 120 (8.6%) | 2.29 |
| Single Female/Mother | 202 (14.5%) | 2.23 |
| Non-family | 383 (27.5%) | 1.14 |
| Total Households | 1,395 (100.0%) | 2.35 |
Household Size by Marriage Status in Parker
Out of a total of 1,395 households in Parker, 1,012 (72.5%) are family households, while 383 (27.5%) are nonfamily households. The most numerous type of family households are 3-person households, comprising 283, and the most common type of nonfamily households are 1-person households, comprising 290.
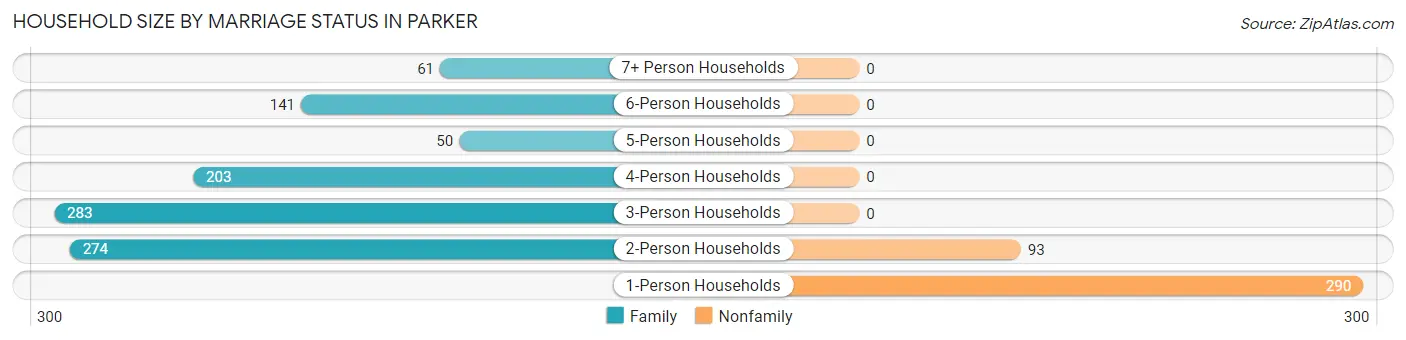
| Household Size | Family Households | Nonfamily Households |
| 1-Person Households | - | 290 (20.8%) |
| 2-Person Households | 274 (19.6%) | 93 (6.7%) |
| 3-Person Households | 283 (20.3%) | 0 (0.0%) |
| 4-Person Households | 203 (14.5%) | 0 (0.0%) |
| 5-Person Households | 50 (3.6%) | 0 (0.0%) |
| 6-Person Households | 141 (10.1%) | 0 (0.0%) |
| 7+ Person Households | 61 (4.4%) | 0 (0.0%) |
| Total | 1,012 (72.5%) | 383 (27.5%) |
Female Fertility in Parker
Fertility by Age in Parker
Average fertility rate in Parker is 96.0 births per 1,000 women. Women in the age bracket of 20 to 34 years have the highest fertility rate with 208.0 births per 1,000 women. Women in the age bracket of 20 to 34 years acount for 95.6% of all women with births.
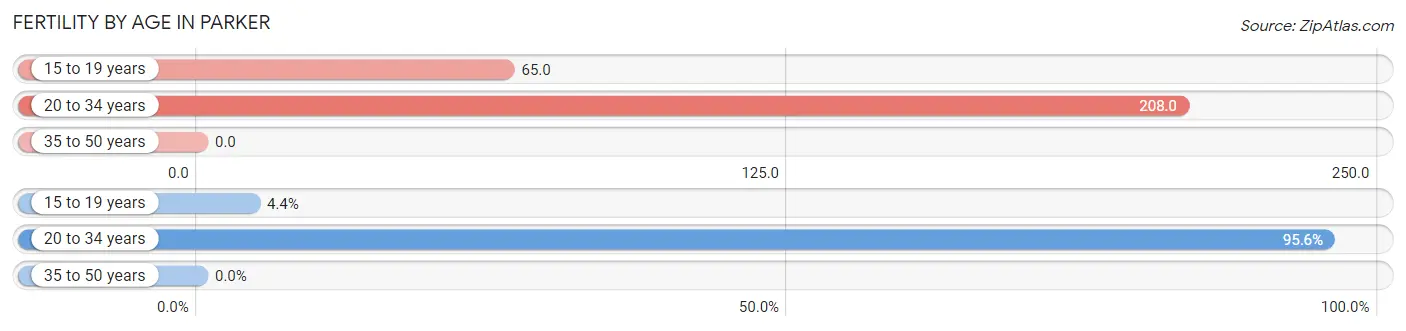
| Age Bracket | Women with Births | Births / 1,000 Women |
| 15 to 19 years | 3 (4.4%) | 65.0 |
| 20 to 34 years | 65 (95.6%) | 208.0 |
| 35 to 50 years | 0 (0.0%) | 0.0 |
| Total | 68 (100.0%) | 96.0 |
Fertility by Age by Marriage Status in Parker
88.2% of women with births (68) in Parker are married. The highest percentage of unmarried women with births falls into 20 to 34 years age bracket with 12.3% of them unmarried at the time of birth, while the lowest percentage of unmarried women with births belong to 15 to 19 years age bracket with 0.0% of them unmarried.
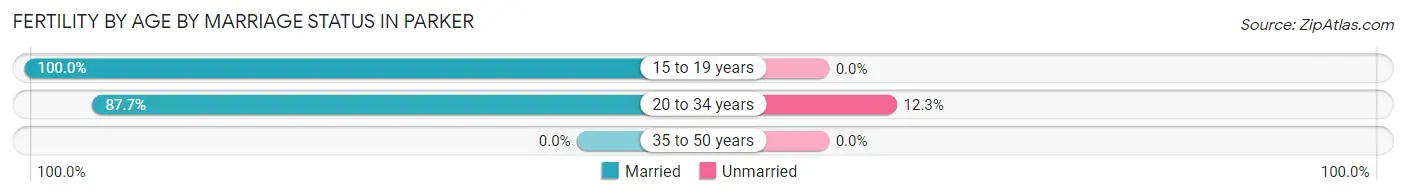
| Age Bracket | Married | Unmarried |
| 15 to 19 years | 3 (100.0%) | 0 (0.0%) |
| 20 to 34 years | 57 (87.7%) | 8 (12.3%) |
| 35 to 50 years | 0 (0.0%) | 0 (0.0%) |
| Total | 60 (88.2%) | 8 (11.8%) |
Fertility by Education in Parker
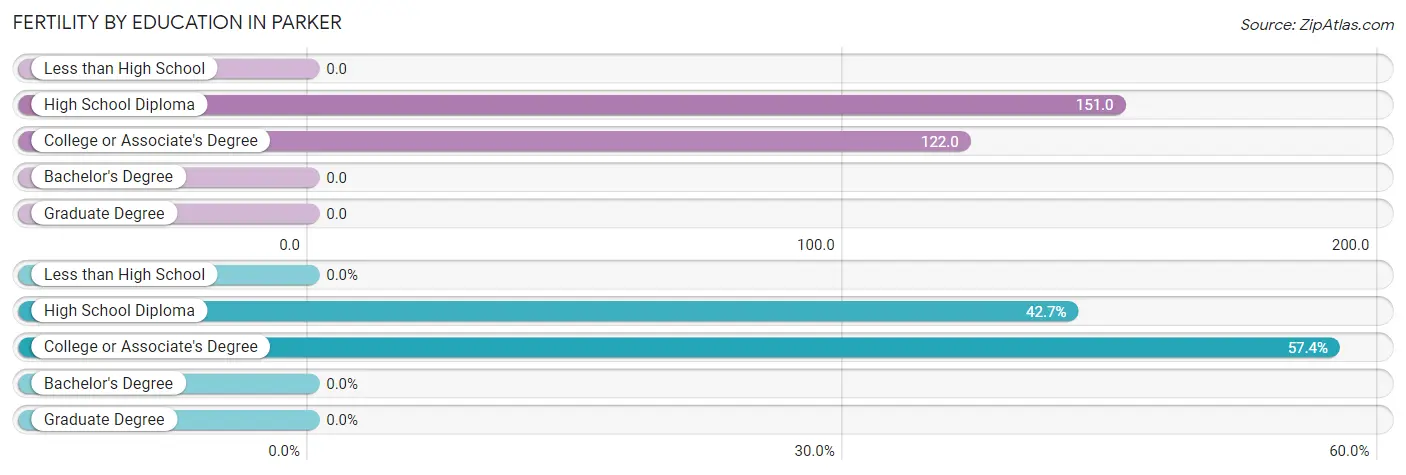
| Educational Attainment | Women with Births | Births / 1,000 Women |
| Less than High School | 0 (0.0%) | 0.0 |
| High School Diploma | 29 (42.6%) | 151.0 |
| College or Associate's Degree | 39 (57.4%) | 122.0 |
| Bachelor's Degree | 0 (0.0%) | 0.0 |
| Graduate Degree | 0 (0.0%) | 0.0 |
| Total | 68 (100.0%) | 96.0 |
Fertility by Education by Marriage Status in Parker
11.8% of women with births in Parker are unmarried. Women with the educational attainment of high school diploma are most likely to be married with 100.0% of them married at childbirth, while women with the educational attainment of college or associate's degree are least likely to be married with 20.5% of them unmarried at childbirth.
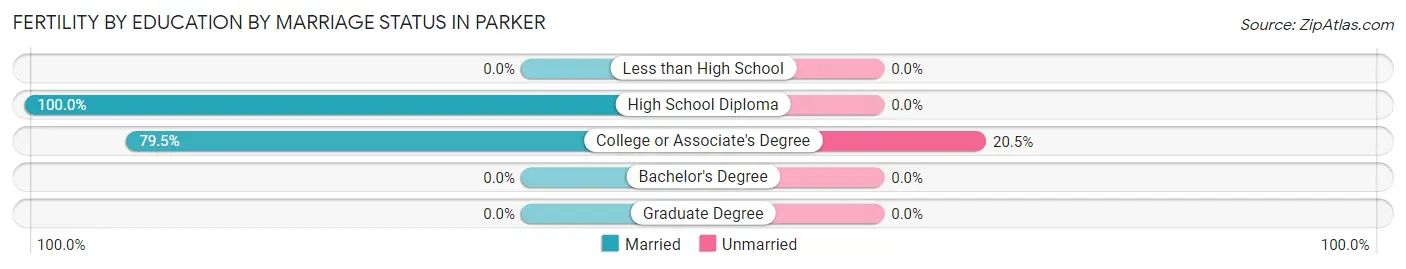
| Educational Attainment | Married | Unmarried |
| Less than High School | 0 (0.0%) | 0 (0.0%) |
| High School Diploma | 29 (100.0%) | 0 (0.0%) |
| College or Associate's Degree | 31 (79.5%) | 8 (20.5%) |
| Bachelor's Degree | 0 (0.0%) | 0 (0.0%) |
| Graduate Degree | 0 (0.0%) | 0 (0.0%) |
| Total | 60 (88.2%) | 8 (11.8%) |
Employment Characteristics in Parker
Employment by Class of Employer in Parker
Among the 1,627 employed individuals in Parker, private company employees (712 | 43.8%), local government employees (234 | 14.4%), and federal government employees (181 | 11.1%) make up the most common classes of employment.
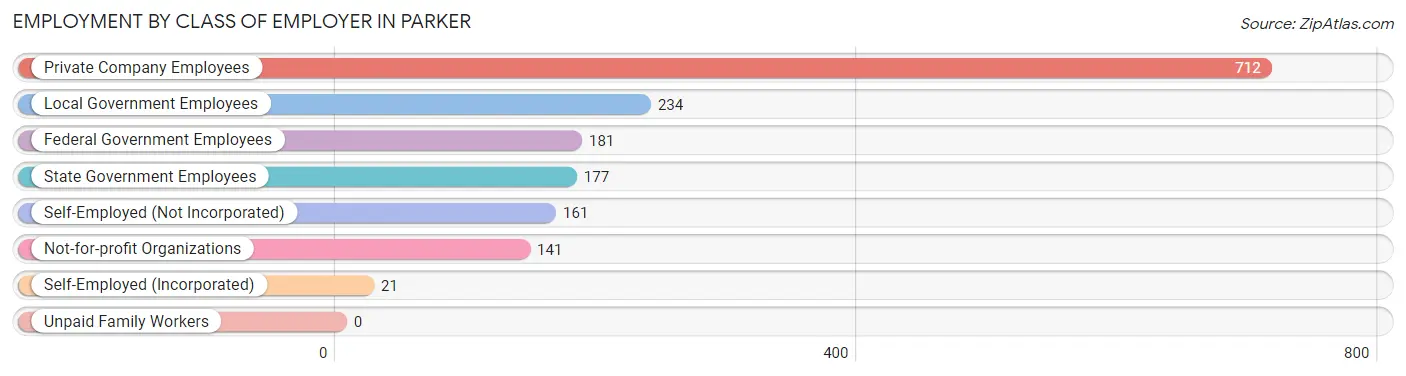
| Employer Class | # Employees | % Employees |
| Private Company Employees | 712 | 43.8% |
| Self-Employed (Incorporated) | 21 | 1.3% |
| Self-Employed (Not Incorporated) | 161 | 9.9% |
| Not-for-profit Organizations | 141 | 8.7% |
| Local Government Employees | 234 | 14.4% |
| State Government Employees | 177 | 10.9% |
| Federal Government Employees | 181 | 11.1% |
| Unpaid Family Workers | 0 | 0.0% |
| Total | 1,627 | 100.0% |
Employment Status by Age in Parker
According to the labor force statistics for Parker, out of the total population over 16 years of age (2,591), 66.4% or 1,720 individuals are in the labor force, with 4.3% or 74 of them unemployed. The age group with the highest labor force participation rate is 25 to 29 years, with 90.4% or 293 individuals in the labor force. Within the labor force, the 35 to 44 years age range has the highest percentage of unemployed individuals, with 10.7% or 43 of them being unemployed.
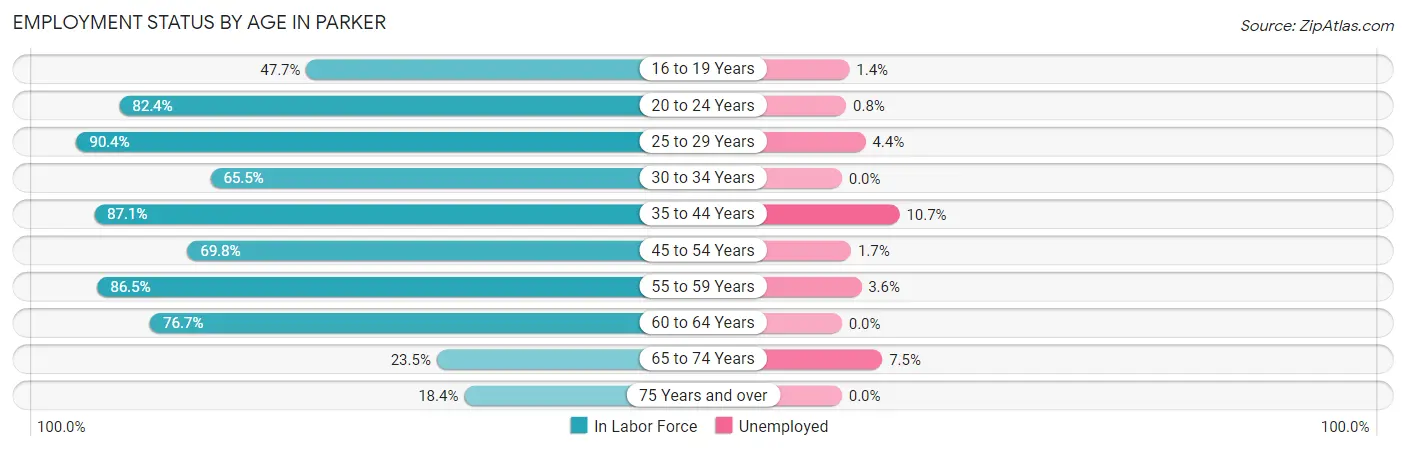
| Age Bracket | In Labor Force | Unemployed |
| 16 to 19 Years | 74 (47.7%) | 1 (1.4%) |
| 20 to 24 Years | 126 (82.4%) | 1 (0.8%) |
| 25 to 29 Years | 293 (90.4%) | 13 (4.4%) |
| 30 to 34 Years | 108 (65.5%) | 0 (0.0%) |
| 35 to 44 Years | 398 (87.1%) | 43 (10.7%) |
| 45 to 54 Years | 286 (69.8%) | 5 (1.7%) |
| 55 to 59 Years | 193 (86.5%) | 7 (3.6%) |
| 60 to 64 Years | 125 (76.7%) | 0 (0.0%) |
| 65 to 74 Years | 80 (23.5%) | 6 (7.5%) |
| 75 Years and over | 37 (18.4%) | 0 (0.0%) |
| Total | 1,720 (66.4%) | 74 (4.3%) |
Employment Status by Educational Attainment in Parker
According to labor force statistics for Parker, 80.5% of individuals (1,402) out of the total population between 25 and 64 years of age (1,742) are in the labor force, with 4.8% or 67 of them being unemployed. The group with the highest labor force participation rate are those with the educational attainment of bachelor's degree or higher, with 86.3% or 233 individuals in the labor force. Within the labor force, individuals with bachelor's degree or higher education have the highest percentage of unemployment, with 9.9% or 23 of them being unemployed.
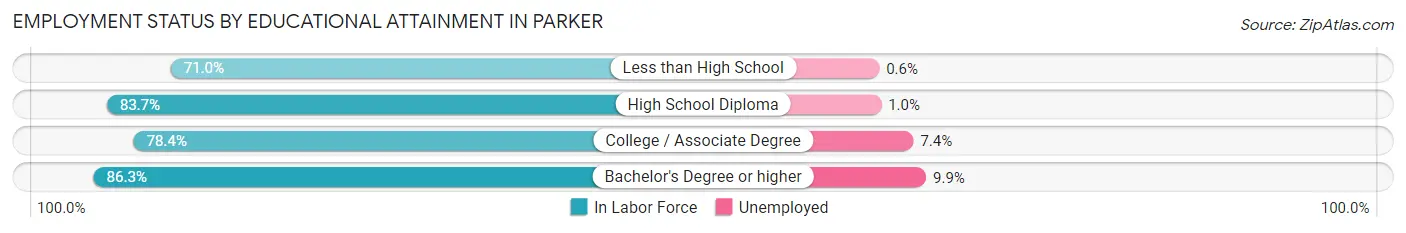
| Educational Attainment | In Labor Force | Unemployed |
| Less than High School | 159 (71.0%) | 1 (0.6%) |
| High School Diploma | 514 (83.7%) | 6 (1.0%) |
| College / Associate Degree | 497 (78.4%) | 47 (7.4%) |
| Bachelor's Degree or higher | 233 (86.3%) | 27 (9.9%) |
| Total | 1,402 (80.5%) | 84 (4.8%) |
Employment Occupations by Sex in Parker
Management, Business, Science and Arts Occupations
The most common Management, Business, Science and Arts occupations in Parker are Community & Social Service (174 | 10.7%), Management (162 | 9.9%), Education, Arts & Media (108 | 6.6%), Education Instruction & Library (66 | 4.1%), and Computers, Engineering & Science (38 | 2.3%).
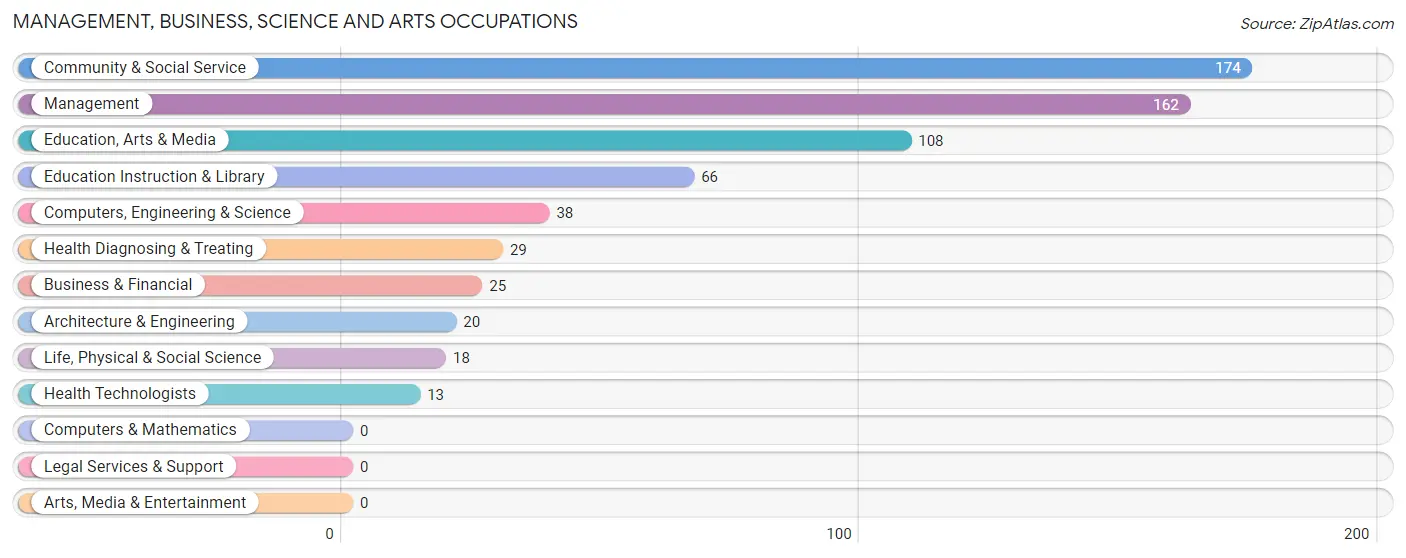
Management, Business, Science and Arts Occupations by Sex
Within the Management, Business, Science and Arts occupations in Parker, the most male-oriented occupations are Architecture & Engineering (70.0%), Education, Arts & Media (56.5%), and Management (54.3%), while the most female-oriented occupations are Life, Physical & Social Science (100.0%), Health Diagnosing & Treating (100.0%), and Health Technologists (100.0%).
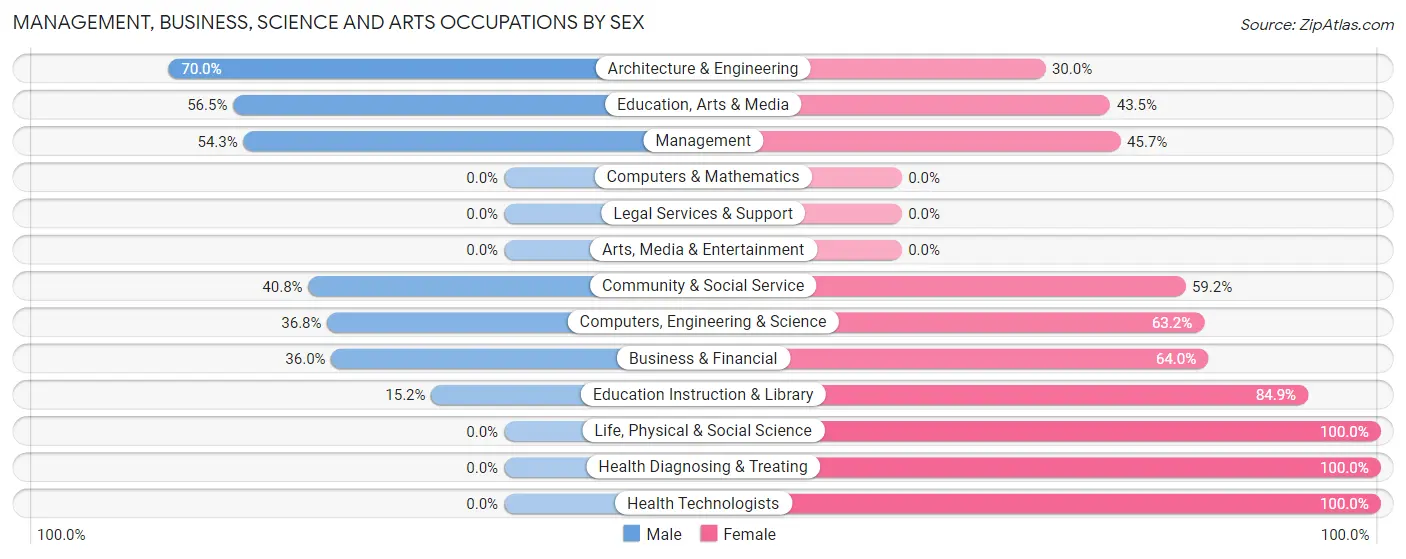
| Occupation | Male | Female |
| Management | 88 (54.3%) | 74 (45.7%) |
| Business & Financial | 9 (36.0%) | 16 (64.0%) |
| Computers, Engineering & Science | 14 (36.8%) | 24 (63.2%) |
| Computers & Mathematics | 0 (0.0%) | 0 (0.0%) |
| Architecture & Engineering | 14 (70.0%) | 6 (30.0%) |
| Life, Physical & Social Science | 0 (0.0%) | 18 (100.0%) |
| Community & Social Service | 71 (40.8%) | 103 (59.2%) |
| Education, Arts & Media | 61 (56.5%) | 47 (43.5%) |
| Legal Services & Support | 0 (0.0%) | 0 (0.0%) |
| Education Instruction & Library | 10 (15.1%) | 56 (84.9%) |
| Arts, Media & Entertainment | 0 (0.0%) | 0 (0.0%) |
| Health Diagnosing & Treating | 0 (0.0%) | 29 (100.0%) |
| Health Technologists | 0 (0.0%) | 13 (100.0%) |
| Total (Category) | 182 (42.5%) | 246 (57.5%) |
| Total (Overall) | 873 (53.5%) | 758 (46.5%) |
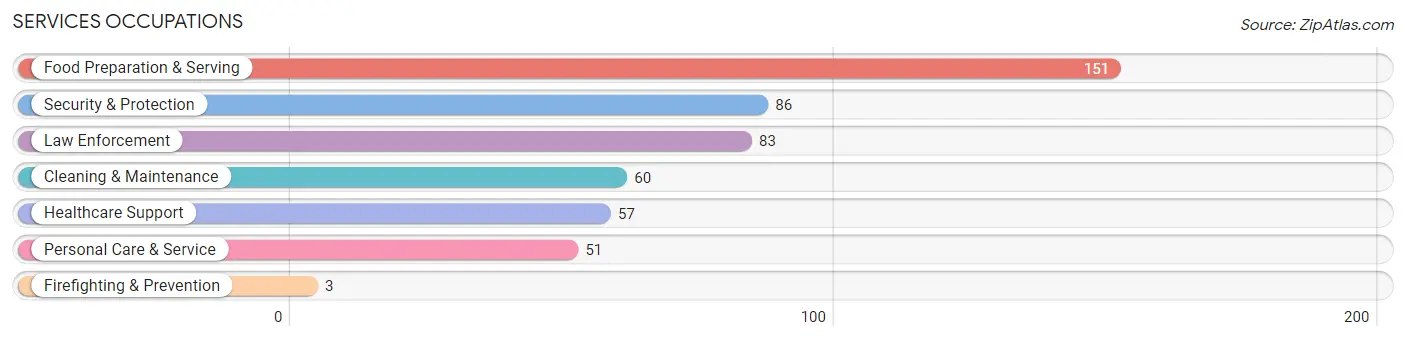
Services Occupations
The most common Services occupations in Parker are Food Preparation & Serving (151 | 9.3%), Security & Protection (86 | 5.3%), Law Enforcement (83 | 5.1%), Cleaning & Maintenance (60 | 3.7%), and Healthcare Support (57 | 3.5%).
Services Occupations by Sex
Within the Services occupations in Parker, the most male-oriented occupations are Firefighting & Prevention (100.0%), Security & Protection (90.7%), and Law Enforcement (90.4%), while the most female-oriented occupations are Healthcare Support (70.2%), Personal Care & Service (56.9%), and Food Preparation & Serving (50.3%).
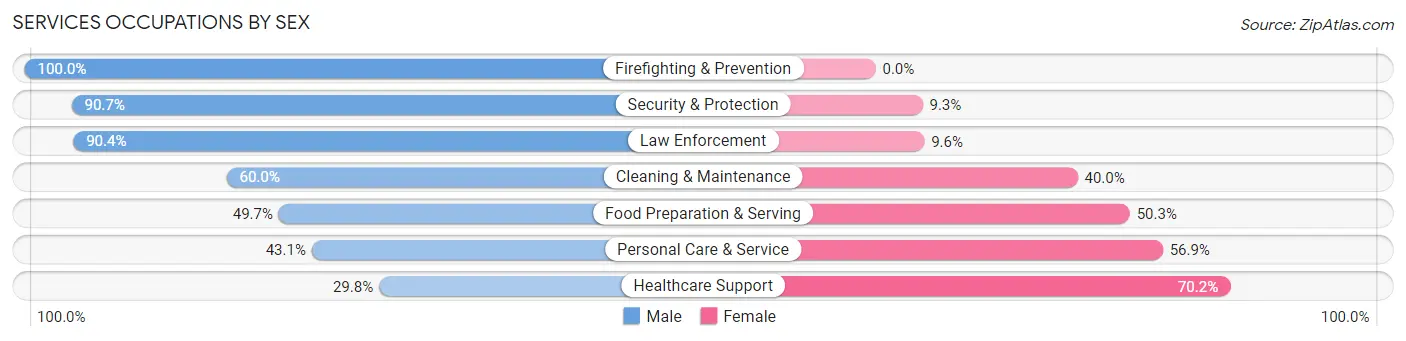
| Occupation | Male | Female |
| Healthcare Support | 17 (29.8%) | 40 (70.2%) |
| Security & Protection | 78 (90.7%) | 8 (9.3%) |
| Firefighting & Prevention | 3 (100.0%) | 0 (0.0%) |
| Law Enforcement | 75 (90.4%) | 8 (9.6%) |
| Food Preparation & Serving | 75 (49.7%) | 76 (50.3%) |
| Cleaning & Maintenance | 36 (60.0%) | 24 (40.0%) |
| Personal Care & Service | 22 (43.1%) | 29 (56.9%) |
| Total (Category) | 228 (56.3%) | 177 (43.7%) |
| Total (Overall) | 873 (53.5%) | 758 (46.5%) |
Sales and Office Occupations
The most common Sales and Office occupations in Parker are Office & Administration (214 | 13.1%), and Sales & Related (136 | 8.3%).

Sales and Office Occupations by Sex

| Occupation | Male | Female |
| Sales & Related | 74 (54.4%) | 62 (45.6%) |
| Office & Administration | 31 (14.5%) | 183 (85.5%) |
| Total (Category) | 105 (30.0%) | 245 (70.0%) |
| Total (Overall) | 873 (53.5%) | 758 (46.5%) |
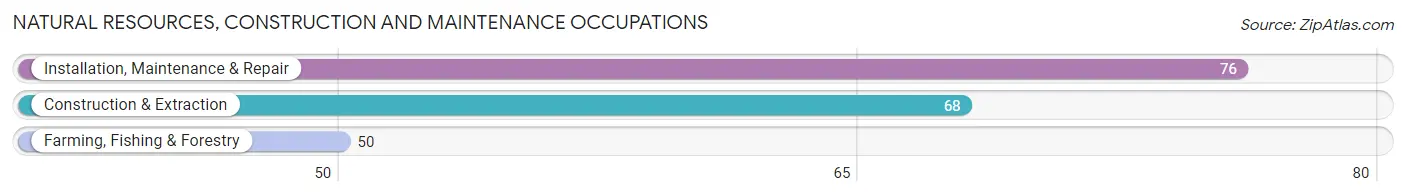
Natural Resources, Construction and Maintenance Occupations
The most common Natural Resources, Construction and Maintenance occupations in Parker are Installation, Maintenance & Repair (76 | 4.7%), Construction & Extraction (68 | 4.2%), and Farming, Fishing & Forestry (50 | 3.1%).
Natural Resources, Construction and Maintenance Occupations by Sex
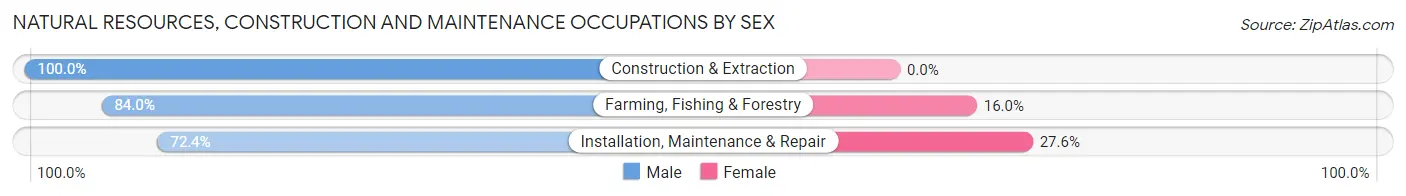
| Occupation | Male | Female |
| Farming, Fishing & Forestry | 42 (84.0%) | 8 (16.0%) |
| Construction & Extraction | 68 (100.0%) | 0 (0.0%) |
| Installation, Maintenance & Repair | 55 (72.4%) | 21 (27.6%) |
| Total (Category) | 165 (85.1%) | 29 (14.9%) |
| Total (Overall) | 873 (53.5%) | 758 (46.5%) |
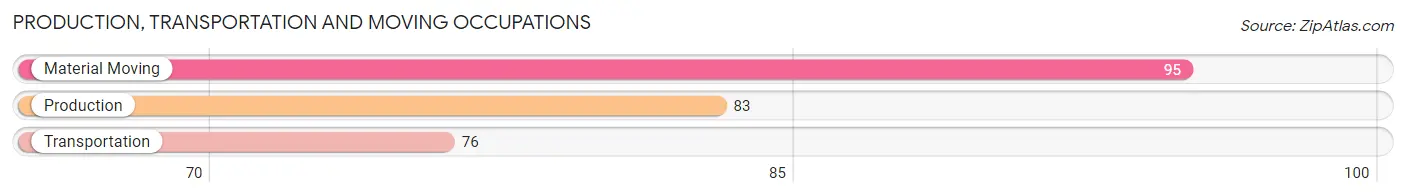
Production, Transportation and Moving Occupations
The most common Production, Transportation and Moving occupations in Parker are Material Moving (95 | 5.8%), Production (83 | 5.1%), and Transportation (76 | 4.7%).
Production, Transportation and Moving Occupations by Sex
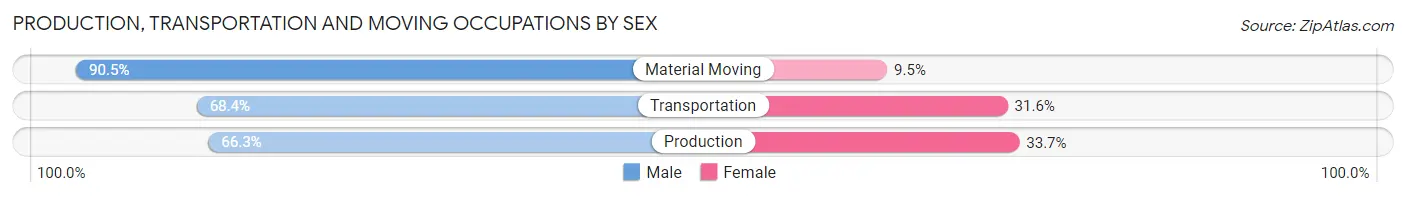
| Occupation | Male | Female |
| Production | 55 (66.3%) | 28 (33.7%) |
| Transportation | 52 (68.4%) | 24 (31.6%) |
| Material Moving | 86 (90.5%) | 9 (9.5%) |
| Total (Category) | 193 (76.0%) | 61 (24.0%) |
| Total (Overall) | 873 (53.5%) | 758 (46.5%) |
Employment Industries by Sex in Parker
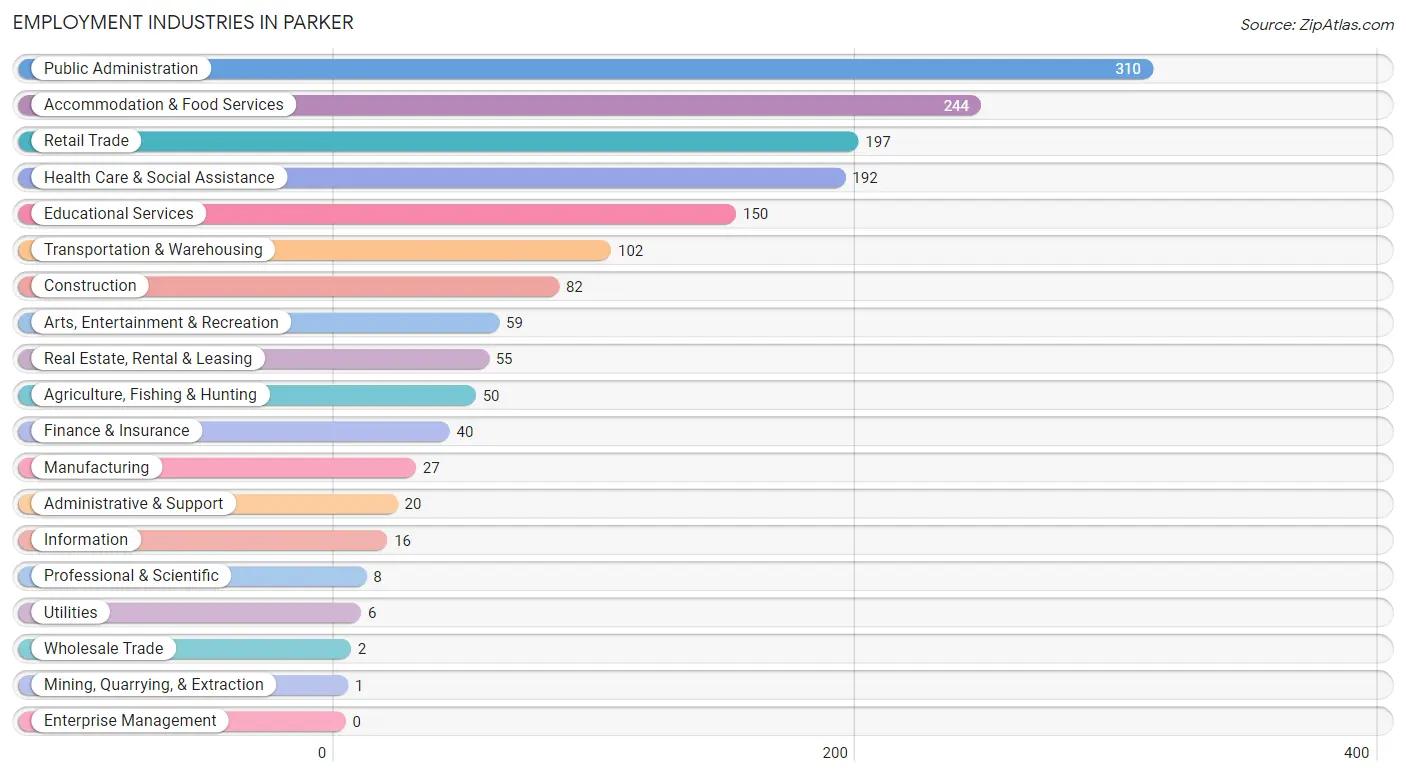
Employment Industries in Parker
The major employment industries in Parker include Public Administration (310 | 19.0%), Accommodation & Food Services (244 | 15.0%), Retail Trade (197 | 12.1%), Health Care & Social Assistance (192 | 11.8%), and Educational Services (150 | 9.2%).
Employment Industries by Sex in Parker
The Parker industries that see more men than women are Construction (100.0%), Wholesale Trade (100.0%), and Information (100.0%), whereas the industries that tend to have a higher number of women are Mining, Quarrying, & Extraction (100.0%), Finance & Insurance (100.0%), and Health Care & Social Assistance (69.3%).
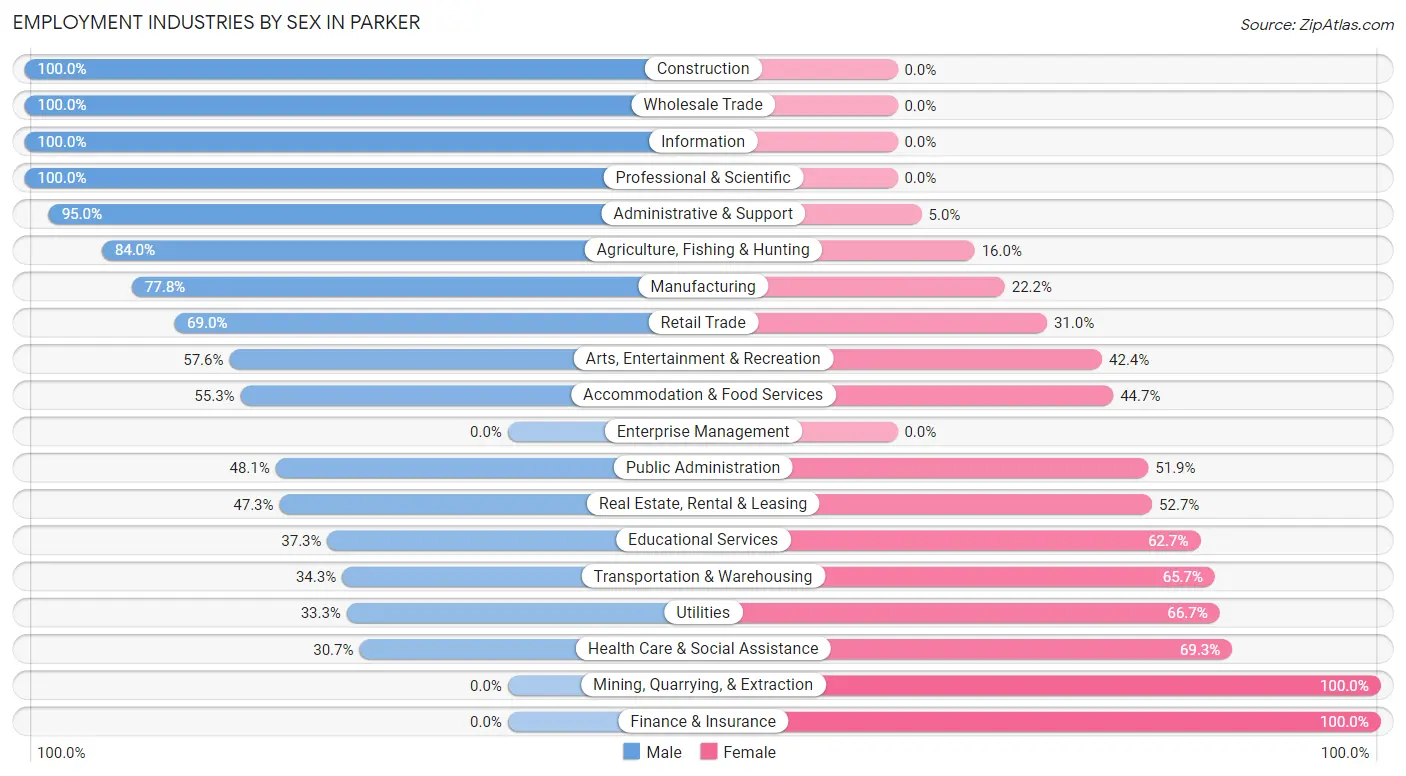
| Industry | Male | Female |
| Agriculture, Fishing & Hunting | 42 (84.0%) | 8 (16.0%) |
| Mining, Quarrying, & Extraction | 0 (0.0%) | 1 (100.0%) |
| Construction | 82 (100.0%) | 0 (0.0%) |
| Manufacturing | 21 (77.8%) | 6 (22.2%) |
| Wholesale Trade | 2 (100.0%) | 0 (0.0%) |
| Retail Trade | 136 (69.0%) | 61 (31.0%) |
| Transportation & Warehousing | 35 (34.3%) | 67 (65.7%) |
| Utilities | 2 (33.3%) | 4 (66.7%) |
| Information | 16 (100.0%) | 0 (0.0%) |
| Finance & Insurance | 0 (0.0%) | 40 (100.0%) |
| Real Estate, Rental & Leasing | 26 (47.3%) | 29 (52.7%) |
| Professional & Scientific | 8 (100.0%) | 0 (0.0%) |
| Enterprise Management | 0 (0.0%) | 0 (0.0%) |
| Administrative & Support | 19 (95.0%) | 1 (5.0%) |
| Educational Services | 56 (37.3%) | 94 (62.7%) |
| Health Care & Social Assistance | 59 (30.7%) | 133 (69.3%) |
| Arts, Entertainment & Recreation | 34 (57.6%) | 25 (42.4%) |
| Accommodation & Food Services | 135 (55.3%) | 109 (44.7%) |
| Public Administration | 149 (48.1%) | 161 (51.9%) |
| Total | 873 (53.5%) | 758 (46.5%) |
Education in Parker
School Enrollment in Parker
The most common levels of schooling among the 821 students in Parker are middle school (205 | 25.0%), high school (190 | 23.1%), and elementary school (147 | 17.9%).
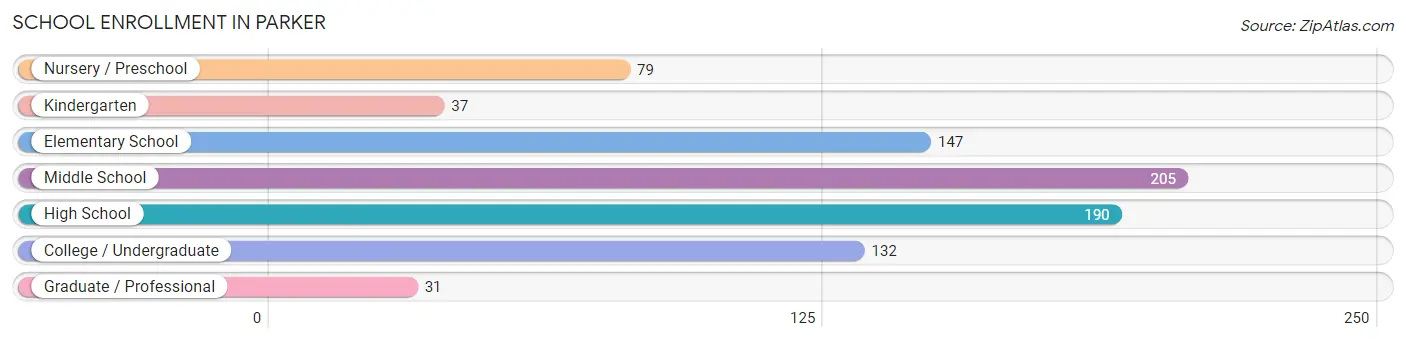
| School Level | # Students | % Students |
| Nursery / Preschool | 79 | 9.6% |
| Kindergarten | 37 | 4.5% |
| Elementary School | 147 | 17.9% |
| Middle School | 205 | 25.0% |
| High School | 190 | 23.1% |
| College / Undergraduate | 132 | 16.1% |
| Graduate / Professional | 31 | 3.8% |
| Total | 821 | 100.0% |
School Enrollment by Age by Funding Source in Parker
Out of a total of 821 students who are enrolled in schools in Parker, 101 (12.3%) attend a private institution, while the remaining 720 (87.7%) are enrolled in public schools. The age group of 35 years and over has the highest likelihood of being enrolled in private schools, with 26 (56.5% in the age bracket) enrolled. Conversely, the age group of 15 to 17 year olds has the lowest likelihood of being enrolled in a private school, with 136 (100.0% in the age bracket) attending a public institution.
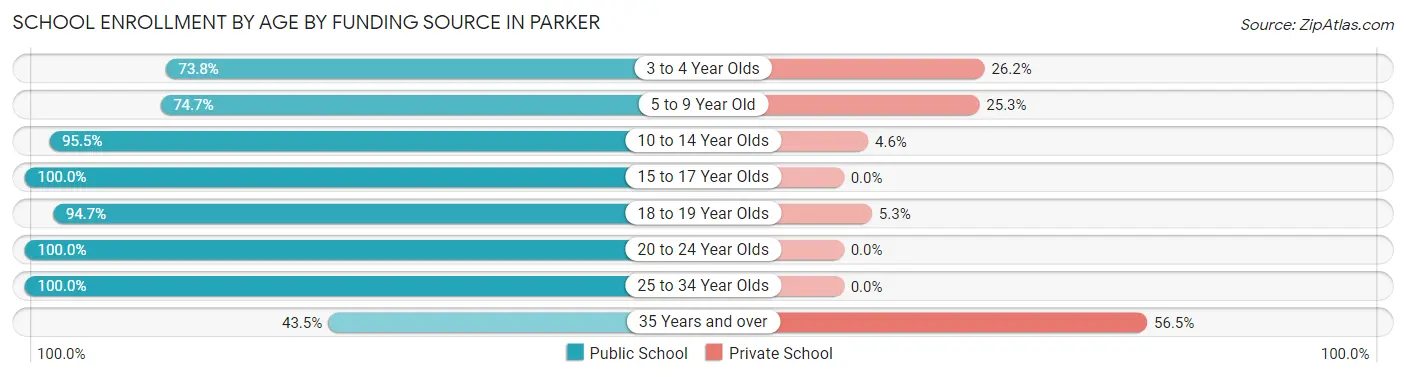
| Age Bracket | Public School | Private School |
| 3 to 4 Year Olds | 45 (73.8%) | 16 (26.2%) |
| 5 to 9 Year Old | 136 (74.7%) | 46 (25.3%) |
| 10 to 14 Year Olds | 252 (95.5%) | 12 (4.5%) |
| 15 to 17 Year Olds | 136 (100.0%) | 0 (0.0%) |
| 18 to 19 Year Olds | 18 (94.7%) | 1 (5.3%) |
| 20 to 24 Year Olds | 51 (100.0%) | 0 (0.0%) |
| 25 to 34 Year Olds | 62 (100.0%) | 0 (0.0%) |
| 35 Years and over | 20 (43.5%) | 26 (56.5%) |
| Total | 720 (87.7%) | 101 (12.3%) |
Educational Attainment by Field of Study in Parker
Education (99 | 27.2%), business (85 | 23.4%), arts & humanities (50 | 13.7%), science & technology (43 | 11.8%), and liberal arts & history (31 | 8.5%) are the most common fields of study among 364 individuals in Parker who have obtained a bachelor's degree or higher.
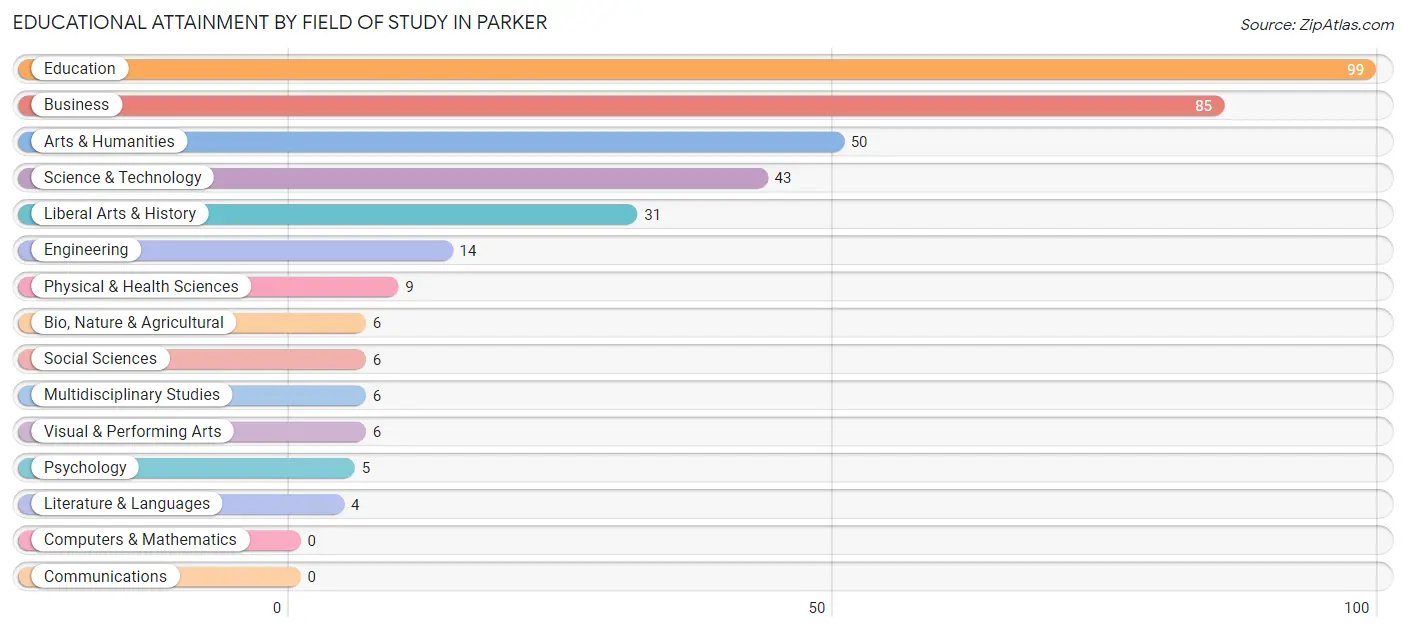
| Field of Study | # Graduates | % Graduates |
| Computers & Mathematics | 0 | 0.0% |
| Bio, Nature & Agricultural | 6 | 1.7% |
| Physical & Health Sciences | 9 | 2.5% |
| Psychology | 5 | 1.4% |
| Social Sciences | 6 | 1.7% |
| Engineering | 14 | 3.8% |
| Multidisciplinary Studies | 6 | 1.7% |
| Science & Technology | 43 | 11.8% |
| Business | 85 | 23.4% |
| Education | 99 | 27.2% |
| Literature & Languages | 4 | 1.1% |
| Liberal Arts & History | 31 | 8.5% |
| Visual & Performing Arts | 6 | 1.7% |
| Communications | 0 | 0.0% |
| Arts & Humanities | 50 | 13.7% |
| Total | 364 | 100.0% |
Transportation & Commute in Parker
Vehicle Availability by Sex in Parker
The most prevalent vehicle ownership categories in Parker are males with 2 vehicles (365, accounting for 41.1%) and females with 2 vehicles (389, making up 49.4%).
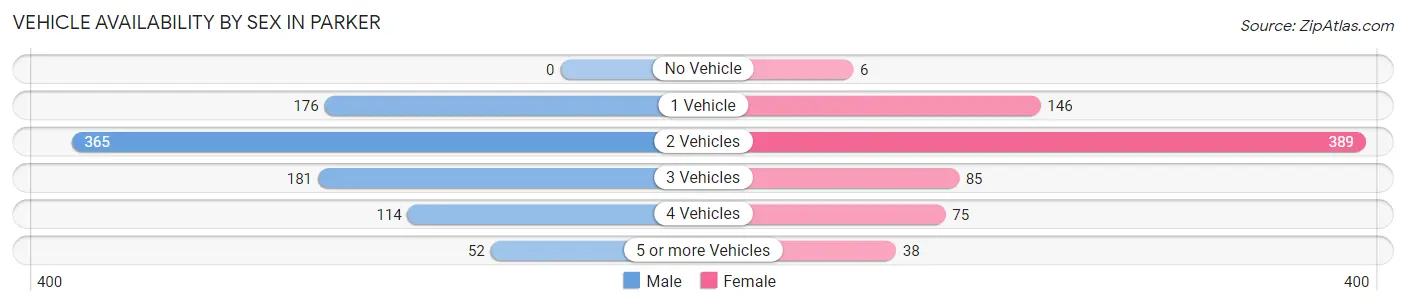
| Vehicles Available | Male | Female |
| No Vehicle | 0 (0.0%) | 6 (0.8%) |
| 1 Vehicle | 176 (19.8%) | 146 (19.8%) |
| 2 Vehicles | 365 (41.1%) | 389 (52.6%) |
| 3 Vehicles | 181 (20.4%) | 85 (11.5%) |
| 4 Vehicles | 114 (12.8%) | 75 (10.2%) |
| 5 or more Vehicles | 52 (5.9%) | 38 (5.1%) |
| Total | 888 (100.0%) | 739 (100.0%) |
Commute Time in Parker
The most frequently occuring commute durations in Parker are 5 to 9 minutes (617 commuters, 39.8%), less than 5 minutes (305 commuters, 19.7%), and 10 to 14 minutes (226 commuters, 14.6%).
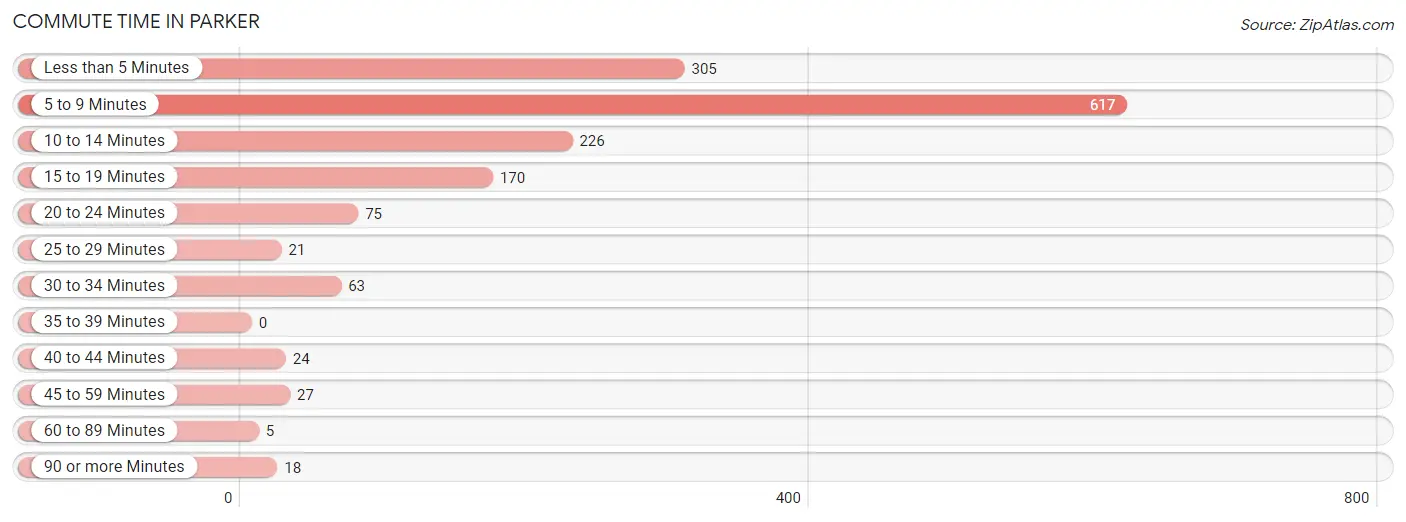
| Commute Time | # Commuters | % Commuters |
| Less than 5 Minutes | 305 | 19.7% |
| 5 to 9 Minutes | 617 | 39.8% |
| 10 to 14 Minutes | 226 | 14.6% |
| 15 to 19 Minutes | 170 | 11.0% |
| 20 to 24 Minutes | 75 | 4.8% |
| 25 to 29 Minutes | 21 | 1.3% |
| 30 to 34 Minutes | 63 | 4.1% |
| 35 to 39 Minutes | 0 | 0.0% |
| 40 to 44 Minutes | 24 | 1.5% |
| 45 to 59 Minutes | 27 | 1.7% |
| 60 to 89 Minutes | 5 | 0.3% |
| 90 or more Minutes | 18 | 1.2% |
Commute Time by Sex in Parker
The most common commute times in Parker are 5 to 9 minutes (348 commuters, 41.2%) for males and 5 to 9 minutes (269 commuters, 38.1%) for females.
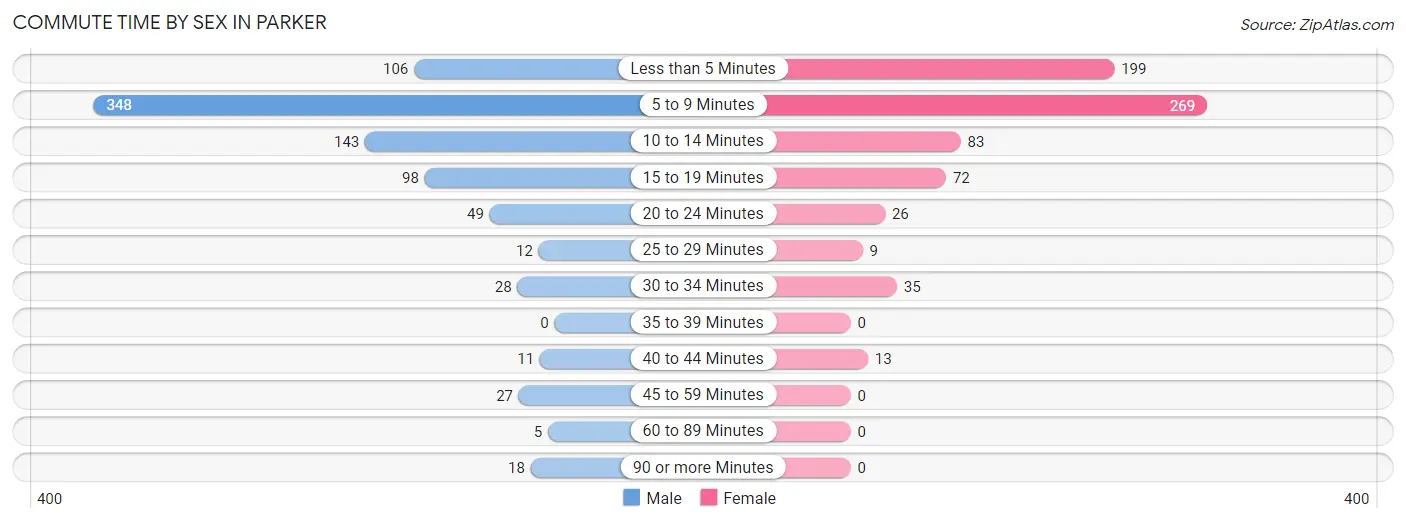
| Commute Time | Male | Female |
| Less than 5 Minutes | 106 (12.5%) | 199 (28.2%) |
| 5 to 9 Minutes | 348 (41.2%) | 269 (38.1%) |
| 10 to 14 Minutes | 143 (16.9%) | 83 (11.8%) |
| 15 to 19 Minutes | 98 (11.6%) | 72 (10.2%) |
| 20 to 24 Minutes | 49 (5.8%) | 26 (3.7%) |
| 25 to 29 Minutes | 12 (1.4%) | 9 (1.3%) |
| 30 to 34 Minutes | 28 (3.3%) | 35 (5.0%) |
| 35 to 39 Minutes | 0 (0.0%) | 0 (0.0%) |
| 40 to 44 Minutes | 11 (1.3%) | 13 (1.8%) |
| 45 to 59 Minutes | 27 (3.2%) | 0 (0.0%) |
| 60 to 89 Minutes | 5 (0.6%) | 0 (0.0%) |
| 90 or more Minutes | 18 (2.1%) | 0 (0.0%) |
Time of Departure to Work by Sex in Parker
The most frequent times of departure to work in Parker are 7:30 AM to 7:59 AM (137, 16.2%) for males and 7:30 AM to 7:59 AM (225, 31.9%) for females.
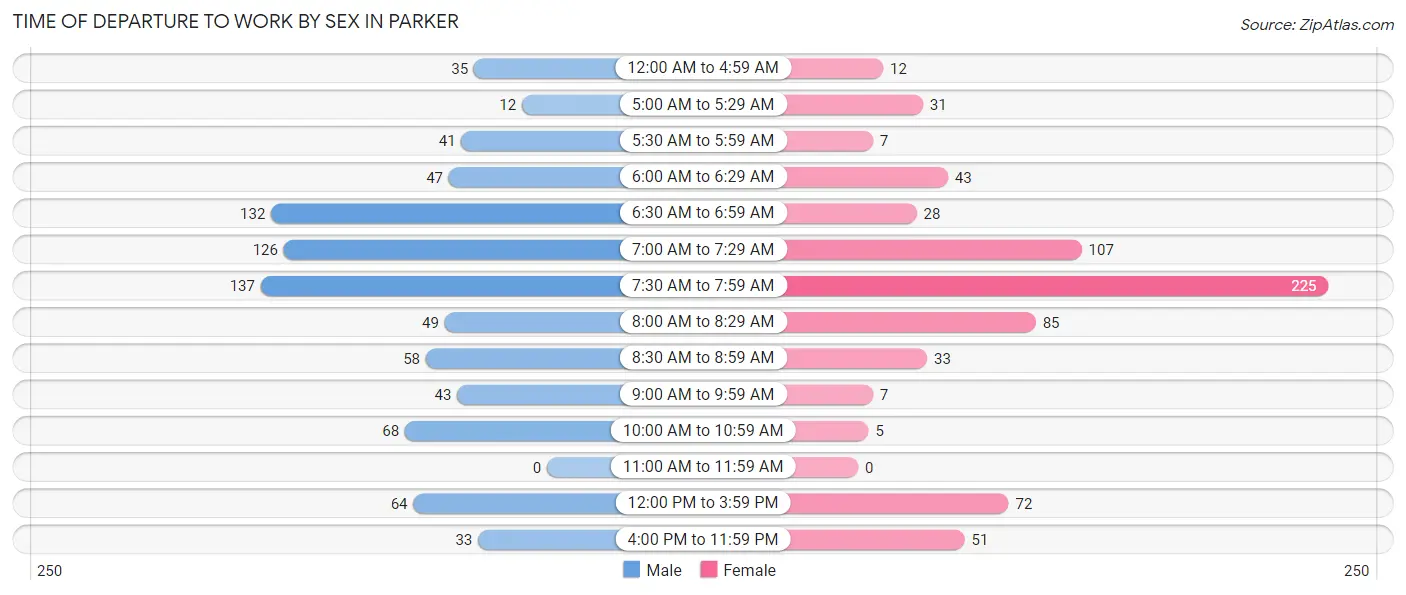
| Time of Departure | Male | Female |
| 12:00 AM to 4:59 AM | 35 (4.1%) | 12 (1.7%) |
| 5:00 AM to 5:29 AM | 12 (1.4%) | 31 (4.4%) |
| 5:30 AM to 5:59 AM | 41 (4.9%) | 7 (1.0%) |
| 6:00 AM to 6:29 AM | 47 (5.6%) | 43 (6.1%) |
| 6:30 AM to 6:59 AM | 132 (15.6%) | 28 (4.0%) |
| 7:00 AM to 7:29 AM | 126 (14.9%) | 107 (15.2%) |
| 7:30 AM to 7:59 AM | 137 (16.2%) | 225 (31.9%) |
| 8:00 AM to 8:29 AM | 49 (5.8%) | 85 (12.0%) |
| 8:30 AM to 8:59 AM | 58 (6.9%) | 33 (4.7%) |
| 9:00 AM to 9:59 AM | 43 (5.1%) | 7 (1.0%) |
| 10:00 AM to 10:59 AM | 68 (8.1%) | 5 (0.7%) |
| 11:00 AM to 11:59 AM | 0 (0.0%) | 0 (0.0%) |
| 12:00 PM to 3:59 PM | 64 (7.6%) | 72 (10.2%) |
| 4:00 PM to 11:59 PM | 33 (3.9%) | 51 (7.2%) |
| Total | 845 (100.0%) | 706 (100.0%) |
Housing Occupancy in Parker
Occupancy by Ownership in Parker
Of the total 1,395 dwellings in Parker, owner-occupied units account for 853 (61.2%), while renter-occupied units make up 542 (38.9%).
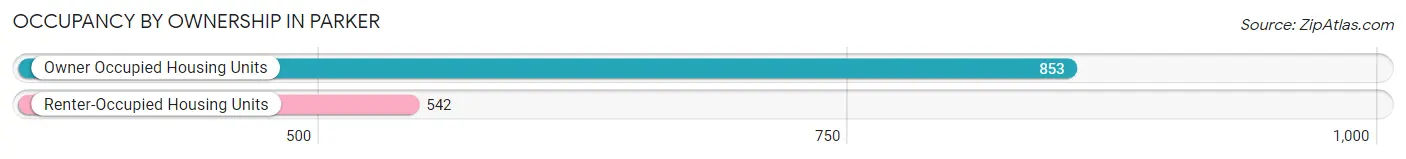
| Occupancy | # Housing Units | % Housing Units |
| Owner Occupied Housing Units | 853 | 61.2% |
| Renter-Occupied Housing Units | 542 | 38.9% |
| Total Occupied Housing Units | 1,395 | 100.0% |
Occupancy by Household Size in Parker
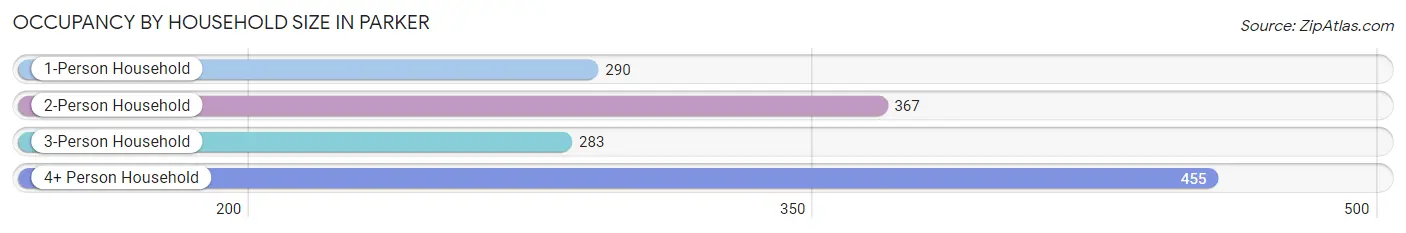
| Household Size | # Housing Units | % Housing Units |
| 1-Person Household | 290 | 20.8% |
| 2-Person Household | 367 | 26.3% |
| 3-Person Household | 283 | 20.3% |
| 4+ Person Household | 455 | 32.6% |
| Total Housing Units | 1,395 | 100.0% |
Occupancy by Ownership by Household Size in Parker
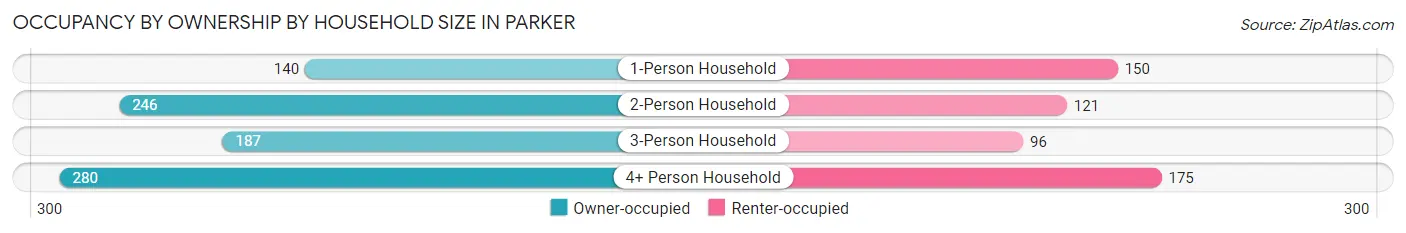
| Household Size | Owner-occupied | Renter-occupied |
| 1-Person Household | 140 (48.3%) | 150 (51.7%) |
| 2-Person Household | 246 (67.0%) | 121 (33.0%) |
| 3-Person Household | 187 (66.1%) | 96 (33.9%) |
| 4+ Person Household | 280 (61.5%) | 175 (38.5%) |
| Total Housing Units | 853 (61.2%) | 542 (38.9%) |
Occupancy by Educational Attainment in Parker
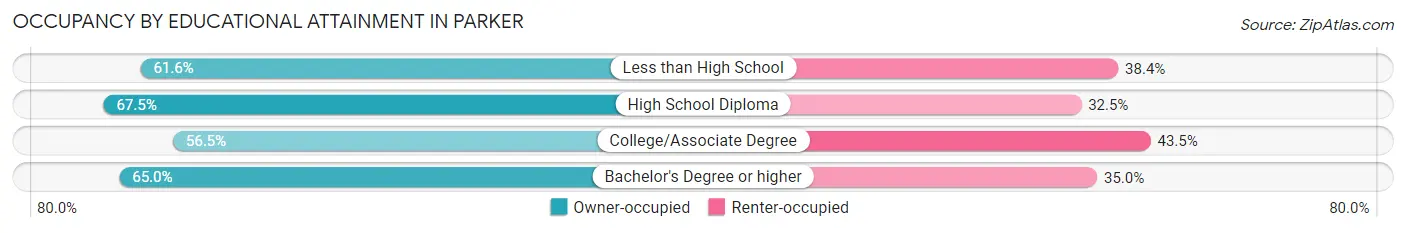
| Household Size | Owner-occupied | Renter-occupied |
| Less than High School | 114 (61.6%) | 71 (38.4%) |
| High School Diploma | 249 (67.5%) | 120 (32.5%) |
| College/Associate Degree | 375 (56.5%) | 289 (43.5%) |
| Bachelor's Degree or higher | 115 (65.0%) | 62 (35.0%) |
Occupancy by Age of Householder in Parker
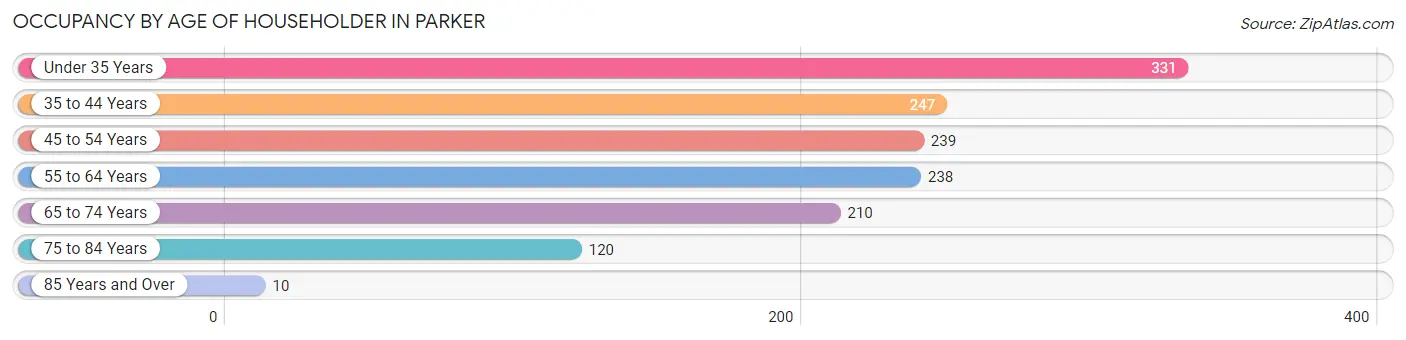
| Age Bracket | # Households | % Households |
| Under 35 Years | 331 | 23.7% |
| 35 to 44 Years | 247 | 17.7% |
| 45 to 54 Years | 239 | 17.1% |
| 55 to 64 Years | 238 | 17.1% |
| 65 to 74 Years | 210 | 15.0% |
| 75 to 84 Years | 120 | 8.6% |
| 85 Years and Over | 10 | 0.7% |
| Total | 1,395 | 100.0% |
Housing Finances in Parker
Median Income by Occupancy in Parker
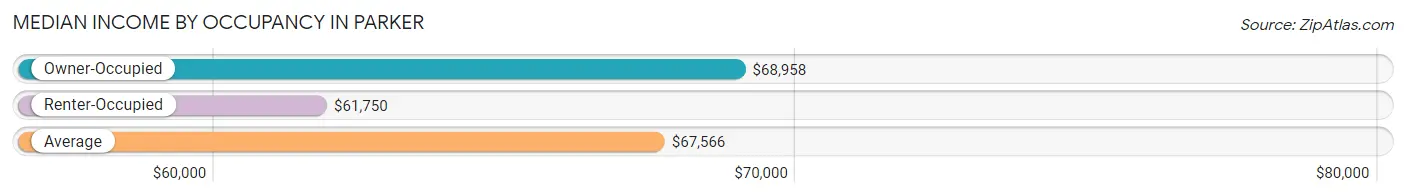
| Occupancy Type | # Households | Median Income |
| Owner-Occupied | 853 (61.2%) | $68,958 |
| Renter-Occupied | 542 (38.9%) | $61,750 |
| Average | 1,395 (100.0%) | $67,566 |
Occupancy by Householder Income Bracket in Parker
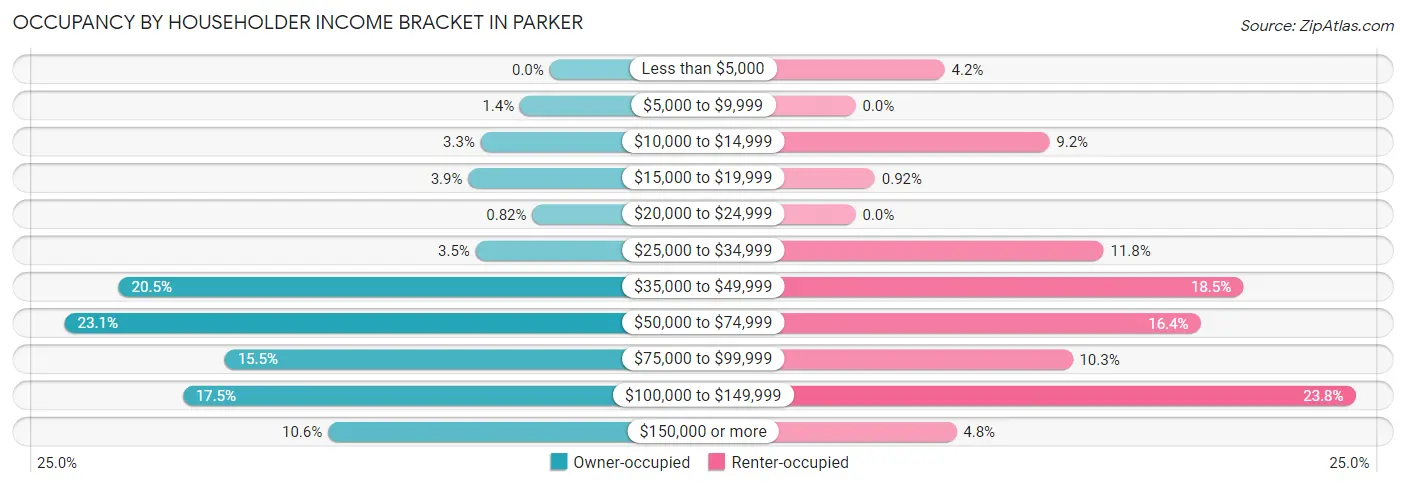
| Income Bracket | Owner-occupied | Renter-occupied |
| Less than $5,000 | 0 (0.0%) | 23 (4.2%) |
| $5,000 to $9,999 | 12 (1.4%) | 0 (0.0%) |
| $10,000 to $14,999 | 28 (3.3%) | 50 (9.2%) |
| $15,000 to $19,999 | 33 (3.9%) | 5 (0.9%) |
| $20,000 to $24,999 | 7 (0.8%) | 0 (0.0%) |
| $25,000 to $34,999 | 30 (3.5%) | 64 (11.8%) |
| $35,000 to $49,999 | 175 (20.5%) | 100 (18.4%) |
| $50,000 to $74,999 | 197 (23.1%) | 89 (16.4%) |
| $75,000 to $99,999 | 132 (15.5%) | 56 (10.3%) |
| $100,000 to $149,999 | 149 (17.5%) | 129 (23.8%) |
| $150,000 or more | 90 (10.5%) | 26 (4.8%) |
| Total | 853 (100.0%) | 542 (100.0%) |
Monthly Housing Cost Tiers in Parker
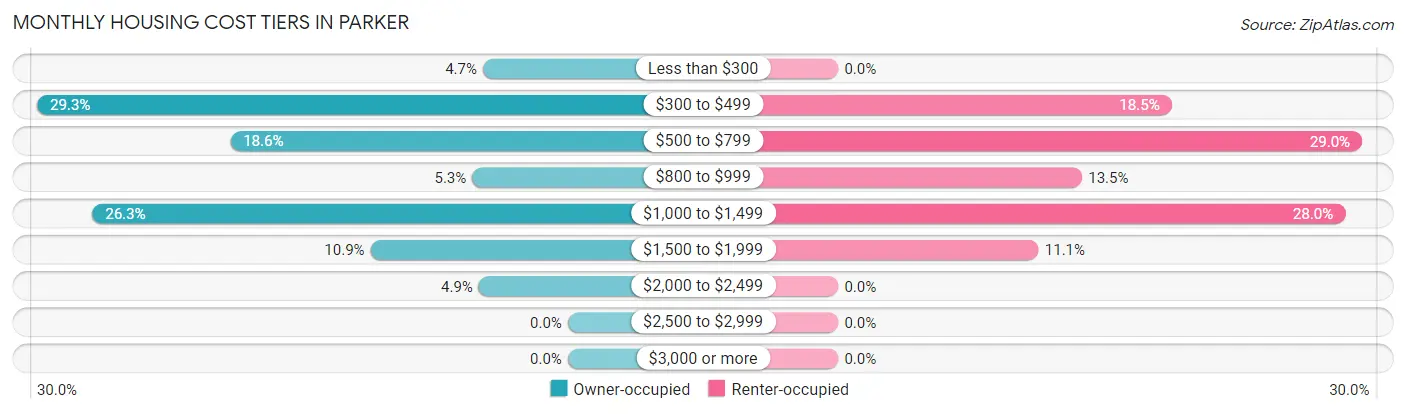
| Monthly Cost | Owner-occupied | Renter-occupied |
| Less than $300 | 40 (4.7%) | 0 (0.0%) |
| $300 to $499 | 250 (29.3%) | 100 (18.4%) |
| $500 to $799 | 159 (18.6%) | 157 (29.0%) |
| $800 to $999 | 45 (5.3%) | 73 (13.5%) |
| $1,000 to $1,499 | 224 (26.3%) | 152 (28.0%) |
| $1,500 to $1,999 | 93 (10.9%) | 60 (11.1%) |
| $2,000 to $2,499 | 42 (4.9%) | 0 (0.0%) |
| $2,500 to $2,999 | 0 (0.0%) | 0 (0.0%) |
| $3,000 or more | 0 (0.0%) | 0 (0.0%) |
| Total | 853 (100.0%) | 542 (100.0%) |
Physical Housing Characteristics in Parker
Housing Structures in Parker
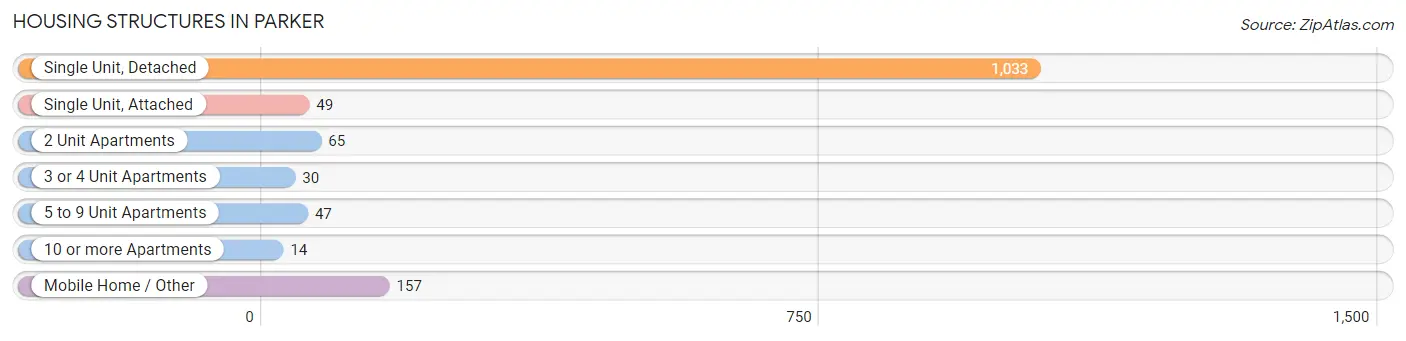
| Structure Type | # Housing Units | % Housing Units |
| Single Unit, Detached | 1,033 | 74.1% |
| Single Unit, Attached | 49 | 3.5% |
| 2 Unit Apartments | 65 | 4.7% |
| 3 or 4 Unit Apartments | 30 | 2.1% |
| 5 to 9 Unit Apartments | 47 | 3.4% |
| 10 or more Apartments | 14 | 1.0% |
| Mobile Home / Other | 157 | 11.3% |
| Total | 1,395 | 100.0% |
Housing Structures by Occupancy in Parker
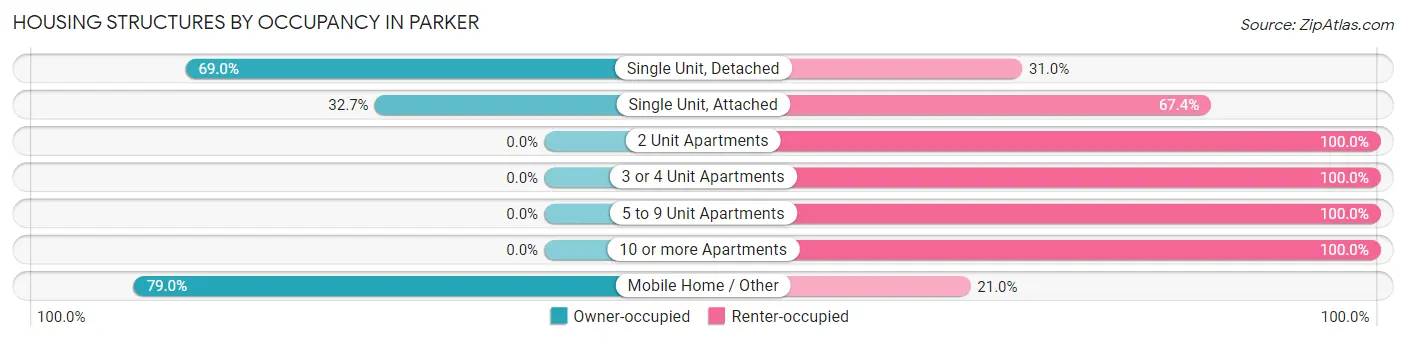
| Structure Type | Owner-occupied | Renter-occupied |
| Single Unit, Detached | 713 (69.0%) | 320 (31.0%) |
| Single Unit, Attached | 16 (32.7%) | 33 (67.3%) |
| 2 Unit Apartments | 0 (0.0%) | 65 (100.0%) |
| 3 or 4 Unit Apartments | 0 (0.0%) | 30 (100.0%) |
| 5 to 9 Unit Apartments | 0 (0.0%) | 47 (100.0%) |
| 10 or more Apartments | 0 (0.0%) | 14 (100.0%) |
| Mobile Home / Other | 124 (79.0%) | 33 (21.0%) |
| Total | 853 (61.2%) | 542 (38.9%) |
Housing Structures by Number of Rooms in Parker
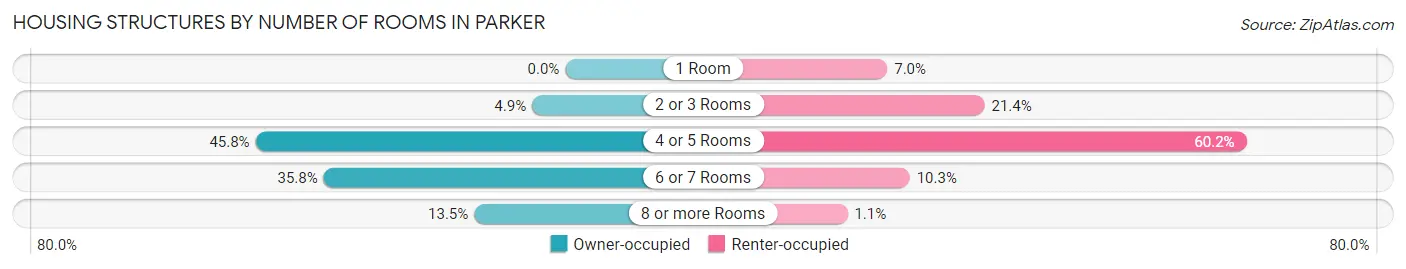
| Number of Rooms | Owner-occupied | Renter-occupied |
| 1 Room | 0 (0.0%) | 38 (7.0%) |
| 2 or 3 Rooms | 42 (4.9%) | 116 (21.4%) |
| 4 or 5 Rooms | 391 (45.8%) | 326 (60.2%) |
| 6 or 7 Rooms | 305 (35.8%) | 56 (10.3%) |
| 8 or more Rooms | 115 (13.5%) | 6 (1.1%) |
| Total | 853 (100.0%) | 542 (100.0%) |
Housing Structure by Heating Type in Parker
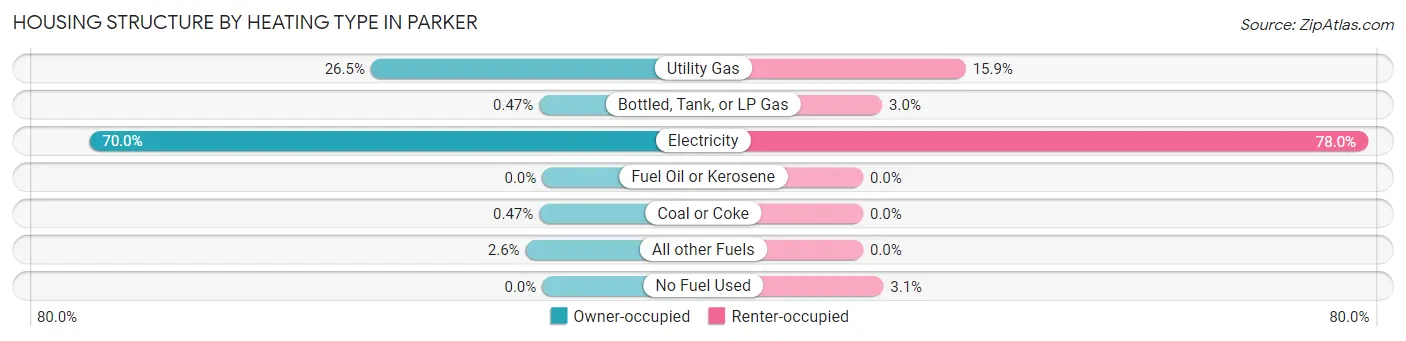
| Heating Type | Owner-occupied | Renter-occupied |
| Utility Gas | 226 (26.5%) | 86 (15.9%) |
| Bottled, Tank, or LP Gas | 4 (0.5%) | 16 (2.9%) |
| Electricity | 597 (70.0%) | 423 (78.0%) |
| Fuel Oil or Kerosene | 0 (0.0%) | 0 (0.0%) |
| Coal or Coke | 4 (0.5%) | 0 (0.0%) |
| All other Fuels | 22 (2.6%) | 0 (0.0%) |
| No Fuel Used | 0 (0.0%) | 17 (3.1%) |
| Total | 853 (100.0%) | 542 (100.0%) |
Household Vehicle Usage in Parker
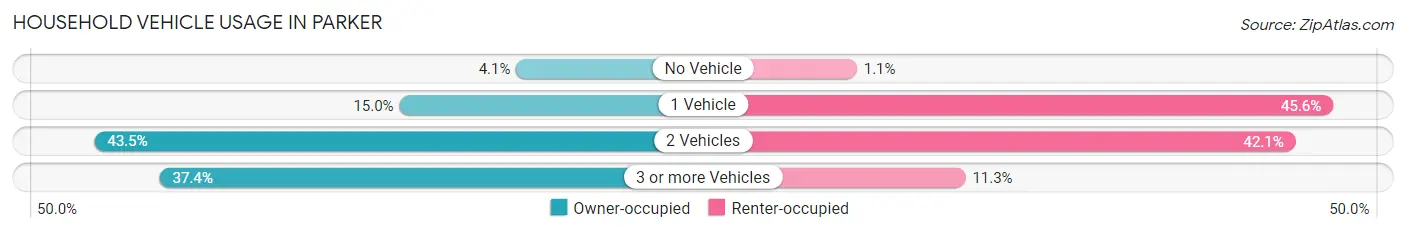
| Vehicles per Household | Owner-occupied | Renter-occupied |
| No Vehicle | 35 (4.1%) | 6 (1.1%) |
| 1 Vehicle | 128 (15.0%) | 247 (45.6%) |
| 2 Vehicles | 371 (43.5%) | 228 (42.1%) |
| 3 or more Vehicles | 319 (37.4%) | 61 (11.3%) |
| Total | 853 (100.0%) | 542 (100.0%) |
Real Estate & Mortgages in Parker
Real Estate and Mortgage Overview in Parker
| Characteristic | Without Mortgage | With Mortgage |
| Housing Units | 380 | 473 |
| Median Property Value | $213,000 | $236,000 |
| Median Household Income | $49,871 | $83 |
| Monthly Housing Costs | $365 | $0 |
| Real Estate Taxes | $976 | $44 |
Property Value by Mortgage Status in Parker
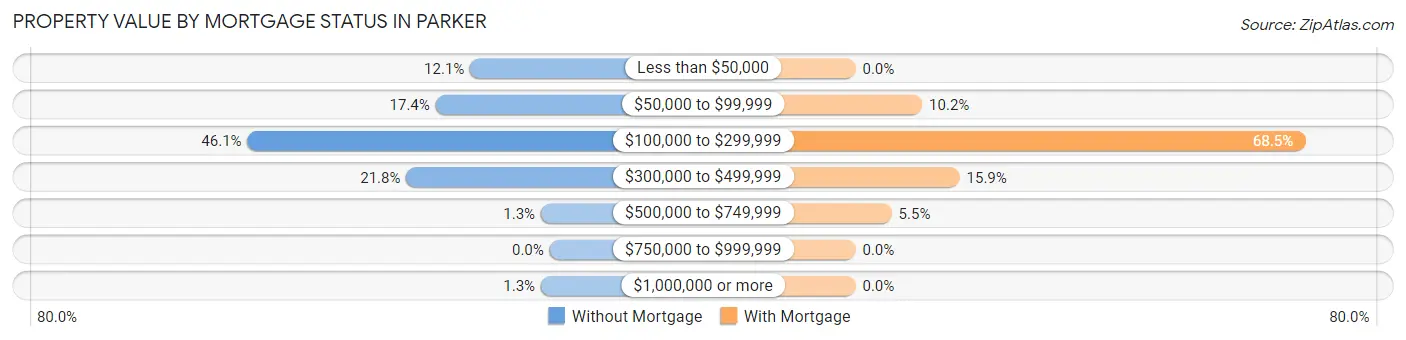
| Property Value | Without Mortgage | With Mortgage |
| Less than $50,000 | 46 (12.1%) | 0 (0.0%) |
| $50,000 to $99,999 | 66 (17.4%) | 48 (10.2%) |
| $100,000 to $299,999 | 175 (46.1%) | 324 (68.5%) |
| $300,000 to $499,999 | 83 (21.8%) | 75 (15.9%) |
| $500,000 to $749,999 | 5 (1.3%) | 26 (5.5%) |
| $750,000 to $999,999 | 0 (0.0%) | 0 (0.0%) |
| $1,000,000 or more | 5 (1.3%) | 0 (0.0%) |
| Total | 380 (100.0%) | 473 (100.0%) |
Household Income by Mortgage Status in Parker
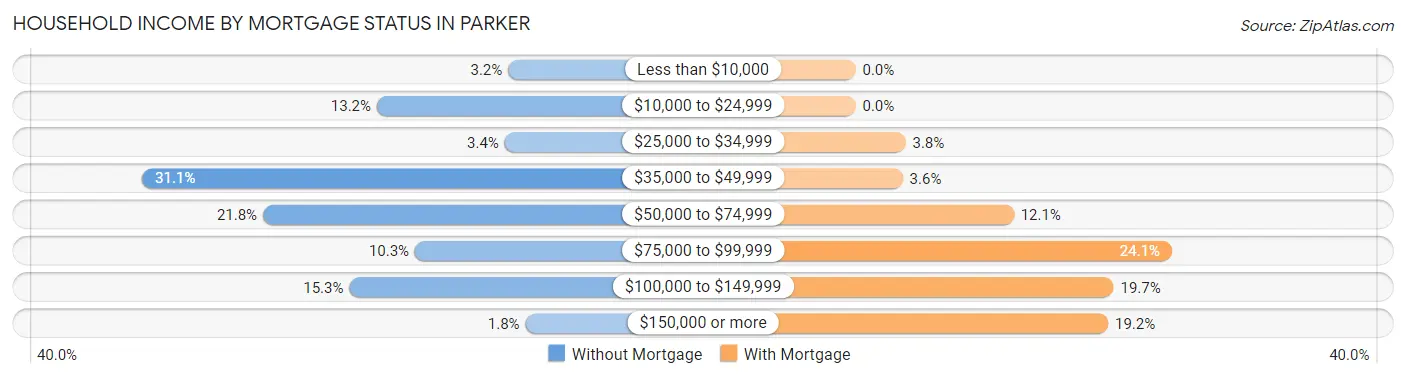
| Household Income | Without Mortgage | With Mortgage |
| Less than $10,000 | 12 (3.2%) | 0 (0.0%) |
| $10,000 to $24,999 | 50 (13.2%) | 0 (0.0%) |
| $25,000 to $34,999 | 13 (3.4%) | 18 (3.8%) |
| $35,000 to $49,999 | 118 (31.0%) | 17 (3.6%) |
| $50,000 to $74,999 | 83 (21.8%) | 57 (12.0%) |
| $75,000 to $99,999 | 39 (10.3%) | 114 (24.1%) |
| $100,000 to $149,999 | 58 (15.3%) | 93 (19.7%) |
| $150,000 or more | 7 (1.8%) | 91 (19.2%) |
| Total | 380 (100.0%) | 473 (100.0%) |
Property Value to Household Income Ratio in Parker
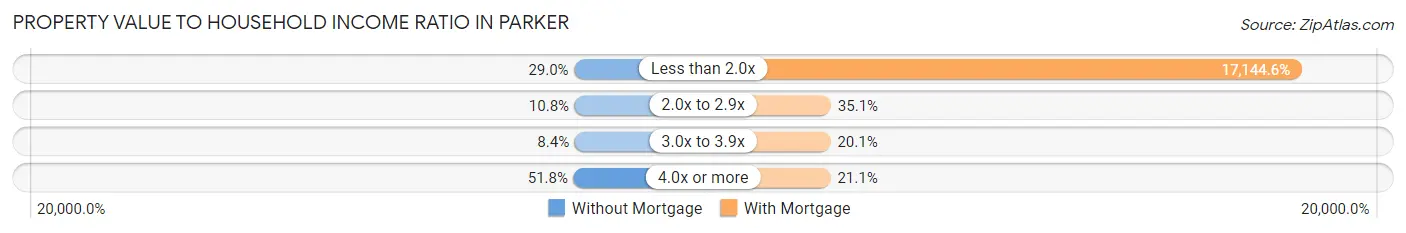
| Value-to-Income Ratio | Without Mortgage | With Mortgage |
| Less than 2.0x | 110 (28.9%) | 81,094 (17,144.6%) |
| 2.0x to 2.9x | 41 (10.8%) | 166 (35.1%) |
| 3.0x to 3.9x | 32 (8.4%) | 95 (20.1%) |
| 4.0x or more | 197 (51.8%) | 100 (21.1%) |
| Total | 380 (100.0%) | 473 (100.0%) |
Real Estate Taxes by Mortgage Status in Parker
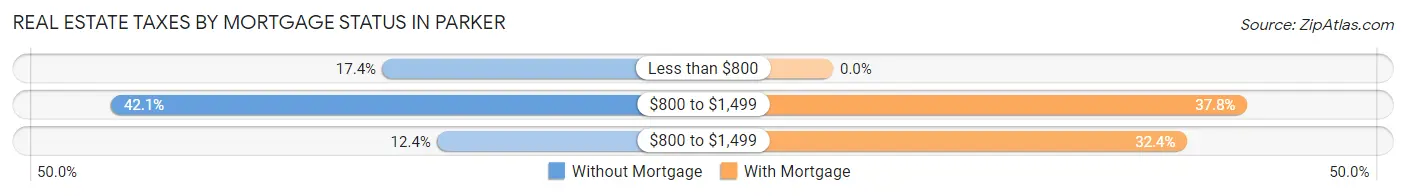
| Property Taxes | Without Mortgage | With Mortgage |
| Less than $800 | 66 (17.4%) | 0 (0.0%) |
| $800 to $1,499 | 160 (42.1%) | 179 (37.8%) |
| $800 to $1,499 | 47 (12.4%) | 153 (32.4%) |
| Total | 380 (100.0%) | 473 (100.0%) |
Health & Disability in Parker
Health Insurance Coverage by Age in Parker
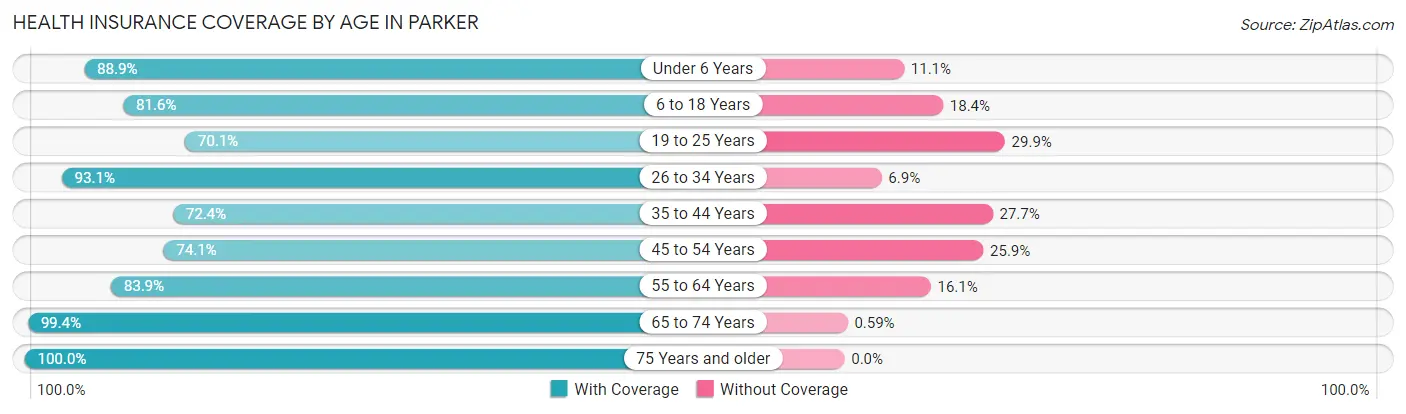
| Age Bracket | With Coverage | Without Coverage |
| Under 6 Years | 264 (88.9%) | 33 (11.1%) |
| 6 to 18 Years | 484 (81.6%) | 109 (18.4%) |
| 19 to 25 Years | 143 (70.1%) | 61 (29.9%) |
| 26 to 34 Years | 390 (93.1%) | 29 (6.9%) |
| 35 to 44 Years | 314 (72.4%) | 120 (27.7%) |
| 45 to 54 Years | 292 (74.1%) | 102 (25.9%) |
| 55 to 64 Years | 318 (83.9%) | 61 (16.1%) |
| 65 to 74 Years | 338 (99.4%) | 2 (0.6%) |
| 75 Years and older | 201 (100.0%) | 0 (0.0%) |
| Total | 2,744 (84.2%) | 517 (15.9%) |
Health Insurance Coverage by Citizenship Status in Parker
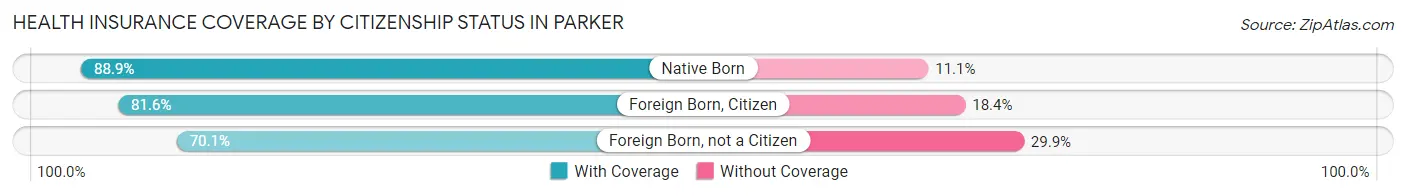
| Citizenship Status | With Coverage | Without Coverage |
| Native Born | 264 (88.9%) | 33 (11.1%) |
| Foreign Born, Citizen | 484 (81.6%) | 109 (18.4%) |
| Foreign Born, not a Citizen | 143 (70.1%) | 61 (29.9%) |
Health Insurance Coverage by Household Income in Parker
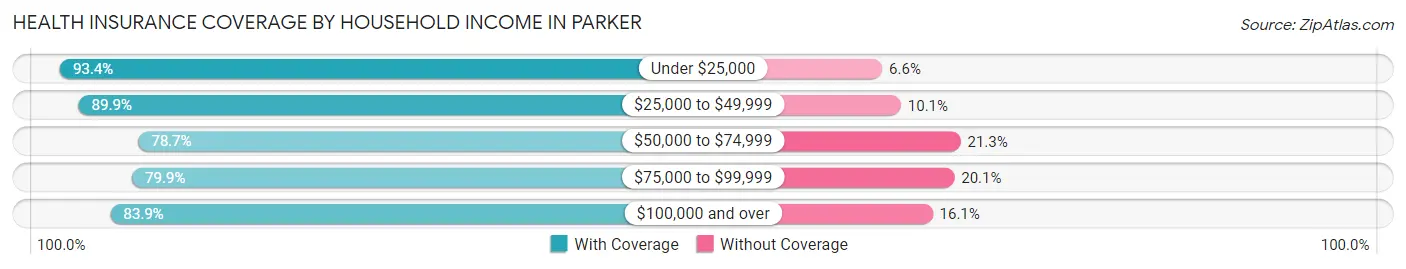
| Household Income | With Coverage | Without Coverage |
| Under $25,000 | 169 (93.4%) | 12 (6.6%) |
| $25,000 to $49,999 | 683 (89.9%) | 77 (10.1%) |
| $50,000 to $74,999 | 565 (78.7%) | 153 (21.3%) |
| $75,000 to $99,999 | 353 (79.9%) | 89 (20.1%) |
| $100,000 and over | 971 (83.9%) | 186 (16.1%) |
Public vs Private Health Insurance Coverage by Age in Parker
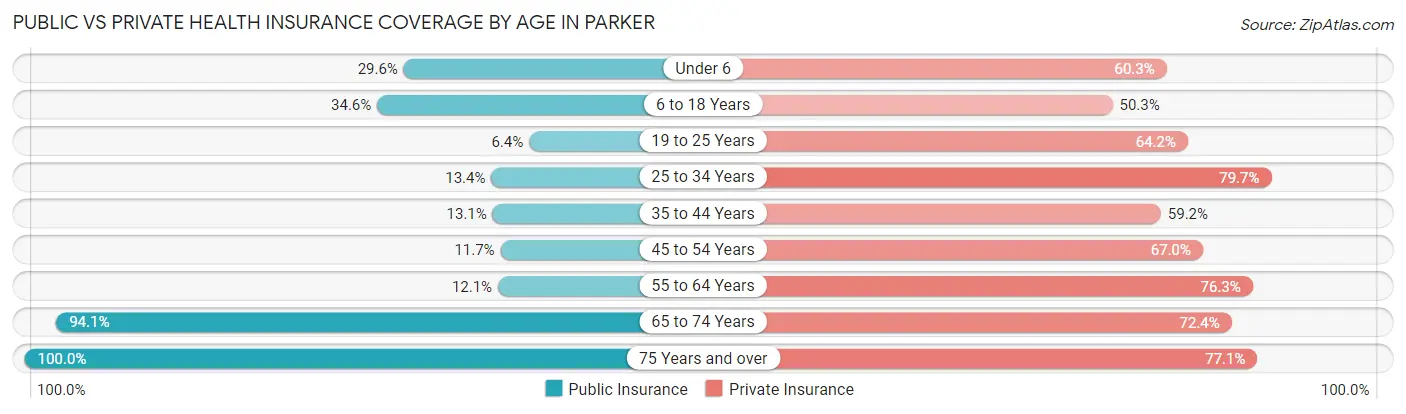
| Age Bracket | Public Insurance | Private Insurance |
| Under 6 | 88 (29.6%) | 179 (60.3%) |
| 6 to 18 Years | 205 (34.6%) | 298 (50.2%) |
| 19 to 25 Years | 13 (6.4%) | 131 (64.2%) |
| 25 to 34 Years | 56 (13.4%) | 334 (79.7%) |
| 35 to 44 Years | 57 (13.1%) | 257 (59.2%) |
| 45 to 54 Years | 46 (11.7%) | 264 (67.0%) |
| 55 to 64 Years | 46 (12.1%) | 289 (76.2%) |
| 65 to 74 Years | 320 (94.1%) | 246 (72.4%) |
| 75 Years and over | 201 (100.0%) | 155 (77.1%) |
| Total | 1,032 (31.7%) | 2,153 (66.0%) |
Disability Status by Sex by Age in Parker
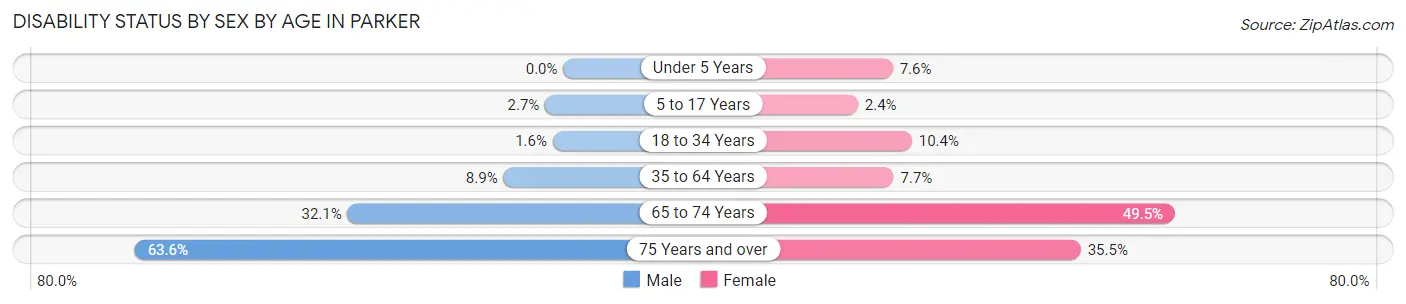
| Age Bracket | Male | Female |
| Under 5 Years | 0 (0.0%) | 9 (7.6%) |
| 5 to 17 Years | 10 (2.7%) | 6 (2.4%) |
| 18 to 34 Years | 5 (1.6%) | 34 (10.4%) |
| 35 to 64 Years | 53 (8.9%) | 47 (7.7%) |
| 65 to 74 Years | 50 (32.1%) | 91 (49.5%) |
| 75 Years and over | 49 (63.6%) | 44 (35.5%) |
Disability Class by Sex by Age in Parker
Disability Class: Hearing Difficulty
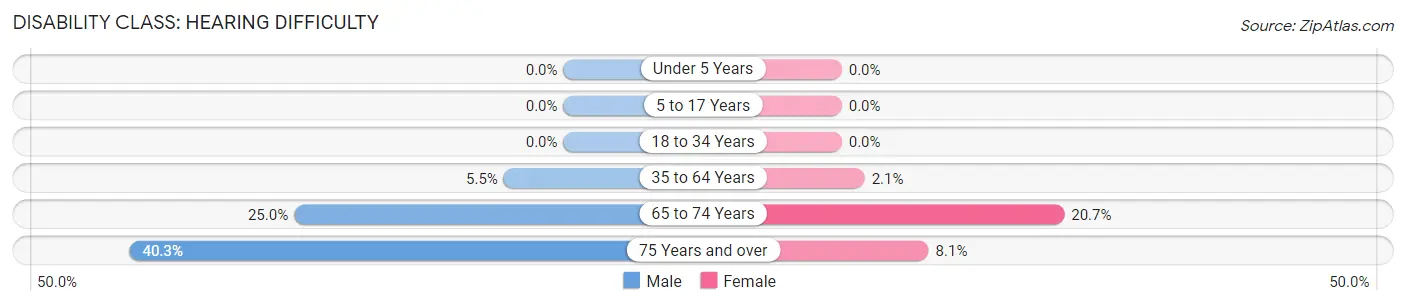
| Age Bracket | Male | Female |
| Under 5 Years | 0 (0.0%) | 0 (0.0%) |
| 5 to 17 Years | 0 (0.0%) | 0 (0.0%) |
| 18 to 34 Years | 0 (0.0%) | 0 (0.0%) |
| 35 to 64 Years | 33 (5.5%) | 13 (2.1%) |
| 65 to 74 Years | 39 (25.0%) | 38 (20.6%) |
| 75 Years and over | 31 (40.3%) | 10 (8.1%) |
Disability Class: Vision Difficulty
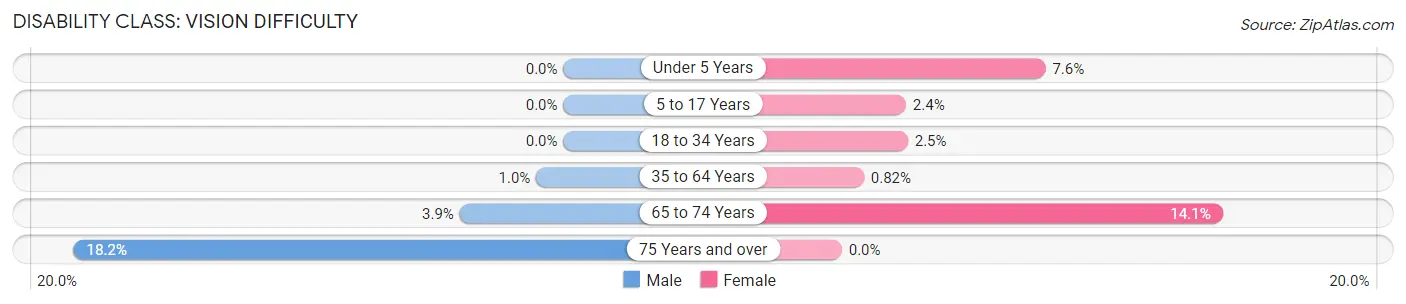
| Age Bracket | Male | Female |
| Under 5 Years | 0 (0.0%) | 9 (7.6%) |
| 5 to 17 Years | 0 (0.0%) | 6 (2.4%) |
| 18 to 34 Years | 0 (0.0%) | 8 (2.5%) |
| 35 to 64 Years | 6 (1.0%) | 5 (0.8%) |
| 65 to 74 Years | 6 (3.8%) | 26 (14.1%) |
| 75 Years and over | 14 (18.2%) | 0 (0.0%) |
Disability Class: Cognitive Difficulty
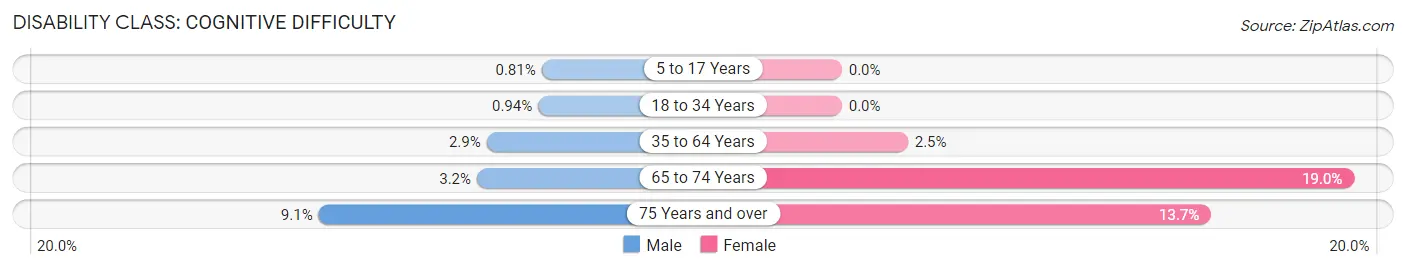
| Age Bracket | Male | Female |
| 5 to 17 Years | 3 (0.8%) | 0 (0.0%) |
| 18 to 34 Years | 3 (0.9%) | 0 (0.0%) |
| 35 to 64 Years | 17 (2.9%) | 15 (2.5%) |
| 65 to 74 Years | 5 (3.2%) | 35 (19.0%) |
| 75 Years and over | 7 (9.1%) | 17 (13.7%) |
Disability Class: Ambulatory Difficulty
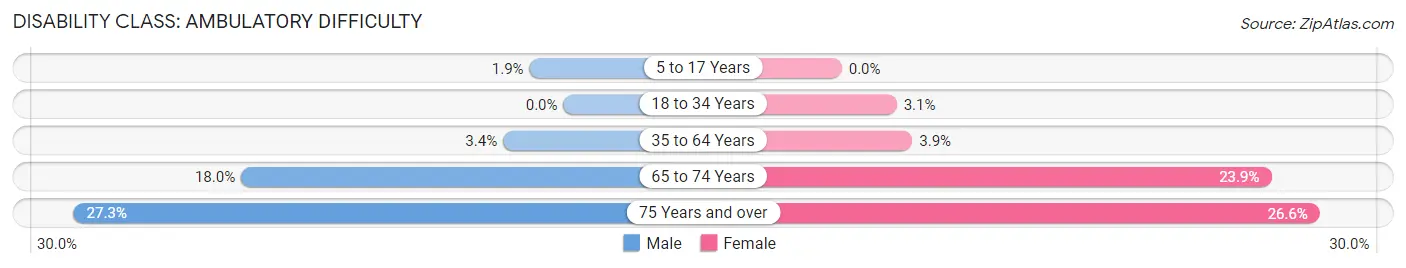
| Age Bracket | Male | Female |
| 5 to 17 Years | 7 (1.9%) | 0 (0.0%) |
| 18 to 34 Years | 0 (0.0%) | 10 (3.1%) |
| 35 to 64 Years | 20 (3.4%) | 24 (3.9%) |
| 65 to 74 Years | 28 (17.9%) | 44 (23.9%) |
| 75 Years and over | 21 (27.3%) | 33 (26.6%) |
Disability Class: Self-Care Difficulty
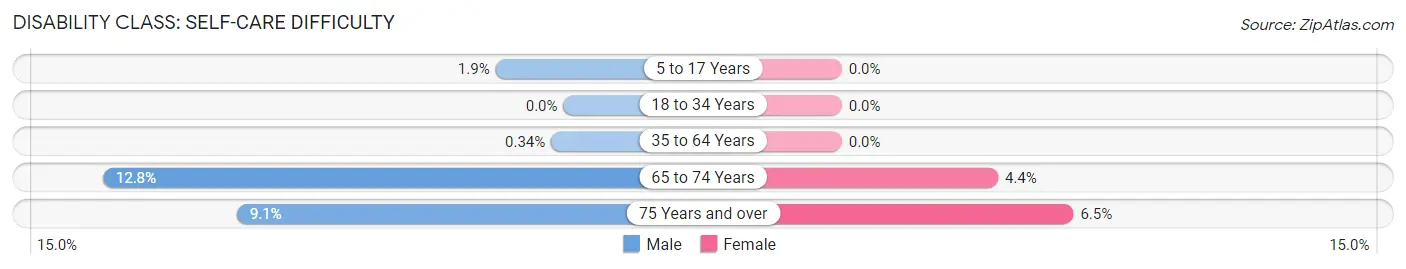
| Age Bracket | Male | Female |
| 5 to 17 Years | 7 (1.9%) | 0 (0.0%) |
| 18 to 34 Years | 0 (0.0%) | 0 (0.0%) |
| 35 to 64 Years | 2 (0.3%) | 0 (0.0%) |
| 65 to 74 Years | 20 (12.8%) | 8 (4.3%) |
| 75 Years and over | 7 (9.1%) | 8 (6.5%) |
Technology Access in Parker
Computing Device Access in Parker
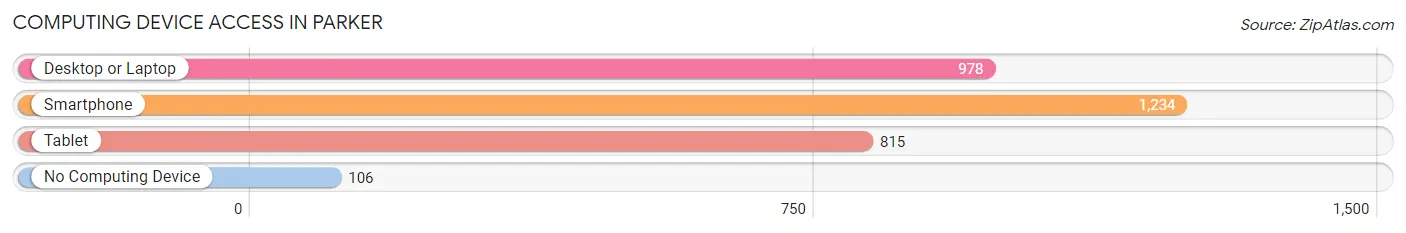
| Device Type | # Households | % Households |
| Desktop or Laptop | 978 | 70.1% |
| Smartphone | 1,234 | 88.5% |
| Tablet | 815 | 58.4% |
| No Computing Device | 106 | 7.6% |
| Total | 1,395 | 100.0% |
Internet Access in Parker
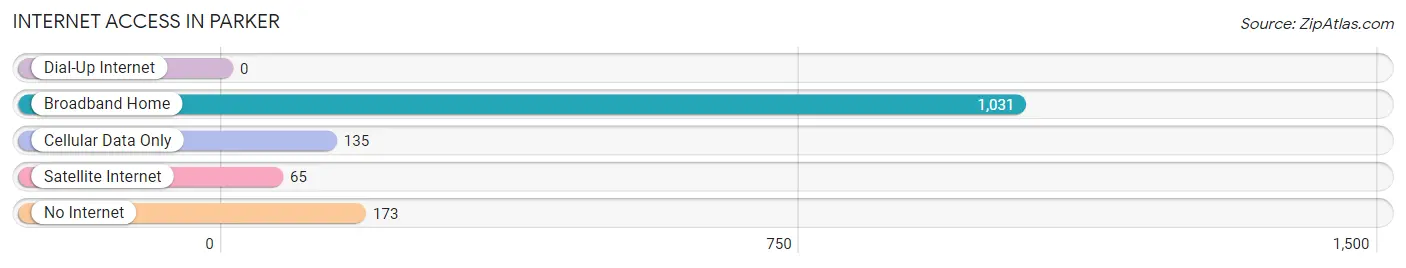
| Internet Type | # Households | % Households |
| Dial-Up Internet | 0 | 0.0% |
| Broadband Home | 1,031 | 73.9% |
| Cellular Data Only | 135 | 9.7% |
| Satellite Internet | 65 | 4.7% |
| No Internet | 173 | 12.4% |
| Total | 1,395 | 100.0% |
Parker Summary
Parker, Arizona is a small town located in La Paz County in the western part of the state. It is situated on the Colorado River, just south of the California border. The town was founded in 1864 by a group of Mormon settlers and was named after the first settler, William Parker. The town has a population of approximately 3,000 people and is the county seat of La Paz County.
Geography
Parker is located in the western part of Arizona, in La Paz County. It is situated on the Colorado River, just south of the California border. The town is surrounded by the Sonoran Desert and is located in the Lower Colorado River Valley. The town is located at an elevation of 1,890 feet above sea level. The climate in Parker is arid and hot, with temperatures ranging from the mid-90s in the summer to the mid-50s in the winter.
Economy
The economy of Parker is largely based on agriculture and tourism. The town is home to several farms and ranches, which produce a variety of crops, including cotton, alfalfa, and melons. The town is also home to several tourist attractions, including the Colorado River Indian Tribes Museum, the Colorado River Indian Reservation, and the Parker Dam.
Demographics
As of the 2010 census, the population of Parker was 3,083. The racial makeup of the town was 73.3% White, 0.7% African American, 0.9% Native American, 0.3% Asian, 0.1% Pacific Islander, 22.2% from other races, and 2.5% from two or more races. Hispanic or Latino of any race were 44.2% of the population.
The median income for a household in Parker was $30,938, and the median income for a family was $35,625. The per capita income for the town was $14,945. About 20.2% of families and 24.2% of the population were below the poverty line, including 33.3% of those under age 18 and 10.2% of those age 65 or over.
History
Parker was founded in 1864 by a group of Mormon settlers and was named after the first settler, William Parker. The town was originally a trading post and was used as a stopover for travelers heading to California. In 1871, the town was officially incorporated and the first post office was established.
In the early 1900s, Parker became a popular destination for tourists, due to its proximity to the Colorado River. The town was also home to several resorts, including the Parker Hotel, which was built in 1910.
In the 1950s, Parker began to experience a population boom, due to the construction of the Parker Dam. The dam was built to provide hydroelectric power to the region and to help control flooding in the area. The dam was completed in 1957 and the town's population grew to over 3,000 people.
Today, Parker is a small town with a population of approximately 3,000 people. The town is home to several tourist attractions, including the Colorado River Indian Tribes Museum, the Colorado River Indian Reservation, and the Parker Dam. The town is also home to several farms and ranches, which produce a variety of crops, including cotton, alfalfa, and melons.
Common Questions
What is Per Capita Income in Parker?
Per Capita income in Parker is $31,607.
What is the Median Family Income in Parker?
Median Family Income in Parker is $74,375.
What is the Median Household income in Parker?
Median Household Income in Parker is $67,566.
What is Income or Wage Gap in Parker?
Income or Wage Gap in Parker is 16.1%.
Women in Parker earn 83.9 cents for every dollar earned by a man.
What is Inequality or Gini Index in Parker?
Inequality or Gini Index in Parker is 0.37.
What is the Total Population of Parker?
Total Population of Parker is 3,357.
What is the Total Male Population of Parker?
Total Male Population of Parker is 1,740.
What is the Total Female Population of Parker?
Total Female Population of Parker is 1,617.
What is the Ratio of Males per 100 Females in Parker?
There are 107.61 Males per 100 Females in Parker.
What is the Ratio of Females per 100 Males in Parker?
There are 92.93 Females per 100 Males in Parker.
What is the Median Population Age in Parker?
Median Population Age in Parker is 38.1 Years.
What is the Average Family Size in Parker
Average Family Size in Parker is 2.7 People.
What is the Average Household Size in Parker
Average Household Size in Parker is 2.4 People.
How Large is the Labor Force in Parker?
There are 1,720 People in the Labor Forcein in Parker.
What is the Percentage of People in the Labor Force in Parker?
66.4% of People are in the Labor Force in Parker.
What is the Unemployment Rate in Parker?
Unemployment Rate in Parker is 4.3%.