Globe, AZ Map & Demographics
Globe Map
Globe Overview
$29,288
PER CAPITA INCOME
$70,893
AVG FAMILY INCOME
$64,516
AVG HOUSEHOLD INCOME
36.0%
WAGE / INCOME GAP [ % ]
64.0¢/ $1
WAGE / INCOME GAP [ $ ]
0.42
INEQUALITY / GINI INDEX
7,230
TOTAL POPULATION
3,875
MALE POPULATION
3,355
FEMALE POPULATION
115.50
MALES / 100 FEMALES
86.58
FEMALES / 100 MALES
45.2
MEDIAN AGE
2.7
AVG FAMILY SIZE
2.2
AVG HOUSEHOLD SIZE
3,235
LABOR FORCE [ PEOPLE ]
53.0%
PERCENT IN LABOR FORCE
3.2%
UNEMPLOYMENT RATE
Globe Zip Codes
Income in Globe
Income Overview in Globe
Per Capita Income in Globe is $29,288, while median incomes of families and households are $70,893 and $64,516 respectively.
| Characteristic | Number | Measure |
| Per Capita Income | 7,230 | $29,288 |
| Median Family Income | 1,912 | $70,893 |
| Mean Family Income | 1,912 | $88,677 |
| Median Household Income | 3,004 | $64,516 |
| Mean Household Income | 3,004 | $72,670 |
| Income Deficit | 1,912 | $0 |
| Wage / Income Gap (%) | 7,230 | 36.05% |
| Wage / Income Gap ($) | 7,230 | 63.95¢ per $1 |
| Gini / Inequality Index | 7,230 | 0.42 |
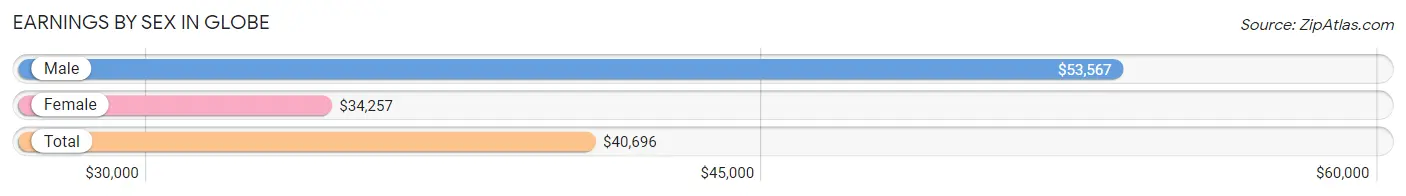
Earnings by Sex in Globe
Average Earnings in Globe are $40,696, $53,567 for men and $34,257 for women, a difference of 36.0%.
| Sex | Number | Average Earnings |
| Male | 1,831 (54.5%) | $53,567 |
| Female | 1,527 (45.5%) | $34,257 |
| Total | 3,358 (100.0%) | $40,696 |
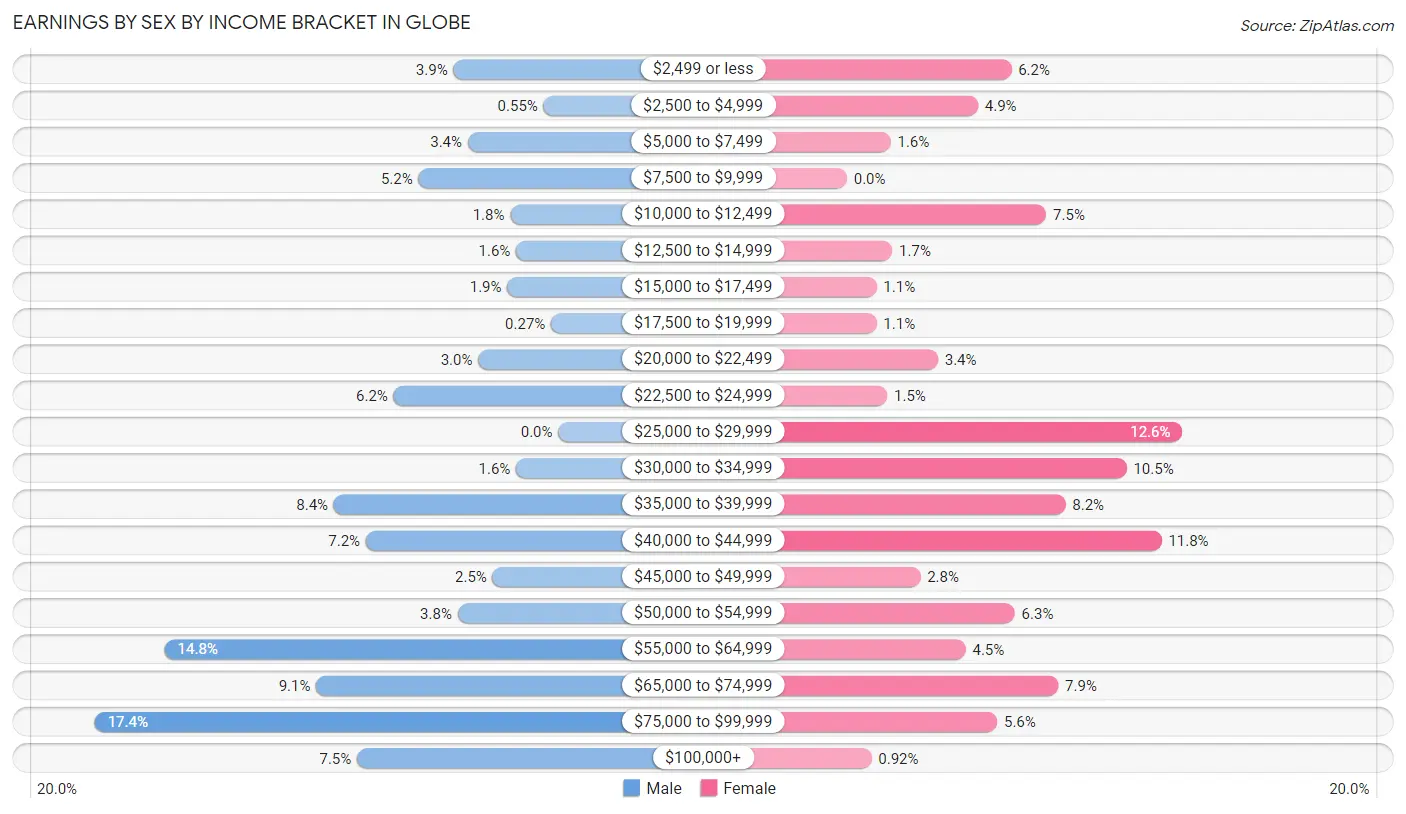
Earnings by Sex by Income Bracket in Globe
The most common earnings brackets in Globe are $75,000 to $99,999 for men (318 | 17.4%) and $25,000 to $29,999 for women (192 | 12.6%).
| Income | Male | Female |
| $2,499 or less | 72 (3.9%) | 94 (6.2%) |
| $2,500 to $4,999 | 10 (0.5%) | 75 (4.9%) |
| $5,000 to $7,499 | 62 (3.4%) | 25 (1.6%) |
| $7,500 to $9,999 | 96 (5.2%) | 0 (0.0%) |
| $10,000 to $12,499 | 33 (1.8%) | 114 (7.5%) |
| $12,500 to $14,999 | 29 (1.6%) | 26 (1.7%) |
| $15,000 to $17,499 | 35 (1.9%) | 17 (1.1%) |
| $17,500 to $19,999 | 5 (0.3%) | 17 (1.1%) |
| $20,000 to $22,499 | 55 (3.0%) | 52 (3.4%) |
| $22,500 to $24,999 | 113 (6.2%) | 23 (1.5%) |
| $25,000 to $29,999 | 0 (0.0%) | 192 (12.6%) |
| $30,000 to $34,999 | 29 (1.6%) | 160 (10.5%) |
| $35,000 to $39,999 | 154 (8.4%) | 125 (8.2%) |
| $40,000 to $44,999 | 132 (7.2%) | 180 (11.8%) |
| $45,000 to $49,999 | 45 (2.5%) | 42 (2.8%) |
| $50,000 to $54,999 | 69 (3.8%) | 96 (6.3%) |
| $55,000 to $64,999 | 270 (14.7%) | 68 (4.4%) |
| $65,000 to $74,999 | 166 (9.1%) | 121 (7.9%) |
| $75,000 to $99,999 | 318 (17.4%) | 86 (5.6%) |
| $100,000+ | 138 (7.5%) | 14 (0.9%) |
| Total | 1,831 (100.0%) | 1,527 (100.0%) |
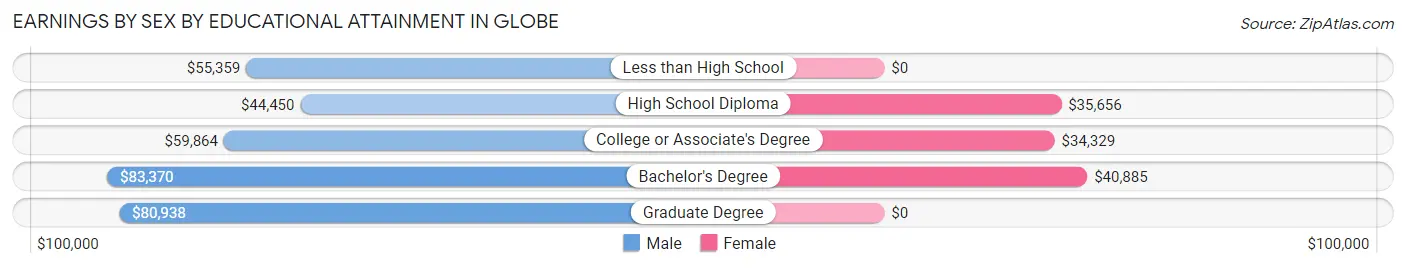
Earnings by Sex by Educational Attainment in Globe
Average earnings in Globe are $57,618 for men and $35,079 for women, a difference of 39.1%. Men with an educational attainment of bachelor's degree enjoy the highest average annual earnings of $83,370, while those with high school diploma education earn the least with $44,450. Women with an educational attainment of bachelor's degree earn the most with the average annual earnings of $40,885, while those with college or associate's degree education have the smallest earnings of $34,329.
| Educational Attainment | Male Income | Female Income |
| Less than High School | $55,359 | $0 |
| High School Diploma | $44,450 | $35,656 |
| College or Associate's Degree | $59,864 | $34,329 |
| Bachelor's Degree | $83,370 | $40,885 |
| Graduate Degree | $80,938 | $0 |
| Total | $57,618 | $35,079 |
Family Income in Globe
Family Income Brackets in Globe
According to the Globe family income data, there are 553 families falling into the $50,000 to $74,999 income range, which is the most common income bracket and makes up 28.9% of all families. Conversely, the $15,000 to $24,999 income bracket is the least frequent group with only 34 families (1.8%) belonging to this category.
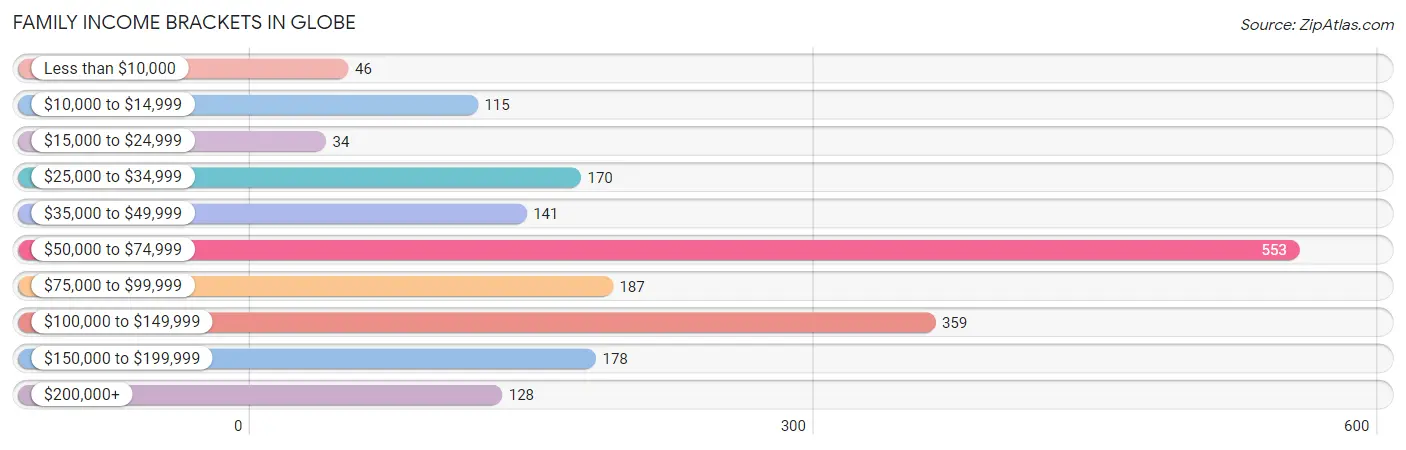
| Income Bracket | # Families | % Families |
| Less than $10,000 | 46 | 2.4% |
| $10,000 to $14,999 | 115 | 6.0% |
| $15,000 to $24,999 | 34 | 1.8% |
| $25,000 to $34,999 | 170 | 8.9% |
| $35,000 to $49,999 | 141 | 7.4% |
| $50,000 to $74,999 | 553 | 28.9% |
| $75,000 to $99,999 | 187 | 9.8% |
| $100,000 to $149,999 | 359 | 18.8% |
| $150,000 to $199,999 | 178 | 9.3% |
| $200,000+ | 128 | 6.7% |
Family Income by Famaliy Size in Globe
6-person families (18 | 0.9%) account for the highest median family income in Globe with $166,250 per family, while 2-person families (1,037 | 54.2%) have the highest median income of $32,513 per family member.
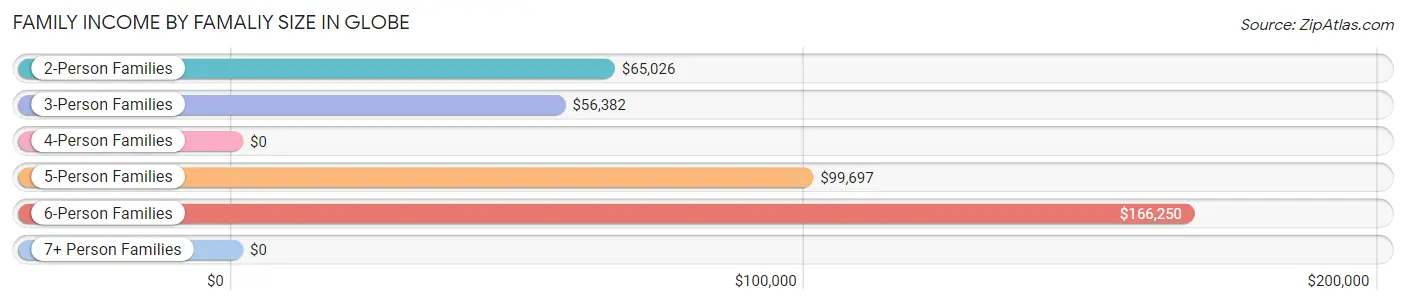
| Income Bracket | # Families | Median Income |
| 2-Person Families | 1,037 (54.2%) | $65,026 |
| 3-Person Families | 403 (21.1%) | $56,382 |
| 4-Person Families | 241 (12.6%) | $0 |
| 5-Person Families | 186 (9.7%) | $99,697 |
| 6-Person Families | 18 (0.9%) | $166,250 |
| 7+ Person Families | 27 (1.4%) | $0 |
| Total | 1,912 (100.0%) | $70,893 |
Family Income by Number of Earners in Globe
The median family income in Globe is $70,893, with families comprising 3+ earners (172) having the highest median family income of $200,438, while families with no earners (455) have the lowest median family income of $44,583, accounting for 9.0% and 23.8% of families, respectively.
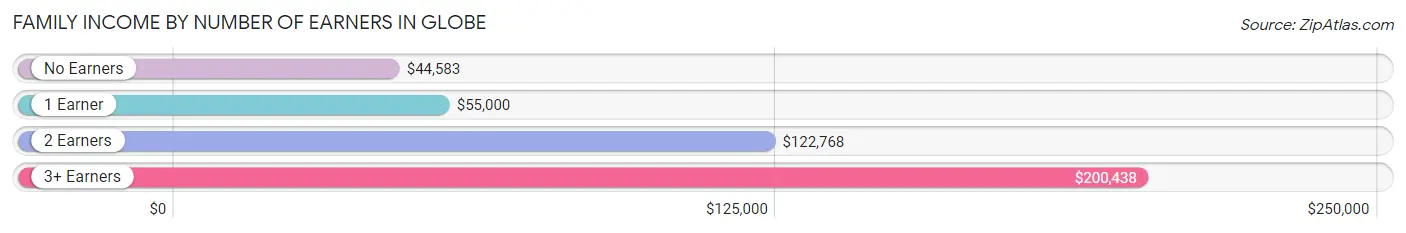
| Number of Earners | # Families | Median Income |
| No Earners | 455 (23.8%) | $44,583 |
| 1 Earner | 462 (24.2%) | $55,000 |
| 2 Earners | 823 (43.0%) | $122,768 |
| 3+ Earners | 172 (9.0%) | $200,438 |
| Total | 1,912 (100.0%) | $70,893 |
Household Income in Globe
Household Income Brackets in Globe
With 565 households falling in the category, the $50,000 to $74,999 income range is the most frequent in Globe, accounting for 18.8% of all households. In contrast, only 81 households (2.7%) fall into the $15,000 to $24,999 income bracket, making it the least populous group.
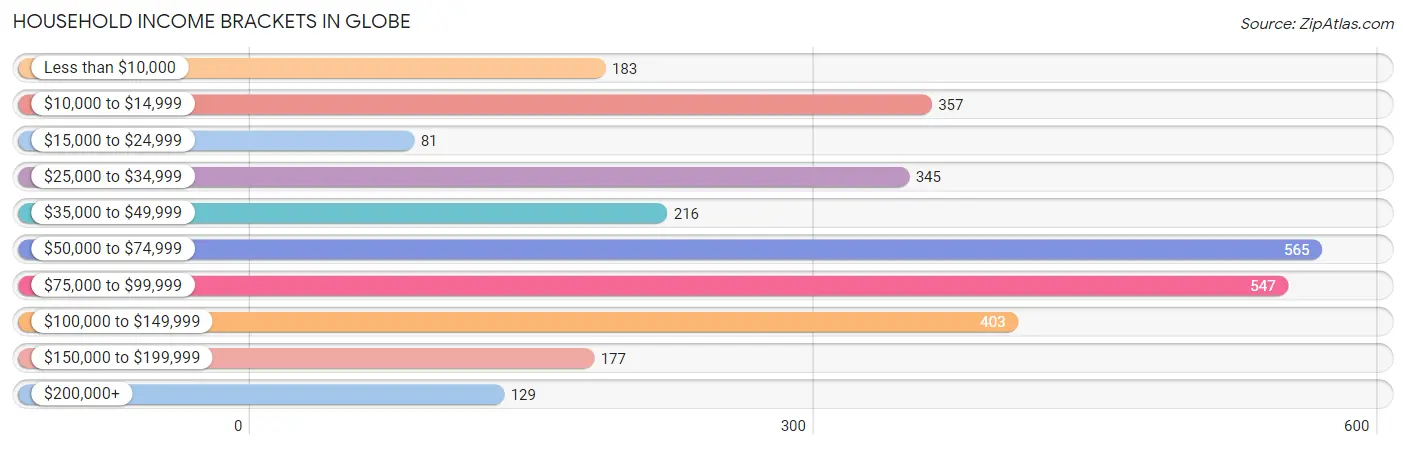
| Income Bracket | # Households | % Households |
| Less than $10,000 | 183 | 6.1% |
| $10,000 to $14,999 | 357 | 11.9% |
| $15,000 to $24,999 | 81 | 2.7% |
| $25,000 to $34,999 | 345 | 11.5% |
| $35,000 to $49,999 | 216 | 7.2% |
| $50,000 to $74,999 | 565 | 18.8% |
| $75,000 to $99,999 | 547 | 18.2% |
| $100,000 to $149,999 | 403 | 13.4% |
| $150,000 to $199,999 | 177 | 5.9% |
| $200,000+ | 129 | 4.3% |
Household Income by Householder Age in Globe
The median household income in Globe is $64,516, with the highest median household income of $91,987 found in the 25 to 44 years age bracket for the primary householder. A total of 721 households (24.0%) fall into this category. Meanwhile, the 65+ years age bracket for the primary householder has the lowest median household income of $32,012, with 904 households (30.1%) in this group.
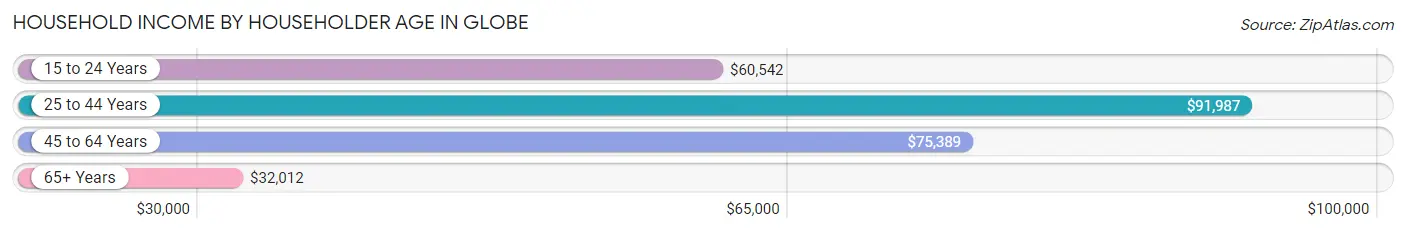
| Income Bracket | # Households | Median Income |
| 15 to 24 Years | 125 (4.2%) | $60,542 |
| 25 to 44 Years | 721 (24.0%) | $91,987 |
| 45 to 64 Years | 1,254 (41.7%) | $75,389 |
| 65+ Years | 904 (30.1%) | $32,012 |
| Total | 3,004 (100.0%) | $64,516 |
Poverty in Globe
Income Below Poverty by Sex and Age in Globe
With 16.2% poverty level for males and 18.9% for females among the residents of Globe, 75 year old and over males and 18 to 24 year old females are the most vulnerable to poverty, with 78 males (34.2%) and 121 females (45.2%) in their respective age groups living below the poverty level.
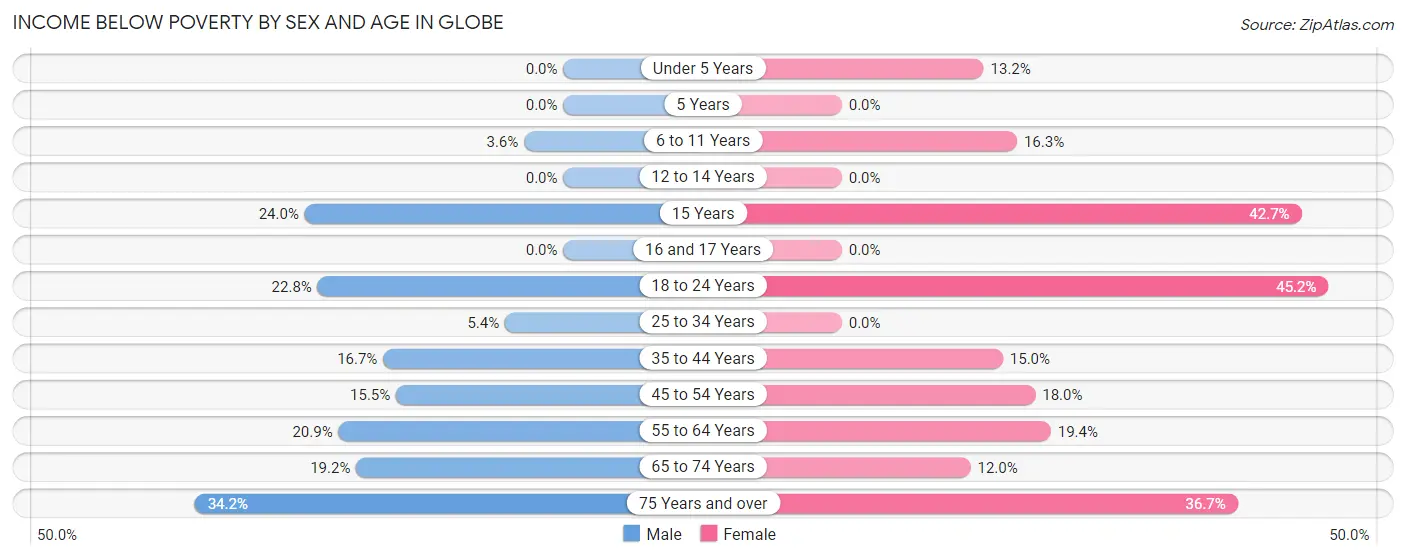
| Age Bracket | Male | Female |
| Under 5 Years | 0 (0.0%) | 15 (13.2%) |
| 5 Years | 0 (0.0%) | 0 (0.0%) |
| 6 to 11 Years | 8 (3.6%) | 33 (16.3%) |
| 12 to 14 Years | 0 (0.0%) | 0 (0.0%) |
| 15 Years | 30 (24.0%) | 29 (42.6%) |
| 16 and 17 Years | 0 (0.0%) | 0 (0.0%) |
| 18 to 24 Years | 75 (22.8%) | 121 (45.2%) |
| 25 to 34 Years | 14 (5.4%) | 0 (0.0%) |
| 35 to 44 Years | 103 (16.7%) | 55 (14.9%) |
| 45 to 54 Years | 72 (15.5%) | 118 (18.0%) |
| 55 to 64 Years | 91 (20.9%) | 84 (19.4%) |
| 65 to 74 Years | 89 (19.2%) | 46 (11.9%) |
| 75 Years and over | 78 (34.2%) | 101 (36.7%) |
| Total | 560 (16.2%) | 602 (18.9%) |
Income Above Poverty by Sex and Age in Globe
According to the poverty statistics in Globe, males aged under 5 years and females aged 12 to 14 years are the age groups that are most secure financially, with 100.0% of males and 100.0% of females in these age groups living above the poverty line.
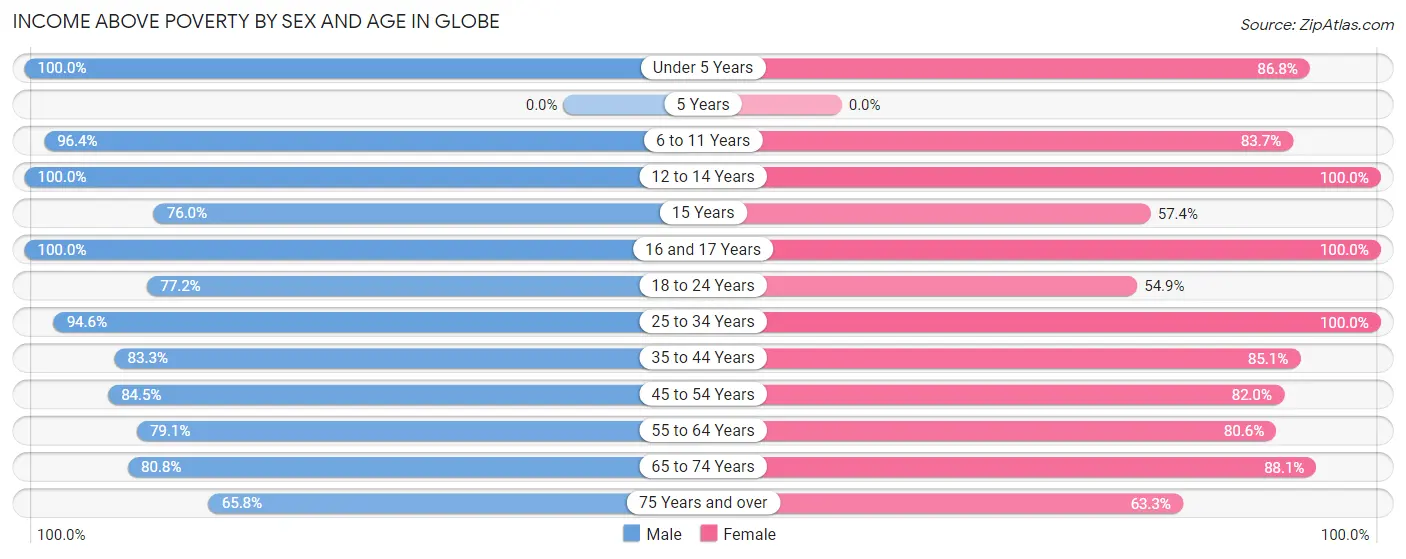
| Age Bracket | Male | Female |
| Under 5 Years | 164 (100.0%) | 99 (86.8%) |
| 5 Years | 0 (0.0%) | 0 (0.0%) |
| 6 to 11 Years | 212 (96.4%) | 170 (83.7%) |
| 12 to 14 Years | 104 (100.0%) | 73 (100.0%) |
| 15 Years | 95 (76.0%) | 39 (57.4%) |
| 16 and 17 Years | 40 (100.0%) | 55 (100.0%) |
| 18 to 24 Years | 254 (77.2%) | 147 (54.8%) |
| 25 to 34 Years | 245 (94.6%) | 291 (100.0%) |
| 35 to 44 Years | 513 (83.3%) | 313 (85.1%) |
| 45 to 54 Years | 392 (84.5%) | 539 (82.0%) |
| 55 to 64 Years | 345 (79.1%) | 349 (80.6%) |
| 65 to 74 Years | 374 (80.8%) | 339 (88.0%) |
| 75 Years and over | 150 (65.8%) | 174 (63.3%) |
| Total | 2,888 (83.8%) | 2,588 (81.1%) |
Income Below Poverty Among Married-Couple Families in Globe
The poverty statistics for married-couple families in Globe show that 10.4% or 141 of the total 1,351 families live below the poverty line. Families with no children have the highest poverty rate of 14.7%, comprising of 132 families. On the other hand, families with 3 or 4 children have the lowest poverty rate of 0.0%, which includes 0 families.
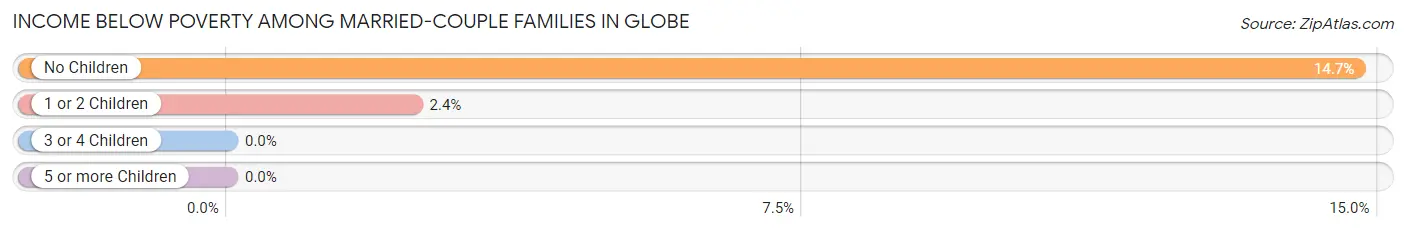
| Children | Above Poverty | Below Poverty |
| No Children | 764 (85.3%) | 132 (14.7%) |
| 1 or 2 Children | 365 (97.6%) | 9 (2.4%) |
| 3 or 4 Children | 54 (100.0%) | 0 (0.0%) |
| 5 or more Children | 27 (100.0%) | 0 (0.0%) |
| Total | 1,210 (89.6%) | 141 (10.4%) |
Income Below Poverty Among Single-Parent Households in Globe
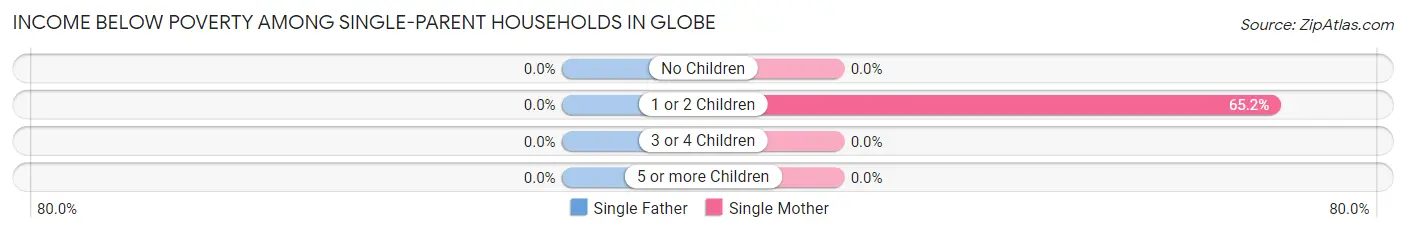
| Children | Single Father | Single Mother |
| No Children | 0 (0.0%) | 0 (0.0%) |
| 1 or 2 Children | 0 (0.0%) | 101 (65.2%) |
| 3 or 4 Children | 0 (0.0%) | 0 (0.0%) |
| 5 or more Children | 0 (0.0%) | 0 (0.0%) |
| Total | 0 (0.0%) | 101 (26.6%) |
Income Below Poverty Among Married-Couple vs Single-Parent Households in Globe
The poverty data for Globe shows that 141 of the married-couple family households (10.4%) and 101 of the single-parent households (18.0%) are living below the poverty level. Within the married-couple family households, those with no children have the highest poverty rate, with 132 households (14.7%) falling below the poverty line. Among the single-parent households, those with 1 or 2 children have the highest poverty rate, with 101 household (42.1%) living below poverty.
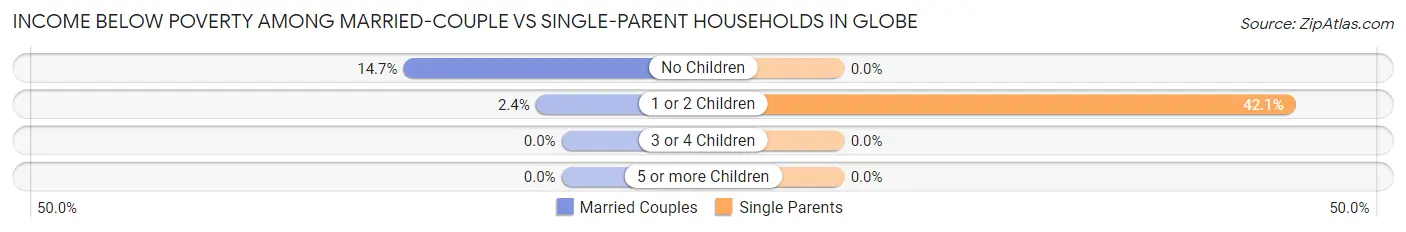
| Children | Married-Couple Families | Single-Parent Households |
| No Children | 132 (14.7%) | 0 (0.0%) |
| 1 or 2 Children | 9 (2.4%) | 101 (42.1%) |
| 3 or 4 Children | 0 (0.0%) | 0 (0.0%) |
| 5 or more Children | 0 (0.0%) | 0 (0.0%) |
| Total | 141 (10.4%) | 101 (18.0%) |
Race in Globe
The most populous races in Globe are White / Caucasian (4,412 | 61.0%), Hispanic or Latino (3,327 | 46.0%), and Two or more Races (1,414 | 19.6%).
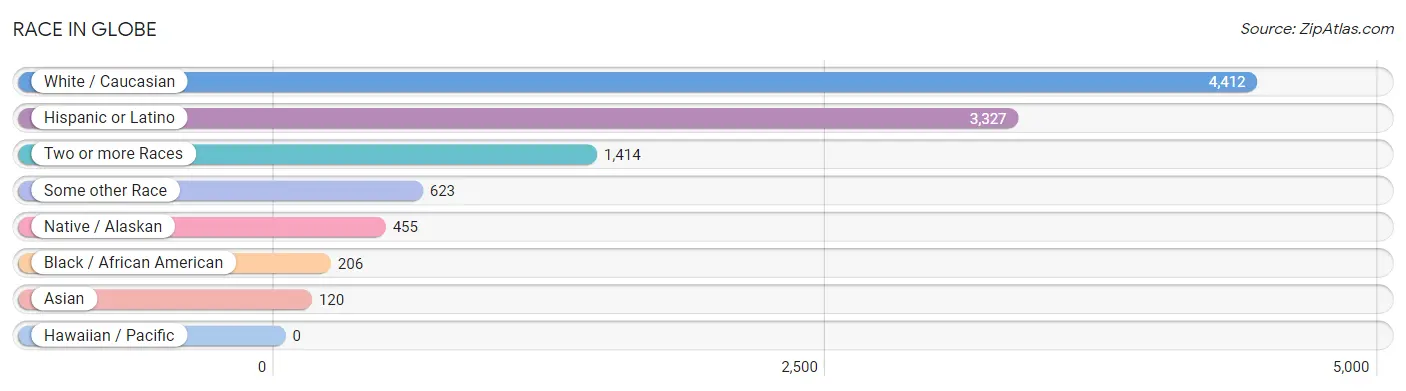
| Race | # Population | % Population |
| Asian | 120 | 1.7% |
| Black / African American | 206 | 2.9% |
| Hawaiian / Pacific | 0 | 0.0% |
| Hispanic or Latino | 3,327 | 46.0% |
| Native / Alaskan | 455 | 6.3% |
| White / Caucasian | 4,412 | 61.0% |
| Two or more Races | 1,414 | 19.6% |
| Some other Race | 623 | 8.6% |
| Total | 7,230 | 100.0% |
Ancestry in Globe
The most populous ancestries reported in Globe are Mexican (2,846 | 39.4%), Irish (791 | 10.9%), German (697 | 9.6%), English (513 | 7.1%), and Italian (480 | 6.6%), together accounting for 73.7% of all Globe residents.
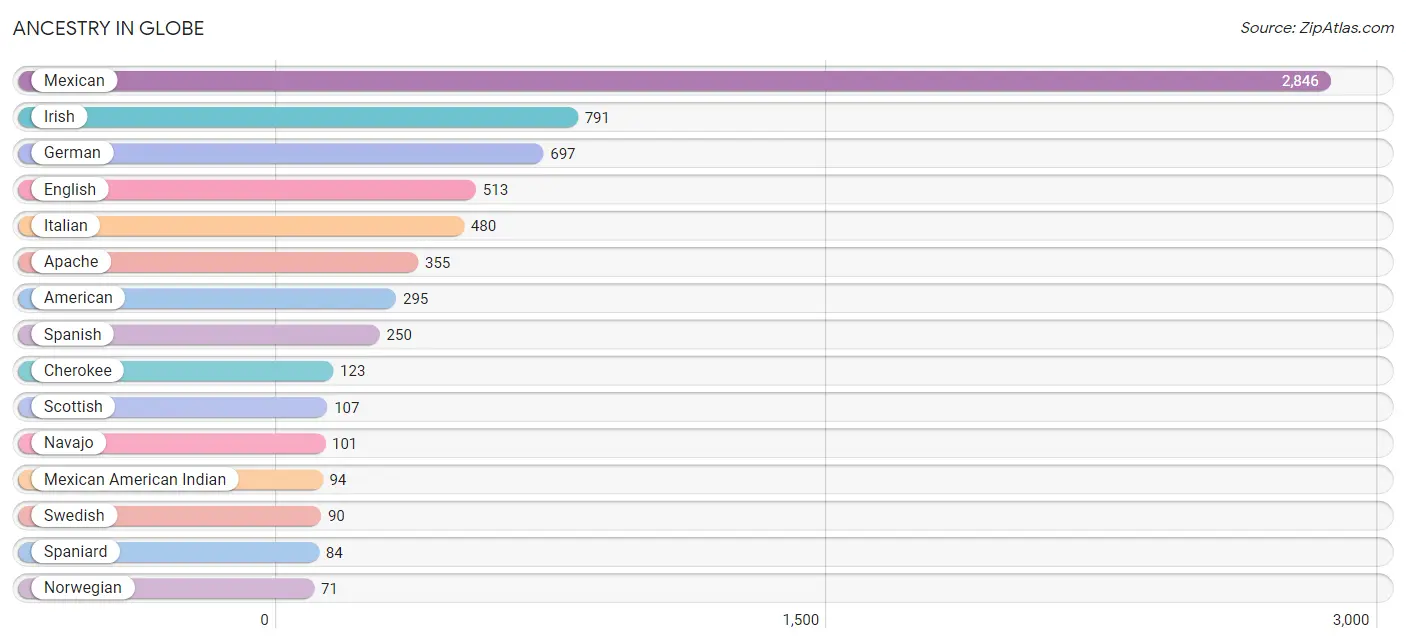
| Ancestry | # Population | % Population |
| American | 295 | 4.1% |
| Apache | 355 | 4.9% |
| Assyrian / Chaldean / Syriac | 14 | 0.2% |
| British | 17 | 0.2% |
| Burmese | 59 | 0.8% |
| Canadian | 62 | 0.9% |
| Central American Indian | 8 | 0.1% |
| Cherokee | 123 | 1.7% |
| Dutch | 6 | 0.1% |
| English | 513 | 7.1% |
| European | 27 | 0.4% |
| Finnish | 22 | 0.3% |
| French | 5 | 0.1% |
| French Canadian | 5 | 0.1% |
| German | 697 | 9.6% |
| Hopi | 33 | 0.5% |
| Irish | 791 | 10.9% |
| Italian | 480 | 6.6% |
| Korean | 55 | 0.8% |
| Laotian | 6 | 0.1% |
| Mexican | 2,846 | 39.4% |
| Mexican American Indian | 94 | 1.3% |
| Native Hawaiian | 25 | 0.4% |
| Navajo | 101 | 1.4% |
| Norwegian | 71 | 1.0% |
| Pima | 9 | 0.1% |
| Polish | 8 | 0.1% |
| Portuguese | 23 | 0.3% |
| Puerto Rican | 29 | 0.4% |
| Russian | 13 | 0.2% |
| Scandinavian | 46 | 0.6% |
| Scotch-Irish | 52 | 0.7% |
| Scottish | 107 | 1.5% |
| Spaniard | 84 | 1.2% |
| Spanish | 250 | 3.5% |
| Swedish | 90 | 1.2% |
| Swiss | 18 | 0.3% |
| Tlingit-Haida | 17 | 0.2% |
| Tohono O'Odham | 2 | 0.0% |
| Welsh | 32 | 0.4% |
| Yaqui | 13 | 0.2% |
| Yugoslavian | 9 | 0.1% | View All 42 Rows |
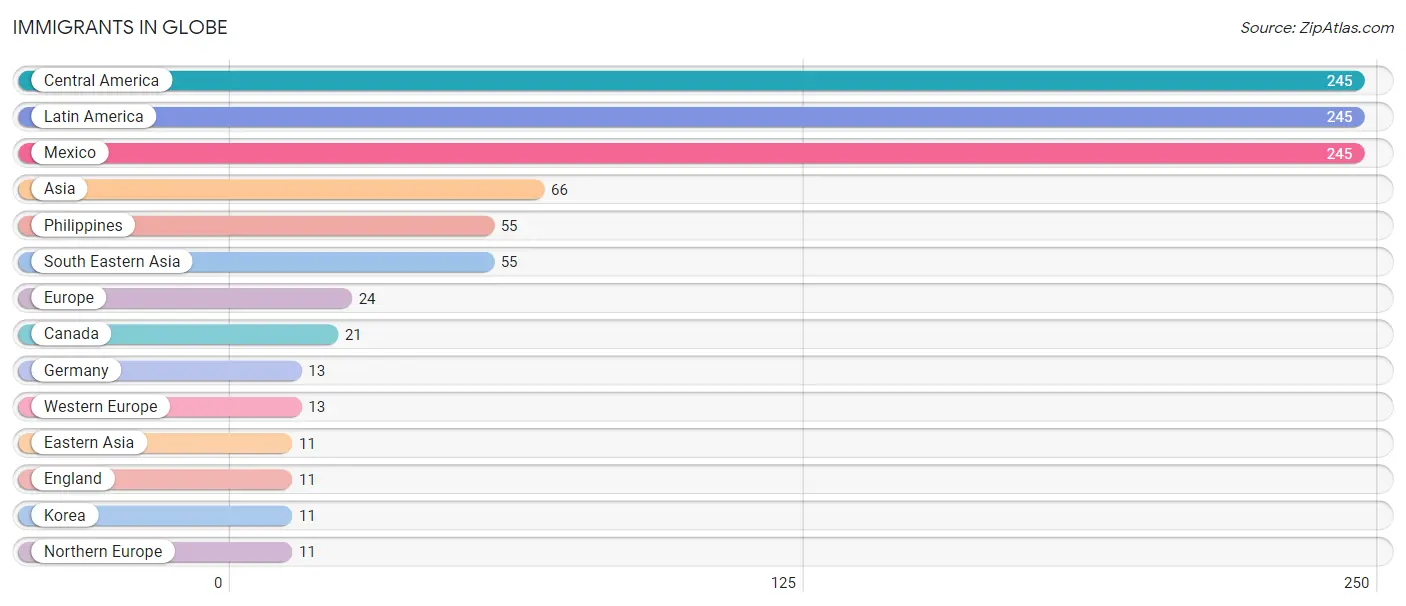
Immigrants in Globe
The most numerous immigrant groups reported in Globe came from Central America (245 | 3.4%), Latin America (245 | 3.4%), Mexico (245 | 3.4%), Asia (66 | 0.9%), and Philippines (55 | 0.8%), together accounting for 11.8% of all Globe residents.
| Immigration Origin | # Population | % Population |
| Asia | 66 | 0.9% |
| Canada | 21 | 0.3% |
| Central America | 245 | 3.4% |
| Eastern Asia | 11 | 0.2% |
| England | 11 | 0.2% |
| Europe | 24 | 0.3% |
| Germany | 13 | 0.2% |
| Korea | 11 | 0.2% |
| Latin America | 245 | 3.4% |
| Mexico | 245 | 3.4% |
| Northern Europe | 11 | 0.2% |
| Philippines | 55 | 0.8% |
| South Eastern Asia | 55 | 0.8% |
| Western Europe | 13 | 0.2% | View All 14 Rows |
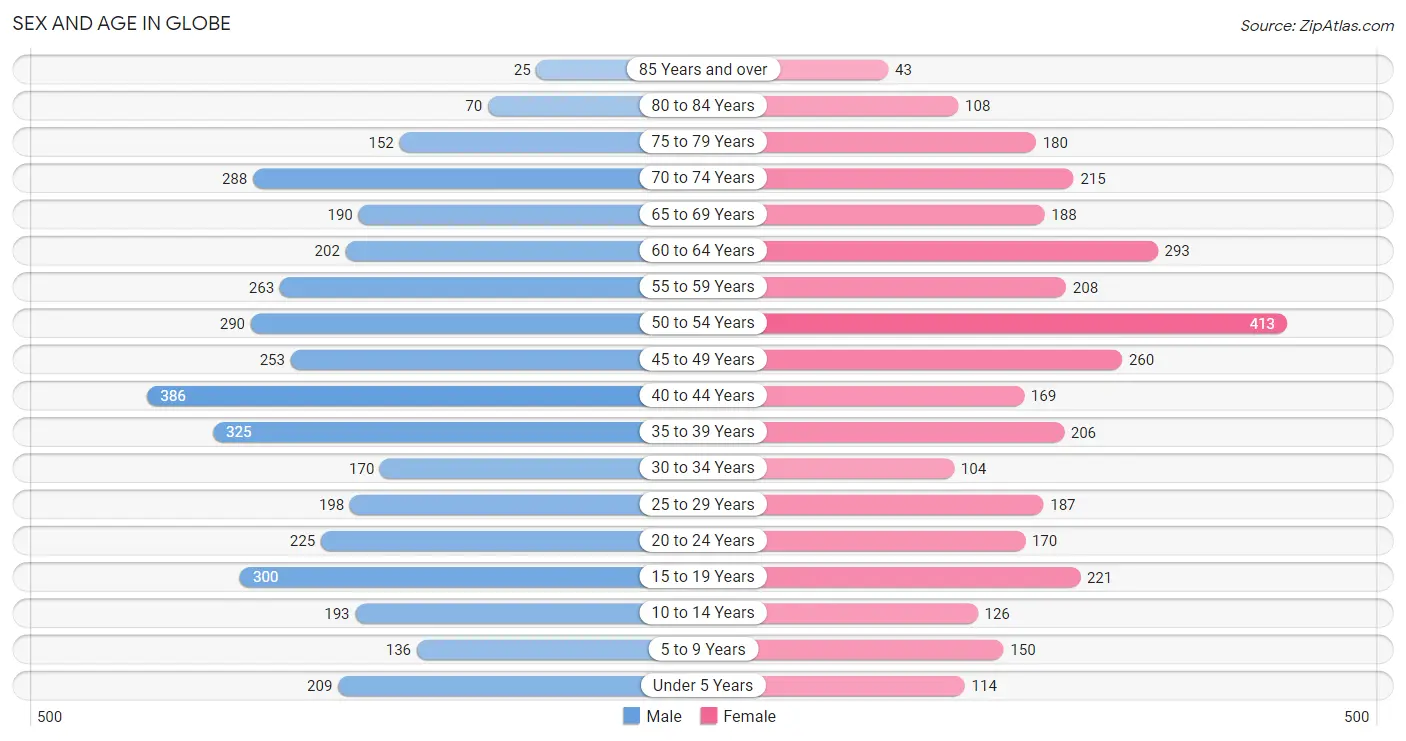
Sex and Age in Globe
Sex and Age in Globe
The most populous age groups in Globe are 40 to 44 Years (386 | 10.0%) for men and 50 to 54 Years (413 | 12.3%) for women.
| Age Bracket | Male | Female |
| Under 5 Years | 209 (5.4%) | 114 (3.4%) |
| 5 to 9 Years | 136 (3.5%) | 150 (4.5%) |
| 10 to 14 Years | 193 (5.0%) | 126 (3.8%) |
| 15 to 19 Years | 300 (7.7%) | 221 (6.6%) |
| 20 to 24 Years | 225 (5.8%) | 170 (5.1%) |
| 25 to 29 Years | 198 (5.1%) | 187 (5.6%) |
| 30 to 34 Years | 170 (4.4%) | 104 (3.1%) |
| 35 to 39 Years | 325 (8.4%) | 206 (6.1%) |
| 40 to 44 Years | 386 (10.0%) | 169 (5.0%) |
| 45 to 49 Years | 253 (6.5%) | 260 (7.7%) |
| 50 to 54 Years | 290 (7.5%) | 413 (12.3%) |
| 55 to 59 Years | 263 (6.8%) | 208 (6.2%) |
| 60 to 64 Years | 202 (5.2%) | 293 (8.7%) |
| 65 to 69 Years | 190 (4.9%) | 188 (5.6%) |
| 70 to 74 Years | 288 (7.4%) | 215 (6.4%) |
| 75 to 79 Years | 152 (3.9%) | 180 (5.4%) |
| 80 to 84 Years | 70 (1.8%) | 108 (3.2%) |
| 85 Years and over | 25 (0.6%) | 43 (1.3%) |
| Total | 3,875 (100.0%) | 3,355 (100.0%) |
Families and Households in Globe
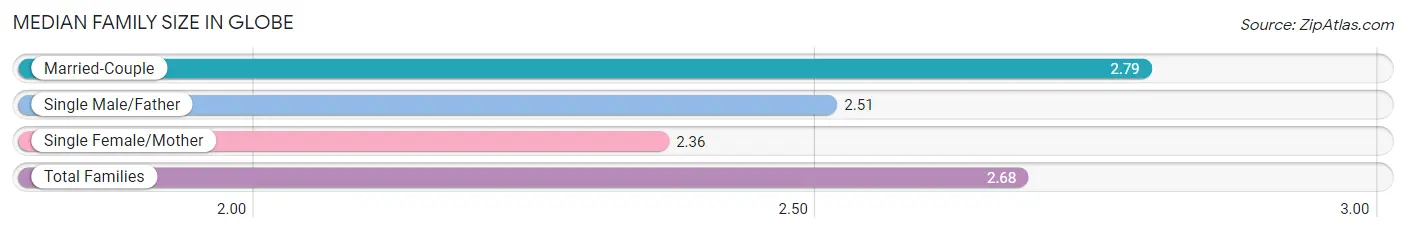
Median Family Size in Globe
The median family size in Globe is 2.68 persons per family, with married-couple families (1,351 | 70.7%) accounting for the largest median family size of 2.79 persons per family. On the other hand, single female/mother families (380 | 19.9%) represent the smallest median family size with 2.36 persons per family.
| Family Type | # Families | Family Size |
| Married-Couple | 1,351 (70.7%) | 2.79 |
| Single Male/Father | 181 (9.5%) | 2.51 |
| Single Female/Mother | 380 (19.9%) | 2.36 |
| Total Families | 1,912 (100.0%) | 2.68 |
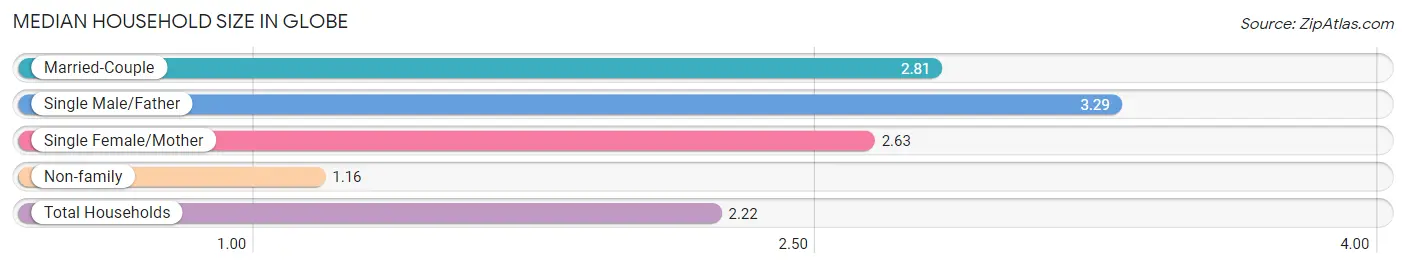
Median Household Size in Globe
The median household size in Globe is 2.22 persons per household, with single male/father households (181 | 6.0%) accounting for the largest median household size of 3.29 persons per household. non-family households (1,092 | 36.3%) represent the smallest median household size with 1.16 persons per household.
| Household Type | # Households | Household Size |
| Married-Couple | 1,351 (45.0%) | 2.81 |
| Single Male/Father | 181 (6.0%) | 3.29 |
| Single Female/Mother | 380 (12.7%) | 2.63 |
| Non-family | 1,092 (36.3%) | 1.16 |
| Total Households | 3,004 (100.0%) | 2.22 |
Household Size by Marriage Status in Globe
Out of a total of 3,004 households in Globe, 1,912 (63.6%) are family households, while 1,092 (36.3%) are nonfamily households. The most numerous type of family households are 2-person households, comprising 967, and the most common type of nonfamily households are 1-person households, comprising 918.
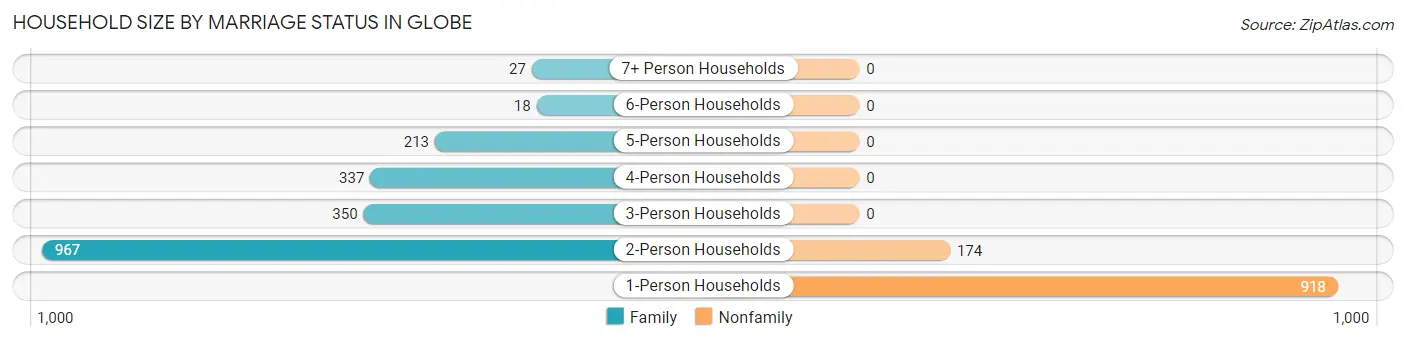
| Household Size | Family Households | Nonfamily Households |
| 1-Person Households | - | 918 (30.6%) |
| 2-Person Households | 967 (32.2%) | 174 (5.8%) |
| 3-Person Households | 350 (11.7%) | 0 (0.0%) |
| 4-Person Households | 337 (11.2%) | 0 (0.0%) |
| 5-Person Households | 213 (7.1%) | 0 (0.0%) |
| 6-Person Households | 18 (0.6%) | 0 (0.0%) |
| 7+ Person Households | 27 (0.9%) | 0 (0.0%) |
| Total | 1,912 (63.6%) | 1,092 (36.3%) |
Female Fertility in Globe
Fertility by Age in Globe
Average fertility rate in Globe is 94.0 births per 1,000 women. Women in the age bracket of 20 to 34 years have the highest fertility rate with 306.0 births per 1,000 women. Women in the age bracket of 20 to 34 years acount for 100.0% of all women with births.
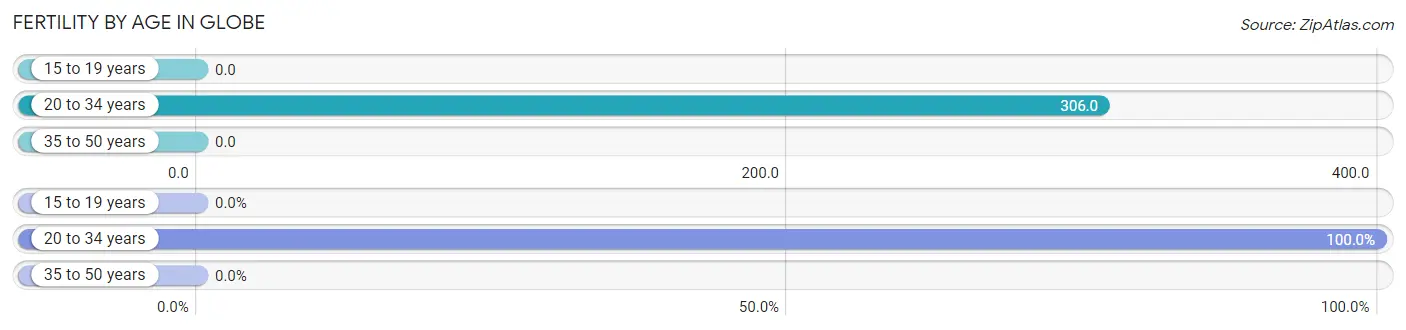
| Age Bracket | Women with Births | Births / 1,000 Women |
| 15 to 19 years | 0 (0.0%) | 0.0 |
| 20 to 34 years | 141 (100.0%) | 306.0 |
| 35 to 50 years | 0 (0.0%) | 0.0 |
| Total | 141 (100.0%) | 94.0 |
Fertility by Age by Marriage Status in Globe
25.5% of women with births (141) in Globe are married. The highest percentage of unmarried women with births falls into 20 to 34 years age bracket with 74.5% of them unmarried at the time of birth, while the lowest percentage of unmarried women with births belong to 20 to 34 years age bracket with 74.5% of them unmarried.
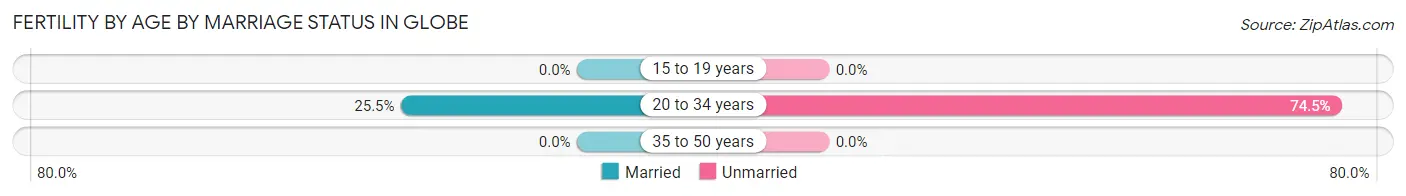
| Age Bracket | Married | Unmarried |
| 15 to 19 years | 0 (0.0%) | 0 (0.0%) |
| 20 to 34 years | 36 (25.5%) | 105 (74.5%) |
| 35 to 50 years | 0 (0.0%) | 0 (0.0%) |
| Total | 36 (25.5%) | 105 (74.5%) |
Fertility by Education in Globe
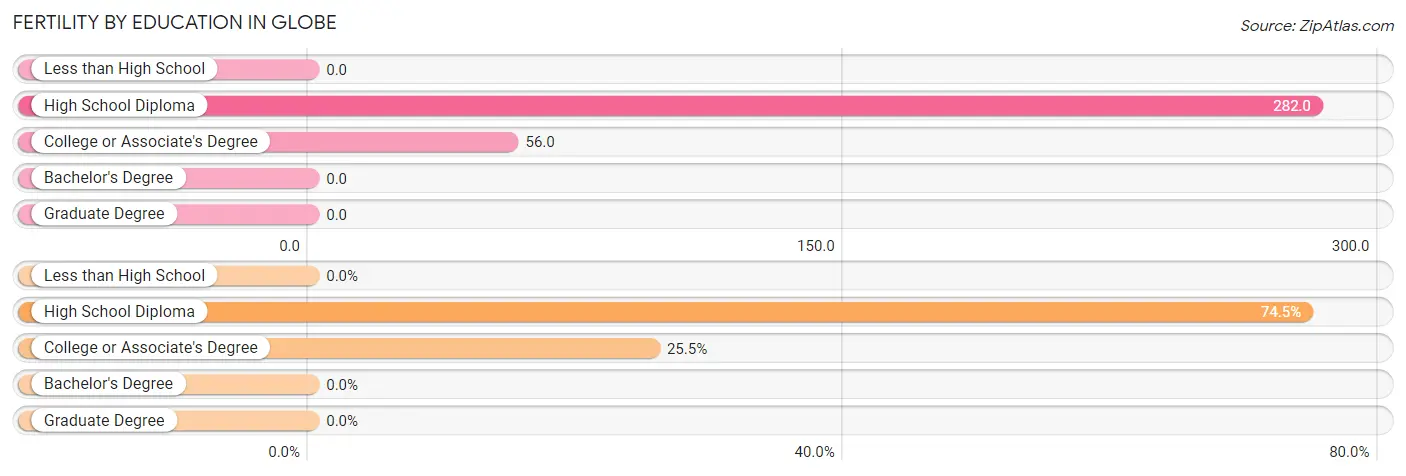
| Educational Attainment | Women with Births | Births / 1,000 Women |
| Less than High School | 0 (0.0%) | 0.0 |
| High School Diploma | 105 (74.5%) | 282.0 |
| College or Associate's Degree | 36 (25.5%) | 56.0 |
| Bachelor's Degree | 0 (0.0%) | 0.0 |
| Graduate Degree | 0 (0.0%) | 0.0 |
| Total | 141 (100.0%) | 94.0 |
Fertility by Education by Marriage Status in Globe
74.5% of women with births in Globe are unmarried. Women with the educational attainment of college or associate's degree are most likely to be married with 100.0% of them married at childbirth, while women with the educational attainment of high school diploma are least likely to be married with 100.0% of them unmarried at childbirth.
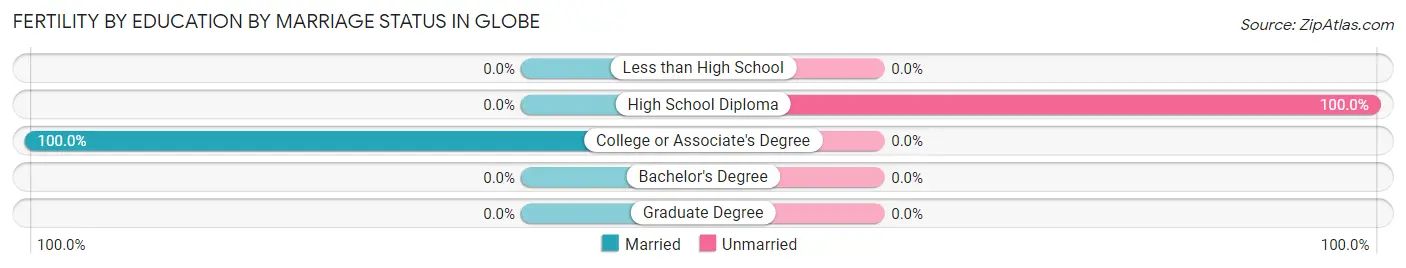
| Educational Attainment | Married | Unmarried |
| Less than High School | 0 (0.0%) | 0 (0.0%) |
| High School Diploma | 0 (0.0%) | 105 (100.0%) |
| College or Associate's Degree | 36 (100.0%) | 0 (0.0%) |
| Bachelor's Degree | 0 (0.0%) | 0 (0.0%) |
| Graduate Degree | 0 (0.0%) | 0 (0.0%) |
| Total | 36 (25.5%) | 105 (74.5%) |
Employment Characteristics in Globe
Employment by Class of Employer in Globe
Among the 3,086 employed individuals in Globe, private company employees (1,809 | 58.6%), local government employees (504 | 16.3%), and self-employed (not incorporated) (289 | 9.4%) make up the most common classes of employment.
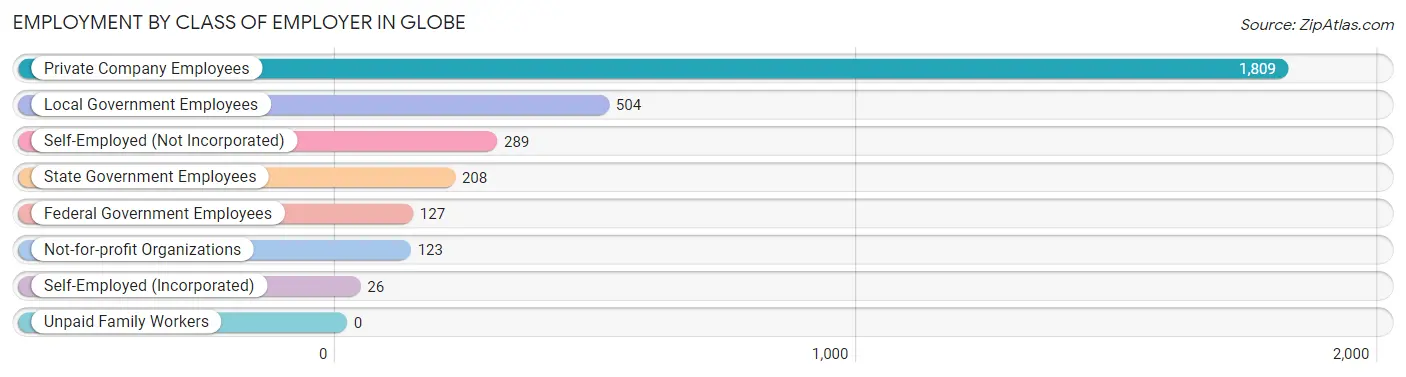
| Employer Class | # Employees | % Employees |
| Private Company Employees | 1,809 | 58.6% |
| Self-Employed (Incorporated) | 26 | 0.8% |
| Self-Employed (Not Incorporated) | 289 | 9.4% |
| Not-for-profit Organizations | 123 | 4.0% |
| Local Government Employees | 504 | 16.3% |
| State Government Employees | 208 | 6.7% |
| Federal Government Employees | 127 | 4.1% |
| Unpaid Family Workers | 0 | 0.0% |
| Total | 3,086 | 100.0% |
Employment Status by Age in Globe
According to the labor force statistics for Globe, out of the total population over 16 years of age (6,104), 53.0% or 3,235 individuals are in the labor force, with 3.2% or 104 of them unemployed. The age group with the highest labor force participation rate is 25 to 29 years, with 83.1% or 320 individuals in the labor force. Within the labor force, the 16 to 19 years age range has the highest percentage of unemployed individuals, with 19.9% or 28 of them being unemployed.
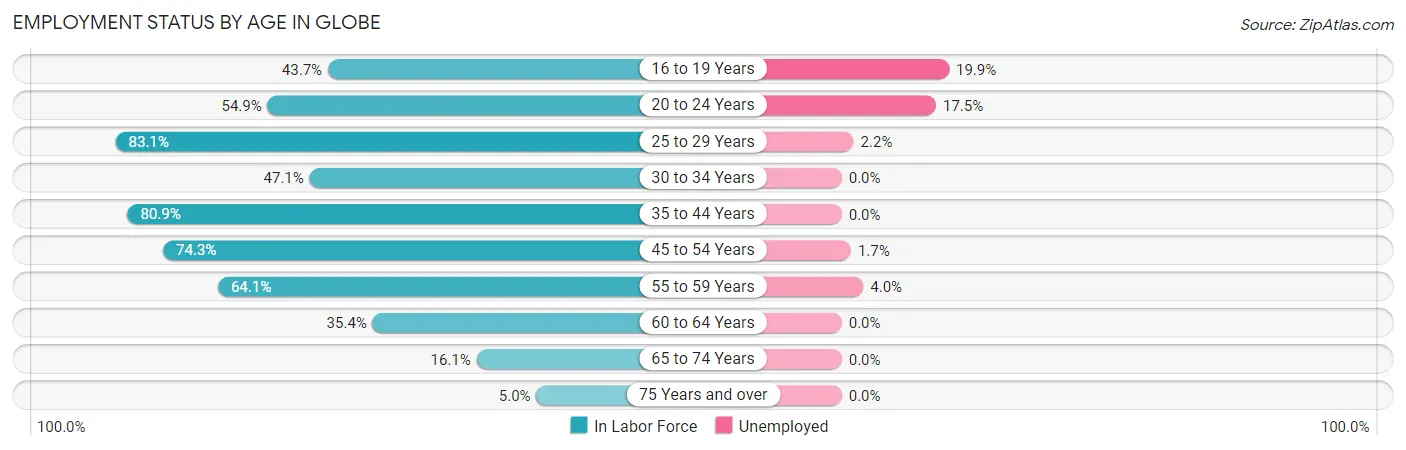
| Age Bracket | In Labor Force | Unemployed |
| 16 to 19 Years | 141 (43.7%) | 28 (19.9%) |
| 20 to 24 Years | 217 (54.9%) | 38 (17.5%) |
| 25 to 29 Years | 320 (83.1%) | 7 (2.2%) |
| 30 to 34 Years | 129 (47.1%) | 0 (0.0%) |
| 35 to 44 Years | 879 (80.9%) | 0 (0.0%) |
| 45 to 54 Years | 903 (74.3%) | 15 (1.7%) |
| 55 to 59 Years | 302 (64.1%) | 12 (4.0%) |
| 60 to 64 Years | 175 (35.4%) | 0 (0.0%) |
| 65 to 74 Years | 142 (16.1%) | 0 (0.0%) |
| 75 Years and over | 29 (5.0%) | 0 (0.0%) |
| Total | 3,235 (53.0%) | 104 (3.2%) |
Employment Status by Educational Attainment in Globe
According to labor force statistics for Globe, 69.0% of individuals (2,710) out of the total population between 25 and 64 years of age (3,927) are in the labor force, with 1.3% or 35 of them being unemployed. The group with the highest labor force participation rate are those with the educational attainment of bachelor's degree or higher, with 88.1% or 647 individuals in the labor force. Within the labor force, individuals with bachelor's degree or higher education have the highest percentage of unemployment, with 2.6% or 17 of them being unemployed.
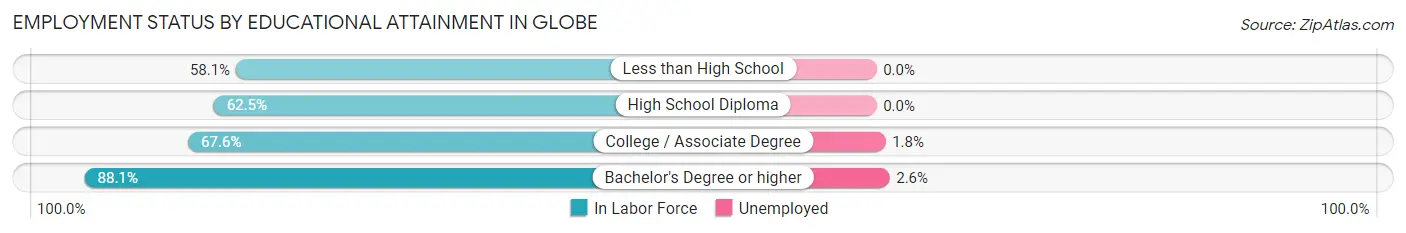
| Educational Attainment | In Labor Force | Unemployed |
| Less than High School | 176 (58.1%) | 0 (0.0%) |
| High School Diploma | 828 (62.5%) | 0 (0.0%) |
| College / Associate Degree | 1,058 (67.6%) | 28 (1.8%) |
| Bachelor's Degree or higher | 647 (88.1%) | 19 (2.6%) |
| Total | 2,710 (69.0%) | 51 (1.3%) |
Employment Occupations by Sex in Globe
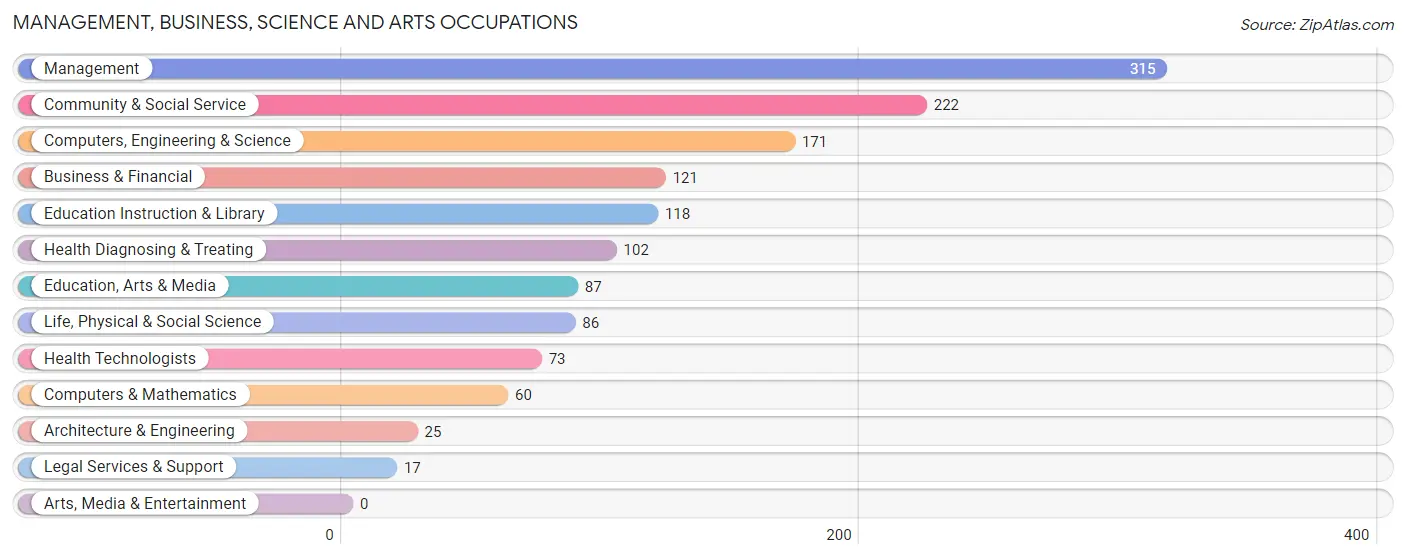
Management, Business, Science and Arts Occupations
The most common Management, Business, Science and Arts occupations in Globe are Management (315 | 10.3%), Community & Social Service (222 | 7.3%), Computers, Engineering & Science (171 | 5.6%), Business & Financial (121 | 4.0%), and Education Instruction & Library (118 | 3.9%).
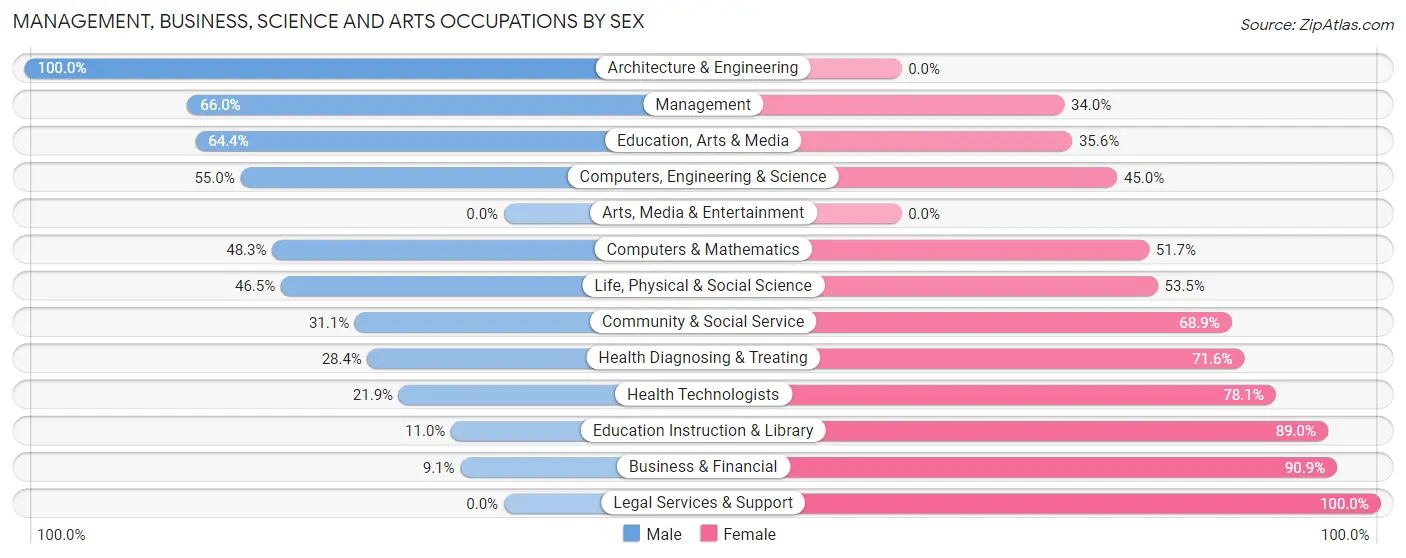
Management, Business, Science and Arts Occupations by Sex
Within the Management, Business, Science and Arts occupations in Globe, the most male-oriented occupations are Architecture & Engineering (100.0%), Management (66.0%), and Education, Arts & Media (64.4%), while the most female-oriented occupations are Legal Services & Support (100.0%), Business & Financial (90.9%), and Education Instruction & Library (89.0%).
| Occupation | Male | Female |
| Management | 208 (66.0%) | 107 (34.0%) |
| Business & Financial | 11 (9.1%) | 110 (90.9%) |
| Computers, Engineering & Science | 94 (55.0%) | 77 (45.0%) |
| Computers & Mathematics | 29 (48.3%) | 31 (51.7%) |
| Architecture & Engineering | 25 (100.0%) | 0 (0.0%) |
| Life, Physical & Social Science | 40 (46.5%) | 46 (53.5%) |
| Community & Social Service | 69 (31.1%) | 153 (68.9%) |
| Education, Arts & Media | 56 (64.4%) | 31 (35.6%) |
| Legal Services & Support | 0 (0.0%) | 17 (100.0%) |
| Education Instruction & Library | 13 (11.0%) | 105 (89.0%) |
| Arts, Media & Entertainment | 0 (0.0%) | 0 (0.0%) |
| Health Diagnosing & Treating | 29 (28.4%) | 73 (71.6%) |
| Health Technologists | 16 (21.9%) | 57 (78.1%) |
| Total (Category) | 411 (44.2%) | 520 (55.8%) |
| Total (Overall) | 1,630 (53.3%) | 1,428 (46.7%) |
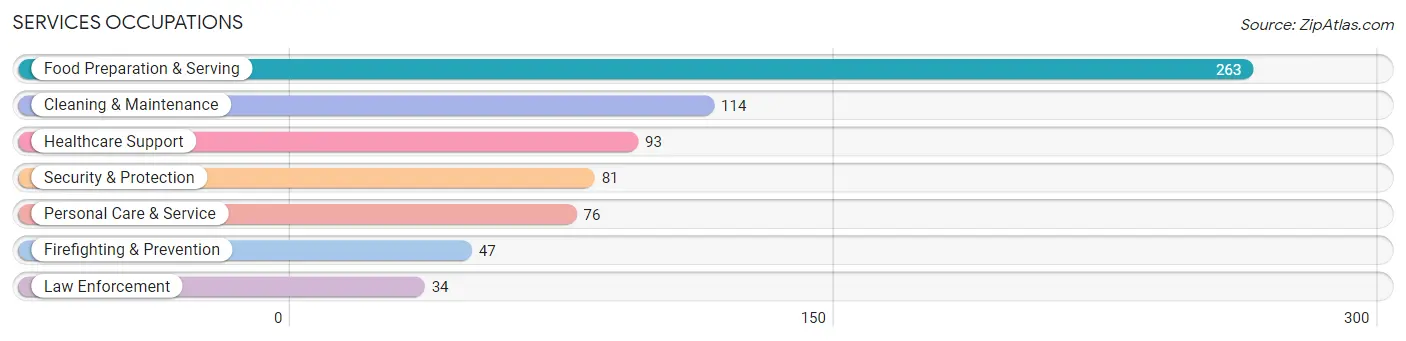
Services Occupations
The most common Services occupations in Globe are Food Preparation & Serving (263 | 8.6%), Cleaning & Maintenance (114 | 3.7%), Healthcare Support (93 | 3.0%), Security & Protection (81 | 2.6%), and Personal Care & Service (76 | 2.5%).
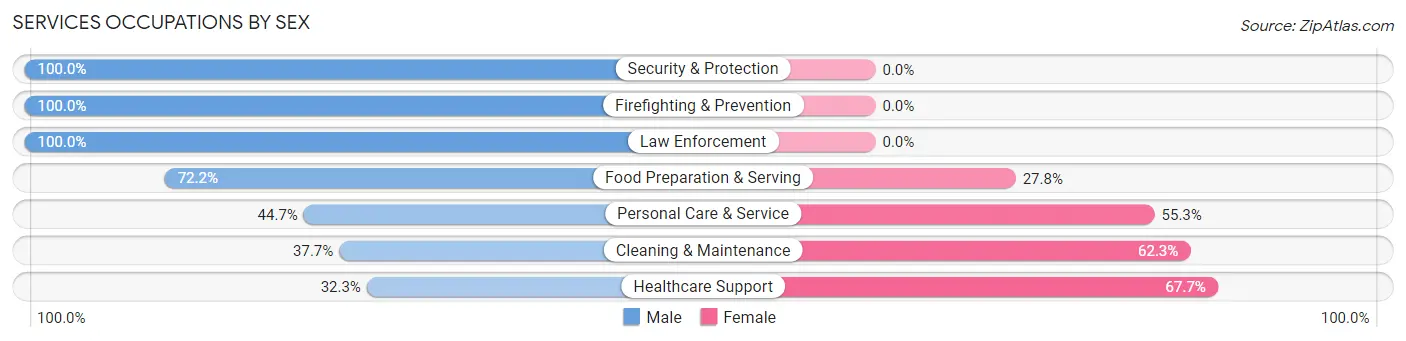
Services Occupations by Sex
Within the Services occupations in Globe, the most male-oriented occupations are Security & Protection (100.0%), Firefighting & Prevention (100.0%), and Law Enforcement (100.0%), while the most female-oriented occupations are Healthcare Support (67.7%), Cleaning & Maintenance (62.3%), and Personal Care & Service (55.3%).
| Occupation | Male | Female |
| Healthcare Support | 30 (32.3%) | 63 (67.7%) |
| Security & Protection | 81 (100.0%) | 0 (0.0%) |
| Firefighting & Prevention | 47 (100.0%) | 0 (0.0%) |
| Law Enforcement | 34 (100.0%) | 0 (0.0%) |
| Food Preparation & Serving | 190 (72.2%) | 73 (27.8%) |
| Cleaning & Maintenance | 43 (37.7%) | 71 (62.3%) |
| Personal Care & Service | 34 (44.7%) | 42 (55.3%) |
| Total (Category) | 378 (60.3%) | 249 (39.7%) |
| Total (Overall) | 1,630 (53.3%) | 1,428 (46.7%) |
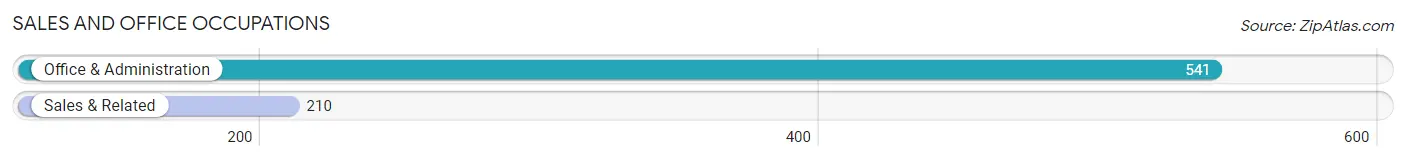
Sales and Office Occupations
The most common Sales and Office occupations in Globe are Office & Administration (541 | 17.7%), and Sales & Related (210 | 6.9%).
Sales and Office Occupations by Sex
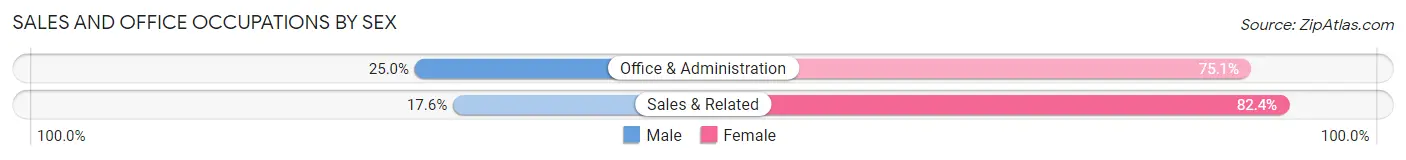
| Occupation | Male | Female |
| Sales & Related | 37 (17.6%) | 173 (82.4%) |
| Office & Administration | 135 (24.9%) | 406 (75.0%) |
| Total (Category) | 172 (22.9%) | 579 (77.1%) |
| Total (Overall) | 1,630 (53.3%) | 1,428 (46.7%) |
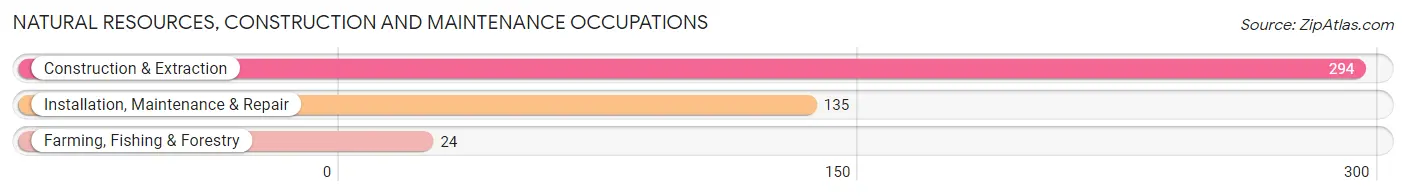
Natural Resources, Construction and Maintenance Occupations
The most common Natural Resources, Construction and Maintenance occupations in Globe are Construction & Extraction (294 | 9.6%), Installation, Maintenance & Repair (135 | 4.4%), and Farming, Fishing & Forestry (24 | 0.8%).
Natural Resources, Construction and Maintenance Occupations by Sex
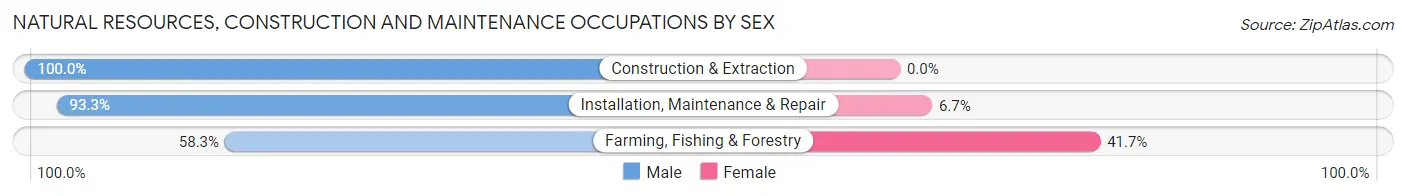
| Occupation | Male | Female |
| Farming, Fishing & Forestry | 14 (58.3%) | 10 (41.7%) |
| Construction & Extraction | 294 (100.0%) | 0 (0.0%) |
| Installation, Maintenance & Repair | 126 (93.3%) | 9 (6.7%) |
| Total (Category) | 434 (95.8%) | 19 (4.2%) |
| Total (Overall) | 1,630 (53.3%) | 1,428 (46.7%) |
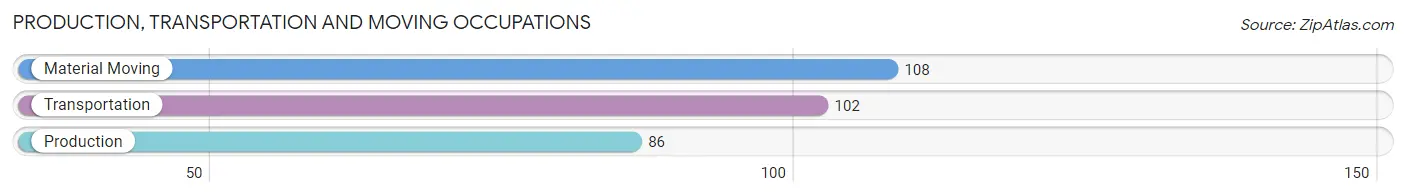
Production, Transportation and Moving Occupations
The most common Production, Transportation and Moving occupations in Globe are Material Moving (108 | 3.5%), Transportation (102 | 3.3%), and Production (86 | 2.8%).
Production, Transportation and Moving Occupations by Sex
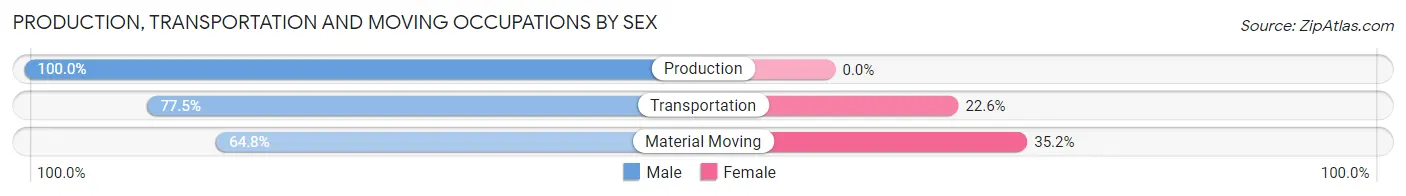
| Occupation | Male | Female |
| Production | 86 (100.0%) | 0 (0.0%) |
| Transportation | 79 (77.4%) | 23 (22.6%) |
| Material Moving | 70 (64.8%) | 38 (35.2%) |
| Total (Category) | 235 (79.4%) | 61 (20.6%) |
| Total (Overall) | 1,630 (53.3%) | 1,428 (46.7%) |
Employment Industries by Sex in Globe
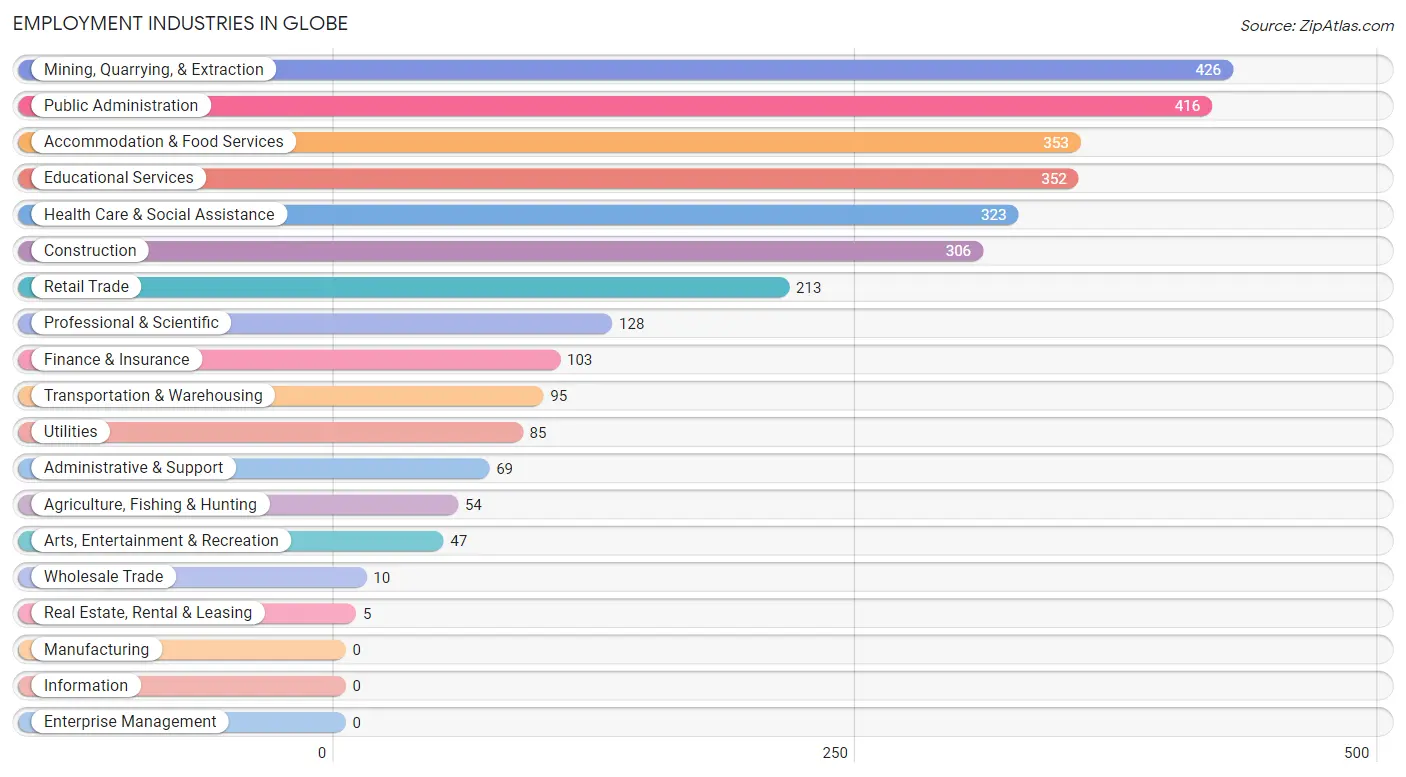
Employment Industries in Globe
The major employment industries in Globe include Mining, Quarrying, & Extraction (426 | 13.9%), Public Administration (416 | 13.6%), Accommodation & Food Services (353 | 11.5%), Educational Services (352 | 11.5%), and Health Care & Social Assistance (323 | 10.6%).
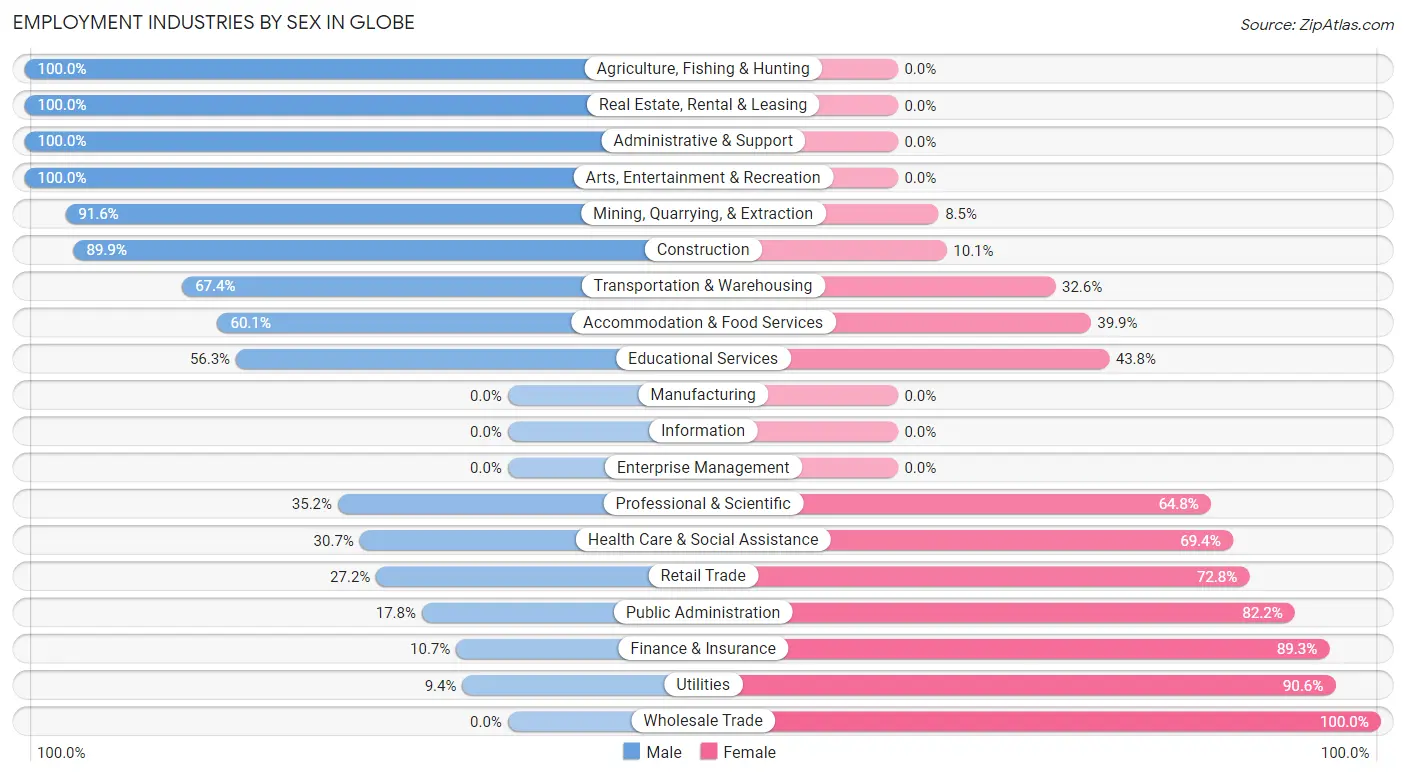
Employment Industries by Sex in Globe
The Globe industries that see more men than women are Agriculture, Fishing & Hunting (100.0%), Real Estate, Rental & Leasing (100.0%), and Administrative & Support (100.0%), whereas the industries that tend to have a higher number of women are Wholesale Trade (100.0%), Utilities (90.6%), and Finance & Insurance (89.3%).
| Industry | Male | Female |
| Agriculture, Fishing & Hunting | 54 (100.0%) | 0 (0.0%) |
| Mining, Quarrying, & Extraction | 390 (91.5%) | 36 (8.5%) |
| Construction | 275 (89.9%) | 31 (10.1%) |
| Manufacturing | 0 (0.0%) | 0 (0.0%) |
| Wholesale Trade | 0 (0.0%) | 10 (100.0%) |
| Retail Trade | 58 (27.2%) | 155 (72.8%) |
| Transportation & Warehousing | 64 (67.4%) | 31 (32.6%) |
| Utilities | 8 (9.4%) | 77 (90.6%) |
| Information | 0 (0.0%) | 0 (0.0%) |
| Finance & Insurance | 11 (10.7%) | 92 (89.3%) |
| Real Estate, Rental & Leasing | 5 (100.0%) | 0 (0.0%) |
| Professional & Scientific | 45 (35.2%) | 83 (64.8%) |
| Enterprise Management | 0 (0.0%) | 0 (0.0%) |
| Administrative & Support | 69 (100.0%) | 0 (0.0%) |
| Educational Services | 198 (56.2%) | 154 (43.8%) |
| Health Care & Social Assistance | 99 (30.6%) | 224 (69.4%) |
| Arts, Entertainment & Recreation | 47 (100.0%) | 0 (0.0%) |
| Accommodation & Food Services | 212 (60.1%) | 141 (39.9%) |
| Public Administration | 74 (17.8%) | 342 (82.2%) |
| Total | 1,630 (53.3%) | 1,428 (46.7%) |
Education in Globe
School Enrollment in Globe
The most common levels of schooling among the 1,369 students in Globe are high school (397 | 29.0%), college / undergraduate (392 | 28.6%), and elementary school (301 | 22.0%).
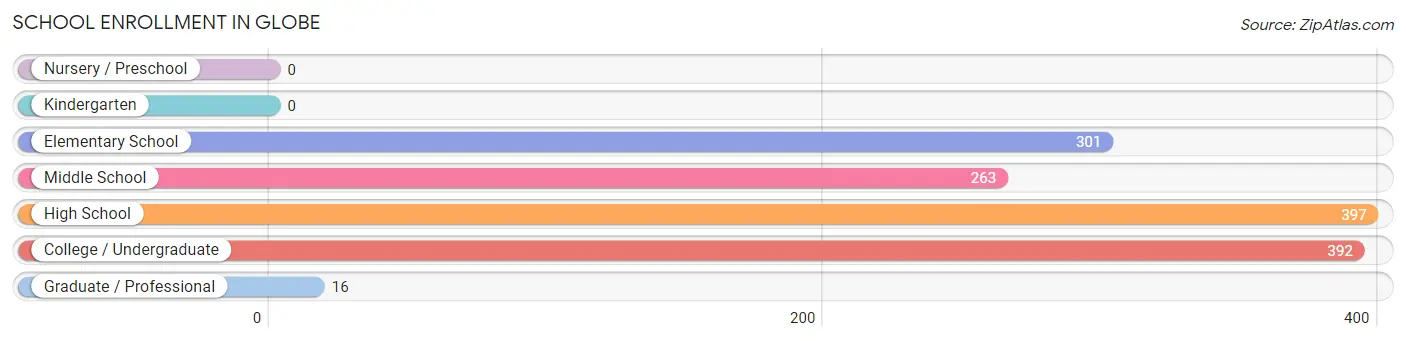
| School Level | # Students | % Students |
| Nursery / Preschool | 0 | 0.0% |
| Kindergarten | 0 | 0.0% |
| Elementary School | 301 | 22.0% |
| Middle School | 263 | 19.2% |
| High School | 397 | 29.0% |
| College / Undergraduate | 392 | 28.6% |
| Graduate / Professional | 16 | 1.2% |
| Total | 1,369 | 100.0% |
School Enrollment by Age by Funding Source in Globe
Out of a total of 1,369 students who are enrolled in schools in Globe, 118 (8.6%) attend a private institution, while the remaining 1,251 (91.4%) are enrolled in public schools. The age group of 20 to 24 year olds has the highest likelihood of being enrolled in private schools, with 32 (39.0% in the age bracket) enrolled. Conversely, the age group of 5 to 9 year old has the lowest likelihood of being enrolled in a private school, with 286 (100.0% in the age bracket) attending a public institution.
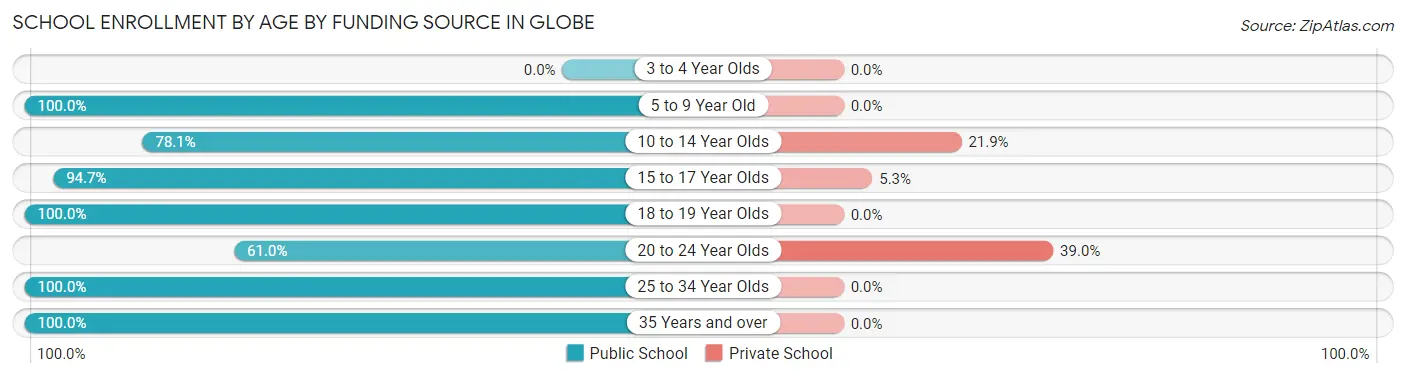
| Age Bracket | Public School | Private School |
| 3 to 4 Year Olds | 0 (0.0%) | 0 (0.0%) |
| 5 to 9 Year Old | 286 (100.0%) | 0 (0.0%) |
| 10 to 14 Year Olds | 249 (78.1%) | 70 (21.9%) |
| 15 to 17 Year Olds | 284 (94.7%) | 16 (5.3%) |
| 18 to 19 Year Olds | 160 (100.0%) | 0 (0.0%) |
| 20 to 24 Year Olds | 50 (61.0%) | 32 (39.0%) |
| 25 to 34 Year Olds | 37 (100.0%) | 0 (0.0%) |
| 35 Years and over | 185 (100.0%) | 0 (0.0%) |
| Total | 1,251 (91.4%) | 118 (8.6%) |
Educational Attainment by Field of Study in Globe
Business (290 | 28.8%), education (190 | 18.9%), bio, nature & agricultural (143 | 14.2%), arts & humanities (81 | 8.0%), and social sciences (69 | 6.9%) are the most common fields of study among 1,008 individuals in Globe who have obtained a bachelor's degree or higher.
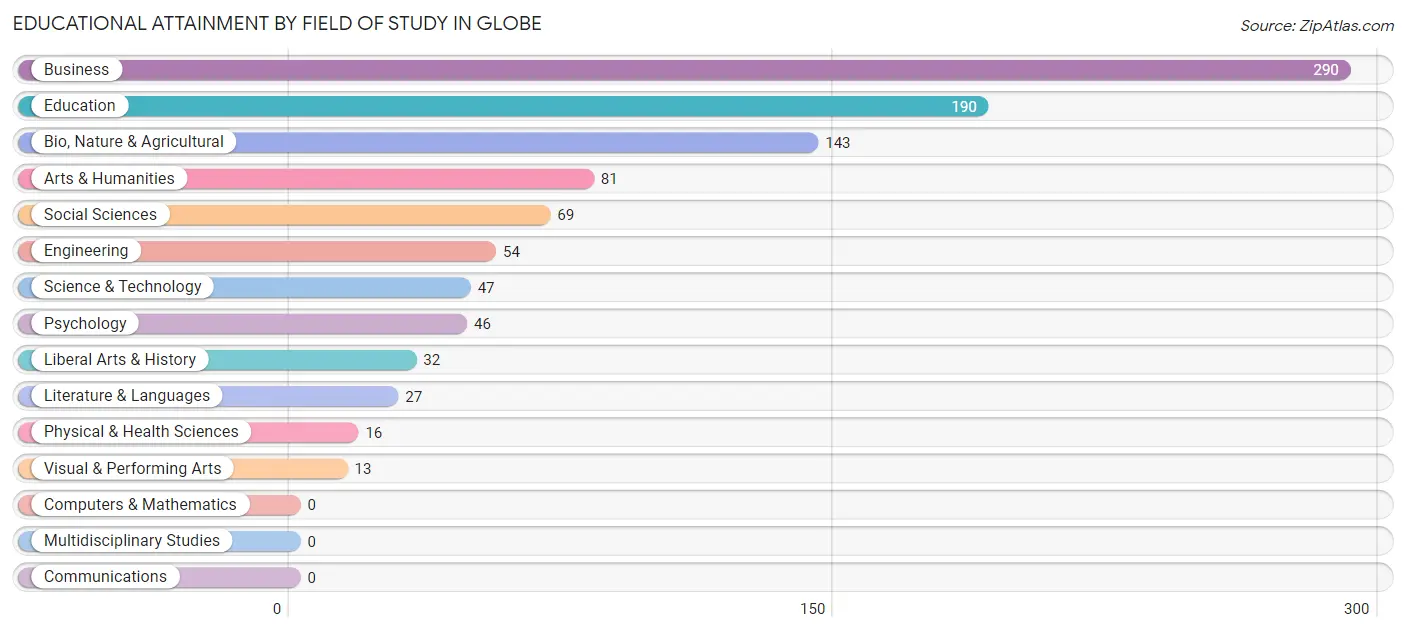
| Field of Study | # Graduates | % Graduates |
| Computers & Mathematics | 0 | 0.0% |
| Bio, Nature & Agricultural | 143 | 14.2% |
| Physical & Health Sciences | 16 | 1.6% |
| Psychology | 46 | 4.6% |
| Social Sciences | 69 | 6.9% |
| Engineering | 54 | 5.4% |
| Multidisciplinary Studies | 0 | 0.0% |
| Science & Technology | 47 | 4.7% |
| Business | 290 | 28.8% |
| Education | 190 | 18.9% |
| Literature & Languages | 27 | 2.7% |
| Liberal Arts & History | 32 | 3.2% |
| Visual & Performing Arts | 13 | 1.3% |
| Communications | 0 | 0.0% |
| Arts & Humanities | 81 | 8.0% |
| Total | 1,008 | 100.0% |
Transportation & Commute in Globe
Vehicle Availability by Sex in Globe
The most prevalent vehicle ownership categories in Globe are males with 2 vehicles (785, accounting for 47.0%) and females with 2 vehicles (578, making up 55.5%).
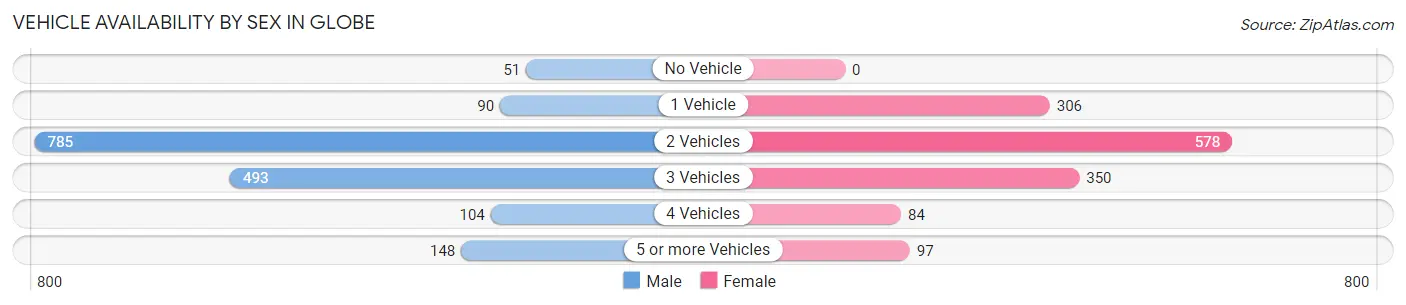
| Vehicles Available | Male | Female |
| No Vehicle | 51 (3.0%) | 0 (0.0%) |
| 1 Vehicle | 90 (5.4%) | 306 (21.6%) |
| 2 Vehicles | 785 (47.0%) | 578 (40.8%) |
| 3 Vehicles | 493 (29.5%) | 350 (24.7%) |
| 4 Vehicles | 104 (6.2%) | 84 (5.9%) |
| 5 or more Vehicles | 148 (8.9%) | 97 (6.9%) |
| Total | 1,671 (100.0%) | 1,415 (100.0%) |
Commute Time in Globe
The most frequently occuring commute durations in Globe are 10 to 14 minutes (578 commuters, 19.9%), 5 to 9 minutes (465 commuters, 16.0%), and 15 to 19 minutes (454 commuters, 15.7%).
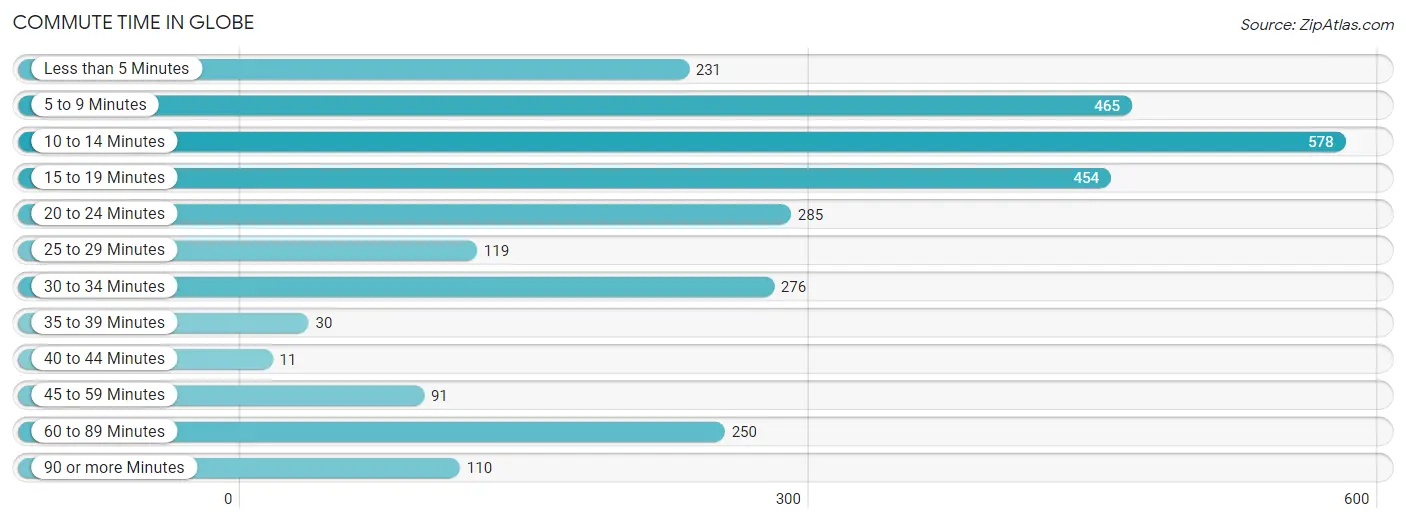
| Commute Time | # Commuters | % Commuters |
| Less than 5 Minutes | 231 | 8.0% |
| 5 to 9 Minutes | 465 | 16.0% |
| 10 to 14 Minutes | 578 | 19.9% |
| 15 to 19 Minutes | 454 | 15.7% |
| 20 to 24 Minutes | 285 | 9.8% |
| 25 to 29 Minutes | 119 | 4.1% |
| 30 to 34 Minutes | 276 | 9.5% |
| 35 to 39 Minutes | 30 | 1.0% |
| 40 to 44 Minutes | 11 | 0.4% |
| 45 to 59 Minutes | 91 | 3.1% |
| 60 to 89 Minutes | 250 | 8.6% |
| 90 or more Minutes | 110 | 3.8% |
Commute Time by Sex in Globe
The most common commute times in Globe are 10 to 14 minutes (349 commuters, 22.0%) for males and 5 to 9 minutes (291 commuters, 22.1%) for females.
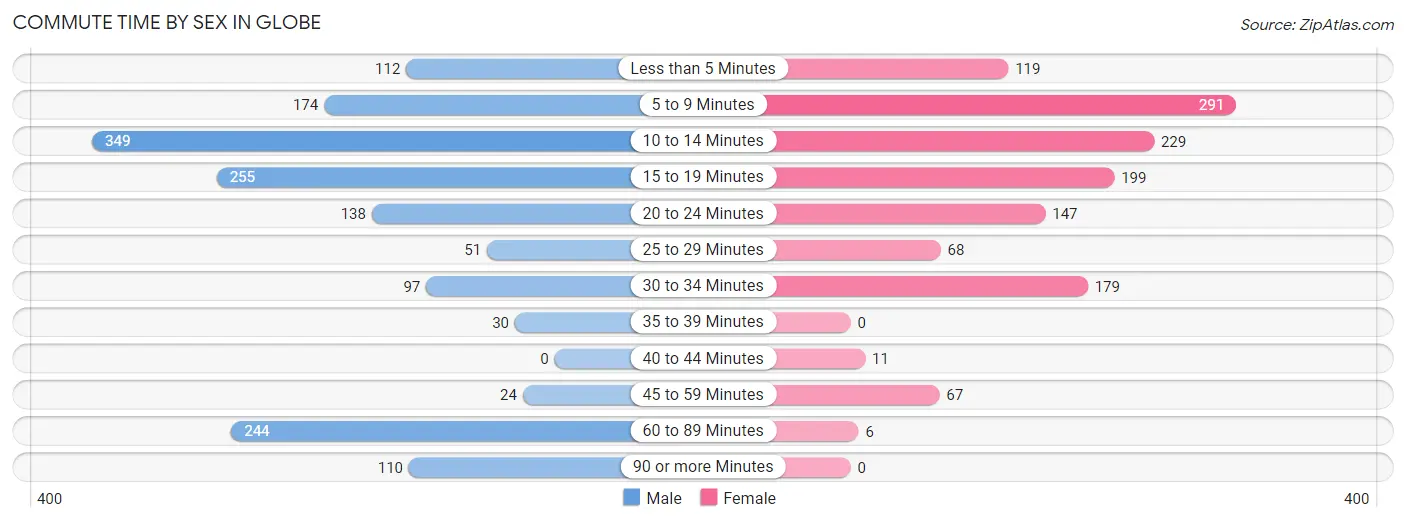
| Commute Time | Male | Female |
| Less than 5 Minutes | 112 (7.1%) | 119 (9.0%) |
| 5 to 9 Minutes | 174 (11.0%) | 291 (22.1%) |
| 10 to 14 Minutes | 349 (22.0%) | 229 (17.4%) |
| 15 to 19 Minutes | 255 (16.1%) | 199 (15.1%) |
| 20 to 24 Minutes | 138 (8.7%) | 147 (11.2%) |
| 25 to 29 Minutes | 51 (3.2%) | 68 (5.2%) |
| 30 to 34 Minutes | 97 (6.1%) | 179 (13.6%) |
| 35 to 39 Minutes | 30 (1.9%) | 0 (0.0%) |
| 40 to 44 Minutes | 0 (0.0%) | 11 (0.8%) |
| 45 to 59 Minutes | 24 (1.5%) | 67 (5.1%) |
| 60 to 89 Minutes | 244 (15.4%) | 6 (0.5%) |
| 90 or more Minutes | 110 (6.9%) | 0 (0.0%) |
Time of Departure to Work by Sex in Globe
The most frequent times of departure to work in Globe are 12:00 AM to 4:59 AM (295, 18.6%) for males and 7:30 AM to 7:59 AM (256, 19.5%) for females.
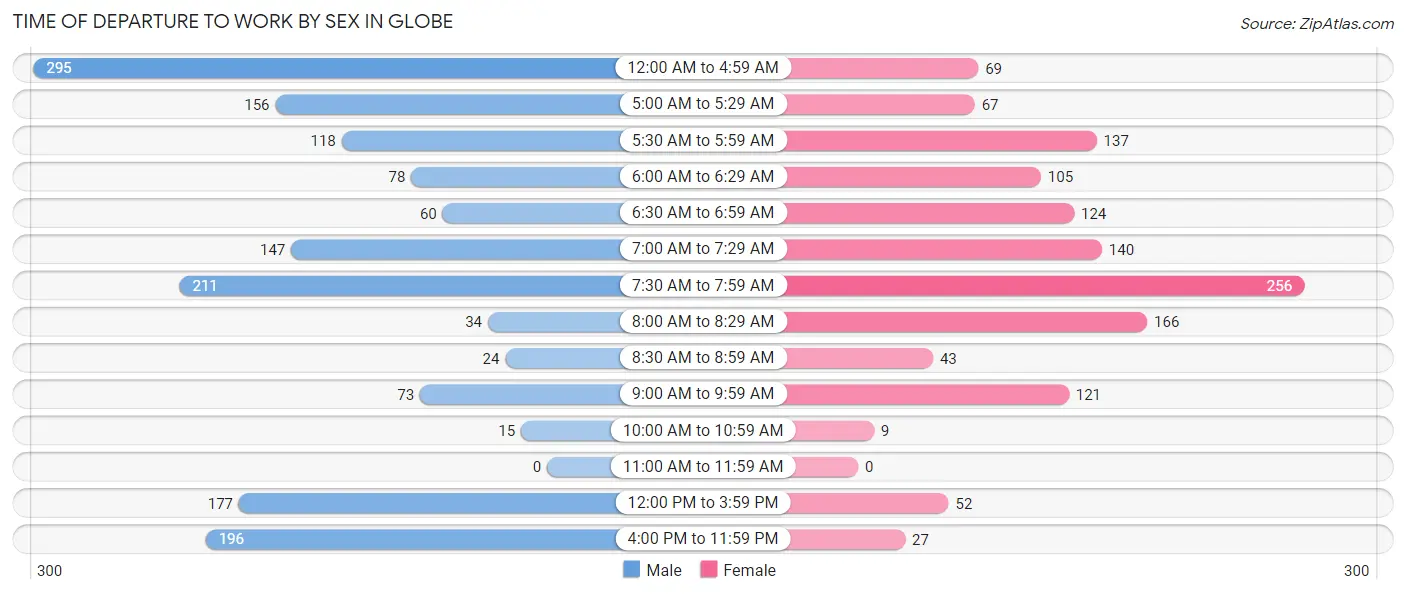
| Time of Departure | Male | Female |
| 12:00 AM to 4:59 AM | 295 (18.6%) | 69 (5.2%) |
| 5:00 AM to 5:29 AM | 156 (9.9%) | 67 (5.1%) |
| 5:30 AM to 5:59 AM | 118 (7.4%) | 137 (10.4%) |
| 6:00 AM to 6:29 AM | 78 (4.9%) | 105 (8.0%) |
| 6:30 AM to 6:59 AM | 60 (3.8%) | 124 (9.4%) |
| 7:00 AM to 7:29 AM | 147 (9.3%) | 140 (10.6%) |
| 7:30 AM to 7:59 AM | 211 (13.3%) | 256 (19.5%) |
| 8:00 AM to 8:29 AM | 34 (2.1%) | 166 (12.6%) |
| 8:30 AM to 8:59 AM | 24 (1.5%) | 43 (3.3%) |
| 9:00 AM to 9:59 AM | 73 (4.6%) | 121 (9.2%) |
| 10:00 AM to 10:59 AM | 15 (0.9%) | 9 (0.7%) |
| 11:00 AM to 11:59 AM | 0 (0.0%) | 0 (0.0%) |
| 12:00 PM to 3:59 PM | 177 (11.2%) | 52 (4.0%) |
| 4:00 PM to 11:59 PM | 196 (12.4%) | 27 (2.1%) |
| Total | 1,584 (100.0%) | 1,316 (100.0%) |
Housing Occupancy in Globe
Occupancy by Ownership in Globe
Of the total 3,004 dwellings in Globe, owner-occupied units account for 1,956 (65.1%), while renter-occupied units make up 1,048 (34.9%).
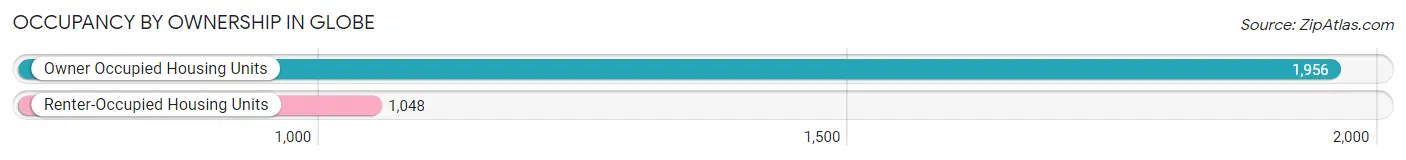
| Occupancy | # Housing Units | % Housing Units |
| Owner Occupied Housing Units | 1,956 | 65.1% |
| Renter-Occupied Housing Units | 1,048 | 34.9% |
| Total Occupied Housing Units | 3,004 | 100.0% |
Occupancy by Household Size in Globe
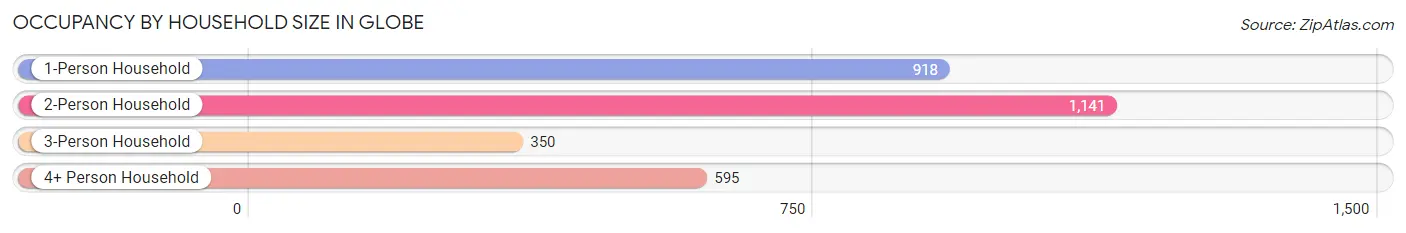
| Household Size | # Housing Units | % Housing Units |
| 1-Person Household | 918 | 30.6% |
| 2-Person Household | 1,141 | 38.0% |
| 3-Person Household | 350 | 11.7% |
| 4+ Person Household | 595 | 19.8% |
| Total Housing Units | 3,004 | 100.0% |
Occupancy by Ownership by Household Size in Globe
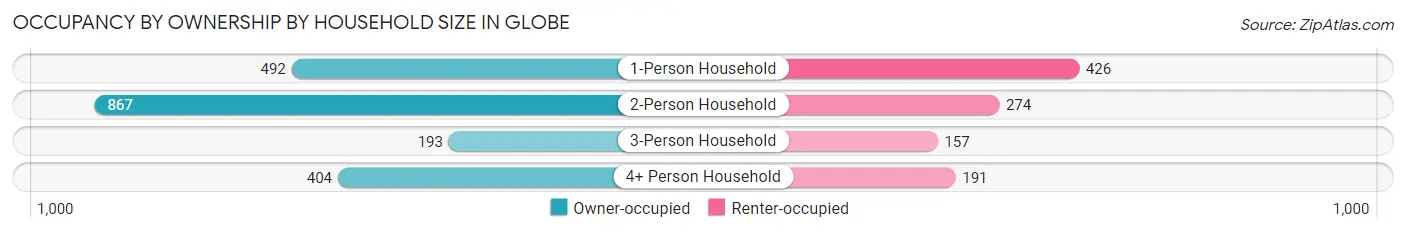
| Household Size | Owner-occupied | Renter-occupied |
| 1-Person Household | 492 (53.6%) | 426 (46.4%) |
| 2-Person Household | 867 (76.0%) | 274 (24.0%) |
| 3-Person Household | 193 (55.1%) | 157 (44.9%) |
| 4+ Person Household | 404 (67.9%) | 191 (32.1%) |
| Total Housing Units | 1,956 (65.1%) | 1,048 (34.9%) |
Occupancy by Educational Attainment in Globe
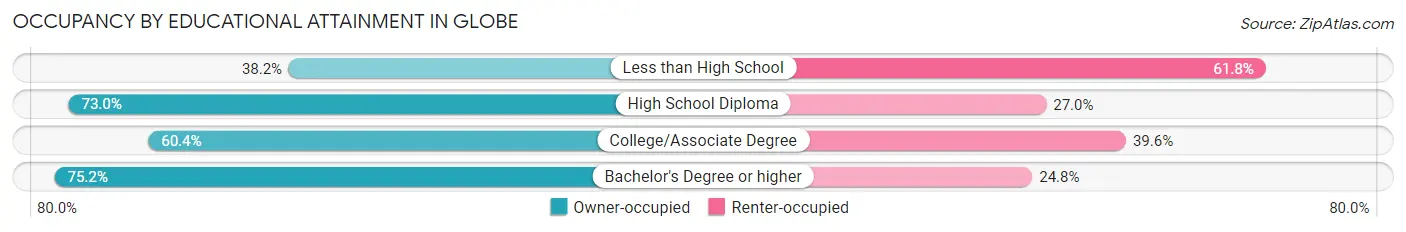
| Household Size | Owner-occupied | Renter-occupied |
| Less than High School | 112 (38.2%) | 181 (61.8%) |
| High School Diploma | 582 (73.0%) | 215 (27.0%) |
| College/Associate Degree | 724 (60.4%) | 475 (39.6%) |
| Bachelor's Degree or higher | 538 (75.2%) | 177 (24.8%) |
Occupancy by Age of Householder in Globe
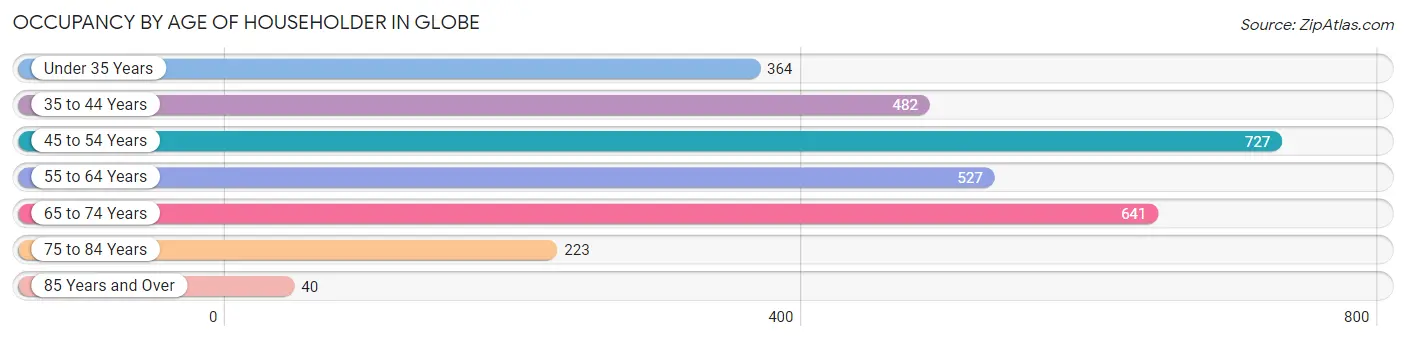
| Age Bracket | # Households | % Households |
| Under 35 Years | 364 | 12.1% |
| 35 to 44 Years | 482 | 16.1% |
| 45 to 54 Years | 727 | 24.2% |
| 55 to 64 Years | 527 | 17.5% |
| 65 to 74 Years | 641 | 21.3% |
| 75 to 84 Years | 223 | 7.4% |
| 85 Years and Over | 40 | 1.3% |
| Total | 3,004 | 100.0% |
Housing Finances in Globe
Median Income by Occupancy in Globe
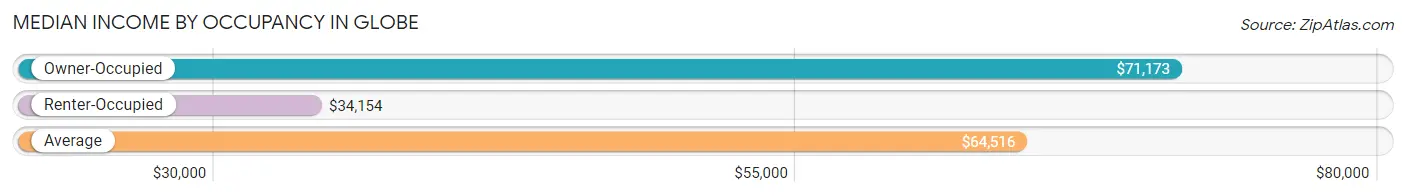
| Occupancy Type | # Households | Median Income |
| Owner-Occupied | 1,956 (65.1%) | $71,173 |
| Renter-Occupied | 1,048 (34.9%) | $34,154 |
| Average | 3,004 (100.0%) | $64,516 |
Occupancy by Householder Income Bracket in Globe
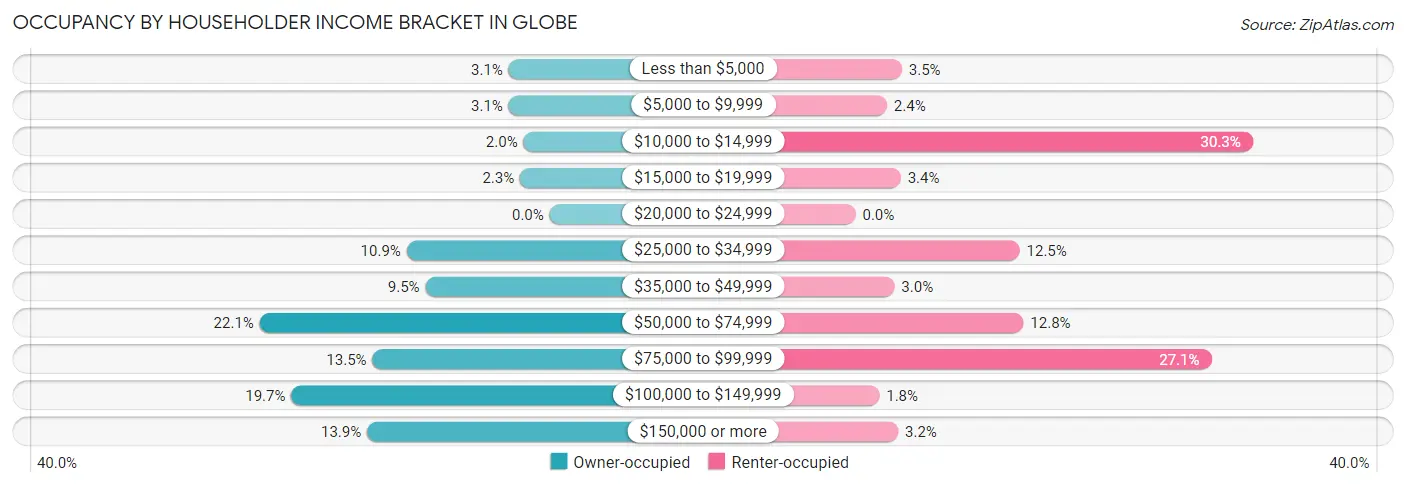
| Income Bracket | Owner-occupied | Renter-occupied |
| Less than $5,000 | 61 (3.1%) | 37 (3.5%) |
| $5,000 to $9,999 | 61 (3.1%) | 25 (2.4%) |
| $10,000 to $14,999 | 39 (2.0%) | 317 (30.2%) |
| $15,000 to $19,999 | 44 (2.2%) | 36 (3.4%) |
| $20,000 to $24,999 | 0 (0.0%) | 0 (0.0%) |
| $25,000 to $34,999 | 213 (10.9%) | 131 (12.5%) |
| $35,000 to $49,999 | 185 (9.5%) | 31 (3.0%) |
| $50,000 to $74,999 | 432 (22.1%) | 134 (12.8%) |
| $75,000 to $99,999 | 264 (13.5%) | 284 (27.1%) |
| $100,000 to $149,999 | 385 (19.7%) | 19 (1.8%) |
| $150,000 or more | 272 (13.9%) | 34 (3.2%) |
| Total | 1,956 (100.0%) | 1,048 (100.0%) |
Monthly Housing Cost Tiers in Globe
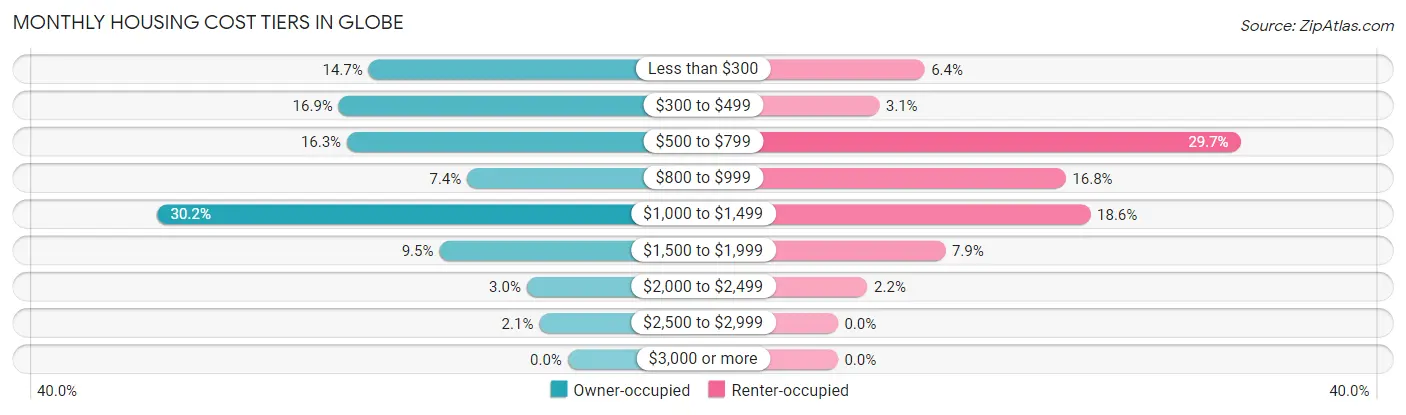
| Monthly Cost | Owner-occupied | Renter-occupied |
| Less than $300 | 287 (14.7%) | 67 (6.4%) |
| $300 to $499 | 330 (16.9%) | 32 (3.0%) |
| $500 to $799 | 318 (16.3%) | 311 (29.7%) |
| $800 to $999 | 145 (7.4%) | 176 (16.8%) |
| $1,000 to $1,499 | 591 (30.2%) | 195 (18.6%) |
| $1,500 to $1,999 | 185 (9.5%) | 83 (7.9%) |
| $2,000 to $2,499 | 59 (3.0%) | 23 (2.2%) |
| $2,500 to $2,999 | 41 (2.1%) | 0 (0.0%) |
| $3,000 or more | 0 (0.0%) | 0 (0.0%) |
| Total | 1,956 (100.0%) | 1,048 (100.0%) |
Physical Housing Characteristics in Globe
Housing Structures in Globe
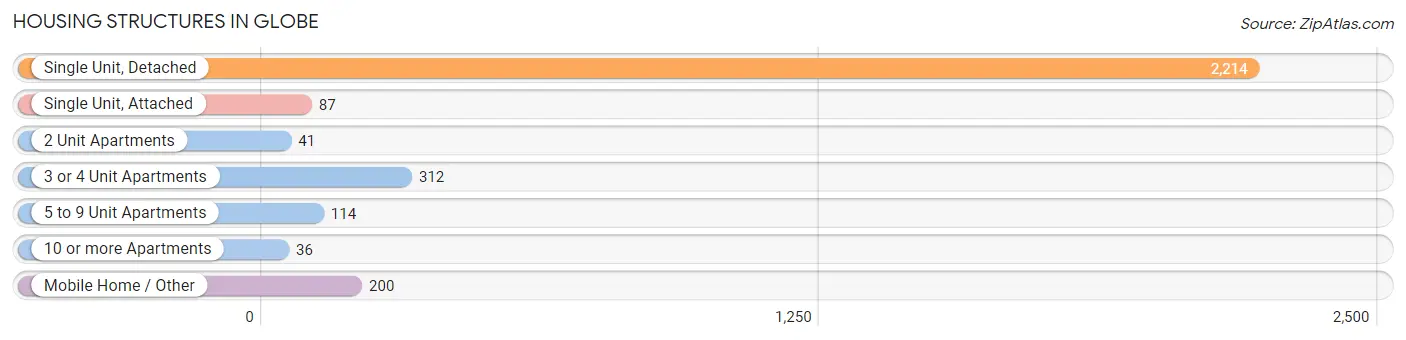
| Structure Type | # Housing Units | % Housing Units |
| Single Unit, Detached | 2,214 | 73.7% |
| Single Unit, Attached | 87 | 2.9% |
| 2 Unit Apartments | 41 | 1.4% |
| 3 or 4 Unit Apartments | 312 | 10.4% |
| 5 to 9 Unit Apartments | 114 | 3.8% |
| 10 or more Apartments | 36 | 1.2% |
| Mobile Home / Other | 200 | 6.7% |
| Total | 3,004 | 100.0% |
Housing Structures by Occupancy in Globe
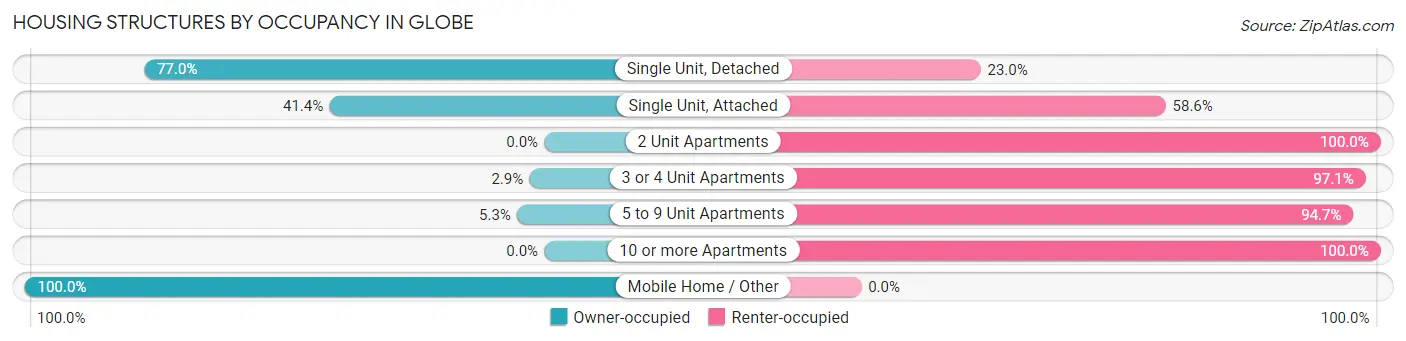
| Structure Type | Owner-occupied | Renter-occupied |
| Single Unit, Detached | 1,705 (77.0%) | 509 (23.0%) |
| Single Unit, Attached | 36 (41.4%) | 51 (58.6%) |
| 2 Unit Apartments | 0 (0.0%) | 41 (100.0%) |
| 3 or 4 Unit Apartments | 9 (2.9%) | 303 (97.1%) |
| 5 to 9 Unit Apartments | 6 (5.3%) | 108 (94.7%) |
| 10 or more Apartments | 0 (0.0%) | 36 (100.0%) |
| Mobile Home / Other | 200 (100.0%) | 0 (0.0%) |
| Total | 1,956 (65.1%) | 1,048 (34.9%) |
Housing Structures by Number of Rooms in Globe
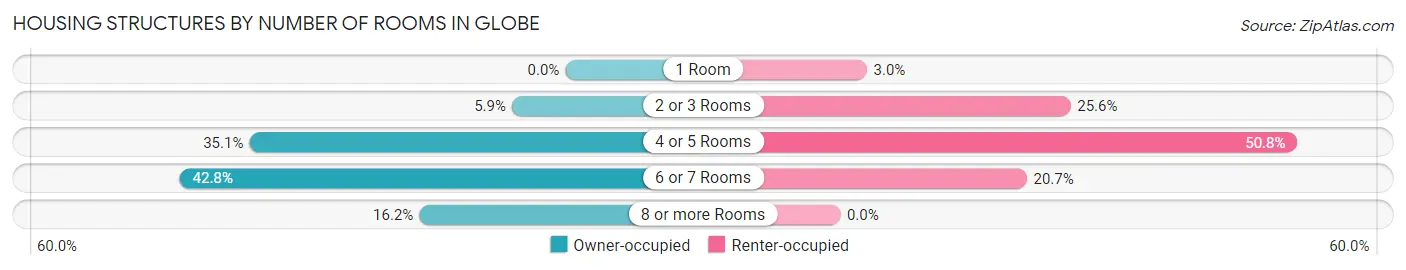
| Number of Rooms | Owner-occupied | Renter-occupied |
| 1 Room | 0 (0.0%) | 31 (3.0%) |
| 2 or 3 Rooms | 116 (5.9%) | 268 (25.6%) |
| 4 or 5 Rooms | 686 (35.1%) | 532 (50.8%) |
| 6 or 7 Rooms | 837 (42.8%) | 217 (20.7%) |
| 8 or more Rooms | 317 (16.2%) | 0 (0.0%) |
| Total | 1,956 (100.0%) | 1,048 (100.0%) |
Housing Structure by Heating Type in Globe
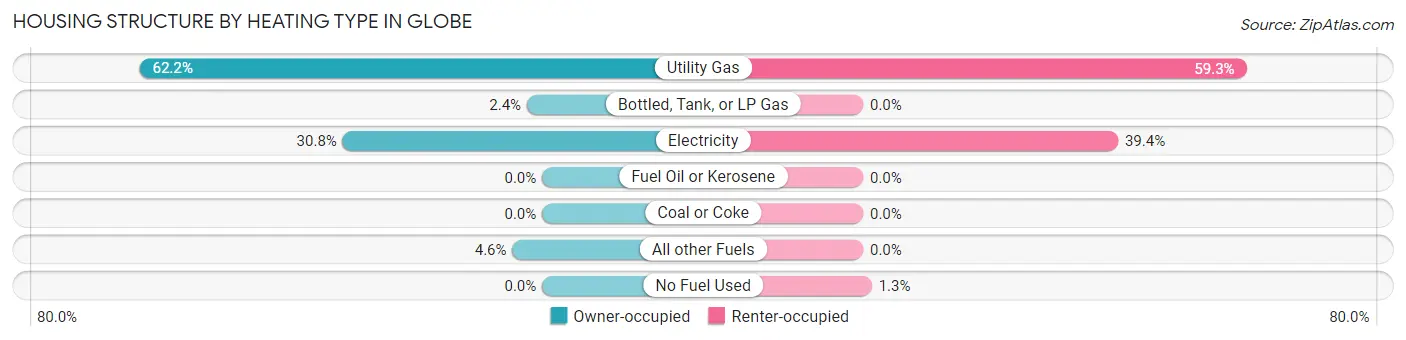
| Heating Type | Owner-occupied | Renter-occupied |
| Utility Gas | 1,217 (62.2%) | 621 (59.3%) |
| Bottled, Tank, or LP Gas | 46 (2.4%) | 0 (0.0%) |
| Electricity | 603 (30.8%) | 413 (39.4%) |
| Fuel Oil or Kerosene | 0 (0.0%) | 0 (0.0%) |
| Coal or Coke | 0 (0.0%) | 0 (0.0%) |
| All other Fuels | 90 (4.6%) | 0 (0.0%) |
| No Fuel Used | 0 (0.0%) | 14 (1.3%) |
| Total | 1,956 (100.0%) | 1,048 (100.0%) |
Household Vehicle Usage in Globe
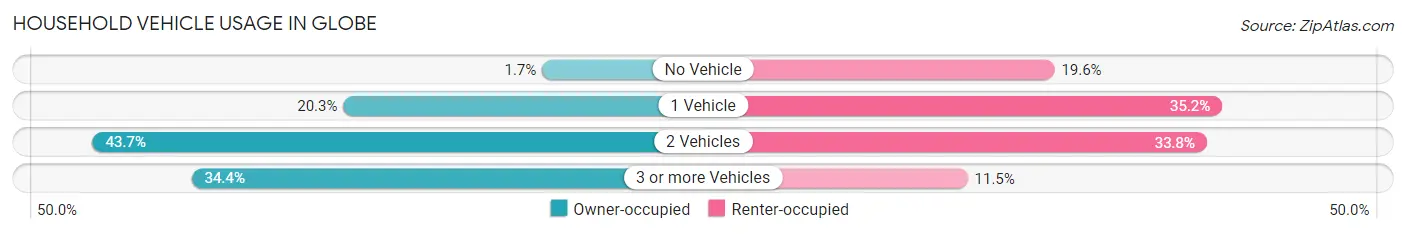
| Vehicles per Household | Owner-occupied | Renter-occupied |
| No Vehicle | 33 (1.7%) | 205 (19.6%) |
| 1 Vehicle | 396 (20.3%) | 369 (35.2%) |
| 2 Vehicles | 854 (43.7%) | 354 (33.8%) |
| 3 or more Vehicles | 673 (34.4%) | 120 (11.5%) |
| Total | 1,956 (100.0%) | 1,048 (100.0%) |
Real Estate & Mortgages in Globe
Real Estate and Mortgage Overview in Globe
| Characteristic | Without Mortgage | With Mortgage |
| Housing Units | 900 | 1,056 |
| Median Property Value | $173,700 | $197,000 |
| Median Household Income | $56,474 | $272 |
| Monthly Housing Costs | $349 | $0 |
| Real Estate Taxes | $701 | $0 |
Property Value by Mortgage Status in Globe
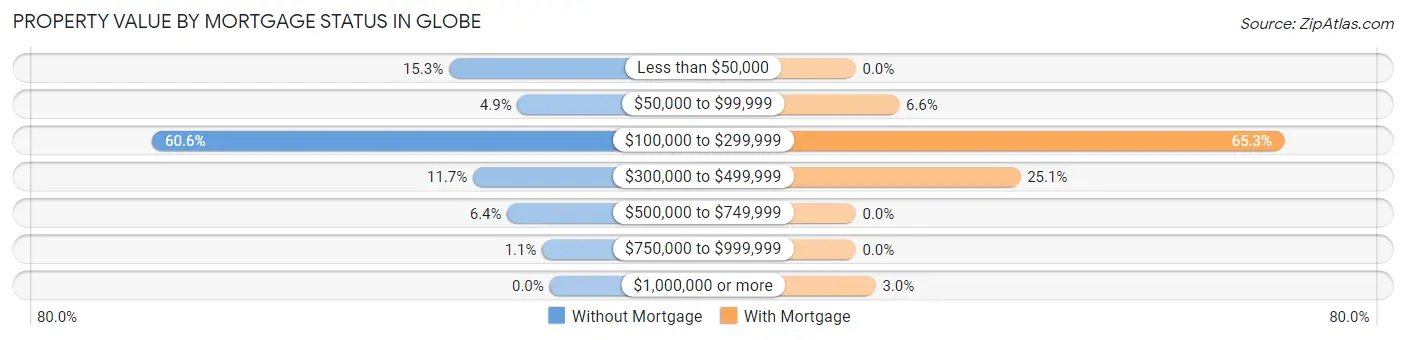
| Property Value | Without Mortgage | With Mortgage |
| Less than $50,000 | 138 (15.3%) | 0 (0.0%) |
| $50,000 to $99,999 | 44 (4.9%) | 70 (6.6%) |
| $100,000 to $299,999 | 545 (60.6%) | 689 (65.2%) |
| $300,000 to $499,999 | 105 (11.7%) | 265 (25.1%) |
| $500,000 to $749,999 | 58 (6.4%) | 0 (0.0%) |
| $750,000 to $999,999 | 10 (1.1%) | 0 (0.0%) |
| $1,000,000 or more | 0 (0.0%) | 32 (3.0%) |
| Total | 900 (100.0%) | 1,056 (100.0%) |
Household Income by Mortgage Status in Globe
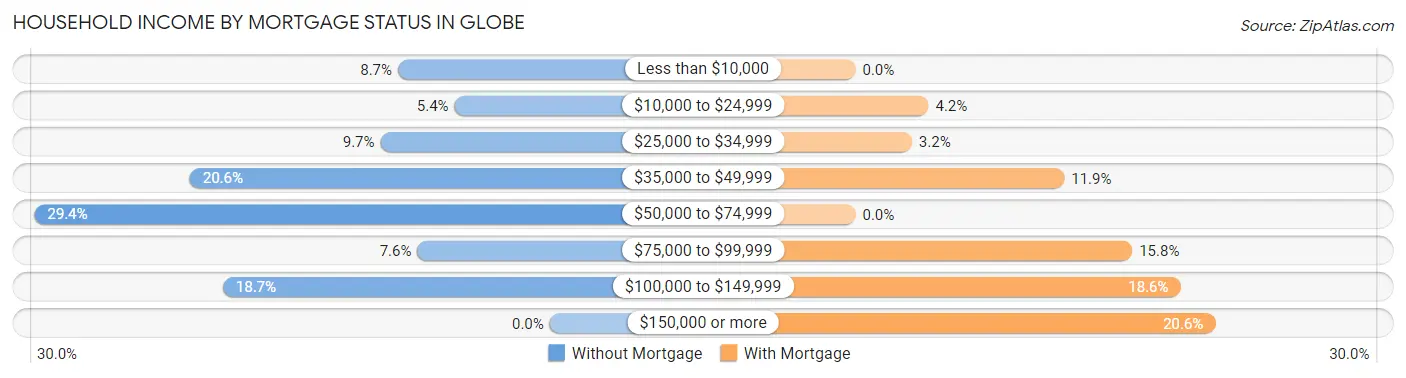
| Household Income | Without Mortgage | With Mortgage |
| Less than $10,000 | 78 (8.7%) | 0 (0.0%) |
| $10,000 to $24,999 | 49 (5.4%) | 44 (4.2%) |
| $25,000 to $34,999 | 87 (9.7%) | 34 (3.2%) |
| $35,000 to $49,999 | 185 (20.6%) | 126 (11.9%) |
| $50,000 to $74,999 | 265 (29.4%) | 0 (0.0%) |
| $75,000 to $99,999 | 68 (7.6%) | 167 (15.8%) |
| $100,000 to $149,999 | 168 (18.7%) | 196 (18.6%) |
| $150,000 or more | 0 (0.0%) | 217 (20.5%) |
| Total | 900 (100.0%) | 1,056 (100.0%) |
Property Value to Household Income Ratio in Globe
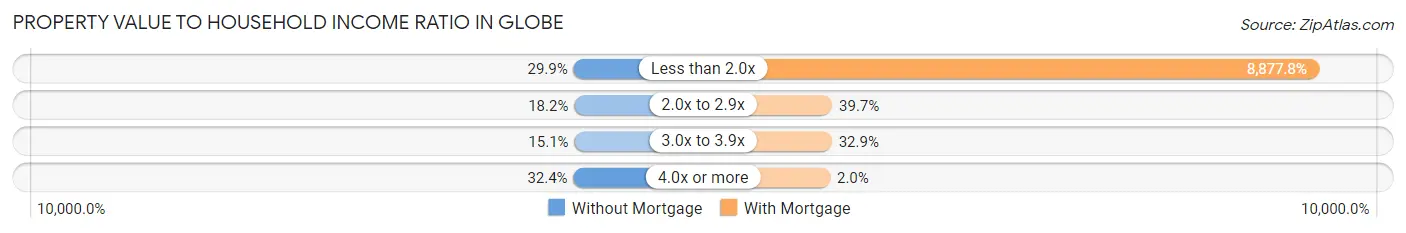
| Value-to-Income Ratio | Without Mortgage | With Mortgage |
| Less than 2.0x | 269 (29.9%) | 93,750 (8,877.8%) |
| 2.0x to 2.9x | 164 (18.2%) | 419 (39.7%) |
| 3.0x to 3.9x | 136 (15.1%) | 347 (32.9%) |
| 4.0x or more | 292 (32.4%) | 21 (2.0%) |
| Total | 900 (100.0%) | 1,056 (100.0%) |
Real Estate Taxes by Mortgage Status in Globe
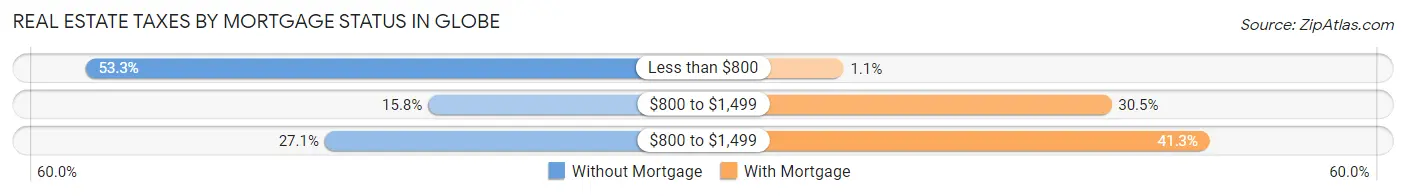
| Property Taxes | Without Mortgage | With Mortgage |
| Less than $800 | 480 (53.3%) | 12 (1.1%) |
| $800 to $1,499 | 142 (15.8%) | 322 (30.5%) |
| $800 to $1,499 | 244 (27.1%) | 436 (41.3%) |
| Total | 900 (100.0%) | 1,056 (100.0%) |
Health & Disability in Globe
Health Insurance Coverage by Age in Globe
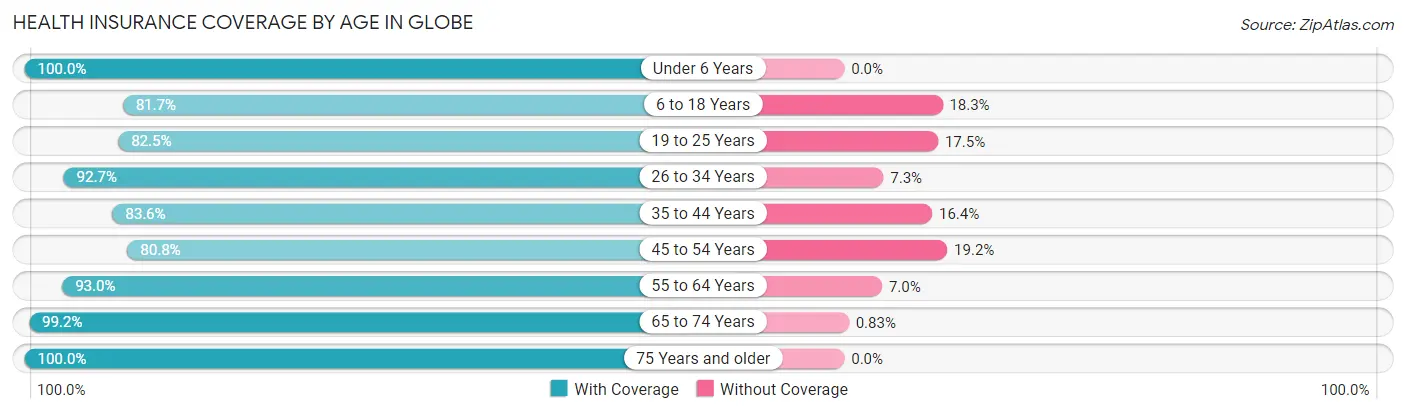
| Age Bracket | With Coverage | Without Coverage |
| Under 6 Years | 323 (100.0%) | 0 (0.0%) |
| 6 to 18 Years | 799 (81.7%) | 179 (18.3%) |
| 19 to 25 Years | 430 (82.5%) | 91 (17.5%) |
| 26 to 34 Years | 497 (92.7%) | 39 (7.3%) |
| 35 to 44 Years | 756 (83.6%) | 148 (16.4%) |
| 45 to 54 Years | 906 (80.8%) | 215 (19.2%) |
| 55 to 64 Years | 808 (93.0%) | 61 (7.0%) |
| 65 to 74 Years | 841 (99.2%) | 7 (0.8%) |
| 75 Years and older | 503 (100.0%) | 0 (0.0%) |
| Total | 5,863 (88.8%) | 740 (11.2%) |
Health Insurance Coverage by Citizenship Status in Globe
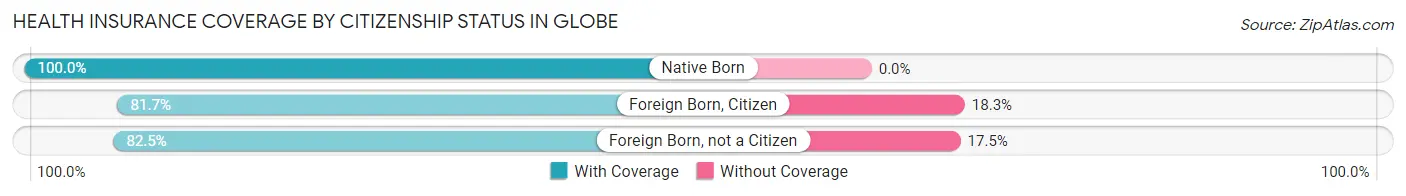
| Citizenship Status | With Coverage | Without Coverage |
| Native Born | 323 (100.0%) | 0 (0.0%) |
| Foreign Born, Citizen | 799 (81.7%) | 179 (18.3%) |
| Foreign Born, not a Citizen | 430 (82.5%) | 91 (17.5%) |
Health Insurance Coverage by Household Income in Globe
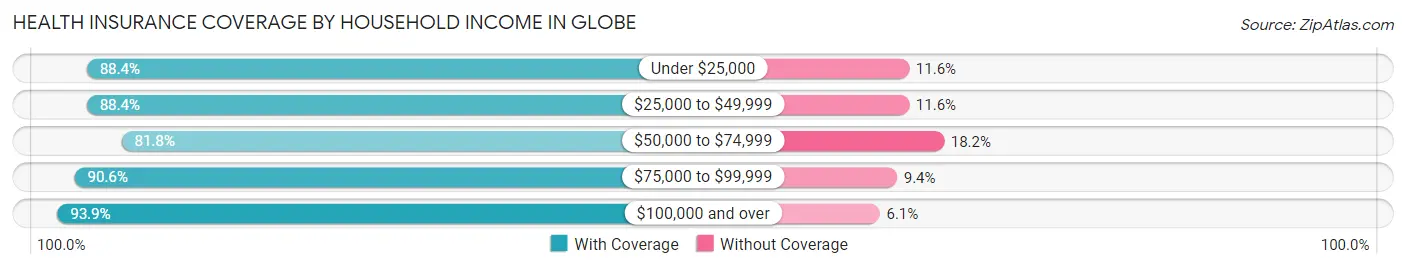
| Household Income | With Coverage | Without Coverage |
| Under $25,000 | 706 (88.4%) | 93 (11.6%) |
| $25,000 to $49,999 | 949 (88.4%) | 125 (11.6%) |
| $50,000 to $74,999 | 1,252 (81.8%) | 278 (18.2%) |
| $75,000 to $99,999 | 1,374 (90.6%) | 142 (9.4%) |
| $100,000 and over | 1,562 (93.9%) | 102 (6.1%) |
Public vs Private Health Insurance Coverage by Age in Globe
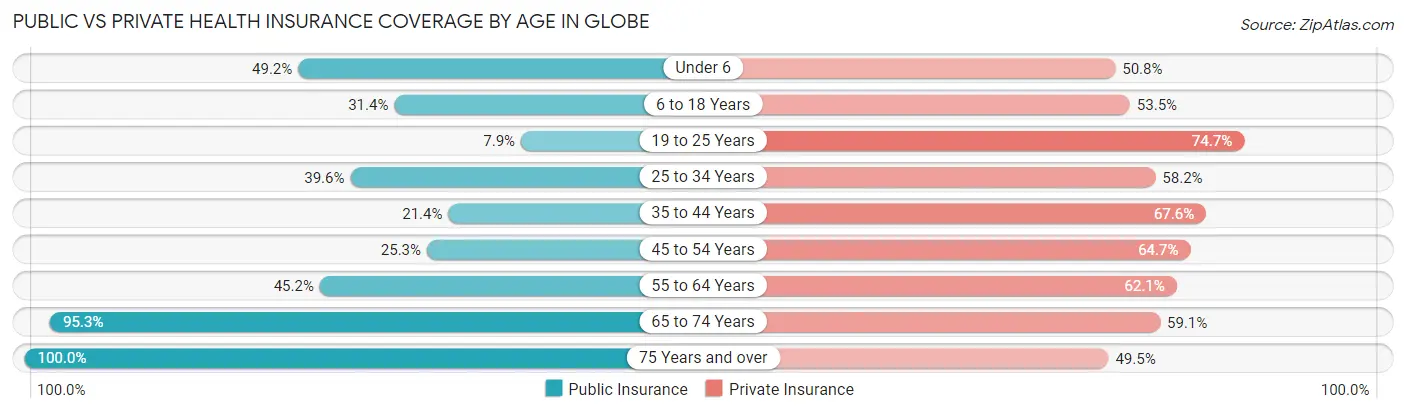
| Age Bracket | Public Insurance | Private Insurance |
| Under 6 | 159 (49.2%) | 164 (50.8%) |
| 6 to 18 Years | 307 (31.4%) | 523 (53.5%) |
| 19 to 25 Years | 41 (7.9%) | 389 (74.7%) |
| 25 to 34 Years | 212 (39.6%) | 312 (58.2%) |
| 35 to 44 Years | 193 (21.3%) | 611 (67.6%) |
| 45 to 54 Years | 284 (25.3%) | 725 (64.7%) |
| 55 to 64 Years | 393 (45.2%) | 540 (62.1%) |
| 65 to 74 Years | 808 (95.3%) | 501 (59.1%) |
| 75 Years and over | 503 (100.0%) | 249 (49.5%) |
| Total | 2,900 (43.9%) | 4,014 (60.8%) |
Disability Status by Sex by Age in Globe
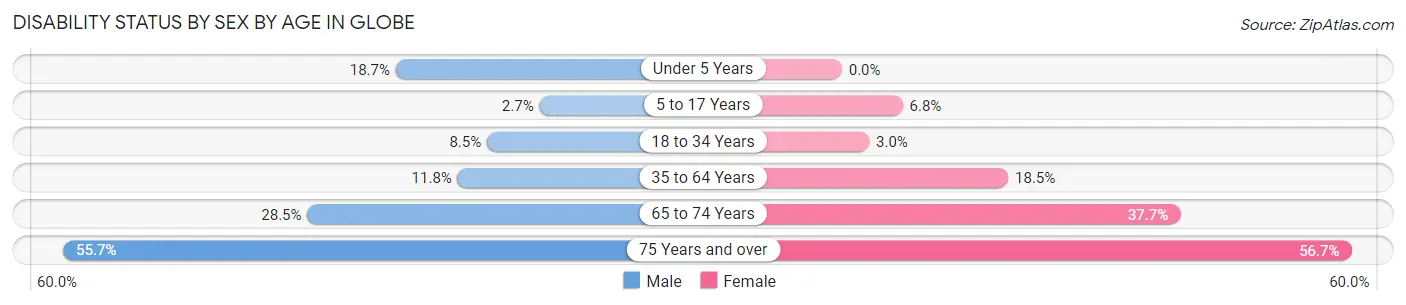
| Age Bracket | Male | Female |
| Under 5 Years | 39 (18.7%) | 0 (0.0%) |
| 5 to 17 Years | 13 (2.7%) | 27 (6.8%) |
| 18 to 34 Years | 50 (8.5%) | 17 (3.0%) |
| 35 to 64 Years | 169 (11.8%) | 270 (18.5%) |
| 65 to 74 Years | 132 (28.5%) | 145 (37.7%) |
| 75 Years and over | 127 (55.7%) | 156 (56.7%) |
Disability Class by Sex by Age in Globe
Disability Class: Hearing Difficulty
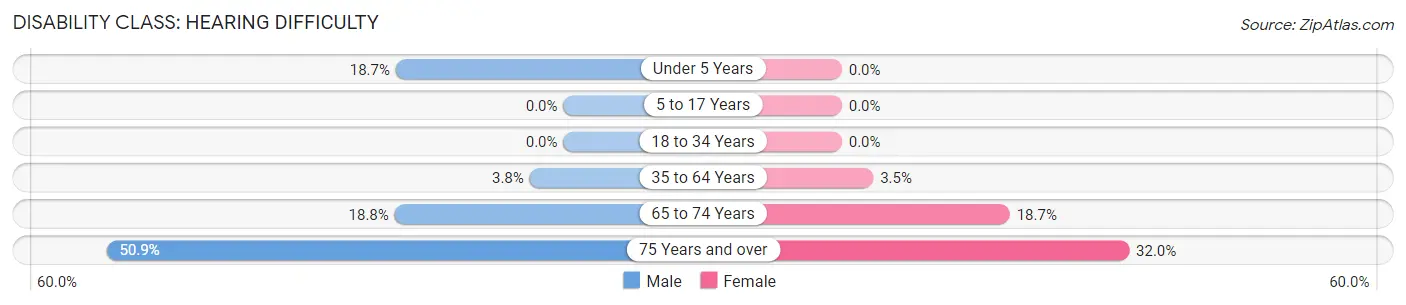
| Age Bracket | Male | Female |
| Under 5 Years | 39 (18.7%) | 0 (0.0%) |
| 5 to 17 Years | 0 (0.0%) | 0 (0.0%) |
| 18 to 34 Years | 0 (0.0%) | 0 (0.0%) |
| 35 to 64 Years | 54 (3.8%) | 51 (3.5%) |
| 65 to 74 Years | 87 (18.8%) | 72 (18.7%) |
| 75 Years and over | 116 (50.9%) | 88 (32.0%) |
Disability Class: Vision Difficulty
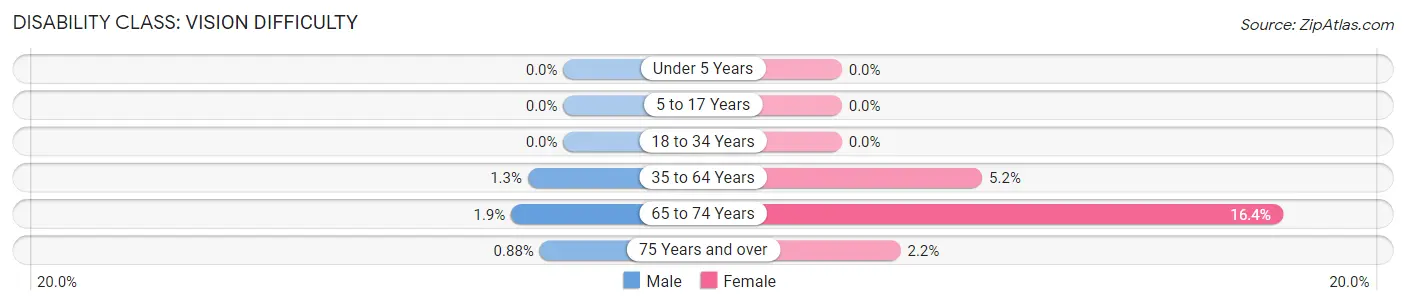
| Age Bracket | Male | Female |
| Under 5 Years | 0 (0.0%) | 0 (0.0%) |
| 5 to 17 Years | 0 (0.0%) | 0 (0.0%) |
| 18 to 34 Years | 0 (0.0%) | 0 (0.0%) |
| 35 to 64 Years | 19 (1.3%) | 76 (5.2%) |
| 65 to 74 Years | 9 (1.9%) | 63 (16.4%) |
| 75 Years and over | 2 (0.9%) | 6 (2.2%) |
Disability Class: Cognitive Difficulty
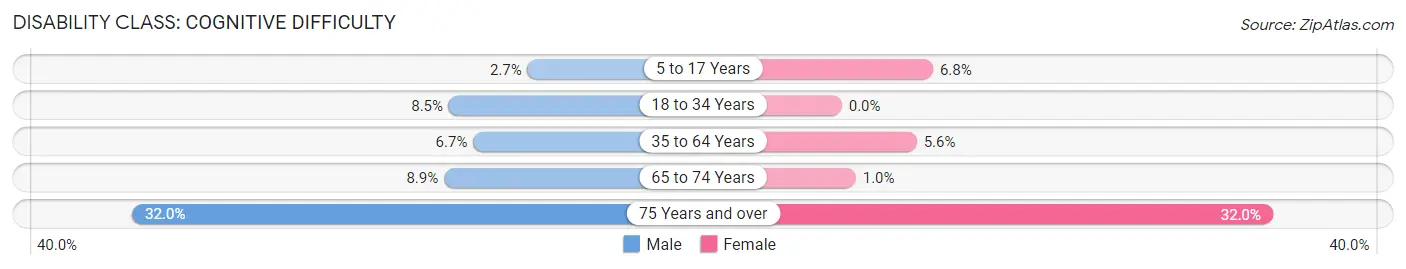
| Age Bracket | Male | Female |
| 5 to 17 Years | 13 (2.7%) | 27 (6.8%) |
| 18 to 34 Years | 50 (8.5%) | 0 (0.0%) |
| 35 to 64 Years | 96 (6.7%) | 81 (5.6%) |
| 65 to 74 Years | 41 (8.9%) | 4 (1.0%) |
| 75 Years and over | 73 (32.0%) | 88 (32.0%) |
Disability Class: Ambulatory Difficulty
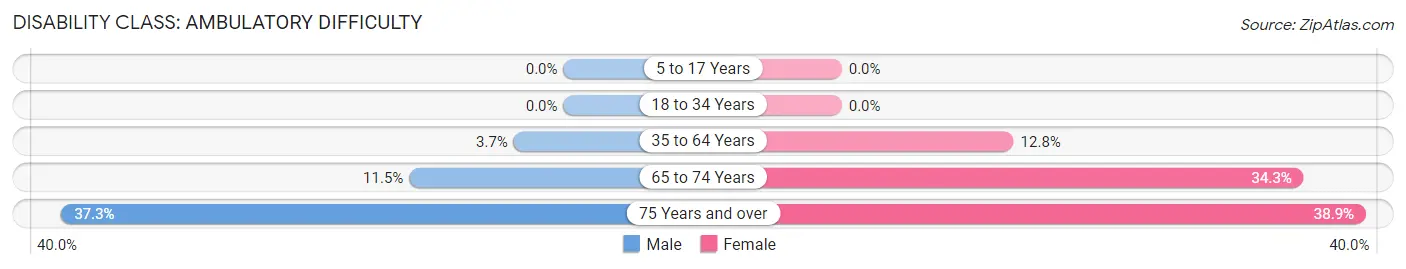
| Age Bracket | Male | Female |
| 5 to 17 Years | 0 (0.0%) | 0 (0.0%) |
| 18 to 34 Years | 0 (0.0%) | 0 (0.0%) |
| 35 to 64 Years | 53 (3.7%) | 186 (12.8%) |
| 65 to 74 Years | 53 (11.5%) | 132 (34.3%) |
| 75 Years and over | 85 (37.3%) | 107 (38.9%) |
Disability Class: Self-Care Difficulty
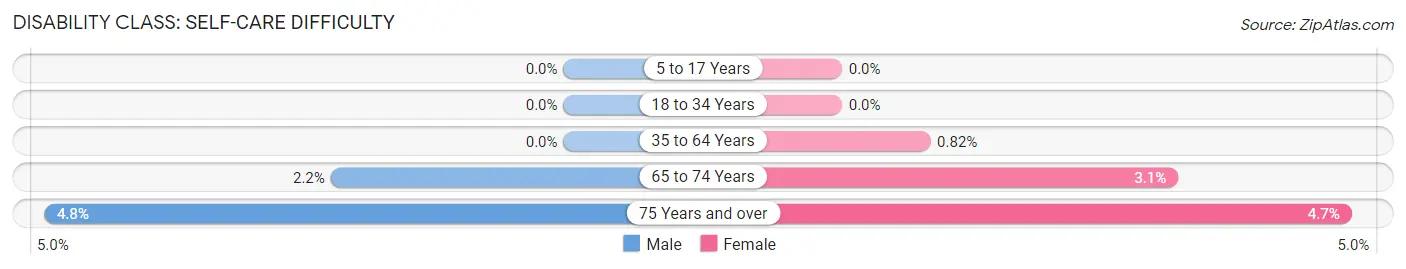
| Age Bracket | Male | Female |
| 5 to 17 Years | 0 (0.0%) | 0 (0.0%) |
| 18 to 34 Years | 0 (0.0%) | 0 (0.0%) |
| 35 to 64 Years | 0 (0.0%) | 12 (0.8%) |
| 65 to 74 Years | 10 (2.2%) | 12 (3.1%) |
| 75 Years and over | 11 (4.8%) | 13 (4.7%) |
Technology Access in Globe
Computing Device Access in Globe
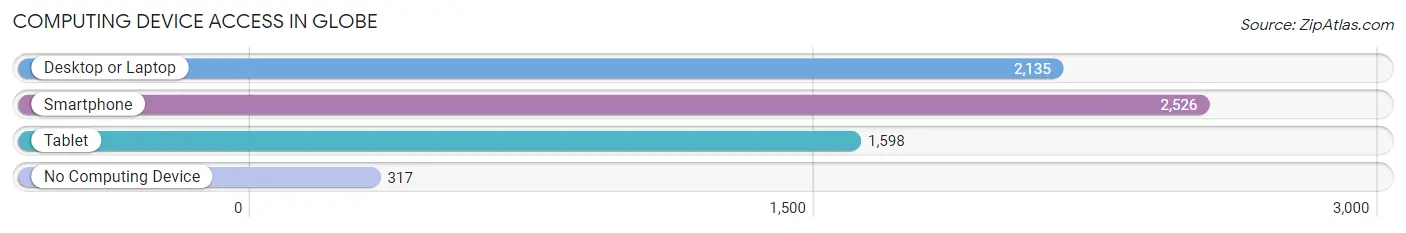
| Device Type | # Households | % Households |
| Desktop or Laptop | 2,135 | 71.1% |
| Smartphone | 2,526 | 84.1% |
| Tablet | 1,598 | 53.2% |
| No Computing Device | 317 | 10.5% |
| Total | 3,004 | 100.0% |
Internet Access in Globe
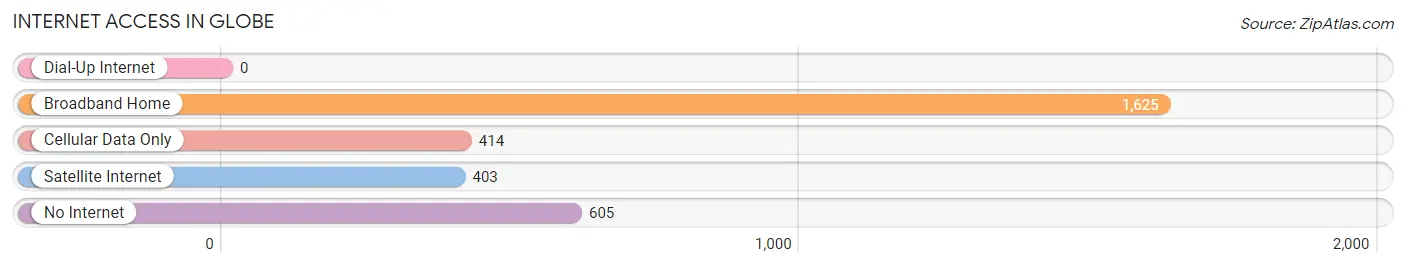
| Internet Type | # Households | % Households |
| Dial-Up Internet | 0 | 0.0% |
| Broadband Home | 1,625 | 54.1% |
| Cellular Data Only | 414 | 13.8% |
| Satellite Internet | 403 | 13.4% |
| No Internet | 605 | 20.1% |
| Total | 3,004 | 100.0% |
Globe Summary
Globe, Arizona is a city located in Gila County in the state of Arizona. It is the county seat of Gila County and is located in the heart of the Tonto National Forest. The city is situated at an elevation of 3,500 feet and is located approximately 85 miles east of Phoenix. As of the 2010 census, the population of Globe was 7,532.
Geography
Globe is located in the Tonto Basin, which is a large valley surrounded by mountains. The city is situated at the junction of US Highway 60 and US Highway 70. The city is located in the foothills of the Pinal Mountains, which are part of the larger Mogollon Rim. The city is located in a semi-arid climate, with hot summers and mild winters. The average annual precipitation is approximately 15 inches.
History
Globe was founded in 1876 by prospectors who were searching for silver and copper. The city was named after a large globe-shaped piece of copper ore that was found in the area. The city quickly grew and by the early 1900s, it was a bustling mining town. The city was incorporated in 1902 and by 1910, the population had grown to over 5,000.
The city experienced a period of decline in the mid-1900s as the mining industry declined. However, the city has experienced a resurgence in recent years due to its proximity to the Tonto National Forest and its growing tourism industry.
Economy
The economy of Globe is largely based on tourism and the mining industry. The city is home to several copper mines, including the Miami Copper Mine, which is the largest copper mine in the United States. The city is also home to several tourist attractions, including the Old Dominion Historic Mine Park, which is a popular destination for visitors.
The city is also home to several manufacturing companies, including Globe Manufacturing, which produces industrial equipment. The city is also home to several retail stores, restaurants, and other businesses.
Demographics
As of the 2010 census, the population of Globe was 7,532. The racial makeup of the city was 73.3% White, 0.7% African American, 1.2% Native American, 0.3% Asian, 0.1% Pacific Islander, 21.2% from other races, and 3.2% from two or more races. Hispanic or Latino of any race were 44.2% of the population.
The median income for a household in the city was $30,938, and the median income for a family was $35,938. The per capita income for the city was $15,938. About 20.2% of families and 24.2% of the population were below the poverty line, including 33.3% of those under age 18 and 11.2% of those age 65 or over.
Conclusion
Globe, Arizona is a city located in Gila County in the state of Arizona. It is the county seat of Gila County and is located in the heart of the Tonto National Forest. The city is situated at an elevation of 3,500 feet and is located approximately 85 miles east of Phoenix. The economy of Globe is largely based on tourism and the mining industry. As of the 2010 census, the population of Globe was 7,532. The racial makeup of the city was 73.3% White, 0.7% African American, 1.2% Native American, 0.3% Asian, 0.1% Pacific Islander, 21.2% from other races, and 3.2% from two or more races. The median income for a household in the city was $30,938, and the median income for a family was $35,938. The per capita income for the city was $15,938.
Common Questions
What is Per Capita Income in Globe?
Per Capita income in Globe is $29,288.
What is the Median Family Income in Globe?
Median Family Income in Globe is $70,893.
What is the Median Household income in Globe?
Median Household Income in Globe is $64,516.
What is Income or Wage Gap in Globe?
Income or Wage Gap in Globe is 36.0%.
Women in Globe earn 64.0 cents for every dollar earned by a man.
What is Inequality or Gini Index in Globe?
Inequality or Gini Index in Globe is 0.42.
What is the Total Population of Globe?
Total Population of Globe is 7,230.
What is the Total Male Population of Globe?
Total Male Population of Globe is 3,875.
What is the Total Female Population of Globe?
Total Female Population of Globe is 3,355.
What is the Ratio of Males per 100 Females in Globe?
There are 115.50 Males per 100 Females in Globe.
What is the Ratio of Females per 100 Males in Globe?
There are 86.58 Females per 100 Males in Globe.
What is the Median Population Age in Globe?
Median Population Age in Globe is 45.2 Years.
What is the Average Family Size in Globe
Average Family Size in Globe is 2.7 People.
What is the Average Household Size in Globe
Average Household Size in Globe is 2.2 People.
How Large is the Labor Force in Globe?
There are 3,235 People in the Labor Forcein in Globe.
What is the Percentage of People in the Labor Force in Globe?
53.0% of People are in the Labor Force in Globe.
What is the Unemployment Rate in Globe?
Unemployment Rate in Globe is 3.2%.