Prescott Valley, AZ Map & Demographics
Prescott Valley Map
Prescott Valley Overview
$33,949
PER CAPITA INCOME
$76,915
AVG FAMILY INCOME
$66,617
AVG HOUSEHOLD INCOME
28.3%
WAGE / INCOME GAP [ % ]
71.7¢/ $1
WAGE / INCOME GAP [ $ ]
$8,565
FAMILY INCOME DEFICIT
0.39
INEQUALITY / GINI INDEX
47,015
TOTAL POPULATION
23,062
MALE POPULATION
23,953
FEMALE POPULATION
96.28
MALES / 100 FEMALES
103.86
FEMALES / 100 MALES
47.7
MEDIAN AGE
2.8
AVG FAMILY SIZE
2.4
AVG HOUSEHOLD SIZE
21,266
LABOR FORCE [ PEOPLE ]
54.3%
PERCENT IN LABOR FORCE
4.2%
UNEMPLOYMENT RATE
Prescott Valley Area Codes
Income in Prescott Valley
Income Overview in Prescott Valley
Per Capita Income in Prescott Valley is $33,949, while median incomes of families and households are $76,915 and $66,617 respectively.
| Characteristic | Number | Measure |
| Per Capita Income | 47,015 | $33,949 |
| Median Family Income | 13,088 | $76,915 |
| Mean Family Income | 13,088 | $89,465 |
| Median Household Income | 19,773 | $66,617 |
| Mean Household Income | 19,773 | $79,846 |
| Income Deficit | 13,088 | $8,565 |
| Wage / Income Gap (%) | 47,015 | 28.29% |
| Wage / Income Gap ($) | 47,015 | 71.71¢ per $1 |
| Gini / Inequality Index | 47,015 | 0.39 |
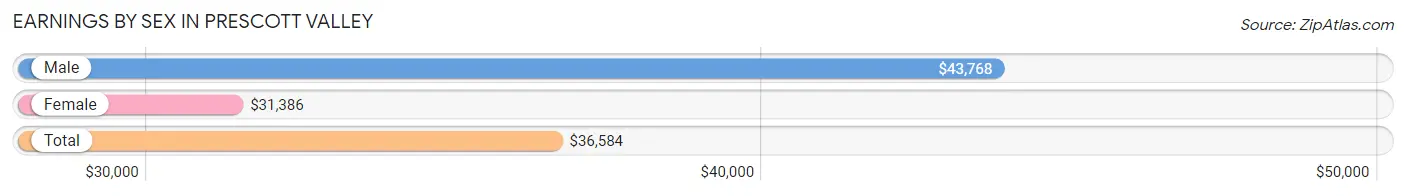
Earnings by Sex in Prescott Valley
Average Earnings in Prescott Valley are $36,584, $43,768 for men and $31,386 for women, a difference of 28.3%.
| Sex | Number | Average Earnings |
| Male | 12,303 (55.2%) | $43,768 |
| Female | 9,997 (44.8%) | $31,386 |
| Total | 22,300 (100.0%) | $36,584 |
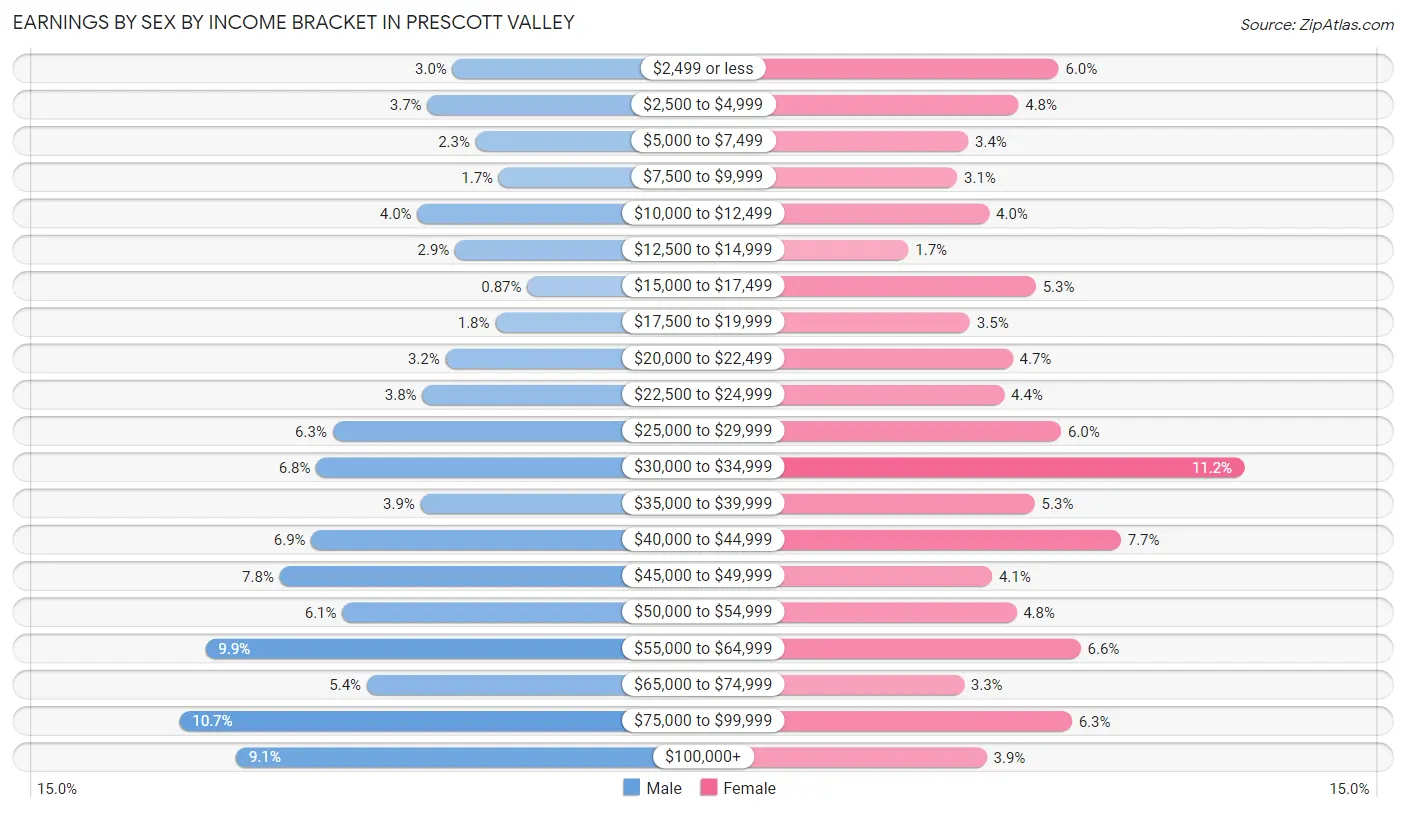
Earnings by Sex by Income Bracket in Prescott Valley
The most common earnings brackets in Prescott Valley are $75,000 to $99,999 for men (1,310 | 10.6%) and $30,000 to $34,999 for women (1,116 | 11.2%).
| Income | Male | Female |
| $2,499 or less | 366 (3.0%) | 595 (5.9%) |
| $2,500 to $4,999 | 453 (3.7%) | 482 (4.8%) |
| $5,000 to $7,499 | 285 (2.3%) | 341 (3.4%) |
| $7,500 to $9,999 | 205 (1.7%) | 310 (3.1%) |
| $10,000 to $12,499 | 487 (4.0%) | 400 (4.0%) |
| $12,500 to $14,999 | 357 (2.9%) | 173 (1.7%) |
| $15,000 to $17,499 | 107 (0.9%) | 531 (5.3%) |
| $17,500 to $19,999 | 218 (1.8%) | 346 (3.5%) |
| $20,000 to $22,499 | 390 (3.2%) | 466 (4.7%) |
| $22,500 to $24,999 | 470 (3.8%) | 442 (4.4%) |
| $25,000 to $29,999 | 780 (6.3%) | 602 (6.0%) |
| $30,000 to $34,999 | 837 (6.8%) | 1,116 (11.2%) |
| $35,000 to $39,999 | 476 (3.9%) | 528 (5.3%) |
| $40,000 to $44,999 | 854 (6.9%) | 770 (7.7%) |
| $45,000 to $49,999 | 963 (7.8%) | 408 (4.1%) |
| $50,000 to $54,999 | 747 (6.1%) | 476 (4.8%) |
| $55,000 to $64,999 | 1,221 (9.9%) | 657 (6.6%) |
| $65,000 to $74,999 | 662 (5.4%) | 329 (3.3%) |
| $75,000 to $99,999 | 1,310 (10.6%) | 632 (6.3%) |
| $100,000+ | 1,115 (9.1%) | 393 (3.9%) |
| Total | 12,303 (100.0%) | 9,997 (100.0%) |
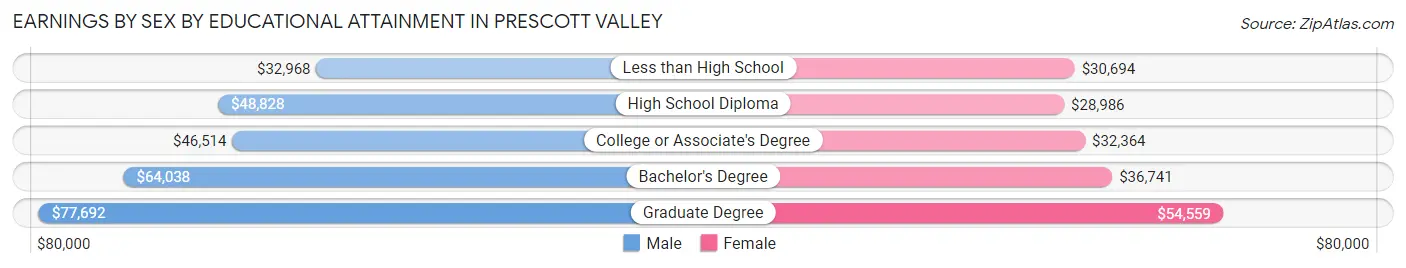
Earnings by Sex by Educational Attainment in Prescott Valley
Average earnings in Prescott Valley are $47,011 for men and $33,940 for women, a difference of 27.8%. Men with an educational attainment of graduate degree enjoy the highest average annual earnings of $77,692, while those with less than high school education earn the least with $32,968. Women with an educational attainment of graduate degree earn the most with the average annual earnings of $54,559, while those with high school diploma education have the smallest earnings of $28,986.
| Educational Attainment | Male Income | Female Income |
| Less than High School | $32,968 | $30,694 |
| High School Diploma | $48,828 | $28,986 |
| College or Associate's Degree | $46,514 | $32,364 |
| Bachelor's Degree | $64,038 | $36,741 |
| Graduate Degree | $77,692 | $54,559 |
| Total | $47,011 | $33,940 |
Family Income in Prescott Valley
Family Income Brackets in Prescott Valley
According to the Prescott Valley family income data, there are 2,539 families falling into the $100,000 to $149,999 income range, which is the most common income bracket and makes up 19.4% of all families. Conversely, the less than $10,000 income bracket is the least frequent group with only 157 families (1.2%) belonging to this category.
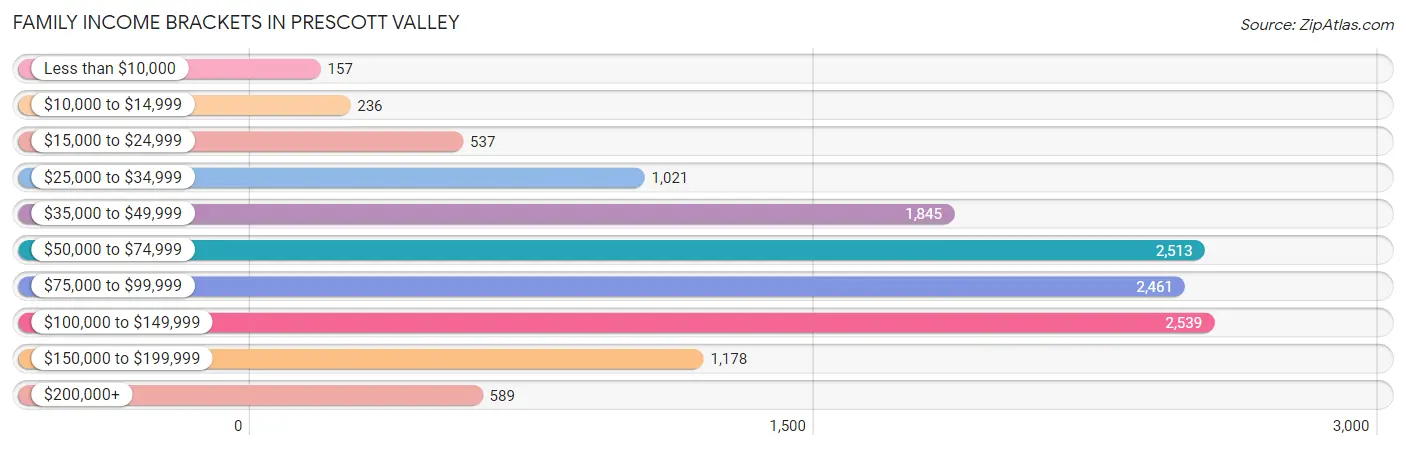
| Income Bracket | # Families | % Families |
| Less than $10,000 | 157 | 1.2% |
| $10,000 to $14,999 | 236 | 1.8% |
| $15,000 to $24,999 | 537 | 4.1% |
| $25,000 to $34,999 | 1,021 | 7.8% |
| $35,000 to $49,999 | 1,845 | 14.1% |
| $50,000 to $74,999 | 2,513 | 19.2% |
| $75,000 to $99,999 | 2,461 | 18.8% |
| $100,000 to $149,999 | 2,539 | 19.4% |
| $150,000 to $199,999 | 1,178 | 9.0% |
| $200,000+ | 589 | 4.5% |
Family Income by Famaliy Size in Prescott Valley
5-person families (869 | 6.6%) account for the highest median family income in Prescott Valley with $98,933 per family, while 2-person families (7,702 | 58.9%) have the highest median income of $37,460 per family member.
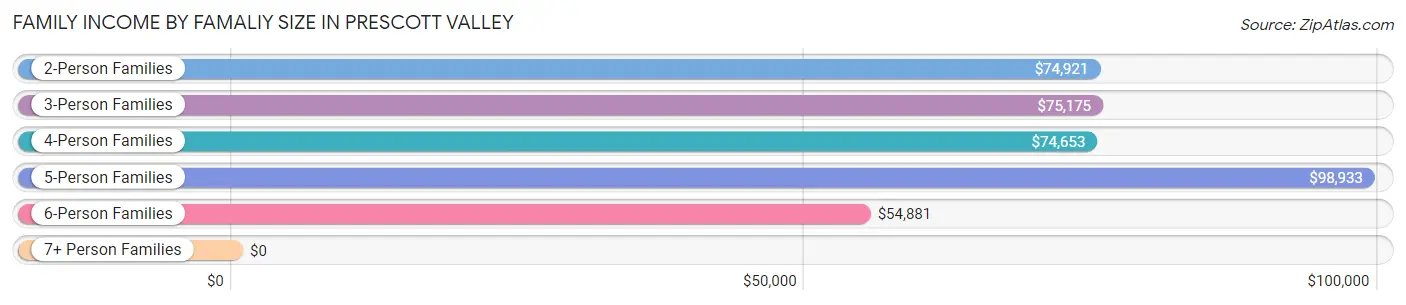
| Income Bracket | # Families | Median Income |
| 2-Person Families | 7,702 (58.9%) | $74,921 |
| 3-Person Families | 2,353 (18.0%) | $75,175 |
| 4-Person Families | 1,828 (14.0%) | $74,653 |
| 5-Person Families | 869 (6.6%) | $98,933 |
| 6-Person Families | 264 (2.0%) | $54,881 |
| 7+ Person Families | 72 (0.5%) | $0 |
| Total | 13,088 (100.0%) | $76,915 |
Family Income by Number of Earners in Prescott Valley
The median family income in Prescott Valley is $76,915, with families comprising 3+ earners (893) having the highest median family income of $147,596, while families with no earners (3,143) have the lowest median family income of $60,221, accounting for 6.8% and 24.0% of families, respectively.
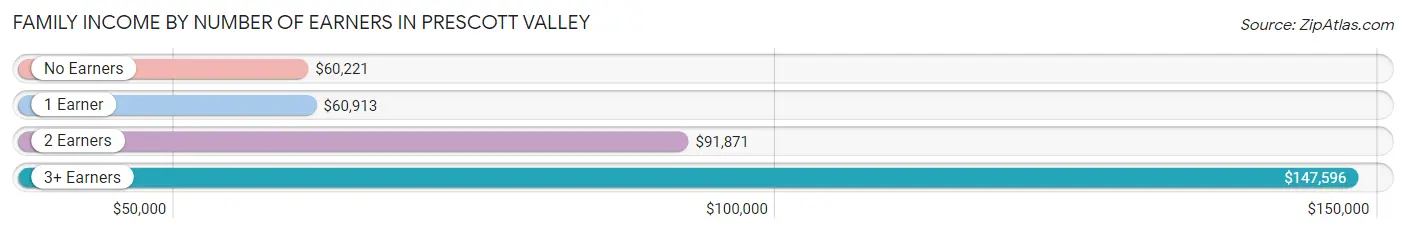
| Number of Earners | # Families | Median Income |
| No Earners | 3,143 (24.0%) | $60,221 |
| 1 Earner | 4,726 (36.1%) | $60,913 |
| 2 Earners | 4,326 (33.1%) | $91,871 |
| 3+ Earners | 893 (6.8%) | $147,596 |
| Total | 13,088 (100.0%) | $76,915 |
Household Income in Prescott Valley
Household Income Brackets in Prescott Valley
With 3,856 households falling in the category, the $50,000 to $74,999 income range is the most frequent in Prescott Valley, accounting for 19.5% of all households. In contrast, only 593 households (3.0%) fall into the less than $10,000 income bracket, making it the least populous group.
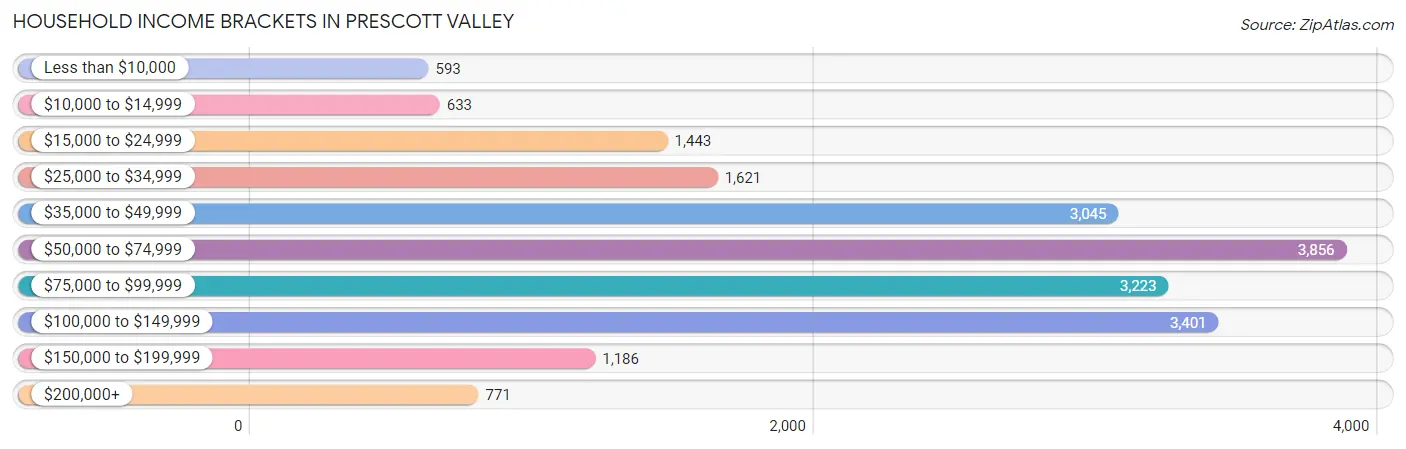
| Income Bracket | # Households | % Households |
| Less than $10,000 | 593 | 3.0% |
| $10,000 to $14,999 | 633 | 3.2% |
| $15,000 to $24,999 | 1,443 | 7.3% |
| $25,000 to $34,999 | 1,621 | 8.2% |
| $35,000 to $49,999 | 3,045 | 15.4% |
| $50,000 to $74,999 | 3,856 | 19.5% |
| $75,000 to $99,999 | 3,223 | 16.3% |
| $100,000 to $149,999 | 3,401 | 17.2% |
| $150,000 to $199,999 | 1,186 | 6.0% |
| $200,000+ | 771 | 3.9% |
Household Income by Householder Age in Prescott Valley
The median household income in Prescott Valley is $66,617, with the highest median household income of $82,266 found in the 25 to 44 years age bracket for the primary householder. A total of 4,639 households (23.5%) fall into this category. Meanwhile, the 15 to 24 years age bracket for the primary householder has the lowest median household income of $41,165, with 610 households (3.1%) in this group.
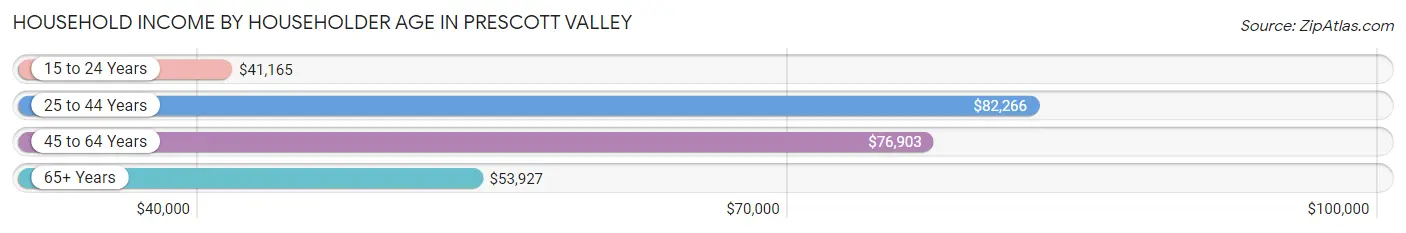
| Income Bracket | # Households | Median Income |
| 15 to 24 Years | 610 (3.1%) | $41,165 |
| 25 to 44 Years | 4,639 (23.5%) | $82,266 |
| 45 to 64 Years | 6,036 (30.5%) | $76,903 |
| 65+ Years | 8,488 (42.9%) | $53,927 |
| Total | 19,773 (100.0%) | $66,617 |
Poverty in Prescott Valley
Income Below Poverty by Sex and Age in Prescott Valley
With 11.7% poverty level for males and 11.9% for females among the residents of Prescott Valley, 5 year old males and 18 to 24 year old females are the most vulnerable to poverty, with 212 males (53.4%) and 416 females (30.7%) in their respective age groups living below the poverty level.
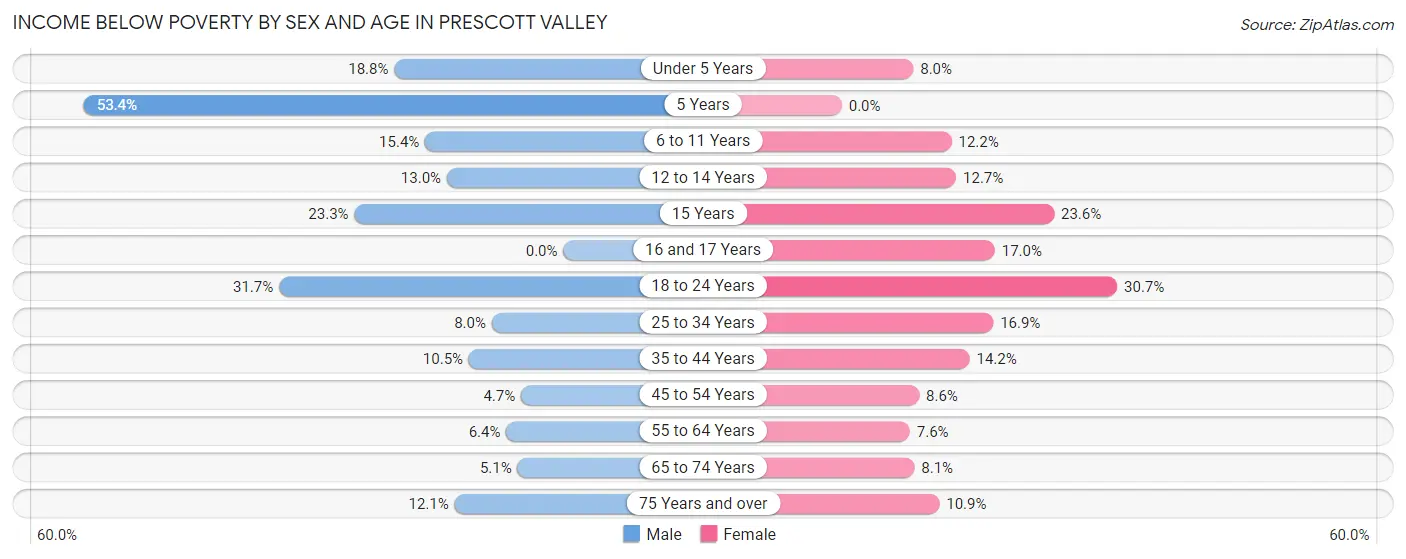
| Age Bracket | Male | Female |
| Under 5 Years | 129 (18.8%) | 102 (8.0%) |
| 5 Years | 212 (53.4%) | 0 (0.0%) |
| 6 to 11 Years | 244 (15.4%) | 194 (12.2%) |
| 12 to 14 Years | 76 (13.0%) | 104 (12.7%) |
| 15 Years | 74 (23.3%) | 26 (23.6%) |
| 16 and 17 Years | 0 (0.0%) | 115 (17.0%) |
| 18 to 24 Years | 648 (31.7%) | 416 (30.7%) |
| 25 to 34 Years | 215 (8.0%) | 415 (16.9%) |
| 35 to 44 Years | 267 (10.5%) | 318 (14.2%) |
| 45 to 54 Years | 132 (4.7%) | 231 (8.6%) |
| 55 to 64 Years | 174 (6.4%) | 233 (7.6%) |
| 65 to 74 Years | 168 (5.1%) | 336 (8.1%) |
| 75 Years and over | 332 (12.1%) | 338 (10.9%) |
| Total | 2,671 (11.7%) | 2,828 (11.9%) |
Income Above Poverty by Sex and Age in Prescott Valley
According to the poverty statistics in Prescott Valley, males aged 16 and 17 years and females aged 5 years are the age groups that are most secure financially, with 100.0% of males and 100.0% of females in these age groups living above the poverty line.
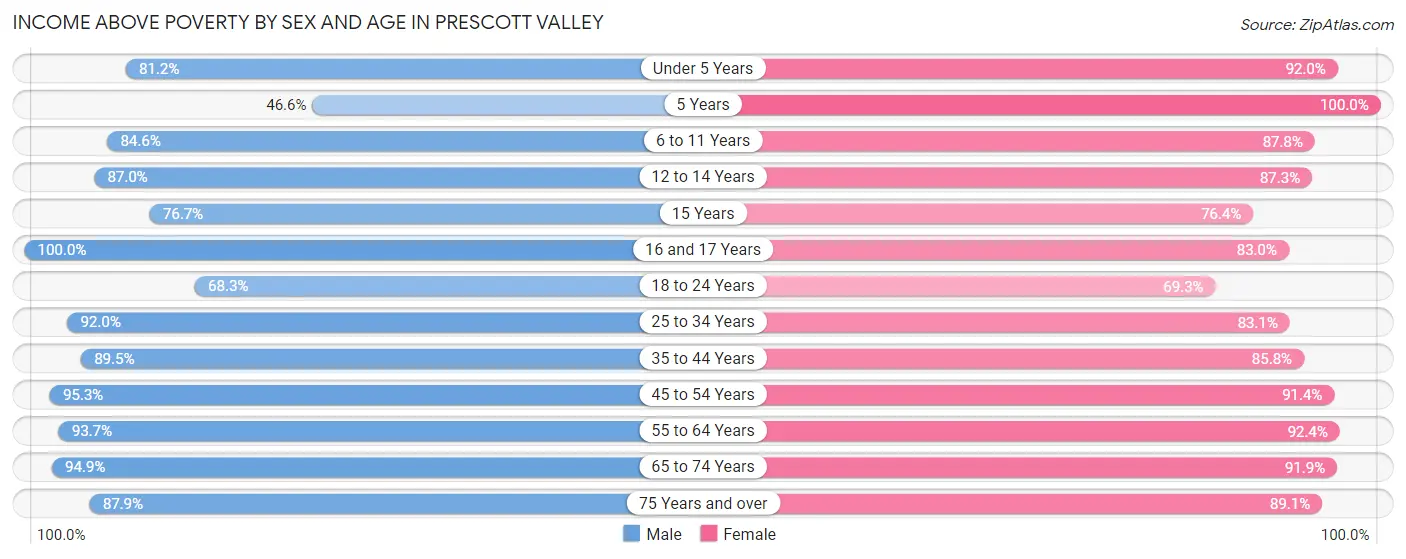
| Age Bracket | Male | Female |
| Under 5 Years | 556 (81.2%) | 1,179 (92.0%) |
| 5 Years | 185 (46.6%) | 245 (100.0%) |
| 6 to 11 Years | 1,341 (84.6%) | 1,394 (87.8%) |
| 12 to 14 Years | 510 (87.0%) | 713 (87.3%) |
| 15 Years | 244 (76.7%) | 84 (76.4%) |
| 16 and 17 Years | 390 (100.0%) | 560 (83.0%) |
| 18 to 24 Years | 1,399 (68.3%) | 941 (69.3%) |
| 25 to 34 Years | 2,484 (92.0%) | 2,047 (83.1%) |
| 35 to 44 Years | 2,270 (89.5%) | 1,917 (85.8%) |
| 45 to 54 Years | 2,669 (95.3%) | 2,453 (91.4%) |
| 55 to 64 Years | 2,566 (93.6%) | 2,839 (92.4%) |
| 65 to 74 Years | 3,128 (94.9%) | 3,823 (91.9%) |
| 75 Years and over | 2,409 (87.9%) | 2,774 (89.1%) |
| Total | 20,151 (88.3%) | 20,969 (88.1%) |
Income Below Poverty Among Married-Couple Families in Prescott Valley
The poverty statistics for married-couple families in Prescott Valley show that 5.7% or 570 of the total 10,086 families live below the poverty line. Families with 3 or 4 children have the highest poverty rate of 32.5%, comprising of 189 families. On the other hand, families with 5 or more children have the lowest poverty rate of 0.0%, which includes 0 families.
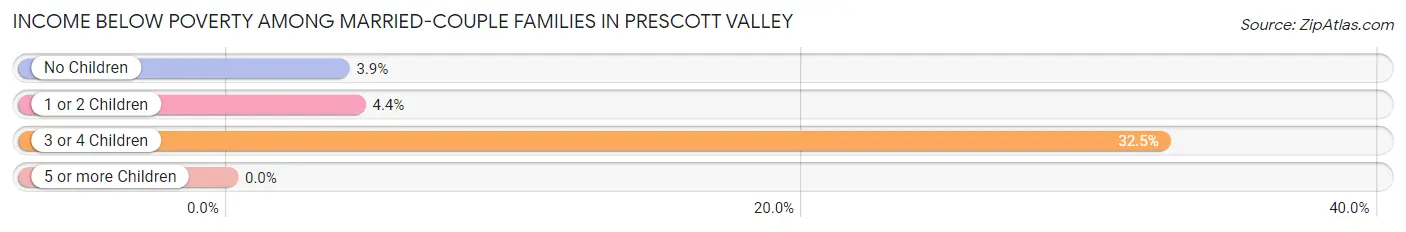
| Children | Above Poverty | Below Poverty |
| No Children | 6,818 (96.1%) | 275 (3.9%) |
| 1 or 2 Children | 2,279 (95.6%) | 106 (4.4%) |
| 3 or 4 Children | 393 (67.5%) | 189 (32.5%) |
| 5 or more Children | 26 (100.0%) | 0 (0.0%) |
| Total | 9,516 (94.4%) | 570 (5.7%) |
Income Below Poverty Among Single-Parent Households in Prescott Valley
According to the poverty data in Prescott Valley, 4.2% or 51 single-father households and 16.7% or 299 single-mother households are living below the poverty line. Among single-father households, those with 1 or 2 children have the highest poverty rate, with 51 households (6.2%) experiencing poverty. Likewise, among single-mother households, those with 5 or more children have the highest poverty rate, with 12 households (100.0%) falling below the poverty line.
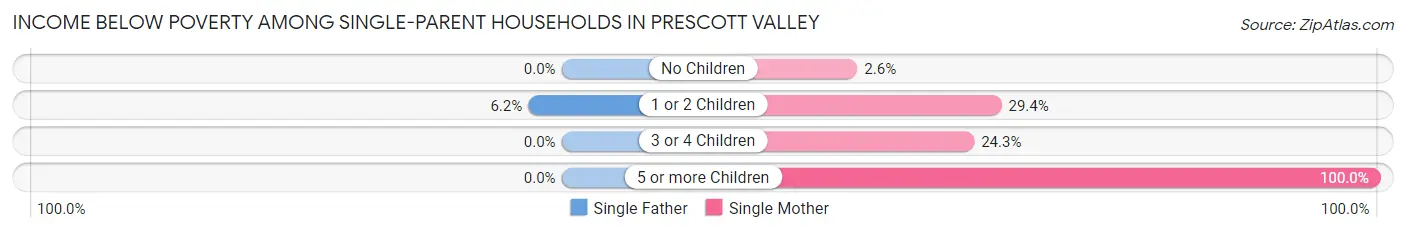
| Children | Single Father | Single Mother |
| No Children | 0 (0.0%) | 22 (2.6%) |
| 1 or 2 Children | 51 (6.2%) | 247 (29.4%) |
| 3 or 4 Children | 0 (0.0%) | 18 (24.3%) |
| 5 or more Children | 0 (0.0%) | 12 (100.0%) |
| Total | 51 (4.2%) | 299 (16.7%) |
Income Below Poverty Among Married-Couple vs Single-Parent Households in Prescott Valley
The poverty data for Prescott Valley shows that 570 of the married-couple family households (5.7%) and 350 of the single-parent households (11.7%) are living below the poverty level. Within the married-couple family households, those with 3 or 4 children have the highest poverty rate, with 189 households (32.5%) falling below the poverty line. Among the single-parent households, those with 5 or more children have the highest poverty rate, with 12 household (100.0%) living below poverty.
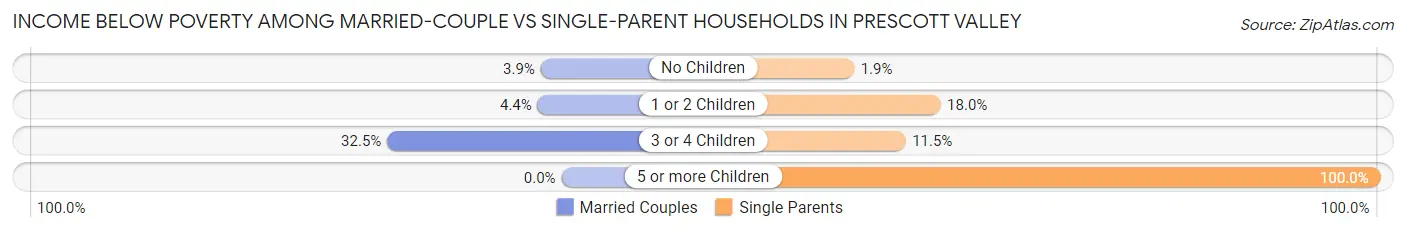
| Children | Married-Couple Families | Single-Parent Households |
| No Children | 275 (3.9%) | 22 (1.9%) |
| 1 or 2 Children | 106 (4.4%) | 298 (18.0%) |
| 3 or 4 Children | 189 (32.5%) | 18 (11.5%) |
| 5 or more Children | 0 (0.0%) | 12 (100.0%) |
| Total | 570 (5.7%) | 350 (11.7%) |
Race in Prescott Valley
The most populous races in Prescott Valley are White / Caucasian (38,544 | 82.0%), Hispanic or Latino (9,426 | 20.1%), and Two or more Races (5,430 | 11.6%).
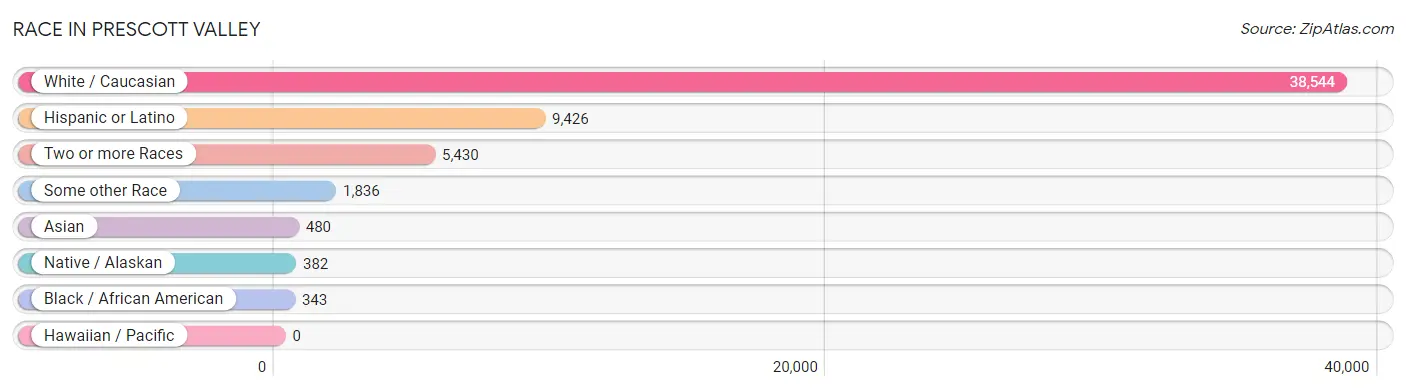
| Race | # Population | % Population |
| Asian | 480 | 1.0% |
| Black / African American | 343 | 0.7% |
| Hawaiian / Pacific | 0 | 0.0% |
| Hispanic or Latino | 9,426 | 20.1% |
| Native / Alaskan | 382 | 0.8% |
| White / Caucasian | 38,544 | 82.0% |
| Two or more Races | 5,430 | 11.6% |
| Some other Race | 1,836 | 3.9% |
| Total | 47,015 | 100.0% |
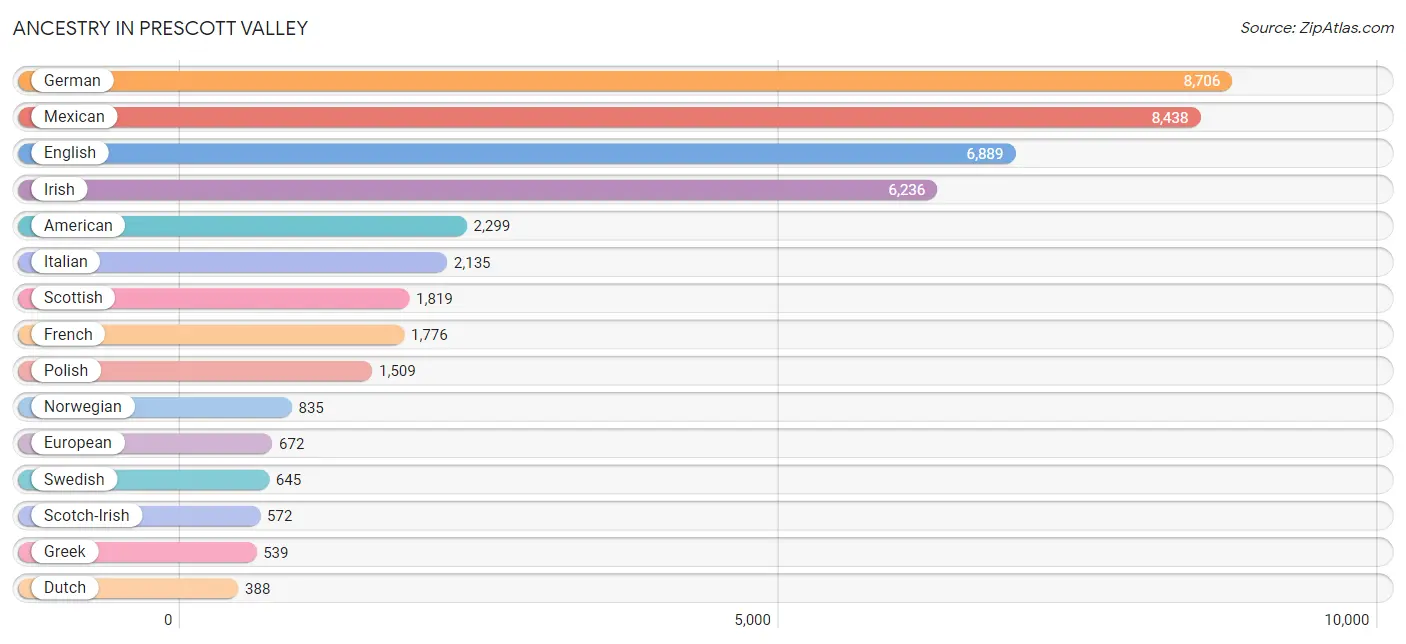
Ancestry in Prescott Valley
The most populous ancestries reported in Prescott Valley are German (8,706 | 18.5%), Mexican (8,438 | 17.9%), English (6,889 | 14.6%), Irish (6,236 | 13.3%), and American (2,299 | 4.9%), together accounting for 69.3% of all Prescott Valley residents.
| Ancestry | # Population | % Population |
| American | 2,299 | 4.9% |
| Apache | 37 | 0.1% |
| Arab | 139 | 0.3% |
| Armenian | 86 | 0.2% |
| Australian | 16 | 0.0% |
| Austrian | 61 | 0.1% |
| Basque | 1 | 0.0% |
| Bhutanese | 54 | 0.1% |
| Blackfeet | 34 | 0.1% |
| Brazilian | 43 | 0.1% |
| British | 370 | 0.8% |
| Bulgarian | 29 | 0.1% |
| Burmese | 285 | 0.6% |
| Canadian | 302 | 0.6% |
| Celtic | 16 | 0.0% |
| Central American Indian | 43 | 0.1% |
| Cherokee | 186 | 0.4% |
| Chickasaw | 8 | 0.0% |
| Chippewa | 1 | 0.0% |
| Colombian | 61 | 0.1% |
| Croatian | 9 | 0.0% |
| Cuban | 97 | 0.2% |
| Czech | 136 | 0.3% |
| Czechoslovakian | 16 | 0.0% |
| Danish | 331 | 0.7% |
| Dominican | 43 | 0.1% |
| Dutch | 388 | 0.8% |
| Eastern European | 64 | 0.1% |
| Ecuadorian | 38 | 0.1% |
| English | 6,889 | 14.6% |
| European | 672 | 1.4% |
| Filipino | 38 | 0.1% |
| Finnish | 269 | 0.6% |
| French | 1,776 | 3.8% |
| French Canadian | 386 | 0.8% |
| German | 8,706 | 18.5% |
| Greek | 539 | 1.1% |
| Guamanian / Chamorro | 9 | 0.0% |
| Hungarian | 233 | 0.5% |
| Indian (Asian) | 128 | 0.3% |
| Iranian | 74 | 0.2% |
| Irish | 6,236 | 13.3% |
| Italian | 2,135 | 4.5% |
| Jamaican | 28 | 0.1% |
| Korean | 214 | 0.5% |
| Laotian | 30 | 0.1% |
| Lebanese | 71 | 0.2% |
| Lithuanian | 90 | 0.2% |
| Luxembourger | 23 | 0.1% |
| Mexican | 8,438 | 17.9% |
| Mexican American Indian | 78 | 0.2% |
| Native Hawaiian | 91 | 0.2% |
| Navajo | 232 | 0.5% |
| Northern European | 67 | 0.1% |
| Norwegian | 835 | 1.8% |
| Paiute | 13 | 0.0% |
| Palestinian | 23 | 0.1% |
| Peruvian | 98 | 0.2% |
| Polish | 1,509 | 3.2% |
| Portuguese | 347 | 0.7% |
| Puerto Rican | 67 | 0.1% |
| Puget Sound Salish | 14 | 0.0% |
| Romanian | 90 | 0.2% |
| Russian | 278 | 0.6% |
| Scandinavian | 213 | 0.4% |
| Scotch-Irish | 572 | 1.2% |
| Scottish | 1,819 | 3.9% |
| Serbian | 61 | 0.1% |
| Slovak | 49 | 0.1% |
| Slovene | 15 | 0.0% |
| South American | 201 | 0.4% |
| Spaniard | 49 | 0.1% |
| Spanish | 287 | 0.6% |
| Sri Lankan | 121 | 0.3% |
| Swedish | 645 | 1.4% |
| Swiss | 182 | 0.4% |
| Syrian | 45 | 0.1% |
| Tohono O'Odham | 1 | 0.0% |
| Turkish | 10 | 0.0% |
| Ukrainian | 24 | 0.1% |
| Venezuelan | 4 | 0.0% |
| Welsh | 355 | 0.8% |
| Yakama | 14 | 0.0% |
| Yaqui | 63 | 0.1% |
| Yuman | 22 | 0.1% | View All 85 Rows |
Immigrants in Prescott Valley
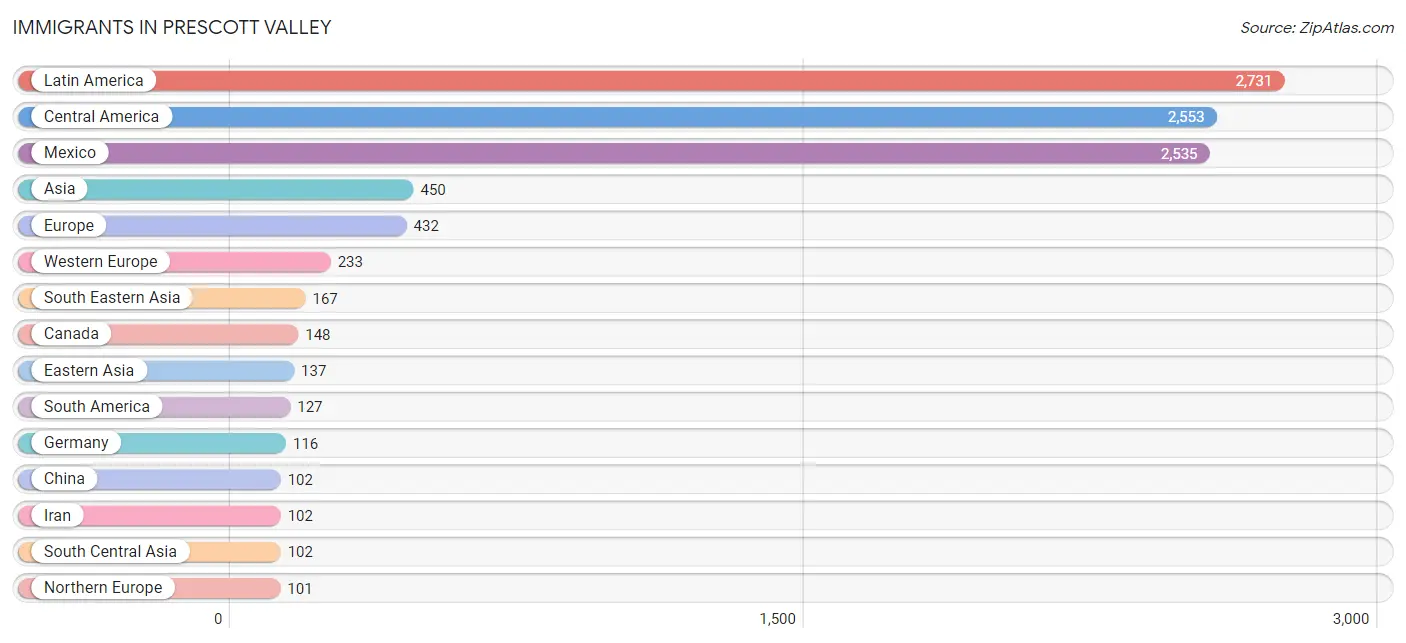
The most numerous immigrant groups reported in Prescott Valley came from Latin America (2,731 | 5.8%), Central America (2,553 | 5.4%), Mexico (2,535 | 5.4%), Asia (450 | 1.0%), and Europe (432 | 0.9%), together accounting for 18.5% of all Prescott Valley residents.
| Immigration Origin | # Population | % Population |
| Africa | 12 | 0.0% |
| Asia | 450 | 1.0% |
| Austria | 45 | 0.1% |
| Brazil | 15 | 0.0% |
| Canada | 148 | 0.3% |
| Caribbean | 51 | 0.1% |
| Central America | 2,553 | 5.4% |
| China | 102 | 0.2% |
| Colombia | 36 | 0.1% |
| Cuba | 23 | 0.1% |
| Eastern Asia | 137 | 0.3% |
| Eastern Europe | 76 | 0.2% |
| Ecuador | 18 | 0.0% |
| England | 49 | 0.1% |
| Europe | 432 | 0.9% |
| France | 53 | 0.1% |
| Germany | 116 | 0.3% |
| Guatemala | 18 | 0.0% |
| Indonesia | 30 | 0.1% |
| Iran | 102 | 0.2% |
| Iraq | 18 | 0.0% |
| Jamaica | 28 | 0.1% |
| Japan | 8 | 0.0% |
| Korea | 27 | 0.1% |
| Latin America | 2,731 | 5.8% |
| Lebanon | 16 | 0.0% |
| Mexico | 2,535 | 5.4% |
| Netherlands | 11 | 0.0% |
| Northern Europe | 101 | 0.2% |
| Oceania | 19 | 0.0% |
| Philippines | 57 | 0.1% |
| Poland | 76 | 0.2% |
| Scotland | 35 | 0.1% |
| South Africa | 12 | 0.0% |
| South America | 127 | 0.3% |
| South Central Asia | 102 | 0.2% |
| South Eastern Asia | 167 | 0.4% |
| Southern Europe | 22 | 0.1% |
| Spain | 22 | 0.1% |
| Taiwan | 4 | 0.0% |
| Turkey | 10 | 0.0% |
| Venezuela | 58 | 0.1% |
| Vietnam | 80 | 0.2% |
| Western Asia | 44 | 0.1% |
| Western Europe | 233 | 0.5% | View All 45 Rows |
Sex and Age in Prescott Valley
Sex and Age in Prescott Valley
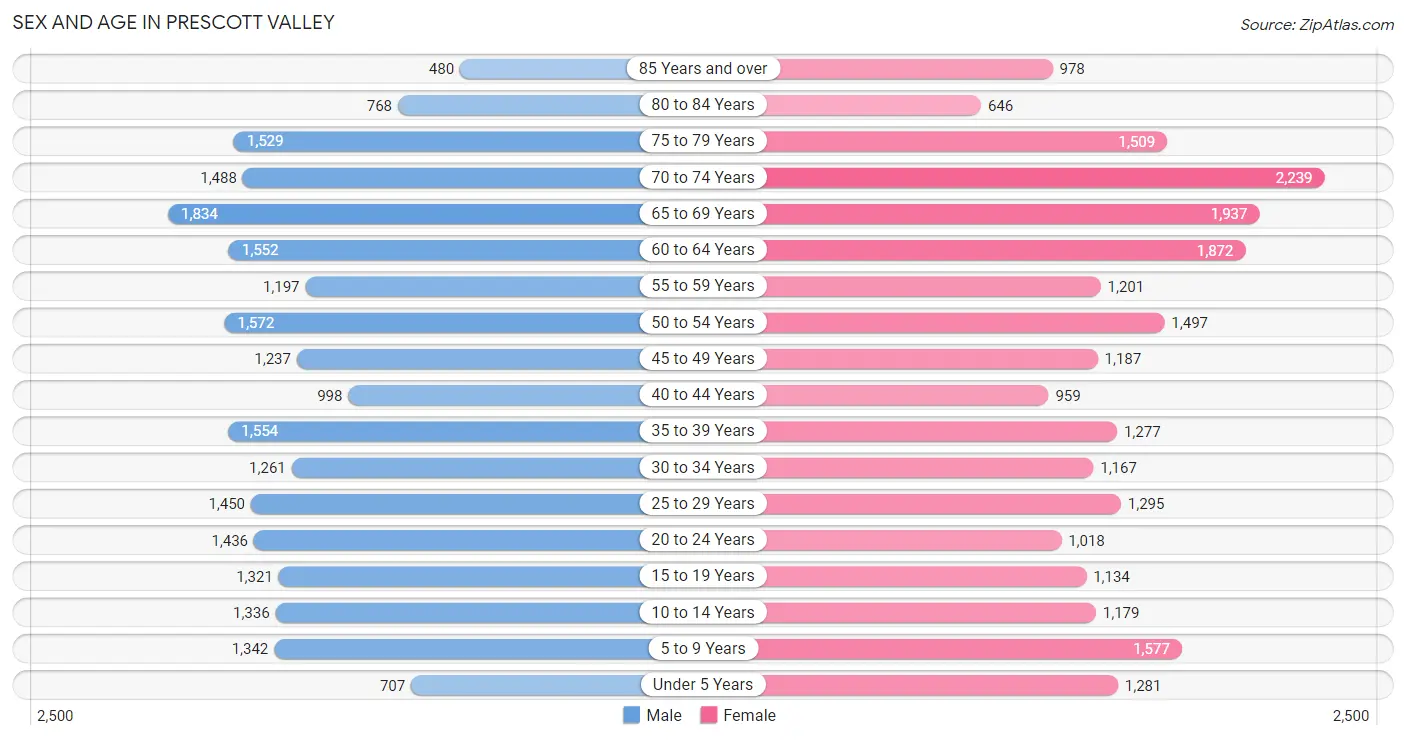
The most populous age groups in Prescott Valley are 65 to 69 Years (1,834 | 8.0%) for men and 70 to 74 Years (2,239 | 9.3%) for women.
| Age Bracket | Male | Female |
| Under 5 Years | 707 (3.1%) | 1,281 (5.3%) |
| 5 to 9 Years | 1,342 (5.8%) | 1,577 (6.6%) |
| 10 to 14 Years | 1,336 (5.8%) | 1,179 (4.9%) |
| 15 to 19 Years | 1,321 (5.7%) | 1,134 (4.7%) |
| 20 to 24 Years | 1,436 (6.2%) | 1,018 (4.3%) |
| 25 to 29 Years | 1,450 (6.3%) | 1,295 (5.4%) |
| 30 to 34 Years | 1,261 (5.5%) | 1,167 (4.9%) |
| 35 to 39 Years | 1,554 (6.7%) | 1,277 (5.3%) |
| 40 to 44 Years | 998 (4.3%) | 959 (4.0%) |
| 45 to 49 Years | 1,237 (5.4%) | 1,187 (5.0%) |
| 50 to 54 Years | 1,572 (6.8%) | 1,497 (6.2%) |
| 55 to 59 Years | 1,197 (5.2%) | 1,201 (5.0%) |
| 60 to 64 Years | 1,552 (6.7%) | 1,872 (7.8%) |
| 65 to 69 Years | 1,834 (8.0%) | 1,937 (8.1%) |
| 70 to 74 Years | 1,488 (6.5%) | 2,239 (9.3%) |
| 75 to 79 Years | 1,529 (6.6%) | 1,509 (6.3%) |
| 80 to 84 Years | 768 (3.3%) | 646 (2.7%) |
| 85 Years and over | 480 (2.1%) | 978 (4.1%) |
| Total | 23,062 (100.0%) | 23,953 (100.0%) |
Families and Households in Prescott Valley
Median Family Size in Prescott Valley
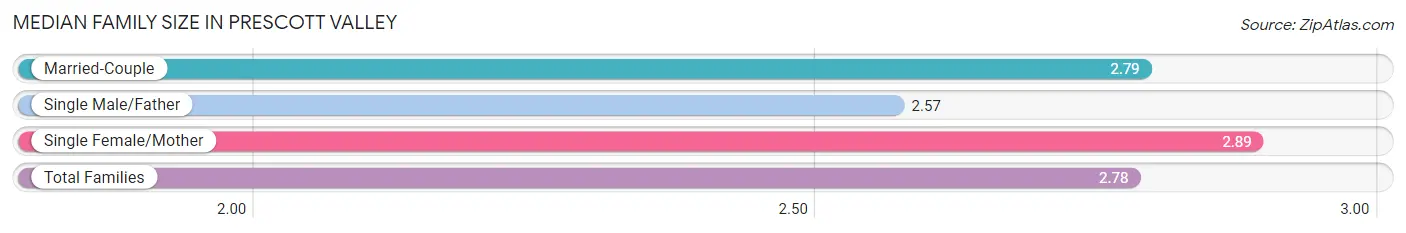
The median family size in Prescott Valley is 2.78 persons per family, with single female/mother families (1,786 | 13.7%) accounting for the largest median family size of 2.89 persons per family. On the other hand, single male/father families (1,216 | 9.3%) represent the smallest median family size with 2.57 persons per family.
| Family Type | # Families | Family Size |
| Married-Couple | 10,086 (77.1%) | 2.79 |
| Single Male/Father | 1,216 (9.3%) | 2.57 |
| Single Female/Mother | 1,786 (13.7%) | 2.89 |
| Total Families | 13,088 (100.0%) | 2.78 |
Median Household Size in Prescott Valley
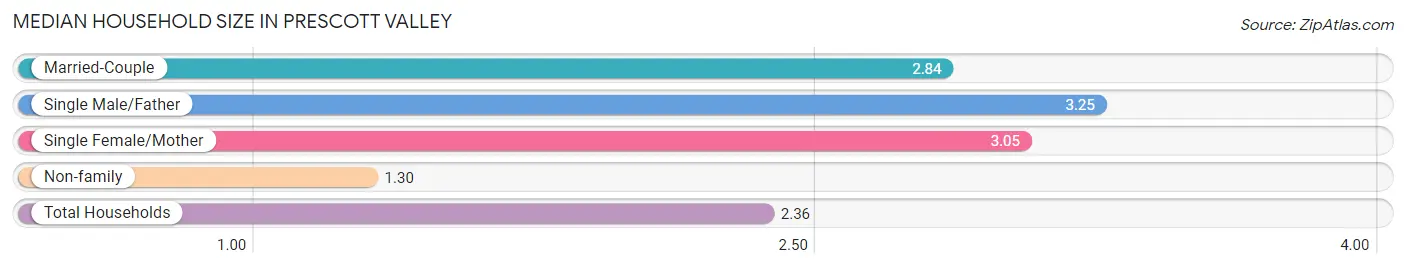
The median household size in Prescott Valley is 2.36 persons per household, with single male/father households (1,216 | 6.1%) accounting for the largest median household size of 3.25 persons per household. non-family households (6,685 | 33.8%) represent the smallest median household size with 1.30 persons per household.
| Household Type | # Households | Household Size |
| Married-Couple | 10,086 (51.0%) | 2.84 |
| Single Male/Father | 1,216 (6.1%) | 3.25 |
| Single Female/Mother | 1,786 (9.0%) | 3.05 |
| Non-family | 6,685 (33.8%) | 1.30 |
| Total Households | 19,773 (100.0%) | 2.36 |
Household Size by Marriage Status in Prescott Valley
Out of a total of 19,773 households in Prescott Valley, 13,088 (66.2%) are family households, while 6,685 (33.8%) are nonfamily households. The most numerous type of family households are 2-person households, comprising 7,255, and the most common type of nonfamily households are 1-person households, comprising 5,151.
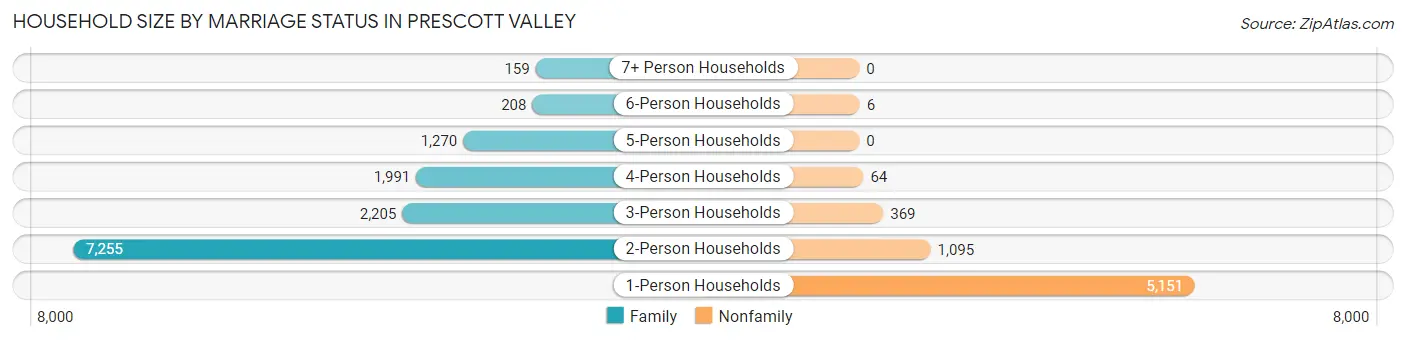
| Household Size | Family Households | Nonfamily Households |
| 1-Person Households | - | 5,151 (26.1%) |
| 2-Person Households | 7,255 (36.7%) | 1,095 (5.5%) |
| 3-Person Households | 2,205 (11.2%) | 369 (1.9%) |
| 4-Person Households | 1,991 (10.1%) | 64 (0.3%) |
| 5-Person Households | 1,270 (6.4%) | 0 (0.0%) |
| 6-Person Households | 208 (1.1%) | 6 (0.0%) |
| 7+ Person Households | 159 (0.8%) | 0 (0.0%) |
| Total | 13,088 (66.2%) | 6,685 (33.8%) |
Female Fertility in Prescott Valley
Fertility by Age in Prescott Valley
Average fertility rate in Prescott Valley is 54.0 births per 1,000 women. Women in the age bracket of 35 to 50 years have the highest fertility rate with 81.0 births per 1,000 women. Women in the age bracket of 35 to 50 years acount for 68.5% of all women with births.
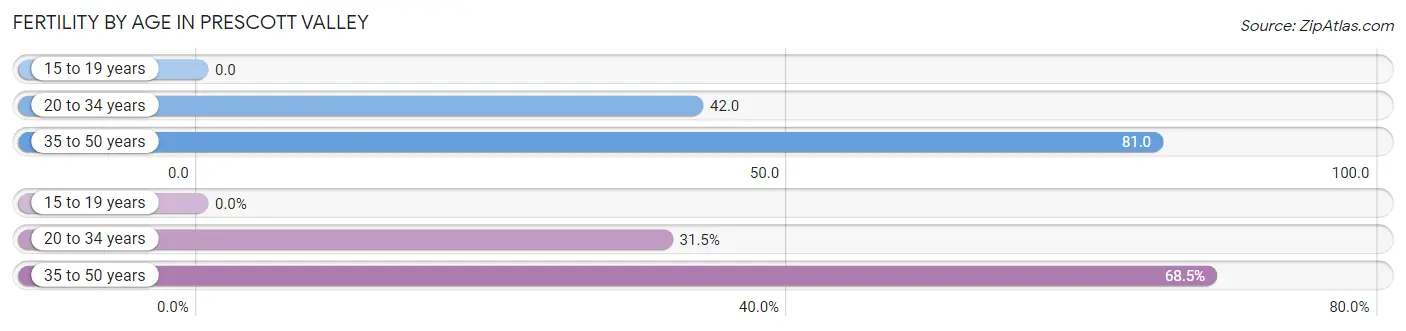
| Age Bracket | Women with Births | Births / 1,000 Women |
| 15 to 19 years | 0 (0.0%) | 0.0 |
| 20 to 34 years | 146 (31.5%) | 42.0 |
| 35 to 50 years | 317 (68.5%) | 81.0 |
| Total | 463 (100.0%) | 54.0 |
Fertility by Age by Marriage Status in Prescott Valley
66.1% of women with births (463) in Prescott Valley are married. The highest percentage of unmarried women with births falls into 35 to 50 years age bracket with 42.3% of them unmarried at the time of birth, while the lowest percentage of unmarried women with births belong to 20 to 34 years age bracket with 15.7% of them unmarried.
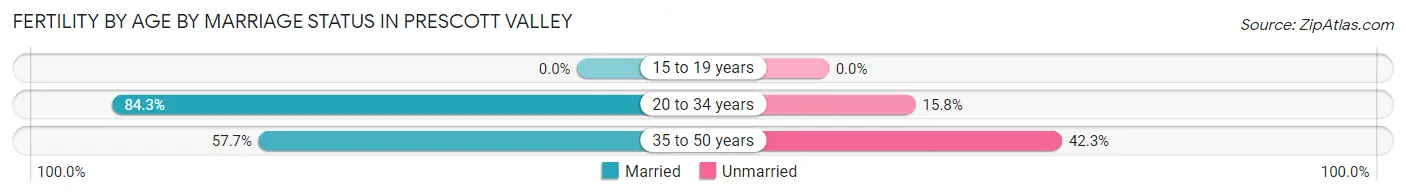
| Age Bracket | Married | Unmarried |
| 15 to 19 years | 0 (0.0%) | 0 (0.0%) |
| 20 to 34 years | 123 (84.3%) | 23 (15.8%) |
| 35 to 50 years | 183 (57.7%) | 134 (42.3%) |
| Total | 306 (66.1%) | 157 (33.9%) |
Fertility by Education in Prescott Valley
Average fertility rate in Prescott Valley is 54.0 births per 1,000 women. Women with the education attainment of college or associate's degree have the highest fertility rate of 83.0 births per 1,000 women, while women with the education attainment of graduate degree have the lowest fertility at 18.0 births per 1,000 women. Women with the education attainment of college or associate's degree represent 62.8% of all women with births.
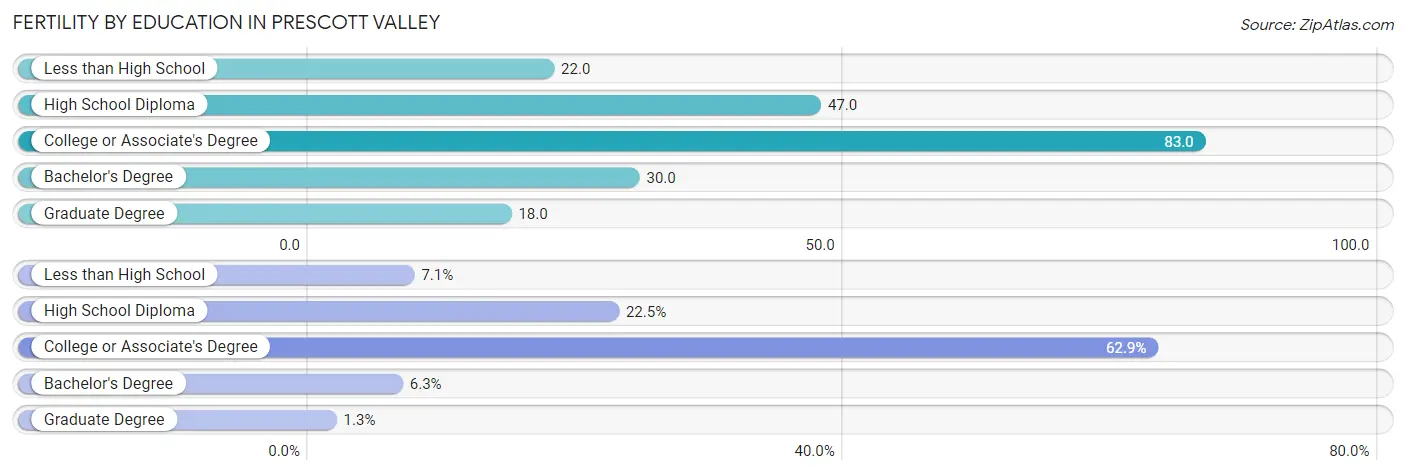
| Educational Attainment | Women with Births | Births / 1,000 Women |
| Less than High School | 33 (7.1%) | 22.0 |
| High School Diploma | 104 (22.5%) | 47.0 |
| College or Associate's Degree | 291 (62.8%) | 83.0 |
| Bachelor's Degree | 29 (6.3%) | 30.0 |
| Graduate Degree | 6 (1.3%) | 18.0 |
| Total | 463 (100.0%) | 54.0 |
Fertility by Education by Marriage Status in Prescott Valley
33.9% of women with births in Prescott Valley are unmarried. Women with the educational attainment of high school diploma are most likely to be married with 100.0% of them married at childbirth, while women with the educational attainment of less than high school are least likely to be married with 69.7% of them unmarried at childbirth.
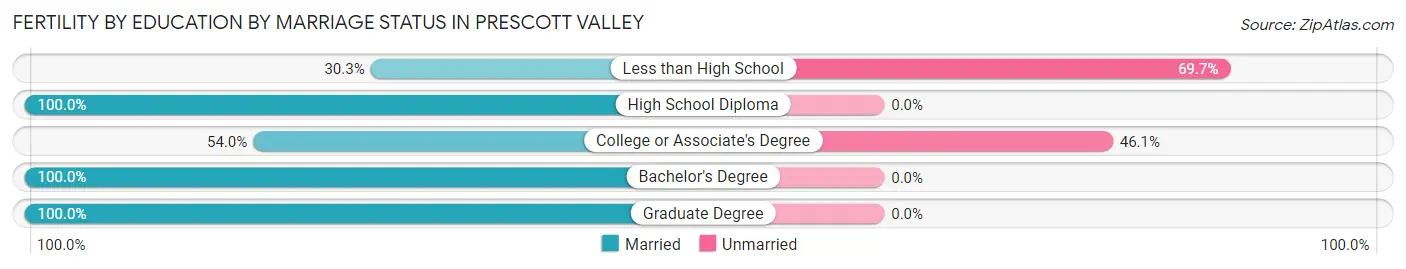
| Educational Attainment | Married | Unmarried |
| Less than High School | 10 (30.3%) | 23 (69.7%) |
| High School Diploma | 104 (100.0%) | 0 (0.0%) |
| College or Associate's Degree | 157 (53.9%) | 134 (46.1%) |
| Bachelor's Degree | 29 (100.0%) | 0 (0.0%) |
| Graduate Degree | 6 (100.0%) | 0 (0.0%) |
| Total | 306 (66.1%) | 157 (33.9%) |
Employment Characteristics in Prescott Valley
Employment by Class of Employer in Prescott Valley
Among the 19,622 employed individuals in Prescott Valley, private company employees (13,124 | 66.9%), self-employed (not incorporated) (1,670 | 8.5%), and not-for-profit organizations (1,655 | 8.4%) make up the most common classes of employment.
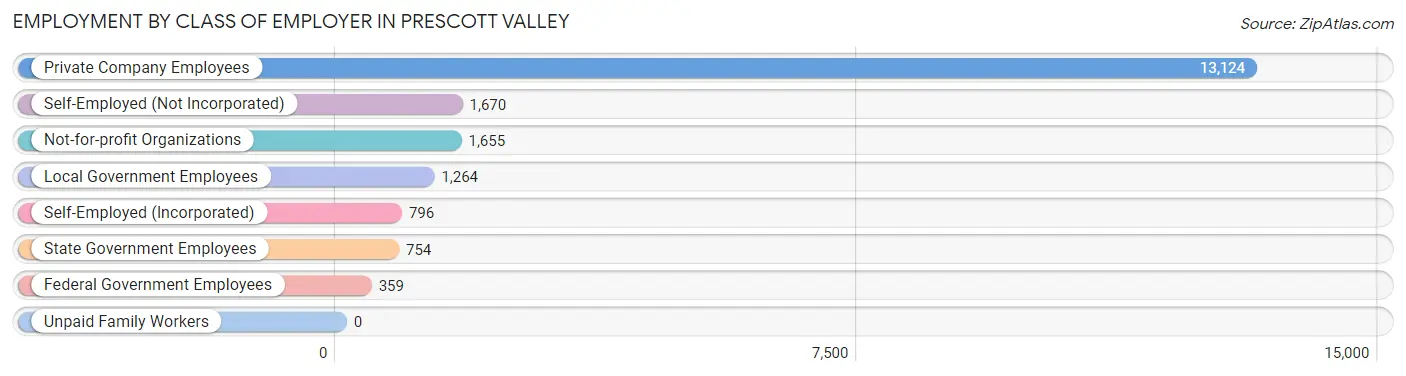
| Employer Class | # Employees | % Employees |
| Private Company Employees | 13,124 | 66.9% |
| Self-Employed (Incorporated) | 796 | 4.1% |
| Self-Employed (Not Incorporated) | 1,670 | 8.5% |
| Not-for-profit Organizations | 1,655 | 8.4% |
| Local Government Employees | 1,264 | 6.4% |
| State Government Employees | 754 | 3.8% |
| Federal Government Employees | 359 | 1.8% |
| Unpaid Family Workers | 0 | 0.0% |
| Total | 19,622 | 100.0% |
Employment Status by Age in Prescott Valley
According to the labor force statistics for Prescott Valley, out of the total population over 16 years of age (39,164), 54.3% or 21,266 individuals are in the labor force, with 4.2% or 893 of them unemployed. The age group with the highest labor force participation rate is 25 to 29 years, with 90.3% or 2,479 individuals in the labor force. Within the labor force, the 25 to 29 years age range has the highest percentage of unemployed individuals, with 9.5% or 236 of them being unemployed.
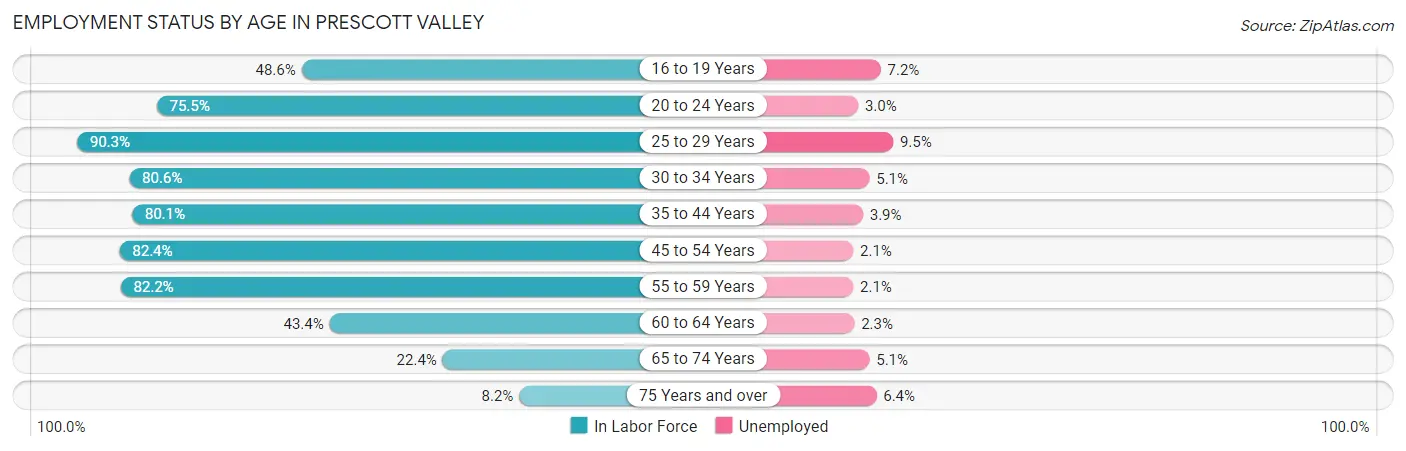
| Age Bracket | In Labor Force | Unemployed |
| 16 to 19 Years | 985 (48.6%) | 71 (7.2%) |
| 20 to 24 Years | 1,853 (75.5%) | 56 (3.0%) |
| 25 to 29 Years | 2,479 (90.3%) | 236 (9.5%) |
| 30 to 34 Years | 1,957 (80.6%) | 100 (5.1%) |
| 35 to 44 Years | 3,835 (80.1%) | 150 (3.9%) |
| 45 to 54 Years | 4,526 (82.4%) | 95 (2.1%) |
| 55 to 59 Years | 1,971 (82.2%) | 41 (2.1%) |
| 60 to 64 Years | 1,486 (43.4%) | 34 (2.3%) |
| 65 to 74 Years | 1,680 (22.4%) | 86 (5.1%) |
| 75 Years and over | 485 (8.2%) | 31 (6.4%) |
| Total | 21,266 (54.3%) | 893 (4.2%) |
Employment Status by Educational Attainment in Prescott Valley
According to labor force statistics for Prescott Valley, 76.4% of individuals (16,255) out of the total population between 25 and 64 years of age (21,276) are in the labor force, with 4.0% or 650 of them being unemployed. The group with the highest labor force participation rate are those with the educational attainment of bachelor's degree or higher, with 79.7% or 3,327 individuals in the labor force. Within the labor force, individuals with high school diploma education have the highest percentage of unemployment, with 6.8% or 337 of them being unemployed.
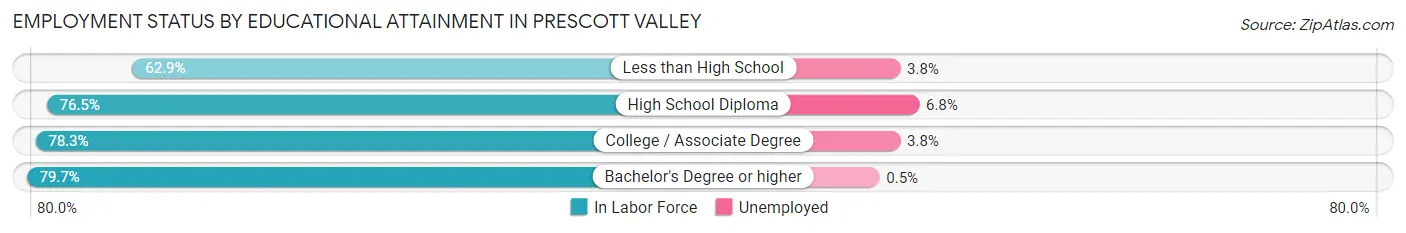
| Educational Attainment | In Labor Force | Unemployed |
| Less than High School | 1,437 (62.9%) | 87 (3.8%) |
| High School Diploma | 4,953 (76.5%) | 440 (6.8%) |
| College / Associate Degree | 6,532 (78.3%) | 317 (3.8%) |
| Bachelor's Degree or higher | 3,327 (79.7%) | 21 (0.5%) |
| Total | 16,255 (76.4%) | 851 (4.0%) |
Employment Occupations by Sex in Prescott Valley
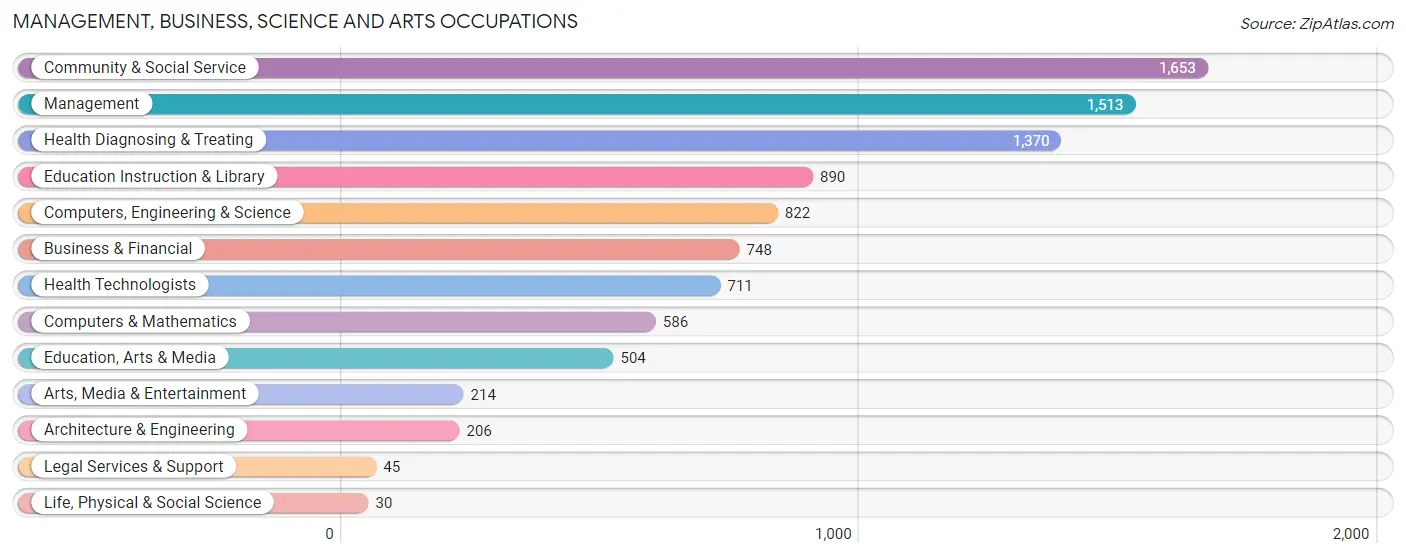
Management, Business, Science and Arts Occupations
The most common Management, Business, Science and Arts occupations in Prescott Valley are Community & Social Service (1,653 | 8.1%), Management (1,513 | 7.4%), Health Diagnosing & Treating (1,370 | 6.7%), Education Instruction & Library (890 | 4.4%), and Computers, Engineering & Science (822 | 4.0%).
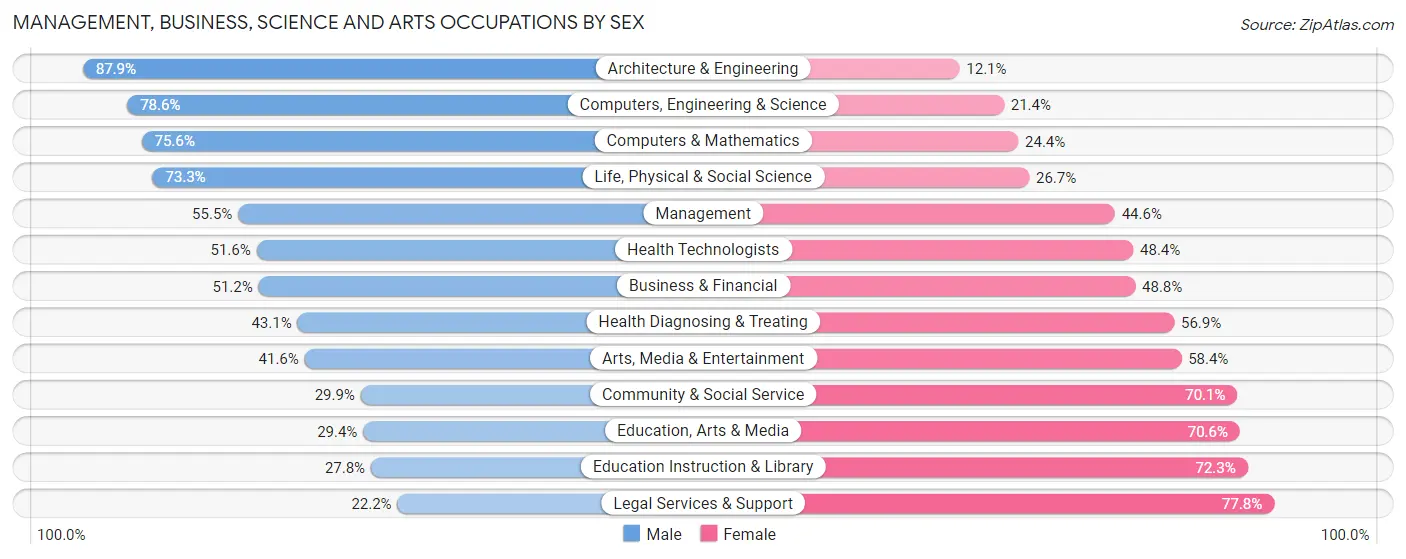
Management, Business, Science and Arts Occupations by Sex
Within the Management, Business, Science and Arts occupations in Prescott Valley, the most male-oriented occupations are Architecture & Engineering (87.9%), Computers, Engineering & Science (78.6%), and Computers & Mathematics (75.6%), while the most female-oriented occupations are Legal Services & Support (77.8%), Education Instruction & Library (72.3%), and Education, Arts & Media (70.6%).
| Occupation | Male | Female |
| Management | 839 (55.4%) | 674 (44.6%) |
| Business & Financial | 383 (51.2%) | 365 (48.8%) |
| Computers, Engineering & Science | 646 (78.6%) | 176 (21.4%) |
| Computers & Mathematics | 443 (75.6%) | 143 (24.4%) |
| Architecture & Engineering | 181 (87.9%) | 25 (12.1%) |
| Life, Physical & Social Science | 22 (73.3%) | 8 (26.7%) |
| Community & Social Service | 494 (29.9%) | 1,159 (70.1%) |
| Education, Arts & Media | 148 (29.4%) | 356 (70.6%) |
| Legal Services & Support | 10 (22.2%) | 35 (77.8%) |
| Education Instruction & Library | 247 (27.8%) | 643 (72.3%) |
| Arts, Media & Entertainment | 89 (41.6%) | 125 (58.4%) |
| Health Diagnosing & Treating | 590 (43.1%) | 780 (56.9%) |
| Health Technologists | 367 (51.6%) | 344 (48.4%) |
| Total (Category) | 2,952 (48.3%) | 3,154 (51.6%) |
| Total (Overall) | 11,350 (55.8%) | 9,004 (44.2%) |
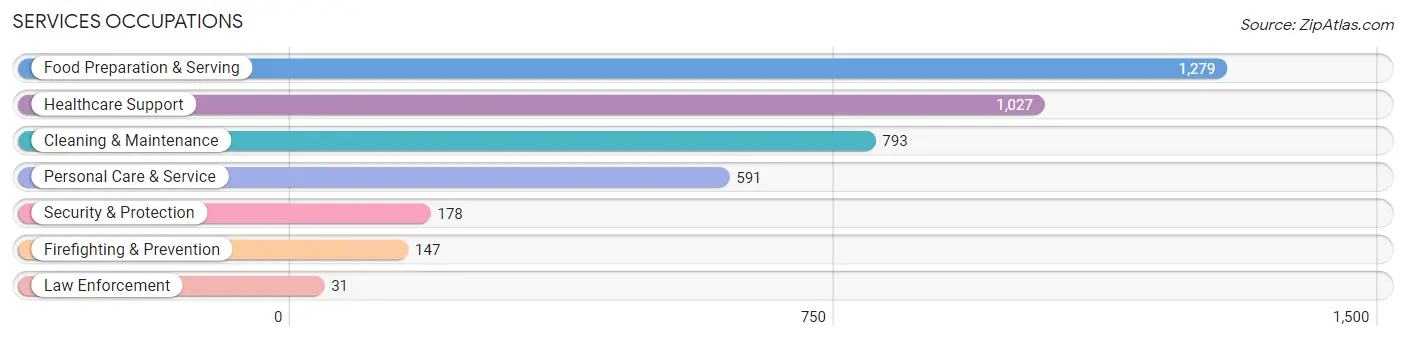
Services Occupations
The most common Services occupations in Prescott Valley are Food Preparation & Serving (1,279 | 6.3%), Healthcare Support (1,027 | 5.1%), Cleaning & Maintenance (793 | 3.9%), Personal Care & Service (591 | 2.9%), and Security & Protection (178 | 0.9%).
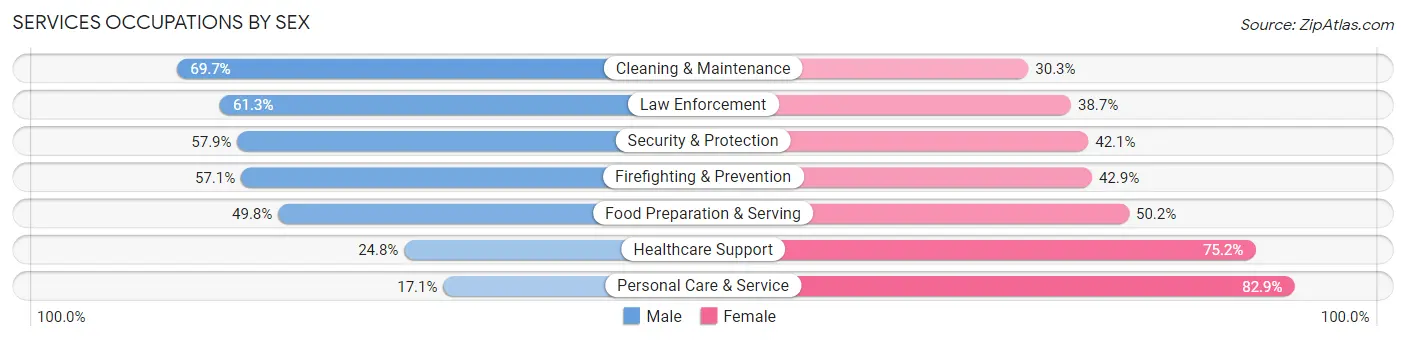
Services Occupations by Sex
Within the Services occupations in Prescott Valley, the most male-oriented occupations are Cleaning & Maintenance (69.7%), Law Enforcement (61.3%), and Security & Protection (57.9%), while the most female-oriented occupations are Personal Care & Service (82.9%), Healthcare Support (75.2%), and Food Preparation & Serving (50.2%).
| Occupation | Male | Female |
| Healthcare Support | 255 (24.8%) | 772 (75.2%) |
| Security & Protection | 103 (57.9%) | 75 (42.1%) |
| Firefighting & Prevention | 84 (57.1%) | 63 (42.9%) |
| Law Enforcement | 19 (61.3%) | 12 (38.7%) |
| Food Preparation & Serving | 637 (49.8%) | 642 (50.2%) |
| Cleaning & Maintenance | 553 (69.7%) | 240 (30.3%) |
| Personal Care & Service | 101 (17.1%) | 490 (82.9%) |
| Total (Category) | 1,649 (42.6%) | 2,219 (57.4%) |
| Total (Overall) | 11,350 (55.8%) | 9,004 (44.2%) |
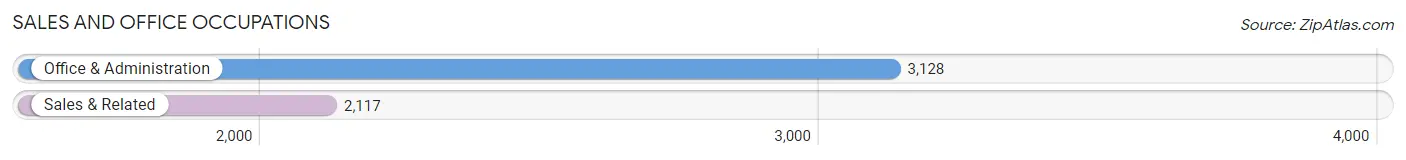
Sales and Office Occupations
The most common Sales and Office occupations in Prescott Valley are Office & Administration (3,128 | 15.4%), and Sales & Related (2,117 | 10.4%).
Sales and Office Occupations by Sex
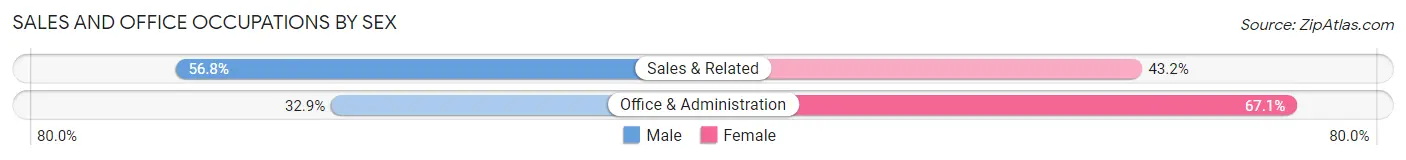
| Occupation | Male | Female |
| Sales & Related | 1,202 (56.8%) | 915 (43.2%) |
| Office & Administration | 1,028 (32.9%) | 2,100 (67.1%) |
| Total (Category) | 2,230 (42.5%) | 3,015 (57.5%) |
| Total (Overall) | 11,350 (55.8%) | 9,004 (44.2%) |
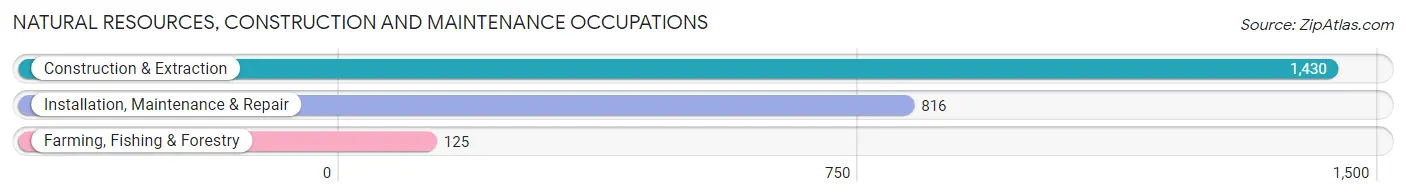
Natural Resources, Construction and Maintenance Occupations
The most common Natural Resources, Construction and Maintenance occupations in Prescott Valley are Construction & Extraction (1,430 | 7.0%), Installation, Maintenance & Repair (816 | 4.0%), and Farming, Fishing & Forestry (125 | 0.6%).
Natural Resources, Construction and Maintenance Occupations by Sex
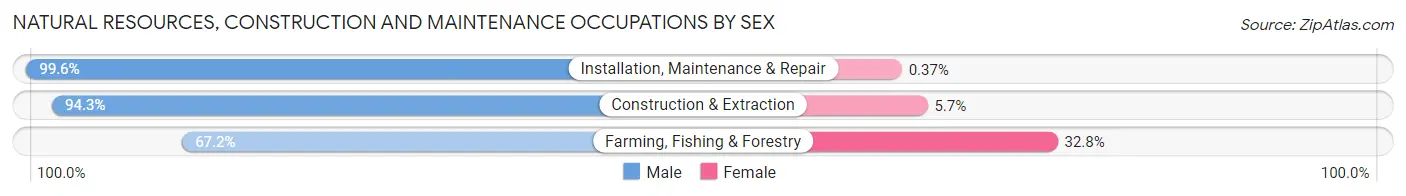
| Occupation | Male | Female |
| Farming, Fishing & Forestry | 84 (67.2%) | 41 (32.8%) |
| Construction & Extraction | 1,348 (94.3%) | 82 (5.7%) |
| Installation, Maintenance & Repair | 813 (99.6%) | 3 (0.4%) |
| Total (Category) | 2,245 (94.7%) | 126 (5.3%) |
| Total (Overall) | 11,350 (55.8%) | 9,004 (44.2%) |
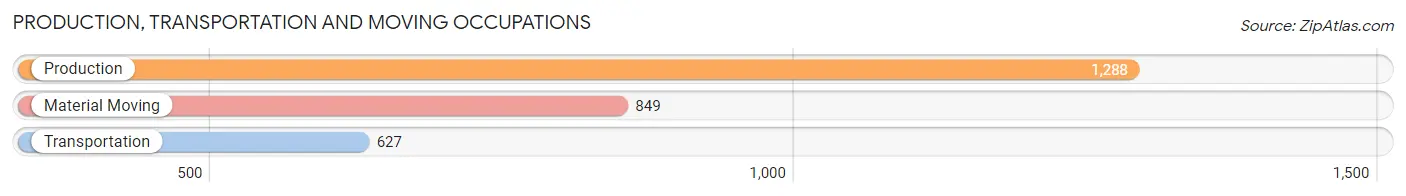
Production, Transportation and Moving Occupations
The most common Production, Transportation and Moving occupations in Prescott Valley are Production (1,288 | 6.3%), Material Moving (849 | 4.2%), and Transportation (627 | 3.1%).
Production, Transportation and Moving Occupations by Sex
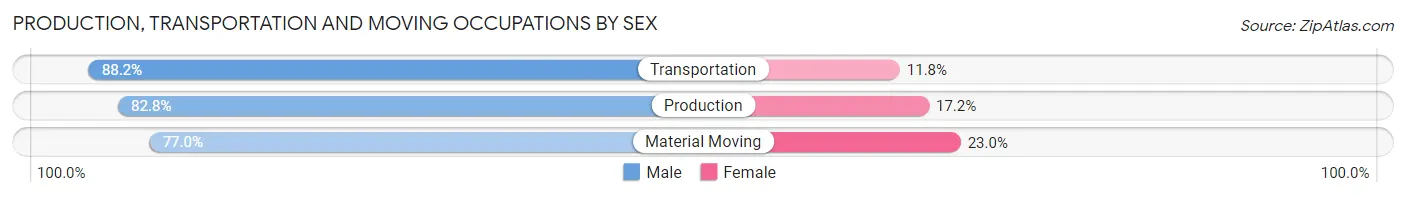
| Occupation | Male | Female |
| Production | 1,067 (82.8%) | 221 (17.2%) |
| Transportation | 553 (88.2%) | 74 (11.8%) |
| Material Moving | 654 (77.0%) | 195 (23.0%) |
| Total (Category) | 2,274 (82.3%) | 490 (17.7%) |
| Total (Overall) | 11,350 (55.8%) | 9,004 (44.2%) |
Employment Industries by Sex in Prescott Valley
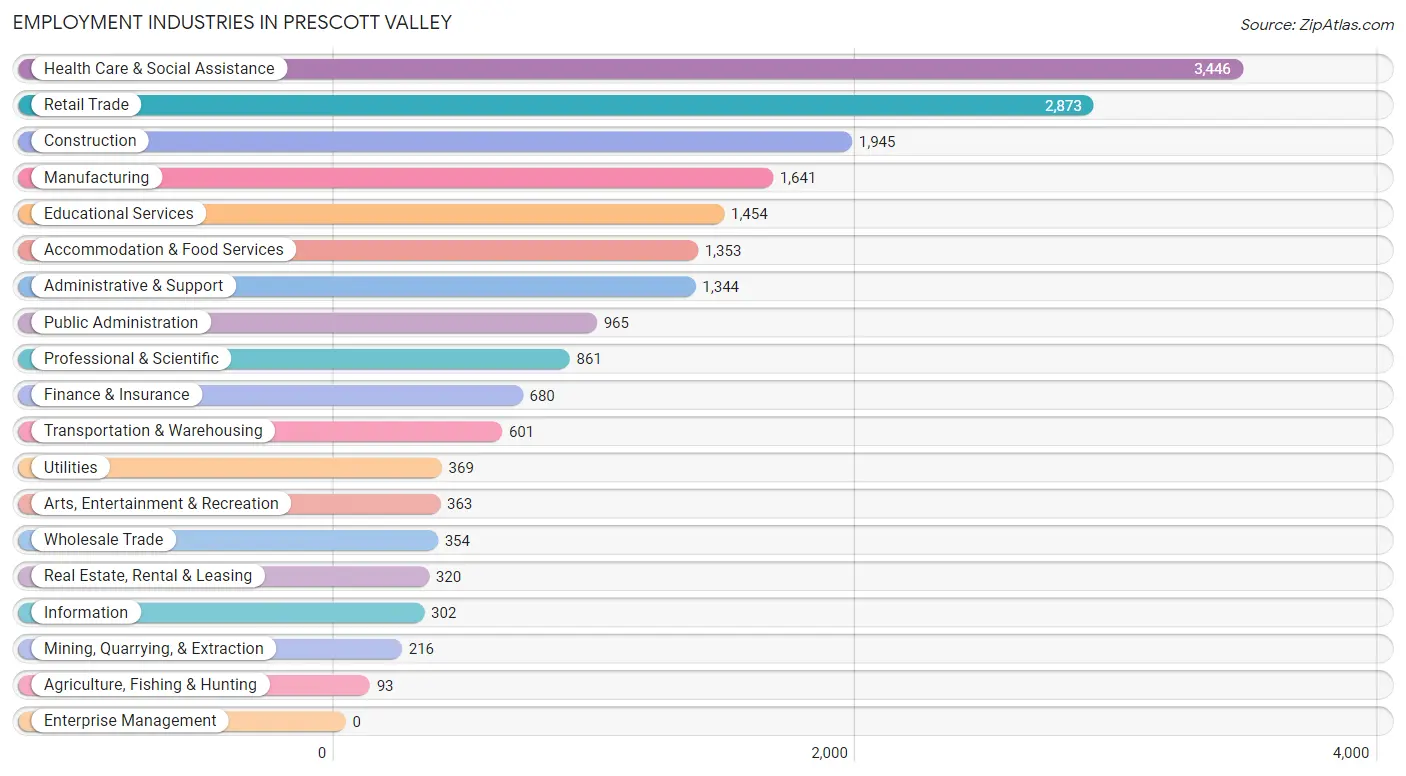
Employment Industries in Prescott Valley
The major employment industries in Prescott Valley include Health Care & Social Assistance (3,446 | 16.9%), Retail Trade (2,873 | 14.1%), Construction (1,945 | 9.6%), Manufacturing (1,641 | 8.1%), and Educational Services (1,454 | 7.1%).
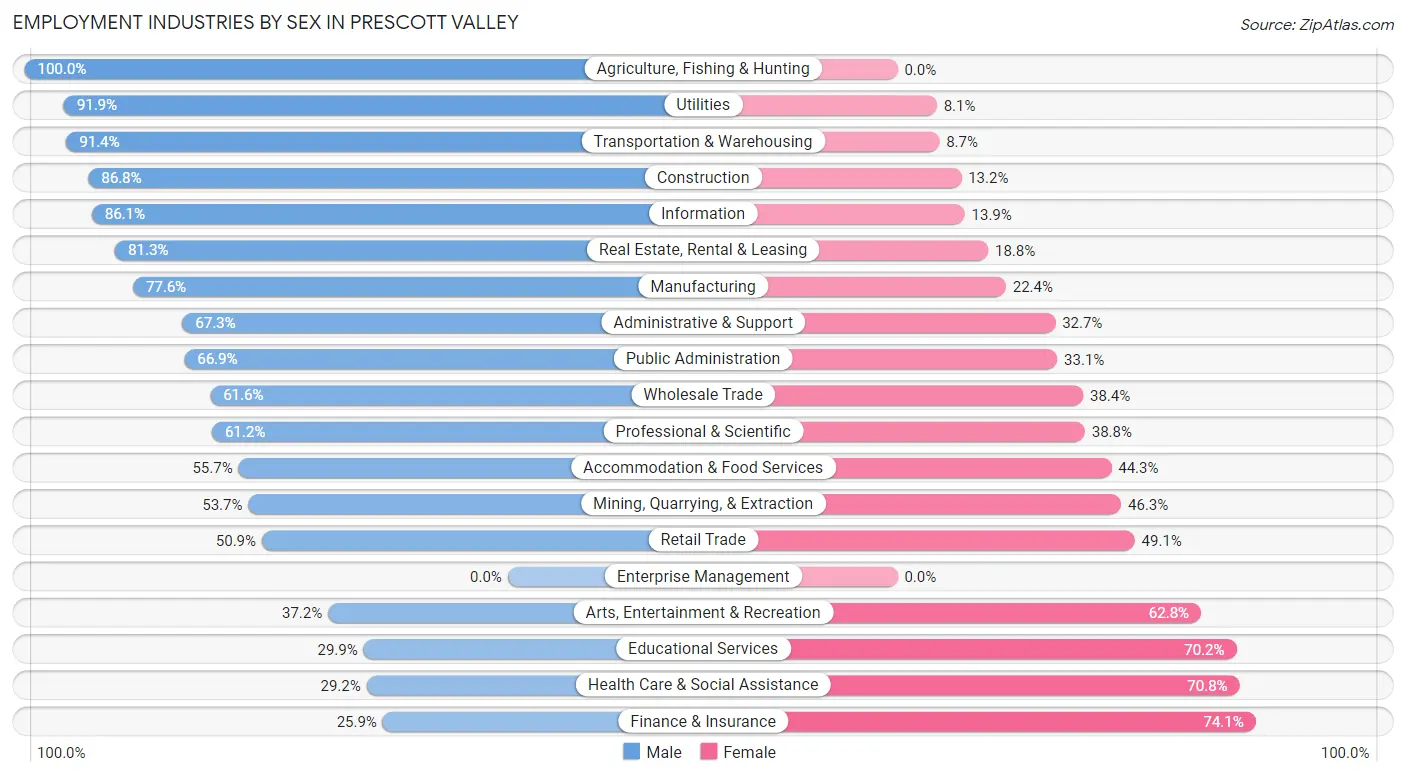
Employment Industries by Sex in Prescott Valley
The Prescott Valley industries that see more men than women are Agriculture, Fishing & Hunting (100.0%), Utilities (91.9%), and Transportation & Warehousing (91.3%), whereas the industries that tend to have a higher number of women are Finance & Insurance (74.1%), Health Care & Social Assistance (70.8%), and Educational Services (70.2%).
| Industry | Male | Female |
| Agriculture, Fishing & Hunting | 93 (100.0%) | 0 (0.0%) |
| Mining, Quarrying, & Extraction | 116 (53.7%) | 100 (46.3%) |
| Construction | 1,688 (86.8%) | 257 (13.2%) |
| Manufacturing | 1,273 (77.6%) | 368 (22.4%) |
| Wholesale Trade | 218 (61.6%) | 136 (38.4%) |
| Retail Trade | 1,462 (50.9%) | 1,411 (49.1%) |
| Transportation & Warehousing | 549 (91.3%) | 52 (8.6%) |
| Utilities | 339 (91.9%) | 30 (8.1%) |
| Information | 260 (86.1%) | 42 (13.9%) |
| Finance & Insurance | 176 (25.9%) | 504 (74.1%) |
| Real Estate, Rental & Leasing | 260 (81.2%) | 60 (18.8%) |
| Professional & Scientific | 527 (61.2%) | 334 (38.8%) |
| Enterprise Management | 0 (0.0%) | 0 (0.0%) |
| Administrative & Support | 905 (67.3%) | 439 (32.7%) |
| Educational Services | 434 (29.8%) | 1,020 (70.2%) |
| Health Care & Social Assistance | 1,007 (29.2%) | 2,439 (70.8%) |
| Arts, Entertainment & Recreation | 135 (37.2%) | 228 (62.8%) |
| Accommodation & Food Services | 754 (55.7%) | 599 (44.3%) |
| Public Administration | 646 (66.9%) | 319 (33.1%) |
| Total | 11,350 (55.8%) | 9,004 (44.2%) |
Education in Prescott Valley
School Enrollment in Prescott Valley
The most common levels of schooling among the 10,093 students in Prescott Valley are college / undergraduate (2,431 | 24.1%), elementary school (2,408 | 23.9%), and high school (2,110 | 20.9%).
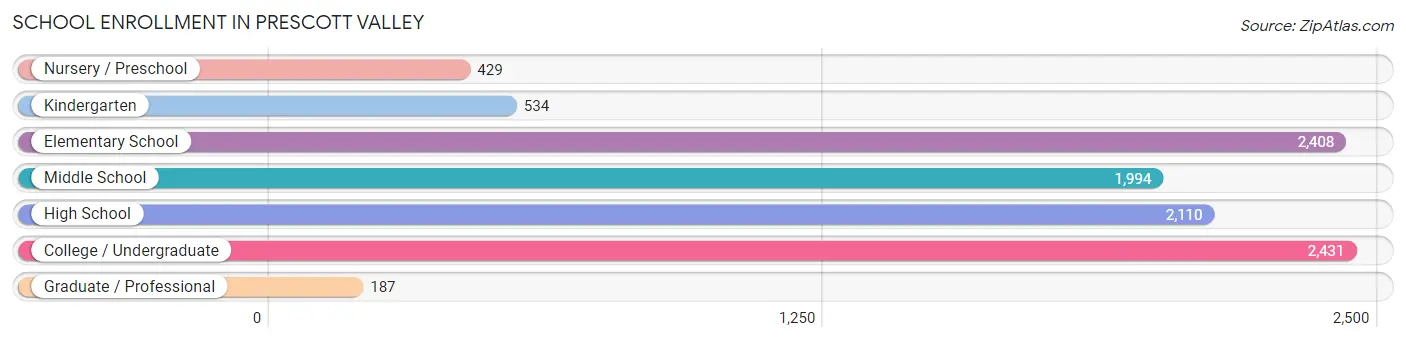
| School Level | # Students | % Students |
| Nursery / Preschool | 429 | 4.3% |
| Kindergarten | 534 | 5.3% |
| Elementary School | 2,408 | 23.9% |
| Middle School | 1,994 | 19.8% |
| High School | 2,110 | 20.9% |
| College / Undergraduate | 2,431 | 24.1% |
| Graduate / Professional | 187 | 1.8% |
| Total | 10,093 | 100.0% |
School Enrollment by Age by Funding Source in Prescott Valley
Out of a total of 10,093 students who are enrolled in schools in Prescott Valley, 1,817 (18.0%) attend a private institution, while the remaining 8,276 (82.0%) are enrolled in public schools. The age group of 20 to 24 year olds has the highest likelihood of being enrolled in private schools, with 684 (53.9% in the age bracket) enrolled. Conversely, the age group of 25 to 34 year olds has the lowest likelihood of being enrolled in a private school, with 611 (97.6% in the age bracket) attending a public institution.
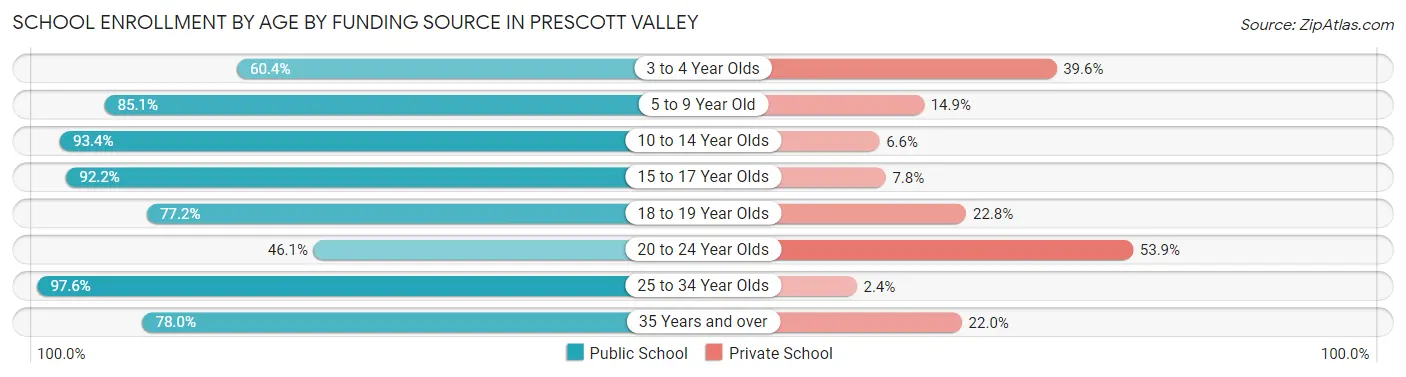
| Age Bracket | Public School | Private School |
| 3 to 4 Year Olds | 238 (60.4%) | 156 (39.6%) |
| 5 to 9 Year Old | 2,339 (85.1%) | 410 (14.9%) |
| 10 to 14 Year Olds | 2,242 (93.4%) | 159 (6.6%) |
| 15 to 17 Year Olds | 1,267 (92.2%) | 107 (7.8%) |
| 18 to 19 Year Olds | 464 (77.2%) | 137 (22.8%) |
| 20 to 24 Year Olds | 586 (46.1%) | 684 (53.9%) |
| 25 to 34 Year Olds | 611 (97.6%) | 15 (2.4%) |
| 35 Years and over | 529 (78.0%) | 149 (22.0%) |
| Total | 8,276 (82.0%) | 1,817 (18.0%) |
Educational Attainment by Field of Study in Prescott Valley
Business (1,963 | 23.5%), education (909 | 10.9%), science & technology (834 | 10.0%), social sciences (772 | 9.2%), and engineering (585 | 7.0%) are the most common fields of study among 8,353 individuals in Prescott Valley who have obtained a bachelor's degree or higher.
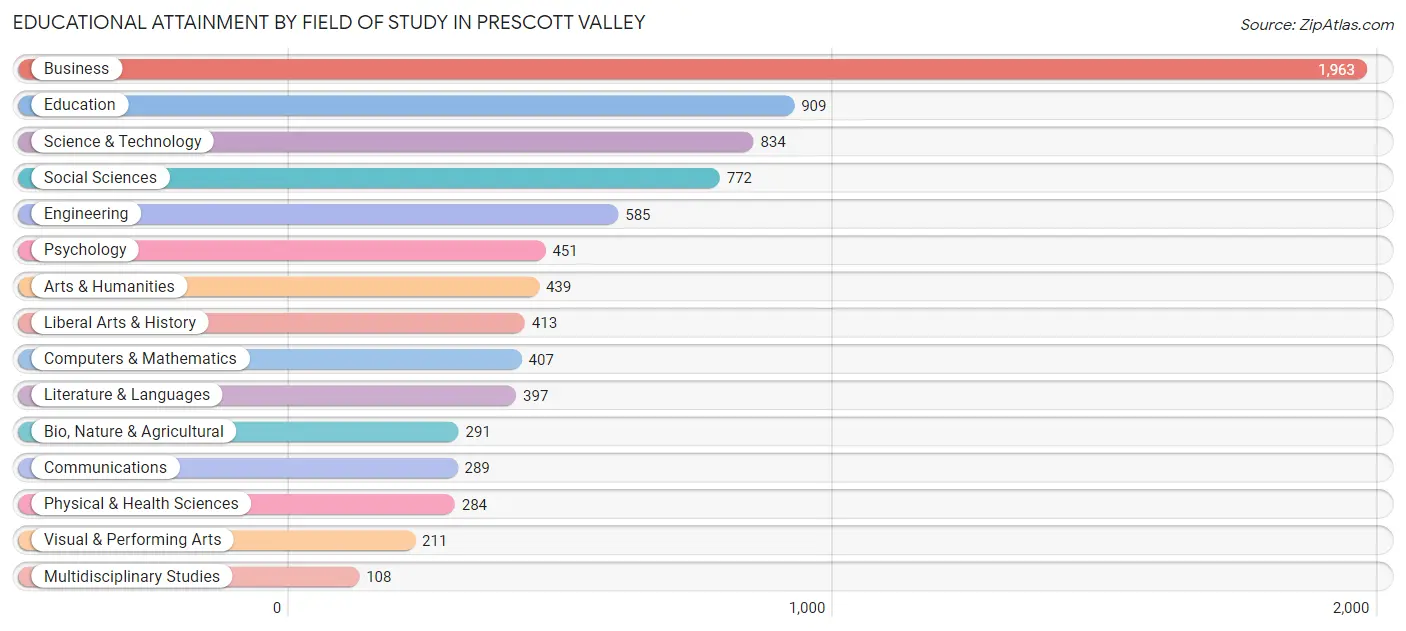
| Field of Study | # Graduates | % Graduates |
| Computers & Mathematics | 407 | 4.9% |
| Bio, Nature & Agricultural | 291 | 3.5% |
| Physical & Health Sciences | 284 | 3.4% |
| Psychology | 451 | 5.4% |
| Social Sciences | 772 | 9.2% |
| Engineering | 585 | 7.0% |
| Multidisciplinary Studies | 108 | 1.3% |
| Science & Technology | 834 | 10.0% |
| Business | 1,963 | 23.5% |
| Education | 909 | 10.9% |
| Literature & Languages | 397 | 4.8% |
| Liberal Arts & History | 413 | 4.9% |
| Visual & Performing Arts | 211 | 2.5% |
| Communications | 289 | 3.5% |
| Arts & Humanities | 439 | 5.3% |
| Total | 8,353 | 100.0% |
Transportation & Commute in Prescott Valley
Vehicle Availability by Sex in Prescott Valley
The most prevalent vehicle ownership categories in Prescott Valley are males with 2 vehicles (5,044, accounting for 45.5%) and females with 2 vehicles (4,043, making up 59.1%).
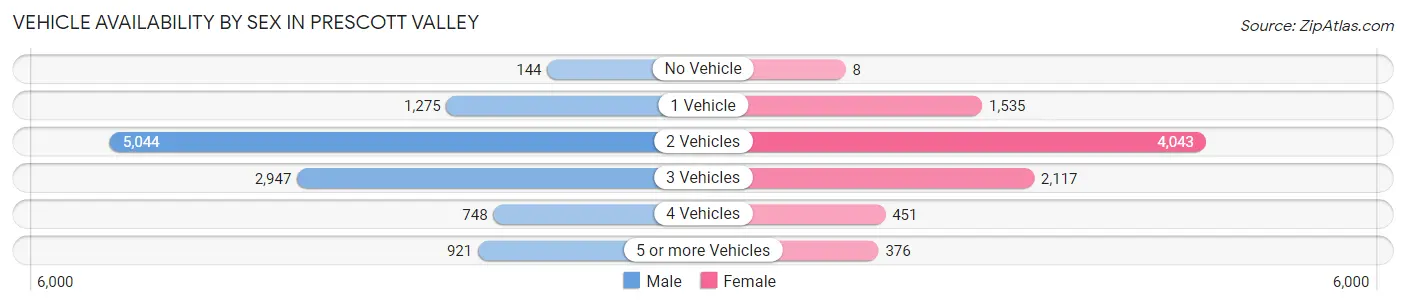
| Vehicles Available | Male | Female |
| No Vehicle | 144 (1.3%) | 8 (0.1%) |
| 1 Vehicle | 1,275 (11.5%) | 1,535 (18.0%) |
| 2 Vehicles | 5,044 (45.5%) | 4,043 (47.4%) |
| 3 Vehicles | 2,947 (26.6%) | 2,117 (24.8%) |
| 4 Vehicles | 748 (6.8%) | 451 (5.3%) |
| 5 or more Vehicles | 921 (8.3%) | 376 (4.4%) |
| Total | 11,079 (100.0%) | 8,530 (100.0%) |
Commute Time in Prescott Valley
The most frequently occuring commute durations in Prescott Valley are 10 to 14 minutes (3,864 commuters, 22.1%), 15 to 19 minutes (3,093 commuters, 17.7%), and 20 to 24 minutes (2,964 commuters, 16.9%).
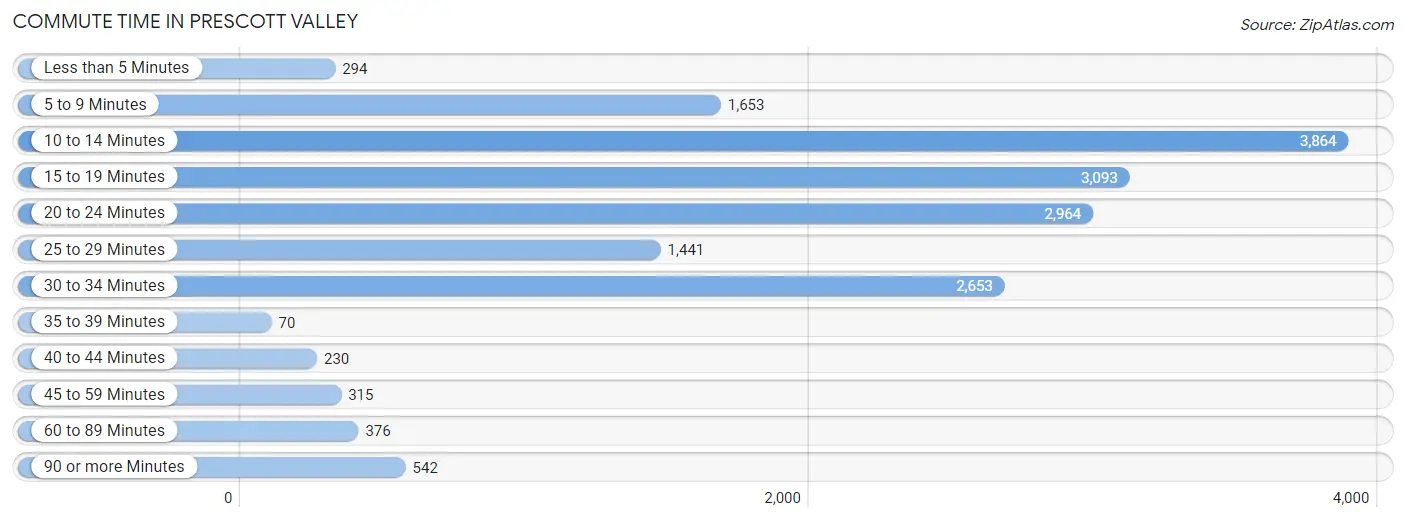
| Commute Time | # Commuters | % Commuters |
| Less than 5 Minutes | 294 | 1.7% |
| 5 to 9 Minutes | 1,653 | 9.5% |
| 10 to 14 Minutes | 3,864 | 22.1% |
| 15 to 19 Minutes | 3,093 | 17.7% |
| 20 to 24 Minutes | 2,964 | 16.9% |
| 25 to 29 Minutes | 1,441 | 8.2% |
| 30 to 34 Minutes | 2,653 | 15.2% |
| 35 to 39 Minutes | 70 | 0.4% |
| 40 to 44 Minutes | 230 | 1.3% |
| 45 to 59 Minutes | 315 | 1.8% |
| 60 to 89 Minutes | 376 | 2.1% |
| 90 or more Minutes | 542 | 3.1% |
Commute Time by Sex in Prescott Valley
The most common commute times in Prescott Valley are 10 to 14 minutes (2,059 commuters, 20.2%) for males and 10 to 14 minutes (1,805 commuters, 24.7%) for females.
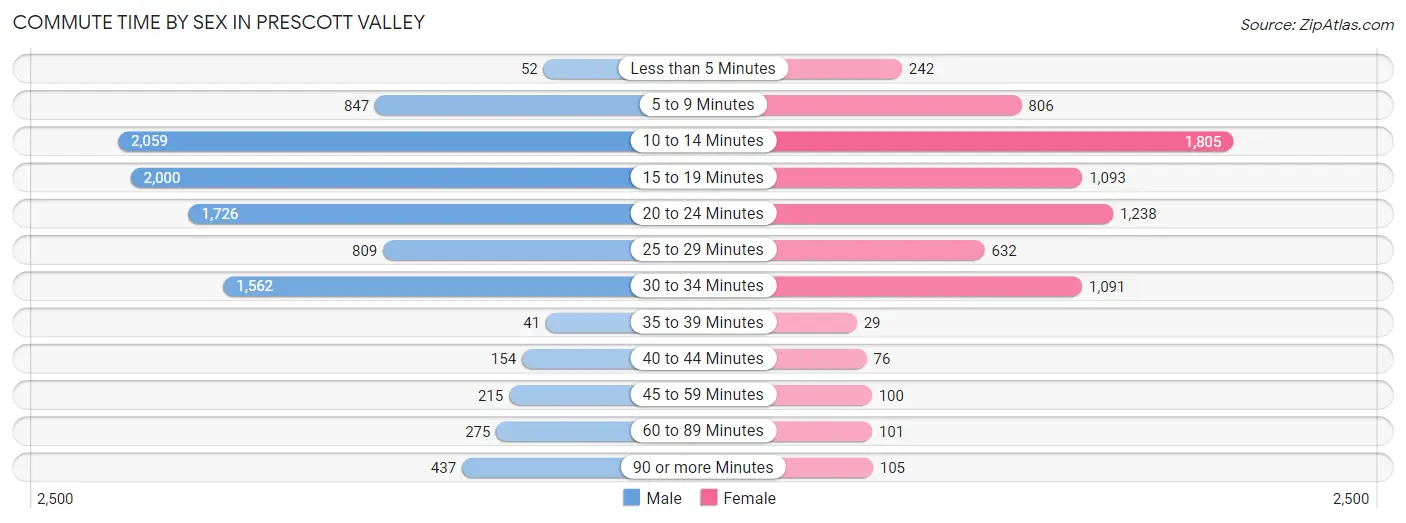
| Commute Time | Male | Female |
| Less than 5 Minutes | 52 (0.5%) | 242 (3.3%) |
| 5 to 9 Minutes | 847 (8.3%) | 806 (11.0%) |
| 10 to 14 Minutes | 2,059 (20.2%) | 1,805 (24.7%) |
| 15 to 19 Minutes | 2,000 (19.7%) | 1,093 (14.9%) |
| 20 to 24 Minutes | 1,726 (17.0%) | 1,238 (16.9%) |
| 25 to 29 Minutes | 809 (8.0%) | 632 (8.6%) |
| 30 to 34 Minutes | 1,562 (15.3%) | 1,091 (14.9%) |
| 35 to 39 Minutes | 41 (0.4%) | 29 (0.4%) |
| 40 to 44 Minutes | 154 (1.5%) | 76 (1.0%) |
| 45 to 59 Minutes | 215 (2.1%) | 100 (1.4%) |
| 60 to 89 Minutes | 275 (2.7%) | 101 (1.4%) |
| 90 or more Minutes | 437 (4.3%) | 105 (1.4%) |
Time of Departure to Work by Sex in Prescott Valley
The most frequent times of departure to work in Prescott Valley are 7:00 AM to 7:29 AM (1,881, 18.5%) for males and 7:30 AM to 7:59 AM (1,431, 19.6%) for females.
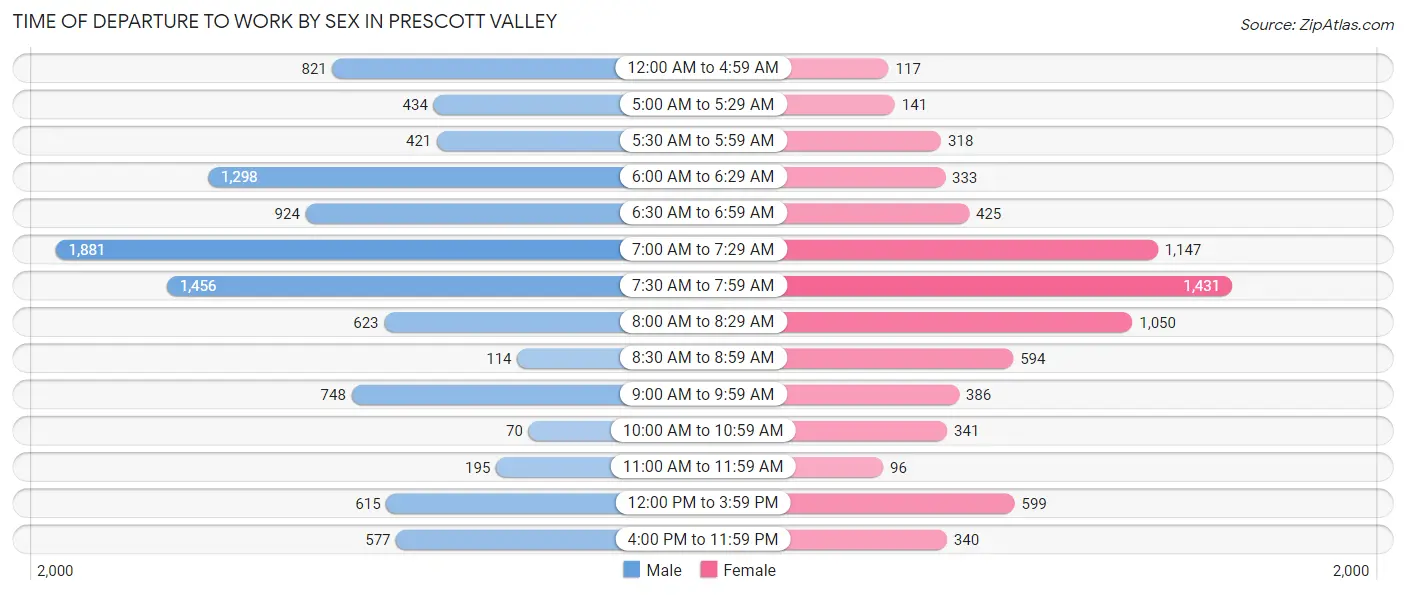
| Time of Departure | Male | Female |
| 12:00 AM to 4:59 AM | 821 (8.1%) | 117 (1.6%) |
| 5:00 AM to 5:29 AM | 434 (4.3%) | 141 (1.9%) |
| 5:30 AM to 5:59 AM | 421 (4.1%) | 318 (4.3%) |
| 6:00 AM to 6:29 AM | 1,298 (12.8%) | 333 (4.5%) |
| 6:30 AM to 6:59 AM | 924 (9.1%) | 425 (5.8%) |
| 7:00 AM to 7:29 AM | 1,881 (18.5%) | 1,147 (15.7%) |
| 7:30 AM to 7:59 AM | 1,456 (14.3%) | 1,431 (19.6%) |
| 8:00 AM to 8:29 AM | 623 (6.1%) | 1,050 (14.3%) |
| 8:30 AM to 8:59 AM | 114 (1.1%) | 594 (8.1%) |
| 9:00 AM to 9:59 AM | 748 (7.3%) | 386 (5.3%) |
| 10:00 AM to 10:59 AM | 70 (0.7%) | 341 (4.7%) |
| 11:00 AM to 11:59 AM | 195 (1.9%) | 96 (1.3%) |
| 12:00 PM to 3:59 PM | 615 (6.0%) | 599 (8.2%) |
| 4:00 PM to 11:59 PM | 577 (5.7%) | 340 (4.6%) |
| Total | 10,177 (100.0%) | 7,318 (100.0%) |
Housing Occupancy in Prescott Valley
Occupancy by Ownership in Prescott Valley
Of the total 19,773 dwellings in Prescott Valley, owner-occupied units account for 14,071 (71.2%), while renter-occupied units make up 5,702 (28.8%).
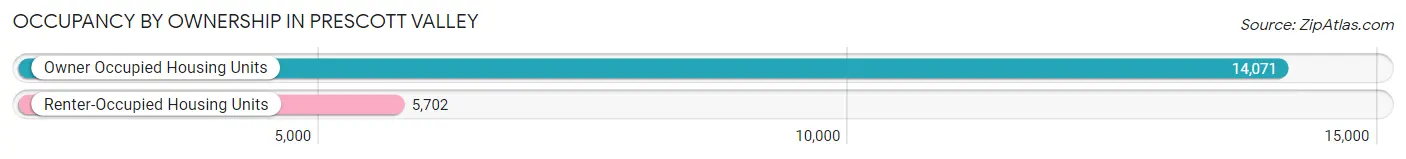
| Occupancy | # Housing Units | % Housing Units |
| Owner Occupied Housing Units | 14,071 | 71.2% |
| Renter-Occupied Housing Units | 5,702 | 28.8% |
| Total Occupied Housing Units | 19,773 | 100.0% |
Occupancy by Household Size in Prescott Valley
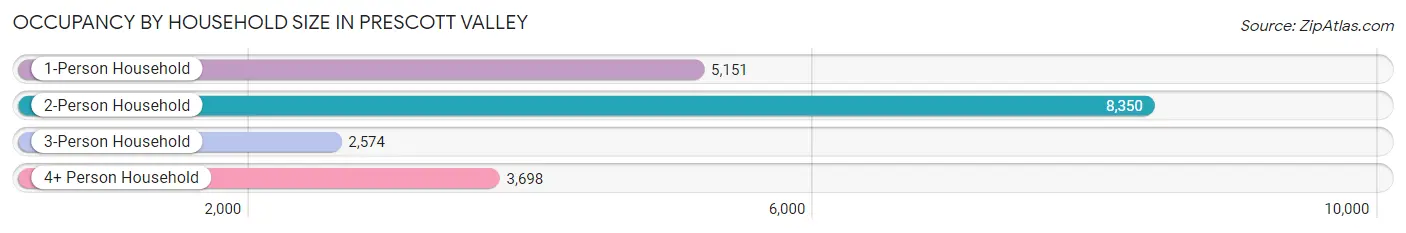
| Household Size | # Housing Units | % Housing Units |
| 1-Person Household | 5,151 | 26.1% |
| 2-Person Household | 8,350 | 42.2% |
| 3-Person Household | 2,574 | 13.0% |
| 4+ Person Household | 3,698 | 18.7% |
| Total Housing Units | 19,773 | 100.0% |
Occupancy by Ownership by Household Size in Prescott Valley
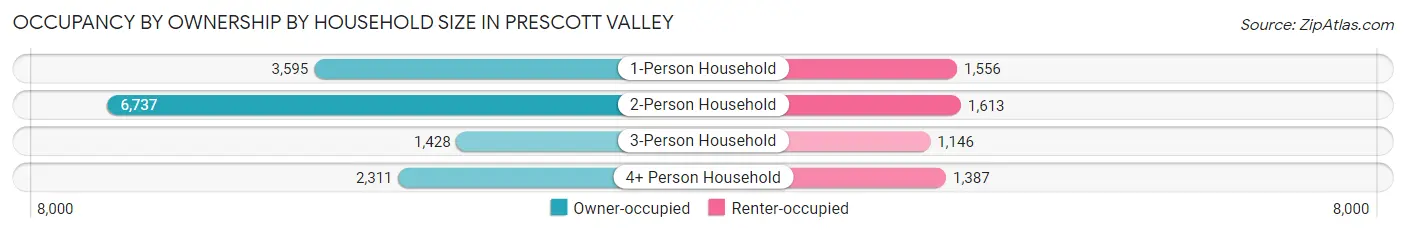
| Household Size | Owner-occupied | Renter-occupied |
| 1-Person Household | 3,595 (69.8%) | 1,556 (30.2%) |
| 2-Person Household | 6,737 (80.7%) | 1,613 (19.3%) |
| 3-Person Household | 1,428 (55.5%) | 1,146 (44.5%) |
| 4+ Person Household | 2,311 (62.5%) | 1,387 (37.5%) |
| Total Housing Units | 14,071 (71.2%) | 5,702 (28.8%) |
Occupancy by Educational Attainment in Prescott Valley
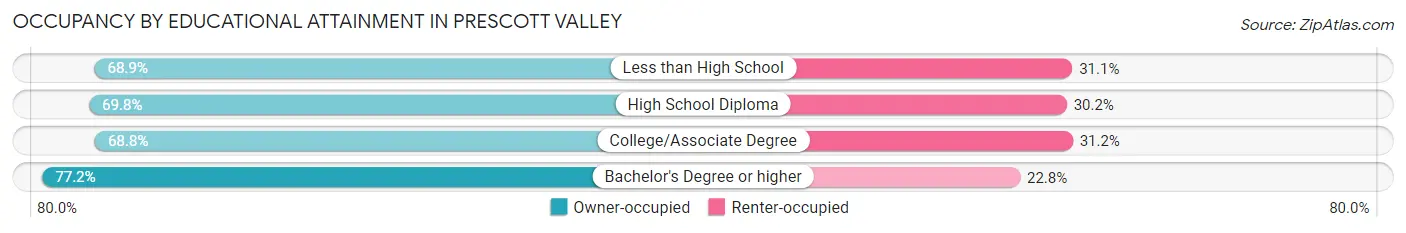
| Household Size | Owner-occupied | Renter-occupied |
| Less than High School | 855 (68.9%) | 386 (31.1%) |
| High School Diploma | 3,436 (69.8%) | 1,488 (30.2%) |
| College/Associate Degree | 5,952 (68.8%) | 2,696 (31.2%) |
| Bachelor's Degree or higher | 3,828 (77.2%) | 1,132 (22.8%) |
Occupancy by Age of Householder in Prescott Valley
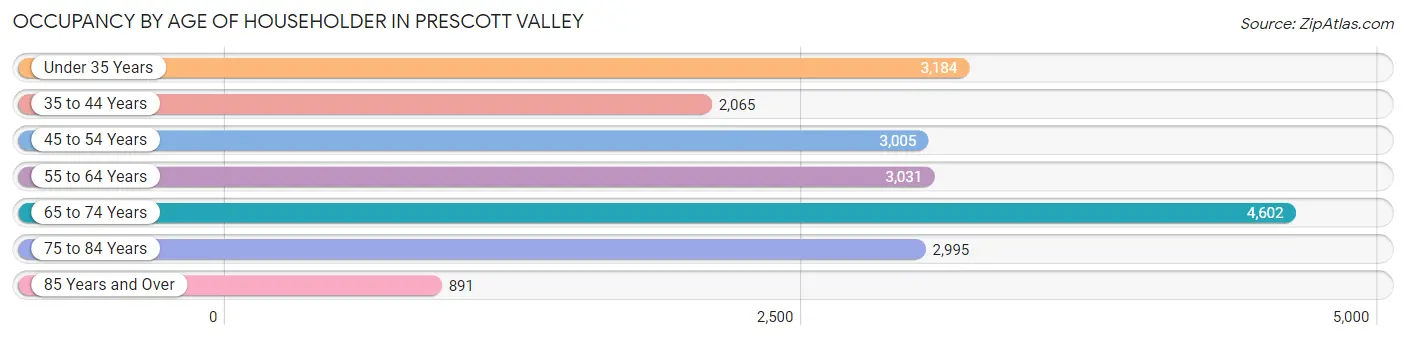
| Age Bracket | # Households | % Households |
| Under 35 Years | 3,184 | 16.1% |
| 35 to 44 Years | 2,065 | 10.4% |
| 45 to 54 Years | 3,005 | 15.2% |
| 55 to 64 Years | 3,031 | 15.3% |
| 65 to 74 Years | 4,602 | 23.3% |
| 75 to 84 Years | 2,995 | 15.1% |
| 85 Years and Over | 891 | 4.5% |
| Total | 19,773 | 100.0% |
Housing Finances in Prescott Valley
Median Income by Occupancy in Prescott Valley
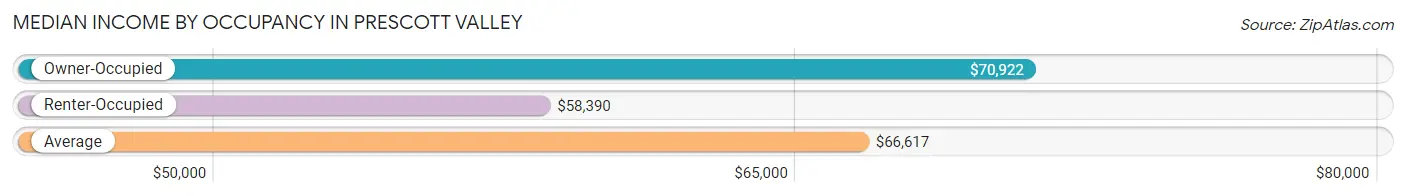
| Occupancy Type | # Households | Median Income |
| Owner-Occupied | 14,071 (71.2%) | $70,922 |
| Renter-Occupied | 5,702 (28.8%) | $58,390 |
| Average | 19,773 (100.0%) | $66,617 |
Occupancy by Householder Income Bracket in Prescott Valley
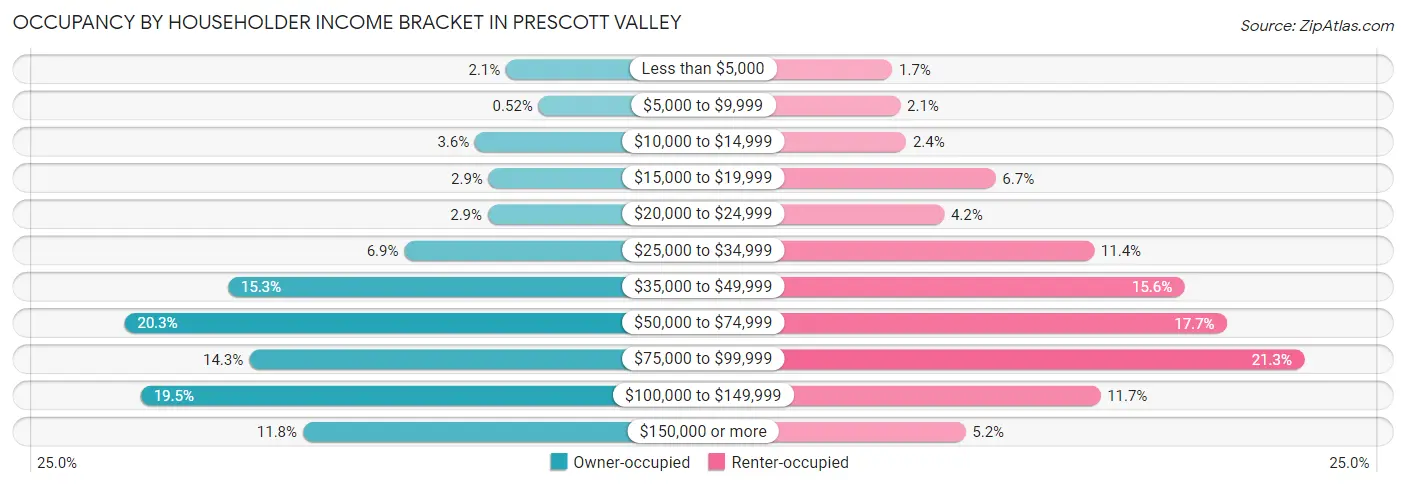
| Income Bracket | Owner-occupied | Renter-occupied |
| Less than $5,000 | 291 (2.1%) | 99 (1.7%) |
| $5,000 to $9,999 | 73 (0.5%) | 121 (2.1%) |
| $10,000 to $14,999 | 499 (3.5%) | 137 (2.4%) |
| $15,000 to $19,999 | 408 (2.9%) | 380 (6.7%) |
| $20,000 to $24,999 | 414 (2.9%) | 240 (4.2%) |
| $25,000 to $34,999 | 974 (6.9%) | 647 (11.4%) |
| $35,000 to $49,999 | 2,156 (15.3%) | 892 (15.6%) |
| $50,000 to $74,999 | 2,849 (20.3%) | 1,007 (17.7%) |
| $75,000 to $99,999 | 2,014 (14.3%) | 1,217 (21.3%) |
| $100,000 to $149,999 | 2,740 (19.5%) | 664 (11.7%) |
| $150,000 or more | 1,653 (11.7%) | 298 (5.2%) |
| Total | 14,071 (100.0%) | 5,702 (100.0%) |
Monthly Housing Cost Tiers in Prescott Valley
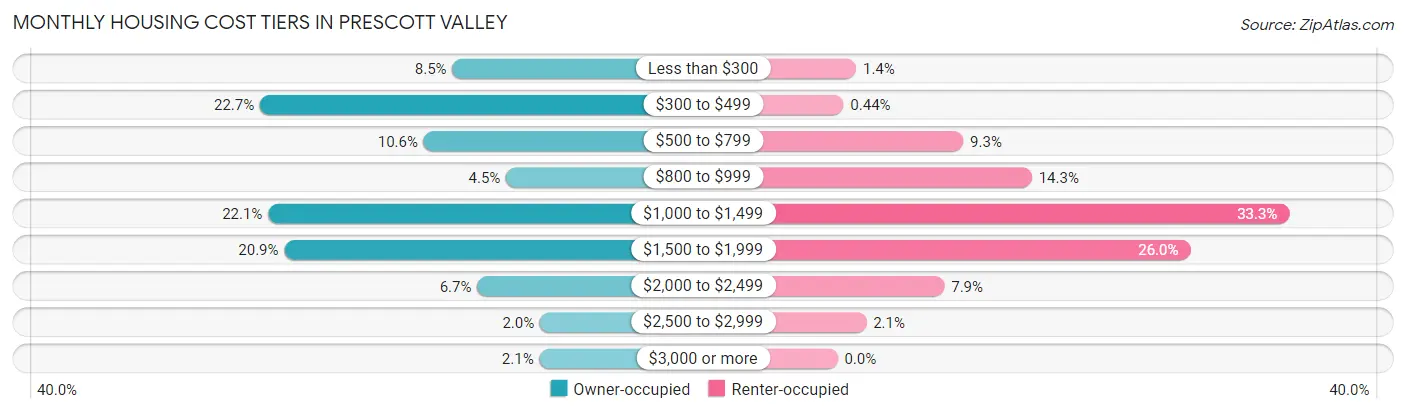
| Monthly Cost | Owner-occupied | Renter-occupied |
| Less than $300 | 1,195 (8.5%) | 78 (1.4%) |
| $300 to $499 | 3,189 (22.7%) | 25 (0.4%) |
| $500 to $799 | 1,492 (10.6%) | 528 (9.3%) |
| $800 to $999 | 638 (4.5%) | 816 (14.3%) |
| $1,000 to $1,499 | 3,104 (22.1%) | 1,897 (33.3%) |
| $1,500 to $1,999 | 2,936 (20.9%) | 1,482 (26.0%) |
| $2,000 to $2,499 | 937 (6.7%) | 449 (7.9%) |
| $2,500 to $2,999 | 287 (2.0%) | 121 (2.1%) |
| $3,000 or more | 293 (2.1%) | 0 (0.0%) |
| Total | 14,071 (100.0%) | 5,702 (100.0%) |
Physical Housing Characteristics in Prescott Valley
Housing Structures in Prescott Valley
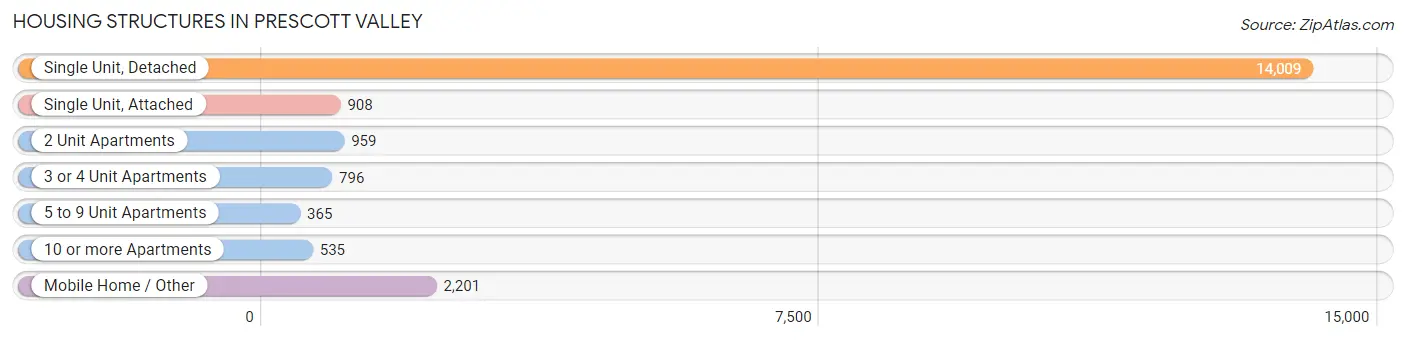
| Structure Type | # Housing Units | % Housing Units |
| Single Unit, Detached | 14,009 | 70.9% |
| Single Unit, Attached | 908 | 4.6% |
| 2 Unit Apartments | 959 | 4.9% |
| 3 or 4 Unit Apartments | 796 | 4.0% |
| 5 to 9 Unit Apartments | 365 | 1.8% |
| 10 or more Apartments | 535 | 2.7% |
| Mobile Home / Other | 2,201 | 11.1% |
| Total | 19,773 | 100.0% |
Housing Structures by Occupancy in Prescott Valley
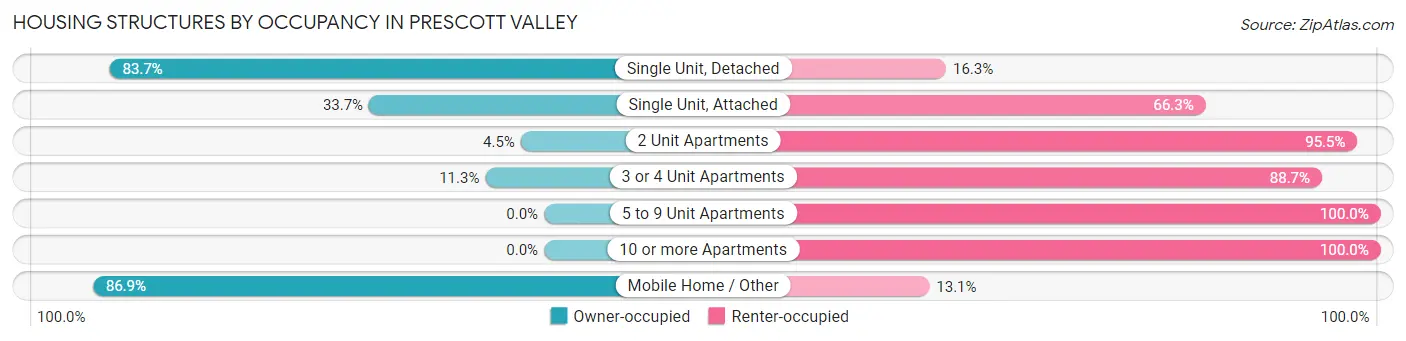
| Structure Type | Owner-occupied | Renter-occupied |
| Single Unit, Detached | 11,720 (83.7%) | 2,289 (16.3%) |
| Single Unit, Attached | 306 (33.7%) | 602 (66.3%) |
| 2 Unit Apartments | 43 (4.5%) | 916 (95.5%) |
| 3 or 4 Unit Apartments | 90 (11.3%) | 706 (88.7%) |
| 5 to 9 Unit Apartments | 0 (0.0%) | 365 (100.0%) |
| 10 or more Apartments | 0 (0.0%) | 535 (100.0%) |
| Mobile Home / Other | 1,912 (86.9%) | 289 (13.1%) |
| Total | 14,071 (71.2%) | 5,702 (28.8%) |
Housing Structures by Number of Rooms in Prescott Valley
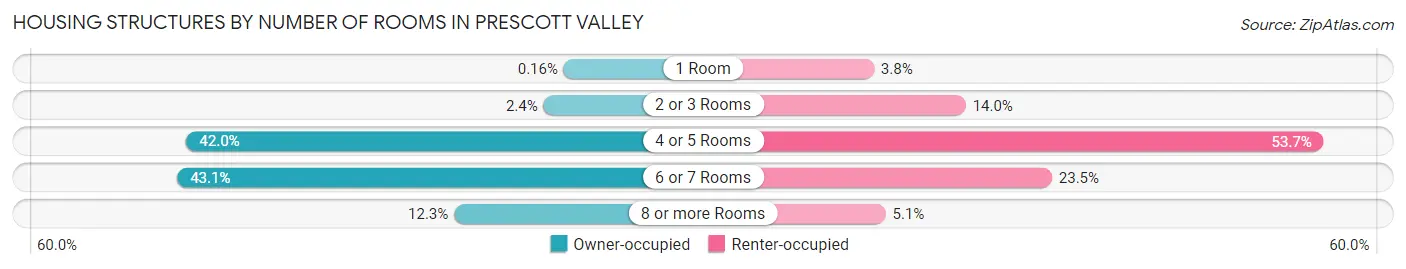
| Number of Rooms | Owner-occupied | Renter-occupied |
| 1 Room | 22 (0.2%) | 215 (3.8%) |
| 2 or 3 Rooms | 339 (2.4%) | 796 (14.0%) |
| 4 or 5 Rooms | 5,916 (42.0%) | 3,061 (53.7%) |
| 6 or 7 Rooms | 6,059 (43.1%) | 1,341 (23.5%) |
| 8 or more Rooms | 1,735 (12.3%) | 289 (5.1%) |
| Total | 14,071 (100.0%) | 5,702 (100.0%) |
Housing Structure by Heating Type in Prescott Valley
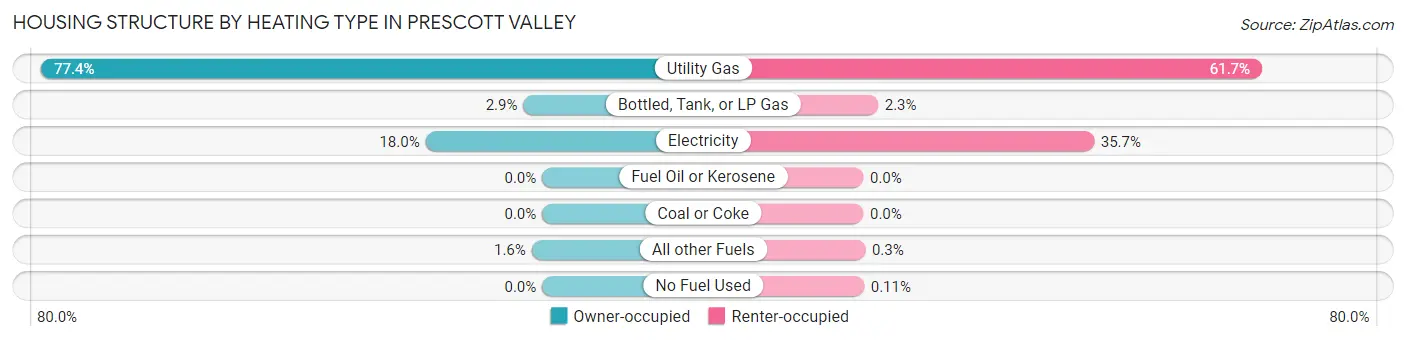
| Heating Type | Owner-occupied | Renter-occupied |
| Utility Gas | 10,896 (77.4%) | 3,515 (61.7%) |
| Bottled, Tank, or LP Gas | 410 (2.9%) | 130 (2.3%) |
| Electricity | 2,537 (18.0%) | 2,034 (35.7%) |
| Fuel Oil or Kerosene | 0 (0.0%) | 0 (0.0%) |
| Coal or Coke | 0 (0.0%) | 0 (0.0%) |
| All other Fuels | 228 (1.6%) | 17 (0.3%) |
| No Fuel Used | 0 (0.0%) | 6 (0.1%) |
| Total | 14,071 (100.0%) | 5,702 (100.0%) |
Household Vehicle Usage in Prescott Valley
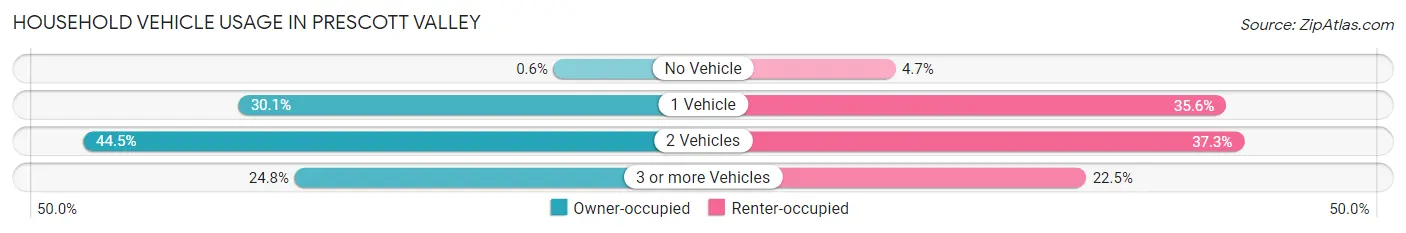
| Vehicles per Household | Owner-occupied | Renter-occupied |
| No Vehicle | 85 (0.6%) | 266 (4.7%) |
| 1 Vehicle | 4,235 (30.1%) | 2,029 (35.6%) |
| 2 Vehicles | 6,266 (44.5%) | 2,125 (37.3%) |
| 3 or more Vehicles | 3,485 (24.8%) | 1,282 (22.5%) |
| Total | 14,071 (100.0%) | 5,702 (100.0%) |
Real Estate & Mortgages in Prescott Valley
Real Estate and Mortgage Overview in Prescott Valley
| Characteristic | Without Mortgage | With Mortgage |
| Housing Units | 5,652 | 8,419 |
| Median Property Value | $324,300 | $353,800 |
| Median Household Income | $55,590 | $1,146 |
| Monthly Housing Costs | $413 | $267 |
| Real Estate Taxes | $1,726 | $348 |
Property Value by Mortgage Status in Prescott Valley
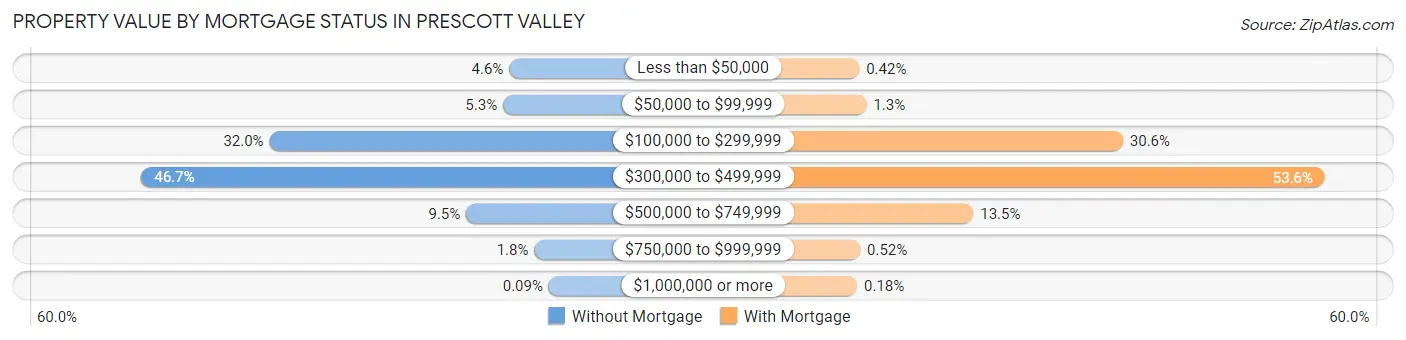
| Property Value | Without Mortgage | With Mortgage |
| Less than $50,000 | 261 (4.6%) | 35 (0.4%) |
| $50,000 to $99,999 | 301 (5.3%) | 105 (1.3%) |
| $100,000 to $299,999 | 1,810 (32.0%) | 2,572 (30.5%) |
| $300,000 to $499,999 | 2,637 (46.7%) | 4,515 (53.6%) |
| $500,000 to $749,999 | 539 (9.5%) | 1,133 (13.5%) |
| $750,000 to $999,999 | 99 (1.8%) | 44 (0.5%) |
| $1,000,000 or more | 5 (0.1%) | 15 (0.2%) |
| Total | 5,652 (100.0%) | 8,419 (100.0%) |
Household Income by Mortgage Status in Prescott Valley
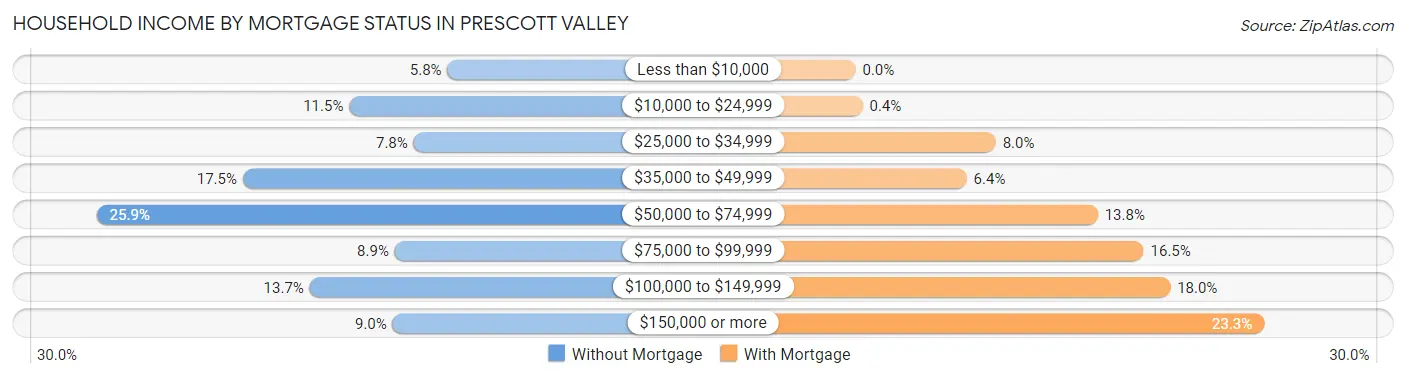
| Household Income | Without Mortgage | With Mortgage |
| Less than $10,000 | 330 (5.8%) | 0 (0.0%) |
| $10,000 to $24,999 | 647 (11.5%) | 34 (0.4%) |
| $25,000 to $34,999 | 439 (7.8%) | 674 (8.0%) |
| $35,000 to $49,999 | 991 (17.5%) | 535 (6.4%) |
| $50,000 to $74,999 | 1,463 (25.9%) | 1,165 (13.8%) |
| $75,000 to $99,999 | 500 (8.8%) | 1,386 (16.5%) |
| $100,000 to $149,999 | 775 (13.7%) | 1,514 (18.0%) |
| $150,000 or more | 507 (9.0%) | 1,965 (23.3%) |
| Total | 5,652 (100.0%) | 8,419 (100.0%) |
Property Value to Household Income Ratio in Prescott Valley
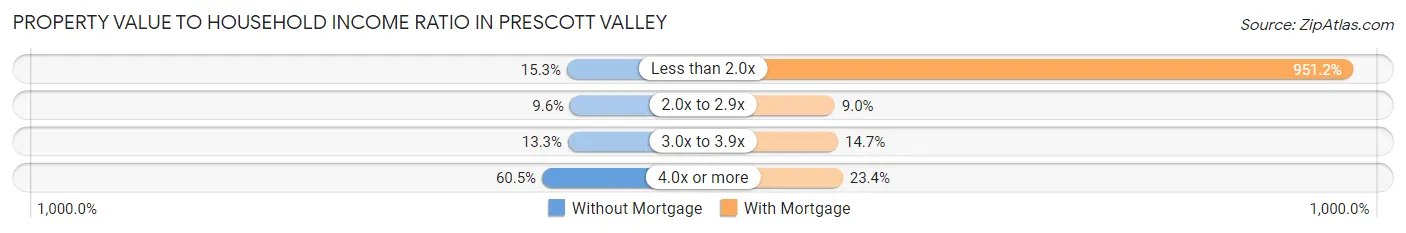
| Value-to-Income Ratio | Without Mortgage | With Mortgage |
| Less than 2.0x | 862 (15.2%) | 80,079 (951.2%) |
| 2.0x to 2.9x | 541 (9.6%) | 754 (9.0%) |
| 3.0x to 3.9x | 754 (13.3%) | 1,238 (14.7%) |
| 4.0x or more | 3,417 (60.5%) | 1,972 (23.4%) |
| Total | 5,652 (100.0%) | 8,419 (100.0%) |
Real Estate Taxes by Mortgage Status in Prescott Valley
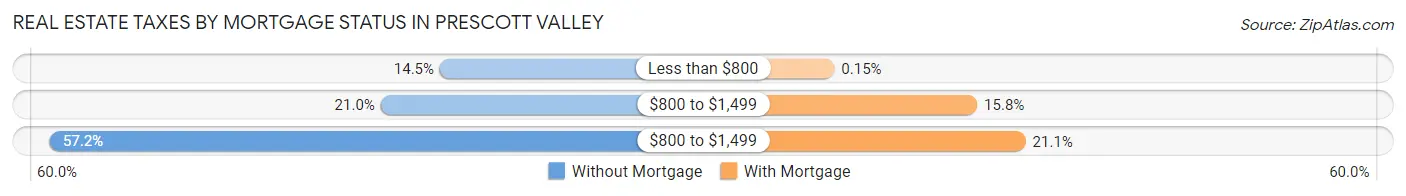
| Property Taxes | Without Mortgage | With Mortgage |
| Less than $800 | 819 (14.5%) | 13 (0.2%) |
| $800 to $1,499 | 1,186 (21.0%) | 1,329 (15.8%) |
| $800 to $1,499 | 3,234 (57.2%) | 1,777 (21.1%) |
| Total | 5,652 (100.0%) | 8,419 (100.0%) |
Health & Disability in Prescott Valley
Health Insurance Coverage by Age in Prescott Valley
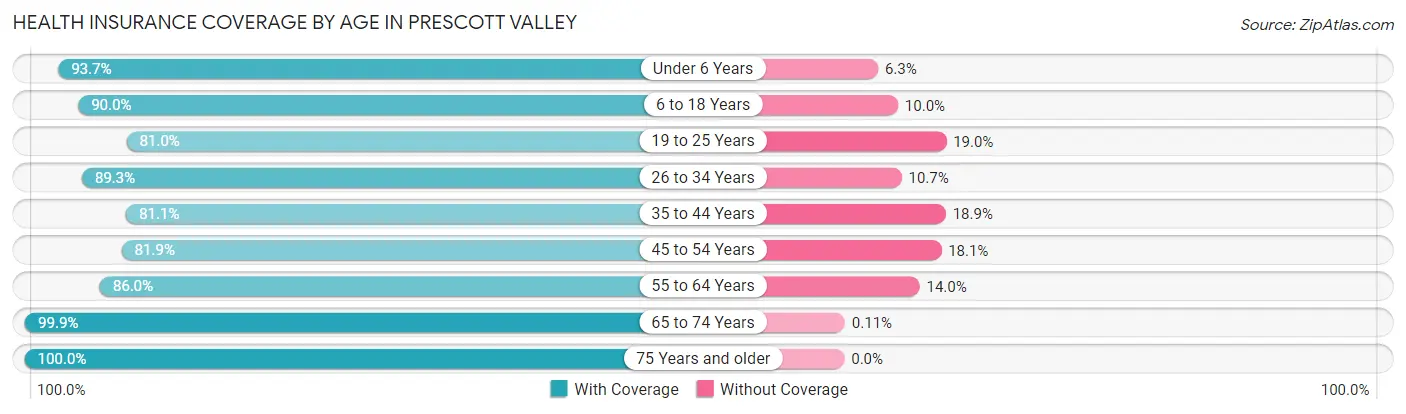
| Age Bracket | With Coverage | Without Coverage |
| Under 6 Years | 2,493 (93.7%) | 167 (6.3%) |
| 6 to 18 Years | 6,112 (90.0%) | 679 (10.0%) |
| 19 to 25 Years | 2,668 (81.0%) | 626 (19.0%) |
| 26 to 34 Years | 4,226 (89.3%) | 505 (10.7%) |
| 35 to 44 Years | 3,869 (81.1%) | 903 (18.9%) |
| 45 to 54 Years | 4,494 (81.9%) | 991 (18.1%) |
| 55 to 64 Years | 4,996 (86.0%) | 816 (14.0%) |
| 65 to 74 Years | 7,447 (99.9%) | 8 (0.1%) |
| 75 Years and older | 5,853 (100.0%) | 0 (0.0%) |
| Total | 42,158 (90.0%) | 4,695 (10.0%) |
Health Insurance Coverage by Citizenship Status in Prescott Valley
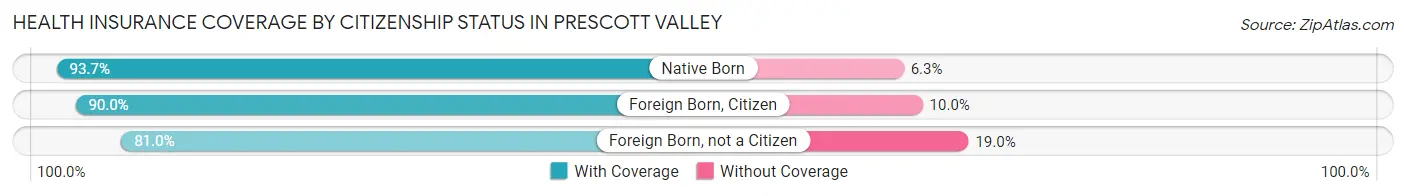
| Citizenship Status | With Coverage | Without Coverage |
| Native Born | 2,493 (93.7%) | 167 (6.3%) |
| Foreign Born, Citizen | 6,112 (90.0%) | 679 (10.0%) |
| Foreign Born, not a Citizen | 2,668 (81.0%) | 626 (19.0%) |
Health Insurance Coverage by Household Income in Prescott Valley
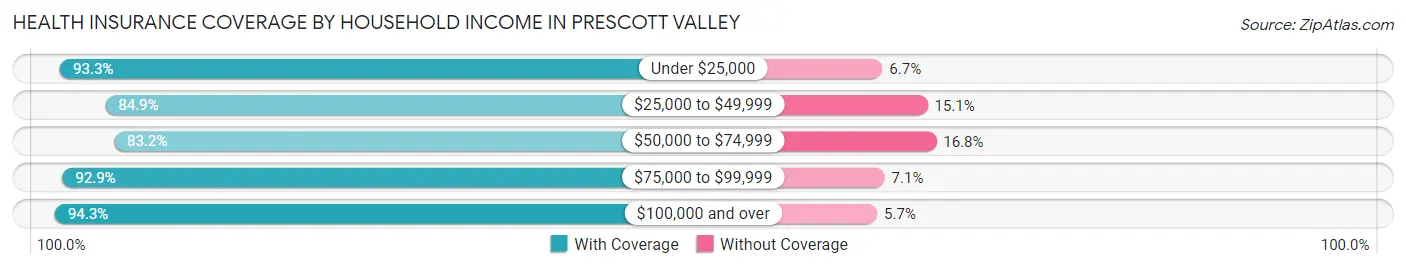
| Household Income | With Coverage | Without Coverage |
| Under $25,000 | 4,341 (93.3%) | 310 (6.7%) |
| $25,000 to $49,999 | 8,041 (84.9%) | 1,435 (15.1%) |
| $50,000 to $74,999 | 7,231 (83.2%) | 1,457 (16.8%) |
| $75,000 to $99,999 | 8,256 (92.9%) | 630 (7.1%) |
| $100,000 and over | 14,199 (94.3%) | 857 (5.7%) |
Public vs Private Health Insurance Coverage by Age in Prescott Valley
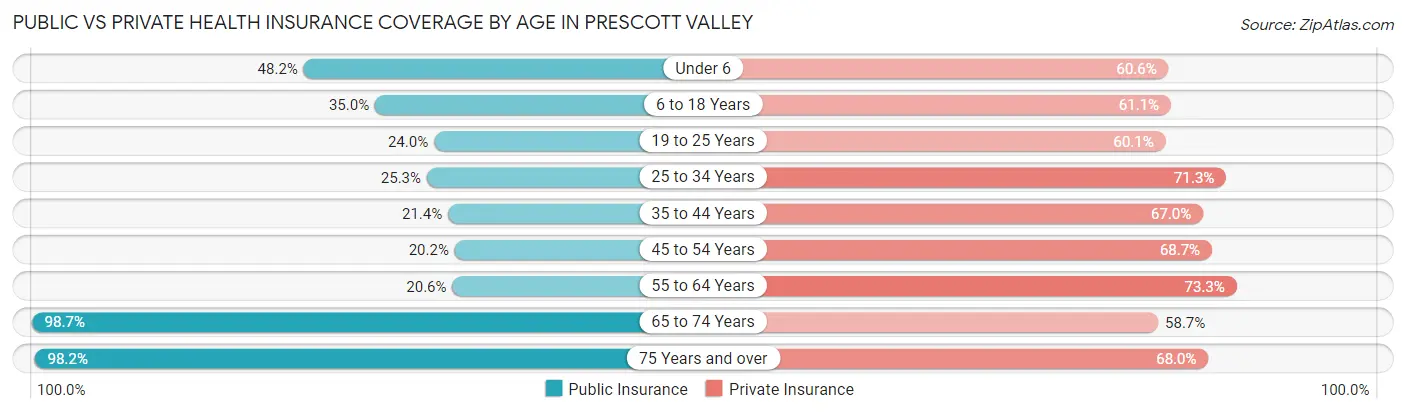
| Age Bracket | Public Insurance | Private Insurance |
| Under 6 | 1,282 (48.2%) | 1,613 (60.6%) |
| 6 to 18 Years | 2,374 (35.0%) | 4,148 (61.1%) |
| 19 to 25 Years | 791 (24.0%) | 1,979 (60.1%) |
| 25 to 34 Years | 1,199 (25.3%) | 3,375 (71.3%) |
| 35 to 44 Years | 1,021 (21.4%) | 3,199 (67.0%) |
| 45 to 54 Years | 1,106 (20.2%) | 3,768 (68.7%) |
| 55 to 64 Years | 1,197 (20.6%) | 4,259 (73.3%) |
| 65 to 74 Years | 7,357 (98.7%) | 4,377 (58.7%) |
| 75 Years and over | 5,745 (98.2%) | 3,981 (68.0%) |
| Total | 22,072 (47.1%) | 30,699 (65.5%) |
Disability Status by Sex by Age in Prescott Valley
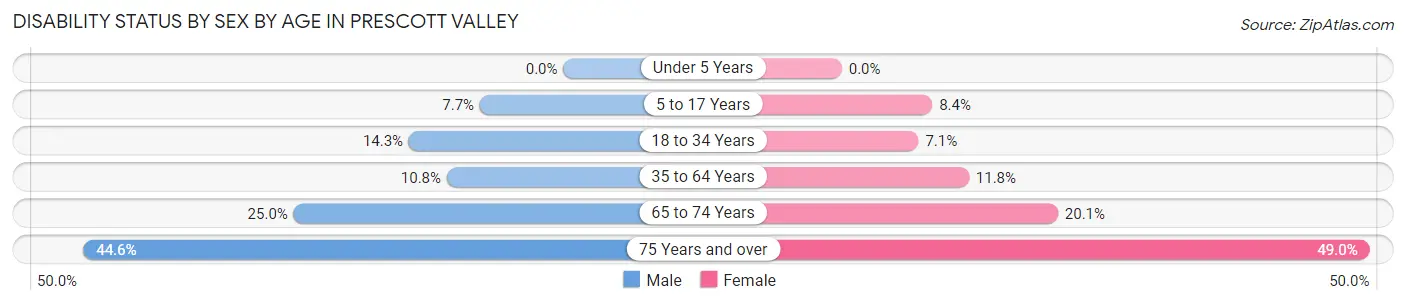
| Age Bracket | Male | Female |
| Under 5 Years | 0 (0.0%) | 0 (0.0%) |
| 5 to 17 Years | 262 (7.7%) | 297 (8.4%) |
| 18 to 34 Years | 680 (14.3%) | 272 (7.1%) |
| 35 to 64 Years | 873 (10.8%) | 942 (11.8%) |
| 65 to 74 Years | 825 (25.0%) | 834 (20.1%) |
| 75 Years and over | 1,221 (44.6%) | 1,524 (49.0%) |
Disability Class by Sex by Age in Prescott Valley
Disability Class: Hearing Difficulty
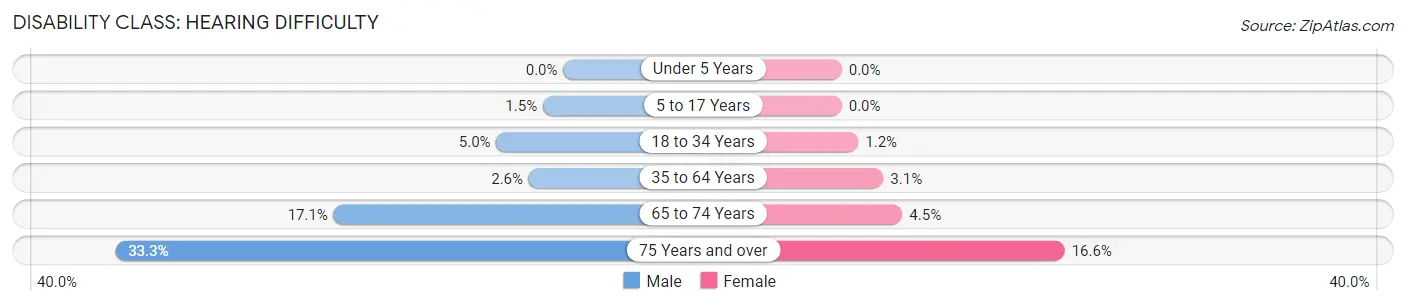
| Age Bracket | Male | Female |
| Under 5 Years | 0 (0.0%) | 0 (0.0%) |
| 5 to 17 Years | 51 (1.5%) | 0 (0.0%) |
| 18 to 34 Years | 236 (5.0%) | 47 (1.2%) |
| 35 to 64 Years | 207 (2.6%) | 247 (3.1%) |
| 65 to 74 Years | 562 (17.1%) | 187 (4.5%) |
| 75 Years and over | 912 (33.3%) | 515 (16.6%) |
Disability Class: Vision Difficulty
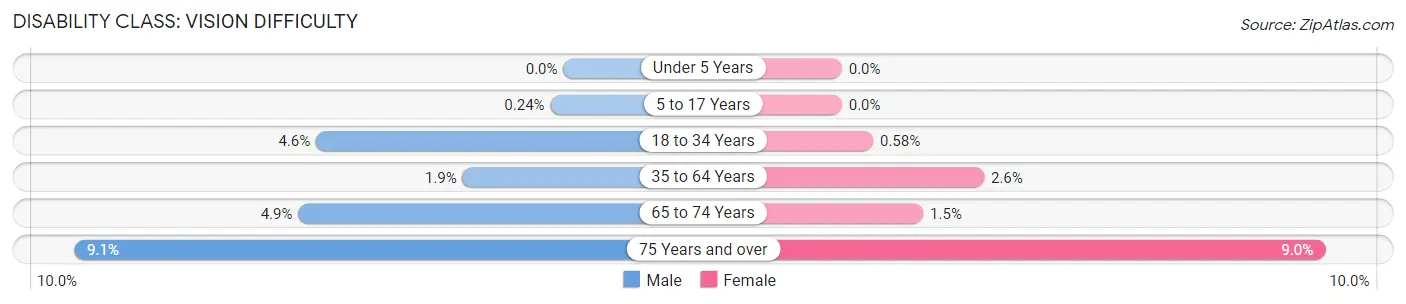
| Age Bracket | Male | Female |
| Under 5 Years | 0 (0.0%) | 0 (0.0%) |
| 5 to 17 Years | 8 (0.2%) | 0 (0.0%) |
| 18 to 34 Years | 218 (4.6%) | 22 (0.6%) |
| 35 to 64 Years | 151 (1.9%) | 211 (2.6%) |
| 65 to 74 Years | 162 (4.9%) | 63 (1.5%) |
| 75 Years and over | 249 (9.1%) | 279 (9.0%) |
Disability Class: Cognitive Difficulty
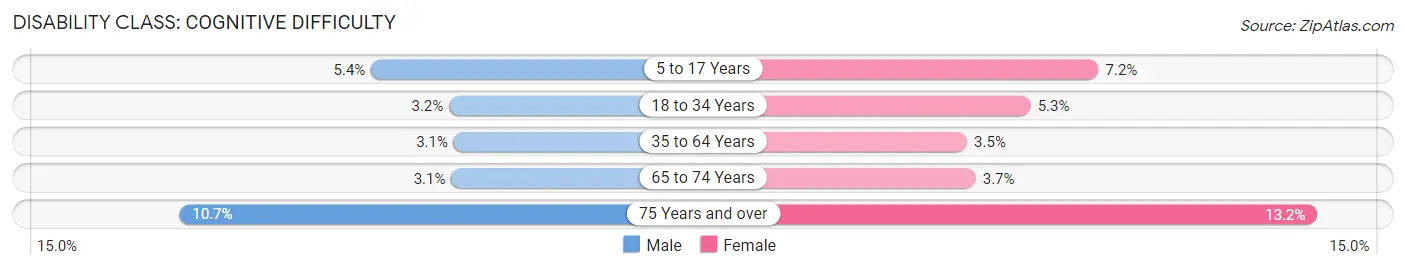
| Age Bracket | Male | Female |
| 5 to 17 Years | 181 (5.3%) | 253 (7.1%) |
| 18 to 34 Years | 151 (3.2%) | 201 (5.3%) |
| 35 to 64 Years | 246 (3.0%) | 279 (3.5%) |
| 65 to 74 Years | 103 (3.1%) | 155 (3.7%) |
| 75 Years and over | 293 (10.7%) | 412 (13.2%) |
Disability Class: Ambulatory Difficulty
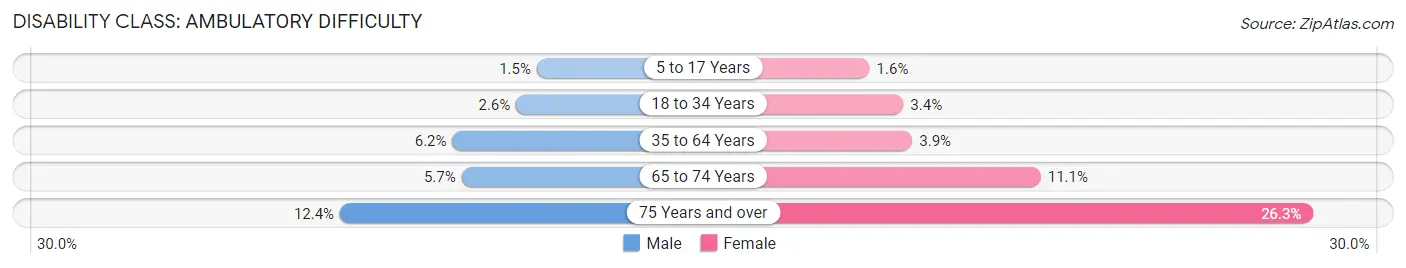
| Age Bracket | Male | Female |
| 5 to 17 Years | 50 (1.5%) | 55 (1.5%) |
| 18 to 34 Years | 125 (2.6%) | 131 (3.4%) |
| 35 to 64 Years | 499 (6.2%) | 314 (3.9%) |
| 65 to 74 Years | 187 (5.7%) | 461 (11.1%) |
| 75 Years and over | 341 (12.4%) | 817 (26.3%) |
Disability Class: Self-Care Difficulty
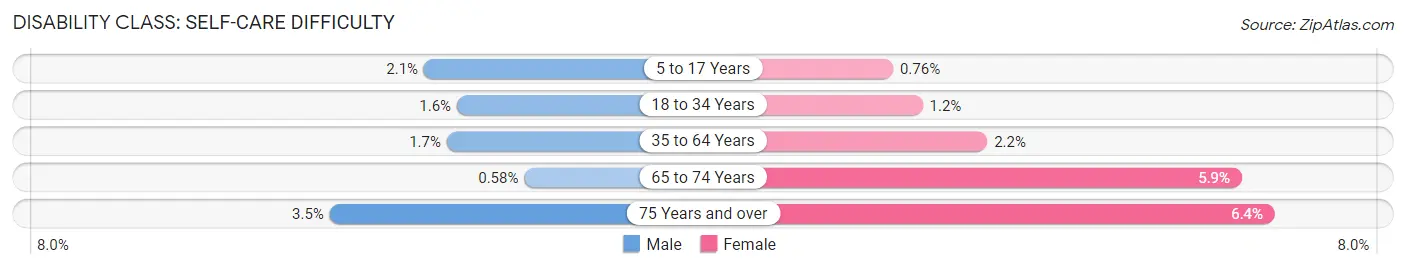
| Age Bracket | Male | Female |
| 5 to 17 Years | 70 (2.1%) | 27 (0.8%) |
| 18 to 34 Years | 75 (1.6%) | 46 (1.2%) |
| 35 to 64 Years | 140 (1.7%) | 173 (2.2%) |
| 65 to 74 Years | 19 (0.6%) | 247 (5.9%) |
| 75 Years and over | 95 (3.5%) | 200 (6.4%) |
Technology Access in Prescott Valley
Computing Device Access in Prescott Valley
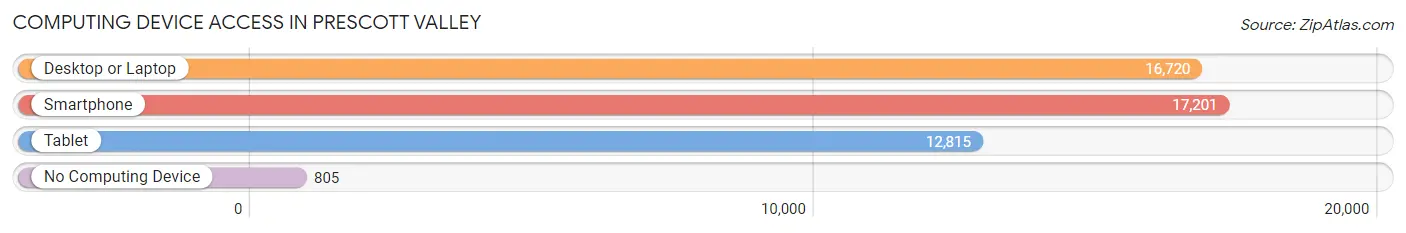
| Device Type | # Households | % Households |
| Desktop or Laptop | 16,720 | 84.6% |
| Smartphone | 17,201 | 87.0% |
| Tablet | 12,815 | 64.8% |
| No Computing Device | 805 | 4.1% |
| Total | 19,773 | 100.0% |
Internet Access in Prescott Valley
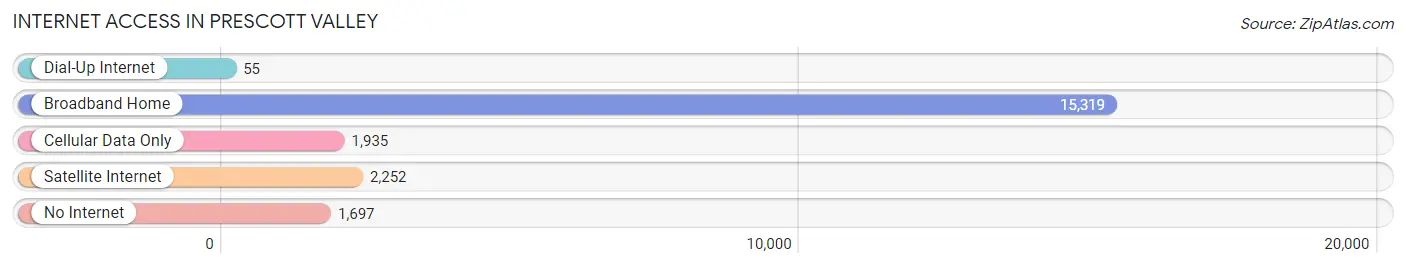
| Internet Type | # Households | % Households |
| Dial-Up Internet | 55 | 0.3% |
| Broadband Home | 15,319 | 77.5% |
| Cellular Data Only | 1,935 | 9.8% |
| Satellite Internet | 2,252 | 11.4% |
| No Internet | 1,697 | 8.6% |
| Total | 19,773 | 100.0% |
Prescott Valley Summary
Prescott Valley, Arizona is a town located in Yavapai County, Arizona. It is situated in the central part of the state, approximately 90 miles north of Phoenix. The town is located in the Bradshaw Mountains, and is surrounded by the Prescott National Forest. The town has a population of approximately 45,000 people, making it the second largest town in Yavapai County.
History
Prescott Valley was first settled in the late 1800s by ranchers and farmers. The town was originally known as Lonesome Valley, and was later renamed to Prescott Valley in the early 1900s. The town was officially incorporated in 1978, and has since grown to become the second largest town in Yavapai County.
Geography
Prescott Valley is located in the Bradshaw Mountains, and is surrounded by the Prescott National Forest. The town is situated at an elevation of 5,000 feet, and has an average annual temperature of 64 degrees Fahrenheit. The town is located approximately 90 miles north of Phoenix, and is accessible via Interstate 17.
Economy
Prescott Valley’s economy is largely based on tourism and retail. The town is home to several large retail stores, including Walmart, Target, and Home Depot. The town is also home to several restaurants, bars, and hotels. The town is also home to several manufacturing companies, including a large paper mill.
Demographics
As of the 2010 census, Prescott Valley had a population of 45,000 people. The town has a median household income of $50,000, and a median age of 38. The town is predominantly white, with approximately 75% of the population identifying as Caucasian. The town also has a large Hispanic population, with approximately 20% of the population identifying as Hispanic or Latino.
Conclusion
Prescott Valley, Arizona is a town located in Yavapai County, Arizona. It is situated in the central part of the state, approximately 90 miles north of Phoenix. The town is located in the Bradshaw Mountains, and is surrounded by the Prescott National Forest. The town has a population of approximately 45,000 people, making it the second largest town in Yavapai County. The town’s economy is largely based on tourism and retail, and the town is home to several large retail stores, restaurants, bars, and hotels. The town is predominantly white, with approximately 75% of the population identifying as Caucasian. The town also has a large Hispanic population, with approximately 20% of the population identifying as Hispanic or Latino.
Common Questions
What is Per Capita Income in Prescott Valley?
Per Capita income in Prescott Valley is $33,949.
What is the Median Family Income in Prescott Valley?
Median Family Income in Prescott Valley is $76,915.
What is the Median Household income in Prescott Valley?
Median Household Income in Prescott Valley is $66,617.
What is Income or Wage Gap in Prescott Valley?
Income or Wage Gap in Prescott Valley is 28.3%.
Women in Prescott Valley earn 71.7 cents for every dollar earned by a man.
What is Family Income Deficit in Prescott Valley?
Family Income Deficit in Prescott Valley is $8,565.
Families that are below poverty line in Prescott Valley earn $8,565 less on average than the poverty threshold level.
What is Inequality or Gini Index in Prescott Valley?
Inequality or Gini Index in Prescott Valley is 0.39.
What is the Total Population of Prescott Valley?
Total Population of Prescott Valley is 47,015.
What is the Total Male Population of Prescott Valley?
Total Male Population of Prescott Valley is 23,062.
What is the Total Female Population of Prescott Valley?
Total Female Population of Prescott Valley is 23,953.
What is the Ratio of Males per 100 Females in Prescott Valley?
There are 96.28 Males per 100 Females in Prescott Valley.
What is the Ratio of Females per 100 Males in Prescott Valley?
There are 103.86 Females per 100 Males in Prescott Valley.
What is the Median Population Age in Prescott Valley?
Median Population Age in Prescott Valley is 47.7 Years.
What is the Average Family Size in Prescott Valley
Average Family Size in Prescott Valley is 2.8 People.
What is the Average Household Size in Prescott Valley
Average Household Size in Prescott Valley is 2.4 People.
How Large is the Labor Force in Prescott Valley?
There are 21,266 People in the Labor Forcein in Prescott Valley.
What is the Percentage of People in the Labor Force in Prescott Valley?
54.3% of People are in the Labor Force in Prescott Valley.
What is the Unemployment Rate in Prescott Valley?
Unemployment Rate in Prescott Valley is 4.2%.