Rock Point, AZ Map & Demographics
Rock Point Map
Rock Point Overview
$15,640
PER CAPITA INCOME
$52,188
AVG FAMILY INCOME
$42,000
AVG HOUSEHOLD INCOME
0.4%
WAGE / INCOME GAP [ % ]
99.6¢/ $1
WAGE / INCOME GAP [ $ ]
0.47
INEQUALITY / GINI INDEX
489
TOTAL POPULATION
271
MALE POPULATION
218
FEMALE POPULATION
124.31
MALES / 100 FEMALES
80.44
FEMALES / 100 MALES
32.1
MEDIAN AGE
4.7
AVG FAMILY SIZE
3.3
AVG HOUSEHOLD SIZE
145
LABOR FORCE [ PEOPLE ]
42.8%
PERCENT IN LABOR FORCE
9.0%
UNEMPLOYMENT RATE
Rock Point Zip Codes
Rock Point Area Codes
Income in Rock Point
Income Overview in Rock Point
Per Capita Income in Rock Point is $15,640, while median incomes of families and households are $52,188 and $42,000 respectively.
| Characteristic | Number | Measure |
| Per Capita Income | 489 | $15,640 |
| Median Family Income | 89 | $52,188 |
| Mean Family Income | 89 | $54,063 |
| Median Household Income | 148 | $42,000 |
| Mean Household Income | 148 | $47,086 |
| Income Deficit | 89 | $0 |
| Wage / Income Gap (%) | 489 | 0.42% |
| Wage / Income Gap ($) | 489 | 99.58¢ per $1 |
| Gini / Inequality Index | 489 | 0.47 |
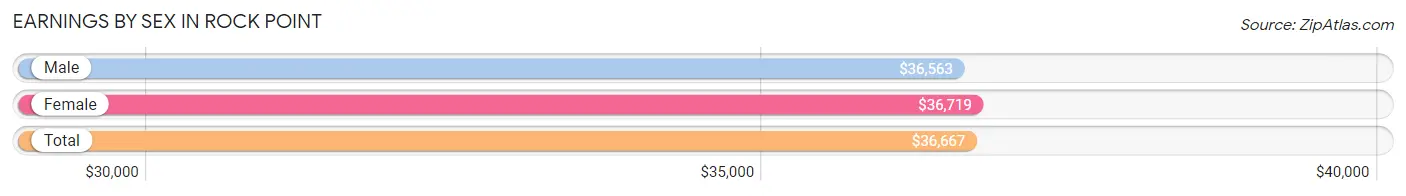
Earnings by Sex in Rock Point
Average Earnings in Rock Point are $36,667, $36,563 for men and $36,719 for women, a difference of 0.4%.
| Sex | Number | Average Earnings |
| Male | 85 (51.8%) | $36,563 |
| Female | 79 (48.2%) | $36,719 |
| Total | 164 (100.0%) | $36,667 |
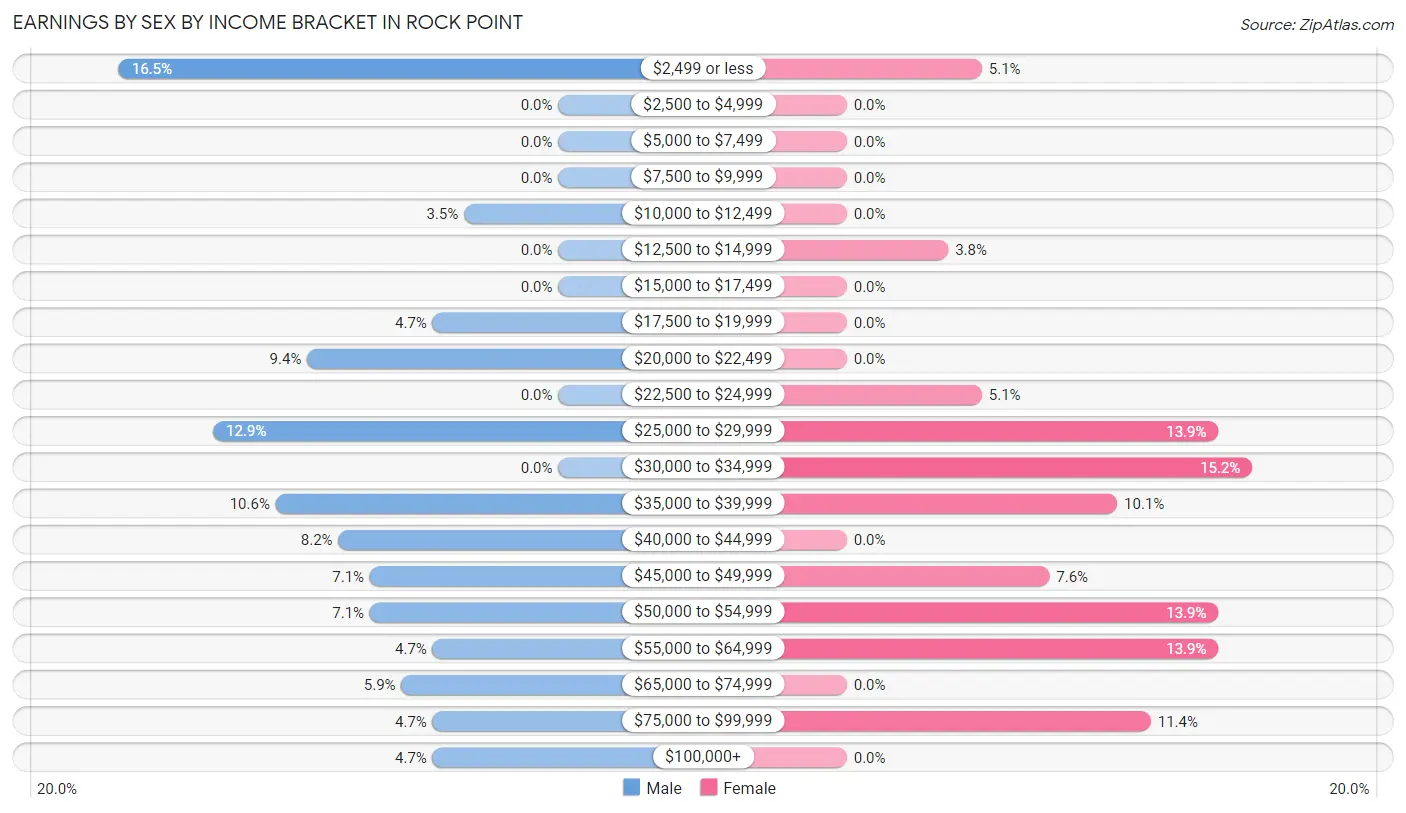
Earnings by Sex by Income Bracket in Rock Point
The most common earnings brackets in Rock Point are $2,499 or less for men (14 | 16.5%) and $30,000 to $34,999 for women (12 | 15.2%).
| Income | Male | Female |
| $2,499 or less | 14 (16.5%) | 4 (5.1%) |
| $2,500 to $4,999 | 0 (0.0%) | 0 (0.0%) |
| $5,000 to $7,499 | 0 (0.0%) | 0 (0.0%) |
| $7,500 to $9,999 | 0 (0.0%) | 0 (0.0%) |
| $10,000 to $12,499 | 3 (3.5%) | 0 (0.0%) |
| $12,500 to $14,999 | 0 (0.0%) | 3 (3.8%) |
| $15,000 to $17,499 | 0 (0.0%) | 0 (0.0%) |
| $17,500 to $19,999 | 4 (4.7%) | 0 (0.0%) |
| $20,000 to $22,499 | 8 (9.4%) | 0 (0.0%) |
| $22,500 to $24,999 | 0 (0.0%) | 4 (5.1%) |
| $25,000 to $29,999 | 11 (12.9%) | 11 (13.9%) |
| $30,000 to $34,999 | 0 (0.0%) | 12 (15.2%) |
| $35,000 to $39,999 | 9 (10.6%) | 8 (10.1%) |
| $40,000 to $44,999 | 7 (8.2%) | 0 (0.0%) |
| $45,000 to $49,999 | 6 (7.1%) | 6 (7.6%) |
| $50,000 to $54,999 | 6 (7.1%) | 11 (13.9%) |
| $55,000 to $64,999 | 4 (4.7%) | 11 (13.9%) |
| $65,000 to $74,999 | 5 (5.9%) | 0 (0.0%) |
| $75,000 to $99,999 | 4 (4.7%) | 9 (11.4%) |
| $100,000+ | 4 (4.7%) | 0 (0.0%) |
| Total | 85 (100.0%) | 79 (100.0%) |
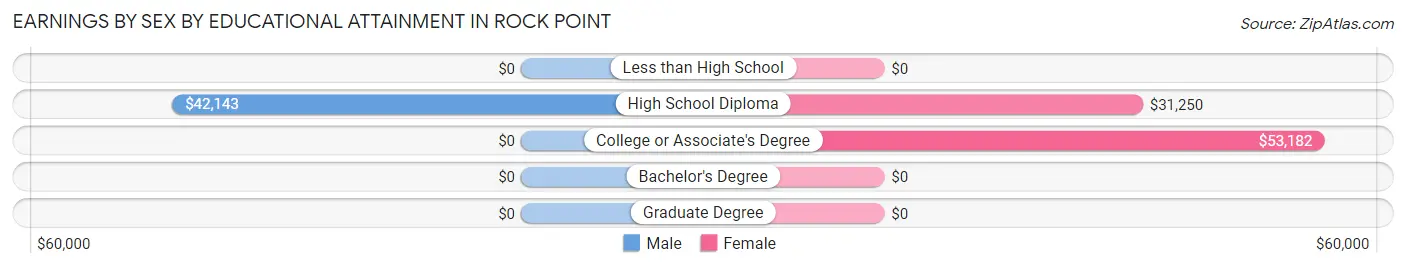
Earnings by Sex by Educational Attainment in Rock Point
Average earnings in Rock Point are $40,893 for men and $36,719 for women, a difference of 10.2%. Men with an educational attainment of high school diploma enjoy the highest average annual earnings of $42,143, while those with high school diploma education earn the least with $42,143. Women with an educational attainment of college or associate's degree earn the most with the average annual earnings of $53,182, while those with high school diploma education have the smallest earnings of $31,250.
| Educational Attainment | Male Income | Female Income |
| Less than High School | - | - |
| High School Diploma | $42,143 | $31,250 |
| College or Associate's Degree | - | - |
| Bachelor's Degree | - | - |
| Graduate Degree | - | - |
| Total | $40,893 | $36,719 |
Family Income in Rock Point
Family Income Brackets in Rock Point
According to the Rock Point family income data, there are 21 families falling into the $75,000 to $99,999 income range, which is the most common income bracket and makes up 23.6% of all families.
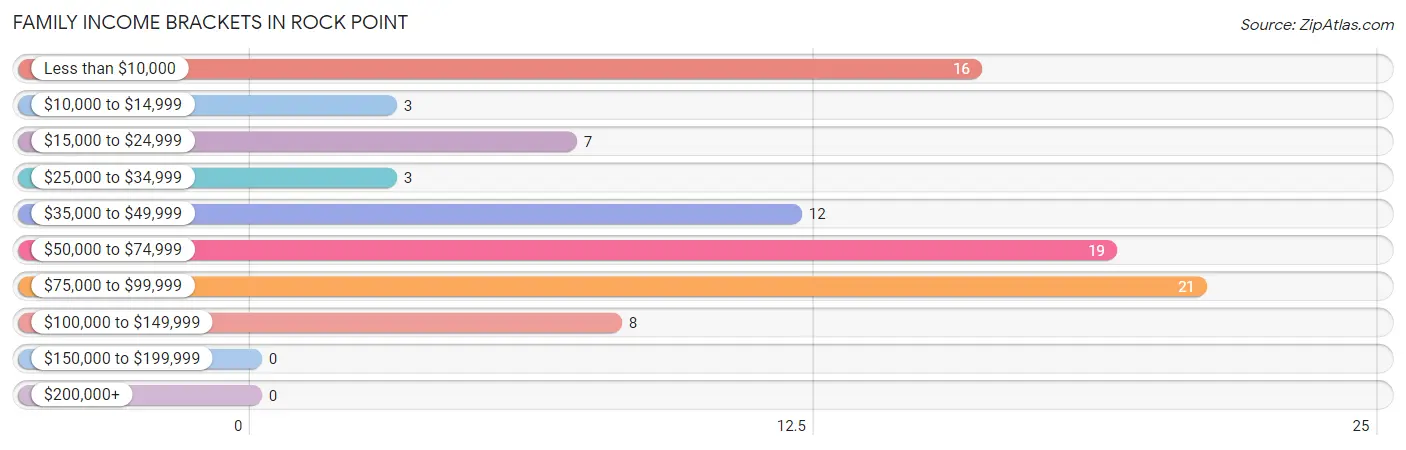
| Income Bracket | # Families | % Families |
| Less than $10,000 | 16 | 18.0% |
| $10,000 to $14,999 | 3 | 3.4% |
| $15,000 to $24,999 | 7 | 7.9% |
| $25,000 to $34,999 | 3 | 3.4% |
| $35,000 to $49,999 | 12 | 13.5% |
| $50,000 to $74,999 | 19 | 21.3% |
| $75,000 to $99,999 | 21 | 23.6% |
| $100,000 to $149,999 | 8 | 9.0% |
| $150,000 to $199,999 | 0 | 0.0% |
| $200,000+ | 0 | 0.0% |
Family Income by Famaliy Size in Rock Point
2-person families (28 | 31.5%) account for the highest median family income in Rock Point with $51,875 per family, while 2-person families (28 | 31.5%) have the highest median income of $25,938 per family member.
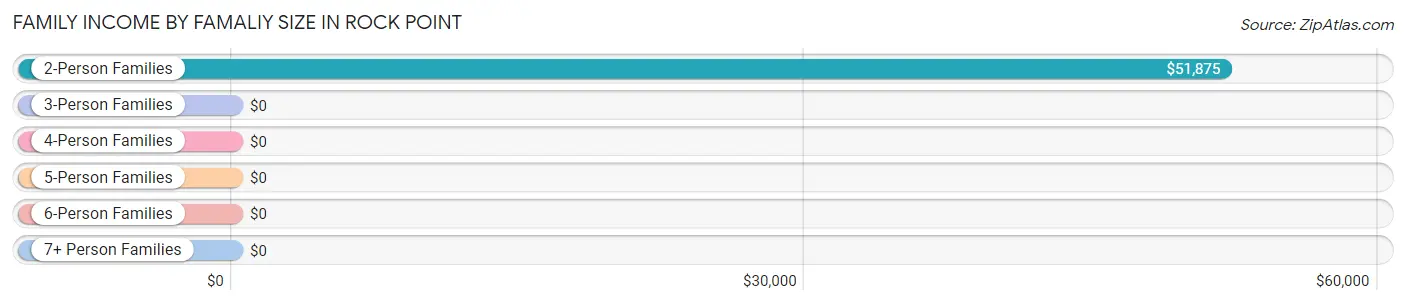
| Income Bracket | # Families | Median Income |
| 2-Person Families | 28 (31.5%) | $51,875 |
| 3-Person Families | 26 (29.2%) | $0 |
| 4-Person Families | 4 (4.5%) | $0 |
| 5-Person Families | 19 (21.3%) | $0 |
| 6-Person Families | 7 (7.9%) | $0 |
| 7+ Person Families | 5 (5.6%) | $0 |
| Total | 89 (100.0%) | $52,188 |
Family Income by Number of Earners in Rock Point
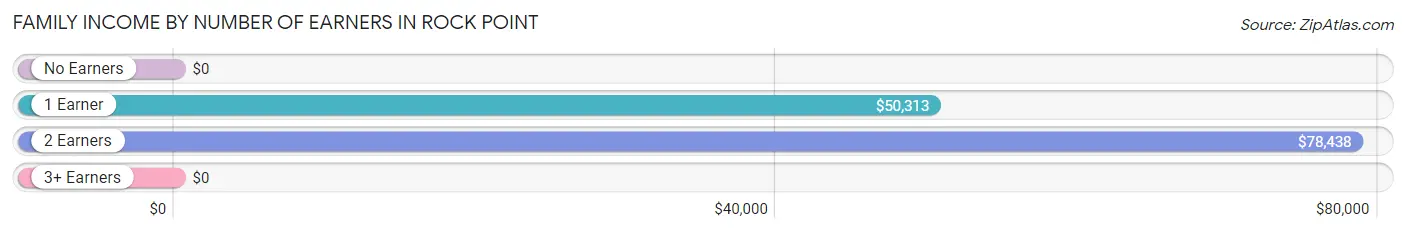
| Number of Earners | # Families | Median Income |
| No Earners | 22 (24.7%) | $0 |
| 1 Earner | 35 (39.3%) | $50,313 |
| 2 Earners | 23 (25.8%) | $78,438 |
| 3+ Earners | 9 (10.1%) | $0 |
| Total | 89 (100.0%) | $52,188 |
Household Income in Rock Point
Household Income Brackets in Rock Point
With 31 households falling in the category, the $50,000 to $74,999 income range is the most frequent in Rock Point, accounting for 20.9% of all households.
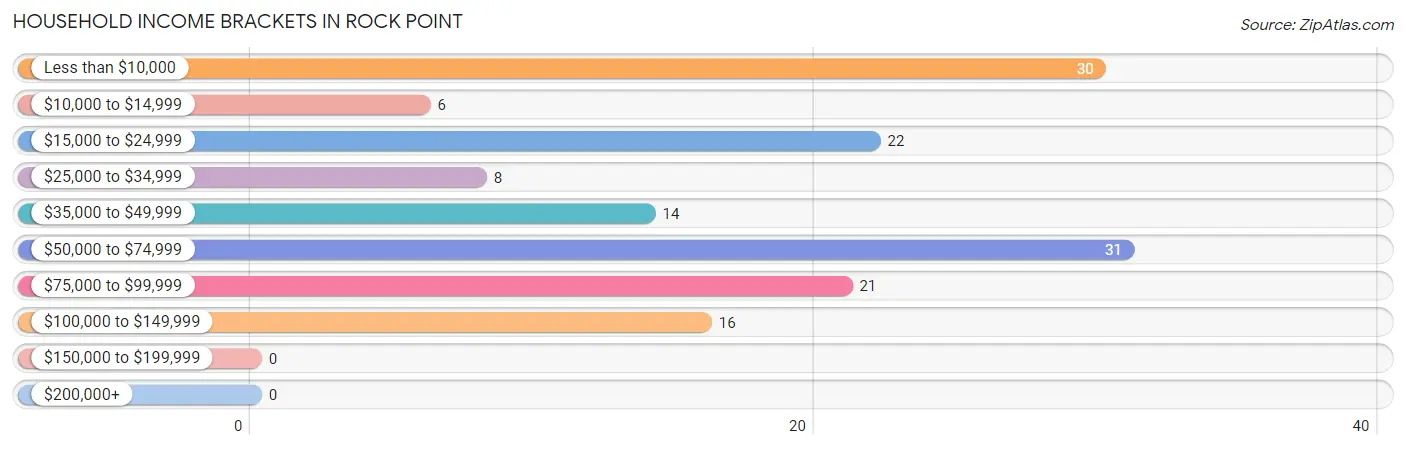
| Income Bracket | # Households | % Households |
| Less than $10,000 | 30 | 20.3% |
| $10,000 to $14,999 | 6 | 4.1% |
| $15,000 to $24,999 | 22 | 14.9% |
| $25,000 to $34,999 | 8 | 5.4% |
| $35,000 to $49,999 | 14 | 9.5% |
| $50,000 to $74,999 | 31 | 20.9% |
| $75,000 to $99,999 | 21 | 14.2% |
| $100,000 to $149,999 | 16 | 10.8% |
| $150,000 to $199,999 | 0 | 0.0% |
| $200,000+ | 0 | 0.0% |
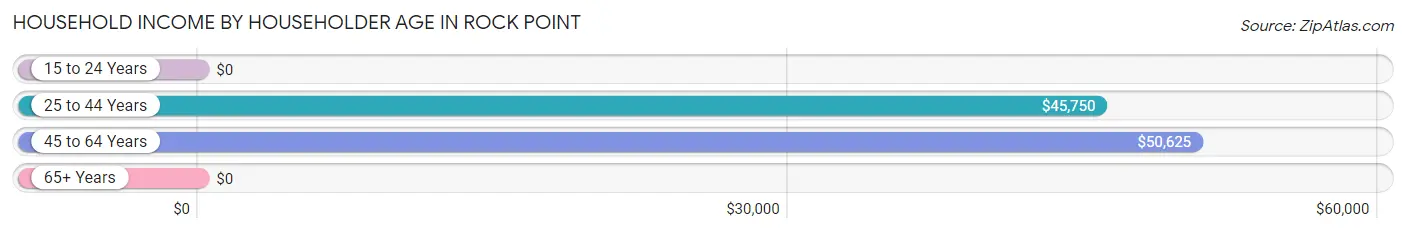
Household Income by Householder Age in Rock Point
The median household income in Rock Point is $42,000, with the highest median household income of $50,625 found in the 45 to 64 years age bracket for the primary householder. A total of 66 households (44.6%) fall into this category. Meanwhile, the 15 to 24 years age bracket for the primary householder has the lowest median household income of $0, with 4 households (2.7%) in this group.
| Income Bracket | # Households | Median Income |
| 15 to 24 Years | 4 (2.7%) | $0 |
| 25 to 44 Years | 45 (30.4%) | $45,750 |
| 45 to 64 Years | 66 (44.6%) | $50,625 |
| 65+ Years | 33 (22.3%) | $0 |
| Total | 148 (100.0%) | $42,000 |
Poverty in Rock Point
Income Below Poverty by Sex and Age in Rock Point
With 47.6% poverty level for males and 42.2% for females among the residents of Rock Point, 12 to 14 year old males and 5 year old females are the most vulnerable to poverty, with 21 males (77.8%) and 4 females (100.0%) in their respective age groups living below the poverty level.
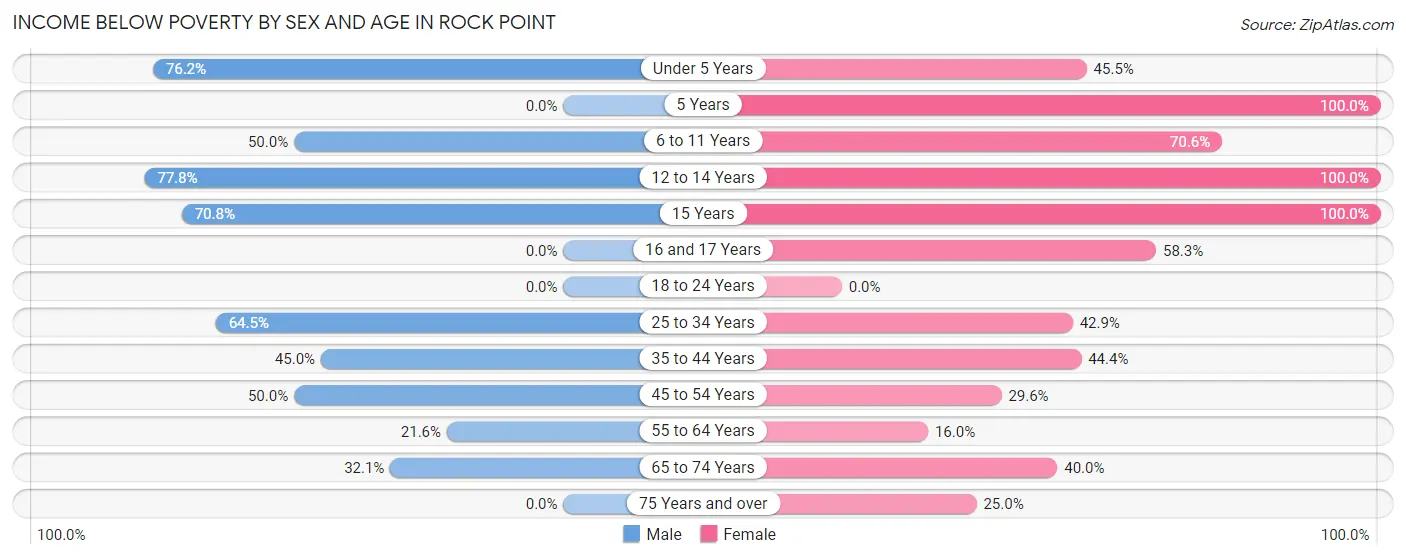
| Age Bracket | Male | Female |
| Under 5 Years | 16 (76.2%) | 5 (45.5%) |
| 5 Years | 0 (0.0%) | 4 (100.0%) |
| 6 to 11 Years | 17 (50.0%) | 12 (70.6%) |
| 12 to 14 Years | 21 (77.8%) | 6 (100.0%) |
| 15 Years | 17 (70.8%) | 6 (100.0%) |
| 16 and 17 Years | 0 (0.0%) | 7 (58.3%) |
| 18 to 24 Years | 0 (0.0%) | 0 (0.0%) |
| 25 to 34 Years | 20 (64.5%) | 12 (42.9%) |
| 35 to 44 Years | 9 (45.0%) | 20 (44.4%) |
| 45 to 54 Years | 12 (50.0%) | 8 (29.6%) |
| 55 to 64 Years | 8 (21.6%) | 4 (16.0%) |
| 65 to 74 Years | 9 (32.1%) | 6 (40.0%) |
| 75 Years and over | 0 (0.0%) | 2 (25.0%) |
| Total | 129 (47.6%) | 92 (42.2%) |
Income Above Poverty by Sex and Age in Rock Point
According to the poverty statistics in Rock Point, males aged 16 and 17 years and females aged 18 to 24 years are the age groups that are most secure financially, with 100.0% of males and 100.0% of females in these age groups living above the poverty line.
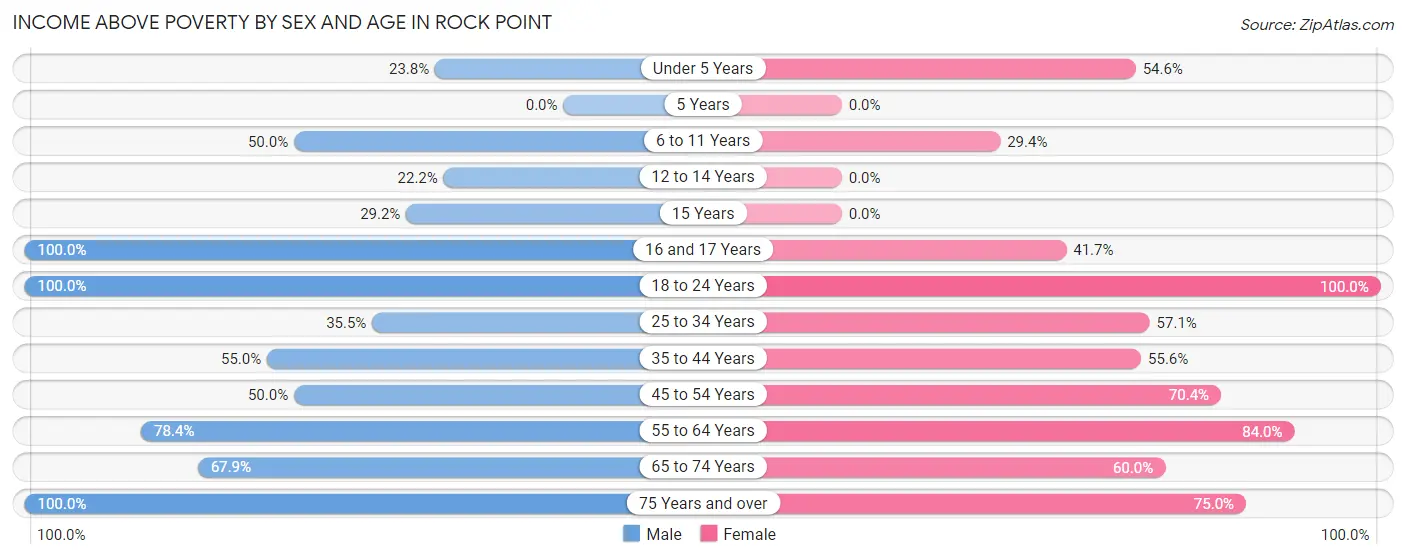
| Age Bracket | Male | Female |
| Under 5 Years | 5 (23.8%) | 6 (54.5%) |
| 5 Years | 0 (0.0%) | 0 (0.0%) |
| 6 to 11 Years | 17 (50.0%) | 5 (29.4%) |
| 12 to 14 Years | 6 (22.2%) | 0 (0.0%) |
| 15 Years | 7 (29.2%) | 0 (0.0%) |
| 16 and 17 Years | 4 (100.0%) | 5 (41.7%) |
| 18 to 24 Years | 18 (100.0%) | 14 (100.0%) |
| 25 to 34 Years | 11 (35.5%) | 16 (57.1%) |
| 35 to 44 Years | 11 (55.0%) | 25 (55.6%) |
| 45 to 54 Years | 12 (50.0%) | 19 (70.4%) |
| 55 to 64 Years | 29 (78.4%) | 21 (84.0%) |
| 65 to 74 Years | 19 (67.9%) | 9 (60.0%) |
| 75 Years and over | 3 (100.0%) | 6 (75.0%) |
| Total | 142 (52.4%) | 126 (57.8%) |
Income Below Poverty Among Married-Couple Families in Rock Point
The poverty statistics for married-couple families in Rock Point show that 27.9% or 17 of the total 61 families live below the poverty line. Families with 3 or 4 children have the highest poverty rate of 100.0%, comprising of 8 families. On the other hand, families with 1 or 2 children have the lowest poverty rate of 0.0%, which includes 0 families.
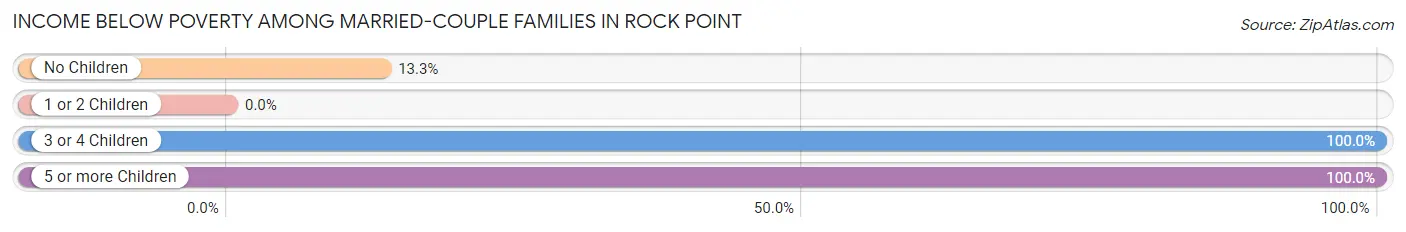
| Children | Above Poverty | Below Poverty |
| No Children | 26 (86.7%) | 4 (13.3%) |
| 1 or 2 Children | 18 (100.0%) | 0 (0.0%) |
| 3 or 4 Children | 0 (0.0%) | 8 (100.0%) |
| 5 or more Children | 0 (0.0%) | 5 (100.0%) |
| Total | 44 (72.1%) | 17 (27.9%) |
Income Below Poverty Among Single-Parent Households in Rock Point
According to the poverty data in Rock Point, 50.0% or 4 single-father households and 50.0% or 10 single-mother households are living below the poverty line. Among single-father households, those with no children have the highest poverty rate, with 4 households (50.0%) experiencing poverty. Likewise, among single-mother households, those with 3 or 4 children have the highest poverty rate, with 4 households (100.0%) falling below the poverty line.
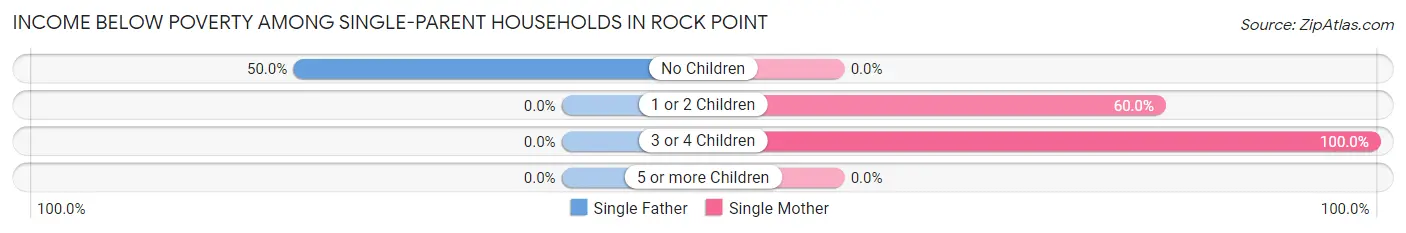
| Children | Single Father | Single Mother |
| No Children | 4 (50.0%) | 0 (0.0%) |
| 1 or 2 Children | 0 (0.0%) | 6 (60.0%) |
| 3 or 4 Children | 0 (0.0%) | 4 (100.0%) |
| 5 or more Children | 0 (0.0%) | 0 (0.0%) |
| Total | 4 (50.0%) | 10 (50.0%) |
Income Below Poverty Among Married-Couple vs Single-Parent Households in Rock Point
The poverty data for Rock Point shows that 17 of the married-couple family households (27.9%) and 14 of the single-parent households (50.0%) are living below the poverty level. Within the married-couple family households, those with 3 or 4 children have the highest poverty rate, with 8 households (100.0%) falling below the poverty line. Among the single-parent households, those with 3 or 4 children have the highest poverty rate, with 4 household (100.0%) living below poverty.
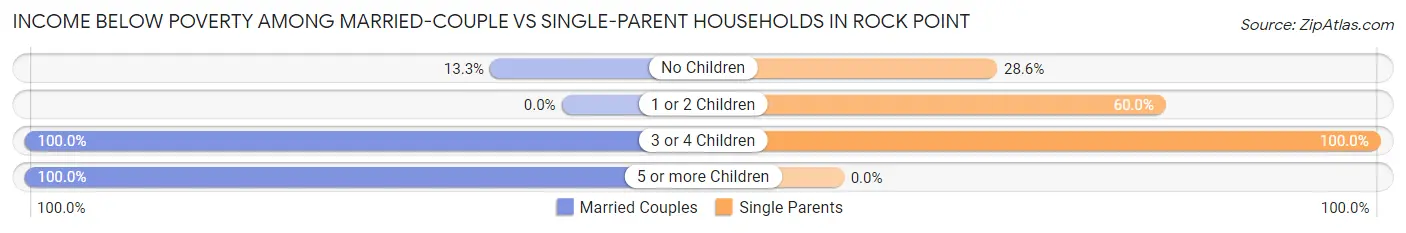
| Children | Married-Couple Families | Single-Parent Households |
| No Children | 4 (13.3%) | 4 (28.6%) |
| 1 or 2 Children | 0 (0.0%) | 6 (60.0%) |
| 3 or 4 Children | 8 (100.0%) | 4 (100.0%) |
| 5 or more Children | 5 (100.0%) | 0 (0.0%) |
| Total | 17 (27.9%) | 14 (50.0%) |
Race in Rock Point
The most populous races in Rock Point are Native / Alaskan (466 | 95.3%), Asian (17 | 3.5%), and Two or more Races (6 | 1.2%).
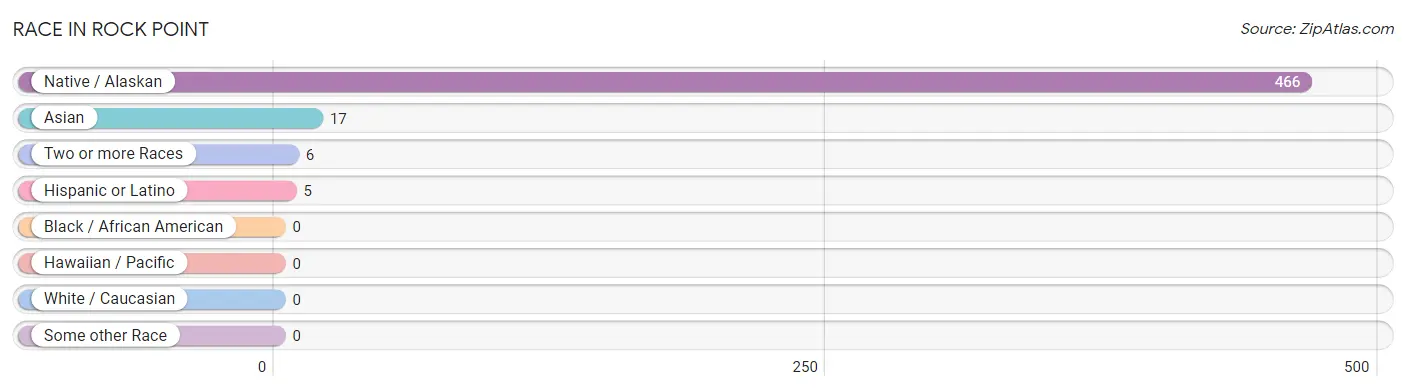
| Race | # Population | % Population |
| Asian | 17 | 3.5% |
| Black / African American | 0 | 0.0% |
| Hawaiian / Pacific | 0 | 0.0% |
| Hispanic or Latino | 5 | 1.0% |
| Native / Alaskan | 466 | 95.3% |
| White / Caucasian | 0 | 0.0% |
| Two or more Races | 6 | 1.2% |
| Some other Race | 0 | 0.0% |
| Total | 489 | 100.0% |
Ancestry in Rock Point
The most populous ancestries reported in Rock Point are Navajo (468 | 95.7%), Thai (17 | 3.5%), Korean (4 | 0.8%), Central American (3 | 0.6%), and Panamanian (3 | 0.6%), together accounting for 101.2% of all Rock Point residents.
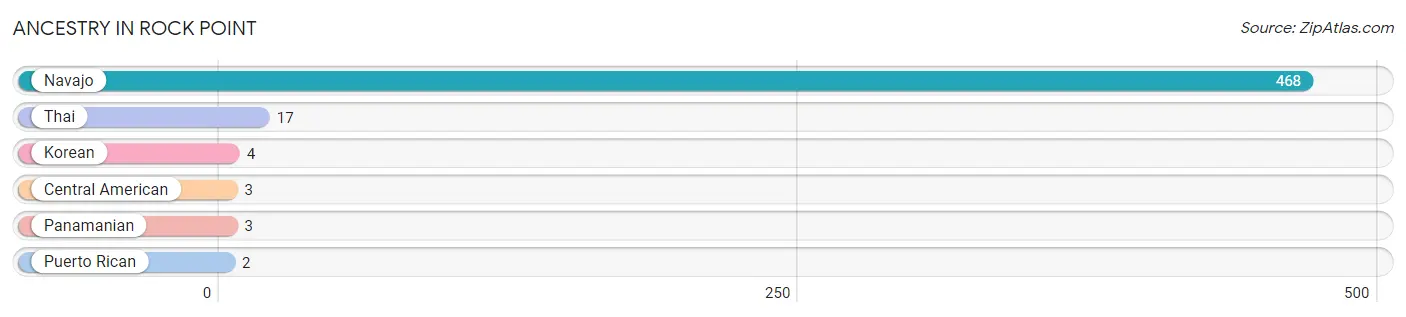
| Ancestry | # Population | % Population |
| Central American | 3 | 0.6% |
| Korean | 4 | 0.8% |
| Navajo | 468 | 95.7% |
| Panamanian | 3 | 0.6% |
| Puerto Rican | 2 | 0.4% |
| Thai | 17 | 3.5% | View All 6 Rows |
Immigrants in Rock Point
The most numerous immigrant groups reported in Rock Point came from Asia (21 | 4.3%), India (17 | 3.5%), South Central Asia (17 | 3.5%), Philippines (4 | 0.8%), and South Eastern Asia (4 | 0.8%), together accounting for 12.9% of all Rock Point residents.
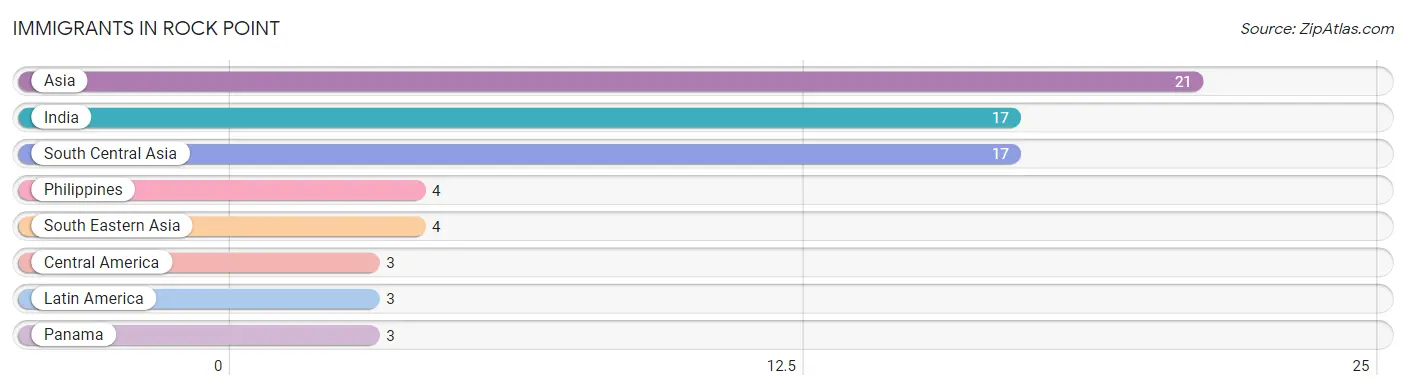
| Immigration Origin | # Population | % Population |
| Asia | 21 | 4.3% |
| Central America | 3 | 0.6% |
| India | 17 | 3.5% |
| Latin America | 3 | 0.6% |
| Panama | 3 | 0.6% |
| Philippines | 4 | 0.8% |
| South Central Asia | 17 | 3.5% |
| South Eastern Asia | 4 | 0.8% | View All 8 Rows |
Sex and Age in Rock Point
Sex and Age in Rock Point
The most populous age groups in Rock Point are 10 to 14 Years (51 | 18.8%) for men and 35 to 39 Years (37 | 17.0%) for women.
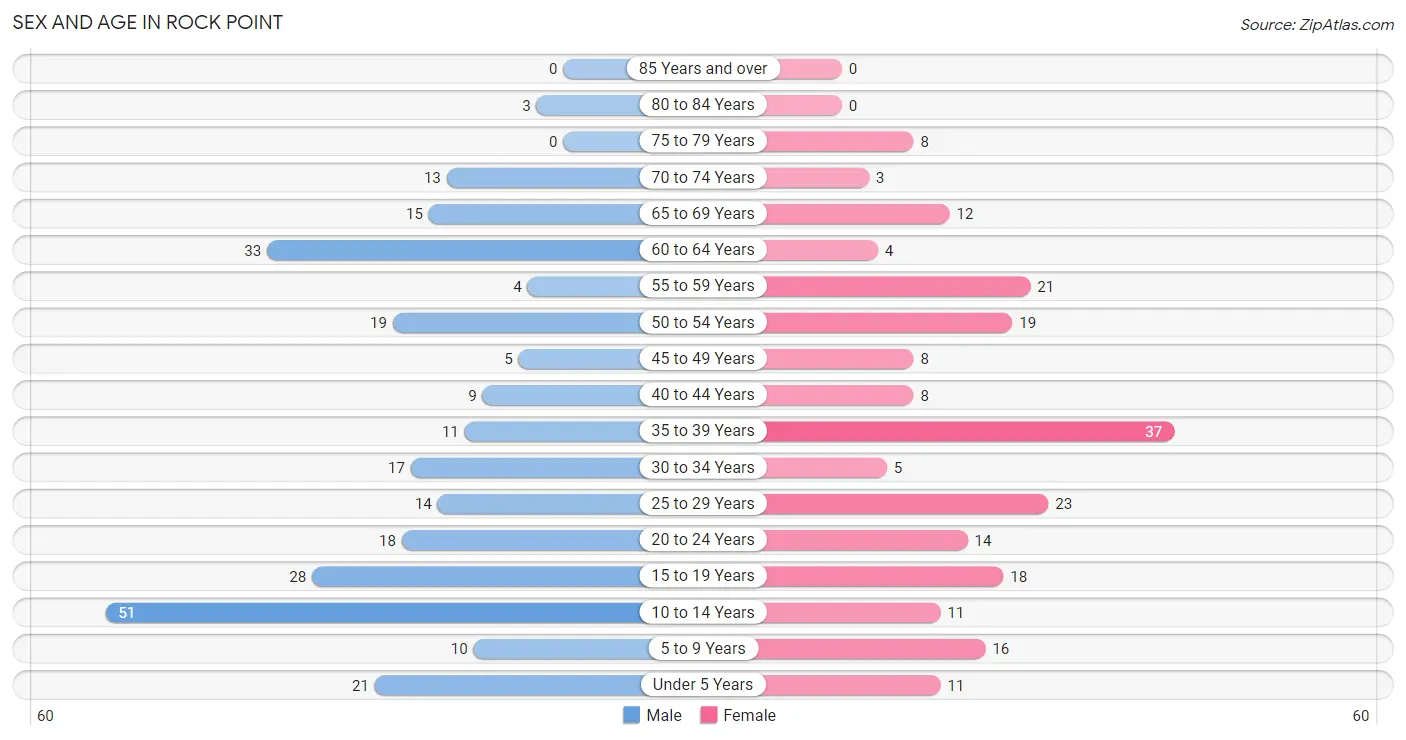
| Age Bracket | Male | Female |
| Under 5 Years | 21 (7.7%) | 11 (5.1%) |
| 5 to 9 Years | 10 (3.7%) | 16 (7.3%) |
| 10 to 14 Years | 51 (18.8%) | 11 (5.1%) |
| 15 to 19 Years | 28 (10.3%) | 18 (8.3%) |
| 20 to 24 Years | 18 (6.6%) | 14 (6.4%) |
| 25 to 29 Years | 14 (5.2%) | 23 (10.5%) |
| 30 to 34 Years | 17 (6.3%) | 5 (2.3%) |
| 35 to 39 Years | 11 (4.1%) | 37 (17.0%) |
| 40 to 44 Years | 9 (3.3%) | 8 (3.7%) |
| 45 to 49 Years | 5 (1.8%) | 8 (3.7%) |
| 50 to 54 Years | 19 (7.0%) | 19 (8.7%) |
| 55 to 59 Years | 4 (1.5%) | 21 (9.6%) |
| 60 to 64 Years | 33 (12.2%) | 4 (1.8%) |
| 65 to 69 Years | 15 (5.5%) | 12 (5.5%) |
| 70 to 74 Years | 13 (4.8%) | 3 (1.4%) |
| 75 to 79 Years | 0 (0.0%) | 8 (3.7%) |
| 80 to 84 Years | 3 (1.1%) | 0 (0.0%) |
| 85 Years and over | 0 (0.0%) | 0 (0.0%) |
| Total | 271 (100.0%) | 218 (100.0%) |
Families and Households in Rock Point
Median Family Size in Rock Point
The median family size in Rock Point is 4.69 persons per family, with single female/mother families (20 | 22.5%) accounting for the largest median family size of 5.65 persons per family. On the other hand, single male/father families (8 | 9.0%) represent the smallest median family size with 2.63 persons per family.
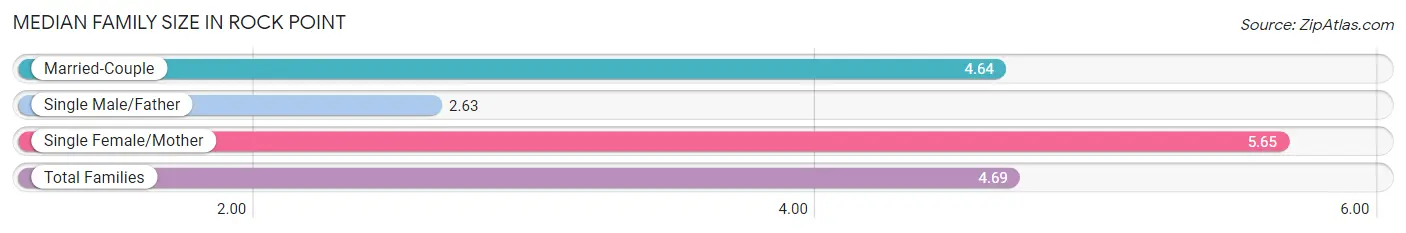
| Family Type | # Families | Family Size |
| Married-Couple | 61 (68.5%) | 4.64 |
| Single Male/Father | 8 (9.0%) | 2.63 |
| Single Female/Mother | 20 (22.5%) | 5.65 |
| Total Families | 89 (100.0%) | 4.69 |
Median Household Size in Rock Point
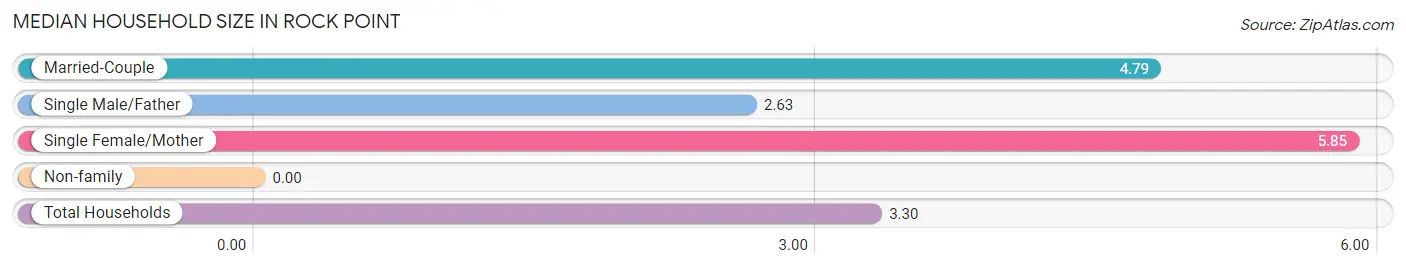
| Household Type | # Households | Household Size |
| Married-Couple | 61 (41.2%) | 4.79 |
| Single Male/Father | 8 (5.4%) | 2.63 |
| Single Female/Mother | 20 (13.5%) | 5.85 |
| Non-family | 59 (39.9%) | - |
| Total Households | 148 (100.0%) | 3.30 |
Household Size by Marriage Status in Rock Point
Out of a total of 148 households in Rock Point, 89 (60.1%) are family households, while 59 (39.9%) are nonfamily households. The most numerous type of family households are 2-person households, comprising 28, and the most common type of nonfamily households are 1-person households, comprising 59.
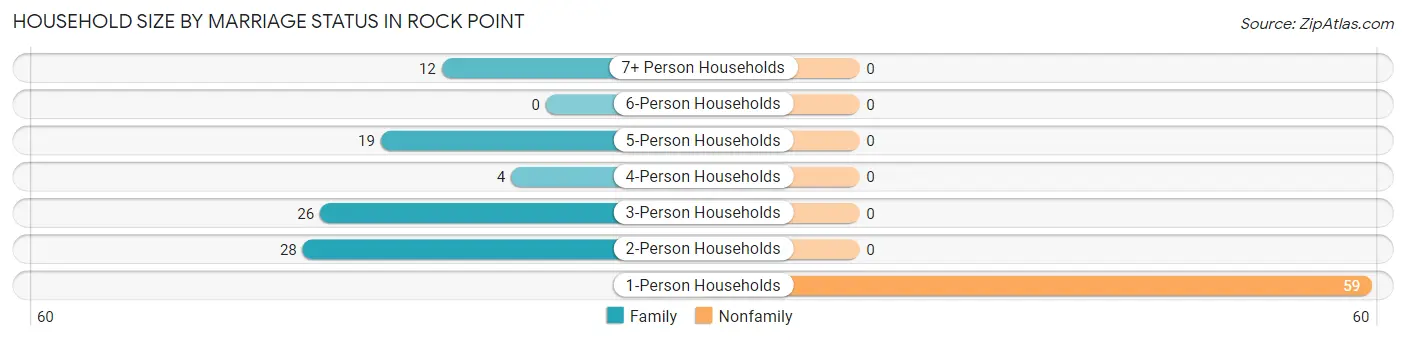
| Household Size | Family Households | Nonfamily Households |
| 1-Person Households | - | 59 (39.9%) |
| 2-Person Households | 28 (18.9%) | 0 (0.0%) |
| 3-Person Households | 26 (17.6%) | 0 (0.0%) |
| 4-Person Households | 4 (2.7%) | 0 (0.0%) |
| 5-Person Households | 19 (12.8%) | 0 (0.0%) |
| 6-Person Households | 0 (0.0%) | 0 (0.0%) |
| 7+ Person Households | 12 (8.1%) | 0 (0.0%) |
| Total | 89 (60.1%) | 59 (39.9%) |
Female Fertility in Rock Point
Fertility by Age in Rock Point
| Age Bracket | Women with Births | Births / 1,000 Women |
| 15 to 19 years | 0 (0.0%) | 0.0 |
| 20 to 34 years | 0 (0.0%) | 0.0 |
| 35 to 50 years | 0 (0.0%) | 0.0 |
| Total | 0 (0.0%) | 0.0 |
Fertility by Age by Marriage Status in Rock Point
| Age Bracket | Married | Unmarried |
| 15 to 19 years | 0 (0.0%) | 0 (0.0%) |
| 20 to 34 years | 0 (0.0%) | 0 (0.0%) |
| 35 to 50 years | 0 (0.0%) | 0 (0.0%) |
| Total | 0 (0.0%) | 0 (0.0%) |
Fertility by Education in Rock Point
| Educational Attainment | Women with Births | Births / 1,000 Women |
| Less than High School | 0 (0.0%) | 0.0 |
| High School Diploma | 0 (0.0%) | 0.0 |
| College or Associate's Degree | 0 (0.0%) | 0.0 |
| Bachelor's Degree | 0 (0.0%) | 0.0 |
| Graduate Degree | 0 (0.0%) | 0.0 |
| Total | 0 (0.0%) | 0.0 |
Fertility by Education by Marriage Status in Rock Point
| Educational Attainment | Married | Unmarried |
| Less than High School | 0 (0.0%) | 0 (0.0%) |
| High School Diploma | 0 (0.0%) | 0 (0.0%) |
| College or Associate's Degree | 0 (0.0%) | 0 (0.0%) |
| Bachelor's Degree | 0 (0.0%) | 0 (0.0%) |
| Graduate Degree | 0 (0.0%) | 0 (0.0%) |
| Total | 0 (0.0%) | 0 (0.0%) |
Employment Characteristics in Rock Point
Employment by Class of Employer in Rock Point
Among the 132 employed individuals in Rock Point, private company employees (58 | 43.9%), local government employees (45 | 34.1%), and state government employees (13 | 9.9%) make up the most common classes of employment.
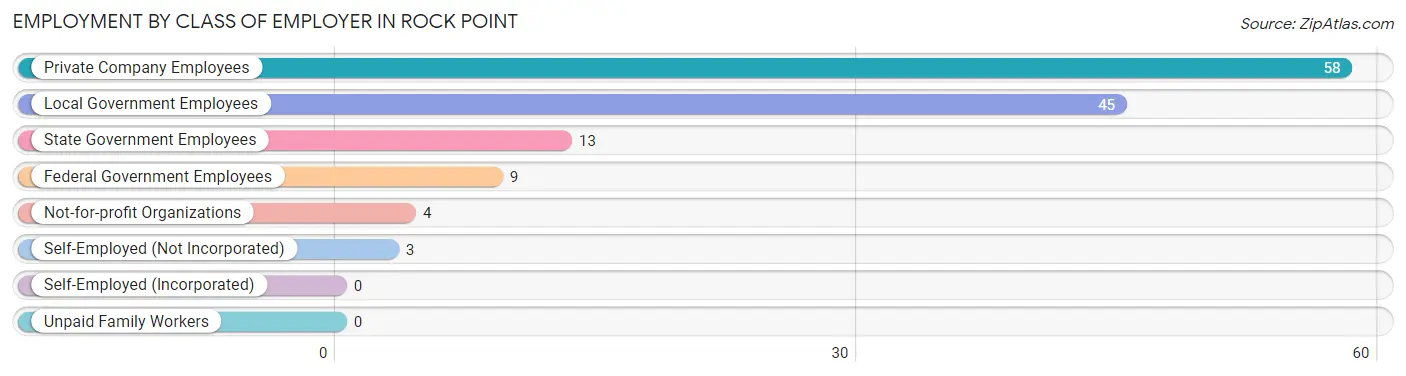
| Employer Class | # Employees | % Employees |
| Private Company Employees | 58 | 43.9% |
| Self-Employed (Incorporated) | 0 | 0.0% |
| Self-Employed (Not Incorporated) | 3 | 2.3% |
| Not-for-profit Organizations | 4 | 3.0% |
| Local Government Employees | 45 | 34.1% |
| State Government Employees | 13 | 9.9% |
| Federal Government Employees | 9 | 6.8% |
| Unpaid Family Workers | 0 | 0.0% |
| Total | 132 | 100.0% |
Employment Status by Age in Rock Point
According to the labor force statistics for Rock Point, out of the total population over 16 years of age (339), 42.8% or 145 individuals are in the labor force, with 9.0% or 13 of them unemployed. The age group with the highest labor force participation rate is 45 to 54 years, with 74.5% or 38 individuals in the labor force. Within the labor force, the 30 to 34 years age range has the highest percentage of unemployed individuals, with 66.7% or 4 of them being unemployed.
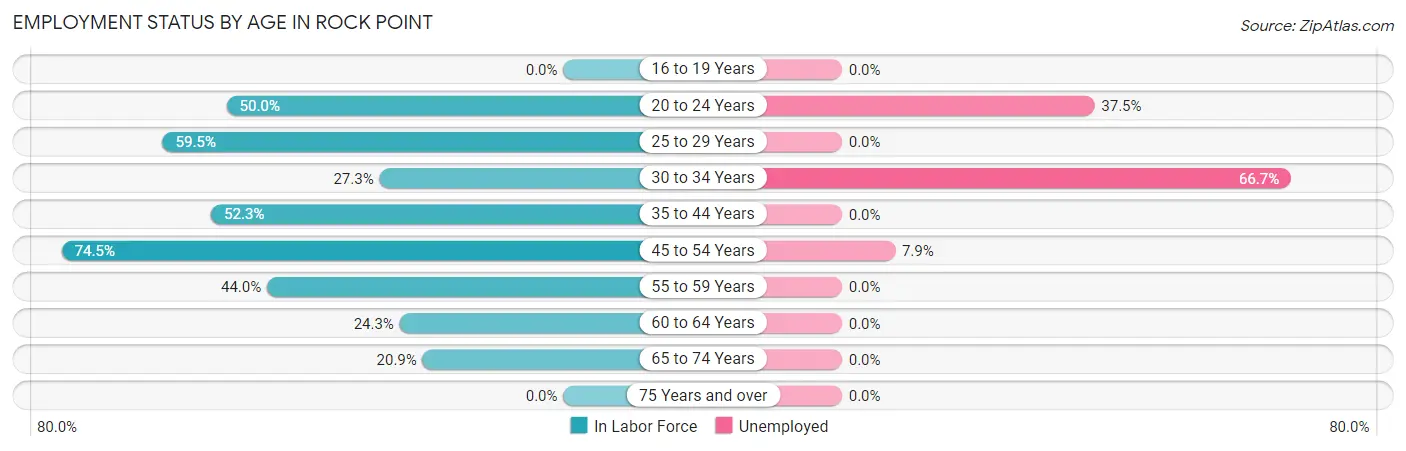
| Age Bracket | In Labor Force | Unemployed |
| 16 to 19 Years | 0 (0.0%) | 0 (0.0%) |
| 20 to 24 Years | 16 (50.0%) | 6 (37.5%) |
| 25 to 29 Years | 22 (59.5%) | 0 (0.0%) |
| 30 to 34 Years | 6 (27.3%) | 4 (66.7%) |
| 35 to 44 Years | 34 (52.3%) | 0 (0.0%) |
| 45 to 54 Years | 38 (74.5%) | 3 (7.9%) |
| 55 to 59 Years | 11 (44.0%) | 0 (0.0%) |
| 60 to 64 Years | 9 (24.3%) | 0 (0.0%) |
| 65 to 74 Years | 9 (20.9%) | 0 (0.0%) |
| 75 Years and over | 0 (0.0%) | 0 (0.0%) |
| Total | 145 (42.8%) | 13 (9.0%) |
Employment Status by Educational Attainment in Rock Point
According to labor force statistics for Rock Point, 50.6% of individuals (120) out of the total population between 25 and 64 years of age (237) are in the labor force, with 5.8% or 7 of them being unemployed. The group with the highest labor force participation rate are those with the educational attainment of bachelor's degree or higher, with 68.2% or 15 individuals in the labor force. Within the labor force, individuals with college / associate degree education have the highest percentage of unemployment, with 13.5% or 7 of them being unemployed.
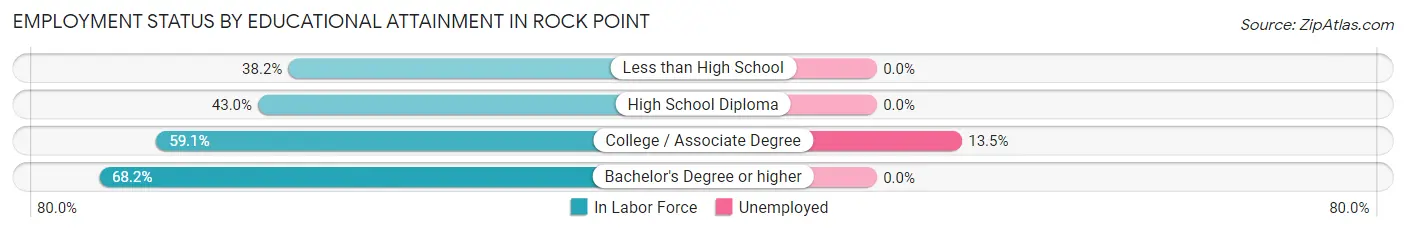
| Educational Attainment | In Labor Force | Unemployed |
| Less than High School | 13 (38.2%) | 0 (0.0%) |
| High School Diploma | 40 (43.0%) | 0 (0.0%) |
| College / Associate Degree | 52 (59.1%) | 12 (13.5%) |
| Bachelor's Degree or higher | 15 (68.2%) | 0 (0.0%) |
| Total | 120 (50.6%) | 14 (5.8%) |
Employment Occupations by Sex in Rock Point
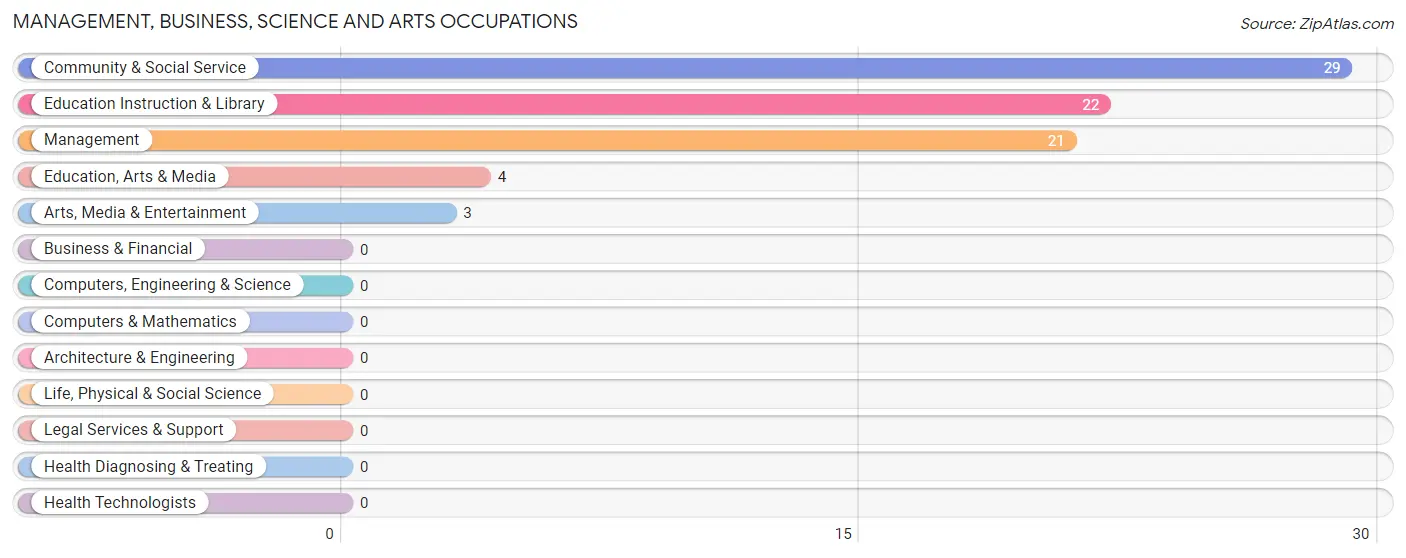
Management, Business, Science and Arts Occupations
The most common Management, Business, Science and Arts occupations in Rock Point are Community & Social Service (29 | 22.0%), Education Instruction & Library (22 | 16.7%), Management (21 | 15.9%), Education, Arts & Media (4 | 3.0%), and Arts, Media & Entertainment (3 | 2.3%).
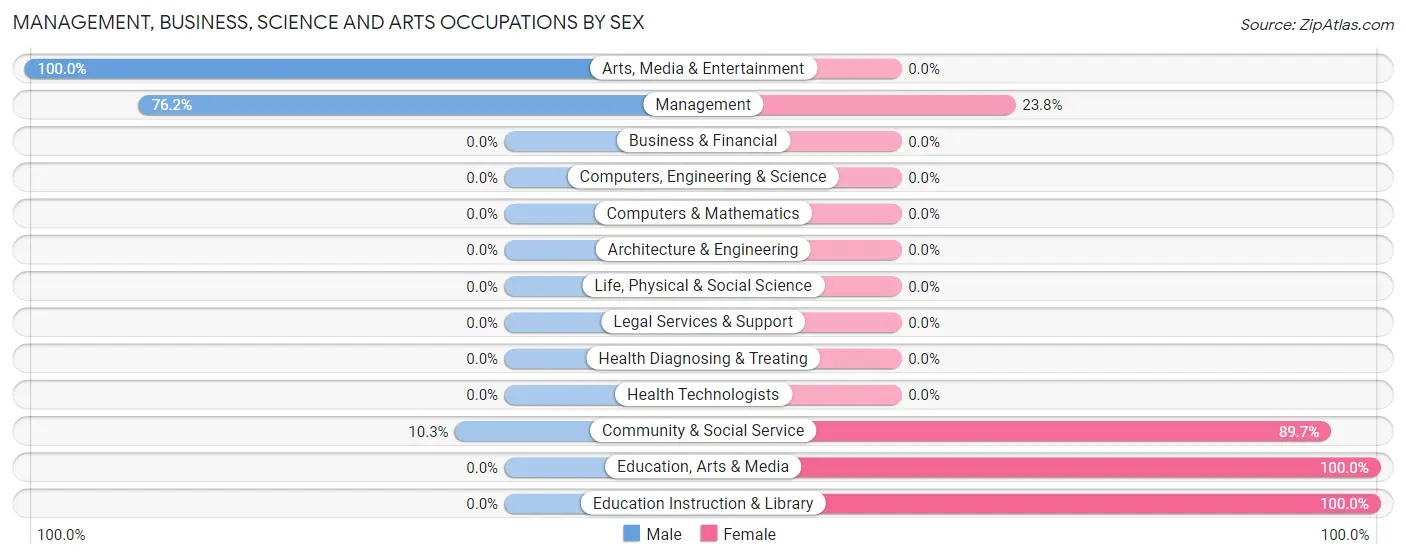
Management, Business, Science and Arts Occupations by Sex
Within the Management, Business, Science and Arts occupations in Rock Point, the most male-oriented occupations are Arts, Media & Entertainment (100.0%), Management (76.2%), and Community & Social Service (10.3%), while the most female-oriented occupations are Education, Arts & Media (100.0%), Education Instruction & Library (100.0%), and Community & Social Service (89.7%).
| Occupation | Male | Female |
| Management | 16 (76.2%) | 5 (23.8%) |
| Business & Financial | 0 (0.0%) | 0 (0.0%) |
| Computers, Engineering & Science | 0 (0.0%) | 0 (0.0%) |
| Computers & Mathematics | 0 (0.0%) | 0 (0.0%) |
| Architecture & Engineering | 0 (0.0%) | 0 (0.0%) |
| Life, Physical & Social Science | 0 (0.0%) | 0 (0.0%) |
| Community & Social Service | 3 (10.3%) | 26 (89.7%) |
| Education, Arts & Media | 0 (0.0%) | 4 (100.0%) |
| Legal Services & Support | 0 (0.0%) | 0 (0.0%) |
| Education Instruction & Library | 0 (0.0%) | 22 (100.0%) |
| Arts, Media & Entertainment | 3 (100.0%) | 0 (0.0%) |
| Health Diagnosing & Treating | 0 (0.0%) | 0 (0.0%) |
| Health Technologists | 0 (0.0%) | 0 (0.0%) |
| Total (Category) | 19 (38.0%) | 31 (62.0%) |
| Total (Overall) | 64 (48.5%) | 68 (51.5%) |
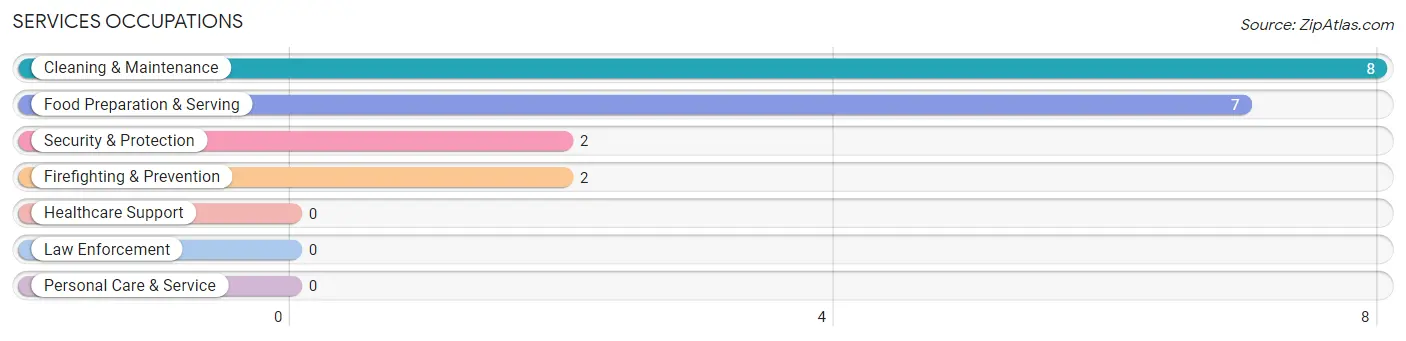
Services Occupations
The most common Services occupations in Rock Point are Cleaning & Maintenance (8 | 6.1%), Food Preparation & Serving (7 | 5.3%), Security & Protection (2 | 1.5%), and Firefighting & Prevention (2 | 1.5%).
Services Occupations by Sex
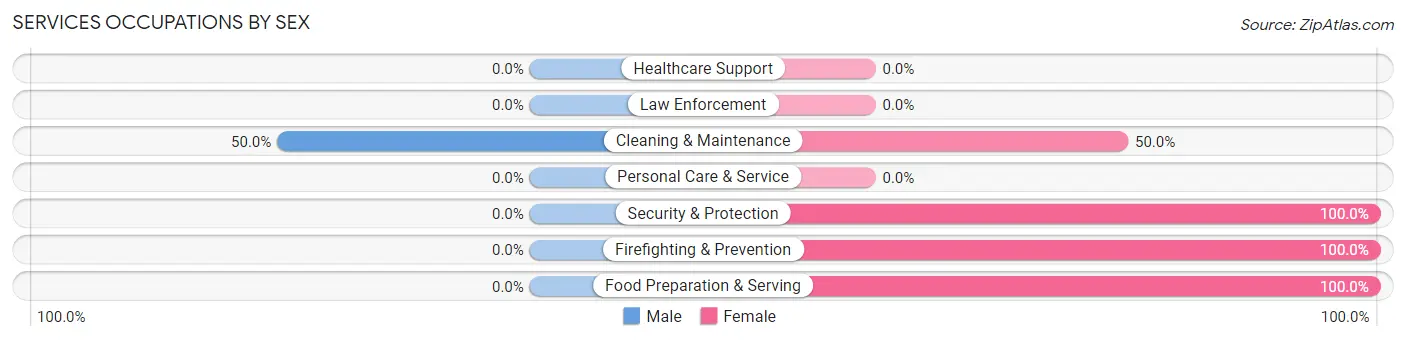
| Occupation | Male | Female |
| Healthcare Support | 0 (0.0%) | 0 (0.0%) |
| Security & Protection | 0 (0.0%) | 2 (100.0%) |
| Firefighting & Prevention | 0 (0.0%) | 2 (100.0%) |
| Law Enforcement | 0 (0.0%) | 0 (0.0%) |
| Food Preparation & Serving | 0 (0.0%) | 7 (100.0%) |
| Cleaning & Maintenance | 4 (50.0%) | 4 (50.0%) |
| Personal Care & Service | 0 (0.0%) | 0 (0.0%) |
| Total (Category) | 4 (23.5%) | 13 (76.5%) |
| Total (Overall) | 64 (48.5%) | 68 (51.5%) |
Sales and Office Occupations
The most common Sales and Office occupations in Rock Point are Office & Administration (4 | 3.0%), and Sales & Related (3 | 2.3%).
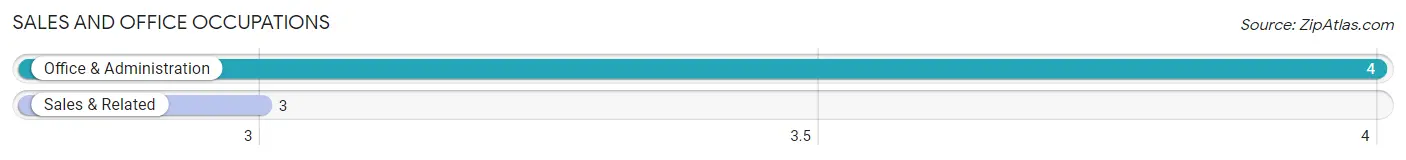
Sales and Office Occupations by Sex
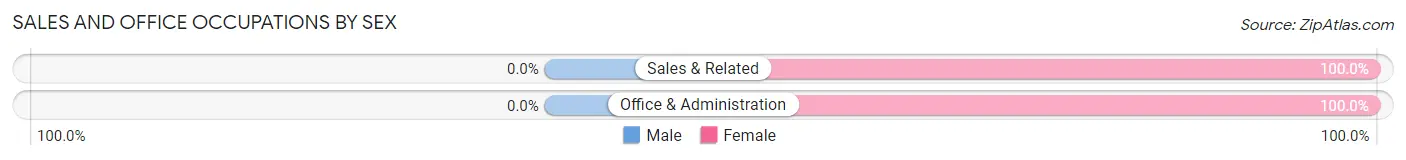
| Occupation | Male | Female |
| Sales & Related | 0 (0.0%) | 3 (100.0%) |
| Office & Administration | 0 (0.0%) | 4 (100.0%) |
| Total (Category) | 0 (0.0%) | 7 (100.0%) |
| Total (Overall) | 64 (48.5%) | 68 (51.5%) |
Natural Resources, Construction and Maintenance Occupations
The most common Natural Resources, Construction and Maintenance occupations in Rock Point are Construction & Extraction (35 | 26.5%), and Installation, Maintenance & Repair (10 | 7.6%).
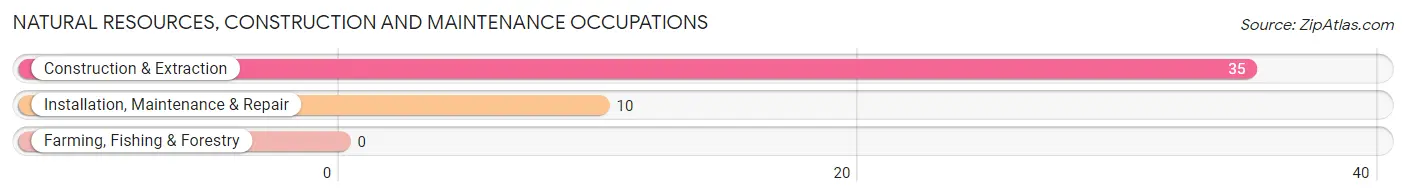
Natural Resources, Construction and Maintenance Occupations by Sex
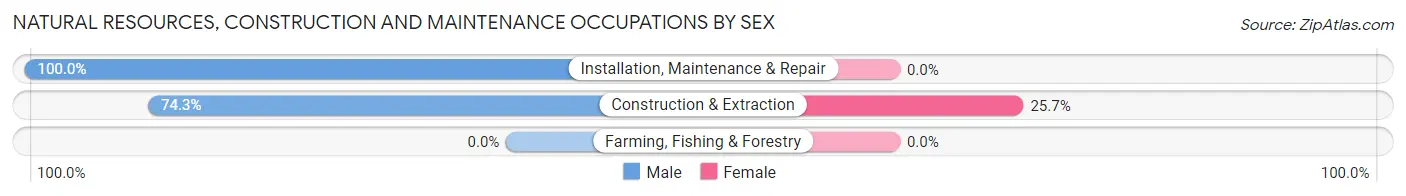
| Occupation | Male | Female |
| Farming, Fishing & Forestry | 0 (0.0%) | 0 (0.0%) |
| Construction & Extraction | 26 (74.3%) | 9 (25.7%) |
| Installation, Maintenance & Repair | 10 (100.0%) | 0 (0.0%) |
| Total (Category) | 36 (80.0%) | 9 (20.0%) |
| Total (Overall) | 64 (48.5%) | 68 (51.5%) |
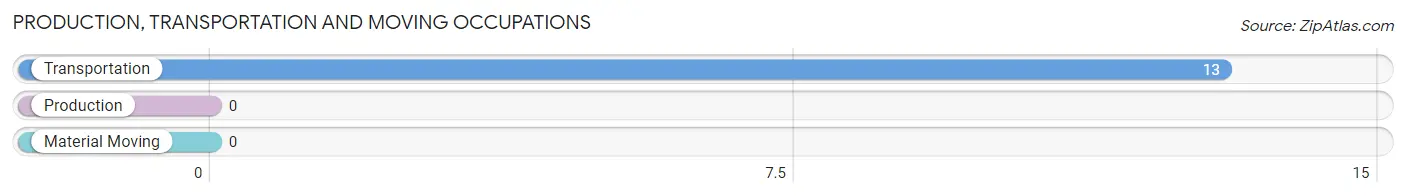
Production, Transportation and Moving Occupations
The most common Production, Transportation and Moving occupations in Rock Point are , and Transportation (13 | 9.9%).
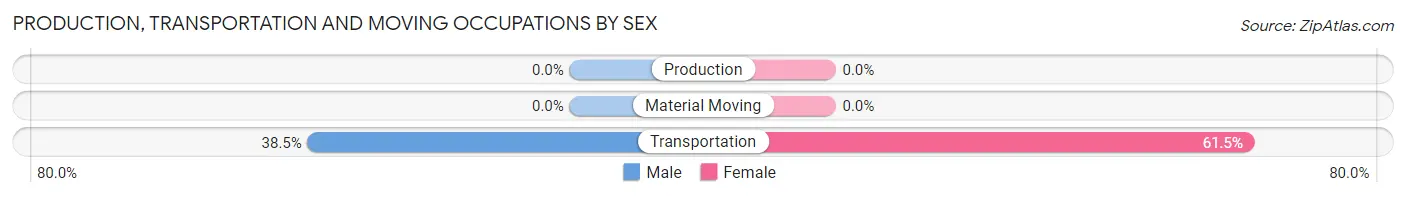
Production, Transportation and Moving Occupations by Sex
| Occupation | Male | Female |
| Production | 0 (0.0%) | 0 (0.0%) |
| Transportation | 5 (38.5%) | 8 (61.5%) |
| Material Moving | 0 (0.0%) | 0 (0.0%) |
| Total (Category) | 5 (38.5%) | 8 (61.5%) |
| Total (Overall) | 64 (48.5%) | 68 (51.5%) |
Employment Industries by Sex in Rock Point
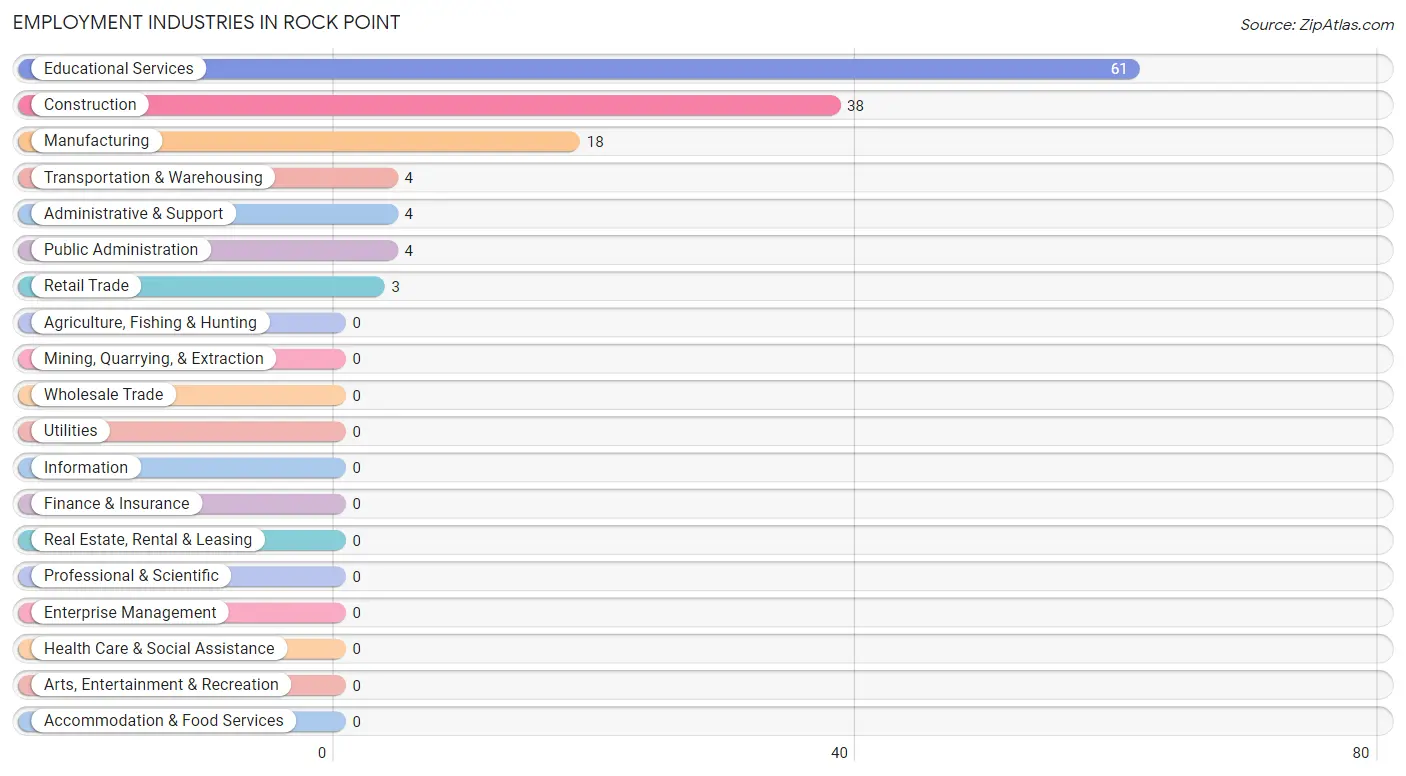
Employment Industries in Rock Point
The major employment industries in Rock Point include Educational Services (61 | 46.2%), Construction (38 | 28.8%), Manufacturing (18 | 13.6%), Transportation & Warehousing (4 | 3.0%), and Administrative & Support (4 | 3.0%).
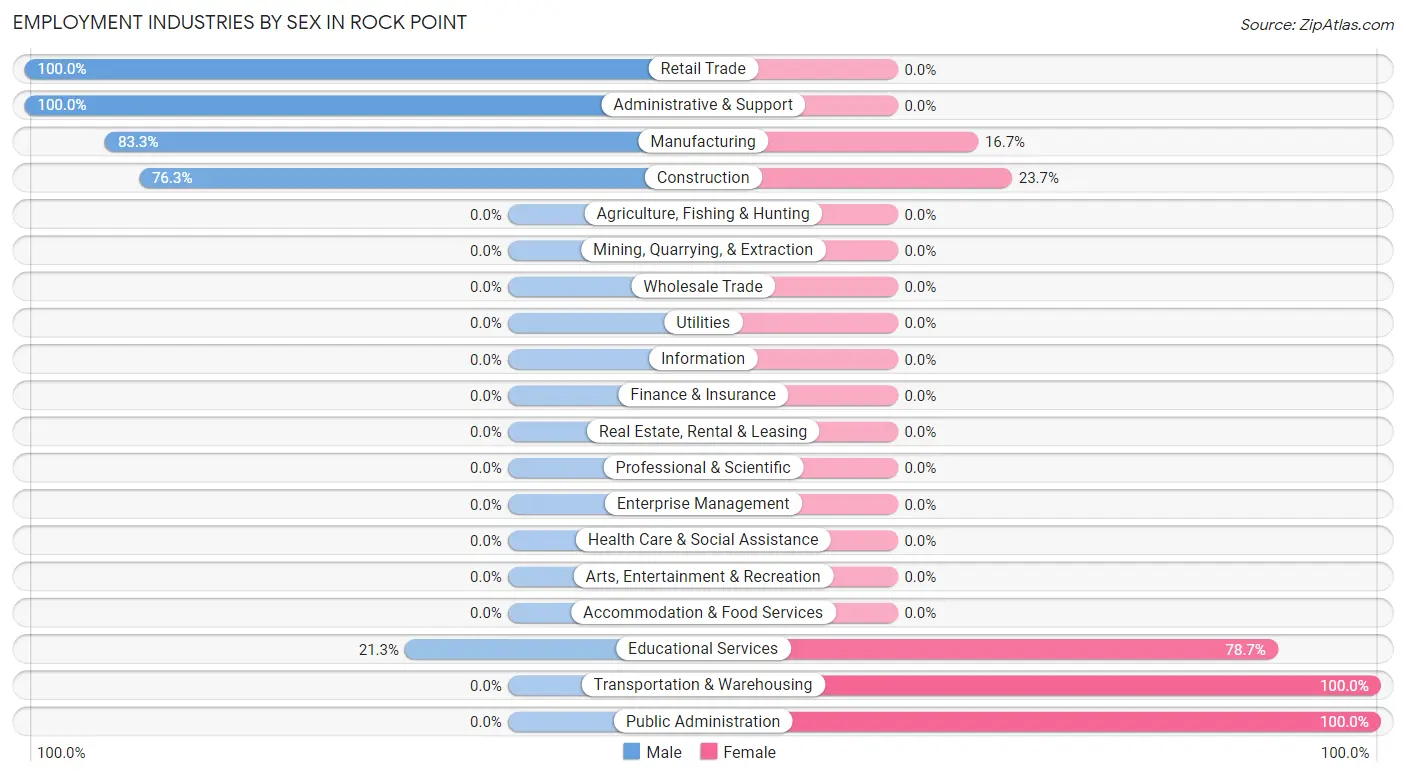
Employment Industries by Sex in Rock Point
The Rock Point industries that see more men than women are Retail Trade (100.0%), Administrative & Support (100.0%), and Manufacturing (83.3%), whereas the industries that tend to have a higher number of women are Transportation & Warehousing (100.0%), Public Administration (100.0%), and Educational Services (78.7%).
| Industry | Male | Female |
| Agriculture, Fishing & Hunting | 0 (0.0%) | 0 (0.0%) |
| Mining, Quarrying, & Extraction | 0 (0.0%) | 0 (0.0%) |
| Construction | 29 (76.3%) | 9 (23.7%) |
| Manufacturing | 15 (83.3%) | 3 (16.7%) |
| Wholesale Trade | 0 (0.0%) | 0 (0.0%) |
| Retail Trade | 3 (100.0%) | 0 (0.0%) |
| Transportation & Warehousing | 0 (0.0%) | 4 (100.0%) |
| Utilities | 0 (0.0%) | 0 (0.0%) |
| Information | 0 (0.0%) | 0 (0.0%) |
| Finance & Insurance | 0 (0.0%) | 0 (0.0%) |
| Real Estate, Rental & Leasing | 0 (0.0%) | 0 (0.0%) |
| Professional & Scientific | 0 (0.0%) | 0 (0.0%) |
| Enterprise Management | 0 (0.0%) | 0 (0.0%) |
| Administrative & Support | 4 (100.0%) | 0 (0.0%) |
| Educational Services | 13 (21.3%) | 48 (78.7%) |
| Health Care & Social Assistance | 0 (0.0%) | 0 (0.0%) |
| Arts, Entertainment & Recreation | 0 (0.0%) | 0 (0.0%) |
| Accommodation & Food Services | 0 (0.0%) | 0 (0.0%) |
| Public Administration | 0 (0.0%) | 4 (100.0%) |
| Total | 64 (48.5%) | 68 (51.5%) |
Education in Rock Point
School Enrollment in Rock Point
The most common levels of schooling among the 154 students in Rock Point are middle school (59 | 38.3%), high school (35 | 22.7%), and elementary school (29 | 18.8%).
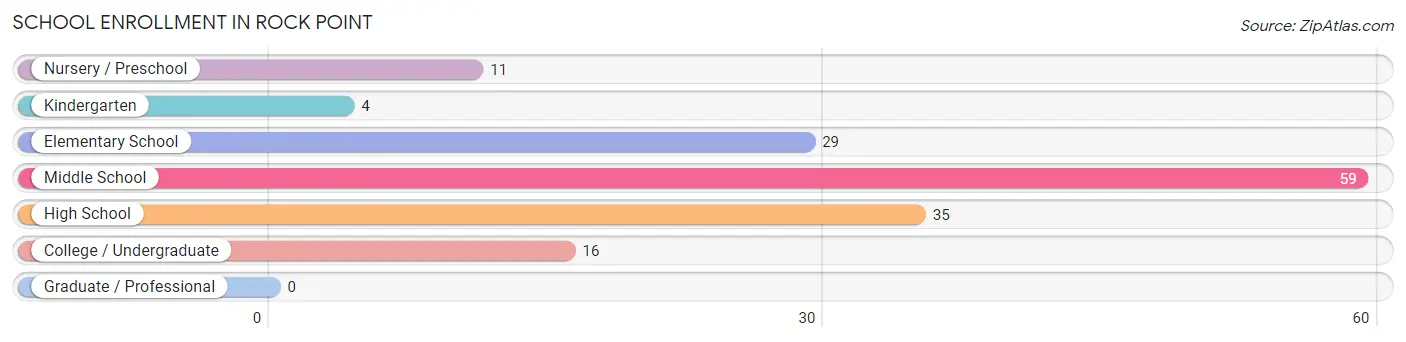
| School Level | # Students | % Students |
| Nursery / Preschool | 11 | 7.1% |
| Kindergarten | 4 | 2.6% |
| Elementary School | 29 | 18.8% |
| Middle School | 59 | 38.3% |
| High School | 35 | 22.7% |
| College / Undergraduate | 16 | 10.4% |
| Graduate / Professional | 0 | 0.0% |
| Total | 154 | 100.0% |
School Enrollment by Age by Funding Source in Rock Point
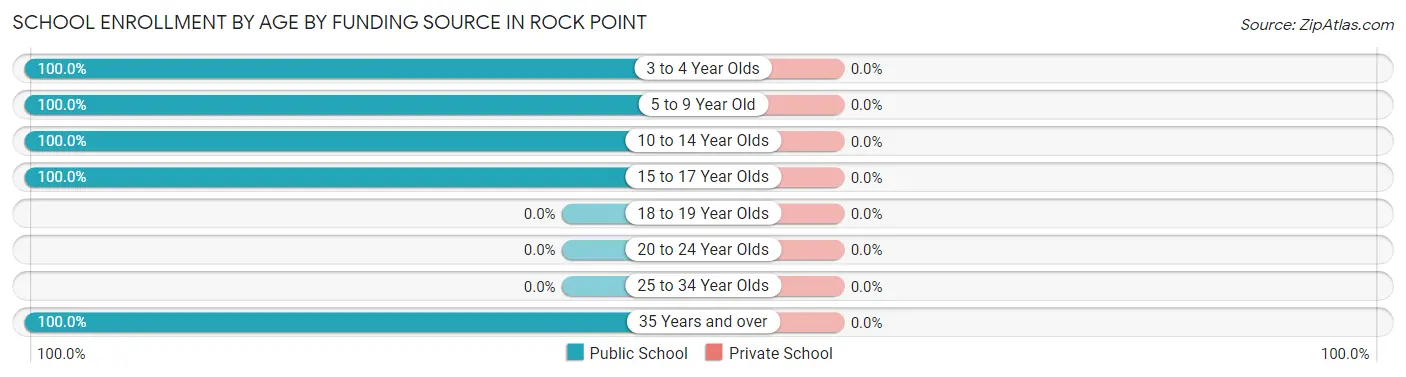
| Age Bracket | Public School | Private School |
| 3 to 4 Year Olds | 11 (100.0%) | 0 (0.0%) |
| 5 to 9 Year Old | 26 (100.0%) | 0 (0.0%) |
| 10 to 14 Year Olds | 62 (100.0%) | 0 (0.0%) |
| 15 to 17 Year Olds | 46 (100.0%) | 0 (0.0%) |
| 18 to 19 Year Olds | 0 (0.0%) | 0 (0.0%) |
| 20 to 24 Year Olds | 0 (0.0%) | 0 (0.0%) |
| 25 to 34 Year Olds | 0 (0.0%) | 0 (0.0%) |
| 35 Years and over | 9 (100.0%) | 0 (0.0%) |
| Total | 154 (100.0%) | 0 (0.0%) |
Educational Attainment by Field of Study in Rock Point
Education (22 | 64.7%), business (6 | 17.6%), psychology (3 | 8.8%), and social sciences (3 | 8.8%) are the most common fields of study among 34 individuals in Rock Point who have obtained a bachelor's degree or higher.
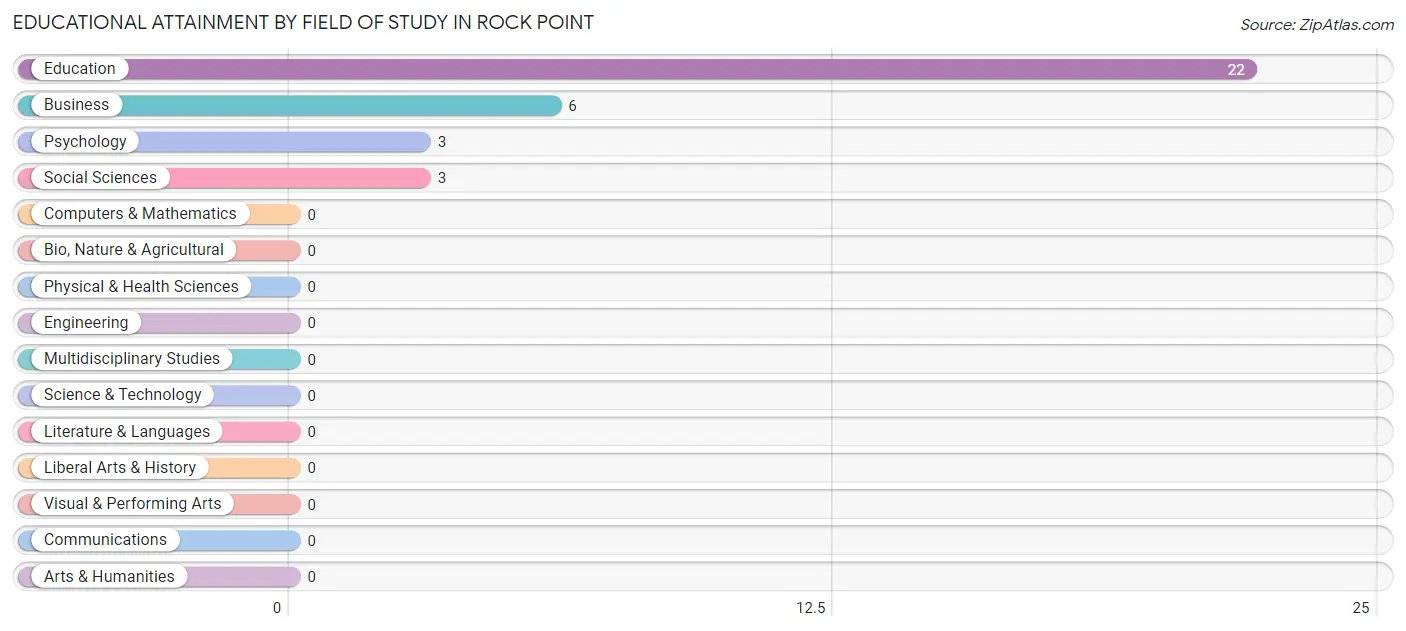
| Field of Study | # Graduates | % Graduates |
| Computers & Mathematics | 0 | 0.0% |
| Bio, Nature & Agricultural | 0 | 0.0% |
| Physical & Health Sciences | 0 | 0.0% |
| Psychology | 3 | 8.8% |
| Social Sciences | 3 | 8.8% |
| Engineering | 0 | 0.0% |
| Multidisciplinary Studies | 0 | 0.0% |
| Science & Technology | 0 | 0.0% |
| Business | 6 | 17.6% |
| Education | 22 | 64.7% |
| Literature & Languages | 0 | 0.0% |
| Liberal Arts & History | 0 | 0.0% |
| Visual & Performing Arts | 0 | 0.0% |
| Communications | 0 | 0.0% |
| Arts & Humanities | 0 | 0.0% |
| Total | 34 | 100.0% |
Transportation & Commute in Rock Point
Vehicle Availability by Sex in Rock Point
The most prevalent vehicle ownership categories in Rock Point are males with 3 vehicles (27, accounting for 42.2%) and females with 3 vehicles (14, making up 39.7%).
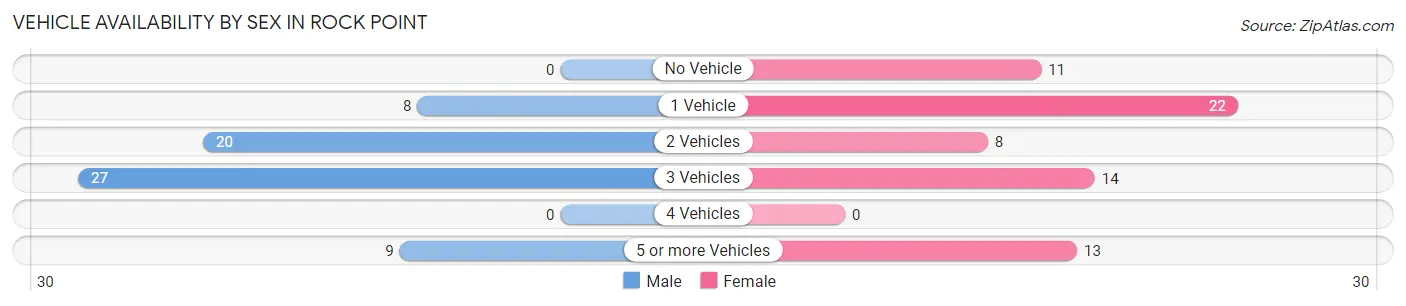
| Vehicles Available | Male | Female |
| No Vehicle | 0 (0.0%) | 11 (16.2%) |
| 1 Vehicle | 8 (12.5%) | 22 (32.4%) |
| 2 Vehicles | 20 (31.2%) | 8 (11.8%) |
| 3 Vehicles | 27 (42.2%) | 14 (20.6%) |
| 4 Vehicles | 0 (0.0%) | 0 (0.0%) |
| 5 or more Vehicles | 9 (14.1%) | 13 (19.1%) |
| Total | 64 (100.0%) | 68 (100.0%) |
Commute Time in Rock Point
The most frequently occuring commute durations in Rock Point are 30 to 34 minutes (30 commuters, 24.0%), 5 to 9 minutes (24 commuters, 19.2%), and 60 to 89 minutes (17 commuters, 13.6%).
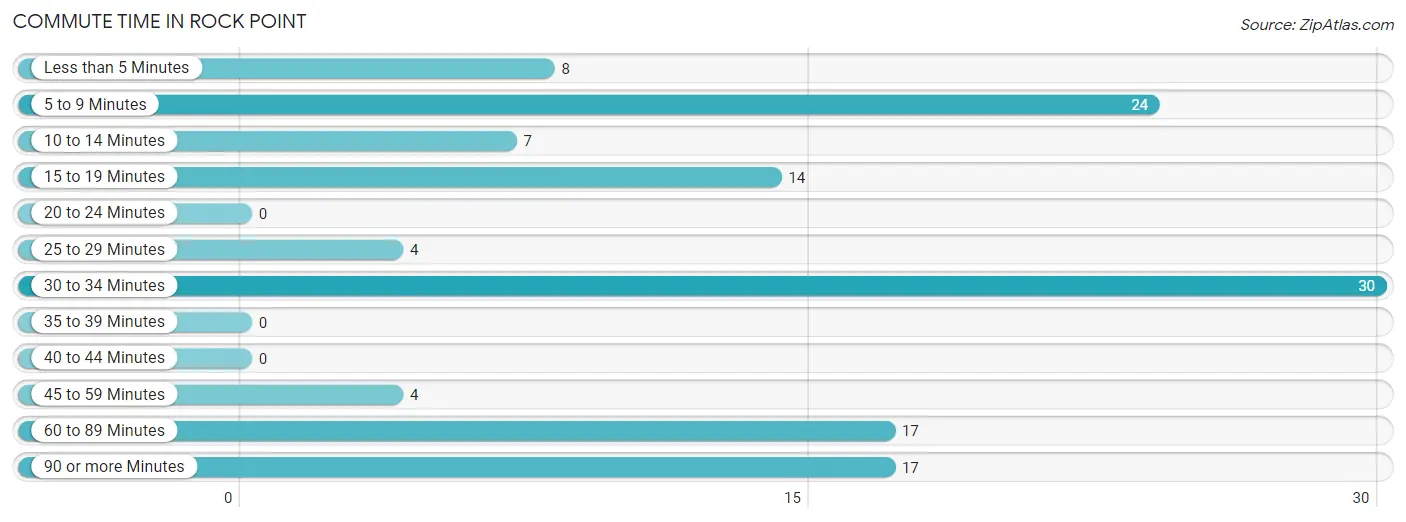
| Commute Time | # Commuters | % Commuters |
| Less than 5 Minutes | 8 | 6.4% |
| 5 to 9 Minutes | 24 | 19.2% |
| 10 to 14 Minutes | 7 | 5.6% |
| 15 to 19 Minutes | 14 | 11.2% |
| 20 to 24 Minutes | 0 | 0.0% |
| 25 to 29 Minutes | 4 | 3.2% |
| 30 to 34 Minutes | 30 | 24.0% |
| 35 to 39 Minutes | 0 | 0.0% |
| 40 to 44 Minutes | 0 | 0.0% |
| 45 to 59 Minutes | 4 | 3.2% |
| 60 to 89 Minutes | 17 | 13.6% |
| 90 or more Minutes | 17 | 13.6% |
Commute Time by Sex in Rock Point
The most common commute times in Rock Point are 60 to 89 minutes (17 commuters, 29.8%) for males and 5 to 9 minutes (20 commuters, 29.4%) for females.
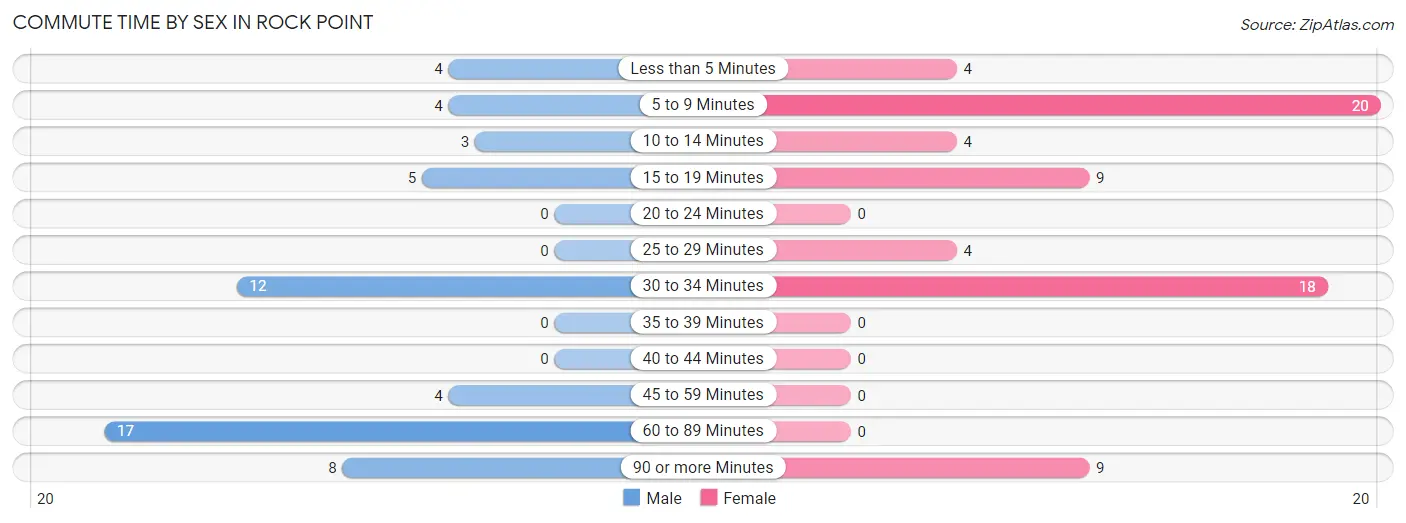
| Commute Time | Male | Female |
| Less than 5 Minutes | 4 (7.0%) | 4 (5.9%) |
| 5 to 9 Minutes | 4 (7.0%) | 20 (29.4%) |
| 10 to 14 Minutes | 3 (5.3%) | 4 (5.9%) |
| 15 to 19 Minutes | 5 (8.8%) | 9 (13.2%) |
| 20 to 24 Minutes | 0 (0.0%) | 0 (0.0%) |
| 25 to 29 Minutes | 0 (0.0%) | 4 (5.9%) |
| 30 to 34 Minutes | 12 (21.0%) | 18 (26.5%) |
| 35 to 39 Minutes | 0 (0.0%) | 0 (0.0%) |
| 40 to 44 Minutes | 0 (0.0%) | 0 (0.0%) |
| 45 to 59 Minutes | 4 (7.0%) | 0 (0.0%) |
| 60 to 89 Minutes | 17 (29.8%) | 0 (0.0%) |
| 90 or more Minutes | 8 (14.0%) | 9 (13.2%) |
Time of Departure to Work by Sex in Rock Point
The most frequent times of departure to work in Rock Point are 7:30 AM to 7:59 AM (25, 43.9%) for males and 7:30 AM to 7:59 AM (34, 50.0%) for females.
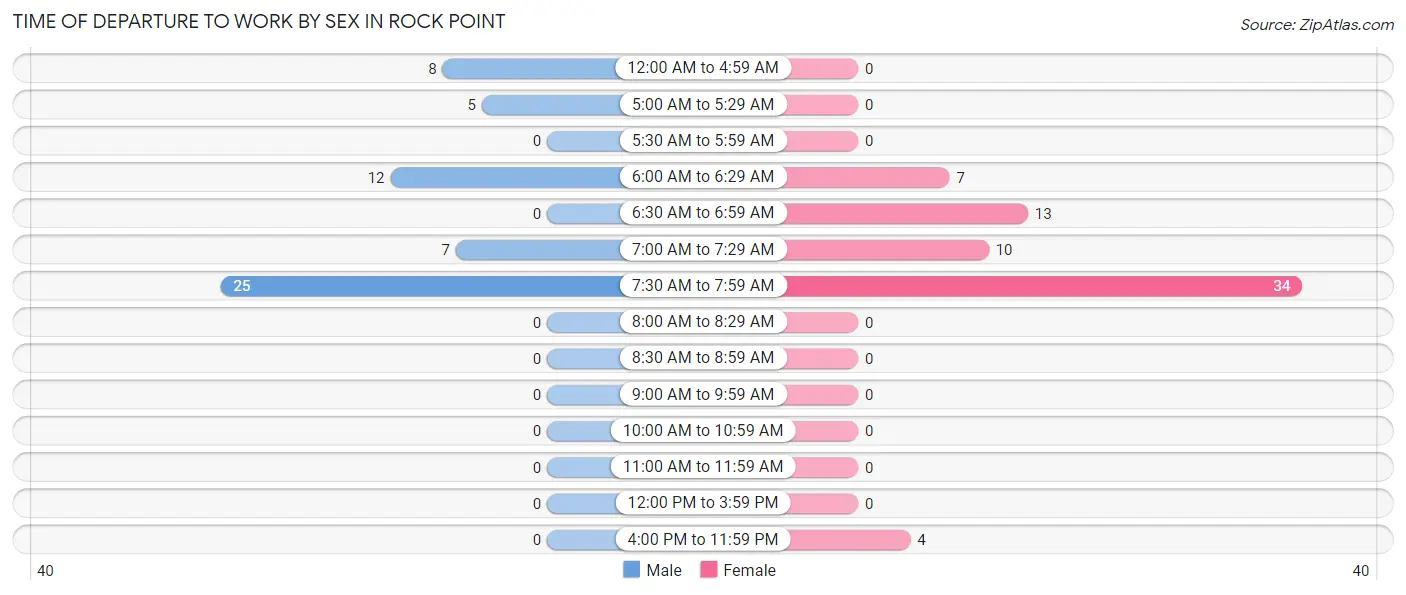
| Time of Departure | Male | Female |
| 12:00 AM to 4:59 AM | 8 (14.0%) | 0 (0.0%) |
| 5:00 AM to 5:29 AM | 5 (8.8%) | 0 (0.0%) |
| 5:30 AM to 5:59 AM | 0 (0.0%) | 0 (0.0%) |
| 6:00 AM to 6:29 AM | 12 (21.0%) | 7 (10.3%) |
| 6:30 AM to 6:59 AM | 0 (0.0%) | 13 (19.1%) |
| 7:00 AM to 7:29 AM | 7 (12.3%) | 10 (14.7%) |
| 7:30 AM to 7:59 AM | 25 (43.9%) | 34 (50.0%) |
| 8:00 AM to 8:29 AM | 0 (0.0%) | 0 (0.0%) |
| 8:30 AM to 8:59 AM | 0 (0.0%) | 0 (0.0%) |
| 9:00 AM to 9:59 AM | 0 (0.0%) | 0 (0.0%) |
| 10:00 AM to 10:59 AM | 0 (0.0%) | 0 (0.0%) |
| 11:00 AM to 11:59 AM | 0 (0.0%) | 0 (0.0%) |
| 12:00 PM to 3:59 PM | 0 (0.0%) | 0 (0.0%) |
| 4:00 PM to 11:59 PM | 0 (0.0%) | 4 (5.9%) |
| Total | 57 (100.0%) | 68 (100.0%) |
Housing Occupancy in Rock Point
Occupancy by Ownership in Rock Point
Of the total 148 dwellings in Rock Point, owner-occupied units account for 95 (64.2%), while renter-occupied units make up 53 (35.8%).
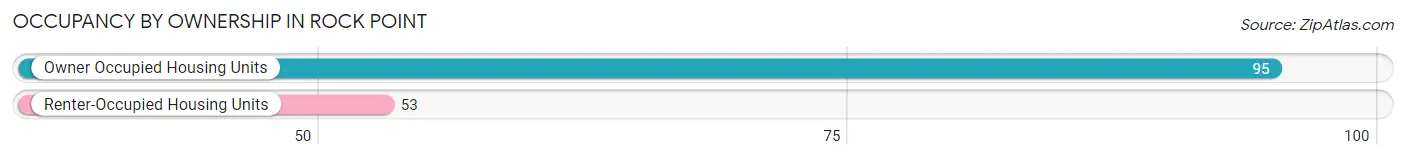
| Occupancy | # Housing Units | % Housing Units |
| Owner Occupied Housing Units | 95 | 64.2% |
| Renter-Occupied Housing Units | 53 | 35.8% |
| Total Occupied Housing Units | 148 | 100.0% |
Occupancy by Household Size in Rock Point
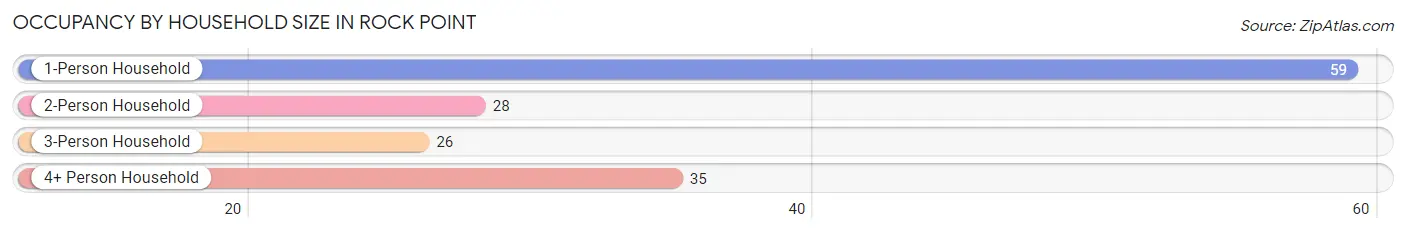
| Household Size | # Housing Units | % Housing Units |
| 1-Person Household | 59 | 39.9% |
| 2-Person Household | 28 | 18.9% |
| 3-Person Household | 26 | 17.6% |
| 4+ Person Household | 35 | 23.6% |
| Total Housing Units | 148 | 100.0% |
Occupancy by Ownership by Household Size in Rock Point
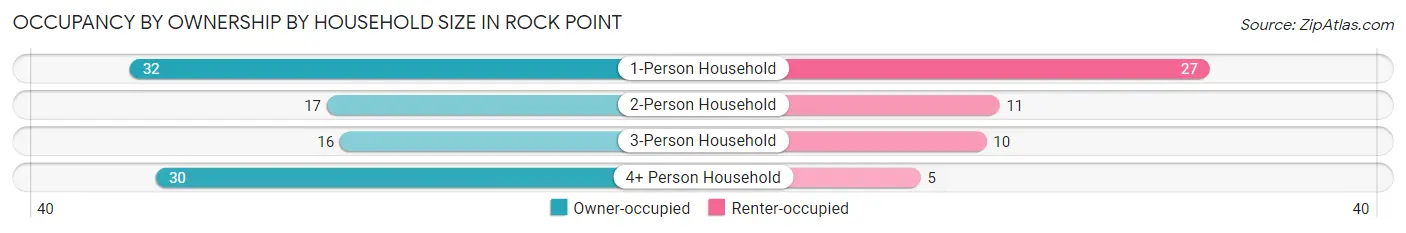
| Household Size | Owner-occupied | Renter-occupied |
| 1-Person Household | 32 (54.2%) | 27 (45.8%) |
| 2-Person Household | 17 (60.7%) | 11 (39.3%) |
| 3-Person Household | 16 (61.5%) | 10 (38.5%) |
| 4+ Person Household | 30 (85.7%) | 5 (14.3%) |
| Total Housing Units | 95 (64.2%) | 53 (35.8%) |
Occupancy by Educational Attainment in Rock Point
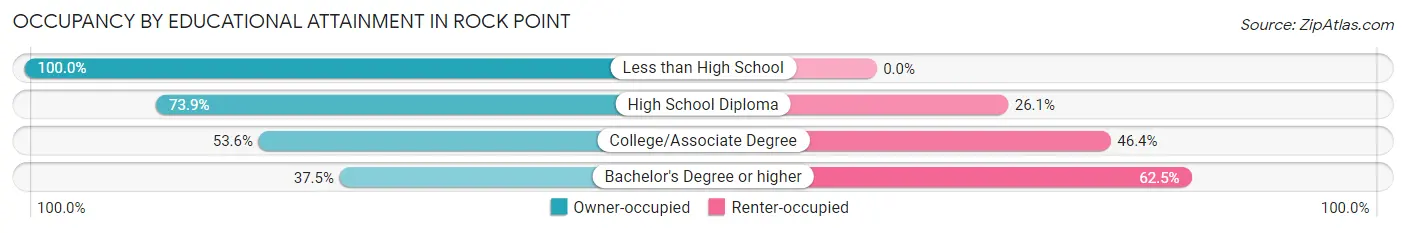
| Household Size | Owner-occupied | Renter-occupied |
| Less than High School | 22 (100.0%) | 0 (0.0%) |
| High School Diploma | 34 (73.9%) | 12 (26.1%) |
| College/Associate Degree | 30 (53.6%) | 26 (46.4%) |
| Bachelor's Degree or higher | 9 (37.5%) | 15 (62.5%) |
Occupancy by Age of Householder in Rock Point
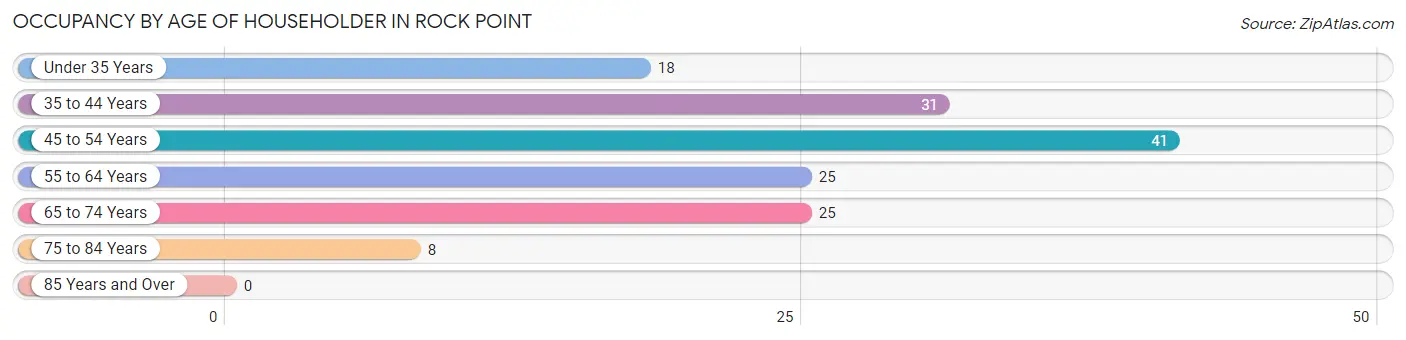
| Age Bracket | # Households | % Households |
| Under 35 Years | 18 | 12.2% |
| 35 to 44 Years | 31 | 20.9% |
| 45 to 54 Years | 41 | 27.7% |
| 55 to 64 Years | 25 | 16.9% |
| 65 to 74 Years | 25 | 16.9% |
| 75 to 84 Years | 8 | 5.4% |
| 85 Years and Over | 0 | 0.0% |
| Total | 148 | 100.0% |
Housing Finances in Rock Point
Median Income by Occupancy in Rock Point
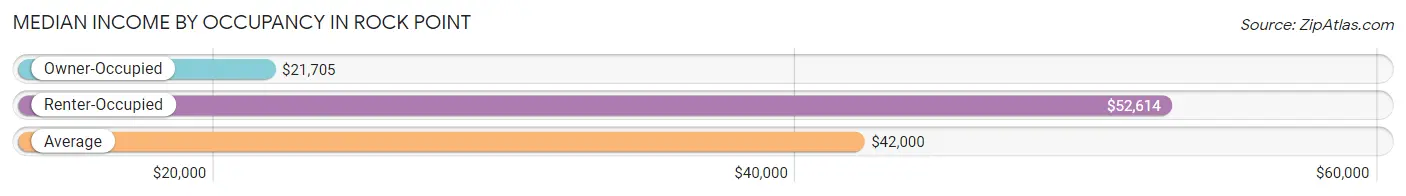
| Occupancy Type | # Households | Median Income |
| Owner-Occupied | 95 (64.2%) | $21,705 |
| Renter-Occupied | 53 (35.8%) | $52,614 |
| Average | 148 (100.0%) | $42,000 |
Occupancy by Householder Income Bracket in Rock Point
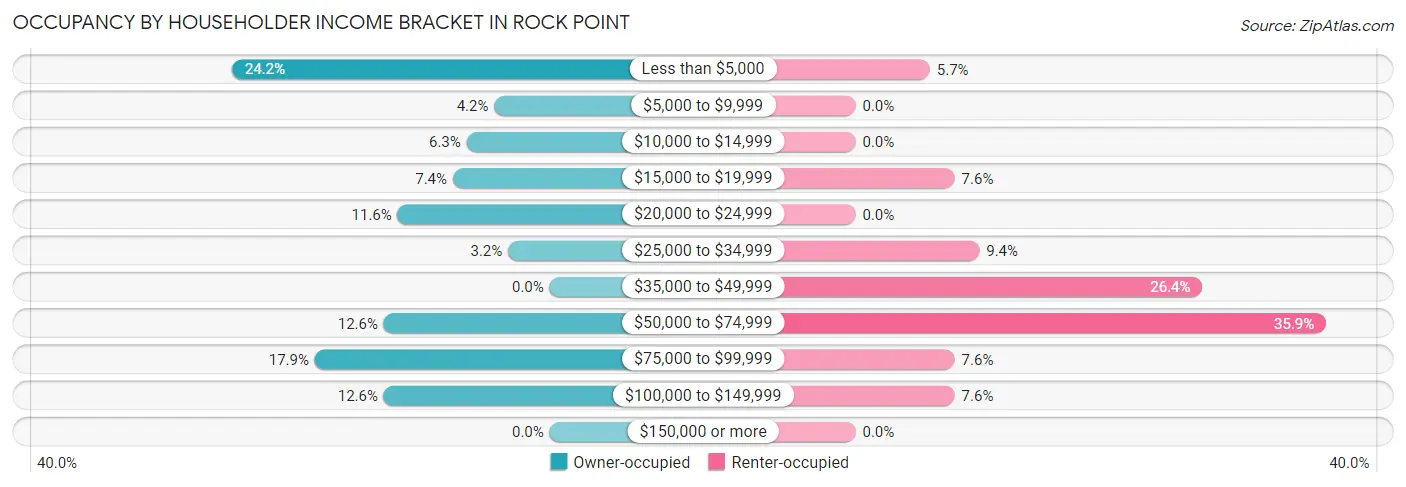
| Income Bracket | Owner-occupied | Renter-occupied |
| Less than $5,000 | 23 (24.2%) | 3 (5.7%) |
| $5,000 to $9,999 | 4 (4.2%) | 0 (0.0%) |
| $10,000 to $14,999 | 6 (6.3%) | 0 (0.0%) |
| $15,000 to $19,999 | 7 (7.4%) | 4 (7.5%) |
| $20,000 to $24,999 | 11 (11.6%) | 0 (0.0%) |
| $25,000 to $34,999 | 3 (3.2%) | 5 (9.4%) |
| $35,000 to $49,999 | 0 (0.0%) | 14 (26.4%) |
| $50,000 to $74,999 | 12 (12.6%) | 19 (35.8%) |
| $75,000 to $99,999 | 17 (17.9%) | 4 (7.5%) |
| $100,000 to $149,999 | 12 (12.6%) | 4 (7.5%) |
| $150,000 or more | 0 (0.0%) | 0 (0.0%) |
| Total | 95 (100.0%) | 53 (100.0%) |
Monthly Housing Cost Tiers in Rock Point
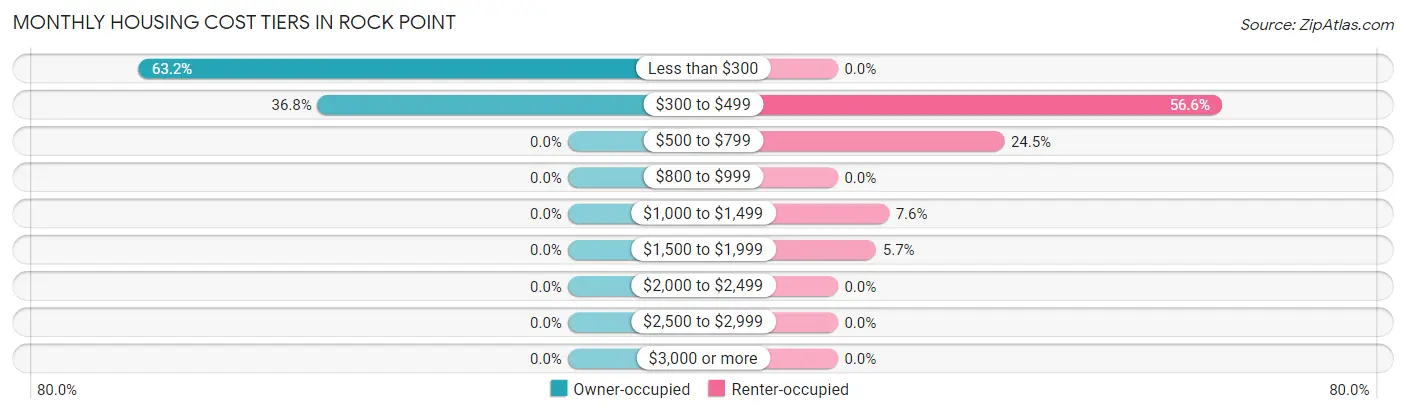
| Monthly Cost | Owner-occupied | Renter-occupied |
| Less than $300 | 60 (63.2%) | 0 (0.0%) |
| $300 to $499 | 35 (36.8%) | 30 (56.6%) |
| $500 to $799 | 0 (0.0%) | 13 (24.5%) |
| $800 to $999 | 0 (0.0%) | 0 (0.0%) |
| $1,000 to $1,499 | 0 (0.0%) | 4 (7.5%) |
| $1,500 to $1,999 | 0 (0.0%) | 3 (5.7%) |
| $2,000 to $2,499 | 0 (0.0%) | 0 (0.0%) |
| $2,500 to $2,999 | 0 (0.0%) | 0 (0.0%) |
| $3,000 or more | 0 (0.0%) | 0 (0.0%) |
| Total | 95 (100.0%) | 53 (100.0%) |
Physical Housing Characteristics in Rock Point
Housing Structures in Rock Point
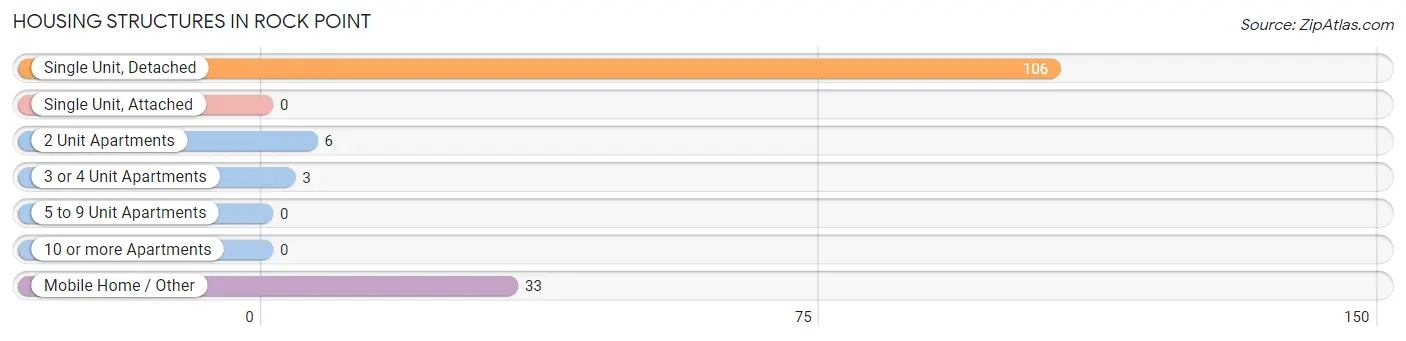
| Structure Type | # Housing Units | % Housing Units |
| Single Unit, Detached | 106 | 71.6% |
| Single Unit, Attached | 0 | 0.0% |
| 2 Unit Apartments | 6 | 4.1% |
| 3 or 4 Unit Apartments | 3 | 2.0% |
| 5 to 9 Unit Apartments | 0 | 0.0% |
| 10 or more Apartments | 0 | 0.0% |
| Mobile Home / Other | 33 | 22.3% |
| Total | 148 | 100.0% |
Housing Structures by Occupancy in Rock Point
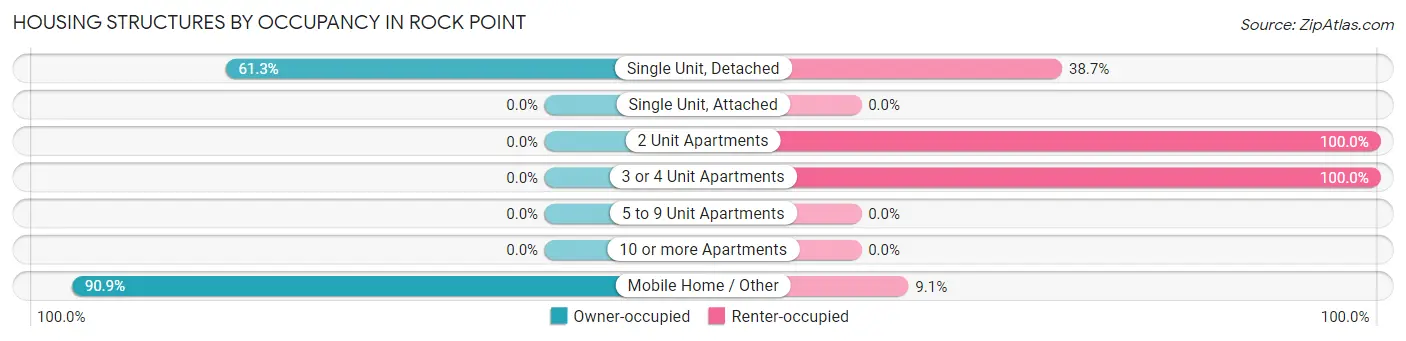
| Structure Type | Owner-occupied | Renter-occupied |
| Single Unit, Detached | 65 (61.3%) | 41 (38.7%) |
| Single Unit, Attached | 0 (0.0%) | 0 (0.0%) |
| 2 Unit Apartments | 0 (0.0%) | 6 (100.0%) |
| 3 or 4 Unit Apartments | 0 (0.0%) | 3 (100.0%) |
| 5 to 9 Unit Apartments | 0 (0.0%) | 0 (0.0%) |
| 10 or more Apartments | 0 (0.0%) | 0 (0.0%) |
| Mobile Home / Other | 30 (90.9%) | 3 (9.1%) |
| Total | 95 (64.2%) | 53 (35.8%) |
Housing Structures by Number of Rooms in Rock Point
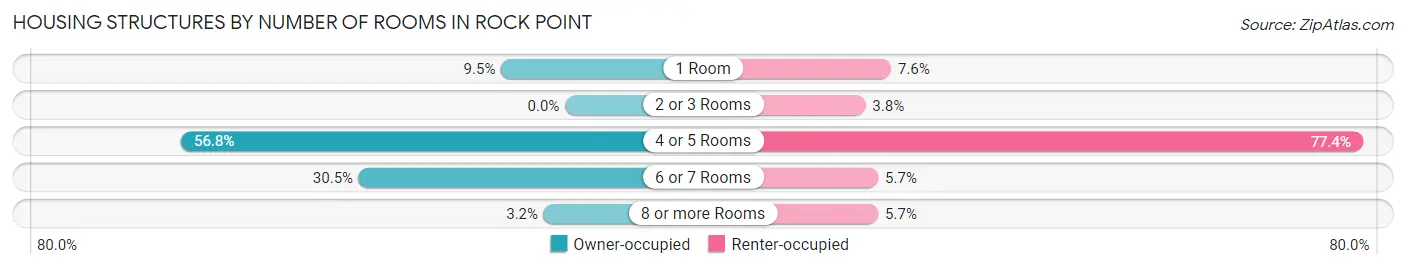
| Number of Rooms | Owner-occupied | Renter-occupied |
| 1 Room | 9 (9.5%) | 4 (7.5%) |
| 2 or 3 Rooms | 0 (0.0%) | 2 (3.8%) |
| 4 or 5 Rooms | 54 (56.8%) | 41 (77.4%) |
| 6 or 7 Rooms | 29 (30.5%) | 3 (5.7%) |
| 8 or more Rooms | 3 (3.2%) | 3 (5.7%) |
| Total | 95 (100.0%) | 53 (100.0%) |
Housing Structure by Heating Type in Rock Point
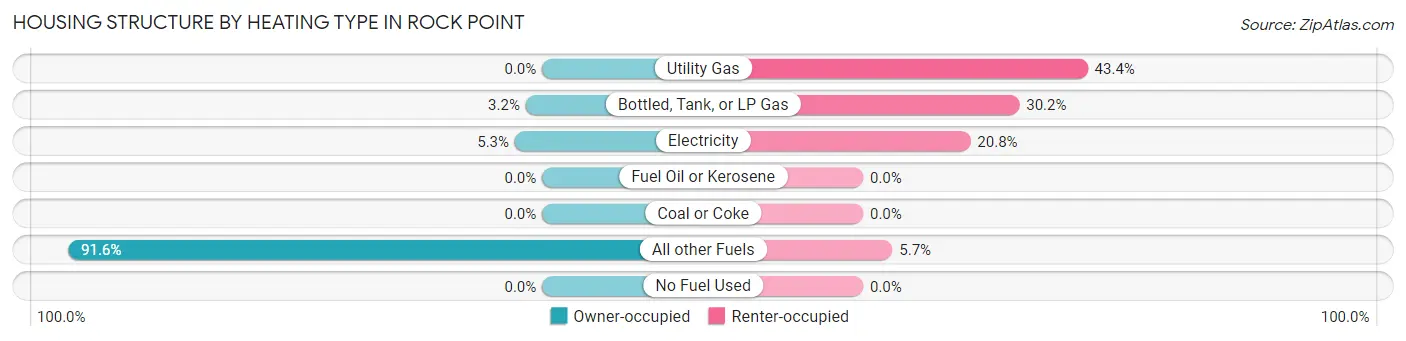
| Heating Type | Owner-occupied | Renter-occupied |
| Utility Gas | 0 (0.0%) | 23 (43.4%) |
| Bottled, Tank, or LP Gas | 3 (3.2%) | 16 (30.2%) |
| Electricity | 5 (5.3%) | 11 (20.7%) |
| Fuel Oil or Kerosene | 0 (0.0%) | 0 (0.0%) |
| Coal or Coke | 0 (0.0%) | 0 (0.0%) |
| All other Fuels | 87 (91.6%) | 3 (5.7%) |
| No Fuel Used | 0 (0.0%) | 0 (0.0%) |
| Total | 95 (100.0%) | 53 (100.0%) |
Household Vehicle Usage in Rock Point
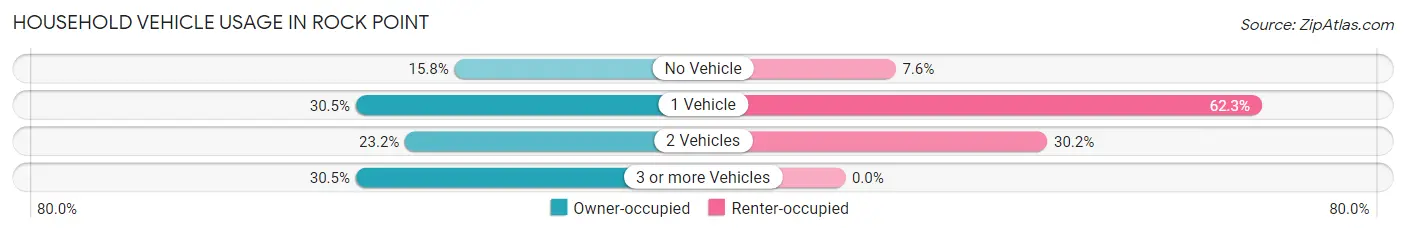
| Vehicles per Household | Owner-occupied | Renter-occupied |
| No Vehicle | 15 (15.8%) | 4 (7.5%) |
| 1 Vehicle | 29 (30.5%) | 33 (62.3%) |
| 2 Vehicles | 22 (23.2%) | 16 (30.2%) |
| 3 or more Vehicles | 29 (30.5%) | 0 (0.0%) |
| Total | 95 (100.0%) | 53 (100.0%) |
Real Estate & Mortgages in Rock Point
Real Estate and Mortgage Overview in Rock Point
| Characteristic | Without Mortgage | With Mortgage |
| Housing Units | 95 | 0 |
| Median Property Value | - | - |
| Median Household Income | $21,705 | $0 |
| Monthly Housing Costs | $245 | $0 |
| Real Estate Taxes | - | - |
Property Value by Mortgage Status in Rock Point
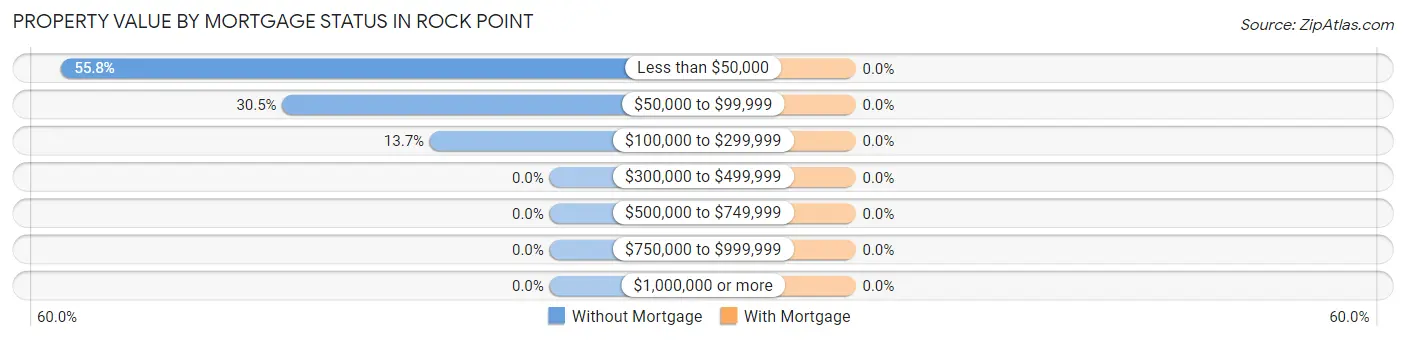
| Property Value | Without Mortgage | With Mortgage |
| Less than $50,000 | 53 (55.8%) | 0 (0.0%) |
| $50,000 to $99,999 | 29 (30.5%) | 0 (0.0%) |
| $100,000 to $299,999 | 13 (13.7%) | 0 (0.0%) |
| $300,000 to $499,999 | 0 (0.0%) | 0 (0.0%) |
| $500,000 to $749,999 | 0 (0.0%) | 0 (0.0%) |
| $750,000 to $999,999 | 0 (0.0%) | 0 (0.0%) |
| $1,000,000 or more | 0 (0.0%) | 0 (0.0%) |
| Total | 95 (100.0%) | 0 (0.0%) |
Household Income by Mortgage Status in Rock Point
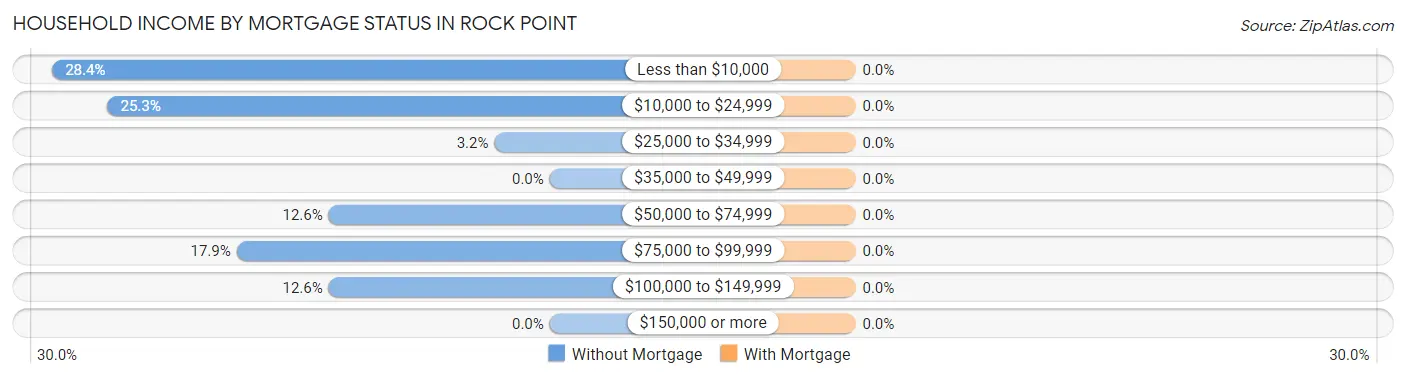
| Household Income | Without Mortgage | With Mortgage |
| Less than $10,000 | 27 (28.4%) | 0 (0.0%) |
| $10,000 to $24,999 | 24 (25.3%) | 0 (0.0%) |
| $25,000 to $34,999 | 3 (3.2%) | 0 (0.0%) |
| $35,000 to $49,999 | 0 (0.0%) | 0 (0.0%) |
| $50,000 to $74,999 | 12 (12.6%) | 0 (0.0%) |
| $75,000 to $99,999 | 17 (17.9%) | 0 (0.0%) |
| $100,000 to $149,999 | 12 (12.6%) | 0 (0.0%) |
| $150,000 or more | 0 (0.0%) | 0 (0.0%) |
| Total | 95 (100.0%) | 0 (0.0%) |
Property Value to Household Income Ratio in Rock Point
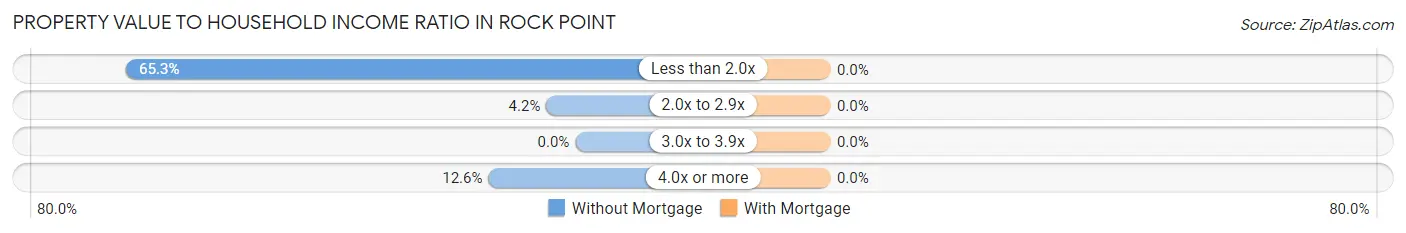
| Value-to-Income Ratio | Without Mortgage | With Mortgage |
| Less than 2.0x | 62 (65.3%) | 0 (0.0%) |
| 2.0x to 2.9x | 4 (4.2%) | 0 (0.0%) |
| 3.0x to 3.9x | 0 (0.0%) | 0 (0.0%) |
| 4.0x or more | 12 (12.6%) | 0 (0.0%) |
| Total | 95 (100.0%) | 0 (0.0%) |
Real Estate Taxes by Mortgage Status in Rock Point
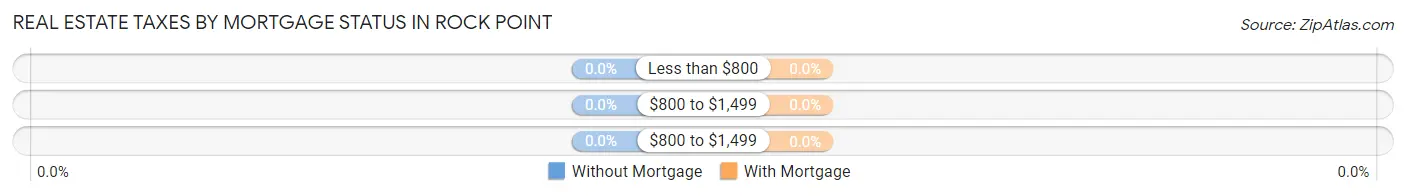
| Property Taxes | Without Mortgage | With Mortgage |
| Less than $800 | 0 (0.0%) | 0 (0.0%) |
| $800 to $1,499 | 0 (0.0%) | 0 (0.0%) |
| $800 to $1,499 | 0 (0.0%) | 0 (0.0%) |
| Total | 95 (100.0%) | 0 (0.0%) |
Health & Disability in Rock Point
Health Insurance Coverage by Age in Rock Point
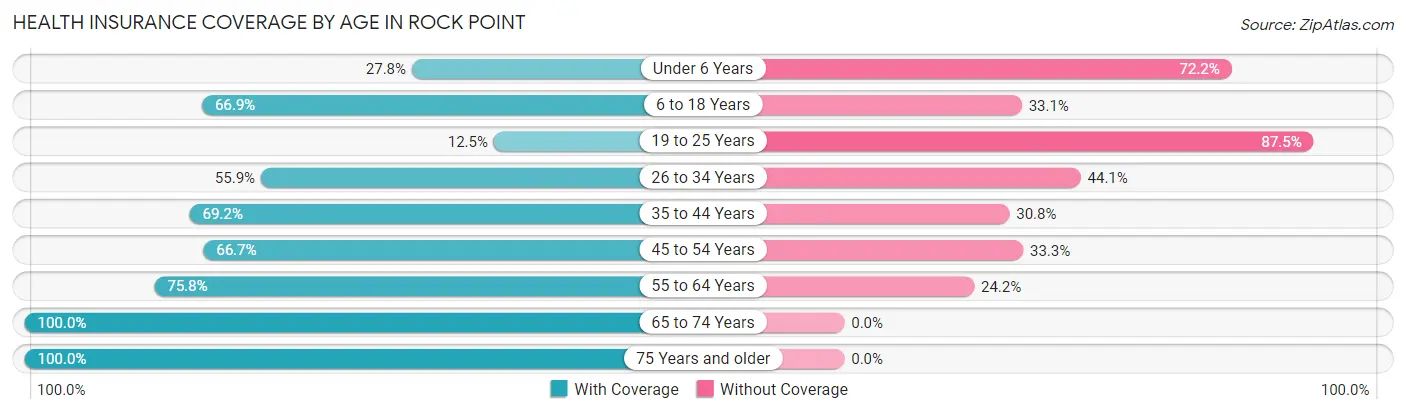
| Age Bracket | With Coverage | Without Coverage |
| Under 6 Years | 10 (27.8%) | 26 (72.2%) |
| 6 to 18 Years | 87 (66.9%) | 43 (33.1%) |
| 19 to 25 Years | 4 (12.5%) | 28 (87.5%) |
| 26 to 34 Years | 33 (55.9%) | 26 (44.1%) |
| 35 to 44 Years | 45 (69.2%) | 20 (30.8%) |
| 45 to 54 Years | 34 (66.7%) | 17 (33.3%) |
| 55 to 64 Years | 47 (75.8%) | 15 (24.2%) |
| 65 to 74 Years | 43 (100.0%) | 0 (0.0%) |
| 75 Years and older | 11 (100.0%) | 0 (0.0%) |
| Total | 314 (64.2%) | 175 (35.8%) |
Health Insurance Coverage by Citizenship Status in Rock Point
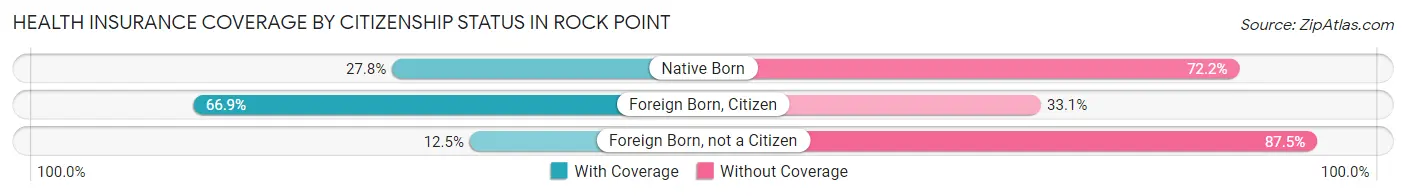
| Citizenship Status | With Coverage | Without Coverage |
| Native Born | 10 (27.8%) | 26 (72.2%) |
| Foreign Born, Citizen | 87 (66.9%) | 43 (33.1%) |
| Foreign Born, not a Citizen | 4 (12.5%) | 28 (87.5%) |
Health Insurance Coverage by Household Income in Rock Point
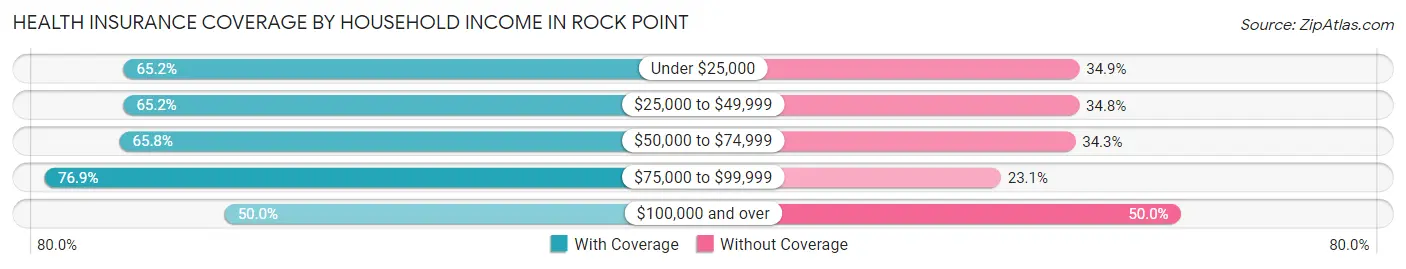
| Household Income | With Coverage | Without Coverage |
| Under $25,000 | 86 (65.1%) | 46 (34.8%) |
| $25,000 to $49,999 | 73 (65.2%) | 39 (34.8%) |
| $50,000 to $74,999 | 48 (65.7%) | 25 (34.3%) |
| $75,000 to $99,999 | 60 (76.9%) | 18 (23.1%) |
| $100,000 and over | 47 (50.0%) | 47 (50.0%) |
Public vs Private Health Insurance Coverage by Age in Rock Point
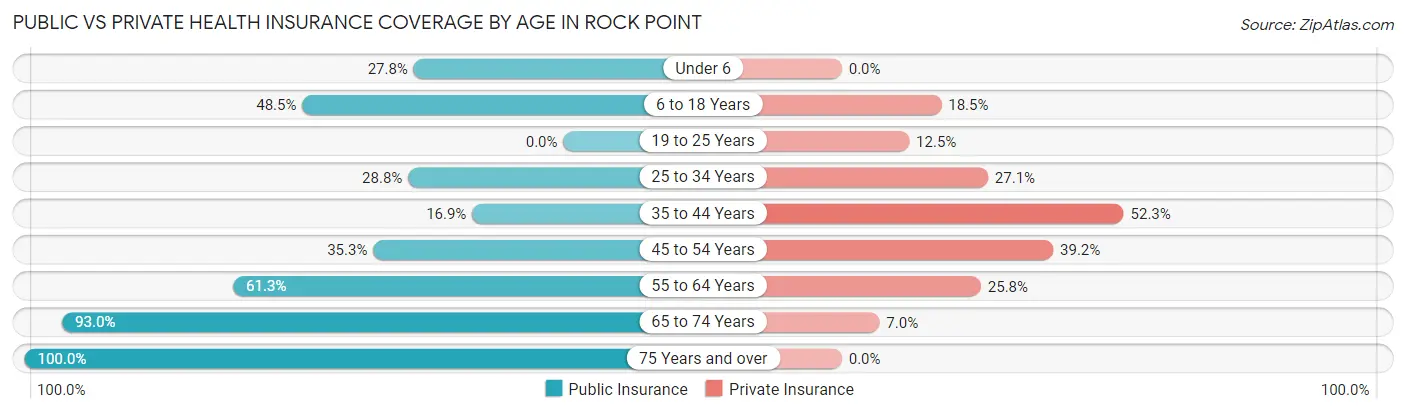
| Age Bracket | Public Insurance | Private Insurance |
| Under 6 | 10 (27.8%) | 0 (0.0%) |
| 6 to 18 Years | 63 (48.5%) | 24 (18.5%) |
| 19 to 25 Years | 0 (0.0%) | 4 (12.5%) |
| 25 to 34 Years | 17 (28.8%) | 16 (27.1%) |
| 35 to 44 Years | 11 (16.9%) | 34 (52.3%) |
| 45 to 54 Years | 18 (35.3%) | 20 (39.2%) |
| 55 to 64 Years | 38 (61.3%) | 16 (25.8%) |
| 65 to 74 Years | 40 (93.0%) | 3 (7.0%) |
| 75 Years and over | 11 (100.0%) | 0 (0.0%) |
| Total | 208 (42.5%) | 117 (23.9%) |
Disability Status by Sex by Age in Rock Point
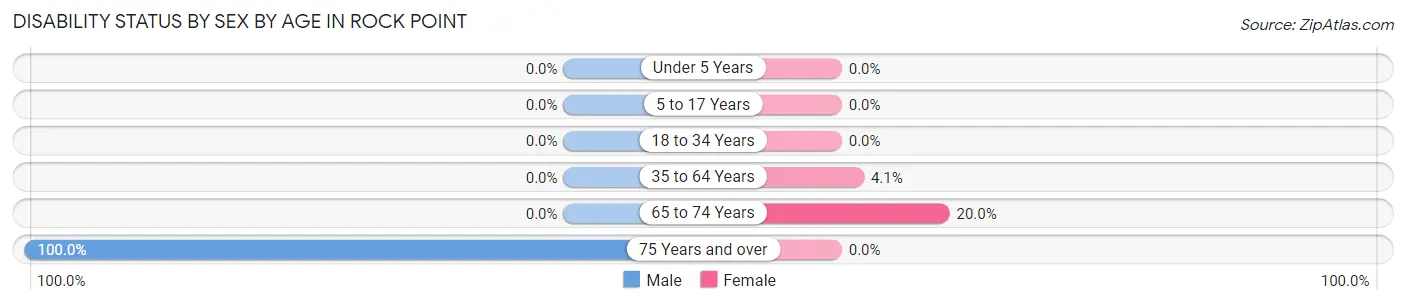
| Age Bracket | Male | Female |
| Under 5 Years | 0 (0.0%) | 0 (0.0%) |
| 5 to 17 Years | 0 (0.0%) | 0 (0.0%) |
| 18 to 34 Years | 0 (0.0%) | 0 (0.0%) |
| 35 to 64 Years | 0 (0.0%) | 4 (4.1%) |
| 65 to 74 Years | 0 (0.0%) | 3 (20.0%) |
| 75 Years and over | 3 (100.0%) | 0 (0.0%) |
Disability Class by Sex by Age in Rock Point
Disability Class: Hearing Difficulty
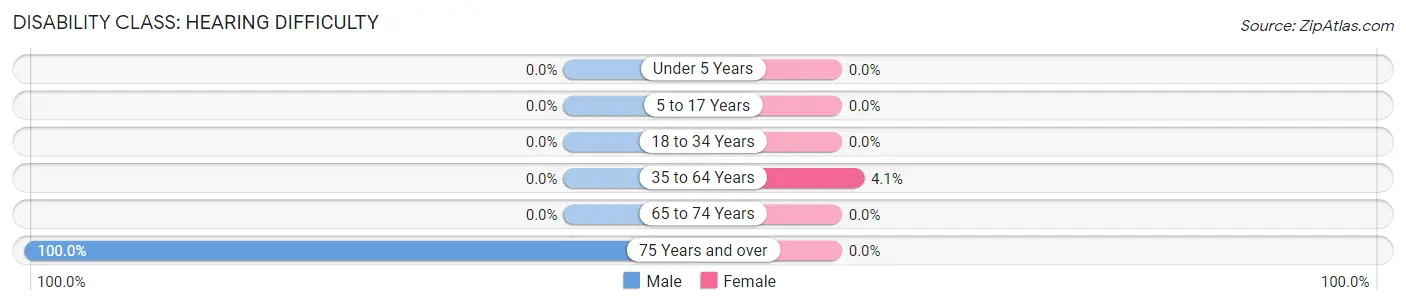
| Age Bracket | Male | Female |
| Under 5 Years | 0 (0.0%) | 0 (0.0%) |
| 5 to 17 Years | 0 (0.0%) | 0 (0.0%) |
| 18 to 34 Years | 0 (0.0%) | 0 (0.0%) |
| 35 to 64 Years | 0 (0.0%) | 4 (4.1%) |
| 65 to 74 Years | 0 (0.0%) | 0 (0.0%) |
| 75 Years and over | 3 (100.0%) | 0 (0.0%) |
Disability Class: Vision Difficulty
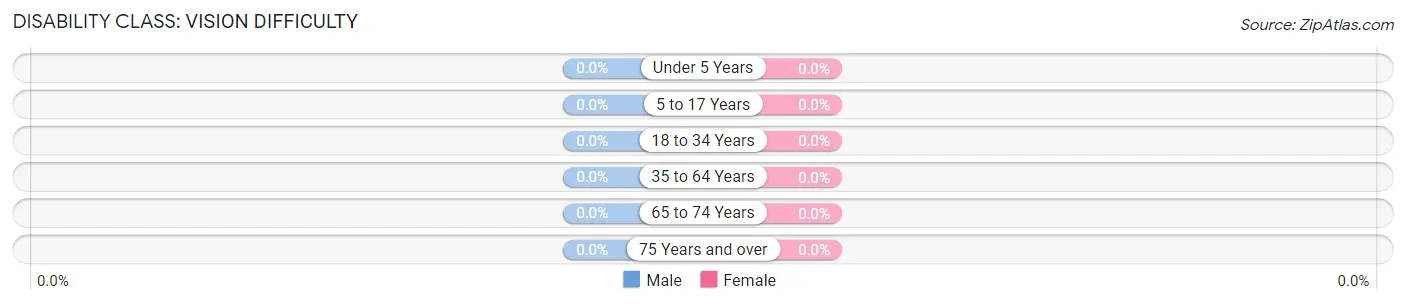
| Age Bracket | Male | Female |
| Under 5 Years | 0 (0.0%) | 0 (0.0%) |
| 5 to 17 Years | 0 (0.0%) | 0 (0.0%) |
| 18 to 34 Years | 0 (0.0%) | 0 (0.0%) |
| 35 to 64 Years | 0 (0.0%) | 0 (0.0%) |
| 65 to 74 Years | 0 (0.0%) | 0 (0.0%) |
| 75 Years and over | 0 (0.0%) | 0 (0.0%) |
Disability Class: Cognitive Difficulty
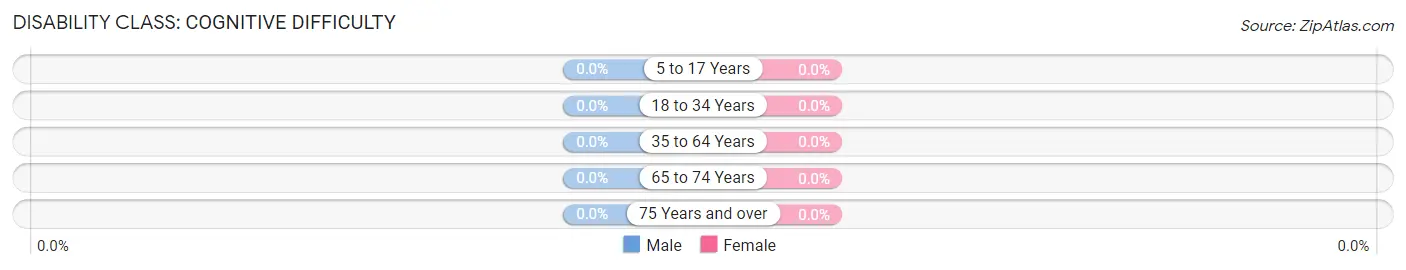
| Age Bracket | Male | Female |
| 5 to 17 Years | 0 (0.0%) | 0 (0.0%) |
| 18 to 34 Years | 0 (0.0%) | 0 (0.0%) |
| 35 to 64 Years | 0 (0.0%) | 0 (0.0%) |
| 65 to 74 Years | 0 (0.0%) | 0 (0.0%) |
| 75 Years and over | 0 (0.0%) | 0 (0.0%) |
Disability Class: Ambulatory Difficulty
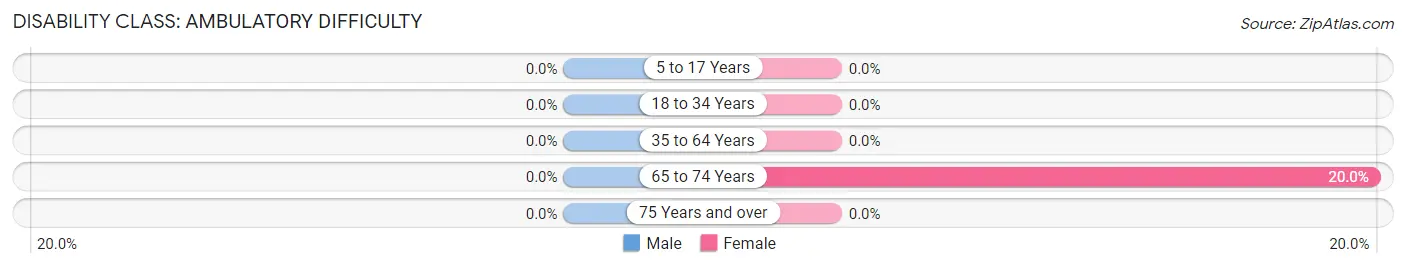
| Age Bracket | Male | Female |
| 5 to 17 Years | 0 (0.0%) | 0 (0.0%) |
| 18 to 34 Years | 0 (0.0%) | 0 (0.0%) |
| 35 to 64 Years | 0 (0.0%) | 0 (0.0%) |
| 65 to 74 Years | 0 (0.0%) | 3 (20.0%) |
| 75 Years and over | 0 (0.0%) | 0 (0.0%) |
Disability Class: Self-Care Difficulty
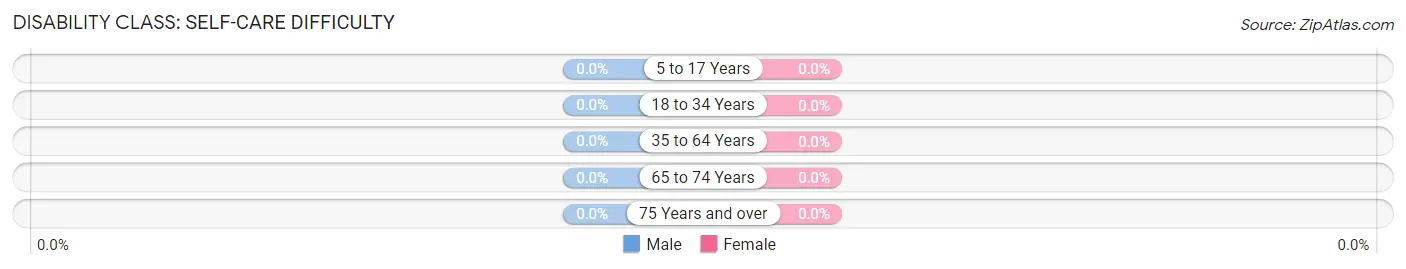
| Age Bracket | Male | Female |
| 5 to 17 Years | 0 (0.0%) | 0 (0.0%) |
| 18 to 34 Years | 0 (0.0%) | 0 (0.0%) |
| 35 to 64 Years | 0 (0.0%) | 0 (0.0%) |
| 65 to 74 Years | 0 (0.0%) | 0 (0.0%) |
| 75 Years and over | 0 (0.0%) | 0 (0.0%) |
Technology Access in Rock Point
Computing Device Access in Rock Point
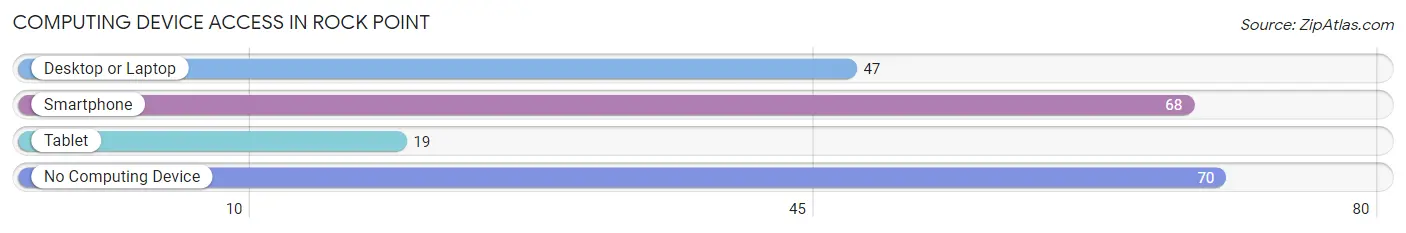
| Device Type | # Households | % Households |
| Desktop or Laptop | 47 | 31.8% |
| Smartphone | 68 | 46.0% |
| Tablet | 19 | 12.8% |
| No Computing Device | 70 | 47.3% |
| Total | 148 | 100.0% |
Internet Access in Rock Point
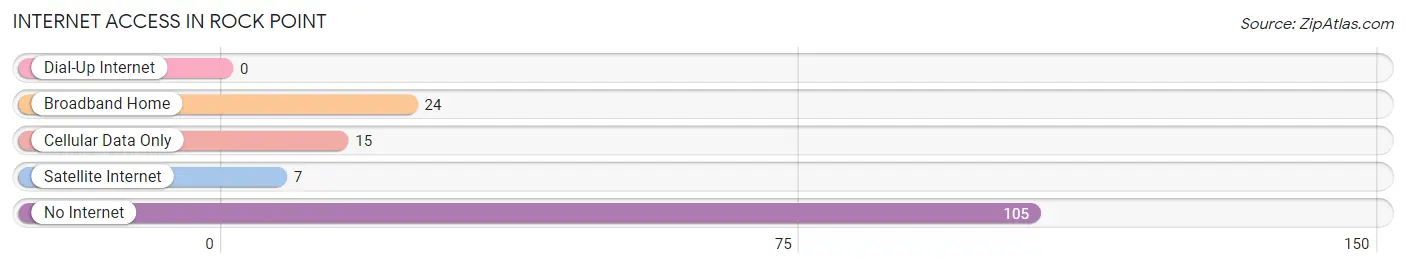
| Internet Type | # Households | % Households |
| Dial-Up Internet | 0 | 0.0% |
| Broadband Home | 24 | 16.2% |
| Cellular Data Only | 15 | 10.1% |
| Satellite Internet | 7 | 4.7% |
| No Internet | 105 | 71.0% |
| Total | 148 | 100.0% |
Rock Point Summary
Point Rock, Arizona is a small unincorporated community located in the northern part of the state, in Coconino County. It is situated in the Coconino National Forest, near the Arizona-Utah border. The community is located on the western edge of the Colorado Plateau, and is surrounded by the Kaibab National Forest and the Grand Canyon National Park. The area is known for its stunning views of the Grand Canyon and its surrounding landscape.
History
Point Rock was first settled in the late 1800s by Mormon settlers who were looking for a place to homestead. The area was originally known as "Point of Rocks" due to the large number of rocks that were found in the area. The settlers built a small community and named it Point Rock.
The area was used primarily for ranching and farming, and the community grew slowly over the years. In the early 1900s, the area was used as a stopover for travelers on their way to the Grand Canyon. The area was also used as a base for prospectors looking for gold and other minerals.
In the 1950s, the area began to attract tourists who were looking for a place to stay while visiting the Grand Canyon. The area was also used as a base for hikers and campers. In the 1960s, the area was designated as a National Forest and the Point Rock Ranger Station was established.
Geography
Point Rock is located in the northern part of Arizona, in Coconino County. It is situated in the Coconino National Forest, near the Arizona-Utah border. The area is known for its stunning views of the Grand Canyon and its surrounding landscape. The area is also home to a variety of wildlife, including elk, deer, and bighorn sheep.
The area is characterized by its rugged terrain, with steep canyons, mesas, and buttes. The area is also home to a variety of plant life, including juniper, pinyon, and ponderosa pine.
Economy
The economy of Point Rock is largely based on tourism. The area is a popular destination for hikers, campers, and other outdoor enthusiasts. The area is also home to a variety of businesses, including restaurants, hotels, and stores.
The area is also home to a number of ranches and farms, which provide food and other products to the local community. The area is also home to a number of mining operations, which provide jobs to the local population.
Demographics
As of the 2010 census, the population of Point Rock was 1,093. The population is largely white, with a small percentage of Native American and Hispanic residents. The median household income is $37,500, and the median age is 44.
Conclusion
Point Rock, Arizona is a small unincorporated community located in the northern part of the state, in Coconino County. It is situated in the Coconino National Forest, near the Arizona-Utah border. The area is known for its stunning views of the Grand Canyon and its surrounding landscape. The economy of Point Rock is largely based on tourism, with a variety of businesses, ranches, and farms providing jobs to the local population. The population of Point Rock is largely white, with a small percentage of Native American and Hispanic residents.
Common Questions
What is Per Capita Income in Rock Point?
Per Capita income in Rock Point is $15,640.
What is the Median Family Income in Rock Point?
Median Family Income in Rock Point is $52,188.
What is the Median Household income in Rock Point?
Median Household Income in Rock Point is $42,000.
What is Income or Wage Gap in Rock Point?
Income or Wage Gap in Rock Point is 0.4%.
Women in Rock Point earn 99.6 cents for every dollar earned by a man.
What is Inequality or Gini Index in Rock Point?
Inequality or Gini Index in Rock Point is 0.47.
What is the Total Population of Rock Point?
Total Population of Rock Point is 489.
What is the Total Male Population of Rock Point?
Total Male Population of Rock Point is 271.
What is the Total Female Population of Rock Point?
Total Female Population of Rock Point is 218.
What is the Ratio of Males per 100 Females in Rock Point?
There are 124.31 Males per 100 Females in Rock Point.
What is the Ratio of Females per 100 Males in Rock Point?
There are 80.44 Females per 100 Males in Rock Point.
What is the Median Population Age in Rock Point?
Median Population Age in Rock Point is 32.1 Years.
What is the Average Family Size in Rock Point
Average Family Size in Rock Point is 4.7 People.
What is the Average Household Size in Rock Point
Average Household Size in Rock Point is 3.3 People.
How Large is the Labor Force in Rock Point?
There are 145 People in the Labor Forcein in Rock Point.
What is the Percentage of People in the Labor Force in Rock Point?
42.8% of People are in the Labor Force in Rock Point.
What is the Unemployment Rate in Rock Point?
Unemployment Rate in Rock Point is 9.0%.