Kingman, AZ Map & Demographics
Kingman Map
Kingman Overview
$31,806
PER CAPITA INCOME
$63,614
AVG FAMILY INCOME
$56,360
AVG HOUSEHOLD INCOME
17.9%
WAGE / INCOME GAP [ % ]
82.1¢/ $1
WAGE / INCOME GAP [ $ ]
$10,440
FAMILY INCOME DEFICIT
0.44
INEQUALITY / GINI INDEX
33,052
TOTAL POPULATION
16,516
MALE POPULATION
16,536
FEMALE POPULATION
99.88
MALES / 100 FEMALES
100.12
FEMALES / 100 MALES
42.1
MEDIAN AGE
2.8
AVG FAMILY SIZE
2.2
AVG HOUSEHOLD SIZE
13,253
LABOR FORCE [ PEOPLE ]
49.3%
PERCENT IN LABOR FORCE
6.3%
UNEMPLOYMENT RATE
Kingman Area Codes
Income in Kingman
Income Overview in Kingman
Per Capita Income in Kingman is $31,806, while median incomes of families and households are $63,614 and $56,360 respectively.
| Characteristic | Number | Measure |
| Per Capita Income | 33,052 | $31,806 |
| Median Family Income | 8,902 | $63,614 |
| Mean Family Income | 8,902 | $81,862 |
| Median Household Income | 14,029 | $56,360 |
| Mean Household Income | 14,029 | $73,286 |
| Income Deficit | 8,902 | $10,440 |
| Wage / Income Gap (%) | 33,052 | 17.95% |
| Wage / Income Gap ($) | 33,052 | 82.05¢ per $1 |
| Gini / Inequality Index | 33,052 | 0.44 |
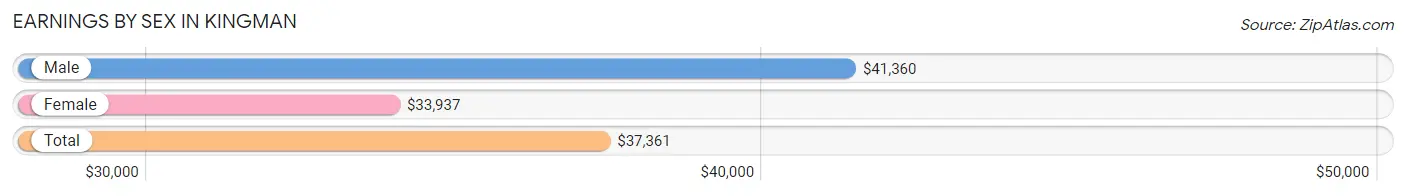
Earnings by Sex in Kingman
Average Earnings in Kingman are $37,361, $41,360 for men and $33,937 for women, a difference of 17.9%.
| Sex | Number | Average Earnings |
| Male | 7,553 (54.1%) | $41,360 |
| Female | 6,395 (45.9%) | $33,937 |
| Total | 13,948 (100.0%) | $37,361 |
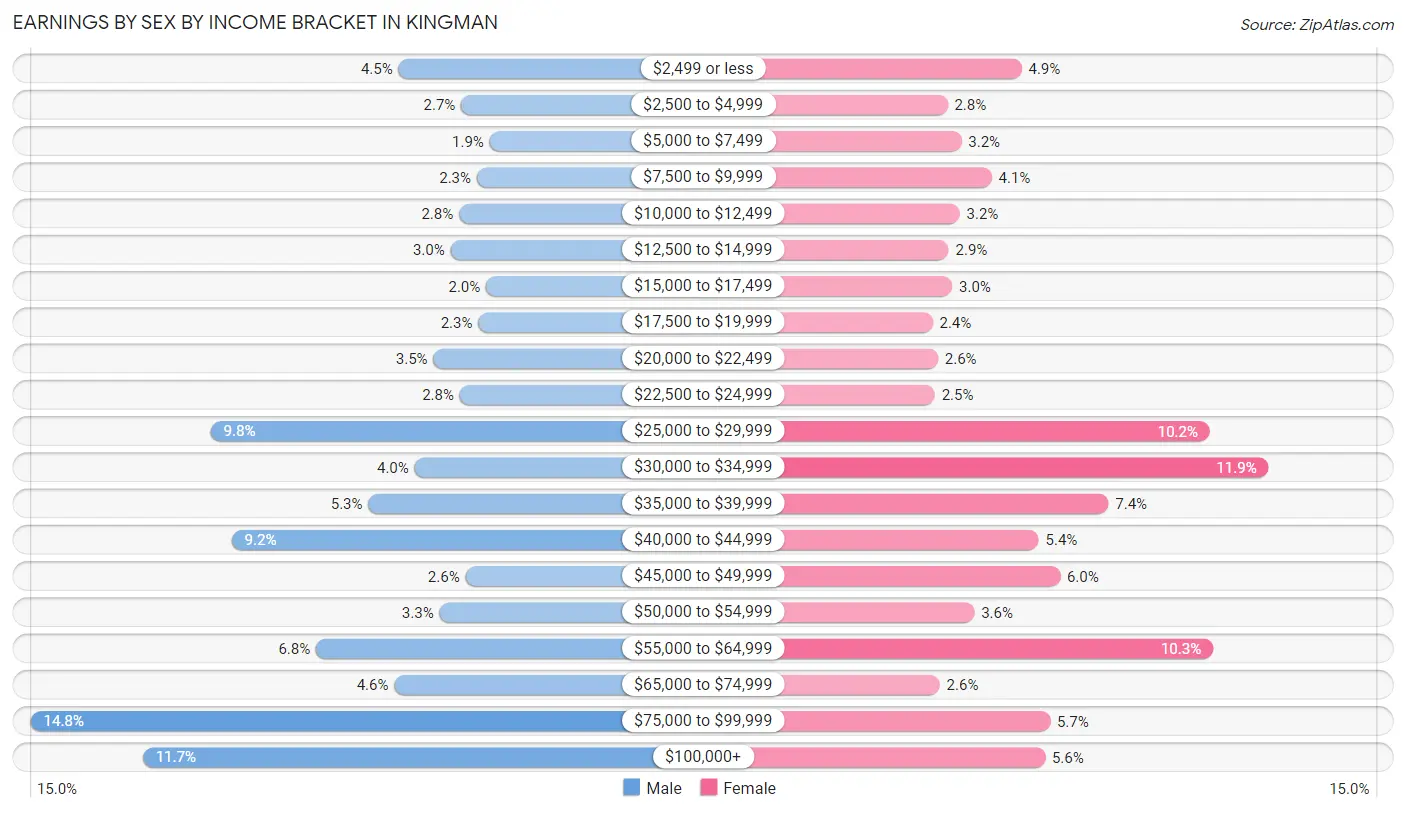
Earnings by Sex by Income Bracket in Kingman
The most common earnings brackets in Kingman are $75,000 to $99,999 for men (1,120 | 14.8%) and $30,000 to $34,999 for women (758 | 11.8%).
| Income | Male | Female |
| $2,499 or less | 339 (4.5%) | 314 (4.9%) |
| $2,500 to $4,999 | 206 (2.7%) | 181 (2.8%) |
| $5,000 to $7,499 | 146 (1.9%) | 206 (3.2%) |
| $7,500 to $9,999 | 173 (2.3%) | 260 (4.1%) |
| $10,000 to $12,499 | 211 (2.8%) | 203 (3.2%) |
| $12,500 to $14,999 | 229 (3.0%) | 183 (2.9%) |
| $15,000 to $17,499 | 153 (2.0%) | 189 (3.0%) |
| $17,500 to $19,999 | 170 (2.2%) | 154 (2.4%) |
| $20,000 to $22,499 | 265 (3.5%) | 164 (2.6%) |
| $22,500 to $24,999 | 209 (2.8%) | 158 (2.5%) |
| $25,000 to $29,999 | 738 (9.8%) | 652 (10.2%) |
| $30,000 to $34,999 | 305 (4.0%) | 758 (11.8%) |
| $35,000 to $39,999 | 403 (5.3%) | 470 (7.3%) |
| $40,000 to $44,999 | 693 (9.2%) | 345 (5.4%) |
| $45,000 to $49,999 | 197 (2.6%) | 383 (6.0%) |
| $50,000 to $54,999 | 252 (3.3%) | 229 (3.6%) |
| $55,000 to $64,999 | 514 (6.8%) | 658 (10.3%) |
| $65,000 to $74,999 | 348 (4.6%) | 167 (2.6%) |
| $75,000 to $99,999 | 1,120 (14.8%) | 365 (5.7%) |
| $100,000+ | 882 (11.7%) | 356 (5.6%) |
| Total | 7,553 (100.0%) | 6,395 (100.0%) |
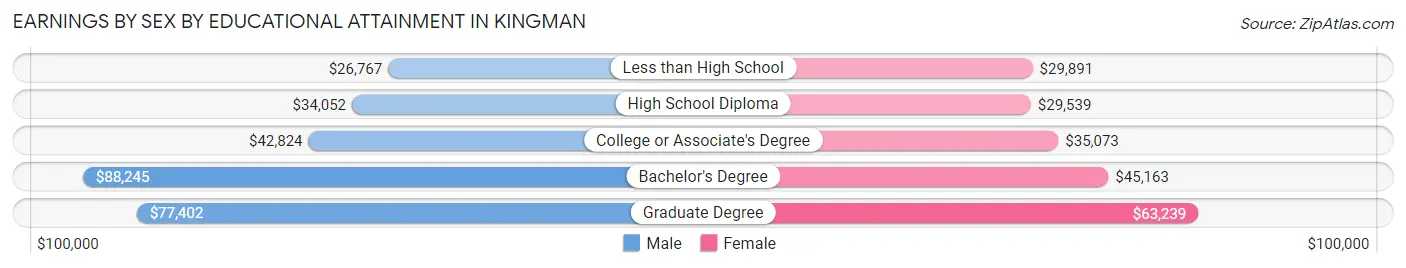
Earnings by Sex by Educational Attainment in Kingman
Average earnings in Kingman are $43,057 for men and $36,027 for women, a difference of 16.3%. Men with an educational attainment of bachelor's degree enjoy the highest average annual earnings of $88,245, while those with less than high school education earn the least with $26,767. Women with an educational attainment of graduate degree earn the most with the average annual earnings of $63,239, while those with high school diploma education have the smallest earnings of $29,539.
| Educational Attainment | Male Income | Female Income |
| Less than High School | $26,767 | $29,891 |
| High School Diploma | $34,052 | $29,539 |
| College or Associate's Degree | $42,824 | $35,073 |
| Bachelor's Degree | $88,245 | $45,163 |
| Graduate Degree | $77,402 | $63,239 |
| Total | $43,057 | $36,027 |
Family Income in Kingman
Family Income Brackets in Kingman
According to the Kingman family income data, there are 2,208 families falling into the $50,000 to $74,999 income range, which is the most common income bracket and makes up 24.8% of all families. Conversely, the less than $10,000 income bracket is the least frequent group with only 187 families (2.1%) belonging to this category.
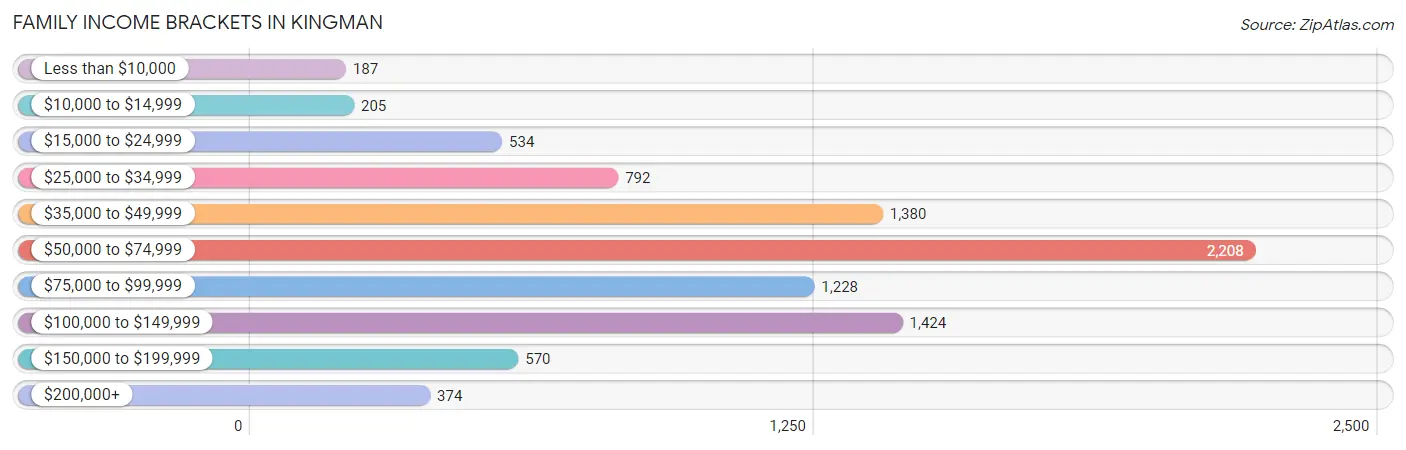
| Income Bracket | # Families | % Families |
| Less than $10,000 | 187 | 2.1% |
| $10,000 to $14,999 | 205 | 2.3% |
| $15,000 to $24,999 | 534 | 6.0% |
| $25,000 to $34,999 | 792 | 8.9% |
| $35,000 to $49,999 | 1,380 | 15.5% |
| $50,000 to $74,999 | 2,208 | 24.8% |
| $75,000 to $99,999 | 1,228 | 13.8% |
| $100,000 to $149,999 | 1,424 | 16.0% |
| $150,000 to $199,999 | 570 | 6.4% |
| $200,000+ | 374 | 4.2% |
Family Income by Famaliy Size in Kingman
7+ person families (200 | 2.2%) account for the highest median family income in Kingman with $106,630 per family, while 2-person families (5,229 | 58.7%) have the highest median income of $31,539 per family member.
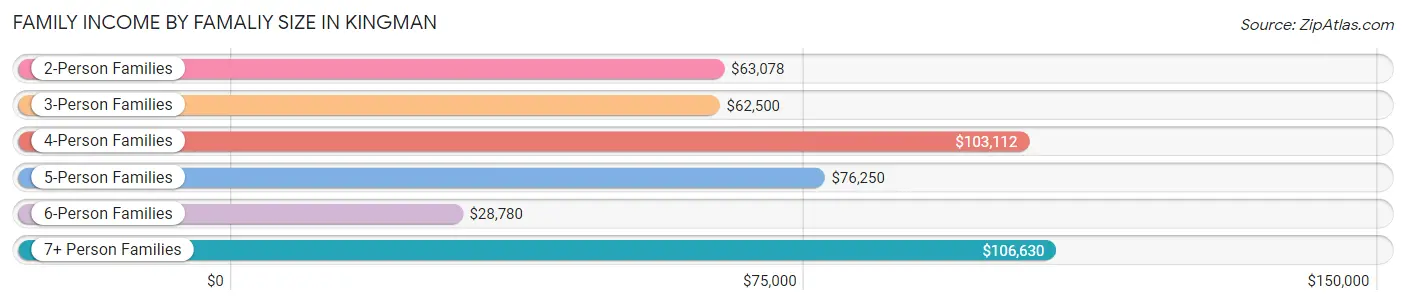
| Income Bracket | # Families | Median Income |
| 2-Person Families | 5,229 (58.7%) | $63,078 |
| 3-Person Families | 1,698 (19.1%) | $62,500 |
| 4-Person Families | 1,081 (12.1%) | $103,112 |
| 5-Person Families | 538 (6.0%) | $76,250 |
| 6-Person Families | 156 (1.8%) | $28,780 |
| 7+ Person Families | 200 (2.2%) | $106,630 |
| Total | 8,902 (100.0%) | $63,614 |
Family Income by Number of Earners in Kingman
The median family income in Kingman is $63,614, with families comprising 3+ earners (277) having the highest median family income of $111,250, while families with 1 earner (3,404) have the lowest median family income of $55,497, accounting for 3.1% and 38.2% of families, respectively.
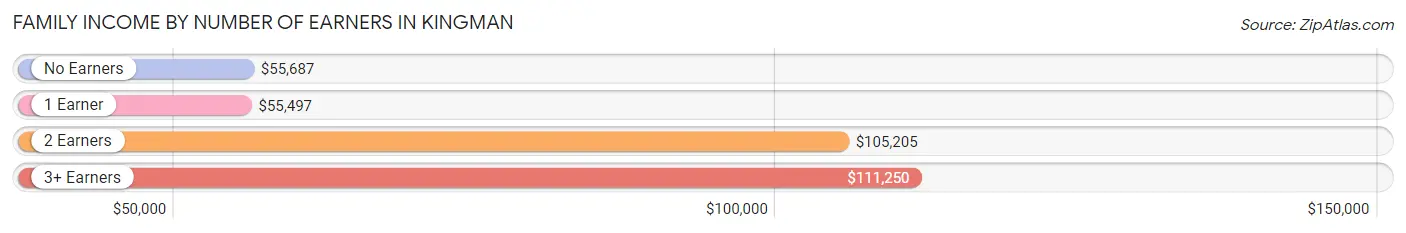
| Number of Earners | # Families | Median Income |
| No Earners | 2,722 (30.6%) | $55,687 |
| 1 Earner | 3,404 (38.2%) | $55,497 |
| 2 Earners | 2,499 (28.1%) | $105,205 |
| 3+ Earners | 277 (3.1%) | $111,250 |
| Total | 8,902 (100.0%) | $63,614 |
Household Income in Kingman
Household Income Brackets in Kingman
With 3,311 households falling in the category, the $50,000 to $74,999 income range is the most frequent in Kingman, accounting for 23.6% of all households. In contrast, only 463 households (3.3%) fall into the $200,000+ income bracket, making it the least populous group.
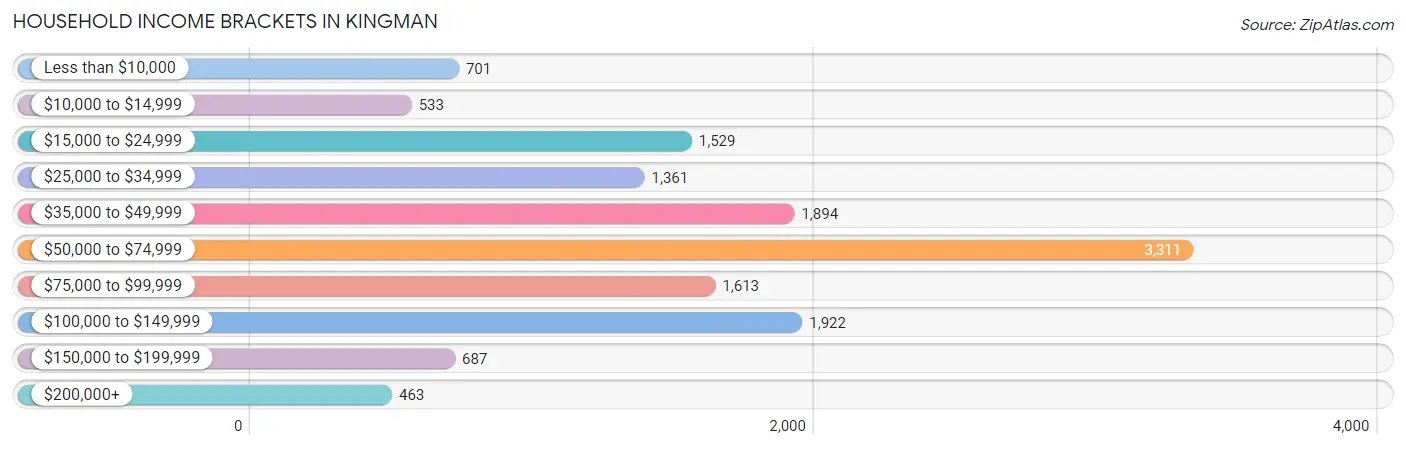
| Income Bracket | # Households | % Households |
| Less than $10,000 | 701 | 5.0% |
| $10,000 to $14,999 | 533 | 3.8% |
| $15,000 to $24,999 | 1,529 | 10.9% |
| $25,000 to $34,999 | 1,361 | 9.7% |
| $35,000 to $49,999 | 1,894 | 13.5% |
| $50,000 to $74,999 | 3,311 | 23.6% |
| $75,000 to $99,999 | 1,613 | 11.5% |
| $100,000 to $149,999 | 1,922 | 13.7% |
| $150,000 to $199,999 | 687 | 4.9% |
| $200,000+ | 463 | 3.3% |
Household Income by Householder Age in Kingman
The median household income in Kingman is $56,360, with the highest median household income of $64,770 found in the 45 to 64 years age bracket for the primary householder. A total of 4,248 households (30.3%) fall into this category. Meanwhile, the 65+ years age bracket for the primary householder has the lowest median household income of $40,953, with 4,772 households (34.0%) in this group.
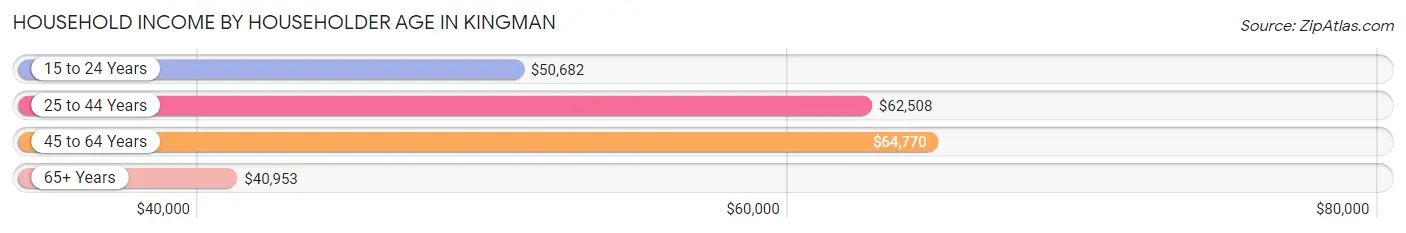
| Income Bracket | # Households | Median Income |
| 15 to 24 Years | 680 (4.9%) | $50,682 |
| 25 to 44 Years | 4,329 (30.9%) | $62,508 |
| 45 to 64 Years | 4,248 (30.3%) | $64,770 |
| 65+ Years | 4,772 (34.0%) | $40,953 |
| Total | 14,029 (100.0%) | $56,360 |
Poverty in Kingman
Income Below Poverty by Sex and Age in Kingman
With 12.3% poverty level for males and 14.5% for females among the residents of Kingman, 16 and 17 year old males and under 5 year old females are the most vulnerable to poverty, with 147 males (27.7%) and 329 females (34.5%) in their respective age groups living below the poverty level.
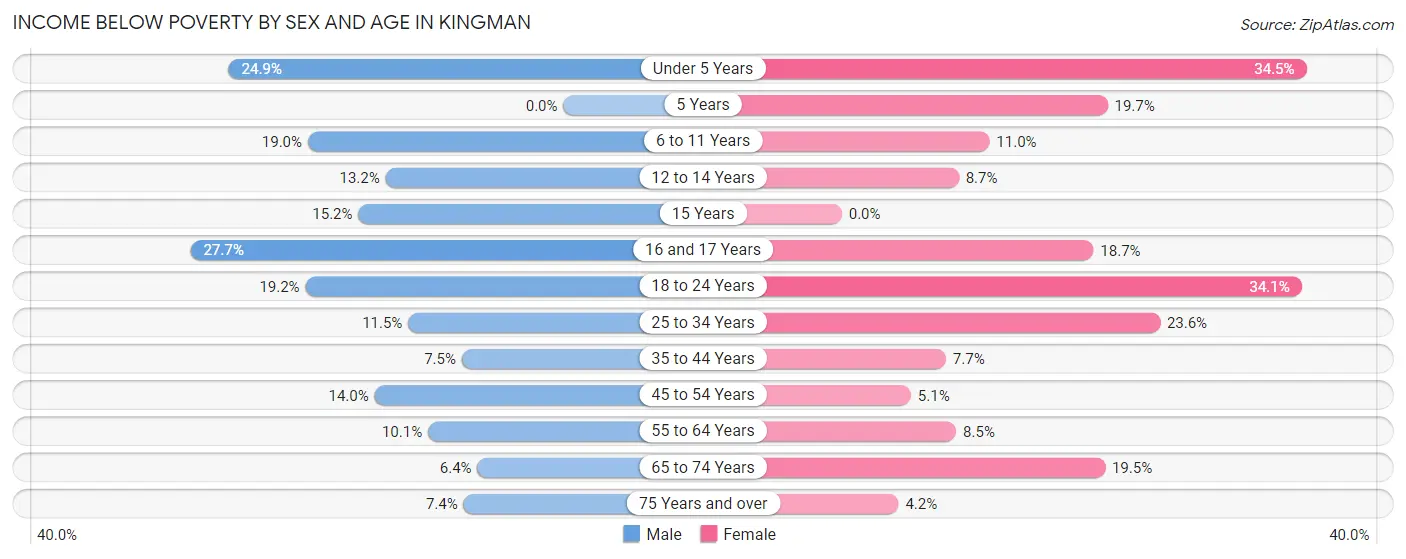
| Age Bracket | Male | Female |
| Under 5 Years | 213 (24.8%) | 329 (34.5%) |
| 5 Years | 0 (0.0%) | 72 (19.7%) |
| 6 to 11 Years | 231 (19.0%) | 95 (11.0%) |
| 12 to 14 Years | 64 (13.2%) | 56 (8.7%) |
| 15 Years | 28 (15.2%) | 0 (0.0%) |
| 16 and 17 Years | 147 (27.7%) | 48 (18.7%) |
| 18 to 24 Years | 175 (19.2%) | 387 (34.1%) |
| 25 to 34 Years | 249 (11.5%) | 478 (23.6%) |
| 35 to 44 Years | 137 (7.5%) | 136 (7.7%) |
| 45 to 54 Years | 166 (14.0%) | 69 (5.1%) |
| 55 to 64 Years | 253 (10.1%) | 196 (8.5%) |
| 65 to 74 Years | 116 (6.4%) | 381 (19.5%) |
| 75 Years and over | 131 (7.4%) | 88 (4.2%) |
| Total | 1,910 (12.3%) | 2,335 (14.5%) |
Income Above Poverty by Sex and Age in Kingman
According to the poverty statistics in Kingman, males aged 5 years and females aged 15 years are the age groups that are most secure financially, with 100.0% of males and 100.0% of females in these age groups living above the poverty line.
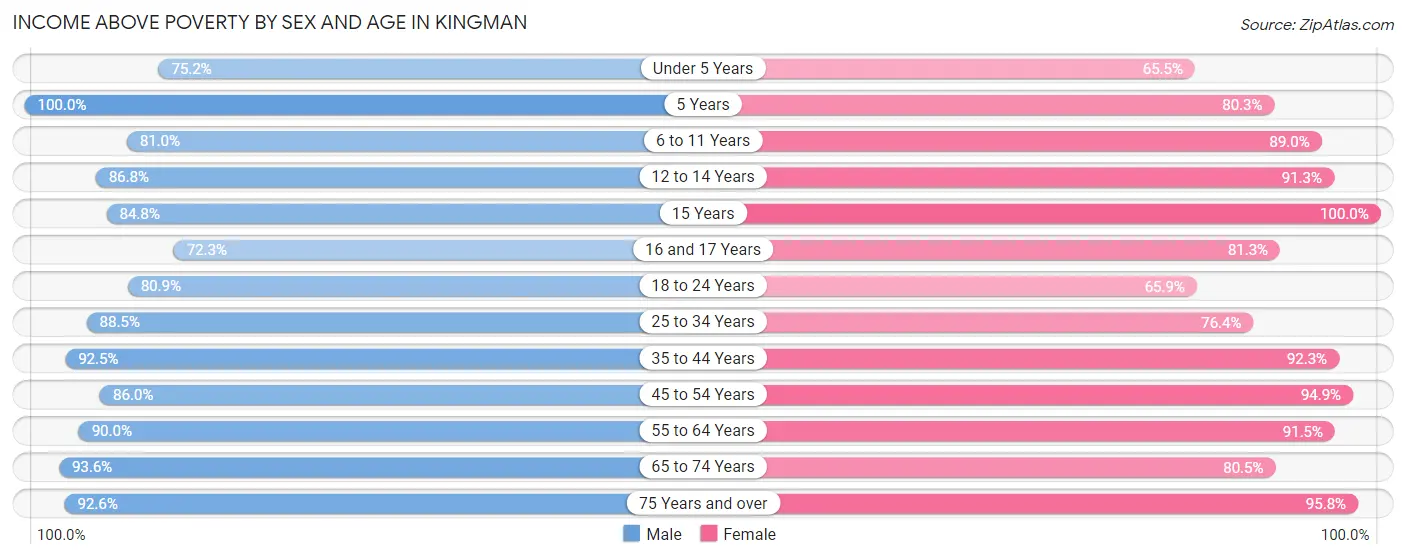
| Age Bracket | Male | Female |
| Under 5 Years | 644 (75.1%) | 625 (65.5%) |
| 5 Years | 91 (100.0%) | 293 (80.3%) |
| 6 to 11 Years | 987 (81.0%) | 772 (89.0%) |
| 12 to 14 Years | 421 (86.8%) | 589 (91.3%) |
| 15 Years | 156 (84.8%) | 408 (100.0%) |
| 16 and 17 Years | 384 (72.3%) | 209 (81.3%) |
| 18 to 24 Years | 739 (80.8%) | 747 (65.9%) |
| 25 to 34 Years | 1,913 (88.5%) | 1,546 (76.4%) |
| 35 to 44 Years | 1,680 (92.5%) | 1,624 (92.3%) |
| 45 to 54 Years | 1,018 (86.0%) | 1,277 (94.9%) |
| 55 to 64 Years | 2,265 (89.9%) | 2,113 (91.5%) |
| 65 to 74 Years | 1,703 (93.6%) | 1,569 (80.5%) |
| 75 Years and over | 1,637 (92.6%) | 2,000 (95.8%) |
| Total | 13,638 (87.7%) | 13,772 (85.5%) |
Income Below Poverty Among Married-Couple Families in Kingman
The poverty statistics for married-couple families in Kingman show that 5.0% or 305 of the total 6,162 families live below the poverty line. Families with 3 or 4 children have the highest poverty rate of 24.1%, comprising of 122 families. On the other hand, families with 5 or more children have the lowest poverty rate of 0.0%, which includes 0 families.
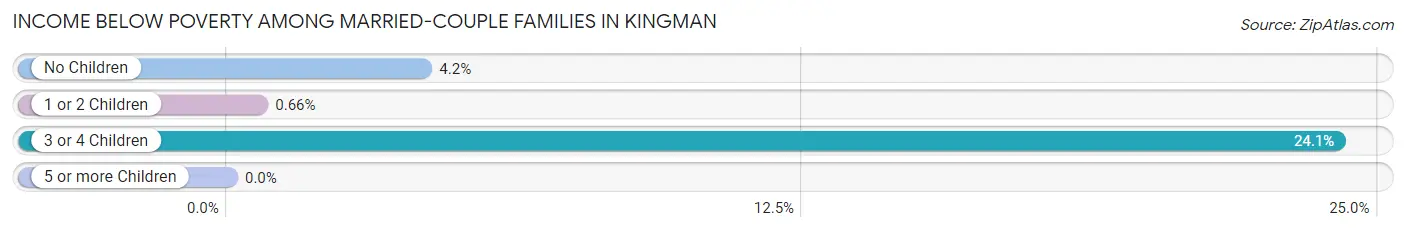
| Children | Above Poverty | Below Poverty |
| No Children | 3,916 (95.8%) | 173 (4.2%) |
| 1 or 2 Children | 1,515 (99.3%) | 10 (0.7%) |
| 3 or 4 Children | 384 (75.9%) | 122 (24.1%) |
| 5 or more Children | 42 (100.0%) | 0 (0.0%) |
| Total | 5,857 (95.1%) | 305 (5.0%) |
Income Below Poverty Among Single-Parent Households in Kingman
According to the poverty data in Kingman, 16.6% or 179 single-father households and 18.8% or 312 single-mother households are living below the poverty line. Among single-father households, those with 5 or more children have the highest poverty rate, with 57 households (100.0%) experiencing poverty. Likewise, among single-mother households, those with 3 or 4 children have the highest poverty rate, with 78 households (38.2%) falling below the poverty line.
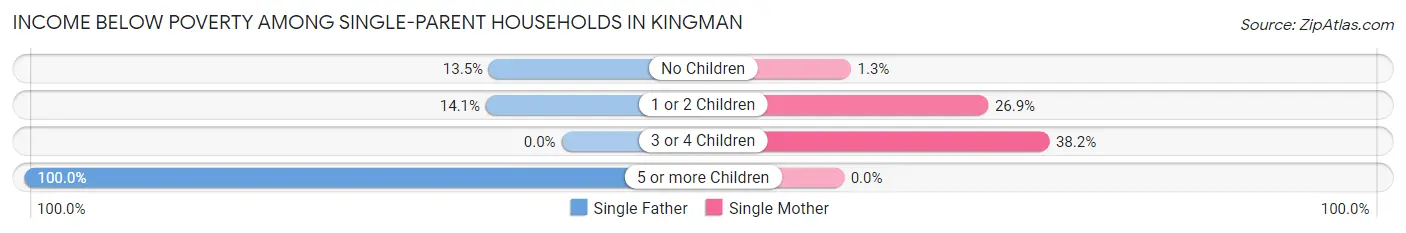
| Children | Single Father | Single Mother |
| No Children | 53 (13.5%) | 8 (1.3%) |
| 1 or 2 Children | 69 (14.1%) | 226 (26.9%) |
| 3 or 4 Children | 0 (0.0%) | 78 (38.2%) |
| 5 or more Children | 57 (100.0%) | 0 (0.0%) |
| Total | 179 (16.6%) | 312 (18.8%) |
Income Below Poverty Among Married-Couple vs Single-Parent Households in Kingman
The poverty data for Kingman shows that 305 of the married-couple family households (5.0%) and 491 of the single-parent households (17.9%) are living below the poverty level. Within the married-couple family households, those with 3 or 4 children have the highest poverty rate, with 122 households (24.1%) falling below the poverty line. Among the single-parent households, those with 5 or more children have the highest poverty rate, with 57 household (100.0%) living below poverty.
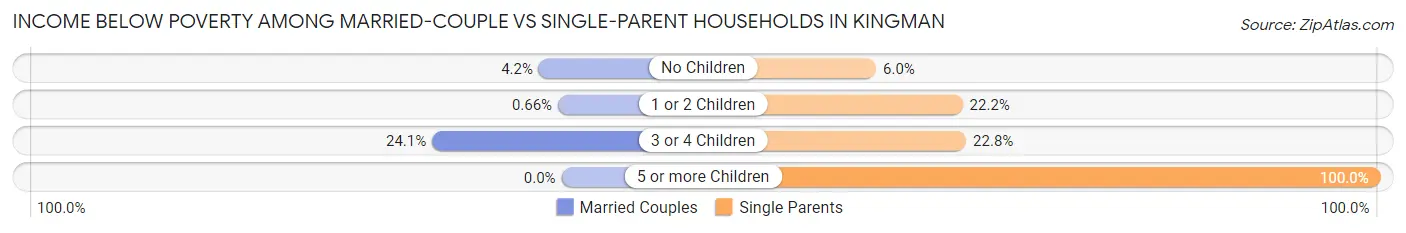
| Children | Married-Couple Families | Single-Parent Households |
| No Children | 173 (4.2%) | 61 (6.0%) |
| 1 or 2 Children | 10 (0.7%) | 295 (22.2%) |
| 3 or 4 Children | 122 (24.1%) | 78 (22.8%) |
| 5 or more Children | 0 (0.0%) | 57 (100.0%) |
| Total | 305 (5.0%) | 491 (17.9%) |
Race in Kingman
The most populous races in Kingman are White / Caucasian (28,168 | 85.2%), Hispanic or Latino (5,492 | 16.6%), and Two or more Races (2,433 | 7.4%).
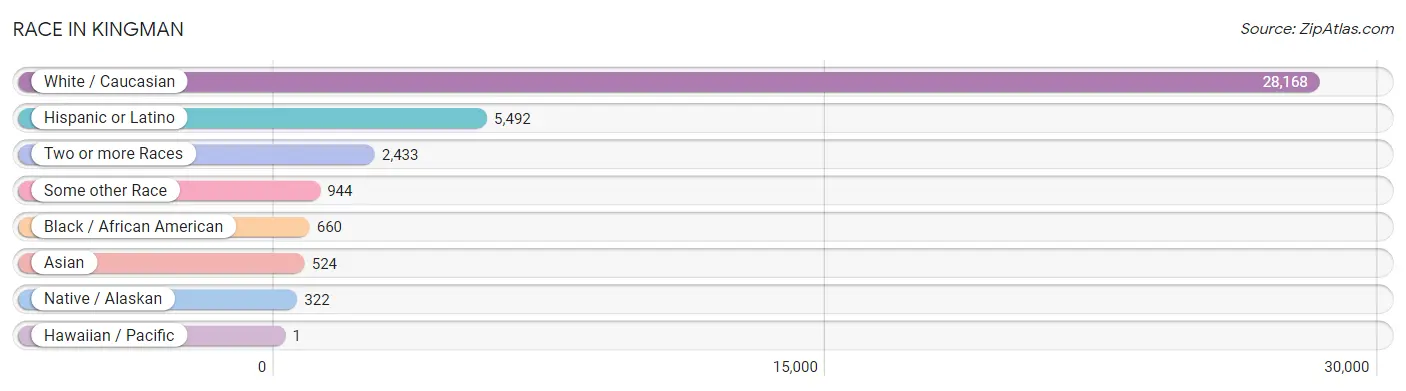
| Race | # Population | % Population |
| Asian | 524 | 1.6% |
| Black / African American | 660 | 2.0% |
| Hawaiian / Pacific | 1 | 0.0% |
| Hispanic or Latino | 5,492 | 16.6% |
| Native / Alaskan | 322 | 1.0% |
| White / Caucasian | 28,168 | 85.2% |
| Two or more Races | 2,433 | 7.4% |
| Some other Race | 944 | 2.9% |
| Total | 33,052 | 100.0% |
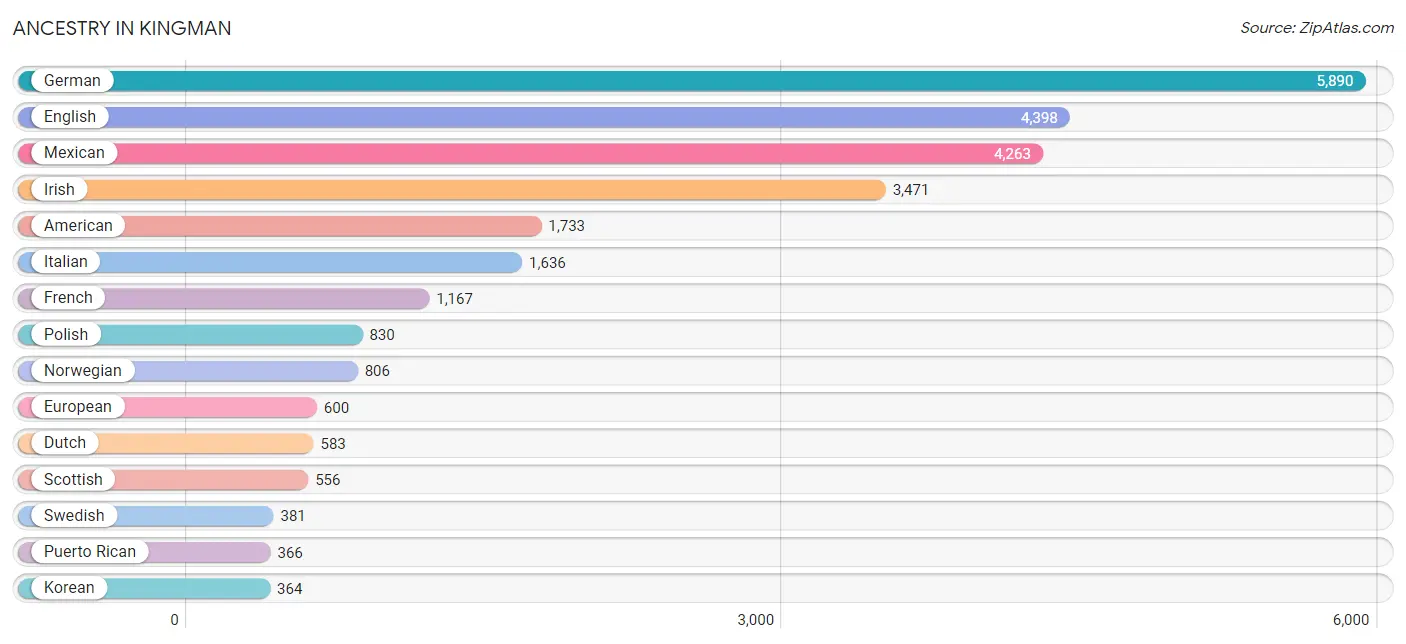
Ancestry in Kingman
The most populous ancestries reported in Kingman are German (5,890 | 17.8%), English (4,398 | 13.3%), Mexican (4,263 | 12.9%), Irish (3,471 | 10.5%), and American (1,733 | 5.2%), together accounting for 59.8% of all Kingman residents.
| Ancestry | # Population | % Population |
| African | 21 | 0.1% |
| American | 1,733 | 5.2% |
| Apache | 47 | 0.1% |
| Arab | 98 | 0.3% |
| Argentinean | 22 | 0.1% |
| Armenian | 6 | 0.0% |
| Australian | 9 | 0.0% |
| Austrian | 9 | 0.0% |
| Belgian | 13 | 0.0% |
| Bhutanese | 178 | 0.5% |
| Blackfeet | 9 | 0.0% |
| Brazilian | 97 | 0.3% |
| British | 250 | 0.8% |
| Burmese | 47 | 0.1% |
| Canadian | 30 | 0.1% |
| Central American | 88 | 0.3% |
| Cherokee | 71 | 0.2% |
| Cheyenne | 1 | 0.0% |
| Chickasaw | 12 | 0.0% |
| Chippewa | 9 | 0.0% |
| Colombian | 10 | 0.0% |
| Comanche | 17 | 0.1% |
| Cuban | 99 | 0.3% |
| Czech | 99 | 0.3% |
| Czechoslovakian | 50 | 0.2% |
| Danish | 88 | 0.3% |
| Dutch | 583 | 1.8% |
| Eastern European | 120 | 0.4% |
| Egyptian | 71 | 0.2% |
| English | 4,398 | 13.3% |
| Ethiopian | 73 | 0.2% |
| European | 600 | 1.8% |
| Finnish | 40 | 0.1% |
| French | 1,167 | 3.5% |
| French Canadian | 162 | 0.5% |
| German | 5,890 | 17.8% |
| Greek | 52 | 0.2% |
| Guatemalan | 32 | 0.1% |
| Honduran | 25 | 0.1% |
| Hopi | 5 | 0.0% |
| Hungarian | 155 | 0.5% |
| Indian (Asian) | 10 | 0.0% |
| Irish | 3,471 | 10.5% |
| Israeli | 92 | 0.3% |
| Italian | 1,636 | 5.0% |
| Korean | 364 | 1.1% |
| Lebanese | 27 | 0.1% |
| Luxembourger | 36 | 0.1% |
| Mexican | 4,263 | 12.9% |
| Native Hawaiian | 94 | 0.3% |
| Navajo | 99 | 0.3% |
| Nicaraguan | 16 | 0.1% |
| Northern European | 16 | 0.1% |
| Norwegian | 806 | 2.4% |
| Pakistani | 180 | 0.5% |
| Pennsylvania German | 41 | 0.1% |
| Peruvian | 130 | 0.4% |
| Pima | 10 | 0.0% |
| Polish | 830 | 2.5% |
| Portuguese | 209 | 0.6% |
| Puerto Rican | 366 | 1.1% |
| Russian | 330 | 1.0% |
| Salvadoran | 15 | 0.1% |
| Samoan | 1 | 0.0% |
| Scandinavian | 110 | 0.3% |
| Scotch-Irish | 325 | 1.0% |
| Scottish | 556 | 1.7% |
| Serbian | 23 | 0.1% |
| Sioux | 26 | 0.1% |
| Slovene | 17 | 0.1% |
| South African | 13 | 0.0% |
| South American | 174 | 0.5% |
| Spaniard | 292 | 0.9% |
| Spanish | 27 | 0.1% |
| Sri Lankan | 25 | 0.1% |
| Subsaharan African | 107 | 0.3% |
| Swedish | 381 | 1.1% |
| Swiss | 73 | 0.2% |
| Thai | 96 | 0.3% |
| Tohono O'Odham | 4 | 0.0% |
| Ukrainian | 60 | 0.2% |
| Uruguayan | 12 | 0.0% |
| Welsh | 302 | 0.9% |
| Yaqui | 40 | 0.1% |
| Yugoslavian | 20 | 0.1% |
| Yuman | 94 | 0.3% | View All 86 Rows |
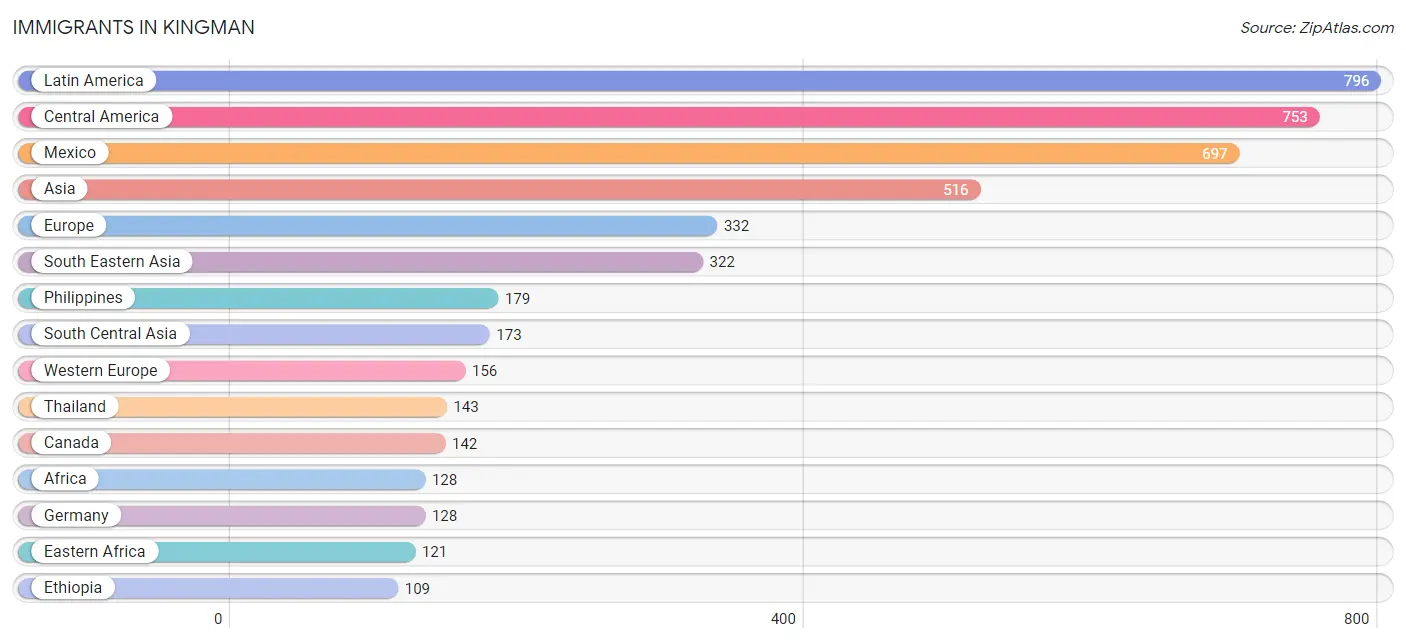
Immigrants in Kingman
The most numerous immigrant groups reported in Kingman came from Latin America (796 | 2.4%), Central America (753 | 2.3%), Mexico (697 | 2.1%), Asia (516 | 1.6%), and Europe (332 | 1.0%), together accounting for 9.4% of all Kingman residents.
| Immigration Origin | # Population | % Population |
| Africa | 128 | 0.4% |
| Asia | 516 | 1.6% |
| Canada | 142 | 0.4% |
| Caribbean | 21 | 0.1% |
| Central America | 753 | 2.3% |
| China | 10 | 0.0% |
| Colombia | 10 | 0.0% |
| Eastern Africa | 121 | 0.4% |
| Eastern Asia | 21 | 0.1% |
| Eastern Europe | 49 | 0.2% |
| El Salvador | 15 | 0.1% |
| England | 46 | 0.1% |
| Ethiopia | 109 | 0.3% |
| Europe | 332 | 1.0% |
| France | 28 | 0.1% |
| Germany | 128 | 0.4% |
| Honduras | 25 | 0.1% |
| Hungary | 27 | 0.1% |
| India | 25 | 0.1% |
| Iran | 68 | 0.2% |
| Ireland | 9 | 0.0% |
| Italy | 72 | 0.2% |
| Korea | 11 | 0.0% |
| Latin America | 796 | 2.4% |
| Mexico | 697 | 2.1% |
| Morocco | 7 | 0.0% |
| Nicaragua | 16 | 0.1% |
| Northern Africa | 7 | 0.0% |
| Northern Europe | 55 | 0.2% |
| Pakistan | 80 | 0.2% |
| Philippines | 179 | 0.5% |
| Poland | 22 | 0.1% |
| South America | 22 | 0.1% |
| South Central Asia | 173 | 0.5% |
| South Eastern Asia | 322 | 1.0% |
| Southern Europe | 72 | 0.2% |
| Thailand | 143 | 0.4% |
| Trinidad and Tobago | 21 | 0.1% |
| Uruguay | 12 | 0.0% |
| Western Europe | 156 | 0.5% | View All 40 Rows |
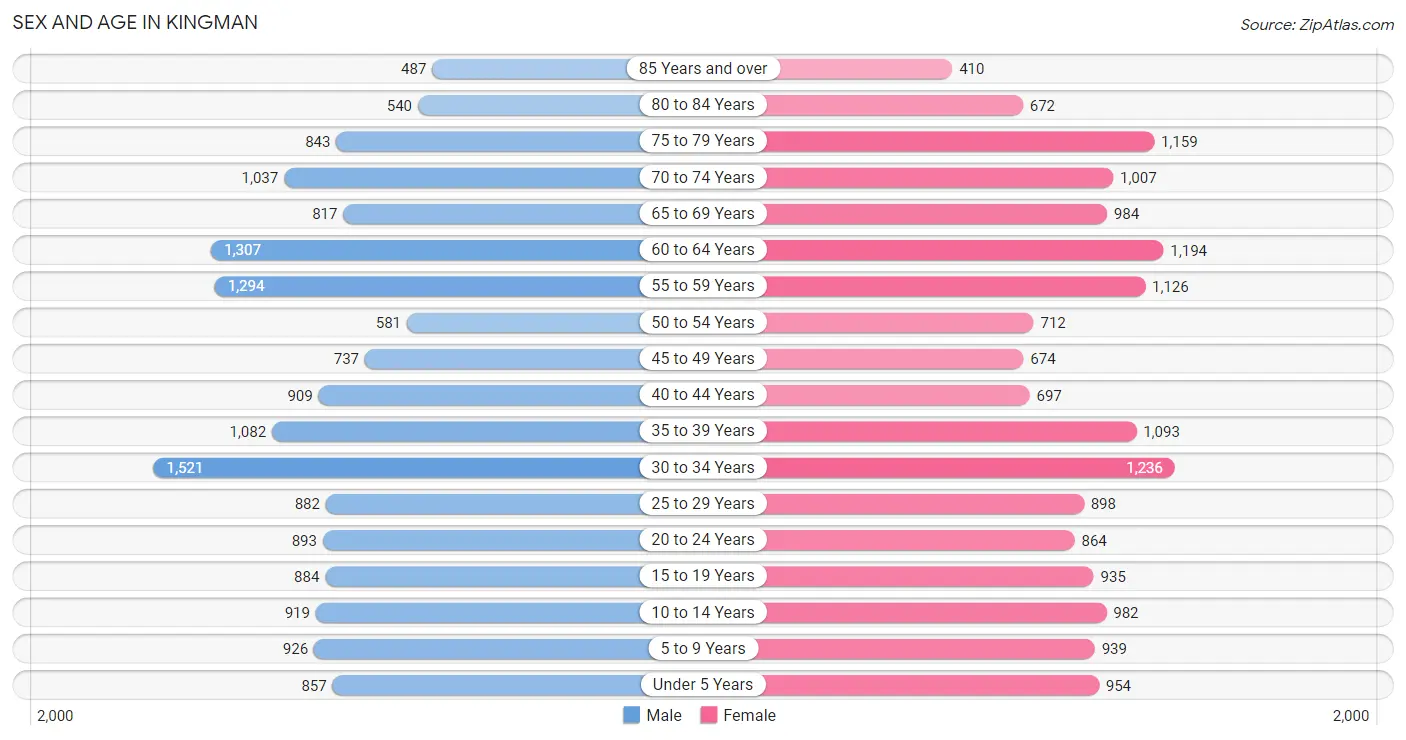
Sex and Age in Kingman
Sex and Age in Kingman
The most populous age groups in Kingman are 30 to 34 Years (1,521 | 9.2%) for men and 30 to 34 Years (1,236 | 7.5%) for women.
| Age Bracket | Male | Female |
| Under 5 Years | 857 (5.2%) | 954 (5.8%) |
| 5 to 9 Years | 926 (5.6%) | 939 (5.7%) |
| 10 to 14 Years | 919 (5.6%) | 982 (5.9%) |
| 15 to 19 Years | 884 (5.3%) | 935 (5.7%) |
| 20 to 24 Years | 893 (5.4%) | 864 (5.2%) |
| 25 to 29 Years | 882 (5.3%) | 898 (5.4%) |
| 30 to 34 Years | 1,521 (9.2%) | 1,236 (7.5%) |
| 35 to 39 Years | 1,082 (6.6%) | 1,093 (6.6%) |
| 40 to 44 Years | 909 (5.5%) | 697 (4.2%) |
| 45 to 49 Years | 737 (4.5%) | 674 (4.1%) |
| 50 to 54 Years | 581 (3.5%) | 712 (4.3%) |
| 55 to 59 Years | 1,294 (7.8%) | 1,126 (6.8%) |
| 60 to 64 Years | 1,307 (7.9%) | 1,194 (7.2%) |
| 65 to 69 Years | 817 (5.0%) | 984 (5.9%) |
| 70 to 74 Years | 1,037 (6.3%) | 1,007 (6.1%) |
| 75 to 79 Years | 843 (5.1%) | 1,159 (7.0%) |
| 80 to 84 Years | 540 (3.3%) | 672 (4.1%) |
| 85 Years and over | 487 (2.9%) | 410 (2.5%) |
| Total | 16,516 (100.0%) | 16,536 (100.0%) |
Families and Households in Kingman
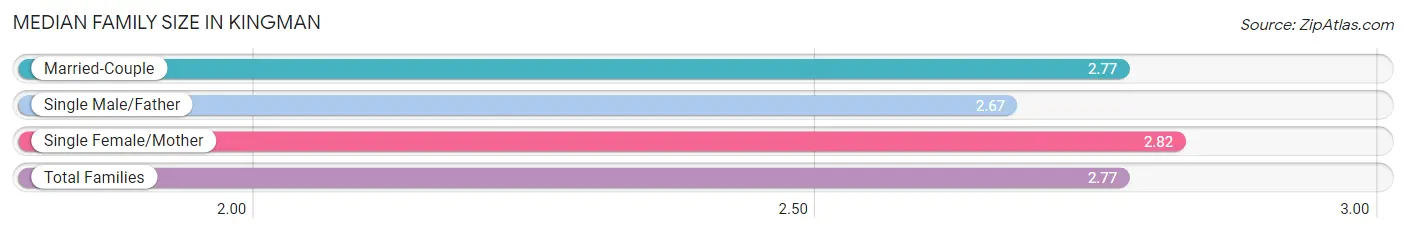
Median Family Size in Kingman
The median family size in Kingman is 2.77 persons per family, with single female/mother families (1,663 | 18.7%) accounting for the largest median family size of 2.82 persons per family. On the other hand, single male/father families (1,077 | 12.1%) represent the smallest median family size with 2.67 persons per family.
| Family Type | # Families | Family Size |
| Married-Couple | 6,162 (69.2%) | 2.77 |
| Single Male/Father | 1,077 (12.1%) | 2.67 |
| Single Female/Mother | 1,663 (18.7%) | 2.82 |
| Total Families | 8,902 (100.0%) | 2.77 |
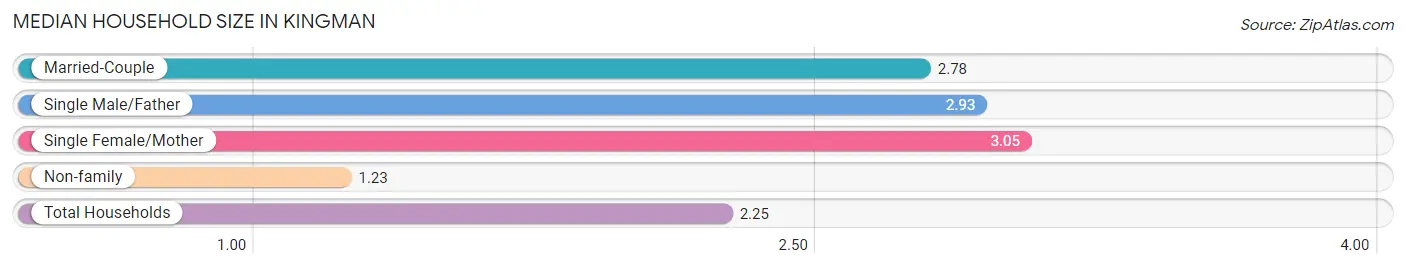
Median Household Size in Kingman
The median household size in Kingman is 2.25 persons per household, with single female/mother households (1,663 | 11.8%) accounting for the largest median household size of 3.05 persons per household. non-family households (5,127 | 36.5%) represent the smallest median household size with 1.23 persons per household.
| Household Type | # Households | Household Size |
| Married-Couple | 6,162 (43.9%) | 2.78 |
| Single Male/Father | 1,077 (7.7%) | 2.93 |
| Single Female/Mother | 1,663 (11.8%) | 3.05 |
| Non-family | 5,127 (36.5%) | 1.23 |
| Total Households | 14,029 (100.0%) | 2.25 |
Household Size by Marriage Status in Kingman
Out of a total of 14,029 households in Kingman, 8,902 (63.4%) are family households, while 5,127 (36.5%) are nonfamily households. The most numerous type of family households are 2-person households, comprising 4,895, and the most common type of nonfamily households are 1-person households, comprising 4,102.
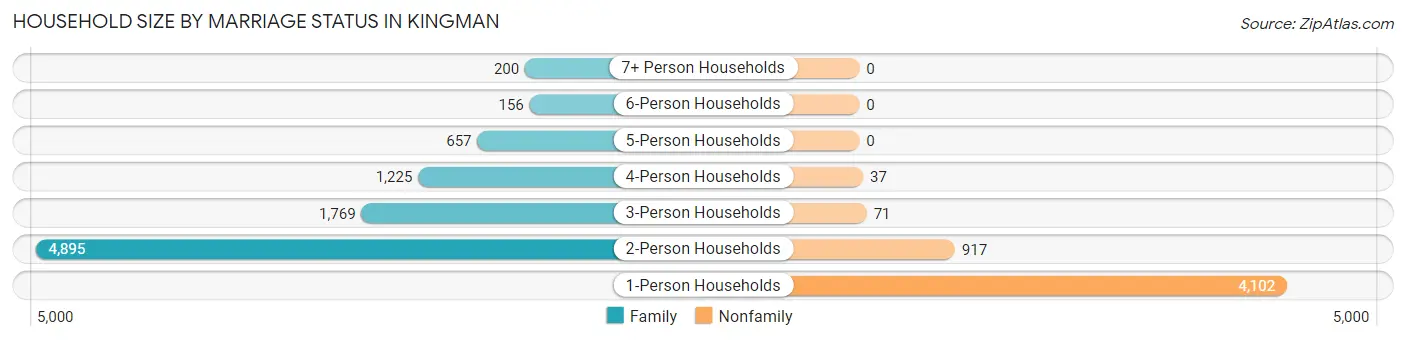
| Household Size | Family Households | Nonfamily Households |
| 1-Person Households | - | 4,102 (29.2%) |
| 2-Person Households | 4,895 (34.9%) | 917 (6.5%) |
| 3-Person Households | 1,769 (12.6%) | 71 (0.5%) |
| 4-Person Households | 1,225 (8.7%) | 37 (0.3%) |
| 5-Person Households | 657 (4.7%) | 0 (0.0%) |
| 6-Person Households | 156 (1.1%) | 0 (0.0%) |
| 7+ Person Households | 200 (1.4%) | 0 (0.0%) |
| Total | 8,902 (63.4%) | 5,127 (36.5%) |
Female Fertility in Kingman
Fertility by Age in Kingman
Average fertility rate in Kingman is 63.0 births per 1,000 women. Women in the age bracket of 15 to 19 years have the highest fertility rate with 114.0 births per 1,000 women. Women in the age bracket of 20 to 34 years acount for 66.7% of all women with births.
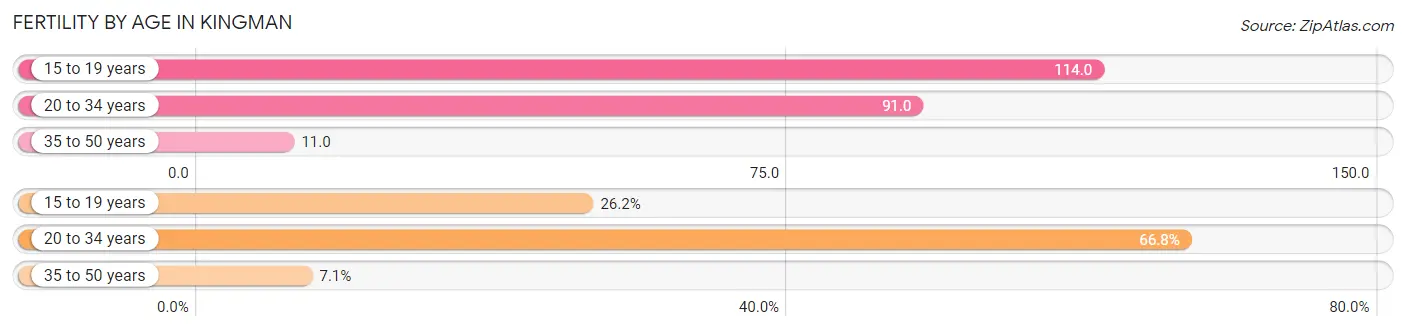
| Age Bracket | Women with Births | Births / 1,000 Women |
| 15 to 19 years | 107 (26.2%) | 114.0 |
| 20 to 34 years | 273 (66.7%) | 91.0 |
| 35 to 50 years | 29 (7.1%) | 11.0 |
| Total | 409 (100.0%) | 63.0 |
Fertility by Age by Marriage Status in Kingman
82.6% of women with births (409) in Kingman are married. The highest percentage of unmarried women with births falls into 15 to 19 years age bracket with 66.4% of them unmarried at the time of birth, while the lowest percentage of unmarried women with births belong to 20 to 34 years age bracket with 0.0% of them unmarried.
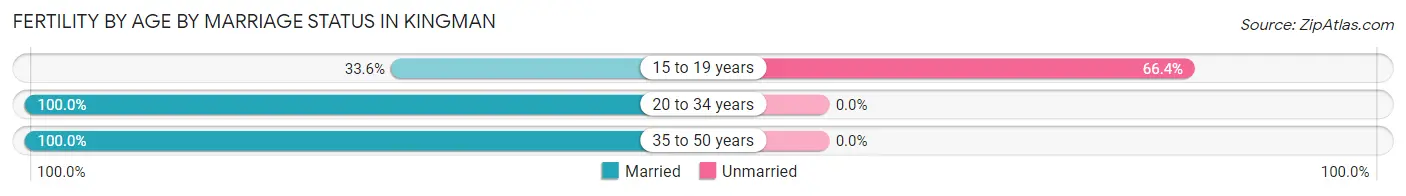
| Age Bracket | Married | Unmarried |
| 15 to 19 years | 36 (33.6%) | 71 (66.4%) |
| 20 to 34 years | 273 (100.0%) | 0 (0.0%) |
| 35 to 50 years | 29 (100.0%) | 0 (0.0%) |
| Total | 338 (82.6%) | 71 (17.4%) |
Fertility by Education in Kingman
Average fertility rate in Kingman is 63.0 births per 1,000 women. Women with the education attainment of less than high school have the highest fertility rate of 103.0 births per 1,000 women, while women with the education attainment of college or associate's degree have the lowest fertility at 26.0 births per 1,000 women. Women with the education attainment of high school diploma represent 38.1% of all women with births.
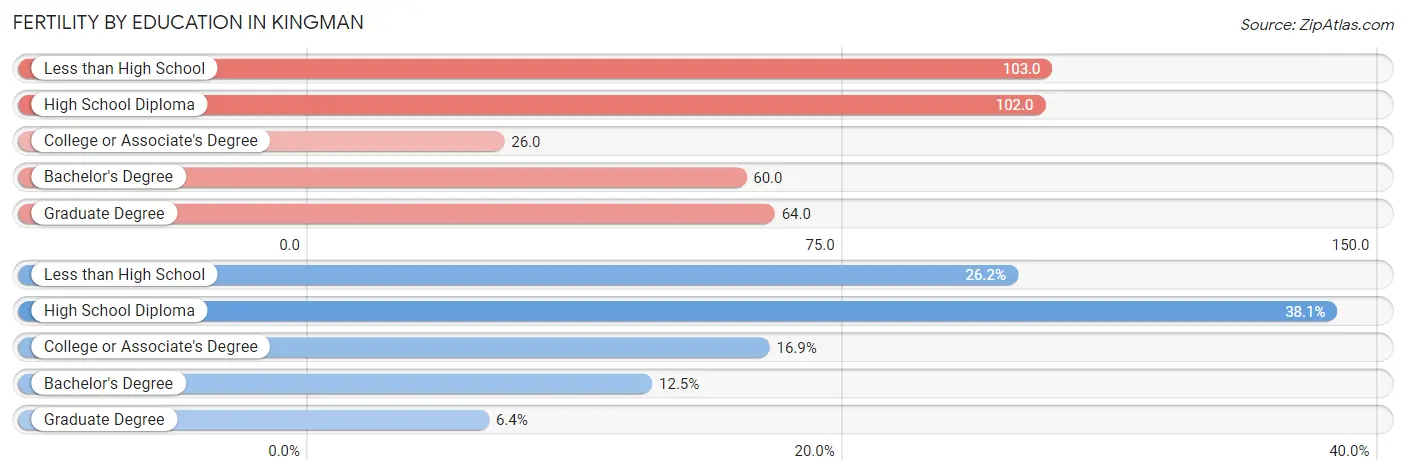
| Educational Attainment | Women with Births | Births / 1,000 Women |
| Less than High School | 107 (26.2%) | 103.0 |
| High School Diploma | 156 (38.1%) | 102.0 |
| College or Associate's Degree | 69 (16.9%) | 26.0 |
| Bachelor's Degree | 51 (12.5%) | 60.0 |
| Graduate Degree | 26 (6.4%) | 64.0 |
| Total | 409 (100.0%) | 63.0 |
Fertility by Education by Marriage Status in Kingman
17.4% of women with births in Kingman are unmarried. Women with the educational attainment of high school diploma are most likely to be married with 100.0% of them married at childbirth, while women with the educational attainment of less than high school are least likely to be married with 66.4% of them unmarried at childbirth.
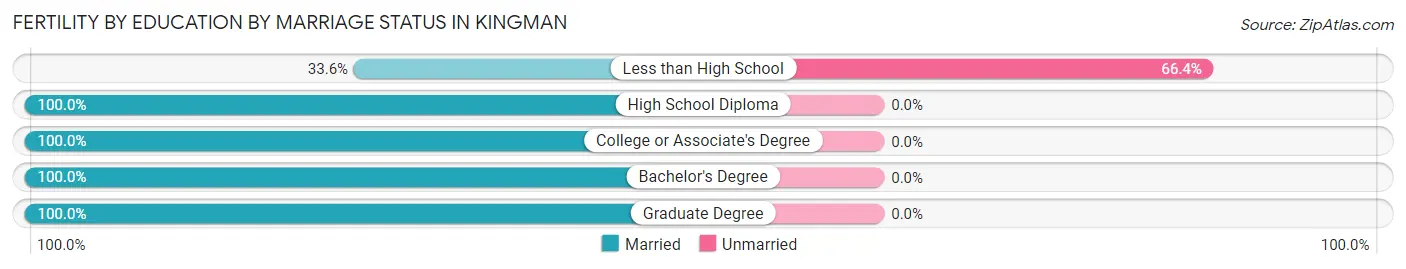
| Educational Attainment | Married | Unmarried |
| Less than High School | 36 (33.6%) | 71 (66.4%) |
| High School Diploma | 156 (100.0%) | 0 (0.0%) |
| College or Associate's Degree | 69 (100.0%) | 0 (0.0%) |
| Bachelor's Degree | 51 (100.0%) | 0 (0.0%) |
| Graduate Degree | 26 (100.0%) | 0 (0.0%) |
| Total | 338 (82.6%) | 71 (17.4%) |
Employment Characteristics in Kingman
Employment by Class of Employer in Kingman
Among the 12,123 employed individuals in Kingman, private company employees (6,230 | 51.4%), local government employees (1,674 | 13.8%), and not-for-profit organizations (1,395 | 11.5%) make up the most common classes of employment.
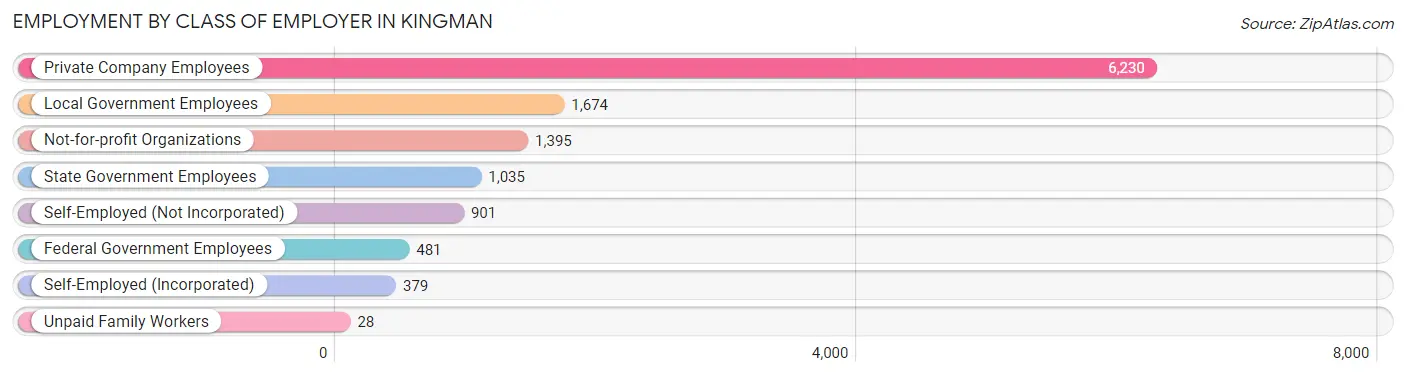
| Employer Class | # Employees | % Employees |
| Private Company Employees | 6,230 | 51.4% |
| Self-Employed (Incorporated) | 379 | 3.1% |
| Self-Employed (Not Incorporated) | 901 | 7.4% |
| Not-for-profit Organizations | 1,395 | 11.5% |
| Local Government Employees | 1,674 | 13.8% |
| State Government Employees | 1,035 | 8.5% |
| Federal Government Employees | 481 | 4.0% |
| Unpaid Family Workers | 28 | 0.2% |
| Total | 12,123 | 100.0% |
Employment Status by Age in Kingman
According to the labor force statistics for Kingman, out of the total population over 16 years of age (26,883), 49.3% or 13,253 individuals are in the labor force, with 6.3% or 835 of them unemployed. The age group with the highest labor force participation rate is 35 to 44 years, with 81.8% or 3,093 individuals in the labor force. Within the labor force, the 16 to 19 years age range has the highest percentage of unemployed individuals, with 21.6% or 69 of them being unemployed.
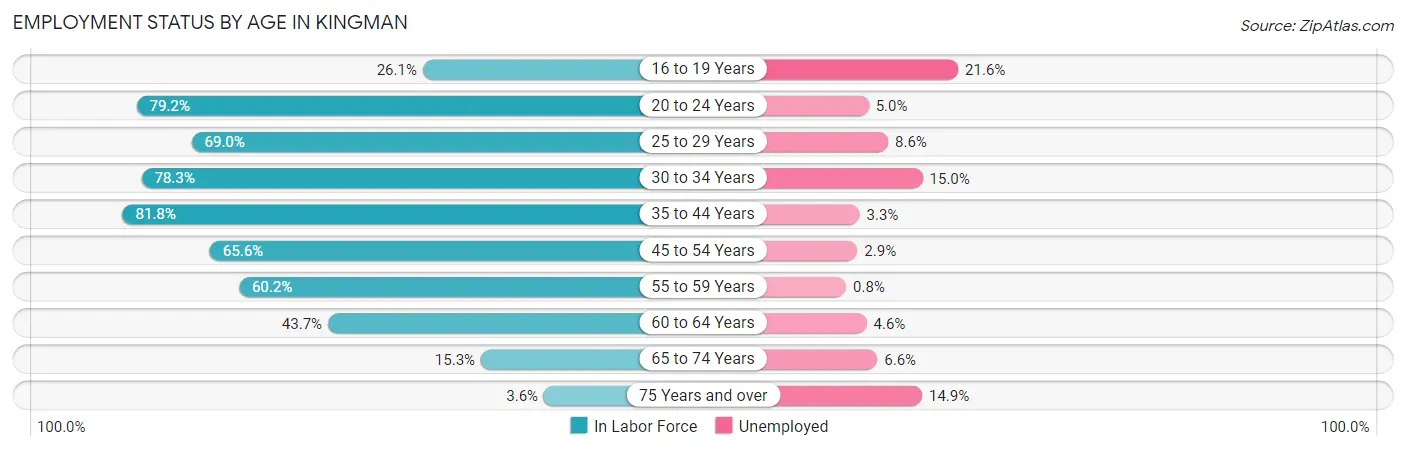
| Age Bracket | In Labor Force | Unemployed |
| 16 to 19 Years | 320 (26.1%) | 69 (21.6%) |
| 20 to 24 Years | 1,392 (79.2%) | 70 (5.0%) |
| 25 to 29 Years | 1,228 (69.0%) | 106 (8.6%) |
| 30 to 34 Years | 2,159 (78.3%) | 324 (15.0%) |
| 35 to 44 Years | 3,093 (81.8%) | 102 (3.3%) |
| 45 to 54 Years | 1,774 (65.6%) | 51 (2.9%) |
| 55 to 59 Years | 1,457 (60.2%) | 12 (0.8%) |
| 60 to 64 Years | 1,093 (43.7%) | 50 (4.6%) |
| 65 to 74 Years | 588 (15.3%) | 39 (6.6%) |
| 75 Years and over | 148 (3.6%) | 22 (14.9%) |
| Total | 13,253 (49.3%) | 835 (6.3%) |
Employment Status by Educational Attainment in Kingman
According to labor force statistics for Kingman, 67.8% of individuals (10,809) out of the total population between 25 and 64 years of age (15,943) are in the labor force, with 5.9% or 638 of them being unemployed. The group with the highest labor force participation rate are those with the educational attainment of bachelor's degree or higher, with 83.9% or 2,936 individuals in the labor force. Within the labor force, individuals with less than high school education have the highest percentage of unemployment, with 13.5% or 105 of them being unemployed.
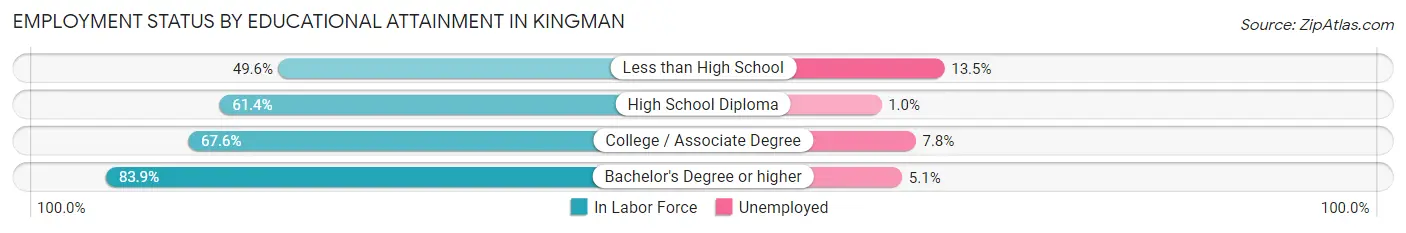
| Educational Attainment | In Labor Force | Unemployed |
| Less than High School | 777 (49.6%) | 211 (13.5%) |
| High School Diploma | 2,613 (61.4%) | 43 (1.0%) |
| College / Associate Degree | 4,476 (67.6%) | 517 (7.8%) |
| Bachelor's Degree or higher | 2,936 (83.9%) | 178 (5.1%) |
| Total | 10,809 (67.8%) | 941 (5.9%) |
Employment Occupations by Sex in Kingman
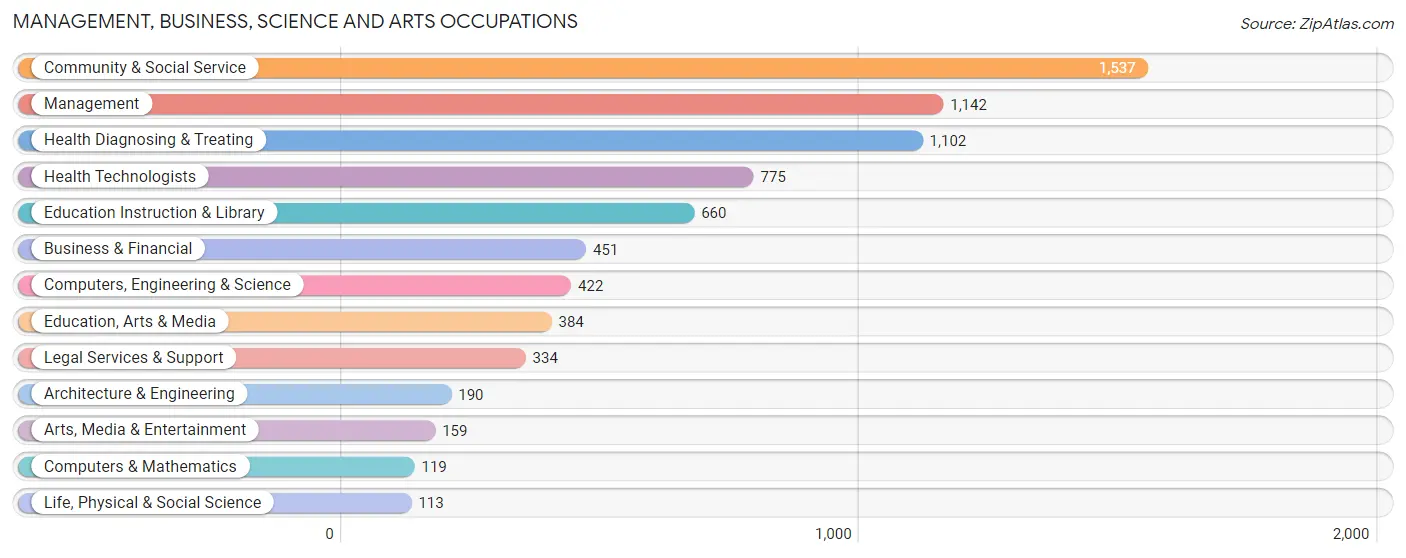
Management, Business, Science and Arts Occupations
The most common Management, Business, Science and Arts occupations in Kingman are Community & Social Service (1,537 | 12.5%), Management (1,142 | 9.3%), Health Diagnosing & Treating (1,102 | 8.9%), Health Technologists (775 | 6.3%), and Education Instruction & Library (660 | 5.4%).
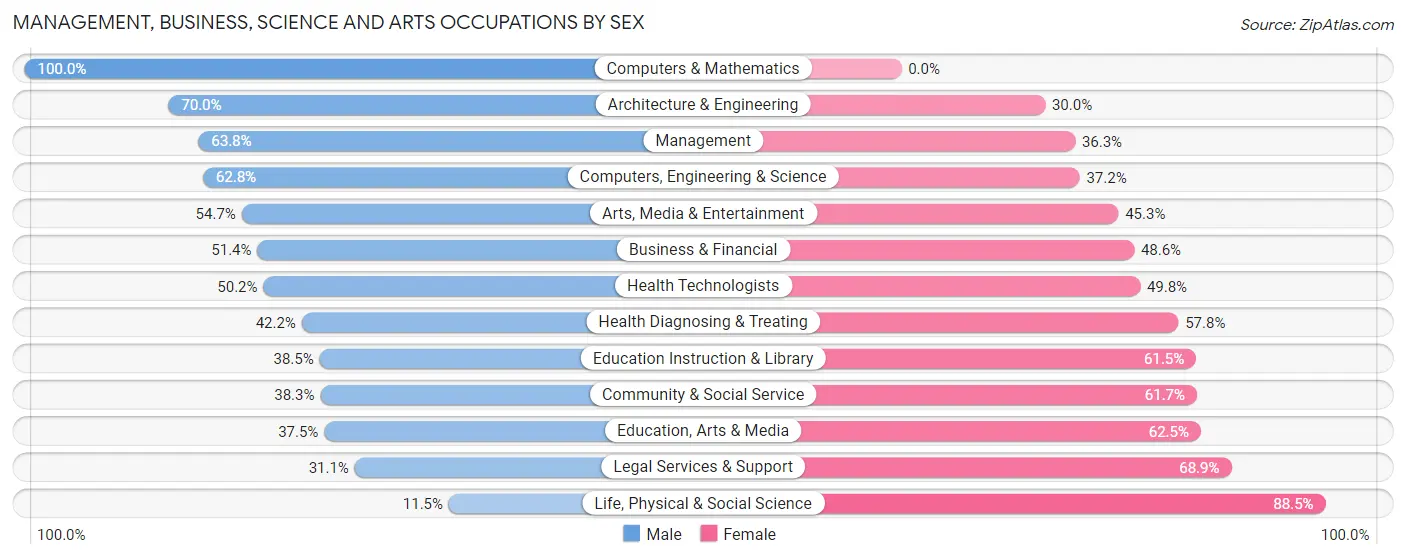
Management, Business, Science and Arts Occupations by Sex
Within the Management, Business, Science and Arts occupations in Kingman, the most male-oriented occupations are Computers & Mathematics (100.0%), Architecture & Engineering (70.0%), and Management (63.7%), while the most female-oriented occupations are Life, Physical & Social Science (88.5%), Legal Services & Support (68.9%), and Education, Arts & Media (62.5%).
| Occupation | Male | Female |
| Management | 728 (63.7%) | 414 (36.2%) |
| Business & Financial | 232 (51.4%) | 219 (48.6%) |
| Computers, Engineering & Science | 265 (62.8%) | 157 (37.2%) |
| Computers & Mathematics | 119 (100.0%) | 0 (0.0%) |
| Architecture & Engineering | 133 (70.0%) | 57 (30.0%) |
| Life, Physical & Social Science | 13 (11.5%) | 100 (88.5%) |
| Community & Social Service | 589 (38.3%) | 948 (61.7%) |
| Education, Arts & Media | 144 (37.5%) | 240 (62.5%) |
| Legal Services & Support | 104 (31.1%) | 230 (68.9%) |
| Education Instruction & Library | 254 (38.5%) | 406 (61.5%) |
| Arts, Media & Entertainment | 87 (54.7%) | 72 (45.3%) |
| Health Diagnosing & Treating | 465 (42.2%) | 637 (57.8%) |
| Health Technologists | 389 (50.2%) | 386 (49.8%) |
| Total (Category) | 2,279 (49.0%) | 2,375 (51.0%) |
| Total (Overall) | 6,567 (53.3%) | 5,754 (46.7%) |
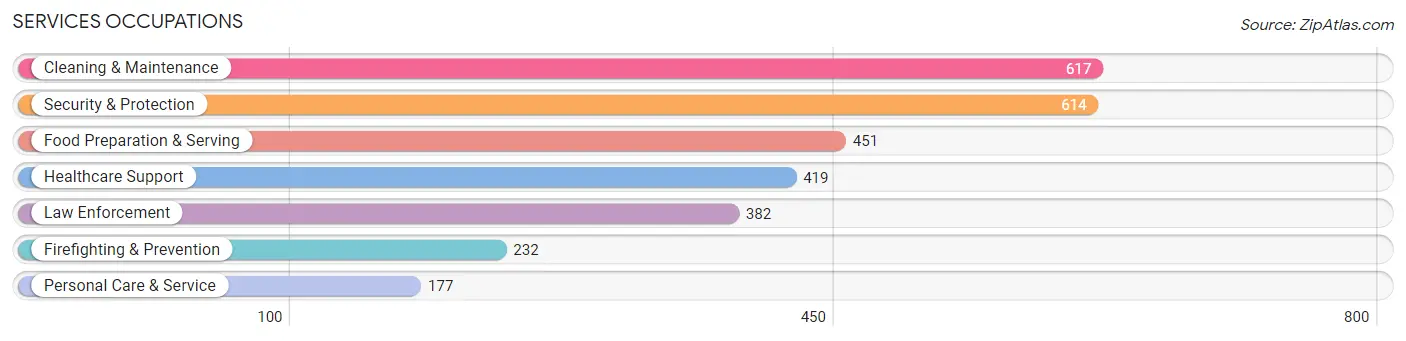
Services Occupations
The most common Services occupations in Kingman are Cleaning & Maintenance (617 | 5.0%), Security & Protection (614 | 5.0%), Food Preparation & Serving (451 | 3.7%), Healthcare Support (419 | 3.4%), and Law Enforcement (382 | 3.1%).
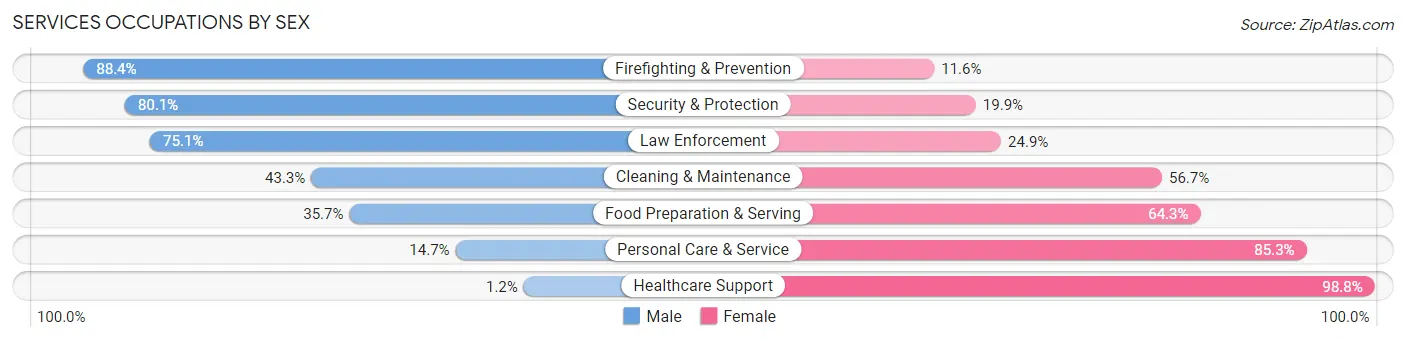
Services Occupations by Sex
Within the Services occupations in Kingman, the most male-oriented occupations are Firefighting & Prevention (88.4%), Security & Protection (80.1%), and Law Enforcement (75.1%), while the most female-oriented occupations are Healthcare Support (98.8%), Personal Care & Service (85.3%), and Food Preparation & Serving (64.3%).
| Occupation | Male | Female |
| Healthcare Support | 5 (1.2%) | 414 (98.8%) |
| Security & Protection | 492 (80.1%) | 122 (19.9%) |
| Firefighting & Prevention | 205 (88.4%) | 27 (11.6%) |
| Law Enforcement | 287 (75.1%) | 95 (24.9%) |
| Food Preparation & Serving | 161 (35.7%) | 290 (64.3%) |
| Cleaning & Maintenance | 267 (43.3%) | 350 (56.7%) |
| Personal Care & Service | 26 (14.7%) | 151 (85.3%) |
| Total (Category) | 951 (41.7%) | 1,327 (58.3%) |
| Total (Overall) | 6,567 (53.3%) | 5,754 (46.7%) |
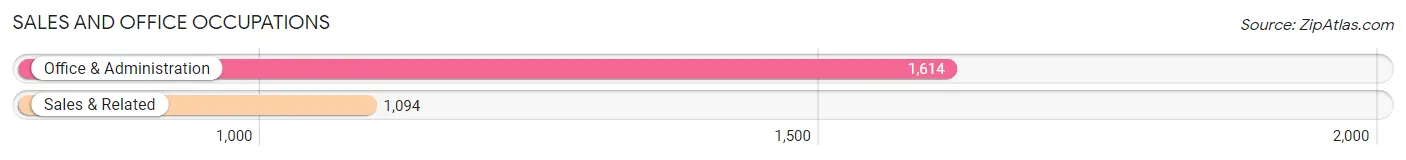
Sales and Office Occupations
The most common Sales and Office occupations in Kingman are Office & Administration (1,614 | 13.1%), and Sales & Related (1,094 | 8.9%).
Sales and Office Occupations by Sex
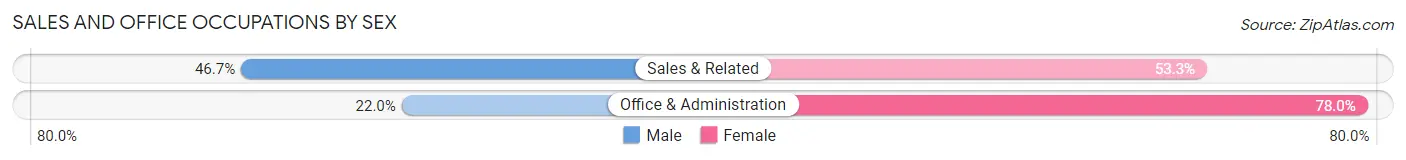
| Occupation | Male | Female |
| Sales & Related | 511 (46.7%) | 583 (53.3%) |
| Office & Administration | 355 (22.0%) | 1,259 (78.0%) |
| Total (Category) | 866 (32.0%) | 1,842 (68.0%) |
| Total (Overall) | 6,567 (53.3%) | 5,754 (46.7%) |
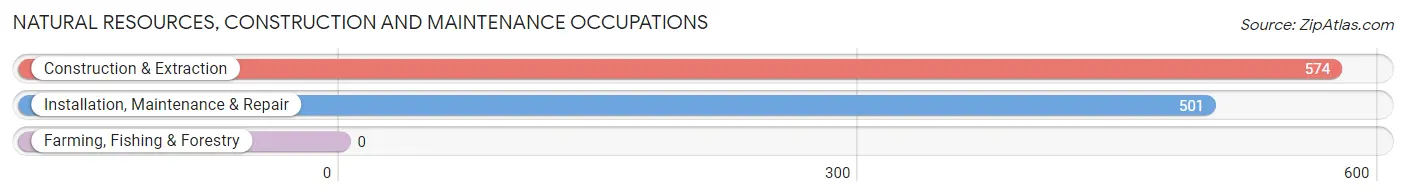
Natural Resources, Construction and Maintenance Occupations
The most common Natural Resources, Construction and Maintenance occupations in Kingman are Construction & Extraction (574 | 4.7%), and Installation, Maintenance & Repair (501 | 4.1%).
Natural Resources, Construction and Maintenance Occupations by Sex
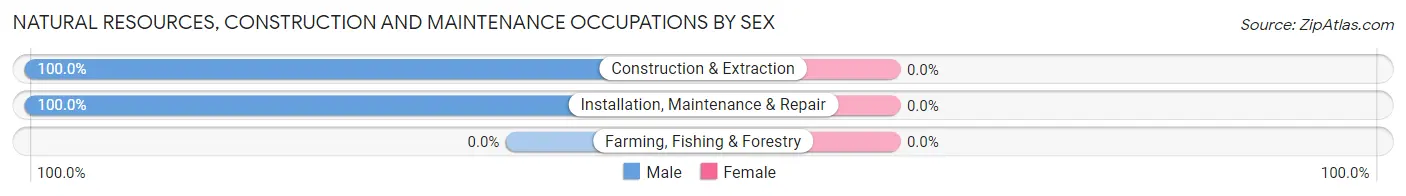
| Occupation | Male | Female |
| Farming, Fishing & Forestry | 0 (0.0%) | 0 (0.0%) |
| Construction & Extraction | 574 (100.0%) | 0 (0.0%) |
| Installation, Maintenance & Repair | 501 (100.0%) | 0 (0.0%) |
| Total (Category) | 1,075 (100.0%) | 0 (0.0%) |
| Total (Overall) | 6,567 (53.3%) | 5,754 (46.7%) |
Production, Transportation and Moving Occupations
The most common Production, Transportation and Moving occupations in Kingman are Production (575 | 4.7%), Transportation (557 | 4.5%), and Material Moving (474 | 3.8%).
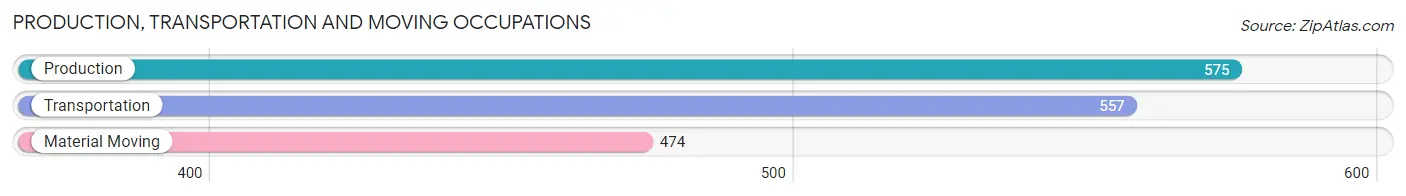
Production, Transportation and Moving Occupations by Sex
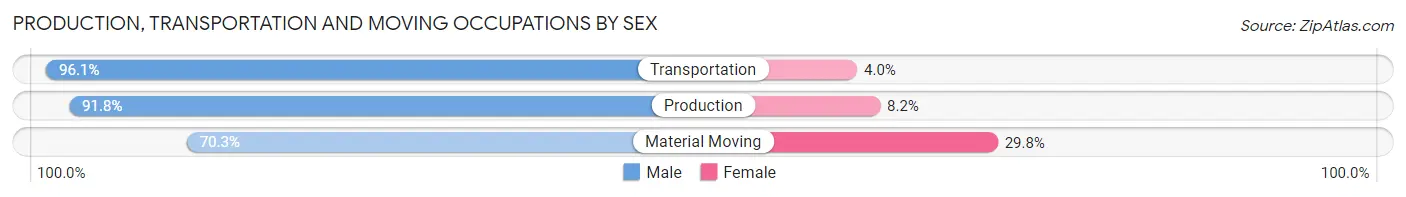
| Occupation | Male | Female |
| Production | 528 (91.8%) | 47 (8.2%) |
| Transportation | 535 (96.1%) | 22 (4.0%) |
| Material Moving | 333 (70.3%) | 141 (29.7%) |
| Total (Category) | 1,396 (86.9%) | 210 (13.1%) |
| Total (Overall) | 6,567 (53.3%) | 5,754 (46.7%) |
Employment Industries by Sex in Kingman
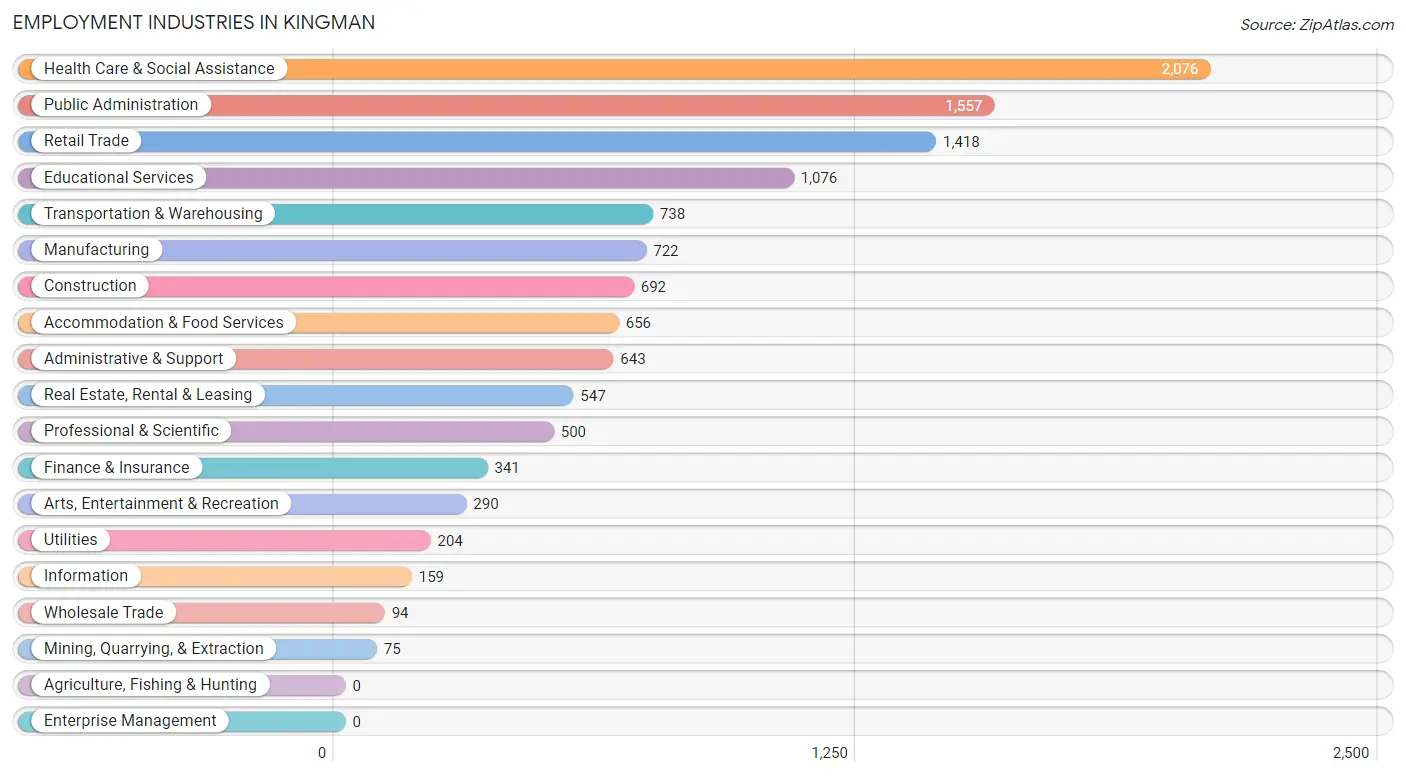
Employment Industries in Kingman
The major employment industries in Kingman include Health Care & Social Assistance (2,076 | 16.9%), Public Administration (1,557 | 12.6%), Retail Trade (1,418 | 11.5%), Educational Services (1,076 | 8.7%), and Transportation & Warehousing (738 | 6.0%).
Employment Industries by Sex in Kingman
The Kingman industries that see more men than women are Mining, Quarrying, & Extraction (100.0%), Manufacturing (97.0%), and Construction (94.9%), whereas the industries that tend to have a higher number of women are Real Estate, Rental & Leasing (75.9%), Finance & Insurance (69.8%), and Health Care & Social Assistance (65.6%).
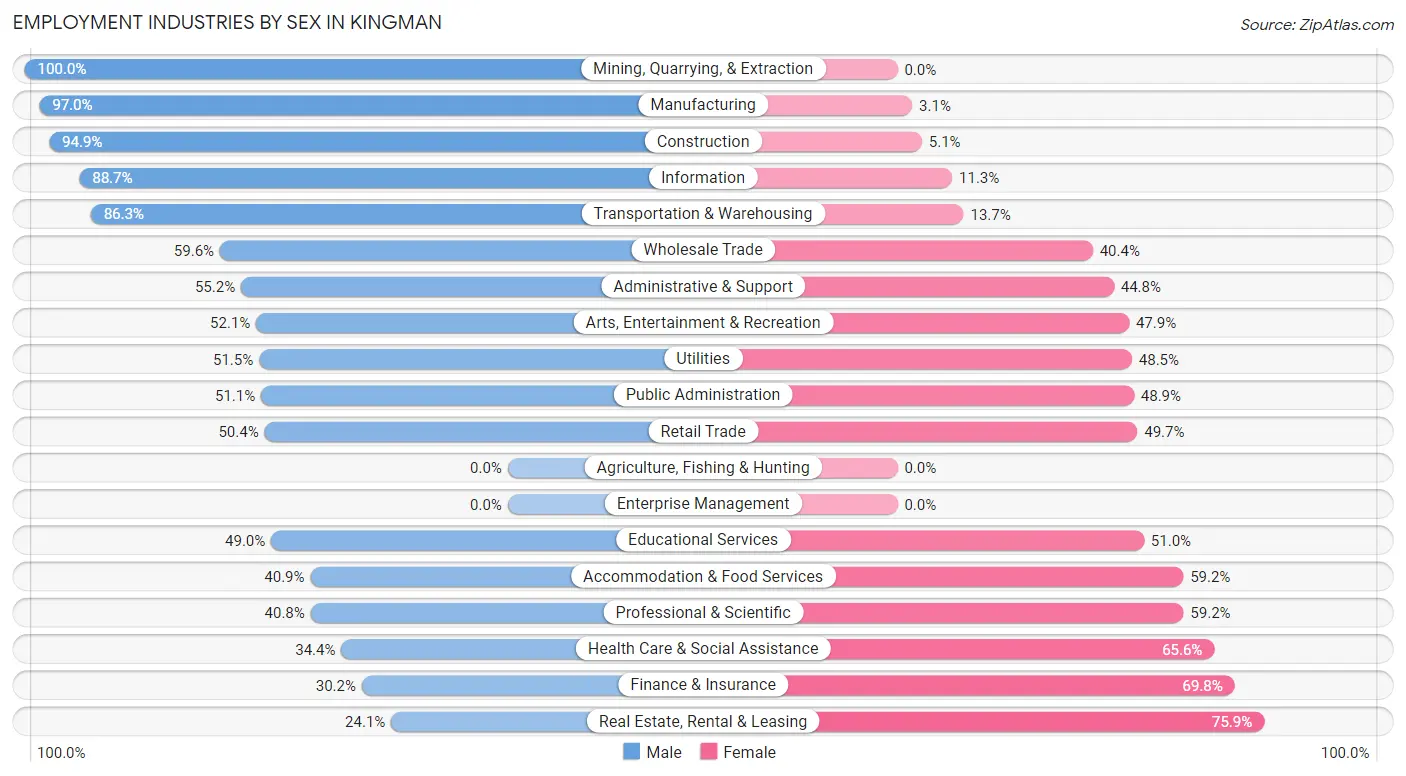
| Industry | Male | Female |
| Agriculture, Fishing & Hunting | 0 (0.0%) | 0 (0.0%) |
| Mining, Quarrying, & Extraction | 75 (100.0%) | 0 (0.0%) |
| Construction | 657 (94.9%) | 35 (5.1%) |
| Manufacturing | 700 (97.0%) | 22 (3.0%) |
| Wholesale Trade | 56 (59.6%) | 38 (40.4%) |
| Retail Trade | 714 (50.3%) | 704 (49.6%) |
| Transportation & Warehousing | 637 (86.3%) | 101 (13.7%) |
| Utilities | 105 (51.5%) | 99 (48.5%) |
| Information | 141 (88.7%) | 18 (11.3%) |
| Finance & Insurance | 103 (30.2%) | 238 (69.8%) |
| Real Estate, Rental & Leasing | 132 (24.1%) | 415 (75.9%) |
| Professional & Scientific | 204 (40.8%) | 296 (59.2%) |
| Enterprise Management | 0 (0.0%) | 0 (0.0%) |
| Administrative & Support | 355 (55.2%) | 288 (44.8%) |
| Educational Services | 527 (49.0%) | 549 (51.0%) |
| Health Care & Social Assistance | 715 (34.4%) | 1,361 (65.6%) |
| Arts, Entertainment & Recreation | 151 (52.1%) | 139 (47.9%) |
| Accommodation & Food Services | 268 (40.8%) | 388 (59.2%) |
| Public Administration | 795 (51.1%) | 762 (48.9%) |
| Total | 6,567 (53.3%) | 5,754 (46.7%) |
Education in Kingman
School Enrollment in Kingman
The most common levels of schooling among the 7,004 students in Kingman are middle school (1,631 | 23.3%), high school (1,560 | 22.3%), and elementary school (1,406 | 20.1%).
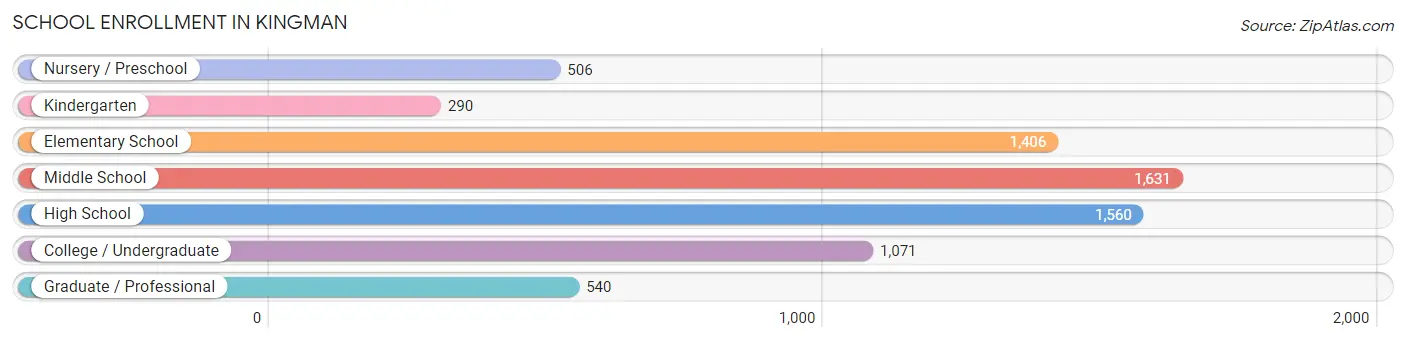
| School Level | # Students | % Students |
| Nursery / Preschool | 506 | 7.2% |
| Kindergarten | 290 | 4.1% |
| Elementary School | 1,406 | 20.1% |
| Middle School | 1,631 | 23.3% |
| High School | 1,560 | 22.3% |
| College / Undergraduate | 1,071 | 15.3% |
| Graduate / Professional | 540 | 7.7% |
| Total | 7,004 | 100.0% |
School Enrollment by Age by Funding Source in Kingman
Out of a total of 7,004 students who are enrolled in schools in Kingman, 1,114 (15.9%) attend a private institution, while the remaining 5,890 (84.1%) are enrolled in public schools. The age group of 3 to 4 year olds has the highest likelihood of being enrolled in private schools, with 159 (42.5% in the age bracket) enrolled. Conversely, the age group of 18 to 19 year olds has the lowest likelihood of being enrolled in a private school, with 219 (100.0% in the age bracket) attending a public institution.
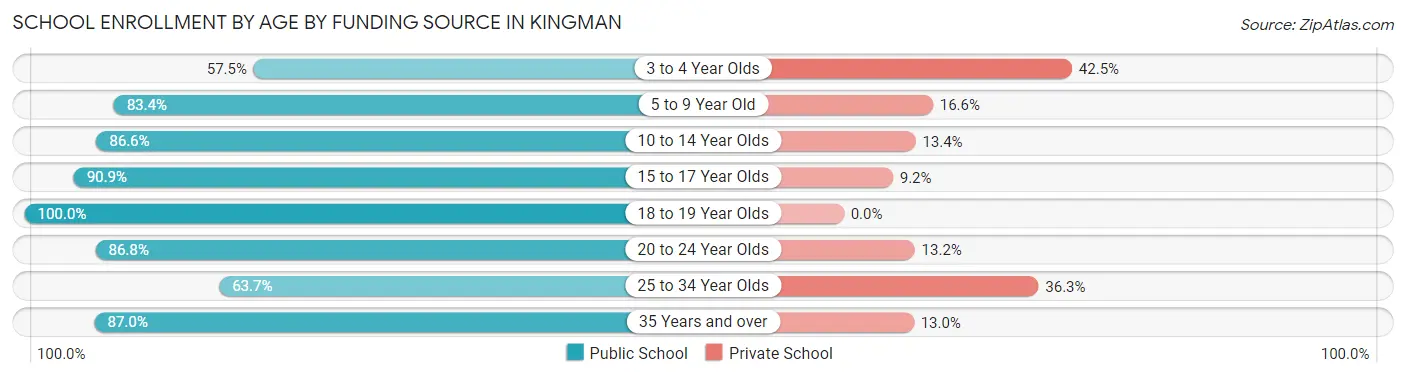
| Age Bracket | Public School | Private School |
| 3 to 4 Year Olds | 215 (57.5%) | 159 (42.5%) |
| 5 to 9 Year Old | 1,422 (83.4%) | 283 (16.6%) |
| 10 to 14 Year Olds | 1,614 (86.6%) | 249 (13.4%) |
| 15 to 17 Year Olds | 1,251 (90.8%) | 126 (9.1%) |
| 18 to 19 Year Olds | 219 (100.0%) | 0 (0.0%) |
| 20 to 24 Year Olds | 361 (86.8%) | 55 (13.2%) |
| 25 to 34 Year Olds | 283 (63.7%) | 161 (36.3%) |
| 35 Years and over | 527 (87.0%) | 79 (13.0%) |
| Total | 5,890 (84.1%) | 1,114 (15.9%) |
Educational Attainment by Field of Study in Kingman
Education (965 | 18.3%), business (875 | 16.6%), science & technology (640 | 12.1%), arts & humanities (467 | 8.8%), and bio, nature & agricultural (398 | 7.5%) are the most common fields of study among 5,283 individuals in Kingman who have obtained a bachelor's degree or higher.
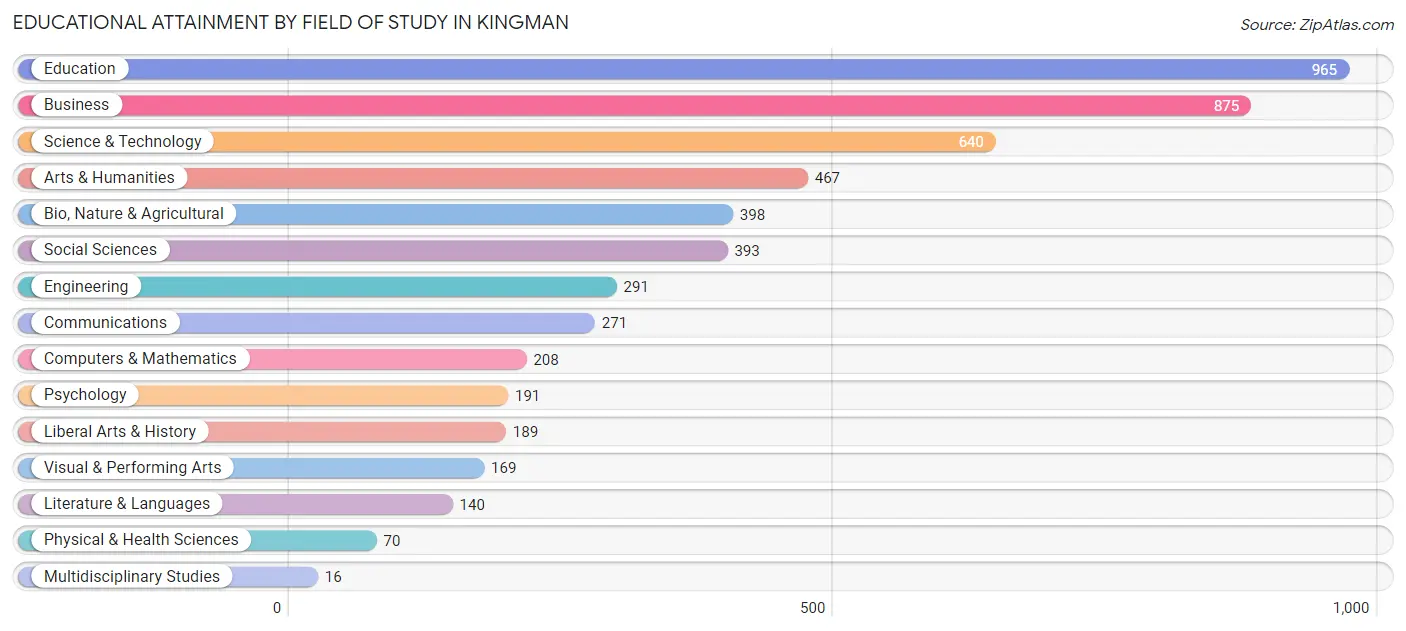
| Field of Study | # Graduates | % Graduates |
| Computers & Mathematics | 208 | 3.9% |
| Bio, Nature & Agricultural | 398 | 7.5% |
| Physical & Health Sciences | 70 | 1.3% |
| Psychology | 191 | 3.6% |
| Social Sciences | 393 | 7.4% |
| Engineering | 291 | 5.5% |
| Multidisciplinary Studies | 16 | 0.3% |
| Science & Technology | 640 | 12.1% |
| Business | 875 | 16.6% |
| Education | 965 | 18.3% |
| Literature & Languages | 140 | 2.6% |
| Liberal Arts & History | 189 | 3.6% |
| Visual & Performing Arts | 169 | 3.2% |
| Communications | 271 | 5.1% |
| Arts & Humanities | 467 | 8.8% |
| Total | 5,283 | 100.0% |
Transportation & Commute in Kingman
Vehicle Availability by Sex in Kingman
The most prevalent vehicle ownership categories in Kingman are males with 2 vehicles (3,021, accounting for 45.7%) and females with 2 vehicles (2,409, making up 54.9%).
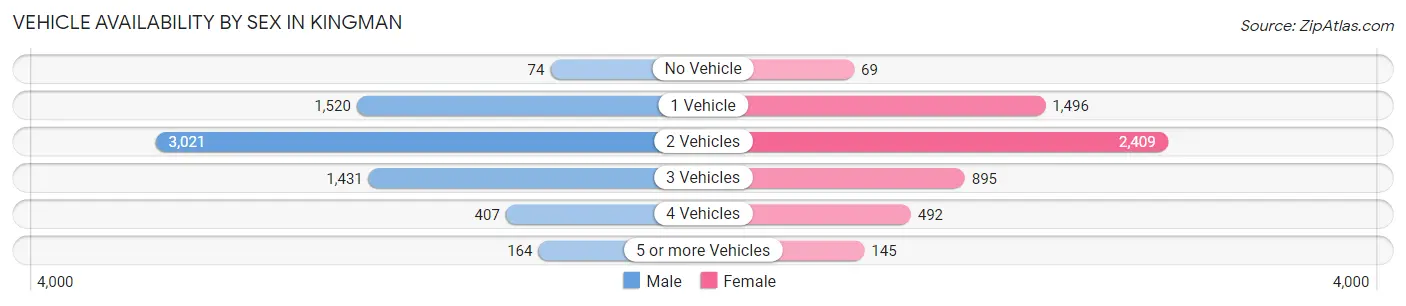
| Vehicles Available | Male | Female |
| No Vehicle | 74 (1.1%) | 69 (1.3%) |
| 1 Vehicle | 1,520 (23.0%) | 1,496 (27.2%) |
| 2 Vehicles | 3,021 (45.7%) | 2,409 (43.8%) |
| 3 Vehicles | 1,431 (21.6%) | 895 (16.3%) |
| 4 Vehicles | 407 (6.1%) | 492 (8.9%) |
| 5 or more Vehicles | 164 (2.5%) | 145 (2.6%) |
| Total | 6,617 (100.0%) | 5,506 (100.0%) |
Commute Time in Kingman
The most frequently occuring commute durations in Kingman are 10 to 14 minutes (3,630 commuters, 31.7%), 5 to 9 minutes (2,548 commuters, 22.2%), and 15 to 19 minutes (1,907 commuters, 16.7%).
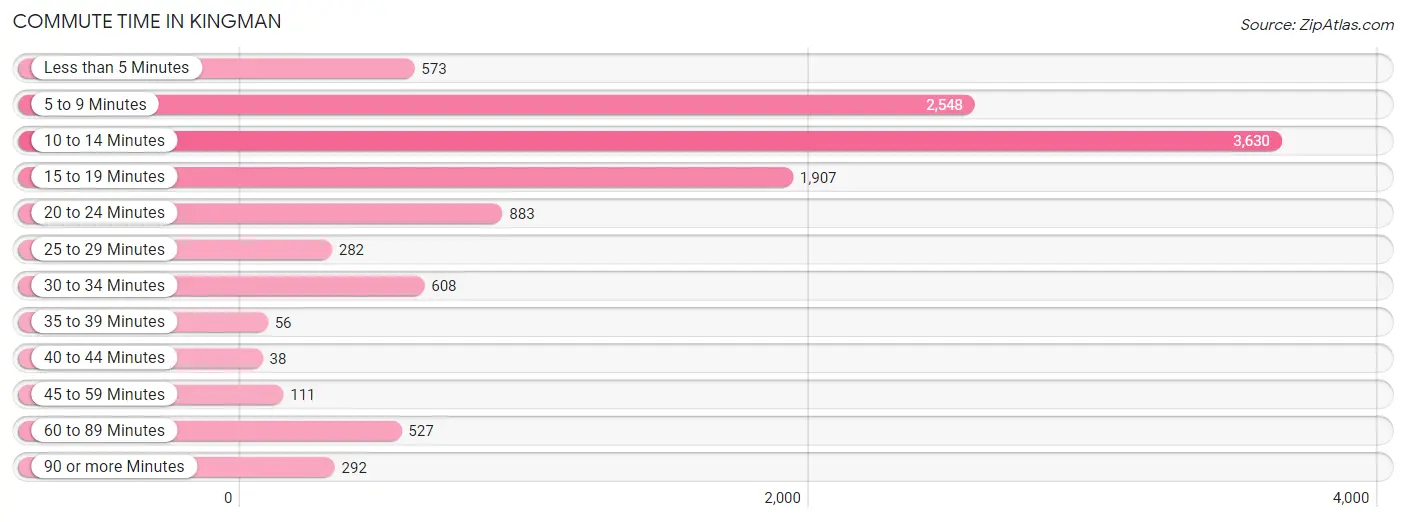
| Commute Time | # Commuters | % Commuters |
| Less than 5 Minutes | 573 | 5.0% |
| 5 to 9 Minutes | 2,548 | 22.2% |
| 10 to 14 Minutes | 3,630 | 31.7% |
| 15 to 19 Minutes | 1,907 | 16.7% |
| 20 to 24 Minutes | 883 | 7.7% |
| 25 to 29 Minutes | 282 | 2.5% |
| 30 to 34 Minutes | 608 | 5.3% |
| 35 to 39 Minutes | 56 | 0.5% |
| 40 to 44 Minutes | 38 | 0.3% |
| 45 to 59 Minutes | 111 | 1.0% |
| 60 to 89 Minutes | 527 | 4.6% |
| 90 or more Minutes | 292 | 2.5% |
Commute Time by Sex in Kingman
The most common commute times in Kingman are 10 to 14 minutes (1,479 commuters, 23.2%) for males and 10 to 14 minutes (2,151 commuters, 42.3%) for females.
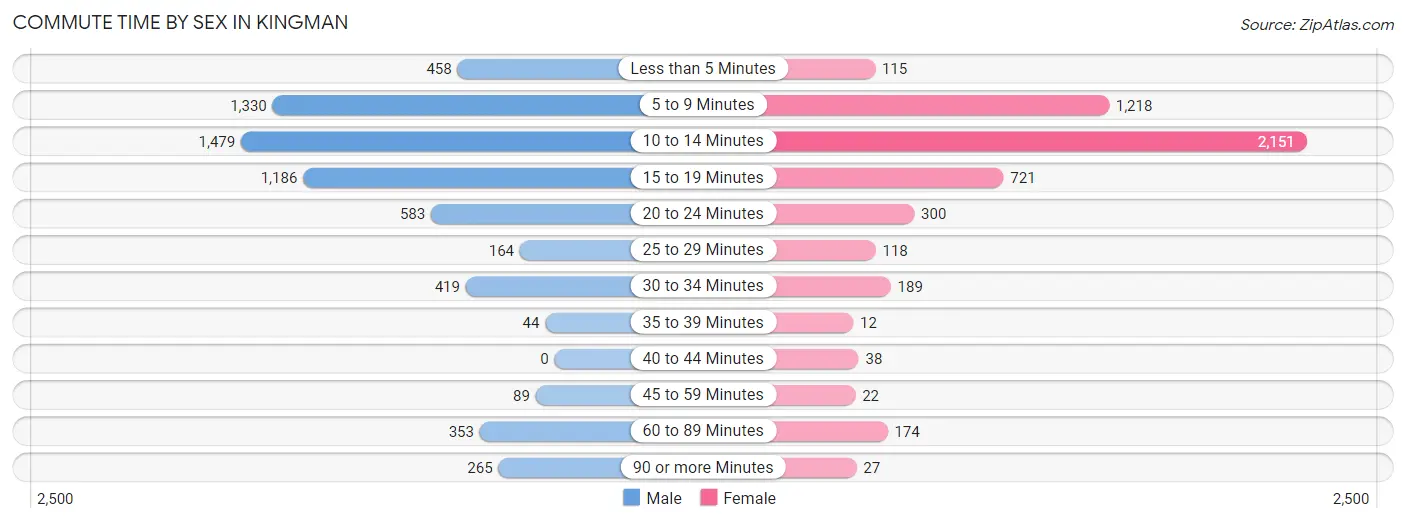
| Commute Time | Male | Female |
| Less than 5 Minutes | 458 (7.2%) | 115 (2.3%) |
| 5 to 9 Minutes | 1,330 (20.9%) | 1,218 (23.9%) |
| 10 to 14 Minutes | 1,479 (23.2%) | 2,151 (42.3%) |
| 15 to 19 Minutes | 1,186 (18.6%) | 721 (14.2%) |
| 20 to 24 Minutes | 583 (9.1%) | 300 (5.9%) |
| 25 to 29 Minutes | 164 (2.6%) | 118 (2.3%) |
| 30 to 34 Minutes | 419 (6.6%) | 189 (3.7%) |
| 35 to 39 Minutes | 44 (0.7%) | 12 (0.2%) |
| 40 to 44 Minutes | 0 (0.0%) | 38 (0.7%) |
| 45 to 59 Minutes | 89 (1.4%) | 22 (0.4%) |
| 60 to 89 Minutes | 353 (5.5%) | 174 (3.4%) |
| 90 or more Minutes | 265 (4.2%) | 27 (0.5%) |
Time of Departure to Work by Sex in Kingman
The most frequent times of departure to work in Kingman are 7:00 AM to 7:29 AM (983, 15.4%) for males and 7:00 AM to 7:29 AM (981, 19.3%) for females.
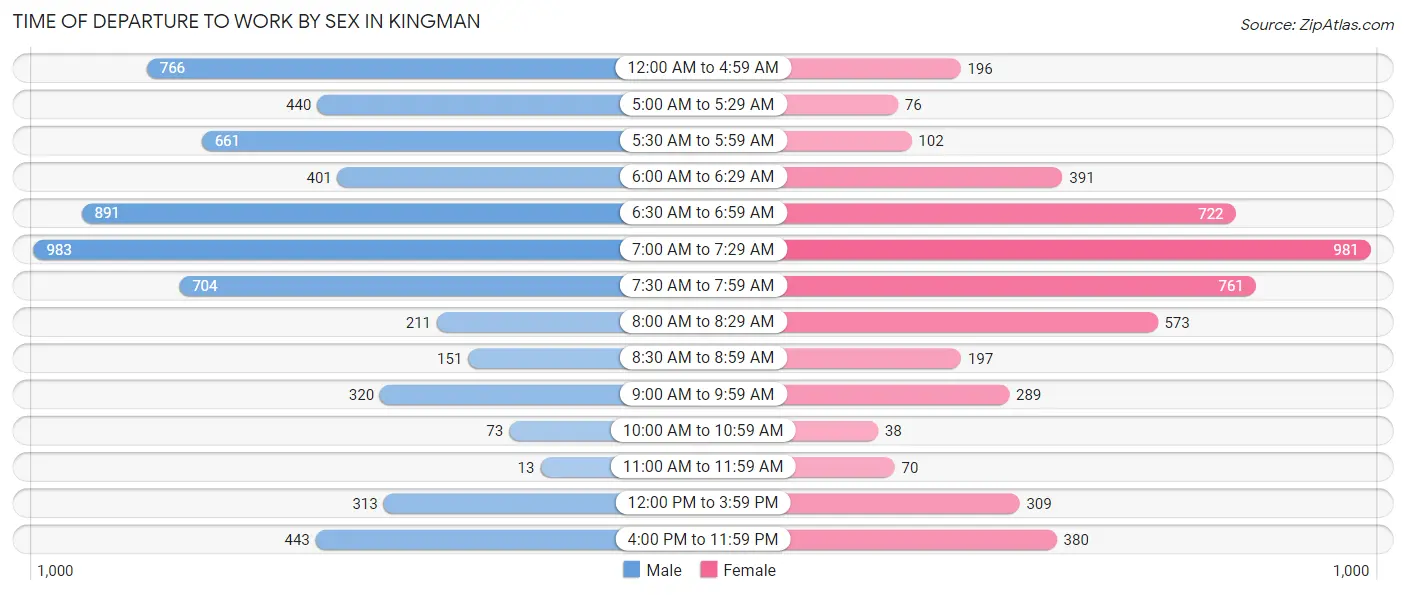
| Time of Departure | Male | Female |
| 12:00 AM to 4:59 AM | 766 (12.0%) | 196 (3.8%) |
| 5:00 AM to 5:29 AM | 440 (6.9%) | 76 (1.5%) |
| 5:30 AM to 5:59 AM | 661 (10.4%) | 102 (2.0%) |
| 6:00 AM to 6:29 AM | 401 (6.3%) | 391 (7.7%) |
| 6:30 AM to 6:59 AM | 891 (14.0%) | 722 (14.2%) |
| 7:00 AM to 7:29 AM | 983 (15.4%) | 981 (19.3%) |
| 7:30 AM to 7:59 AM | 704 (11.1%) | 761 (15.0%) |
| 8:00 AM to 8:29 AM | 211 (3.3%) | 573 (11.3%) |
| 8:30 AM to 8:59 AM | 151 (2.4%) | 197 (3.9%) |
| 9:00 AM to 9:59 AM | 320 (5.0%) | 289 (5.7%) |
| 10:00 AM to 10:59 AM | 73 (1.1%) | 38 (0.7%) |
| 11:00 AM to 11:59 AM | 13 (0.2%) | 70 (1.4%) |
| 12:00 PM to 3:59 PM | 313 (4.9%) | 309 (6.1%) |
| 4:00 PM to 11:59 PM | 443 (7.0%) | 380 (7.5%) |
| Total | 6,370 (100.0%) | 5,085 (100.0%) |
Housing Occupancy in Kingman
Occupancy by Ownership in Kingman
Of the total 14,029 dwellings in Kingman, owner-occupied units account for 9,044 (64.5%), while renter-occupied units make up 4,985 (35.5%).
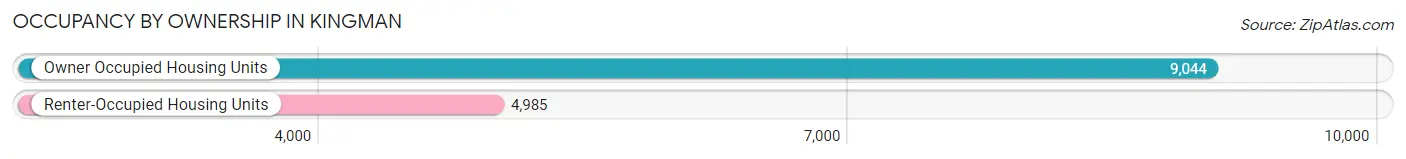
| Occupancy | # Housing Units | % Housing Units |
| Owner Occupied Housing Units | 9,044 | 64.5% |
| Renter-Occupied Housing Units | 4,985 | 35.5% |
| Total Occupied Housing Units | 14,029 | 100.0% |
Occupancy by Household Size in Kingman
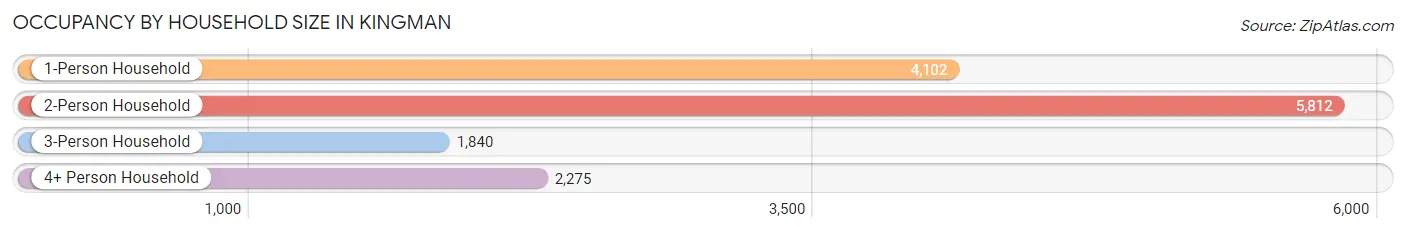
| Household Size | # Housing Units | % Housing Units |
| 1-Person Household | 4,102 | 29.2% |
| 2-Person Household | 5,812 | 41.4% |
| 3-Person Household | 1,840 | 13.1% |
| 4+ Person Household | 2,275 | 16.2% |
| Total Housing Units | 14,029 | 100.0% |
Occupancy by Ownership by Household Size in Kingman
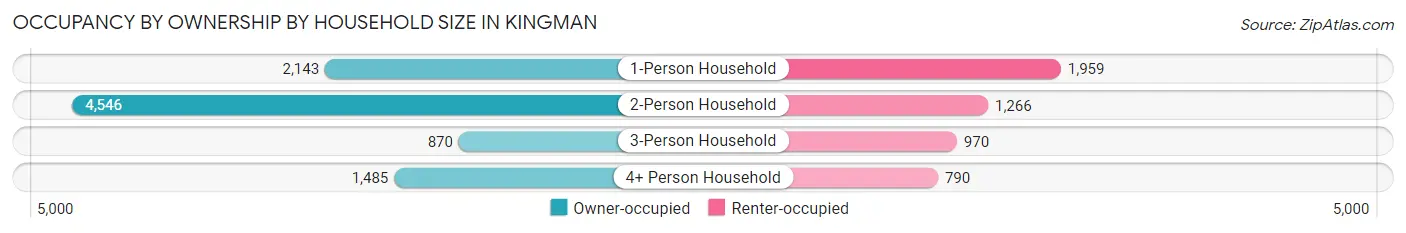
| Household Size | Owner-occupied | Renter-occupied |
| 1-Person Household | 2,143 (52.2%) | 1,959 (47.8%) |
| 2-Person Household | 4,546 (78.2%) | 1,266 (21.8%) |
| 3-Person Household | 870 (47.3%) | 970 (52.7%) |
| 4+ Person Household | 1,485 (65.3%) | 790 (34.7%) |
| Total Housing Units | 9,044 (64.5%) | 4,985 (35.5%) |
Occupancy by Educational Attainment in Kingman
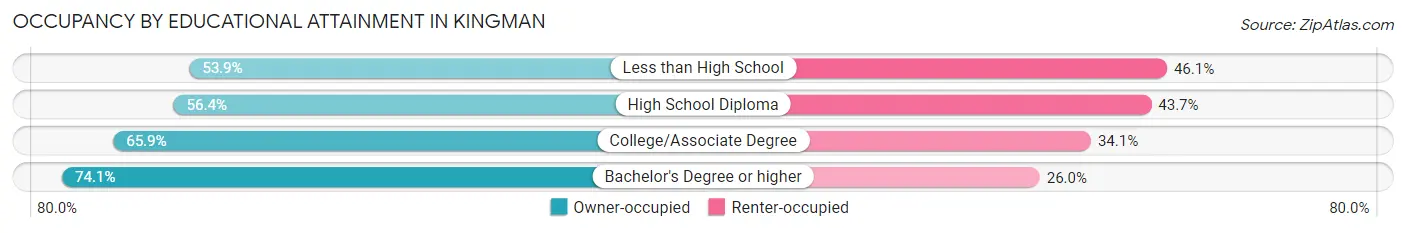
| Household Size | Owner-occupied | Renter-occupied |
| Less than High School | 529 (53.9%) | 453 (46.1%) |
| High School Diploma | 1,939 (56.4%) | 1,502 (43.6%) |
| College/Associate Degree | 4,359 (65.9%) | 2,253 (34.1%) |
| Bachelor's Degree or higher | 2,217 (74.1%) | 777 (26.0%) |
Occupancy by Age of Householder in Kingman
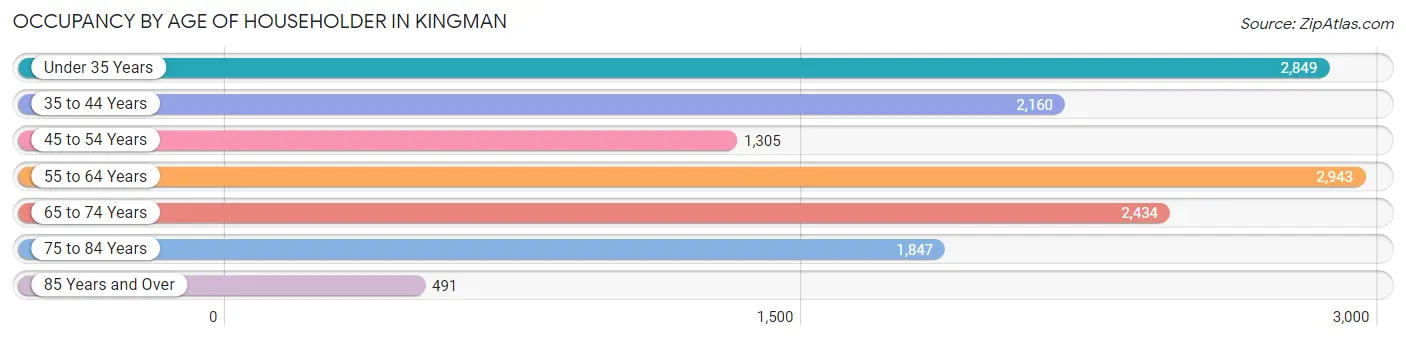
| Age Bracket | # Households | % Households |
| Under 35 Years | 2,849 | 20.3% |
| 35 to 44 Years | 2,160 | 15.4% |
| 45 to 54 Years | 1,305 | 9.3% |
| 55 to 64 Years | 2,943 | 21.0% |
| 65 to 74 Years | 2,434 | 17.3% |
| 75 to 84 Years | 1,847 | 13.2% |
| 85 Years and Over | 491 | 3.5% |
| Total | 14,029 | 100.0% |
Housing Finances in Kingman
Median Income by Occupancy in Kingman
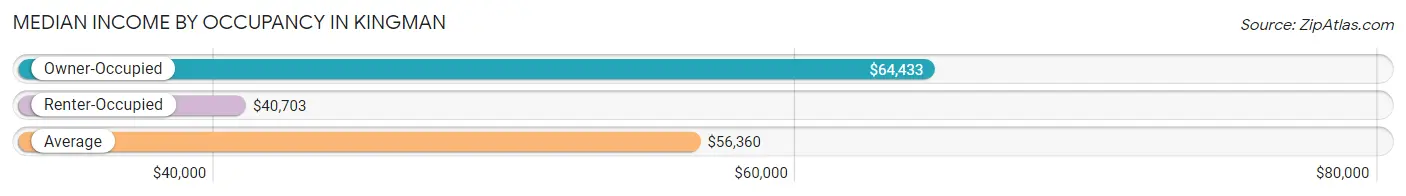
| Occupancy Type | # Households | Median Income |
| Owner-Occupied | 9,044 (64.5%) | $64,433 |
| Renter-Occupied | 4,985 (35.5%) | $40,703 |
| Average | 14,029 (100.0%) | $56,360 |
Occupancy by Householder Income Bracket in Kingman
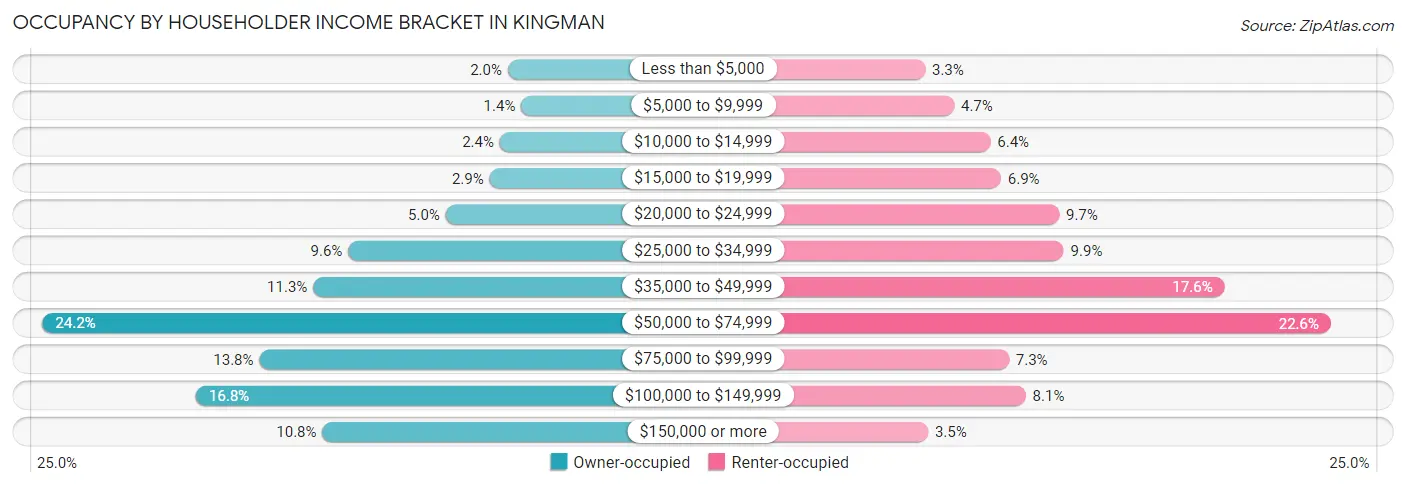
| Income Bracket | Owner-occupied | Renter-occupied |
| Less than $5,000 | 180 (2.0%) | 165 (3.3%) |
| $5,000 to $9,999 | 122 (1.3%) | 234 (4.7%) |
| $10,000 to $14,999 | 214 (2.4%) | 320 (6.4%) |
| $15,000 to $19,999 | 259 (2.9%) | 345 (6.9%) |
| $20,000 to $24,999 | 448 (5.0%) | 483 (9.7%) |
| $25,000 to $34,999 | 867 (9.6%) | 494 (9.9%) |
| $35,000 to $49,999 | 1,018 (11.3%) | 876 (17.6%) |
| $50,000 to $74,999 | 2,184 (24.1%) | 1,128 (22.6%) |
| $75,000 to $99,999 | 1,250 (13.8%) | 364 (7.3%) |
| $100,000 to $149,999 | 1,523 (16.8%) | 404 (8.1%) |
| $150,000 or more | 979 (10.8%) | 172 (3.5%) |
| Total | 9,044 (100.0%) | 4,985 (100.0%) |
Monthly Housing Cost Tiers in Kingman
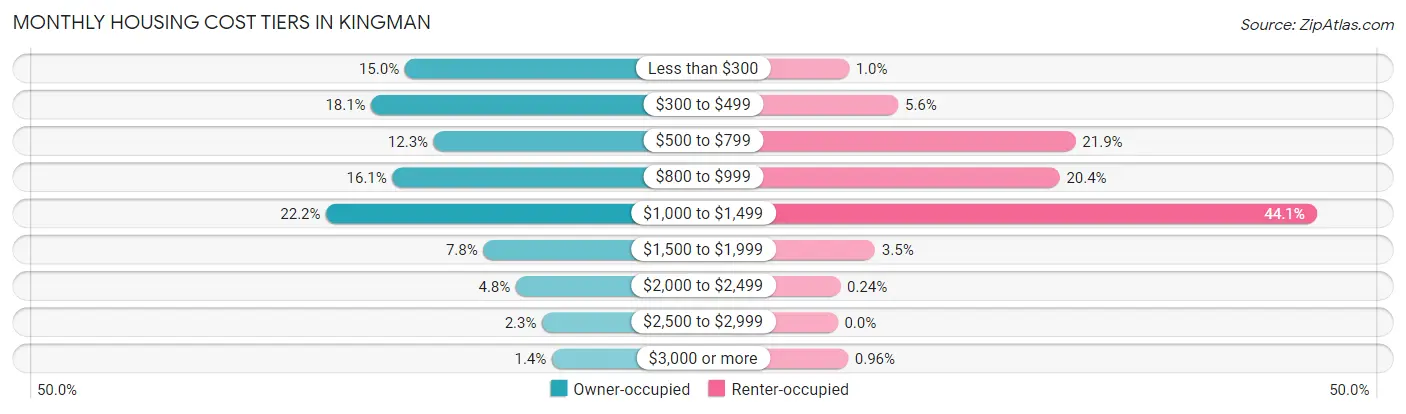
| Monthly Cost | Owner-occupied | Renter-occupied |
| Less than $300 | 1,355 (15.0%) | 52 (1.0%) |
| $300 to $499 | 1,634 (18.1%) | 278 (5.6%) |
| $500 to $799 | 1,114 (12.3%) | 1,092 (21.9%) |
| $800 to $999 | 1,458 (16.1%) | 1,019 (20.4%) |
| $1,000 to $1,499 | 2,010 (22.2%) | 2,199 (44.1%) |
| $1,500 to $1,999 | 701 (7.7%) | 172 (3.5%) |
| $2,000 to $2,499 | 430 (4.8%) | 12 (0.2%) |
| $2,500 to $2,999 | 212 (2.3%) | 0 (0.0%) |
| $3,000 or more | 130 (1.4%) | 48 (1.0%) |
| Total | 9,044 (100.0%) | 4,985 (100.0%) |
Physical Housing Characteristics in Kingman
Housing Structures in Kingman
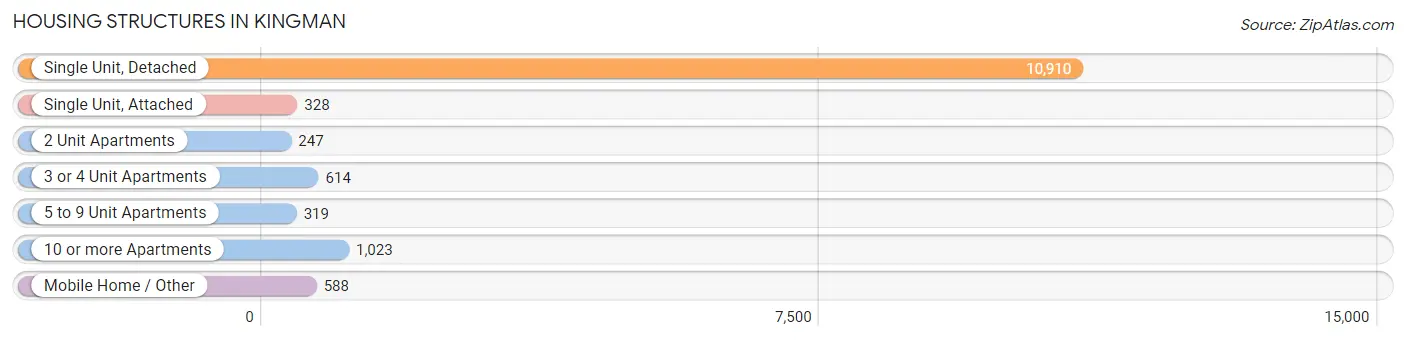
| Structure Type | # Housing Units | % Housing Units |
| Single Unit, Detached | 10,910 | 77.8% |
| Single Unit, Attached | 328 | 2.3% |
| 2 Unit Apartments | 247 | 1.8% |
| 3 or 4 Unit Apartments | 614 | 4.4% |
| 5 to 9 Unit Apartments | 319 | 2.3% |
| 10 or more Apartments | 1,023 | 7.3% |
| Mobile Home / Other | 588 | 4.2% |
| Total | 14,029 | 100.0% |
Housing Structures by Occupancy in Kingman
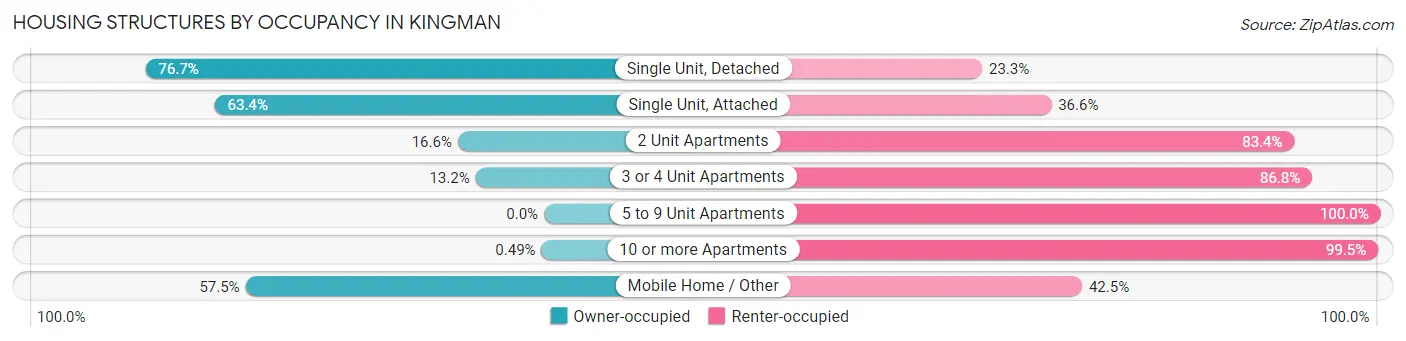
| Structure Type | Owner-occupied | Renter-occupied |
| Single Unit, Detached | 8,371 (76.7%) | 2,539 (23.3%) |
| Single Unit, Attached | 208 (63.4%) | 120 (36.6%) |
| 2 Unit Apartments | 41 (16.6%) | 206 (83.4%) |
| 3 or 4 Unit Apartments | 81 (13.2%) | 533 (86.8%) |
| 5 to 9 Unit Apartments | 0 (0.0%) | 319 (100.0%) |
| 10 or more Apartments | 5 (0.5%) | 1,018 (99.5%) |
| Mobile Home / Other | 338 (57.5%) | 250 (42.5%) |
| Total | 9,044 (64.5%) | 4,985 (35.5%) |
Housing Structures by Number of Rooms in Kingman
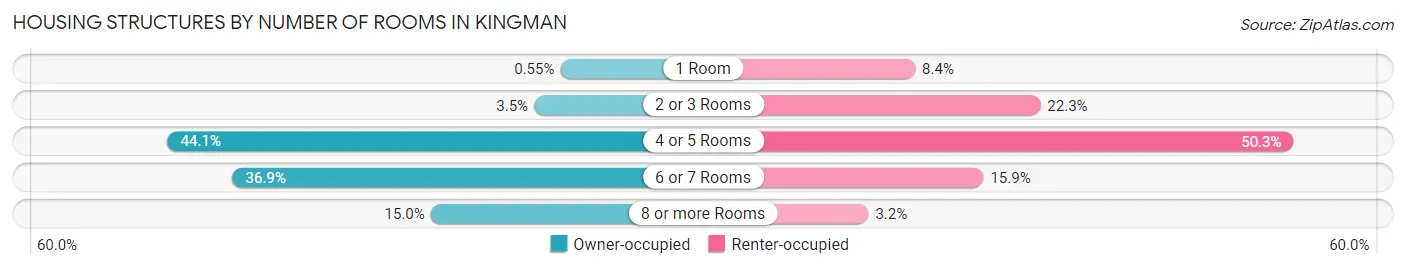
| Number of Rooms | Owner-occupied | Renter-occupied |
| 1 Room | 50 (0.5%) | 416 (8.4%) |
| 2 or 3 Rooms | 314 (3.5%) | 1,109 (22.3%) |
| 4 or 5 Rooms | 3,990 (44.1%) | 2,508 (50.3%) |
| 6 or 7 Rooms | 3,338 (36.9%) | 794 (15.9%) |
| 8 or more Rooms | 1,352 (14.9%) | 158 (3.2%) |
| Total | 9,044 (100.0%) | 4,985 (100.0%) |
Housing Structure by Heating Type in Kingman
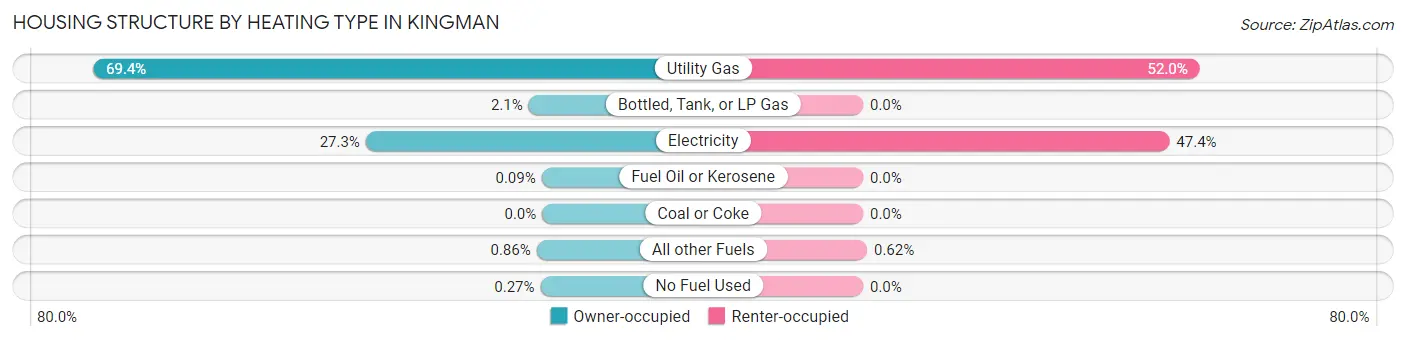
| Heating Type | Owner-occupied | Renter-occupied |
| Utility Gas | 6,279 (69.4%) | 2,593 (52.0%) |
| Bottled, Tank, or LP Gas | 189 (2.1%) | 0 (0.0%) |
| Electricity | 2,466 (27.3%) | 2,361 (47.4%) |
| Fuel Oil or Kerosene | 8 (0.1%) | 0 (0.0%) |
| Coal or Coke | 0 (0.0%) | 0 (0.0%) |
| All other Fuels | 78 (0.9%) | 31 (0.6%) |
| No Fuel Used | 24 (0.3%) | 0 (0.0%) |
| Total | 9,044 (100.0%) | 4,985 (100.0%) |
Household Vehicle Usage in Kingman
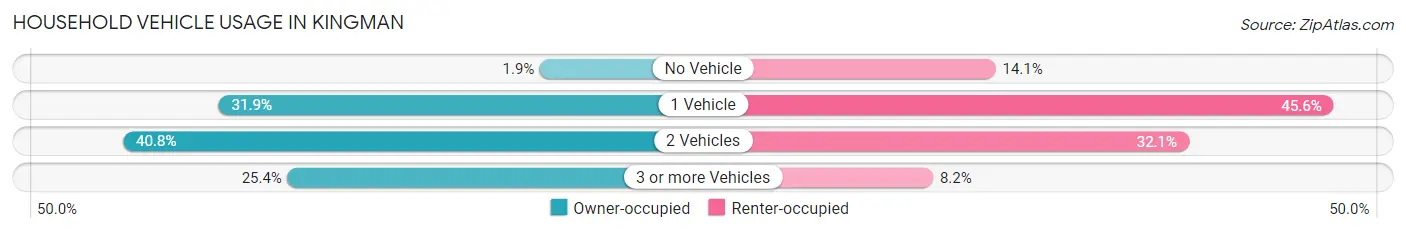
| Vehicles per Household | Owner-occupied | Renter-occupied |
| No Vehicle | 169 (1.9%) | 701 (14.1%) |
| 1 Vehicle | 2,883 (31.9%) | 2,274 (45.6%) |
| 2 Vehicles | 3,691 (40.8%) | 1,600 (32.1%) |
| 3 or more Vehicles | 2,301 (25.4%) | 410 (8.2%) |
| Total | 9,044 (100.0%) | 4,985 (100.0%) |
Real Estate & Mortgages in Kingman
Real Estate and Mortgage Overview in Kingman
| Characteristic | Without Mortgage | With Mortgage |
| Housing Units | 3,415 | 5,629 |
| Median Property Value | $211,600 | $226,500 |
| Median Household Income | $56,404 | $653 |
| Monthly Housing Costs | $335 | $130 |
| Real Estate Taxes | $922 | $52 |
Property Value by Mortgage Status in Kingman
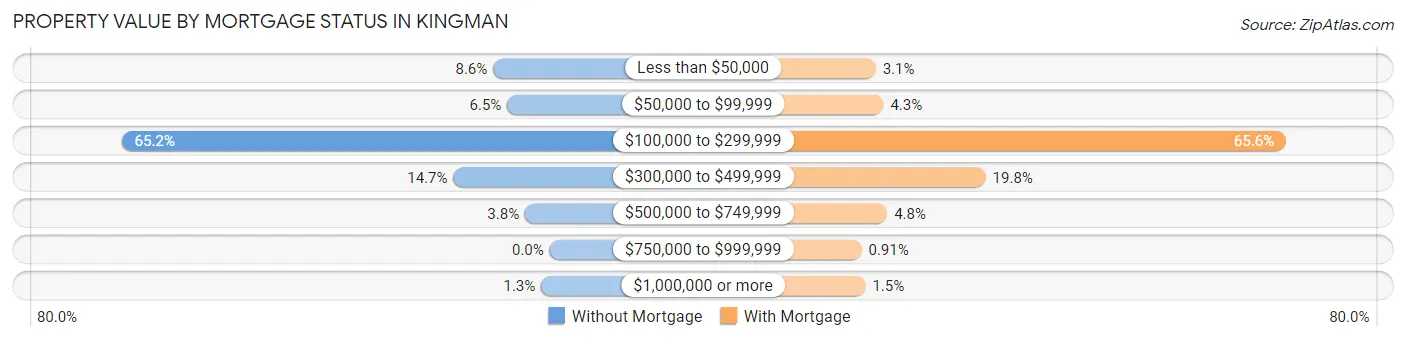
| Property Value | Without Mortgage | With Mortgage |
| Less than $50,000 | 294 (8.6%) | 173 (3.1%) |
| $50,000 to $99,999 | 221 (6.5%) | 240 (4.3%) |
| $100,000 to $299,999 | 2,227 (65.2%) | 3,692 (65.6%) |
| $300,000 to $499,999 | 501 (14.7%) | 1,116 (19.8%) |
| $500,000 to $749,999 | 128 (3.7%) | 272 (4.8%) |
| $750,000 to $999,999 | 0 (0.0%) | 51 (0.9%) |
| $1,000,000 or more | 44 (1.3%) | 85 (1.5%) |
| Total | 3,415 (100.0%) | 5,629 (100.0%) |
Household Income by Mortgage Status in Kingman
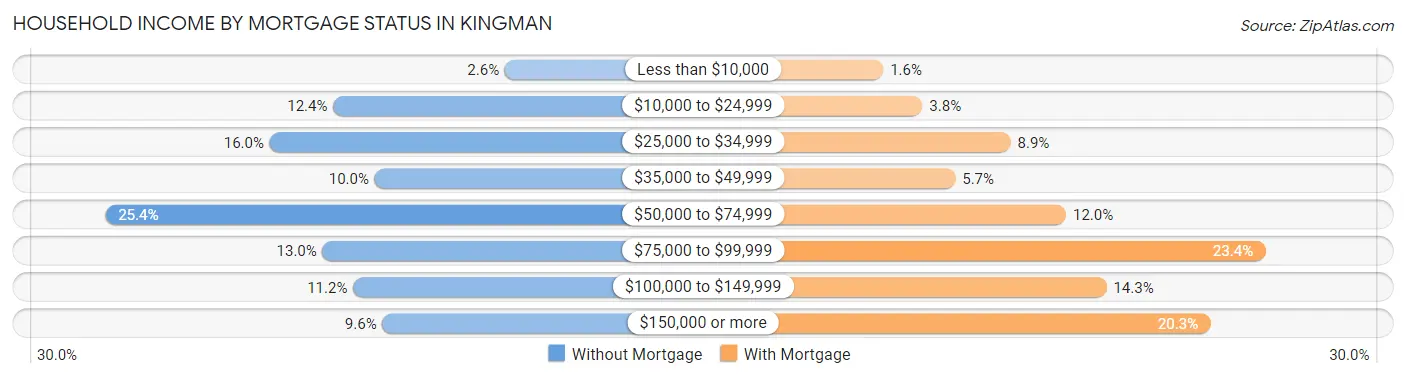
| Household Income | Without Mortgage | With Mortgage |
| Less than $10,000 | 87 (2.5%) | 89 (1.6%) |
| $10,000 to $24,999 | 422 (12.4%) | 215 (3.8%) |
| $25,000 to $34,999 | 546 (16.0%) | 499 (8.9%) |
| $35,000 to $49,999 | 341 (10.0%) | 321 (5.7%) |
| $50,000 to $74,999 | 867 (25.4%) | 677 (12.0%) |
| $75,000 to $99,999 | 443 (13.0%) | 1,317 (23.4%) |
| $100,000 to $149,999 | 383 (11.2%) | 807 (14.3%) |
| $150,000 or more | 326 (9.6%) | 1,140 (20.3%) |
| Total | 3,415 (100.0%) | 5,629 (100.0%) |
Property Value to Household Income Ratio in Kingman
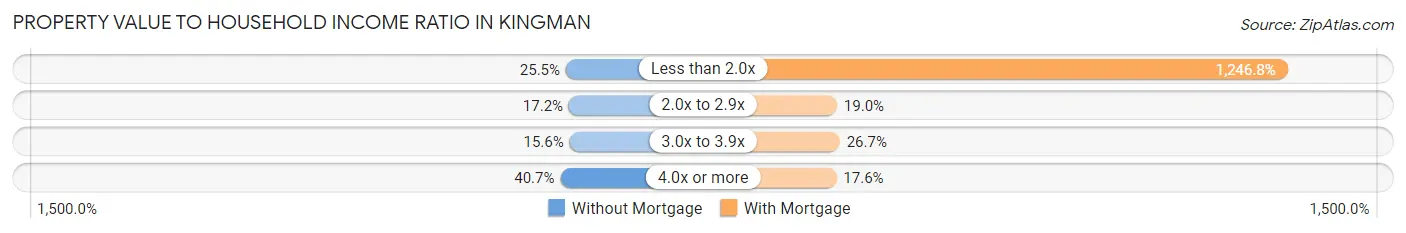
| Value-to-Income Ratio | Without Mortgage | With Mortgage |
| Less than 2.0x | 871 (25.5%) | 70,184 (1,246.8%) |
| 2.0x to 2.9x | 587 (17.2%) | 1,071 (19.0%) |
| 3.0x to 3.9x | 532 (15.6%) | 1,504 (26.7%) |
| 4.0x or more | 1,391 (40.7%) | 992 (17.6%) |
| Total | 3,415 (100.0%) | 5,629 (100.0%) |
Real Estate Taxes by Mortgage Status in Kingman
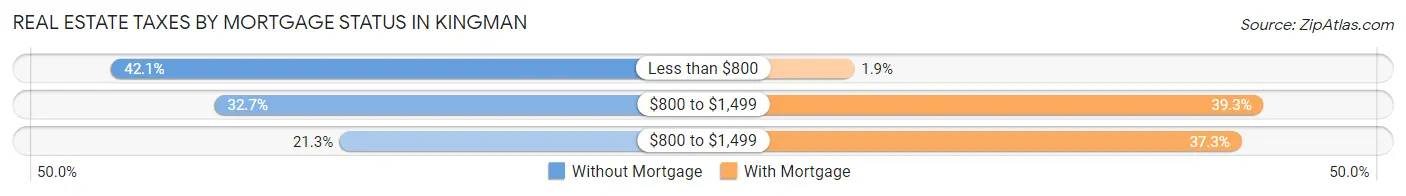
| Property Taxes | Without Mortgage | With Mortgage |
| Less than $800 | 1,437 (42.1%) | 109 (1.9%) |
| $800 to $1,499 | 1,115 (32.7%) | 2,213 (39.3%) |
| $800 to $1,499 | 727 (21.3%) | 2,101 (37.3%) |
| Total | 3,415 (100.0%) | 5,629 (100.0%) |
Health & Disability in Kingman
Health Insurance Coverage by Age in Kingman
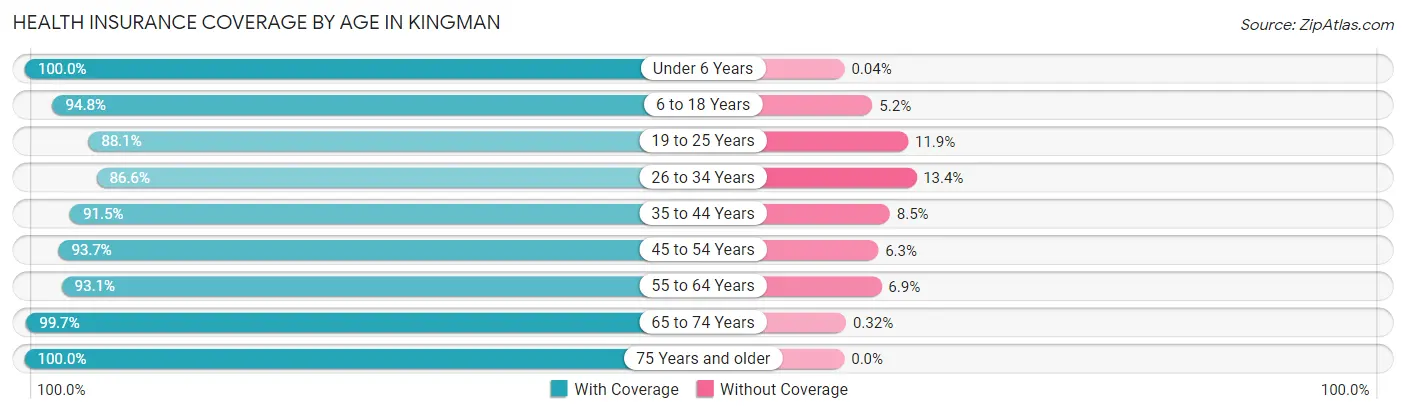
| Age Bracket | With Coverage | Without Coverage |
| Under 6 Years | 2,288 (100.0%) | 1 (0.0%) |
| 6 to 18 Years | 4,646 (94.8%) | 257 (5.2%) |
| 19 to 25 Years | 1,815 (88.1%) | 245 (11.9%) |
| 26 to 34 Years | 3,319 (86.6%) | 514 (13.4%) |
| 35 to 44 Years | 3,273 (91.5%) | 304 (8.5%) |
| 45 to 54 Years | 2,370 (93.7%) | 160 (6.3%) |
| 55 to 64 Years | 4,493 (93.1%) | 334 (6.9%) |
| 65 to 74 Years | 3,757 (99.7%) | 12 (0.3%) |
| 75 Years and older | 3,856 (100.0%) | 0 (0.0%) |
| Total | 29,817 (94.2%) | 1,827 (5.8%) |
Health Insurance Coverage by Citizenship Status in Kingman
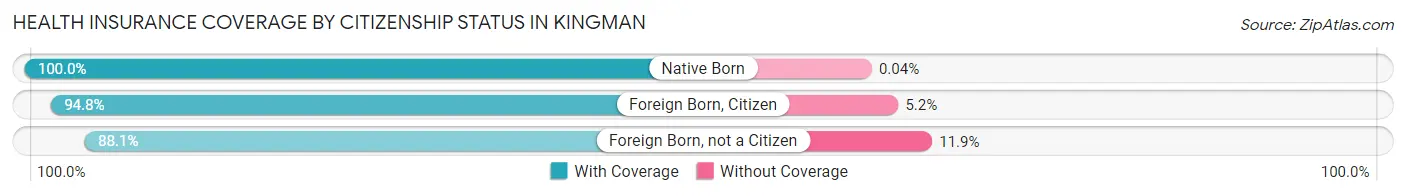
| Citizenship Status | With Coverage | Without Coverage |
| Native Born | 2,288 (100.0%) | 1 (0.0%) |
| Foreign Born, Citizen | 4,646 (94.8%) | 257 (5.2%) |
| Foreign Born, not a Citizen | 1,815 (88.1%) | 245 (11.9%) |
Health Insurance Coverage by Household Income in Kingman
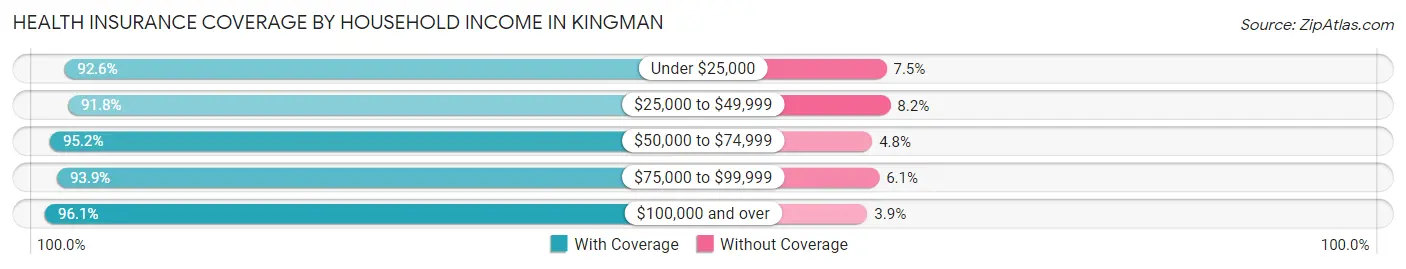
| Household Income | With Coverage | Without Coverage |
| Under $25,000 | 4,036 (92.5%) | 325 (7.4%) |
| $25,000 to $49,999 | 6,358 (91.8%) | 566 (8.2%) |
| $50,000 to $74,999 | 6,696 (95.2%) | 335 (4.8%) |
| $75,000 to $99,999 | 3,835 (93.9%) | 248 (6.1%) |
| $100,000 and over | 8,781 (96.1%) | 353 (3.9%) |
Public vs Private Health Insurance Coverage by Age in Kingman
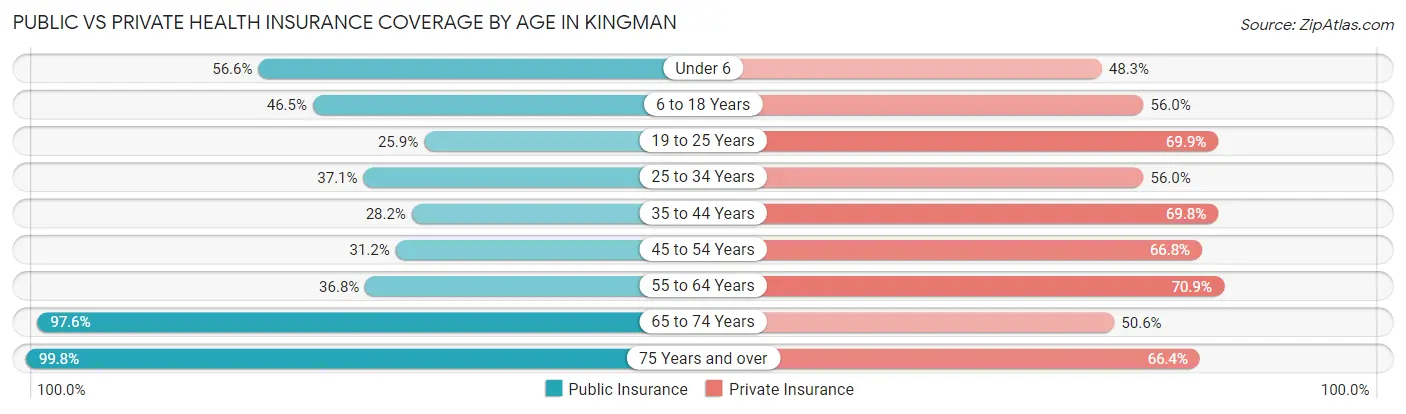
| Age Bracket | Public Insurance | Private Insurance |
| Under 6 | 1,296 (56.6%) | 1,105 (48.3%) |
| 6 to 18 Years | 2,280 (46.5%) | 2,746 (56.0%) |
| 19 to 25 Years | 533 (25.9%) | 1,439 (69.9%) |
| 25 to 34 Years | 1,423 (37.1%) | 2,147 (56.0%) |
| 35 to 44 Years | 1,007 (28.1%) | 2,498 (69.8%) |
| 45 to 54 Years | 788 (31.1%) | 1,691 (66.8%) |
| 55 to 64 Years | 1,776 (36.8%) | 3,422 (70.9%) |
| 65 to 74 Years | 3,680 (97.6%) | 1,907 (50.6%) |
| 75 Years and over | 3,847 (99.8%) | 2,562 (66.4%) |
| Total | 16,630 (52.5%) | 19,517 (61.7%) |
Disability Status by Sex by Age in Kingman
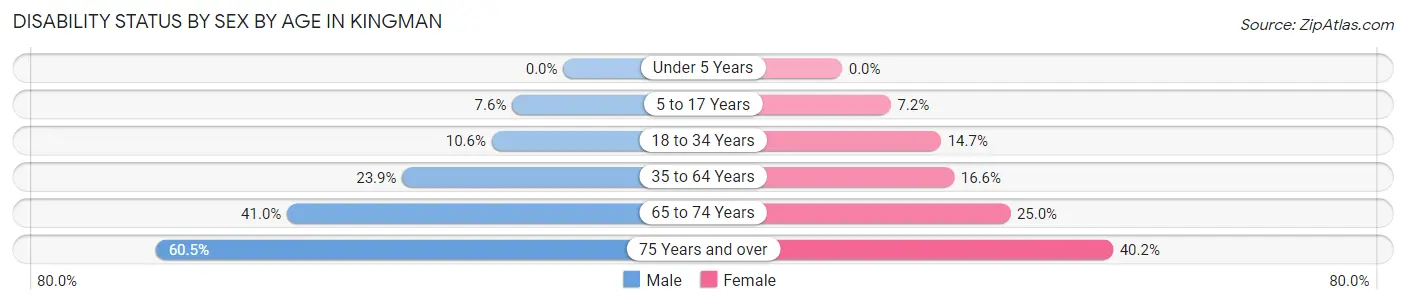
| Age Bracket | Male | Female |
| Under 5 Years | 0 (0.0%) | 0 (0.0%) |
| 5 to 17 Years | 194 (7.6%) | 187 (7.2%) |
| 18 to 34 Years | 316 (10.6%) | 464 (14.7%) |
| 35 to 64 Years | 1,320 (23.9%) | 901 (16.6%) |
| 65 to 74 Years | 746 (41.0%) | 487 (25.0%) |
| 75 Years and over | 1,070 (60.5%) | 840 (40.2%) |
Disability Class by Sex by Age in Kingman
Disability Class: Hearing Difficulty
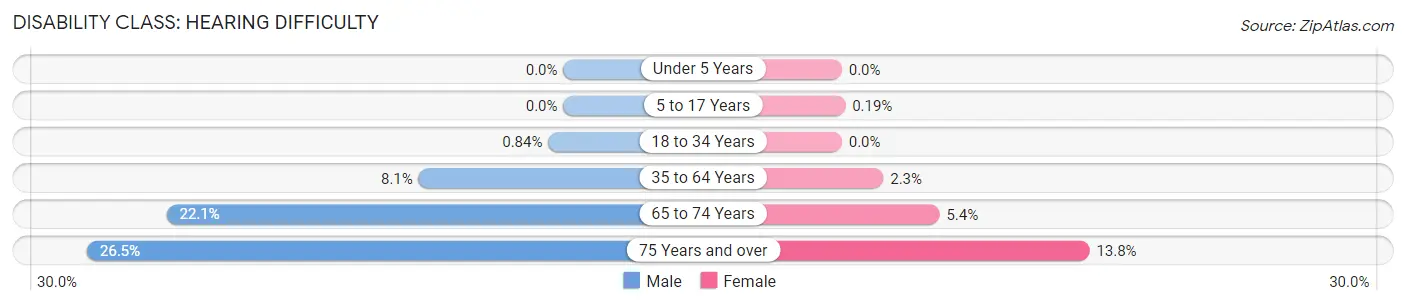
| Age Bracket | Male | Female |
| Under 5 Years | 0 (0.0%) | 0 (0.0%) |
| 5 to 17 Years | 0 (0.0%) | 5 (0.2%) |
| 18 to 34 Years | 25 (0.8%) | 0 (0.0%) |
| 35 to 64 Years | 445 (8.1%) | 125 (2.3%) |
| 65 to 74 Years | 402 (22.1%) | 106 (5.4%) |
| 75 Years and over | 469 (26.5%) | 288 (13.8%) |
Disability Class: Vision Difficulty
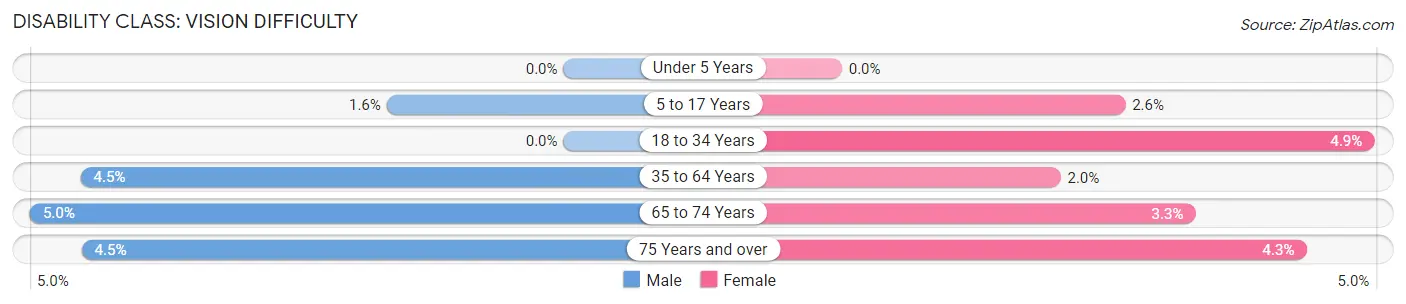
| Age Bracket | Male | Female |
| Under 5 Years | 0 (0.0%) | 0 (0.0%) |
| 5 to 17 Years | 42 (1.6%) | 68 (2.6%) |
| 18 to 34 Years | 0 (0.0%) | 156 (4.9%) |
| 35 to 64 Years | 247 (4.5%) | 110 (2.0%) |
| 65 to 74 Years | 90 (5.0%) | 64 (3.3%) |
| 75 Years and over | 79 (4.5%) | 90 (4.3%) |
Disability Class: Cognitive Difficulty
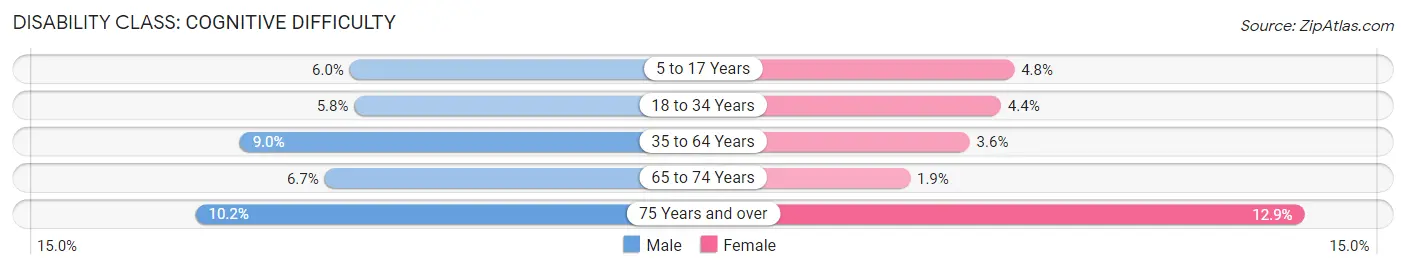
| Age Bracket | Male | Female |
| 5 to 17 Years | 152 (5.9%) | 124 (4.8%) |
| 18 to 34 Years | 173 (5.8%) | 140 (4.4%) |
| 35 to 64 Years | 497 (9.0%) | 193 (3.6%) |
| 65 to 74 Years | 121 (6.7%) | 37 (1.9%) |
| 75 Years and over | 181 (10.2%) | 269 (12.9%) |
Disability Class: Ambulatory Difficulty
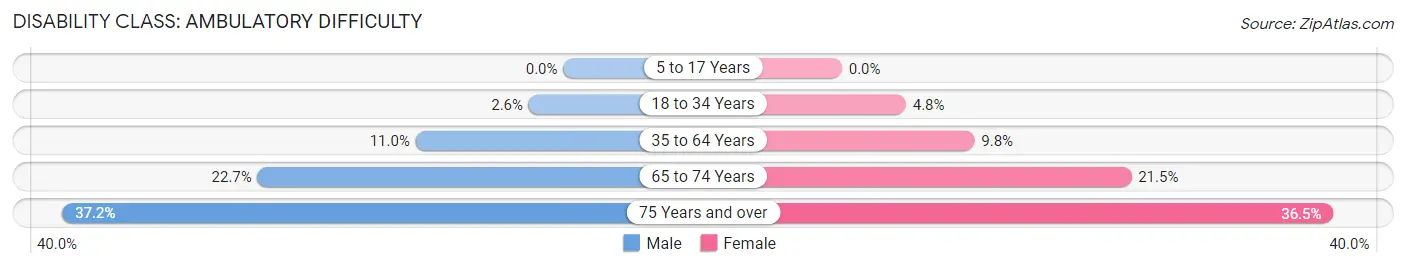
| Age Bracket | Male | Female |
| 5 to 17 Years | 0 (0.0%) | 0 (0.0%) |
| 18 to 34 Years | 76 (2.6%) | 150 (4.8%) |
| 35 to 64 Years | 605 (11.0%) | 533 (9.8%) |
| 65 to 74 Years | 413 (22.7%) | 419 (21.5%) |
| 75 Years and over | 658 (37.2%) | 762 (36.5%) |
Disability Class: Self-Care Difficulty
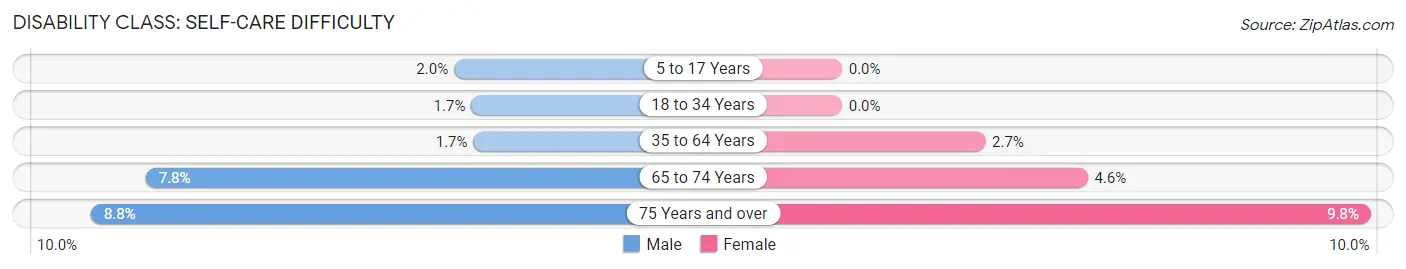
| Age Bracket | Male | Female |
| 5 to 17 Years | 52 (2.0%) | 0 (0.0%) |
| 18 to 34 Years | 51 (1.7%) | 0 (0.0%) |
| 35 to 64 Years | 92 (1.7%) | 144 (2.7%) |
| 65 to 74 Years | 141 (7.7%) | 89 (4.6%) |
| 75 Years and over | 155 (8.8%) | 205 (9.8%) |
Technology Access in Kingman
Computing Device Access in Kingman
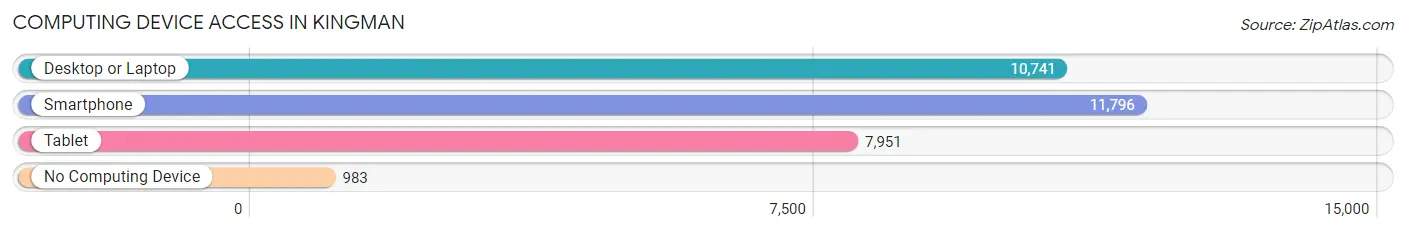
| Device Type | # Households | % Households |
| Desktop or Laptop | 10,741 | 76.6% |
| Smartphone | 11,796 | 84.1% |
| Tablet | 7,951 | 56.7% |
| No Computing Device | 983 | 7.0% |
| Total | 14,029 | 100.0% |
Internet Access in Kingman
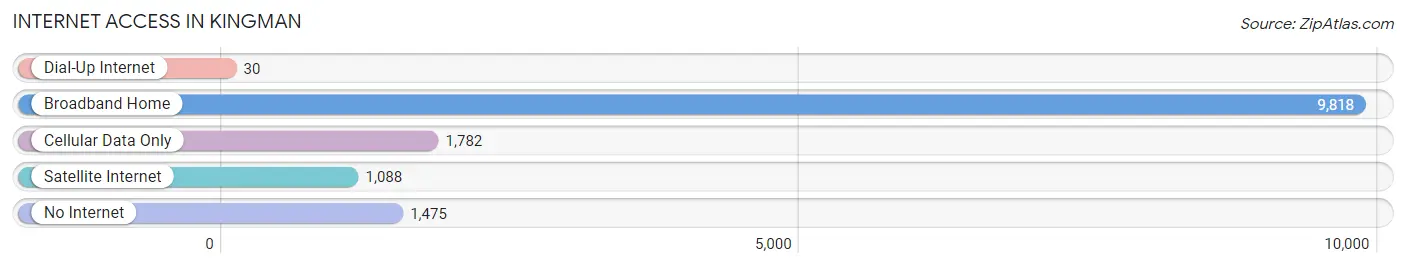
| Internet Type | # Households | % Households |
| Dial-Up Internet | 30 | 0.2% |
| Broadband Home | 9,818 | 70.0% |
| Cellular Data Only | 1,782 | 12.7% |
| Satellite Internet | 1,088 | 7.8% |
| No Internet | 1,475 | 10.5% |
| Total | 14,029 | 100.0% |
Kingman Summary
Kingman, Arizona is a city located in Mohave County in the northwestern corner of the state. It is the county seat and the largest city in the county. The city is situated along the historic Route 66 and is located about 85 miles southeast of Las Vegas, Nevada and about 165 miles northwest of Phoenix, Arizona. The city is located in the Hualapai Valley, which is surrounded by the Cerbat and Hualapai mountain ranges.
History
The area that is now Kingman was first inhabited by the Hualapai Native American tribe. The tribe had a settlement in the area for centuries before the arrival of the first European settlers in the late 19th century. The first settlers were miners who were drawn to the area by the discovery of gold and silver in the nearby mountains. The town of Kingman was founded in 1882 and was named after Lewis Kingman, a surveyor who worked for the Atlantic and Pacific Railroad.
The city quickly grew and became an important stop on the historic Route 66. The city was also a major hub for the mining industry and was home to several large copper mines. The city was also an important stop for travelers on the route, as it was the last major town before the California border.
Geography
Kingman is located in the Hualapai Valley, which is surrounded by the Cerbat and Hualapai mountain ranges. The city is located at an elevation of 3,336 feet and has a total area of 33.2 square miles. The city is located about 85 miles southeast of Las Vegas, Nevada and about 165 miles northwest of Phoenix, Arizona.
The climate in Kingman is classified as a semi-arid climate, with hot summers and mild winters. The average high temperature in the summer is around 95 degrees Fahrenheit, while the average low temperature in the winter is around 40 degrees Fahrenheit. The city receives an average of 8.5 inches of precipitation per year.
Economy
The economy of Kingman is largely based on tourism, manufacturing, and mining. The city is home to several large copper mines, which are a major source of employment for the city. The city is also a popular tourist destination, as it is located along the historic Route 66. The city is home to several museums, galleries, and other attractions that draw visitors from all over the world.
The city is also home to several manufacturing companies, including a large paper mill and a large aluminum smelter. The city is also home to several retail stores, restaurants, and other businesses that serve the local population.
Demographics
As of the 2010 census, the population of Kingman was 28,068. The racial makeup of the city was 79.2% White, 1.3% African American, 1.2% Native American, 0.7% Asian, 0.1% Pacific Islander, 15.2% from other races, and 2.5% from two or more races. Hispanic or Latino of any race were 28.2% of the population.
The median household income in Kingman was $37,845, and the median family income was $45,813. The per capita income for the city was $20,845. About 17.2% of the population was below the poverty line.
Kingman is a diverse city with a rich history and a vibrant economy. The city is home to several large copper mines, which are a major source of employment for the city. The city is also a popular tourist destination, as it is located along the historic Route 66. The city is home to several museums, galleries, and other attractions that draw visitors from all over the world. The city is also home to several manufacturing companies, retail stores, restaurants, and other businesses that serve the local population.
Common Questions
What is Per Capita Income in Kingman?
Per Capita income in Kingman is $31,806.
What is the Median Family Income in Kingman?
Median Family Income in Kingman is $63,614.
What is the Median Household income in Kingman?
Median Household Income in Kingman is $56,360.
What is Income or Wage Gap in Kingman?
Income or Wage Gap in Kingman is 17.9%.
Women in Kingman earn 82.1 cents for every dollar earned by a man.
What is Family Income Deficit in Kingman?
Family Income Deficit in Kingman is $10,440.
Families that are below poverty line in Kingman earn $10,440 less on average than the poverty threshold level.
What is Inequality or Gini Index in Kingman?
Inequality or Gini Index in Kingman is 0.44.
What is the Total Population of Kingman?
Total Population of Kingman is 33,052.
What is the Total Male Population of Kingman?
Total Male Population of Kingman is 16,516.
What is the Total Female Population of Kingman?
Total Female Population of Kingman is 16,536.
What is the Ratio of Males per 100 Females in Kingman?
There are 99.88 Males per 100 Females in Kingman.
What is the Ratio of Females per 100 Males in Kingman?
There are 100.12 Females per 100 Males in Kingman.
What is the Median Population Age in Kingman?
Median Population Age in Kingman is 42.1 Years.
What is the Average Family Size in Kingman
Average Family Size in Kingman is 2.8 People.
What is the Average Household Size in Kingman
Average Household Size in Kingman is 2.2 People.
How Large is the Labor Force in Kingman?
There are 13,253 People in the Labor Forcein in Kingman.
What is the Percentage of People in the Labor Force in Kingman?
49.3% of People are in the Labor Force in Kingman.
What is the Unemployment Rate in Kingman?
Unemployment Rate in Kingman is 6.3%.