Goodyear, AZ Map & Demographics
Goodyear Map
Goodyear Overview
$40,779
PER CAPITA INCOME
$108,046
AVG FAMILY INCOME
$97,307
AVG HOUSEHOLD INCOME
33.0%
WAGE / INCOME GAP [ % ]
67.0¢/ $1
WAGE / INCOME GAP [ $ ]
$12,155
FAMILY INCOME DEFICIT
0.38
INEQUALITY / GINI INDEX
97,542
TOTAL POPULATION
47,648
MALE POPULATION
49,894
FEMALE POPULATION
95.50
MALES / 100 FEMALES
104.71
FEMALES / 100 MALES
40.4
MEDIAN AGE
3.1
AVG FAMILY SIZE
2.8
AVG HOUSEHOLD SIZE
46,201
LABOR FORCE [ PEOPLE ]
59.2%
PERCENT IN LABOR FORCE
5.5%
UNEMPLOYMENT RATE
Goodyear Area Codes
Income in Goodyear
Income Overview in Goodyear
Per Capita Income in Goodyear is $40,779, while median incomes of families and households are $108,046 and $97,307 respectively.
| Characteristic | Number | Measure |
| Per Capita Income | 97,542 | $40,779 |
| Median Family Income | 25,820 | $108,046 |
| Mean Family Income | 25,820 | $126,248 |
| Median Household Income | 33,222 | $97,307 |
| Mean Household Income | 33,222 | $117,968 |
| Income Deficit | 25,820 | $12,155 |
| Wage / Income Gap (%) | 97,542 | 32.96% |
| Wage / Income Gap ($) | 97,542 | 67.04¢ per $1 |
| Gini / Inequality Index | 97,542 | 0.38 |
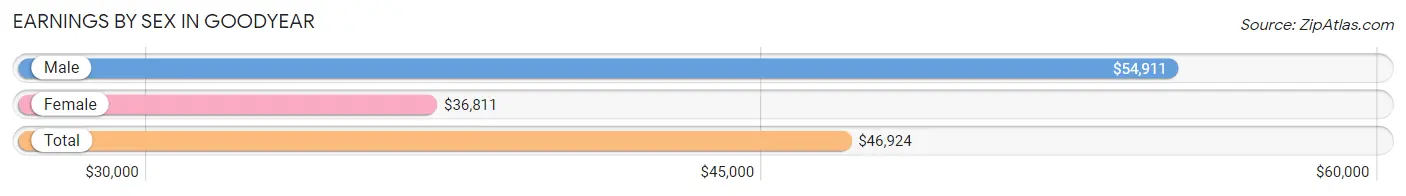
Earnings by Sex in Goodyear
Average Earnings in Goodyear are $46,924, $54,911 for men and $36,811 for women, a difference of 33.0%.
| Sex | Number | Average Earnings |
| Male | 26,098 (53.7%) | $54,911 |
| Female | 22,465 (46.3%) | $36,811 |
| Total | 48,563 (100.0%) | $46,924 |
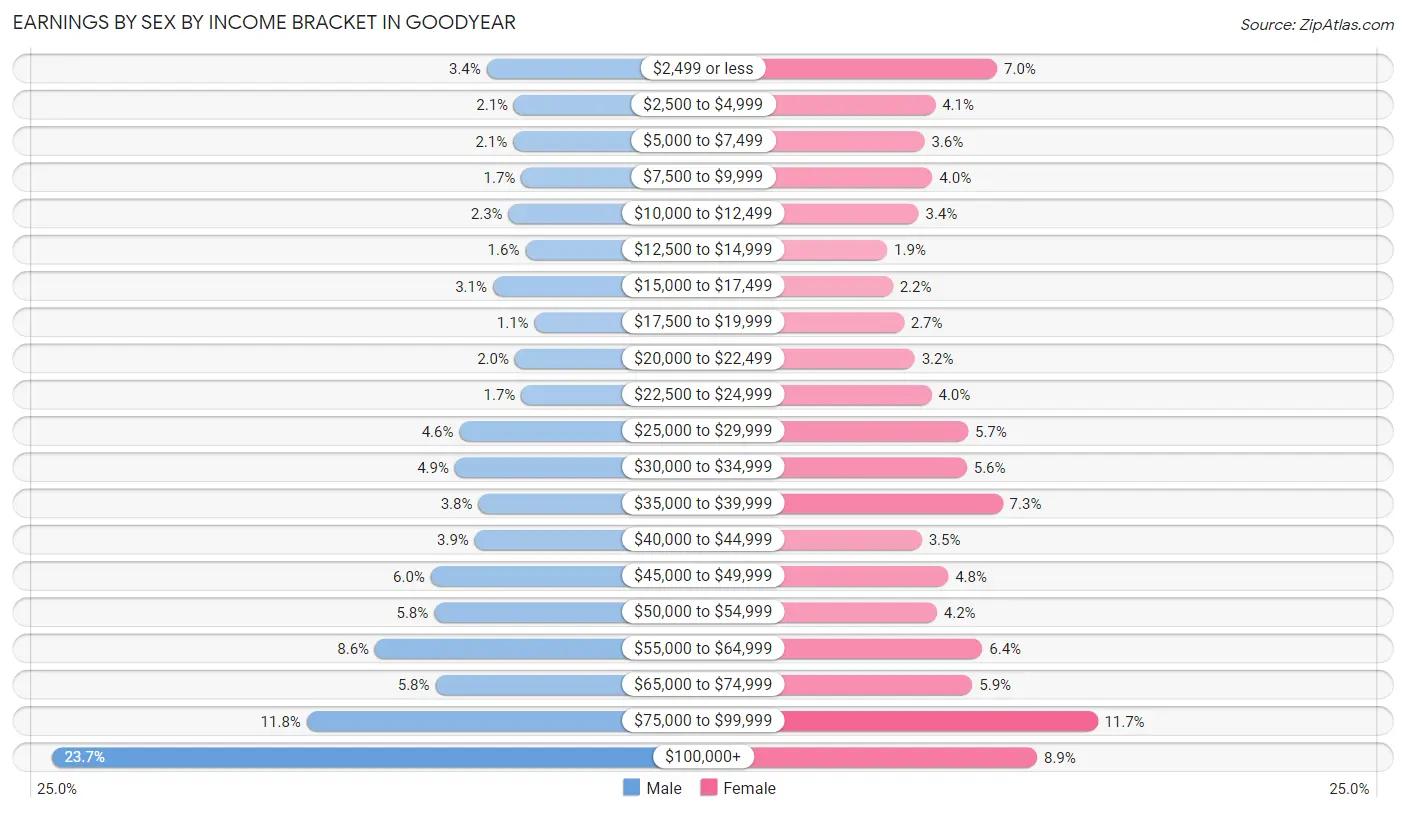
Earnings by Sex by Income Bracket in Goodyear
The most common earnings brackets in Goodyear are $100,000+ for men (6,196 | 23.7%) and $75,000 to $99,999 for women (2,637 | 11.7%).
| Income | Male | Female |
| $2,499 or less | 877 (3.4%) | 1,581 (7.0%) |
| $2,500 to $4,999 | 544 (2.1%) | 931 (4.1%) |
| $5,000 to $7,499 | 552 (2.1%) | 817 (3.6%) |
| $7,500 to $9,999 | 453 (1.7%) | 901 (4.0%) |
| $10,000 to $12,499 | 610 (2.3%) | 755 (3.4%) |
| $12,500 to $14,999 | 404 (1.5%) | 425 (1.9%) |
| $15,000 to $17,499 | 802 (3.1%) | 483 (2.1%) |
| $17,500 to $19,999 | 293 (1.1%) | 599 (2.7%) |
| $20,000 to $22,499 | 532 (2.0%) | 714 (3.2%) |
| $22,500 to $24,999 | 453 (1.7%) | 891 (4.0%) |
| $25,000 to $29,999 | 1,211 (4.6%) | 1,277 (5.7%) |
| $30,000 to $34,999 | 1,267 (4.9%) | 1,263 (5.6%) |
| $35,000 to $39,999 | 978 (3.7%) | 1,639 (7.3%) |
| $40,000 to $44,999 | 1,023 (3.9%) | 788 (3.5%) |
| $45,000 to $49,999 | 1,561 (6.0%) | 1,067 (4.8%) |
| $50,000 to $54,999 | 1,519 (5.8%) | 949 (4.2%) |
| $55,000 to $64,999 | 2,243 (8.6%) | 1,427 (6.4%) |
| $65,000 to $74,999 | 1,502 (5.8%) | 1,320 (5.9%) |
| $75,000 to $99,999 | 3,078 (11.8%) | 2,637 (11.7%) |
| $100,000+ | 6,196 (23.7%) | 2,001 (8.9%) |
| Total | 26,098 (100.0%) | 22,465 (100.0%) |
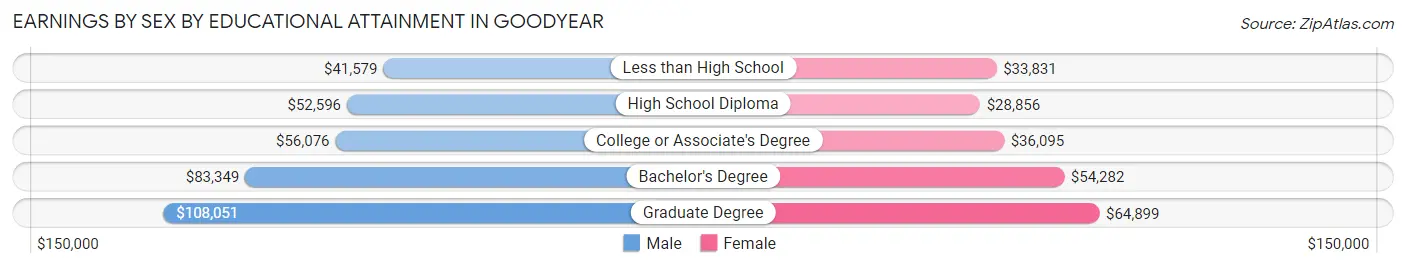
Earnings by Sex by Educational Attainment in Goodyear
Average earnings in Goodyear are $61,450 for men and $40,204 for women, a difference of 34.6%. Men with an educational attainment of graduate degree enjoy the highest average annual earnings of $108,051, while those with less than high school education earn the least with $41,579. Women with an educational attainment of graduate degree earn the most with the average annual earnings of $64,899, while those with high school diploma education have the smallest earnings of $28,856.
| Educational Attainment | Male Income | Female Income |
| Less than High School | $41,579 | $33,831 |
| High School Diploma | $52,596 | $28,856 |
| College or Associate's Degree | $56,076 | $36,095 |
| Bachelor's Degree | $83,349 | $54,282 |
| Graduate Degree | $108,051 | $64,899 |
| Total | $61,450 | $40,204 |
Family Income in Goodyear
Family Income Brackets in Goodyear
According to the Goodyear family income data, there are 6,326 families falling into the $100,000 to $149,999 income range, which is the most common income bracket and makes up 24.5% of all families. Conversely, the $10,000 to $14,999 income bracket is the least frequent group with only 26 families (0.1%) belonging to this category.
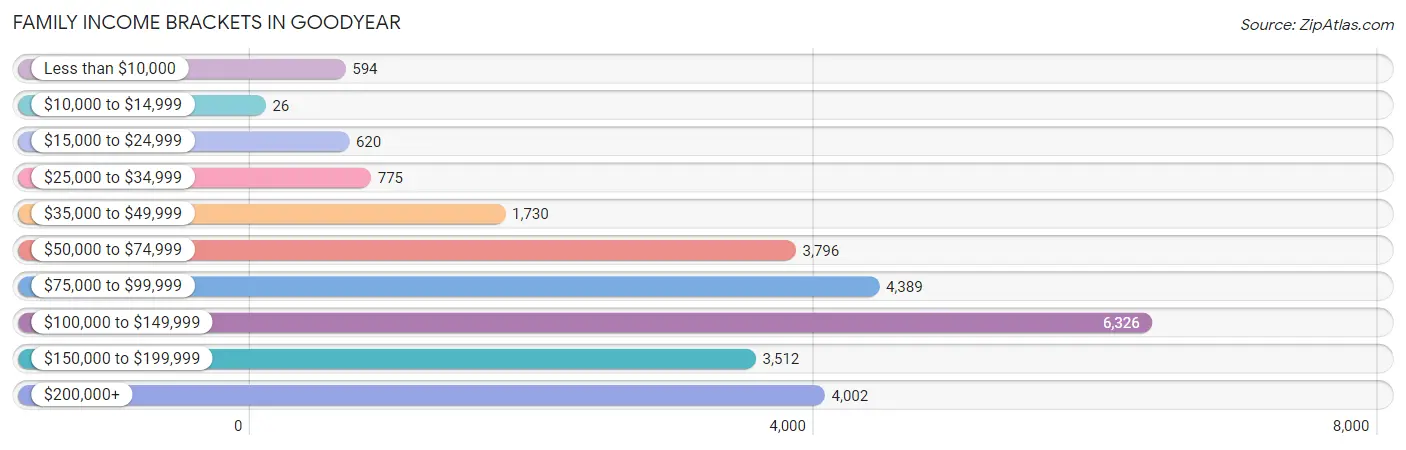
| Income Bracket | # Families | % Families |
| Less than $10,000 | 594 | 2.3% |
| $10,000 to $14,999 | 26 | 0.1% |
| $15,000 to $24,999 | 620 | 2.4% |
| $25,000 to $34,999 | 775 | 3.0% |
| $35,000 to $49,999 | 1,730 | 6.7% |
| $50,000 to $74,999 | 3,796 | 14.7% |
| $75,000 to $99,999 | 4,389 | 17.0% |
| $100,000 to $149,999 | 6,326 | 24.5% |
| $150,000 to $199,999 | 3,512 | 13.6% |
| $200,000+ | 4,002 | 15.5% |
Family Income by Famaliy Size in Goodyear
7+ person families (574 | 2.2%) account for the highest median family income in Goodyear with $124,306 per family, while 2-person families (12,230 | 47.4%) have the highest median income of $48,105 per family member.
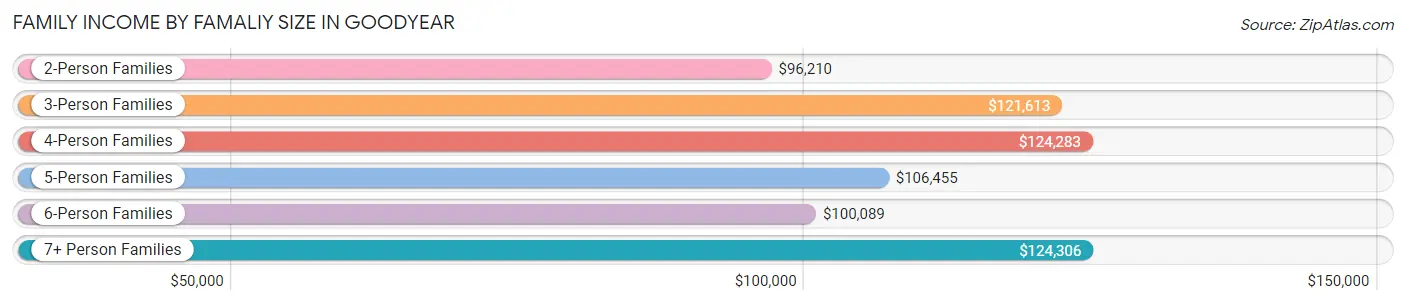
| Income Bracket | # Families | Median Income |
| 2-Person Families | 12,230 (47.4%) | $96,210 |
| 3-Person Families | 4,698 (18.2%) | $121,613 |
| 4-Person Families | 4,607 (17.8%) | $124,283 |
| 5-Person Families | 2,866 (11.1%) | $106,455 |
| 6-Person Families | 845 (3.3%) | $100,089 |
| 7+ Person Families | 574 (2.2%) | $124,306 |
| Total | 25,820 (100.0%) | $108,046 |
Family Income by Number of Earners in Goodyear
The median family income in Goodyear is $108,046, with families comprising 3+ earners (3,474) having the highest median family income of $157,315, while families with 1 earner (7,529) have the lowest median family income of $84,312, accounting for 13.5% and 29.2% of families, respectively.
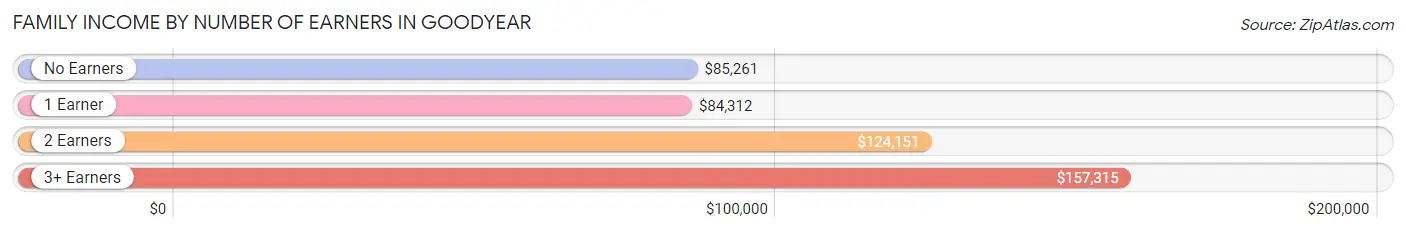
| Number of Earners | # Families | Median Income |
| No Earners | 4,797 (18.6%) | $85,261 |
| 1 Earner | 7,529 (29.2%) | $84,312 |
| 2 Earners | 10,020 (38.8%) | $124,151 |
| 3+ Earners | 3,474 (13.5%) | $157,315 |
| Total | 25,820 (100.0%) | $108,046 |
Household Income in Goodyear
Household Income Brackets in Goodyear
With 7,508 households falling in the category, the $100,000 to $149,999 income range is the most frequent in Goodyear, accounting for 22.6% of all households. In contrast, only 100 households (0.3%) fall into the $10,000 to $14,999 income bracket, making it the least populous group.
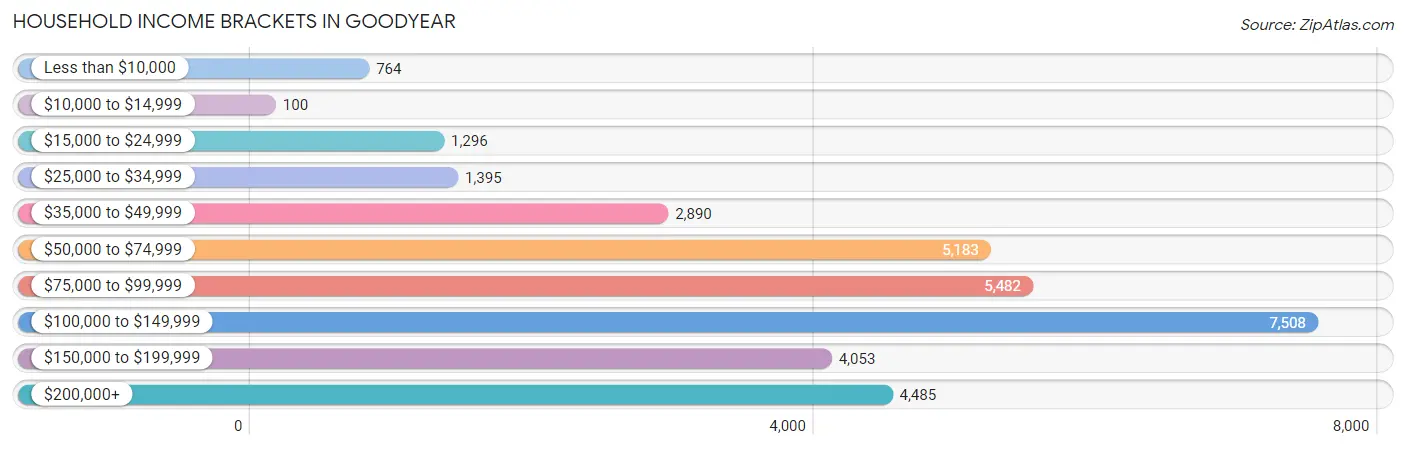
| Income Bracket | # Households | % Households |
| Less than $10,000 | 764 | 2.3% |
| $10,000 to $14,999 | 100 | 0.3% |
| $15,000 to $24,999 | 1,296 | 3.9% |
| $25,000 to $34,999 | 1,395 | 4.2% |
| $35,000 to $49,999 | 2,890 | 8.7% |
| $50,000 to $74,999 | 5,183 | 15.6% |
| $75,000 to $99,999 | 5,482 | 16.5% |
| $100,000 to $149,999 | 7,508 | 22.6% |
| $150,000 to $199,999 | 4,053 | 12.2% |
| $200,000+ | 4,485 | 13.5% |
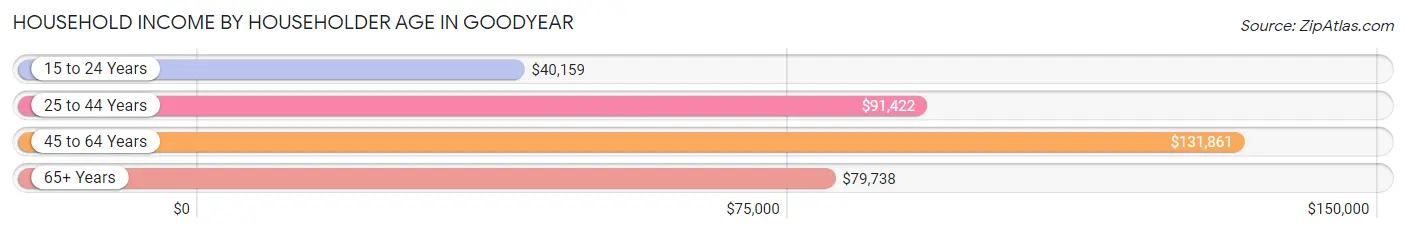
Household Income by Householder Age in Goodyear
The median household income in Goodyear is $97,307, with the highest median household income of $131,861 found in the 45 to 64 years age bracket for the primary householder. A total of 12,155 households (36.6%) fall into this category. Meanwhile, the 15 to 24 years age bracket for the primary householder has the lowest median household income of $40,159, with 626 households (1.9%) in this group.
| Income Bracket | # Households | Median Income |
| 15 to 24 Years | 626 (1.9%) | $40,159 |
| 25 to 44 Years | 10,672 (32.1%) | $91,422 |
| 45 to 64 Years | 12,155 (36.6%) | $131,861 |
| 65+ Years | 9,769 (29.4%) | $79,738 |
| Total | 33,222 (100.0%) | $97,307 |
Poverty in Goodyear
Income Below Poverty by Sex and Age in Goodyear
With 5.5% poverty level for males and 5.5% for females among the residents of Goodyear, under 5 year old males and under 5 year old females are the most vulnerable to poverty, with 393 males (12.1%) and 230 females (10.2%) in their respective age groups living below the poverty level.
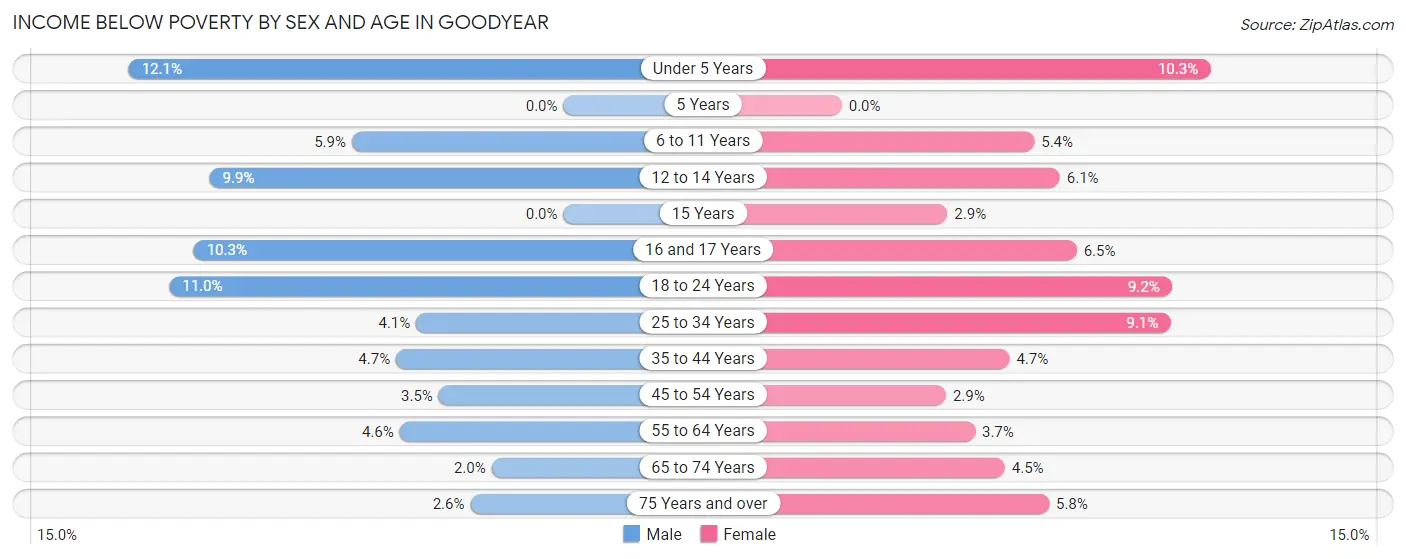
| Age Bracket | Male | Female |
| Under 5 Years | 393 (12.1%) | 230 (10.2%) |
| 5 Years | 0 (0.0%) | 0 (0.0%) |
| 6 to 11 Years | 224 (5.9%) | 201 (5.4%) |
| 12 to 14 Years | 227 (9.9%) | 125 (6.1%) |
| 15 Years | 0 (0.0%) | 16 (2.9%) |
| 16 and 17 Years | 148 (10.3%) | 83 (6.5%) |
| 18 to 24 Years | 418 (11.0%) | 292 (9.2%) |
| 25 to 34 Years | 210 (4.1%) | 455 (9.1%) |
| 35 to 44 Years | 279 (4.7%) | 306 (4.7%) |
| 45 to 54 Years | 239 (3.5%) | 185 (2.9%) |
| 55 to 64 Years | 227 (4.6%) | 197 (3.7%) |
| 65 to 74 Years | 103 (2.0%) | 263 (4.5%) |
| 75 Years and over | 80 (2.6%) | 188 (5.8%) |
| Total | 2,548 (5.5%) | 2,541 (5.5%) |
Income Above Poverty by Sex and Age in Goodyear
According to the poverty statistics in Goodyear, males aged 5 years and females aged 5 years are the age groups that are most secure financially, with 100.0% of males and 100.0% of females in these age groups living above the poverty line.
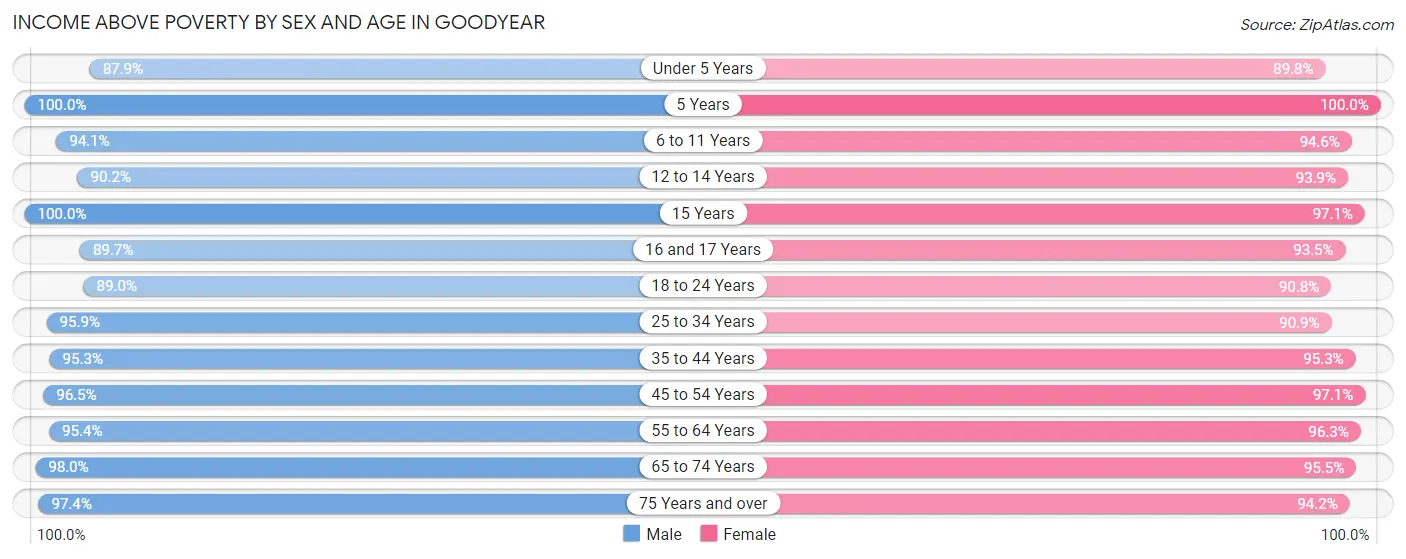
| Age Bracket | Male | Female |
| Under 5 Years | 2,855 (87.9%) | 2,014 (89.7%) |
| 5 Years | 399 (100.0%) | 618 (100.0%) |
| 6 to 11 Years | 3,577 (94.1%) | 3,552 (94.6%) |
| 12 to 14 Years | 2,078 (90.1%) | 1,936 (93.9%) |
| 15 Years | 385 (100.0%) | 528 (97.1%) |
| 16 and 17 Years | 1,290 (89.7%) | 1,186 (93.5%) |
| 18 to 24 Years | 3,393 (89.0%) | 2,889 (90.8%) |
| 25 to 34 Years | 4,906 (95.9%) | 4,522 (90.9%) |
| 35 to 44 Years | 5,706 (95.3%) | 6,240 (95.3%) |
| 45 to 54 Years | 6,646 (96.5%) | 6,198 (97.1%) |
| 55 to 64 Years | 4,749 (95.4%) | 5,107 (96.3%) |
| 65 to 74 Years | 5,044 (98.0%) | 5,535 (95.5%) |
| 75 Years and over | 3,006 (97.4%) | 3,073 (94.2%) |
| Total | 44,034 (94.5%) | 43,398 (94.5%) |
Income Below Poverty Among Married-Couple Families in Goodyear
The poverty statistics for married-couple families in Goodyear show that 2.3% or 509 of the total 21,856 families live below the poverty line. Families with 3 or 4 children have the highest poverty rate of 8.4%, comprising of 187 families. On the other hand, families with 5 or more children have the lowest poverty rate of 0.0%, which includes 0 families.
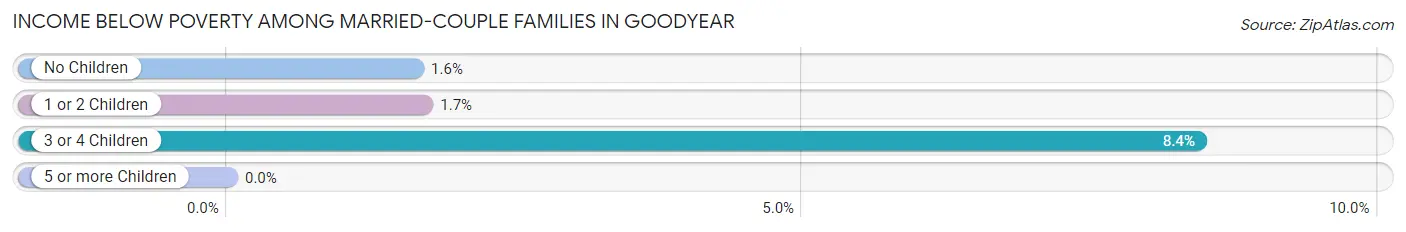
| Children | Above Poverty | Below Poverty |
| No Children | 12,853 (98.4%) | 212 (1.6%) |
| 1 or 2 Children | 6,349 (98.3%) | 110 (1.7%) |
| 3 or 4 Children | 2,031 (91.6%) | 187 (8.4%) |
| 5 or more Children | 114 (100.0%) | 0 (0.0%) |
| Total | 21,347 (97.7%) | 509 (2.3%) |
Income Below Poverty Among Single-Parent Households in Goodyear
According to the poverty data in Goodyear, 5.0% or 54 single-father households and 18.2% or 522 single-mother households are living below the poverty line. Among single-father households, those with 1 or 2 children have the highest poverty rate, with 50 households (13.3%) experiencing poverty. Likewise, among single-mother households, those with 3 or 4 children have the highest poverty rate, with 98 households (32.0%) falling below the poverty line.
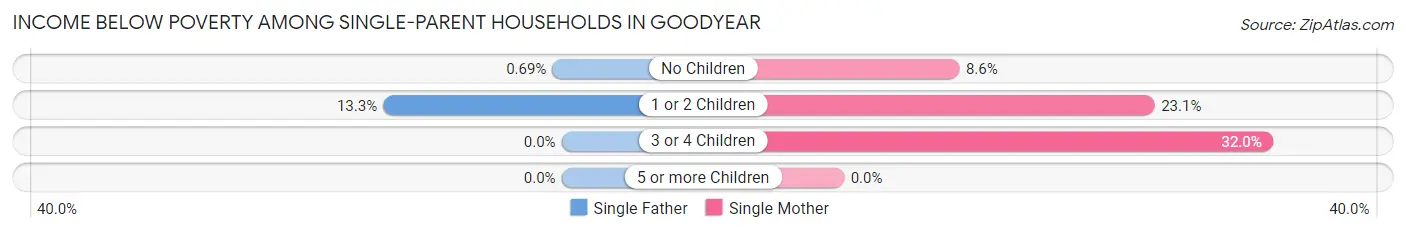
| Children | Single Father | Single Mother |
| No Children | 4 (0.7%) | 81 (8.6%) |
| 1 or 2 Children | 50 (13.3%) | 343 (23.1%) |
| 3 or 4 Children | 0 (0.0%) | 98 (32.0%) |
| 5 or more Children | 0 (0.0%) | 0 (0.0%) |
| Total | 54 (5.0%) | 522 (18.2%) |
Income Below Poverty Among Married-Couple vs Single-Parent Households in Goodyear
The poverty data for Goodyear shows that 509 of the married-couple family households (2.3%) and 576 of the single-parent households (14.5%) are living below the poverty level. Within the married-couple family households, those with 3 or 4 children have the highest poverty rate, with 187 households (8.4%) falling below the poverty line. Among the single-parent households, those with 3 or 4 children have the highest poverty rate, with 98 household (25.4%) living below poverty.
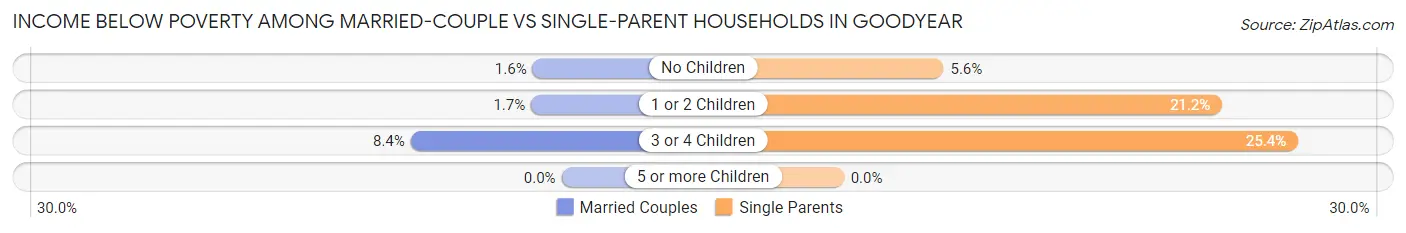
| Children | Married-Couple Families | Single-Parent Households |
| No Children | 212 (1.6%) | 85 (5.6%) |
| 1 or 2 Children | 110 (1.7%) | 393 (21.1%) |
| 3 or 4 Children | 187 (8.4%) | 98 (25.4%) |
| 5 or more Children | 0 (0.0%) | 0 (0.0%) |
| Total | 509 (2.3%) | 576 (14.5%) |
Race in Goodyear
The most populous races in Goodyear are White / Caucasian (63,231 | 64.8%), Hispanic or Latino (31,348 | 32.1%), and Two or more Races (14,685 | 15.1%).
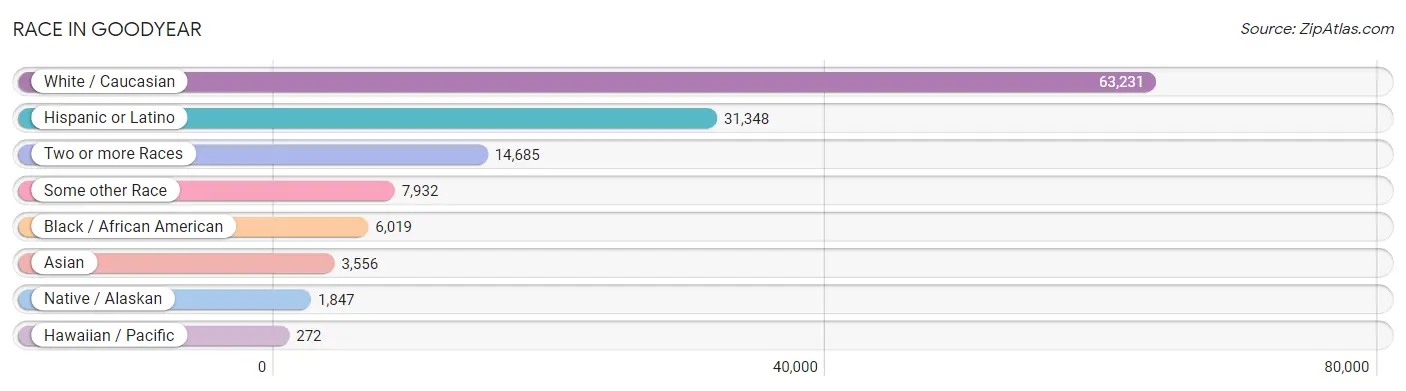
| Race | # Population | % Population |
| Asian | 3,556 | 3.6% |
| Black / African American | 6,019 | 6.2% |
| Hawaiian / Pacific | 272 | 0.3% |
| Hispanic or Latino | 31,348 | 32.1% |
| Native / Alaskan | 1,847 | 1.9% |
| White / Caucasian | 63,231 | 64.8% |
| Two or more Races | 14,685 | 15.1% |
| Some other Race | 7,932 | 8.1% |
| Total | 97,542 | 100.0% |
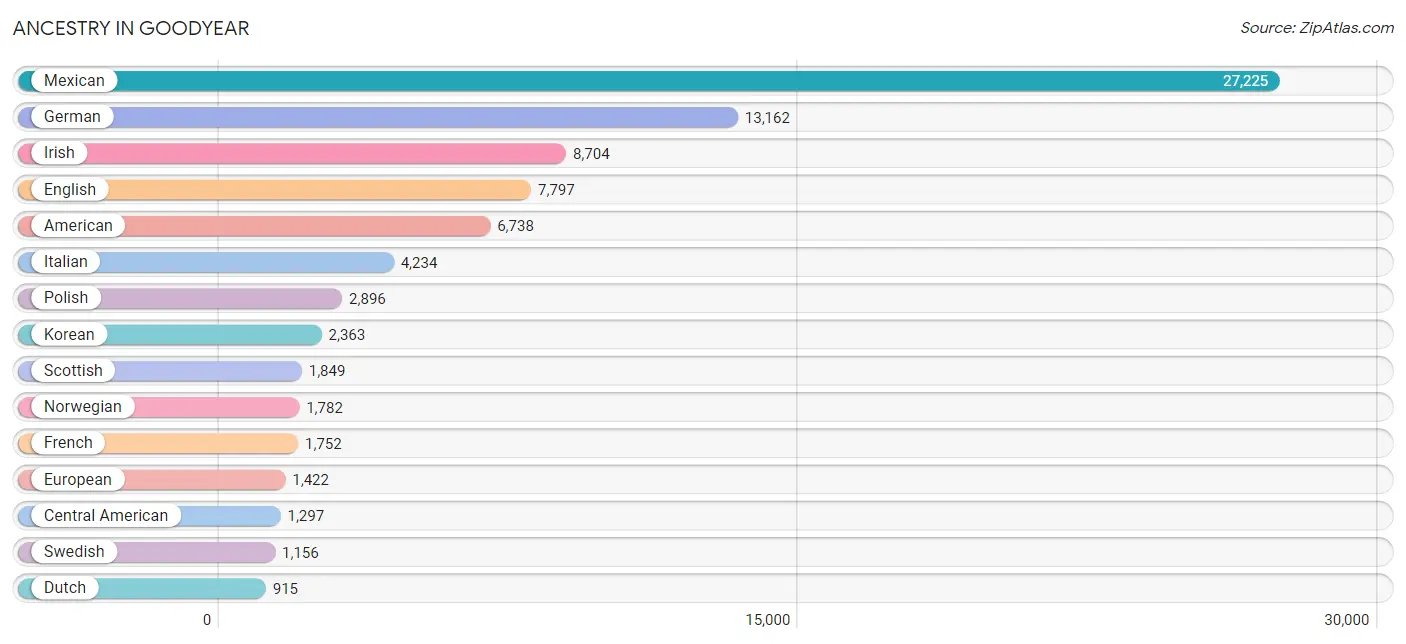
Ancestry in Goodyear
The most populous ancestries reported in Goodyear are Mexican (27,225 | 27.9%), German (13,162 | 13.5%), Irish (8,704 | 8.9%), English (7,797 | 8.0%), and American (6,738 | 6.9%), together accounting for 65.2% of all Goodyear residents.
| Ancestry | # Population | % Population |
| Afghan | 27 | 0.0% |
| African | 265 | 0.3% |
| Alaskan Athabascan | 10 | 0.0% |
| American | 6,738 | 6.9% |
| Apache | 389 | 0.4% |
| Arab | 181 | 0.2% |
| Armenian | 23 | 0.0% |
| Australian | 154 | 0.2% |
| Austrian | 182 | 0.2% |
| Barbadian | 48 | 0.1% |
| Belgian | 102 | 0.1% |
| Bhutanese | 304 | 0.3% |
| Blackfeet | 141 | 0.1% |
| Brazilian | 288 | 0.3% |
| British | 684 | 0.7% |
| Bulgarian | 49 | 0.1% |
| Burmese | 210 | 0.2% |
| Canadian | 257 | 0.3% |
| Central American | 1,297 | 1.3% |
| Central American Indian | 19 | 0.0% |
| Cherokee | 437 | 0.4% |
| Cheyenne | 8 | 0.0% |
| Choctaw | 32 | 0.0% |
| Colombian | 261 | 0.3% |
| Comanche | 16 | 0.0% |
| Costa Rican | 93 | 0.1% |
| Creek | 9 | 0.0% |
| Croatian | 194 | 0.2% |
| Cuban | 365 | 0.4% |
| Czech | 269 | 0.3% |
| Czechoslovakian | 73 | 0.1% |
| Danish | 466 | 0.5% |
| Dominican | 350 | 0.4% |
| Dutch | 915 | 0.9% |
| Eastern European | 140 | 0.1% |
| Ecuadorian | 45 | 0.1% |
| Egyptian | 10 | 0.0% |
| English | 7,797 | 8.0% |
| Estonian | 14 | 0.0% |
| European | 1,422 | 1.5% |
| Filipino | 633 | 0.6% |
| Finnish | 307 | 0.3% |
| French | 1,752 | 1.8% |
| French Canadian | 604 | 0.6% |
| German | 13,162 | 13.5% |
| Greek | 161 | 0.2% |
| Guamanian / Chamorro | 67 | 0.1% |
| Guatemalan | 176 | 0.2% |
| Honduran | 82 | 0.1% |
| Hopi | 38 | 0.0% |
| Hungarian | 387 | 0.4% |
| Indian (Asian) | 816 | 0.8% |
| Iranian | 33 | 0.0% |
| Irish | 8,704 | 8.9% |
| Iroquois | 12 | 0.0% |
| Italian | 4,234 | 4.3% |
| Jamaican | 107 | 0.1% |
| Japanese | 51 | 0.1% |
| Jordanian | 25 | 0.0% |
| Korean | 2,363 | 2.4% |
| Lebanese | 67 | 0.1% |
| Lithuanian | 230 | 0.2% |
| Lumbee | 17 | 0.0% |
| Luxembourger | 15 | 0.0% |
| Malaysian | 61 | 0.1% |
| Mexican | 27,225 | 27.9% |
| Mexican American Indian | 147 | 0.2% |
| Mongolian | 11 | 0.0% |
| Moroccan | 10 | 0.0% |
| Native Hawaiian | 192 | 0.2% |
| Navajo | 331 | 0.3% |
| Nicaraguan | 183 | 0.2% |
| Northern European | 356 | 0.4% |
| Norwegian | 1,782 | 1.8% |
| Okinawan | 60 | 0.1% |
| Pakistani | 123 | 0.1% |
| Panamanian | 66 | 0.1% |
| Peruvian | 113 | 0.1% |
| Pima | 24 | 0.0% |
| Polish | 2,896 | 3.0% |
| Portuguese | 280 | 0.3% |
| Puerto Rican | 661 | 0.7% |
| Romanian | 145 | 0.2% |
| Russian | 454 | 0.5% |
| Salvadoran | 640 | 0.7% |
| Samoan | 4 | 0.0% |
| Scandinavian | 446 | 0.5% |
| Scotch-Irish | 370 | 0.4% |
| Scottish | 1,849 | 1.9% |
| Seminole | 12 | 0.0% |
| Senegalese | 12 | 0.0% |
| Serbian | 43 | 0.0% |
| Sioux | 72 | 0.1% |
| Slavic | 44 | 0.1% |
| Slovak | 131 | 0.1% |
| Slovene | 8 | 0.0% |
| South African | 47 | 0.1% |
| South American | 419 | 0.4% |
| Spaniard | 334 | 0.3% |
| Spanish | 187 | 0.2% |
| Sri Lankan | 565 | 0.6% |
| Subsaharan African | 397 | 0.4% |
| Swedish | 1,156 | 1.2% |
| Swiss | 229 | 0.2% |
| Thai | 430 | 0.4% |
| Tlingit-Haida | 4 | 0.0% |
| Tohono O'Odham | 11 | 0.0% |
| Turkish | 72 | 0.1% |
| Ukrainian | 94 | 0.1% |
| Welsh | 373 | 0.4% |
| West Indian | 33 | 0.0% |
| Yakama | 9 | 0.0% |
| Yaqui | 326 | 0.3% |
| Zimbabwean | 36 | 0.0% | View All 114 Rows |
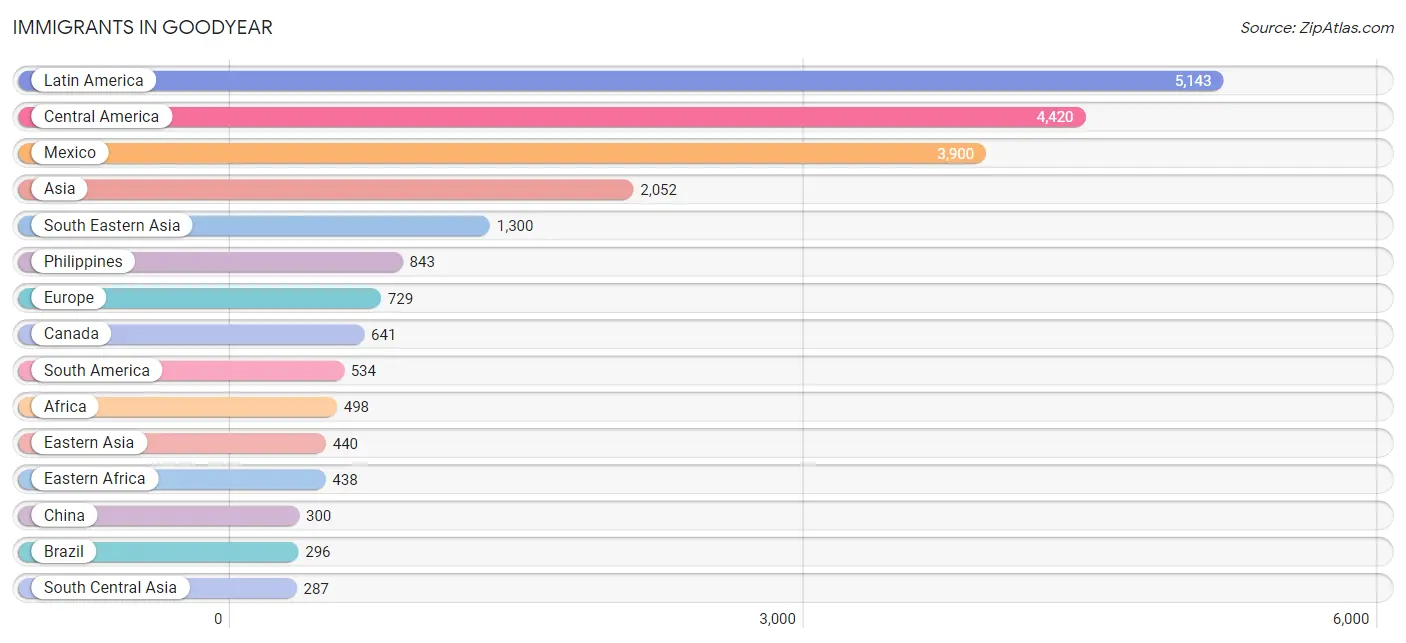
Immigrants in Goodyear
The most numerous immigrant groups reported in Goodyear came from Latin America (5,143 | 5.3%), Central America (4,420 | 4.5%), Mexico (3,900 | 4.0%), Asia (2,052 | 2.1%), and South Eastern Asia (1,300 | 1.3%), together accounting for 17.2% of all Goodyear residents.
| Immigration Origin | # Population | % Population |
| Africa | 498 | 0.5% |
| Asia | 2,052 | 2.1% |
| Australia | 160 | 0.2% |
| Austria | 13 | 0.0% |
| Bahamas | 13 | 0.0% |
| Barbados | 48 | 0.1% |
| Belgium | 9 | 0.0% |
| Brazil | 296 | 0.3% |
| Bulgaria | 49 | 0.1% |
| Canada | 641 | 0.7% |
| Caribbean | 189 | 0.2% |
| Central America | 4,420 | 4.5% |
| China | 300 | 0.3% |
| Colombia | 78 | 0.1% |
| Cuba | 72 | 0.1% |
| Eastern Africa | 438 | 0.4% |
| Eastern Asia | 440 | 0.4% |
| Eastern Europe | 178 | 0.2% |
| Ecuador | 62 | 0.1% |
| El Salvador | 178 | 0.2% |
| England | 53 | 0.1% |
| Europe | 729 | 0.7% |
| France | 8 | 0.0% |
| Germany | 167 | 0.2% |
| Guatemala | 119 | 0.1% |
| Guyana | 17 | 0.0% |
| Honduras | 70 | 0.1% |
| Hong Kong | 34 | 0.0% |
| India | 211 | 0.2% |
| Ireland | 104 | 0.1% |
| Italy | 78 | 0.1% |
| Jamaica | 56 | 0.1% |
| Japan | 75 | 0.1% |
| Jordan | 25 | 0.0% |
| Korea | 65 | 0.1% |
| Laos | 21 | 0.0% |
| Latin America | 5,143 | 5.3% |
| Malaysia | 11 | 0.0% |
| Mexico | 3,900 | 4.0% |
| Nepal | 4 | 0.0% |
| Nicaragua | 87 | 0.1% |
| Northern Africa | 44 | 0.1% |
| Northern Europe | 276 | 0.3% |
| Norway | 22 | 0.0% |
| Oceania | 160 | 0.2% |
| Panama | 66 | 0.1% |
| Peru | 81 | 0.1% |
| Philippines | 843 | 0.9% |
| Poland | 81 | 0.1% |
| Romania | 39 | 0.0% |
| Russia | 9 | 0.0% |
| Scotland | 17 | 0.0% |
| Singapore | 82 | 0.1% |
| South Africa | 16 | 0.0% |
| South America | 534 | 0.5% |
| South Central Asia | 287 | 0.3% |
| South Eastern Asia | 1,300 | 1.3% |
| Southern Europe | 78 | 0.1% |
| Sri Lanka | 72 | 0.1% |
| Sudan | 44 | 0.1% |
| Sweden | 40 | 0.0% |
| Taiwan | 48 | 0.1% |
| Thailand | 111 | 0.1% |
| Vietnam | 228 | 0.2% |
| Western Asia | 25 | 0.0% |
| Western Europe | 197 | 0.2% | View All 66 Rows |
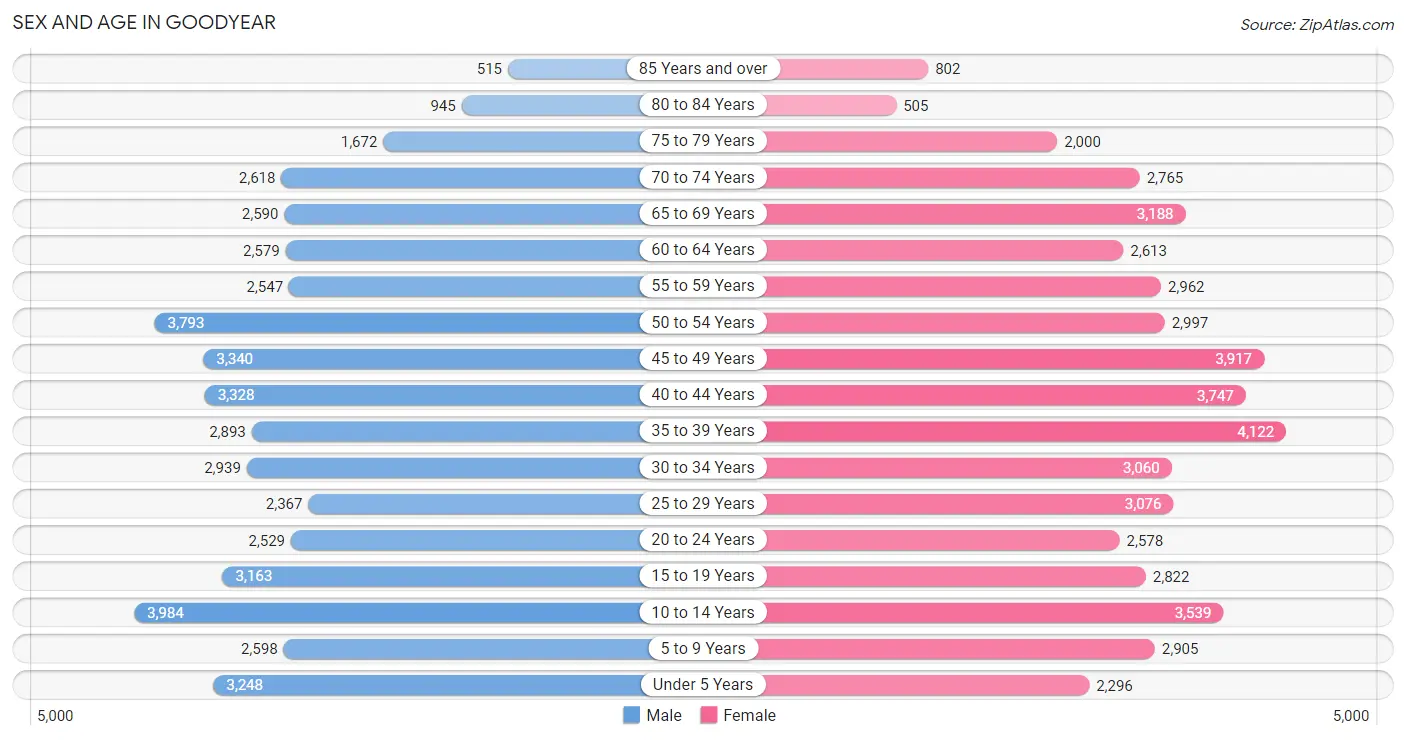
Sex and Age in Goodyear
Sex and Age in Goodyear
The most populous age groups in Goodyear are 10 to 14 Years (3,984 | 8.4%) for men and 35 to 39 Years (4,122 | 8.3%) for women.
| Age Bracket | Male | Female |
| Under 5 Years | 3,248 (6.8%) | 2,296 (4.6%) |
| 5 to 9 Years | 2,598 (5.4%) | 2,905 (5.8%) |
| 10 to 14 Years | 3,984 (8.4%) | 3,539 (7.1%) |
| 15 to 19 Years | 3,163 (6.6%) | 2,822 (5.7%) |
| 20 to 24 Years | 2,529 (5.3%) | 2,578 (5.2%) |
| 25 to 29 Years | 2,367 (5.0%) | 3,076 (6.2%) |
| 30 to 34 Years | 2,939 (6.2%) | 3,060 (6.1%) |
| 35 to 39 Years | 2,893 (6.1%) | 4,122 (8.3%) |
| 40 to 44 Years | 3,328 (7.0%) | 3,747 (7.5%) |
| 45 to 49 Years | 3,340 (7.0%) | 3,917 (7.9%) |
| 50 to 54 Years | 3,793 (8.0%) | 2,997 (6.0%) |
| 55 to 59 Years | 2,547 (5.3%) | 2,962 (5.9%) |
| 60 to 64 Years | 2,579 (5.4%) | 2,613 (5.2%) |
| 65 to 69 Years | 2,590 (5.4%) | 3,188 (6.4%) |
| 70 to 74 Years | 2,618 (5.5%) | 2,765 (5.5%) |
| 75 to 79 Years | 1,672 (3.5%) | 2,000 (4.0%) |
| 80 to 84 Years | 945 (2.0%) | 505 (1.0%) |
| 85 Years and over | 515 (1.1%) | 802 (1.6%) |
| Total | 47,648 (100.0%) | 49,894 (100.0%) |
Families and Households in Goodyear
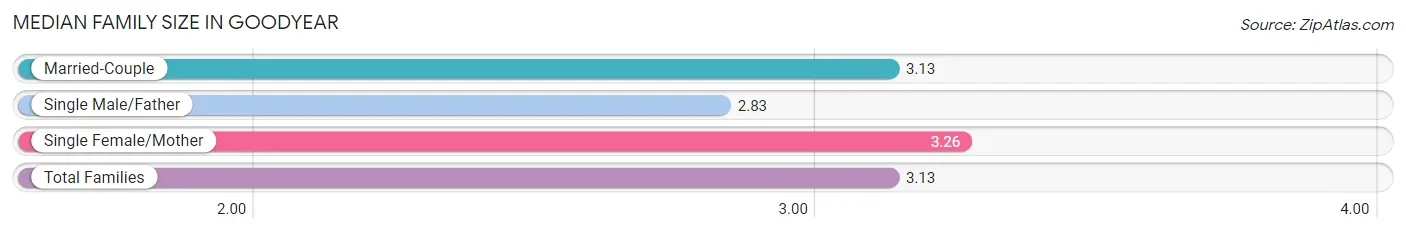
Median Family Size in Goodyear
The median family size in Goodyear is 3.13 persons per family, with single female/mother families (2,874 | 11.1%) accounting for the largest median family size of 3.26 persons per family. On the other hand, single male/father families (1,090 | 4.2%) represent the smallest median family size with 2.83 persons per family.
| Family Type | # Families | Family Size |
| Married-Couple | 21,856 (84.7%) | 3.13 |
| Single Male/Father | 1,090 (4.2%) | 2.83 |
| Single Female/Mother | 2,874 (11.1%) | 3.26 |
| Total Families | 25,820 (100.0%) | 3.13 |
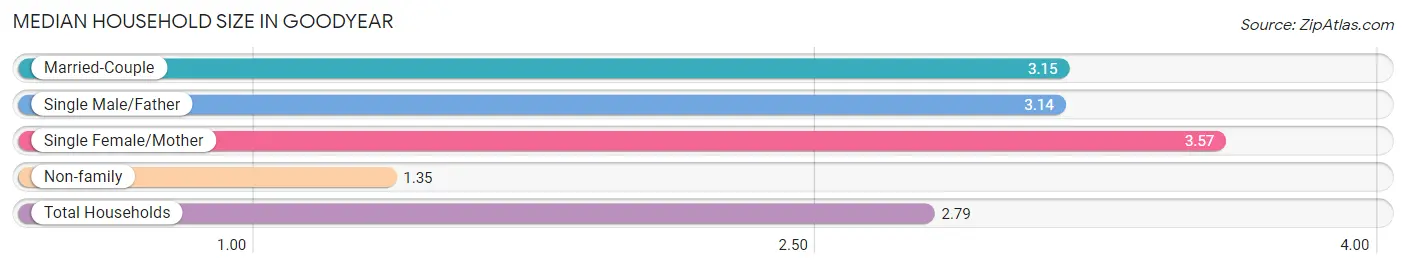
Median Household Size in Goodyear
The median household size in Goodyear is 2.79 persons per household, with single female/mother households (2,874 | 8.6%) accounting for the largest median household size of 3.57 persons per household. non-family households (7,402 | 22.3%) represent the smallest median household size with 1.35 persons per household.
| Household Type | # Households | Household Size |
| Married-Couple | 21,856 (65.8%) | 3.15 |
| Single Male/Father | 1,090 (3.3%) | 3.14 |
| Single Female/Mother | 2,874 (8.6%) | 3.57 |
| Non-family | 7,402 (22.3%) | 1.35 |
| Total Households | 33,222 (100.0%) | 2.79 |
Household Size by Marriage Status in Goodyear
Out of a total of 33,222 households in Goodyear, 25,820 (77.7%) are family households, while 7,402 (22.3%) are nonfamily households. The most numerous type of family households are 2-person households, comprising 11,570, and the most common type of nonfamily households are 1-person households, comprising 5,575.
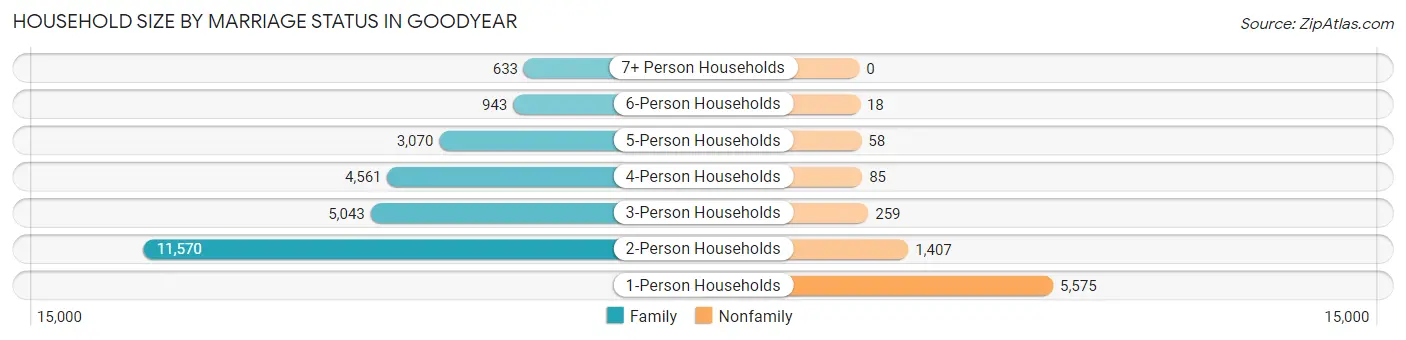
| Household Size | Family Households | Nonfamily Households |
| 1-Person Households | - | 5,575 (16.8%) |
| 2-Person Households | 11,570 (34.8%) | 1,407 (4.2%) |
| 3-Person Households | 5,043 (15.2%) | 259 (0.8%) |
| 4-Person Households | 4,561 (13.7%) | 85 (0.3%) |
| 5-Person Households | 3,070 (9.2%) | 58 (0.2%) |
| 6-Person Households | 943 (2.8%) | 18 (0.1%) |
| 7+ Person Households | 633 (1.9%) | 0 (0.0%) |
| Total | 25,820 (77.7%) | 7,402 (22.3%) |
Female Fertility in Goodyear
Fertility by Age in Goodyear
Average fertility rate in Goodyear is 52.0 births per 1,000 women. Women in the age bracket of 20 to 34 years have the highest fertility rate with 82.0 births per 1,000 women. Women in the age bracket of 20 to 34 years acount for 57.6% of all women with births.
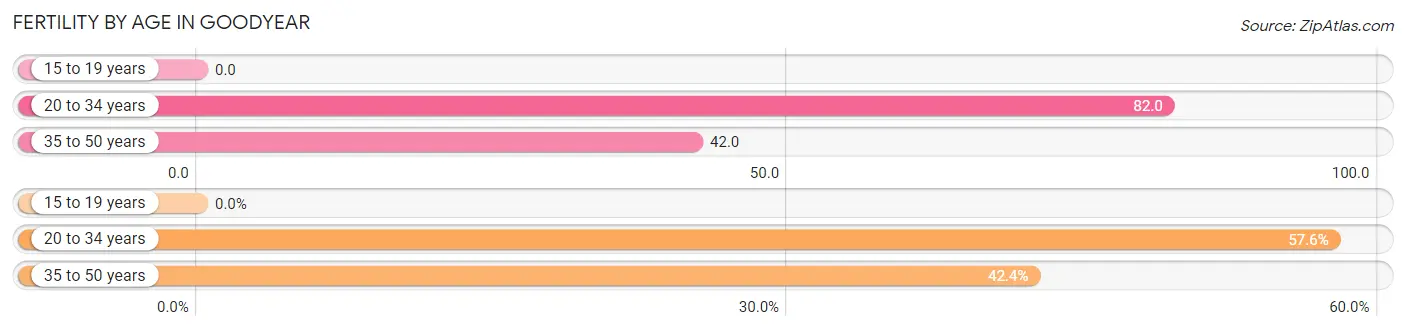
| Age Bracket | Women with Births | Births / 1,000 Women |
| 15 to 19 years | 0 (0.0%) | 0.0 |
| 20 to 34 years | 713 (57.6%) | 82.0 |
| 35 to 50 years | 524 (42.4%) | 42.0 |
| Total | 1,237 (100.0%) | 52.0 |
Fertility by Age by Marriage Status in Goodyear
72.4% of women with births (1,237) in Goodyear are married. The highest percentage of unmarried women with births falls into 20 to 34 years age bracket with 39.6% of them unmarried at the time of birth, while the lowest percentage of unmarried women with births belong to 35 to 50 years age bracket with 11.5% of them unmarried.
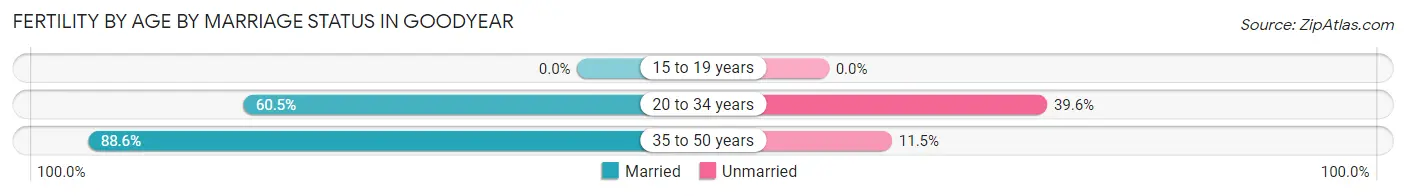
| Age Bracket | Married | Unmarried |
| 15 to 19 years | 0 (0.0%) | 0 (0.0%) |
| 20 to 34 years | 431 (60.5%) | 282 (39.6%) |
| 35 to 50 years | 464 (88.5%) | 60 (11.5%) |
| Total | 896 (72.4%) | 341 (27.6%) |
Fertility by Education in Goodyear
Average fertility rate in Goodyear is 52.0 births per 1,000 women. Women with the education attainment of graduate degree have the highest fertility rate of 57.0 births per 1,000 women, while women with the education attainment of bachelor's degree have the lowest fertility at 36.0 births per 1,000 women. Women with the education attainment of college or associate's degree represent 41.8% of all women with births.
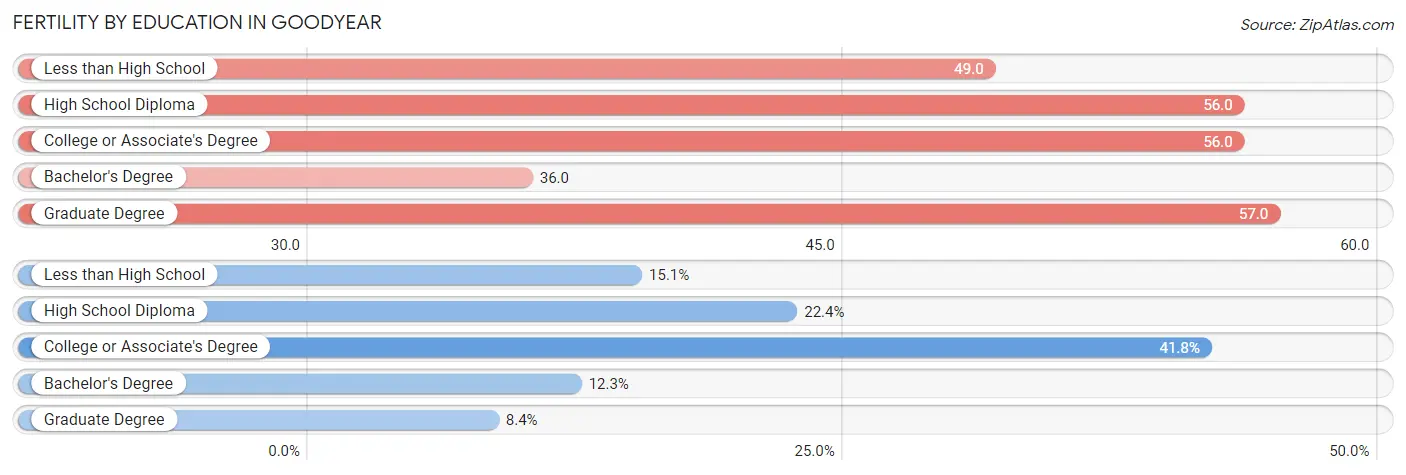
| Educational Attainment | Women with Births | Births / 1,000 Women |
| Less than High School | 187 (15.1%) | 49.0 |
| High School Diploma | 277 (22.4%) | 56.0 |
| College or Associate's Degree | 517 (41.8%) | 56.0 |
| Bachelor's Degree | 152 (12.3%) | 36.0 |
| Graduate Degree | 104 (8.4%) | 57.0 |
| Total | 1,237 (100.0%) | 52.0 |
Fertility by Education by Marriage Status in Goodyear
27.6% of women with births in Goodyear are unmarried. Women with the educational attainment of less than high school are most likely to be married with 92.5% of them married at childbirth, while women with the educational attainment of high school diploma are least likely to be married with 41.9% of them unmarried at childbirth.
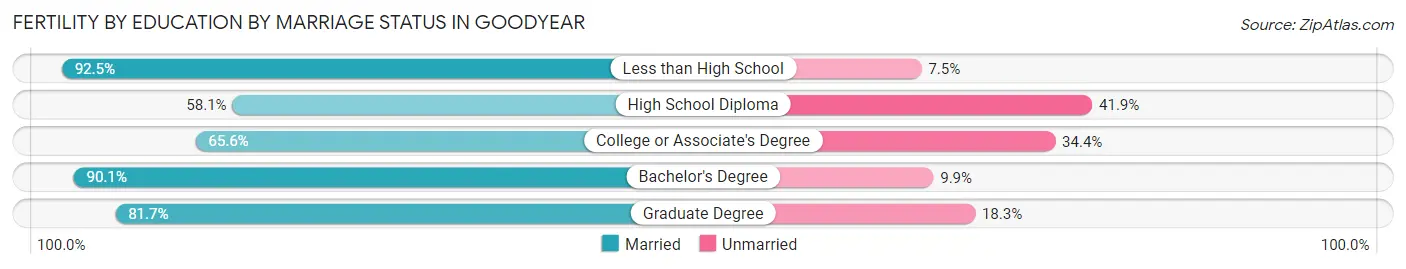
| Educational Attainment | Married | Unmarried |
| Less than High School | 173 (92.5%) | 14 (7.5%) |
| High School Diploma | 161 (58.1%) | 116 (41.9%) |
| College or Associate's Degree | 339 (65.6%) | 178 (34.4%) |
| Bachelor's Degree | 137 (90.1%) | 15 (9.9%) |
| Graduate Degree | 85 (81.7%) | 19 (18.3%) |
| Total | 896 (72.4%) | 341 (27.6%) |
Employment Characteristics in Goodyear
Employment by Class of Employer in Goodyear
Among the 43,024 employed individuals in Goodyear, private company employees (28,904 | 67.2%), local government employees (3,899 | 9.1%), and not-for-profit organizations (2,759 | 6.4%) make up the most common classes of employment.
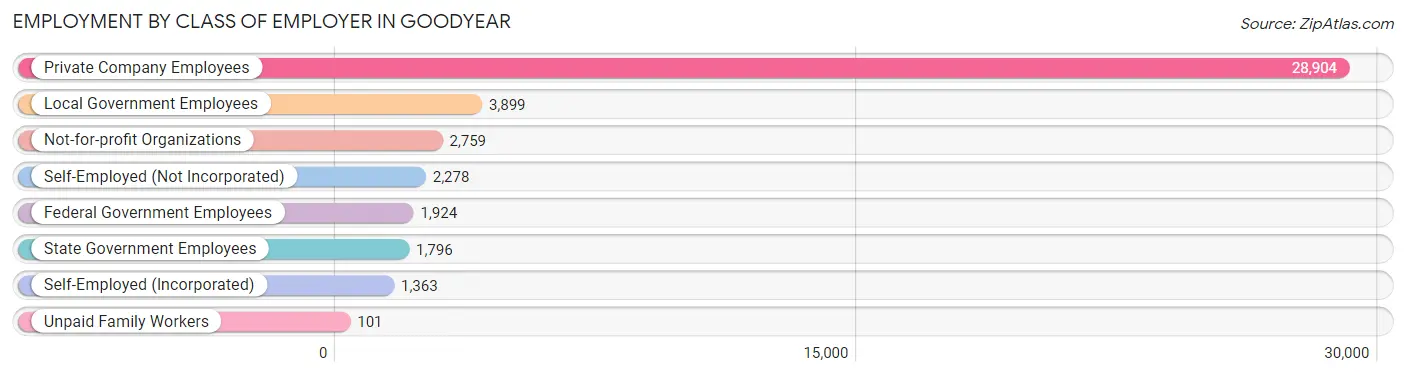
| Employer Class | # Employees | % Employees |
| Private Company Employees | 28,904 | 67.2% |
| Self-Employed (Incorporated) | 1,363 | 3.2% |
| Self-Employed (Not Incorporated) | 2,278 | 5.3% |
| Not-for-profit Organizations | 2,759 | 6.4% |
| Local Government Employees | 3,899 | 9.1% |
| State Government Employees | 1,796 | 4.2% |
| Federal Government Employees | 1,924 | 4.5% |
| Unpaid Family Workers | 101 | 0.2% |
| Total | 43,024 | 100.0% |
Employment Status by Age in Goodyear
According to the labor force statistics for Goodyear, out of the total population over 16 years of age (78,043), 59.2% or 46,201 individuals are in the labor force, with 5.5% or 2,541 of them unemployed. The age group with the highest labor force participation rate is 45 to 54 years, with 81.1% or 11,392 individuals in the labor force. Within the labor force, the 16 to 19 years age range has the highest percentage of unemployed individuals, with 24.1% or 497 of them being unemployed.
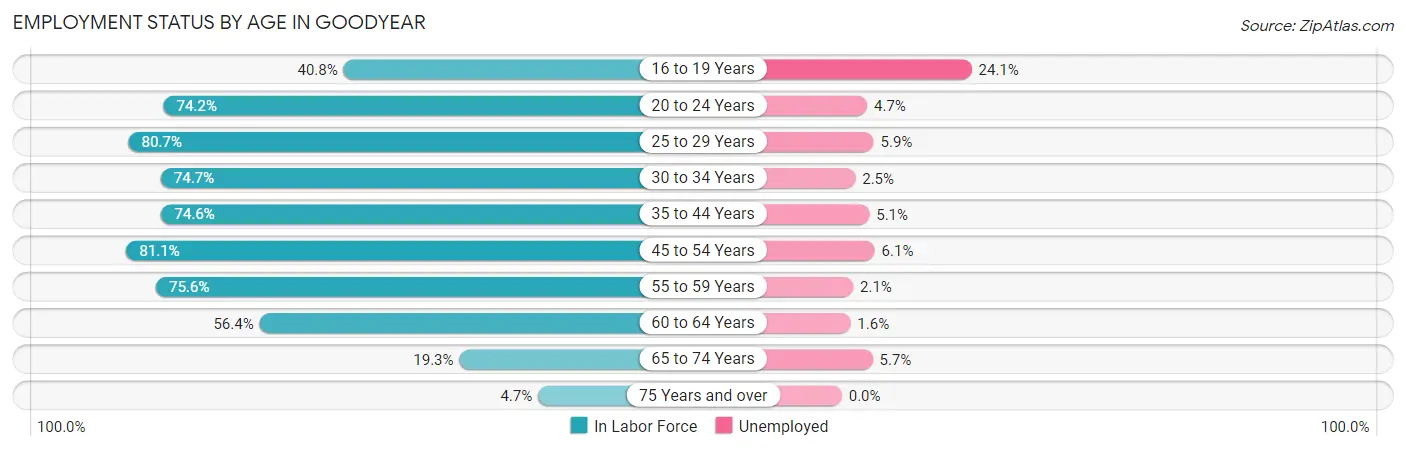
| Age Bracket | In Labor Force | Unemployed |
| 16 to 19 Years | 2,063 (40.8%) | 497 (24.1%) |
| 20 to 24 Years | 3,789 (74.2%) | 178 (4.7%) |
| 25 to 29 Years | 4,393 (80.7%) | 259 (5.9%) |
| 30 to 34 Years | 4,481 (74.7%) | 112 (2.5%) |
| 35 to 44 Years | 10,511 (74.6%) | 536 (5.1%) |
| 45 to 54 Years | 11,392 (81.1%) | 695 (6.1%) |
| 55 to 59 Years | 4,165 (75.6%) | 87 (2.1%) |
| 60 to 64 Years | 2,928 (56.4%) | 47 (1.6%) |
| 65 to 74 Years | 2,154 (19.3%) | 123 (5.7%) |
| 75 Years and over | 303 (4.7%) | 0 (0.0%) |
| Total | 46,201 (59.2%) | 2,541 (5.5%) |
Employment Status by Educational Attainment in Goodyear
According to labor force statistics for Goodyear, 75.3% of individuals (37,861) out of the total population between 25 and 64 years of age (50,280) are in the labor force, with 4.6% or 1,742 of them being unemployed. The group with the highest labor force participation rate are those with the educational attainment of bachelor's degree or higher, with 82.8% or 13,051 individuals in the labor force. Within the labor force, individuals with college / associate degree education have the highest percentage of unemployment, with 5.9% or 891 of them being unemployed.
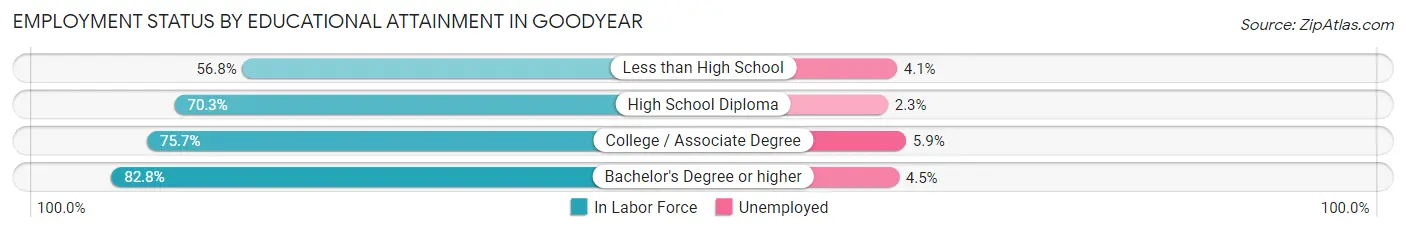
| Educational Attainment | In Labor Force | Unemployed |
| Less than High School | 2,233 (56.8%) | 161 (4.1%) |
| High School Diploma | 7,471 (70.3%) | 244 (2.3%) |
| College / Associate Degree | 15,109 (75.7%) | 1,178 (5.9%) |
| Bachelor's Degree or higher | 13,051 (82.8%) | 709 (4.5%) |
| Total | 37,861 (75.3%) | 2,313 (4.6%) |
Employment Occupations by Sex in Goodyear
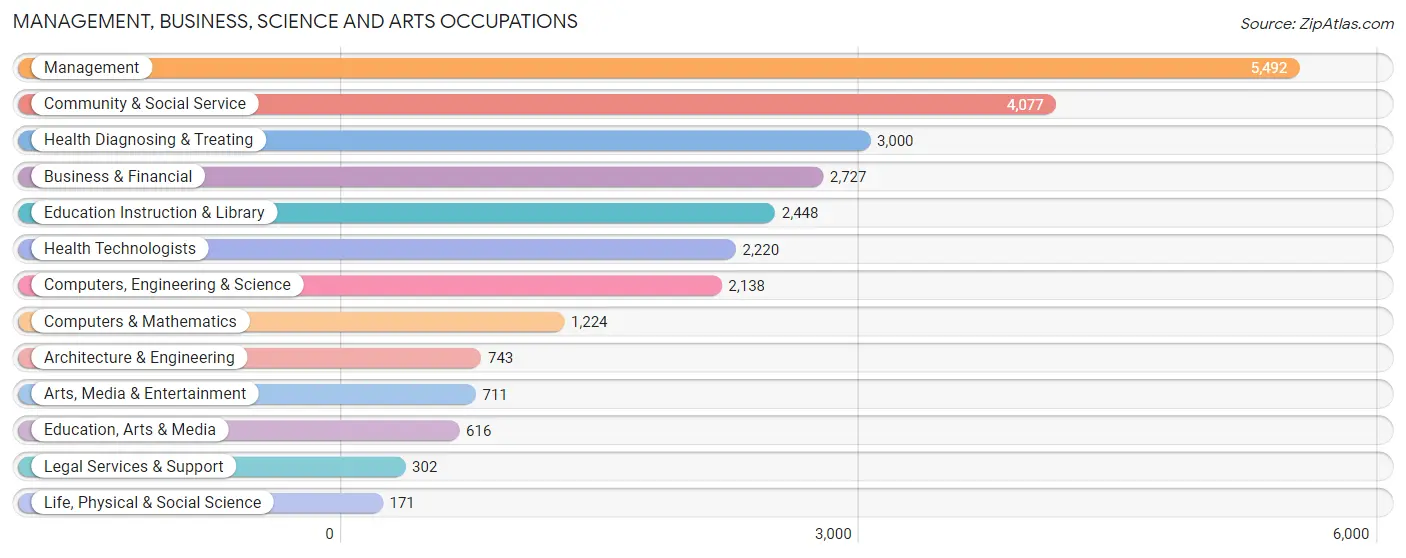
Management, Business, Science and Arts Occupations
The most common Management, Business, Science and Arts occupations in Goodyear are Management (5,492 | 12.7%), Community & Social Service (4,077 | 9.4%), Health Diagnosing & Treating (3,000 | 6.9%), Business & Financial (2,727 | 6.3%), and Education Instruction & Library (2,448 | 5.7%).
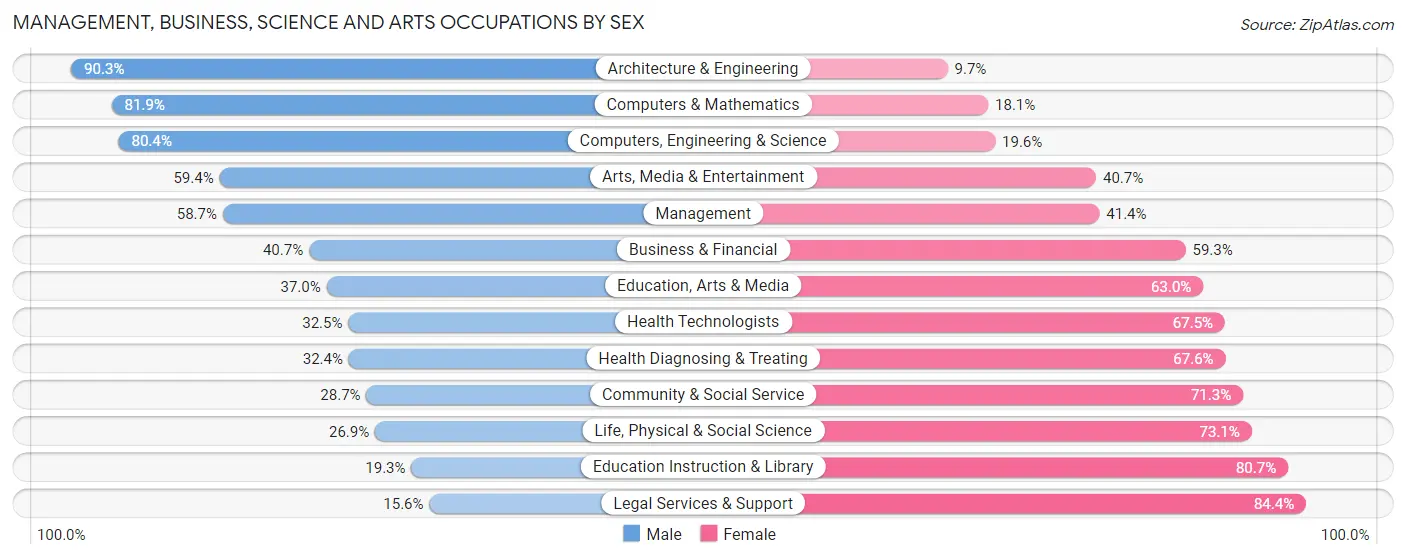
Management, Business, Science and Arts Occupations by Sex
Within the Management, Business, Science and Arts occupations in Goodyear, the most male-oriented occupations are Architecture & Engineering (90.3%), Computers & Mathematics (81.9%), and Computers, Engineering & Science (80.4%), while the most female-oriented occupations are Legal Services & Support (84.4%), Education Instruction & Library (80.7%), and Life, Physical & Social Science (73.1%).
| Occupation | Male | Female |
| Management | 3,221 (58.7%) | 2,271 (41.3%) |
| Business & Financial | 1,109 (40.7%) | 1,618 (59.3%) |
| Computers, Engineering & Science | 1,719 (80.4%) | 419 (19.6%) |
| Computers & Mathematics | 1,002 (81.9%) | 222 (18.1%) |
| Architecture & Engineering | 671 (90.3%) | 72 (9.7%) |
| Life, Physical & Social Science | 46 (26.9%) | 125 (73.1%) |
| Community & Social Service | 1,170 (28.7%) | 2,907 (71.3%) |
| Education, Arts & Media | 228 (37.0%) | 388 (63.0%) |
| Legal Services & Support | 47 (15.6%) | 255 (84.4%) |
| Education Instruction & Library | 473 (19.3%) | 1,975 (80.7%) |
| Arts, Media & Entertainment | 422 (59.4%) | 289 (40.6%) |
| Health Diagnosing & Treating | 971 (32.4%) | 2,029 (67.6%) |
| Health Technologists | 721 (32.5%) | 1,499 (67.5%) |
| Total (Category) | 8,190 (47.0%) | 9,244 (53.0%) |
| Total (Overall) | 23,726 (54.9%) | 19,481 (45.1%) |
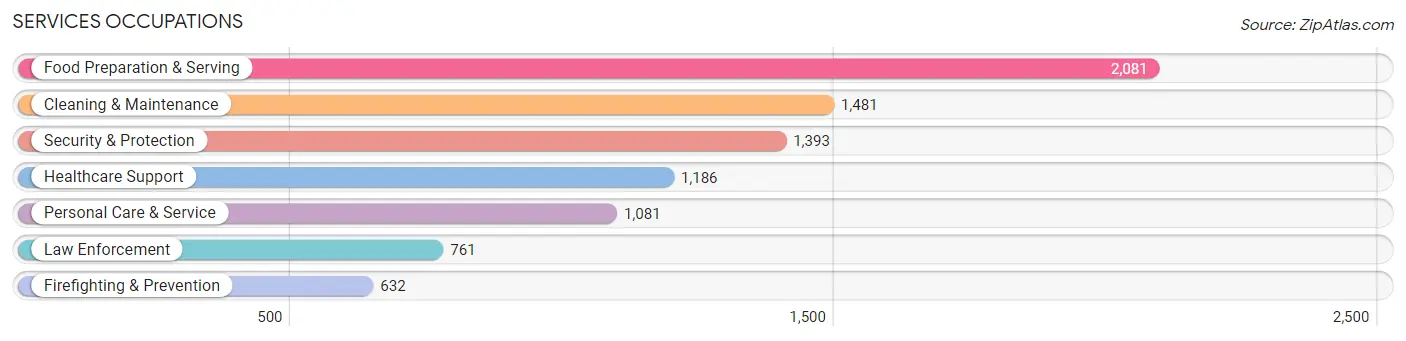
Services Occupations
The most common Services occupations in Goodyear are Food Preparation & Serving (2,081 | 4.8%), Cleaning & Maintenance (1,481 | 3.4%), Security & Protection (1,393 | 3.2%), Healthcare Support (1,186 | 2.7%), and Personal Care & Service (1,081 | 2.5%).
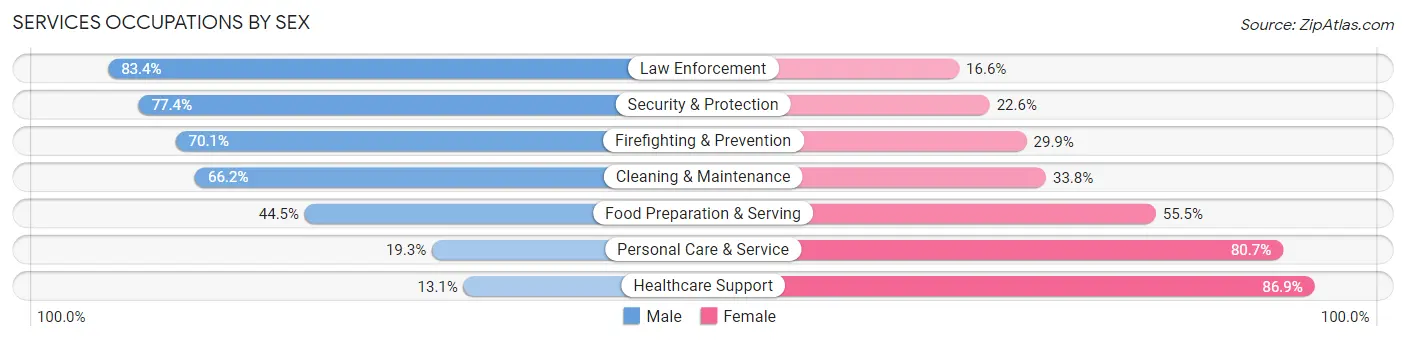
Services Occupations by Sex
Within the Services occupations in Goodyear, the most male-oriented occupations are Law Enforcement (83.4%), Security & Protection (77.4%), and Firefighting & Prevention (70.1%), while the most female-oriented occupations are Healthcare Support (86.9%), Personal Care & Service (80.7%), and Food Preparation & Serving (55.5%).
| Occupation | Male | Female |
| Healthcare Support | 155 (13.1%) | 1,031 (86.9%) |
| Security & Protection | 1,078 (77.4%) | 315 (22.6%) |
| Firefighting & Prevention | 443 (70.1%) | 189 (29.9%) |
| Law Enforcement | 635 (83.4%) | 126 (16.6%) |
| Food Preparation & Serving | 926 (44.5%) | 1,155 (55.5%) |
| Cleaning & Maintenance | 981 (66.2%) | 500 (33.8%) |
| Personal Care & Service | 209 (19.3%) | 872 (80.7%) |
| Total (Category) | 3,349 (46.4%) | 3,873 (53.6%) |
| Total (Overall) | 23,726 (54.9%) | 19,481 (45.1%) |
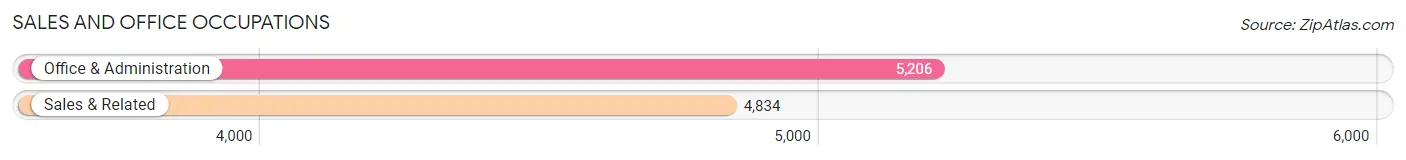
Sales and Office Occupations
The most common Sales and Office occupations in Goodyear are Office & Administration (5,206 | 12.0%), and Sales & Related (4,834 | 11.2%).
Sales and Office Occupations by Sex
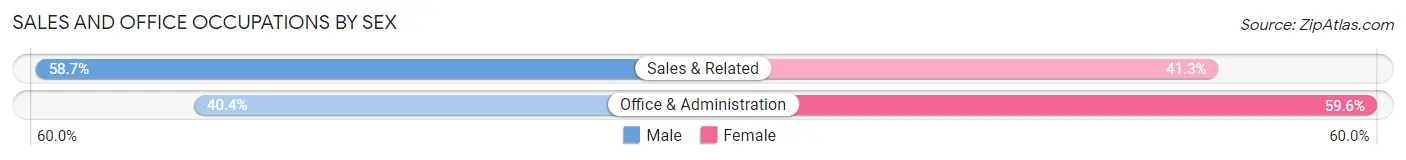
| Occupation | Male | Female |
| Sales & Related | 2,838 (58.7%) | 1,996 (41.3%) |
| Office & Administration | 2,105 (40.4%) | 3,101 (59.6%) |
| Total (Category) | 4,943 (49.2%) | 5,097 (50.8%) |
| Total (Overall) | 23,726 (54.9%) | 19,481 (45.1%) |
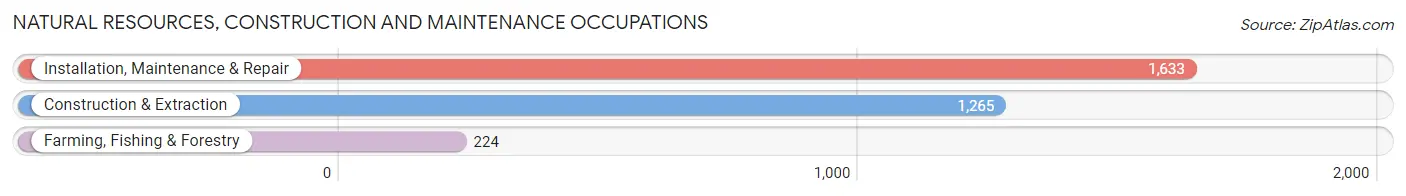
Natural Resources, Construction and Maintenance Occupations
The most common Natural Resources, Construction and Maintenance occupations in Goodyear are Installation, Maintenance & Repair (1,633 | 3.8%), Construction & Extraction (1,265 | 2.9%), and Farming, Fishing & Forestry (224 | 0.5%).
Natural Resources, Construction and Maintenance Occupations by Sex
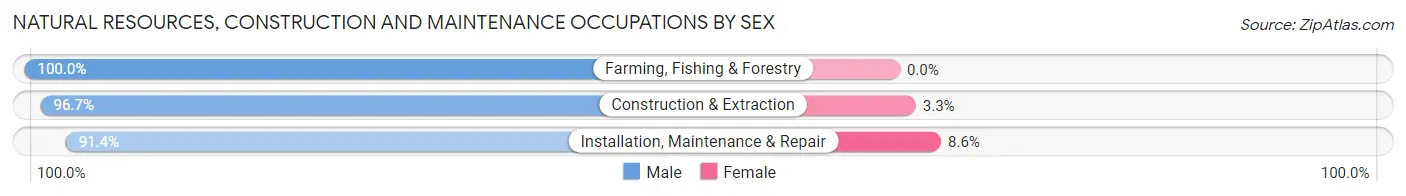
| Occupation | Male | Female |
| Farming, Fishing & Forestry | 224 (100.0%) | 0 (0.0%) |
| Construction & Extraction | 1,223 (96.7%) | 42 (3.3%) |
| Installation, Maintenance & Repair | 1,493 (91.4%) | 140 (8.6%) |
| Total (Category) | 2,940 (94.2%) | 182 (5.8%) |
| Total (Overall) | 23,726 (54.9%) | 19,481 (45.1%) |
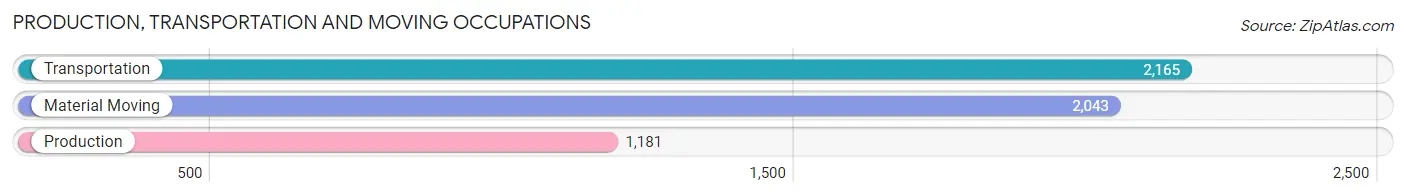
Production, Transportation and Moving Occupations
The most common Production, Transportation and Moving occupations in Goodyear are Transportation (2,165 | 5.0%), Material Moving (2,043 | 4.7%), and Production (1,181 | 2.7%).
Production, Transportation and Moving Occupations by Sex
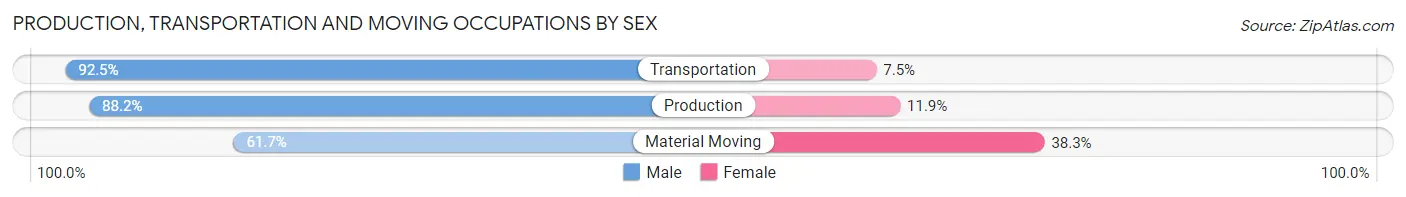
| Occupation | Male | Female |
| Production | 1,041 (88.1%) | 140 (11.8%) |
| Transportation | 2,003 (92.5%) | 162 (7.5%) |
| Material Moving | 1,260 (61.7%) | 783 (38.3%) |
| Total (Category) | 4,304 (79.9%) | 1,085 (20.1%) |
| Total (Overall) | 23,726 (54.9%) | 19,481 (45.1%) |
Employment Industries by Sex in Goodyear
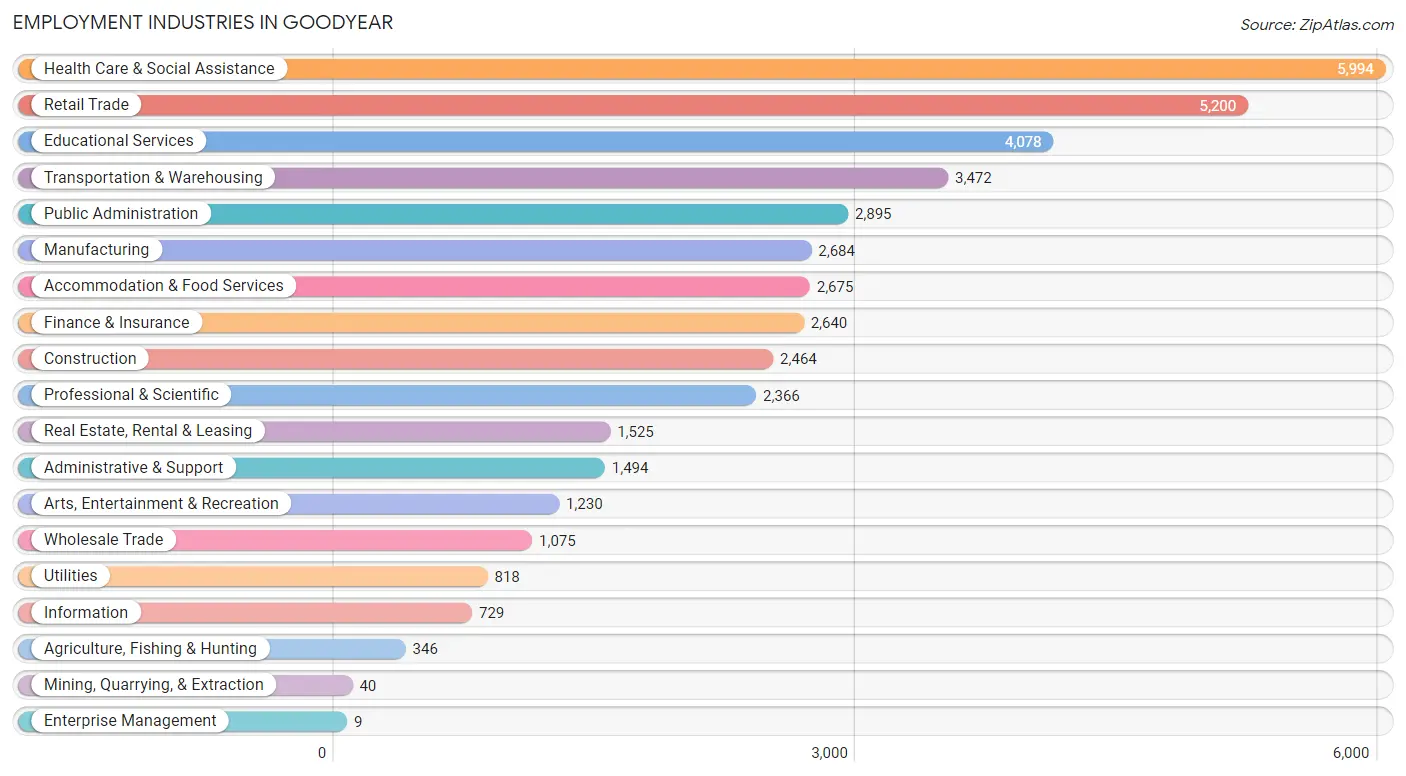
Employment Industries in Goodyear
The major employment industries in Goodyear include Health Care & Social Assistance (5,994 | 13.9%), Retail Trade (5,200 | 12.0%), Educational Services (4,078 | 9.4%), Transportation & Warehousing (3,472 | 8.0%), and Public Administration (2,895 | 6.7%).
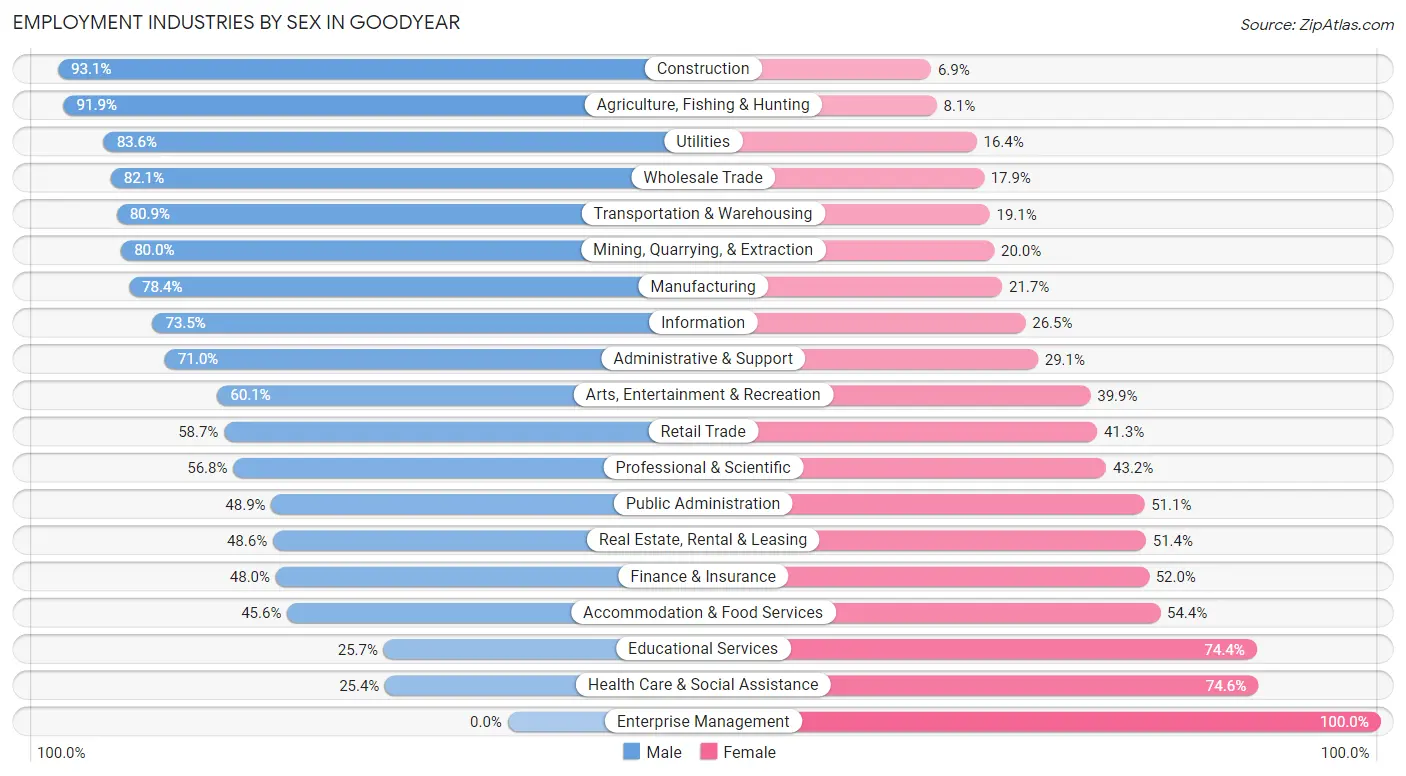
Employment Industries by Sex in Goodyear
The Goodyear industries that see more men than women are Construction (93.1%), Agriculture, Fishing & Hunting (91.9%), and Utilities (83.6%), whereas the industries that tend to have a higher number of women are Enterprise Management (100.0%), Health Care & Social Assistance (74.6%), and Educational Services (74.4%).
| Industry | Male | Female |
| Agriculture, Fishing & Hunting | 318 (91.9%) | 28 (8.1%) |
| Mining, Quarrying, & Extraction | 32 (80.0%) | 8 (20.0%) |
| Construction | 2,293 (93.1%) | 171 (6.9%) |
| Manufacturing | 2,103 (78.3%) | 581 (21.6%) |
| Wholesale Trade | 883 (82.1%) | 192 (17.9%) |
| Retail Trade | 3,052 (58.7%) | 2,148 (41.3%) |
| Transportation & Warehousing | 2,810 (80.9%) | 662 (19.1%) |
| Utilities | 684 (83.6%) | 134 (16.4%) |
| Information | 536 (73.5%) | 193 (26.5%) |
| Finance & Insurance | 1,267 (48.0%) | 1,373 (52.0%) |
| Real Estate, Rental & Leasing | 741 (48.6%) | 784 (51.4%) |
| Professional & Scientific | 1,344 (56.8%) | 1,022 (43.2%) |
| Enterprise Management | 0 (0.0%) | 9 (100.0%) |
| Administrative & Support | 1,060 (71.0%) | 434 (29.0%) |
| Educational Services | 1,046 (25.7%) | 3,032 (74.4%) |
| Health Care & Social Assistance | 1,520 (25.4%) | 4,474 (74.6%) |
| Arts, Entertainment & Recreation | 739 (60.1%) | 491 (39.9%) |
| Accommodation & Food Services | 1,221 (45.6%) | 1,454 (54.4%) |
| Public Administration | 1,416 (48.9%) | 1,479 (51.1%) |
| Total | 23,726 (54.9%) | 19,481 (45.1%) |
Education in Goodyear
School Enrollment in Goodyear
The most common levels of schooling among the 23,085 students in Goodyear are middle school (5,736 | 24.8%), high school (5,107 | 22.1%), and elementary school (4,706 | 20.4%).
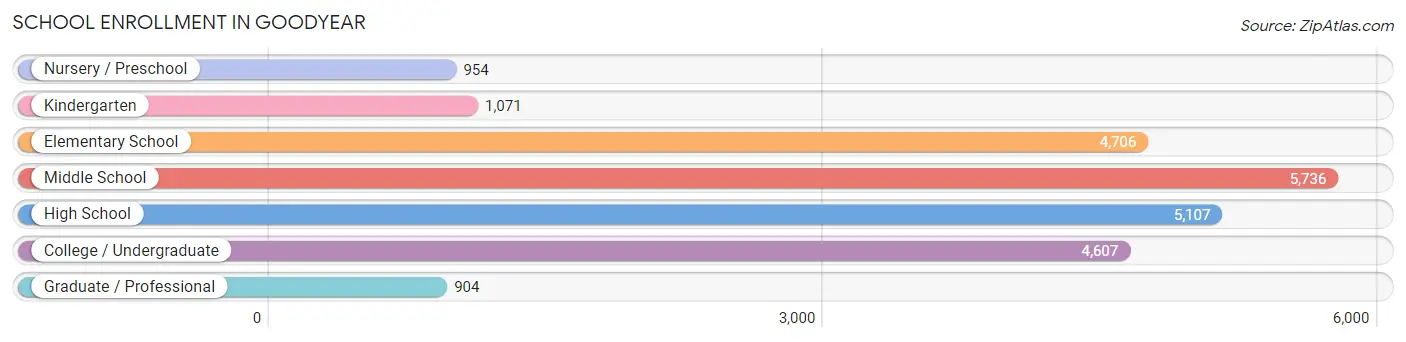
| School Level | # Students | % Students |
| Nursery / Preschool | 954 | 4.1% |
| Kindergarten | 1,071 | 4.6% |
| Elementary School | 4,706 | 20.4% |
| Middle School | 5,736 | 24.8% |
| High School | 5,107 | 22.1% |
| College / Undergraduate | 4,607 | 20.0% |
| Graduate / Professional | 904 | 3.9% |
| Total | 23,085 | 100.0% |
School Enrollment by Age by Funding Source in Goodyear
Out of a total of 23,085 students who are enrolled in schools in Goodyear, 2,816 (12.2%) attend a private institution, while the remaining 20,269 (87.8%) are enrolled in public schools. The age group of 3 to 4 year olds has the highest likelihood of being enrolled in private schools, with 132 (21.5% in the age bracket) enrolled. Conversely, the age group of 15 to 17 year olds has the lowest likelihood of being enrolled in a private school, with 3,324 (95.4% in the age bracket) attending a public institution.
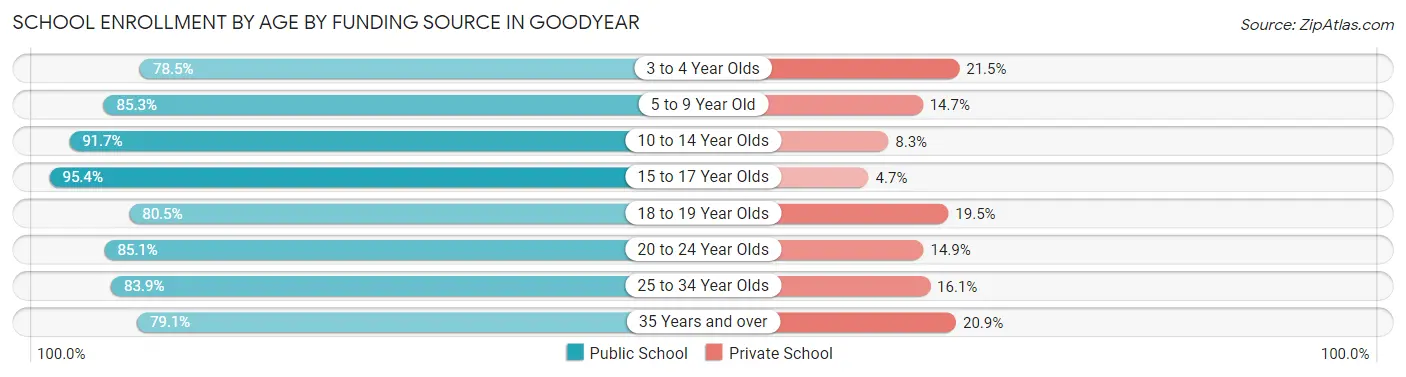
| Age Bracket | Public School | Private School |
| 3 to 4 Year Olds | 481 (78.5%) | 132 (21.5%) |
| 5 to 9 Year Old | 4,398 (85.3%) | 760 (14.7%) |
| 10 to 14 Year Olds | 6,736 (91.7%) | 611 (8.3%) |
| 15 to 17 Year Olds | 3,324 (95.4%) | 162 (4.6%) |
| 18 to 19 Year Olds | 1,291 (80.5%) | 313 (19.5%) |
| 20 to 24 Year Olds | 1,625 (85.1%) | 284 (14.9%) |
| 25 to 34 Year Olds | 1,047 (83.9%) | 201 (16.1%) |
| 35 Years and over | 1,360 (79.1%) | 360 (20.9%) |
| Total | 20,269 (87.8%) | 2,816 (12.2%) |
Educational Attainment by Field of Study in Goodyear
Business (5,913 | 24.2%), education (3,397 | 13.9%), science & technology (3,297 | 13.5%), arts & humanities (2,449 | 10.0%), and engineering (1,468 | 6.0%) are the most common fields of study among 24,381 individuals in Goodyear who have obtained a bachelor's degree or higher.
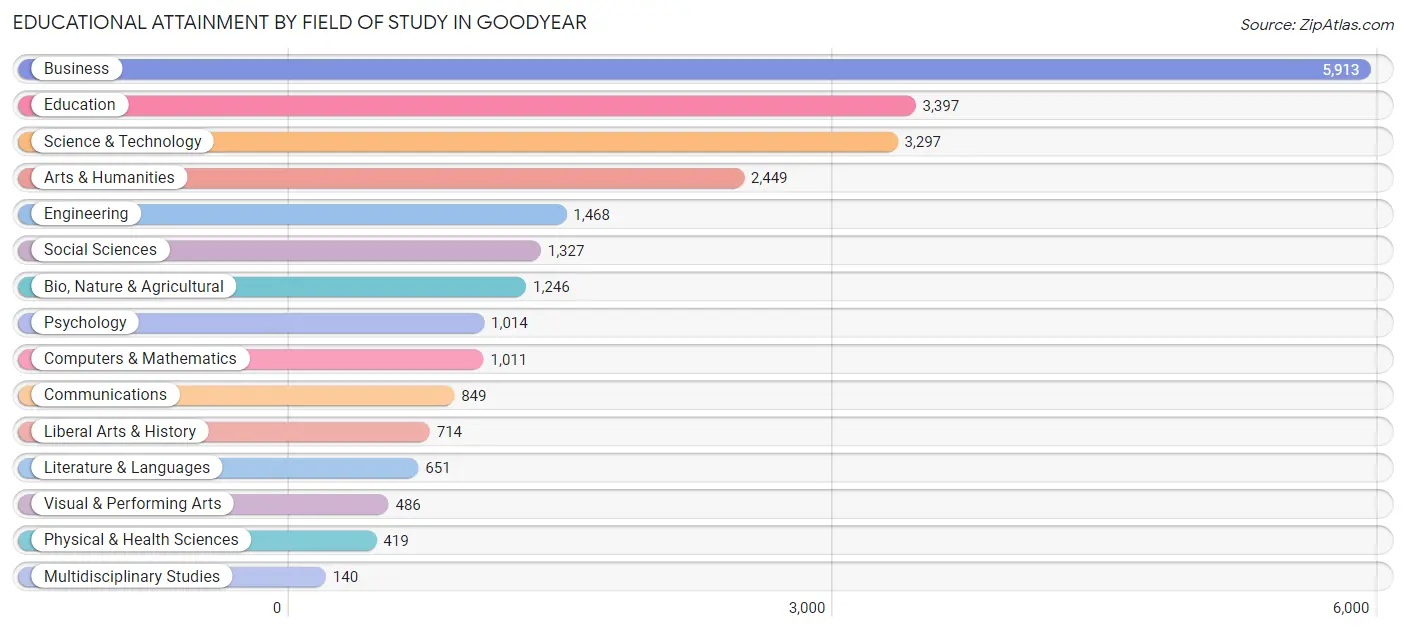
| Field of Study | # Graduates | % Graduates |
| Computers & Mathematics | 1,011 | 4.2% |
| Bio, Nature & Agricultural | 1,246 | 5.1% |
| Physical & Health Sciences | 419 | 1.7% |
| Psychology | 1,014 | 4.2% |
| Social Sciences | 1,327 | 5.4% |
| Engineering | 1,468 | 6.0% |
| Multidisciplinary Studies | 140 | 0.6% |
| Science & Technology | 3,297 | 13.5% |
| Business | 5,913 | 24.2% |
| Education | 3,397 | 13.9% |
| Literature & Languages | 651 | 2.7% |
| Liberal Arts & History | 714 | 2.9% |
| Visual & Performing Arts | 486 | 2.0% |
| Communications | 849 | 3.5% |
| Arts & Humanities | 2,449 | 10.0% |
| Total | 24,381 | 100.0% |
Transportation & Commute in Goodyear
Vehicle Availability by Sex in Goodyear
The most prevalent vehicle ownership categories in Goodyear are males with 2 vehicles (9,229, accounting for 38.8%) and females with 2 vehicles (7,374, making up 48.1%).
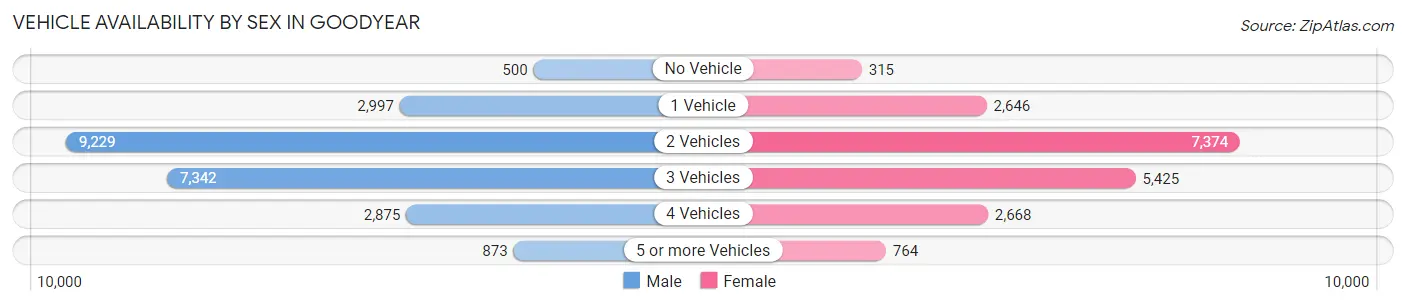
| Vehicles Available | Male | Female |
| No Vehicle | 500 (2.1%) | 315 (1.6%) |
| 1 Vehicle | 2,997 (12.6%) | 2,646 (13.8%) |
| 2 Vehicles | 9,229 (38.8%) | 7,374 (38.4%) |
| 3 Vehicles | 7,342 (30.8%) | 5,425 (28.3%) |
| 4 Vehicles | 2,875 (12.1%) | 2,668 (13.9%) |
| 5 or more Vehicles | 873 (3.7%) | 764 (4.0%) |
| Total | 23,816 (100.0%) | 19,192 (100.0%) |
Commute Time in Goodyear
The most frequently occuring commute durations in Goodyear are 15 to 19 minutes (5,085 commuters, 14.1%), 30 to 34 minutes (4,693 commuters, 13.0%), and 20 to 24 minutes (4,422 commuters, 12.3%).
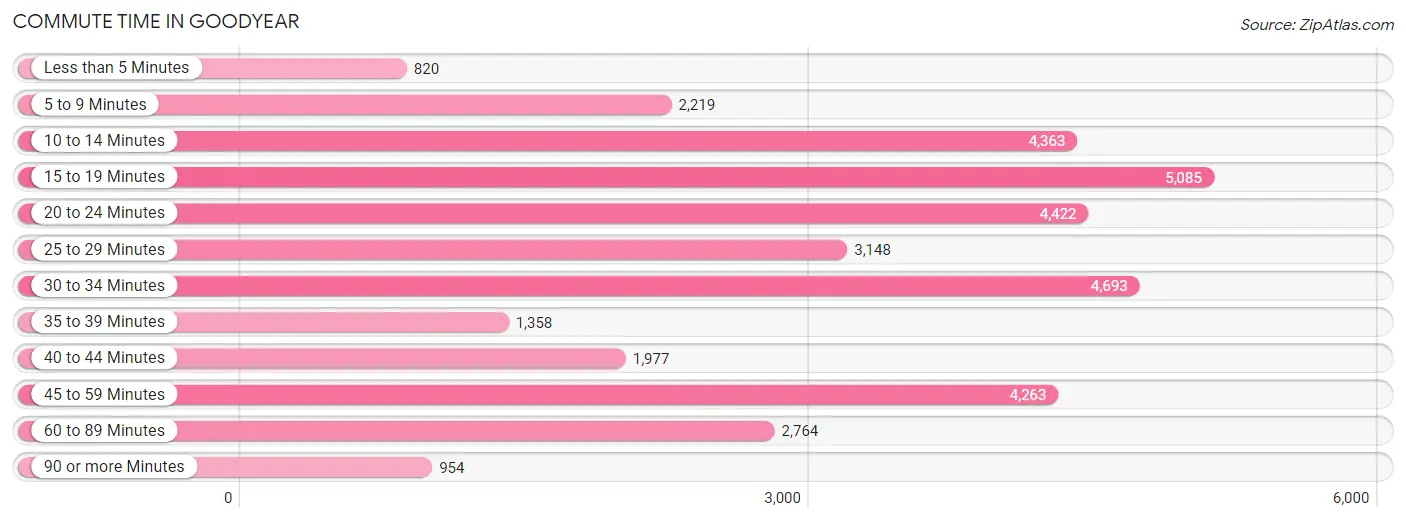
| Commute Time | # Commuters | % Commuters |
| Less than 5 Minutes | 820 | 2.3% |
| 5 to 9 Minutes | 2,219 | 6.1% |
| 10 to 14 Minutes | 4,363 | 12.1% |
| 15 to 19 Minutes | 5,085 | 14.1% |
| 20 to 24 Minutes | 4,422 | 12.3% |
| 25 to 29 Minutes | 3,148 | 8.7% |
| 30 to 34 Minutes | 4,693 | 13.0% |
| 35 to 39 Minutes | 1,358 | 3.8% |
| 40 to 44 Minutes | 1,977 | 5.5% |
| 45 to 59 Minutes | 4,263 | 11.8% |
| 60 to 89 Minutes | 2,764 | 7.7% |
| 90 or more Minutes | 954 | 2.6% |
Commute Time by Sex in Goodyear
The most common commute times in Goodyear are 30 to 34 minutes (2,902 commuters, 14.1%) for males and 15 to 19 minutes (2,478 commuters, 16.0%) for females.
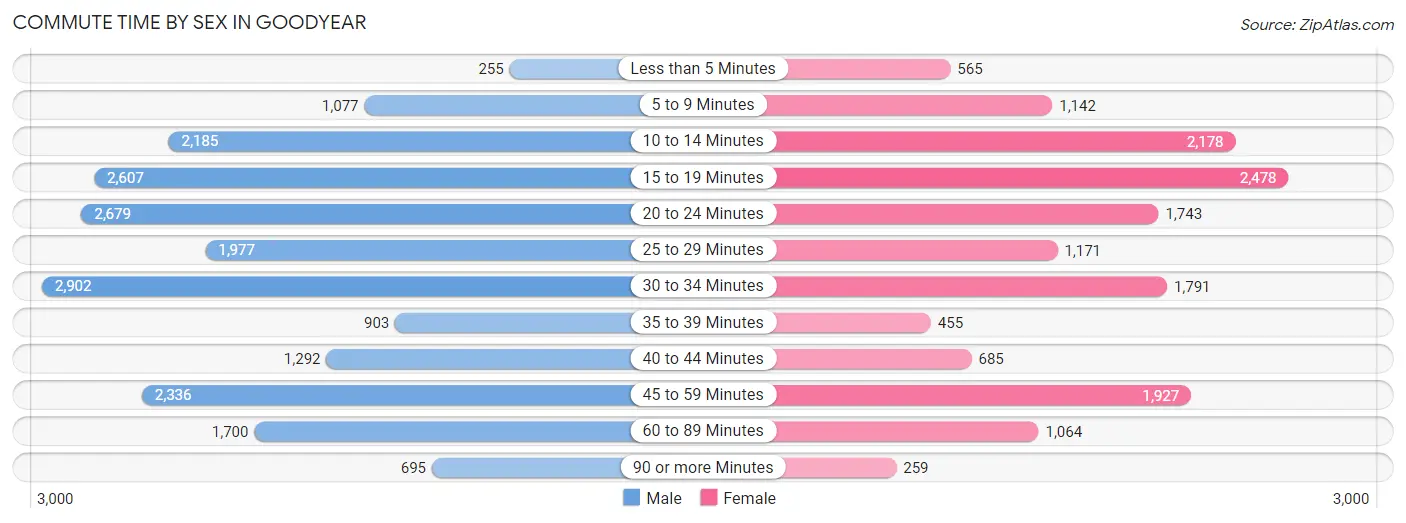
| Commute Time | Male | Female |
| Less than 5 Minutes | 255 (1.2%) | 565 (3.7%) |
| 5 to 9 Minutes | 1,077 (5.2%) | 1,142 (7.4%) |
| 10 to 14 Minutes | 2,185 (10.6%) | 2,178 (14.1%) |
| 15 to 19 Minutes | 2,607 (12.7%) | 2,478 (16.0%) |
| 20 to 24 Minutes | 2,679 (13.0%) | 1,743 (11.3%) |
| 25 to 29 Minutes | 1,977 (9.6%) | 1,171 (7.6%) |
| 30 to 34 Minutes | 2,902 (14.1%) | 1,791 (11.6%) |
| 35 to 39 Minutes | 903 (4.4%) | 455 (2.9%) |
| 40 to 44 Minutes | 1,292 (6.3%) | 685 (4.4%) |
| 45 to 59 Minutes | 2,336 (11.3%) | 1,927 (12.5%) |
| 60 to 89 Minutes | 1,700 (8.3%) | 1,064 (6.9%) |
| 90 or more Minutes | 695 (3.4%) | 259 (1.7%) |
Time of Departure to Work by Sex in Goodyear
The most frequent times of departure to work in Goodyear are 5:00 AM to 5:29 AM (2,579, 12.5%) for males and 7:00 AM to 7:29 AM (1,993, 12.9%) for females.
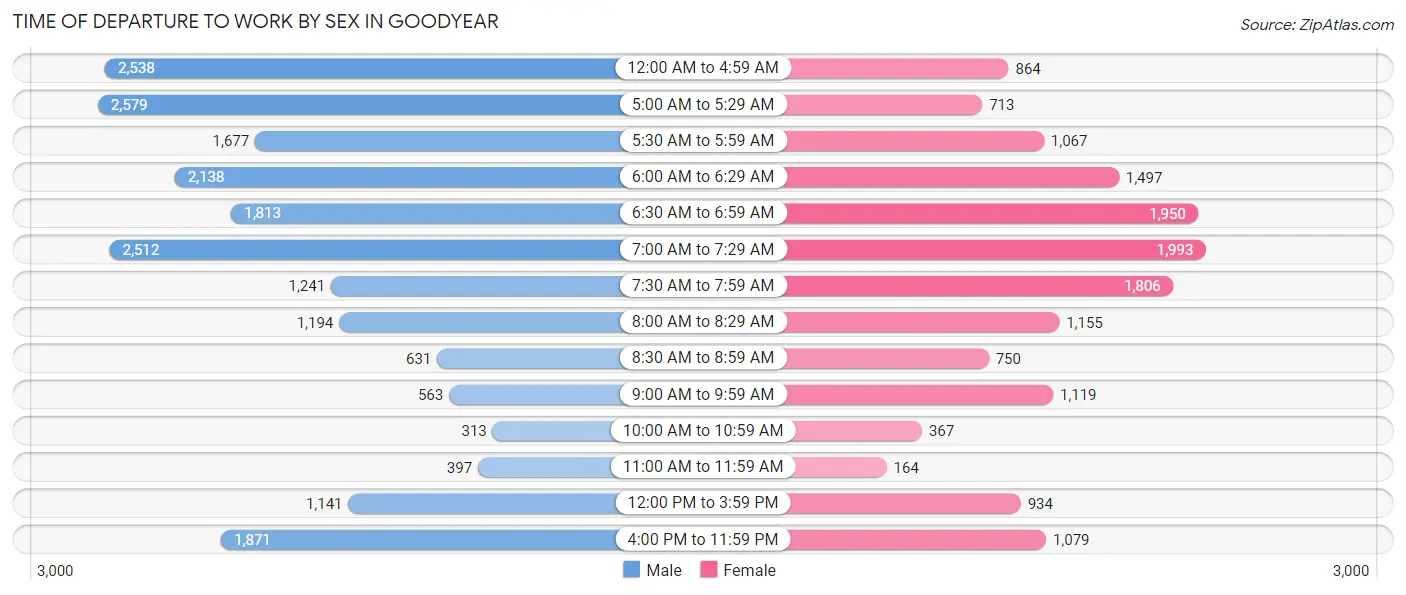
| Time of Departure | Male | Female |
| 12:00 AM to 4:59 AM | 2,538 (12.3%) | 864 (5.6%) |
| 5:00 AM to 5:29 AM | 2,579 (12.5%) | 713 (4.6%) |
| 5:30 AM to 5:59 AM | 1,677 (8.1%) | 1,067 (6.9%) |
| 6:00 AM to 6:29 AM | 2,138 (10.4%) | 1,497 (9.7%) |
| 6:30 AM to 6:59 AM | 1,813 (8.8%) | 1,950 (12.6%) |
| 7:00 AM to 7:29 AM | 2,512 (12.2%) | 1,993 (12.9%) |
| 7:30 AM to 7:59 AM | 1,241 (6.0%) | 1,806 (11.7%) |
| 8:00 AM to 8:29 AM | 1,194 (5.8%) | 1,155 (7.5%) |
| 8:30 AM to 8:59 AM | 631 (3.1%) | 750 (4.9%) |
| 9:00 AM to 9:59 AM | 563 (2.7%) | 1,119 (7.2%) |
| 10:00 AM to 10:59 AM | 313 (1.5%) | 367 (2.4%) |
| 11:00 AM to 11:59 AM | 397 (1.9%) | 164 (1.1%) |
| 12:00 PM to 3:59 PM | 1,141 (5.5%) | 934 (6.0%) |
| 4:00 PM to 11:59 PM | 1,871 (9.1%) | 1,079 (7.0%) |
| Total | 20,608 (100.0%) | 15,458 (100.0%) |
Housing Occupancy in Goodyear
Occupancy by Ownership in Goodyear
Of the total 33,222 dwellings in Goodyear, owner-occupied units account for 25,831 (77.7%), while renter-occupied units make up 7,391 (22.3%).
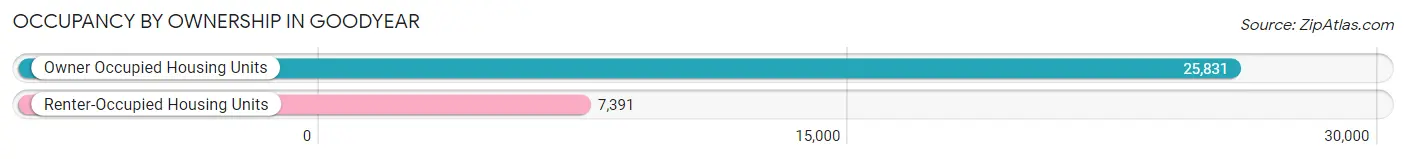
| Occupancy | # Housing Units | % Housing Units |
| Owner Occupied Housing Units | 25,831 | 77.7% |
| Renter-Occupied Housing Units | 7,391 | 22.3% |
| Total Occupied Housing Units | 33,222 | 100.0% |
Occupancy by Household Size in Goodyear
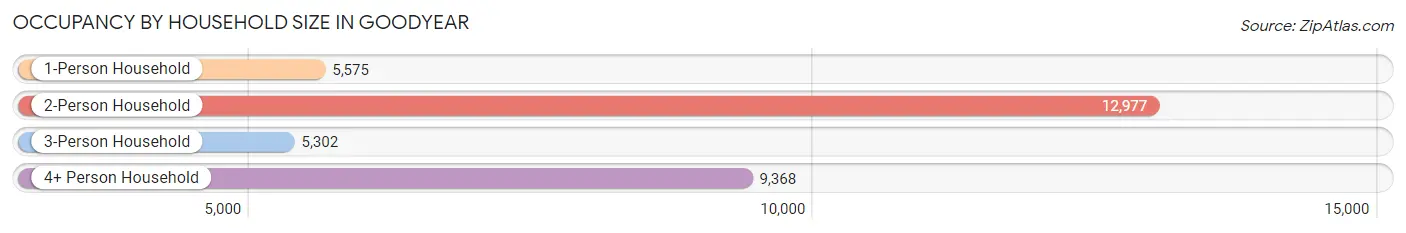
| Household Size | # Housing Units | % Housing Units |
| 1-Person Household | 5,575 | 16.8% |
| 2-Person Household | 12,977 | 39.1% |
| 3-Person Household | 5,302 | 16.0% |
| 4+ Person Household | 9,368 | 28.2% |
| Total Housing Units | 33,222 | 100.0% |
Occupancy by Ownership by Household Size in Goodyear
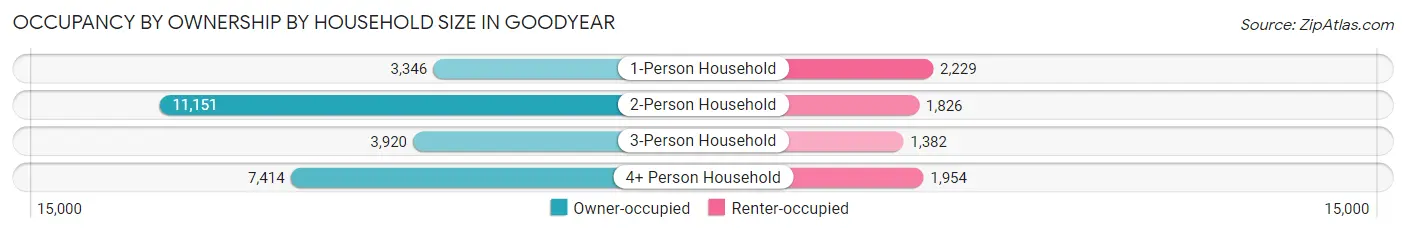
| Household Size | Owner-occupied | Renter-occupied |
| 1-Person Household | 3,346 (60.0%) | 2,229 (40.0%) |
| 2-Person Household | 11,151 (85.9%) | 1,826 (14.1%) |
| 3-Person Household | 3,920 (73.9%) | 1,382 (26.1%) |
| 4+ Person Household | 7,414 (79.1%) | 1,954 (20.9%) |
| Total Housing Units | 25,831 (77.7%) | 7,391 (22.3%) |
Occupancy by Educational Attainment in Goodyear
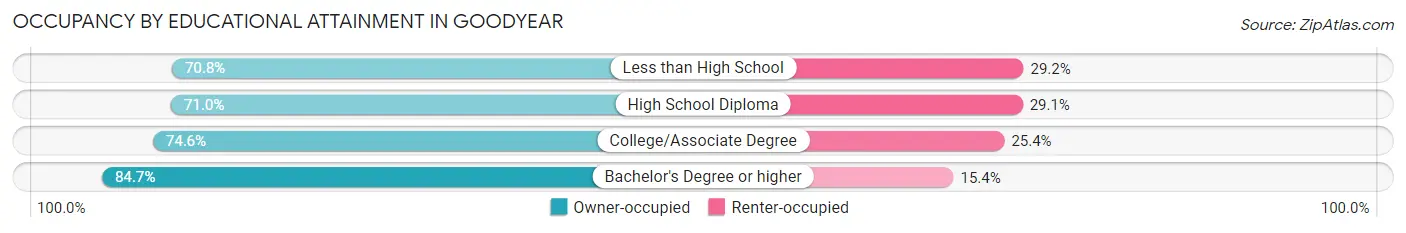
| Household Size | Owner-occupied | Renter-occupied |
| Less than High School | 998 (70.8%) | 412 (29.2%) |
| High School Diploma | 4,147 (71.0%) | 1,698 (29.0%) |
| College/Associate Degree | 9,582 (74.6%) | 3,267 (25.4%) |
| Bachelor's Degree or higher | 11,104 (84.7%) | 2,014 (15.3%) |
Occupancy by Age of Householder in Goodyear
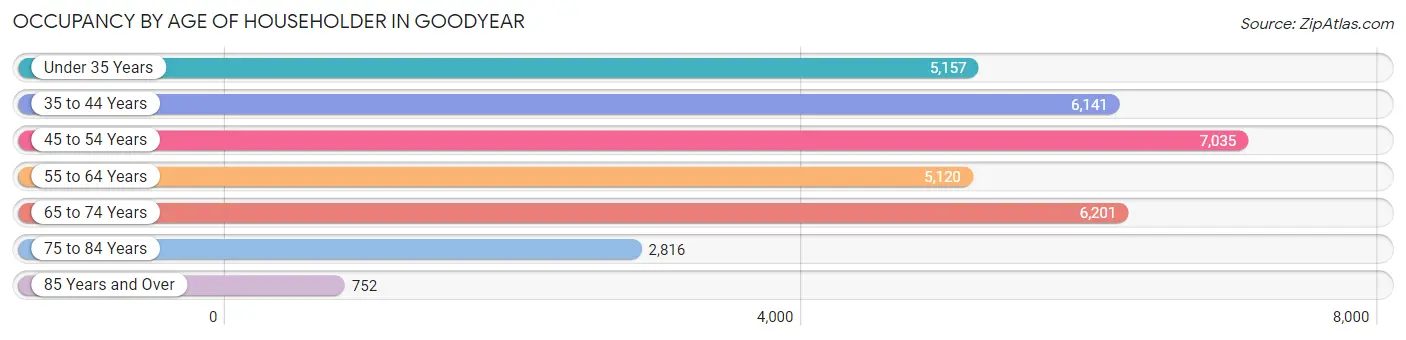
| Age Bracket | # Households | % Households |
| Under 35 Years | 5,157 | 15.5% |
| 35 to 44 Years | 6,141 | 18.5% |
| 45 to 54 Years | 7,035 | 21.2% |
| 55 to 64 Years | 5,120 | 15.4% |
| 65 to 74 Years | 6,201 | 18.7% |
| 75 to 84 Years | 2,816 | 8.5% |
| 85 Years and Over | 752 | 2.3% |
| Total | 33,222 | 100.0% |
Housing Finances in Goodyear
Median Income by Occupancy in Goodyear
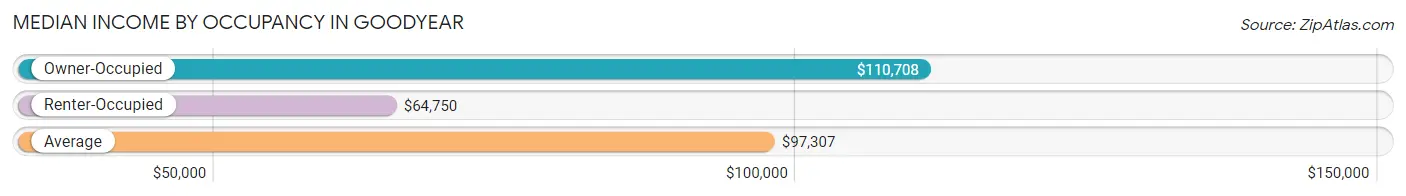
| Occupancy Type | # Households | Median Income |
| Owner-Occupied | 25,831 (77.7%) | $110,708 |
| Renter-Occupied | 7,391 (22.3%) | $64,750 |
| Average | 33,222 (100.0%) | $97,307 |
Occupancy by Householder Income Bracket in Goodyear
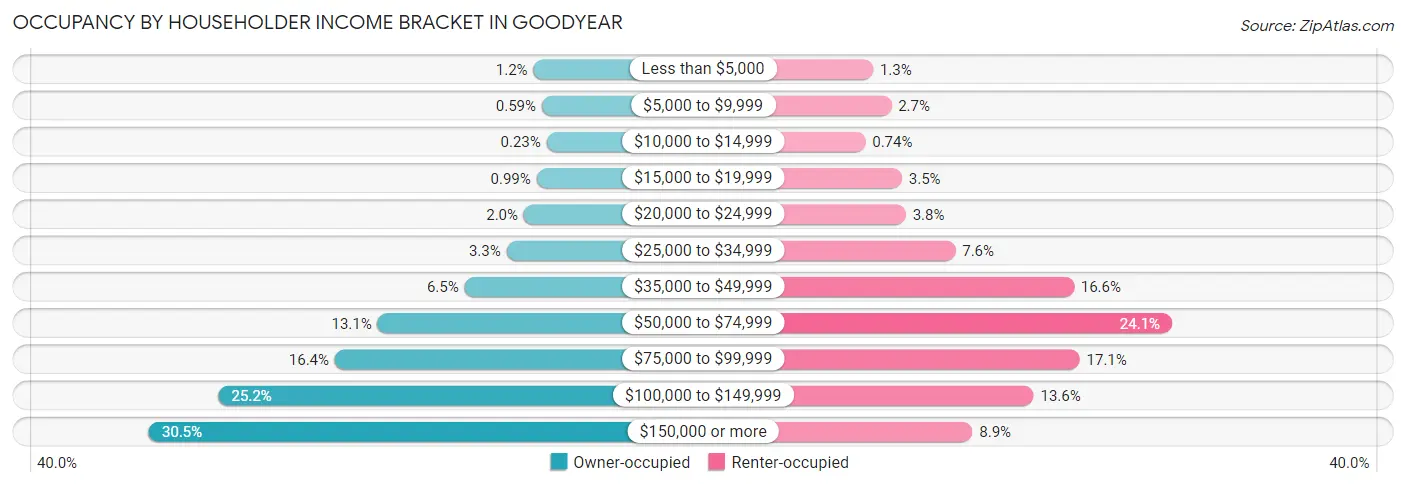
| Income Bracket | Owner-occupied | Renter-occupied |
| Less than $5,000 | 318 (1.2%) | 98 (1.3%) |
| $5,000 to $9,999 | 153 (0.6%) | 201 (2.7%) |
| $10,000 to $14,999 | 59 (0.2%) | 55 (0.7%) |
| $15,000 to $19,999 | 256 (1.0%) | 261 (3.5%) |
| $20,000 to $24,999 | 506 (2.0%) | 282 (3.8%) |
| $25,000 to $34,999 | 848 (3.3%) | 562 (7.6%) |
| $35,000 to $49,999 | 1,675 (6.5%) | 1,229 (16.6%) |
| $50,000 to $74,999 | 3,387 (13.1%) | 1,781 (24.1%) |
| $75,000 to $99,999 | 4,226 (16.4%) | 1,262 (17.1%) |
| $100,000 to $149,999 | 6,517 (25.2%) | 1,002 (13.6%) |
| $150,000 or more | 7,886 (30.5%) | 658 (8.9%) |
| Total | 25,831 (100.0%) | 7,391 (100.0%) |
Monthly Housing Cost Tiers in Goodyear
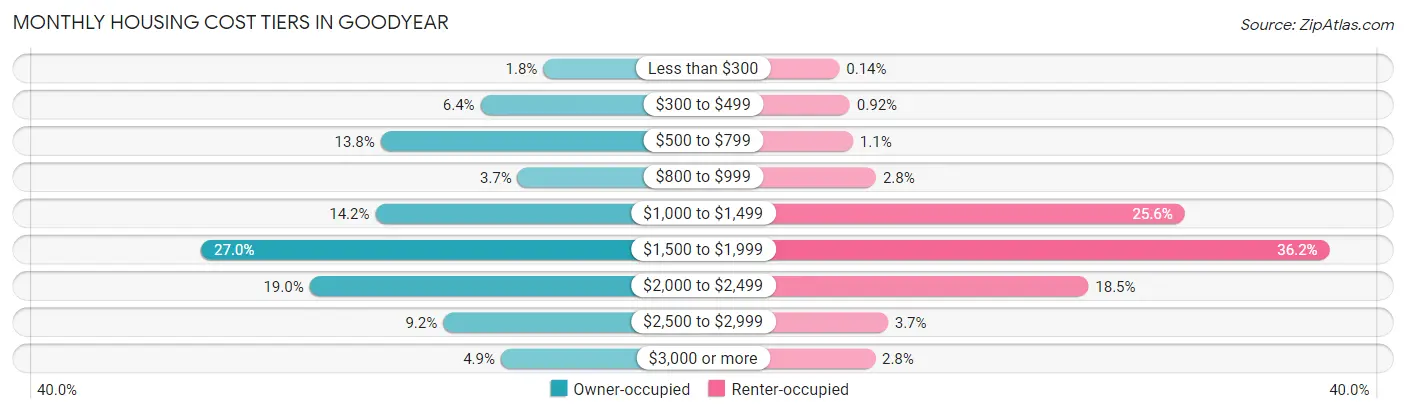
| Monthly Cost | Owner-occupied | Renter-occupied |
| Less than $300 | 467 (1.8%) | 10 (0.1%) |
| $300 to $499 | 1,661 (6.4%) | 68 (0.9%) |
| $500 to $799 | 3,560 (13.8%) | 84 (1.1%) |
| $800 to $999 | 953 (3.7%) | 210 (2.8%) |
| $1,000 to $1,499 | 3,659 (14.2%) | 1,890 (25.6%) |
| $1,500 to $1,999 | 6,974 (27.0%) | 2,678 (36.2%) |
| $2,000 to $2,499 | 4,913 (19.0%) | 1,366 (18.5%) |
| $2,500 to $2,999 | 2,370 (9.2%) | 274 (3.7%) |
| $3,000 or more | 1,274 (4.9%) | 205 (2.8%) |
| Total | 25,831 (100.0%) | 7,391 (100.0%) |
Physical Housing Characteristics in Goodyear
Housing Structures in Goodyear
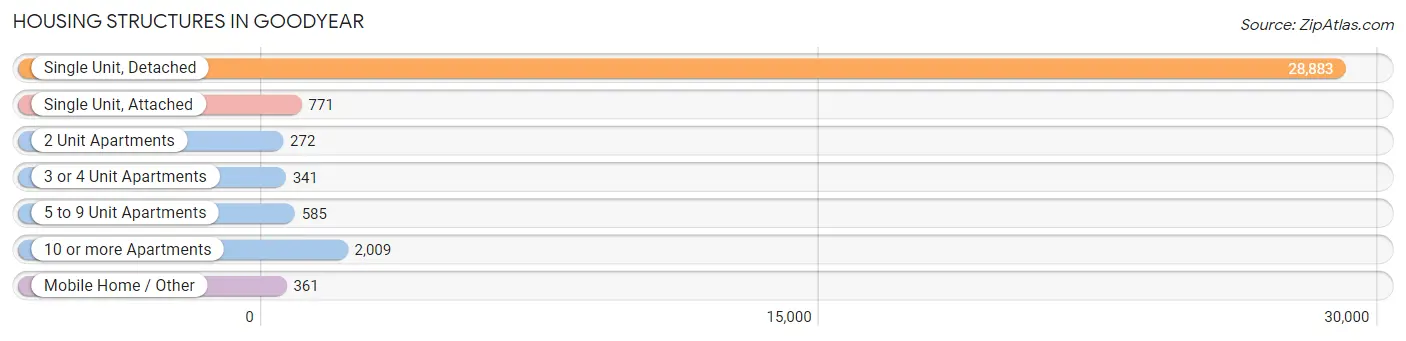
| Structure Type | # Housing Units | % Housing Units |
| Single Unit, Detached | 28,883 | 86.9% |
| Single Unit, Attached | 771 | 2.3% |
| 2 Unit Apartments | 272 | 0.8% |
| 3 or 4 Unit Apartments | 341 | 1.0% |
| 5 to 9 Unit Apartments | 585 | 1.8% |
| 10 or more Apartments | 2,009 | 6.0% |
| Mobile Home / Other | 361 | 1.1% |
| Total | 33,222 | 100.0% |
Housing Structures by Occupancy in Goodyear
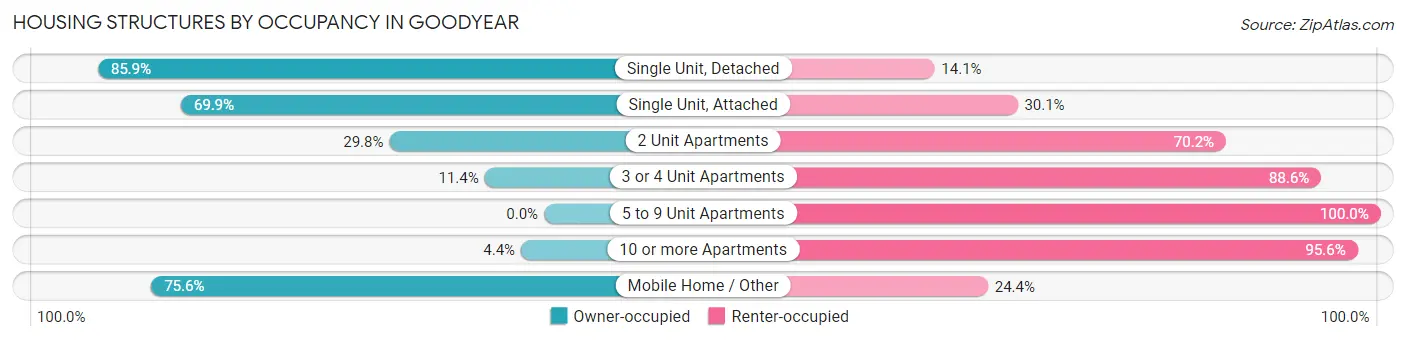
| Structure Type | Owner-occupied | Renter-occupied |
| Single Unit, Detached | 24,810 (85.9%) | 4,073 (14.1%) |
| Single Unit, Attached | 539 (69.9%) | 232 (30.1%) |
| 2 Unit Apartments | 81 (29.8%) | 191 (70.2%) |
| 3 or 4 Unit Apartments | 39 (11.4%) | 302 (88.6%) |
| 5 to 9 Unit Apartments | 0 (0.0%) | 585 (100.0%) |
| 10 or more Apartments | 89 (4.4%) | 1,920 (95.6%) |
| Mobile Home / Other | 273 (75.6%) | 88 (24.4%) |
| Total | 25,831 (77.7%) | 7,391 (22.3%) |
Housing Structures by Number of Rooms in Goodyear
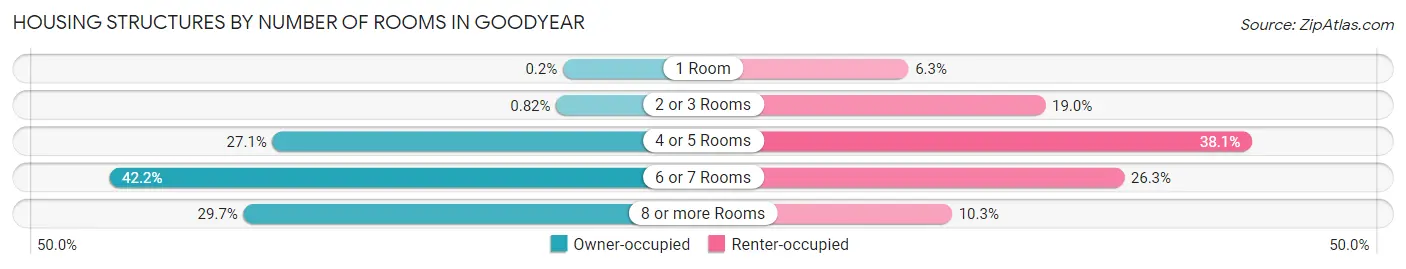
| Number of Rooms | Owner-occupied | Renter-occupied |
| 1 Room | 52 (0.2%) | 467 (6.3%) |
| 2 or 3 Rooms | 211 (0.8%) | 1,402 (19.0%) |
| 4 or 5 Rooms | 6,989 (27.1%) | 2,817 (38.1%) |
| 6 or 7 Rooms | 10,896 (42.2%) | 1,941 (26.3%) |
| 8 or more Rooms | 7,683 (29.7%) | 764 (10.3%) |
| Total | 25,831 (100.0%) | 7,391 (100.0%) |
Housing Structure by Heating Type in Goodyear
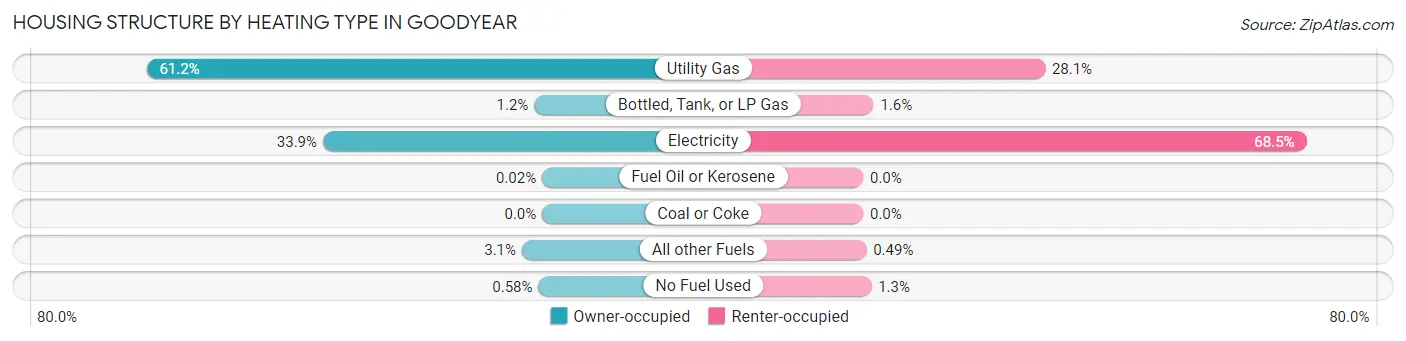
| Heating Type | Owner-occupied | Renter-occupied |
| Utility Gas | 15,798 (61.2%) | 2,078 (28.1%) |
| Bottled, Tank, or LP Gas | 316 (1.2%) | 119 (1.6%) |
| Electricity | 8,753 (33.9%) | 5,065 (68.5%) |
| Fuel Oil or Kerosene | 5 (0.0%) | 0 (0.0%) |
| Coal or Coke | 0 (0.0%) | 0 (0.0%) |
| All other Fuels | 809 (3.1%) | 36 (0.5%) |
| No Fuel Used | 150 (0.6%) | 93 (1.3%) |
| Total | 25,831 (100.0%) | 7,391 (100.0%) |
Household Vehicle Usage in Goodyear
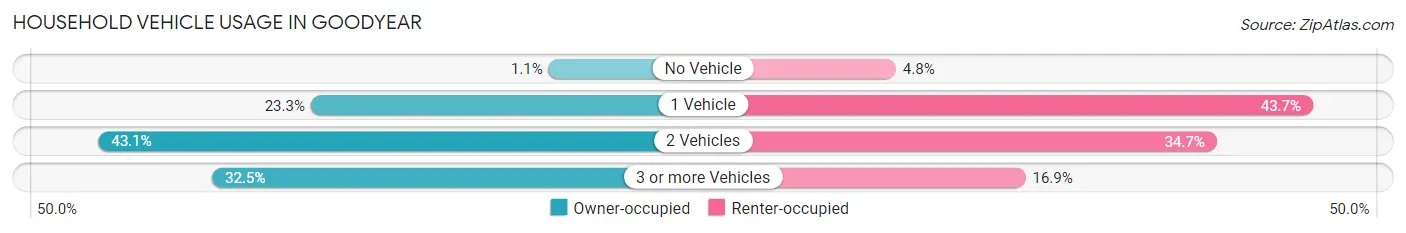
| Vehicles per Household | Owner-occupied | Renter-occupied |
| No Vehicle | 282 (1.1%) | 352 (4.8%) |
| 1 Vehicle | 6,015 (23.3%) | 3,228 (43.7%) |
| 2 Vehicles | 11,138 (43.1%) | 2,565 (34.7%) |
| 3 or more Vehicles | 8,396 (32.5%) | 1,246 (16.9%) |
| Total | 25,831 (100.0%) | 7,391 (100.0%) |
Real Estate & Mortgages in Goodyear
Real Estate and Mortgage Overview in Goodyear
| Characteristic | Without Mortgage | With Mortgage |
| Housing Units | 6,424 | 19,407 |
| Median Property Value | $407,700 | $393,000 |
| Median Household Income | $95,291 | $6,505 |
| Monthly Housing Costs | $599 | $1,229 |
| Real Estate Taxes | $2,798 | $215 |
Property Value by Mortgage Status in Goodyear
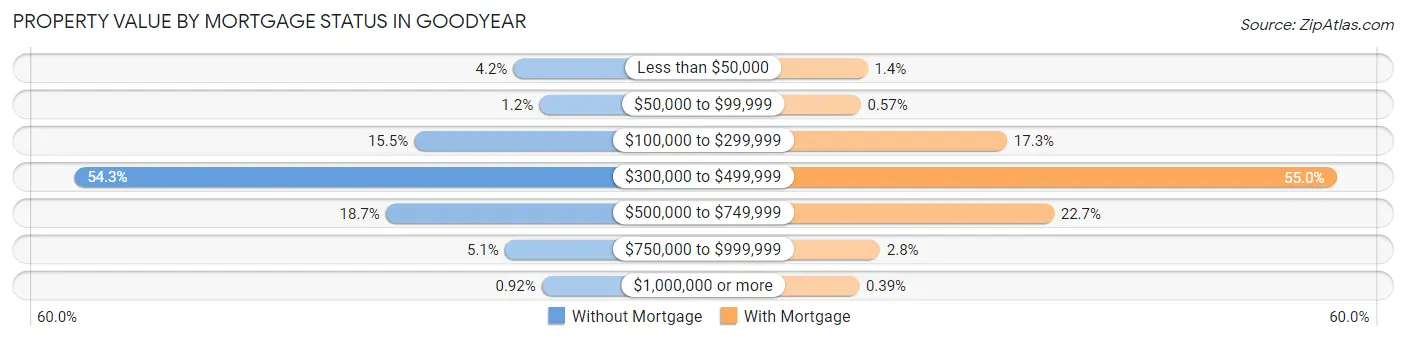
| Property Value | Without Mortgage | With Mortgage |
| Less than $50,000 | 267 (4.2%) | 263 (1.4%) |
| $50,000 to $99,999 | 78 (1.2%) | 111 (0.6%) |
| $100,000 to $299,999 | 996 (15.5%) | 3,357 (17.3%) |
| $300,000 to $499,999 | 3,490 (54.3%) | 10,664 (54.9%) |
| $500,000 to $749,999 | 1,204 (18.7%) | 4,397 (22.7%) |
| $750,000 to $999,999 | 330 (5.1%) | 539 (2.8%) |
| $1,000,000 or more | 59 (0.9%) | 76 (0.4%) |
| Total | 6,424 (100.0%) | 19,407 (100.0%) |
Household Income by Mortgage Status in Goodyear
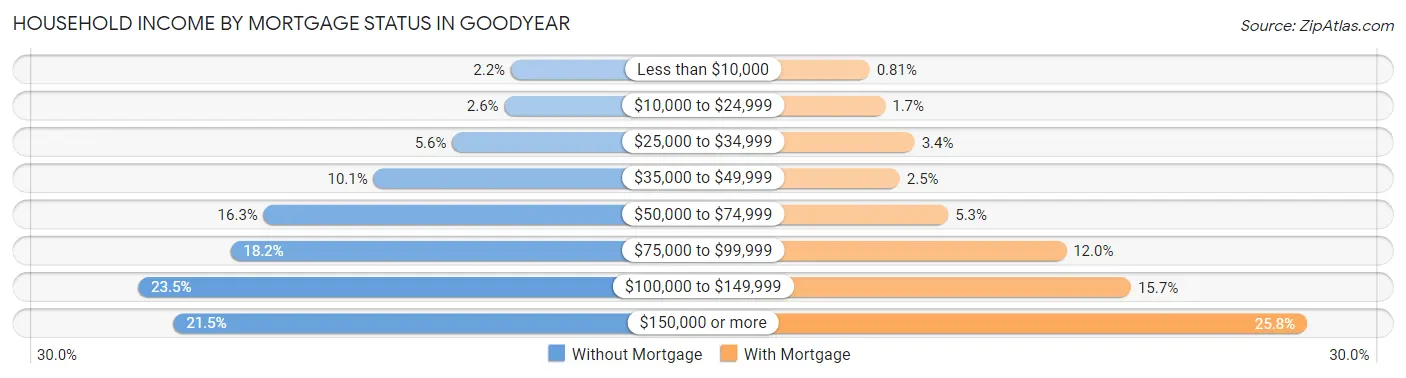
| Household Income | Without Mortgage | With Mortgage |
| Less than $10,000 | 142 (2.2%) | 158 (0.8%) |
| $10,000 to $24,999 | 166 (2.6%) | 329 (1.7%) |
| $25,000 to $34,999 | 357 (5.6%) | 655 (3.4%) |
| $35,000 to $49,999 | 646 (10.1%) | 491 (2.5%) |
| $50,000 to $74,999 | 1,050 (16.3%) | 1,029 (5.3%) |
| $75,000 to $99,999 | 1,172 (18.2%) | 2,337 (12.0%) |
| $100,000 to $149,999 | 1,510 (23.5%) | 3,054 (15.7%) |
| $150,000 or more | 1,381 (21.5%) | 5,007 (25.8%) |
| Total | 6,424 (100.0%) | 19,407 (100.0%) |
Property Value to Household Income Ratio in Goodyear
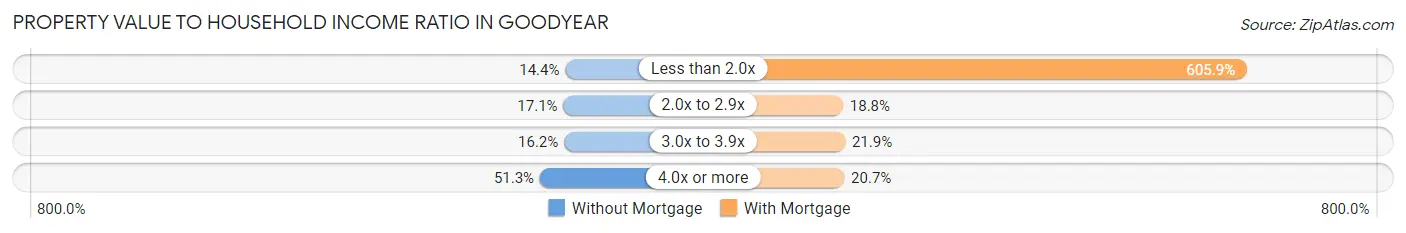
| Value-to-Income Ratio | Without Mortgage | With Mortgage |
| Less than 2.0x | 924 (14.4%) | 117,583 (605.9%) |
| 2.0x to 2.9x | 1,101 (17.1%) | 3,656 (18.8%) |
| 3.0x to 3.9x | 1,038 (16.2%) | 4,251 (21.9%) |
| 4.0x or more | 3,293 (51.3%) | 4,018 (20.7%) |
| Total | 6,424 (100.0%) | 19,407 (100.0%) |
Real Estate Taxes by Mortgage Status in Goodyear
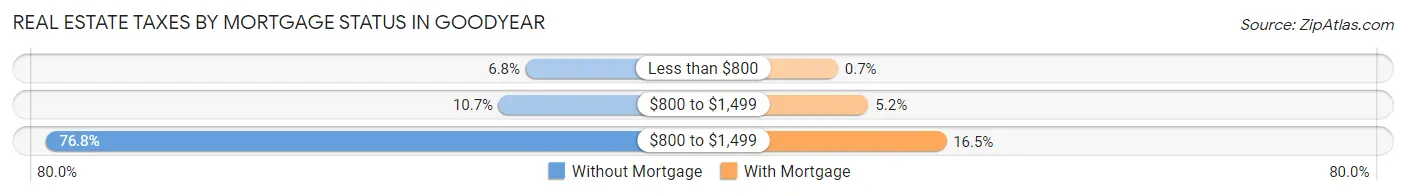
| Property Taxes | Without Mortgage | With Mortgage |
| Less than $800 | 434 (6.8%) | 136 (0.7%) |
| $800 to $1,499 | 687 (10.7%) | 1,004 (5.2%) |
| $800 to $1,499 | 4,935 (76.8%) | 3,208 (16.5%) |
| Total | 6,424 (100.0%) | 19,407 (100.0%) |
Health & Disability in Goodyear
Health Insurance Coverage by Age in Goodyear
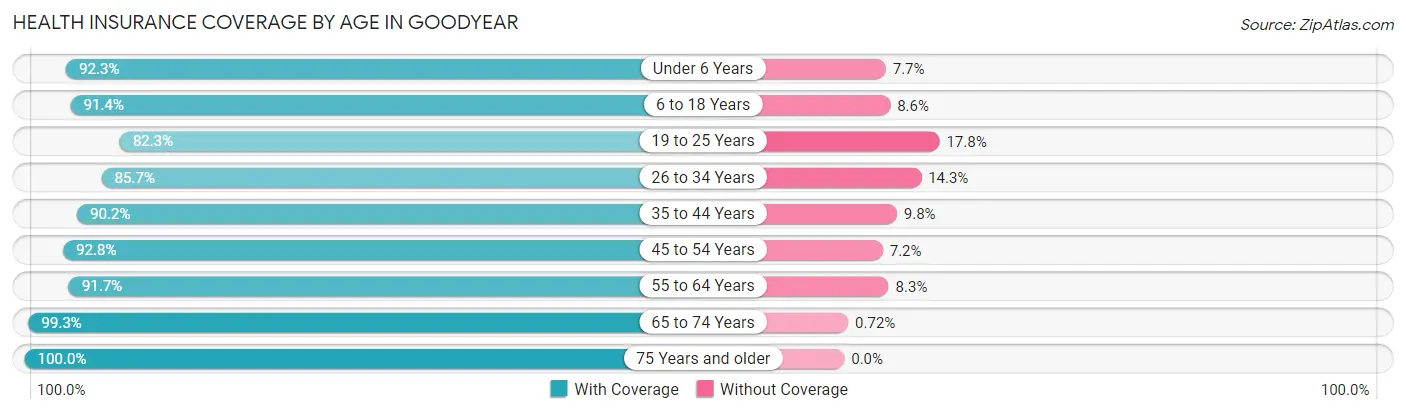
| Age Bracket | With Coverage | Without Coverage |
| Under 6 Years | 6,053 (92.3%) | 508 (7.7%) |
| 6 to 18 Years | 15,427 (91.4%) | 1,445 (8.6%) |
| 19 to 25 Years | 5,552 (82.3%) | 1,198 (17.7%) |
| 26 to 34 Years | 7,586 (85.7%) | 1,270 (14.3%) |
| 35 to 44 Years | 11,179 (90.2%) | 1,215 (9.8%) |
| 45 to 54 Years | 12,288 (92.8%) | 950 (7.2%) |
| 55 to 64 Years | 9,430 (91.7%) | 850 (8.3%) |
| 65 to 74 Years | 10,866 (99.3%) | 79 (0.7%) |
| 75 Years and older | 6,347 (100.0%) | 0 (0.0%) |
| Total | 84,728 (91.8%) | 7,515 (8.2%) |
Health Insurance Coverage by Citizenship Status in Goodyear
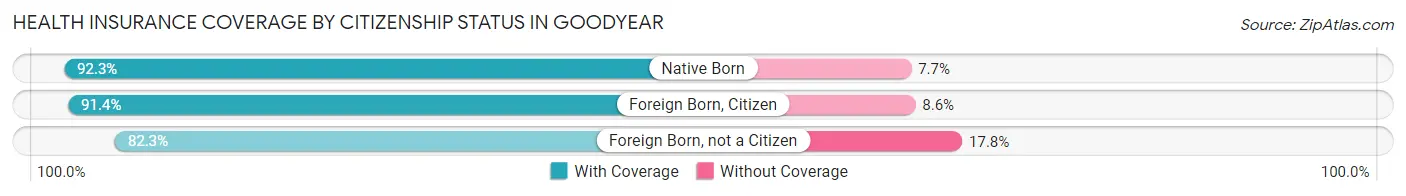
| Citizenship Status | With Coverage | Without Coverage |
| Native Born | 6,053 (92.3%) | 508 (7.7%) |
| Foreign Born, Citizen | 15,427 (91.4%) | 1,445 (8.6%) |
| Foreign Born, not a Citizen | 5,552 (82.3%) | 1,198 (17.7%) |
Health Insurance Coverage by Household Income in Goodyear
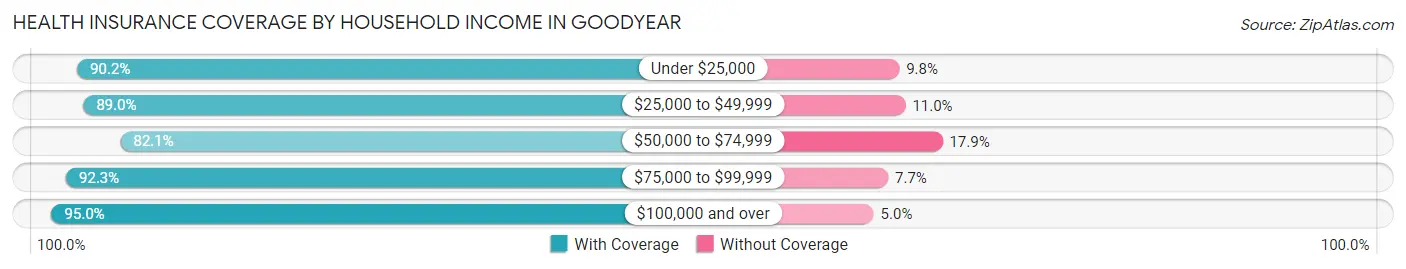
| Household Income | With Coverage | Without Coverage |
| Under $25,000 | 3,903 (90.2%) | 425 (9.8%) |
| $25,000 to $49,999 | 8,619 (89.0%) | 1,064 (11.0%) |
| $50,000 to $74,999 | 10,858 (82.1%) | 2,372 (17.9%) |
| $75,000 to $99,999 | 13,405 (92.3%) | 1,124 (7.7%) |
| $100,000 and over | 47,797 (95.0%) | 2,529 (5.0%) |
Public vs Private Health Insurance Coverage by Age in Goodyear
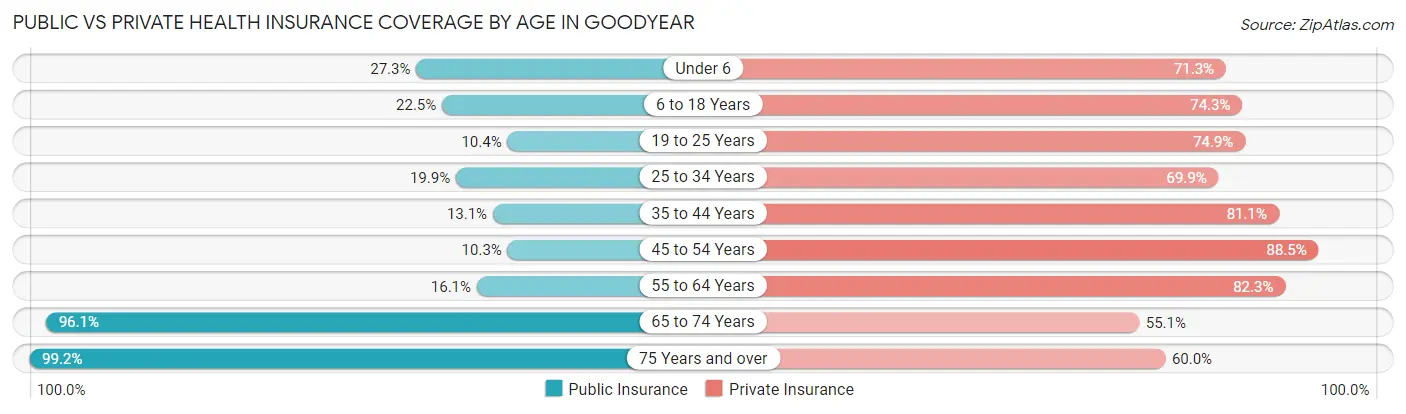
| Age Bracket | Public Insurance | Private Insurance |
| Under 6 | 1,791 (27.3%) | 4,678 (71.3%) |
| 6 to 18 Years | 3,796 (22.5%) | 12,543 (74.3%) |
| 19 to 25 Years | 700 (10.4%) | 5,054 (74.9%) |
| 25 to 34 Years | 1,765 (19.9%) | 6,194 (69.9%) |
| 35 to 44 Years | 1,620 (13.1%) | 10,051 (81.1%) |
| 45 to 54 Years | 1,369 (10.3%) | 11,715 (88.5%) |
| 55 to 64 Years | 1,650 (16.1%) | 8,460 (82.3%) |
| 65 to 74 Years | 10,516 (96.1%) | 6,034 (55.1%) |
| 75 Years and over | 6,294 (99.2%) | 3,807 (60.0%) |
| Total | 29,501 (32.0%) | 68,536 (74.3%) |
Disability Status by Sex by Age in Goodyear
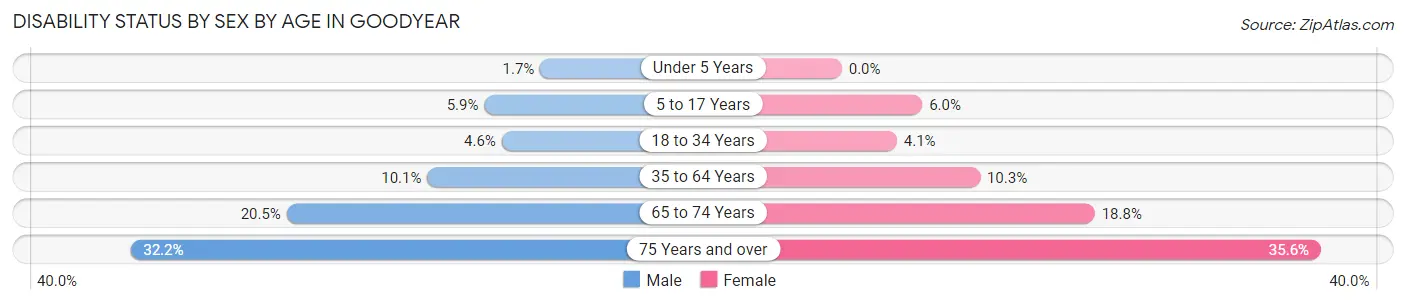
| Age Bracket | Male | Female |
| Under 5 Years | 56 (1.7%) | 0 (0.0%) |
| 5 to 17 Years | 493 (5.9%) | 493 (6.0%) |
| 18 to 34 Years | 399 (4.6%) | 332 (4.1%) |
| 35 to 64 Years | 1,785 (10.1%) | 1,871 (10.3%) |
| 65 to 74 Years | 1,057 (20.5%) | 1,089 (18.8%) |
| 75 Years and over | 992 (32.2%) | 1,160 (35.6%) |
Disability Class by Sex by Age in Goodyear
Disability Class: Hearing Difficulty
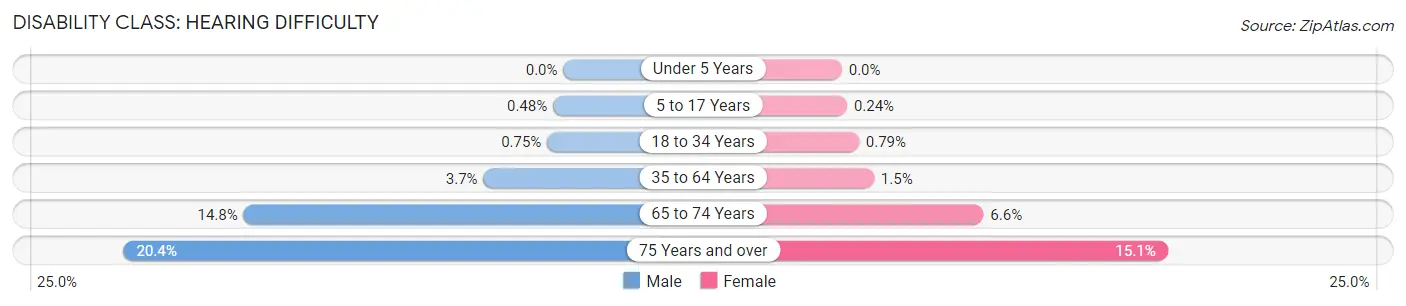
| Age Bracket | Male | Female |
| Under 5 Years | 0 (0.0%) | 0 (0.0%) |
| 5 to 17 Years | 40 (0.5%) | 20 (0.2%) |
| 18 to 34 Years | 65 (0.7%) | 64 (0.8%) |
| 35 to 64 Years | 656 (3.7%) | 272 (1.5%) |
| 65 to 74 Years | 764 (14.8%) | 381 (6.6%) |
| 75 Years and over | 630 (20.4%) | 493 (15.1%) |
Disability Class: Vision Difficulty
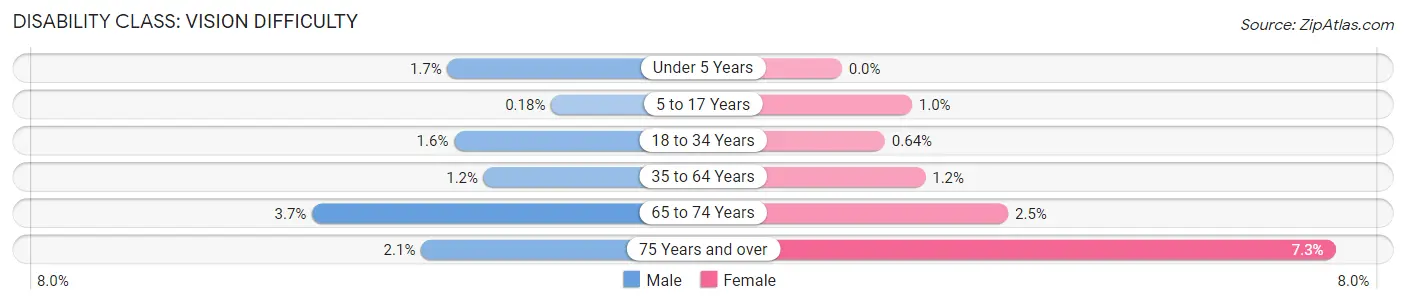
| Age Bracket | Male | Female |
| Under 5 Years | 56 (1.7%) | 0 (0.0%) |
| 5 to 17 Years | 15 (0.2%) | 86 (1.0%) |
| 18 to 34 Years | 141 (1.6%) | 52 (0.6%) |
| 35 to 64 Years | 208 (1.2%) | 226 (1.2%) |
| 65 to 74 Years | 192 (3.7%) | 143 (2.5%) |
| 75 Years and over | 65 (2.1%) | 239 (7.3%) |
Disability Class: Cognitive Difficulty
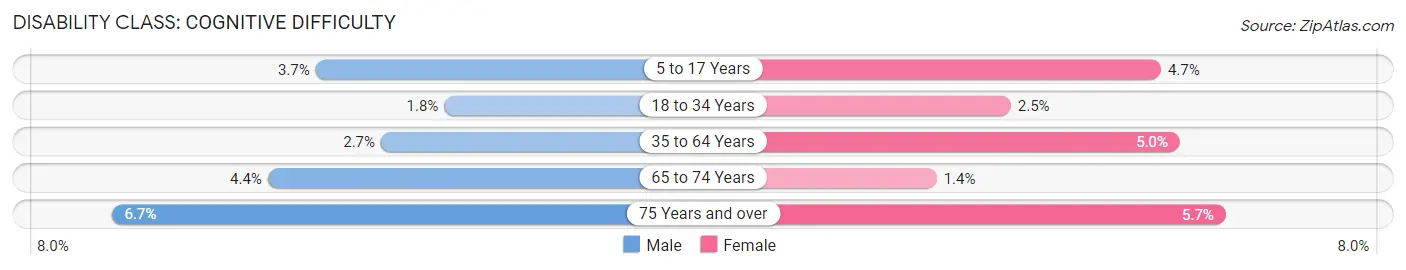
| Age Bracket | Male | Female |
| 5 to 17 Years | 309 (3.7%) | 391 (4.7%) |
| 18 to 34 Years | 154 (1.8%) | 204 (2.5%) |
| 35 to 64 Years | 479 (2.7%) | 915 (5.0%) |
| 65 to 74 Years | 226 (4.4%) | 82 (1.4%) |
| 75 Years and over | 207 (6.7%) | 186 (5.7%) |
Disability Class: Ambulatory Difficulty
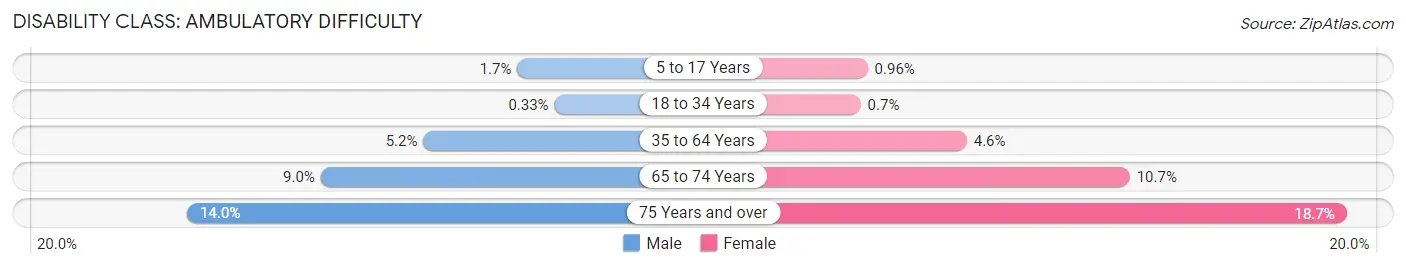
| Age Bracket | Male | Female |
| 5 to 17 Years | 144 (1.7%) | 79 (1.0%) |
| 18 to 34 Years | 29 (0.3%) | 57 (0.7%) |
| 35 to 64 Years | 920 (5.2%) | 846 (4.6%) |
| 65 to 74 Years | 464 (9.0%) | 620 (10.7%) |
| 75 Years and over | 431 (14.0%) | 611 (18.7%) |
Disability Class: Self-Care Difficulty
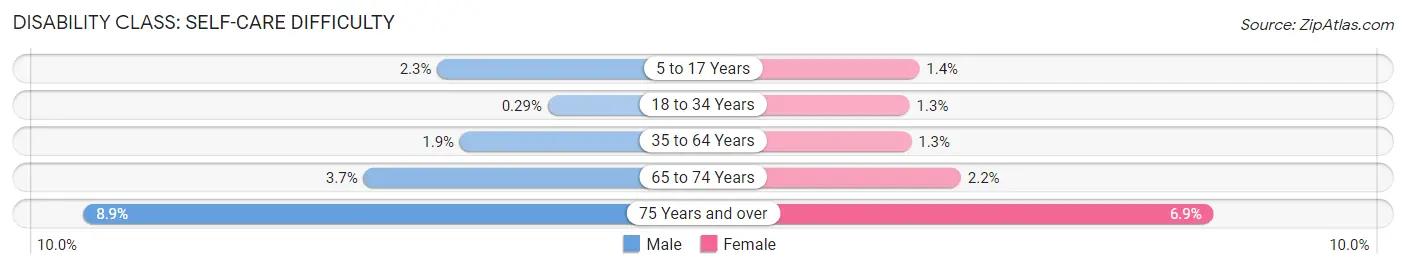
| Age Bracket | Male | Female |
| 5 to 17 Years | 197 (2.3%) | 119 (1.4%) |
| 18 to 34 Years | 25 (0.3%) | 102 (1.3%) |
| 35 to 64 Years | 340 (1.9%) | 236 (1.3%) |
| 65 to 74 Years | 191 (3.7%) | 128 (2.2%) |
| 75 Years and over | 275 (8.9%) | 225 (6.9%) |
Technology Access in Goodyear
Computing Device Access in Goodyear
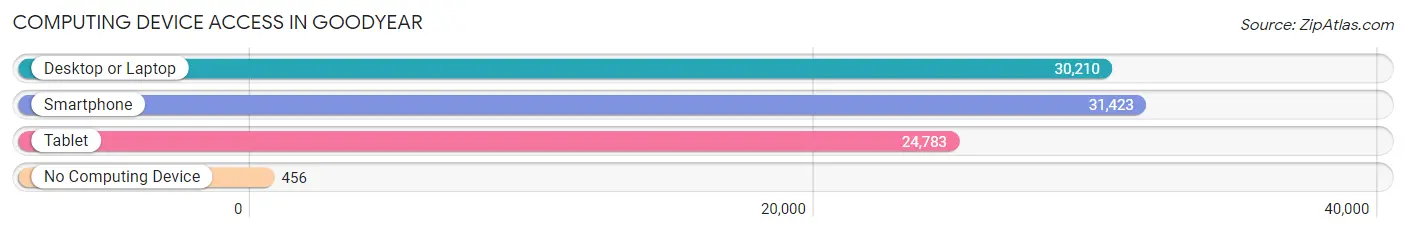
| Device Type | # Households | % Households |
| Desktop or Laptop | 30,210 | 90.9% |
| Smartphone | 31,423 | 94.6% |
| Tablet | 24,783 | 74.6% |
| No Computing Device | 456 | 1.4% |
| Total | 33,222 | 100.0% |
Internet Access in Goodyear
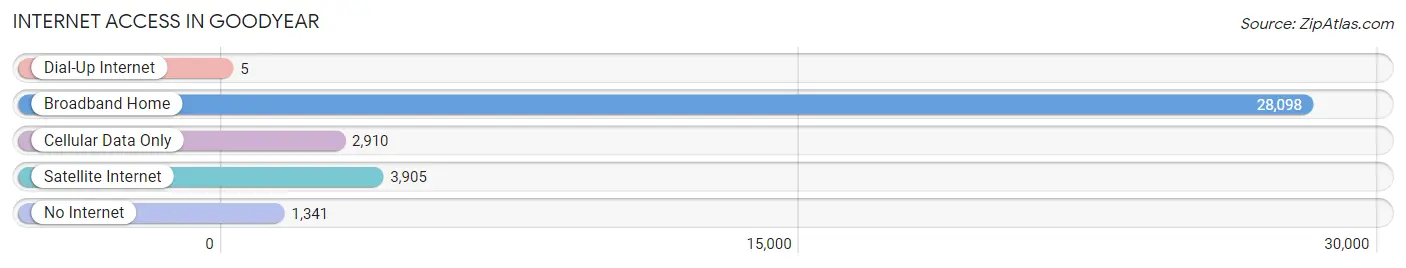
| Internet Type | # Households | % Households |
| Dial-Up Internet | 5 | 0.0% |
| Broadband Home | 28,098 | 84.6% |
| Cellular Data Only | 2,910 | 8.8% |
| Satellite Internet | 3,905 | 11.7% |
| No Internet | 1,341 | 4.0% |
| Total | 33,222 | 100.0% |
Goodyear Summary
Goodyear, Arizona is a city located in Maricopa County, Arizona, United States. It is a suburb of Phoenix and is located about 19 miles west of downtown Phoenix. The city was named after the Goodyear Tire and Rubber Company, which purchased 16,000 acres of land in the area in 1917. As of the 2010 census, the population of Goodyear was 65,275.
Geography
Goodyear is located at 33°27'N 112°21'W (33.45, -112.35). According to the United States Census Bureau, the city has a total area of 116.5 square miles, of which 115.9 square miles is land and 0.6 square miles is water.
Goodyear is located in the Sonoran Desert, which is characterized by hot summers and mild winters. The average annual temperature is 85°F, with an average high of 105°F in July and an average low of 65°F in January. The average annual precipitation is 8.2 inches.
Economy
Goodyear is home to several major employers, including the Goodyear Tire and Rubber Company, Amazon, and Lockheed Martin. The city is also home to several smaller businesses, including retail stores, restaurants, and medical offices.
Goodyear is also home to the Phoenix Goodyear Airport, which is a general aviation airport. The airport is used for corporate and recreational aviation, as well as for flight training.
Demographics
As of the 2010 census, there were 65,275 people, 22,817 households, and 17,845 families residing in the city. The population density was 562.2 people per square mile. The racial makeup of the city was 77.2% White, 5.2% African American, 1.2% Native American, 2.7% Asian, 0.2% Pacific Islander, 10.3% from other races, and 3.2% from two or more races. Hispanic or Latino of any race were 24.2% of the population.
The median income for a household in the city was $60,945, and the median income for a family was $71,845. The per capita income for the city was $25,945. About 6.2% of families and 8.3% of the population were below the poverty line, including 11.2% of those under age 18 and 5.2% of those age 65 or over.
Goodyear is served by the Dysart Unified School District, which includes seven elementary schools, two middle schools, and two high schools. The city is also home to several private schools, including the Arizona Christian University and the Arizona School for the Arts.
Goodyear is served by the Maricopa County Library District, which operates the Goodyear Branch Library. The city is also home to several parks, including the Estrella Mountain Regional Park, which offers hiking, biking, and horseback riding trails.
Goodyear is served by the Valley Metro bus system, which provides public transportation throughout the city. The city is also served by the Phoenix Sky Harbor International Airport, which is located about 25 miles away.
Common Questions
What is Per Capita Income in Goodyear?
Per Capita income in Goodyear is $40,779.
What is the Median Family Income in Goodyear?
Median Family Income in Goodyear is $108,046.
What is the Median Household income in Goodyear?
Median Household Income in Goodyear is $97,307.
What is Income or Wage Gap in Goodyear?
Income or Wage Gap in Goodyear is 33.0%.
Women in Goodyear earn 67.0 cents for every dollar earned by a man.
What is Family Income Deficit in Goodyear?
Family Income Deficit in Goodyear is $12,155.
Families that are below poverty line in Goodyear earn $12,155 less on average than the poverty threshold level.
What is Inequality or Gini Index in Goodyear?
Inequality or Gini Index in Goodyear is 0.38.
What is the Total Population of Goodyear?
Total Population of Goodyear is 97,542.
What is the Total Male Population of Goodyear?
Total Male Population of Goodyear is 47,648.
What is the Total Female Population of Goodyear?
Total Female Population of Goodyear is 49,894.
What is the Ratio of Males per 100 Females in Goodyear?
There are 95.50 Males per 100 Females in Goodyear.
What is the Ratio of Females per 100 Males in Goodyear?
There are 104.71 Females per 100 Males in Goodyear.
What is the Median Population Age in Goodyear?
Median Population Age in Goodyear is 40.4 Years.
What is the Average Family Size in Goodyear
Average Family Size in Goodyear is 3.1 People.
What is the Average Household Size in Goodyear
Average Household Size in Goodyear is 2.8 People.
How Large is the Labor Force in Goodyear?
There are 46,201 People in the Labor Forcein in Goodyear.
What is the Percentage of People in the Labor Force in Goodyear?
59.2% of People are in the Labor Force in Goodyear.
What is the Unemployment Rate in Goodyear?
Unemployment Rate in Goodyear is 5.5%.