Camp Verde, AZ Map & Demographics
Camp Verde Map
Camp Verde Overview
$30,044
PER CAPITA INCOME
$68,715
AVG FAMILY INCOME
$50,247
AVG HOUSEHOLD INCOME
14.2%
WAGE / INCOME GAP [ % ]
85.8¢/ $1
WAGE / INCOME GAP [ $ ]
$12,267
FAMILY INCOME DEFICIT
0.48
INEQUALITY / GINI INDEX
12,132
TOTAL POPULATION
6,445
MALE POPULATION
5,687
FEMALE POPULATION
113.33
MALES / 100 FEMALES
88.24
FEMALES / 100 MALES
40.5
MEDIAN AGE
3.1
AVG FAMILY SIZE
2.6
AVG HOUSEHOLD SIZE
4,972
LABOR FORCE [ PEOPLE ]
50.9%
PERCENT IN LABOR FORCE
5.4%
UNEMPLOYMENT RATE
Camp Verde Zip Codes
Camp Verde Area Codes
Income in Camp Verde
Income Overview in Camp Verde
Per Capita Income in Camp Verde is $30,044, while median incomes of families and households are $68,715 and $50,247 respectively.
| Characteristic | Number | Measure |
| Per Capita Income | 12,132 | $30,044 |
| Median Family Income | 2,821 | $68,715 |
| Mean Family Income | 2,821 | $94,758 |
| Median Household Income | 4,343 | $50,247 |
| Mean Household Income | 4,343 | $79,542 |
| Income Deficit | 2,821 | $12,267 |
| Wage / Income Gap (%) | 12,132 | 14.17% |
| Wage / Income Gap ($) | 12,132 | 85.83¢ per $1 |
| Gini / Inequality Index | 12,132 | 0.48 |
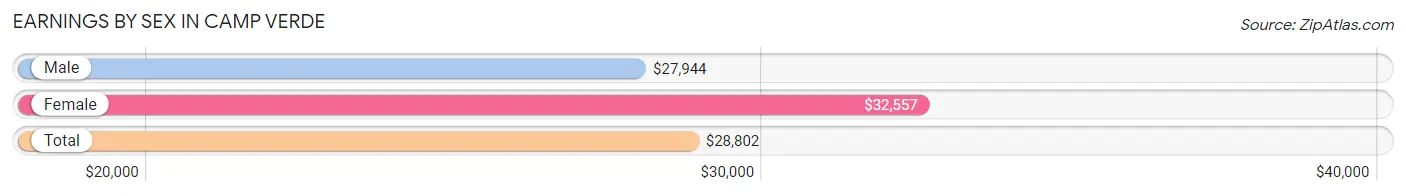
Earnings by Sex in Camp Verde
Average Earnings in Camp Verde are $28,802, $27,944 for men and $32,557 for women, a difference of 14.2%.
| Sex | Number | Average Earnings |
| Male | 3,212 (57.4%) | $27,944 |
| Female | 2,386 (42.6%) | $32,557 |
| Total | 5,598 (100.0%) | $28,802 |
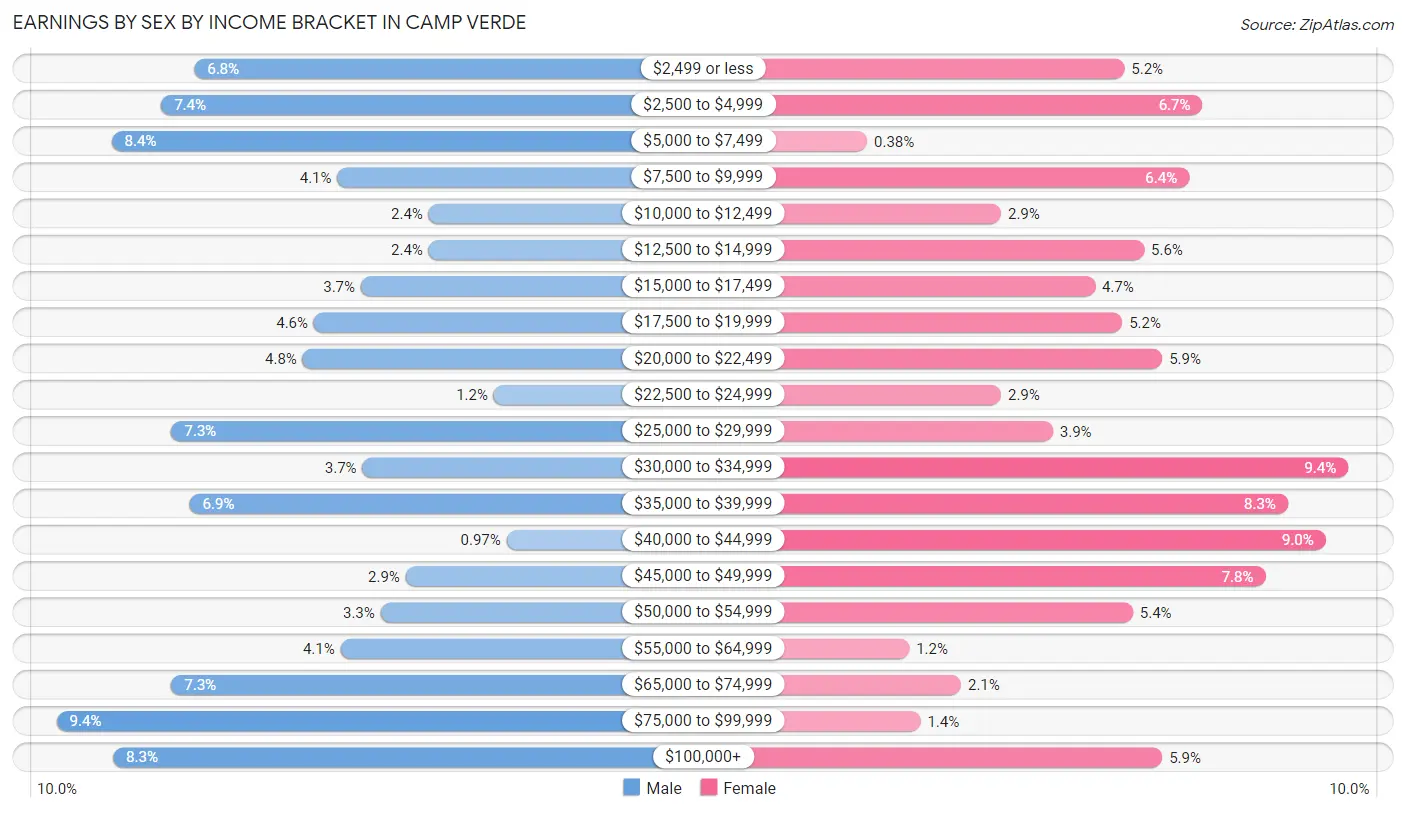
Earnings by Sex by Income Bracket in Camp Verde
The most common earnings brackets in Camp Verde are $75,000 to $99,999 for men (302 | 9.4%) and $30,000 to $34,999 for women (224 | 9.4%).
| Income | Male | Female |
| $2,499 or less | 219 (6.8%) | 124 (5.2%) |
| $2,500 to $4,999 | 239 (7.4%) | 159 (6.7%) |
| $5,000 to $7,499 | 269 (8.4%) | 9 (0.4%) |
| $7,500 to $9,999 | 133 (4.1%) | 153 (6.4%) |
| $10,000 to $12,499 | 78 (2.4%) | 69 (2.9%) |
| $12,500 to $14,999 | 78 (2.4%) | 133 (5.6%) |
| $15,000 to $17,499 | 119 (3.7%) | 111 (4.6%) |
| $17,500 to $19,999 | 147 (4.6%) | 123 (5.2%) |
| $20,000 to $22,499 | 154 (4.8%) | 141 (5.9%) |
| $22,500 to $24,999 | 39 (1.2%) | 69 (2.9%) |
| $25,000 to $29,999 | 233 (7.2%) | 92 (3.9%) |
| $30,000 to $34,999 | 118 (3.7%) | 224 (9.4%) |
| $35,000 to $39,999 | 222 (6.9%) | 197 (8.3%) |
| $40,000 to $44,999 | 31 (1.0%) | 214 (9.0%) |
| $45,000 to $49,999 | 92 (2.9%) | 187 (7.8%) |
| $50,000 to $54,999 | 107 (3.3%) | 128 (5.4%) |
| $55,000 to $64,999 | 131 (4.1%) | 28 (1.2%) |
| $65,000 to $74,999 | 233 (7.2%) | 51 (2.1%) |
| $75,000 to $99,999 | 302 (9.4%) | 33 (1.4%) |
| $100,000+ | 268 (8.3%) | 141 (5.9%) |
| Total | 3,212 (100.0%) | 2,386 (100.0%) |
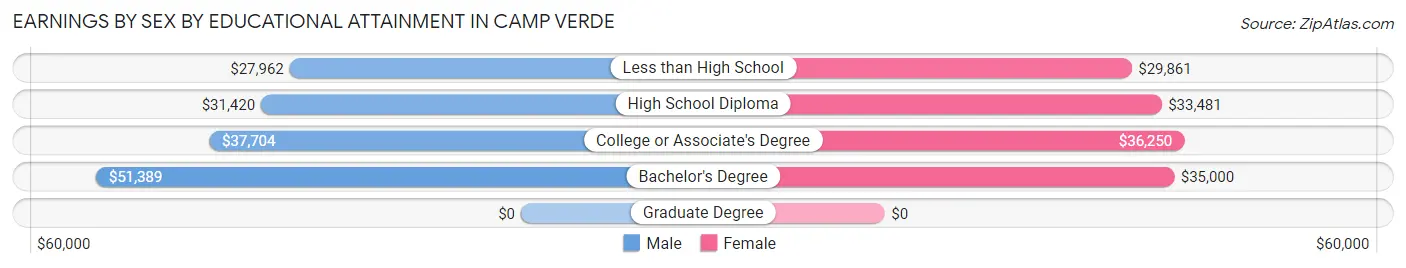
Earnings by Sex by Educational Attainment in Camp Verde
Average earnings in Camp Verde are $32,643 for men and $34,217 for women, a difference of 4.6%. Men with an educational attainment of bachelor's degree enjoy the highest average annual earnings of $51,389, while those with less than high school education earn the least with $27,962. Women with an educational attainment of college or associate's degree earn the most with the average annual earnings of $36,250, while those with less than high school education have the smallest earnings of $29,861.
| Educational Attainment | Male Income | Female Income |
| Less than High School | $27,962 | $29,861 |
| High School Diploma | $31,420 | $33,481 |
| College or Associate's Degree | $37,704 | $36,250 |
| Bachelor's Degree | $51,389 | $35,000 |
| Graduate Degree | - | - |
| Total | $32,643 | $34,217 |
Family Income in Camp Verde
Family Income Brackets in Camp Verde
According to the Camp Verde family income data, there are 550 families falling into the $100,000 to $149,999 income range, which is the most common income bracket and makes up 19.5% of all families. Conversely, the $10,000 to $14,999 income bracket is the least frequent group with only 54 families (1.9%) belonging to this category.
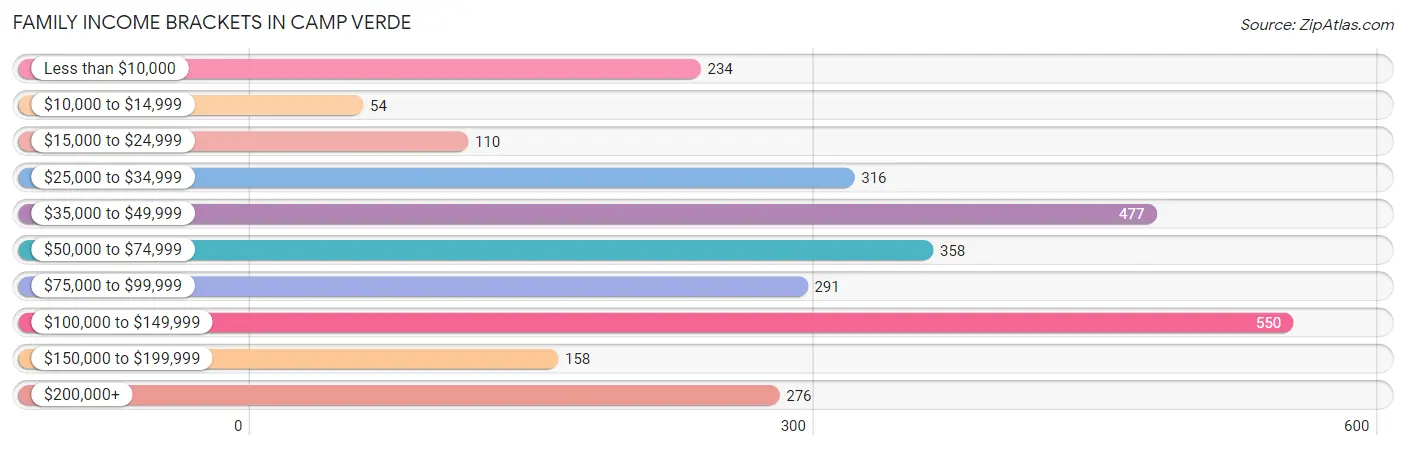
| Income Bracket | # Families | % Families |
| Less than $10,000 | 234 | 8.3% |
| $10,000 to $14,999 | 54 | 1.9% |
| $15,000 to $24,999 | 110 | 3.9% |
| $25,000 to $34,999 | 316 | 11.2% |
| $35,000 to $49,999 | 477 | 16.9% |
| $50,000 to $74,999 | 358 | 12.7% |
| $75,000 to $99,999 | 291 | 10.3% |
| $100,000 to $149,999 | 550 | 19.5% |
| $150,000 to $199,999 | 158 | 5.6% |
| $200,000+ | 276 | 9.8% |
Family Income by Famaliy Size in Camp Verde
7+ person families (87 | 3.1%) account for the highest median family income in Camp Verde with $226,625 per family, while 7+ person families (87 | 3.1%) have the highest median income of $32,375 per family member.
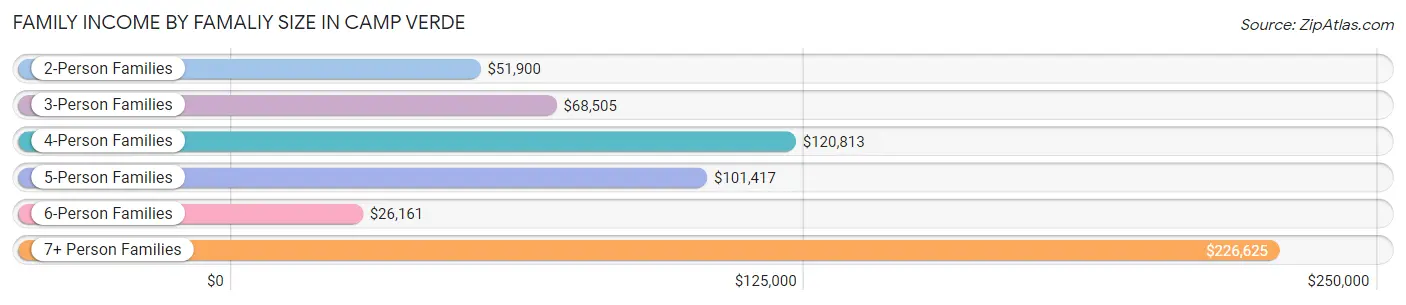
| Income Bracket | # Families | Median Income |
| 2-Person Families | 1,474 (52.2%) | $51,900 |
| 3-Person Families | 507 (18.0%) | $68,505 |
| 4-Person Families | 296 (10.5%) | $120,813 |
| 5-Person Families | 364 (12.9%) | $101,417 |
| 6-Person Families | 93 (3.3%) | $26,161 |
| 7+ Person Families | 87 (3.1%) | $226,625 |
| Total | 2,821 (100.0%) | $68,715 |
Family Income by Number of Earners in Camp Verde
The median family income in Camp Verde is $68,715, with families comprising 3+ earners (379) having the highest median family income of $121,734, while families with 1 earner (1,038) have the lowest median family income of $43,041, accounting for 13.4% and 36.8% of families, respectively.
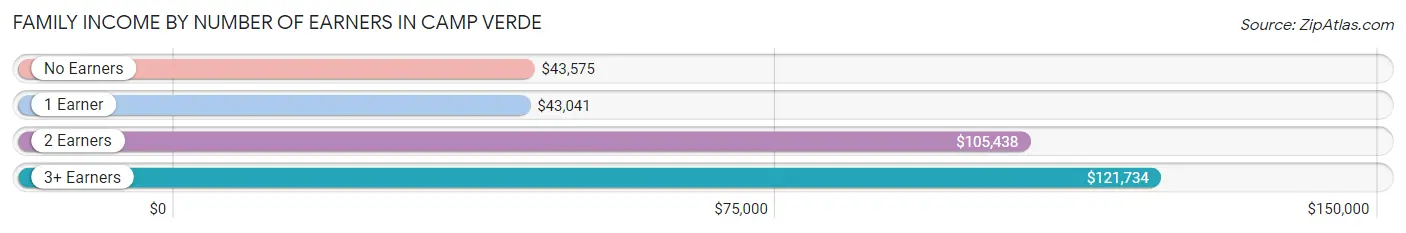
| Number of Earners | # Families | Median Income |
| No Earners | 680 (24.1%) | $43,575 |
| 1 Earner | 1,038 (36.8%) | $43,041 |
| 2 Earners | 724 (25.7%) | $105,438 |
| 3+ Earners | 379 (13.4%) | $121,734 |
| Total | 2,821 (100.0%) | $68,715 |
Household Income in Camp Verde
Household Income Brackets in Camp Verde
With 799 households falling in the category, the $35,000 to $49,999 income range is the most frequent in Camp Verde, accounting for 18.4% of all households. In contrast, only 139 households (3.2%) fall into the $10,000 to $14,999 income bracket, making it the least populous group.
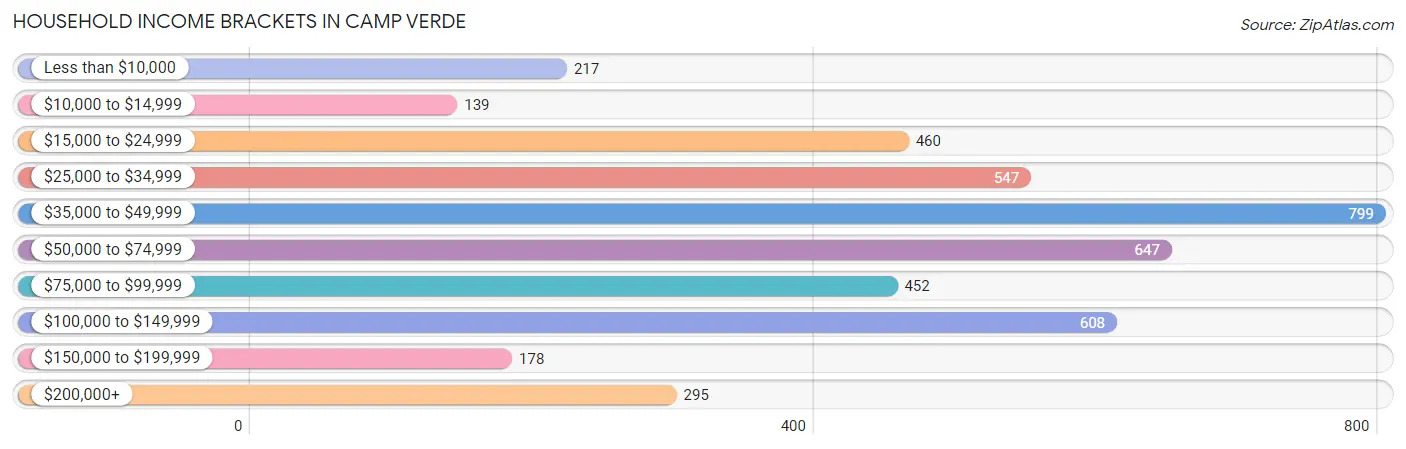
| Income Bracket | # Households | % Households |
| Less than $10,000 | 217 | 5.0% |
| $10,000 to $14,999 | 139 | 3.2% |
| $15,000 to $24,999 | 460 | 10.6% |
| $25,000 to $34,999 | 547 | 12.6% |
| $35,000 to $49,999 | 799 | 18.4% |
| $50,000 to $74,999 | 647 | 14.9% |
| $75,000 to $99,999 | 452 | 10.4% |
| $100,000 to $149,999 | 608 | 14.0% |
| $150,000 to $199,999 | 178 | 4.1% |
| $200,000+ | 295 | 6.8% |
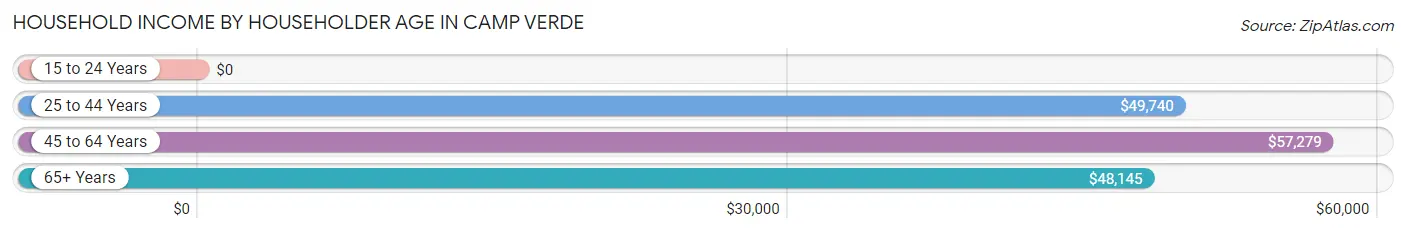
Household Income by Householder Age in Camp Verde
The median household income in Camp Verde is $50,247, with the highest median household income of $57,279 found in the 45 to 64 years age bracket for the primary householder. A total of 1,201 households (27.7%) fall into this category. Meanwhile, the 15 to 24 years age bracket for the primary householder has the lowest median household income of $0, with 48 households (1.1%) in this group.
| Income Bracket | # Households | Median Income |
| 15 to 24 Years | 48 (1.1%) | $0 |
| 25 to 44 Years | 1,282 (29.5%) | $49,740 |
| 45 to 64 Years | 1,201 (27.7%) | $57,279 |
| 65+ Years | 1,812 (41.7%) | $48,145 |
| Total | 4,343 (100.0%) | $50,247 |
Poverty in Camp Verde
Income Below Poverty by Sex and Age in Camp Verde
With 22.4% poverty level for males and 23.5% for females among the residents of Camp Verde, 5 year old males and 5 year old females are the most vulnerable to poverty, with 17 males (77.3%) and 69 females (64.5%) in their respective age groups living below the poverty level.
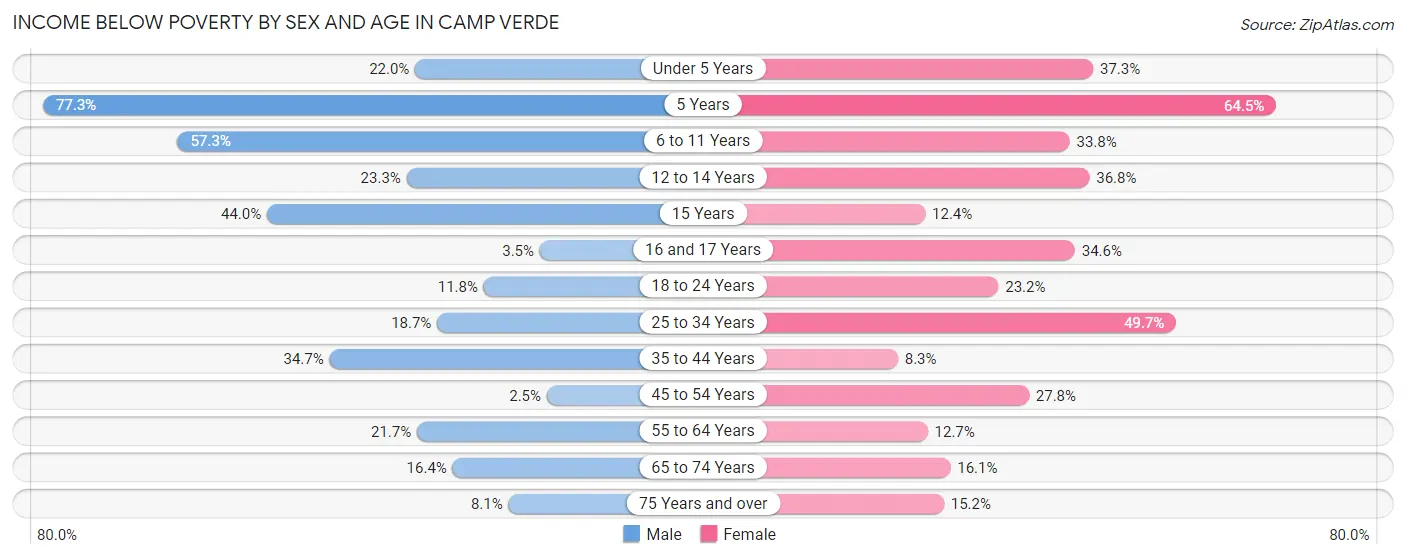
| Age Bracket | Male | Female |
| Under 5 Years | 66 (22.0%) | 50 (37.3%) |
| 5 Years | 17 (77.3%) | 69 (64.5%) |
| 6 to 11 Years | 326 (57.3%) | 117 (33.8%) |
| 12 to 14 Years | 57 (23.3%) | 111 (36.7%) |
| 15 Years | 55 (44.0%) | 12 (12.4%) |
| 16 and 17 Years | 9 (3.5%) | 73 (34.6%) |
| 18 to 24 Years | 45 (11.8%) | 86 (23.2%) |
| 25 to 34 Years | 94 (18.7%) | 285 (49.6%) |
| 35 to 44 Years | 293 (34.7%) | 72 (8.3%) |
| 45 to 54 Years | 12 (2.5%) | 130 (27.8%) |
| 55 to 64 Years | 148 (21.7%) | 87 (12.7%) |
| 65 to 74 Years | 133 (16.4%) | 121 (16.1%) |
| 75 Years and over | 48 (8.1%) | 105 (15.1%) |
| Total | 1,303 (22.4%) | 1,318 (23.5%) |
Income Above Poverty by Sex and Age in Camp Verde
According to the poverty statistics in Camp Verde, males aged 45 to 54 years and females aged 35 to 44 years are the age groups that are most secure financially, with 97.6% of males and 91.7% of females in these age groups living above the poverty line.
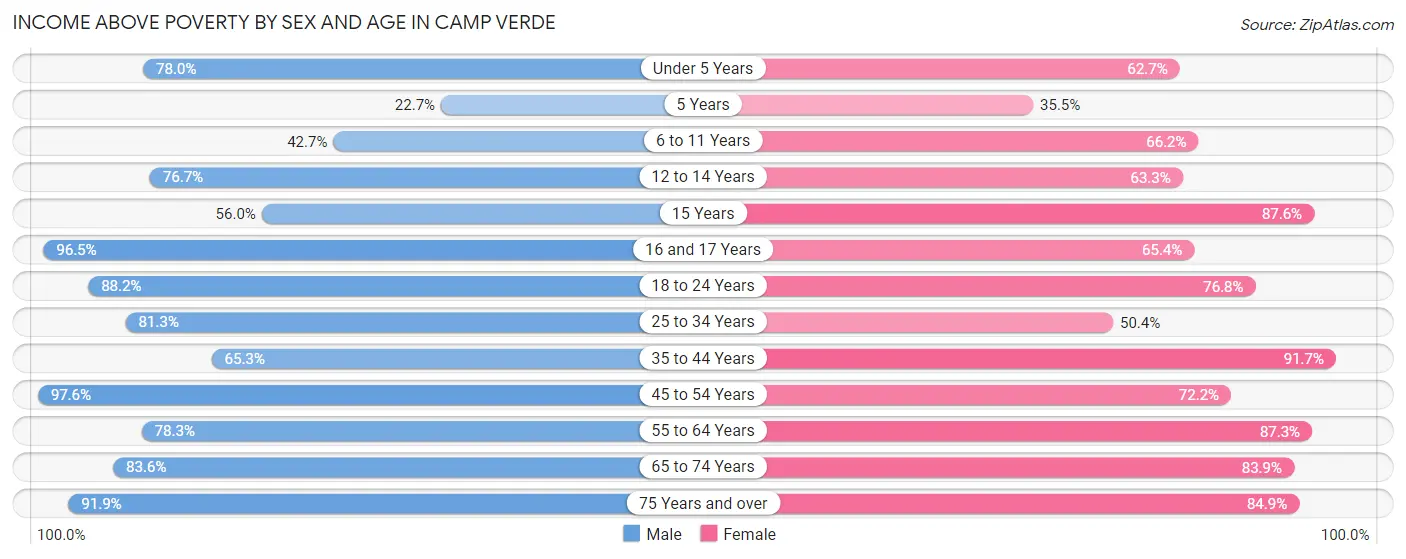
| Age Bracket | Male | Female |
| Under 5 Years | 234 (78.0%) | 84 (62.7%) |
| 5 Years | 5 (22.7%) | 38 (35.5%) |
| 6 to 11 Years | 243 (42.7%) | 229 (66.2%) |
| 12 to 14 Years | 188 (76.7%) | 191 (63.2%) |
| 15 Years | 70 (56.0%) | 85 (87.6%) |
| 16 and 17 Years | 249 (96.5%) | 138 (65.4%) |
| 18 to 24 Years | 336 (88.2%) | 284 (76.8%) |
| 25 to 34 Years | 408 (81.3%) | 289 (50.3%) |
| 35 to 44 Years | 551 (65.3%) | 794 (91.7%) |
| 45 to 54 Years | 478 (97.6%) | 338 (72.2%) |
| 55 to 64 Years | 533 (78.3%) | 596 (87.3%) |
| 65 to 74 Years | 676 (83.6%) | 630 (83.9%) |
| 75 Years and over | 542 (91.9%) | 588 (84.9%) |
| Total | 4,513 (77.6%) | 4,284 (76.5%) |
Income Below Poverty Among Married-Couple Families in Camp Verde
The poverty statistics for married-couple families in Camp Verde show that 9.0% or 164 of the total 1,829 families live below the poverty line. Families with 3 or 4 children have the highest poverty rate of 40.9%, comprising of 106 families. On the other hand, families with no children have the lowest poverty rate of 2.4%, which includes 29 families.
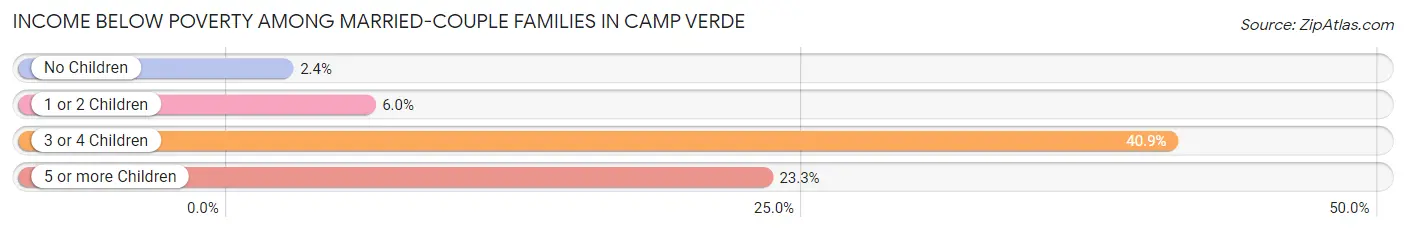
| Children | Above Poverty | Below Poverty |
| No Children | 1,180 (97.6%) | 29 (2.4%) |
| 1 or 2 Children | 299 (94.0%) | 19 (6.0%) |
| 3 or 4 Children | 153 (59.1%) | 106 (40.9%) |
| 5 or more Children | 33 (76.7%) | 10 (23.3%) |
| Total | 1,665 (91.0%) | 164 (9.0%) |
Income Below Poverty Among Single-Parent Households in Camp Verde
According to the poverty data in Camp Verde, 36.0% or 107 single-father households and 34.4% or 239 single-mother households are living below the poverty line. Among single-father households, those with 1 or 2 children have the highest poverty rate, with 90 households (42.9%) experiencing poverty. Likewise, among single-mother households, those with 5 or more children have the highest poverty rate, with 5 households (100.0%) falling below the poverty line.
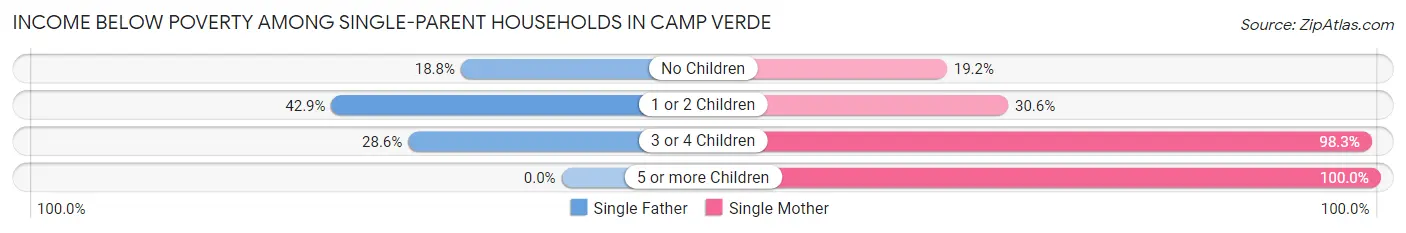
| Children | Single Father | Single Mother |
| No Children | 15 (18.8%) | 29 (19.2%) |
| 1 or 2 Children | 90 (42.9%) | 147 (30.6%) |
| 3 or 4 Children | 2 (28.6%) | 58 (98.3%) |
| 5 or more Children | 0 (0.0%) | 5 (100.0%) |
| Total | 107 (36.0%) | 239 (34.4%) |
Income Below Poverty Among Married-Couple vs Single-Parent Households in Camp Verde
The poverty data for Camp Verde shows that 164 of the married-couple family households (9.0%) and 346 of the single-parent households (34.9%) are living below the poverty level. Within the married-couple family households, those with 3 or 4 children have the highest poverty rate, with 106 households (40.9%) falling below the poverty line. Among the single-parent households, those with 5 or more children have the highest poverty rate, with 5 household (100.0%) living below poverty.
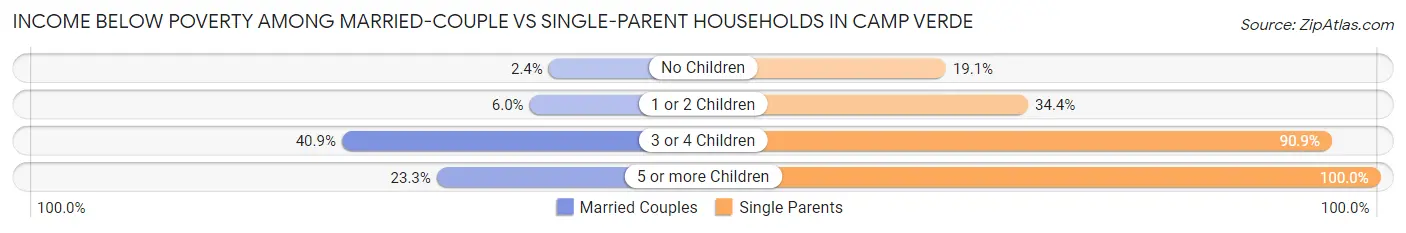
| Children | Married-Couple Families | Single-Parent Households |
| No Children | 29 (2.4%) | 44 (19.1%) |
| 1 or 2 Children | 19 (6.0%) | 237 (34.4%) |
| 3 or 4 Children | 106 (40.9%) | 60 (90.9%) |
| 5 or more Children | 10 (23.3%) | 5 (100.0%) |
| Total | 164 (9.0%) | 346 (34.9%) |
Race in Camp Verde
The most populous races in Camp Verde are White / Caucasian (9,333 | 76.9%), Hispanic or Latino (2,770 | 22.8%), and Some other Race (1,076 | 8.9%).
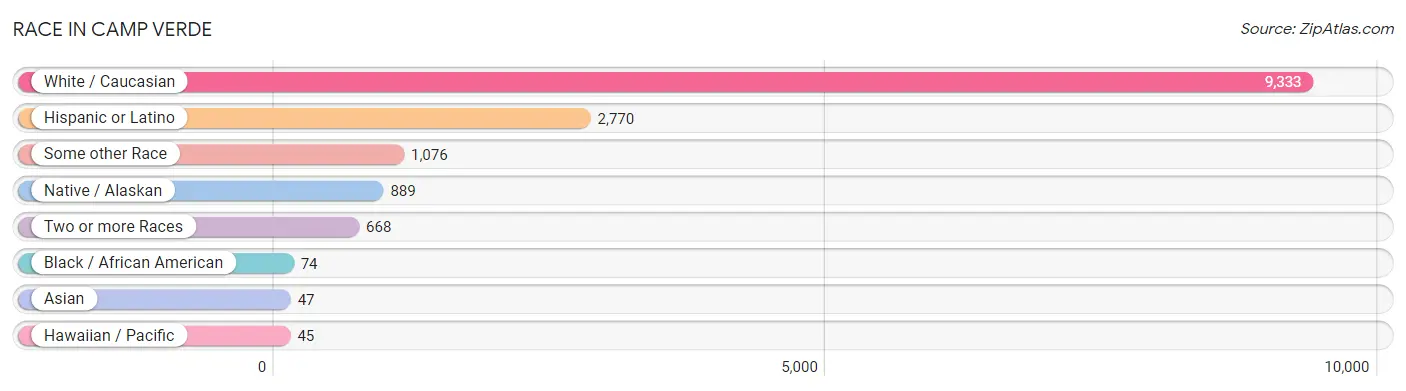
| Race | # Population | % Population |
| Asian | 47 | 0.4% |
| Black / African American | 74 | 0.6% |
| Hawaiian / Pacific | 45 | 0.4% |
| Hispanic or Latino | 2,770 | 22.8% |
| Native / Alaskan | 889 | 7.3% |
| White / Caucasian | 9,333 | 76.9% |
| Two or more Races | 668 | 5.5% |
| Some other Race | 1,076 | 8.9% |
| Total | 12,132 | 100.0% |
Ancestry in Camp Verde
The most populous ancestries reported in Camp Verde are German (2,290 | 18.9%), Mexican (2,078 | 17.1%), English (1,335 | 11.0%), Irish (992 | 8.2%), and Norwegian (476 | 3.9%), together accounting for 59.1% of all Camp Verde residents.
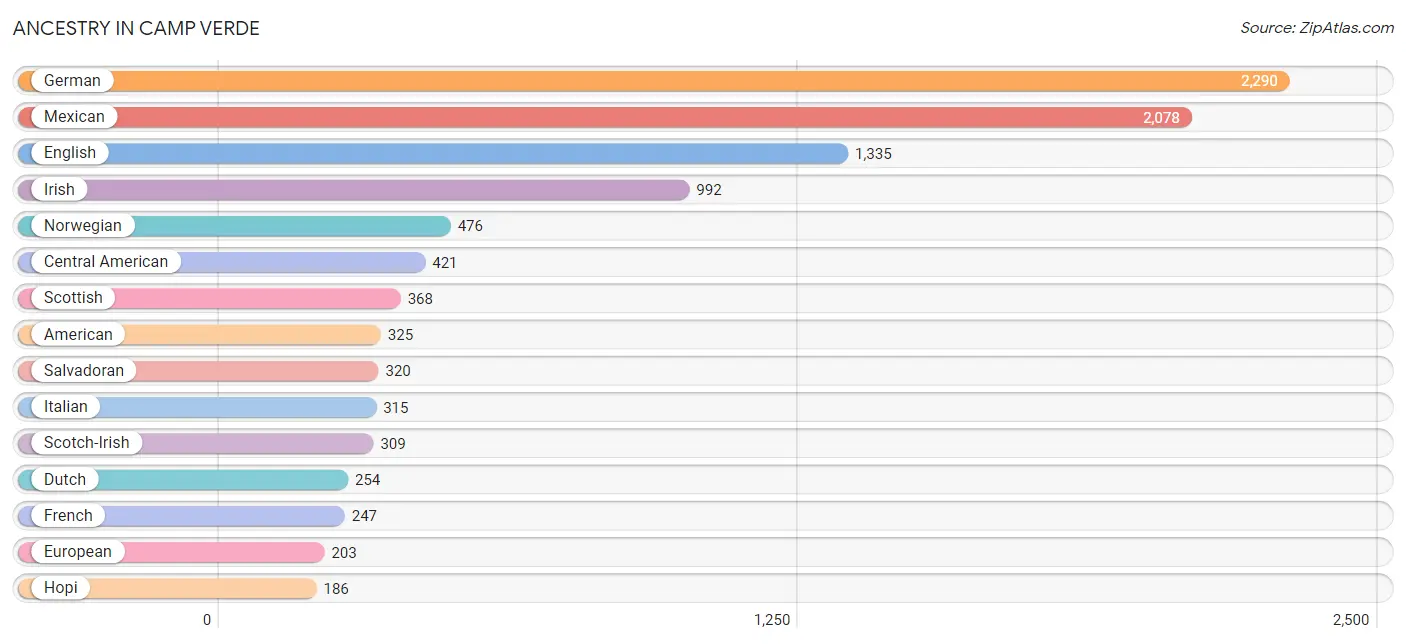
| Ancestry | # Population | % Population |
| American | 325 | 2.7% |
| Apache | 169 | 1.4% |
| Arab | 16 | 0.1% |
| Austrian | 182 | 1.5% |
| Belgian | 24 | 0.2% |
| Blackfeet | 1 | 0.0% |
| British | 36 | 0.3% |
| Burmese | 49 | 0.4% |
| Canadian | 30 | 0.3% |
| Central American | 421 | 3.5% |
| Cherokee | 44 | 0.4% |
| Choctaw | 35 | 0.3% |
| Costa Rican | 21 | 0.2% |
| Czech | 47 | 0.4% |
| Danish | 18 | 0.2% |
| Dutch | 254 | 2.1% |
| Eastern European | 30 | 0.3% |
| English | 1,335 | 11.0% |
| European | 203 | 1.7% |
| French | 247 | 2.0% |
| French Canadian | 15 | 0.1% |
| German | 2,290 | 18.9% |
| Guatemalan | 37 | 0.3% |
| Guyanese | 6 | 0.1% |
| Hopi | 186 | 1.5% |
| Hungarian | 24 | 0.2% |
| Icelander | 20 | 0.2% |
| Indian (Asian) | 18 | 0.2% |
| Irish | 992 | 8.2% |
| Italian | 315 | 2.6% |
| Korean | 27 | 0.2% |
| Laotian | 16 | 0.1% |
| Lithuanian | 27 | 0.2% |
| Maltese | 6 | 0.1% |
| Mexican | 2,078 | 17.1% |
| Navajo | 53 | 0.4% |
| Northern European | 9 | 0.1% |
| Norwegian | 476 | 3.9% |
| Panamanian | 43 | 0.4% |
| Pennsylvania German | 11 | 0.1% |
| Pima | 13 | 0.1% |
| Polish | 113 | 0.9% |
| Portuguese | 101 | 0.8% |
| Potawatomi | 15 | 0.1% |
| Pueblo | 1 | 0.0% |
| Puerto Rican | 2 | 0.0% |
| Russian | 19 | 0.2% |
| Salvadoran | 320 | 2.6% |
| Scandinavian | 49 | 0.4% |
| Scotch-Irish | 309 | 2.5% |
| Scottish | 368 | 3.0% |
| Slovak | 19 | 0.2% |
| Spaniard | 111 | 0.9% |
| Spanish | 119 | 1.0% |
| Swedish | 148 | 1.2% |
| Swiss | 28 | 0.2% |
| Thai | 6 | 0.1% |
| Welsh | 100 | 0.8% |
| Yaqui | 24 | 0.2% |
| Yuman | 57 | 0.5% | View All 60 Rows |
Immigrants in Camp Verde
The most numerous immigrant groups reported in Camp Verde came from Central America (612 | 5.0%), Latin America (612 | 5.0%), Mexico (410 | 3.4%), El Salvador (156 | 1.3%), and Europe (89 | 0.7%), together accounting for 15.5% of all Camp Verde residents.
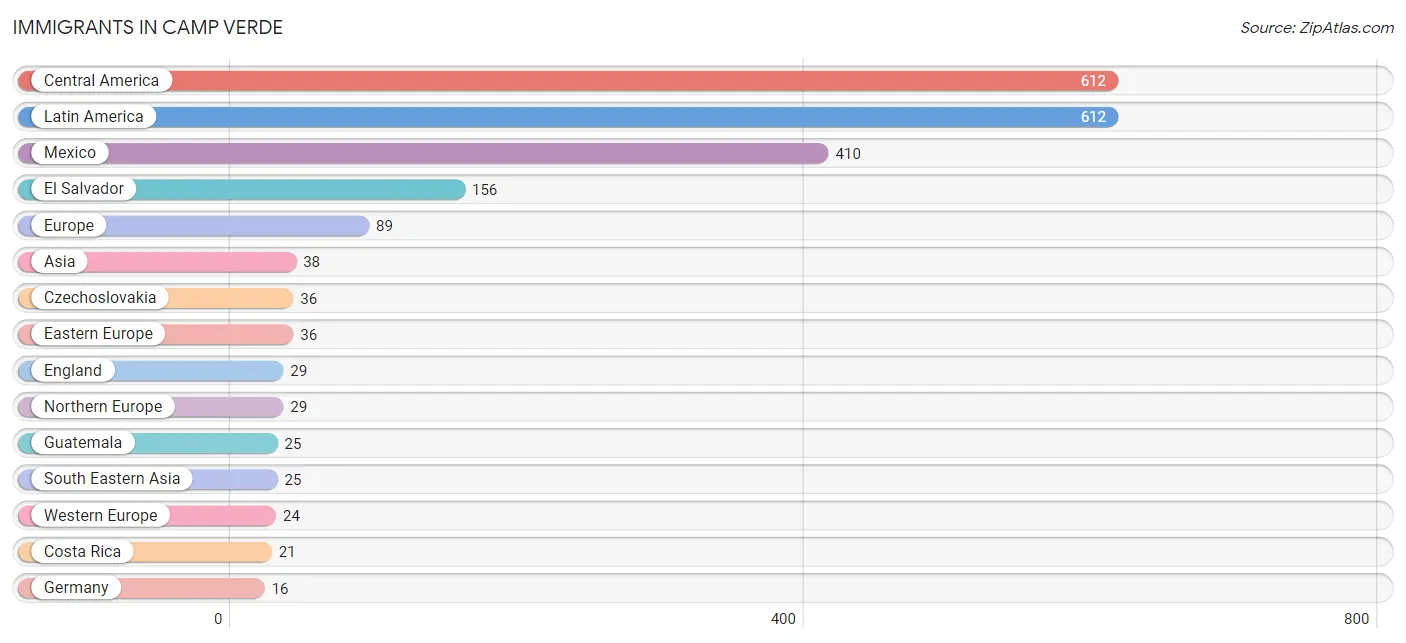
| Immigration Origin | # Population | % Population |
| Asia | 38 | 0.3% |
| Central America | 612 | 5.0% |
| Costa Rica | 21 | 0.2% |
| Czechoslovakia | 36 | 0.3% |
| Eastern Asia | 13 | 0.1% |
| Eastern Europe | 36 | 0.3% |
| El Salvador | 156 | 1.3% |
| England | 29 | 0.2% |
| Europe | 89 | 0.7% |
| Germany | 16 | 0.1% |
| Guatemala | 25 | 0.2% |
| Indonesia | 16 | 0.1% |
| Korea | 13 | 0.1% |
| Latin America | 612 | 5.0% |
| Mexico | 410 | 3.4% |
| Netherlands | 8 | 0.1% |
| Northern Europe | 29 | 0.2% |
| Philippines | 9 | 0.1% |
| South Eastern Asia | 25 | 0.2% |
| Western Europe | 24 | 0.2% | View All 20 Rows |
Sex and Age in Camp Verde
Sex and Age in Camp Verde
The most populous age groups in Camp Verde are 10 to 14 Years (588 | 9.1%) for men and 35 to 39 Years (476 | 8.4%) for women.
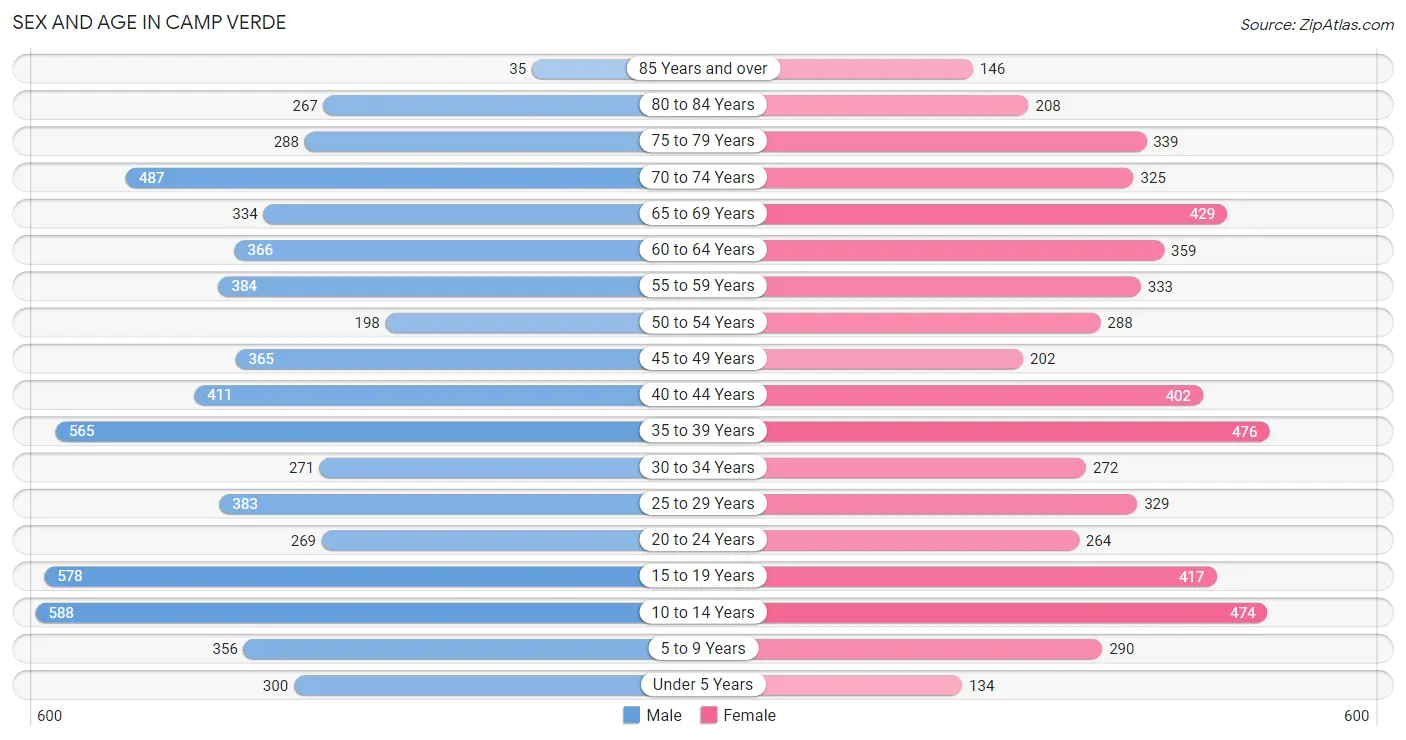
| Age Bracket | Male | Female |
| Under 5 Years | 300 (4.6%) | 134 (2.4%) |
| 5 to 9 Years | 356 (5.5%) | 290 (5.1%) |
| 10 to 14 Years | 588 (9.1%) | 474 (8.3%) |
| 15 to 19 Years | 578 (9.0%) | 417 (7.3%) |
| 20 to 24 Years | 269 (4.2%) | 264 (4.6%) |
| 25 to 29 Years | 383 (5.9%) | 329 (5.8%) |
| 30 to 34 Years | 271 (4.2%) | 272 (4.8%) |
| 35 to 39 Years | 565 (8.8%) | 476 (8.4%) |
| 40 to 44 Years | 411 (6.4%) | 402 (7.1%) |
| 45 to 49 Years | 365 (5.7%) | 202 (3.5%) |
| 50 to 54 Years | 198 (3.1%) | 288 (5.1%) |
| 55 to 59 Years | 384 (6.0%) | 333 (5.9%) |
| 60 to 64 Years | 366 (5.7%) | 359 (6.3%) |
| 65 to 69 Years | 334 (5.2%) | 429 (7.5%) |
| 70 to 74 Years | 487 (7.6%) | 325 (5.7%) |
| 75 to 79 Years | 288 (4.5%) | 339 (6.0%) |
| 80 to 84 Years | 267 (4.1%) | 208 (3.7%) |
| 85 Years and over | 35 (0.5%) | 146 (2.6%) |
| Total | 6,445 (100.0%) | 5,687 (100.0%) |
Families and Households in Camp Verde
Median Family Size in Camp Verde
The median family size in Camp Verde is 3.11 persons per family, with single female/mother families (695 | 24.6%) accounting for the largest median family size of 3.36 persons per family. On the other hand, single male/father families (297 | 10.5%) represent the smallest median family size with 1.97 persons per family.
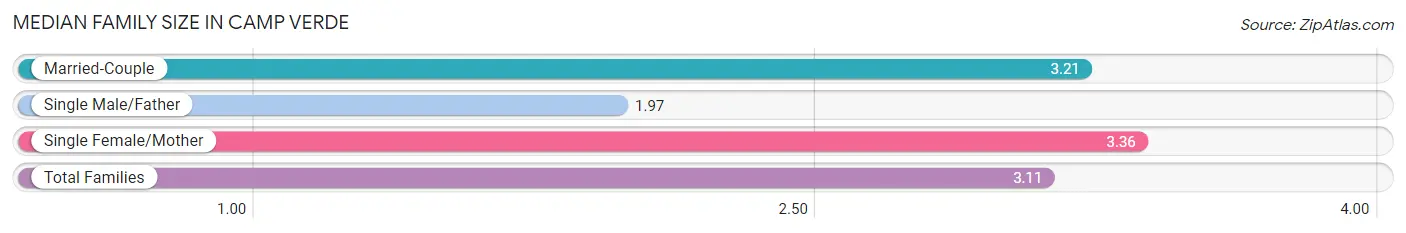
| Family Type | # Families | Family Size |
| Married-Couple | 1,829 (64.8%) | 3.21 |
| Single Male/Father | 297 (10.5%) | 1.97 |
| Single Female/Mother | 695 (24.6%) | 3.36 |
| Total Families | 2,821 (100.0%) | 3.11 |
Median Household Size in Camp Verde
The median household size in Camp Verde is 2.62 persons per household, with single female/mother households (695 | 16.0%) accounting for the largest median household size of 3.73 persons per household. non-family households (1,522 | 35.0%) represent the smallest median household size with 1.27 persons per household.
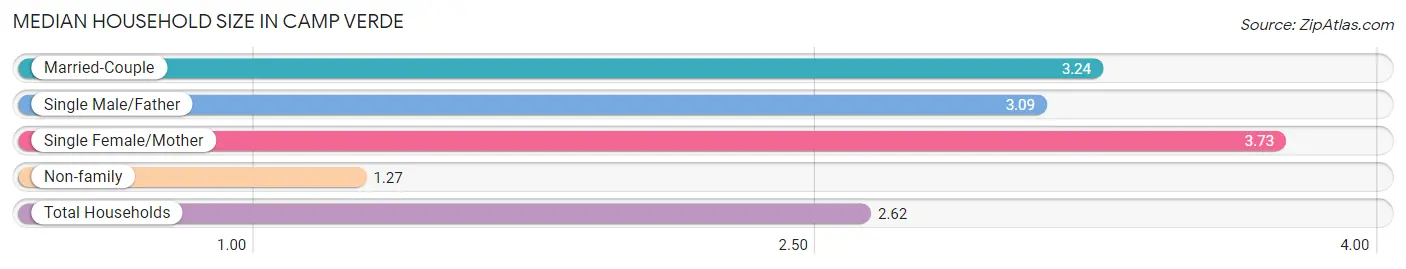
| Household Type | # Households | Household Size |
| Married-Couple | 1,829 (42.1%) | 3.24 |
| Single Male/Father | 297 (6.8%) | 3.09 |
| Single Female/Mother | 695 (16.0%) | 3.73 |
| Non-family | 1,522 (35.0%) | 1.27 |
| Total Households | 4,343 (100.0%) | 2.62 |
Household Size by Marriage Status in Camp Verde
Out of a total of 4,343 households in Camp Verde, 2,821 (65.0%) are family households, while 1,522 (35.0%) are nonfamily households. The most numerous type of family households are 2-person households, comprising 1,136, and the most common type of nonfamily households are 1-person households, comprising 1,160.
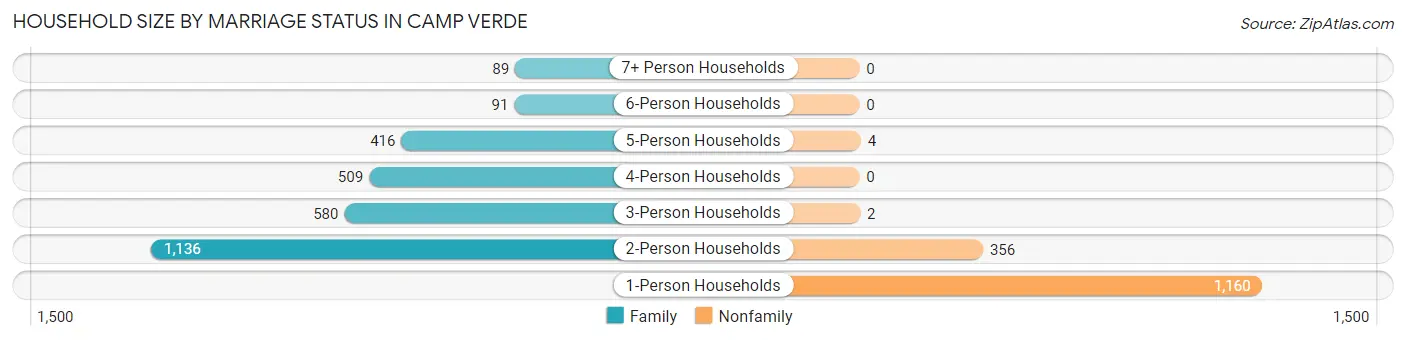
| Household Size | Family Households | Nonfamily Households |
| 1-Person Households | - | 1,160 (26.7%) |
| 2-Person Households | 1,136 (26.2%) | 356 (8.2%) |
| 3-Person Households | 580 (13.4%) | 2 (0.1%) |
| 4-Person Households | 509 (11.7%) | 0 (0.0%) |
| 5-Person Households | 416 (9.6%) | 4 (0.1%) |
| 6-Person Households | 91 (2.1%) | 0 (0.0%) |
| 7+ Person Households | 89 (2.1%) | 0 (0.0%) |
| Total | 2,821 (65.0%) | 1,522 (35.0%) |
Female Fertility in Camp Verde
Fertility by Age in Camp Verde
Average fertility rate in Camp Verde is 30.0 births per 1,000 women. Women in the age bracket of 20 to 34 years have the highest fertility rate with 58.0 births per 1,000 women. Women in the age bracket of 20 to 34 years acount for 66.7% of all women with births.
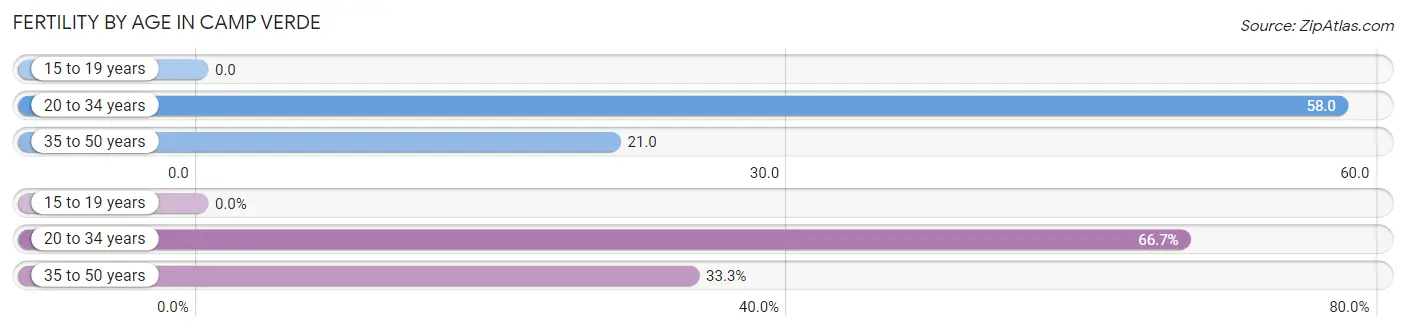
| Age Bracket | Women with Births | Births / 1,000 Women |
| 15 to 19 years | 0 (0.0%) | 0.0 |
| 20 to 34 years | 50 (66.7%) | 58.0 |
| 35 to 50 years | 25 (33.3%) | 21.0 |
| Total | 75 (100.0%) | 30.0 |
Fertility by Age by Marriage Status in Camp Verde
69.3% of women with births (75) in Camp Verde are married. The highest percentage of unmarried women with births falls into 20 to 34 years age bracket with 46.0% of them unmarried at the time of birth, while the lowest percentage of unmarried women with births belong to 35 to 50 years age bracket with 0.0% of them unmarried.
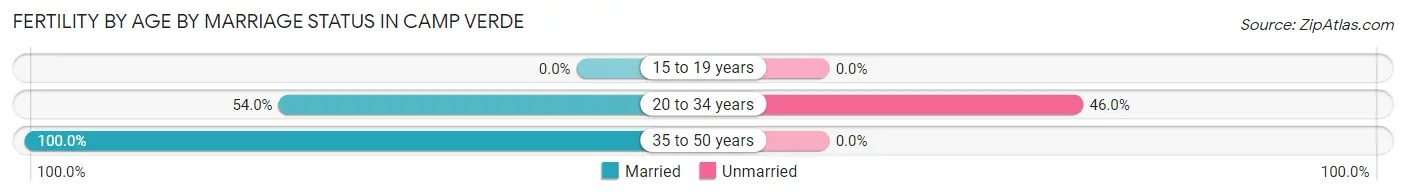
| Age Bracket | Married | Unmarried |
| 15 to 19 years | 0 (0.0%) | 0 (0.0%) |
| 20 to 34 years | 27 (54.0%) | 23 (46.0%) |
| 35 to 50 years | 25 (100.0%) | 0 (0.0%) |
| Total | 52 (69.3%) | 23 (30.7%) |
Fertility by Education in Camp Verde
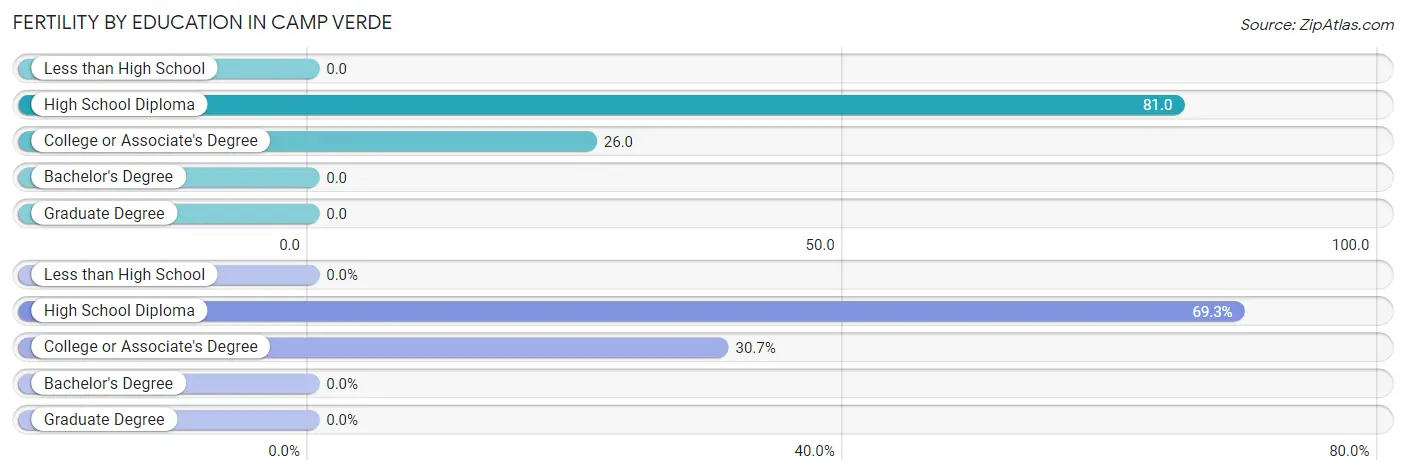
| Educational Attainment | Women with Births | Births / 1,000 Women |
| Less than High School | 0 (0.0%) | 0.0 |
| High School Diploma | 52 (69.3%) | 81.0 |
| College or Associate's Degree | 23 (30.7%) | 26.0 |
| Bachelor's Degree | 0 (0.0%) | 0.0 |
| Graduate Degree | 0 (0.0%) | 0.0 |
| Total | 75 (100.0%) | 30.0 |
Fertility by Education by Marriage Status in Camp Verde
30.7% of women with births in Camp Verde are unmarried. Women with the educational attainment of high school diploma are most likely to be married with 76.9% of them married at childbirth, while women with the educational attainment of college or associate's degree are least likely to be married with 47.8% of them unmarried at childbirth.
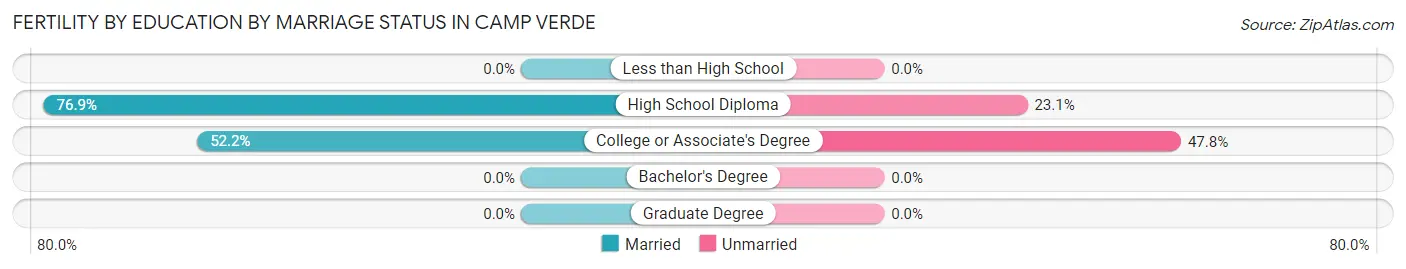
| Educational Attainment | Married | Unmarried |
| Less than High School | 0 (0.0%) | 0 (0.0%) |
| High School Diploma | 40 (76.9%) | 12 (23.1%) |
| College or Associate's Degree | 12 (52.2%) | 11 (47.8%) |
| Bachelor's Degree | 0 (0.0%) | 0 (0.0%) |
| Graduate Degree | 0 (0.0%) | 0 (0.0%) |
| Total | 52 (69.3%) | 23 (30.7%) |
Employment Characteristics in Camp Verde
Employment by Class of Employer in Camp Verde
Among the 4,648 employed individuals in Camp Verde, private company employees (3,268 | 70.3%), local government employees (339 | 7.3%), and self-employed (not incorporated) (304 | 6.5%) make up the most common classes of employment.
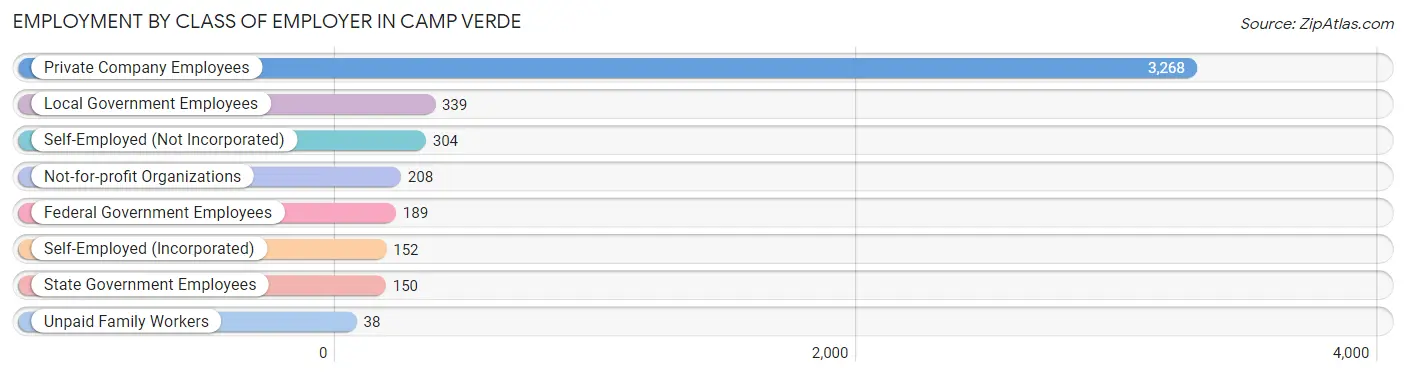
| Employer Class | # Employees | % Employees |
| Private Company Employees | 3,268 | 70.3% |
| Self-Employed (Incorporated) | 152 | 3.3% |
| Self-Employed (Not Incorporated) | 304 | 6.5% |
| Not-for-profit Organizations | 208 | 4.5% |
| Local Government Employees | 339 | 7.3% |
| State Government Employees | 150 | 3.2% |
| Federal Government Employees | 189 | 4.1% |
| Unpaid Family Workers | 38 | 0.8% |
| Total | 4,648 | 100.0% |
Employment Status by Age in Camp Verde
According to the labor force statistics for Camp Verde, out of the total population over 16 years of age (9,768), 50.9% or 4,972 individuals are in the labor force, with 5.4% or 268 of them unemployed. The age group with the highest labor force participation rate is 35 to 44 years, with 86.7% or 1,607 individuals in the labor force. Within the labor force, the 30 to 34 years age range has the highest percentage of unemployed individuals, with 10.8% or 37 of them being unemployed.
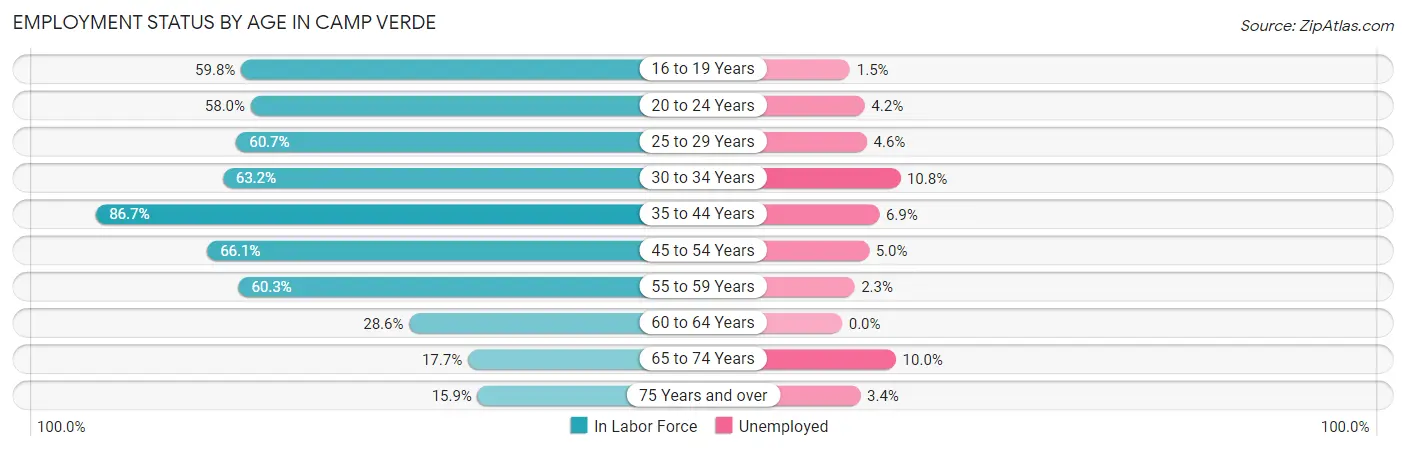
| Age Bracket | In Labor Force | Unemployed |
| 16 to 19 Years | 462 (59.8%) | 7 (1.5%) |
| 20 to 24 Years | 309 (58.0%) | 13 (4.2%) |
| 25 to 29 Years | 432 (60.7%) | 20 (4.6%) |
| 30 to 34 Years | 343 (63.2%) | 37 (10.8%) |
| 35 to 44 Years | 1,607 (86.7%) | 111 (6.9%) |
| 45 to 54 Years | 696 (66.1%) | 35 (5.0%) |
| 55 to 59 Years | 432 (60.3%) | 10 (2.3%) |
| 60 to 64 Years | 207 (28.6%) | 0 (0.0%) |
| 65 to 74 Years | 279 (17.7%) | 28 (10.0%) |
| 75 Years and over | 204 (15.9%) | 7 (3.4%) |
| Total | 4,972 (50.9%) | 268 (5.4%) |
Employment Status by Educational Attainment in Camp Verde
According to labor force statistics for Camp Verde, 66.3% of individuals (3,715) out of the total population between 25 and 64 years of age (5,604) are in the labor force, with 5.7% or 212 of them being unemployed. The group with the highest labor force participation rate are those with the educational attainment of college / associate degree, with 70.1% or 1,353 individuals in the labor force. Within the labor force, individuals with college / associate degree education have the highest percentage of unemployment, with 7.8% or 106 of them being unemployed.
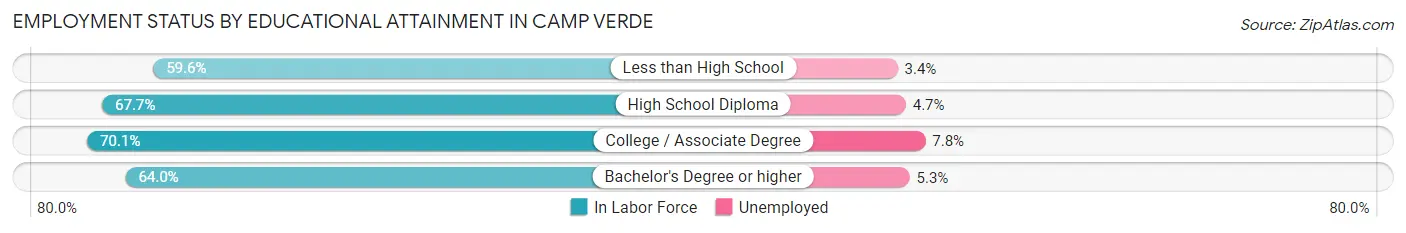
| Educational Attainment | In Labor Force | Unemployed |
| Less than High School | 645 (59.6%) | 37 (3.4%) |
| High School Diploma | 1,138 (67.7%) | 79 (4.7%) |
| College / Associate Degree | 1,353 (70.1%) | 151 (7.8%) |
| Bachelor's Degree or higher | 582 (64.0%) | 48 (5.3%) |
| Total | 3,715 (66.3%) | 319 (5.7%) |
Employment Occupations by Sex in Camp Verde
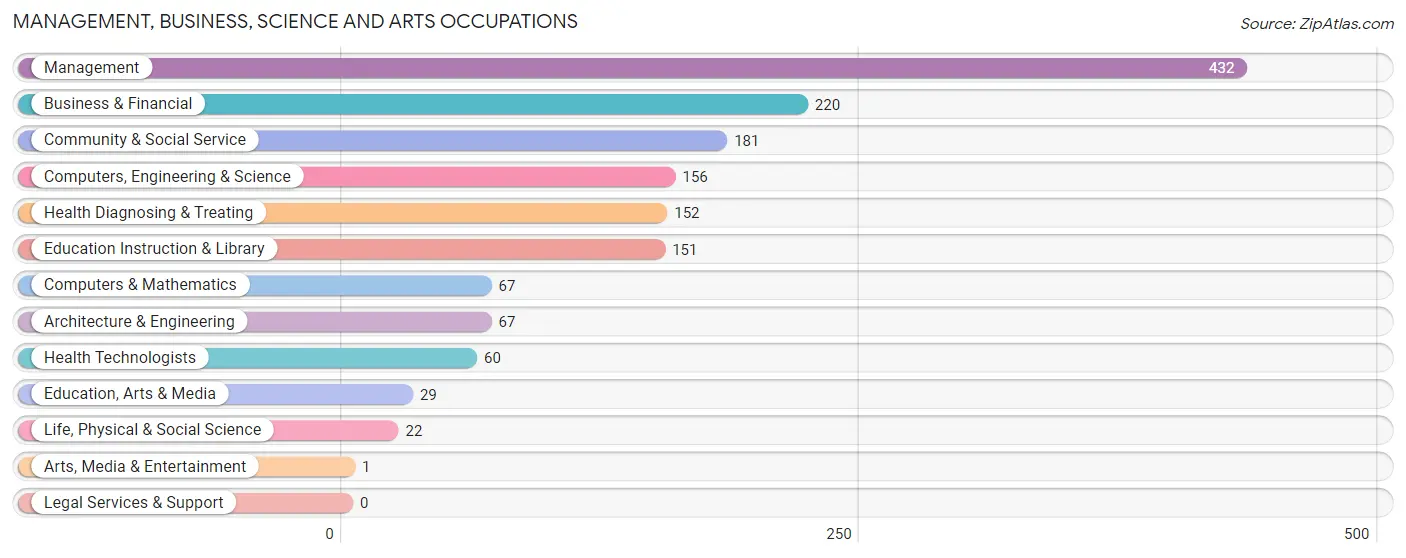
Management, Business, Science and Arts Occupations
The most common Management, Business, Science and Arts occupations in Camp Verde are Management (432 | 9.2%), Business & Financial (220 | 4.7%), Community & Social Service (181 | 3.8%), Computers, Engineering & Science (156 | 3.3%), and Health Diagnosing & Treating (152 | 3.2%).
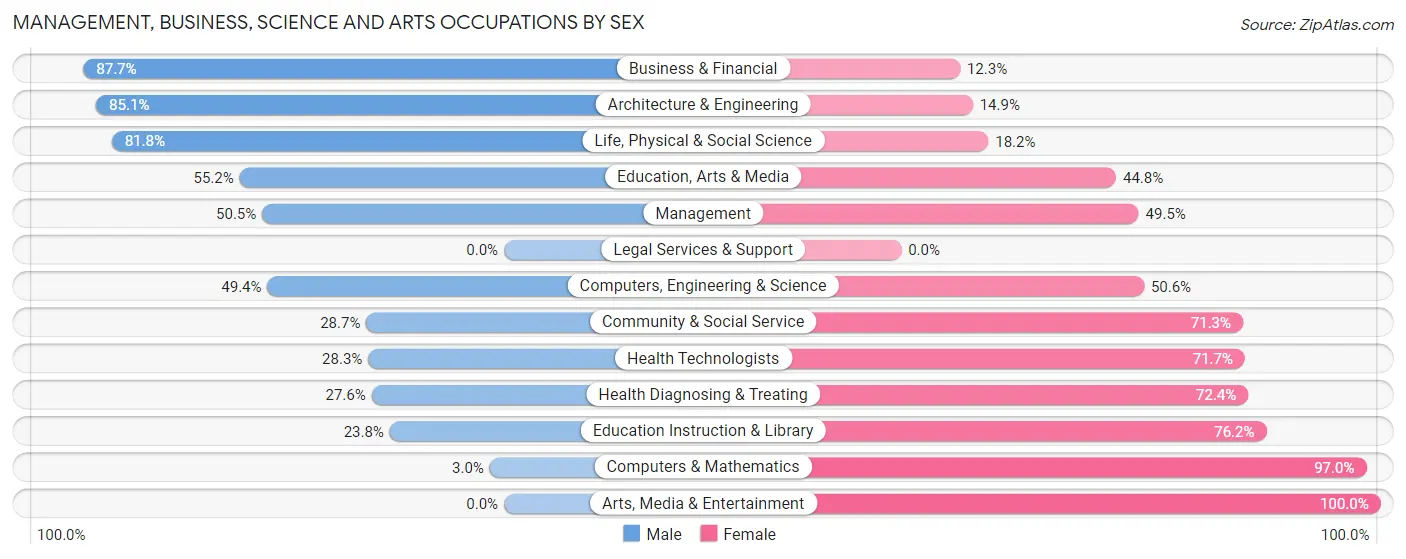
Management, Business, Science and Arts Occupations by Sex
Within the Management, Business, Science and Arts occupations in Camp Verde, the most male-oriented occupations are Business & Financial (87.7%), Architecture & Engineering (85.1%), and Life, Physical & Social Science (81.8%), while the most female-oriented occupations are Arts, Media & Entertainment (100.0%), Computers & Mathematics (97.0%), and Education Instruction & Library (76.2%).
| Occupation | Male | Female |
| Management | 218 (50.5%) | 214 (49.5%) |
| Business & Financial | 193 (87.7%) | 27 (12.3%) |
| Computers, Engineering & Science | 77 (49.4%) | 79 (50.6%) |
| Computers & Mathematics | 2 (3.0%) | 65 (97.0%) |
| Architecture & Engineering | 57 (85.1%) | 10 (14.9%) |
| Life, Physical & Social Science | 18 (81.8%) | 4 (18.2%) |
| Community & Social Service | 52 (28.7%) | 129 (71.3%) |
| Education, Arts & Media | 16 (55.2%) | 13 (44.8%) |
| Legal Services & Support | 0 (0.0%) | 0 (0.0%) |
| Education Instruction & Library | 36 (23.8%) | 115 (76.2%) |
| Arts, Media & Entertainment | 0 (0.0%) | 1 (100.0%) |
| Health Diagnosing & Treating | 42 (27.6%) | 110 (72.4%) |
| Health Technologists | 17 (28.3%) | 43 (71.7%) |
| Total (Category) | 582 (51.0%) | 559 (49.0%) |
| Total (Overall) | 2,678 (56.9%) | 2,025 (43.1%) |
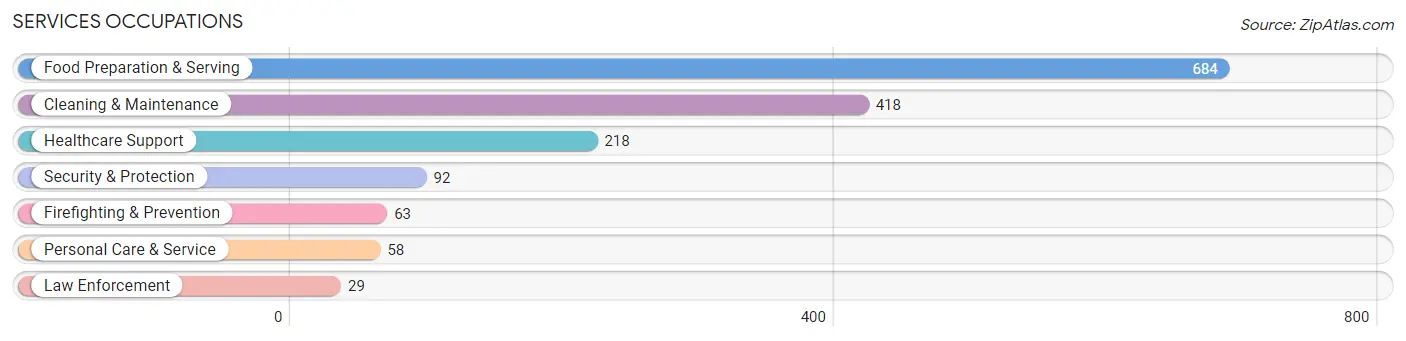
Services Occupations
The most common Services occupations in Camp Verde are Food Preparation & Serving (684 | 14.5%), Cleaning & Maintenance (418 | 8.9%), Healthcare Support (218 | 4.6%), Security & Protection (92 | 2.0%), and Firefighting & Prevention (63 | 1.3%).
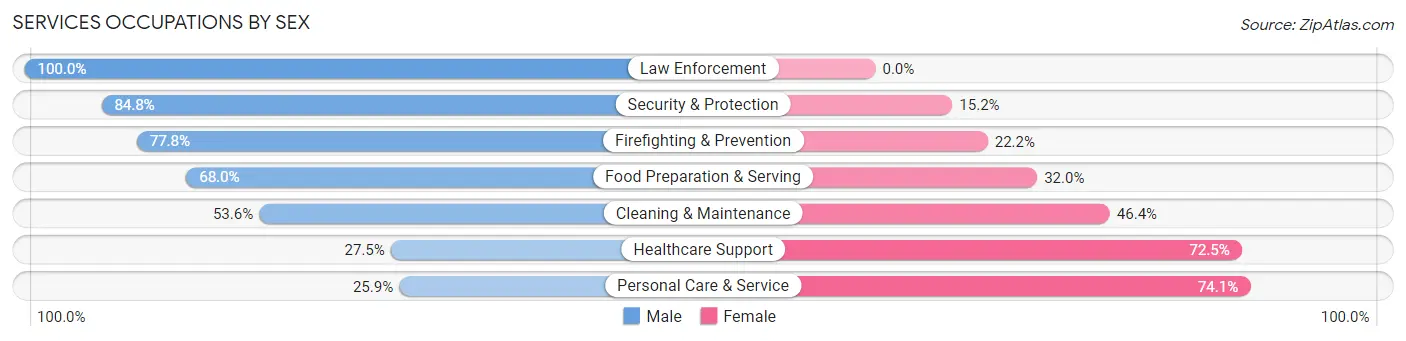
Services Occupations by Sex
Within the Services occupations in Camp Verde, the most male-oriented occupations are Law Enforcement (100.0%), Security & Protection (84.8%), and Firefighting & Prevention (77.8%), while the most female-oriented occupations are Personal Care & Service (74.1%), Healthcare Support (72.5%), and Cleaning & Maintenance (46.4%).
| Occupation | Male | Female |
| Healthcare Support | 60 (27.5%) | 158 (72.5%) |
| Security & Protection | 78 (84.8%) | 14 (15.2%) |
| Firefighting & Prevention | 49 (77.8%) | 14 (22.2%) |
| Law Enforcement | 29 (100.0%) | 0 (0.0%) |
| Food Preparation & Serving | 465 (68.0%) | 219 (32.0%) |
| Cleaning & Maintenance | 224 (53.6%) | 194 (46.4%) |
| Personal Care & Service | 15 (25.9%) | 43 (74.1%) |
| Total (Category) | 842 (57.3%) | 628 (42.7%) |
| Total (Overall) | 2,678 (56.9%) | 2,025 (43.1%) |
Sales and Office Occupations
The most common Sales and Office occupations in Camp Verde are Sales & Related (774 | 16.5%), and Office & Administration (503 | 10.7%).

Sales and Office Occupations by Sex

| Occupation | Male | Female |
| Sales & Related | 428 (55.3%) | 346 (44.7%) |
| Office & Administration | 90 (17.9%) | 413 (82.1%) |
| Total (Category) | 518 (40.6%) | 759 (59.4%) |
| Total (Overall) | 2,678 (56.9%) | 2,025 (43.1%) |
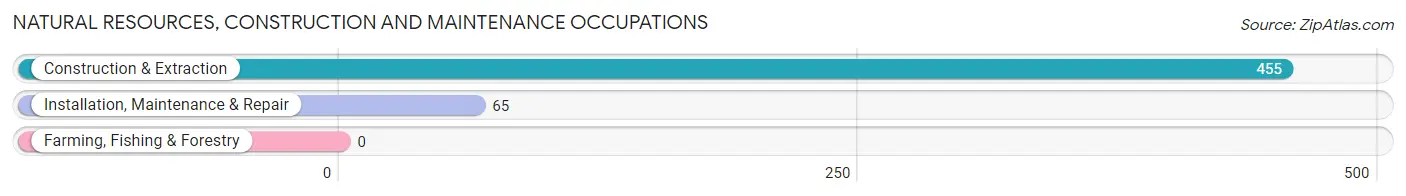
Natural Resources, Construction and Maintenance Occupations
The most common Natural Resources, Construction and Maintenance occupations in Camp Verde are Construction & Extraction (455 | 9.7%), and Installation, Maintenance & Repair (65 | 1.4%).
Natural Resources, Construction and Maintenance Occupations by Sex
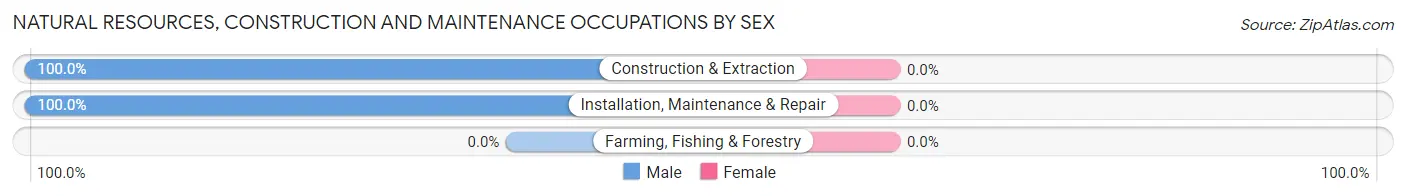
| Occupation | Male | Female |
| Farming, Fishing & Forestry | 0 (0.0%) | 0 (0.0%) |
| Construction & Extraction | 455 (100.0%) | 0 (0.0%) |
| Installation, Maintenance & Repair | 65 (100.0%) | 0 (0.0%) |
| Total (Category) | 520 (100.0%) | 0 (0.0%) |
| Total (Overall) | 2,678 (56.9%) | 2,025 (43.1%) |
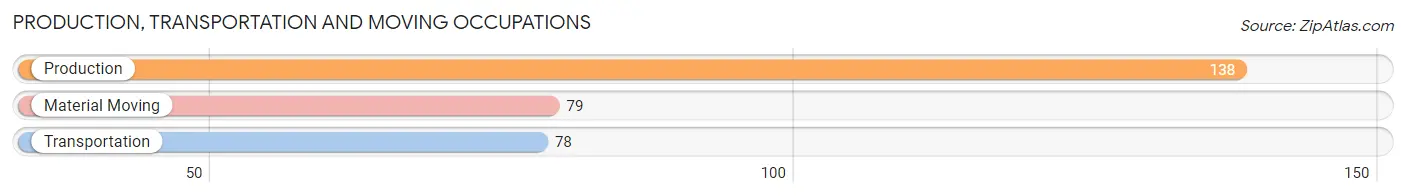
Production, Transportation and Moving Occupations
The most common Production, Transportation and Moving occupations in Camp Verde are Production (138 | 2.9%), Material Moving (79 | 1.7%), and Transportation (78 | 1.7%).
Production, Transportation and Moving Occupations by Sex
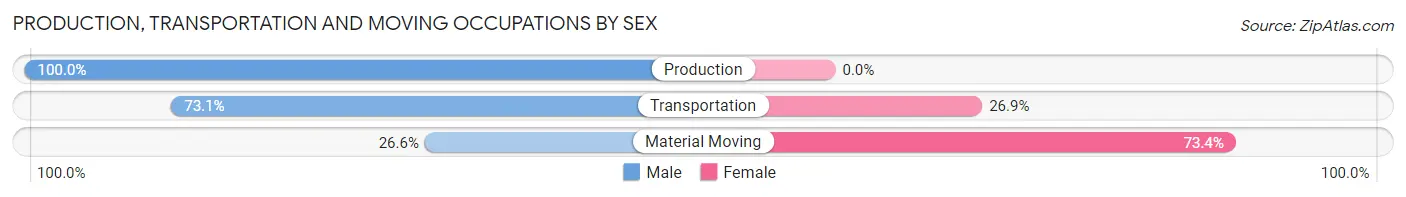
| Occupation | Male | Female |
| Production | 138 (100.0%) | 0 (0.0%) |
| Transportation | 57 (73.1%) | 21 (26.9%) |
| Material Moving | 21 (26.6%) | 58 (73.4%) |
| Total (Category) | 216 (73.2%) | 79 (26.8%) |
| Total (Overall) | 2,678 (56.9%) | 2,025 (43.1%) |
Employment Industries by Sex in Camp Verde
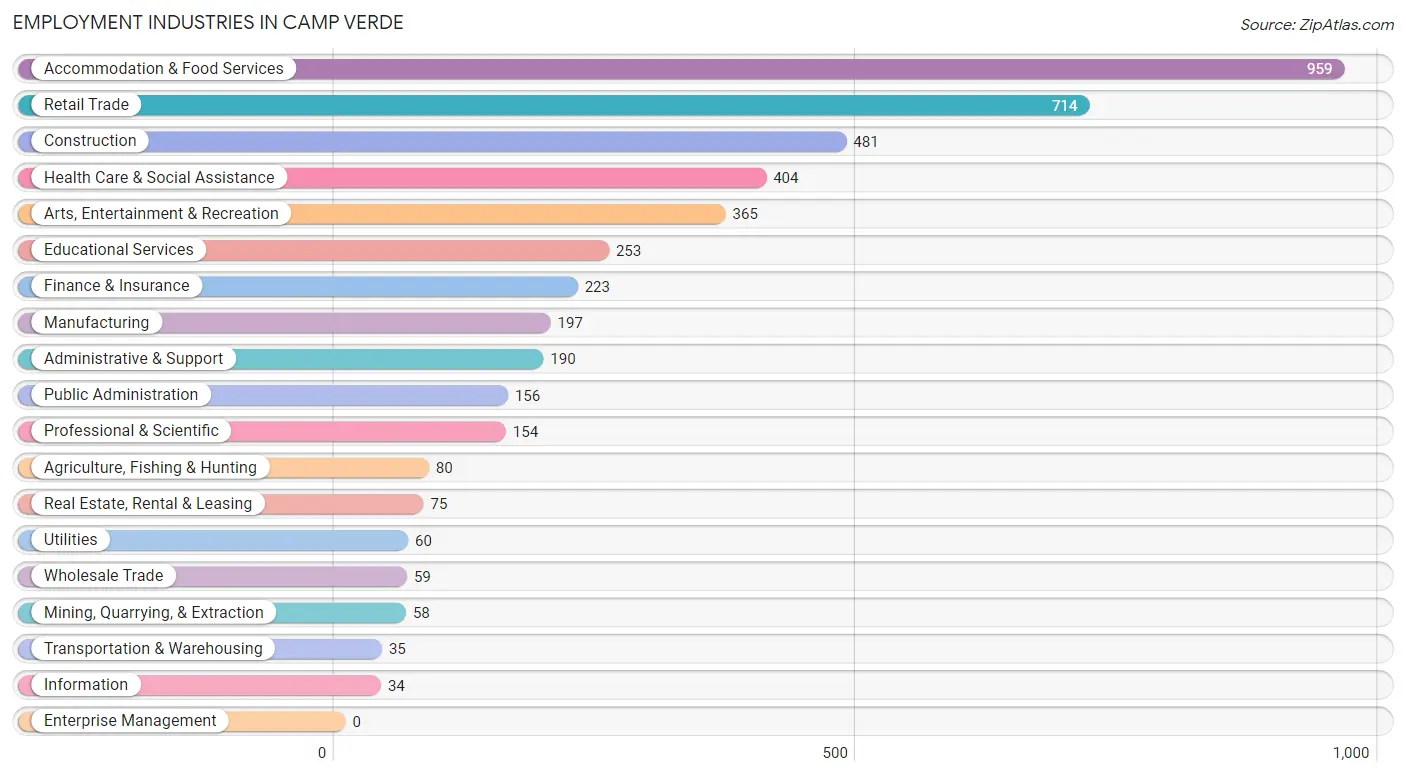
Employment Industries in Camp Verde
The major employment industries in Camp Verde include Accommodation & Food Services (959 | 20.4%), Retail Trade (714 | 15.2%), Construction (481 | 10.2%), Health Care & Social Assistance (404 | 8.6%), and Arts, Entertainment & Recreation (365 | 7.8%).
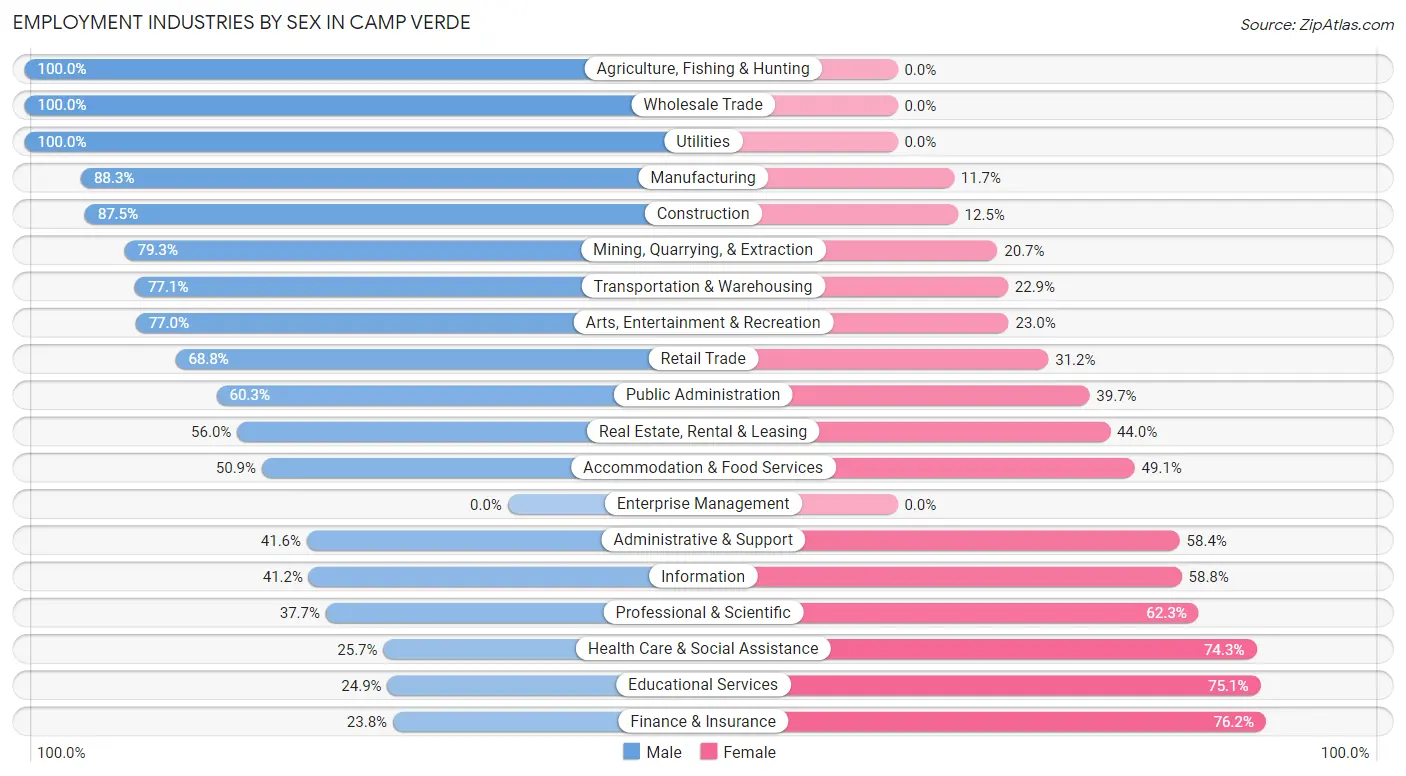
Employment Industries by Sex in Camp Verde
The Camp Verde industries that see more men than women are Agriculture, Fishing & Hunting (100.0%), Wholesale Trade (100.0%), and Utilities (100.0%), whereas the industries that tend to have a higher number of women are Finance & Insurance (76.2%), Educational Services (75.1%), and Health Care & Social Assistance (74.3%).
| Industry | Male | Female |
| Agriculture, Fishing & Hunting | 80 (100.0%) | 0 (0.0%) |
| Mining, Quarrying, & Extraction | 46 (79.3%) | 12 (20.7%) |
| Construction | 421 (87.5%) | 60 (12.5%) |
| Manufacturing | 174 (88.3%) | 23 (11.7%) |
| Wholesale Trade | 59 (100.0%) | 0 (0.0%) |
| Retail Trade | 491 (68.8%) | 223 (31.2%) |
| Transportation & Warehousing | 27 (77.1%) | 8 (22.9%) |
| Utilities | 60 (100.0%) | 0 (0.0%) |
| Information | 14 (41.2%) | 20 (58.8%) |
| Finance & Insurance | 53 (23.8%) | 170 (76.2%) |
| Real Estate, Rental & Leasing | 42 (56.0%) | 33 (44.0%) |
| Professional & Scientific | 58 (37.7%) | 96 (62.3%) |
| Enterprise Management | 0 (0.0%) | 0 (0.0%) |
| Administrative & Support | 79 (41.6%) | 111 (58.4%) |
| Educational Services | 63 (24.9%) | 190 (75.1%) |
| Health Care & Social Assistance | 104 (25.7%) | 300 (74.3%) |
| Arts, Entertainment & Recreation | 281 (77.0%) | 84 (23.0%) |
| Accommodation & Food Services | 488 (50.9%) | 471 (49.1%) |
| Public Administration | 94 (60.3%) | 62 (39.7%) |
| Total | 2,678 (56.9%) | 2,025 (43.1%) |
Education in Camp Verde
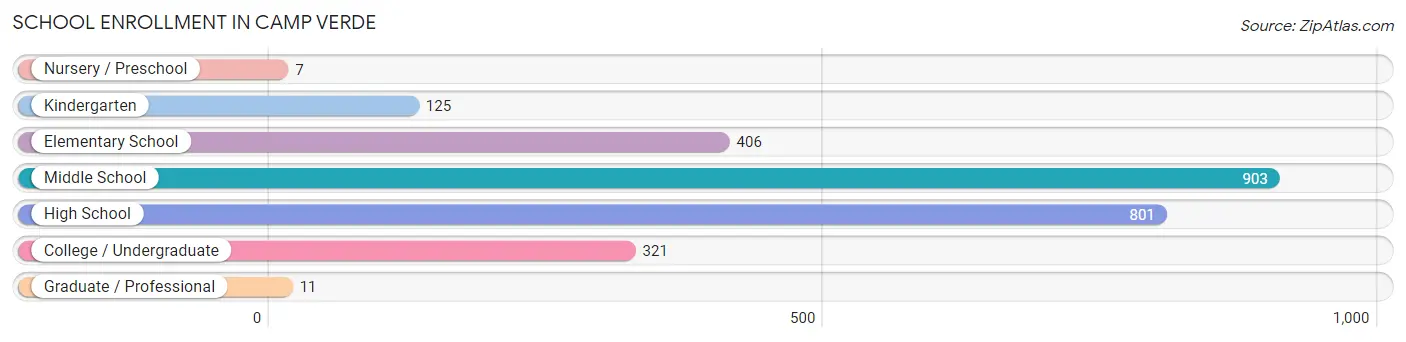
School Enrollment in Camp Verde
The most common levels of schooling among the 2,574 students in Camp Verde are middle school (903 | 35.1%), high school (801 | 31.1%), and elementary school (406 | 15.8%).
| School Level | # Students | % Students |
| Nursery / Preschool | 7 | 0.3% |
| Kindergarten | 125 | 4.9% |
| Elementary School | 406 | 15.8% |
| Middle School | 903 | 35.1% |
| High School | 801 | 31.1% |
| College / Undergraduate | 321 | 12.5% |
| Graduate / Professional | 11 | 0.4% |
| Total | 2,574 | 100.0% |
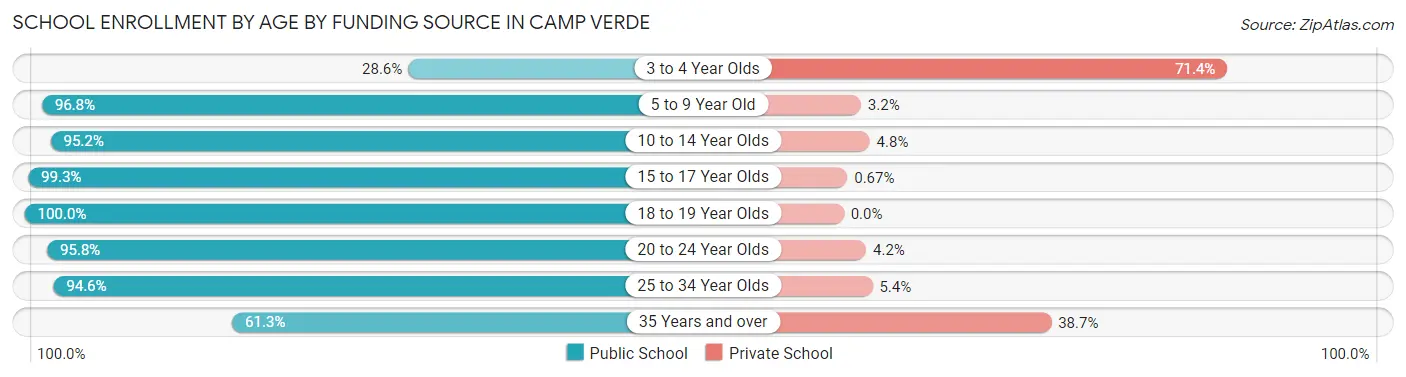
School Enrollment by Age by Funding Source in Camp Verde
Out of a total of 2,574 students who are enrolled in schools in Camp Verde, 134 (5.2%) attend a private institution, while the remaining 2,440 (94.8%) are enrolled in public schools. The age group of 3 to 4 year olds has the highest likelihood of being enrolled in private schools, with 5 (71.4% in the age bracket) enrolled. Conversely, the age group of 18 to 19 year olds has the lowest likelihood of being enrolled in a private school, with 48 (100.0% in the age bracket) attending a public institution.
| Age Bracket | Public School | Private School |
| 3 to 4 Year Olds | 2 (28.6%) | 5 (71.4%) |
| 5 to 9 Year Old | 512 (96.8%) | 17 (3.2%) |
| 10 to 14 Year Olds | 984 (95.2%) | 50 (4.8%) |
| 15 to 17 Year Olds | 593 (99.3%) | 4 (0.7%) |
| 18 to 19 Year Olds | 48 (100.0%) | 0 (0.0%) |
| 20 to 24 Year Olds | 69 (95.8%) | 3 (4.2%) |
| 25 to 34 Year Olds | 159 (94.6%) | 9 (5.4%) |
| 35 Years and over | 73 (61.3%) | 46 (38.7%) |
| Total | 2,440 (94.8%) | 134 (5.2%) |
Educational Attainment by Field of Study in Camp Verde
Education (307 | 17.3%), science & technology (238 | 13.4%), business (211 | 11.9%), arts & humanities (185 | 10.4%), and bio, nature & agricultural (153 | 8.6%) are the most common fields of study among 1,775 individuals in Camp Verde who have obtained a bachelor's degree or higher.
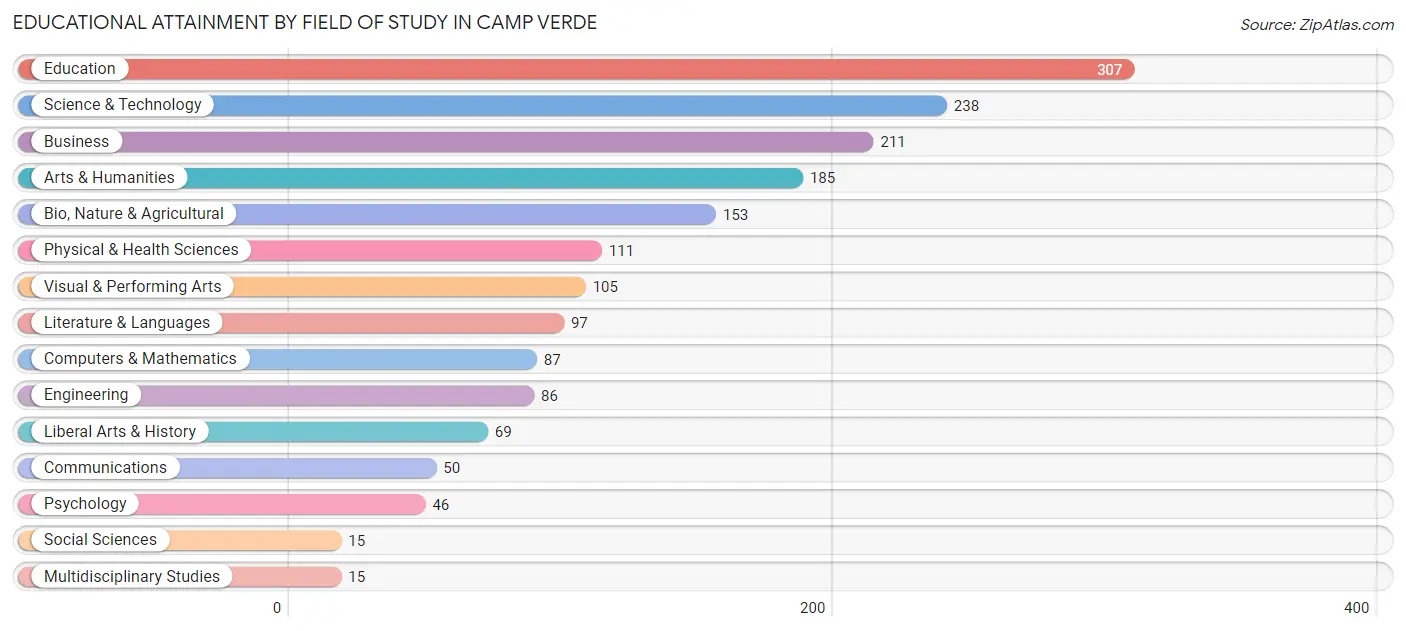
| Field of Study | # Graduates | % Graduates |
| Computers & Mathematics | 87 | 4.9% |
| Bio, Nature & Agricultural | 153 | 8.6% |
| Physical & Health Sciences | 111 | 6.2% |
| Psychology | 46 | 2.6% |
| Social Sciences | 15 | 0.9% |
| Engineering | 86 | 4.9% |
| Multidisciplinary Studies | 15 | 0.9% |
| Science & Technology | 238 | 13.4% |
| Business | 211 | 11.9% |
| Education | 307 | 17.3% |
| Literature & Languages | 97 | 5.5% |
| Liberal Arts & History | 69 | 3.9% |
| Visual & Performing Arts | 105 | 5.9% |
| Communications | 50 | 2.8% |
| Arts & Humanities | 185 | 10.4% |
| Total | 1,775 | 100.0% |
Transportation & Commute in Camp Verde
Vehicle Availability by Sex in Camp Verde
The most prevalent vehicle ownership categories in Camp Verde are males with 2 vehicles (1,125, accounting for 44.9%) and females with 2 vehicles (748, making up 56.6%).
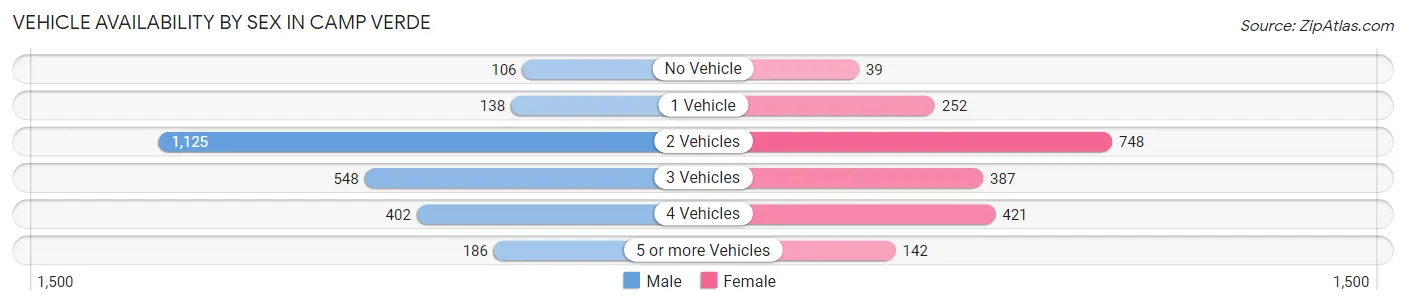
| Vehicles Available | Male | Female |
| No Vehicle | 106 (4.2%) | 39 (2.0%) |
| 1 Vehicle | 138 (5.5%) | 252 (12.7%) |
| 2 Vehicles | 1,125 (44.9%) | 748 (37.6%) |
| 3 Vehicles | 548 (21.9%) | 387 (19.5%) |
| 4 Vehicles | 402 (16.1%) | 421 (21.2%) |
| 5 or more Vehicles | 186 (7.4%) | 142 (7.1%) |
| Total | 2,505 (100.0%) | 1,989 (100.0%) |
Commute Time in Camp Verde
The most frequently occuring commute durations in Camp Verde are 5 to 9 minutes (962 commuters, 23.1%), 15 to 19 minutes (604 commuters, 14.5%), and 20 to 24 minutes (467 commuters, 11.2%).
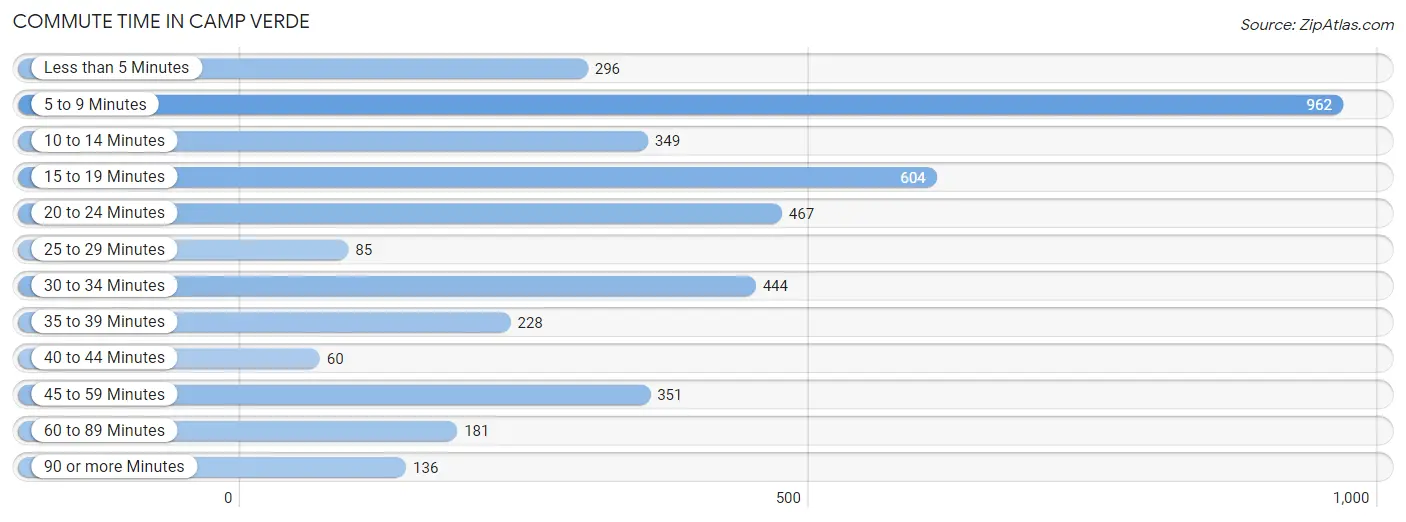
| Commute Time | # Commuters | % Commuters |
| Less than 5 Minutes | 296 | 7.1% |
| 5 to 9 Minutes | 962 | 23.1% |
| 10 to 14 Minutes | 349 | 8.4% |
| 15 to 19 Minutes | 604 | 14.5% |
| 20 to 24 Minutes | 467 | 11.2% |
| 25 to 29 Minutes | 85 | 2.0% |
| 30 to 34 Minutes | 444 | 10.7% |
| 35 to 39 Minutes | 228 | 5.5% |
| 40 to 44 Minutes | 60 | 1.4% |
| 45 to 59 Minutes | 351 | 8.4% |
| 60 to 89 Minutes | 181 | 4.3% |
| 90 or more Minutes | 136 | 3.3% |
Commute Time by Sex in Camp Verde
The most common commute times in Camp Verde are 5 to 9 minutes (566 commuters, 23.7%) for males and 5 to 9 minutes (396 commuters, 22.3%) for females.
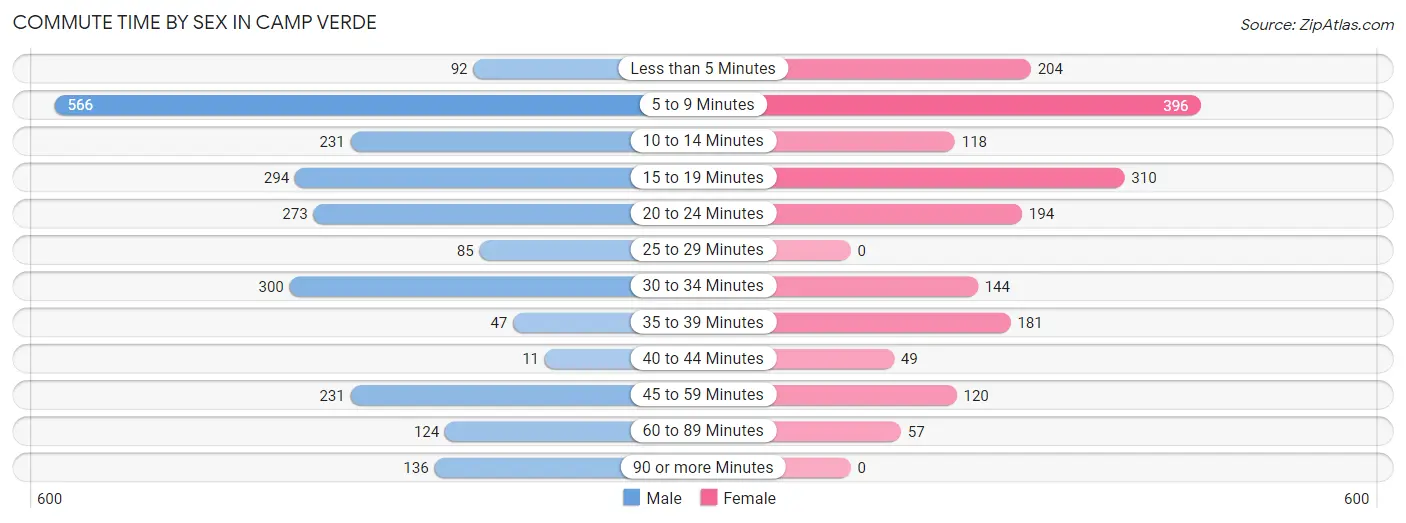
| Commute Time | Male | Female |
| Less than 5 Minutes | 92 (3.8%) | 204 (11.5%) |
| 5 to 9 Minutes | 566 (23.7%) | 396 (22.3%) |
| 10 to 14 Minutes | 231 (9.7%) | 118 (6.7%) |
| 15 to 19 Minutes | 294 (12.3%) | 310 (17.5%) |
| 20 to 24 Minutes | 273 (11.4%) | 194 (10.9%) |
| 25 to 29 Minutes | 85 (3.6%) | 0 (0.0%) |
| 30 to 34 Minutes | 300 (12.6%) | 144 (8.1%) |
| 35 to 39 Minutes | 47 (2.0%) | 181 (10.2%) |
| 40 to 44 Minutes | 11 (0.5%) | 49 (2.8%) |
| 45 to 59 Minutes | 231 (9.7%) | 120 (6.8%) |
| 60 to 89 Minutes | 124 (5.2%) | 57 (3.2%) |
| 90 or more Minutes | 136 (5.7%) | 0 (0.0%) |
Time of Departure to Work by Sex in Camp Verde
The most frequent times of departure to work in Camp Verde are 4:00 PM to 11:59 PM (384, 16.1%) for males and 7:30 AM to 7:59 AM (455, 25.7%) for females.
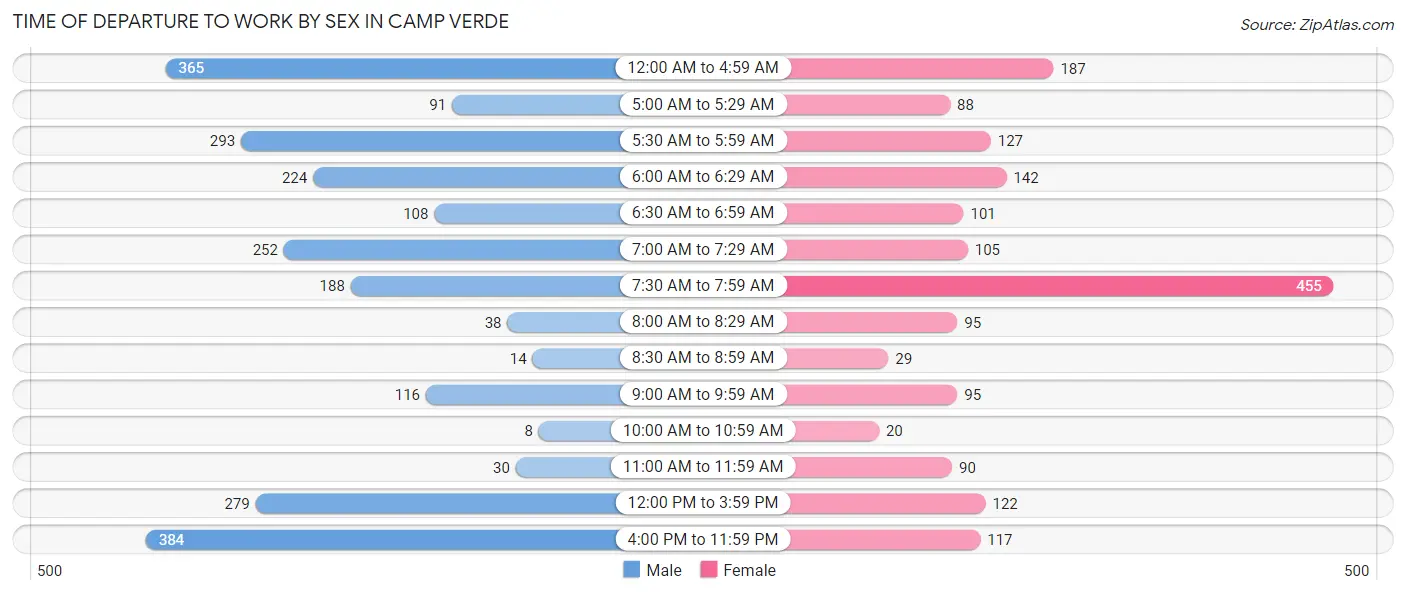
| Time of Departure | Male | Female |
| 12:00 AM to 4:59 AM | 365 (15.3%) | 187 (10.5%) |
| 5:00 AM to 5:29 AM | 91 (3.8%) | 88 (5.0%) |
| 5:30 AM to 5:59 AM | 293 (12.3%) | 127 (7.2%) |
| 6:00 AM to 6:29 AM | 224 (9.4%) | 142 (8.0%) |
| 6:30 AM to 6:59 AM | 108 (4.5%) | 101 (5.7%) |
| 7:00 AM to 7:29 AM | 252 (10.5%) | 105 (5.9%) |
| 7:30 AM to 7:59 AM | 188 (7.9%) | 455 (25.7%) |
| 8:00 AM to 8:29 AM | 38 (1.6%) | 95 (5.4%) |
| 8:30 AM to 8:59 AM | 14 (0.6%) | 29 (1.6%) |
| 9:00 AM to 9:59 AM | 116 (4.9%) | 95 (5.4%) |
| 10:00 AM to 10:59 AM | 8 (0.3%) | 20 (1.1%) |
| 11:00 AM to 11:59 AM | 30 (1.3%) | 90 (5.1%) |
| 12:00 PM to 3:59 PM | 279 (11.7%) | 122 (6.9%) |
| 4:00 PM to 11:59 PM | 384 (16.1%) | 117 (6.6%) |
| Total | 2,390 (100.0%) | 1,773 (100.0%) |
Housing Occupancy in Camp Verde
Occupancy by Ownership in Camp Verde
Of the total 4,343 dwellings in Camp Verde, owner-occupied units account for 3,270 (75.3%), while renter-occupied units make up 1,073 (24.7%).
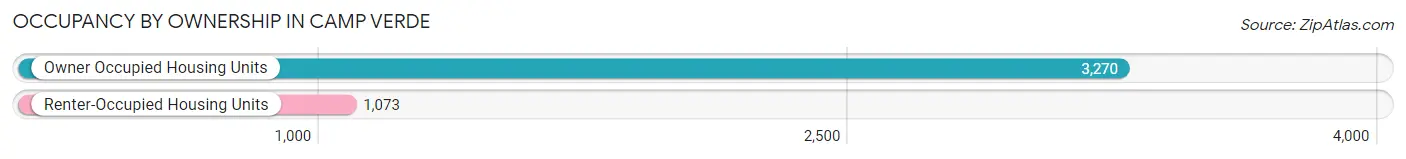
| Occupancy | # Housing Units | % Housing Units |
| Owner Occupied Housing Units | 3,270 | 75.3% |
| Renter-Occupied Housing Units | 1,073 | 24.7% |
| Total Occupied Housing Units | 4,343 | 100.0% |
Occupancy by Household Size in Camp Verde
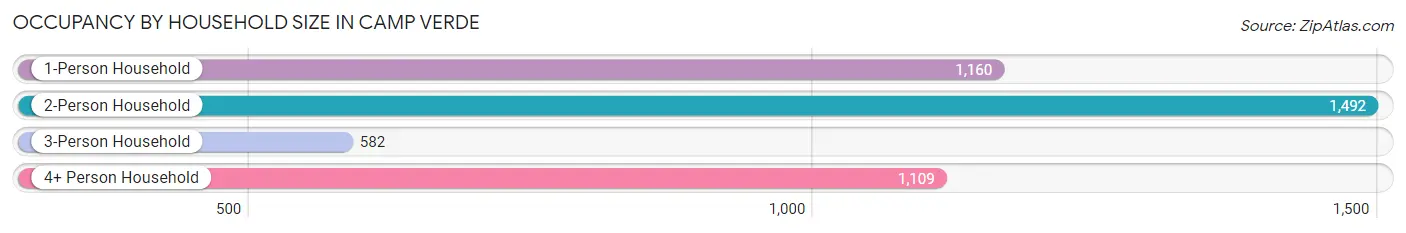
| Household Size | # Housing Units | % Housing Units |
| 1-Person Household | 1,160 | 26.7% |
| 2-Person Household | 1,492 | 34.4% |
| 3-Person Household | 582 | 13.4% |
| 4+ Person Household | 1,109 | 25.5% |
| Total Housing Units | 4,343 | 100.0% |
Occupancy by Ownership by Household Size in Camp Verde
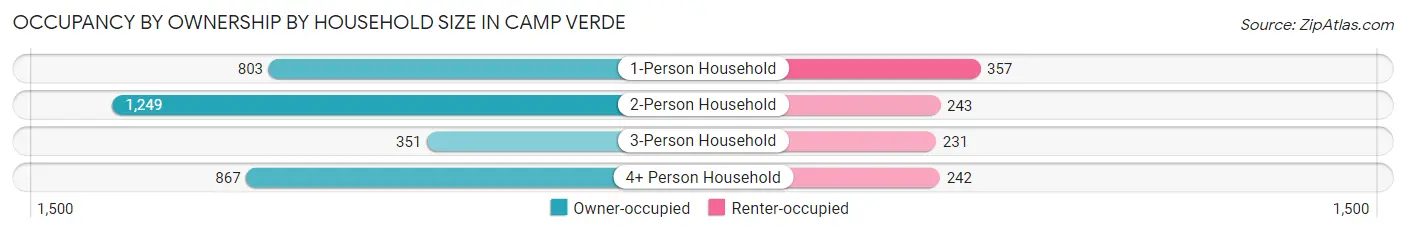
| Household Size | Owner-occupied | Renter-occupied |
| 1-Person Household | 803 (69.2%) | 357 (30.8%) |
| 2-Person Household | 1,249 (83.7%) | 243 (16.3%) |
| 3-Person Household | 351 (60.3%) | 231 (39.7%) |
| 4+ Person Household | 867 (78.2%) | 242 (21.8%) |
| Total Housing Units | 3,270 (75.3%) | 1,073 (24.7%) |
Occupancy by Educational Attainment in Camp Verde
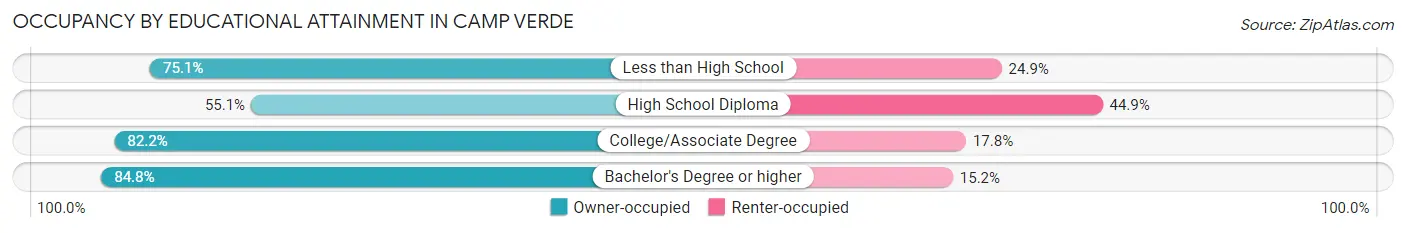
| Household Size | Owner-occupied | Renter-occupied |
| Less than High School | 471 (75.1%) | 156 (24.9%) |
| High School Diploma | 565 (55.1%) | 460 (44.9%) |
| College/Associate Degree | 1,504 (82.2%) | 326 (17.8%) |
| Bachelor's Degree or higher | 730 (84.8%) | 131 (15.2%) |
Occupancy by Age of Householder in Camp Verde
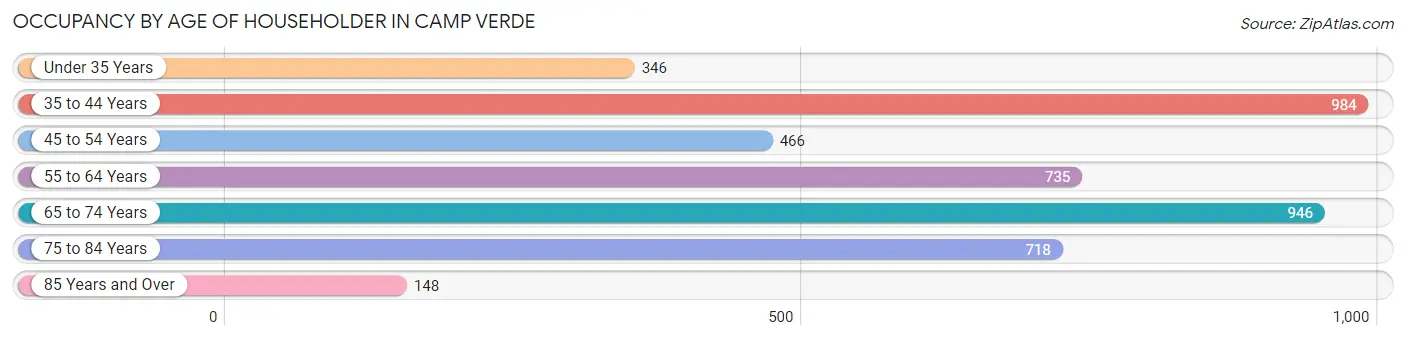
| Age Bracket | # Households | % Households |
| Under 35 Years | 346 | 8.0% |
| 35 to 44 Years | 984 | 22.7% |
| 45 to 54 Years | 466 | 10.7% |
| 55 to 64 Years | 735 | 16.9% |
| 65 to 74 Years | 946 | 21.8% |
| 75 to 84 Years | 718 | 16.5% |
| 85 Years and Over | 148 | 3.4% |
| Total | 4,343 | 100.0% |
Housing Finances in Camp Verde
Median Income by Occupancy in Camp Verde
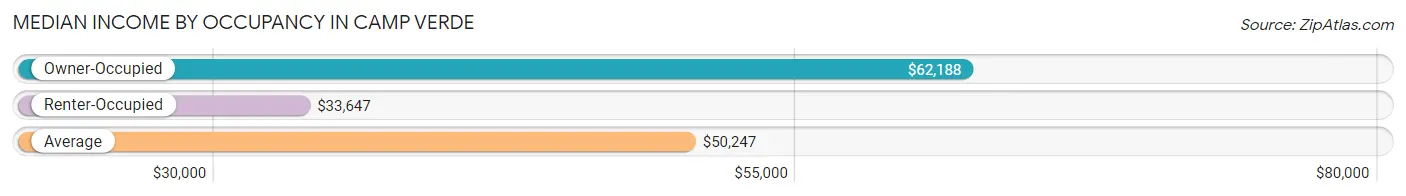
| Occupancy Type | # Households | Median Income |
| Owner-Occupied | 3,270 (75.3%) | $62,188 |
| Renter-Occupied | 1,073 (24.7%) | $33,647 |
| Average | 4,343 (100.0%) | $50,247 |
Occupancy by Householder Income Bracket in Camp Verde
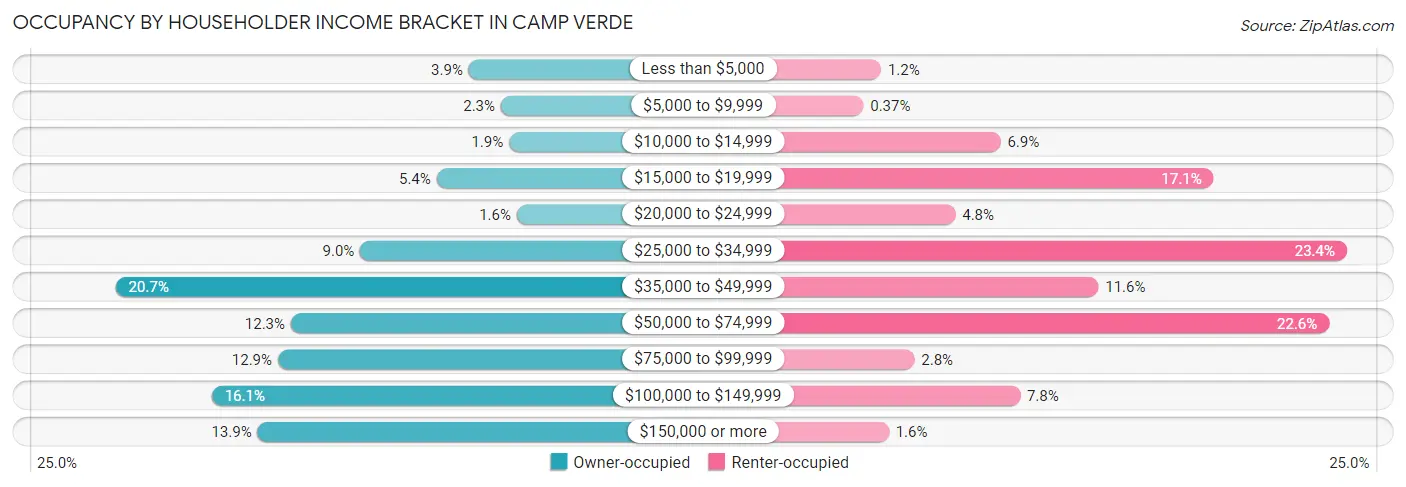
| Income Bracket | Owner-occupied | Renter-occupied |
| Less than $5,000 | 126 (3.8%) | 13 (1.2%) |
| $5,000 to $9,999 | 76 (2.3%) | 4 (0.4%) |
| $10,000 to $14,999 | 63 (1.9%) | 74 (6.9%) |
| $15,000 to $19,999 | 176 (5.4%) | 183 (17.1%) |
| $20,000 to $24,999 | 51 (1.6%) | 51 (4.8%) |
| $25,000 to $34,999 | 295 (9.0%) | 251 (23.4%) |
| $35,000 to $49,999 | 676 (20.7%) | 124 (11.6%) |
| $50,000 to $74,999 | 403 (12.3%) | 242 (22.6%) |
| $75,000 to $99,999 | 423 (12.9%) | 30 (2.8%) |
| $100,000 to $149,999 | 526 (16.1%) | 84 (7.8%) |
| $150,000 or more | 455 (13.9%) | 17 (1.6%) |
| Total | 3,270 (100.0%) | 1,073 (100.0%) |
Monthly Housing Cost Tiers in Camp Verde
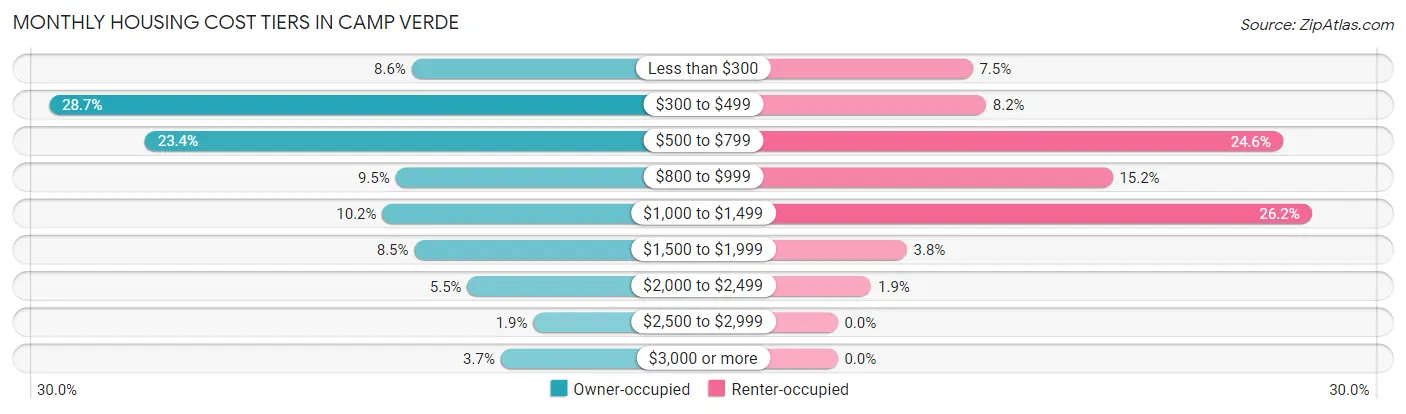
| Monthly Cost | Owner-occupied | Renter-occupied |
| Less than $300 | 282 (8.6%) | 80 (7.5%) |
| $300 to $499 | 937 (28.6%) | 88 (8.2%) |
| $500 to $799 | 764 (23.4%) | 264 (24.6%) |
| $800 to $999 | 311 (9.5%) | 163 (15.2%) |
| $1,000 to $1,499 | 335 (10.2%) | 281 (26.2%) |
| $1,500 to $1,999 | 277 (8.5%) | 41 (3.8%) |
| $2,000 to $2,499 | 181 (5.5%) | 20 (1.9%) |
| $2,500 to $2,999 | 62 (1.9%) | 0 (0.0%) |
| $3,000 or more | 121 (3.7%) | 0 (0.0%) |
| Total | 3,270 (100.0%) | 1,073 (100.0%) |
Physical Housing Characteristics in Camp Verde
Housing Structures in Camp Verde
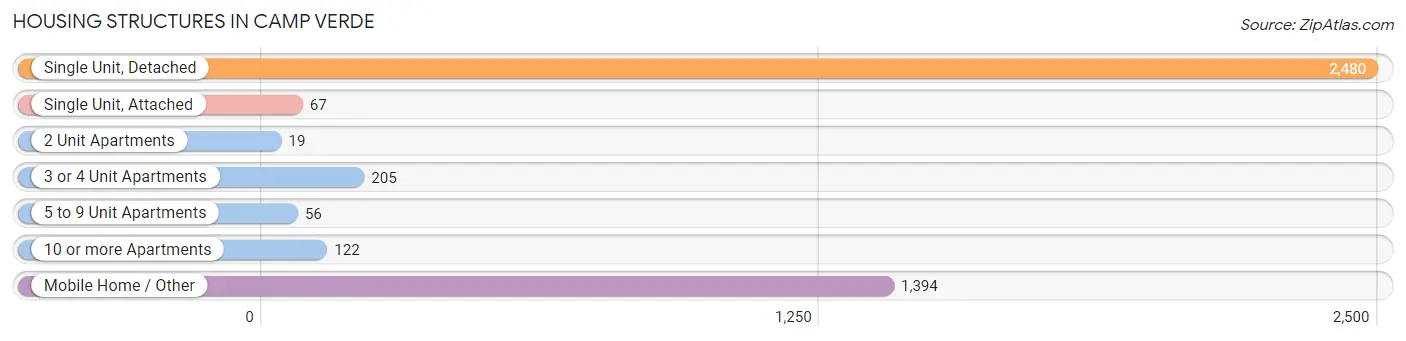
| Structure Type | # Housing Units | % Housing Units |
| Single Unit, Detached | 2,480 | 57.1% |
| Single Unit, Attached | 67 | 1.5% |
| 2 Unit Apartments | 19 | 0.4% |
| 3 or 4 Unit Apartments | 205 | 4.7% |
| 5 to 9 Unit Apartments | 56 | 1.3% |
| 10 or more Apartments | 122 | 2.8% |
| Mobile Home / Other | 1,394 | 32.1% |
| Total | 4,343 | 100.0% |
Housing Structures by Occupancy in Camp Verde
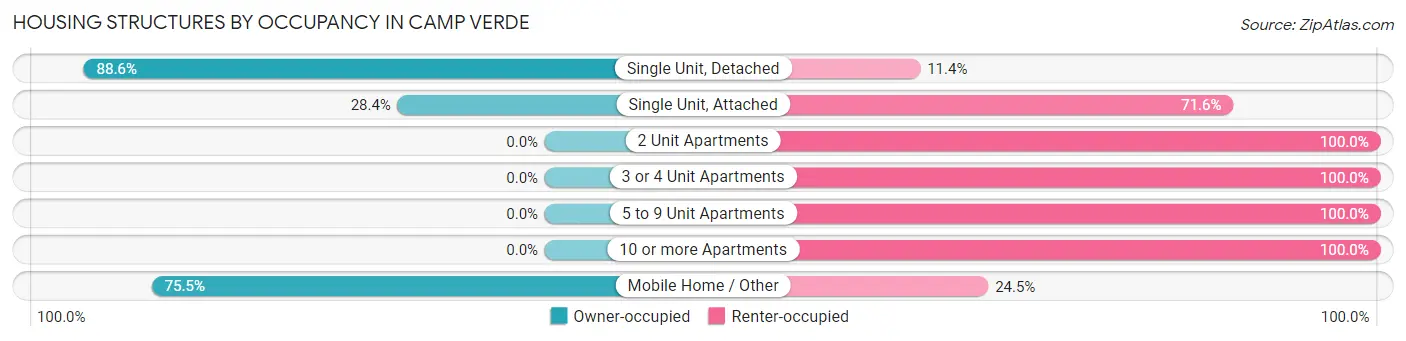
| Structure Type | Owner-occupied | Renter-occupied |
| Single Unit, Detached | 2,198 (88.6%) | 282 (11.4%) |
| Single Unit, Attached | 19 (28.4%) | 48 (71.6%) |
| 2 Unit Apartments | 0 (0.0%) | 19 (100.0%) |
| 3 or 4 Unit Apartments | 0 (0.0%) | 205 (100.0%) |
| 5 to 9 Unit Apartments | 0 (0.0%) | 56 (100.0%) |
| 10 or more Apartments | 0 (0.0%) | 122 (100.0%) |
| Mobile Home / Other | 1,053 (75.5%) | 341 (24.5%) |
| Total | 3,270 (75.3%) | 1,073 (24.7%) |
Housing Structures by Number of Rooms in Camp Verde
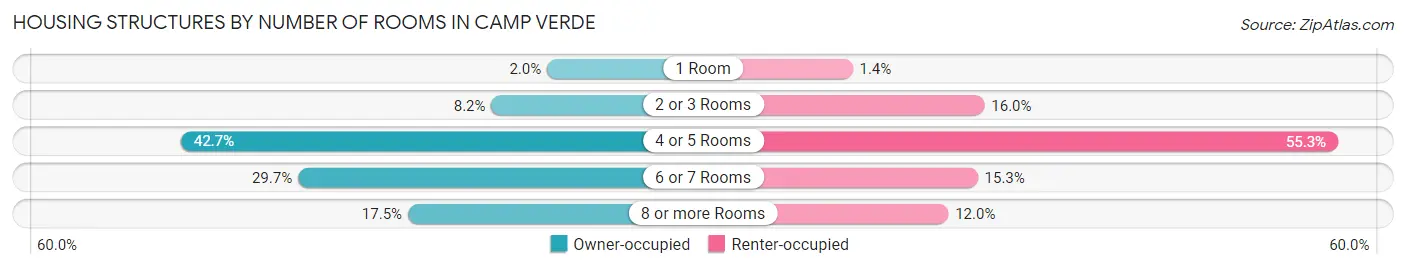
| Number of Rooms | Owner-occupied | Renter-occupied |
| 1 Room | 66 (2.0%) | 15 (1.4%) |
| 2 or 3 Rooms | 268 (8.2%) | 172 (16.0%) |
| 4 or 5 Rooms | 1,395 (42.7%) | 593 (55.3%) |
| 6 or 7 Rooms | 970 (29.7%) | 164 (15.3%) |
| 8 or more Rooms | 571 (17.5%) | 129 (12.0%) |
| Total | 3,270 (100.0%) | 1,073 (100.0%) |
Housing Structure by Heating Type in Camp Verde
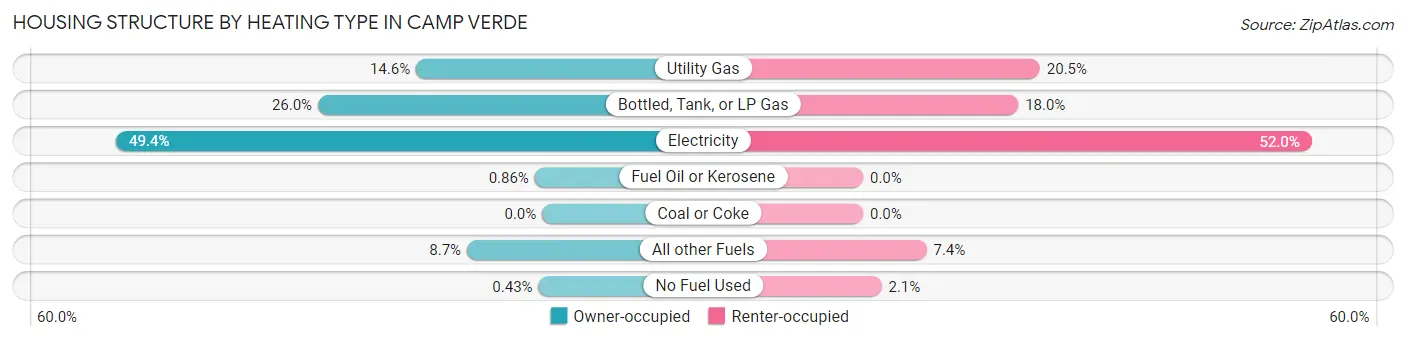
| Heating Type | Owner-occupied | Renter-occupied |
| Utility Gas | 478 (14.6%) | 220 (20.5%) |
| Bottled, Tank, or LP Gas | 850 (26.0%) | 193 (18.0%) |
| Electricity | 1,615 (49.4%) | 558 (52.0%) |
| Fuel Oil or Kerosene | 28 (0.9%) | 0 (0.0%) |
| Coal or Coke | 0 (0.0%) | 0 (0.0%) |
| All other Fuels | 285 (8.7%) | 79 (7.4%) |
| No Fuel Used | 14 (0.4%) | 23 (2.1%) |
| Total | 3,270 (100.0%) | 1,073 (100.0%) |
Household Vehicle Usage in Camp Verde
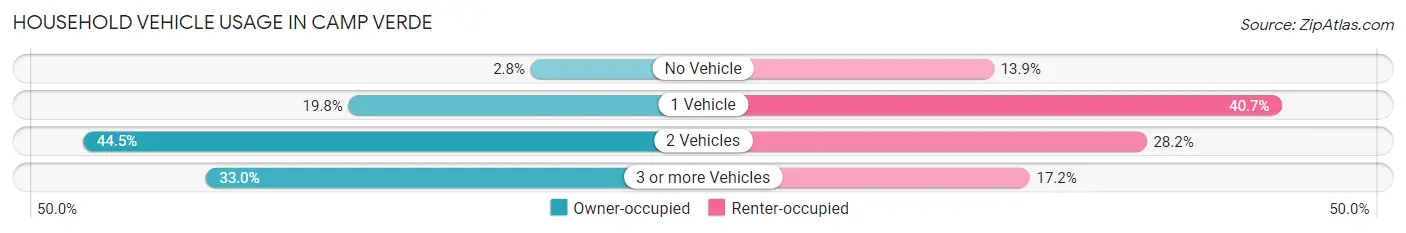
| Vehicles per Household | Owner-occupied | Renter-occupied |
| No Vehicle | 90 (2.8%) | 149 (13.9%) |
| 1 Vehicle | 646 (19.8%) | 437 (40.7%) |
| 2 Vehicles | 1,454 (44.5%) | 302 (28.1%) |
| 3 or more Vehicles | 1,080 (33.0%) | 185 (17.2%) |
| Total | 3,270 (100.0%) | 1,073 (100.0%) |
Real Estate & Mortgages in Camp Verde
Real Estate and Mortgage Overview in Camp Verde
| Characteristic | Without Mortgage | With Mortgage |
| Housing Units | 1,922 | 1,348 |
| Median Property Value | $217,800 | $315,400 |
| Median Household Income | $48,454 | $317 |
| Monthly Housing Costs | $453 | $121 |
| Real Estate Taxes | $1,292 | $43 |
Property Value by Mortgage Status in Camp Verde
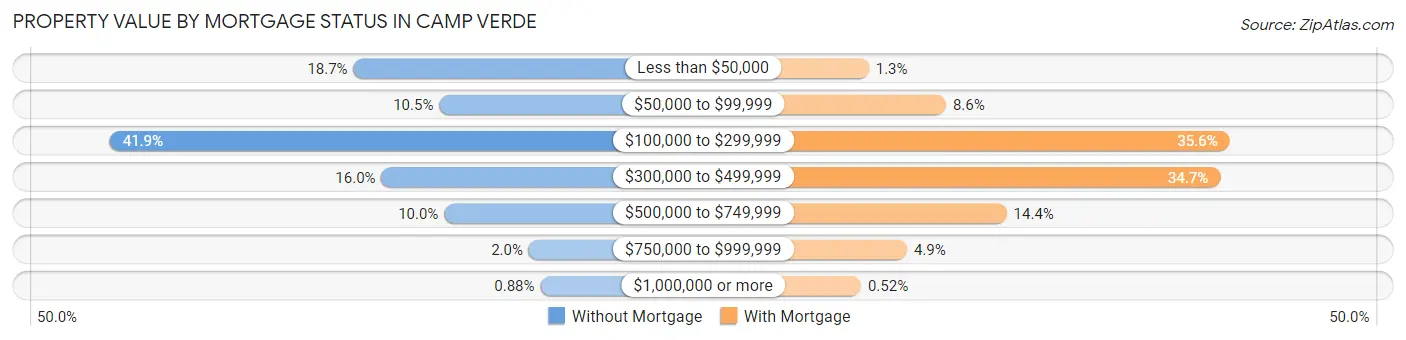
| Property Value | Without Mortgage | With Mortgage |
| Less than $50,000 | 359 (18.7%) | 17 (1.3%) |
| $50,000 to $99,999 | 202 (10.5%) | 116 (8.6%) |
| $100,000 to $299,999 | 805 (41.9%) | 480 (35.6%) |
| $300,000 to $499,999 | 308 (16.0%) | 468 (34.7%) |
| $500,000 to $749,999 | 193 (10.0%) | 194 (14.4%) |
| $750,000 to $999,999 | 38 (2.0%) | 66 (4.9%) |
| $1,000,000 or more | 17 (0.9%) | 7 (0.5%) |
| Total | 1,922 (100.0%) | 1,348 (100.0%) |
Household Income by Mortgage Status in Camp Verde
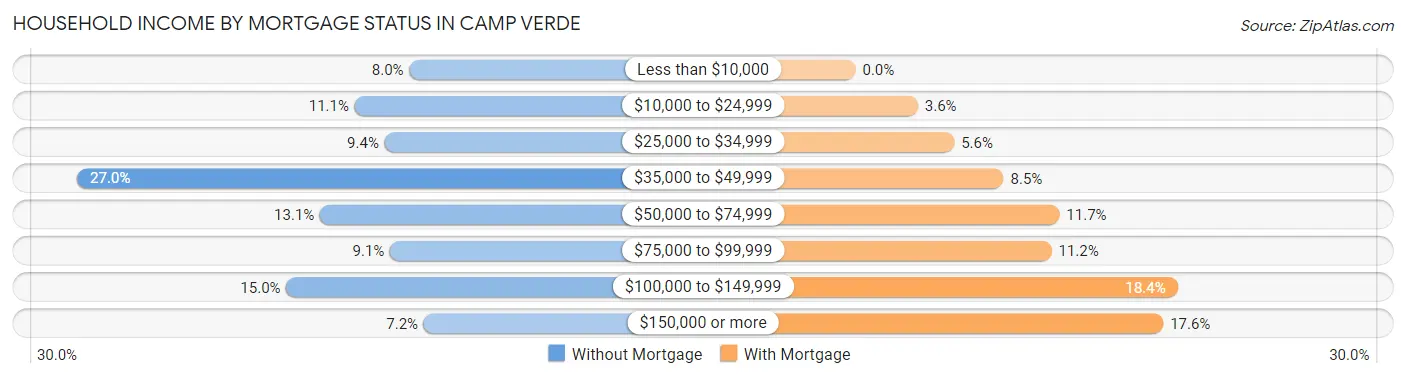
| Household Income | Without Mortgage | With Mortgage |
| Less than $10,000 | 154 (8.0%) | 0 (0.0%) |
| $10,000 to $24,999 | 214 (11.1%) | 48 (3.6%) |
| $25,000 to $34,999 | 181 (9.4%) | 76 (5.6%) |
| $35,000 to $49,999 | 519 (27.0%) | 114 (8.5%) |
| $50,000 to $74,999 | 252 (13.1%) | 157 (11.7%) |
| $75,000 to $99,999 | 175 (9.1%) | 151 (11.2%) |
| $100,000 to $149,999 | 289 (15.0%) | 248 (18.4%) |
| $150,000 or more | 138 (7.2%) | 237 (17.6%) |
| Total | 1,922 (100.0%) | 1,348 (100.0%) |
Property Value to Household Income Ratio in Camp Verde
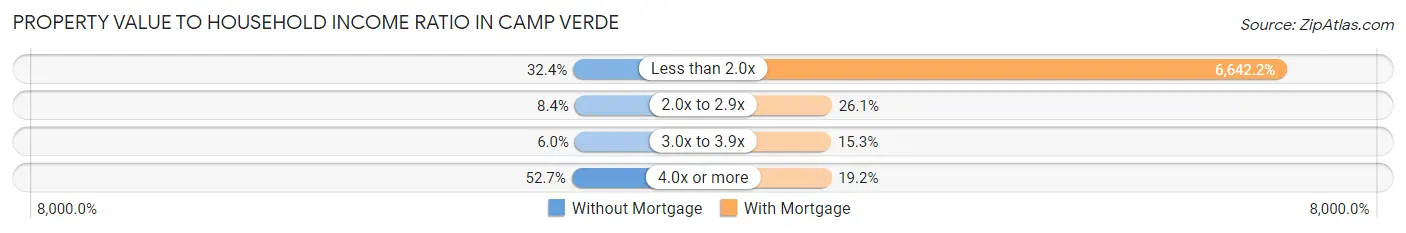
| Value-to-Income Ratio | Without Mortgage | With Mortgage |
| Less than 2.0x | 622 (32.4%) | 89,537 (6,642.2%) |
| 2.0x to 2.9x | 161 (8.4%) | 352 (26.1%) |
| 3.0x to 3.9x | 115 (6.0%) | 206 (15.3%) |
| 4.0x or more | 1,013 (52.7%) | 259 (19.2%) |
| Total | 1,922 (100.0%) | 1,348 (100.0%) |
Real Estate Taxes by Mortgage Status in Camp Verde
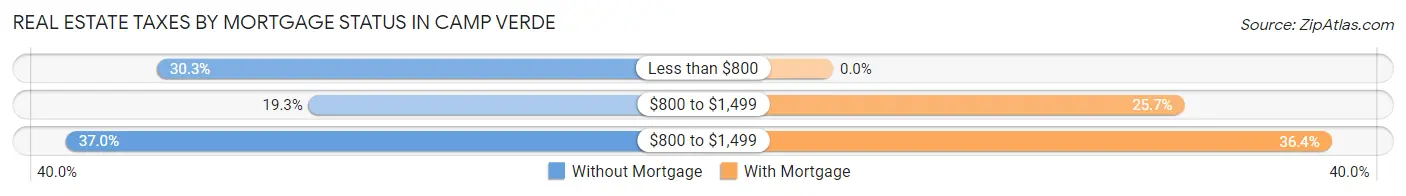
| Property Taxes | Without Mortgage | With Mortgage |
| Less than $800 | 583 (30.3%) | 0 (0.0%) |
| $800 to $1,499 | 370 (19.3%) | 346 (25.7%) |
| $800 to $1,499 | 711 (37.0%) | 491 (36.4%) |
| Total | 1,922 (100.0%) | 1,348 (100.0%) |
Health & Disability in Camp Verde
Health Insurance Coverage by Age in Camp Verde
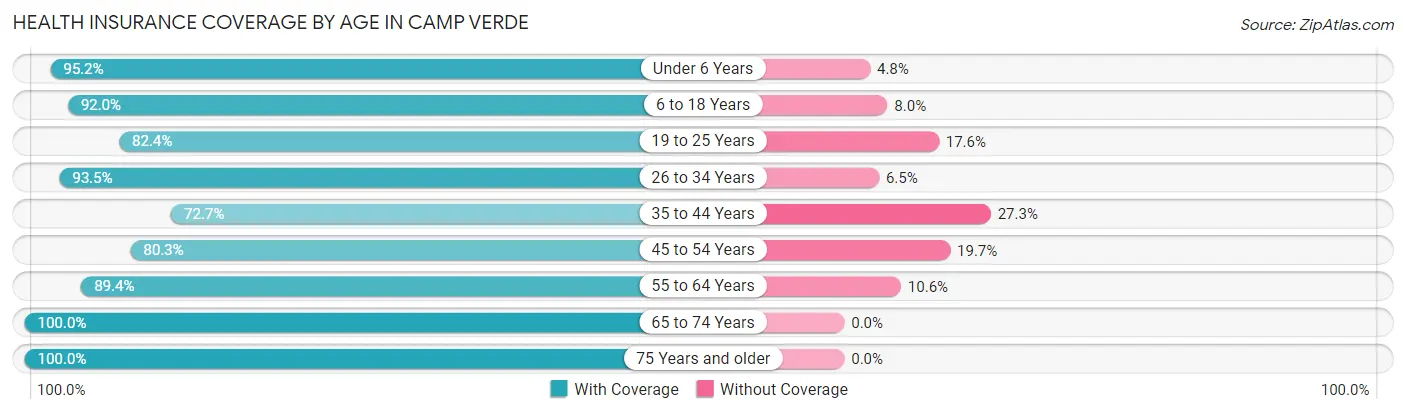
| Age Bracket | With Coverage | Without Coverage |
| Under 6 Years | 536 (95.2%) | 27 (4.8%) |
| 6 to 18 Years | 2,299 (92.0%) | 201 (8.0%) |
| 19 to 25 Years | 603 (82.4%) | 129 (17.6%) |
| 26 to 34 Years | 809 (93.5%) | 56 (6.5%) |
| 35 to 44 Years | 1,243 (72.7%) | 467 (27.3%) |
| 45 to 54 Years | 769 (80.3%) | 189 (19.7%) |
| 55 to 64 Years | 1,220 (89.4%) | 144 (10.6%) |
| 65 to 74 Years | 1,560 (100.0%) | 0 (0.0%) |
| 75 Years and older | 1,283 (100.0%) | 0 (0.0%) |
| Total | 10,322 (89.5%) | 1,213 (10.5%) |
Health Insurance Coverage by Citizenship Status in Camp Verde
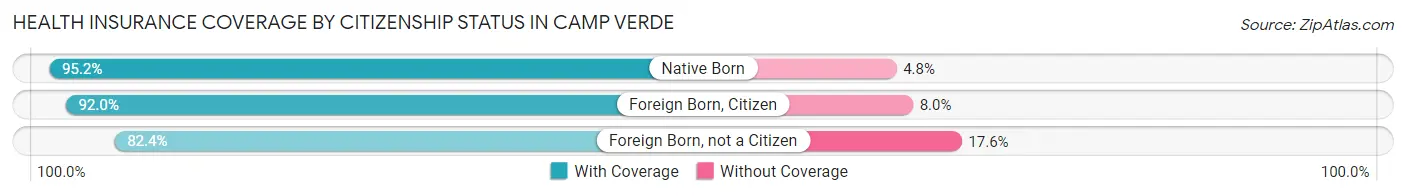
| Citizenship Status | With Coverage | Without Coverage |
| Native Born | 536 (95.2%) | 27 (4.8%) |
| Foreign Born, Citizen | 2,299 (92.0%) | 201 (8.0%) |
| Foreign Born, not a Citizen | 603 (82.4%) | 129 (17.6%) |
Health Insurance Coverage by Household Income in Camp Verde
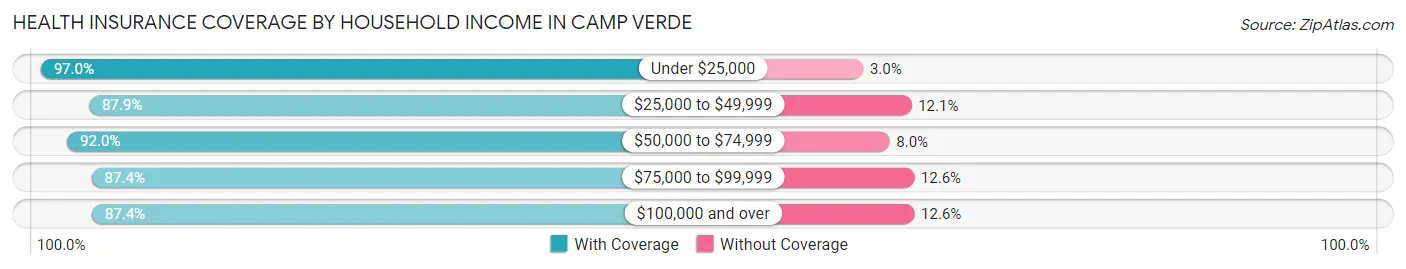
| Household Income | With Coverage | Without Coverage |
| Under $25,000 | 1,346 (97.0%) | 42 (3.0%) |
| $25,000 to $49,999 | 3,073 (87.9%) | 422 (12.1%) |
| $50,000 to $74,999 | 1,454 (92.0%) | 126 (8.0%) |
| $75,000 to $99,999 | 967 (87.4%) | 139 (12.6%) |
| $100,000 and over | 3,331 (87.4%) | 481 (12.6%) |
Public vs Private Health Insurance Coverage by Age in Camp Verde
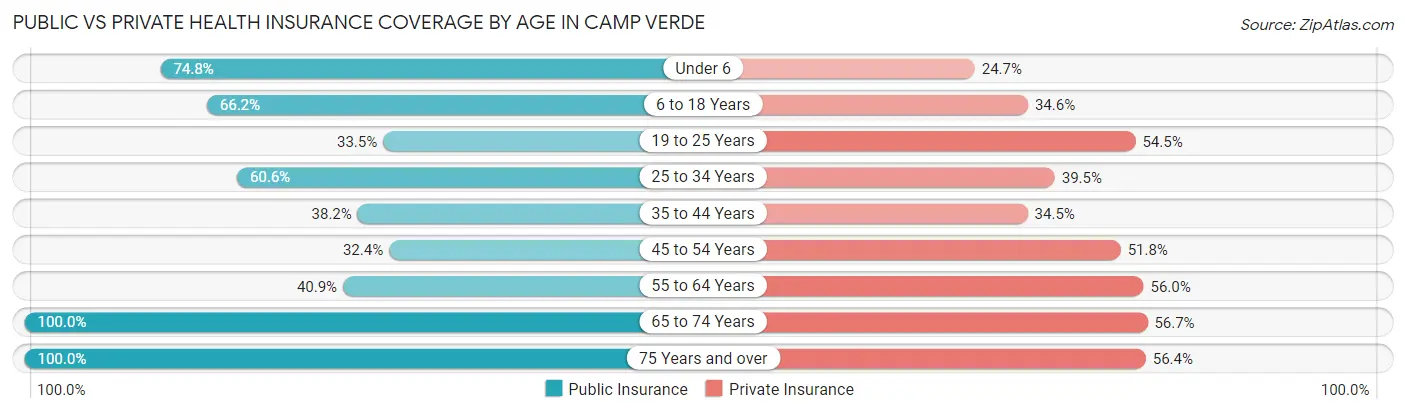
| Age Bracket | Public Insurance | Private Insurance |
| Under 6 | 421 (74.8%) | 139 (24.7%) |
| 6 to 18 Years | 1,654 (66.2%) | 864 (34.6%) |
| 19 to 25 Years | 245 (33.5%) | 399 (54.5%) |
| 25 to 34 Years | 524 (60.6%) | 342 (39.5%) |
| 35 to 44 Years | 653 (38.2%) | 590 (34.5%) |
| 45 to 54 Years | 310 (32.4%) | 496 (51.8%) |
| 55 to 64 Years | 558 (40.9%) | 764 (56.0%) |
| 65 to 74 Years | 1,560 (100.0%) | 885 (56.7%) |
| 75 Years and over | 1,283 (100.0%) | 724 (56.4%) |
| Total | 7,208 (62.5%) | 5,203 (45.1%) |
Disability Status by Sex by Age in Camp Verde
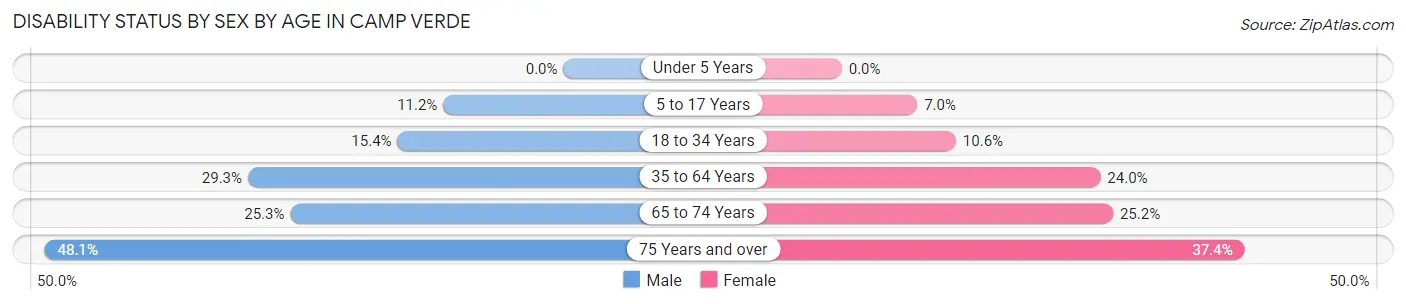
| Age Bracket | Male | Female |
| Under 5 Years | 0 (0.0%) | 0 (0.0%) |
| 5 to 17 Years | 148 (11.2%) | 75 (7.0%) |
| 18 to 34 Years | 136 (15.4%) | 100 (10.6%) |
| 35 to 64 Years | 590 (29.3%) | 484 (24.0%) |
| 65 to 74 Years | 205 (25.3%) | 189 (25.2%) |
| 75 Years and over | 284 (48.1%) | 259 (37.4%) |
Disability Class by Sex by Age in Camp Verde
Disability Class: Hearing Difficulty
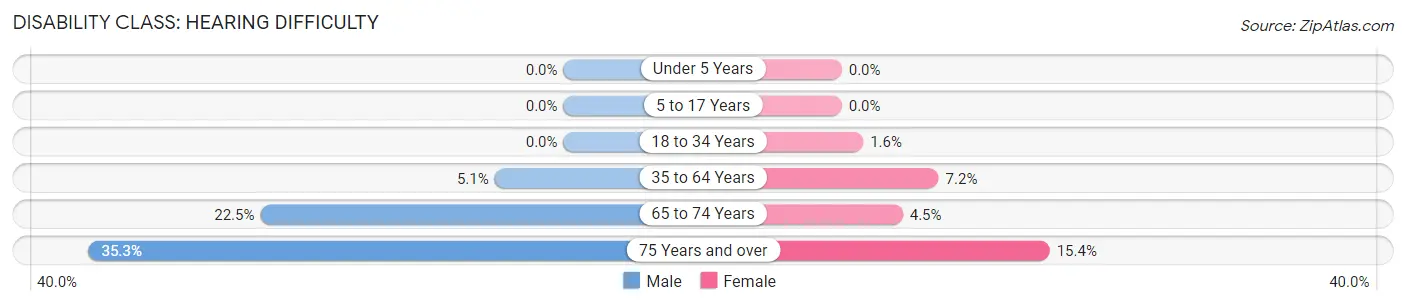
| Age Bracket | Male | Female |
| Under 5 Years | 0 (0.0%) | 0 (0.0%) |
| 5 to 17 Years | 0 (0.0%) | 0 (0.0%) |
| 18 to 34 Years | 0 (0.0%) | 15 (1.6%) |
| 35 to 64 Years | 103 (5.1%) | 145 (7.2%) |
| 65 to 74 Years | 182 (22.5%) | 34 (4.5%) |
| 75 Years and over | 208 (35.2%) | 107 (15.4%) |
Disability Class: Vision Difficulty
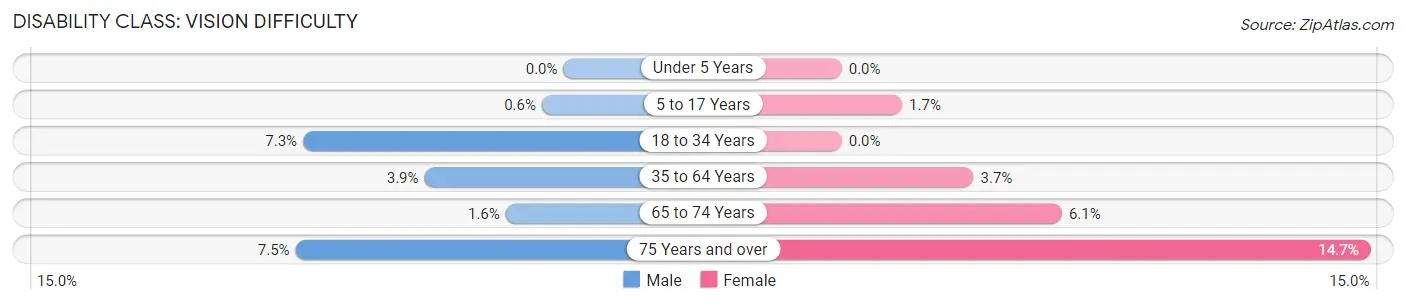
| Age Bracket | Male | Female |
| Under 5 Years | 0 (0.0%) | 0 (0.0%) |
| 5 to 17 Years | 8 (0.6%) | 18 (1.7%) |
| 18 to 34 Years | 64 (7.2%) | 0 (0.0%) |
| 35 to 64 Years | 78 (3.9%) | 74 (3.7%) |
| 65 to 74 Years | 13 (1.6%) | 46 (6.1%) |
| 75 Years and over | 44 (7.5%) | 102 (14.7%) |
Disability Class: Cognitive Difficulty
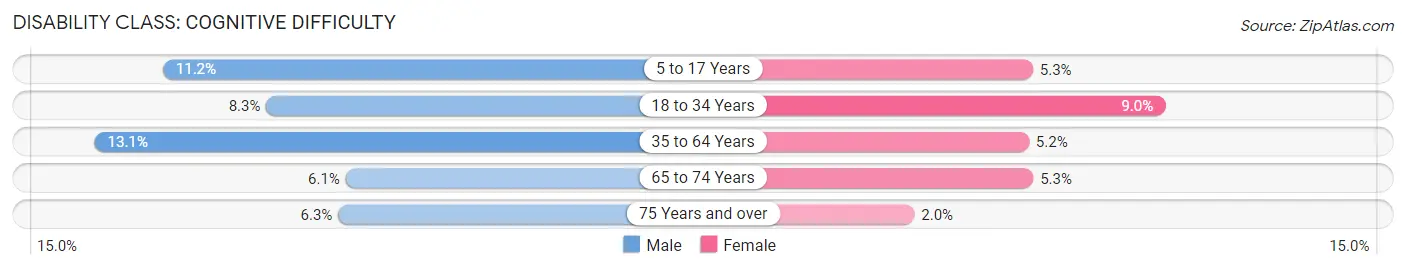
| Age Bracket | Male | Female |
| 5 to 17 Years | 148 (11.2%) | 57 (5.3%) |
| 18 to 34 Years | 73 (8.3%) | 85 (9.0%) |
| 35 to 64 Years | 263 (13.1%) | 105 (5.2%) |
| 65 to 74 Years | 49 (6.1%) | 40 (5.3%) |
| 75 Years and over | 37 (6.3%) | 14 (2.0%) |
Disability Class: Ambulatory Difficulty
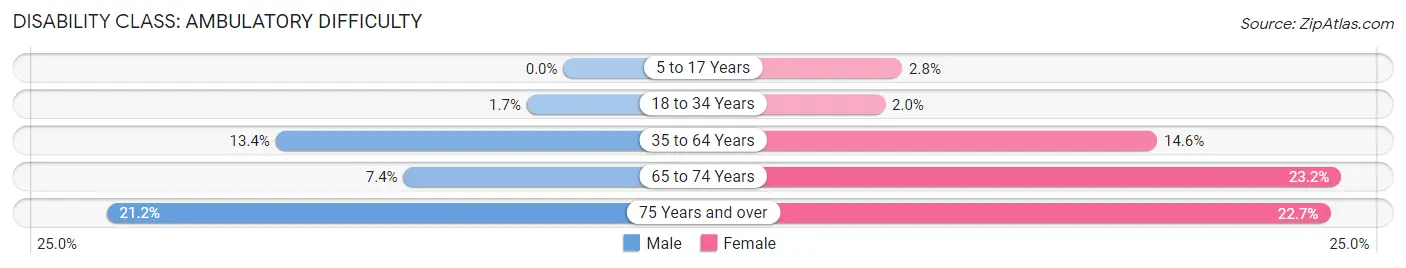
| Age Bracket | Male | Female |
| 5 to 17 Years | 0 (0.0%) | 30 (2.8%) |
| 18 to 34 Years | 15 (1.7%) | 19 (2.0%) |
| 35 to 64 Years | 269 (13.4%) | 295 (14.6%) |
| 65 to 74 Years | 60 (7.4%) | 174 (23.2%) |
| 75 Years and over | 125 (21.2%) | 157 (22.7%) |
Disability Class: Self-Care Difficulty
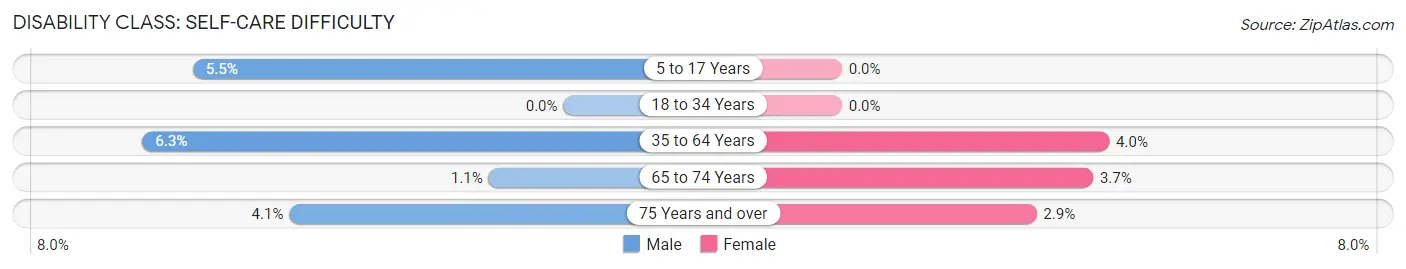
| Age Bracket | Male | Female |
| 5 to 17 Years | 73 (5.5%) | 0 (0.0%) |
| 18 to 34 Years | 0 (0.0%) | 0 (0.0%) |
| 35 to 64 Years | 126 (6.2%) | 80 (4.0%) |
| 65 to 74 Years | 9 (1.1%) | 28 (3.7%) |
| 75 Years and over | 24 (4.1%) | 20 (2.9%) |
Technology Access in Camp Verde
Computing Device Access in Camp Verde
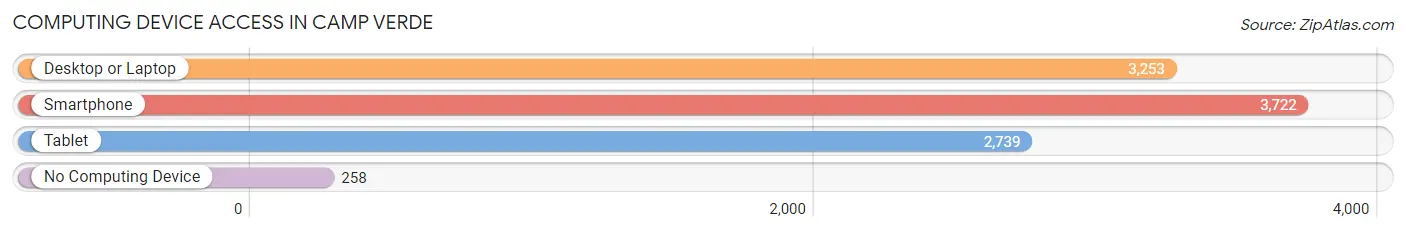
| Device Type | # Households | % Households |
| Desktop or Laptop | 3,253 | 74.9% |
| Smartphone | 3,722 | 85.7% |
| Tablet | 2,739 | 63.1% |
| No Computing Device | 258 | 5.9% |
| Total | 4,343 | 100.0% |
Internet Access in Camp Verde
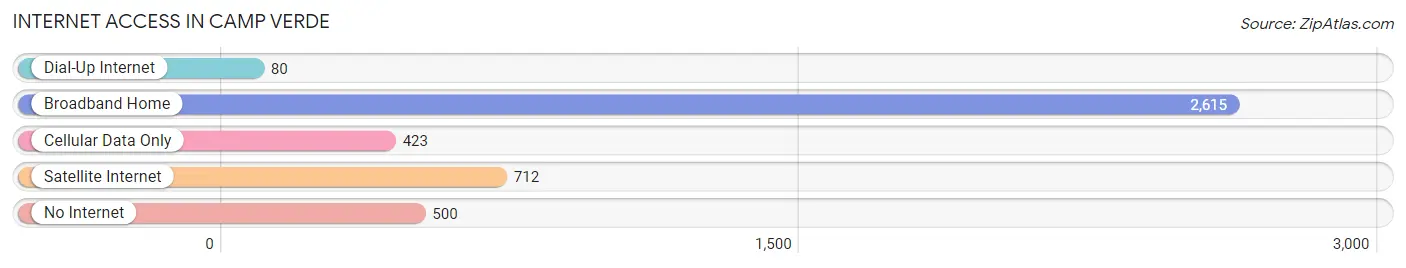
| Internet Type | # Households | % Households |
| Dial-Up Internet | 80 | 1.8% |
| Broadband Home | 2,615 | 60.2% |
| Cellular Data Only | 423 | 9.7% |
| Satellite Internet | 712 | 16.4% |
| No Internet | 500 | 11.5% |
| Total | 4,343 | 100.0% |
Camp Verde Summary
Verde Valley is a region in Arizona that is home to the town of Camp Verde. The town is located in Yavapai County and is situated in the Verde Valley, which is a part of the larger Prescott National Forest. The town is located at an elevation of 3,400 feet and is surrounded by the Coconino National Forest to the north, the Tonto National Forest to the east, and the Prescott National Forest to the south. The town is located approximately 85 miles north of Phoenix and is a popular destination for outdoor recreation.
History
The area that is now Camp Verde was first inhabited by the Yavapai people, who were a part of the larger Yuman-speaking group of Native Americans. The Yavapai people were hunter-gatherers who lived in the area for thousands of years before the arrival of Europeans. The first Europeans to arrive in the area were Spanish explorers in the late 1700s. The area was then part of Mexico until 1848 when it became part of the United States after the Mexican-American War.
In 1864, the United States Army established Camp Lincoln in the area, which was later renamed Camp Verde. The camp was used as a supply depot and staging area for the US Army during the Indian Wars. The camp was abandoned in 1871 and the town of Camp Verde was established in 1876. The town was named after the nearby Camp Verde and was originally a farming community.
Geography
Camp Verde is located in the Verde Valley, which is a part of the larger Prescott National Forest. The town is located at an elevation of 3,400 feet and is surrounded by the Coconino National Forest to the north, the Tonto National Forest to the east, and the Prescott National Forest to the south. The town is located approximately 85 miles north of Phoenix and is a popular destination for outdoor recreation.
The town is located in a semi-arid climate and is characterized by hot summers and mild winters. The average annual temperature is around 70 degrees Fahrenheit and the average annual precipitation is around 12 inches. The town is located in a desert environment and is surrounded by mountains and canyons.
Economy
The economy of Camp Verde is largely based on tourism and agriculture. The town is a popular destination for outdoor recreation and is home to several tourist attractions, including Montezuma Castle National Monument, Fort Verde State Historic Park, and the Verde River Greenway State Natural Area. The town is also home to several wineries and vineyards, as well as a number of restaurants and shops.
Agriculture is also an important part of the economy of Camp Verde. The town is home to several farms and ranches, which produce a variety of crops, including alfalfa, hay, corn, and cotton. The town is also home to several cattle ranches, which produce beef and dairy products.
Demographics
As of the 2010 census, the population of Camp Verde was 10,873. The population is largely white (83.3%) and Hispanic (14.2%). The median household income is $41,945 and the median age is 39.7 years. The town is home to a large number of retirees, with nearly 20% of the population over the age of 65. The town is also home to a large number of veterans, with nearly 10% of the population having served in the military.
Common Questions
What is Per Capita Income in Camp Verde?
Per Capita income in Camp Verde is $30,044.
What is the Median Family Income in Camp Verde?
Median Family Income in Camp Verde is $68,715.
What is the Median Household income in Camp Verde?
Median Household Income in Camp Verde is $50,247.
What is Income or Wage Gap in Camp Verde?
Income or Wage Gap in Camp Verde is 14.2%.
Women in Camp Verde earn 85.8 cents for every dollar earned by a man.
What is Family Income Deficit in Camp Verde?
Family Income Deficit in Camp Verde is $12,267.
Families that are below poverty line in Camp Verde earn $12,267 less on average than the poverty threshold level.
What is Inequality or Gini Index in Camp Verde?
Inequality or Gini Index in Camp Verde is 0.48.
What is the Total Population of Camp Verde?
Total Population of Camp Verde is 12,132.
What is the Total Male Population of Camp Verde?
Total Male Population of Camp Verde is 6,445.
What is the Total Female Population of Camp Verde?
Total Female Population of Camp Verde is 5,687.
What is the Ratio of Males per 100 Females in Camp Verde?
There are 113.33 Males per 100 Females in Camp Verde.
What is the Ratio of Females per 100 Males in Camp Verde?
There are 88.24 Females per 100 Males in Camp Verde.
What is the Median Population Age in Camp Verde?
Median Population Age in Camp Verde is 40.5 Years.
What is the Average Family Size in Camp Verde
Average Family Size in Camp Verde is 3.1 People.
What is the Average Household Size in Camp Verde
Average Household Size in Camp Verde is 2.6 People.
How Large is the Labor Force in Camp Verde?
There are 4,972 People in the Labor Forcein in Camp Verde.
What is the Percentage of People in the Labor Force in Camp Verde?
50.9% of People are in the Labor Force in Camp Verde.
What is the Unemployment Rate in Camp Verde?
Unemployment Rate in Camp Verde is 5.4%.