New River, AZ Map & Demographics
New River Map
New River Overview
$56,657
PER CAPITA INCOME
$131,689
AVG FAMILY INCOME
$116,837
AVG HOUSEHOLD INCOME
28.0%
WAGE / INCOME GAP [ % ]
72.0¢/ $1
WAGE / INCOME GAP [ $ ]
0.38
INEQUALITY / GINI INDEX
18,422
TOTAL POPULATION
9,117
MALE POPULATION
9,305
FEMALE POPULATION
97.98
MALES / 100 FEMALES
102.06
FEMALES / 100 MALES
49.5
MEDIAN AGE
3.0
AVG FAMILY SIZE
2.6
AVG HOUSEHOLD SIZE
10,332
LABOR FORCE [ PEOPLE ]
68.8%
PERCENT IN LABOR FORCE
2.2%
UNEMPLOYMENT RATE
New River Zip Codes
Income in New River
Income Overview in New River
Per Capita Income in New River is $56,657, while median incomes of families and households are $131,689 and $116,837 respectively.
| Characteristic | Number | Measure |
| Per Capita Income | 18,422 | $56,657 |
| Median Family Income | 5,240 | $131,689 |
| Mean Family Income | 5,240 | $163,327 |
| Median Household Income | 6,945 | $116,837 |
| Mean Household Income | 6,945 | $148,354 |
| Income Deficit | 5,240 | $0 |
| Wage / Income Gap (%) | 18,422 | 28.00% |
| Wage / Income Gap ($) | 18,422 | 72.00¢ per $1 |
| Gini / Inequality Index | 18,422 | 0.38 |
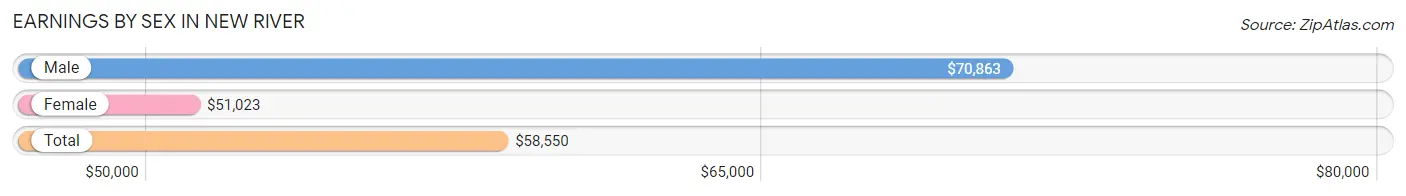
Earnings by Sex in New River
Average Earnings in New River are $58,550, $70,863 for men and $51,023 for women, a difference of 28.0%.
| Sex | Number | Average Earnings |
| Male | 5,747 (53.7%) | $70,863 |
| Female | 4,956 (46.3%) | $51,023 |
| Total | 10,703 (100.0%) | $58,550 |
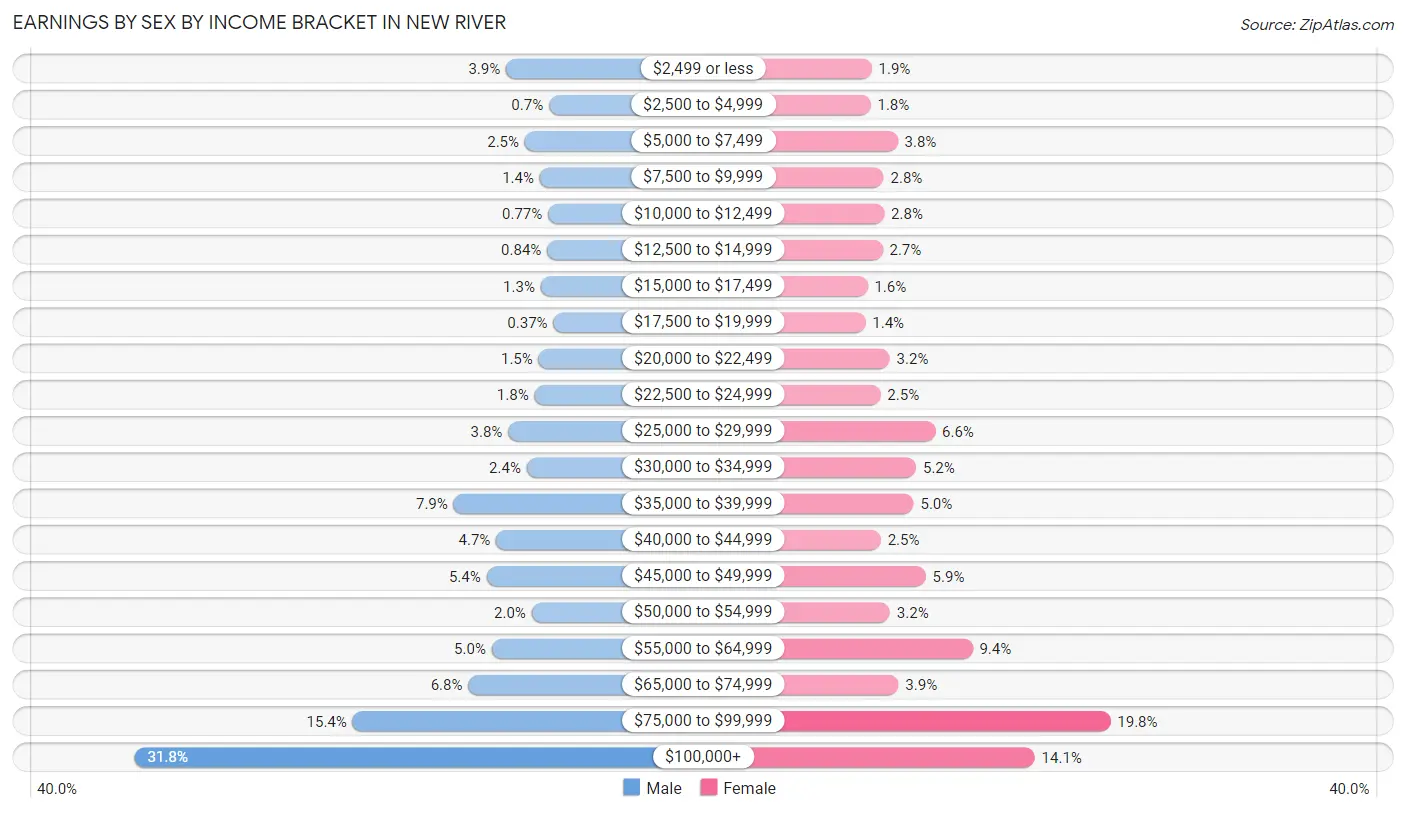
Earnings by Sex by Income Bracket in New River
The most common earnings brackets in New River are $100,000+ for men (1,825 | 31.8%) and $75,000 to $99,999 for women (979 | 19.8%).
| Income | Male | Female |
| $2,499 or less | 225 (3.9%) | 92 (1.9%) |
| $2,500 to $4,999 | 40 (0.7%) | 88 (1.8%) |
| $5,000 to $7,499 | 144 (2.5%) | 189 (3.8%) |
| $7,500 to $9,999 | 80 (1.4%) | 137 (2.8%) |
| $10,000 to $12,499 | 44 (0.8%) | 139 (2.8%) |
| $12,500 to $14,999 | 48 (0.8%) | 133 (2.7%) |
| $15,000 to $17,499 | 76 (1.3%) | 77 (1.5%) |
| $17,500 to $19,999 | 21 (0.4%) | 69 (1.4%) |
| $20,000 to $22,499 | 85 (1.5%) | 159 (3.2%) |
| $22,500 to $24,999 | 103 (1.8%) | 125 (2.5%) |
| $25,000 to $29,999 | 216 (3.8%) | 328 (6.6%) |
| $30,000 to $34,999 | 136 (2.4%) | 257 (5.2%) |
| $35,000 to $39,999 | 451 (7.9%) | 248 (5.0%) |
| $40,000 to $44,999 | 268 (4.7%) | 126 (2.5%) |
| $45,000 to $49,999 | 309 (5.4%) | 293 (5.9%) |
| $50,000 to $54,999 | 115 (2.0%) | 160 (3.2%) |
| $55,000 to $64,999 | 287 (5.0%) | 467 (9.4%) |
| $65,000 to $74,999 | 388 (6.8%) | 192 (3.9%) |
| $75,000 to $99,999 | 886 (15.4%) | 979 (19.8%) |
| $100,000+ | 1,825 (31.8%) | 698 (14.1%) |
| Total | 5,747 (100.0%) | 4,956 (100.0%) |
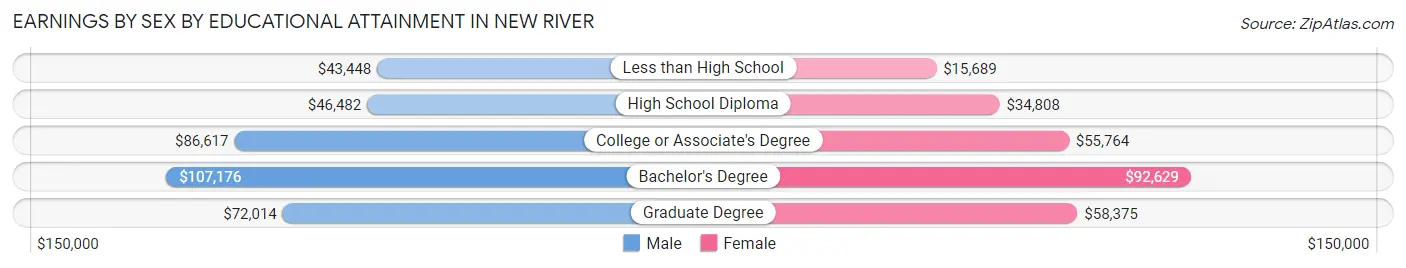
Earnings by Sex by Educational Attainment in New River
Average earnings in New River are $78,833 for men and $56,085 for women, a difference of 28.9%. Men with an educational attainment of bachelor's degree enjoy the highest average annual earnings of $107,176, while those with less than high school education earn the least with $43,448. Women with an educational attainment of bachelor's degree earn the most with the average annual earnings of $92,629, while those with less than high school education have the smallest earnings of $15,689.
| Educational Attainment | Male Income | Female Income |
| Less than High School | $43,448 | $15,689 |
| High School Diploma | $46,482 | $34,808 |
| College or Associate's Degree | $86,617 | $55,764 |
| Bachelor's Degree | $107,176 | $92,629 |
| Graduate Degree | $72,014 | $58,375 |
| Total | $78,833 | $56,085 |
Family Income in New River
Family Income Brackets in New River
According to the New River family income data, there are 1,258 families falling into the $100,000 to $149,999 income range, which is the most common income bracket and makes up 24.0% of all families. Conversely, the $10,000 to $14,999 income bracket is the least frequent group with only 21 families (0.4%) belonging to this category.
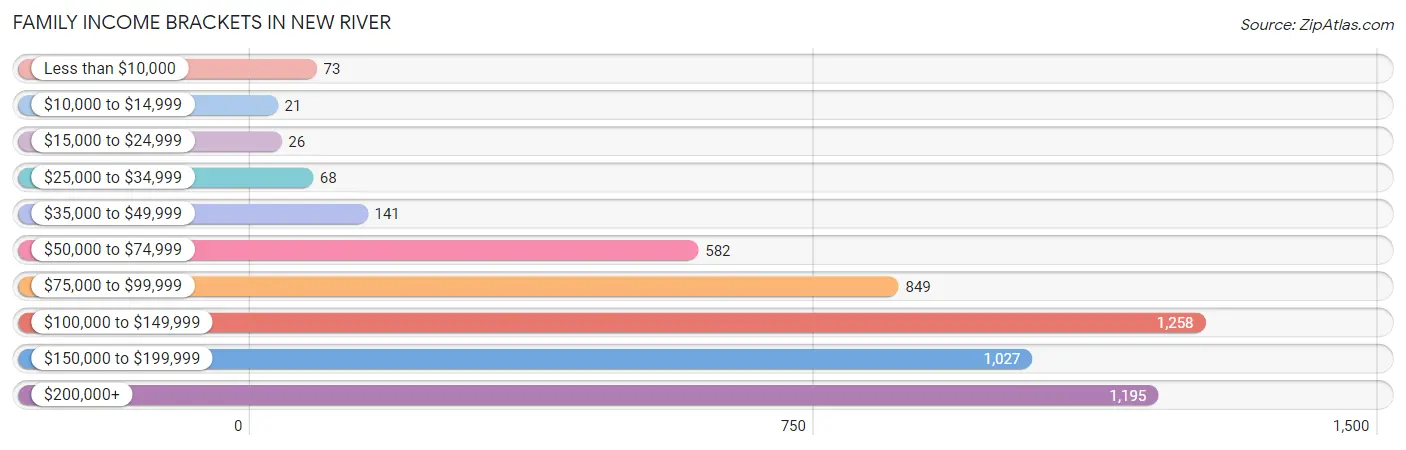
| Income Bracket | # Families | % Families |
| Less than $10,000 | 73 | 1.4% |
| $10,000 to $14,999 | 21 | 0.4% |
| $15,000 to $24,999 | 26 | 0.5% |
| $25,000 to $34,999 | 68 | 1.3% |
| $35,000 to $49,999 | 141 | 2.7% |
| $50,000 to $74,999 | 582 | 11.1% |
| $75,000 to $99,999 | 849 | 16.2% |
| $100,000 to $149,999 | 1,258 | 24.0% |
| $150,000 to $199,999 | 1,027 | 19.6% |
| $200,000+ | 1,195 | 22.8% |
Family Income by Famaliy Size in New River
4-person families (956 | 18.2%) account for the highest median family income in New River with $175,765 per family, while 3-person families (1,155 | 22.0%) have the highest median income of $55,162 per family member.
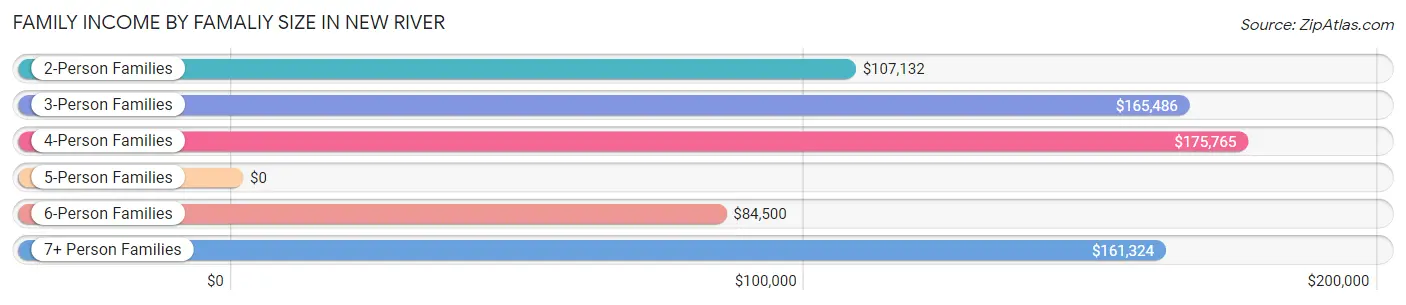
| Income Bracket | # Families | Median Income |
| 2-Person Families | 2,647 (50.5%) | $107,132 |
| 3-Person Families | 1,155 (22.0%) | $165,486 |
| 4-Person Families | 956 (18.2%) | $175,765 |
| 5-Person Families | 150 (2.9%) | $0 |
| 6-Person Families | 240 (4.6%) | $84,500 |
| 7+ Person Families | 92 (1.8%) | $161,324 |
| Total | 5,240 (100.0%) | $131,689 |
Family Income by Number of Earners in New River
The median family income in New River is $131,689, with families comprising 3+ earners (752) having the highest median family income of $178,093, while families with no earners (615) have the lowest median family income of $73,403, accounting for 14.3% and 11.7% of families, respectively.
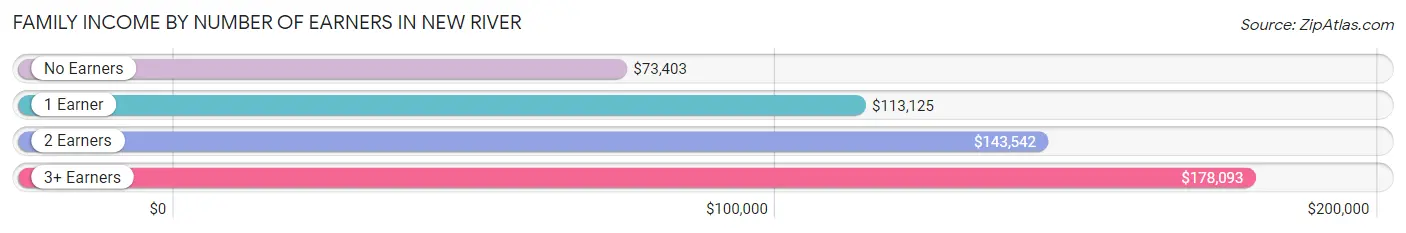
| Number of Earners | # Families | Median Income |
| No Earners | 615 (11.7%) | $73,403 |
| 1 Earner | 1,217 (23.2%) | $113,125 |
| 2 Earners | 2,656 (50.7%) | $143,542 |
| 3+ Earners | 752 (14.3%) | $178,093 |
| Total | 5,240 (100.0%) | $131,689 |
Household Income in New River
Household Income Brackets in New River
With 1,465 households falling in the category, the $100,000 to $149,999 income range is the most frequent in New River, accounting for 21.1% of all households. In contrast, only 42 households (0.6%) fall into the $10,000 to $14,999 income bracket, making it the least populous group.
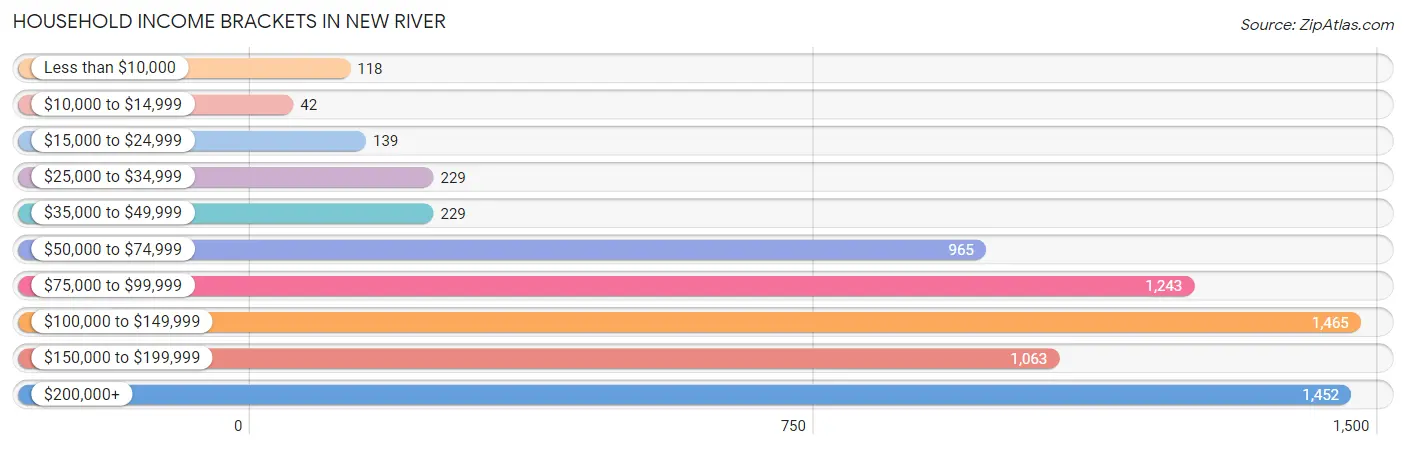
| Income Bracket | # Households | % Households |
| Less than $10,000 | 118 | 1.7% |
| $10,000 to $14,999 | 42 | 0.6% |
| $15,000 to $24,999 | 139 | 2.0% |
| $25,000 to $34,999 | 229 | 3.3% |
| $35,000 to $49,999 | 229 | 3.3% |
| $50,000 to $74,999 | 965 | 13.9% |
| $75,000 to $99,999 | 1,243 | 17.9% |
| $100,000 to $149,999 | 1,465 | 21.1% |
| $150,000 to $199,999 | 1,063 | 15.3% |
| $200,000+ | 1,452 | 20.9% |
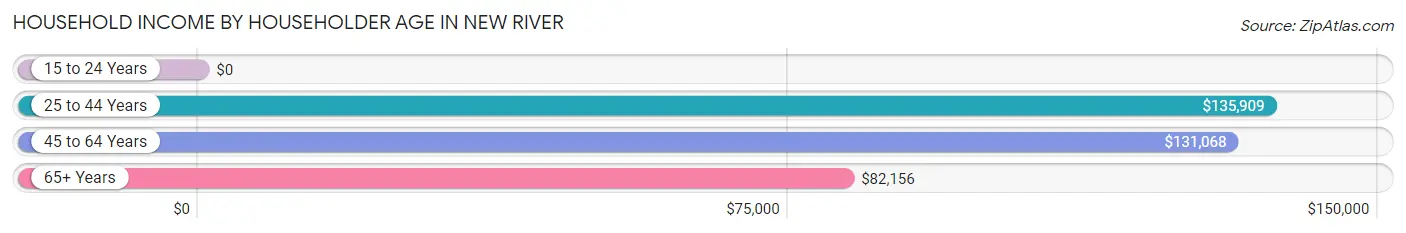
Household Income by Householder Age in New River
The median household income in New River is $116,837, with the highest median household income of $135,909 found in the 25 to 44 years age bracket for the primary householder. A total of 1,124 households (16.2%) fall into this category.
| Income Bracket | # Households | Median Income |
| 15 to 24 Years | 0 (0.0%) | $0 |
| 25 to 44 Years | 1,124 (16.2%) | $135,909 |
| 45 to 64 Years | 3,761 (54.1%) | $131,068 |
| 65+ Years | 2,060 (29.7%) | $82,156 |
| Total | 6,945 (100.0%) | $116,837 |
Poverty in New River
Income Below Poverty by Sex and Age in New River
With 2.7% poverty level for males and 3.5% for females among the residents of New River, 75 year old and over males and 75 year old and over females are the most vulnerable to poverty, with 41 males (8.3%) and 55 females (11.3%) in their respective age groups living below the poverty level.
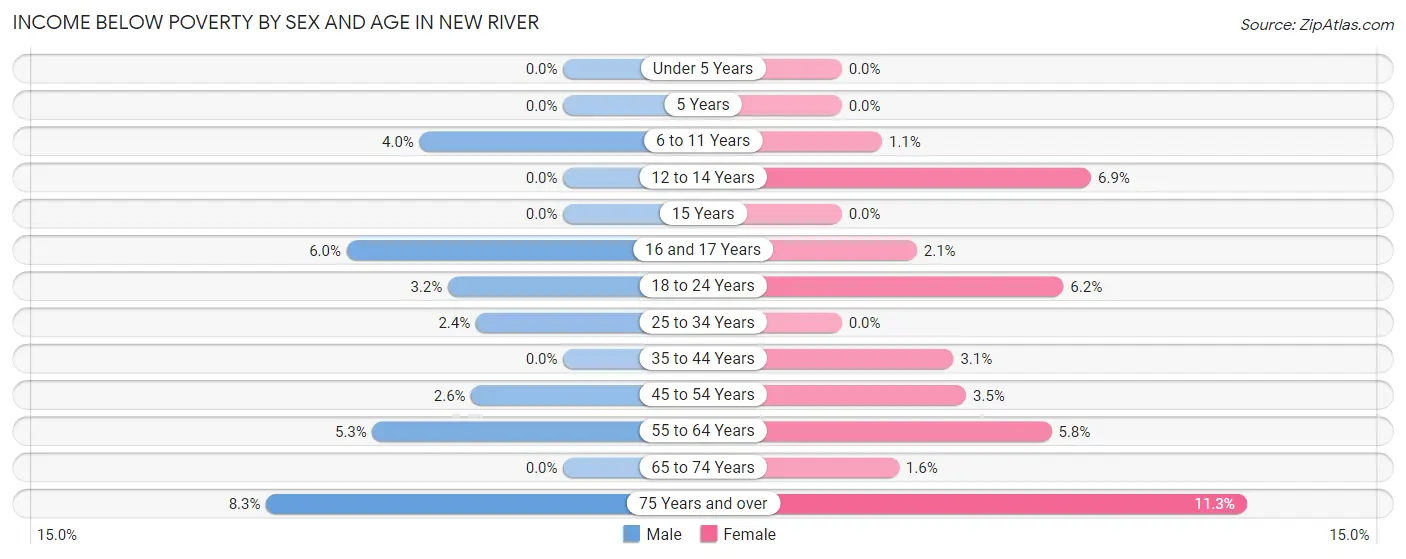
| Age Bracket | Male | Female |
| Under 5 Years | 0 (0.0%) | 0 (0.0%) |
| 5 Years | 0 (0.0%) | 0 (0.0%) |
| 6 to 11 Years | 16 (4.0%) | 9 (1.1%) |
| 12 to 14 Years | 0 (0.0%) | 29 (6.9%) |
| 15 Years | 0 (0.0%) | 0 (0.0%) |
| 16 and 17 Years | 14 (6.0%) | 5 (2.1%) |
| 18 to 24 Years | 15 (3.2%) | 23 (6.2%) |
| 25 to 34 Years | 19 (2.4%) | 0 (0.0%) |
| 35 to 44 Years | 0 (0.0%) | 28 (3.1%) |
| 45 to 54 Years | 44 (2.6%) | 61 (3.5%) |
| 55 to 64 Years | 100 (5.3%) | 96 (5.8%) |
| 65 to 74 Years | 0 (0.0%) | 20 (1.6%) |
| 75 Years and over | 41 (8.3%) | 55 (11.3%) |
| Total | 249 (2.7%) | 326 (3.5%) |
Income Above Poverty by Sex and Age in New River
According to the poverty statistics in New River, males aged under 5 years and females aged under 5 years are the age groups that are most secure financially, with 100.0% of males and 100.0% of females in these age groups living above the poverty line.
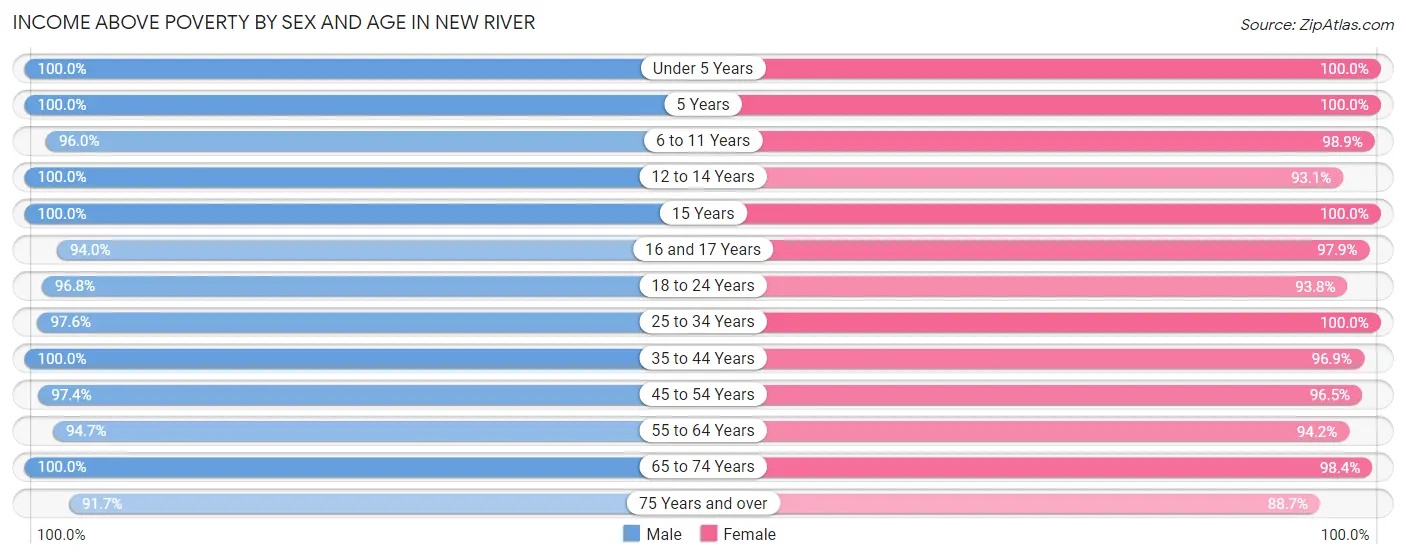
| Age Bracket | Male | Female |
| Under 5 Years | 642 (100.0%) | 406 (100.0%) |
| 5 Years | 130 (100.0%) | 29 (100.0%) |
| 6 to 11 Years | 384 (96.0%) | 793 (98.9%) |
| 12 to 14 Years | 218 (100.0%) | 389 (93.1%) |
| 15 Years | 141 (100.0%) | 91 (100.0%) |
| 16 and 17 Years | 218 (94.0%) | 234 (97.9%) |
| 18 to 24 Years | 453 (96.8%) | 350 (93.8%) |
| 25 to 34 Years | 763 (97.6%) | 768 (100.0%) |
| 35 to 44 Years | 783 (100.0%) | 873 (96.9%) |
| 45 to 54 Years | 1,675 (97.4%) | 1,702 (96.5%) |
| 55 to 64 Years | 1,783 (94.7%) | 1,547 (94.2%) |
| 65 to 74 Years | 1,222 (100.0%) | 1,236 (98.4%) |
| 75 Years and over | 455 (91.7%) | 433 (88.7%) |
| Total | 8,867 (97.3%) | 8,851 (96.5%) |
Income Below Poverty Among Married-Couple Families in New River
The poverty statistics for married-couple families in New River show that 2.0% or 94 of the total 4,791 families live below the poverty line. Families with no children have the highest poverty rate of 2.9%, comprising of 89 families. On the other hand, families with 3 or 4 children have the lowest poverty rate of 0.0%, which includes 0 families.
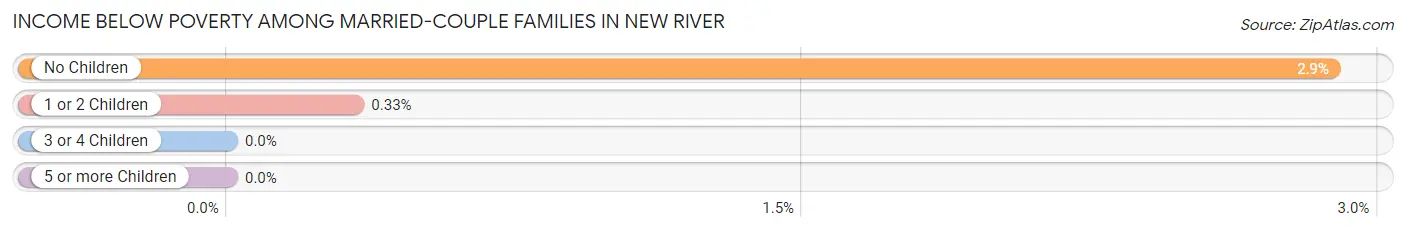
| Children | Above Poverty | Below Poverty |
| No Children | 2,999 (97.1%) | 89 (2.9%) |
| 1 or 2 Children | 1,514 (99.7%) | 5 (0.3%) |
| 3 or 4 Children | 137 (100.0%) | 0 (0.0%) |
| 5 or more Children | 47 (100.0%) | 0 (0.0%) |
| Total | 4,697 (98.0%) | 94 (2.0%) |
Income Below Poverty Among Single-Parent Households in New River
According to the poverty data in New River, 1.9% or 5 single-father households and 9.3% or 18 single-mother households are living below the poverty line. Among single-father households, those with 1 or 2 children have the highest poverty rate, with 5 households (7.7%) experiencing poverty. Likewise, among single-mother households, those with 3 or 4 children have the highest poverty rate, with 5 households (38.5%) falling below the poverty line.
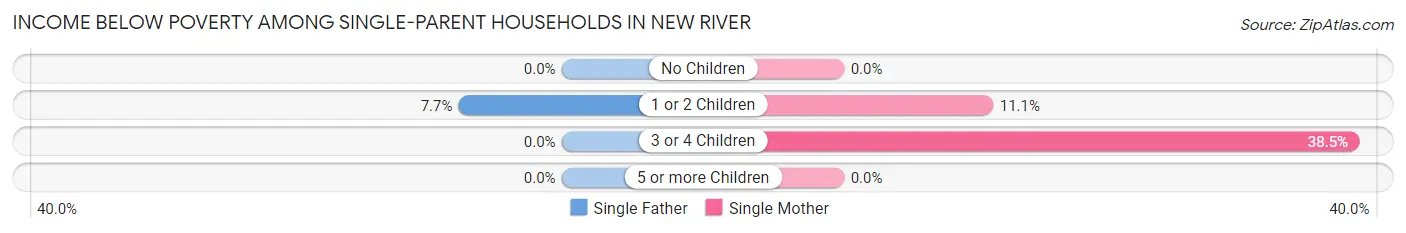
| Children | Single Father | Single Mother |
| No Children | 0 (0.0%) | 0 (0.0%) |
| 1 or 2 Children | 5 (7.7%) | 13 (11.1%) |
| 3 or 4 Children | 0 (0.0%) | 5 (38.5%) |
| 5 or more Children | 0 (0.0%) | 0 (0.0%) |
| Total | 5 (1.9%) | 18 (9.3%) |
Income Below Poverty Among Married-Couple vs Single-Parent Households in New River
The poverty data for New River shows that 94 of the married-couple family households (2.0%) and 23 of the single-parent households (5.1%) are living below the poverty level. Within the married-couple family households, those with no children have the highest poverty rate, with 89 households (2.9%) falling below the poverty line. Among the single-parent households, those with 1 or 2 children have the highest poverty rate, with 18 household (9.9%) living below poverty.
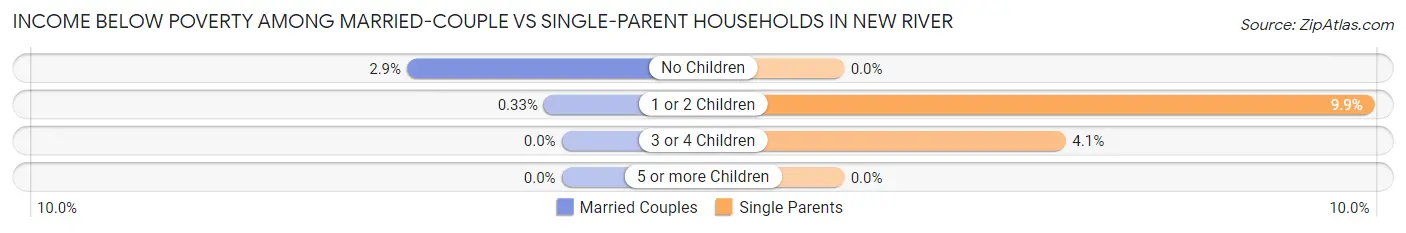
| Children | Married-Couple Families | Single-Parent Households |
| No Children | 89 (2.9%) | 0 (0.0%) |
| 1 or 2 Children | 5 (0.3%) | 18 (9.9%) |
| 3 or 4 Children | 0 (0.0%) | 5 (4.1%) |
| 5 or more Children | 0 (0.0%) | 0 (0.0%) |
| Total | 94 (2.0%) | 23 (5.1%) |
Race in New River
The most populous races in New River are White / Caucasian (16,579 | 90.0%), Hispanic or Latino (1,563 | 8.5%), and Two or more Races (864 | 4.7%).
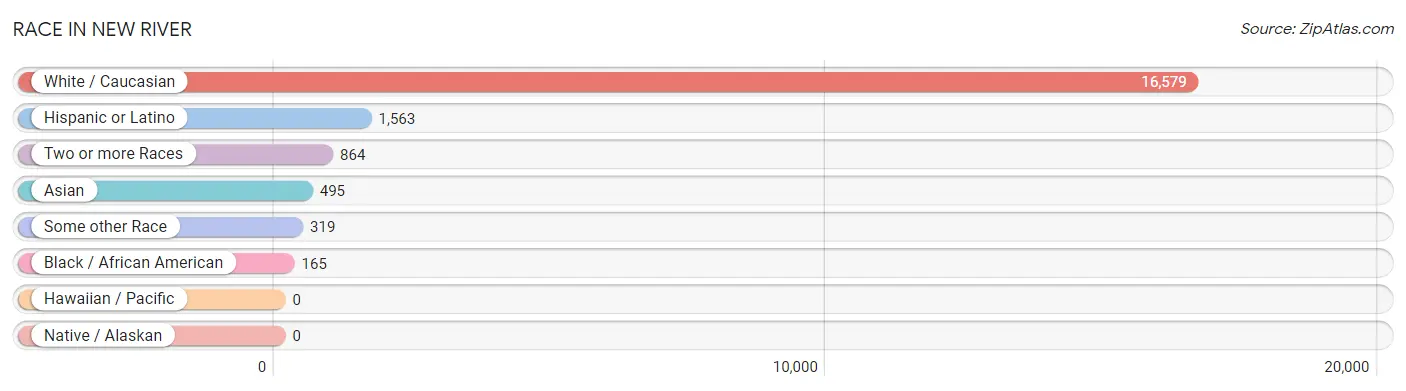
| Race | # Population | % Population |
| Asian | 495 | 2.7% |
| Black / African American | 165 | 0.9% |
| Hawaiian / Pacific | 0 | 0.0% |
| Hispanic or Latino | 1,563 | 8.5% |
| Native / Alaskan | 0 | 0.0% |
| White / Caucasian | 16,579 | 90.0% |
| Two or more Races | 864 | 4.7% |
| Some other Race | 319 | 1.7% |
| Total | 18,422 | 100.0% |
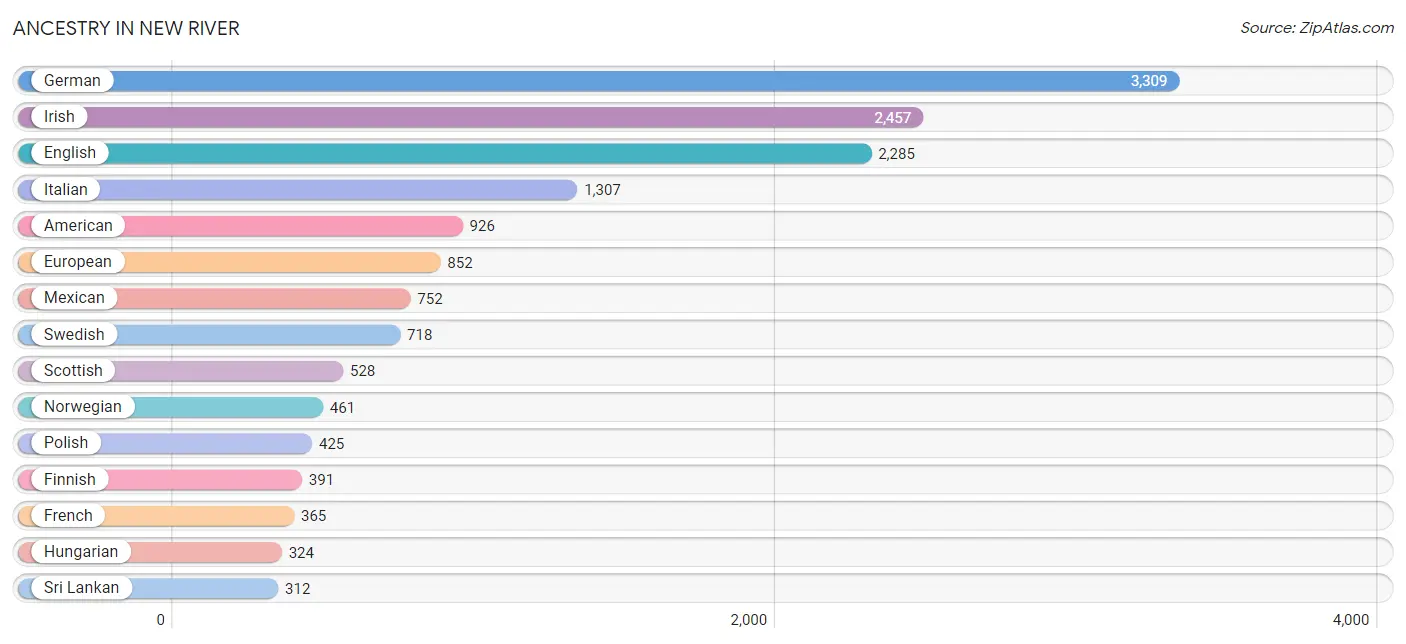
Ancestry in New River
The most populous ancestries reported in New River are German (3,309 | 18.0%), Irish (2,457 | 13.3%), English (2,285 | 12.4%), Italian (1,307 | 7.1%), and American (926 | 5.0%), together accounting for 55.8% of all New River residents.
| Ancestry | # Population | % Population |
| African | 28 | 0.2% |
| Albanian | 73 | 0.4% |
| American | 926 | 5.0% |
| Armenian | 15 | 0.1% |
| Belgian | 17 | 0.1% |
| Bhutanese | 85 | 0.5% |
| British | 136 | 0.7% |
| Burmese | 40 | 0.2% |
| Canadian | 55 | 0.3% |
| Cherokee | 14 | 0.1% |
| Czech | 25 | 0.1% |
| Czechoslovakian | 56 | 0.3% |
| Danish | 67 | 0.4% |
| Dutch | 162 | 0.9% |
| Eastern European | 57 | 0.3% |
| Ecuadorian | 262 | 1.4% |
| English | 2,285 | 12.4% |
| Estonian | 5 | 0.0% |
| Ethiopian | 15 | 0.1% |
| European | 852 | 4.6% |
| Finnish | 391 | 2.1% |
| French | 365 | 2.0% |
| French Canadian | 20 | 0.1% |
| German | 3,309 | 18.0% |
| Greek | 80 | 0.4% |
| Hungarian | 324 | 1.8% |
| Indian (Asian) | 88 | 0.5% |
| Irish | 2,457 | 13.3% |
| Italian | 1,307 | 7.1% |
| Korean | 29 | 0.2% |
| Latvian | 19 | 0.1% |
| Lithuanian | 27 | 0.2% |
| Mexican | 752 | 4.1% |
| Nigerian | 15 | 0.1% |
| Northern European | 88 | 0.5% |
| Norwegian | 461 | 2.5% |
| Peruvian | 5 | 0.0% |
| Polish | 425 | 2.3% |
| Portuguese | 50 | 0.3% |
| Puerto Rican | 42 | 0.2% |
| Russian | 133 | 0.7% |
| Scandinavian | 25 | 0.1% |
| Scotch-Irish | 270 | 1.5% |
| Scottish | 528 | 2.9% |
| Slavic | 4 | 0.0% |
| Slovak | 107 | 0.6% |
| Slovene | 11 | 0.1% |
| South American | 267 | 1.5% |
| Spaniard | 88 | 0.5% |
| Spanish | 230 | 1.3% |
| Sri Lankan | 312 | 1.7% |
| Subsaharan African | 58 | 0.3% |
| Swedish | 718 | 3.9% |
| Swiss | 122 | 0.7% |
| Thai | 27 | 0.2% |
| Ukrainian | 96 | 0.5% |
| Welsh | 182 | 1.0% |
| Yugoslavian | 25 | 0.1% | View All 58 Rows |
Immigrants in New River
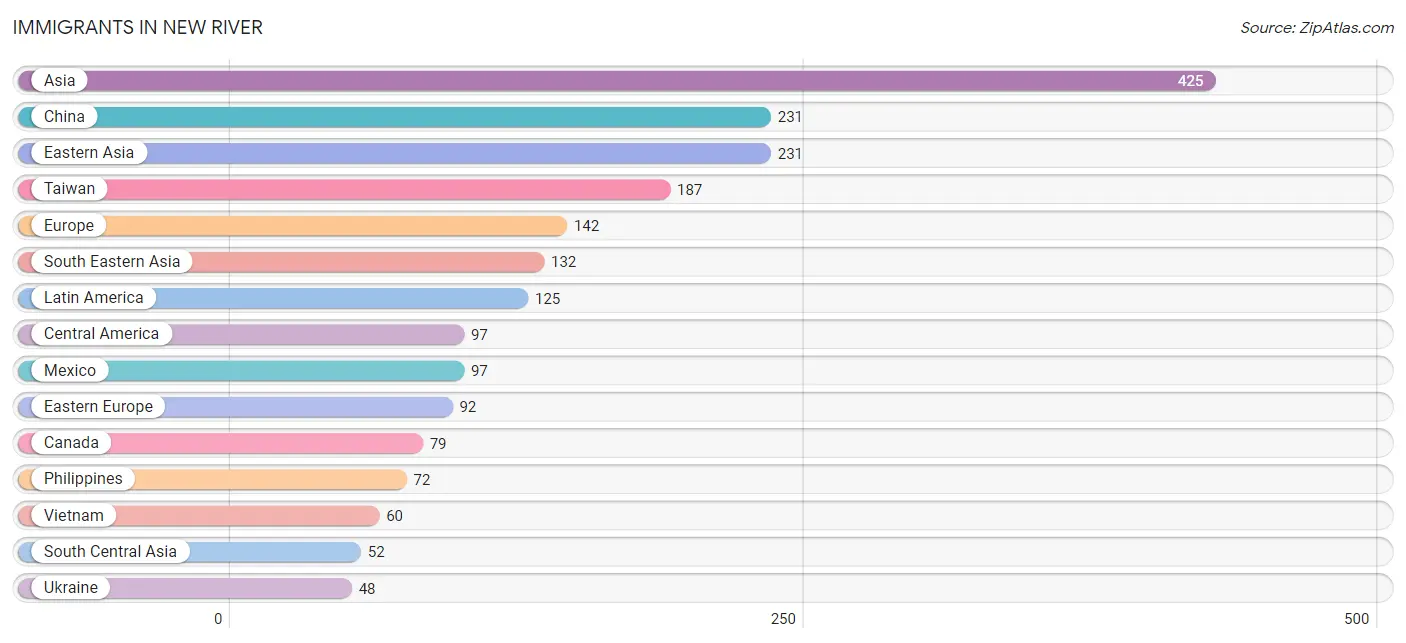
The most numerous immigrant groups reported in New River came from Asia (425 | 2.3%), China (231 | 1.3%), Eastern Asia (231 | 1.3%), Taiwan (187 | 1.0%), and Europe (142 | 0.8%), together accounting for 6.6% of all New River residents.
| Immigration Origin | # Population | % Population |
| Africa | 27 | 0.2% |
| Asia | 425 | 2.3% |
| Austria | 4 | 0.0% |
| Canada | 79 | 0.4% |
| Central America | 97 | 0.5% |
| China | 231 | 1.3% |
| Eastern Africa | 23 | 0.1% |
| Eastern Asia | 231 | 1.3% |
| Eastern Europe | 92 | 0.5% |
| Ecuador | 28 | 0.2% |
| Ethiopia | 23 | 0.1% |
| Europe | 142 | 0.8% |
| Germany | 42 | 0.2% |
| India | 27 | 0.2% |
| Israel | 10 | 0.1% |
| Latin America | 125 | 0.7% |
| Mexico | 97 | 0.5% |
| Northern Africa | 4 | 0.0% |
| Northern Europe | 4 | 0.0% |
| Pakistan | 25 | 0.1% |
| Philippines | 72 | 0.4% |
| Poland | 8 | 0.0% |
| South America | 28 | 0.2% |
| South Central Asia | 52 | 0.3% |
| South Eastern Asia | 132 | 0.7% |
| Taiwan | 187 | 1.0% |
| Ukraine | 48 | 0.3% |
| Vietnam | 60 | 0.3% |
| Western Asia | 10 | 0.1% |
| Western Europe | 46 | 0.3% | View All 30 Rows |
Sex and Age in New River
Sex and Age in New River
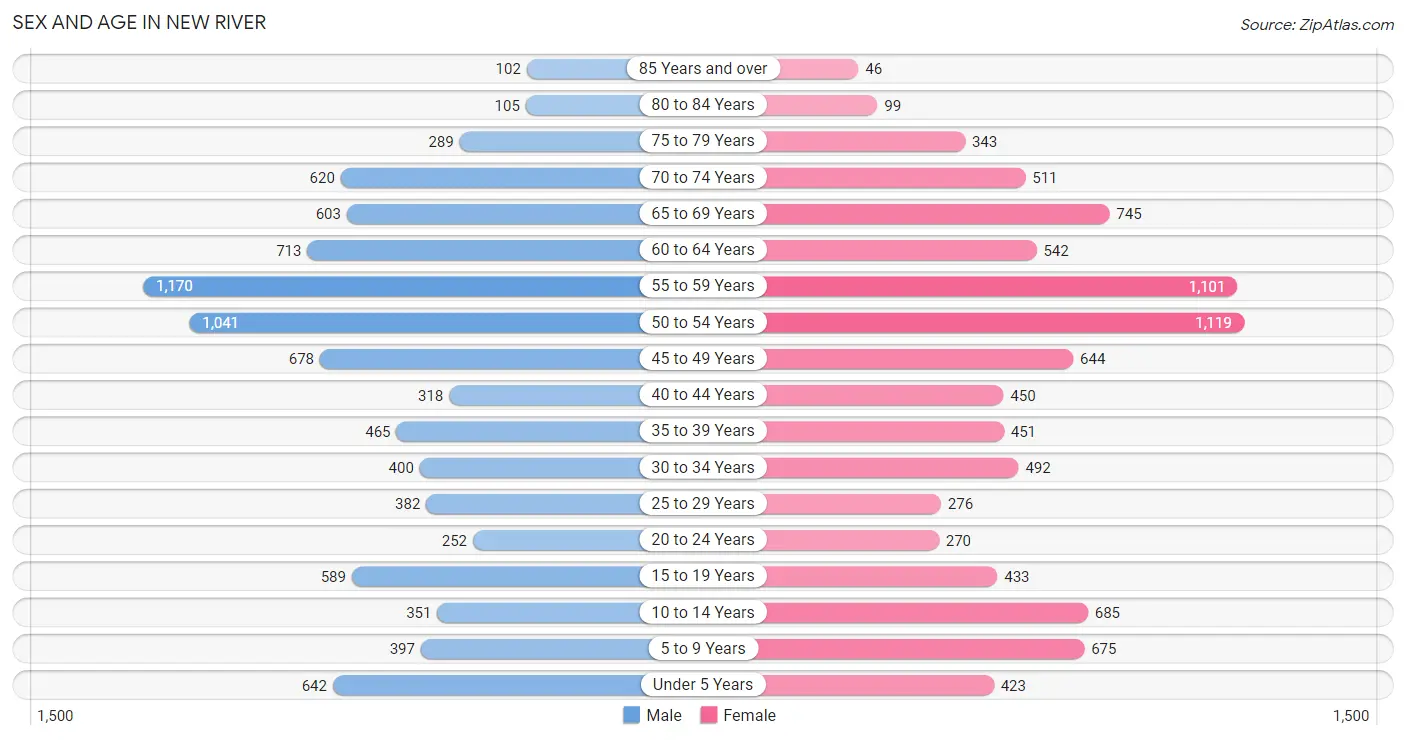
The most populous age groups in New River are 55 to 59 Years (1,170 | 12.8%) for men and 50 to 54 Years (1,119 | 12.0%) for women.
| Age Bracket | Male | Female |
| Under 5 Years | 642 (7.0%) | 423 (4.5%) |
| 5 to 9 Years | 397 (4.3%) | 675 (7.2%) |
| 10 to 14 Years | 351 (3.8%) | 685 (7.4%) |
| 15 to 19 Years | 589 (6.5%) | 433 (4.6%) |
| 20 to 24 Years | 252 (2.8%) | 270 (2.9%) |
| 25 to 29 Years | 382 (4.2%) | 276 (3.0%) |
| 30 to 34 Years | 400 (4.4%) | 492 (5.3%) |
| 35 to 39 Years | 465 (5.1%) | 451 (4.9%) |
| 40 to 44 Years | 318 (3.5%) | 450 (4.8%) |
| 45 to 49 Years | 678 (7.4%) | 644 (6.9%) |
| 50 to 54 Years | 1,041 (11.4%) | 1,119 (12.0%) |
| 55 to 59 Years | 1,170 (12.8%) | 1,101 (11.8%) |
| 60 to 64 Years | 713 (7.8%) | 542 (5.8%) |
| 65 to 69 Years | 603 (6.6%) | 745 (8.0%) |
| 70 to 74 Years | 620 (6.8%) | 511 (5.5%) |
| 75 to 79 Years | 289 (3.2%) | 343 (3.7%) |
| 80 to 84 Years | 105 (1.1%) | 99 (1.1%) |
| 85 Years and over | 102 (1.1%) | 46 (0.5%) |
| Total | 9,117 (100.0%) | 9,305 (100.0%) |
Families and Households in New River
Median Family Size in New River
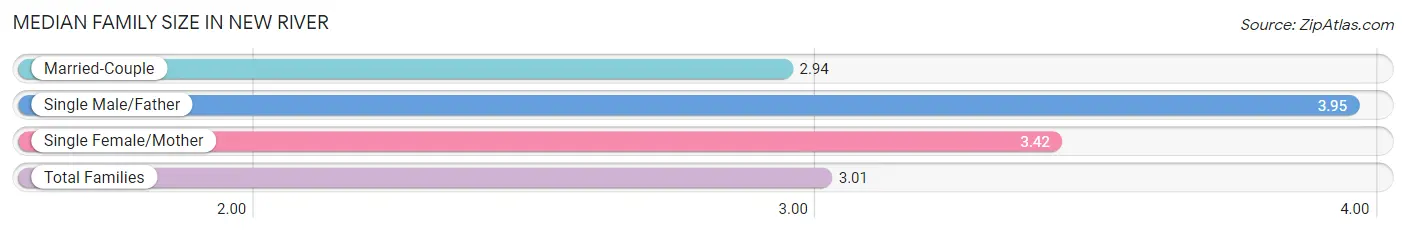
The median family size in New River is 3.01 persons per family, with single male/father families (256 | 4.9%) accounting for the largest median family size of 3.95 persons per family. On the other hand, married-couple families (4,791 | 91.4%) represent the smallest median family size with 2.94 persons per family.
| Family Type | # Families | Family Size |
| Married-Couple | 4,791 (91.4%) | 2.94 |
| Single Male/Father | 256 (4.9%) | 3.95 |
| Single Female/Mother | 193 (3.7%) | 3.42 |
| Total Families | 5,240 (100.0%) | 3.01 |
Median Household Size in New River
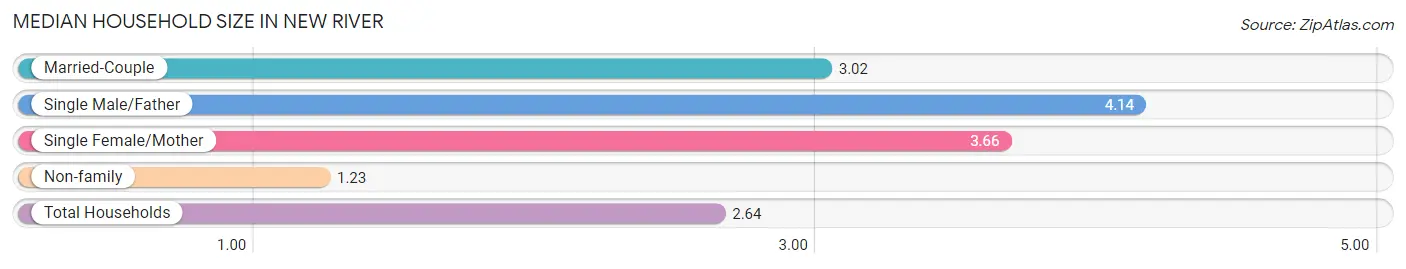
The median household size in New River is 2.64 persons per household, with single male/father households (256 | 3.7%) accounting for the largest median household size of 4.14 persons per household. non-family households (1,705 | 24.5%) represent the smallest median household size with 1.23 persons per household.
| Household Type | # Households | Household Size |
| Married-Couple | 4,791 (69.0%) | 3.02 |
| Single Male/Father | 256 (3.7%) | 4.14 |
| Single Female/Mother | 193 (2.8%) | 3.66 |
| Non-family | 1,705 (24.5%) | 1.23 |
| Total Households | 6,945 (100.0%) | 2.64 |
Household Size by Marriage Status in New River
Out of a total of 6,945 households in New River, 5,240 (75.4%) are family households, while 1,705 (24.5%) are nonfamily households. The most numerous type of family households are 2-person households, comprising 2,594, and the most common type of nonfamily households are 1-person households, comprising 1,303.
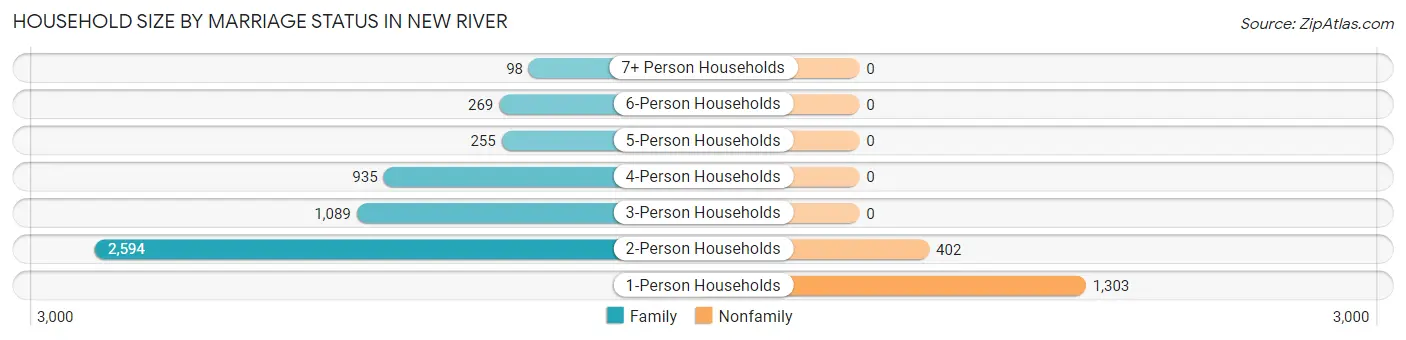
| Household Size | Family Households | Nonfamily Households |
| 1-Person Households | - | 1,303 (18.8%) |
| 2-Person Households | 2,594 (37.3%) | 402 (5.8%) |
| 3-Person Households | 1,089 (15.7%) | 0 (0.0%) |
| 4-Person Households | 935 (13.5%) | 0 (0.0%) |
| 5-Person Households | 255 (3.7%) | 0 (0.0%) |
| 6-Person Households | 269 (3.9%) | 0 (0.0%) |
| 7+ Person Households | 98 (1.4%) | 0 (0.0%) |
| Total | 5,240 (75.4%) | 1,705 (24.5%) |
Female Fertility in New River
Fertility by Age in New River
Average fertility rate in New River is 45.0 births per 1,000 women. Women in the age bracket of 20 to 34 years have the highest fertility rate with 114.0 births per 1,000 women. Women in the age bracket of 20 to 34 years acount for 83.7% of all women with births.
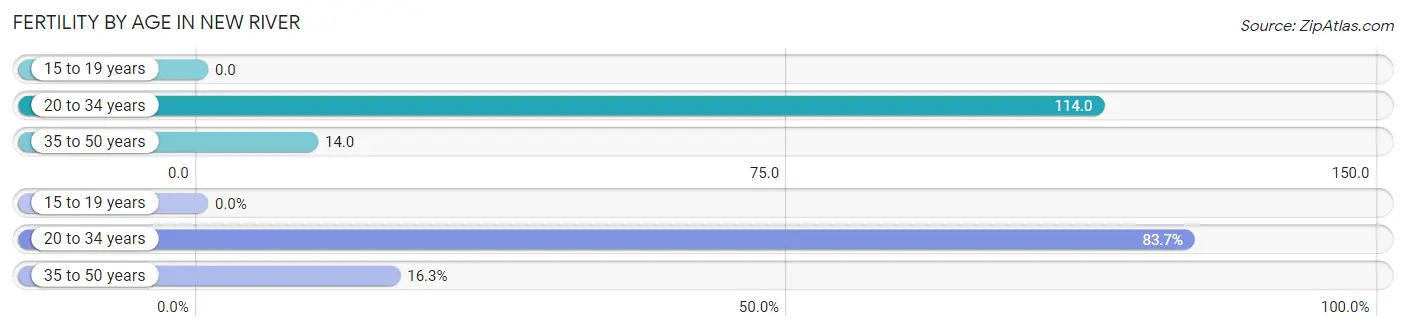
| Age Bracket | Women with Births | Births / 1,000 Women |
| 15 to 19 years | 0 (0.0%) | 0.0 |
| 20 to 34 years | 118 (83.7%) | 114.0 |
| 35 to 50 years | 23 (16.3%) | 14.0 |
| Total | 141 (100.0%) | 45.0 |
Fertility by Age by Marriage Status in New River
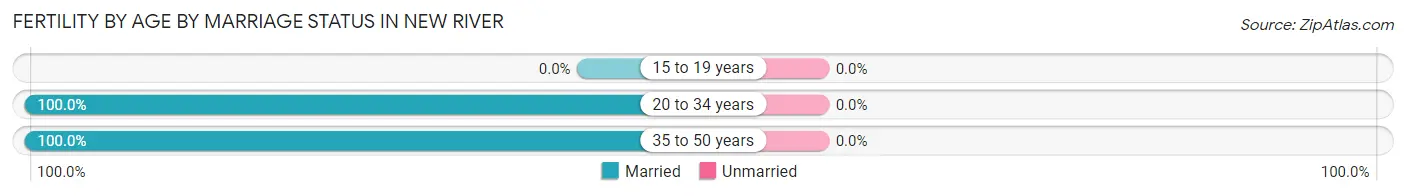
| Age Bracket | Married | Unmarried |
| 15 to 19 years | 0 (0.0%) | 0 (0.0%) |
| 20 to 34 years | 118 (100.0%) | 0 (0.0%) |
| 35 to 50 years | 23 (100.0%) | 0 (0.0%) |
| Total | 141 (100.0%) | 0 (0.0%) |
Fertility by Education in New River
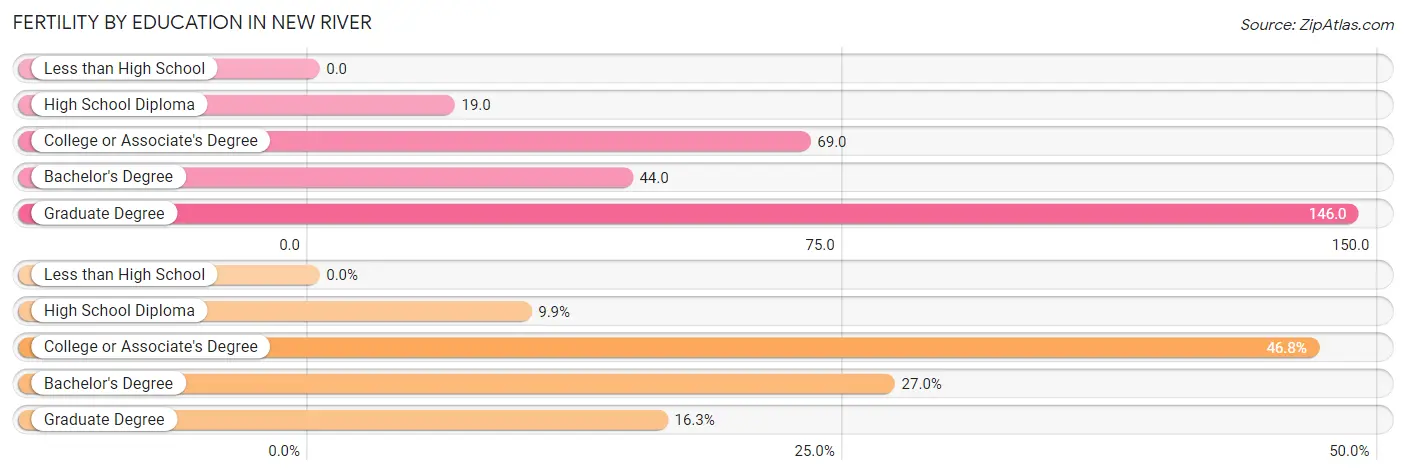
| Educational Attainment | Women with Births | Births / 1,000 Women |
| Less than High School | 0 (0.0%) | 0.0 |
| High School Diploma | 14 (9.9%) | 19.0 |
| College or Associate's Degree | 66 (46.8%) | 69.0 |
| Bachelor's Degree | 38 (27.0%) | 44.0 |
| Graduate Degree | 23 (16.3%) | 146.0 |
| Total | 141 (100.0%) | 45.0 |
Fertility by Education by Marriage Status in New River
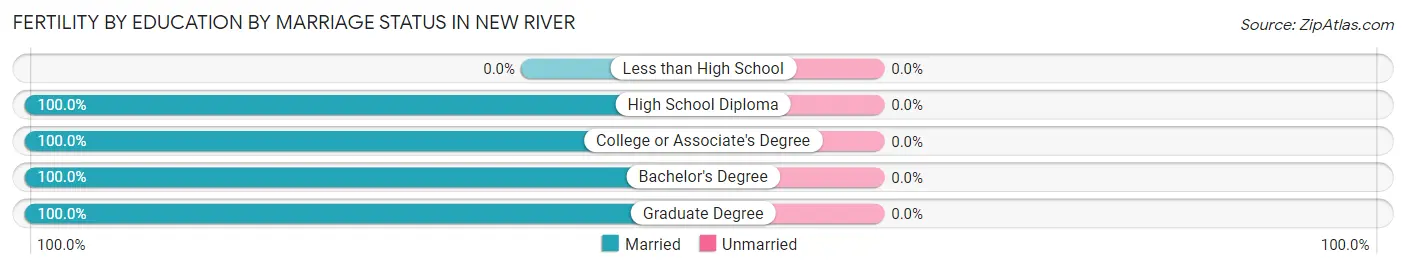
| Educational Attainment | Married | Unmarried |
| Less than High School | 0 (0.0%) | 0 (0.0%) |
| High School Diploma | 14 (100.0%) | 0 (0.0%) |
| College or Associate's Degree | 66 (100.0%) | 0 (0.0%) |
| Bachelor's Degree | 38 (100.0%) | 0 (0.0%) |
| Graduate Degree | 23 (100.0%) | 0 (0.0%) |
| Total | 141 (100.0%) | 0 (0.0%) |
Employment Characteristics in New River
Employment by Class of Employer in New River
Among the 9,913 employed individuals in New River, private company employees (6,544 | 66.0%), self-employed (not incorporated) (1,032 | 10.4%), and self-employed (incorporated) (830 | 8.4%) make up the most common classes of employment.
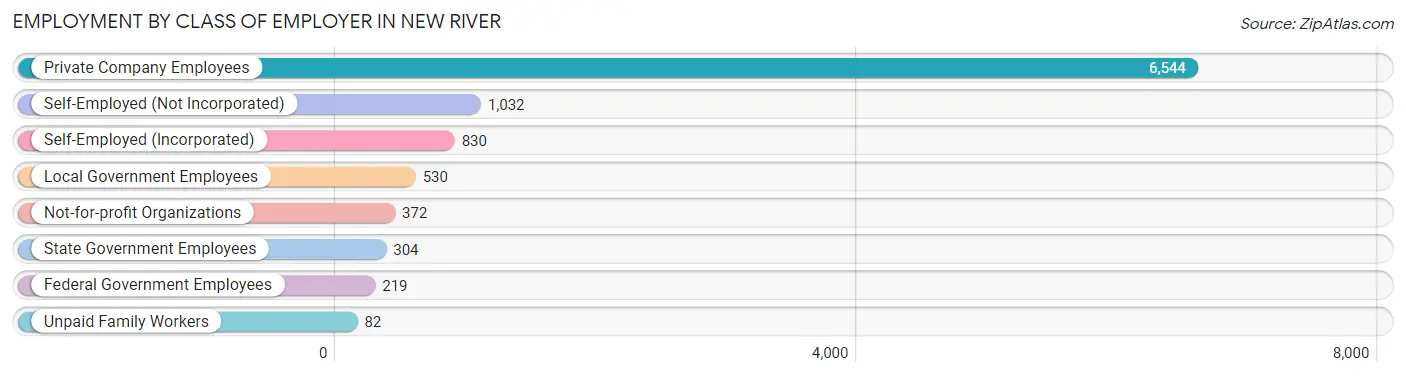
| Employer Class | # Employees | % Employees |
| Private Company Employees | 6,544 | 66.0% |
| Self-Employed (Incorporated) | 830 | 8.4% |
| Self-Employed (Not Incorporated) | 1,032 | 10.4% |
| Not-for-profit Organizations | 372 | 3.7% |
| Local Government Employees | 530 | 5.3% |
| State Government Employees | 304 | 3.1% |
| Federal Government Employees | 219 | 2.2% |
| Unpaid Family Workers | 82 | 0.8% |
| Total | 9,913 | 100.0% |
Employment Status by Age in New River
According to the labor force statistics for New River, out of the total population over 16 years of age (15,017), 68.8% or 10,332 individuals are in the labor force, with 2.2% or 227 of them unemployed. The age group with the highest labor force participation rate is 35 to 44 years, with 87.7% or 1,477 individuals in the labor force. Within the labor force, the 20 to 24 years age range has the highest percentage of unemployed individuals, with 32.1% or 143 of them being unemployed.
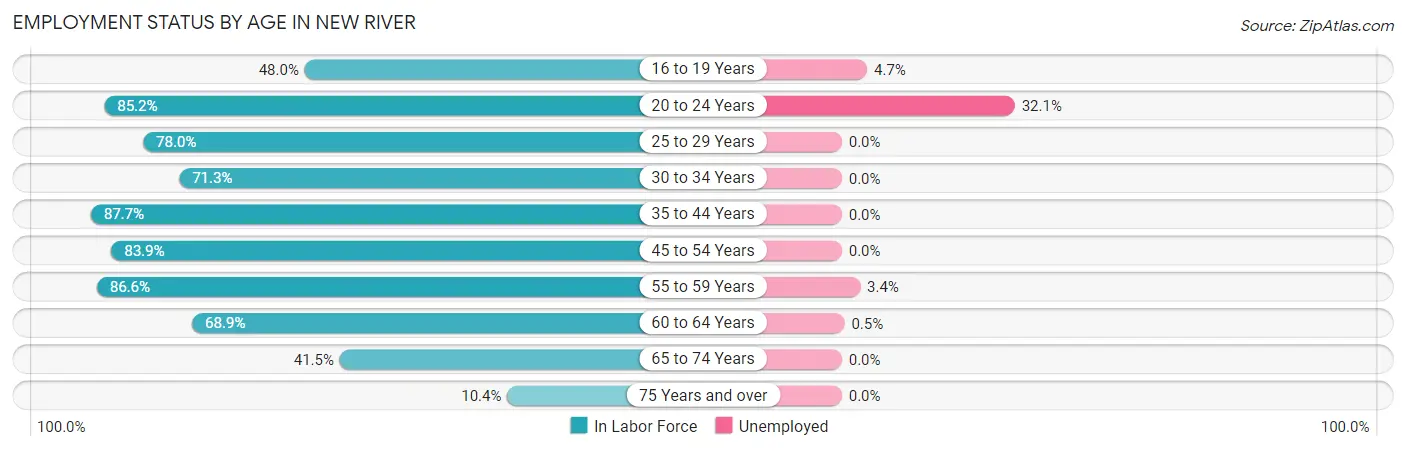
| Age Bracket | In Labor Force | Unemployed |
| 16 to 19 Years | 379 (48.0%) | 18 (4.7%) |
| 20 to 24 Years | 445 (85.2%) | 143 (32.1%) |
| 25 to 29 Years | 513 (78.0%) | 0 (0.0%) |
| 30 to 34 Years | 636 (71.3%) | 0 (0.0%) |
| 35 to 44 Years | 1,477 (87.7%) | 0 (0.0%) |
| 45 to 54 Years | 2,921 (83.9%) | 0 (0.0%) |
| 55 to 59 Years | 1,967 (86.6%) | 67 (3.4%) |
| 60 to 64 Years | 865 (68.9%) | 4 (0.5%) |
| 65 to 74 Years | 1,029 (41.5%) | 0 (0.0%) |
| 75 Years and over | 102 (10.4%) | 0 (0.0%) |
| Total | 10,332 (68.8%) | 227 (2.2%) |
Employment Status by Educational Attainment in New River
According to labor force statistics for New River, 81.8% of individuals (8,378) out of the total population between 25 and 64 years of age (10,242) are in the labor force, with 0.8% or 67 of them being unemployed. The group with the highest labor force participation rate are those with the educational attainment of less than high school, with 87.3% or 338 individuals in the labor force. Within the labor force, individuals with less than high school education have the highest percentage of unemployment, with 8.0% or 27 of them being unemployed.
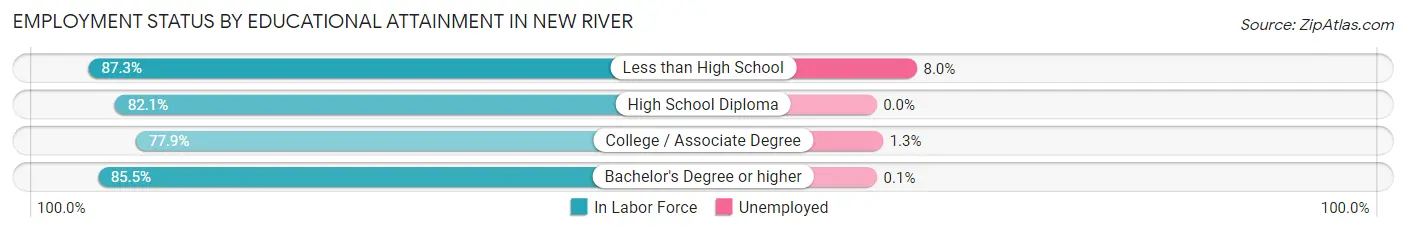
| Educational Attainment | In Labor Force | Unemployed |
| Less than High School | 338 (87.3%) | 31 (8.0%) |
| High School Diploma | 2,186 (82.1%) | 0 (0.0%) |
| College / Associate Degree | 3,012 (77.9%) | 50 (1.3%) |
| Bachelor's Degree or higher | 2,844 (85.5%) | 3 (0.1%) |
| Total | 8,378 (81.8%) | 82 (0.8%) |
Employment Occupations by Sex in New River
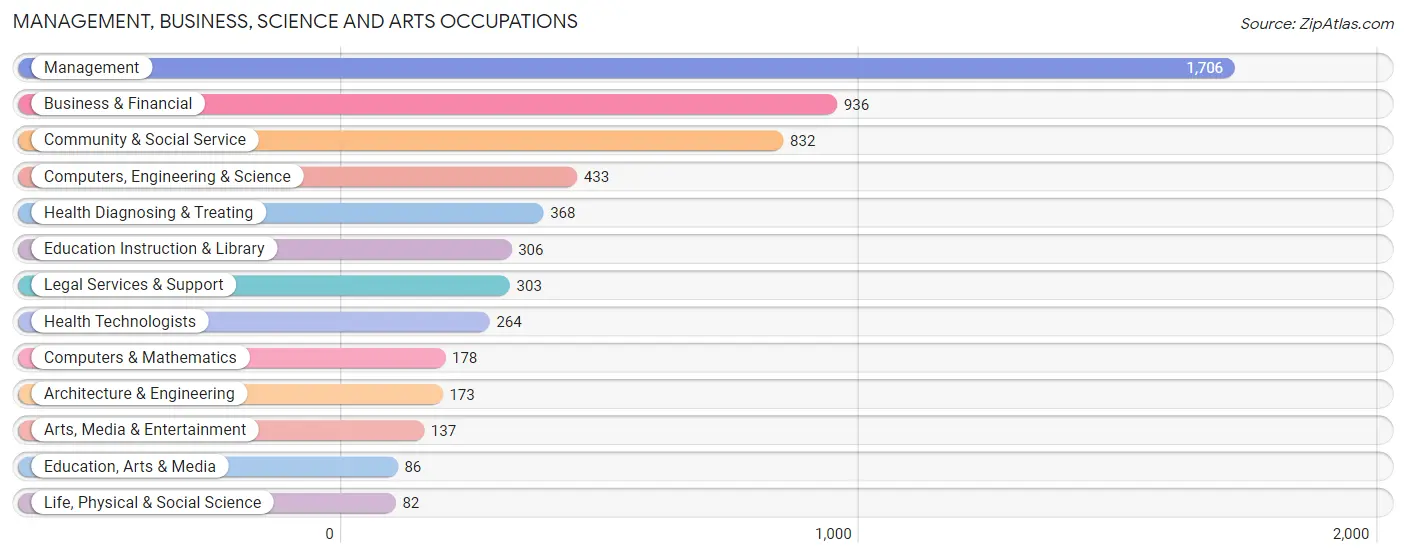
Management, Business, Science and Arts Occupations
The most common Management, Business, Science and Arts occupations in New River are Management (1,706 | 16.9%), Business & Financial (936 | 9.3%), Community & Social Service (832 | 8.3%), Computers, Engineering & Science (433 | 4.3%), and Health Diagnosing & Treating (368 | 3.6%).
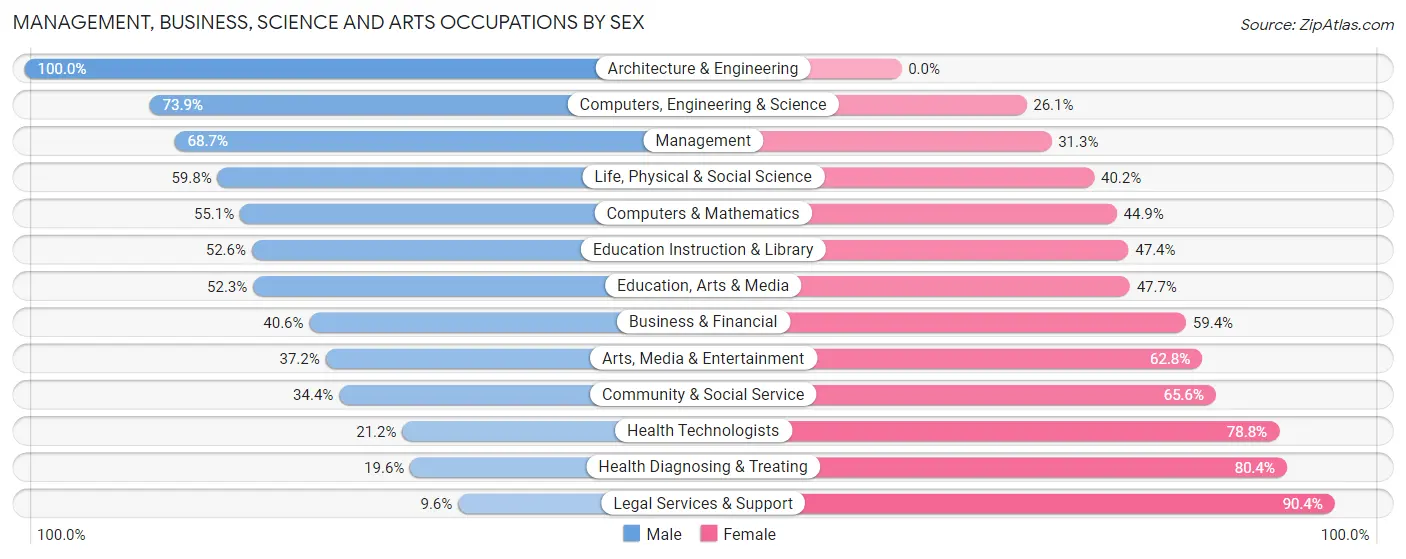
Management, Business, Science and Arts Occupations by Sex
Within the Management, Business, Science and Arts occupations in New River, the most male-oriented occupations are Architecture & Engineering (100.0%), Computers, Engineering & Science (73.9%), and Management (68.7%), while the most female-oriented occupations are Legal Services & Support (90.4%), Health Diagnosing & Treating (80.4%), and Health Technologists (78.8%).
| Occupation | Male | Female |
| Management | 1,172 (68.7%) | 534 (31.3%) |
| Business & Financial | 380 (40.6%) | 556 (59.4%) |
| Computers, Engineering & Science | 320 (73.9%) | 113 (26.1%) |
| Computers & Mathematics | 98 (55.1%) | 80 (44.9%) |
| Architecture & Engineering | 173 (100.0%) | 0 (0.0%) |
| Life, Physical & Social Science | 49 (59.8%) | 33 (40.2%) |
| Community & Social Service | 286 (34.4%) | 546 (65.6%) |
| Education, Arts & Media | 45 (52.3%) | 41 (47.7%) |
| Legal Services & Support | 29 (9.6%) | 274 (90.4%) |
| Education Instruction & Library | 161 (52.6%) | 145 (47.4%) |
| Arts, Media & Entertainment | 51 (37.2%) | 86 (62.8%) |
| Health Diagnosing & Treating | 72 (19.6%) | 296 (80.4%) |
| Health Technologists | 56 (21.2%) | 208 (78.8%) |
| Total (Category) | 2,230 (52.2%) | 2,045 (47.8%) |
| Total (Overall) | 5,529 (54.8%) | 4,555 (45.2%) |
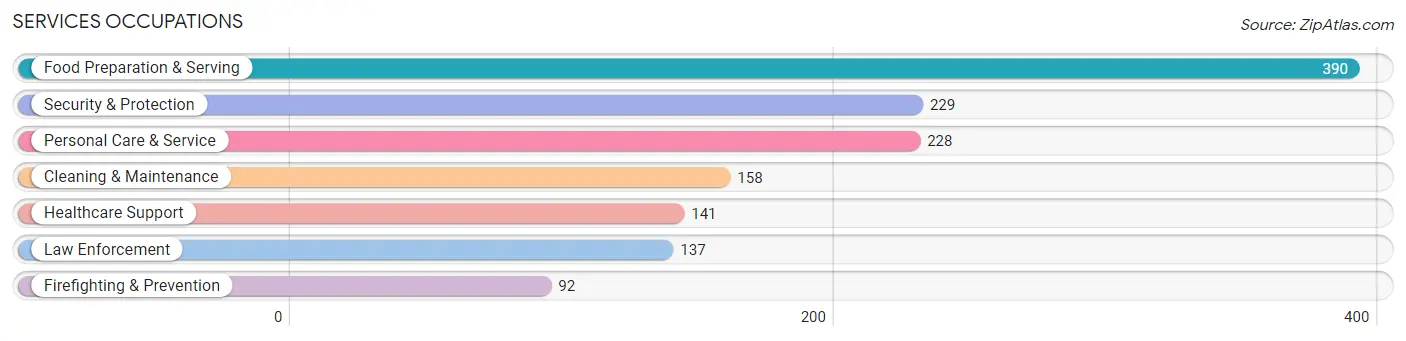
Services Occupations
The most common Services occupations in New River are Food Preparation & Serving (390 | 3.9%), Security & Protection (229 | 2.3%), Personal Care & Service (228 | 2.3%), Cleaning & Maintenance (158 | 1.6%), and Healthcare Support (141 | 1.4%).
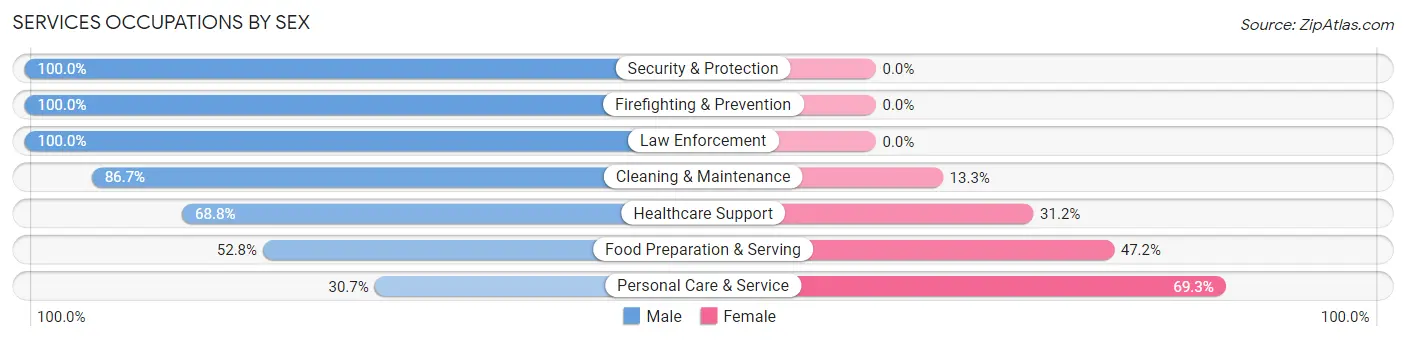
Services Occupations by Sex
Within the Services occupations in New River, the most male-oriented occupations are Security & Protection (100.0%), Firefighting & Prevention (100.0%), and Law Enforcement (100.0%), while the most female-oriented occupations are Personal Care & Service (69.3%), Food Preparation & Serving (47.2%), and Healthcare Support (31.2%).
| Occupation | Male | Female |
| Healthcare Support | 97 (68.8%) | 44 (31.2%) |
| Security & Protection | 229 (100.0%) | 0 (0.0%) |
| Firefighting & Prevention | 92 (100.0%) | 0 (0.0%) |
| Law Enforcement | 137 (100.0%) | 0 (0.0%) |
| Food Preparation & Serving | 206 (52.8%) | 184 (47.2%) |
| Cleaning & Maintenance | 137 (86.7%) | 21 (13.3%) |
| Personal Care & Service | 70 (30.7%) | 158 (69.3%) |
| Total (Category) | 739 (64.5%) | 407 (35.5%) |
| Total (Overall) | 5,529 (54.8%) | 4,555 (45.2%) |
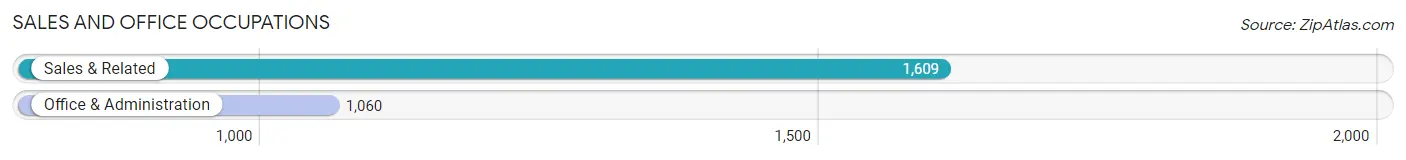
Sales and Office Occupations
The most common Sales and Office occupations in New River are Sales & Related (1,609 | 16.0%), and Office & Administration (1,060 | 10.5%).
Sales and Office Occupations by Sex
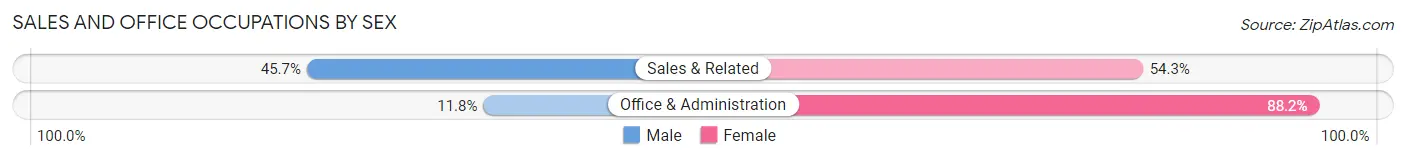
| Occupation | Male | Female |
| Sales & Related | 736 (45.7%) | 873 (54.3%) |
| Office & Administration | 125 (11.8%) | 935 (88.2%) |
| Total (Category) | 861 (32.3%) | 1,808 (67.7%) |
| Total (Overall) | 5,529 (54.8%) | 4,555 (45.2%) |
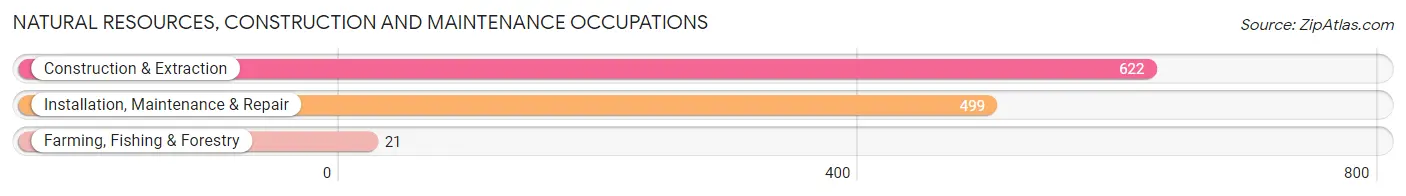
Natural Resources, Construction and Maintenance Occupations
The most common Natural Resources, Construction and Maintenance occupations in New River are Construction & Extraction (622 | 6.2%), Installation, Maintenance & Repair (499 | 5.0%), and Farming, Fishing & Forestry (21 | 0.2%).
Natural Resources, Construction and Maintenance Occupations by Sex
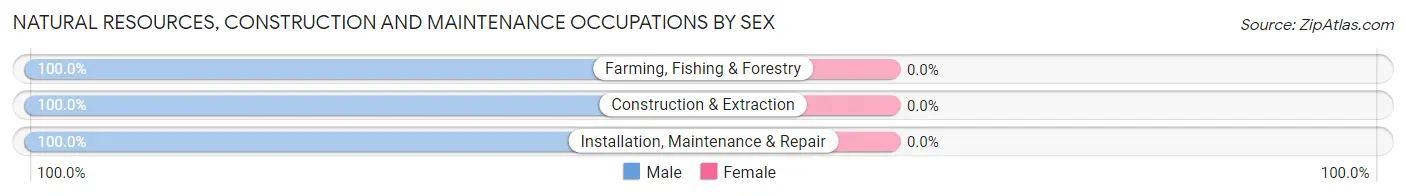
| Occupation | Male | Female |
| Farming, Fishing & Forestry | 21 (100.0%) | 0 (0.0%) |
| Construction & Extraction | 622 (100.0%) | 0 (0.0%) |
| Installation, Maintenance & Repair | 499 (100.0%) | 0 (0.0%) |
| Total (Category) | 1,142 (100.0%) | 0 (0.0%) |
| Total (Overall) | 5,529 (54.8%) | 4,555 (45.2%) |
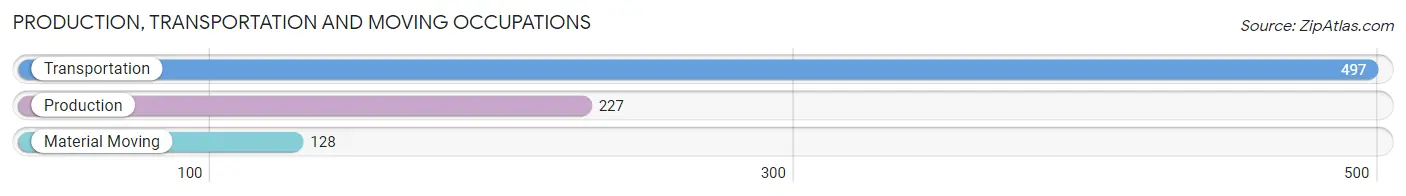
Production, Transportation and Moving Occupations
The most common Production, Transportation and Moving occupations in New River are Transportation (497 | 4.9%), Production (227 | 2.2%), and Material Moving (128 | 1.3%).
Production, Transportation and Moving Occupations by Sex
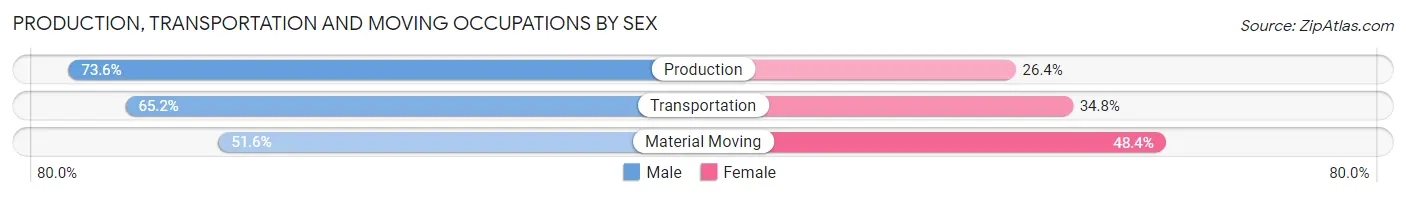
| Occupation | Male | Female |
| Production | 167 (73.6%) | 60 (26.4%) |
| Transportation | 324 (65.2%) | 173 (34.8%) |
| Material Moving | 66 (51.6%) | 62 (48.4%) |
| Total (Category) | 557 (65.4%) | 295 (34.6%) |
| Total (Overall) | 5,529 (54.8%) | 4,555 (45.2%) |
Employment Industries by Sex in New River
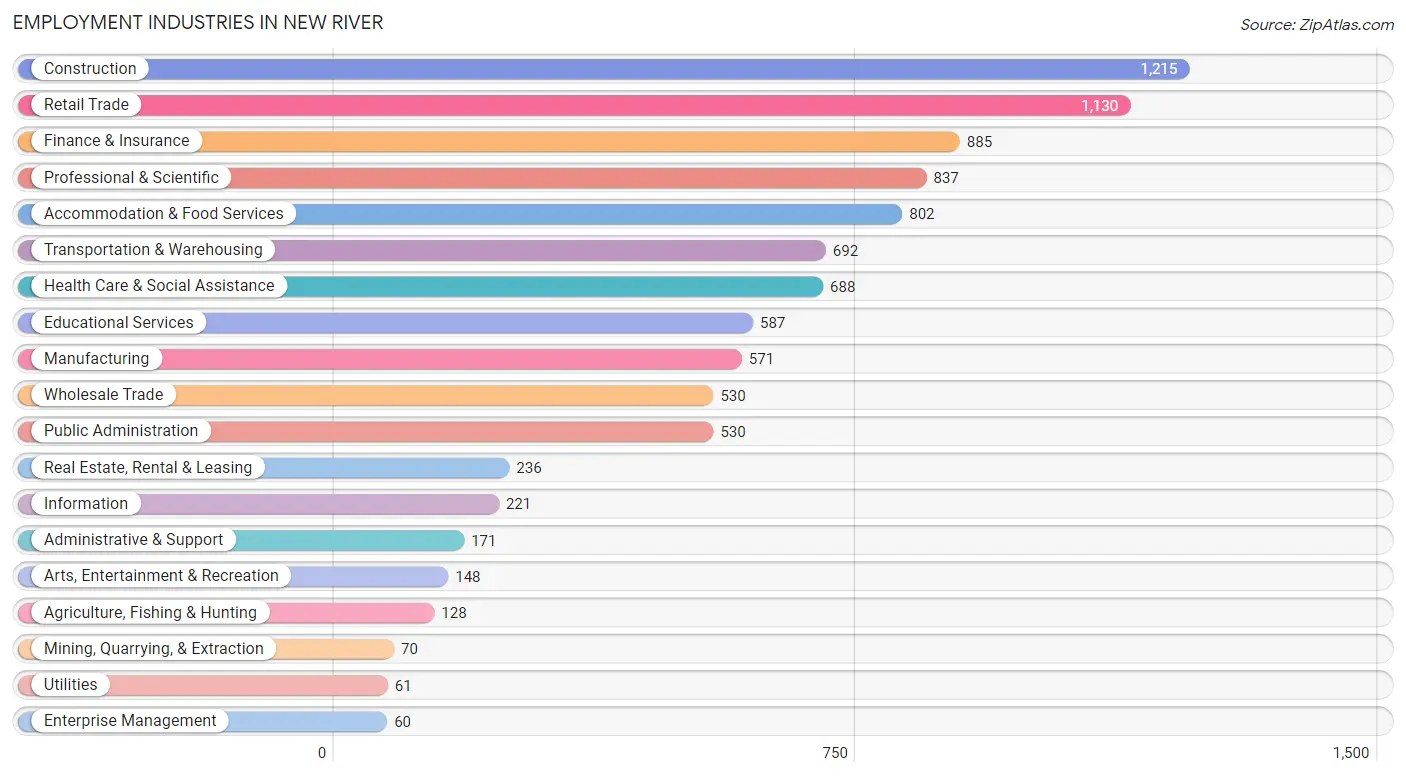
Employment Industries in New River
The major employment industries in New River include Construction (1,215 | 12.0%), Retail Trade (1,130 | 11.2%), Finance & Insurance (885 | 8.8%), Professional & Scientific (837 | 8.3%), and Accommodation & Food Services (802 | 8.0%).
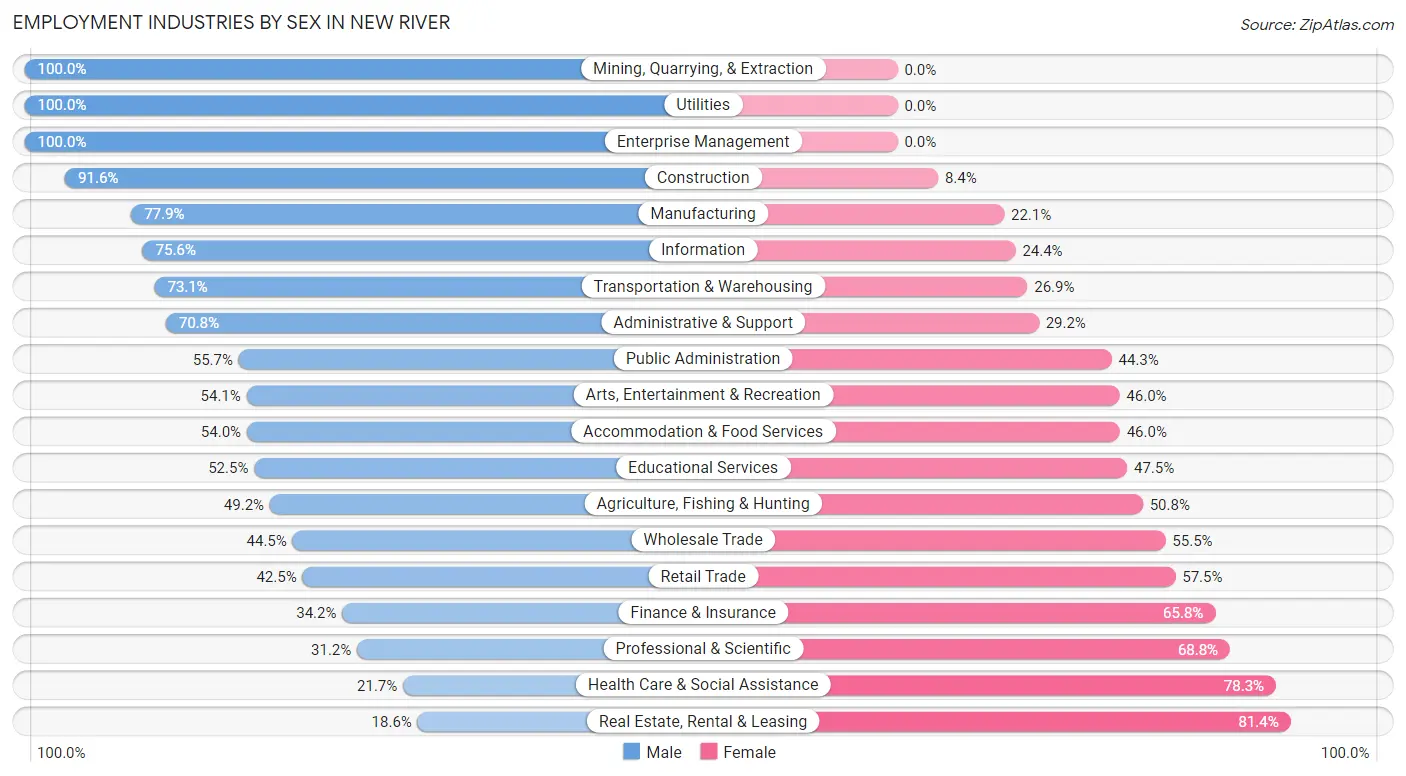
Employment Industries by Sex in New River
The New River industries that see more men than women are Mining, Quarrying, & Extraction (100.0%), Utilities (100.0%), and Enterprise Management (100.0%), whereas the industries that tend to have a higher number of women are Real Estate, Rental & Leasing (81.4%), Health Care & Social Assistance (78.3%), and Professional & Scientific (68.8%).
| Industry | Male | Female |
| Agriculture, Fishing & Hunting | 63 (49.2%) | 65 (50.8%) |
| Mining, Quarrying, & Extraction | 70 (100.0%) | 0 (0.0%) |
| Construction | 1,113 (91.6%) | 102 (8.4%) |
| Manufacturing | 445 (77.9%) | 126 (22.1%) |
| Wholesale Trade | 236 (44.5%) | 294 (55.5%) |
| Retail Trade | 480 (42.5%) | 650 (57.5%) |
| Transportation & Warehousing | 506 (73.1%) | 186 (26.9%) |
| Utilities | 61 (100.0%) | 0 (0.0%) |
| Information | 167 (75.6%) | 54 (24.4%) |
| Finance & Insurance | 303 (34.2%) | 582 (65.8%) |
| Real Estate, Rental & Leasing | 44 (18.6%) | 192 (81.4%) |
| Professional & Scientific | 261 (31.2%) | 576 (68.8%) |
| Enterprise Management | 60 (100.0%) | 0 (0.0%) |
| Administrative & Support | 121 (70.8%) | 50 (29.2%) |
| Educational Services | 308 (52.5%) | 279 (47.5%) |
| Health Care & Social Assistance | 149 (21.7%) | 539 (78.3%) |
| Arts, Entertainment & Recreation | 80 (54.0%) | 68 (46.0%) |
| Accommodation & Food Services | 433 (54.0%) | 369 (46.0%) |
| Public Administration | 295 (55.7%) | 235 (44.3%) |
| Total | 5,529 (54.8%) | 4,555 (45.2%) |
Education in New River
School Enrollment in New River
The most common levels of schooling among the 3,572 students in New River are high school (965 | 27.0%), elementary school (940 | 26.3%), and middle school (706 | 19.8%).
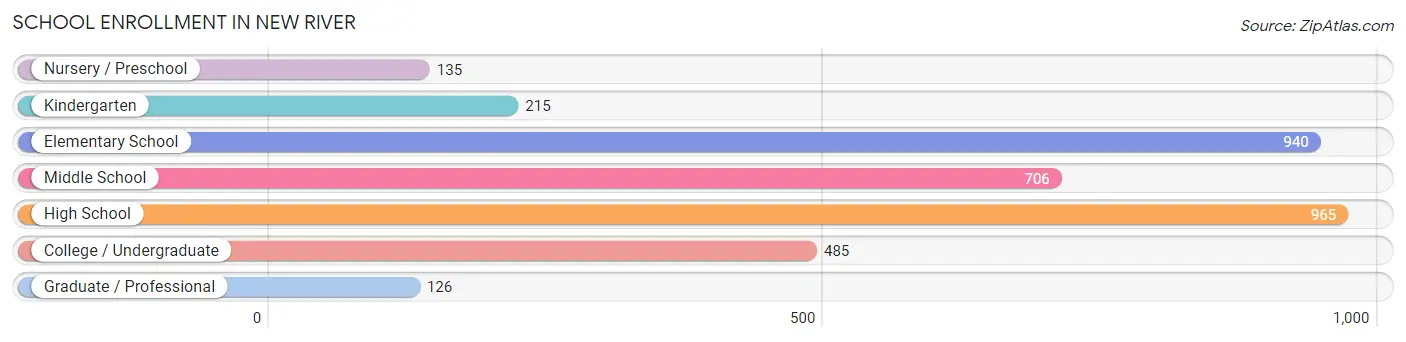
| School Level | # Students | % Students |
| Nursery / Preschool | 135 | 3.8% |
| Kindergarten | 215 | 6.0% |
| Elementary School | 940 | 26.3% |
| Middle School | 706 | 19.8% |
| High School | 965 | 27.0% |
| College / Undergraduate | 485 | 13.6% |
| Graduate / Professional | 126 | 3.5% |
| Total | 3,572 | 100.0% |
School Enrollment by Age by Funding Source in New River
Out of a total of 3,572 students who are enrolled in schools in New River, 557 (15.6%) attend a private institution, while the remaining 3,015 (84.4%) are enrolled in public schools. The age group of 25 to 34 year olds has the highest likelihood of being enrolled in private schools, with 64 (67.4% in the age bracket) enrolled. Conversely, the age group of 3 to 4 year olds has the lowest likelihood of being enrolled in a private school, with 135 (100.0% in the age bracket) attending a public institution.
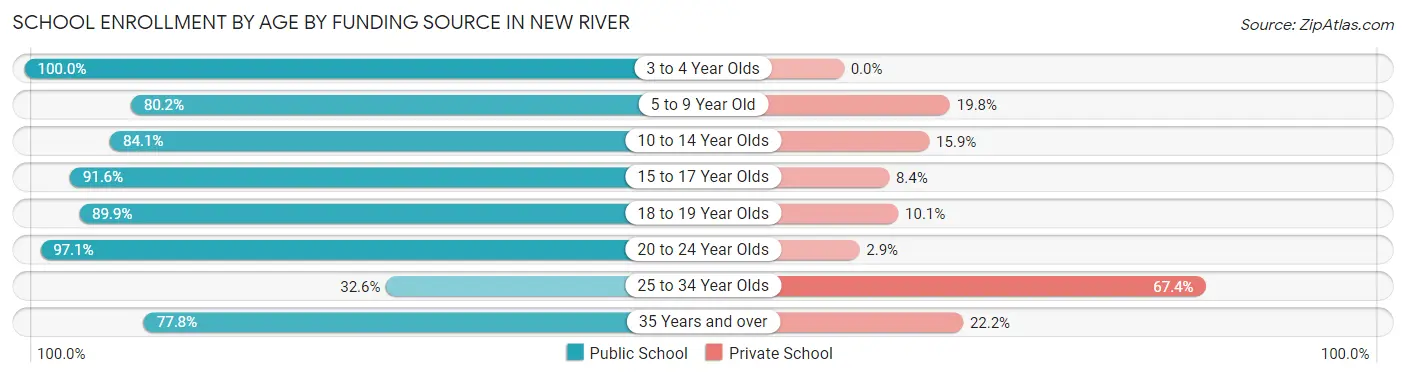
| Age Bracket | Public School | Private School |
| 3 to 4 Year Olds | 135 (100.0%) | 0 (0.0%) |
| 5 to 9 Year Old | 860 (80.2%) | 212 (19.8%) |
| 10 to 14 Year Olds | 808 (84.1%) | 153 (15.9%) |
| 15 to 17 Year Olds | 640 (91.6%) | 59 (8.4%) |
| 18 to 19 Year Olds | 257 (89.9%) | 29 (10.1%) |
| 20 to 24 Year Olds | 166 (97.1%) | 5 (2.9%) |
| 25 to 34 Year Olds | 31 (32.6%) | 64 (67.4%) |
| 35 Years and over | 119 (77.8%) | 34 (22.2%) |
| Total | 3,015 (84.4%) | 557 (15.6%) |
Educational Attainment by Field of Study in New River
Business (1,151 | 24.1%), arts & humanities (478 | 10.0%), social sciences (453 | 9.5%), science & technology (439 | 9.2%), and education (407 | 8.5%) are the most common fields of study among 4,771 individuals in New River who have obtained a bachelor's degree or higher.
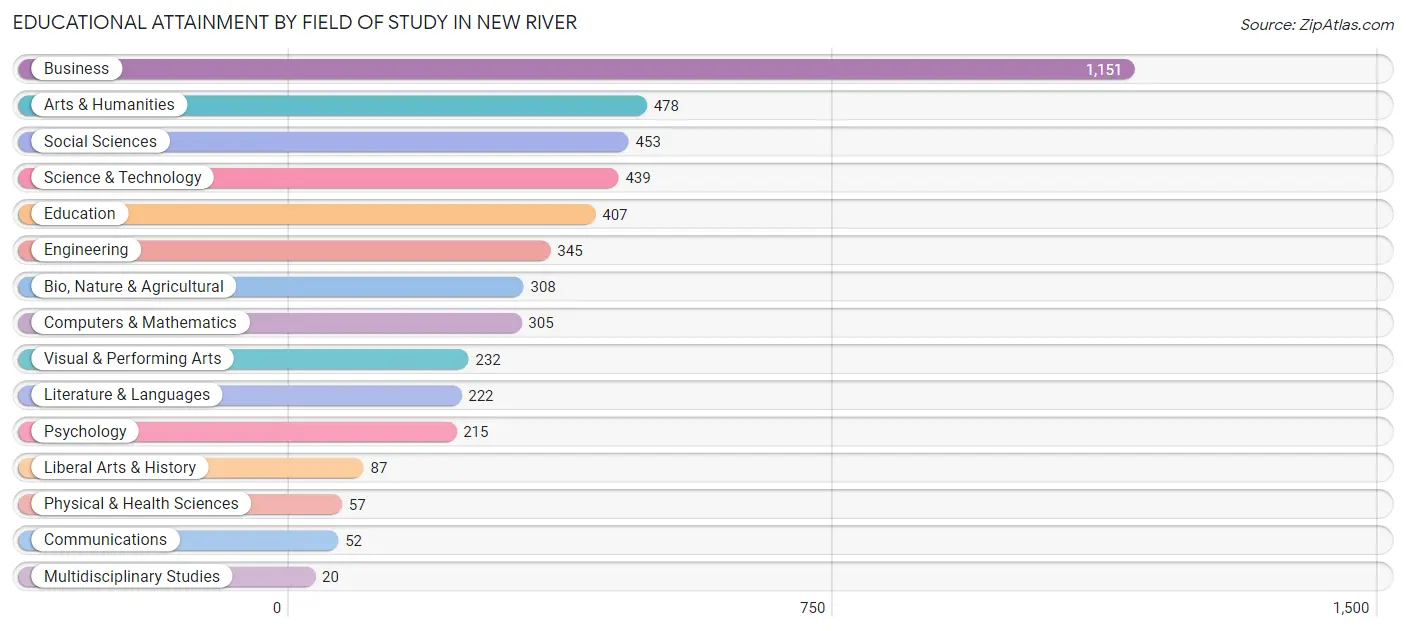
| Field of Study | # Graduates | % Graduates |
| Computers & Mathematics | 305 | 6.4% |
| Bio, Nature & Agricultural | 308 | 6.5% |
| Physical & Health Sciences | 57 | 1.2% |
| Psychology | 215 | 4.5% |
| Social Sciences | 453 | 9.5% |
| Engineering | 345 | 7.2% |
| Multidisciplinary Studies | 20 | 0.4% |
| Science & Technology | 439 | 9.2% |
| Business | 1,151 | 24.1% |
| Education | 407 | 8.5% |
| Literature & Languages | 222 | 4.6% |
| Liberal Arts & History | 87 | 1.8% |
| Visual & Performing Arts | 232 | 4.9% |
| Communications | 52 | 1.1% |
| Arts & Humanities | 478 | 10.0% |
| Total | 4,771 | 100.0% |
Transportation & Commute in New River
Vehicle Availability by Sex in New River
The most prevalent vehicle ownership categories in New River are males with 3 vehicles (1,774, accounting for 32.7%) and females with 3 vehicles (1,638, making up 39.6%).
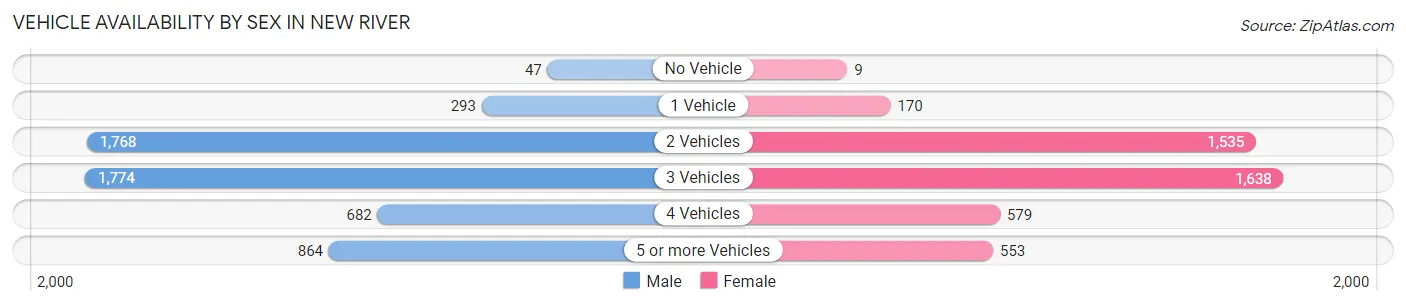
| Vehicles Available | Male | Female |
| No Vehicle | 47 (0.9%) | 9 (0.2%) |
| 1 Vehicle | 293 (5.4%) | 170 (3.8%) |
| 2 Vehicles | 1,768 (32.6%) | 1,535 (34.2%) |
| 3 Vehicles | 1,774 (32.7%) | 1,638 (36.5%) |
| 4 Vehicles | 682 (12.6%) | 579 (12.9%) |
| 5 or more Vehicles | 864 (15.9%) | 553 (12.3%) |
| Total | 5,428 (100.0%) | 4,484 (100.0%) |
Commute Time in New River
The most frequently occuring commute durations in New River are 45 to 59 minutes (1,830 commuters, 23.1%), 20 to 24 minutes (1,067 commuters, 13.5%), and 40 to 44 minutes (1,025 commuters, 13.0%).
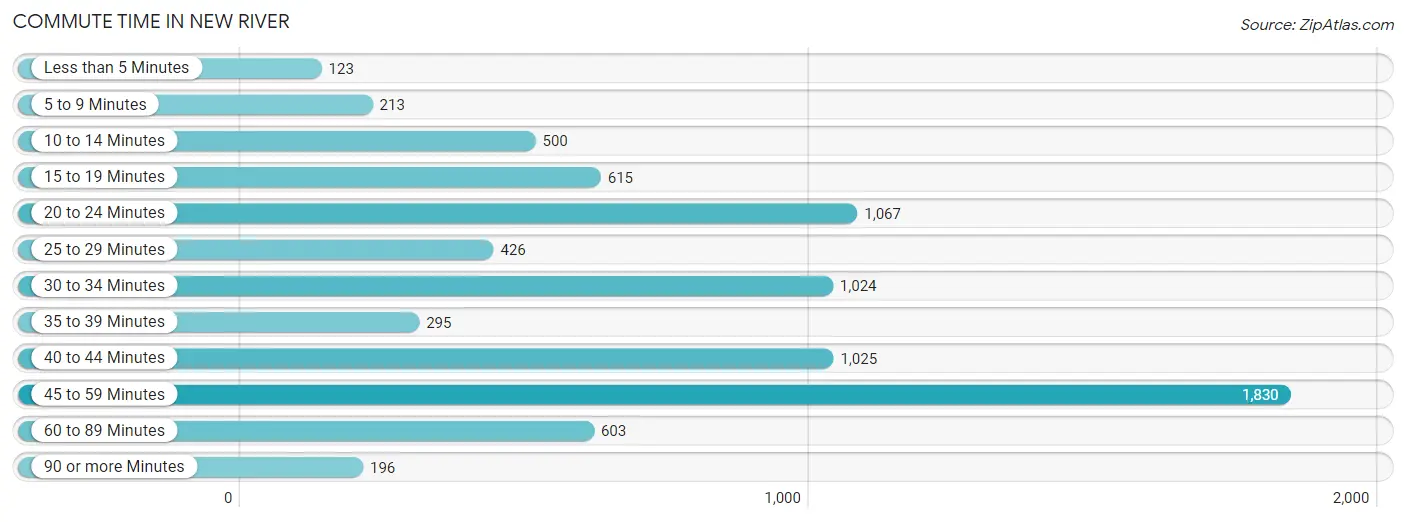
| Commute Time | # Commuters | % Commuters |
| Less than 5 Minutes | 123 | 1.5% |
| 5 to 9 Minutes | 213 | 2.7% |
| 10 to 14 Minutes | 500 | 6.3% |
| 15 to 19 Minutes | 615 | 7.8% |
| 20 to 24 Minutes | 1,067 | 13.5% |
| 25 to 29 Minutes | 426 | 5.4% |
| 30 to 34 Minutes | 1,024 | 12.9% |
| 35 to 39 Minutes | 295 | 3.7% |
| 40 to 44 Minutes | 1,025 | 13.0% |
| 45 to 59 Minutes | 1,830 | 23.1% |
| 60 to 89 Minutes | 603 | 7.6% |
| 90 or more Minutes | 196 | 2.5% |
Commute Time by Sex in New River
The most common commute times in New River are 45 to 59 minutes (901 commuters, 19.9%) for males and 45 to 59 minutes (929 commuters, 27.3%) for females.
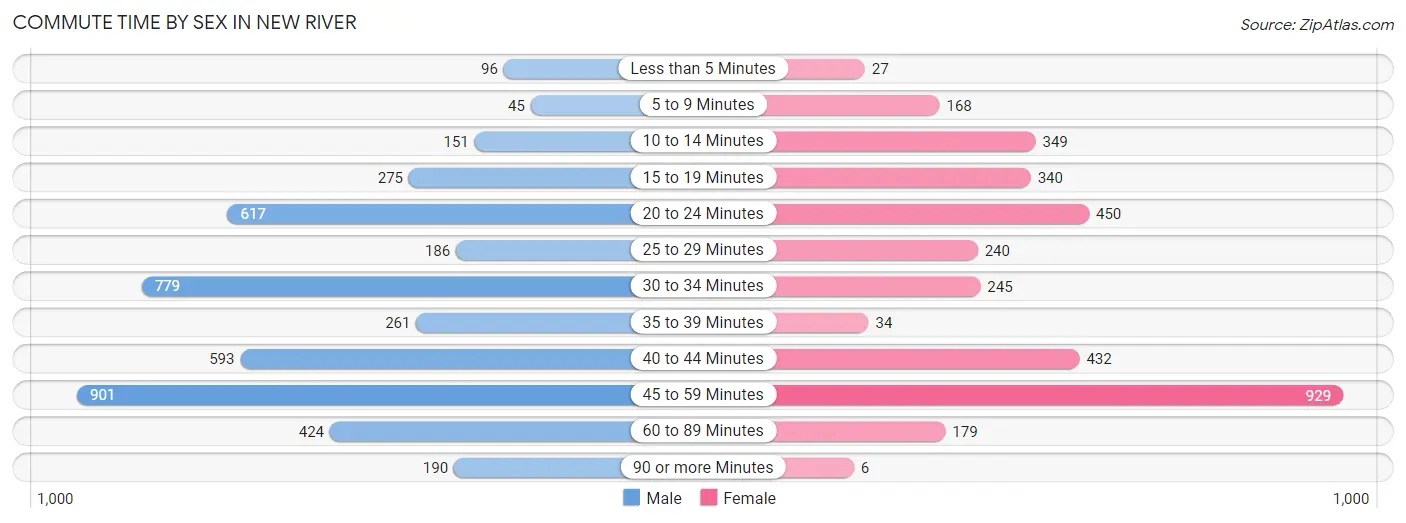
| Commute Time | Male | Female |
| Less than 5 Minutes | 96 (2.1%) | 27 (0.8%) |
| 5 to 9 Minutes | 45 (1.0%) | 168 (4.9%) |
| 10 to 14 Minutes | 151 (3.3%) | 349 (10.3%) |
| 15 to 19 Minutes | 275 (6.1%) | 340 (10.0%) |
| 20 to 24 Minutes | 617 (13.7%) | 450 (13.2%) |
| 25 to 29 Minutes | 186 (4.1%) | 240 (7.1%) |
| 30 to 34 Minutes | 779 (17.2%) | 245 (7.2%) |
| 35 to 39 Minutes | 261 (5.8%) | 34 (1.0%) |
| 40 to 44 Minutes | 593 (13.1%) | 432 (12.7%) |
| 45 to 59 Minutes | 901 (19.9%) | 929 (27.3%) |
| 60 to 89 Minutes | 424 (9.4%) | 179 (5.3%) |
| 90 or more Minutes | 190 (4.2%) | 6 (0.2%) |
Time of Departure to Work by Sex in New River
The most frequent times of departure to work in New River are 7:00 AM to 7:29 AM (808, 17.9%) for males and 7:30 AM to 7:59 AM (526, 15.5%) for females.
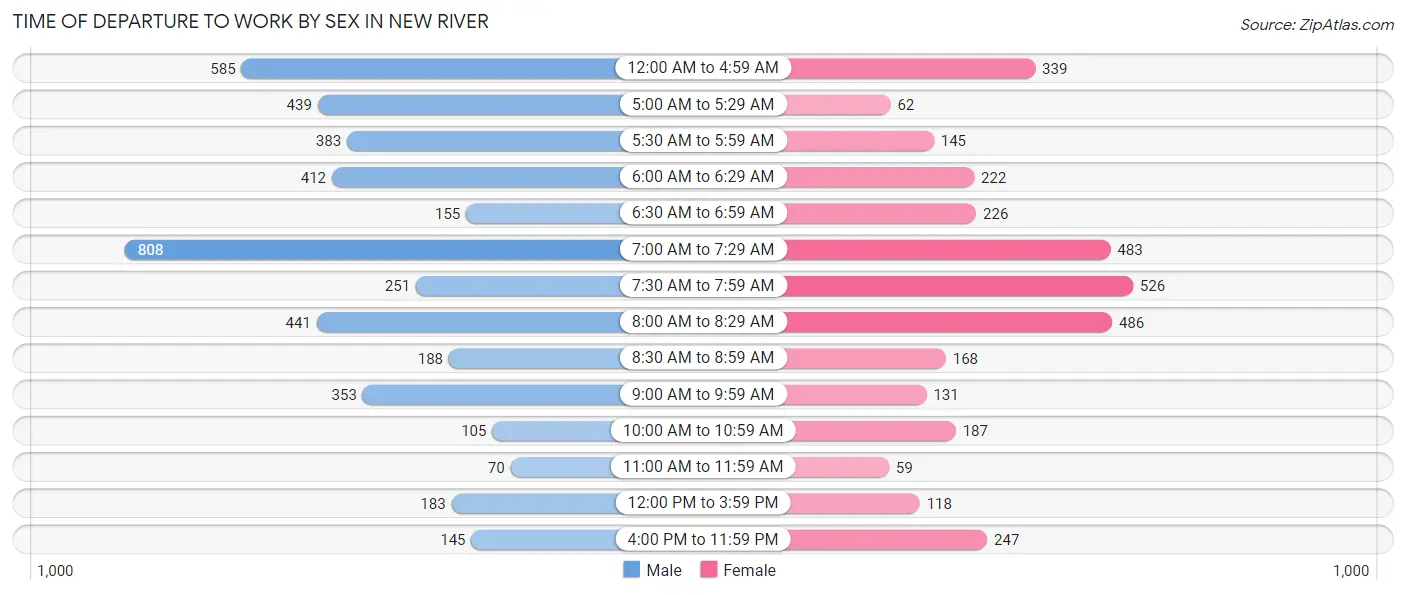
| Time of Departure | Male | Female |
| 12:00 AM to 4:59 AM | 585 (13.0%) | 339 (10.0%) |
| 5:00 AM to 5:29 AM | 439 (9.7%) | 62 (1.8%) |
| 5:30 AM to 5:59 AM | 383 (8.5%) | 145 (4.3%) |
| 6:00 AM to 6:29 AM | 412 (9.1%) | 222 (6.5%) |
| 6:30 AM to 6:59 AM | 155 (3.4%) | 226 (6.7%) |
| 7:00 AM to 7:29 AM | 808 (17.9%) | 483 (14.2%) |
| 7:30 AM to 7:59 AM | 251 (5.6%) | 526 (15.5%) |
| 8:00 AM to 8:29 AM | 441 (9.8%) | 486 (14.3%) |
| 8:30 AM to 8:59 AM | 188 (4.2%) | 168 (4.9%) |
| 9:00 AM to 9:59 AM | 353 (7.8%) | 131 (3.8%) |
| 10:00 AM to 10:59 AM | 105 (2.3%) | 187 (5.5%) |
| 11:00 AM to 11:59 AM | 70 (1.5%) | 59 (1.7%) |
| 12:00 PM to 3:59 PM | 183 (4.1%) | 118 (3.5%) |
| 4:00 PM to 11:59 PM | 145 (3.2%) | 247 (7.3%) |
| Total | 4,518 (100.0%) | 3,399 (100.0%) |
Housing Occupancy in New River
Occupancy by Ownership in New River
Of the total 6,945 dwellings in New River, owner-occupied units account for 6,533 (94.1%), while renter-occupied units make up 412 (5.9%).
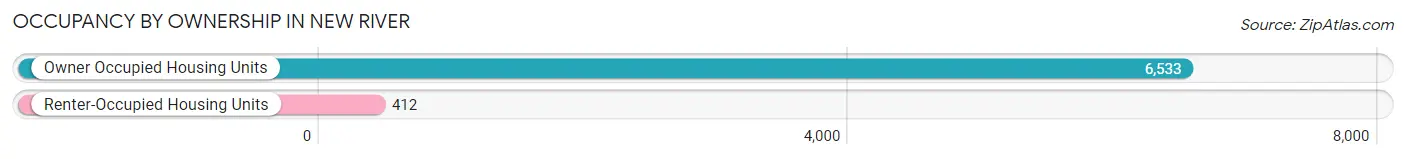
| Occupancy | # Housing Units | % Housing Units |
| Owner Occupied Housing Units | 6,533 | 94.1% |
| Renter-Occupied Housing Units | 412 | 5.9% |
| Total Occupied Housing Units | 6,945 | 100.0% |
Occupancy by Household Size in New River
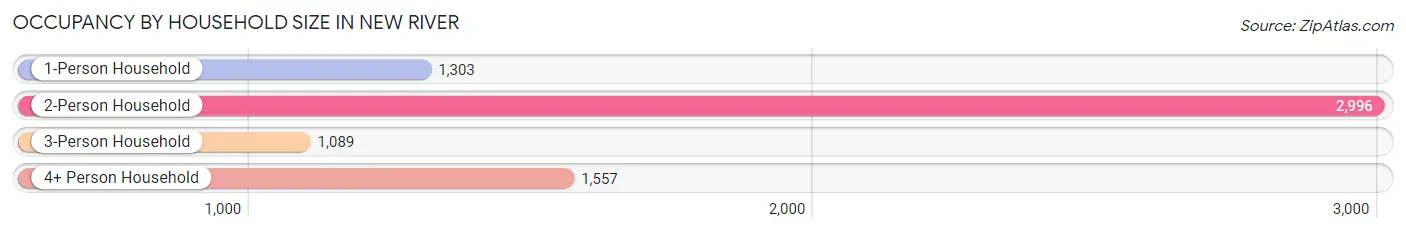
| Household Size | # Housing Units | % Housing Units |
| 1-Person Household | 1,303 | 18.8% |
| 2-Person Household | 2,996 | 43.1% |
| 3-Person Household | 1,089 | 15.7% |
| 4+ Person Household | 1,557 | 22.4% |
| Total Housing Units | 6,945 | 100.0% |
Occupancy by Ownership by Household Size in New River
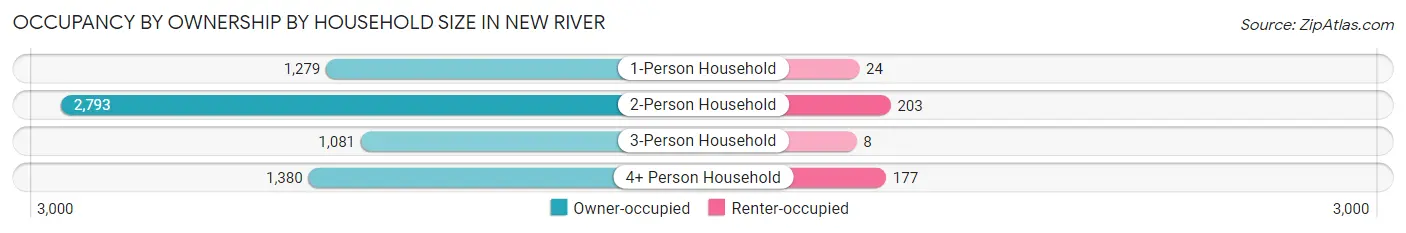
| Household Size | Owner-occupied | Renter-occupied |
| 1-Person Household | 1,279 (98.2%) | 24 (1.8%) |
| 2-Person Household | 2,793 (93.2%) | 203 (6.8%) |
| 3-Person Household | 1,081 (99.3%) | 8 (0.7%) |
| 4+ Person Household | 1,380 (88.6%) | 177 (11.4%) |
| Total Housing Units | 6,533 (94.1%) | 412 (5.9%) |
Occupancy by Educational Attainment in New River
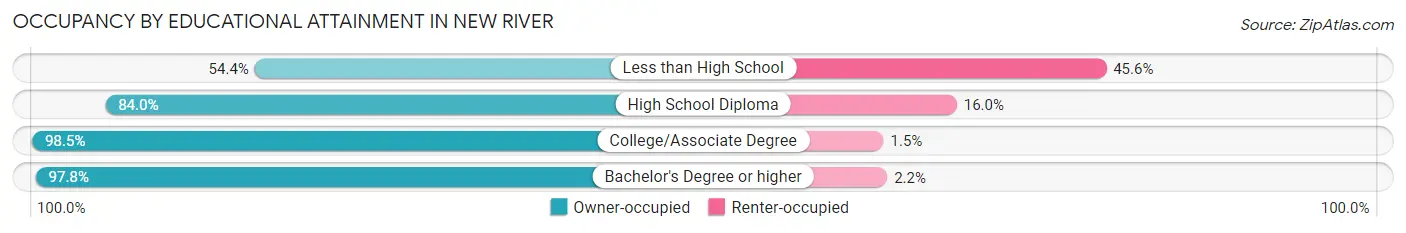
| Household Size | Owner-occupied | Renter-occupied |
| Less than High School | 130 (54.4%) | 109 (45.6%) |
| High School Diploma | 1,072 (84.0%) | 204 (16.0%) |
| College/Associate Degree | 2,739 (98.5%) | 41 (1.5%) |
| Bachelor's Degree or higher | 2,592 (97.8%) | 58 (2.2%) |
Occupancy by Age of Householder in New River
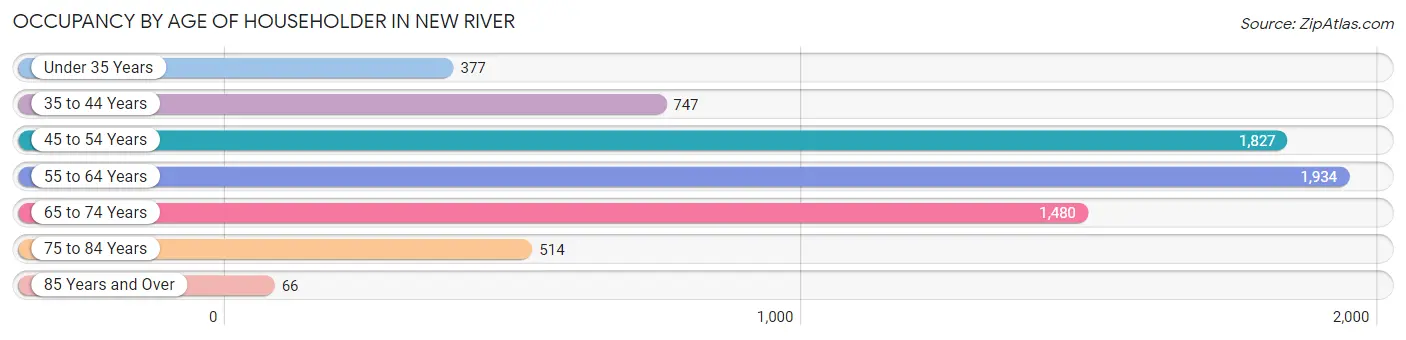
| Age Bracket | # Households | % Households |
| Under 35 Years | 377 | 5.4% |
| 35 to 44 Years | 747 | 10.8% |
| 45 to 54 Years | 1,827 | 26.3% |
| 55 to 64 Years | 1,934 | 27.9% |
| 65 to 74 Years | 1,480 | 21.3% |
| 75 to 84 Years | 514 | 7.4% |
| 85 Years and Over | 66 | 0.9% |
| Total | 6,945 | 100.0% |
Housing Finances in New River
Median Income by Occupancy in New River
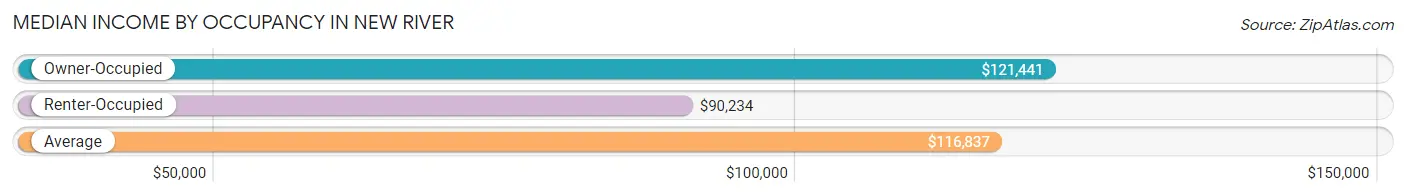
| Occupancy Type | # Households | Median Income |
| Owner-Occupied | 6,533 (94.1%) | $121,441 |
| Renter-Occupied | 412 (5.9%) | $90,234 |
| Average | 6,945 (100.0%) | $116,837 |
Occupancy by Householder Income Bracket in New River
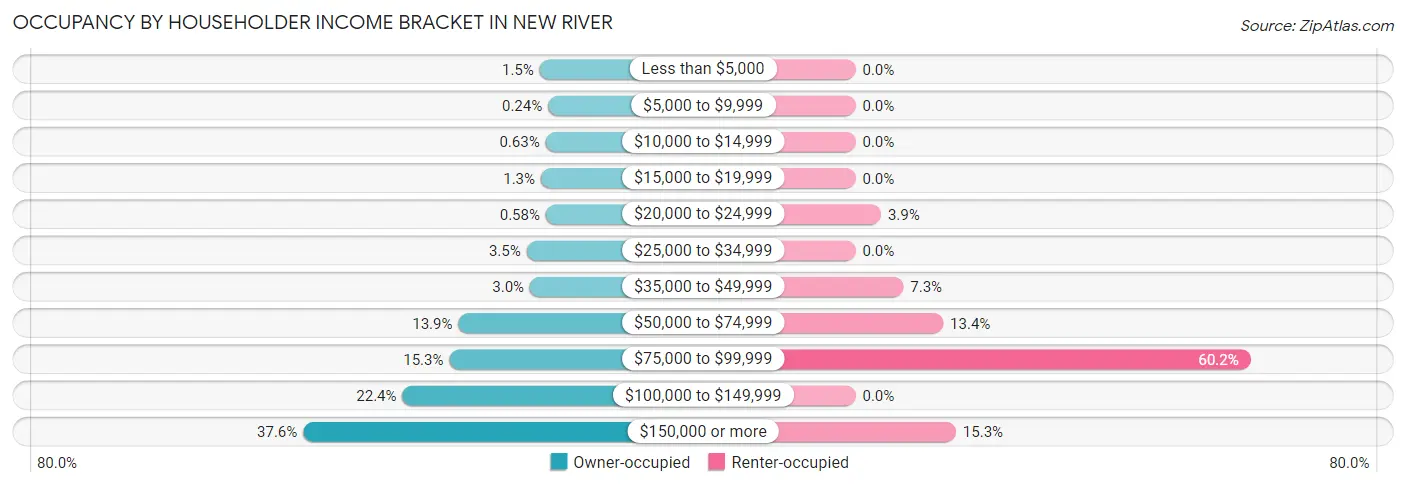
| Income Bracket | Owner-occupied | Renter-occupied |
| Less than $5,000 | 99 (1.5%) | 0 (0.0%) |
| $5,000 to $9,999 | 16 (0.2%) | 0 (0.0%) |
| $10,000 to $14,999 | 41 (0.6%) | 0 (0.0%) |
| $15,000 to $19,999 | 87 (1.3%) | 0 (0.0%) |
| $20,000 to $24,999 | 38 (0.6%) | 16 (3.9%) |
| $25,000 to $34,999 | 229 (3.5%) | 0 (0.0%) |
| $35,000 to $49,999 | 196 (3.0%) | 30 (7.3%) |
| $50,000 to $74,999 | 909 (13.9%) | 55 (13.4%) |
| $75,000 to $99,999 | 998 (15.3%) | 248 (60.2%) |
| $100,000 to $149,999 | 1,466 (22.4%) | 0 (0.0%) |
| $150,000 or more | 2,454 (37.6%) | 63 (15.3%) |
| Total | 6,533 (100.0%) | 412 (100.0%) |
Monthly Housing Cost Tiers in New River
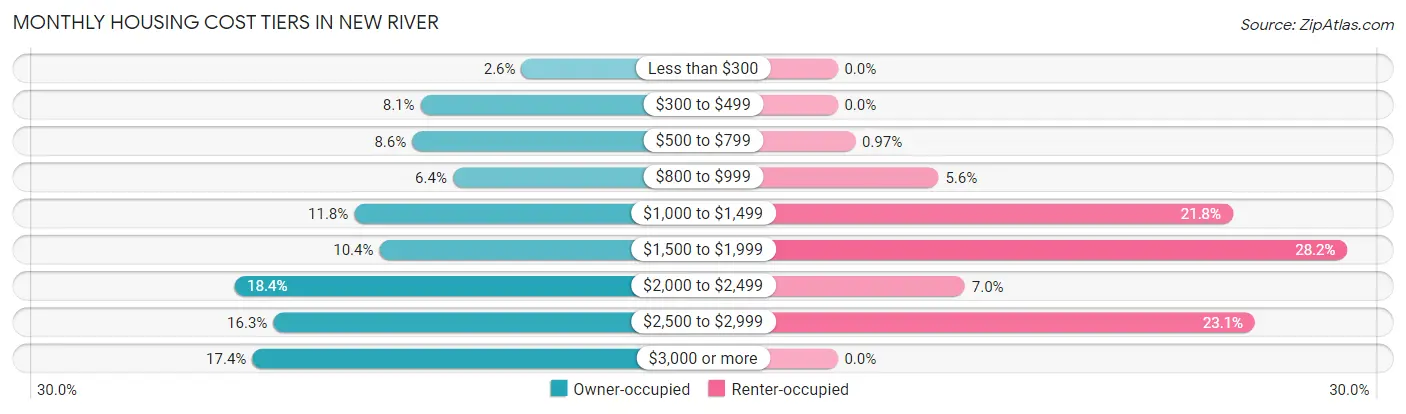
| Monthly Cost | Owner-occupied | Renter-occupied |
| Less than $300 | 167 (2.6%) | 0 (0.0%) |
| $300 to $499 | 532 (8.1%) | 0 (0.0%) |
| $500 to $799 | 562 (8.6%) | 4 (1.0%) |
| $800 to $999 | 415 (6.4%) | 23 (5.6%) |
| $1,000 to $1,499 | 771 (11.8%) | 90 (21.8%) |
| $1,500 to $1,999 | 680 (10.4%) | 116 (28.2%) |
| $2,000 to $2,499 | 1,204 (18.4%) | 29 (7.0%) |
| $2,500 to $2,999 | 1,063 (16.3%) | 95 (23.1%) |
| $3,000 or more | 1,139 (17.4%) | 0 (0.0%) |
| Total | 6,533 (100.0%) | 412 (100.0%) |
Physical Housing Characteristics in New River
Housing Structures in New River
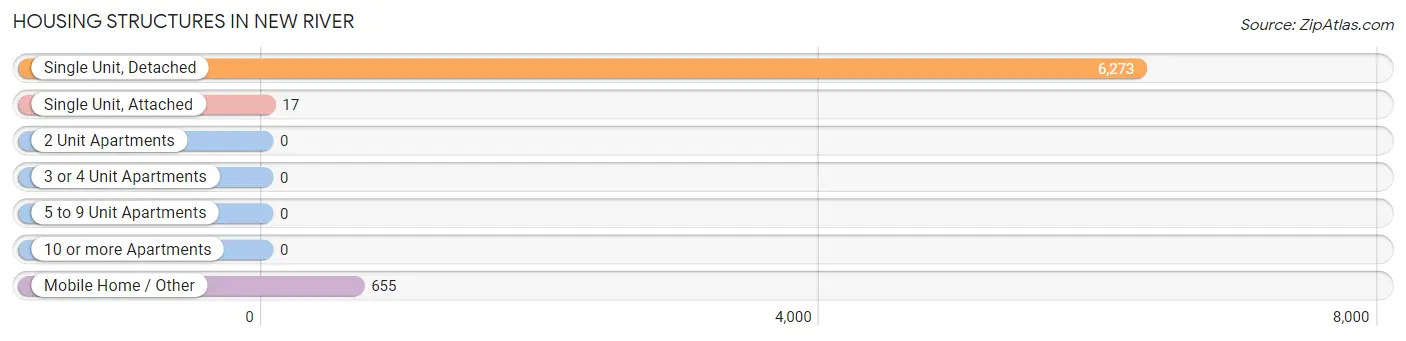
| Structure Type | # Housing Units | % Housing Units |
| Single Unit, Detached | 6,273 | 90.3% |
| Single Unit, Attached | 17 | 0.2% |
| 2 Unit Apartments | 0 | 0.0% |
| 3 or 4 Unit Apartments | 0 | 0.0% |
| 5 to 9 Unit Apartments | 0 | 0.0% |
| 10 or more Apartments | 0 | 0.0% |
| Mobile Home / Other | 655 | 9.4% |
| Total | 6,945 | 100.0% |
Housing Structures by Occupancy in New River
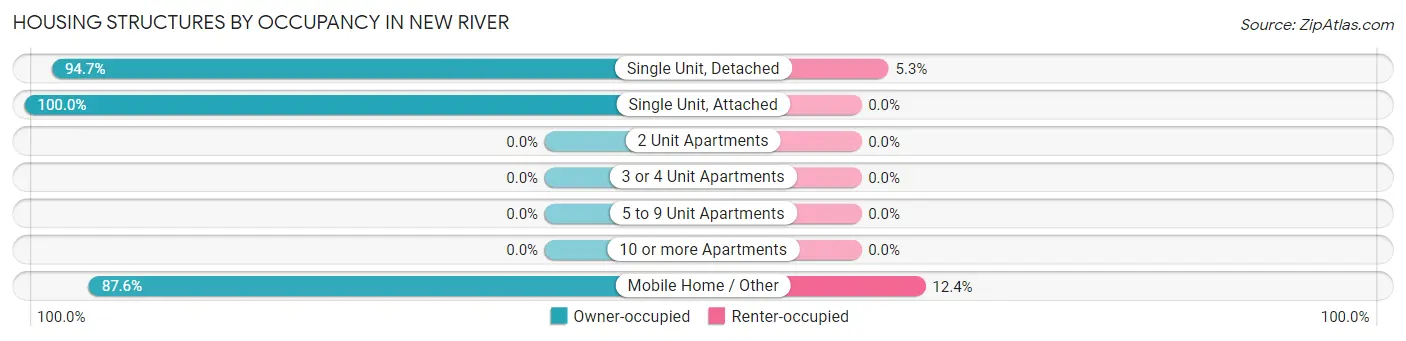
| Structure Type | Owner-occupied | Renter-occupied |
| Single Unit, Detached | 5,942 (94.7%) | 331 (5.3%) |
| Single Unit, Attached | 17 (100.0%) | 0 (0.0%) |
| 2 Unit Apartments | 0 (0.0%) | 0 (0.0%) |
| 3 or 4 Unit Apartments | 0 (0.0%) | 0 (0.0%) |
| 5 to 9 Unit Apartments | 0 (0.0%) | 0 (0.0%) |
| 10 or more Apartments | 0 (0.0%) | 0 (0.0%) |
| Mobile Home / Other | 574 (87.6%) | 81 (12.4%) |
| Total | 6,533 (94.1%) | 412 (5.9%) |
Housing Structures by Number of Rooms in New River
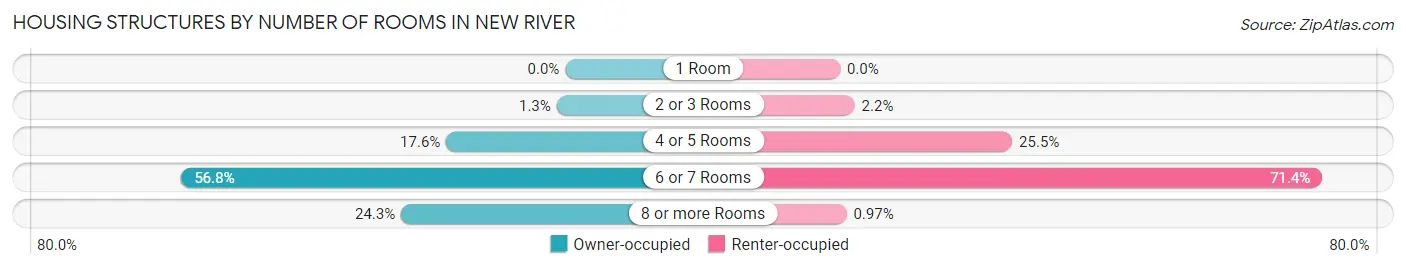
| Number of Rooms | Owner-occupied | Renter-occupied |
| 1 Room | 0 (0.0%) | 0 (0.0%) |
| 2 or 3 Rooms | 83 (1.3%) | 9 (2.2%) |
| 4 or 5 Rooms | 1,151 (17.6%) | 105 (25.5%) |
| 6 or 7 Rooms | 3,712 (56.8%) | 294 (71.4%) |
| 8 or more Rooms | 1,587 (24.3%) | 4 (1.0%) |
| Total | 6,533 (100.0%) | 412 (100.0%) |
Housing Structure by Heating Type in New River
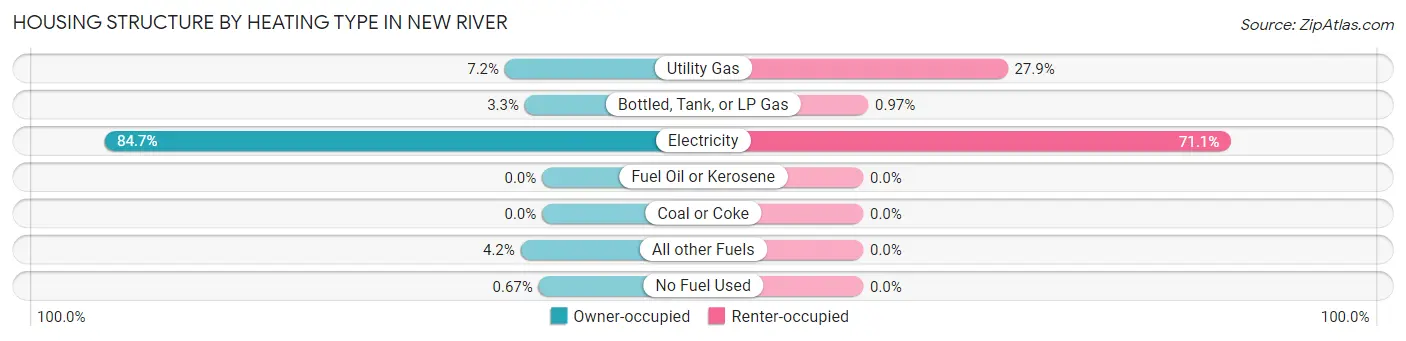
| Heating Type | Owner-occupied | Renter-occupied |
| Utility Gas | 470 (7.2%) | 115 (27.9%) |
| Bottled, Tank, or LP Gas | 218 (3.3%) | 4 (1.0%) |
| Electricity | 5,530 (84.7%) | 293 (71.1%) |
| Fuel Oil or Kerosene | 0 (0.0%) | 0 (0.0%) |
| Coal or Coke | 0 (0.0%) | 0 (0.0%) |
| All other Fuels | 271 (4.2%) | 0 (0.0%) |
| No Fuel Used | 44 (0.7%) | 0 (0.0%) |
| Total | 6,533 (100.0%) | 412 (100.0%) |
Household Vehicle Usage in New River
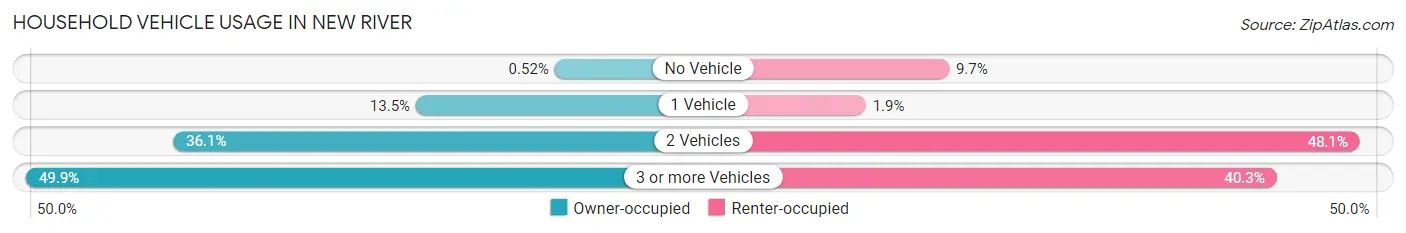
| Vehicles per Household | Owner-occupied | Renter-occupied |
| No Vehicle | 34 (0.5%) | 40 (9.7%) |
| 1 Vehicle | 880 (13.5%) | 8 (1.9%) |
| 2 Vehicles | 2,361 (36.1%) | 198 (48.1%) |
| 3 or more Vehicles | 3,258 (49.9%) | 166 (40.3%) |
| Total | 6,533 (100.0%) | 412 (100.0%) |
Real Estate & Mortgages in New River
Real Estate and Mortgage Overview in New River
| Characteristic | Without Mortgage | With Mortgage |
| Housing Units | 1,628 | 4,905 |
| Median Property Value | $527,700 | $572,600 |
| Median Household Income | $92,796 | $2,037 |
| Monthly Housing Costs | $650 | $1,139 |
| Real Estate Taxes | $3,213 | $87 |
Property Value by Mortgage Status in New River
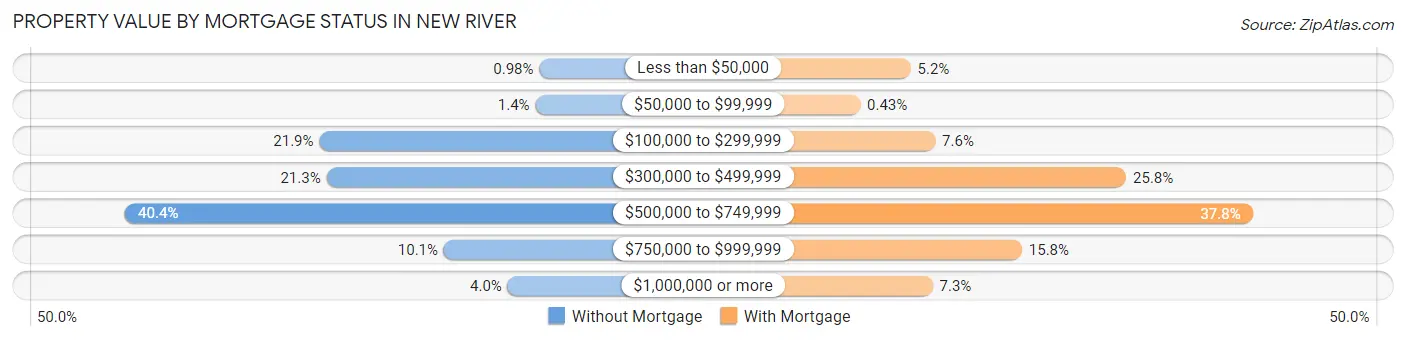
| Property Value | Without Mortgage | With Mortgage |
| Less than $50,000 | 16 (1.0%) | 257 (5.2%) |
| $50,000 to $99,999 | 22 (1.3%) | 21 (0.4%) |
| $100,000 to $299,999 | 357 (21.9%) | 372 (7.6%) |
| $300,000 to $499,999 | 346 (21.2%) | 1,264 (25.8%) |
| $500,000 to $749,999 | 658 (40.4%) | 1,854 (37.8%) |
| $750,000 to $999,999 | 164 (10.1%) | 777 (15.8%) |
| $1,000,000 or more | 65 (4.0%) | 360 (7.3%) |
| Total | 1,628 (100.0%) | 4,905 (100.0%) |
Household Income by Mortgage Status in New River
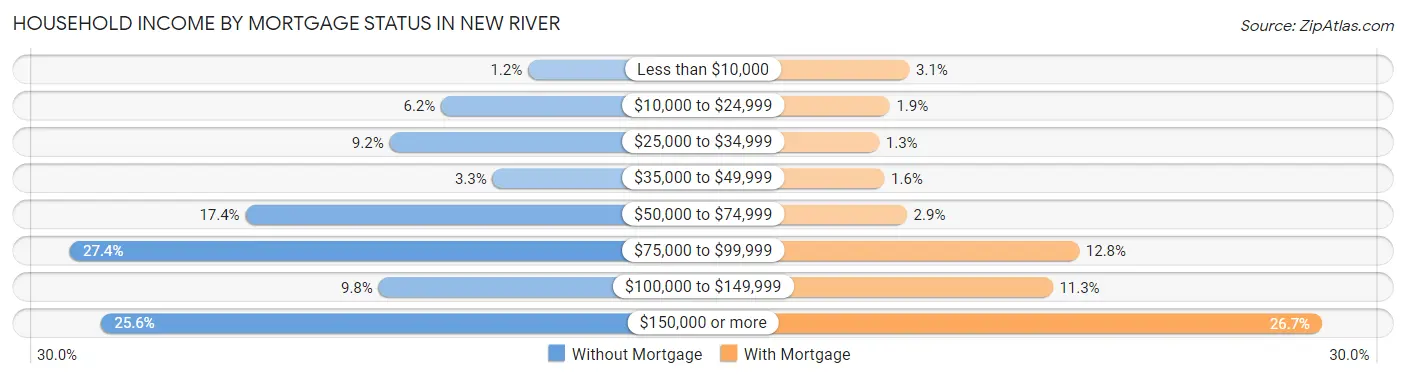
| Household Income | Without Mortgage | With Mortgage |
| Less than $10,000 | 20 (1.2%) | 150 (3.1%) |
| $10,000 to $24,999 | 101 (6.2%) | 95 (1.9%) |
| $25,000 to $34,999 | 149 (9.1%) | 65 (1.3%) |
| $35,000 to $49,999 | 53 (3.3%) | 80 (1.6%) |
| $50,000 to $74,999 | 283 (17.4%) | 143 (2.9%) |
| $75,000 to $99,999 | 446 (27.4%) | 626 (12.8%) |
| $100,000 to $149,999 | 159 (9.8%) | 552 (11.3%) |
| $150,000 or more | 417 (25.6%) | 1,307 (26.7%) |
| Total | 1,628 (100.0%) | 4,905 (100.0%) |
Property Value to Household Income Ratio in New River
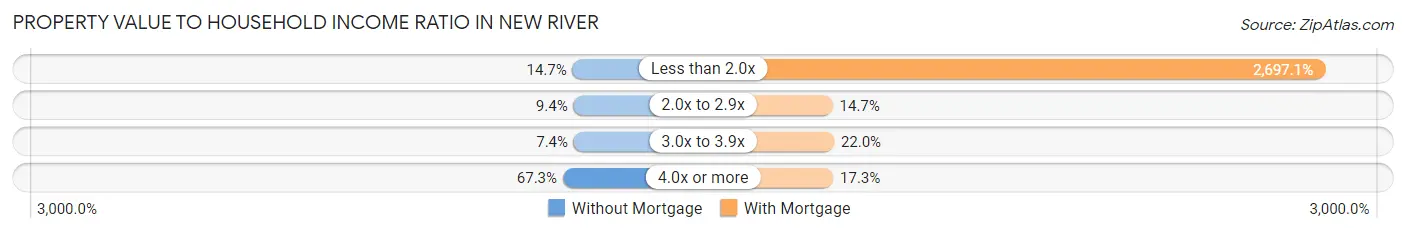
| Value-to-Income Ratio | Without Mortgage | With Mortgage |
| Less than 2.0x | 239 (14.7%) | 132,291 (2,697.1%) |
| 2.0x to 2.9x | 153 (9.4%) | 719 (14.7%) |
| 3.0x to 3.9x | 121 (7.4%) | 1,078 (22.0%) |
| 4.0x or more | 1,095 (67.3%) | 846 (17.2%) |
| Total | 1,628 (100.0%) | 4,905 (100.0%) |
Real Estate Taxes by Mortgage Status in New River
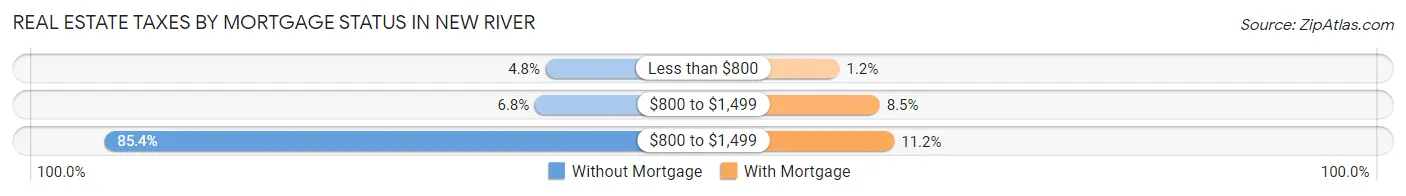
| Property Taxes | Without Mortgage | With Mortgage |
| Less than $800 | 78 (4.8%) | 58 (1.2%) |
| $800 to $1,499 | 110 (6.8%) | 419 (8.5%) |
| $800 to $1,499 | 1,391 (85.4%) | 549 (11.2%) |
| Total | 1,628 (100.0%) | 4,905 (100.0%) |
Health & Disability in New River
Health Insurance Coverage by Age in New River
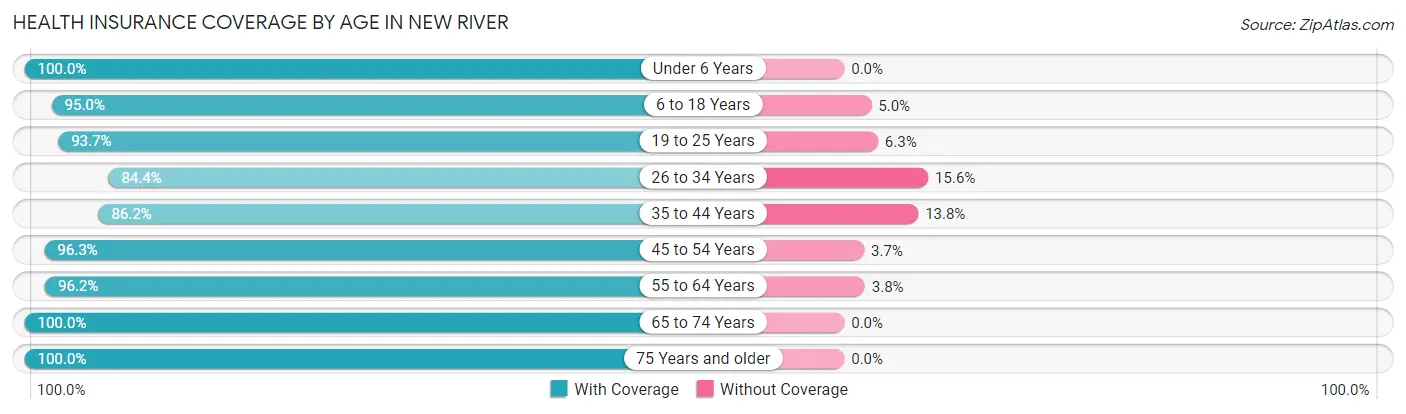
| Age Bracket | With Coverage | Without Coverage |
| Under 6 Years | 1,224 (100.0%) | 0 (0.0%) |
| 6 to 18 Years | 2,618 (95.0%) | 139 (5.0%) |
| 19 to 25 Years | 733 (93.7%) | 49 (6.3%) |
| 26 to 34 Years | 1,251 (84.4%) | 232 (15.6%) |
| 35 to 44 Years | 1,452 (86.2%) | 232 (13.8%) |
| 45 to 54 Years | 3,353 (96.3%) | 129 (3.7%) |
| 55 to 64 Years | 3,391 (96.2%) | 135 (3.8%) |
| 65 to 74 Years | 2,478 (100.0%) | 0 (0.0%) |
| 75 Years and older | 984 (100.0%) | 0 (0.0%) |
| Total | 17,484 (95.0%) | 916 (5.0%) |
Health Insurance Coverage by Citizenship Status in New River
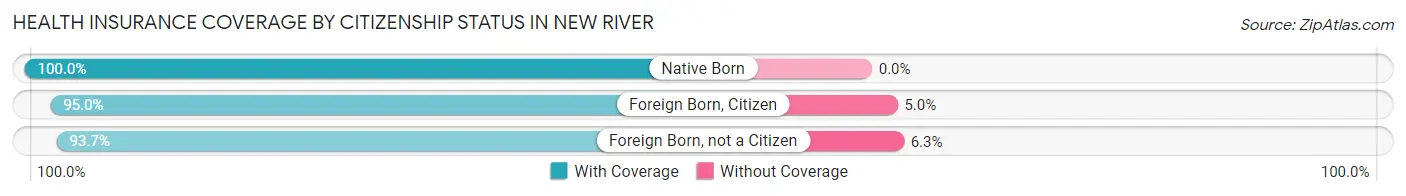
| Citizenship Status | With Coverage | Without Coverage |
| Native Born | 1,224 (100.0%) | 0 (0.0%) |
| Foreign Born, Citizen | 2,618 (95.0%) | 139 (5.0%) |
| Foreign Born, not a Citizen | 733 (93.7%) | 49 (6.3%) |
Health Insurance Coverage by Household Income in New River
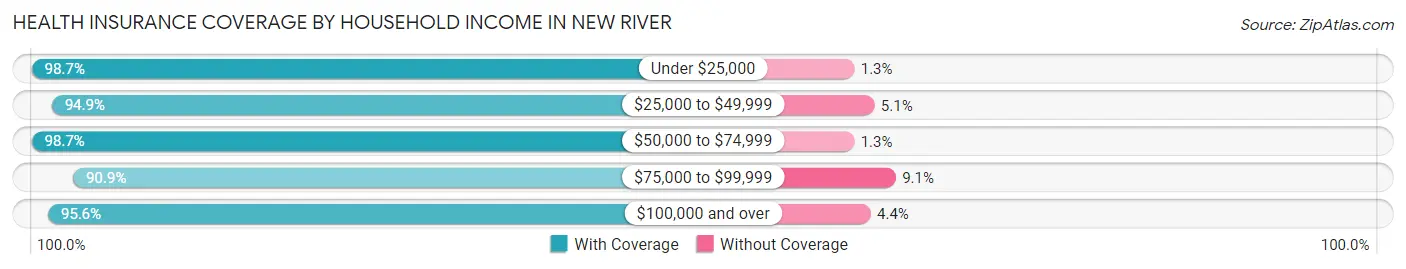
| Household Income | With Coverage | Without Coverage |
| Under $25,000 | 451 (98.7%) | 6 (1.3%) |
| $25,000 to $49,999 | 766 (94.9%) | 41 (5.1%) |
| $50,000 to $74,999 | 1,763 (98.7%) | 23 (1.3%) |
| $75,000 to $99,999 | 3,128 (90.9%) | 312 (9.1%) |
| $100,000 and over | 11,293 (95.6%) | 515 (4.4%) |
Public vs Private Health Insurance Coverage by Age in New River
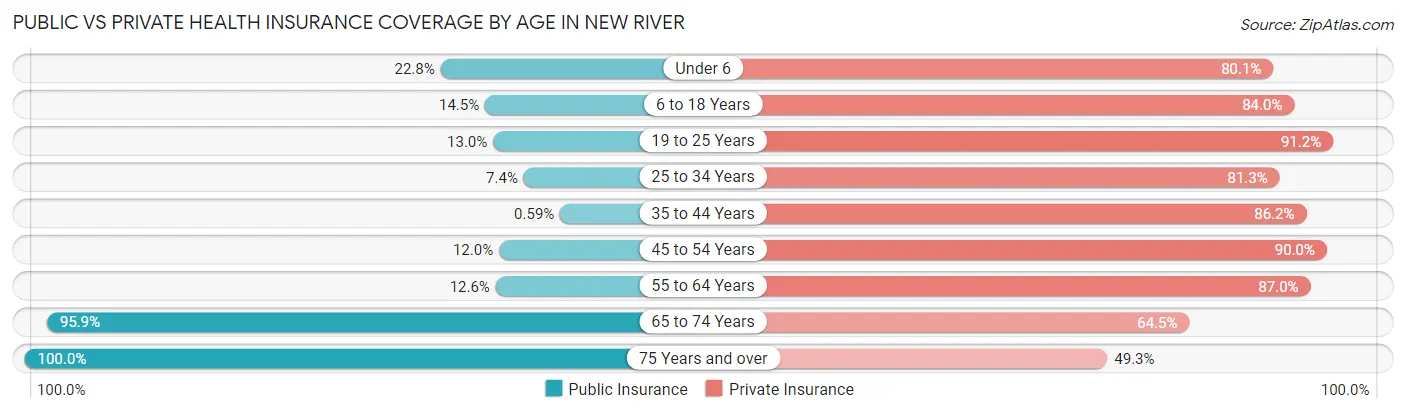
| Age Bracket | Public Insurance | Private Insurance |
| Under 6 | 279 (22.8%) | 980 (80.1%) |
| 6 to 18 Years | 401 (14.5%) | 2,315 (84.0%) |
| 19 to 25 Years | 102 (13.0%) | 713 (91.2%) |
| 25 to 34 Years | 109 (7.3%) | 1,205 (81.2%) |
| 35 to 44 Years | 10 (0.6%) | 1,452 (86.2%) |
| 45 to 54 Years | 416 (11.9%) | 3,135 (90.0%) |
| 55 to 64 Years | 443 (12.6%) | 3,067 (87.0%) |
| 65 to 74 Years | 2,376 (95.9%) | 1,598 (64.5%) |
| 75 Years and over | 984 (100.0%) | 485 (49.3%) |
| Total | 5,120 (27.8%) | 14,950 (81.2%) |
Disability Status by Sex by Age in New River
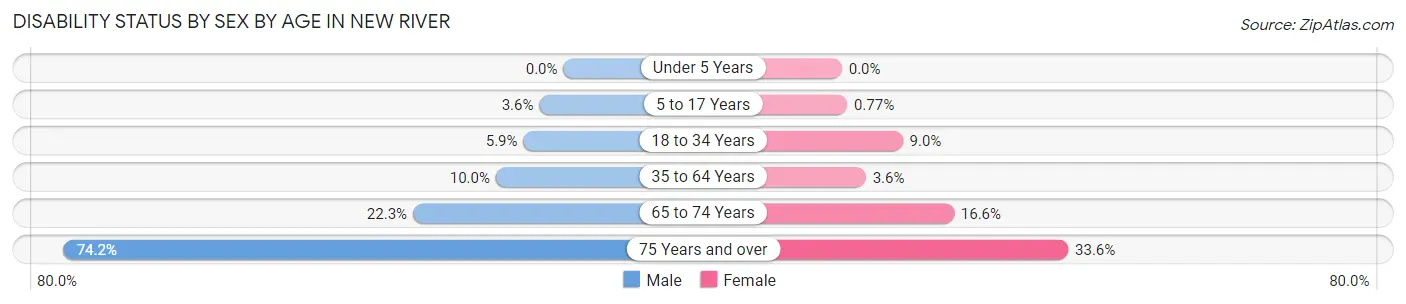
| Age Bracket | Male | Female |
| Under 5 Years | 0 (0.0%) | 0 (0.0%) |
| 5 to 17 Years | 40 (3.6%) | 13 (0.8%) |
| 18 to 34 Years | 73 (5.9%) | 103 (9.0%) |
| 35 to 64 Years | 440 (10.0%) | 153 (3.5%) |
| 65 to 74 Years | 273 (22.3%) | 209 (16.6%) |
| 75 Years and over | 368 (74.2%) | 164 (33.6%) |
Disability Class by Sex by Age in New River
Disability Class: Hearing Difficulty
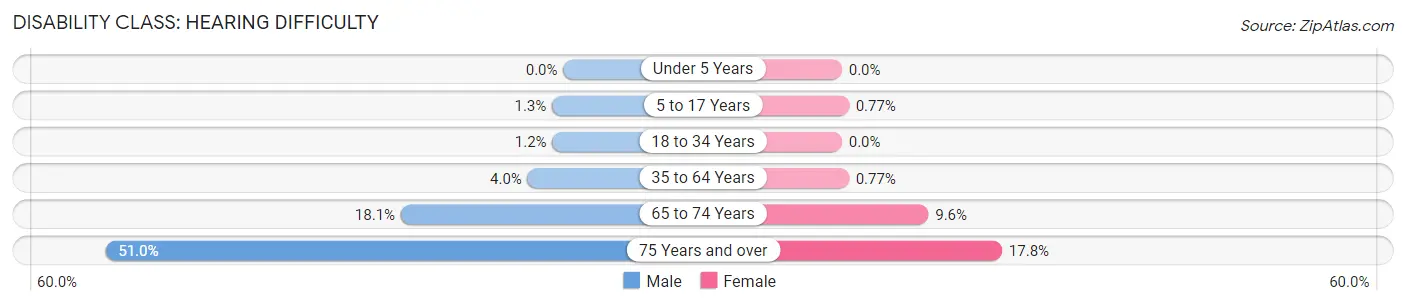
| Age Bracket | Male | Female |
| Under 5 Years | 0 (0.0%) | 0 (0.0%) |
| 5 to 17 Years | 14 (1.3%) | 13 (0.8%) |
| 18 to 34 Years | 15 (1.2%) | 0 (0.0%) |
| 35 to 64 Years | 174 (4.0%) | 33 (0.8%) |
| 65 to 74 Years | 221 (18.1%) | 121 (9.6%) |
| 75 Years and over | 253 (51.0%) | 87 (17.8%) |
Disability Class: Vision Difficulty
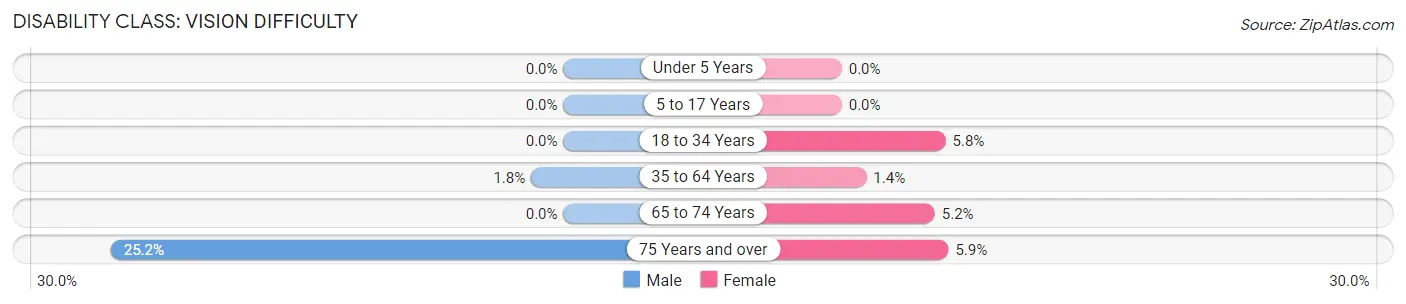
| Age Bracket | Male | Female |
| Under 5 Years | 0 (0.0%) | 0 (0.0%) |
| 5 to 17 Years | 0 (0.0%) | 0 (0.0%) |
| 18 to 34 Years | 0 (0.0%) | 66 (5.8%) |
| 35 to 64 Years | 79 (1.8%) | 59 (1.4%) |
| 65 to 74 Years | 0 (0.0%) | 65 (5.2%) |
| 75 Years and over | 125 (25.2%) | 29 (5.9%) |
Disability Class: Cognitive Difficulty
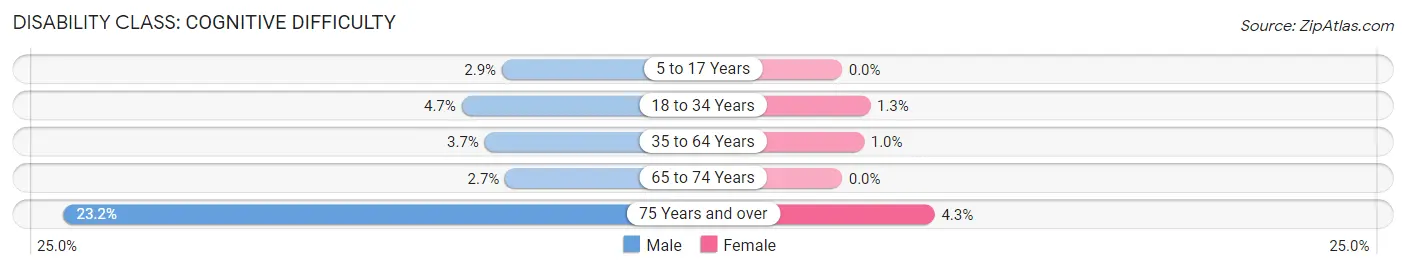
| Age Bracket | Male | Female |
| 5 to 17 Years | 32 (2.9%) | 0 (0.0%) |
| 18 to 34 Years | 58 (4.7%) | 15 (1.3%) |
| 35 to 64 Years | 160 (3.6%) | 44 (1.0%) |
| 65 to 74 Years | 33 (2.7%) | 0 (0.0%) |
| 75 Years and over | 115 (23.2%) | 21 (4.3%) |
Disability Class: Ambulatory Difficulty
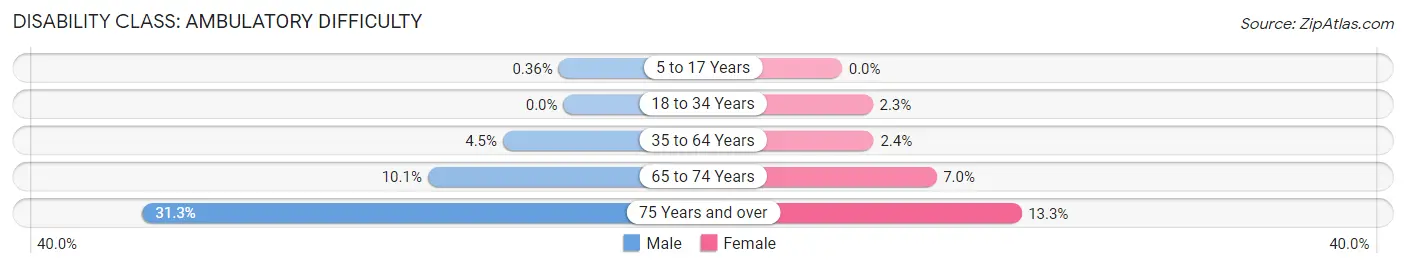
| Age Bracket | Male | Female |
| 5 to 17 Years | 4 (0.4%) | 0 (0.0%) |
| 18 to 34 Years | 0 (0.0%) | 26 (2.3%) |
| 35 to 64 Years | 197 (4.5%) | 101 (2.4%) |
| 65 to 74 Years | 123 (10.1%) | 88 (7.0%) |
| 75 Years and over | 155 (31.2%) | 65 (13.3%) |
Disability Class: Self-Care Difficulty
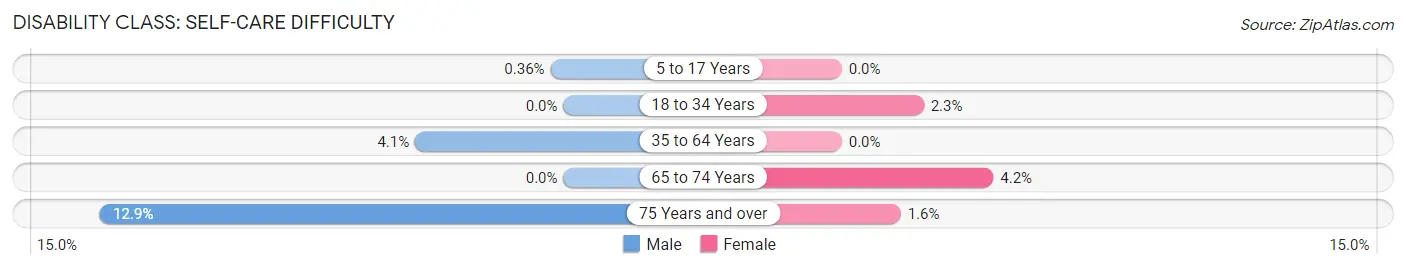
| Age Bracket | Male | Female |
| 5 to 17 Years | 4 (0.4%) | 0 (0.0%) |
| 18 to 34 Years | 0 (0.0%) | 26 (2.3%) |
| 35 to 64 Years | 181 (4.1%) | 0 (0.0%) |
| 65 to 74 Years | 0 (0.0%) | 53 (4.2%) |
| 75 Years and over | 64 (12.9%) | 8 (1.6%) |
Technology Access in New River
Computing Device Access in New River
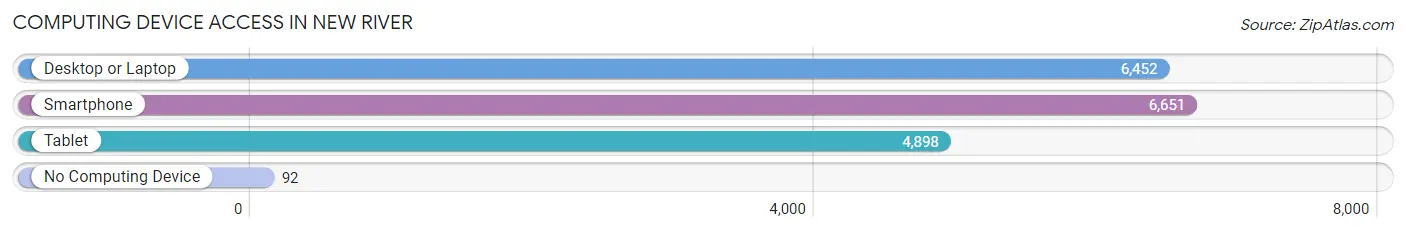
| Device Type | # Households | % Households |
| Desktop or Laptop | 6,452 | 92.9% |
| Smartphone | 6,651 | 95.8% |
| Tablet | 4,898 | 70.5% |
| No Computing Device | 92 | 1.3% |
| Total | 6,945 | 100.0% |
Internet Access in New River
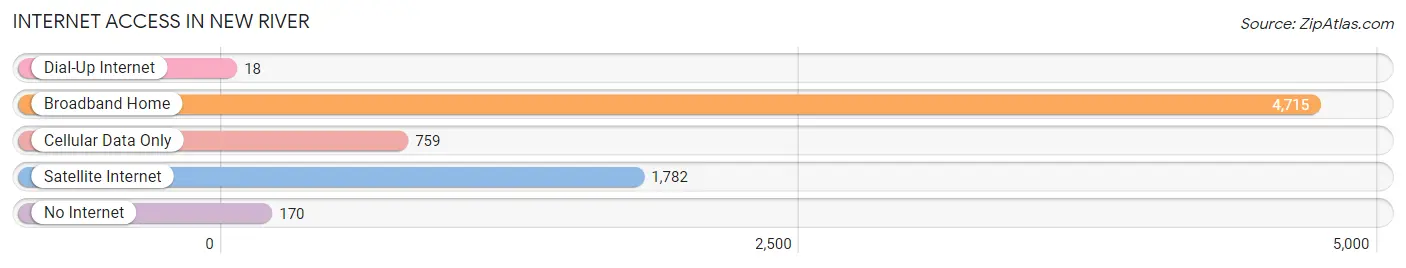
| Internet Type | # Households | % Households |
| Dial-Up Internet | 18 | 0.3% |
| Broadband Home | 4,715 | 67.9% |
| Cellular Data Only | 759 | 10.9% |
| Satellite Internet | 1,782 | 25.7% |
| No Internet | 170 | 2.5% |
| Total | 6,945 | 100.0% |
New River Summary
New River, Arizona is a small unincorporated community located in Maricopa County, Arizona. It is situated in the Sonoran Desert, approximately 25 miles north of Phoenix. The town is home to a population of approximately 10,000 people, and is known for its rural atmosphere and small-town charm.
History
New River was first settled in the late 1800s by ranchers and farmers who were attracted to the area by its abundant water supply. The town was originally known as “Rio Nuevo”, which translates to “New River” in Spanish. The name was changed to New River in the early 1900s.
In the early 1900s, the town was home to a number of small businesses, including a general store, a blacksmith shop, and a post office. The town also had a school, which was built in 1912.
In the 1950s, the town began to grow as more people moved to the area. The population increased from around 500 in 1950 to over 10,000 by 2000.
Geography
New River is located in the Sonoran Desert, approximately 25 miles north of Phoenix. The town is situated at an elevation of 1,400 feet, and is surrounded by the White Tank Mountains to the west and the Bradshaw Mountains to the east.
The town is located in a valley, and is bordered by the Agua Fria River to the north and the New River to the south. The town is also located near the Gila River, which is a major tributary of the Colorado River.
The climate in New River is hot and dry, with temperatures ranging from the mid-90s in the summer to the mid-50s in the winter. The town receives an average of 8 inches of rain per year.
Economy
The economy of New River is largely based on agriculture and tourism. The town is home to a number of farms, which produce a variety of crops, including cotton, alfalfa, and hay.
The town is also home to a number of tourist attractions, including the White Tank Mountain Regional Park, which offers hiking, camping, and other outdoor activities. The town is also home to a number of restaurants, bars, and shops.
Demographics
As of the 2010 census, the population of New River was 10,660. The racial makeup of the town was 79.3% White, 0.7% African American, 0.7% Native American, 0.3% Asian, 0.1% Pacific Islander, 16.2% from other races, and 2.9% from two or more races. Hispanic or Latino of any race were 28.3% of the population.
The median household income in New River was $50,945, and the median family income was $54,945. The per capita income was $21,945. About 11.3% of families and 14.2% of the population were below the poverty line, including 19.2% of those under age 18 and 8.2% of those age 65 or over.
New River is served by the Deer Valley Unified School District. The town is also home to a number of churches, including the New River Baptist Church, the New River United Methodist Church, and the New River Church of Christ.
Common Questions
What is Per Capita Income in New River?
Per Capita income in New River is $56,657.
What is the Median Family Income in New River?
Median Family Income in New River is $131,689.
What is the Median Household income in New River?
Median Household Income in New River is $116,837.
What is Income or Wage Gap in New River?
Income or Wage Gap in New River is 28.0%.
Women in New River earn 72.0 cents for every dollar earned by a man.
What is Inequality or Gini Index in New River?
Inequality or Gini Index in New River is 0.38.
What is the Total Population of New River?
Total Population of New River is 18,422.
What is the Total Male Population of New River?
Total Male Population of New River is 9,117.
What is the Total Female Population of New River?
Total Female Population of New River is 9,305.
What is the Ratio of Males per 100 Females in New River?
There are 97.98 Males per 100 Females in New River.
What is the Ratio of Females per 100 Males in New River?
There are 102.06 Females per 100 Males in New River.
What is the Median Population Age in New River?
Median Population Age in New River is 49.5 Years.
What is the Average Family Size in New River
Average Family Size in New River is 3.0 People.
What is the Average Household Size in New River
Average Household Size in New River is 2.6 People.
How Large is the Labor Force in New River?
There are 10,332 People in the Labor Forcein in New River.
What is the Percentage of People in the Labor Force in New River?
68.8% of People are in the Labor Force in New River.
What is the Unemployment Rate in New River?
Unemployment Rate in New River is 2.2%.