Ganado, AZ Map & Demographics
Ganado Map
Ganado Overview
$19,016
PER CAPITA INCOME
$46,389
AVG FAMILY INCOME
$46,339
AVG HOUSEHOLD INCOME
0.4%
WAGE / INCOME GAP [ % ]
99.6¢/ $1
WAGE / INCOME GAP [ $ ]
0.43
INEQUALITY / GINI INDEX
737
TOTAL POPULATION
332
MALE POPULATION
405
FEMALE POPULATION
81.98
MALES / 100 FEMALES
121.99
FEMALES / 100 MALES
31.6
MEDIAN AGE
4.6
AVG FAMILY SIZE
3.6
AVG HOUSEHOLD SIZE
275
LABOR FORCE [ PEOPLE ]
47.7%
PERCENT IN LABOR FORCE
Ganado Zip Codes
Ganado Area Codes
Income in Ganado
Income Overview in Ganado
Per Capita Income in Ganado is $19,016, while median incomes of families and households are $46,389 and $46,339 respectively.
| Characteristic | Number | Measure |
| Per Capita Income | 737 | $19,016 |
| Median Family Income | 140 | $46,389 |
| Mean Family Income | 140 | $53,968 |
| Median Household Income | 205 | $46,339 |
| Mean Household Income | 205 | $54,094 |
| Income Deficit | 140 | $0 |
| Wage / Income Gap (%) | 737 | 0.39% |
| Wage / Income Gap ($) | 737 | 99.61¢ per $1 |
| Gini / Inequality Index | 737 | 0.43 |
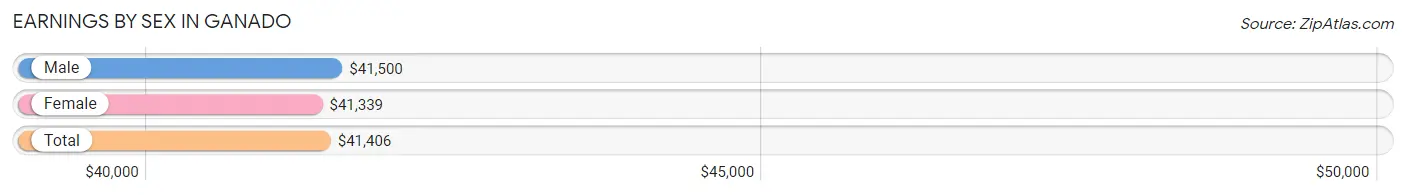
Earnings by Sex in Ganado
Average Earnings in Ganado are $41,406, $41,500 for men and $41,339 for women, a difference of 0.4%.
| Sex | Number | Average Earnings |
| Male | 78 (28.0%) | $41,500 |
| Female | 201 (72.0%) | $41,339 |
| Total | 279 (100.0%) | $41,406 |
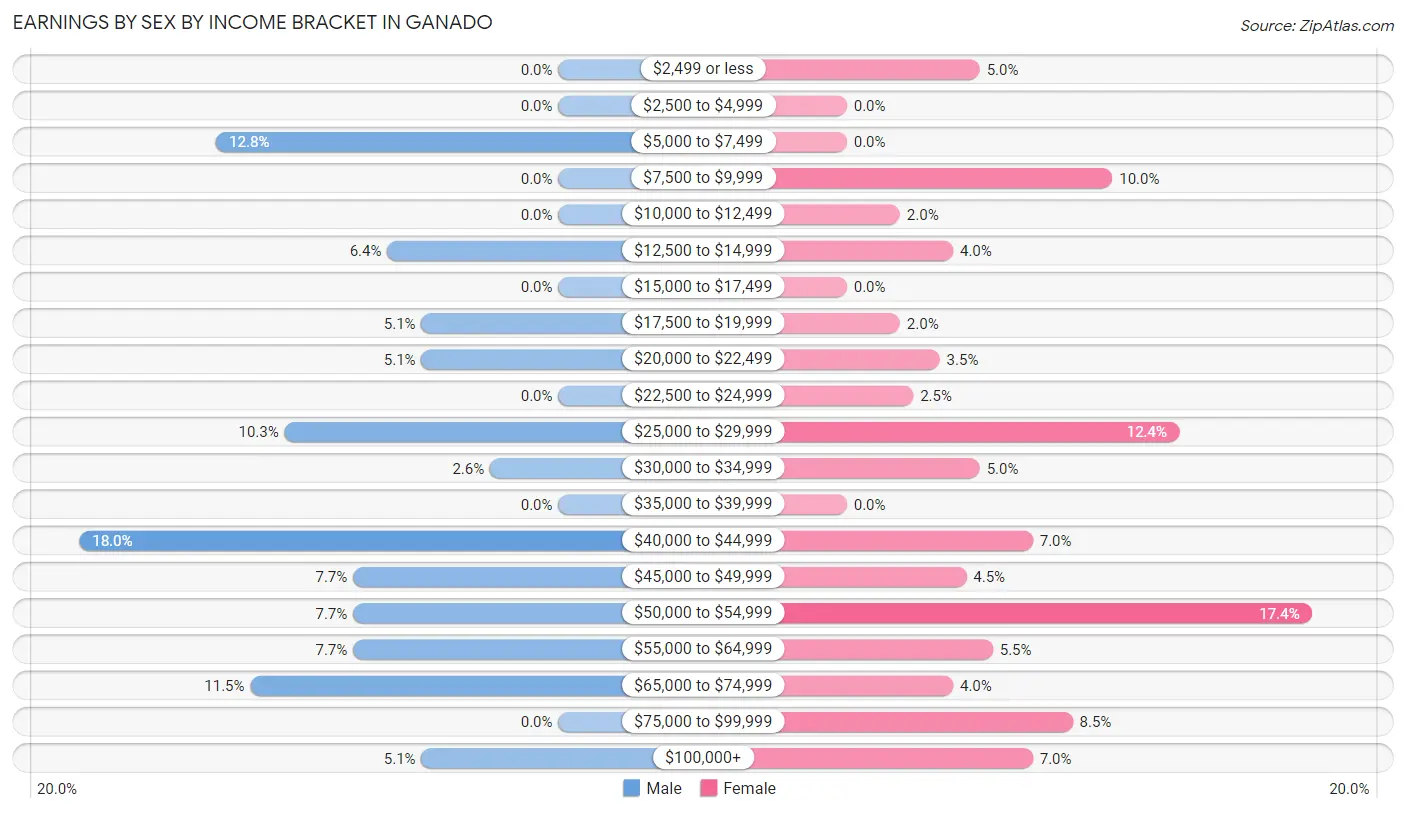
Earnings by Sex by Income Bracket in Ganado
The most common earnings brackets in Ganado are $40,000 to $44,999 for men (14 | 17.9%) and $50,000 to $54,999 for women (35 | 17.4%).
| Income | Male | Female |
| $2,499 or less | 0 (0.0%) | 10 (5.0%) |
| $2,500 to $4,999 | 0 (0.0%) | 0 (0.0%) |
| $5,000 to $7,499 | 10 (12.8%) | 0 (0.0%) |
| $7,500 to $9,999 | 0 (0.0%) | 20 (10.0%) |
| $10,000 to $12,499 | 0 (0.0%) | 4 (2.0%) |
| $12,500 to $14,999 | 5 (6.4%) | 8 (4.0%) |
| $15,000 to $17,499 | 0 (0.0%) | 0 (0.0%) |
| $17,500 to $19,999 | 4 (5.1%) | 4 (2.0%) |
| $20,000 to $22,499 | 4 (5.1%) | 7 (3.5%) |
| $22,500 to $24,999 | 0 (0.0%) | 5 (2.5%) |
| $25,000 to $29,999 | 8 (10.3%) | 25 (12.4%) |
| $30,000 to $34,999 | 2 (2.6%) | 10 (5.0%) |
| $35,000 to $39,999 | 0 (0.0%) | 0 (0.0%) |
| $40,000 to $44,999 | 14 (17.9%) | 14 (7.0%) |
| $45,000 to $49,999 | 6 (7.7%) | 9 (4.5%) |
| $50,000 to $54,999 | 6 (7.7%) | 35 (17.4%) |
| $55,000 to $64,999 | 6 (7.7%) | 11 (5.5%) |
| $65,000 to $74,999 | 9 (11.5%) | 8 (4.0%) |
| $75,000 to $99,999 | 0 (0.0%) | 17 (8.5%) |
| $100,000+ | 4 (5.1%) | 14 (7.0%) |
| Total | 78 (100.0%) | 201 (100.0%) |
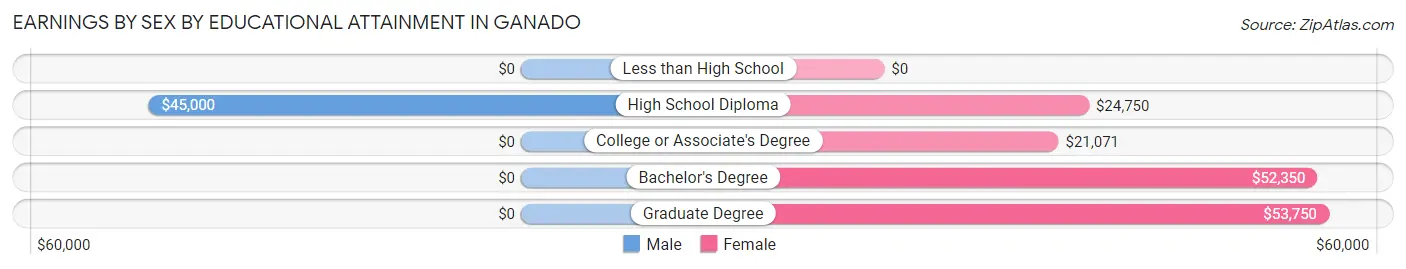
Earnings by Sex by Educational Attainment in Ganado
Average earnings in Ganado are $42,500 for men and $45,694 for women, a difference of 7.0%. Men with an educational attainment of high school diploma enjoy the highest average annual earnings of $45,000, while those with high school diploma education earn the least with $45,000. Women with an educational attainment of graduate degree earn the most with the average annual earnings of $53,750, while those with college or associate's degree education have the smallest earnings of $21,071.
| Educational Attainment | Male Income | Female Income |
| Less than High School | - | - |
| High School Diploma | $45,000 | $24,750 |
| College or Associate's Degree | - | - |
| Bachelor's Degree | - | - |
| Graduate Degree | - | - |
| Total | $42,500 | $45,694 |
Family Income in Ganado
Family Income Brackets in Ganado
According to the Ganado family income data, there are 34 families falling into the $15,000 to $24,999 income range, which is the most common income bracket and makes up 24.3% of all families.
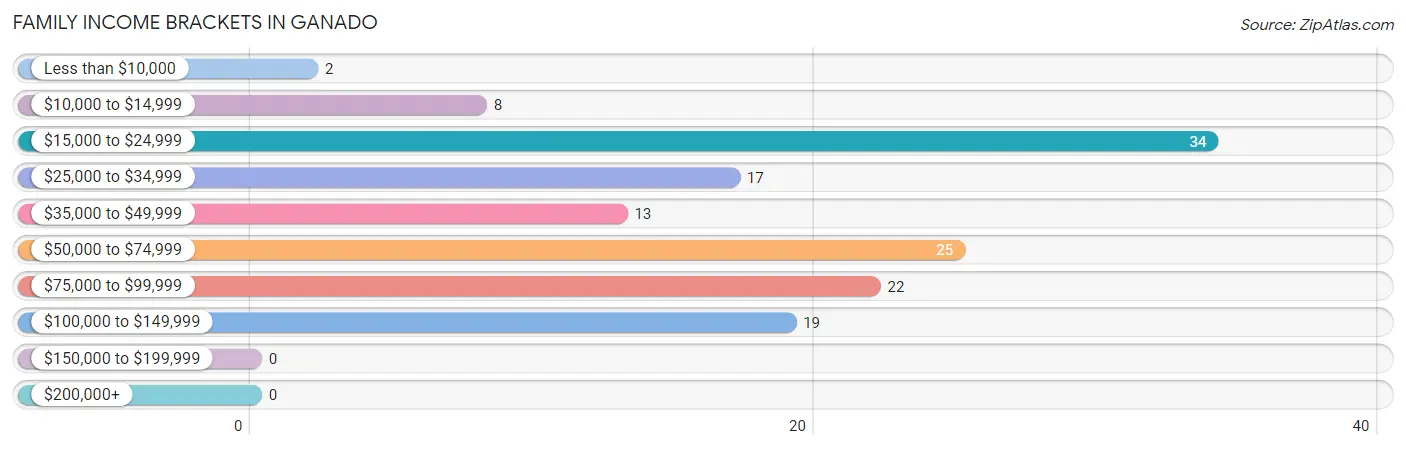
| Income Bracket | # Families | % Families |
| Less than $10,000 | 2 | 1.4% |
| $10,000 to $14,999 | 8 | 5.7% |
| $15,000 to $24,999 | 34 | 24.3% |
| $25,000 to $34,999 | 17 | 12.1% |
| $35,000 to $49,999 | 13 | 9.3% |
| $50,000 to $74,999 | 25 | 17.9% |
| $75,000 to $99,999 | 22 | 15.7% |
| $100,000 to $149,999 | 19 | 13.6% |
| $150,000 to $199,999 | 0 | 0.0% |
| $200,000+ | 0 | 0.0% |
Family Income by Famaliy Size in Ganado
4-person families (21 | 15.0%) account for the highest median family income in Ganado with $95,750 per family, while 4-person families (21 | 15.0%) have the highest median income of $23,938 per family member.
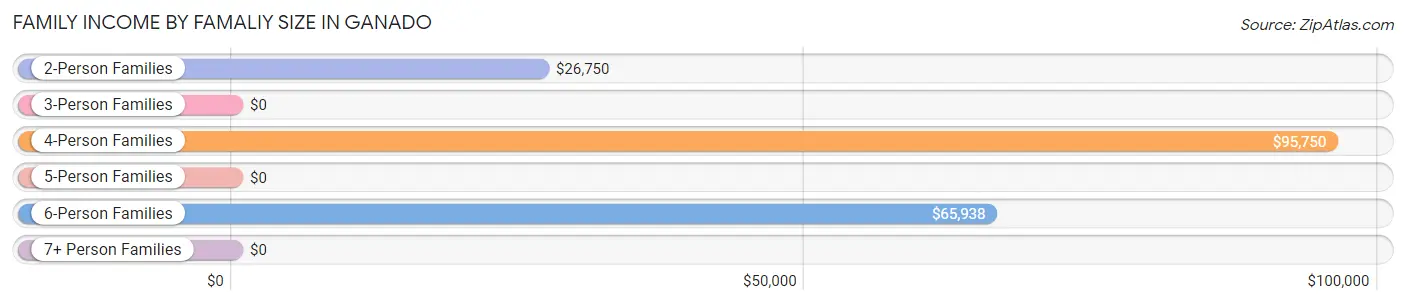
| Income Bracket | # Families | Median Income |
| 2-Person Families | 57 (40.7%) | $26,750 |
| 3-Person Families | 34 (24.3%) | $0 |
| 4-Person Families | 21 (15.0%) | $95,750 |
| 5-Person Families | 8 (5.7%) | $0 |
| 6-Person Families | 13 (9.3%) | $65,938 |
| 7+ Person Families | 7 (5.0%) | $0 |
| Total | 140 (100.0%) | $46,389 |
Family Income by Number of Earners in Ganado
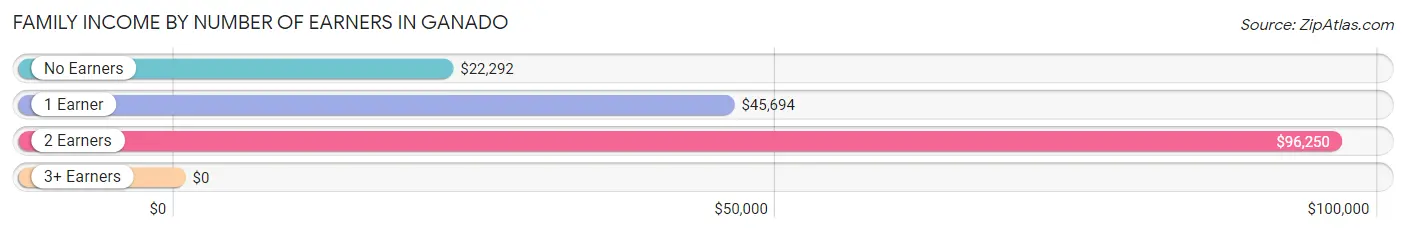
| Number of Earners | # Families | Median Income |
| No Earners | 26 (18.6%) | $22,292 |
| 1 Earner | 83 (59.3%) | $45,694 |
| 2 Earners | 27 (19.3%) | $96,250 |
| 3+ Earners | 4 (2.9%) | $0 |
| Total | 140 (100.0%) | $46,389 |
Household Income in Ganado
Household Income Brackets in Ganado
With 41 households falling in the category, the $15,000 to $24,999 income range is the most frequent in Ganado, accounting for 20.0% of all households.
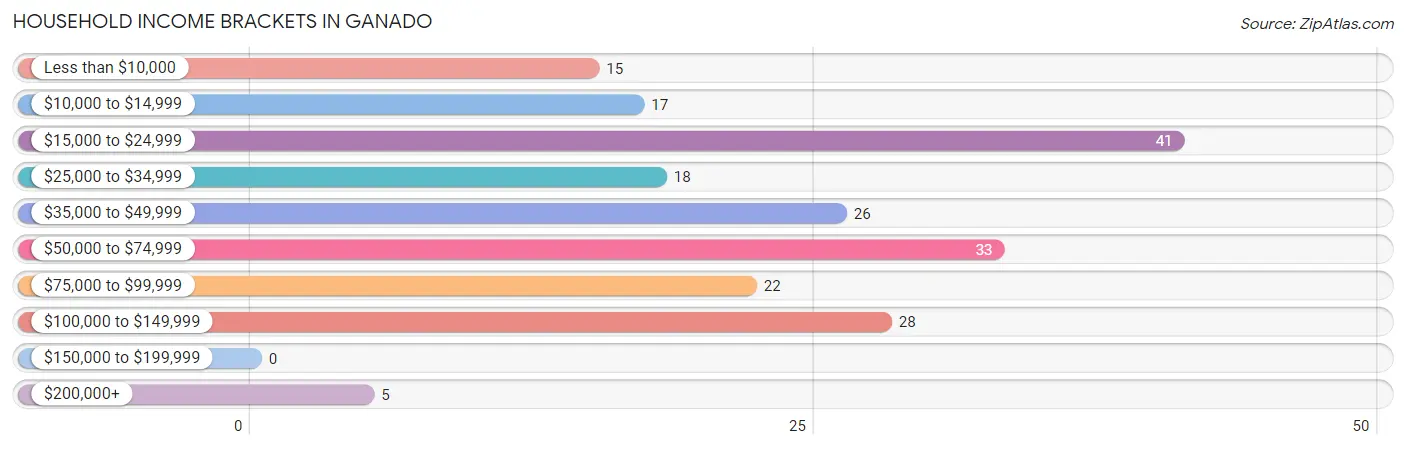
| Income Bracket | # Households | % Households |
| Less than $10,000 | 15 | 7.3% |
| $10,000 to $14,999 | 17 | 8.3% |
| $15,000 to $24,999 | 41 | 20.0% |
| $25,000 to $34,999 | 18 | 8.8% |
| $35,000 to $49,999 | 26 | 12.7% |
| $50,000 to $74,999 | 33 | 16.1% |
| $75,000 to $99,999 | 22 | 10.7% |
| $100,000 to $149,999 | 28 | 13.7% |
| $150,000 to $199,999 | 0 | 0.0% |
| $200,000+ | 5 | 2.4% |
Household Income by Householder Age in Ganado
The median household income in Ganado is $46,339, with the highest median household income of $65,000 found in the 45 to 64 years age bracket for the primary householder. A total of 108 households (52.7%) fall into this category.
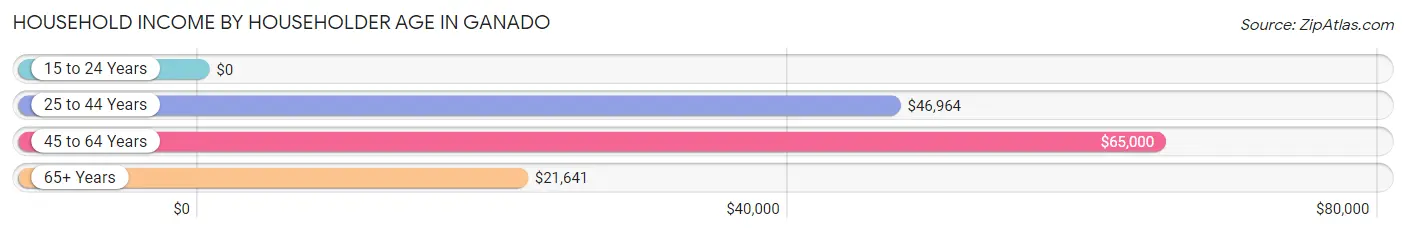
| Income Bracket | # Households | Median Income |
| 15 to 24 Years | 0 (0.0%) | $0 |
| 25 to 44 Years | 40 (19.5%) | $46,964 |
| 45 to 64 Years | 108 (52.7%) | $65,000 |
| 65+ Years | 57 (27.8%) | $21,641 |
| Total | 205 (100.0%) | $46,339 |
Poverty in Ganado
Income Below Poverty by Sex and Age in Ganado
With 27.1% poverty level for males and 20.3% for females among the residents of Ganado, 6 to 11 year old males and under 5 year old females are the most vulnerable to poverty, with 28 males (50.9%) and 6 females (60.0%) in their respective age groups living below the poverty level.
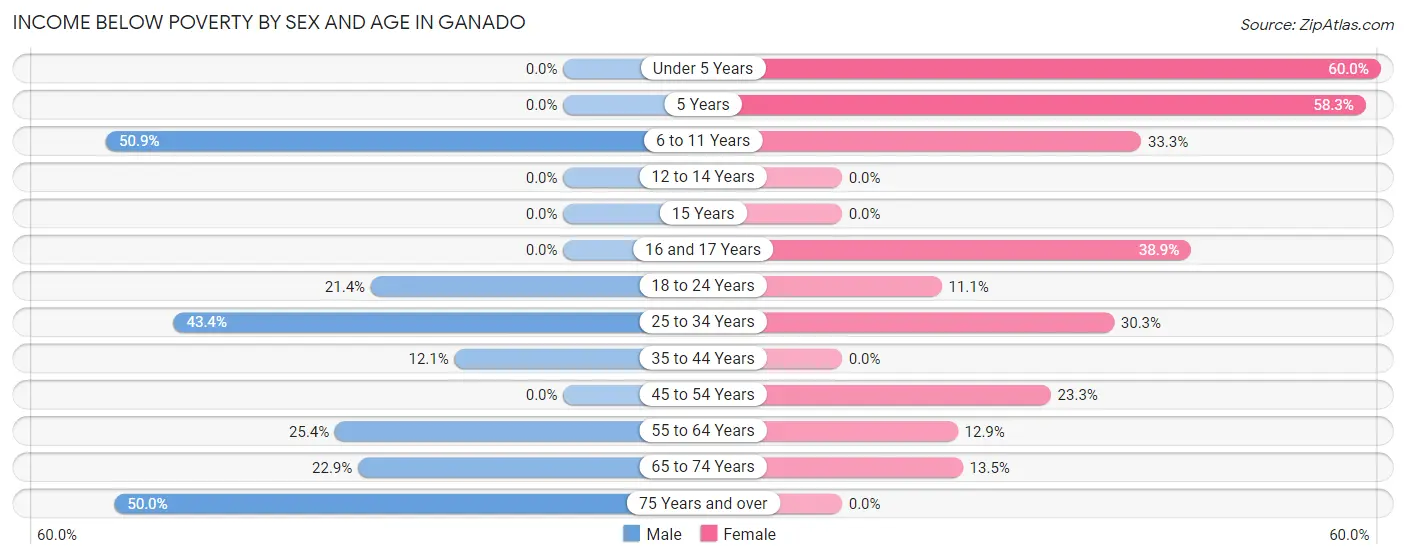
| Age Bracket | Male | Female |
| Under 5 Years | 0 (0.0%) | 6 (60.0%) |
| 5 Years | 0 (0.0%) | 7 (58.3%) |
| 6 to 11 Years | 28 (50.9%) | 9 (33.3%) |
| 12 to 14 Years | 0 (0.0%) | 0 (0.0%) |
| 15 Years | 0 (0.0%) | 0 (0.0%) |
| 16 and 17 Years | 0 (0.0%) | 7 (38.9%) |
| 18 to 24 Years | 9 (21.4%) | 2 (11.1%) |
| 25 to 34 Years | 23 (43.4%) | 30 (30.3%) |
| 35 to 44 Years | 4 (12.1%) | 0 (0.0%) |
| 45 to 54 Years | 0 (0.0%) | 10 (23.3%) |
| 55 to 64 Years | 15 (25.4%) | 4 (12.9%) |
| 65 to 74 Years | 8 (22.9%) | 7 (13.5%) |
| 75 Years and over | 3 (50.0%) | 0 (0.0%) |
| Total | 90 (27.1%) | 82 (20.3%) |
Income Above Poverty by Sex and Age in Ganado
According to the poverty statistics in Ganado, males aged under 5 years and females aged 12 to 14 years are the age groups that are most secure financially, with 100.0% of males and 100.0% of females in these age groups living above the poverty line.
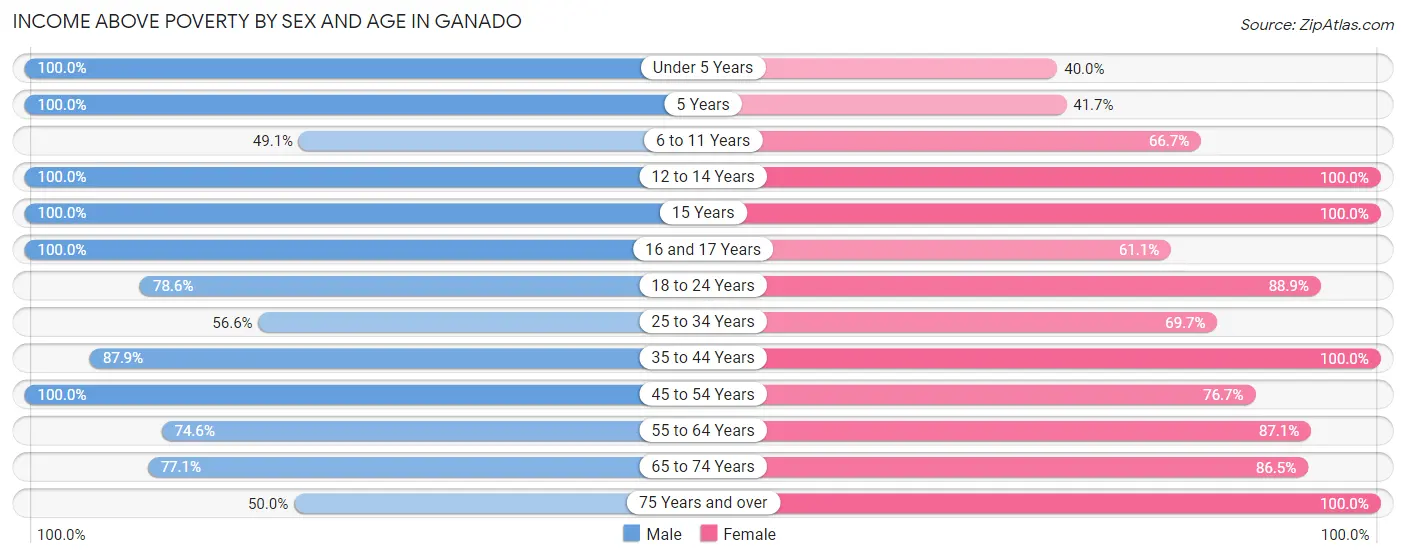
| Age Bracket | Male | Female |
| Under 5 Years | 8 (100.0%) | 4 (40.0%) |
| 5 Years | 2 (100.0%) | 5 (41.7%) |
| 6 to 11 Years | 27 (49.1%) | 18 (66.7%) |
| 12 to 14 Years | 12 (100.0%) | 25 (100.0%) |
| 15 Years | 5 (100.0%) | 4 (100.0%) |
| 16 and 17 Years | 8 (100.0%) | 11 (61.1%) |
| 18 to 24 Years | 33 (78.6%) | 16 (88.9%) |
| 25 to 34 Years | 30 (56.6%) | 69 (69.7%) |
| 35 to 44 Years | 29 (87.9%) | 49 (100.0%) |
| 45 to 54 Years | 14 (100.0%) | 33 (76.7%) |
| 55 to 64 Years | 44 (74.6%) | 27 (87.1%) |
| 65 to 74 Years | 27 (77.1%) | 45 (86.5%) |
| 75 Years and over | 3 (50.0%) | 17 (100.0%) |
| Total | 242 (72.9%) | 323 (79.7%) |
Income Below Poverty Among Married-Couple Families in Ganado
The poverty statistics for married-couple families in Ganado show that 10.4% or 5 of the total 48 families live below the poverty line. Families with 1 or 2 children have the highest poverty rate of 31.2%, comprising of 5 families. On the other hand, families with no children have the lowest poverty rate of 0.0%, which includes 0 families.
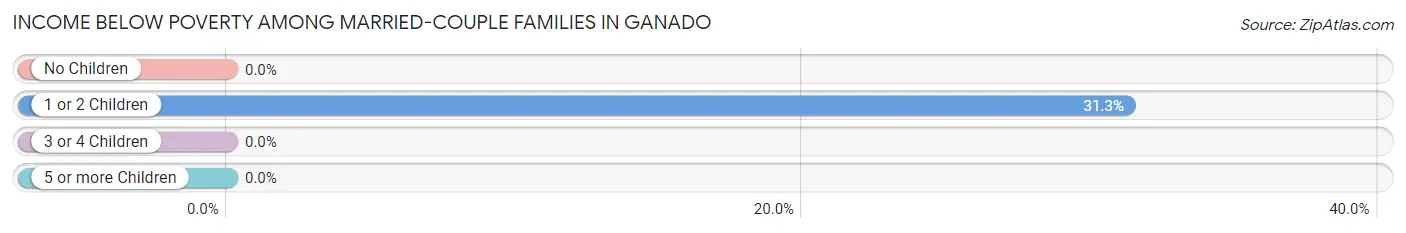
| Children | Above Poverty | Below Poverty |
| No Children | 32 (100.0%) | 0 (0.0%) |
| 1 or 2 Children | 11 (68.8%) | 5 (31.2%) |
| 3 or 4 Children | 0 (0.0%) | 0 (0.0%) |
| 5 or more Children | 0 (0.0%) | 0 (0.0%) |
| Total | 43 (89.6%) | 5 (10.4%) |
Income Below Poverty Among Single-Parent Households in Ganado
According to the poverty data in Ganado, 20.8% or 5 single-father households and 20.6% or 14 single-mother households are living below the poverty line. Among single-father households, those with 1 or 2 children have the highest poverty rate, with 5 households (55.6%) experiencing poverty. Likewise, among single-mother households, those with 3 or 4 children have the highest poverty rate, with 5 households (29.4%) falling below the poverty line.
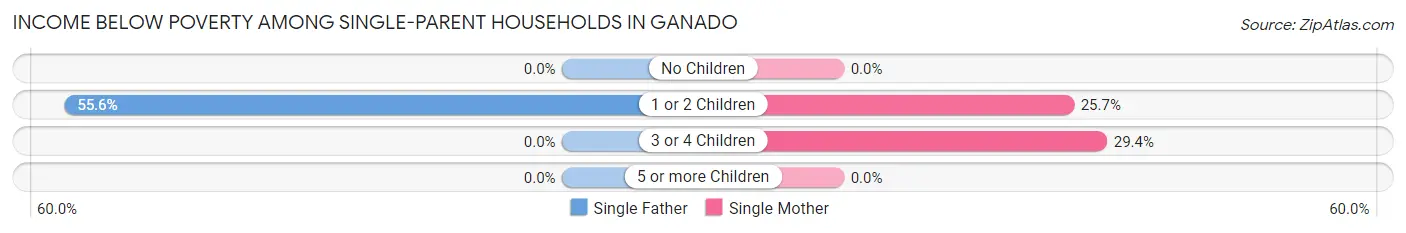
| Children | Single Father | Single Mother |
| No Children | 0 (0.0%) | 0 (0.0%) |
| 1 or 2 Children | 5 (55.6%) | 9 (25.7%) |
| 3 or 4 Children | 0 (0.0%) | 5 (29.4%) |
| 5 or more Children | 0 (0.0%) | 0 (0.0%) |
| Total | 5 (20.8%) | 14 (20.6%) |
Income Below Poverty Among Married-Couple vs Single-Parent Households in Ganado
The poverty data for Ganado shows that 5 of the married-couple family households (10.4%) and 19 of the single-parent households (20.6%) are living below the poverty level. Within the married-couple family households, those with 1 or 2 children have the highest poverty rate, with 5 households (31.2%) falling below the poverty line. Among the single-parent households, those with 1 or 2 children have the highest poverty rate, with 14 household (31.8%) living below poverty.
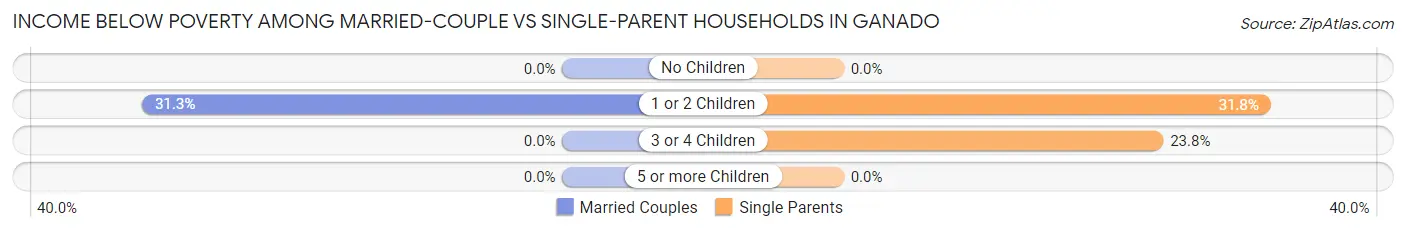
| Children | Married-Couple Families | Single-Parent Households |
| No Children | 0 (0.0%) | 0 (0.0%) |
| 1 or 2 Children | 5 (31.2%) | 14 (31.8%) |
| 3 or 4 Children | 0 (0.0%) | 5 (23.8%) |
| 5 or more Children | 0 (0.0%) | 0 (0.0%) |
| Total | 5 (10.4%) | 19 (20.6%) |
Race in Ganado
The most populous races in Ganado are Native / Alaskan (699 | 94.8%), White / Caucasian (18 | 2.4%), and Asian (12 | 1.6%).
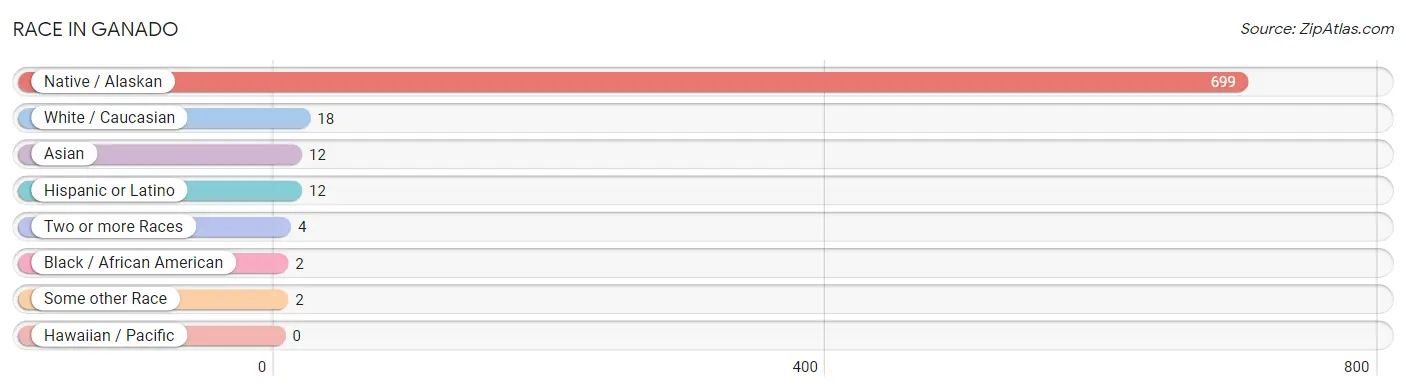
| Race | # Population | % Population |
| Asian | 12 | 1.6% |
| Black / African American | 2 | 0.3% |
| Hawaiian / Pacific | 0 | 0.0% |
| Hispanic or Latino | 12 | 1.6% |
| Native / Alaskan | 699 | 94.8% |
| White / Caucasian | 18 | 2.4% |
| Two or more Races | 4 | 0.5% |
| Some other Race | 2 | 0.3% |
| Total | 737 | 100.0% |
Ancestry in Ganado
The most populous ancestries reported in Ganado are Navajo (694 | 94.2%), Korean (12 | 1.6%), Hopi (9 | 1.2%), Irish (8 | 1.1%), and Mexican (8 | 1.1%), together accounting for 99.2% of all Ganado residents.
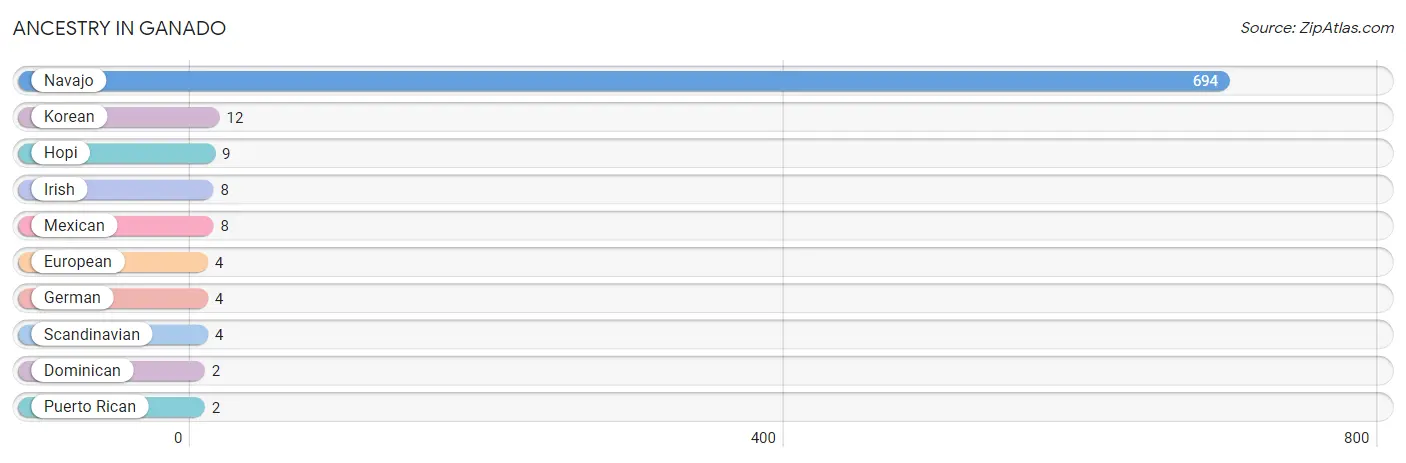
| Ancestry | # Population | % Population |
| Dominican | 2 | 0.3% |
| European | 4 | 0.5% |
| German | 4 | 0.5% |
| Hopi | 9 | 1.2% |
| Irish | 8 | 1.1% |
| Korean | 12 | 1.6% |
| Mexican | 8 | 1.1% |
| Navajo | 694 | 94.2% |
| Puerto Rican | 2 | 0.3% |
| Scandinavian | 4 | 0.5% | View All 10 Rows |
Immigrants in Ganado
The most numerous immigrant groups reported in Ganado came from Asia (12 | 1.6%), South Eastern Asia (12 | 1.6%), Philippines (9 | 1.2%), Vietnam (3 | 0.4%), and Caribbean (2 | 0.3%), together accounting for 5.2% of all Ganado residents.
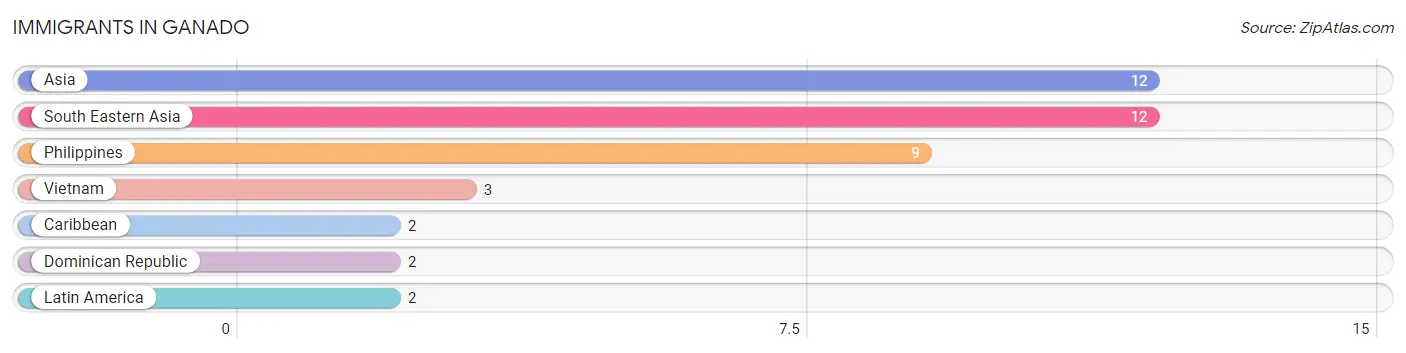
| Immigration Origin | # Population | % Population |
| Asia | 12 | 1.6% |
| Caribbean | 2 | 0.3% |
| Dominican Republic | 2 | 0.3% |
| Latin America | 2 | 0.3% |
| Philippines | 9 | 1.2% |
| South Eastern Asia | 12 | 1.6% |
| Vietnam | 3 | 0.4% | View All 7 Rows |
Sex and Age in Ganado
Sex and Age in Ganado
The most populous age groups in Ganado are 10 to 14 Years (44 | 13.3%) for men and 25 to 29 Years (59 | 14.6%) for women.
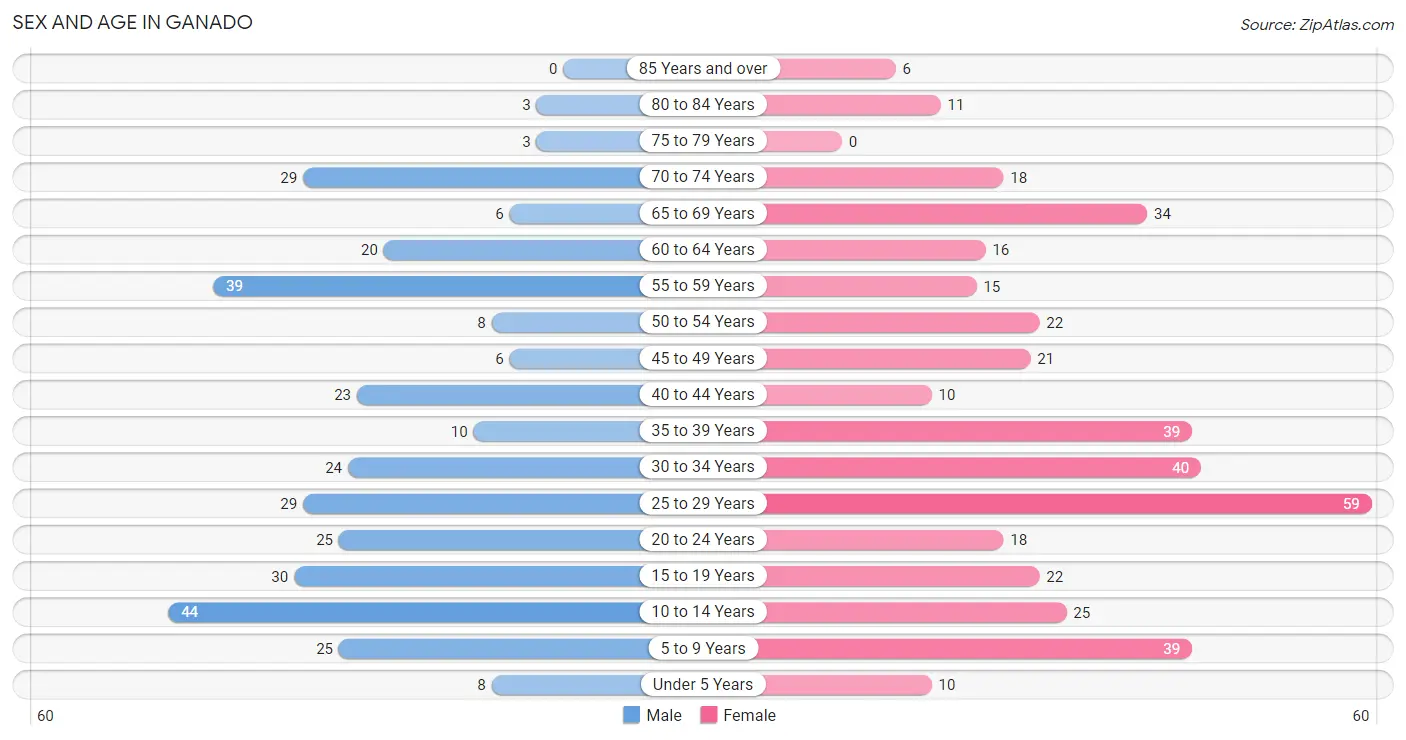
| Age Bracket | Male | Female |
| Under 5 Years | 8 (2.4%) | 10 (2.5%) |
| 5 to 9 Years | 25 (7.5%) | 39 (9.6%) |
| 10 to 14 Years | 44 (13.3%) | 25 (6.2%) |
| 15 to 19 Years | 30 (9.0%) | 22 (5.4%) |
| 20 to 24 Years | 25 (7.5%) | 18 (4.4%) |
| 25 to 29 Years | 29 (8.7%) | 59 (14.6%) |
| 30 to 34 Years | 24 (7.2%) | 40 (9.9%) |
| 35 to 39 Years | 10 (3.0%) | 39 (9.6%) |
| 40 to 44 Years | 23 (6.9%) | 10 (2.5%) |
| 45 to 49 Years | 6 (1.8%) | 21 (5.2%) |
| 50 to 54 Years | 8 (2.4%) | 22 (5.4%) |
| 55 to 59 Years | 39 (11.7%) | 15 (3.7%) |
| 60 to 64 Years | 20 (6.0%) | 16 (4.0%) |
| 65 to 69 Years | 6 (1.8%) | 34 (8.4%) |
| 70 to 74 Years | 29 (8.7%) | 18 (4.4%) |
| 75 to 79 Years | 3 (0.9%) | 0 (0.0%) |
| 80 to 84 Years | 3 (0.9%) | 11 (2.7%) |
| 85 Years and over | 0 (0.0%) | 6 (1.5%) |
| Total | 332 (100.0%) | 405 (100.0%) |
Families and Households in Ganado
Median Family Size in Ganado
The median family size in Ganado is 4.61 persons per family, with single male/father families (24 | 17.1%) accounting for the largest median family size of 5.5 persons per family. On the other hand, married-couple families (48 | 34.3%) represent the smallest median family size with 3.67 persons per family.
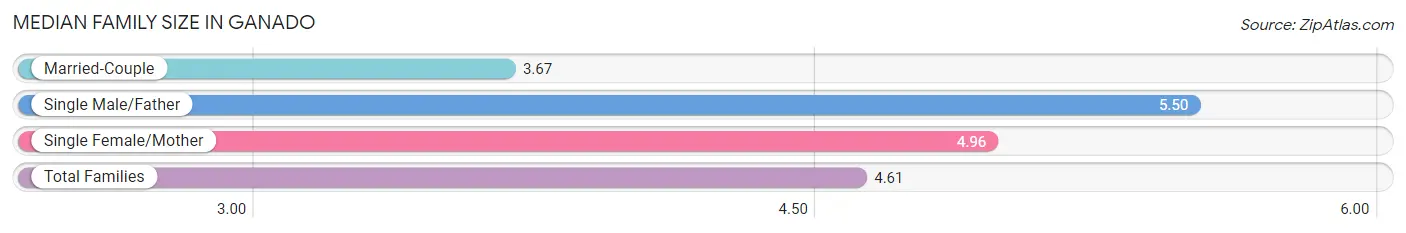
| Family Type | # Families | Family Size |
| Married-Couple | 48 (34.3%) | 3.67 |
| Single Male/Father | 24 (17.1%) | 5.50 |
| Single Female/Mother | 68 (48.6%) | 4.96 |
| Total Families | 140 (100.0%) | 4.61 |
Median Household Size in Ganado
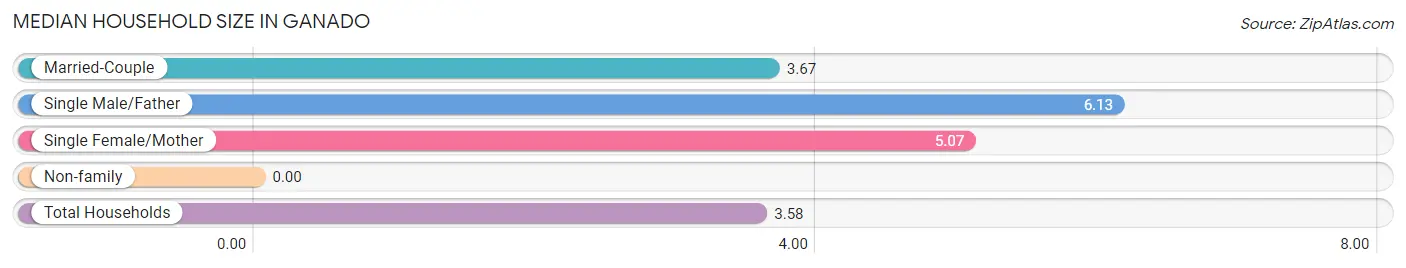
| Household Type | # Households | Household Size |
| Married-Couple | 48 (23.4%) | 3.67 |
| Single Male/Father | 24 (11.7%) | 6.13 |
| Single Female/Mother | 68 (33.2%) | 5.07 |
| Non-family | 65 (31.7%) | - |
| Total Households | 205 (100.0%) | 3.58 |
Household Size by Marriage Status in Ganado
Out of a total of 205 households in Ganado, 140 (68.3%) are family households, while 65 (31.7%) are nonfamily households. The most numerous type of family households are 2-person households, comprising 46, and the most common type of nonfamily households are 1-person households, comprising 65.
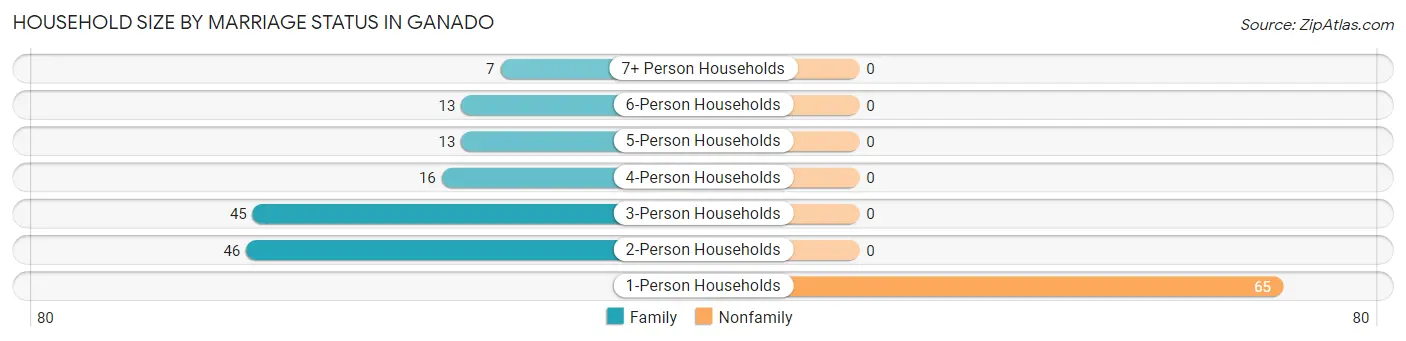
| Household Size | Family Households | Nonfamily Households |
| 1-Person Households | - | 65 (31.7%) |
| 2-Person Households | 46 (22.4%) | 0 (0.0%) |
| 3-Person Households | 45 (22.0%) | 0 (0.0%) |
| 4-Person Households | 16 (7.8%) | 0 (0.0%) |
| 5-Person Households | 13 (6.3%) | 0 (0.0%) |
| 6-Person Households | 13 (6.3%) | 0 (0.0%) |
| 7+ Person Households | 7 (3.4%) | 0 (0.0%) |
| Total | 140 (68.3%) | 65 (31.7%) |
Female Fertility in Ganado
Fertility by Age in Ganado
Average fertility rate in Ganado is 63.0 births per 1,000 women. Women in the age bracket of 20 to 34 years have the highest fertility rate with 85.0 births per 1,000 women. Women in the age bracket of 20 to 34 years acount for 71.4% of all women with births.
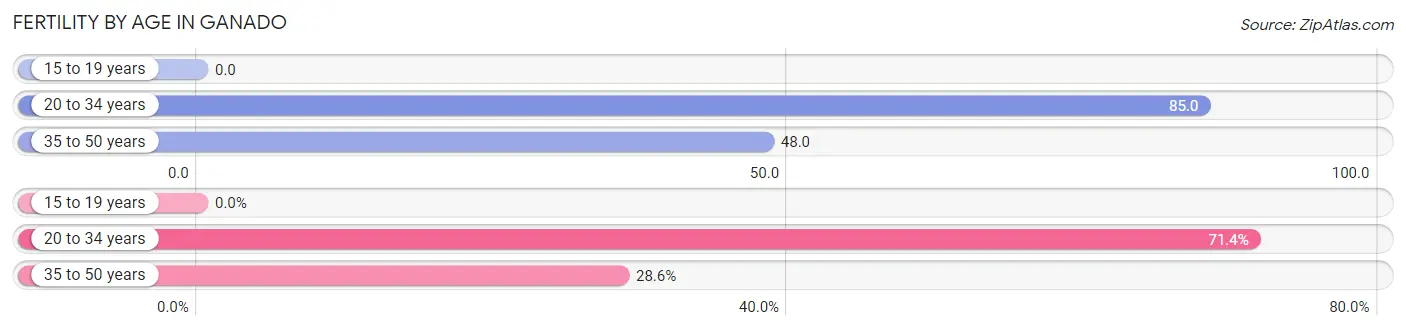
| Age Bracket | Women with Births | Births / 1,000 Women |
| 15 to 19 years | 0 (0.0%) | 0.0 |
| 20 to 34 years | 10 (71.4%) | 85.0 |
| 35 to 50 years | 4 (28.6%) | 48.0 |
| Total | 14 (100.0%) | 63.0 |
Fertility by Age by Marriage Status in Ganado
71.4% of women with births (14) in Ganado are married. The highest percentage of unmarried women with births falls into 35 to 50 years age bracket with 100.0% of them unmarried at the time of birth, while the lowest percentage of unmarried women with births belong to 20 to 34 years age bracket with 0.0% of them unmarried.
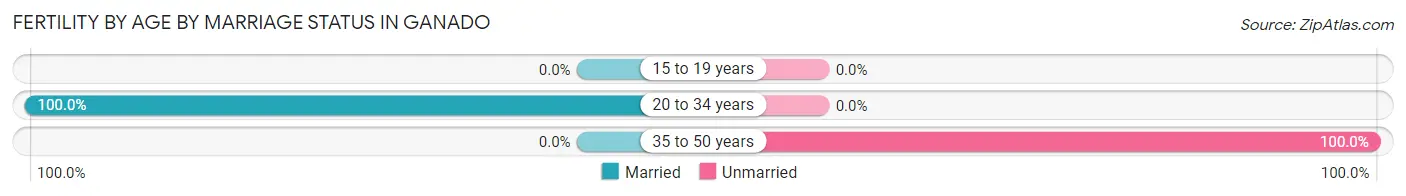
| Age Bracket | Married | Unmarried |
| 15 to 19 years | 0 (0.0%) | 0 (0.0%) |
| 20 to 34 years | 10 (100.0%) | 0 (0.0%) |
| 35 to 50 years | 0 (0.0%) | 4 (100.0%) |
| Total | 10 (71.4%) | 4 (28.6%) |
Fertility by Education in Ganado
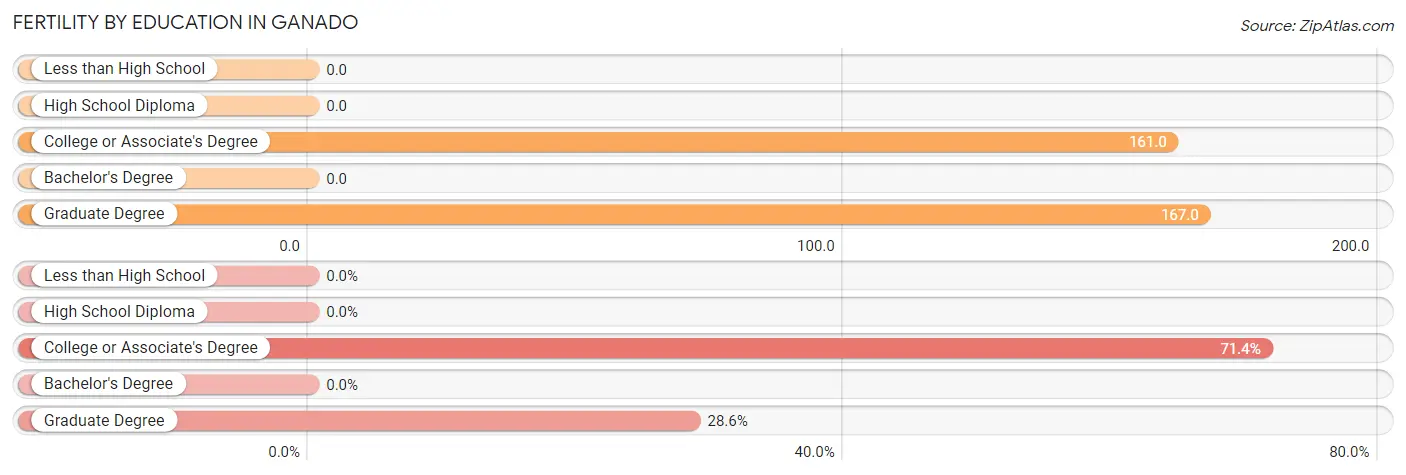
| Educational Attainment | Women with Births | Births / 1,000 Women |
| Less than High School | 0 (0.0%) | 0.0 |
| High School Diploma | 0 (0.0%) | 0.0 |
| College or Associate's Degree | 10 (71.4%) | 161.0 |
| Bachelor's Degree | 0 (0.0%) | 0.0 |
| Graduate Degree | 4 (28.6%) | 167.0 |
| Total | 14 (100.0%) | 63.0 |
Fertility by Education by Marriage Status in Ganado
28.6% of women with births in Ganado are unmarried. Women with the educational attainment of college or associate's degree are most likely to be married with 100.0% of them married at childbirth, while women with the educational attainment of graduate degree are least likely to be married with 100.0% of them unmarried at childbirth.
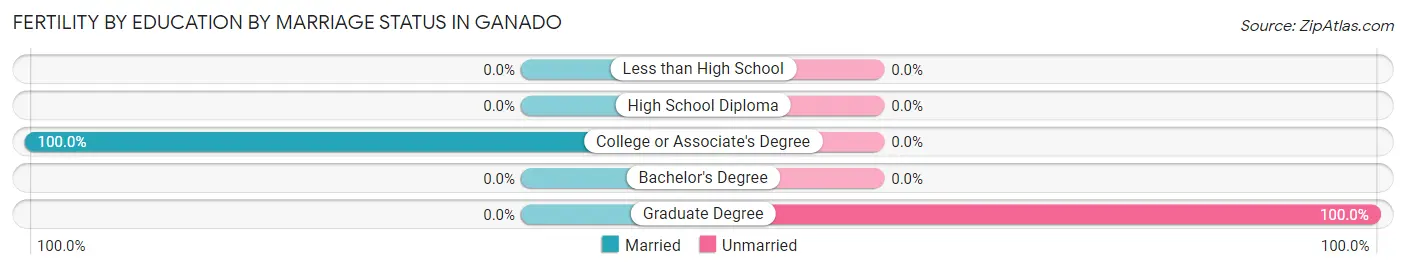
| Educational Attainment | Married | Unmarried |
| Less than High School | 0 (0.0%) | 0 (0.0%) |
| High School Diploma | 0 (0.0%) | 0 (0.0%) |
| College or Associate's Degree | 10 (100.0%) | 0 (0.0%) |
| Bachelor's Degree | 0 (0.0%) | 0 (0.0%) |
| Graduate Degree | 0 (0.0%) | 4 (100.0%) |
| Total | 10 (71.4%) | 4 (28.6%) |
Employment Characteristics in Ganado
Employment by Class of Employer in Ganado
Among the 275 employed individuals in Ganado, state government employees (131 | 47.6%), private company employees (70 | 25.5%), and federal government employees (37 | 13.5%) make up the most common classes of employment.
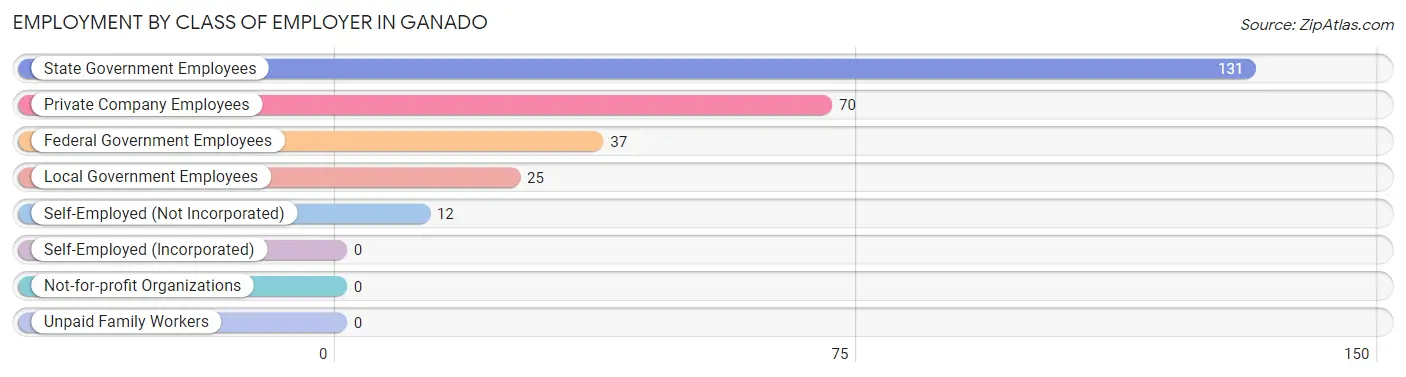
| Employer Class | # Employees | % Employees |
| Private Company Employees | 70 | 25.5% |
| Self-Employed (Incorporated) | 0 | 0.0% |
| Self-Employed (Not Incorporated) | 12 | 4.4% |
| Not-for-profit Organizations | 0 | 0.0% |
| Local Government Employees | 25 | 9.1% |
| State Government Employees | 131 | 47.6% |
| Federal Government Employees | 37 | 13.5% |
| Unpaid Family Workers | 0 | 0.0% |
| Total | 275 | 100.0% |
Employment Status by Age in Ganado
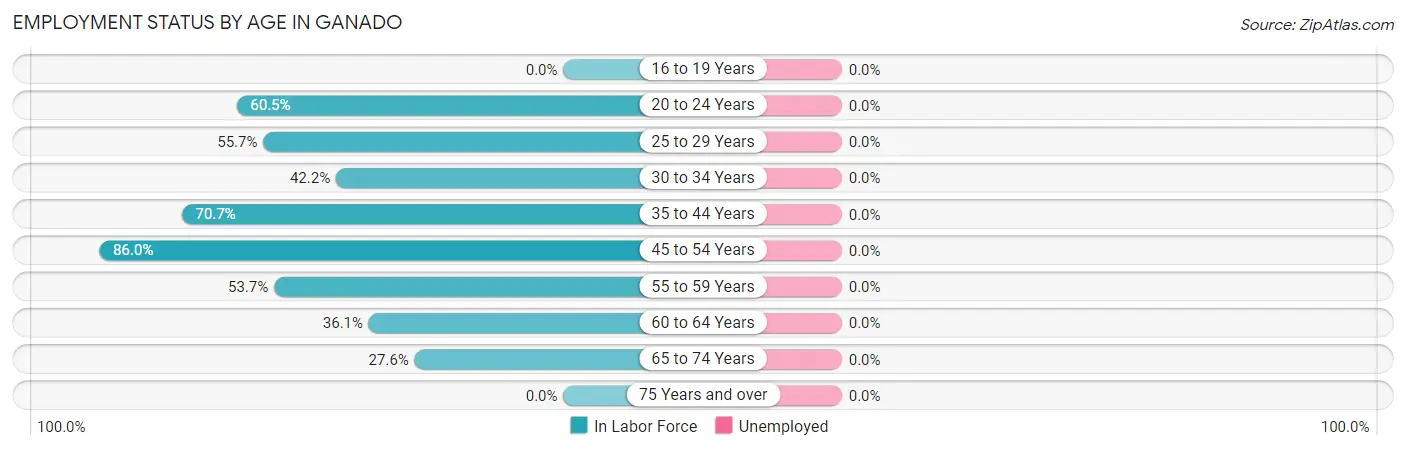
| Age Bracket | In Labor Force | Unemployed |
| 16 to 19 Years | 0 (0.0%) | 0 (0.0%) |
| 20 to 24 Years | 26 (60.5%) | 0 (0.0%) |
| 25 to 29 Years | 49 (55.7%) | 0 (0.0%) |
| 30 to 34 Years | 27 (42.2%) | 0 (0.0%) |
| 35 to 44 Years | 58 (70.7%) | 0 (0.0%) |
| 45 to 54 Years | 49 (86.0%) | 0 (0.0%) |
| 55 to 59 Years | 29 (53.7%) | 0 (0.0%) |
| 60 to 64 Years | 13 (36.1%) | 0 (0.0%) |
| 65 to 74 Years | 24 (27.6%) | 0 (0.0%) |
| 75 Years and over | 0 (0.0%) | 0 (0.0%) |
| Total | 275 (47.7%) | 0 (0.0%) |
Employment Status by Educational Attainment in Ganado
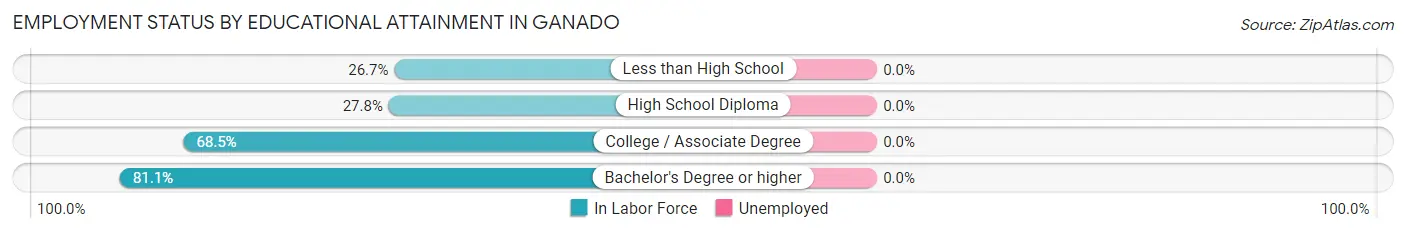
| Educational Attainment | In Labor Force | Unemployed |
| Less than High School | 8 (26.7%) | 0 (0.0%) |
| High School Diploma | 27 (27.8%) | 0 (0.0%) |
| College / Associate Degree | 87 (68.5%) | 0 (0.0%) |
| Bachelor's Degree or higher | 103 (81.1%) | 0 (0.0%) |
| Total | 225 (59.1%) | 0 (0.0%) |
Employment Occupations by Sex in Ganado
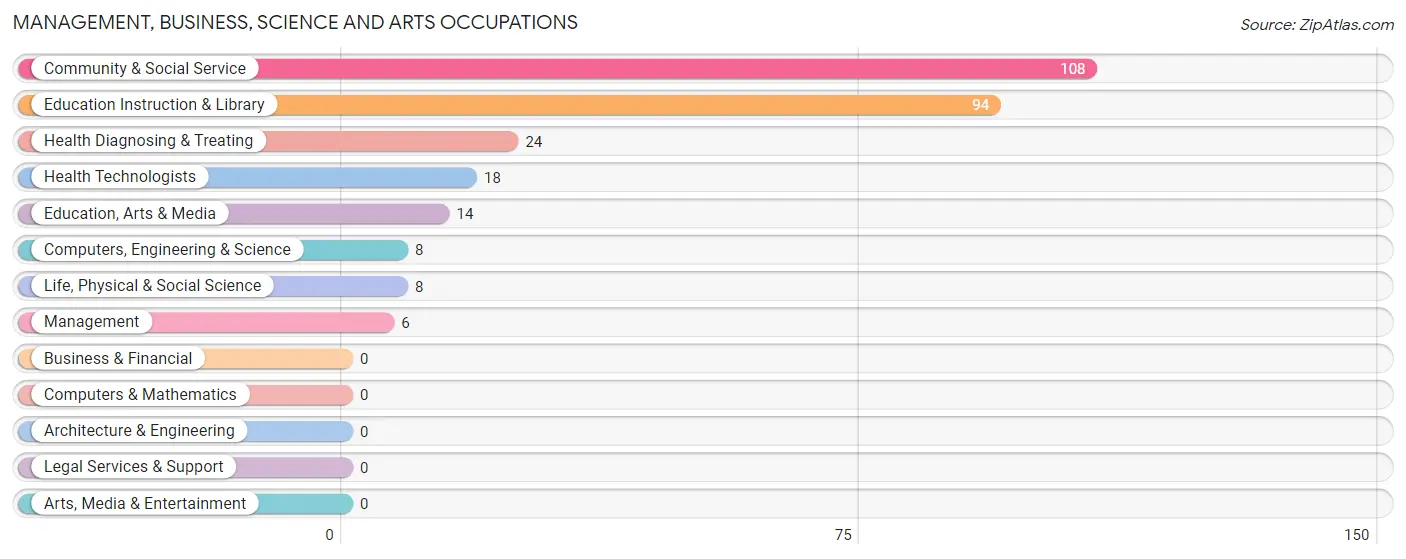
Management, Business, Science and Arts Occupations
The most common Management, Business, Science and Arts occupations in Ganado are Community & Social Service (108 | 39.3%), Education Instruction & Library (94 | 34.2%), Health Diagnosing & Treating (24 | 8.7%), Health Technologists (18 | 6.6%), and Education, Arts & Media (14 | 5.1%).
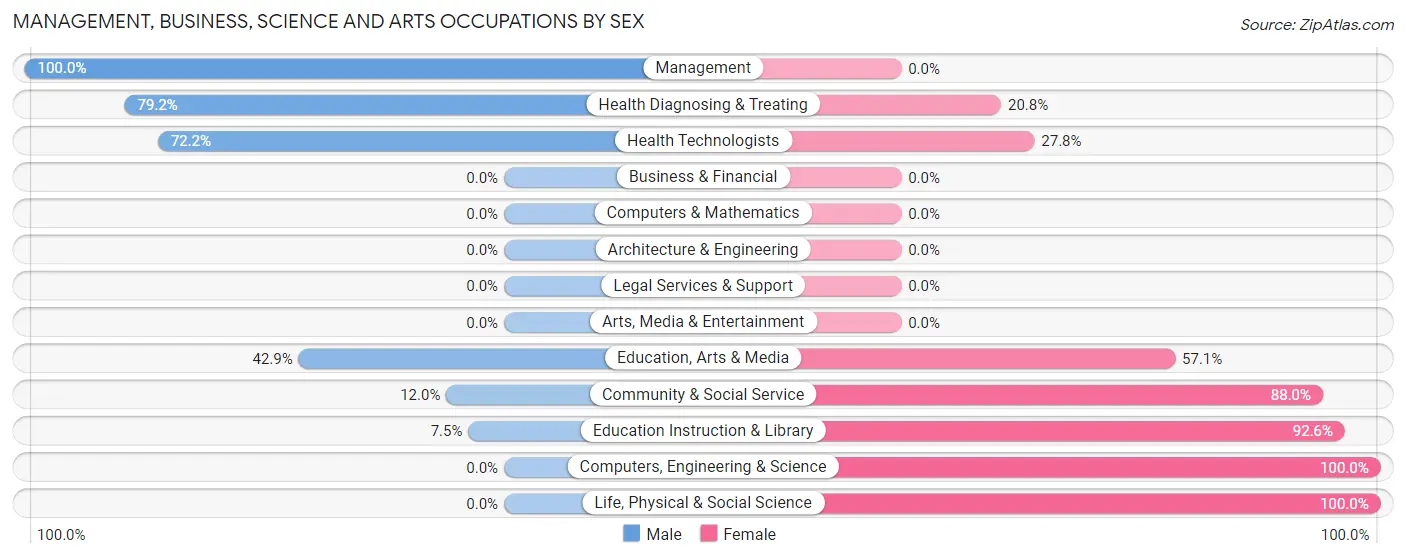
Management, Business, Science and Arts Occupations by Sex
Within the Management, Business, Science and Arts occupations in Ganado, the most male-oriented occupations are Management (100.0%), Health Diagnosing & Treating (79.2%), and Health Technologists (72.2%), while the most female-oriented occupations are Computers, Engineering & Science (100.0%), Life, Physical & Social Science (100.0%), and Education Instruction & Library (92.5%).
| Occupation | Male | Female |
| Management | 6 (100.0%) | 0 (0.0%) |
| Business & Financial | 0 (0.0%) | 0 (0.0%) |
| Computers, Engineering & Science | 0 (0.0%) | 8 (100.0%) |
| Computers & Mathematics | 0 (0.0%) | 0 (0.0%) |
| Architecture & Engineering | 0 (0.0%) | 0 (0.0%) |
| Life, Physical & Social Science | 0 (0.0%) | 8 (100.0%) |
| Community & Social Service | 13 (12.0%) | 95 (88.0%) |
| Education, Arts & Media | 6 (42.9%) | 8 (57.1%) |
| Legal Services & Support | 0 (0.0%) | 0 (0.0%) |
| Education Instruction & Library | 7 (7.4%) | 87 (92.5%) |
| Arts, Media & Entertainment | 0 (0.0%) | 0 (0.0%) |
| Health Diagnosing & Treating | 19 (79.2%) | 5 (20.8%) |
| Health Technologists | 13 (72.2%) | 5 (27.8%) |
| Total (Category) | 38 (26.0%) | 108 (74.0%) |
| Total (Overall) | 78 (28.4%) | 197 (71.6%) |
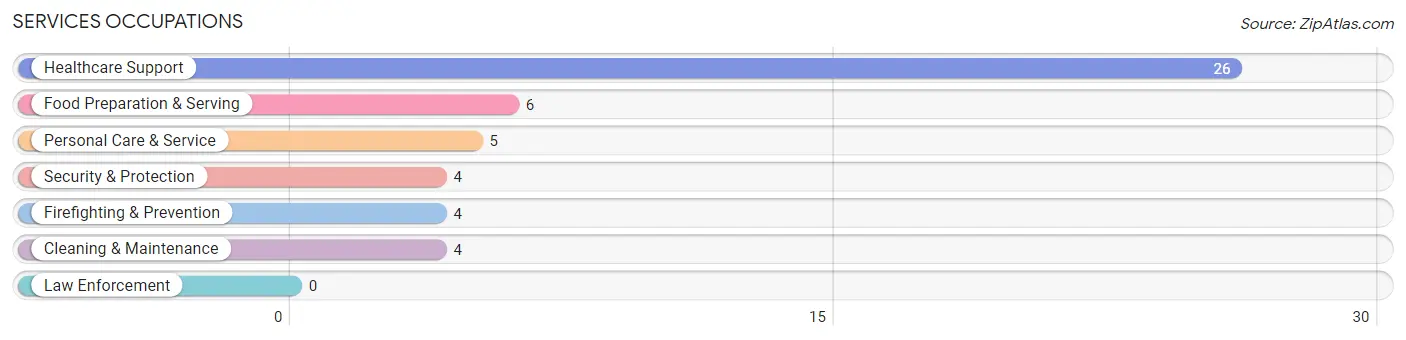
Services Occupations
The most common Services occupations in Ganado are Healthcare Support (26 | 9.5%), Food Preparation & Serving (6 | 2.2%), Personal Care & Service (5 | 1.8%), Security & Protection (4 | 1.5%), and Firefighting & Prevention (4 | 1.5%).
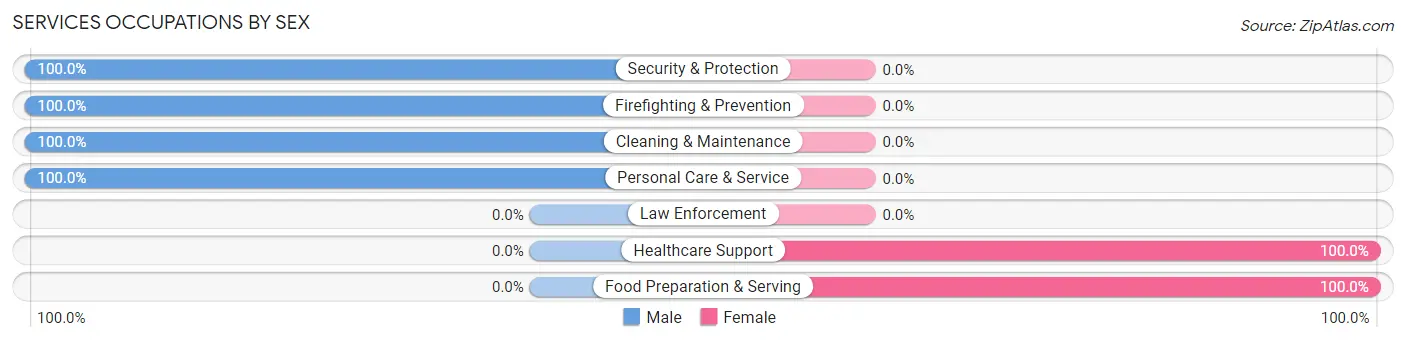
Services Occupations by Sex
Within the Services occupations in Ganado, the most male-oriented occupations are Security & Protection (100.0%), Firefighting & Prevention (100.0%), and Cleaning & Maintenance (100.0%), while the most female-oriented occupations are Healthcare Support (100.0%), and Food Preparation & Serving (100.0%).
| Occupation | Male | Female |
| Healthcare Support | 0 (0.0%) | 26 (100.0%) |
| Security & Protection | 4 (100.0%) | 0 (0.0%) |
| Firefighting & Prevention | 4 (100.0%) | 0 (0.0%) |
| Law Enforcement | 0 (0.0%) | 0 (0.0%) |
| Food Preparation & Serving | 0 (0.0%) | 6 (100.0%) |
| Cleaning & Maintenance | 4 (100.0%) | 0 (0.0%) |
| Personal Care & Service | 5 (100.0%) | 0 (0.0%) |
| Total (Category) | 13 (28.9%) | 32 (71.1%) |
| Total (Overall) | 78 (28.4%) | 197 (71.6%) |
Sales and Office Occupations
The most common Sales and Office occupations in Ganado are Office & Administration (46 | 16.7%), and Sales & Related (12 | 4.4%).
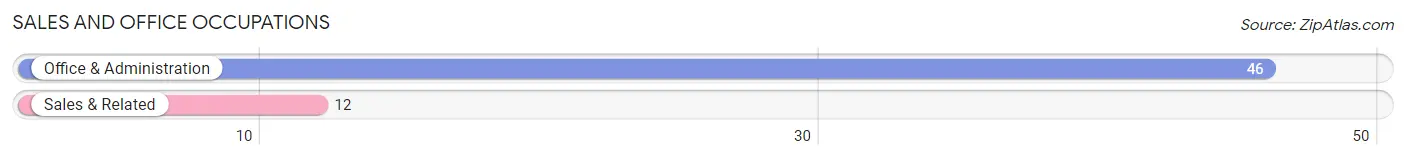
Sales and Office Occupations by Sex
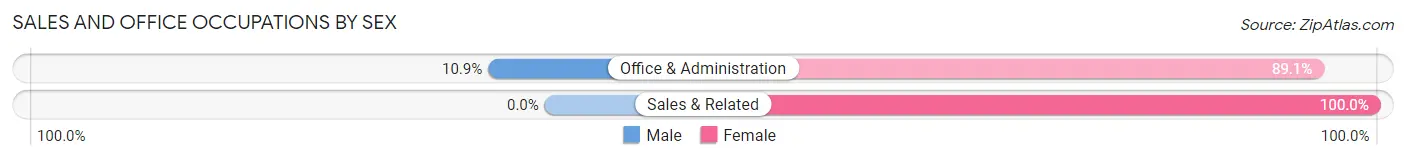
| Occupation | Male | Female |
| Sales & Related | 0 (0.0%) | 12 (100.0%) |
| Office & Administration | 5 (10.9%) | 41 (89.1%) |
| Total (Category) | 5 (8.6%) | 53 (91.4%) |
| Total (Overall) | 78 (28.4%) | 197 (71.6%) |
Natural Resources, Construction and Maintenance Occupations
The most common Natural Resources, Construction and Maintenance occupations in Ganado are , and Construction & Extraction (17 | 6.2%).
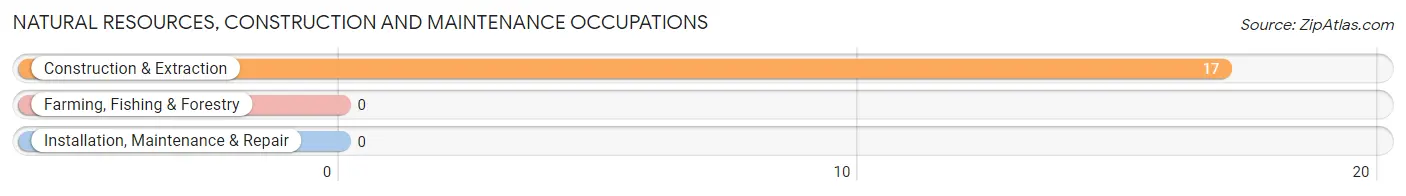
Natural Resources, Construction and Maintenance Occupations by Sex
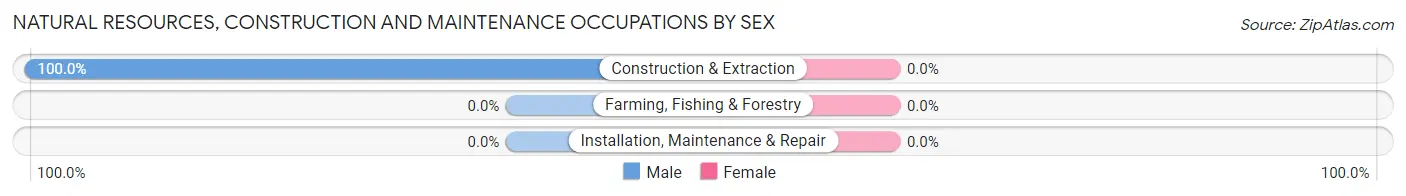
| Occupation | Male | Female |
| Farming, Fishing & Forestry | 0 (0.0%) | 0 (0.0%) |
| Construction & Extraction | 17 (100.0%) | 0 (0.0%) |
| Installation, Maintenance & Repair | 0 (0.0%) | 0 (0.0%) |
| Total (Category) | 17 (100.0%) | 0 (0.0%) |
| Total (Overall) | 78 (28.4%) | 197 (71.6%) |
Production, Transportation and Moving Occupations
The most common Production, Transportation and Moving occupations in Ganado are , and Transportation (9 | 3.3%).
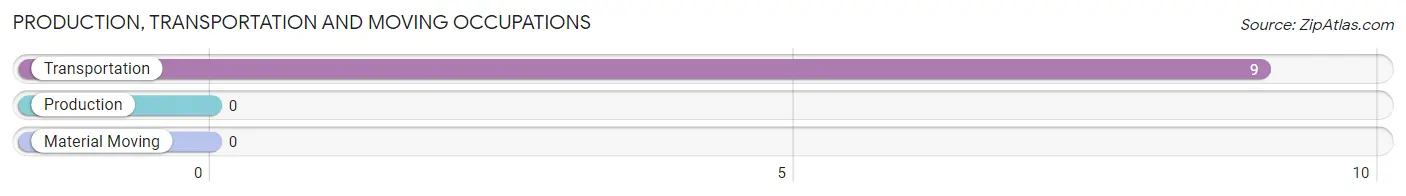
Production, Transportation and Moving Occupations by Sex
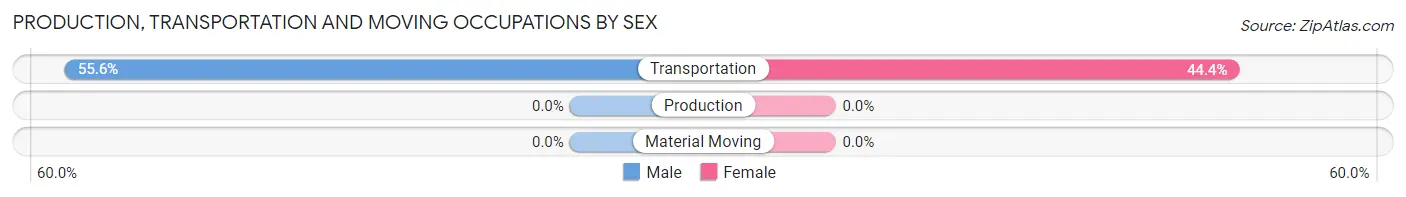
| Occupation | Male | Female |
| Production | 0 (0.0%) | 0 (0.0%) |
| Transportation | 5 (55.6%) | 4 (44.4%) |
| Material Moving | 0 (0.0%) | 0 (0.0%) |
| Total (Category) | 5 (55.6%) | 4 (44.4%) |
| Total (Overall) | 78 (28.4%) | 197 (71.6%) |
Employment Industries by Sex in Ganado
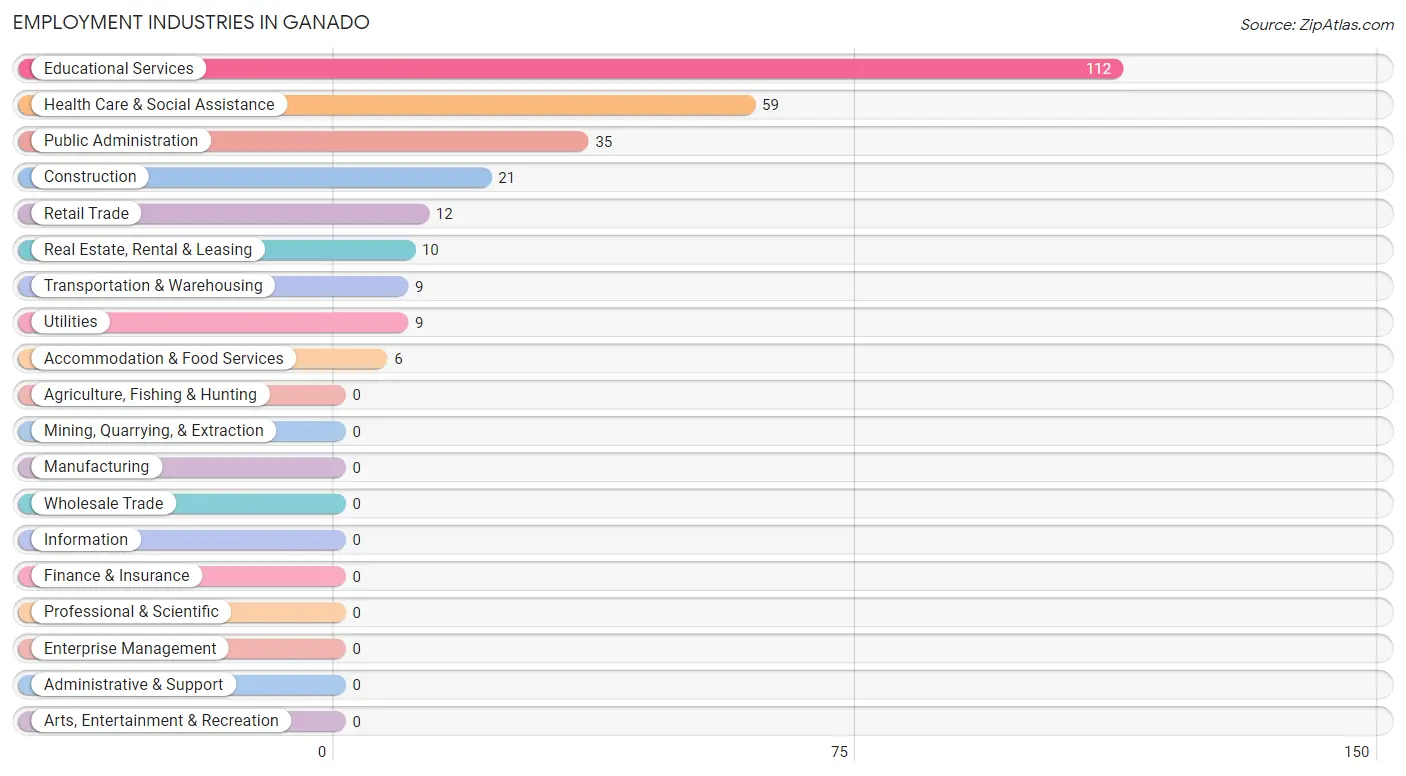
Employment Industries in Ganado
The major employment industries in Ganado include Educational Services (112 | 40.7%), Health Care & Social Assistance (59 | 21.4%), Public Administration (35 | 12.7%), Construction (21 | 7.6%), and Retail Trade (12 | 4.4%).
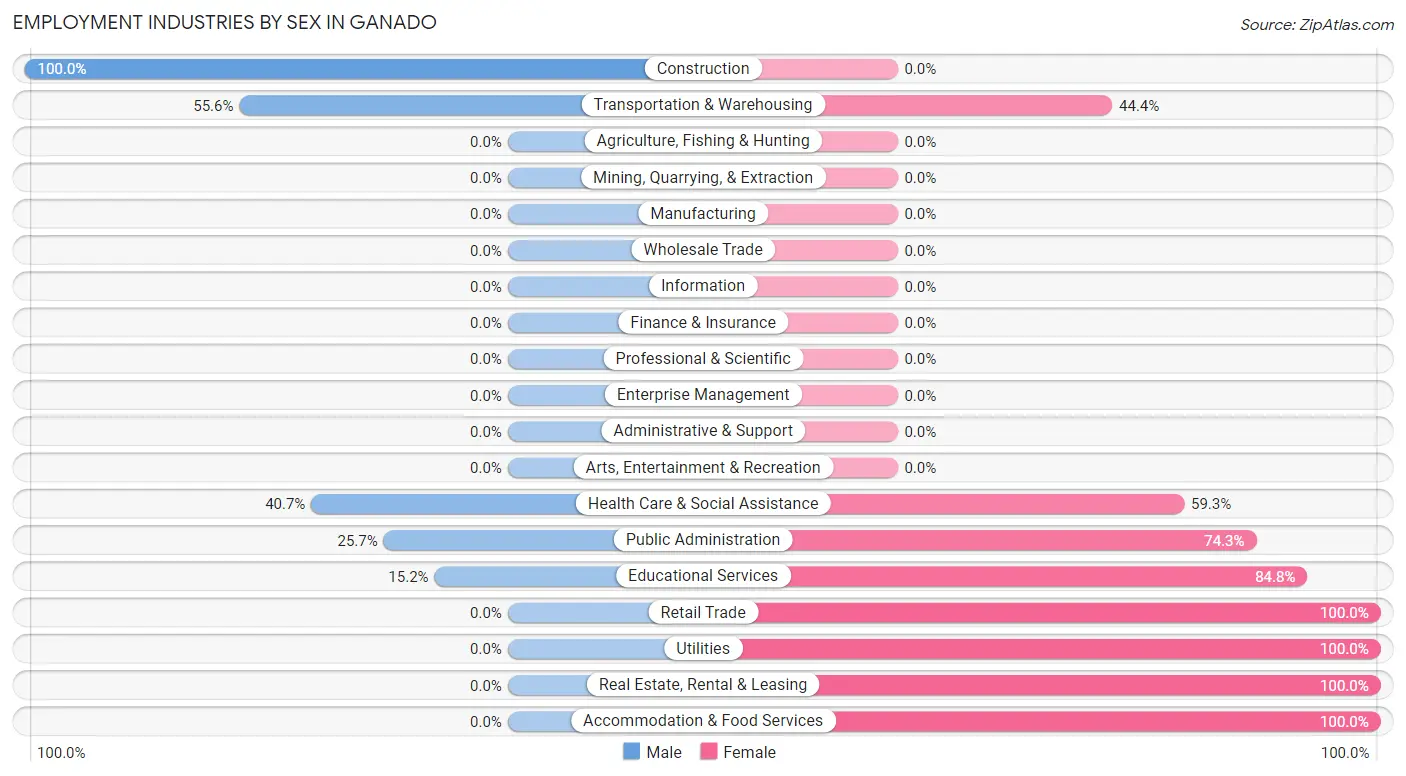
Employment Industries by Sex in Ganado
The Ganado industries that see more men than women are Construction (100.0%), Transportation & Warehousing (55.6%), and Health Care & Social Assistance (40.7%), whereas the industries that tend to have a higher number of women are Retail Trade (100.0%), Utilities (100.0%), and Real Estate, Rental & Leasing (100.0%).
| Industry | Male | Female |
| Agriculture, Fishing & Hunting | 0 (0.0%) | 0 (0.0%) |
| Mining, Quarrying, & Extraction | 0 (0.0%) | 0 (0.0%) |
| Construction | 21 (100.0%) | 0 (0.0%) |
| Manufacturing | 0 (0.0%) | 0 (0.0%) |
| Wholesale Trade | 0 (0.0%) | 0 (0.0%) |
| Retail Trade | 0 (0.0%) | 12 (100.0%) |
| Transportation & Warehousing | 5 (55.6%) | 4 (44.4%) |
| Utilities | 0 (0.0%) | 9 (100.0%) |
| Information | 0 (0.0%) | 0 (0.0%) |
| Finance & Insurance | 0 (0.0%) | 0 (0.0%) |
| Real Estate, Rental & Leasing | 0 (0.0%) | 10 (100.0%) |
| Professional & Scientific | 0 (0.0%) | 0 (0.0%) |
| Enterprise Management | 0 (0.0%) | 0 (0.0%) |
| Administrative & Support | 0 (0.0%) | 0 (0.0%) |
| Educational Services | 17 (15.2%) | 95 (84.8%) |
| Health Care & Social Assistance | 24 (40.7%) | 35 (59.3%) |
| Arts, Entertainment & Recreation | 0 (0.0%) | 0 (0.0%) |
| Accommodation & Food Services | 0 (0.0%) | 6 (100.0%) |
| Public Administration | 9 (25.7%) | 26 (74.3%) |
| Total | 78 (28.4%) | 197 (71.6%) |
Education in Ganado
School Enrollment in Ganado
The most common levels of schooling among the 200 students in Ganado are elementary school (63 | 31.5%), middle school (50 | 25.0%), and high school (49 | 24.5%).
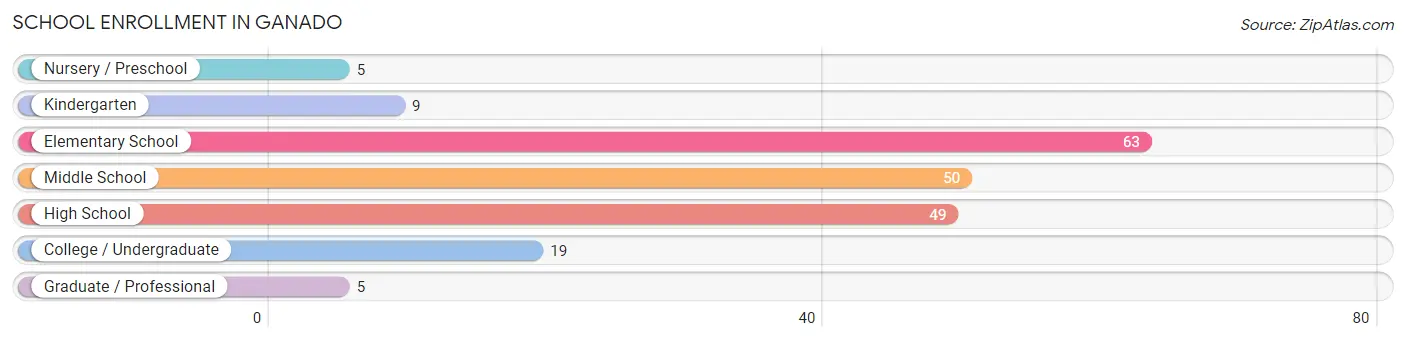
| School Level | # Students | % Students |
| Nursery / Preschool | 5 | 2.5% |
| Kindergarten | 9 | 4.5% |
| Elementary School | 63 | 31.5% |
| Middle School | 50 | 25.0% |
| High School | 49 | 24.5% |
| College / Undergraduate | 19 | 9.5% |
| Graduate / Professional | 5 | 2.5% |
| Total | 200 | 100.0% |
School Enrollment by Age by Funding Source in Ganado
Out of a total of 200 students who are enrolled in schools in Ganado, 5 (2.5%) attend a private institution, while the remaining 195 (97.5%) are enrolled in public schools. The age group of 35 years and over has the highest likelihood of being enrolled in private schools, with 5 (100.0% in the age bracket) enrolled. Conversely, the age group of 5 to 9 year old has the lowest likelihood of being enrolled in a private school, with 64 (100.0% in the age bracket) attending a public institution.
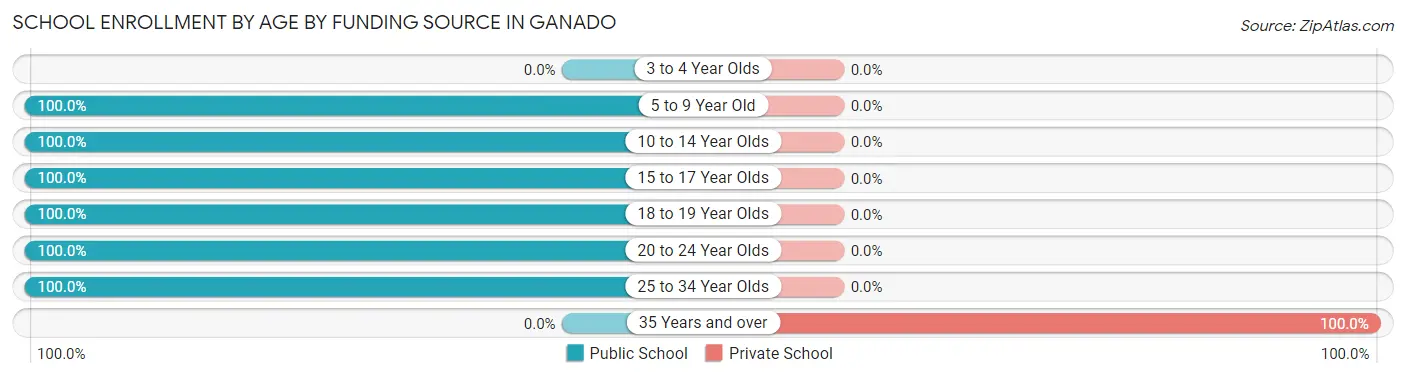
| Age Bracket | Public School | Private School |
| 3 to 4 Year Olds | 0 (0.0%) | 0 (0.0%) |
| 5 to 9 Year Old | 64 (100.0%) | 0 (0.0%) |
| 10 to 14 Year Olds | 69 (100.0%) | 0 (0.0%) |
| 15 to 17 Year Olds | 32 (100.0%) | 0 (0.0%) |
| 18 to 19 Year Olds | 11 (100.0%) | 0 (0.0%) |
| 20 to 24 Year Olds | 11 (100.0%) | 0 (0.0%) |
| 25 to 34 Year Olds | 8 (100.0%) | 0 (0.0%) |
| 35 Years and over | 0 (0.0%) | 5 (100.0%) |
| Total | 195 (97.5%) | 5 (2.5%) |
Educational Attainment by Field of Study in Ganado
Education (71 | 46.4%), arts & humanities (22 | 14.4%), science & technology (15 | 9.8%), social sciences (13 | 8.5%), and business (13 | 8.5%) are the most common fields of study among 153 individuals in Ganado who have obtained a bachelor's degree or higher.
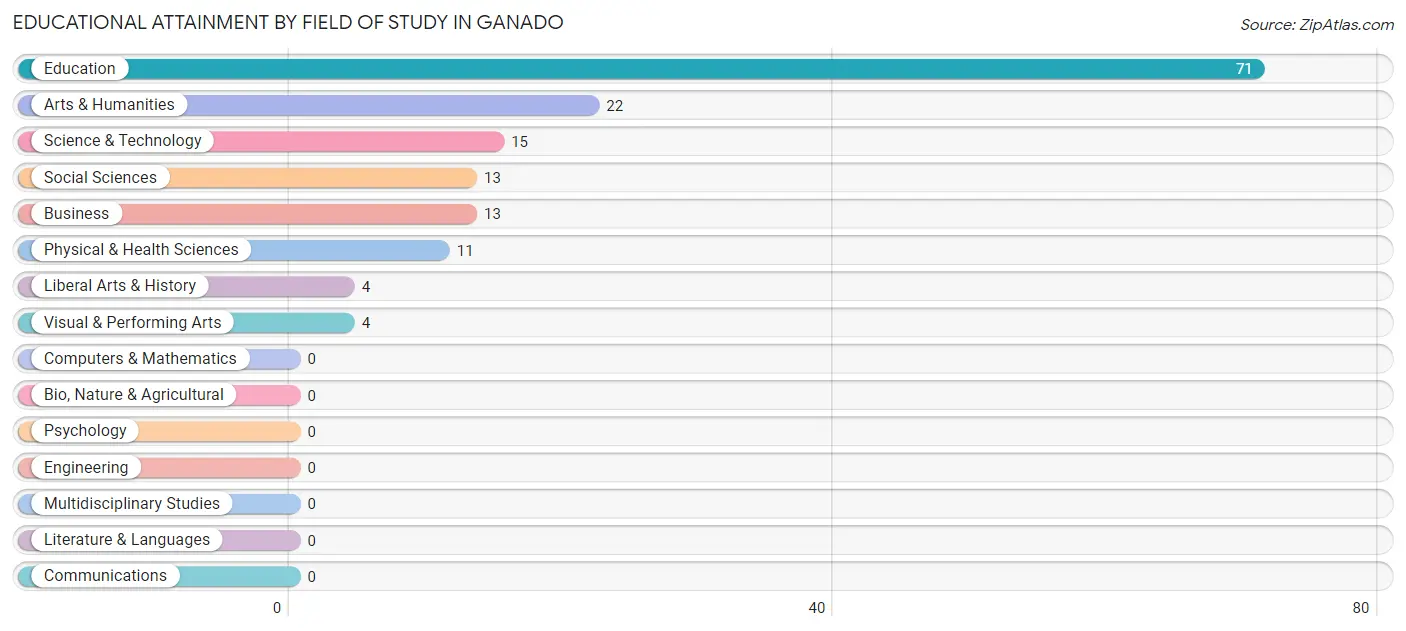
| Field of Study | # Graduates | % Graduates |
| Computers & Mathematics | 0 | 0.0% |
| Bio, Nature & Agricultural | 0 | 0.0% |
| Physical & Health Sciences | 11 | 7.2% |
| Psychology | 0 | 0.0% |
| Social Sciences | 13 | 8.5% |
| Engineering | 0 | 0.0% |
| Multidisciplinary Studies | 0 | 0.0% |
| Science & Technology | 15 | 9.8% |
| Business | 13 | 8.5% |
| Education | 71 | 46.4% |
| Literature & Languages | 0 | 0.0% |
| Liberal Arts & History | 4 | 2.6% |
| Visual & Performing Arts | 4 | 2.6% |
| Communications | 0 | 0.0% |
| Arts & Humanities | 22 | 14.4% |
| Total | 153 | 100.0% |
Transportation & Commute in Ganado
Vehicle Availability by Sex in Ganado
The most prevalent vehicle ownership categories in Ganado are males with 2 vehicles (44, accounting for 57.9%) and females with 2 vehicles (65, making up 22.6%).
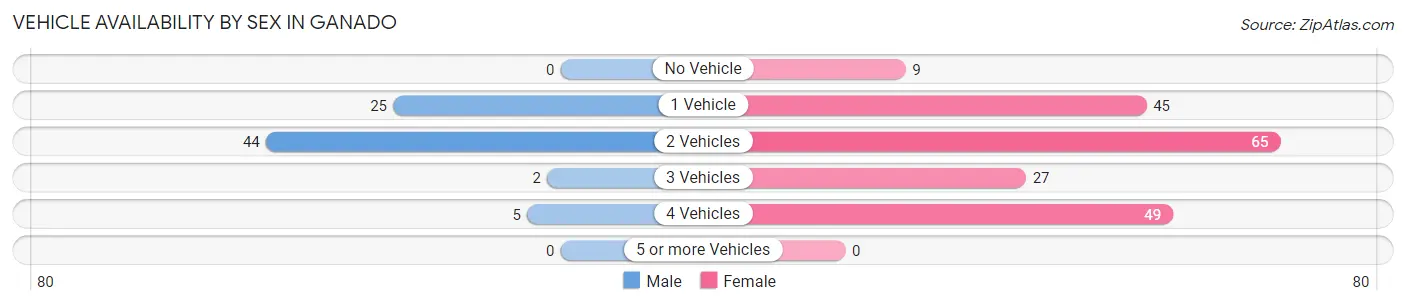
| Vehicles Available | Male | Female |
| No Vehicle | 0 (0.0%) | 9 (4.6%) |
| 1 Vehicle | 25 (32.9%) | 45 (23.1%) |
| 2 Vehicles | 44 (57.9%) | 65 (33.3%) |
| 3 Vehicles | 2 (2.6%) | 27 (13.9%) |
| 4 Vehicles | 5 (6.6%) | 49 (25.1%) |
| 5 or more Vehicles | 0 (0.0%) | 0 (0.0%) |
| Total | 76 (100.0%) | 195 (100.0%) |
Commute Time in Ganado
The most frequently occuring commute durations in Ganado are less than 5 minutes (82 commuters, 33.1%), 40 to 44 minutes (47 commuters, 19.0%), and 10 to 14 minutes (44 commuters, 17.7%).
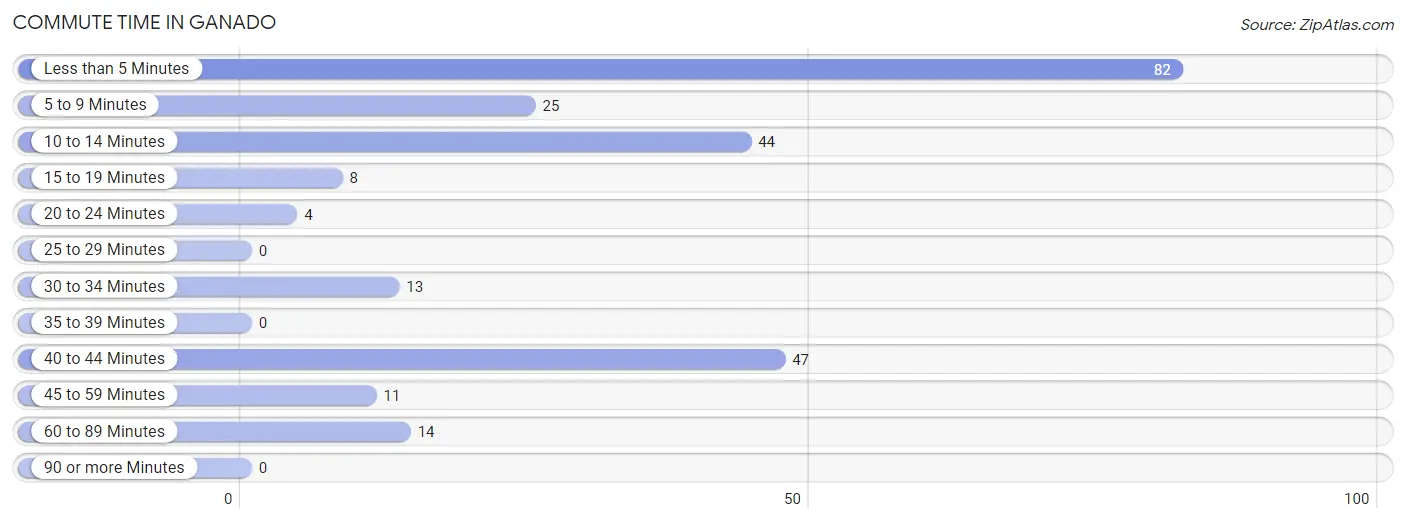
| Commute Time | # Commuters | % Commuters |
| Less than 5 Minutes | 82 | 33.1% |
| 5 to 9 Minutes | 25 | 10.1% |
| 10 to 14 Minutes | 44 | 17.7% |
| 15 to 19 Minutes | 8 | 3.2% |
| 20 to 24 Minutes | 4 | 1.6% |
| 25 to 29 Minutes | 0 | 0.0% |
| 30 to 34 Minutes | 13 | 5.2% |
| 35 to 39 Minutes | 0 | 0.0% |
| 40 to 44 Minutes | 47 | 19.0% |
| 45 to 59 Minutes | 11 | 4.4% |
| 60 to 89 Minutes | 14 | 5.7% |
| 90 or more Minutes | 0 | 0.0% |
Commute Time by Sex in Ganado
The most common commute times in Ganado are less than 5 minutes (37 commuters, 47.4%) for males and 40 to 44 minutes (47 commuters, 27.7%) for females.
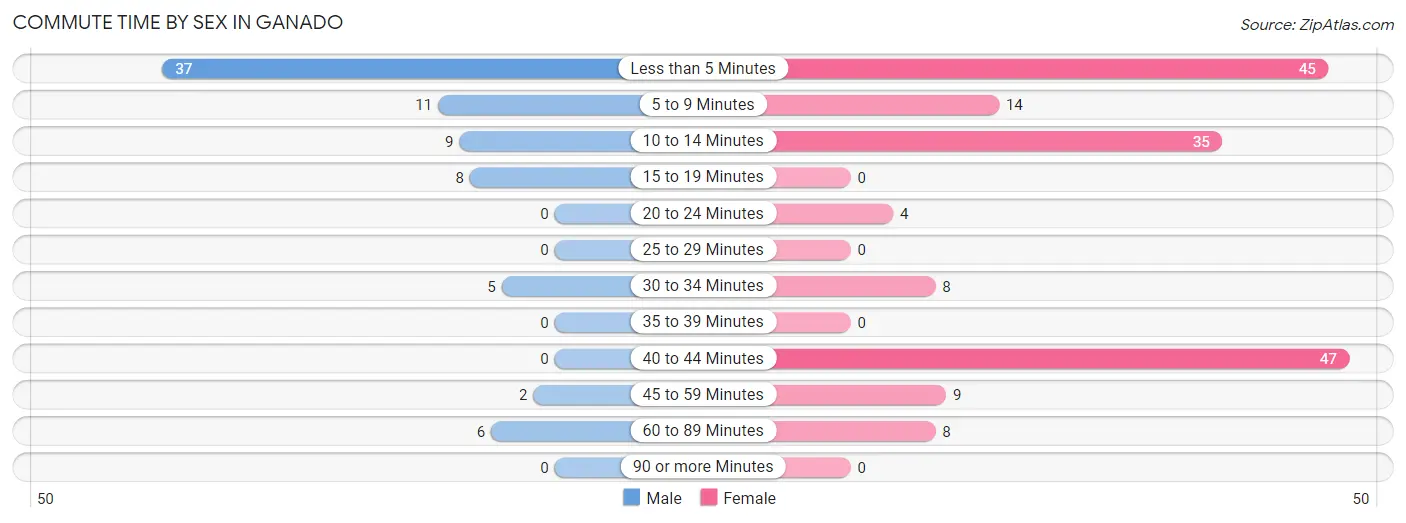
| Commute Time | Male | Female |
| Less than 5 Minutes | 37 (47.4%) | 45 (26.5%) |
| 5 to 9 Minutes | 11 (14.1%) | 14 (8.2%) |
| 10 to 14 Minutes | 9 (11.5%) | 35 (20.6%) |
| 15 to 19 Minutes | 8 (10.3%) | 0 (0.0%) |
| 20 to 24 Minutes | 0 (0.0%) | 4 (2.4%) |
| 25 to 29 Minutes | 0 (0.0%) | 0 (0.0%) |
| 30 to 34 Minutes | 5 (6.4%) | 8 (4.7%) |
| 35 to 39 Minutes | 0 (0.0%) | 0 (0.0%) |
| 40 to 44 Minutes | 0 (0.0%) | 47 (27.7%) |
| 45 to 59 Minutes | 2 (2.6%) | 9 (5.3%) |
| 60 to 89 Minutes | 6 (7.7%) | 8 (4.7%) |
| 90 or more Minutes | 0 (0.0%) | 0 (0.0%) |
Time of Departure to Work by Sex in Ganado
The most frequent times of departure to work in Ganado are 7:00 AM to 7:29 AM (53, 67.9%) for males and 7:00 AM to 7:29 AM (71, 41.8%) for females.
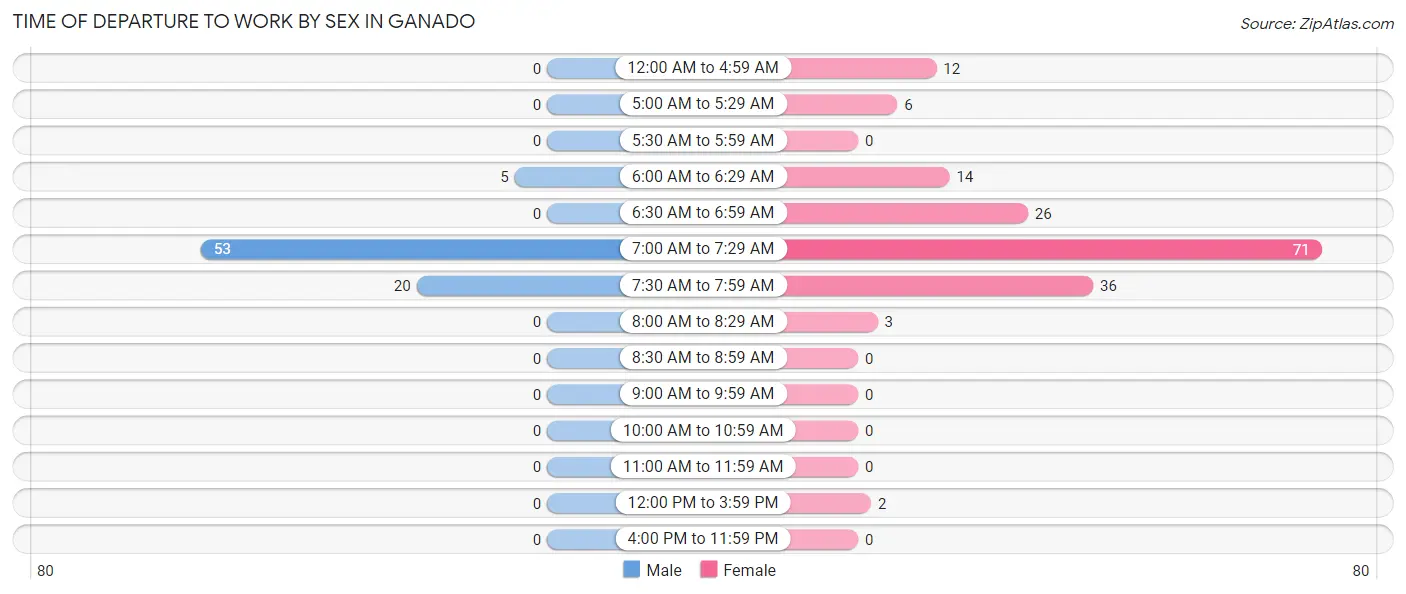
| Time of Departure | Male | Female |
| 12:00 AM to 4:59 AM | 0 (0.0%) | 12 (7.1%) |
| 5:00 AM to 5:29 AM | 0 (0.0%) | 6 (3.5%) |
| 5:30 AM to 5:59 AM | 0 (0.0%) | 0 (0.0%) |
| 6:00 AM to 6:29 AM | 5 (6.4%) | 14 (8.2%) |
| 6:30 AM to 6:59 AM | 0 (0.0%) | 26 (15.3%) |
| 7:00 AM to 7:29 AM | 53 (67.9%) | 71 (41.8%) |
| 7:30 AM to 7:59 AM | 20 (25.6%) | 36 (21.2%) |
| 8:00 AM to 8:29 AM | 0 (0.0%) | 3 (1.8%) |
| 8:30 AM to 8:59 AM | 0 (0.0%) | 0 (0.0%) |
| 9:00 AM to 9:59 AM | 0 (0.0%) | 0 (0.0%) |
| 10:00 AM to 10:59 AM | 0 (0.0%) | 0 (0.0%) |
| 11:00 AM to 11:59 AM | 0 (0.0%) | 0 (0.0%) |
| 12:00 PM to 3:59 PM | 0 (0.0%) | 2 (1.2%) |
| 4:00 PM to 11:59 PM | 0 (0.0%) | 0 (0.0%) |
| Total | 78 (100.0%) | 170 (100.0%) |
Housing Occupancy in Ganado
Occupancy by Ownership in Ganado
Of the total 205 dwellings in Ganado, owner-occupied units account for 113 (55.1%), while renter-occupied units make up 92 (44.9%).
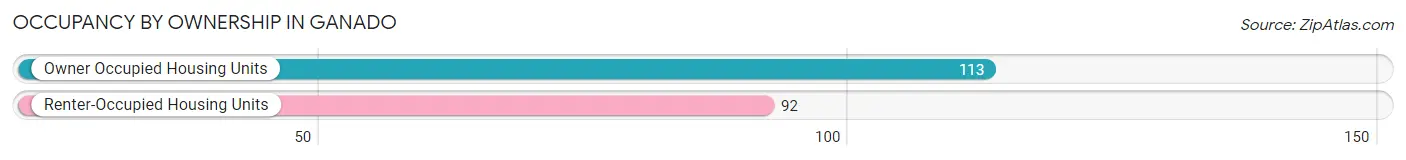
| Occupancy | # Housing Units | % Housing Units |
| Owner Occupied Housing Units | 113 | 55.1% |
| Renter-Occupied Housing Units | 92 | 44.9% |
| Total Occupied Housing Units | 205 | 100.0% |
Occupancy by Household Size in Ganado
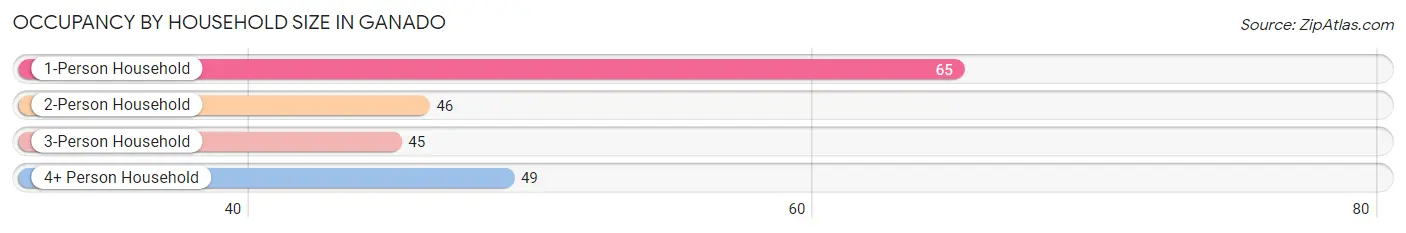
| Household Size | # Housing Units | % Housing Units |
| 1-Person Household | 65 | 31.7% |
| 2-Person Household | 46 | 22.4% |
| 3-Person Household | 45 | 22.0% |
| 4+ Person Household | 49 | 23.9% |
| Total Housing Units | 205 | 100.0% |
Occupancy by Ownership by Household Size in Ganado
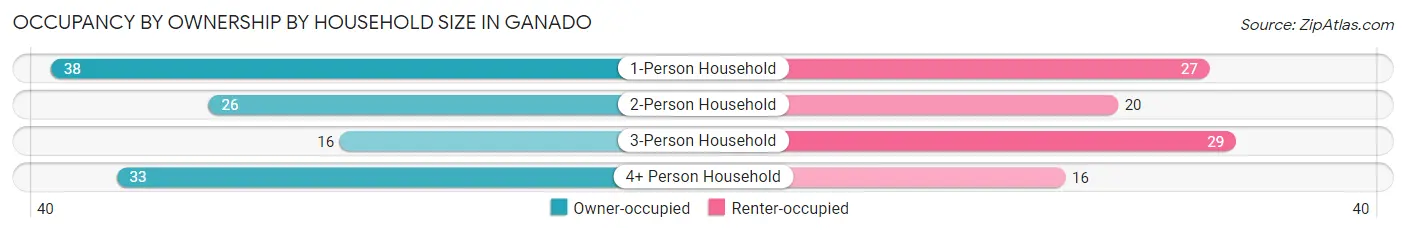
| Household Size | Owner-occupied | Renter-occupied |
| 1-Person Household | 38 (58.5%) | 27 (41.5%) |
| 2-Person Household | 26 (56.5%) | 20 (43.5%) |
| 3-Person Household | 16 (35.6%) | 29 (64.4%) |
| 4+ Person Household | 33 (67.3%) | 16 (32.7%) |
| Total Housing Units | 113 (55.1%) | 92 (44.9%) |
Occupancy by Educational Attainment in Ganado
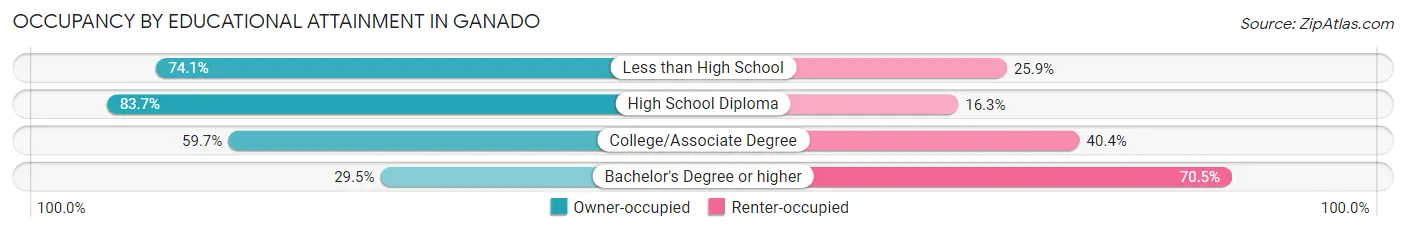
| Household Size | Owner-occupied | Renter-occupied |
| Less than High School | 20 (74.1%) | 7 (25.9%) |
| High School Diploma | 36 (83.7%) | 7 (16.3%) |
| College/Associate Degree | 34 (59.7%) | 23 (40.4%) |
| Bachelor's Degree or higher | 23 (29.5%) | 55 (70.5%) |
Occupancy by Age of Householder in Ganado
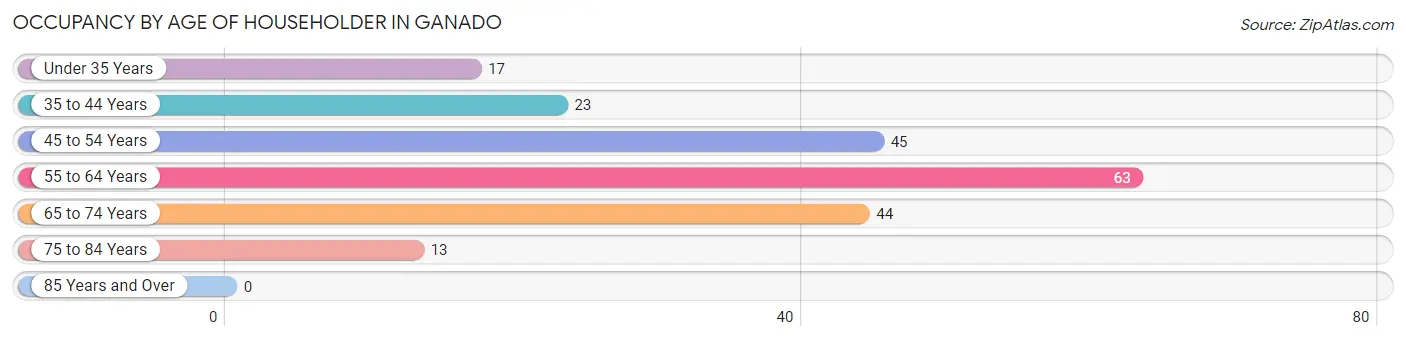
| Age Bracket | # Households | % Households |
| Under 35 Years | 17 | 8.3% |
| 35 to 44 Years | 23 | 11.2% |
| 45 to 54 Years | 45 | 22.0% |
| 55 to 64 Years | 63 | 30.7% |
| 65 to 74 Years | 44 | 21.5% |
| 75 to 84 Years | 13 | 6.3% |
| 85 Years and Over | 0 | 0.0% |
| Total | 205 | 100.0% |
Housing Finances in Ganado
Median Income by Occupancy in Ganado
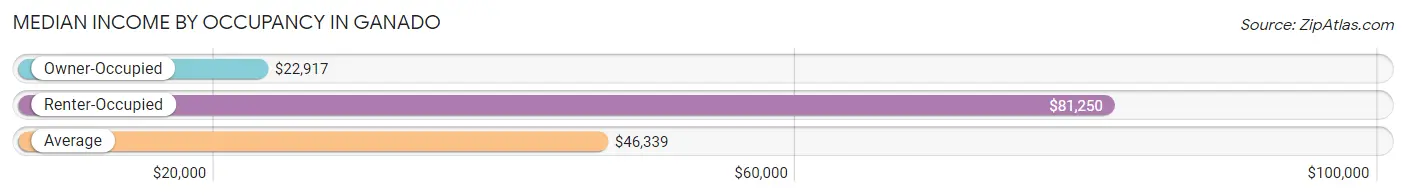
| Occupancy Type | # Households | Median Income |
| Owner-Occupied | 113 (55.1%) | $22,917 |
| Renter-Occupied | 92 (44.9%) | $81,250 |
| Average | 205 (100.0%) | $46,339 |
Occupancy by Householder Income Bracket in Ganado
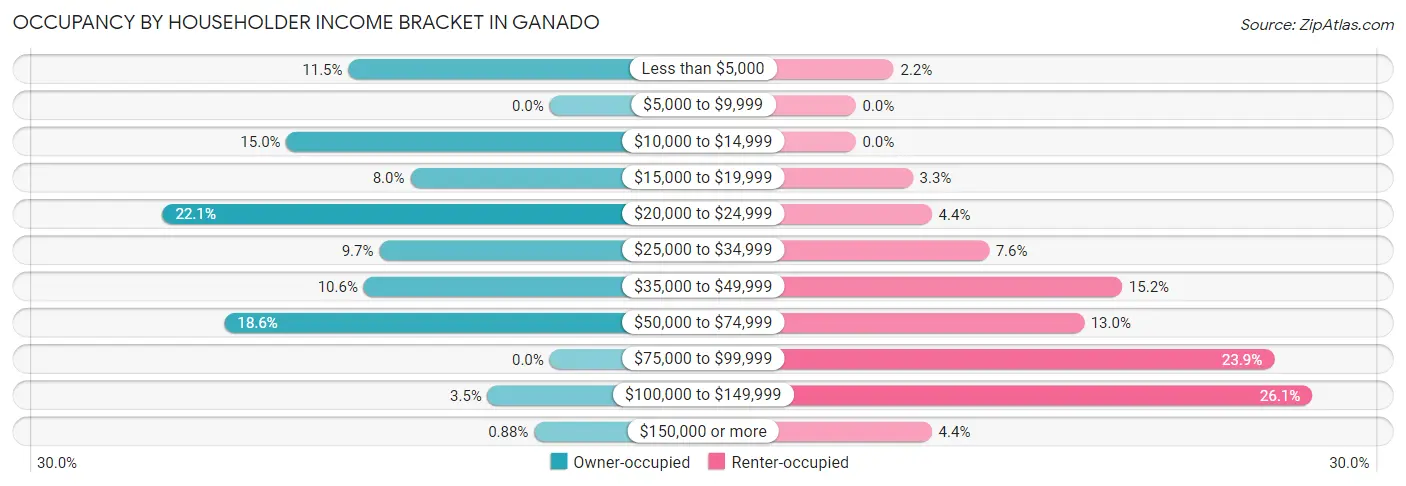
| Income Bracket | Owner-occupied | Renter-occupied |
| Less than $5,000 | 13 (11.5%) | 2 (2.2%) |
| $5,000 to $9,999 | 0 (0.0%) | 0 (0.0%) |
| $10,000 to $14,999 | 17 (15.0%) | 0 (0.0%) |
| $15,000 to $19,999 | 9 (8.0%) | 3 (3.3%) |
| $20,000 to $24,999 | 25 (22.1%) | 4 (4.3%) |
| $25,000 to $34,999 | 11 (9.7%) | 7 (7.6%) |
| $35,000 to $49,999 | 12 (10.6%) | 14 (15.2%) |
| $50,000 to $74,999 | 21 (18.6%) | 12 (13.0%) |
| $75,000 to $99,999 | 0 (0.0%) | 22 (23.9%) |
| $100,000 to $149,999 | 4 (3.5%) | 24 (26.1%) |
| $150,000 or more | 1 (0.9%) | 4 (4.3%) |
| Total | 113 (100.0%) | 92 (100.0%) |
Monthly Housing Cost Tiers in Ganado
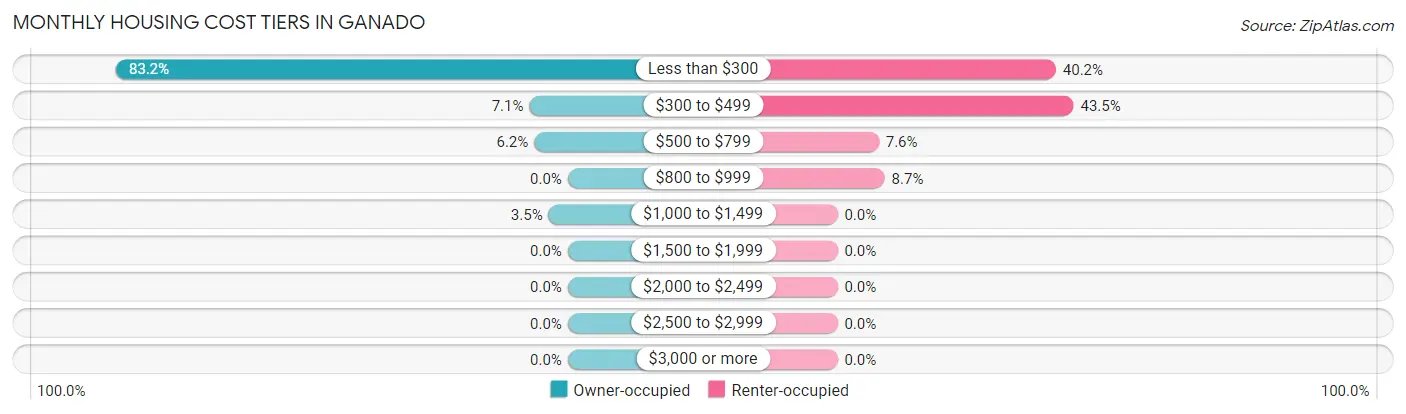
| Monthly Cost | Owner-occupied | Renter-occupied |
| Less than $300 | 94 (83.2%) | 37 (40.2%) |
| $300 to $499 | 8 (7.1%) | 40 (43.5%) |
| $500 to $799 | 7 (6.2%) | 7 (7.6%) |
| $800 to $999 | 0 (0.0%) | 8 (8.7%) |
| $1,000 to $1,499 | 4 (3.5%) | 0 (0.0%) |
| $1,500 to $1,999 | 0 (0.0%) | 0 (0.0%) |
| $2,000 to $2,499 | 0 (0.0%) | 0 (0.0%) |
| $2,500 to $2,999 | 0 (0.0%) | 0 (0.0%) |
| $3,000 or more | 0 (0.0%) | 0 (0.0%) |
| Total | 113 (100.0%) | 92 (100.0%) |
Physical Housing Characteristics in Ganado
Housing Structures in Ganado
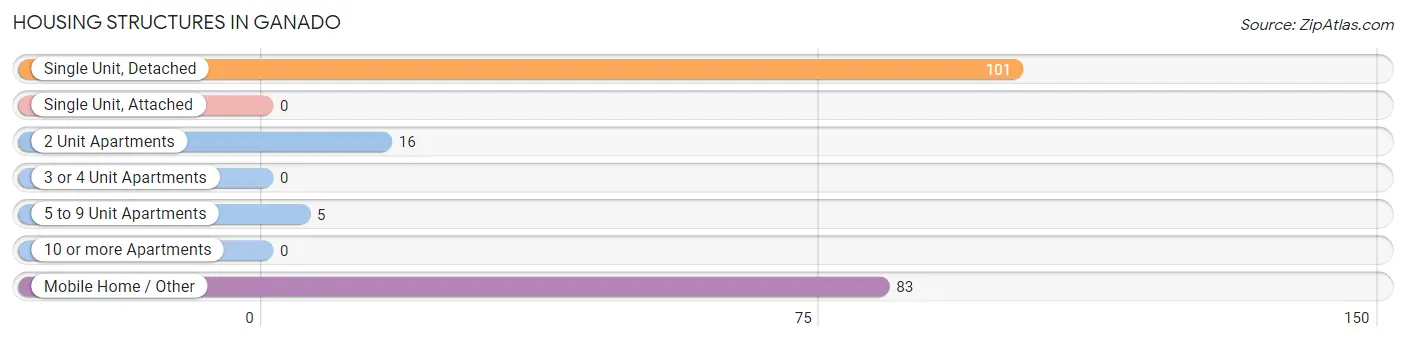
| Structure Type | # Housing Units | % Housing Units |
| Single Unit, Detached | 101 | 49.3% |
| Single Unit, Attached | 0 | 0.0% |
| 2 Unit Apartments | 16 | 7.8% |
| 3 or 4 Unit Apartments | 0 | 0.0% |
| 5 to 9 Unit Apartments | 5 | 2.4% |
| 10 or more Apartments | 0 | 0.0% |
| Mobile Home / Other | 83 | 40.5% |
| Total | 205 | 100.0% |
Housing Structures by Occupancy in Ganado
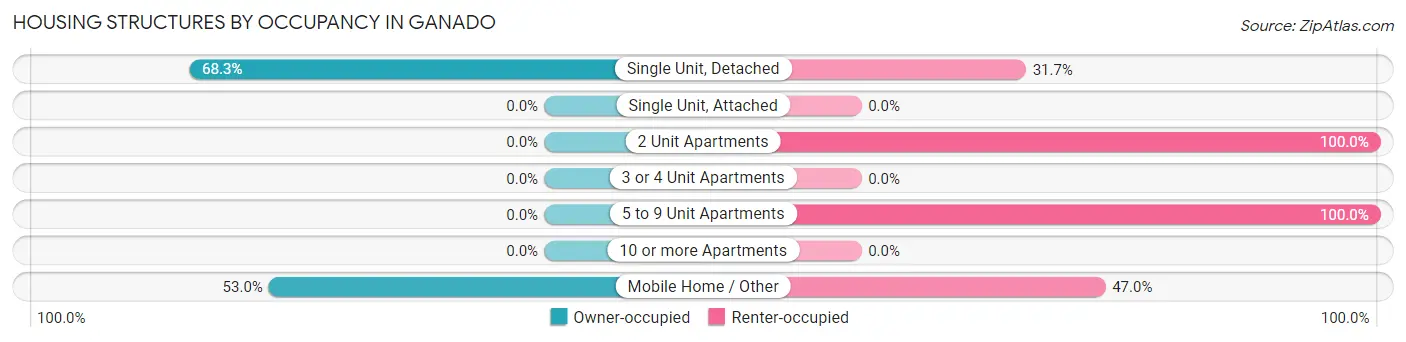
| Structure Type | Owner-occupied | Renter-occupied |
| Single Unit, Detached | 69 (68.3%) | 32 (31.7%) |
| Single Unit, Attached | 0 (0.0%) | 0 (0.0%) |
| 2 Unit Apartments | 0 (0.0%) | 16 (100.0%) |
| 3 or 4 Unit Apartments | 0 (0.0%) | 0 (0.0%) |
| 5 to 9 Unit Apartments | 0 (0.0%) | 5 (100.0%) |
| 10 or more Apartments | 0 (0.0%) | 0 (0.0%) |
| Mobile Home / Other | 44 (53.0%) | 39 (47.0%) |
| Total | 113 (55.1%) | 92 (44.9%) |
Housing Structures by Number of Rooms in Ganado
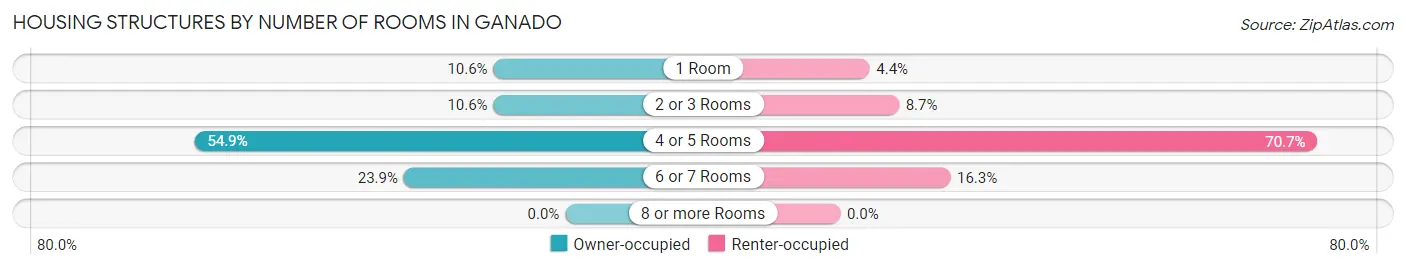
| Number of Rooms | Owner-occupied | Renter-occupied |
| 1 Room | 12 (10.6%) | 4 (4.3%) |
| 2 or 3 Rooms | 12 (10.6%) | 8 (8.7%) |
| 4 or 5 Rooms | 62 (54.9%) | 65 (70.7%) |
| 6 or 7 Rooms | 27 (23.9%) | 15 (16.3%) |
| 8 or more Rooms | 0 (0.0%) | 0 (0.0%) |
| Total | 113 (100.0%) | 92 (100.0%) |
Housing Structure by Heating Type in Ganado
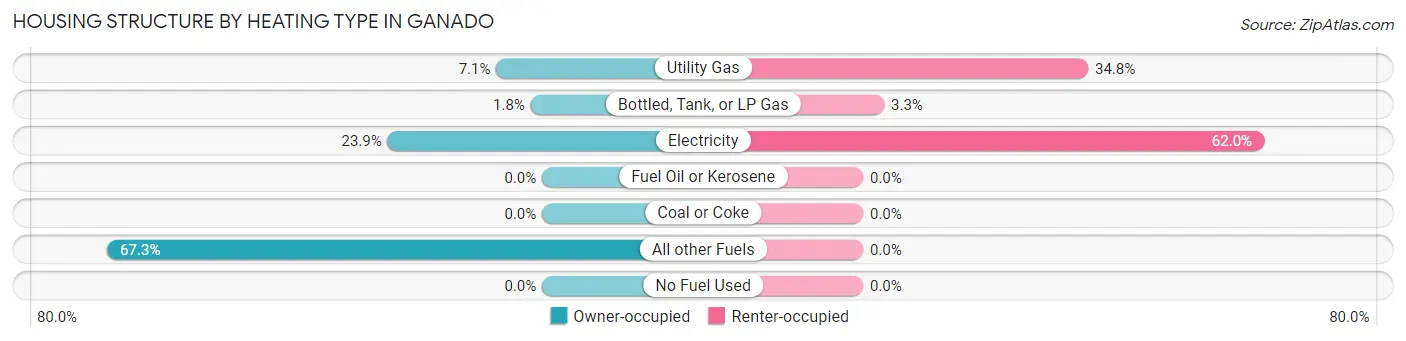
| Heating Type | Owner-occupied | Renter-occupied |
| Utility Gas | 8 (7.1%) | 32 (34.8%) |
| Bottled, Tank, or LP Gas | 2 (1.8%) | 3 (3.3%) |
| Electricity | 27 (23.9%) | 57 (62.0%) |
| Fuel Oil or Kerosene | 0 (0.0%) | 0 (0.0%) |
| Coal or Coke | 0 (0.0%) | 0 (0.0%) |
| All other Fuels | 76 (67.3%) | 0 (0.0%) |
| No Fuel Used | 0 (0.0%) | 0 (0.0%) |
| Total | 113 (100.0%) | 92 (100.0%) |
Household Vehicle Usage in Ganado
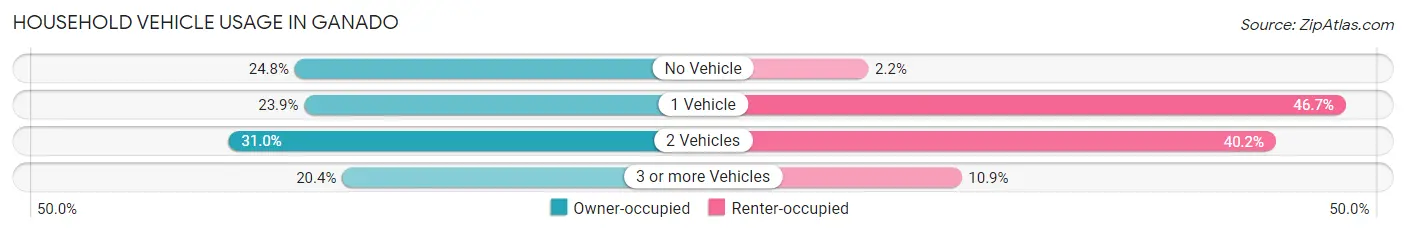
| Vehicles per Household | Owner-occupied | Renter-occupied |
| No Vehicle | 28 (24.8%) | 2 (2.2%) |
| 1 Vehicle | 27 (23.9%) | 43 (46.7%) |
| 2 Vehicles | 35 (31.0%) | 37 (40.2%) |
| 3 or more Vehicles | 23 (20.3%) | 10 (10.9%) |
| Total | 113 (100.0%) | 92 (100.0%) |
Real Estate & Mortgages in Ganado
Real Estate and Mortgage Overview in Ganado
| Characteristic | Without Mortgage | With Mortgage |
| Housing Units | 107 | 6 |
| Median Property Value | $30,400 | $0 |
| Median Household Income | $22,266 | $0 |
| Monthly Housing Costs | $129 | $0 |
| Real Estate Taxes | - | - |
Property Value by Mortgage Status in Ganado
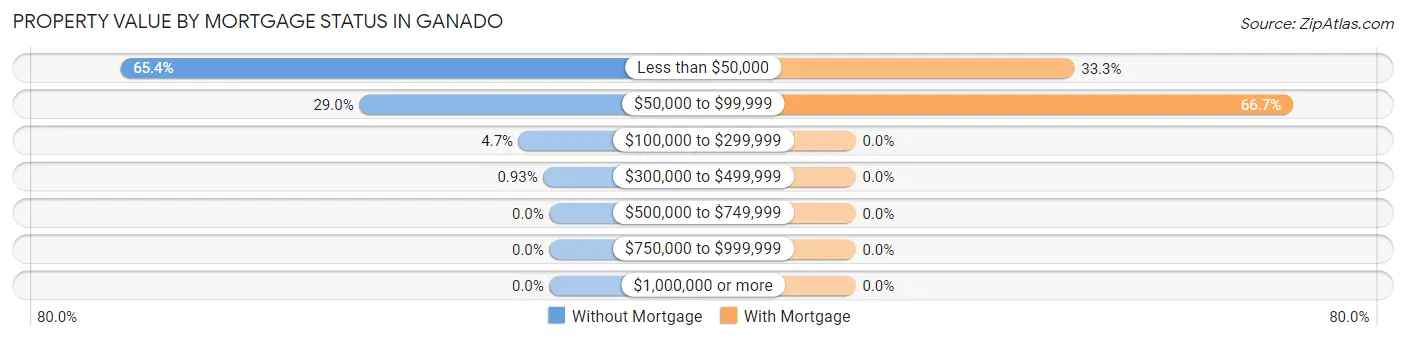
| Property Value | Without Mortgage | With Mortgage |
| Less than $50,000 | 70 (65.4%) | 2 (33.3%) |
| $50,000 to $99,999 | 31 (29.0%) | 4 (66.7%) |
| $100,000 to $299,999 | 5 (4.7%) | 0 (0.0%) |
| $300,000 to $499,999 | 1 (0.9%) | 0 (0.0%) |
| $500,000 to $749,999 | 0 (0.0%) | 0 (0.0%) |
| $750,000 to $999,999 | 0 (0.0%) | 0 (0.0%) |
| $1,000,000 or more | 0 (0.0%) | 0 (0.0%) |
| Total | 107 (100.0%) | 6 (100.0%) |
Household Income by Mortgage Status in Ganado
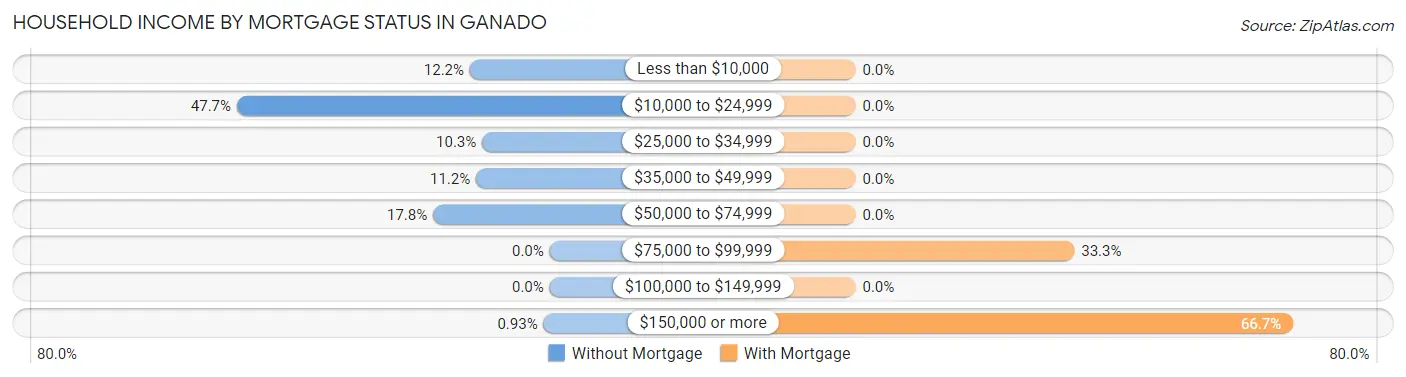
| Household Income | Without Mortgage | With Mortgage |
| Less than $10,000 | 13 (12.1%) | 0 (0.0%) |
| $10,000 to $24,999 | 51 (47.7%) | 0 (0.0%) |
| $25,000 to $34,999 | 11 (10.3%) | 0 (0.0%) |
| $35,000 to $49,999 | 12 (11.2%) | 0 (0.0%) |
| $50,000 to $74,999 | 19 (17.8%) | 0 (0.0%) |
| $75,000 to $99,999 | 0 (0.0%) | 2 (33.3%) |
| $100,000 to $149,999 | 0 (0.0%) | 0 (0.0%) |
| $150,000 or more | 1 (0.9%) | 4 (66.7%) |
| Total | 107 (100.0%) | 6 (100.0%) |
Property Value to Household Income Ratio in Ganado
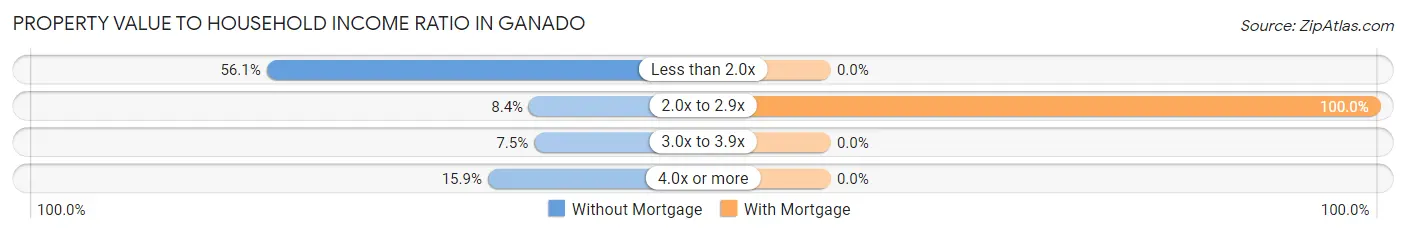
| Value-to-Income Ratio | Without Mortgage | With Mortgage |
| Less than 2.0x | 60 (56.1%) | 0 (0.0%) |
| 2.0x to 2.9x | 9 (8.4%) | 6 (100.0%) |
| 3.0x to 3.9x | 8 (7.5%) | 0 (0.0%) |
| 4.0x or more | 17 (15.9%) | 0 (0.0%) |
| Total | 107 (100.0%) | 6 (100.0%) |
Real Estate Taxes by Mortgage Status in Ganado
| Property Taxes | Without Mortgage | With Mortgage |
| Less than $800 | 0 (0.0%) | 0 (0.0%) |
| $800 to $1,499 | 0 (0.0%) | 0 (0.0%) |
| $800 to $1,499 | 0 (0.0%) | 0 (0.0%) |
| Total | 107 (100.0%) | 6 (100.0%) |
Health & Disability in Ganado
Health Insurance Coverage by Age in Ganado
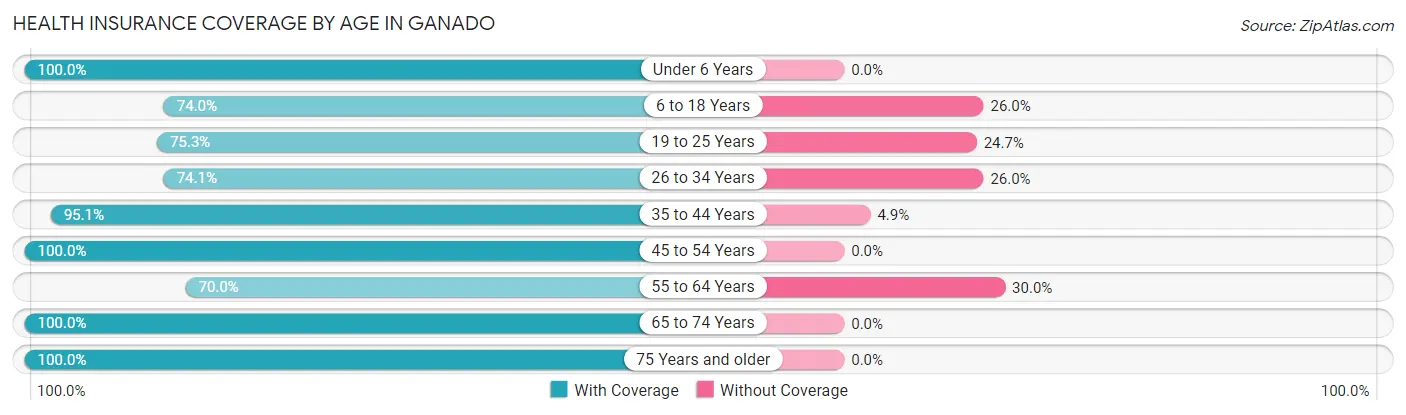
| Age Bracket | With Coverage | Without Coverage |
| Under 6 Years | 32 (100.0%) | 0 (0.0%) |
| 6 to 18 Years | 114 (74.0%) | 40 (26.0%) |
| 19 to 25 Years | 61 (75.3%) | 20 (24.7%) |
| 26 to 34 Years | 97 (74.1%) | 34 (26.0%) |
| 35 to 44 Years | 78 (95.1%) | 4 (4.9%) |
| 45 to 54 Years | 57 (100.0%) | 0 (0.0%) |
| 55 to 64 Years | 63 (70.0%) | 27 (30.0%) |
| 65 to 74 Years | 87 (100.0%) | 0 (0.0%) |
| 75 Years and older | 23 (100.0%) | 0 (0.0%) |
| Total | 612 (83.0%) | 125 (17.0%) |
Health Insurance Coverage by Citizenship Status in Ganado
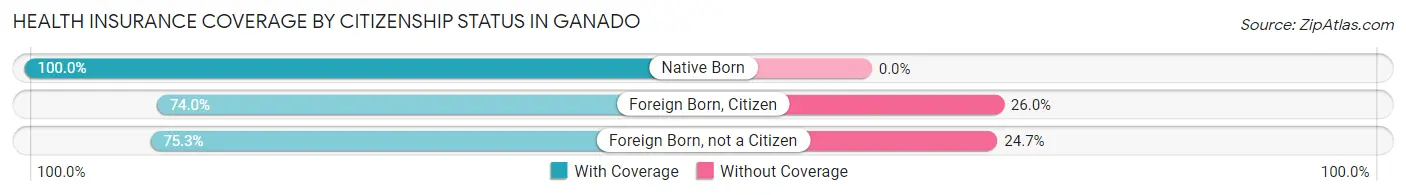
| Citizenship Status | With Coverage | Without Coverage |
| Native Born | 32 (100.0%) | 0 (0.0%) |
| Foreign Born, Citizen | 114 (74.0%) | 40 (26.0%) |
| Foreign Born, not a Citizen | 61 (75.3%) | 20 (24.7%) |
Health Insurance Coverage by Household Income in Ganado
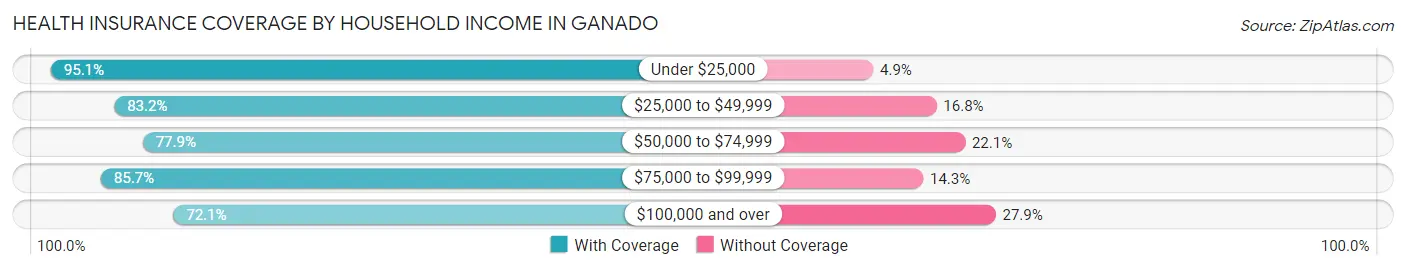
| Household Income | With Coverage | Without Coverage |
| Under $25,000 | 193 (95.1%) | 10 (4.9%) |
| $25,000 to $49,999 | 114 (83.2%) | 23 (16.8%) |
| $50,000 to $74,999 | 109 (77.9%) | 31 (22.1%) |
| $75,000 to $99,999 | 60 (85.7%) | 10 (14.3%) |
| $100,000 and over | 132 (72.1%) | 51 (27.9%) |
Public vs Private Health Insurance Coverage by Age in Ganado
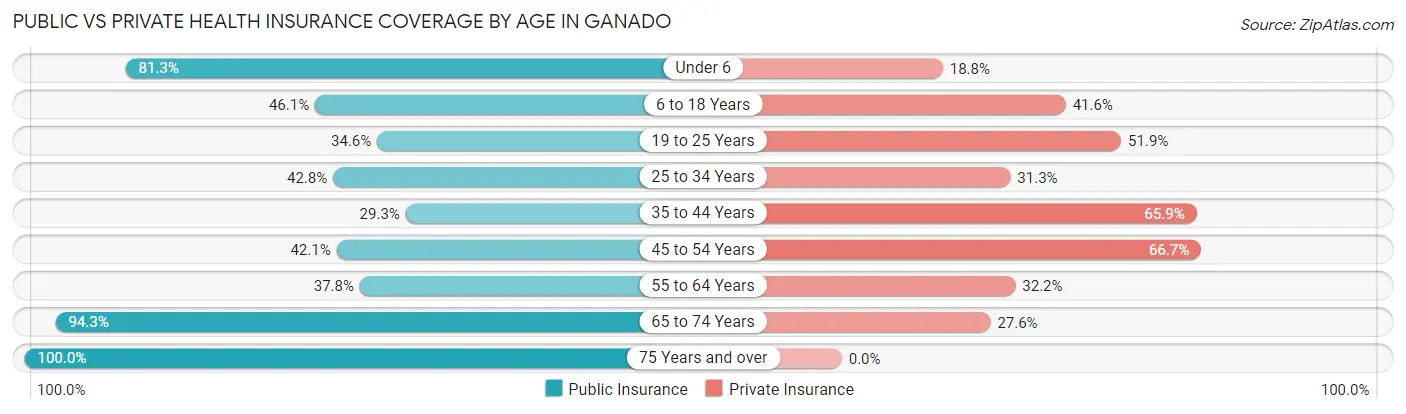
| Age Bracket | Public Insurance | Private Insurance |
| Under 6 | 26 (81.2%) | 6 (18.8%) |
| 6 to 18 Years | 71 (46.1%) | 64 (41.6%) |
| 19 to 25 Years | 28 (34.6%) | 42 (51.8%) |
| 25 to 34 Years | 56 (42.7%) | 41 (31.3%) |
| 35 to 44 Years | 24 (29.3%) | 54 (65.8%) |
| 45 to 54 Years | 24 (42.1%) | 38 (66.7%) |
| 55 to 64 Years | 34 (37.8%) | 29 (32.2%) |
| 65 to 74 Years | 82 (94.3%) | 24 (27.6%) |
| 75 Years and over | 23 (100.0%) | 0 (0.0%) |
| Total | 368 (49.9%) | 298 (40.4%) |
Disability Status by Sex by Age in Ganado
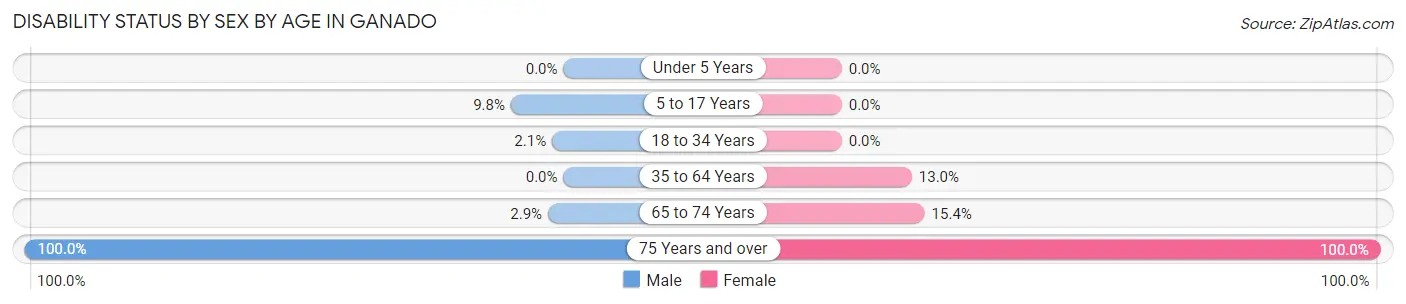
| Age Bracket | Male | Female |
| Under 5 Years | 0 (0.0%) | 0 (0.0%) |
| 5 to 17 Years | 8 (9.8%) | 0 (0.0%) |
| 18 to 34 Years | 2 (2.1%) | 0 (0.0%) |
| 35 to 64 Years | 0 (0.0%) | 16 (13.0%) |
| 65 to 74 Years | 1 (2.9%) | 8 (15.4%) |
| 75 Years and over | 6 (100.0%) | 17 (100.0%) |
Disability Class by Sex by Age in Ganado
Disability Class: Hearing Difficulty
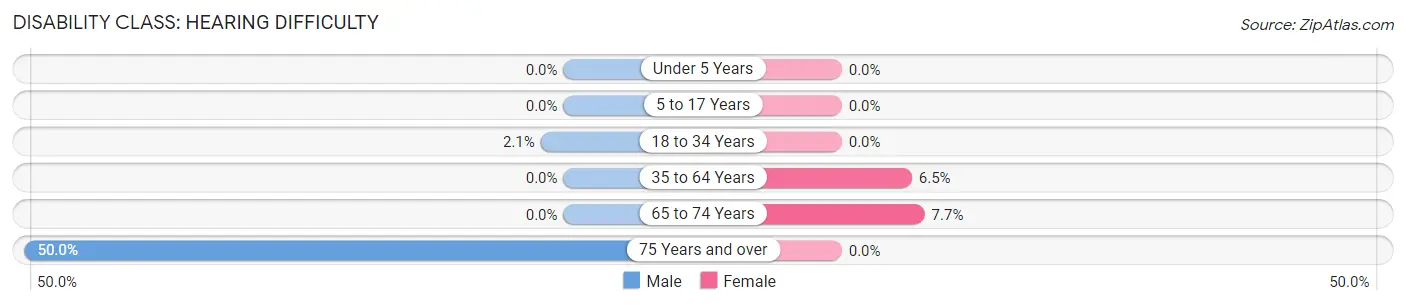
| Age Bracket | Male | Female |
| Under 5 Years | 0 (0.0%) | 0 (0.0%) |
| 5 to 17 Years | 0 (0.0%) | 0 (0.0%) |
| 18 to 34 Years | 2 (2.1%) | 0 (0.0%) |
| 35 to 64 Years | 0 (0.0%) | 8 (6.5%) |
| 65 to 74 Years | 0 (0.0%) | 4 (7.7%) |
| 75 Years and over | 3 (50.0%) | 0 (0.0%) |
Disability Class: Vision Difficulty
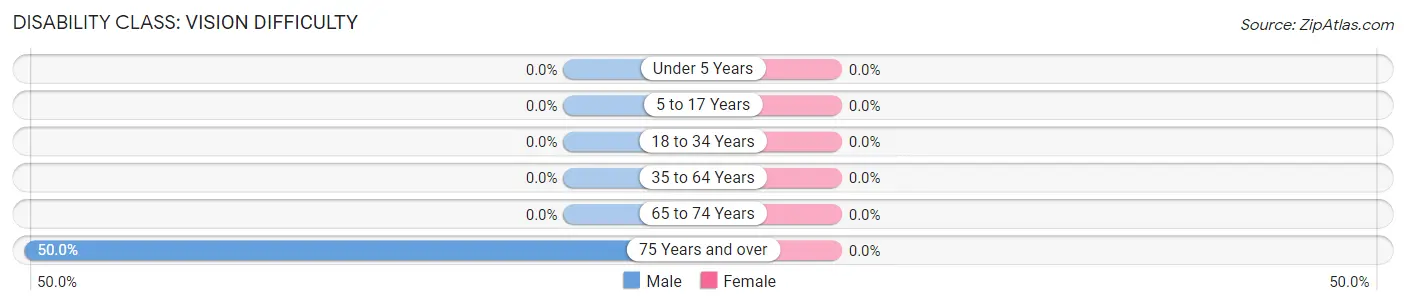
| Age Bracket | Male | Female |
| Under 5 Years | 0 (0.0%) | 0 (0.0%) |
| 5 to 17 Years | 0 (0.0%) | 0 (0.0%) |
| 18 to 34 Years | 0 (0.0%) | 0 (0.0%) |
| 35 to 64 Years | 0 (0.0%) | 0 (0.0%) |
| 65 to 74 Years | 0 (0.0%) | 0 (0.0%) |
| 75 Years and over | 3 (50.0%) | 0 (0.0%) |
Disability Class: Cognitive Difficulty
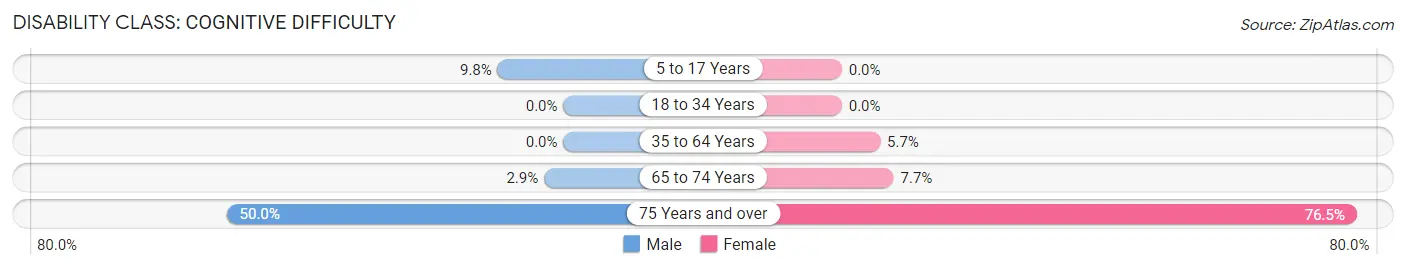
| Age Bracket | Male | Female |
| 5 to 17 Years | 8 (9.8%) | 0 (0.0%) |
| 18 to 34 Years | 0 (0.0%) | 0 (0.0%) |
| 35 to 64 Years | 0 (0.0%) | 7 (5.7%) |
| 65 to 74 Years | 1 (2.9%) | 4 (7.7%) |
| 75 Years and over | 3 (50.0%) | 13 (76.5%) |
Disability Class: Ambulatory Difficulty
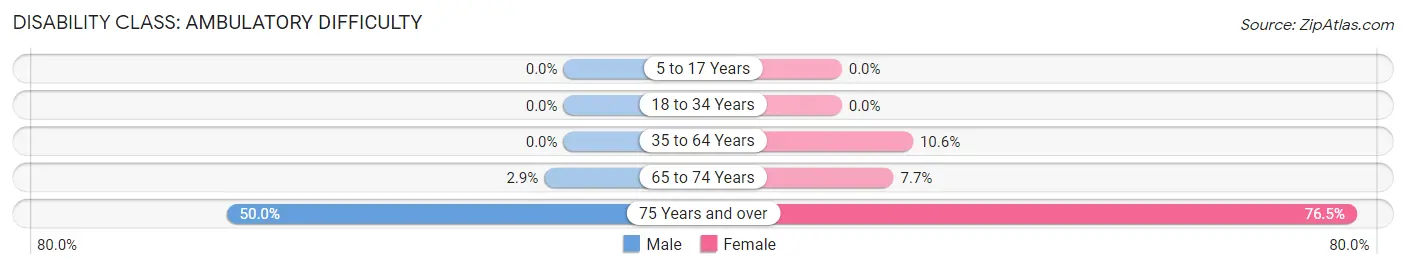
| Age Bracket | Male | Female |
| 5 to 17 Years | 0 (0.0%) | 0 (0.0%) |
| 18 to 34 Years | 0 (0.0%) | 0 (0.0%) |
| 35 to 64 Years | 0 (0.0%) | 13 (10.6%) |
| 65 to 74 Years | 1 (2.9%) | 4 (7.7%) |
| 75 Years and over | 3 (50.0%) | 13 (76.5%) |
Disability Class: Self-Care Difficulty
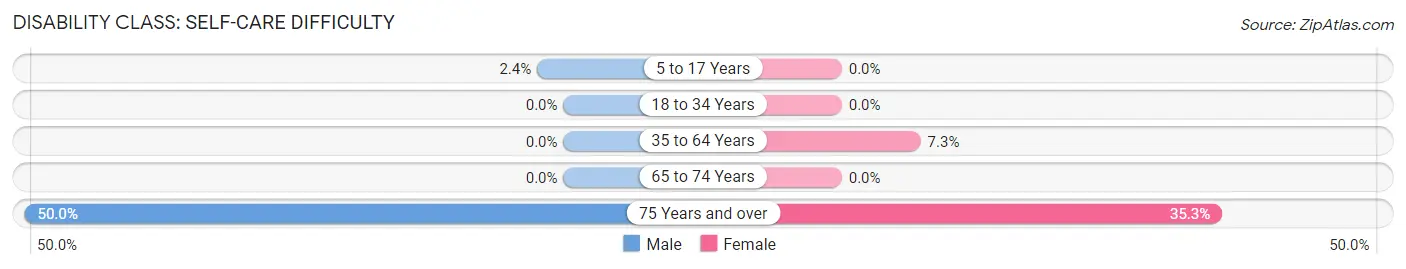
| Age Bracket | Male | Female |
| 5 to 17 Years | 2 (2.4%) | 0 (0.0%) |
| 18 to 34 Years | 0 (0.0%) | 0 (0.0%) |
| 35 to 64 Years | 0 (0.0%) | 9 (7.3%) |
| 65 to 74 Years | 0 (0.0%) | 0 (0.0%) |
| 75 Years and over | 3 (50.0%) | 6 (35.3%) |
Technology Access in Ganado
Computing Device Access in Ganado
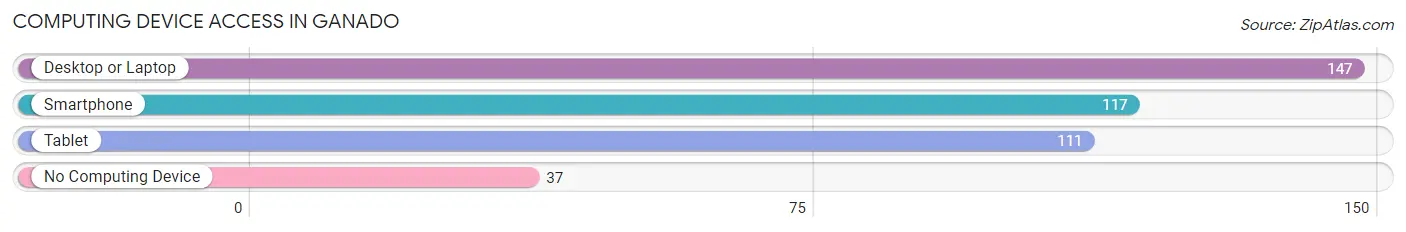
| Device Type | # Households | % Households |
| Desktop or Laptop | 147 | 71.7% |
| Smartphone | 117 | 57.1% |
| Tablet | 111 | 54.1% |
| No Computing Device | 37 | 18.0% |
| Total | 205 | 100.0% |
Internet Access in Ganado
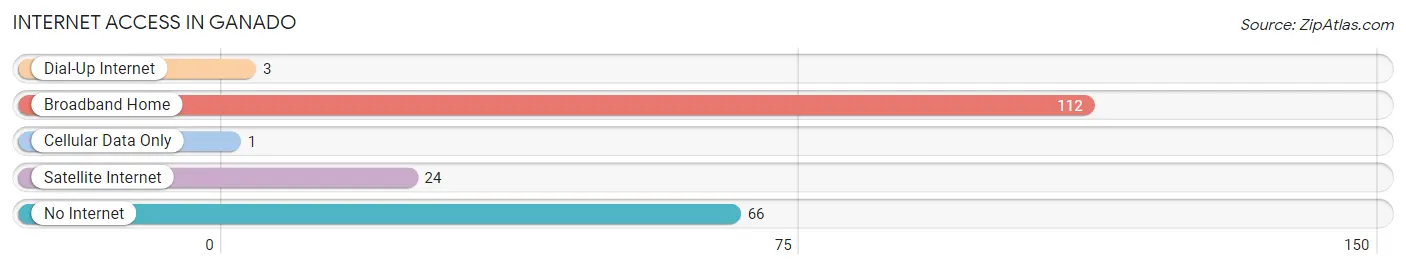
| Internet Type | # Households | % Households |
| Dial-Up Internet | 3 | 1.5% |
| Broadband Home | 112 | 54.6% |
| Cellular Data Only | 1 | 0.5% |
| Satellite Internet | 24 | 11.7% |
| No Internet | 66 | 32.2% |
| Total | 205 | 100.0% |
Ganado Summary
Ganado is a small town located in Apache County, Arizona, United States. It is situated in the Navajo Nation, the largest Native American reservation in the United States. The town is located in the heart of the Navajo Nation, and is home to a population of approximately 2,000 people.
History
Ganado was founded in 1876 by a group of Navajo people who were relocated from their traditional homelands in the Four Corners region. The town was named after the Navajo word for “sheep”, as the area was known for its large herds of sheep. The town was originally established as a trading post, and was the first permanent settlement in the Navajo Nation.
In the early 1900s, the town began to grow and develop, and by the 1920s it had become a major trading center for the Navajo people. The town was also home to a number of schools, churches, and other businesses.
In the 1950s, the town was relocated to its current location, and the original site of the town is now a historic site. The town has continued to grow and develop over the years, and today it is home to a variety of businesses, including a grocery store, a gas station, and a number of restaurants.
Geography
Ganado is located in the heart of the Navajo Nation, in the northeastern corner of Arizona. The town is situated in the Chuska Mountains, and is surrounded by a number of other small towns and villages. The town is located approximately 40 miles east of Flagstaff, Arizona, and is approximately 200 miles from Phoenix, Arizona.
The town is located at an elevation of 5,400 feet, and the surrounding area is characterized by rolling hills and mesas. The area is also home to a number of natural attractions, including the Chuska Mountains, the Grand Canyon, and the Petrified Forest National Park.
Economy
Ganado’s economy is largely based on tourism and agriculture. The town is home to a number of tourist attractions, including the Navajo Nation Museum, the Navajo Nation Zoo, and the Navajo Nation Cultural Center. The town is also home to a number of agricultural businesses, including sheep and cattle ranches, and a number of farms.
The town is also home to a number of businesses, including a grocery store, a gas station, and a number of restaurants. The town is also home to a number of government offices, including the Navajo Nation Tribal Council and the Navajo Nation Supreme Court.
Demographics
As of the 2010 census, the population of Ganado was 2,073. The town is predominantly Native American, with the majority of the population being Navajo. The town is also home to a small number of Hispanic and White residents.
The median household income in Ganado is $25,000, and the median home value is $90,000. The town has a high poverty rate, with approximately 40% of the population living below the poverty line. The town also has a high unemployment rate, with approximately 20% of the population unemployed.
Conclusion
Ganado is a small town located in Apache County, Arizona, United States. It is situated in the Navajo Nation, the largest Native American reservation in the United States. The town is located in the heart of the Navajo Nation, and is home to a population of approximately 2,000 people. The town’s economy is largely based on tourism and agriculture, and the town is home to a number of tourist attractions, businesses, and government offices. The town is predominantly Native American, with the majority of the population being Navajo. The town has a high poverty rate, with approximately 40% of the population living below the poverty line.
Common Questions
What is Per Capita Income in Ganado?
Per Capita income in Ganado is $19,016.
What is the Median Family Income in Ganado?
Median Family Income in Ganado is $46,389.
What is the Median Household income in Ganado?
Median Household Income in Ganado is $46,339.
What is Income or Wage Gap in Ganado?
Income or Wage Gap in Ganado is 0.4%.
Women in Ganado earn 99.6 cents for every dollar earned by a man.
What is Inequality or Gini Index in Ganado?
Inequality or Gini Index in Ganado is 0.43.
What is the Total Population of Ganado?
Total Population of Ganado is 737.
What is the Total Male Population of Ganado?
Total Male Population of Ganado is 332.
What is the Total Female Population of Ganado?
Total Female Population of Ganado is 405.
What is the Ratio of Males per 100 Females in Ganado?
There are 81.98 Males per 100 Females in Ganado.
What is the Ratio of Females per 100 Males in Ganado?
There are 121.99 Females per 100 Males in Ganado.
What is the Median Population Age in Ganado?
Median Population Age in Ganado is 31.6 Years.
What is the Average Family Size in Ganado
Average Family Size in Ganado is 4.6 People.
What is the Average Household Size in Ganado
Average Household Size in Ganado is 3.6 People.
How Large is the Labor Force in Ganado?
There are 275 People in the Labor Forcein in Ganado.
What is the Percentage of People in the Labor Force in Ganado?
47.7% of People are in the Labor Force in Ganado.