Cities with the Highest Percentage of Population Employed in Administrative & Support Services in Alaska
RELATED REPORTS & OPTIONS
Administrative & Support Services
Alaska
Compare Cities
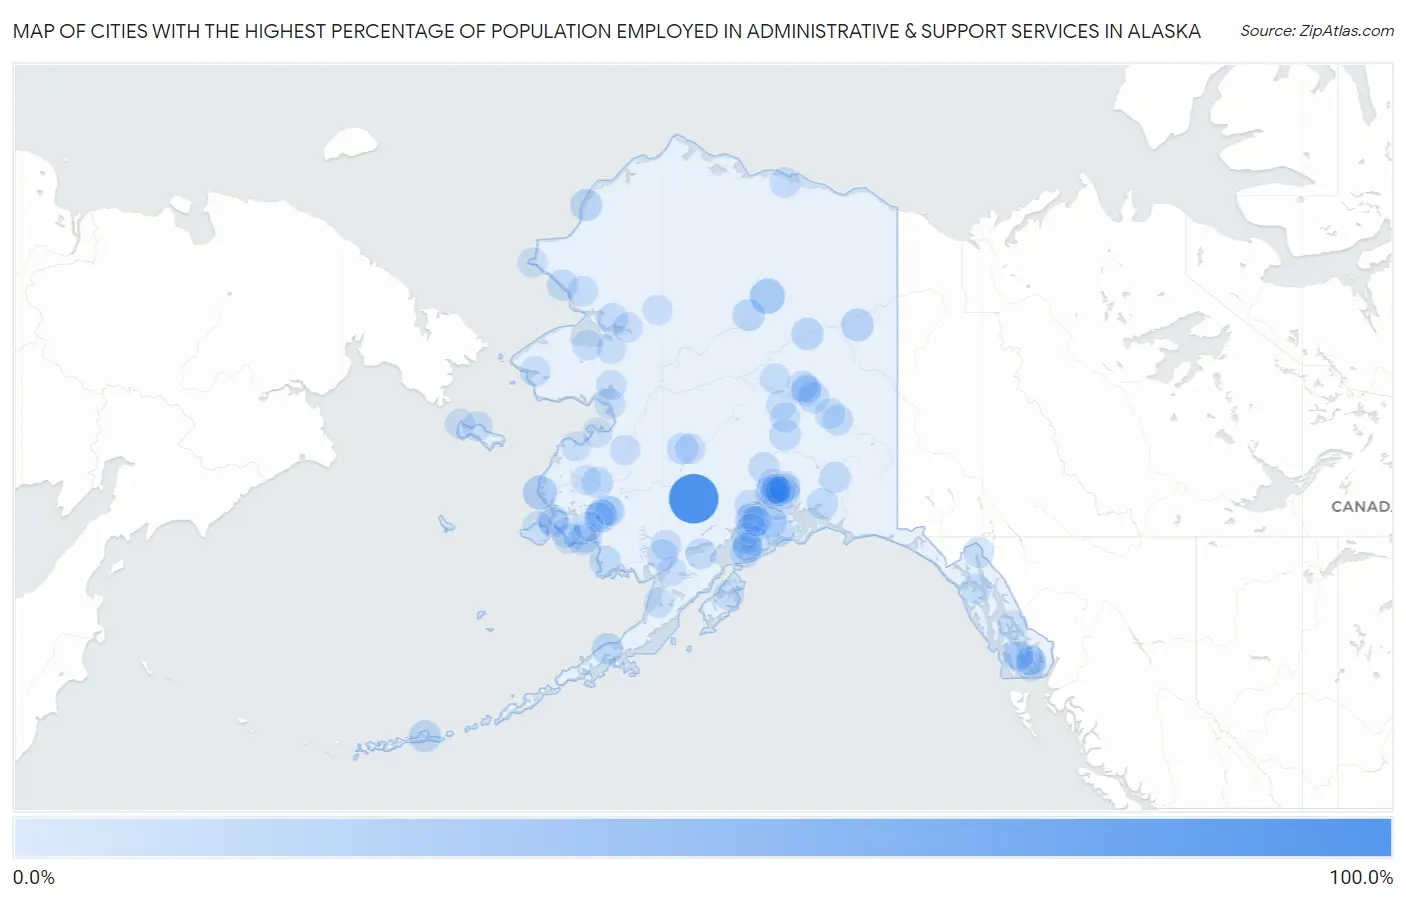
Map of Cities with the Highest Percentage of Population Employed in Administrative & Support Services in Alaska
0.0%
100.0%
Cities with the Highest Percentage of Population Employed in Administrative & Support Services in Alaska
| City | % Employed | vs State | vs National | |
| 1. | Lime Village | 100.0% | 3.0%(+97.0)#1 | 4.1%(+95.9)#9 |
| 2. | Wiseman | 26.3% | 3.0%(+23.3)#2 | 4.1%(+22.2)#255 |
| 3. | Hooper Bay | 22.0% | 3.0%(+19.0)#3 | 4.1%(+17.9)#374 |
| 4. | Chalkyitsik | 15.4% | 3.0%(+12.3)#4 | 4.1%(+11.2)#757 |
| 5. | Oscarville | 13.6% | 3.0%(+10.6)#5 | 4.1%(+9.49)#1,010 |
| 6. | Beaver | 12.5% | 3.0%(+9.46)#6 | 4.1%(+8.35)#1,208 |
| 7. | Evansville | 12.5% | 3.0%(+9.46)#7 | 4.1%(+8.35)#1,213 |
| 8. | Point Lay | 11.3% | 3.0%(+8.25)#8 | 4.1%(+7.14)#1,469 |
| 9. | Atka | 11.1% | 3.0%(+8.07)#9 | 4.1%(+6.96)#1,524 |
| 10. | Nelson Lagoon | 9.6% | 3.0%(+6.57)#10 | 4.1%(+5.47)#2,068 |
| 11. | Takotna | 9.5% | 3.0%(+6.48)#11 | 4.1%(+5.37)#2,118 |
| 12. | Cantwell | 9.4% | 3.0%(+6.33)#12 | 4.1%(+5.23)#2,184 |
| 13. | Silver Springs | 9.0% | 3.0%(+5.91)#13 | 4.1%(+4.81)#2,398 |
| 14. | Goodnews Bay | 8.7% | 3.0%(+5.65)#14 | 4.1%(+4.55)#2,557 |
| 15. | Valdez | 8.5% | 3.0%(+5.42)#15 | 4.1%(+4.31)#2,700 |
| 16. | Salcha | 8.3% | 3.0%(+5.29)#16 | 4.1%(+4.18)#2,776 |
| 17. | Marshall | 8.3% | 3.0%(+5.29)#17 | 4.1%(+4.18)#2,787 |
| 18. | Ekwok | 8.3% | 3.0%(+5.29)#18 | 4.1%(+4.18)#2,799 |
| 19. | Noorvik | 7.9% | 3.0%(+4.89)#19 | 4.1%(+3.79)#3,039 |
| 20. | Bear Creek | 7.9% | 3.0%(+4.85)#20 | 4.1%(+3.74)#3,077 |
| 21. | Cooper Landing | 7.7% | 3.0%(+4.65)#21 | 4.1%(+3.54)#3,223 |
| 22. | Kivalina | 7.5% | 3.0%(+4.46)#22 | 4.1%(+3.35)#3,391 |
| 23. | Deltana | 6.7% | 3.0%(+3.62)#23 | 4.1%(+2.52)#4,217 |
| 24. | Kokhanok | 6.7% | 3.0%(+3.62)#24 | 4.1%(+2.52)#4,240 |
| 25. | Farmers Loop | 6.4% | 3.0%(+3.40)#25 | 4.1%(+2.30)#4,511 |
| 26. | Thorne Bay | 6.4% | 3.0%(+3.32)#26 | 4.1%(+2.21)#4,604 |
| 27. | Big Lake | 5.9% | 3.0%(+2.90)#27 | 4.1%(+1.80)#5,239 |
| 28. | Tununak | 5.8% | 3.0%(+2.80)#28 | 4.1%(+1.69)#5,400 |
| 29. | Seldovia | 5.8% | 3.0%(+2.77)#29 | 4.1%(+1.66)#5,439 |
| 30. | North Lakes | 5.7% | 3.0%(+2.68)#30 | 4.1%(+1.58)#5,574 |
| 31. | Delta Junction | 5.7% | 3.0%(+2.66)#31 | 4.1%(+1.55)#5,625 |
| 32. | Deering | 5.7% | 3.0%(+2.62)#32 | 4.1%(+1.51)#5,696 |
| 33. | Kongiganak | 5.6% | 3.0%(+2.57)#33 | 4.1%(+1.47)#5,766 |
| 34. | Tyonek | 5.6% | 3.0%(+2.51)#34 | 4.1%(+1.41)#5,881 |
| 35. | Skagway | 5.5% | 3.0%(+2.41)#35 | 4.1%(+1.31)#6,082 |
| 36. | Trapper Creek | 5.4% | 3.0%(+2.34)#36 | 4.1%(+1.23)#6,216 |
| 37. | Knik River | 5.3% | 3.0%(+2.26)#37 | 4.1%(+1.15)#6,393 |
| 38. | Minto | 5.1% | 3.0%(+2.08)#38 | 4.1%(+0.978)#6,762 |
| 39. | Prudhoe Bay | 5.1% | 3.0%(+2.06)#39 | 4.1%(+0.955)#6,809 |
| 40. | Port Lions | 5.1% | 3.0%(+2.04)#40 | 4.1%(+0.935)#6,861 |
| 41. | Nikiski | 5.0% | 3.0%(+1.96)#41 | 4.1%(+0.850)#7,043 |
| 42. | Happy Valley | 4.9% | 3.0%(+1.87)#42 | 4.1%(+0.761)#7,256 |
| 43. | Sutton Alpine | 4.9% | 3.0%(+1.83)#43 | 4.1%(+0.721)#7,361 |
| 44. | Noatak | 4.7% | 3.0%(+1.68)#44 | 4.1%(+0.575)#7,717 |
| 45. | Brevig Mission | 4.6% | 3.0%(+1.59)#45 | 4.1%(+0.486)#7,950 |
| 46. | Mcgrath | 4.6% | 3.0%(+1.55)#46 | 4.1%(+0.448)#8,042 |
| 47. | Salamatof | 4.5% | 3.0%(+1.45)#47 | 4.1%(+0.348)#8,303 |
| 48. | Kipnuk | 4.4% | 3.0%(+1.34)#48 | 4.1%(+0.230)#8,647 |
| 49. | Kwigillingok | 4.4% | 3.0%(+1.33)#49 | 4.1%(+0.222)#8,673 |
| 50. | Koyuk | 4.3% | 3.0%(+1.24)#50 | 4.1%(+0.136)#8,970 |
| 51. | Anderson | 4.3% | 3.0%(+1.21)#51 | 4.1%(+0.106)#9,067 |
| 52. | Metlakatla | 4.0% | 3.0%(+0.943)#52 | 4.1%(-0.163)#9,903 |
| 53. | Fox River | 4.0% | 3.0%(+0.916)#53 | 4.1%(-0.189)#9,986 |
| 54. | Healy | 3.8% | 3.0%(+0.757)#54 | 4.1%(-0.349)#10,511 |
| 55. | Koliganek | 3.8% | 3.0%(+0.730)#55 | 4.1%(-0.376)#10,613 |
| 56. | Shaktoolik | 3.7% | 3.0%(+0.706)#56 | 4.1%(-0.400)#10,700 |
| 57. | North Pole | 3.7% | 3.0%(+0.690)#57 | 4.1%(-0.416)#10,754 |
| 58. | Toksook Bay | 3.7% | 3.0%(+0.687)#58 | 4.1%(-0.418)#10,761 |
| 59. | Anchorage | 3.7% | 3.0%(+0.687)#59 | 4.1%(-0.419)#10,764 |
| 60. | Mill Bay | 3.7% | 3.0%(+0.682)#60 | 4.1%(-0.423)#10,782 |
| 61. | Juneau City And Borough | 3.7% | 3.0%(+0.657)#61 | 4.1%(-0.448)#10,876 |
| 62. | Savoonga | 3.6% | 3.0%(+0.546)#62 | 4.1%(-0.560)#11,283 |
| 63. | Houston | 3.5% | 3.0%(+0.414)#63 | 4.1%(-0.692)#11,773 |
| 64. | Ridgeway | 3.3% | 3.0%(+0.289)#64 | 4.1%(-0.816)#12,225 |
| 65. | Selawik | 3.3% | 3.0%(+0.253)#65 | 4.1%(-0.853)#12,373 |
| 66. | Farm Loop | 3.2% | 3.0%(+0.190)#66 | 4.1%(-0.916)#12,584 |
| 67. | Hoonah | 3.2% | 3.0%(+0.182)#67 | 4.1%(-0.924)#12,609 |
| 68. | Gambell | 3.2% | 3.0%(+0.182)#68 | 4.1%(-0.924)#12,616 |
| 69. | Cohoe | 3.2% | 3.0%(+0.159)#69 | 4.1%(-0.947)#12,701 |
| 70. | Willow | 3.2% | 3.0%(+0.151)#70 | 4.1%(-0.955)#12,732 |
| 71. | Akiachak | 3.2% | 3.0%(+0.148)#71 | 4.1%(-0.958)#12,740 |
| 72. | Grayling | 3.2% | 3.0%(+0.131)#72 | 4.1%(-0.975)#12,799 |
| 73. | Lazy Mountain | 3.1% | 3.0%(+0.102)#73 | 4.1%(-1.00)#12,910 |
| 74. | Knik Fairview | 3.1% | 3.0%(+0.101)#74 | 4.1%(-1.00)#12,912 |
| 75. | Ketchikan | 3.1% | 3.0%(+0.059)#75 | 4.1%(-1.05)#13,045 |
| 76. | Wasilla | 3.1% | 3.0%(+0.045)#76 | 4.1%(-1.06)#13,090 |
| 77. | Diamond Ridge | 3.0% | 3.0%(-0.014)#77 | 4.1%(-1.12)#13,305 |
| 78. | Naknek | 3.0% | 3.0%(-0.029)#78 | 4.1%(-1.13)#13,387 |
| 79. | Sterling | 2.9% | 3.0%(-0.134)#79 | 4.1%(-1.24)#13,785 |
| 80. | Ambler | 2.9% | 3.0%(-0.145)#80 | 4.1%(-1.25)#13,821 |
| 81. | Saxman | 2.9% | 3.0%(-0.159)#81 | 4.1%(-1.27)#13,883 |
| 82. | Pilot Station | 2.9% | 3.0%(-0.187)#82 | 4.1%(-1.29)#13,993 |
| 83. | St Michael | 2.9% | 3.0%(-0.187)#83 | 4.1%(-1.29)#13,995 |
| 84. | Pilot Point | 2.9% | 3.0%(-0.187)#84 | 4.1%(-1.29)#14,008 |
| 85. | Homer | 2.8% | 3.0%(-0.201)#85 | 4.1%(-1.31)#14,054 |
| 86. | Mekoryuk | 2.8% | 3.0%(-0.240)#86 | 4.1%(-1.35)#14,208 |
| 87. | Point Hope | 2.8% | 3.0%(-0.247)#87 | 4.1%(-1.35)#14,231 |
| 88. | Petersburg | 2.7% | 3.0%(-0.328)#88 | 4.1%(-1.43)#14,557 |
| 89. | Buckland | 2.7% | 3.0%(-0.341)#89 | 4.1%(-1.45)#14,596 |
| 90. | Bethel | 2.7% | 3.0%(-0.356)#90 | 4.1%(-1.46)#14,663 |
| 91. | Badger | 2.7% | 3.0%(-0.360)#91 | 4.1%(-1.47)#14,686 |
| 92. | Chefornak | 2.6% | 3.0%(-0.480)#92 | 4.1%(-1.59)#15,176 |
| 93. | Napakiak | 2.5% | 3.0%(-0.502)#93 | 4.1%(-1.61)#15,269 |
| 94. | Tanaina | 2.5% | 3.0%(-0.510)#94 | 4.1%(-1.62)#15,290 |
| 95. | Kotlik | 2.5% | 3.0%(-0.560)#95 | 4.1%(-1.67)#15,478 |
| 96. | Meadow Lakes | 2.4% | 3.0%(-0.671)#96 | 4.1%(-1.78)#15,906 |
| 97. | Akiak | 2.3% | 3.0%(-0.745)#97 | 4.1%(-1.85)#16,192 |
| 98. | Tuntutuliak | 2.3% | 3.0%(-0.749)#98 | 4.1%(-1.85)#16,206 |
| 99. | Kasaan | 2.3% | 3.0%(-0.771)#99 | 4.1%(-1.88)#16,304 |
| 100. | Gateway | 2.3% | 3.0%(-0.775)#100 | 4.1%(-1.88)#16,315 |
Common Questions
What are the Top 10 Cities with the Highest Percentage of Population Employed in Administrative & Support Services in Alaska?
Top 10 Cities with the Highest Percentage of Population Employed in Administrative & Support Services in Alaska are:
#1
100.0%
#2
26.3%
#3
22.0%
#4
15.4%
#5
13.6%
#6
12.5%
#7
12.5%
#8
11.3%
#9
11.1%
#10
9.6%
What city has the Highest Percentage of Population Employed in Administrative & Support Services in Alaska?
Lime Village has the Highest Percentage of Population Employed in Administrative & Support Services in Alaska with 100.0%.
What is the Percentage of Population Employed in Administrative & Support Services in the State of Alaska?
Percentage of Population Employed in Administrative & Support Services in Alaska is 3.0%.
What is the Percentage of Population Employed in Administrative & Support Services in the United States?
Percentage of Population Employed in Administrative & Support Services in the United States is 4.1%.