Savoonga, AK Map & Demographics
Savoonga Map
Savoonga Overview
$17,931
PER CAPITA INCOME
$52,981
AVG FAMILY INCOME
$53,125
AVG HOUSEHOLD INCOME
$11,738
FAMILY INCOME DEFICIT
0.48
INEQUALITY / GINI INDEX
823
TOTAL POPULATION
462
MALE POPULATION
361
FEMALE POPULATION
127.98
MALES / 100 FEMALES
78.14
FEMALES / 100 MALES
24.8
MEDIAN AGE
5.0
AVG FAMILY SIZE
4.8
AVG HOUSEHOLD SIZE
286
LABOR FORCE [ PEOPLE ]
50.7%
PERCENT IN LABOR FORCE
31.8%
UNEMPLOYMENT RATE
Savoonga Zip Codes
Savoonga Area Codes
Income in Savoonga
Income Overview in Savoonga
Per Capita Income in Savoonga is $17,931, while median incomes of families and households are $52,981 and $53,125 respectively.
| Characteristic | Number | Measure |
| Per Capita Income | 823 | $17,931 |
| Median Family Income | 147 | $52,981 |
| Mean Family Income | 147 | $60,895 |
| Median Household Income | 165 | $53,125 |
| Mean Household Income | 165 | $65,822 |
| Income Deficit | 147 | $11,738 |
| Wage / Income Gap (%) | 823 | 0.00% |
| Wage / Income Gap ($) | 823 | 100.00¢ per $1 |
| Gini / Inequality Index | 823 | 0.48 |
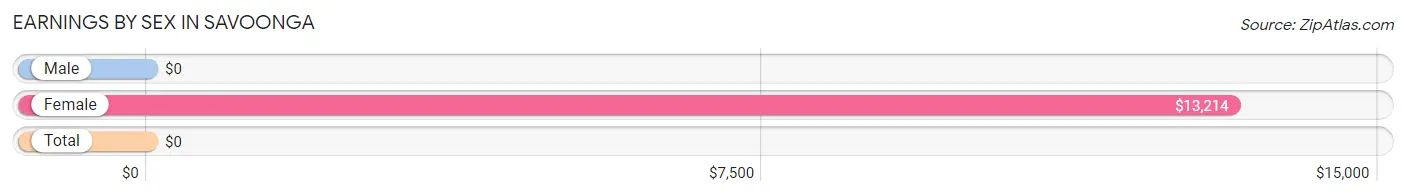
Earnings by Sex in Savoonga
| Sex | Number | Average Earnings |
| Male | 170 (61.6%) | $0 |
| Female | 106 (38.4%) | $13,214 |
| Total | 276 (100.0%) | $0 |
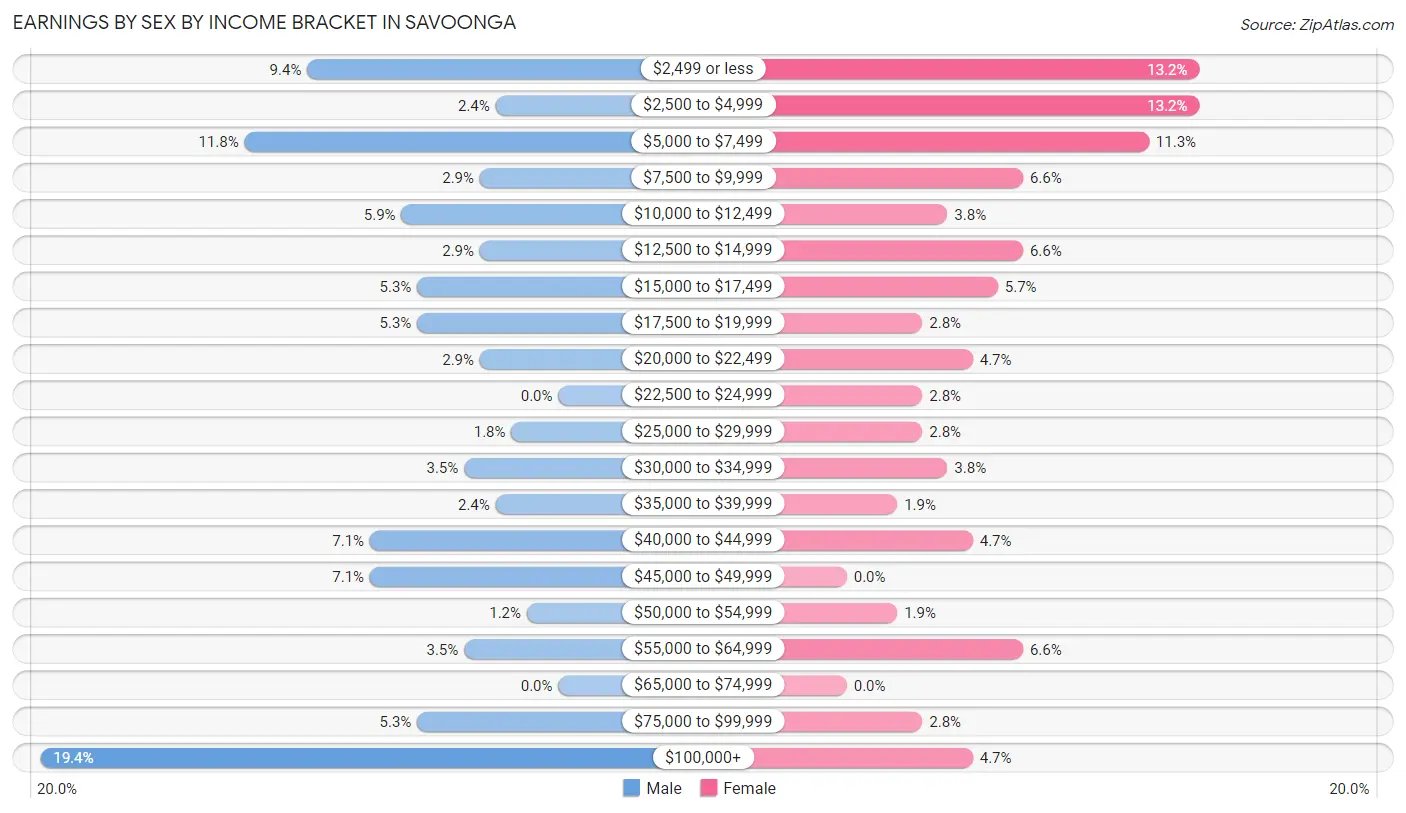
Earnings by Sex by Income Bracket in Savoonga
The most common earnings brackets in Savoonga are $100,000+ for men (33 | 19.4%) and $2,499 or less for women (14 | 13.2%).
| Income | Male | Female |
| $2,499 or less | 16 (9.4%) | 14 (13.2%) |
| $2,500 to $4,999 | 4 (2.4%) | 14 (13.2%) |
| $5,000 to $7,499 | 20 (11.8%) | 12 (11.3%) |
| $7,500 to $9,999 | 5 (2.9%) | 7 (6.6%) |
| $10,000 to $12,499 | 10 (5.9%) | 4 (3.8%) |
| $12,500 to $14,999 | 5 (2.9%) | 7 (6.6%) |
| $15,000 to $17,499 | 9 (5.3%) | 6 (5.7%) |
| $17,500 to $19,999 | 9 (5.3%) | 3 (2.8%) |
| $20,000 to $22,499 | 5 (2.9%) | 5 (4.7%) |
| $22,500 to $24,999 | 0 (0.0%) | 3 (2.8%) |
| $25,000 to $29,999 | 3 (1.8%) | 3 (2.8%) |
| $30,000 to $34,999 | 6 (3.5%) | 4 (3.8%) |
| $35,000 to $39,999 | 4 (2.4%) | 2 (1.9%) |
| $40,000 to $44,999 | 12 (7.1%) | 5 (4.7%) |
| $45,000 to $49,999 | 12 (7.1%) | 0 (0.0%) |
| $50,000 to $54,999 | 2 (1.2%) | 2 (1.9%) |
| $55,000 to $64,999 | 6 (3.5%) | 7 (6.6%) |
| $65,000 to $74,999 | 0 (0.0%) | 0 (0.0%) |
| $75,000 to $99,999 | 9 (5.3%) | 3 (2.8%) |
| $100,000+ | 33 (19.4%) | 5 (4.7%) |
| Total | 170 (100.0%) | 106 (100.0%) |
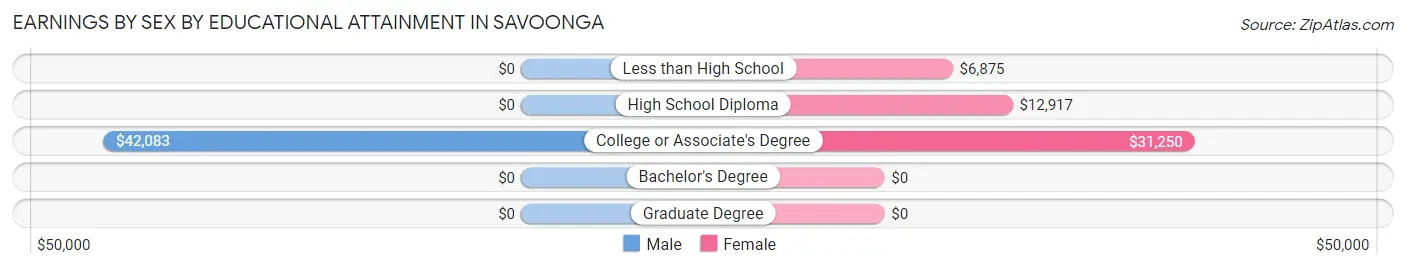
Earnings by Sex by Educational Attainment in Savoonga
| Educational Attainment | Male Income | Female Income |
| Less than High School | - | - |
| High School Diploma | - | - |
| College or Associate's Degree | $42,083 | $31,250 |
| Bachelor's Degree | - | - |
| Graduate Degree | - | - |
| Total | - | - |
Family Income in Savoonga
Family Income Brackets in Savoonga
According to the Savoonga family income data, there are 34 families falling into the $50,000 to $74,999 income range, which is the most common income bracket and makes up 23.1% of all families. Conversely, the $10,000 to $14,999 income bracket is the least frequent group with only 6 families (4.1%) belonging to this category.
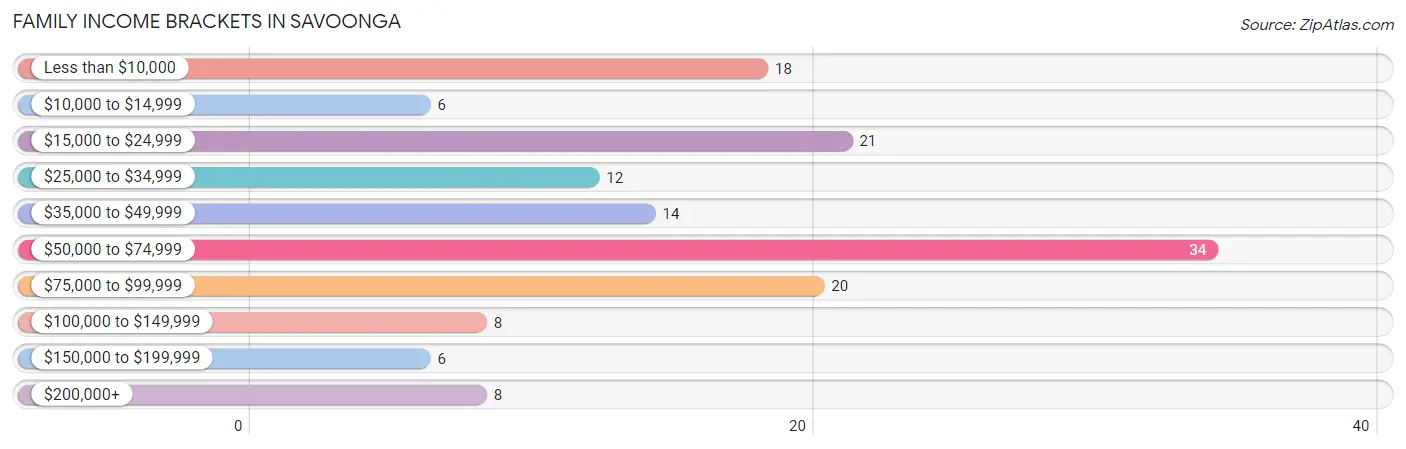
| Income Bracket | # Families | % Families |
| Less than $10,000 | 18 | 12.2% |
| $10,000 to $14,999 | 6 | 4.1% |
| $15,000 to $24,999 | 21 | 14.3% |
| $25,000 to $34,999 | 12 | 8.2% |
| $35,000 to $49,999 | 14 | 9.5% |
| $50,000 to $74,999 | 34 | 23.1% |
| $75,000 to $99,999 | 20 | 13.6% |
| $100,000 to $149,999 | 8 | 5.4% |
| $150,000 to $199,999 | 6 | 4.1% |
| $200,000+ | 8 | 5.4% |
Family Income by Famaliy Size in Savoonga
7+ person families (48 | 32.7%) account for the highest median family income in Savoonga with $71,667 per family, while 5-person families (31 | 21.1%) have the highest median income of $13,750 per family member.
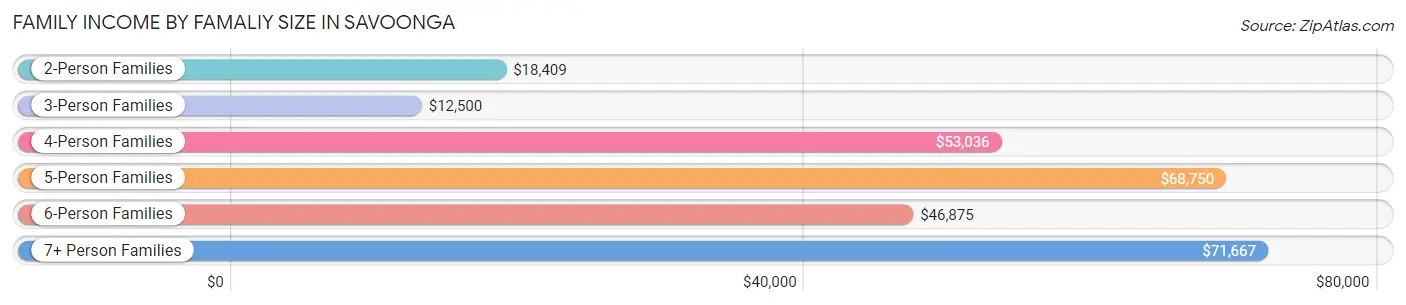
| Income Bracket | # Families | Median Income |
| 2-Person Families | 26 (17.7%) | $18,409 |
| 3-Person Families | 12 (8.2%) | $12,500 |
| 4-Person Families | 21 (14.3%) | $53,036 |
| 5-Person Families | 31 (21.1%) | $68,750 |
| 6-Person Families | 9 (6.1%) | $46,875 |
| 7+ Person Families | 48 (32.7%) | $71,667 |
| Total | 147 (100.0%) | $52,981 |
Family Income by Number of Earners in Savoonga
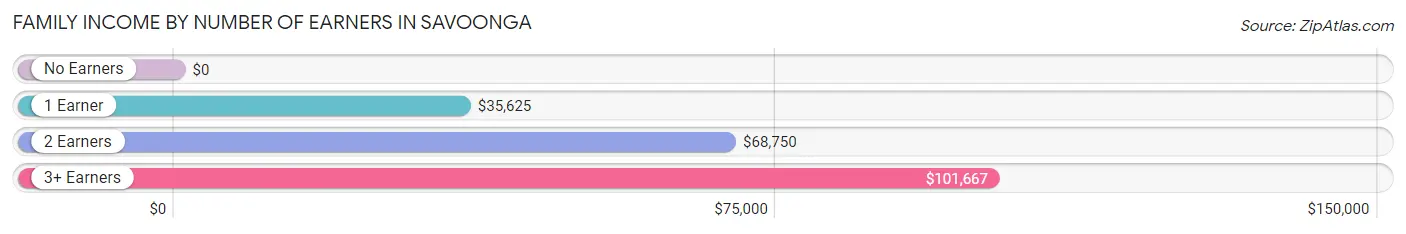
| Number of Earners | # Families | Median Income |
| No Earners | 31 (21.1%) | $0 |
| 1 Earner | 50 (34.0%) | $35,625 |
| 2 Earners | 36 (24.5%) | $68,750 |
| 3+ Earners | 30 (20.4%) | $101,667 |
| Total | 147 (100.0%) | $52,981 |
Household Income in Savoonga
Household Income Brackets in Savoonga
With 37 households falling in the category, the $50,000 to $74,999 income range is the most frequent in Savoonga, accounting for 22.4% of all households. In contrast, only 8 households (4.9%) fall into the $10,000 to $14,999 income bracket, making it the least populous group.
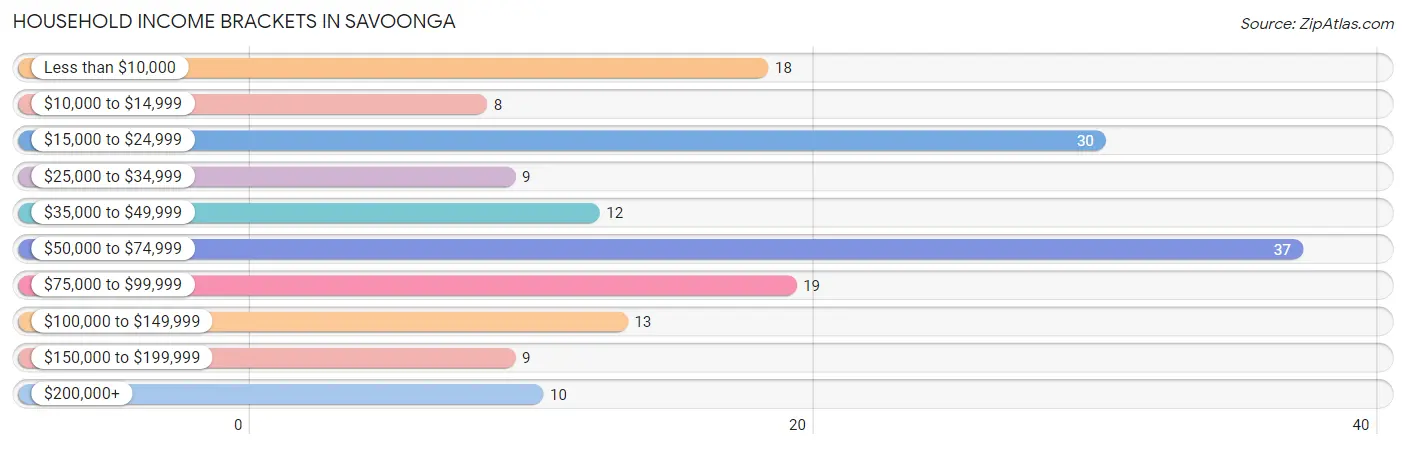
| Income Bracket | # Households | % Households |
| Less than $10,000 | 18 | 10.9% |
| $10,000 to $14,999 | 8 | 4.8% |
| $15,000 to $24,999 | 30 | 18.2% |
| $25,000 to $34,999 | 9 | 5.5% |
| $35,000 to $49,999 | 12 | 7.3% |
| $50,000 to $74,999 | 37 | 22.4% |
| $75,000 to $99,999 | 19 | 11.5% |
| $100,000 to $149,999 | 13 | 7.9% |
| $150,000 to $199,999 | 9 | 5.5% |
| $200,000+ | 10 | 6.1% |
Household Income by Householder Age in Savoonga
The median household income in Savoonga is $53,125, with the highest median household income of $53,958 found in the 65+ years age bracket for the primary householder. A total of 59 households (35.8%) fall into this category. Meanwhile, the 15 to 24 years age bracket for the primary householder has the lowest median household income of $0, with 4 households (2.4%) in this group.
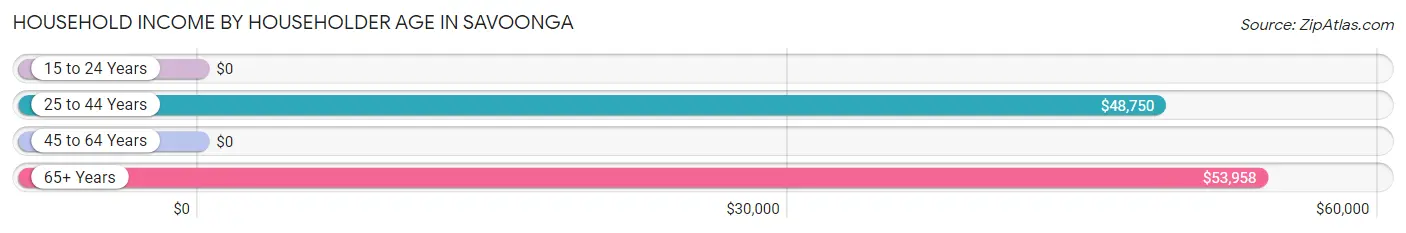
| Income Bracket | # Households | Median Income |
| 15 to 24 Years | 4 (2.4%) | $0 |
| 25 to 44 Years | 38 (23.0%) | $48,750 |
| 45 to 64 Years | 64 (38.8%) | $0 |
| 65+ Years | 59 (35.8%) | $53,958 |
| Total | 165 (100.0%) | $53,125 |
Poverty in Savoonga
Income Below Poverty by Sex and Age in Savoonga
With 31.8% poverty level for males and 36.3% for females among the residents of Savoonga, 15 year old males and 15 year old females are the most vulnerable to poverty, with 4 males (66.7%) and 13 females (81.2%) in their respective age groups living below the poverty level.
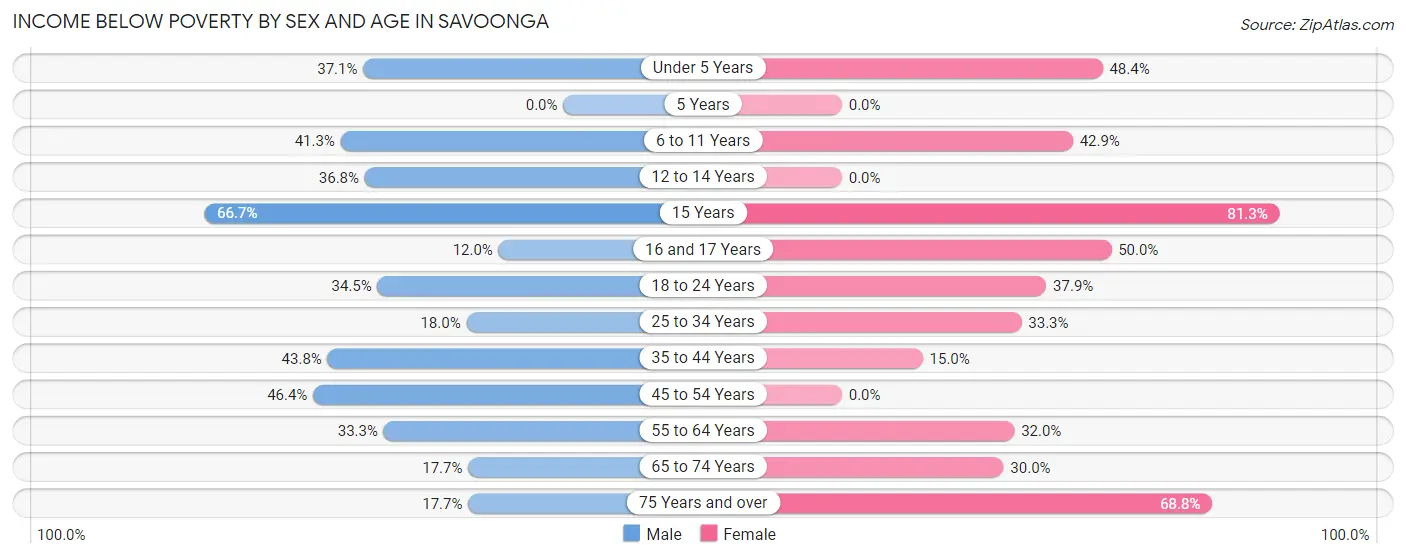
| Age Bracket | Male | Female |
| Under 5 Years | 13 (37.1%) | 15 (48.4%) |
| 5 Years | 0 (0.0%) | 0 (0.0%) |
| 6 to 11 Years | 31 (41.3%) | 24 (42.9%) |
| 12 to 14 Years | 7 (36.8%) | 0 (0.0%) |
| 15 Years | 4 (66.7%) | 13 (81.2%) |
| 16 and 17 Years | 3 (12.0%) | 8 (50.0%) |
| 18 to 24 Years | 20 (34.5%) | 22 (37.9%) |
| 25 to 34 Years | 16 (18.0%) | 21 (33.3%) |
| 35 to 44 Years | 21 (43.8%) | 3 (15.0%) |
| 45 to 54 Years | 13 (46.4%) | 0 (0.0%) |
| 55 to 64 Years | 13 (33.3%) | 8 (32.0%) |
| 65 to 74 Years | 3 (17.6%) | 6 (30.0%) |
| 75 Years and over | 3 (17.6%) | 11 (68.8%) |
| Total | 147 (31.8%) | 131 (36.3%) |
Income Above Poverty by Sex and Age in Savoonga
According to the poverty statistics in Savoonga, males aged 5 years and females aged 5 years are the age groups that are most secure financially, with 100.0% of males and 100.0% of females in these age groups living above the poverty line.
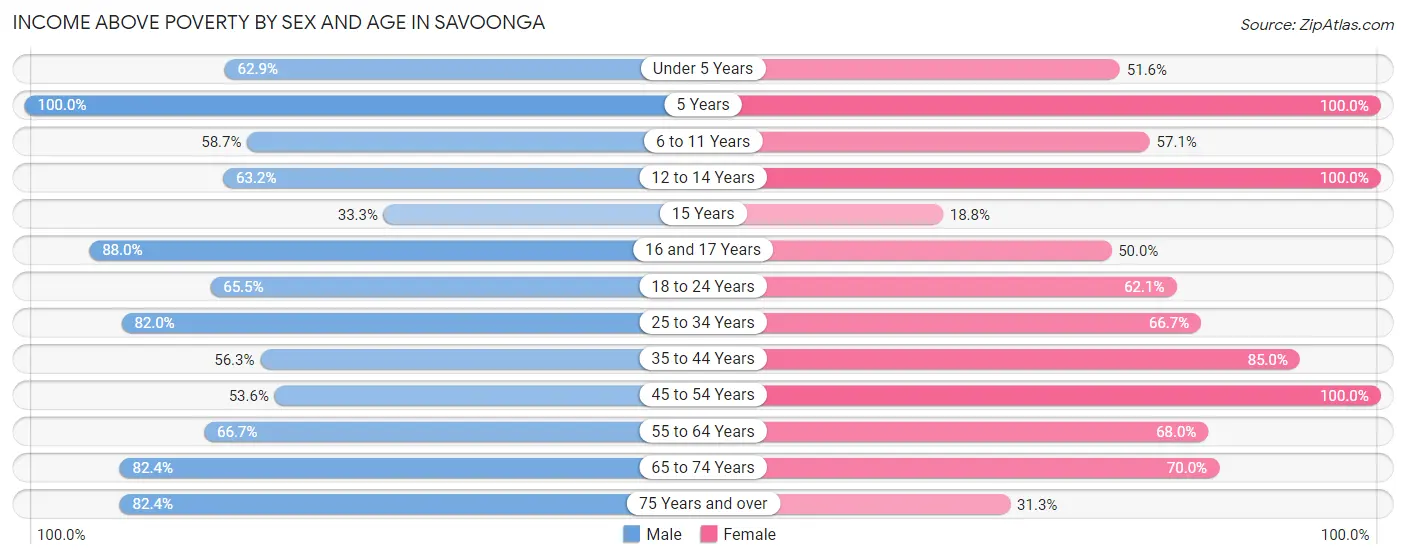
| Age Bracket | Male | Female |
| Under 5 Years | 22 (62.9%) | 16 (51.6%) |
| 5 Years | 6 (100.0%) | 5 (100.0%) |
| 6 to 11 Years | 44 (58.7%) | 32 (57.1%) |
| 12 to 14 Years | 12 (63.2%) | 10 (100.0%) |
| 15 Years | 2 (33.3%) | 3 (18.8%) |
| 16 and 17 Years | 22 (88.0%) | 8 (50.0%) |
| 18 to 24 Years | 38 (65.5%) | 36 (62.1%) |
| 25 to 34 Years | 73 (82.0%) | 42 (66.7%) |
| 35 to 44 Years | 27 (56.2%) | 17 (85.0%) |
| 45 to 54 Years | 15 (53.6%) | 25 (100.0%) |
| 55 to 64 Years | 26 (66.7%) | 17 (68.0%) |
| 65 to 74 Years | 14 (82.4%) | 14 (70.0%) |
| 75 Years and over | 14 (82.4%) | 5 (31.2%) |
| Total | 315 (68.2%) | 230 (63.7%) |
Income Below Poverty Among Married-Couple Families in Savoonga
The poverty statistics for married-couple families in Savoonga show that 20.8% or 10 of the total 48 families live below the poverty line. Families with 1 or 2 children have the highest poverty rate of 25.0%, comprising of 6 families. On the other hand, families with 3 or 4 children have the lowest poverty rate of 16.7%, which includes 4 families.
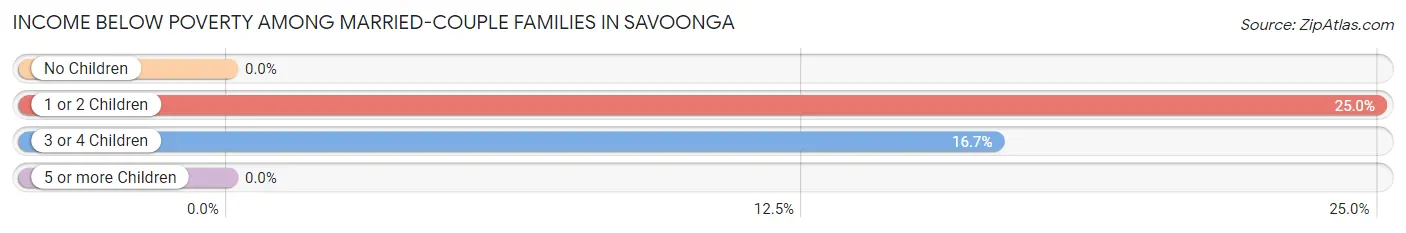
| Children | Above Poverty | Below Poverty |
| No Children | 0 (0.0%) | 0 (0.0%) |
| 1 or 2 Children | 18 (75.0%) | 6 (25.0%) |
| 3 or 4 Children | 20 (83.3%) | 4 (16.7%) |
| 5 or more Children | 0 (0.0%) | 0 (0.0%) |
| Total | 38 (79.2%) | 10 (20.8%) |
Income Below Poverty Among Single-Parent Households in Savoonga
According to the poverty data in Savoonga, 50.8% or 32 single-father households and 50.0% or 18 single-mother households are living below the poverty line. Among single-father households, those with 5 or more children have the highest poverty rate, with 8 households (100.0%) experiencing poverty. Likewise, among single-mother households, those with no children have the highest poverty rate, with 2 households (100.0%) falling below the poverty line.
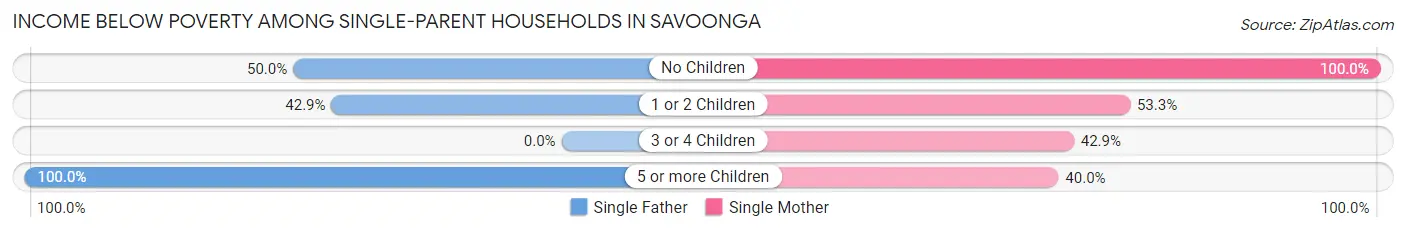
| Children | Single Father | Single Mother |
| No Children | 9 (50.0%) | 2 (100.0%) |
| 1 or 2 Children | 15 (42.9%) | 8 (53.3%) |
| 3 or 4 Children | 0 (0.0%) | 6 (42.9%) |
| 5 or more Children | 8 (100.0%) | 2 (40.0%) |
| Total | 32 (50.8%) | 18 (50.0%) |
Income Below Poverty Among Married-Couple vs Single-Parent Households in Savoonga
The poverty data for Savoonga shows that 10 of the married-couple family households (20.8%) and 50 of the single-parent households (50.5%) are living below the poverty level. Within the married-couple family households, those with 1 or 2 children have the highest poverty rate, with 6 households (25.0%) falling below the poverty line. Among the single-parent households, those with 5 or more children have the highest poverty rate, with 10 household (76.9%) living below poverty.
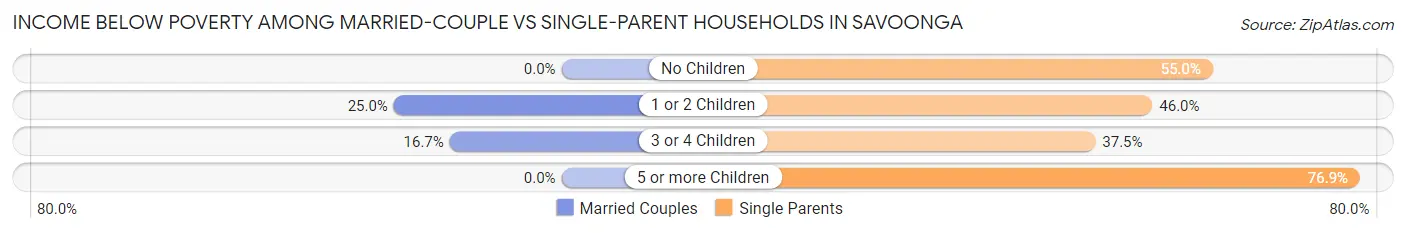
| Children | Married-Couple Families | Single-Parent Households |
| No Children | 0 (0.0%) | 11 (55.0%) |
| 1 or 2 Children | 6 (25.0%) | 23 (46.0%) |
| 3 or 4 Children | 4 (16.7%) | 6 (37.5%) |
| 5 or more Children | 0 (0.0%) | 10 (76.9%) |
| Total | 10 (20.8%) | 50 (50.5%) |
Race in Savoonga
The most populous races in Savoonga are Native / Alaskan (782 | 95.0%), White / Caucasian (38 | 4.6%), and Black / African American (3 | 0.4%).
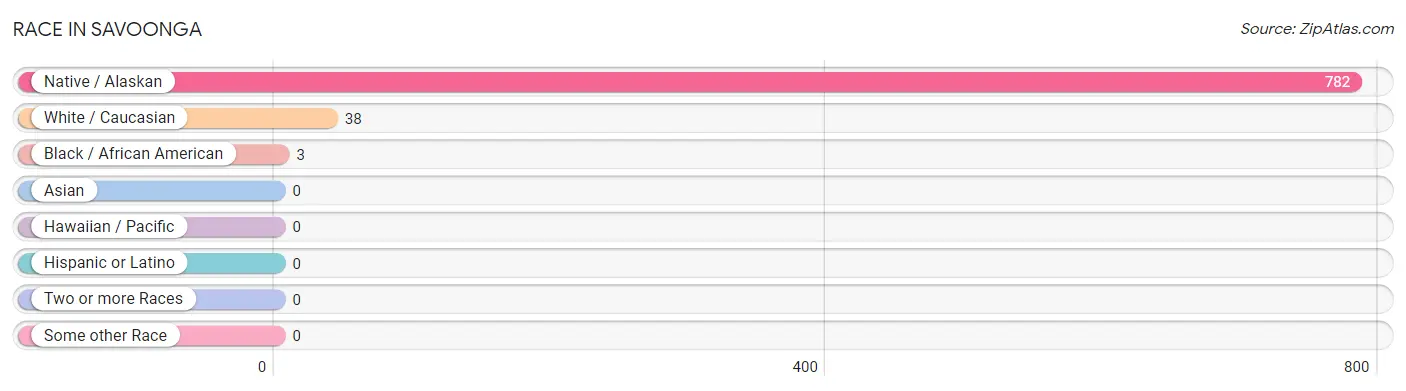
| Race | # Population | % Population |
| Asian | 0 | 0.0% |
| Black / African American | 3 | 0.4% |
| Hawaiian / Pacific | 0 | 0.0% |
| Hispanic or Latino | 0 | 0.0% |
| Native / Alaskan | 782 | 95.0% |
| White / Caucasian | 38 | 4.6% |
| Two or more Races | 0 | 0.0% |
| Some other Race | 0 | 0.0% |
| Total | 823 | 100.0% |
Ancestry in Savoonga
The most populous ancestries reported in Savoonga are Yup'ik (765 | 92.9%), American (139 | 16.9%), Inupiat (11 | 1.3%), Aleut (6 | 0.7%), and Norwegian (5 | 0.6%), together accounting for 112.5% of all Savoonga residents.
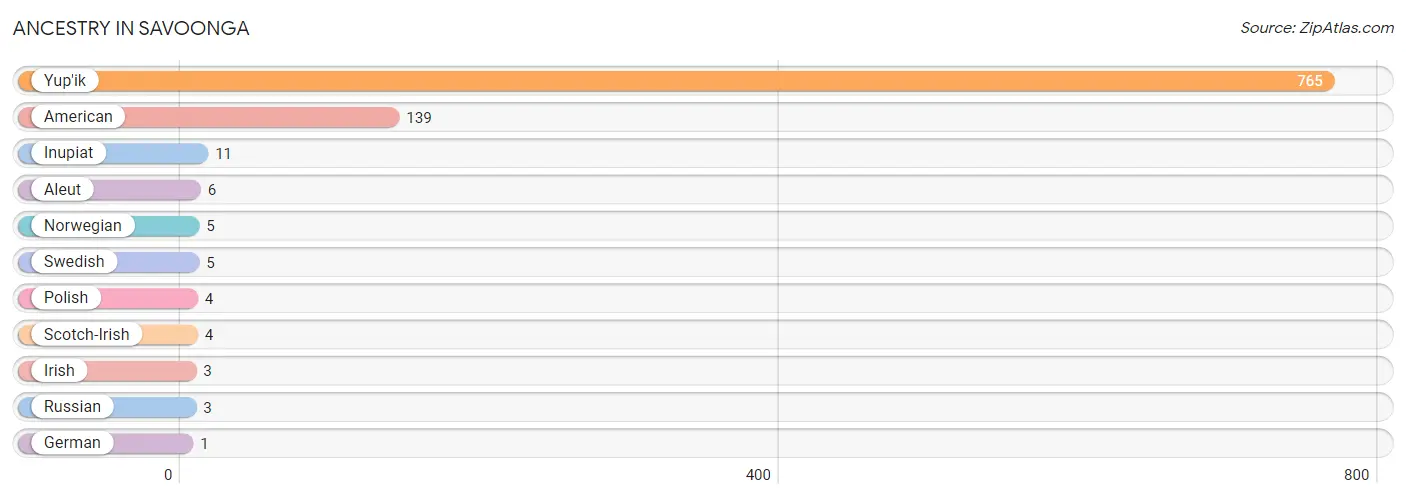
| Ancestry | # Population | % Population |
| Aleut | 6 | 0.7% |
| American | 139 | 16.9% |
| German | 1 | 0.1% |
| Inupiat | 11 | 1.3% |
| Irish | 3 | 0.4% |
| Norwegian | 5 | 0.6% |
| Polish | 4 | 0.5% |
| Russian | 3 | 0.4% |
| Scotch-Irish | 4 | 0.5% |
| Swedish | 5 | 0.6% |
| Yup'ik | 765 | 92.9% | View All 11 Rows |
Immigrants in Savoonga

| Immigration Origin | # Population | % Population | View All 0 Rows |
Sex and Age in Savoonga
Sex and Age in Savoonga
The most populous age groups in Savoonga are 5 to 9 Years (57 | 12.3%) for men and 15 to 19 Years (55 | 15.2%) for women.
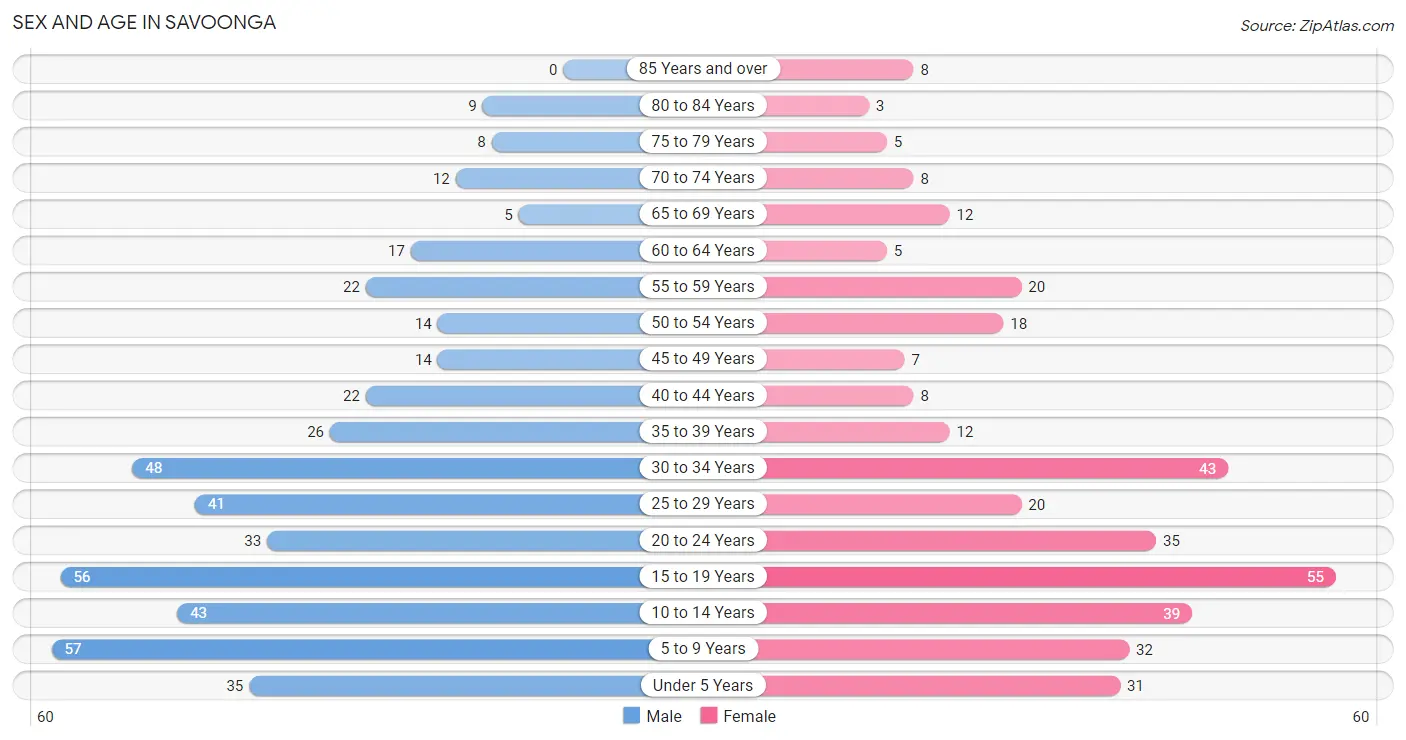
| Age Bracket | Male | Female |
| Under 5 Years | 35 (7.6%) | 31 (8.6%) |
| 5 to 9 Years | 57 (12.3%) | 32 (8.9%) |
| 10 to 14 Years | 43 (9.3%) | 39 (10.8%) |
| 15 to 19 Years | 56 (12.1%) | 55 (15.2%) |
| 20 to 24 Years | 33 (7.1%) | 35 (9.7%) |
| 25 to 29 Years | 41 (8.9%) | 20 (5.5%) |
| 30 to 34 Years | 48 (10.4%) | 43 (11.9%) |
| 35 to 39 Years | 26 (5.6%) | 12 (3.3%) |
| 40 to 44 Years | 22 (4.8%) | 8 (2.2%) |
| 45 to 49 Years | 14 (3.0%) | 7 (1.9%) |
| 50 to 54 Years | 14 (3.0%) | 18 (5.0%) |
| 55 to 59 Years | 22 (4.8%) | 20 (5.5%) |
| 60 to 64 Years | 17 (3.7%) | 5 (1.4%) |
| 65 to 69 Years | 5 (1.1%) | 12 (3.3%) |
| 70 to 74 Years | 12 (2.6%) | 8 (2.2%) |
| 75 to 79 Years | 8 (1.7%) | 5 (1.4%) |
| 80 to 84 Years | 9 (1.9%) | 3 (0.8%) |
| 85 Years and over | 0 (0.0%) | 8 (2.2%) |
| Total | 462 (100.0%) | 361 (100.0%) |
Families and Households in Savoonga
Median Family Size in Savoonga
The median family size in Savoonga is 4.99 persons per family, with married-couple families (48 | 32.7%) accounting for the largest median family size of 6.27 persons per family. On the other hand, single male/father families (63 | 42.9%) represent the smallest median family size with 3.76 persons per family.
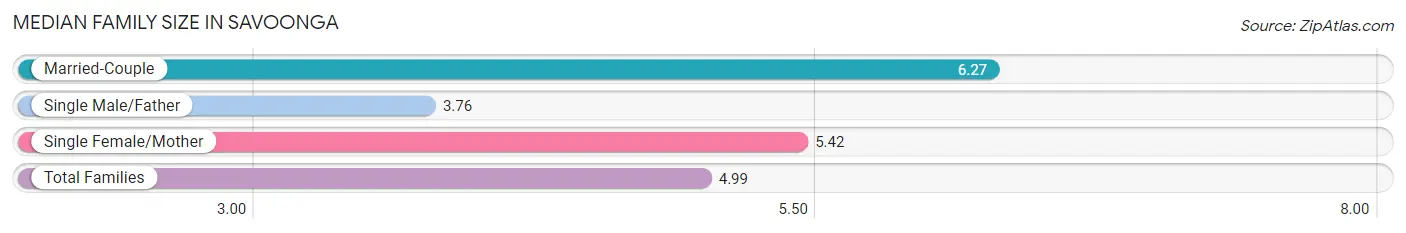
| Family Type | # Families | Family Size |
| Married-Couple | 48 (32.7%) | 6.27 |
| Single Male/Father | 63 (42.9%) | 3.76 |
| Single Female/Mother | 36 (24.5%) | 5.42 |
| Total Families | 147 (100.0%) | 4.99 |
Median Household Size in Savoonga
The median household size in Savoonga is 4.84 persons per household, with married-couple households (48 | 29.1%) accounting for the largest median household size of 6.69 persons per household. non-family households (18 | 10.9%) represent the smallest median household size with 1.06 persons per household.
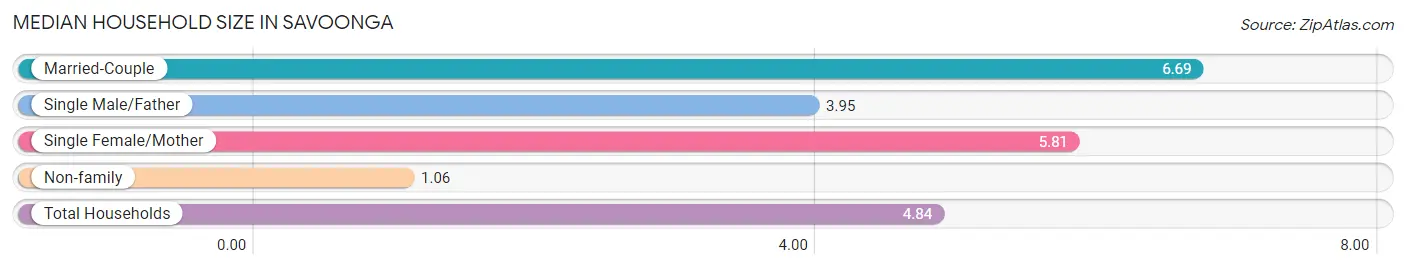
| Household Type | # Households | Household Size |
| Married-Couple | 48 (29.1%) | 6.69 |
| Single Male/Father | 63 (38.2%) | 3.95 |
| Single Female/Mother | 36 (21.8%) | 5.81 |
| Non-family | 18 (10.9%) | 1.06 |
| Total Households | 165 (100.0%) | 4.84 |
Household Size by Marriage Status in Savoonga
Out of a total of 165 households in Savoonga, 147 (89.1%) are family households, while 18 (10.9%) are nonfamily households. The most numerous type of family households are 7+ person households, comprising 58, and the most common type of nonfamily households are 1-person households, comprising 14.
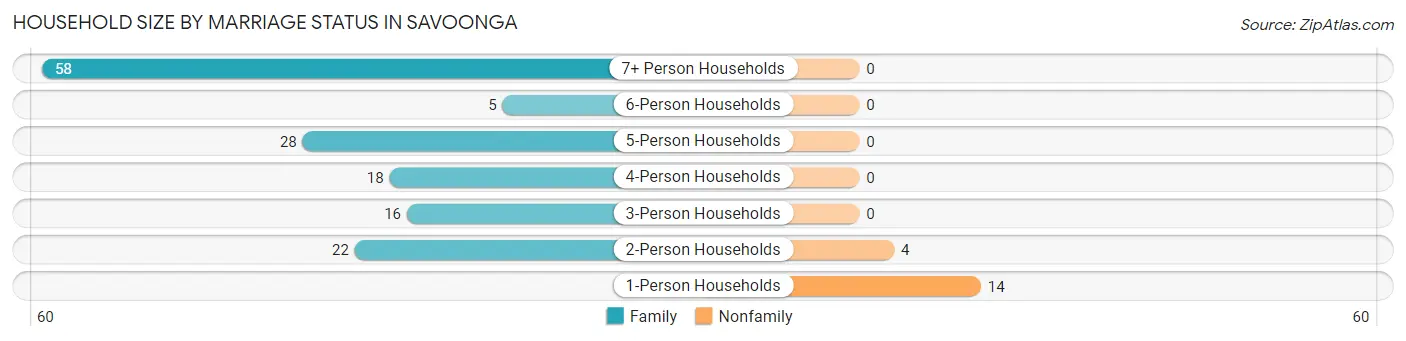
| Household Size | Family Households | Nonfamily Households |
| 1-Person Households | - | 14 (8.5%) |
| 2-Person Households | 22 (13.3%) | 4 (2.4%) |
| 3-Person Households | 16 (9.7%) | 0 (0.0%) |
| 4-Person Households | 18 (10.9%) | 0 (0.0%) |
| 5-Person Households | 28 (17.0%) | 0 (0.0%) |
| 6-Person Households | 5 (3.0%) | 0 (0.0%) |
| 7+ Person Households | 58 (35.1%) | 0 (0.0%) |
| Total | 147 (89.1%) | 18 (10.9%) |
Female Fertility in Savoonga
Fertility by Age in Savoonga
Average fertility rate in Savoonga is 38.0 births per 1,000 women. Women in the age bracket of 35 to 50 years have the highest fertility rate with 91.0 births per 1,000 women. Women in the age bracket of 20 to 34 years acount for 57.1% of all women with births.
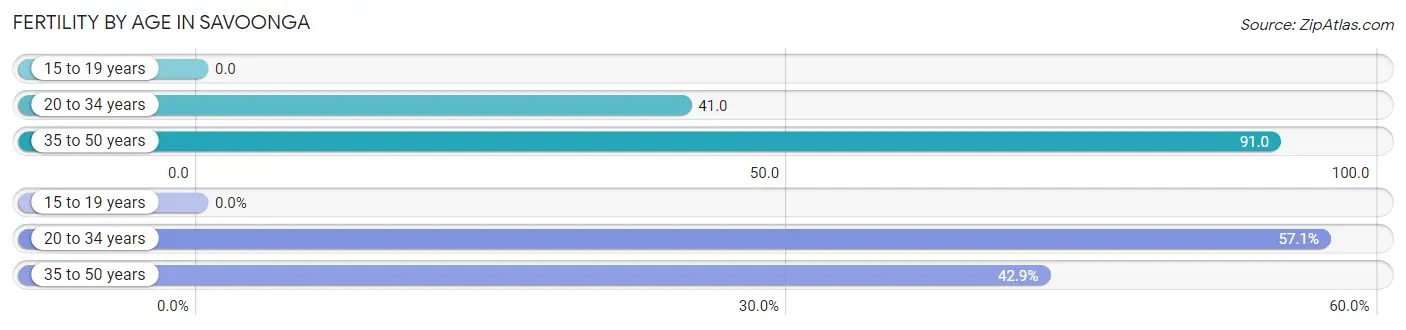
| Age Bracket | Women with Births | Births / 1,000 Women |
| 15 to 19 years | 0 (0.0%) | 0.0 |
| 20 to 34 years | 4 (57.1%) | 41.0 |
| 35 to 50 years | 3 (42.9%) | 91.0 |
| Total | 7 (100.0%) | 38.0 |
Fertility by Age by Marriage Status in Savoonga
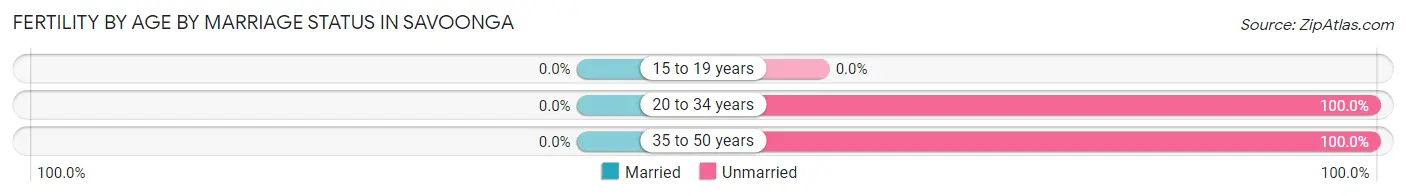
| Age Bracket | Married | Unmarried |
| 15 to 19 years | 0 (0.0%) | 0 (0.0%) |
| 20 to 34 years | 0 (0.0%) | 4 (100.0%) |
| 35 to 50 years | 0 (0.0%) | 3 (100.0%) |
| Total | 0 (0.0%) | 7 (100.0%) |
Fertility by Education in Savoonga
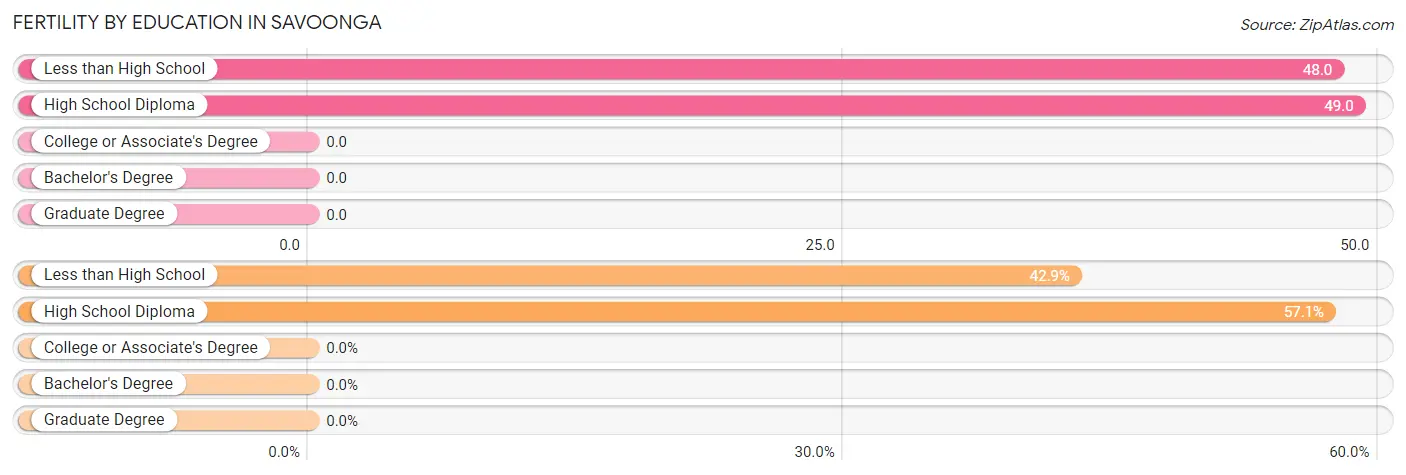
| Educational Attainment | Women with Births | Births / 1,000 Women |
| Less than High School | 3 (42.9%) | 48.0 |
| High School Diploma | 4 (57.1%) | 49.0 |
| College or Associate's Degree | 0 (0.0%) | 0.0 |
| Bachelor's Degree | 0 (0.0%) | 0.0 |
| Graduate Degree | 0 (0.0%) | 0.0 |
| Total | 7 (100.0%) | 38.0 |
Fertility by Education by Marriage Status in Savoonga
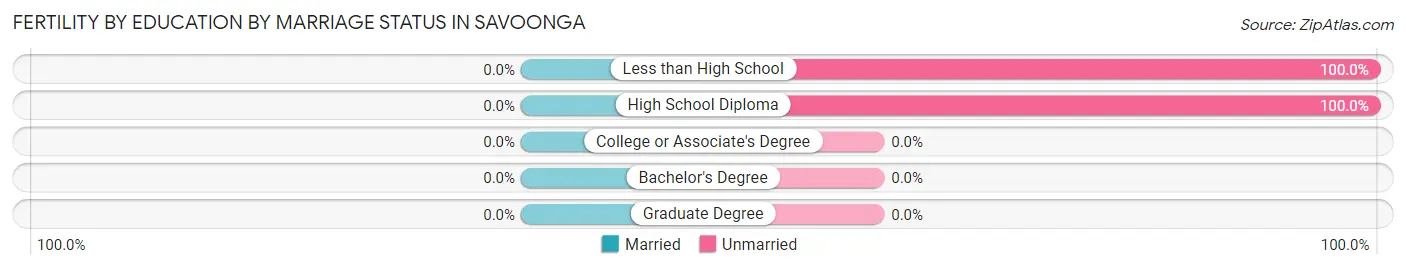
| Educational Attainment | Married | Unmarried |
| Less than High School | 0 (0.0%) | 3 (100.0%) |
| High School Diploma | 0 (0.0%) | 4 (100.0%) |
| College or Associate's Degree | 0 (0.0%) | 0 (0.0%) |
| Bachelor's Degree | 0 (0.0%) | 0 (0.0%) |
| Graduate Degree | 0 (0.0%) | 0 (0.0%) |
| Total | 0 (0.0%) | 7 (100.0%) |
Employment Characteristics in Savoonga
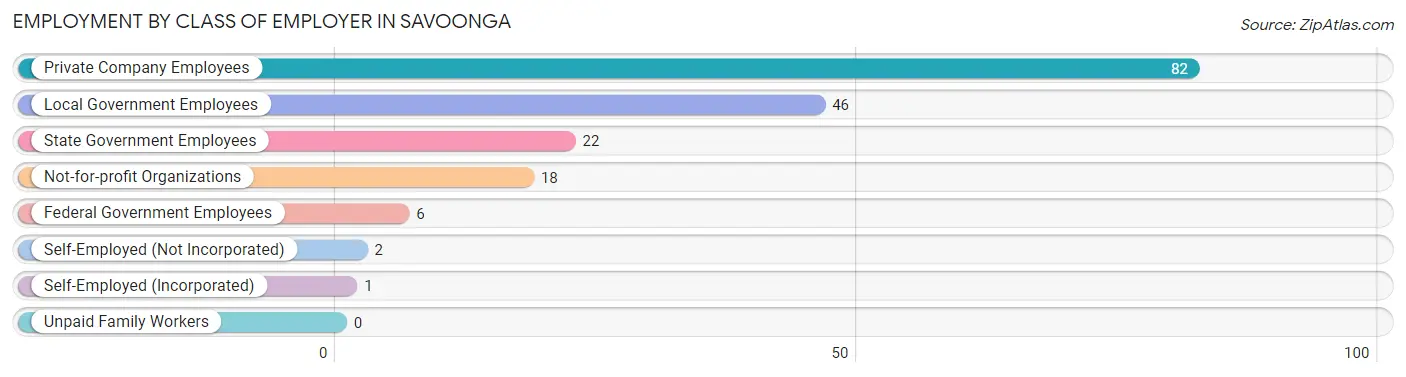
Employment by Class of Employer in Savoonga
Among the 177 employed individuals in Savoonga, private company employees (82 | 46.3%), local government employees (46 | 26.0%), and state government employees (22 | 12.4%) make up the most common classes of employment.
| Employer Class | # Employees | % Employees |
| Private Company Employees | 82 | 46.3% |
| Self-Employed (Incorporated) | 1 | 0.6% |
| Self-Employed (Not Incorporated) | 2 | 1.1% |
| Not-for-profit Organizations | 18 | 10.2% |
| Local Government Employees | 46 | 26.0% |
| State Government Employees | 22 | 12.4% |
| Federal Government Employees | 6 | 3.4% |
| Unpaid Family Workers | 0 | 0.0% |
| Total | 177 | 100.0% |
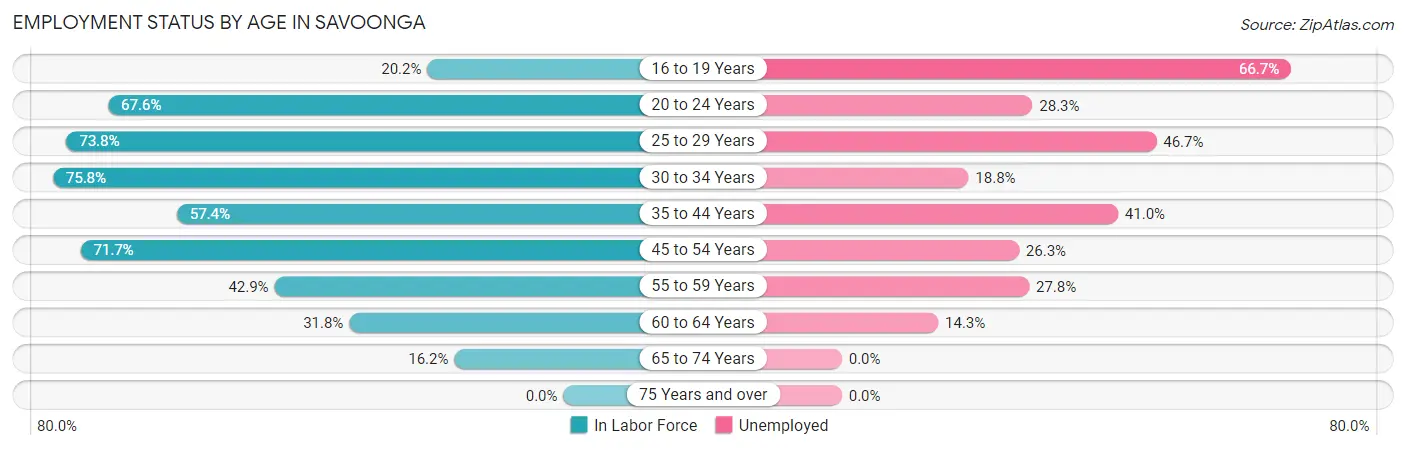
Employment Status by Age in Savoonga
According to the labor force statistics for Savoonga, out of the total population over 16 years of age (564), 50.7% or 286 individuals are in the labor force, with 31.8% or 91 of them unemployed. The age group with the highest labor force participation rate is 30 to 34 years, with 75.8% or 69 individuals in the labor force. Within the labor force, the 16 to 19 years age range has the highest percentage of unemployed individuals, with 66.7% or 12 of them being unemployed.
| Age Bracket | In Labor Force | Unemployed |
| 16 to 19 Years | 18 (20.2%) | 12 (66.7%) |
| 20 to 24 Years | 46 (67.6%) | 13 (28.3%) |
| 25 to 29 Years | 45 (73.8%) | 21 (46.7%) |
| 30 to 34 Years | 69 (75.8%) | 13 (18.8%) |
| 35 to 44 Years | 39 (57.4%) | 16 (41.0%) |
| 45 to 54 Years | 38 (71.7%) | 10 (26.3%) |
| 55 to 59 Years | 18 (42.9%) | 5 (27.8%) |
| 60 to 64 Years | 7 (31.8%) | 1 (14.3%) |
| 65 to 74 Years | 6 (16.2%) | 0 (0.0%) |
| 75 Years and over | 0 (0.0%) | 0 (0.0%) |
| Total | 286 (50.7%) | 91 (31.8%) |
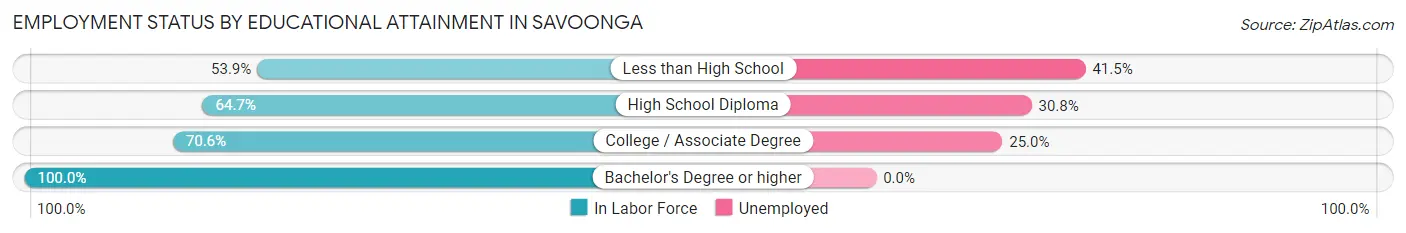
Employment Status by Educational Attainment in Savoonga
According to labor force statistics for Savoonga, 64.1% of individuals (216) out of the total population between 25 and 64 years of age (337) are in the labor force, with 30.6% or 66 of them being unemployed. The group with the highest labor force participation rate are those with the educational attainment of bachelor's degree or higher, with 100.0% or 9 individuals in the labor force. Within the labor force, individuals with less than high school education have the highest percentage of unemployment, with 41.5% or 17 of them being unemployed.
| Educational Attainment | In Labor Force | Unemployed |
| Less than High School | 41 (53.9%) | 32 (41.5%) |
| High School Diploma | 130 (64.7%) | 62 (30.8%) |
| College / Associate Degree | 36 (70.6%) | 13 (25.0%) |
| Bachelor's Degree or higher | 9 (100.0%) | 0 (0.0%) |
| Total | 216 (64.1%) | 103 (30.6%) |
Employment Occupations by Sex in Savoonga
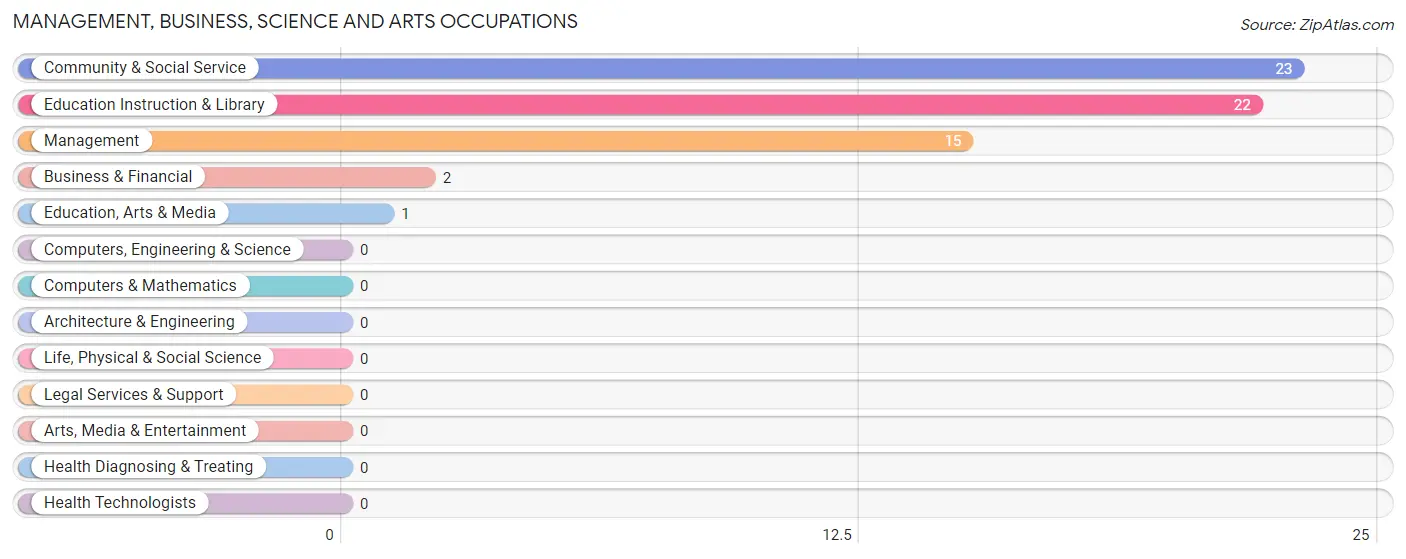
Management, Business, Science and Arts Occupations
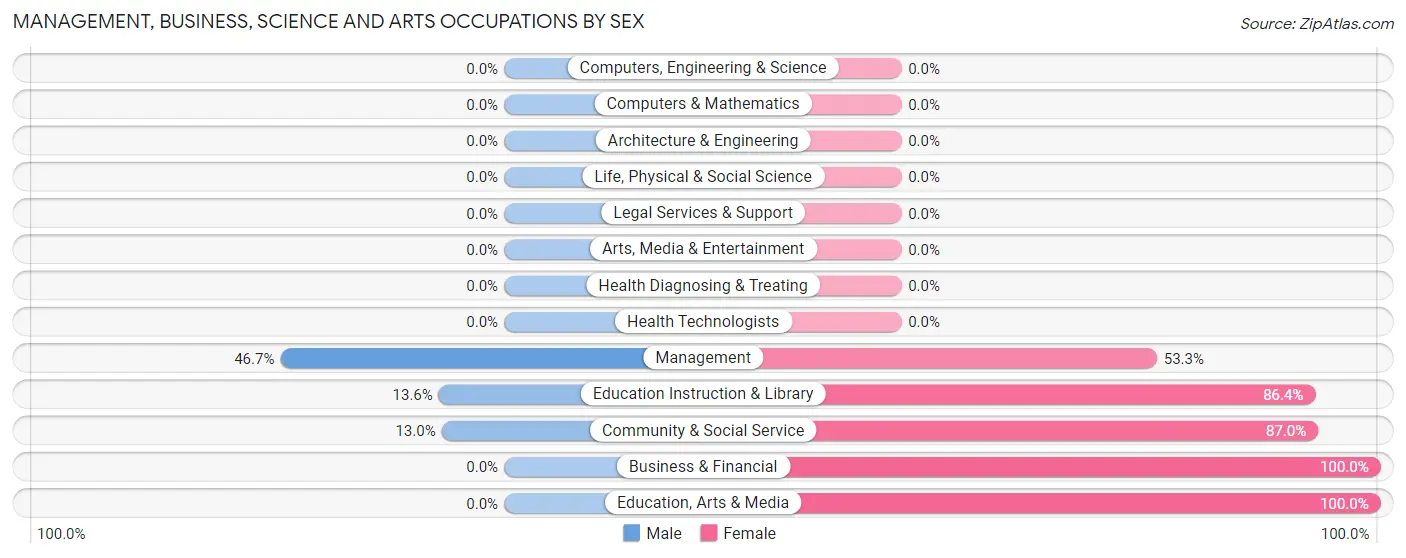
The most common Management, Business, Science and Arts occupations in Savoonga are Community & Social Service (23 | 11.8%), Education Instruction & Library (22 | 11.3%), Management (15 | 7.7%), Business & Financial (2 | 1.0%), and Education, Arts & Media (1 | 0.5%).
Management, Business, Science and Arts Occupations by Sex
Within the Management, Business, Science and Arts occupations in Savoonga, the most male-oriented occupations are Management (46.7%), Education Instruction & Library (13.6%), and Community & Social Service (13.0%), while the most female-oriented occupations are Business & Financial (100.0%), Education, Arts & Media (100.0%), and Community & Social Service (87.0%).
| Occupation | Male | Female |
| Management | 7 (46.7%) | 8 (53.3%) |
| Business & Financial | 0 (0.0%) | 2 (100.0%) |
| Computers, Engineering & Science | 0 (0.0%) | 0 (0.0%) |
| Computers & Mathematics | 0 (0.0%) | 0 (0.0%) |
| Architecture & Engineering | 0 (0.0%) | 0 (0.0%) |
| Life, Physical & Social Science | 0 (0.0%) | 0 (0.0%) |
| Community & Social Service | 3 (13.0%) | 20 (87.0%) |
| Education, Arts & Media | 0 (0.0%) | 1 (100.0%) |
| Legal Services & Support | 0 (0.0%) | 0 (0.0%) |
| Education Instruction & Library | 3 (13.6%) | 19 (86.4%) |
| Arts, Media & Entertainment | 0 (0.0%) | 0 (0.0%) |
| Health Diagnosing & Treating | 0 (0.0%) | 0 (0.0%) |
| Health Technologists | 0 (0.0%) | 0 (0.0%) |
| Total (Category) | 10 (25.0%) | 30 (75.0%) |
| Total (Overall) | 118 (60.5%) | 77 (39.5%) |
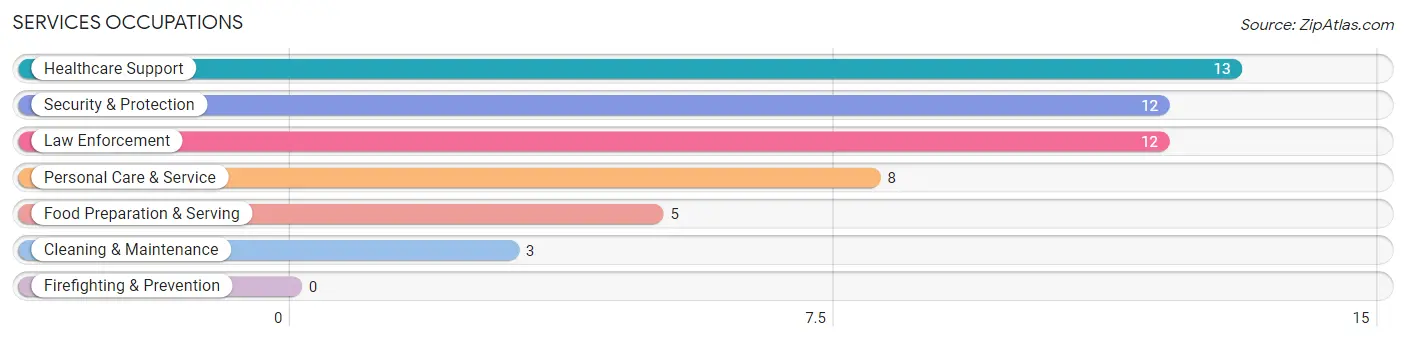
Services Occupations
The most common Services occupations in Savoonga are Healthcare Support (13 | 6.7%), Security & Protection (12 | 6.1%), Law Enforcement (12 | 6.1%), Personal Care & Service (8 | 4.1%), and Food Preparation & Serving (5 | 2.6%).
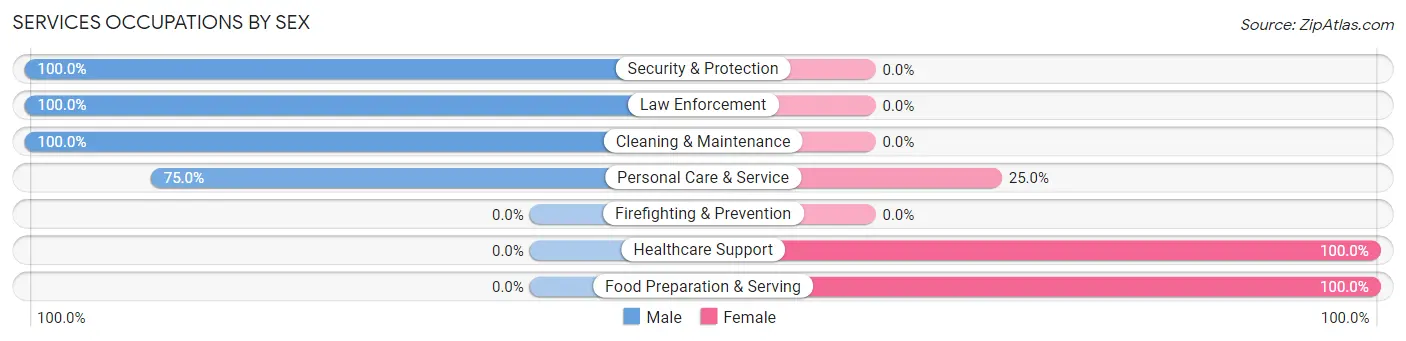
Services Occupations by Sex
Within the Services occupations in Savoonga, the most male-oriented occupations are Security & Protection (100.0%), Law Enforcement (100.0%), and Cleaning & Maintenance (100.0%), while the most female-oriented occupations are Healthcare Support (100.0%), Food Preparation & Serving (100.0%), and Personal Care & Service (25.0%).
| Occupation | Male | Female |
| Healthcare Support | 0 (0.0%) | 13 (100.0%) |
| Security & Protection | 12 (100.0%) | 0 (0.0%) |
| Firefighting & Prevention | 0 (0.0%) | 0 (0.0%) |
| Law Enforcement | 12 (100.0%) | 0 (0.0%) |
| Food Preparation & Serving | 0 (0.0%) | 5 (100.0%) |
| Cleaning & Maintenance | 3 (100.0%) | 0 (0.0%) |
| Personal Care & Service | 6 (75.0%) | 2 (25.0%) |
| Total (Category) | 21 (51.2%) | 20 (48.8%) |
| Total (Overall) | 118 (60.5%) | 77 (39.5%) |
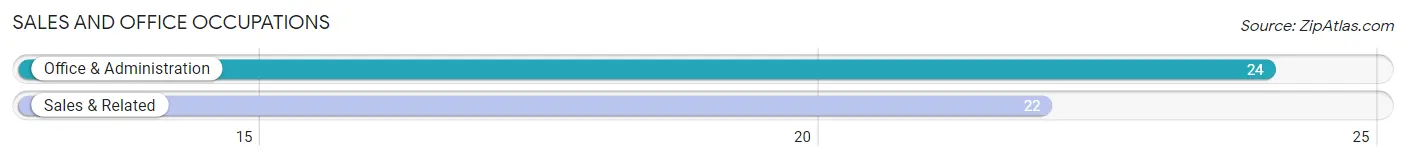
Sales and Office Occupations
The most common Sales and Office occupations in Savoonga are Office & Administration (24 | 12.3%), and Sales & Related (22 | 11.3%).
Sales and Office Occupations by Sex
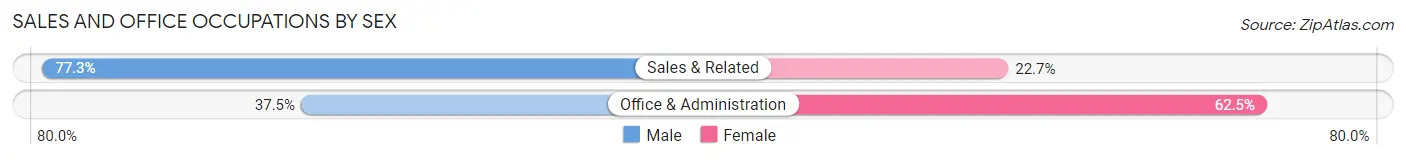
| Occupation | Male | Female |
| Sales & Related | 17 (77.3%) | 5 (22.7%) |
| Office & Administration | 9 (37.5%) | 15 (62.5%) |
| Total (Category) | 26 (56.5%) | 20 (43.5%) |
| Total (Overall) | 118 (60.5%) | 77 (39.5%) |
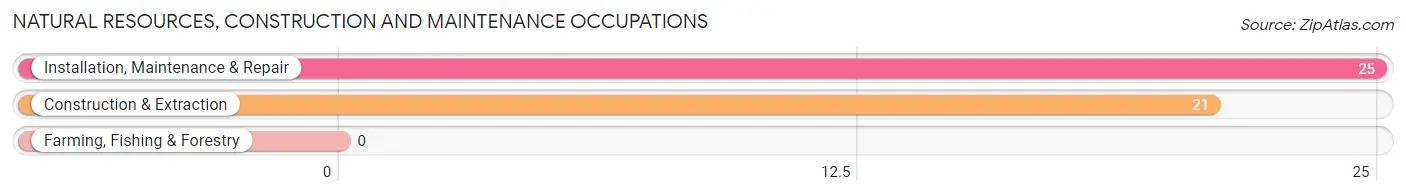
Natural Resources, Construction and Maintenance Occupations
The most common Natural Resources, Construction and Maintenance occupations in Savoonga are Installation, Maintenance & Repair (25 | 12.8%), and Construction & Extraction (21 | 10.8%).
Natural Resources, Construction and Maintenance Occupations by Sex
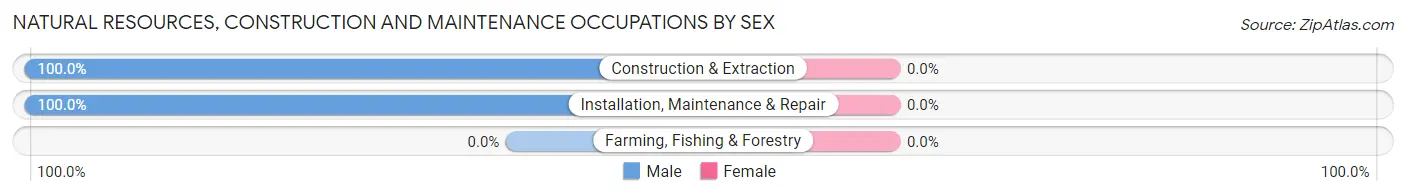
| Occupation | Male | Female |
| Farming, Fishing & Forestry | 0 (0.0%) | 0 (0.0%) |
| Construction & Extraction | 21 (100.0%) | 0 (0.0%) |
| Installation, Maintenance & Repair | 25 (100.0%) | 0 (0.0%) |
| Total (Category) | 46 (100.0%) | 0 (0.0%) |
| Total (Overall) | 118 (60.5%) | 77 (39.5%) |
Production, Transportation and Moving Occupations
The most common Production, Transportation and Moving occupations in Savoonga are Material Moving (11 | 5.6%), Production (9 | 4.6%), and Transportation (2 | 1.0%).
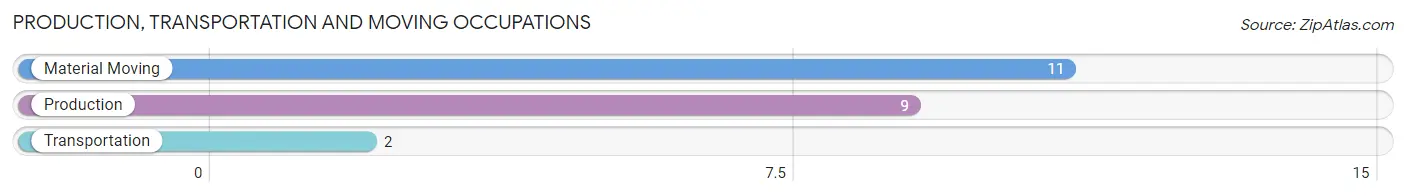
Production, Transportation and Moving Occupations by Sex
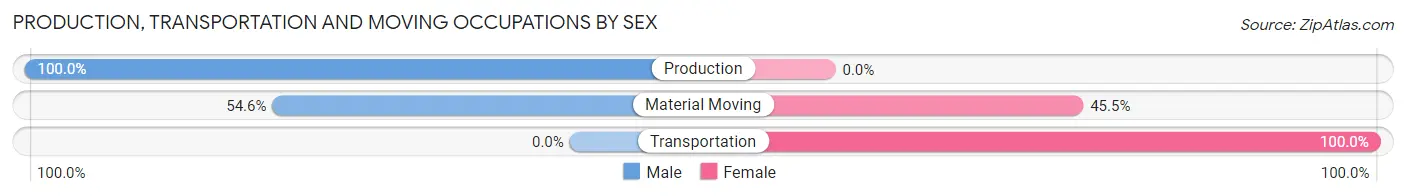
| Occupation | Male | Female |
| Production | 9 (100.0%) | 0 (0.0%) |
| Transportation | 0 (0.0%) | 2 (100.0%) |
| Material Moving | 6 (54.5%) | 5 (45.5%) |
| Total (Category) | 15 (68.2%) | 7 (31.8%) |
| Total (Overall) | 118 (60.5%) | 77 (39.5%) |
Employment Industries by Sex in Savoonga
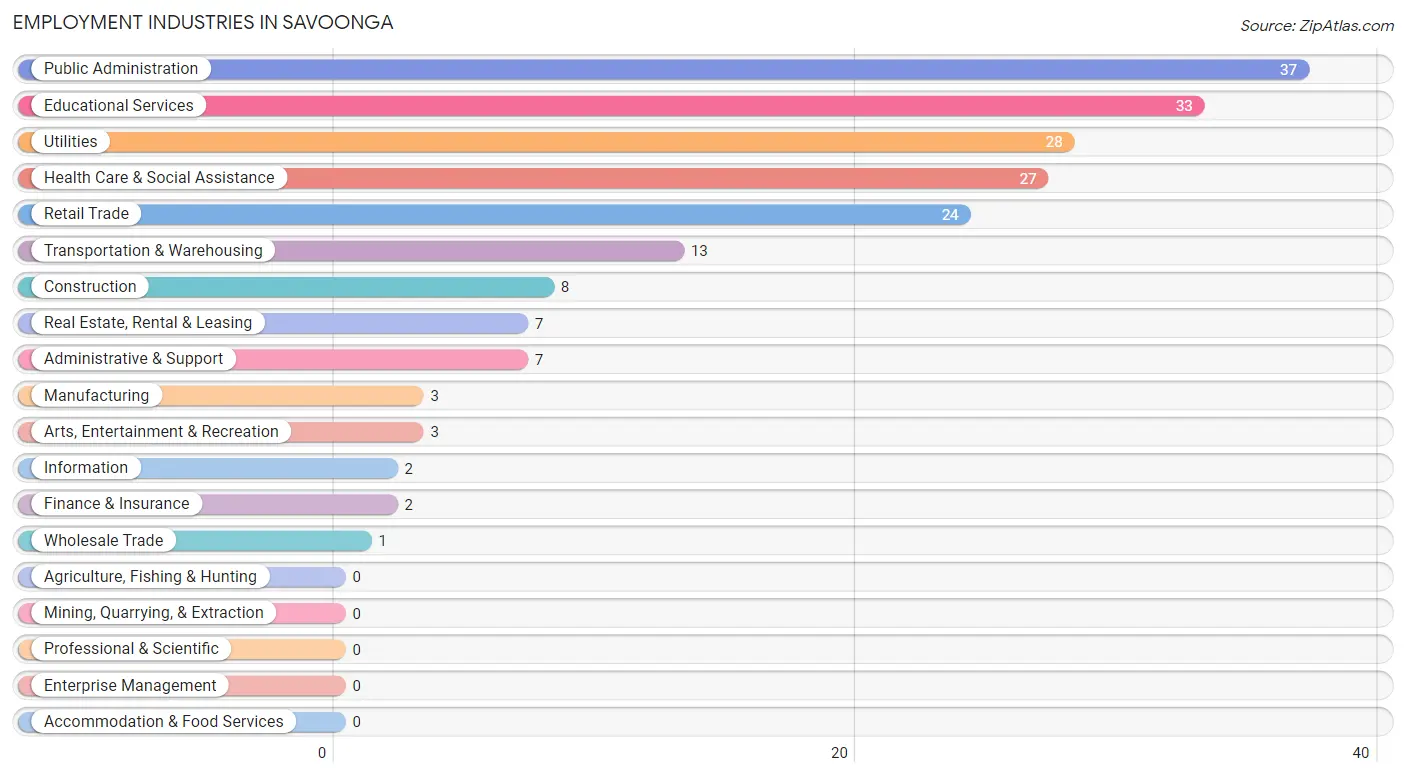
Employment Industries in Savoonga
The major employment industries in Savoonga include Public Administration (37 | 19.0%), Educational Services (33 | 16.9%), Utilities (28 | 14.4%), Health Care & Social Assistance (27 | 13.9%), and Retail Trade (24 | 12.3%).
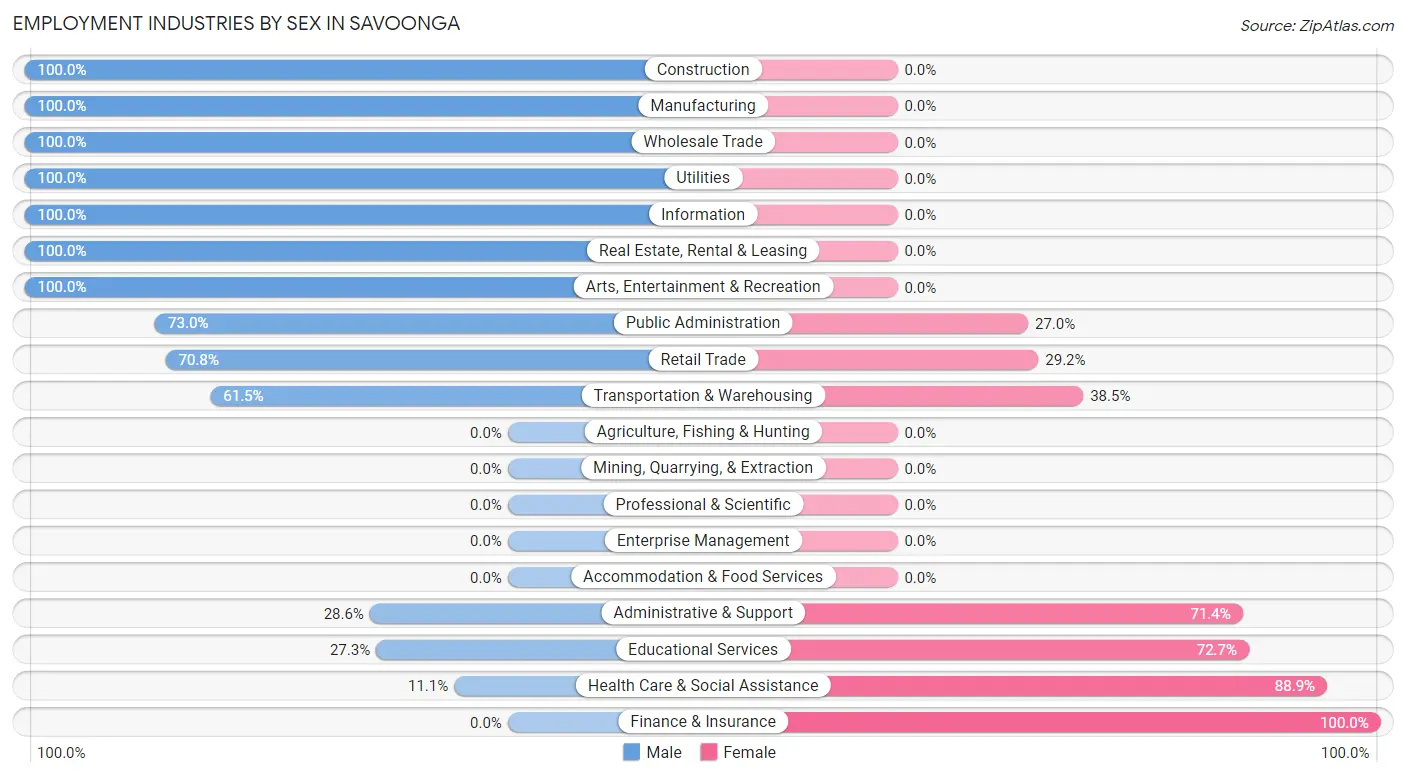
Employment Industries by Sex in Savoonga
The Savoonga industries that see more men than women are Construction (100.0%), Manufacturing (100.0%), and Wholesale Trade (100.0%), whereas the industries that tend to have a higher number of women are Finance & Insurance (100.0%), Health Care & Social Assistance (88.9%), and Educational Services (72.7%).
| Industry | Male | Female |
| Agriculture, Fishing & Hunting | 0 (0.0%) | 0 (0.0%) |
| Mining, Quarrying, & Extraction | 0 (0.0%) | 0 (0.0%) |
| Construction | 8 (100.0%) | 0 (0.0%) |
| Manufacturing | 3 (100.0%) | 0 (0.0%) |
| Wholesale Trade | 1 (100.0%) | 0 (0.0%) |
| Retail Trade | 17 (70.8%) | 7 (29.2%) |
| Transportation & Warehousing | 8 (61.5%) | 5 (38.5%) |
| Utilities | 28 (100.0%) | 0 (0.0%) |
| Information | 2 (100.0%) | 0 (0.0%) |
| Finance & Insurance | 0 (0.0%) | 2 (100.0%) |
| Real Estate, Rental & Leasing | 7 (100.0%) | 0 (0.0%) |
| Professional & Scientific | 0 (0.0%) | 0 (0.0%) |
| Enterprise Management | 0 (0.0%) | 0 (0.0%) |
| Administrative & Support | 2 (28.6%) | 5 (71.4%) |
| Educational Services | 9 (27.3%) | 24 (72.7%) |
| Health Care & Social Assistance | 3 (11.1%) | 24 (88.9%) |
| Arts, Entertainment & Recreation | 3 (100.0%) | 0 (0.0%) |
| Accommodation & Food Services | 0 (0.0%) | 0 (0.0%) |
| Public Administration | 27 (73.0%) | 10 (27.0%) |
| Total | 118 (60.5%) | 77 (39.5%) |
Education in Savoonga
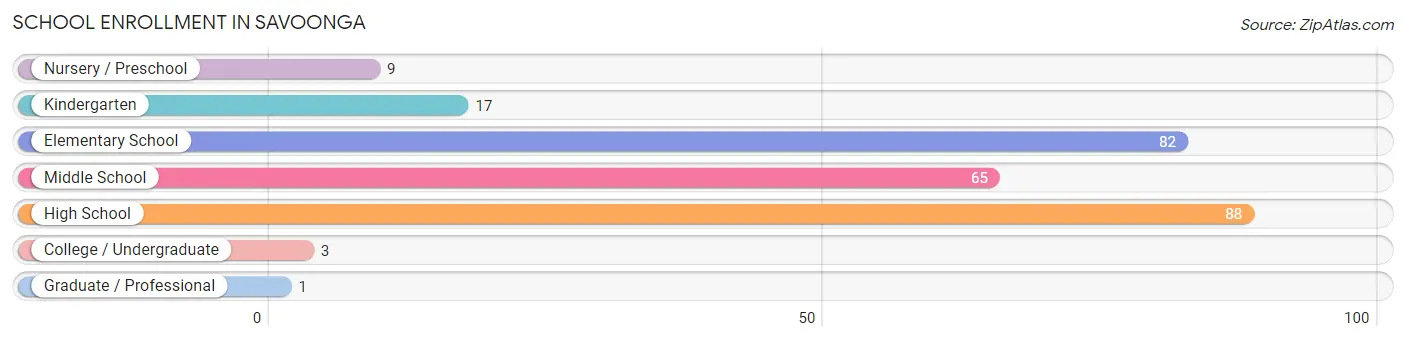
School Enrollment in Savoonga
The most common levels of schooling among the 265 students in Savoonga are high school (88 | 33.2%), elementary school (82 | 30.9%), and middle school (65 | 24.5%).
| School Level | # Students | % Students |
| Nursery / Preschool | 9 | 3.4% |
| Kindergarten | 17 | 6.4% |
| Elementary School | 82 | 30.9% |
| Middle School | 65 | 24.5% |
| High School | 88 | 33.2% |
| College / Undergraduate | 3 | 1.1% |
| Graduate / Professional | 1 | 0.4% |
| Total | 265 | 100.0% |
School Enrollment by Age by Funding Source in Savoonga
Out of a total of 265 students who are enrolled in schools in Savoonga, 2 (0.8%) attend a private institution, while the remaining 263 (99.2%) are enrolled in public schools. The age group of 20 to 24 year olds has the highest likelihood of being enrolled in private schools, with 2 (100.0% in the age bracket) enrolled. Conversely, the age group of 3 to 4 year olds has the lowest likelihood of being enrolled in a private school, with 12 (100.0% in the age bracket) attending a public institution.
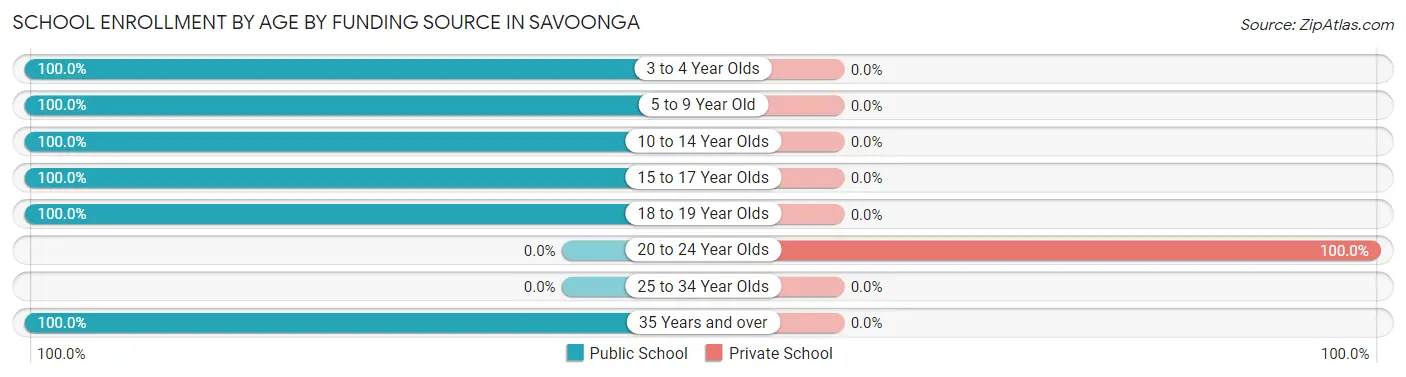
| Age Bracket | Public School | Private School |
| 3 to 4 Year Olds | 12 (100.0%) | 0 (0.0%) |
| 5 to 9 Year Old | 86 (100.0%) | 0 (0.0%) |
| 10 to 14 Year Olds | 81 (100.0%) | 0 (0.0%) |
| 15 to 17 Year Olds | 63 (100.0%) | 0 (0.0%) |
| 18 to 19 Year Olds | 17 (100.0%) | 0 (0.0%) |
| 20 to 24 Year Olds | 0 (0.0%) | 2 (100.0%) |
| 25 to 34 Year Olds | 0 (0.0%) | 0 (0.0%) |
| 35 Years and over | 4 (100.0%) | 0 (0.0%) |
| Total | 263 (99.2%) | 2 (0.8%) |
Educational Attainment by Field of Study in Savoonga
Bio, nature & agricultural (4 | 28.6%), psychology (3 | 21.4%), literature & languages (3 | 21.4%), business (2 | 14.3%), and engineering (1 | 7.1%) are the most common fields of study among 14 individuals in Savoonga who have obtained a bachelor's degree or higher.

| Field of Study | # Graduates | % Graduates |
| Computers & Mathematics | 0 | 0.0% |
| Bio, Nature & Agricultural | 4 | 28.6% |
| Physical & Health Sciences | 0 | 0.0% |
| Psychology | 3 | 21.4% |
| Social Sciences | 0 | 0.0% |
| Engineering | 1 | 7.1% |
| Multidisciplinary Studies | 0 | 0.0% |
| Science & Technology | 0 | 0.0% |
| Business | 2 | 14.3% |
| Education | 0 | 0.0% |
| Literature & Languages | 3 | 21.4% |
| Liberal Arts & History | 0 | 0.0% |
| Visual & Performing Arts | 0 | 0.0% |
| Communications | 0 | 0.0% |
| Arts & Humanities | 1 | 7.1% |
| Total | 14 | 100.0% |
Transportation & Commute in Savoonga
Vehicle Availability by Sex in Savoonga
The most prevalent vehicle ownership categories in Savoonga are males with no vehicle (89, accounting for 96.7%) and females with no vehicle (57, making up 148.3%).
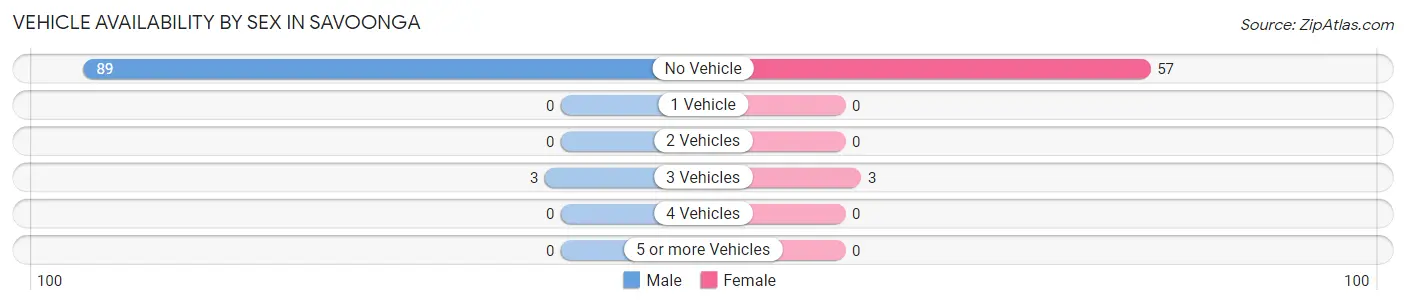
| Vehicles Available | Male | Female |
| No Vehicle | 89 (96.7%) | 57 (95.0%) |
| 1 Vehicle | 0 (0.0%) | 0 (0.0%) |
| 2 Vehicles | 0 (0.0%) | 0 (0.0%) |
| 3 Vehicles | 3 (3.3%) | 3 (5.0%) |
| 4 Vehicles | 0 (0.0%) | 0 (0.0%) |
| 5 or more Vehicles | 0 (0.0%) | 0 (0.0%) |
| Total | 92 (100.0%) | 60 (100.0%) |
Commute Time in Savoonga
The most frequently occuring commute durations in Savoonga are less than 5 minutes (75 commuters, 43.1%), 5 to 9 minutes (53 commuters, 30.5%), and 10 to 14 minutes (38 commuters, 21.8%).
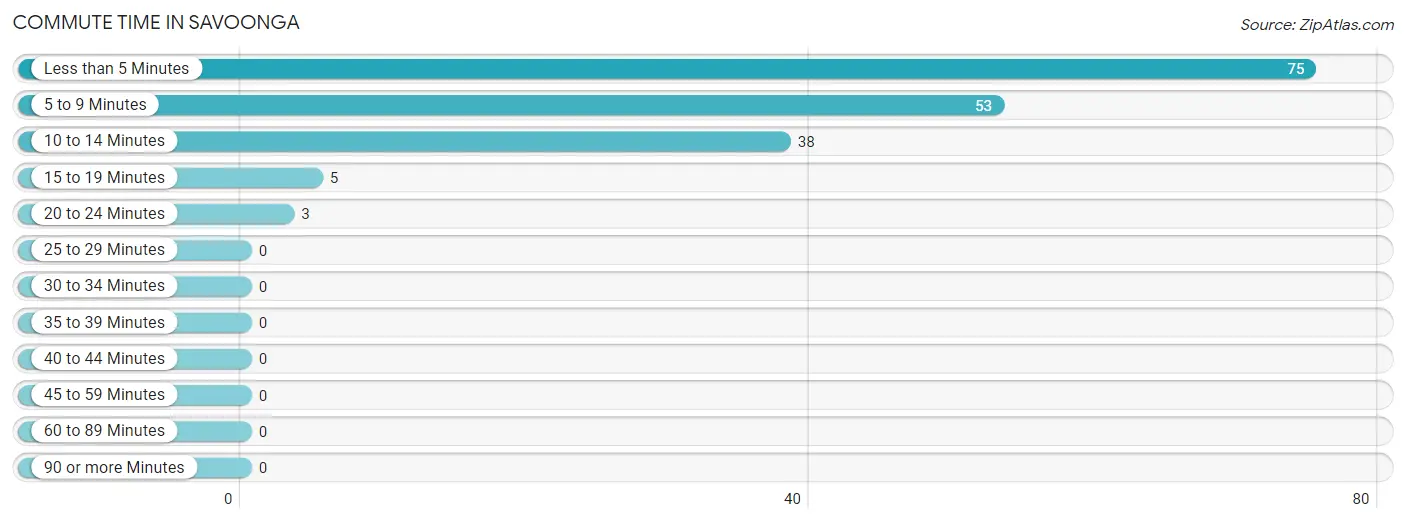
| Commute Time | # Commuters | % Commuters |
| Less than 5 Minutes | 75 | 43.1% |
| 5 to 9 Minutes | 53 | 30.5% |
| 10 to 14 Minutes | 38 | 21.8% |
| 15 to 19 Minutes | 5 | 2.9% |
| 20 to 24 Minutes | 3 | 1.7% |
| 25 to 29 Minutes | 0 | 0.0% |
| 30 to 34 Minutes | 0 | 0.0% |
| 35 to 39 Minutes | 0 | 0.0% |
| 40 to 44 Minutes | 0 | 0.0% |
| 45 to 59 Minutes | 0 | 0.0% |
| 60 to 89 Minutes | 0 | 0.0% |
| 90 or more Minutes | 0 | 0.0% |
Commute Time by Sex in Savoonga
The most common commute times in Savoonga are less than 5 minutes (46 commuters, 40.4%) for males and less than 5 minutes (29 commuters, 48.3%) for females.
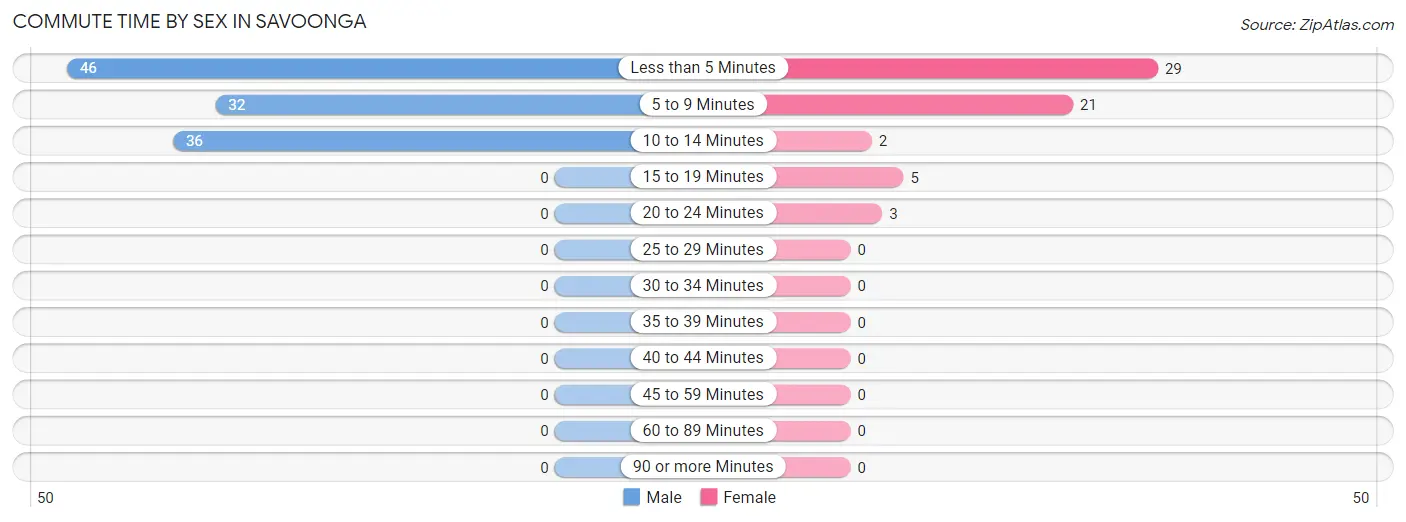
| Commute Time | Male | Female |
| Less than 5 Minutes | 46 (40.4%) | 29 (48.3%) |
| 5 to 9 Minutes | 32 (28.1%) | 21 (35.0%) |
| 10 to 14 Minutes | 36 (31.6%) | 2 (3.3%) |
| 15 to 19 Minutes | 0 (0.0%) | 5 (8.3%) |
| 20 to 24 Minutes | 0 (0.0%) | 3 (5.0%) |
| 25 to 29 Minutes | 0 (0.0%) | 0 (0.0%) |
| 30 to 34 Minutes | 0 (0.0%) | 0 (0.0%) |
| 35 to 39 Minutes | 0 (0.0%) | 0 (0.0%) |
| 40 to 44 Minutes | 0 (0.0%) | 0 (0.0%) |
| 45 to 59 Minutes | 0 (0.0%) | 0 (0.0%) |
| 60 to 89 Minutes | 0 (0.0%) | 0 (0.0%) |
| 90 or more Minutes | 0 (0.0%) | 0 (0.0%) |
Time of Departure to Work by Sex in Savoonga
The most frequent times of departure to work in Savoonga are 8:30 AM to 8:59 AM (41, 36.0%) for males and 8:30 AM to 8:59 AM (21, 35.0%) for females.
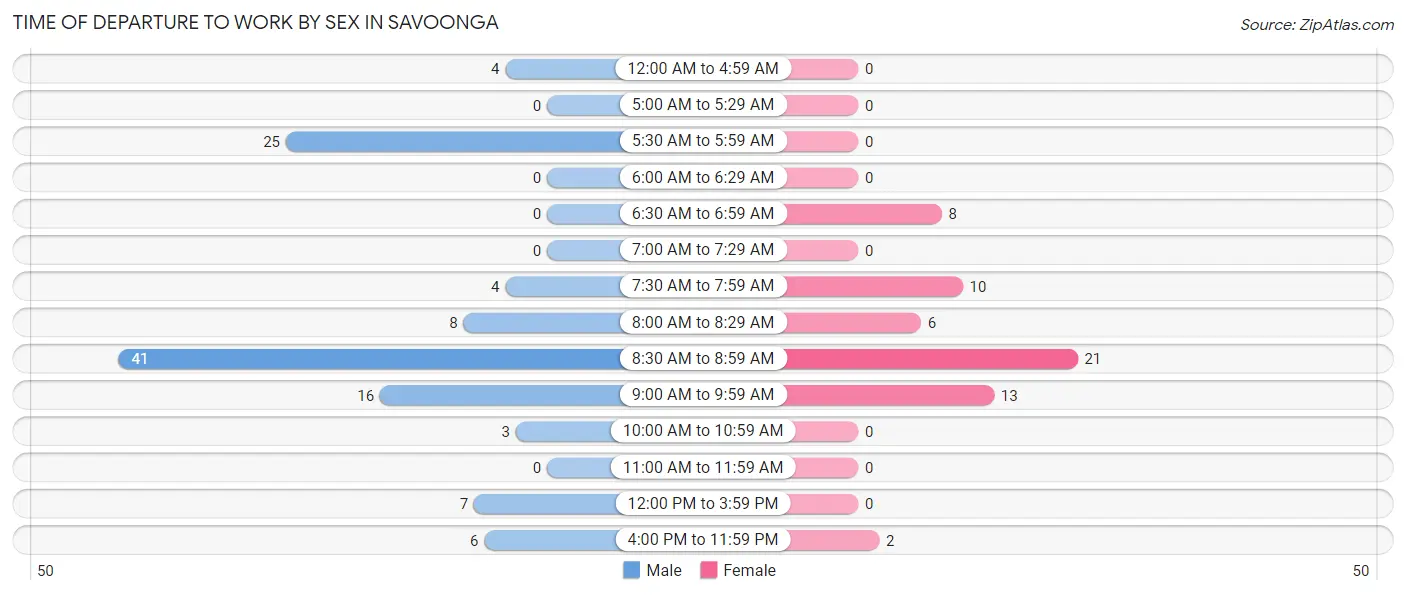
| Time of Departure | Male | Female |
| 12:00 AM to 4:59 AM | 4 (3.5%) | 0 (0.0%) |
| 5:00 AM to 5:29 AM | 0 (0.0%) | 0 (0.0%) |
| 5:30 AM to 5:59 AM | 25 (21.9%) | 0 (0.0%) |
| 6:00 AM to 6:29 AM | 0 (0.0%) | 0 (0.0%) |
| 6:30 AM to 6:59 AM | 0 (0.0%) | 8 (13.3%) |
| 7:00 AM to 7:29 AM | 0 (0.0%) | 0 (0.0%) |
| 7:30 AM to 7:59 AM | 4 (3.5%) | 10 (16.7%) |
| 8:00 AM to 8:29 AM | 8 (7.0%) | 6 (10.0%) |
| 8:30 AM to 8:59 AM | 41 (36.0%) | 21 (35.0%) |
| 9:00 AM to 9:59 AM | 16 (14.0%) | 13 (21.7%) |
| 10:00 AM to 10:59 AM | 3 (2.6%) | 0 (0.0%) |
| 11:00 AM to 11:59 AM | 0 (0.0%) | 0 (0.0%) |
| 12:00 PM to 3:59 PM | 7 (6.1%) | 0 (0.0%) |
| 4:00 PM to 11:59 PM | 6 (5.3%) | 2 (3.3%) |
| Total | 114 (100.0%) | 60 (100.0%) |
Housing Occupancy in Savoonga
Occupancy by Ownership in Savoonga
Of the total 165 dwellings in Savoonga, owner-occupied units account for 150 (90.9%), while renter-occupied units make up 15 (9.1%).
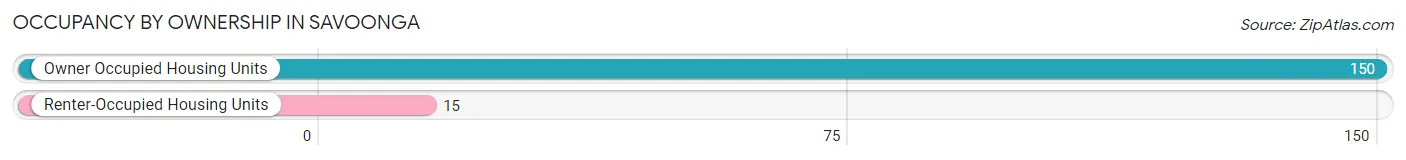
| Occupancy | # Housing Units | % Housing Units |
| Owner Occupied Housing Units | 150 | 90.9% |
| Renter-Occupied Housing Units | 15 | 9.1% |
| Total Occupied Housing Units | 165 | 100.0% |
Occupancy by Household Size in Savoonga
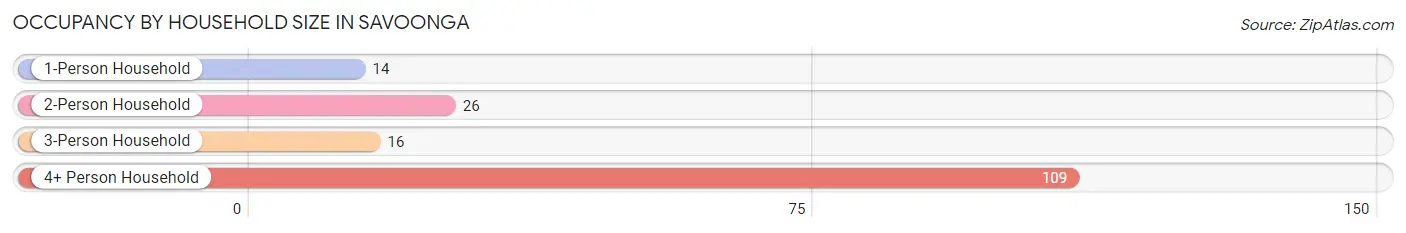
| Household Size | # Housing Units | % Housing Units |
| 1-Person Household | 14 | 8.5% |
| 2-Person Household | 26 | 15.8% |
| 3-Person Household | 16 | 9.7% |
| 4+ Person Household | 109 | 66.1% |
| Total Housing Units | 165 | 100.0% |
Occupancy by Ownership by Household Size in Savoonga
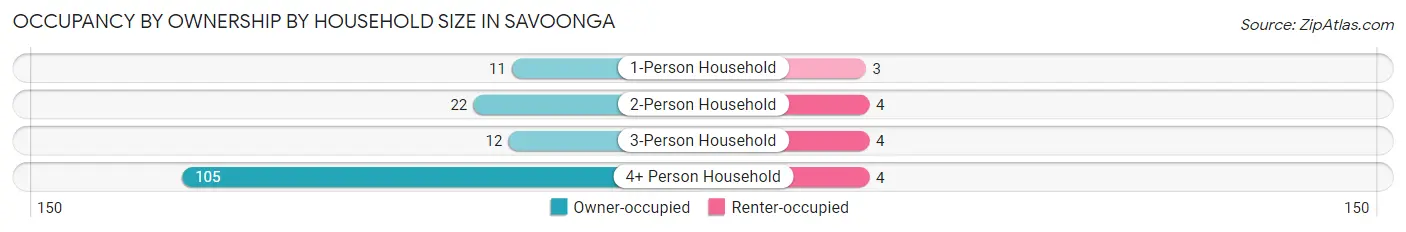
| Household Size | Owner-occupied | Renter-occupied |
| 1-Person Household | 11 (78.6%) | 3 (21.4%) |
| 2-Person Household | 22 (84.6%) | 4 (15.4%) |
| 3-Person Household | 12 (75.0%) | 4 (25.0%) |
| 4+ Person Household | 105 (96.3%) | 4 (3.7%) |
| Total Housing Units | 150 (90.9%) | 15 (9.1%) |
Occupancy by Educational Attainment in Savoonga
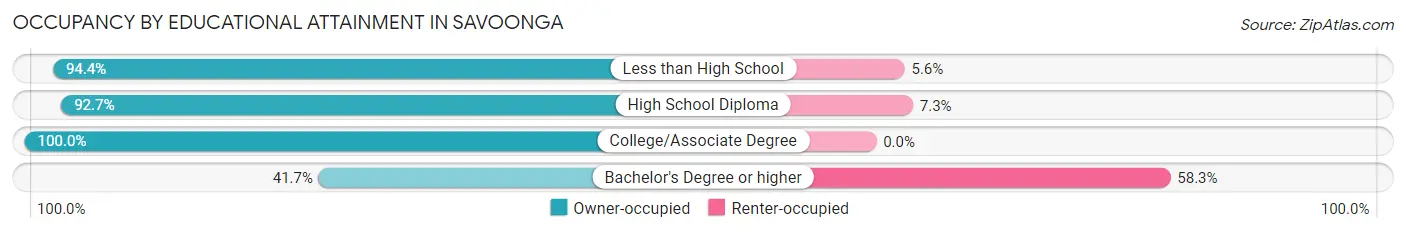
| Household Size | Owner-occupied | Renter-occupied |
| Less than High School | 67 (94.4%) | 4 (5.6%) |
| High School Diploma | 51 (92.7%) | 4 (7.3%) |
| College/Associate Degree | 27 (100.0%) | 0 (0.0%) |
| Bachelor's Degree or higher | 5 (41.7%) | 7 (58.3%) |
Occupancy by Age of Householder in Savoonga
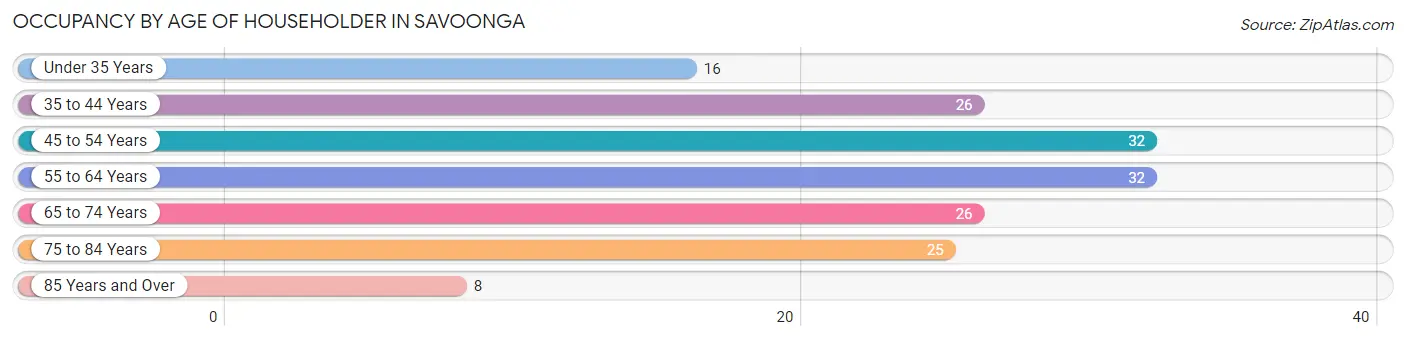
| Age Bracket | # Households | % Households |
| Under 35 Years | 16 | 9.7% |
| 35 to 44 Years | 26 | 15.8% |
| 45 to 54 Years | 32 | 19.4% |
| 55 to 64 Years | 32 | 19.4% |
| 65 to 74 Years | 26 | 15.8% |
| 75 to 84 Years | 25 | 15.1% |
| 85 Years and Over | 8 | 4.9% |
| Total | 165 | 100.0% |
Housing Finances in Savoonga
Median Income by Occupancy in Savoonga
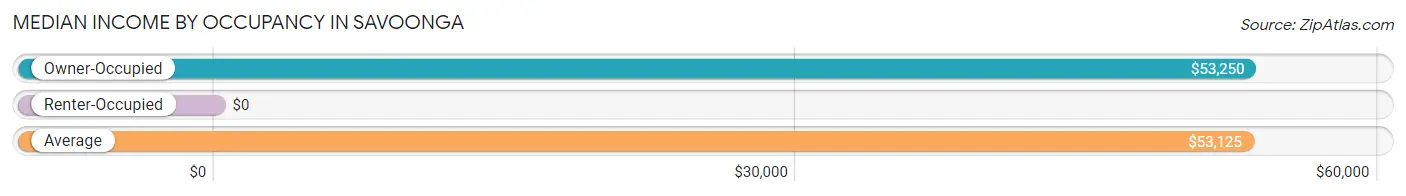
| Occupancy Type | # Households | Median Income |
| Owner-Occupied | 150 (90.9%) | $53,250 |
| Renter-Occupied | 15 (9.1%) | $0 |
| Average | 165 (100.0%) | $53,125 |
Occupancy by Householder Income Bracket in Savoonga
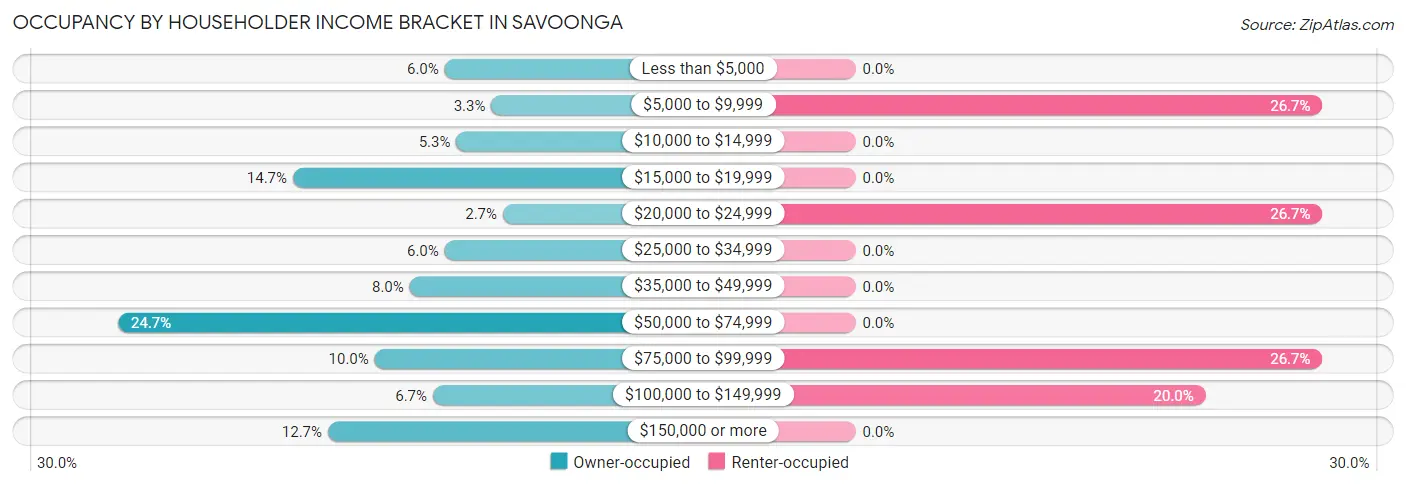
| Income Bracket | Owner-occupied | Renter-occupied |
| Less than $5,000 | 9 (6.0%) | 0 (0.0%) |
| $5,000 to $9,999 | 5 (3.3%) | 4 (26.7%) |
| $10,000 to $14,999 | 8 (5.3%) | 0 (0.0%) |
| $15,000 to $19,999 | 22 (14.7%) | 0 (0.0%) |
| $20,000 to $24,999 | 4 (2.7%) | 4 (26.7%) |
| $25,000 to $34,999 | 9 (6.0%) | 0 (0.0%) |
| $35,000 to $49,999 | 12 (8.0%) | 0 (0.0%) |
| $50,000 to $74,999 | 37 (24.7%) | 0 (0.0%) |
| $75,000 to $99,999 | 15 (10.0%) | 4 (26.7%) |
| $100,000 to $149,999 | 10 (6.7%) | 3 (20.0%) |
| $150,000 or more | 19 (12.7%) | 0 (0.0%) |
| Total | 150 (100.0%) | 15 (100.0%) |
Monthly Housing Cost Tiers in Savoonga
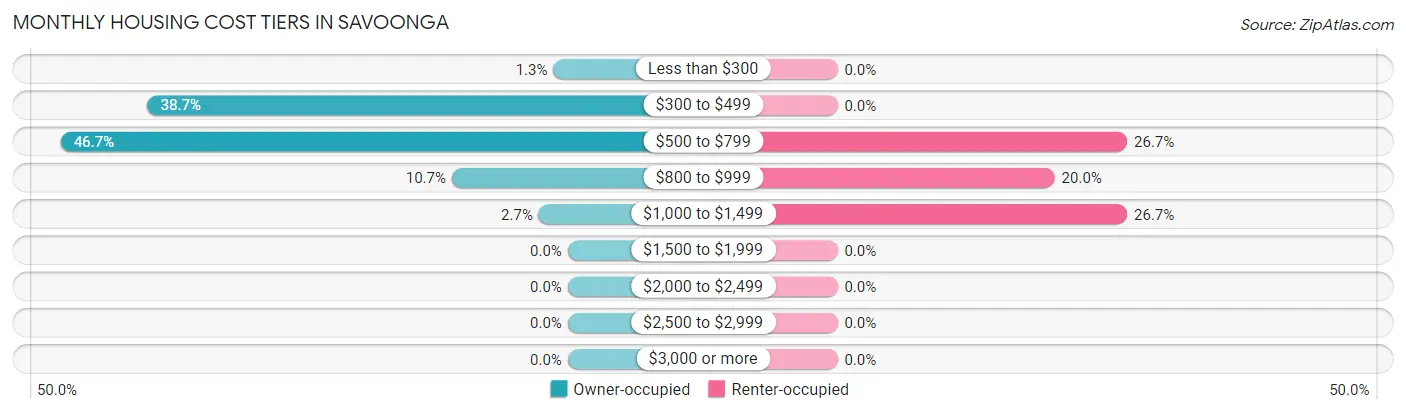
| Monthly Cost | Owner-occupied | Renter-occupied |
| Less than $300 | 2 (1.3%) | 0 (0.0%) |
| $300 to $499 | 58 (38.7%) | 0 (0.0%) |
| $500 to $799 | 70 (46.7%) | 4 (26.7%) |
| $800 to $999 | 16 (10.7%) | 3 (20.0%) |
| $1,000 to $1,499 | 4 (2.7%) | 4 (26.7%) |
| $1,500 to $1,999 | 0 (0.0%) | 0 (0.0%) |
| $2,000 to $2,499 | 0 (0.0%) | 0 (0.0%) |
| $2,500 to $2,999 | 0 (0.0%) | 0 (0.0%) |
| $3,000 or more | 0 (0.0%) | 0 (0.0%) |
| Total | 150 (100.0%) | 15 (100.0%) |
Physical Housing Characteristics in Savoonga
Housing Structures in Savoonga
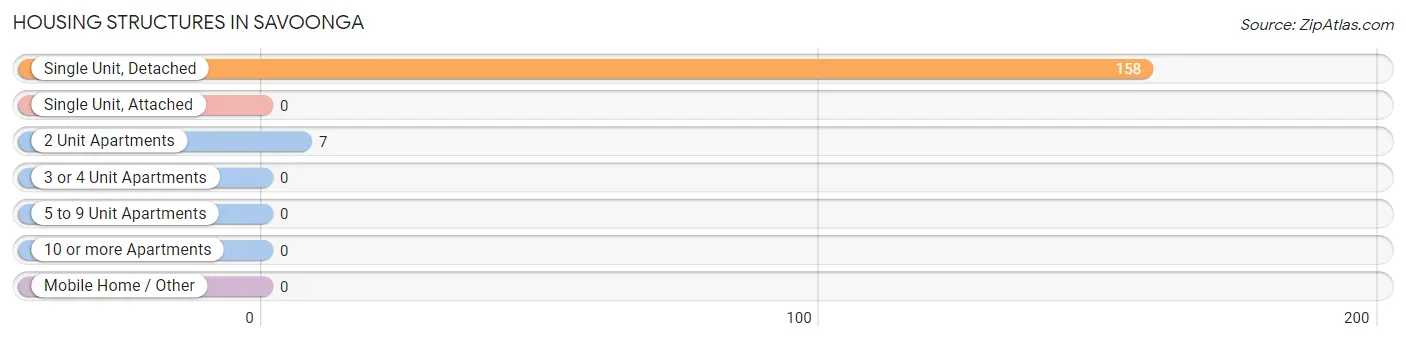
| Structure Type | # Housing Units | % Housing Units |
| Single Unit, Detached | 158 | 95.8% |
| Single Unit, Attached | 0 | 0.0% |
| 2 Unit Apartments | 7 | 4.2% |
| 3 or 4 Unit Apartments | 0 | 0.0% |
| 5 to 9 Unit Apartments | 0 | 0.0% |
| 10 or more Apartments | 0 | 0.0% |
| Mobile Home / Other | 0 | 0.0% |
| Total | 165 | 100.0% |
Housing Structures by Occupancy in Savoonga
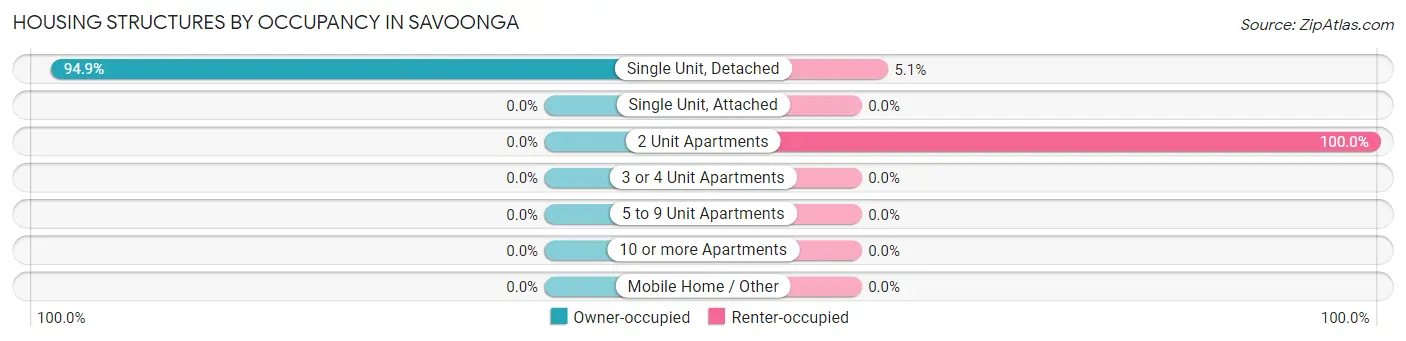
| Structure Type | Owner-occupied | Renter-occupied |
| Single Unit, Detached | 150 (94.9%) | 8 (5.1%) |
| Single Unit, Attached | 0 (0.0%) | 0 (0.0%) |
| 2 Unit Apartments | 0 (0.0%) | 7 (100.0%) |
| 3 or 4 Unit Apartments | 0 (0.0%) | 0 (0.0%) |
| 5 to 9 Unit Apartments | 0 (0.0%) | 0 (0.0%) |
| 10 or more Apartments | 0 (0.0%) | 0 (0.0%) |
| Mobile Home / Other | 0 (0.0%) | 0 (0.0%) |
| Total | 150 (90.9%) | 15 (9.1%) |
Housing Structures by Number of Rooms in Savoonga
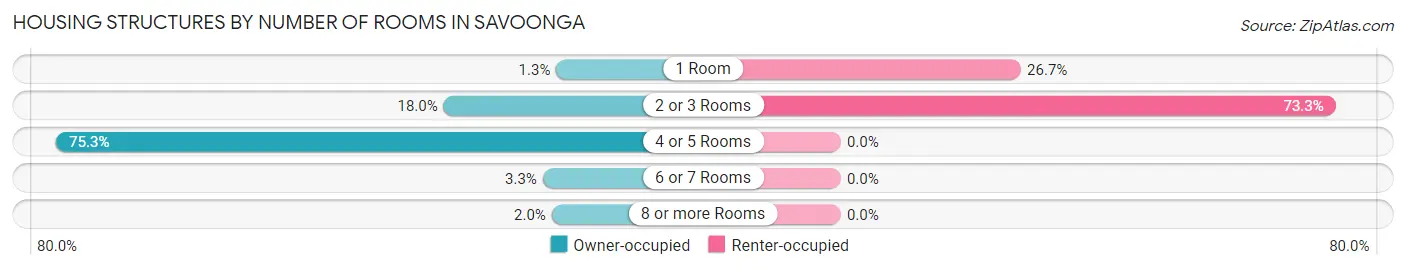
| Number of Rooms | Owner-occupied | Renter-occupied |
| 1 Room | 2 (1.3%) | 4 (26.7%) |
| 2 or 3 Rooms | 27 (18.0%) | 11 (73.3%) |
| 4 or 5 Rooms | 113 (75.3%) | 0 (0.0%) |
| 6 or 7 Rooms | 5 (3.3%) | 0 (0.0%) |
| 8 or more Rooms | 3 (2.0%) | 0 (0.0%) |
| Total | 150 (100.0%) | 15 (100.0%) |
Housing Structure by Heating Type in Savoonga
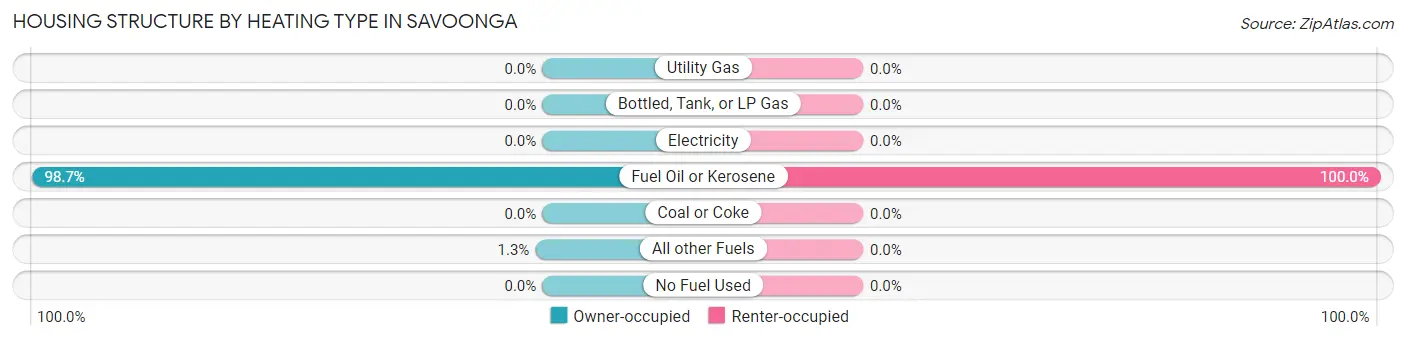
| Heating Type | Owner-occupied | Renter-occupied |
| Utility Gas | 0 (0.0%) | 0 (0.0%) |
| Bottled, Tank, or LP Gas | 0 (0.0%) | 0 (0.0%) |
| Electricity | 0 (0.0%) | 0 (0.0%) |
| Fuel Oil or Kerosene | 148 (98.7%) | 15 (100.0%) |
| Coal or Coke | 0 (0.0%) | 0 (0.0%) |
| All other Fuels | 2 (1.3%) | 0 (0.0%) |
| No Fuel Used | 0 (0.0%) | 0 (0.0%) |
| Total | 150 (100.0%) | 15 (100.0%) |
Household Vehicle Usage in Savoonga
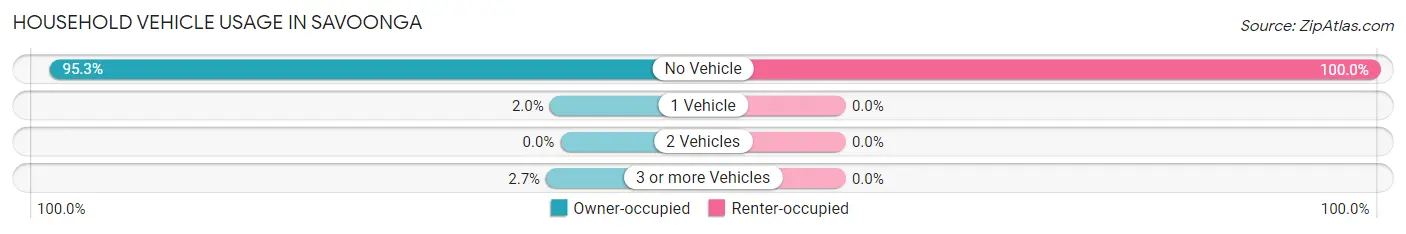
| Vehicles per Household | Owner-occupied | Renter-occupied |
| No Vehicle | 143 (95.3%) | 15 (100.0%) |
| 1 Vehicle | 3 (2.0%) | 0 (0.0%) |
| 2 Vehicles | 0 (0.0%) | 0 (0.0%) |
| 3 or more Vehicles | 4 (2.7%) | 0 (0.0%) |
| Total | 150 (100.0%) | 15 (100.0%) |
Real Estate & Mortgages in Savoonga
Real Estate and Mortgage Overview in Savoonga
| Characteristic | Without Mortgage | With Mortgage |
| Housing Units | 122 | 28 |
| Median Property Value | $90,000 | $0 |
| Median Household Income | $41,250 | $10 |
| Monthly Housing Costs | $522 | $0 |
| Real Estate Taxes | - | - |
Property Value by Mortgage Status in Savoonga
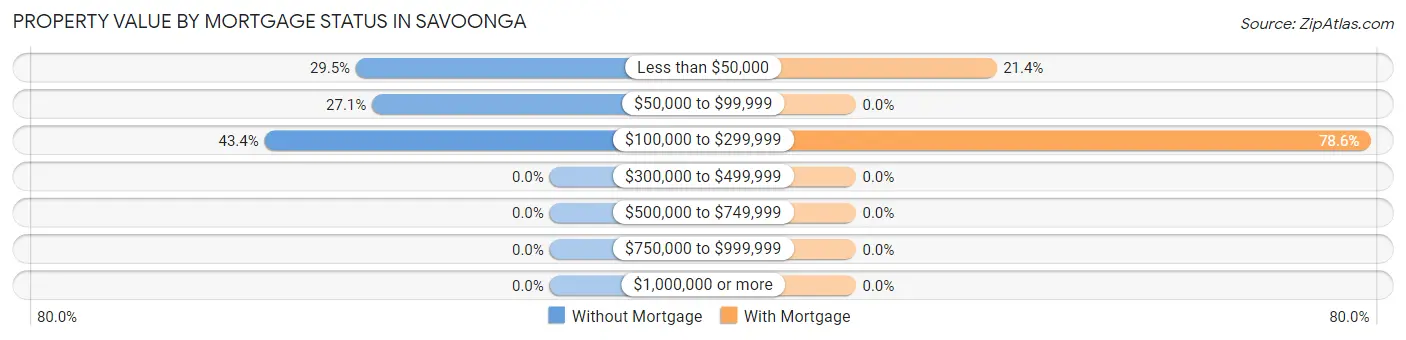
| Property Value | Without Mortgage | With Mortgage |
| Less than $50,000 | 36 (29.5%) | 6 (21.4%) |
| $50,000 to $99,999 | 33 (27.1%) | 0 (0.0%) |
| $100,000 to $299,999 | 53 (43.4%) | 22 (78.6%) |
| $300,000 to $499,999 | 0 (0.0%) | 0 (0.0%) |
| $500,000 to $749,999 | 0 (0.0%) | 0 (0.0%) |
| $750,000 to $999,999 | 0 (0.0%) | 0 (0.0%) |
| $1,000,000 or more | 0 (0.0%) | 0 (0.0%) |
| Total | 122 (100.0%) | 28 (100.0%) |
Household Income by Mortgage Status in Savoonga
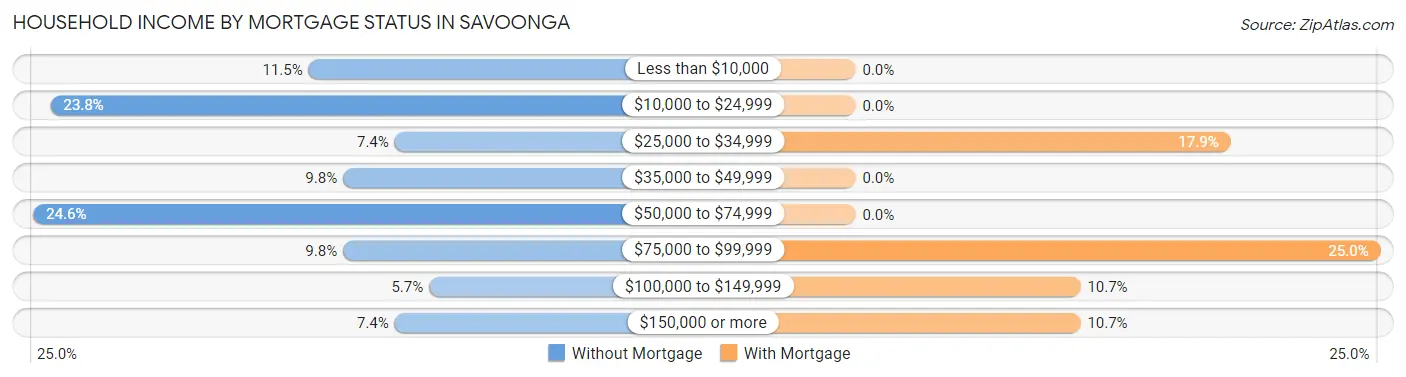
| Household Income | Without Mortgage | With Mortgage |
| Less than $10,000 | 14 (11.5%) | 0 (0.0%) |
| $10,000 to $24,999 | 29 (23.8%) | 0 (0.0%) |
| $25,000 to $34,999 | 9 (7.4%) | 5 (17.9%) |
| $35,000 to $49,999 | 12 (9.8%) | 0 (0.0%) |
| $50,000 to $74,999 | 30 (24.6%) | 0 (0.0%) |
| $75,000 to $99,999 | 12 (9.8%) | 7 (25.0%) |
| $100,000 to $149,999 | 7 (5.7%) | 3 (10.7%) |
| $150,000 or more | 9 (7.4%) | 3 (10.7%) |
| Total | 122 (100.0%) | 28 (100.0%) |
Property Value to Household Income Ratio in Savoonga
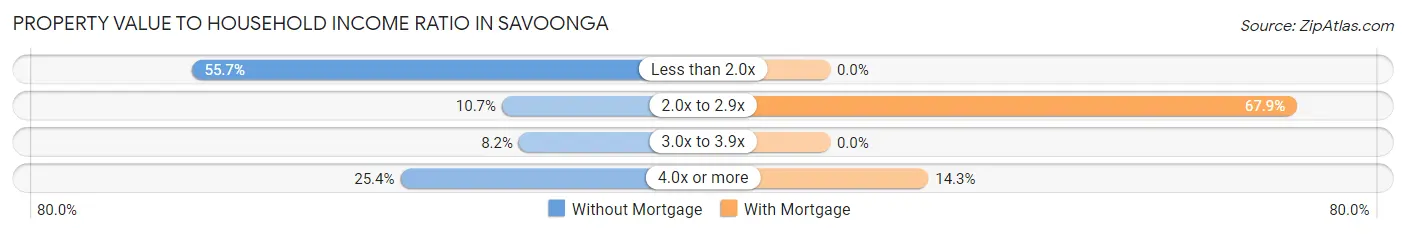
| Value-to-Income Ratio | Without Mortgage | With Mortgage |
| Less than 2.0x | 68 (55.7%) | 0 (0.0%) |
| 2.0x to 2.9x | 13 (10.7%) | 19 (67.9%) |
| 3.0x to 3.9x | 10 (8.2%) | 0 (0.0%) |
| 4.0x or more | 31 (25.4%) | 4 (14.3%) |
| Total | 122 (100.0%) | 28 (100.0%) |
Real Estate Taxes by Mortgage Status in Savoonga
| Property Taxes | Without Mortgage | With Mortgage |
| Less than $800 | 0 (0.0%) | 0 (0.0%) |
| $800 to $1,499 | 0 (0.0%) | 0 (0.0%) |
| $800 to $1,499 | 0 (0.0%) | 0 (0.0%) |
| Total | 122 (100.0%) | 28 (100.0%) |
Health & Disability in Savoonga
Health Insurance Coverage by Age in Savoonga
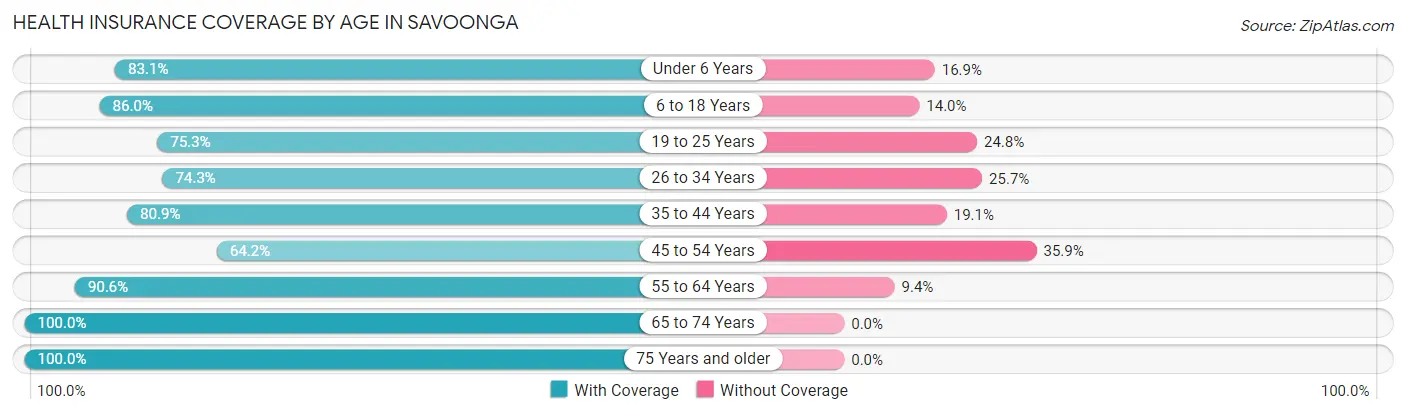
| Age Bracket | With Coverage | Without Coverage |
| Under 6 Years | 64 (83.1%) | 13 (16.9%) |
| 6 to 18 Years | 215 (86.0%) | 35 (14.0%) |
| 19 to 25 Years | 76 (75.2%) | 25 (24.7%) |
| 26 to 34 Years | 104 (74.3%) | 36 (25.7%) |
| 35 to 44 Years | 55 (80.9%) | 13 (19.1%) |
| 45 to 54 Years | 34 (64.1%) | 19 (35.8%) |
| 55 to 64 Years | 58 (90.6%) | 6 (9.4%) |
| 65 to 74 Years | 37 (100.0%) | 0 (0.0%) |
| 75 Years and older | 33 (100.0%) | 0 (0.0%) |
| Total | 676 (82.1%) | 147 (17.9%) |
Health Insurance Coverage by Citizenship Status in Savoonga
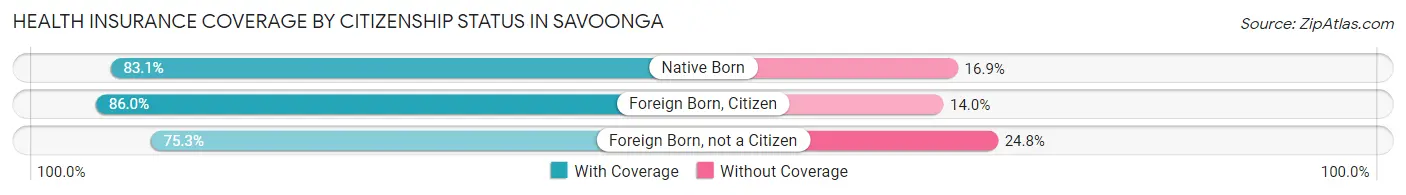
| Citizenship Status | With Coverage | Without Coverage |
| Native Born | 64 (83.1%) | 13 (16.9%) |
| Foreign Born, Citizen | 215 (86.0%) | 35 (14.0%) |
| Foreign Born, not a Citizen | 76 (75.2%) | 25 (24.7%) |
Health Insurance Coverage by Household Income in Savoonga
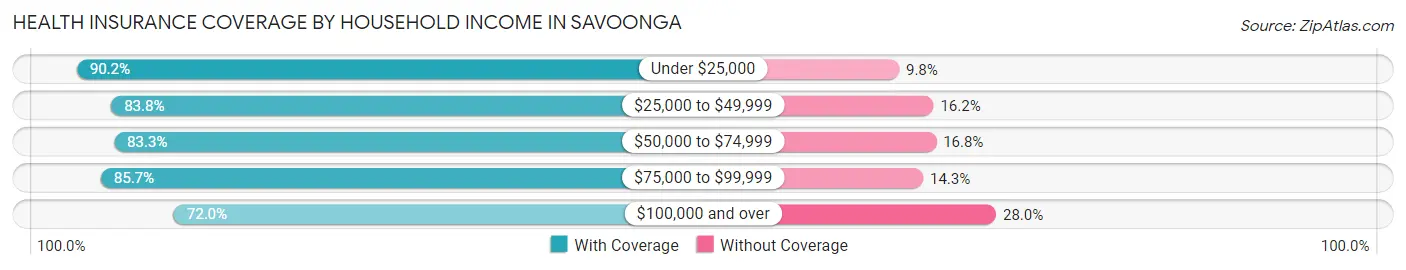
| Household Income | With Coverage | Without Coverage |
| Under $25,000 | 129 (90.2%) | 14 (9.8%) |
| $25,000 to $49,999 | 98 (83.8%) | 19 (16.2%) |
| $50,000 to $74,999 | 164 (83.3%) | 33 (16.8%) |
| $75,000 to $99,999 | 90 (85.7%) | 15 (14.3%) |
| $100,000 and over | 170 (72.0%) | 66 (28.0%) |
Public vs Private Health Insurance Coverage by Age in Savoonga
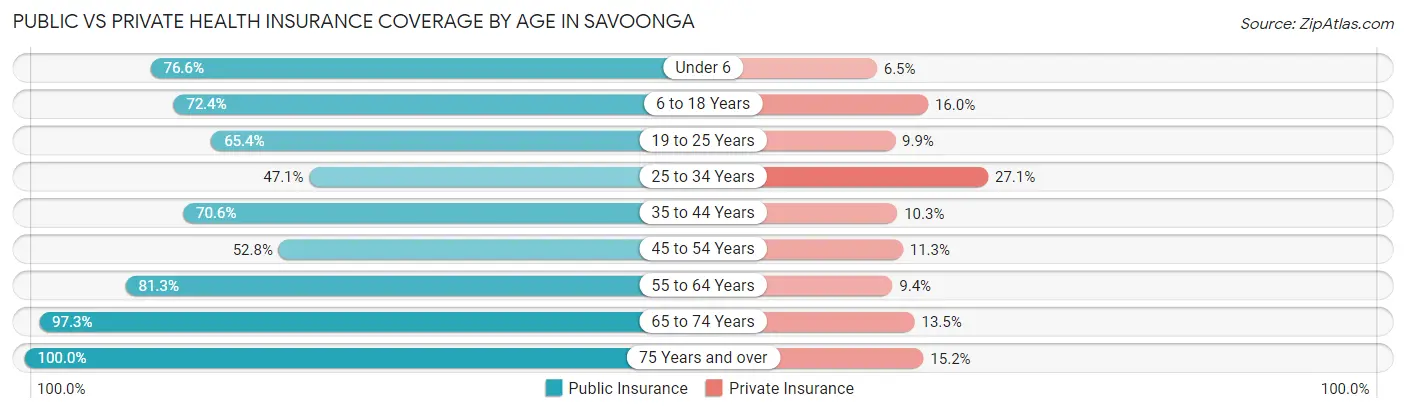
| Age Bracket | Public Insurance | Private Insurance |
| Under 6 | 59 (76.6%) | 5 (6.5%) |
| 6 to 18 Years | 181 (72.4%) | 40 (16.0%) |
| 19 to 25 Years | 66 (65.3%) | 10 (9.9%) |
| 25 to 34 Years | 66 (47.1%) | 38 (27.1%) |
| 35 to 44 Years | 48 (70.6%) | 7 (10.3%) |
| 45 to 54 Years | 28 (52.8%) | 6 (11.3%) |
| 55 to 64 Years | 52 (81.2%) | 6 (9.4%) |
| 65 to 74 Years | 36 (97.3%) | 5 (13.5%) |
| 75 Years and over | 33 (100.0%) | 5 (15.1%) |
| Total | 569 (69.1%) | 122 (14.8%) |
Disability Status by Sex by Age in Savoonga
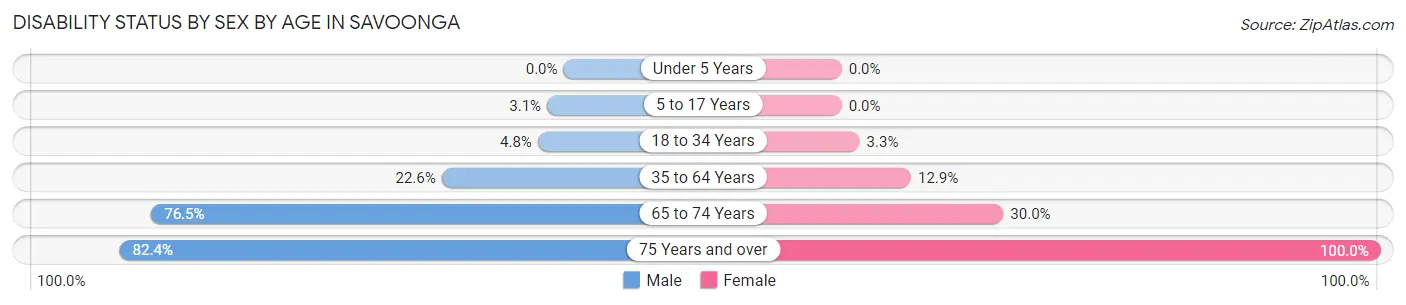
| Age Bracket | Male | Female |
| Under 5 Years | 0 (0.0%) | 0 (0.0%) |
| 5 to 17 Years | 4 (3.0%) | 0 (0.0%) |
| 18 to 34 Years | 7 (4.8%) | 4 (3.3%) |
| 35 to 64 Years | 26 (22.6%) | 9 (12.9%) |
| 65 to 74 Years | 13 (76.5%) | 6 (30.0%) |
| 75 Years and over | 14 (82.4%) | 16 (100.0%) |
Disability Class by Sex by Age in Savoonga
Disability Class: Hearing Difficulty
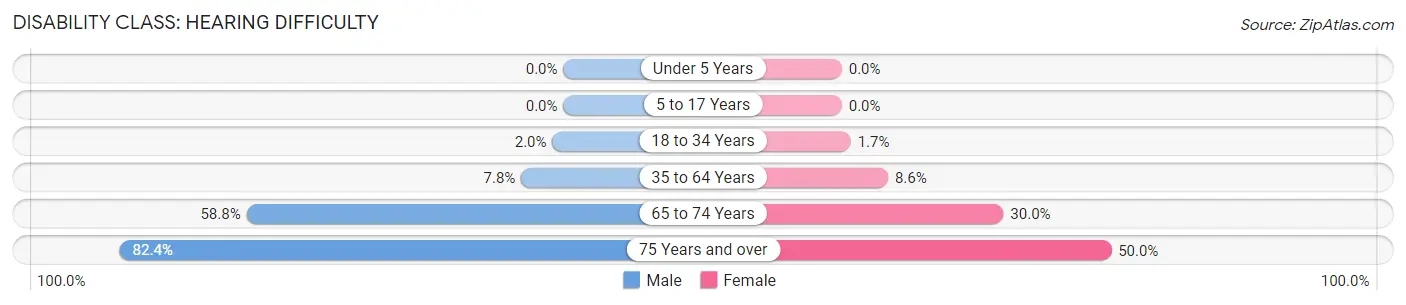
| Age Bracket | Male | Female |
| Under 5 Years | 0 (0.0%) | 0 (0.0%) |
| 5 to 17 Years | 0 (0.0%) | 0 (0.0%) |
| 18 to 34 Years | 3 (2.0%) | 2 (1.7%) |
| 35 to 64 Years | 9 (7.8%) | 6 (8.6%) |
| 65 to 74 Years | 10 (58.8%) | 6 (30.0%) |
| 75 Years and over | 14 (82.4%) | 8 (50.0%) |
Disability Class: Vision Difficulty
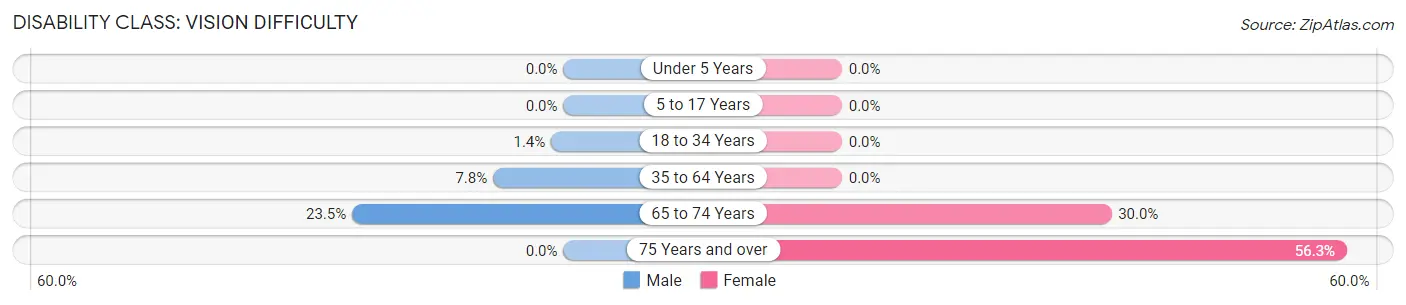
| Age Bracket | Male | Female |
| Under 5 Years | 0 (0.0%) | 0 (0.0%) |
| 5 to 17 Years | 0 (0.0%) | 0 (0.0%) |
| 18 to 34 Years | 2 (1.4%) | 0 (0.0%) |
| 35 to 64 Years | 9 (7.8%) | 0 (0.0%) |
| 65 to 74 Years | 4 (23.5%) | 6 (30.0%) |
| 75 Years and over | 0 (0.0%) | 9 (56.2%) |
Disability Class: Cognitive Difficulty
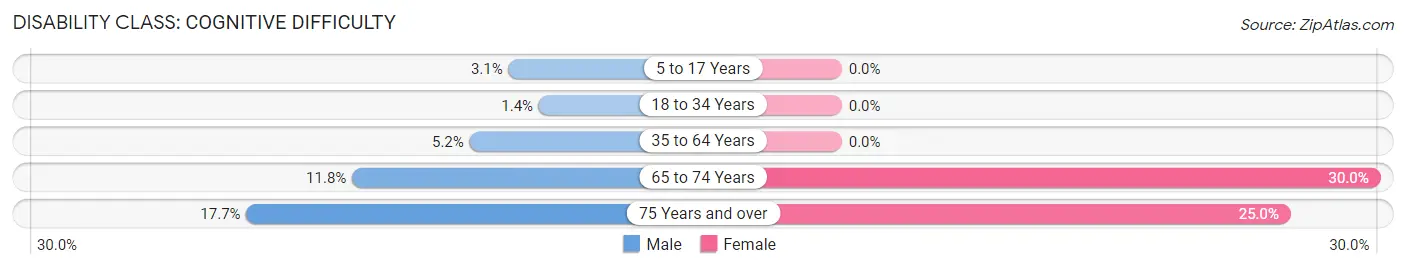
| Age Bracket | Male | Female |
| 5 to 17 Years | 4 (3.0%) | 0 (0.0%) |
| 18 to 34 Years | 2 (1.4%) | 0 (0.0%) |
| 35 to 64 Years | 6 (5.2%) | 0 (0.0%) |
| 65 to 74 Years | 2 (11.8%) | 6 (30.0%) |
| 75 Years and over | 3 (17.6%) | 4 (25.0%) |
Disability Class: Ambulatory Difficulty
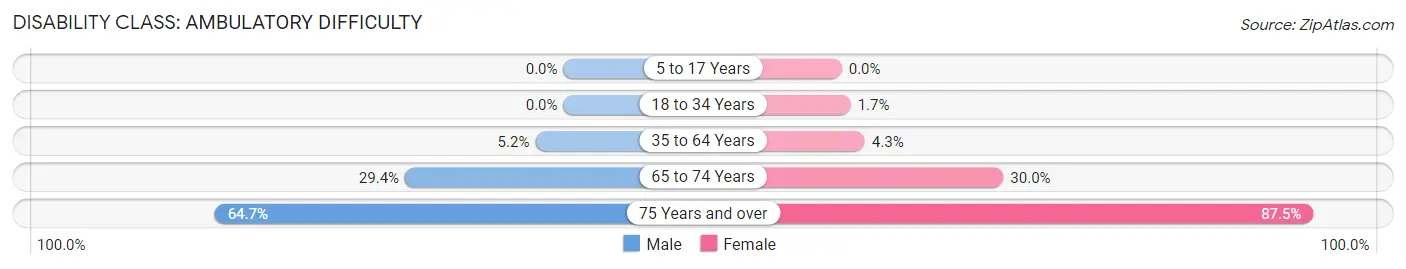
| Age Bracket | Male | Female |
| 5 to 17 Years | 0 (0.0%) | 0 (0.0%) |
| 18 to 34 Years | 0 (0.0%) | 2 (1.7%) |
| 35 to 64 Years | 6 (5.2%) | 3 (4.3%) |
| 65 to 74 Years | 5 (29.4%) | 6 (30.0%) |
| 75 Years and over | 11 (64.7%) | 14 (87.5%) |
Disability Class: Self-Care Difficulty
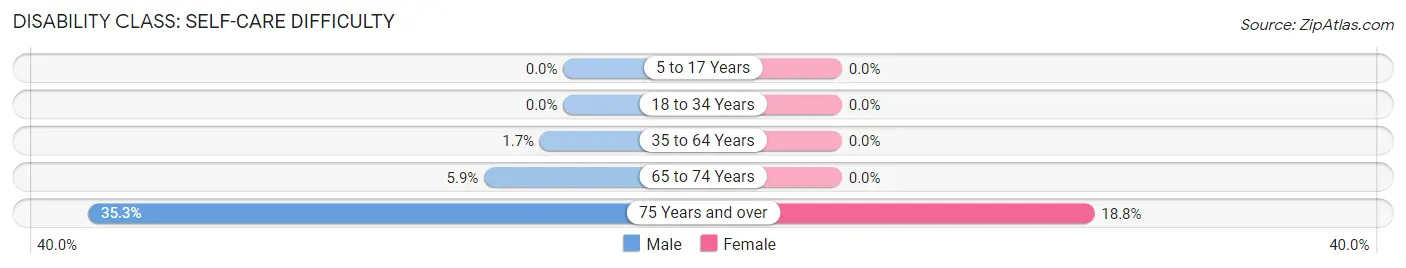
| Age Bracket | Male | Female |
| 5 to 17 Years | 0 (0.0%) | 0 (0.0%) |
| 18 to 34 Years | 0 (0.0%) | 0 (0.0%) |
| 35 to 64 Years | 2 (1.7%) | 0 (0.0%) |
| 65 to 74 Years | 1 (5.9%) | 0 (0.0%) |
| 75 Years and over | 6 (35.3%) | 3 (18.8%) |
Technology Access in Savoonga
Computing Device Access in Savoonga
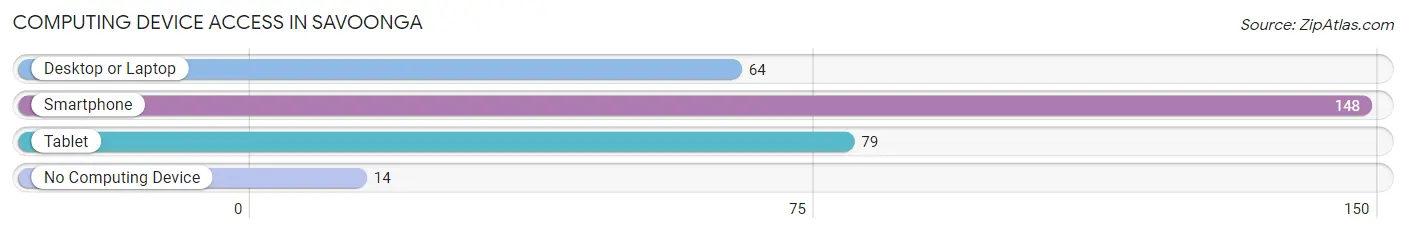
| Device Type | # Households | % Households |
| Desktop or Laptop | 64 | 38.8% |
| Smartphone | 148 | 89.7% |
| Tablet | 79 | 47.9% |
| No Computing Device | 14 | 8.5% |
| Total | 165 | 100.0% |
Internet Access in Savoonga
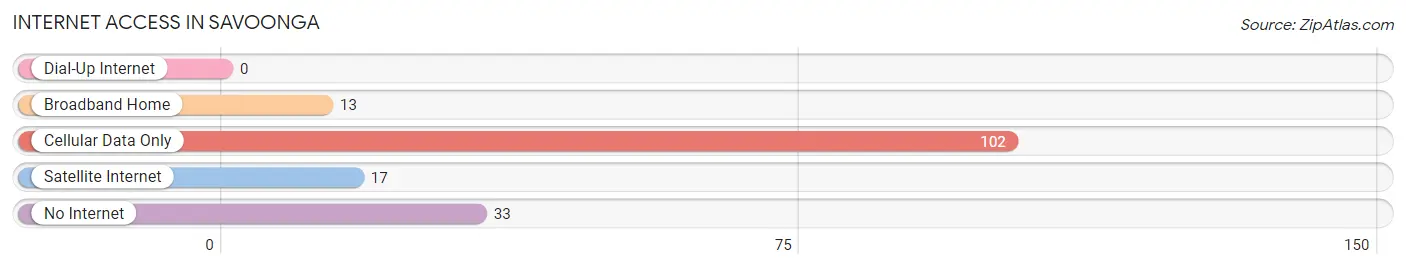
| Internet Type | # Households | % Households |
| Dial-Up Internet | 0 | 0.0% |
| Broadband Home | 13 | 7.9% |
| Cellular Data Only | 102 | 61.8% |
| Satellite Internet | 17 | 10.3% |
| No Internet | 33 | 20.0% |
| Total | 165 | 100.0% |
Savoonga Summary
Savoonga is a small city located on the northwest coast of St. Lawrence Island in the Bering Sea, Alaska. It is the largest city on the island and is home to the Yupik Eskimo people. The city is located in the Nome Census Area and has a population of 690 as of the 2010 census.
Geography
Savoonga is located on the northwest coast of St. Lawrence Island, which is located in the Bering Sea, approximately 200 miles northwest of Nome, Alaska. The island is approximately 60 miles long and 20 miles wide and is the largest island in the Bering Sea. The city is located on the northern shore of the island and is surrounded by the Chukchi Sea to the north and the Bering Sea to the south. The city is located in a tundra climate, with cold winters and mild summers.
Economy
The economy of Savoonga is largely based on subsistence hunting and fishing. The Yupik Eskimos of the area rely heavily on the resources of the Bering Sea for their livelihood. The main sources of income for the city are fishing, hunting, and trapping. The city also has a small tourism industry, with visitors coming to the area to experience the unique culture and wildlife of the region.
Demographics
As of the 2010 census, the population of Savoonga was 690, with a population density of 0.3 people per square mile. The racial makeup of the city was 95.2% Native American, 2.2% White, 0.3% Asian, 0.1% Pacific Islander, and 2.2% from two or more races. The median age of the population was 28.7 years, with a median household income of $25,000.
History
Savoonga has been inhabited by the Yupik Eskimos for centuries. The city was first established in the late 19th century as a trading post for the Yupik people. The city was officially incorporated in 1959 and has since grown to become the largest city on St. Lawrence Island. The city is home to the Savoonga Tribal Council, which is responsible for the governance of the city.
Conclusion
Savoonga is a small city located on the northwest coast of St. Lawrence Island in the Bering Sea, Alaska. It is the largest city on the island and is home to the Yupik Eskimo people. The city is located in the Nome Census Area and has a population of 690 as of the 2010 census. The economy of Savoonga is largely based on subsistence hunting and fishing, with the Yupik Eskimos relying heavily on the resources of the Bering Sea for their livelihood. The city also has a small tourism industry, with visitors coming to the area to experience the unique culture and wildlife of the region. Savoonga has been inhabited by the Yupik Eskimos for centuries and was officially incorporated in 1959.
Common Questions
What is Per Capita Income in Savoonga?
Per Capita income in Savoonga is $17,931.
What is the Median Family Income in Savoonga?
Median Family Income in Savoonga is $52,981.
What is the Median Household income in Savoonga?
Median Household Income in Savoonga is $53,125.
What is Family Income Deficit in Savoonga?
Family Income Deficit in Savoonga is $11,738.
Families that are below poverty line in Savoonga earn $11,738 less on average than the poverty threshold level.
What is Inequality or Gini Index in Savoonga?
Inequality or Gini Index in Savoonga is 0.48.
What is the Total Population of Savoonga?
Total Population of Savoonga is 823.
What is the Total Male Population of Savoonga?
Total Male Population of Savoonga is 462.
What is the Total Female Population of Savoonga?
Total Female Population of Savoonga is 361.
What is the Ratio of Males per 100 Females in Savoonga?
There are 127.98 Males per 100 Females in Savoonga.
What is the Ratio of Females per 100 Males in Savoonga?
There are 78.14 Females per 100 Males in Savoonga.
What is the Median Population Age in Savoonga?
Median Population Age in Savoonga is 24.8 Years.
What is the Average Family Size in Savoonga
Average Family Size in Savoonga is 5.0 People.
What is the Average Household Size in Savoonga
Average Household Size in Savoonga is 4.8 People.
How Large is the Labor Force in Savoonga?
There are 286 People in the Labor Forcein in Savoonga.
What is the Percentage of People in the Labor Force in Savoonga?
50.7% of People are in the Labor Force in Savoonga.
What is the Unemployment Rate in Savoonga?
Unemployment Rate in Savoonga is 31.8%.