Noatak, AK Map & Demographics
Noatak Map
Noatak Overview
$18,241
PER CAPITA INCOME
$68,750
AVG FAMILY INCOME
$67,500
AVG HOUSEHOLD INCOME
47.1%
WAGE / INCOME GAP [ % ]
52.9¢/ $1
WAGE / INCOME GAP [ $ ]
$13,690
FAMILY INCOME DEFICIT
0.41
INEQUALITY / GINI INDEX
536
TOTAL POPULATION
317
MALE POPULATION
219
FEMALE POPULATION
144.75
MALES / 100 FEMALES
69.09
FEMALES / 100 MALES
25.8
MEDIAN AGE
5.6
AVG FAMILY SIZE
5.2
AVG HOUSEHOLD SIZE
197
LABOR FORCE [ PEOPLE ]
55.0%
PERCENT IN LABOR FORCE
35.5%
UNEMPLOYMENT RATE
Noatak Zip Codes
Noatak Area Codes
Income in Noatak
Income Overview in Noatak
Per Capita Income in Noatak is $18,241, while median incomes of families and households are $68,750 and $67,500 respectively.
| Characteristic | Number | Measure |
| Per Capita Income | 536 | $18,241 |
| Median Family Income | 94 | $68,750 |
| Mean Family Income | 94 | $85,601 |
| Median Household Income | 102 | $67,500 |
| Mean Household Income | 102 | $88,228 |
| Income Deficit | 94 | $13,690 |
| Wage / Income Gap (%) | 536 | 47.11% |
| Wage / Income Gap ($) | 536 | 52.89¢ per $1 |
| Gini / Inequality Index | 536 | 0.41 |
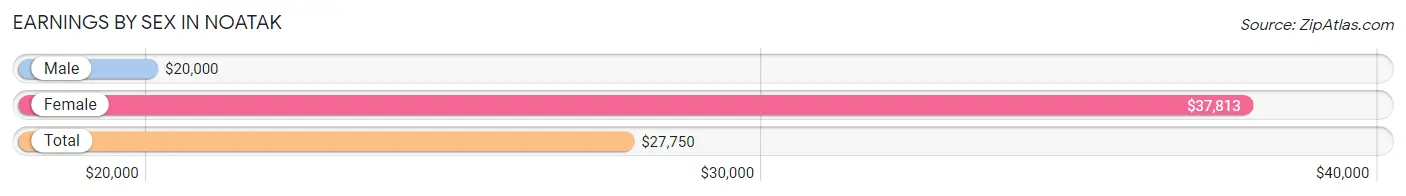
Earnings by Sex in Noatak
Average Earnings in Noatak are $27,750, $20,000 for men and $37,813 for women, a difference of 47.1%.
| Sex | Number | Average Earnings |
| Male | 122 (64.5%) | $20,000 |
| Female | 67 (35.4%) | $37,813 |
| Total | 189 (100.0%) | $27,750 |
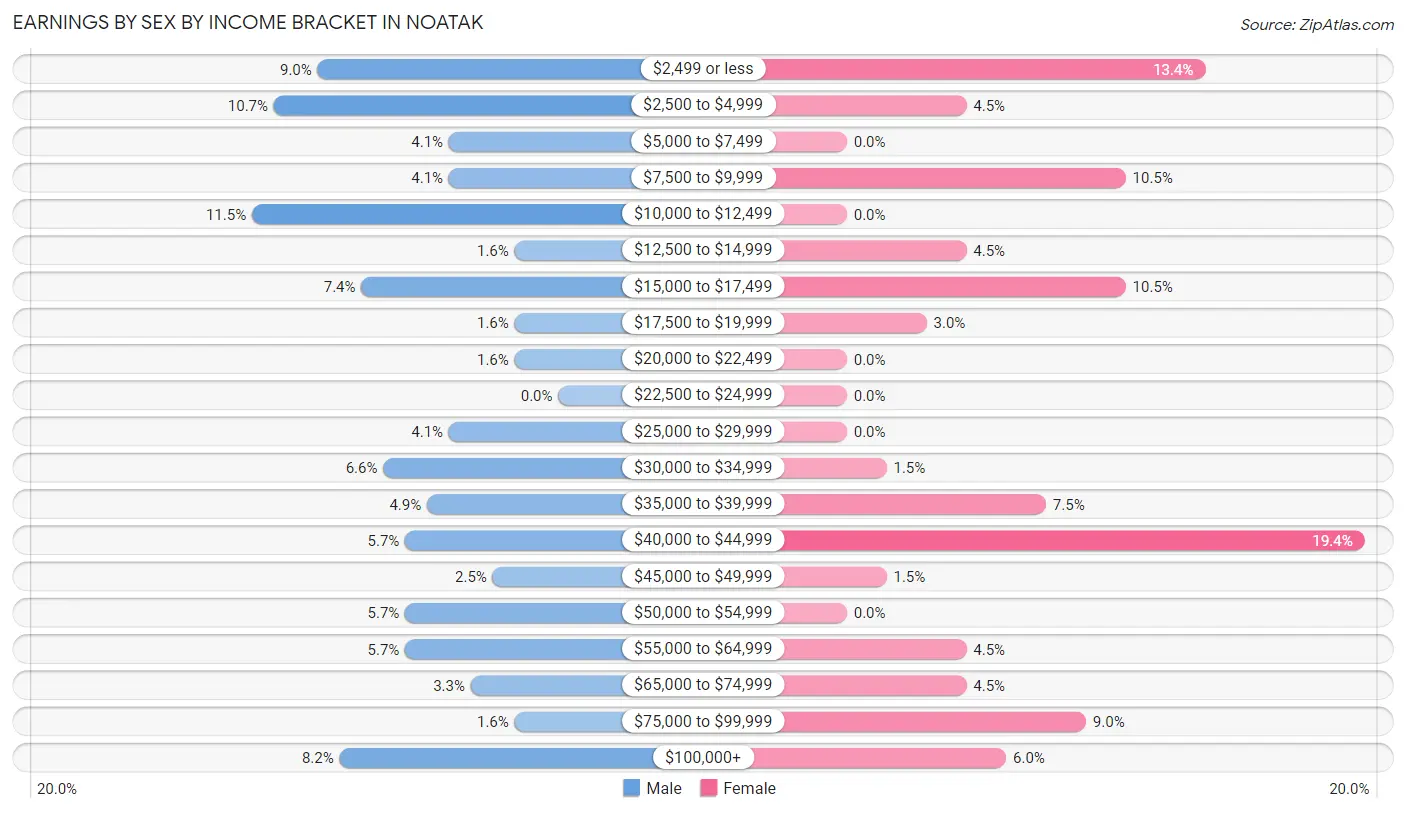
Earnings by Sex by Income Bracket in Noatak
The most common earnings brackets in Noatak are $10,000 to $12,499 for men (14 | 11.5%) and $40,000 to $44,999 for women (13 | 19.4%).
| Income | Male | Female |
| $2,499 or less | 11 (9.0%) | 9 (13.4%) |
| $2,500 to $4,999 | 13 (10.7%) | 3 (4.5%) |
| $5,000 to $7,499 | 5 (4.1%) | 0 (0.0%) |
| $7,500 to $9,999 | 5 (4.1%) | 7 (10.4%) |
| $10,000 to $12,499 | 14 (11.5%) | 0 (0.0%) |
| $12,500 to $14,999 | 2 (1.6%) | 3 (4.5%) |
| $15,000 to $17,499 | 9 (7.4%) | 7 (10.4%) |
| $17,500 to $19,999 | 2 (1.6%) | 2 (3.0%) |
| $20,000 to $22,499 | 2 (1.6%) | 0 (0.0%) |
| $22,500 to $24,999 | 0 (0.0%) | 0 (0.0%) |
| $25,000 to $29,999 | 5 (4.1%) | 0 (0.0%) |
| $30,000 to $34,999 | 8 (6.6%) | 1 (1.5%) |
| $35,000 to $39,999 | 6 (4.9%) | 5 (7.5%) |
| $40,000 to $44,999 | 7 (5.7%) | 13 (19.4%) |
| $45,000 to $49,999 | 3 (2.5%) | 1 (1.5%) |
| $50,000 to $54,999 | 7 (5.7%) | 0 (0.0%) |
| $55,000 to $64,999 | 7 (5.7%) | 3 (4.5%) |
| $65,000 to $74,999 | 4 (3.3%) | 3 (4.5%) |
| $75,000 to $99,999 | 2 (1.6%) | 6 (9.0%) |
| $100,000+ | 10 (8.2%) | 4 (6.0%) |
| Total | 122 (100.0%) | 67 (100.0%) |
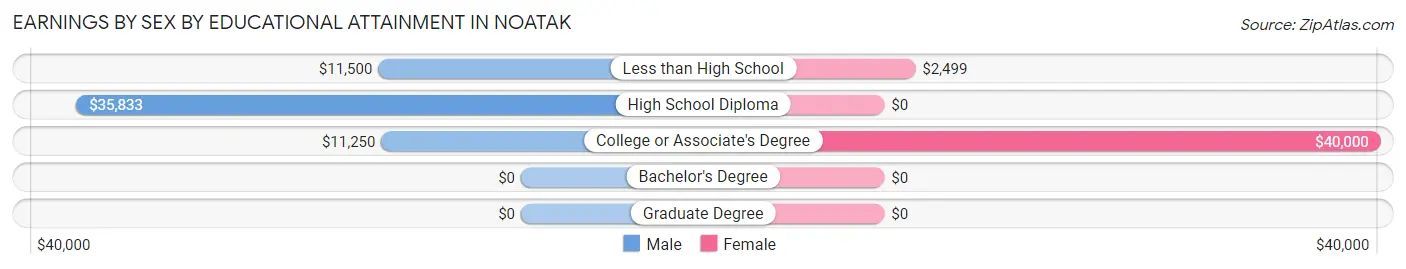
Earnings by Sex by Educational Attainment in Noatak
Average earnings in Noatak are $31,500 for men and $38,125 for women, a difference of 17.4%. Men with an educational attainment of high school diploma enjoy the highest average annual earnings of $35,833, while those with college or associate's degree education earn the least with $11,250. Women with an educational attainment of college or associate's degree earn the most with the average annual earnings of $40,000, while those with less than high school education have the smallest earnings of $2,499.
| Educational Attainment | Male Income | Female Income |
| Less than High School | $11,500 | $2,499 |
| High School Diploma | $35,833 | $0 |
| College or Associate's Degree | $11,250 | $40,000 |
| Bachelor's Degree | - | - |
| Graduate Degree | - | - |
| Total | $31,500 | $38,125 |
Family Income in Noatak
Family Income Brackets in Noatak
According to the Noatak family income data, there are 32 families falling into the $50,000 to $74,999 income range, which is the most common income bracket and makes up 34.0% of all families. Conversely, the less than $10,000 income bracket is the least frequent group with only 2 families (2.1%) belonging to this category.
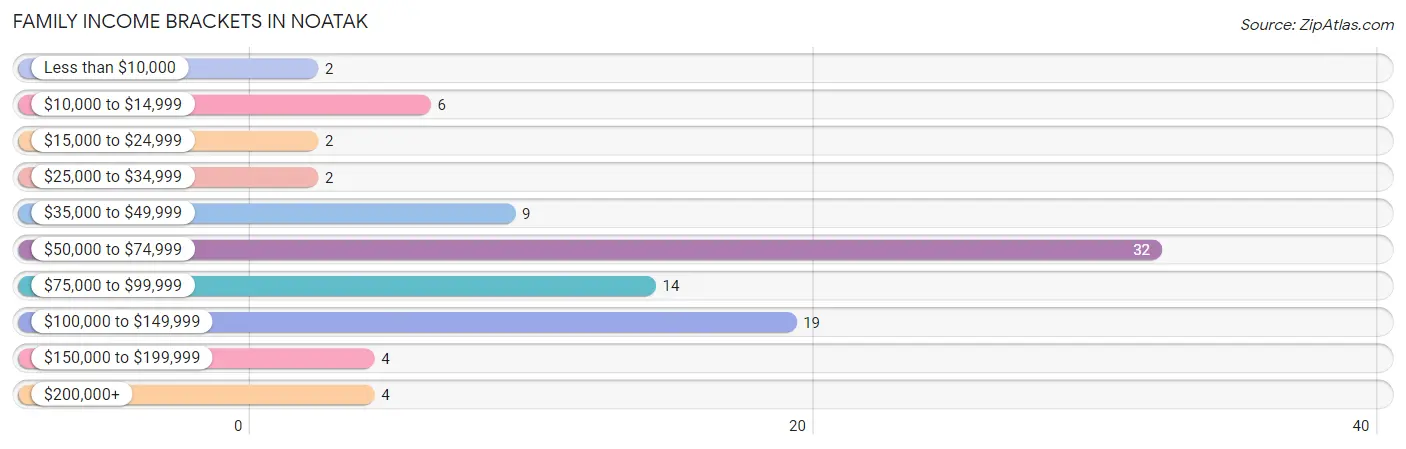
| Income Bracket | # Families | % Families |
| Less than $10,000 | 2 | 2.1% |
| $10,000 to $14,999 | 6 | 6.4% |
| $15,000 to $24,999 | 2 | 2.1% |
| $25,000 to $34,999 | 2 | 2.1% |
| $35,000 to $49,999 | 9 | 9.6% |
| $50,000 to $74,999 | 32 | 34.0% |
| $75,000 to $99,999 | 14 | 14.9% |
| $100,000 to $149,999 | 19 | 20.2% |
| $150,000 to $199,999 | 4 | 4.3% |
| $200,000+ | 4 | 4.3% |
Family Income by Famaliy Size in Noatak
6-person families (11 | 11.7%) account for the highest median family income in Noatak with $108,750 per family, while 2-person families (4 | 4.3%) have the highest median income of $48,125 per family member.
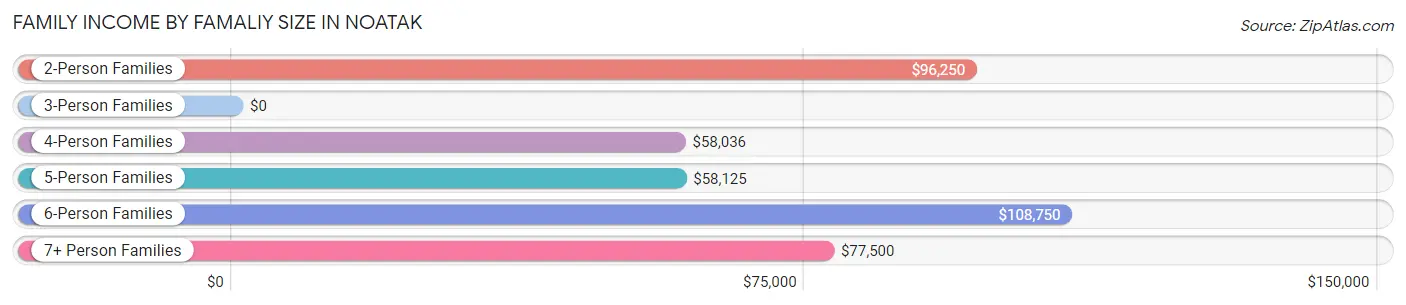
| Income Bracket | # Families | Median Income |
| 2-Person Families | 4 (4.3%) | $96,250 |
| 3-Person Families | 17 (18.1%) | $0 |
| 4-Person Families | 23 (24.5%) | $58,036 |
| 5-Person Families | 17 (18.1%) | $58,125 |
| 6-Person Families | 11 (11.7%) | $108,750 |
| 7+ Person Families | 22 (23.4%) | $77,500 |
| Total | 94 (100.0%) | $68,750 |
Family Income by Number of Earners in Noatak
The median family income in Noatak is $68,750, with families comprising 3+ earners (21) having the highest median family income of $84,375, while families with no earners (17) have the lowest median family income of $38,125, accounting for 22.3% and 18.1% of families, respectively.
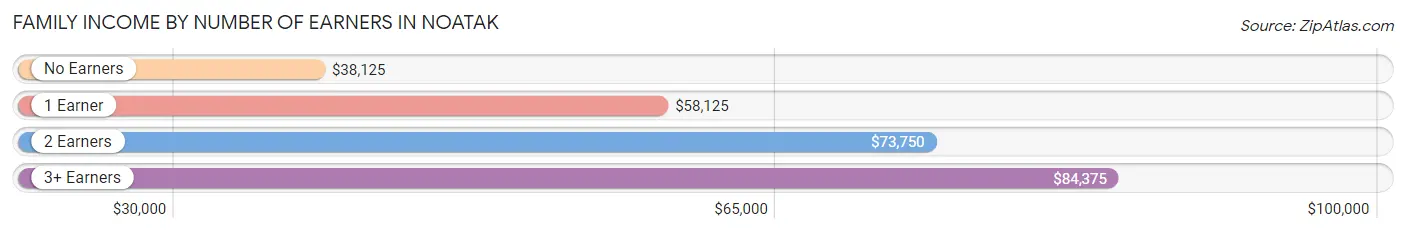
| Number of Earners | # Families | Median Income |
| No Earners | 17 (18.1%) | $38,125 |
| 1 Earner | 25 (26.6%) | $58,125 |
| 2 Earners | 31 (33.0%) | $73,750 |
| 3+ Earners | 21 (22.3%) | $84,375 |
| Total | 94 (100.0%) | $68,750 |
Household Income in Noatak
Household Income Brackets in Noatak
With 30 households falling in the category, the $50,000 to $74,999 income range is the most frequent in Noatak, accounting for 29.4% of all households. In contrast, only 2 households (2.0%) fall into the less than $10,000 income bracket, making it the least populous group.
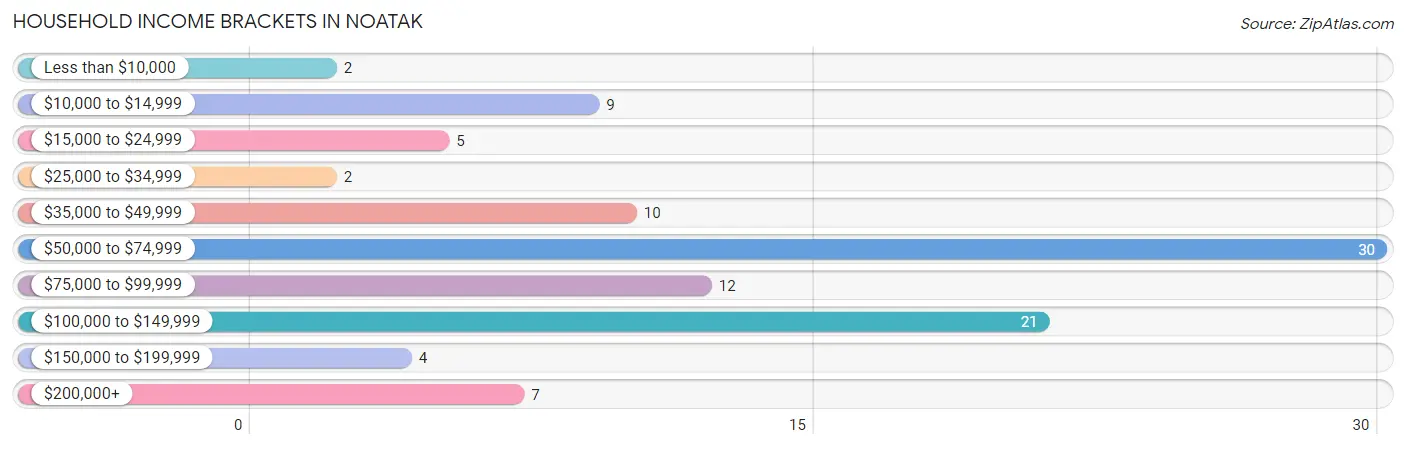
| Income Bracket | # Households | % Households |
| Less than $10,000 | 2 | 2.0% |
| $10,000 to $14,999 | 9 | 8.8% |
| $15,000 to $24,999 | 5 | 4.9% |
| $25,000 to $34,999 | 2 | 2.0% |
| $35,000 to $49,999 | 10 | 9.8% |
| $50,000 to $74,999 | 30 | 29.4% |
| $75,000 to $99,999 | 12 | 11.8% |
| $100,000 to $149,999 | 21 | 20.6% |
| $150,000 to $199,999 | 4 | 3.9% |
| $200,000+ | 7 | 6.9% |
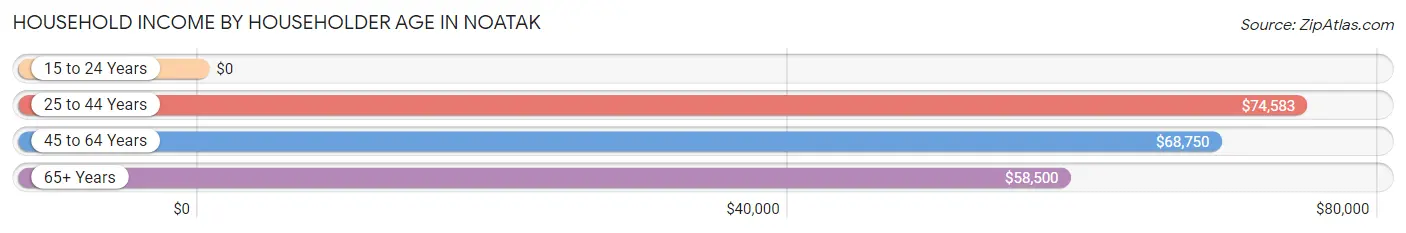
Household Income by Householder Age in Noatak
The median household income in Noatak is $67,500, with the highest median household income of $74,583 found in the 25 to 44 years age bracket for the primary householder. A total of 13 households (12.8%) fall into this category. Meanwhile, the 15 to 24 years age bracket for the primary householder has the lowest median household income of $0, with 1 households (1.0%) in this group.
| Income Bracket | # Households | Median Income |
| 15 to 24 Years | 1 (1.0%) | $0 |
| 25 to 44 Years | 13 (12.8%) | $74,583 |
| 45 to 64 Years | 62 (60.8%) | $68,750 |
| 65+ Years | 26 (25.5%) | $58,500 |
| Total | 102 (100.0%) | $67,500 |
Poverty in Noatak
Income Below Poverty by Sex and Age in Noatak
With 6.0% poverty level for males and 7.3% for females among the residents of Noatak, 55 to 64 year old males and 55 to 64 year old females are the most vulnerable to poverty, with 7 males (21.2%) and 8 females (26.7%) in their respective age groups living below the poverty level.
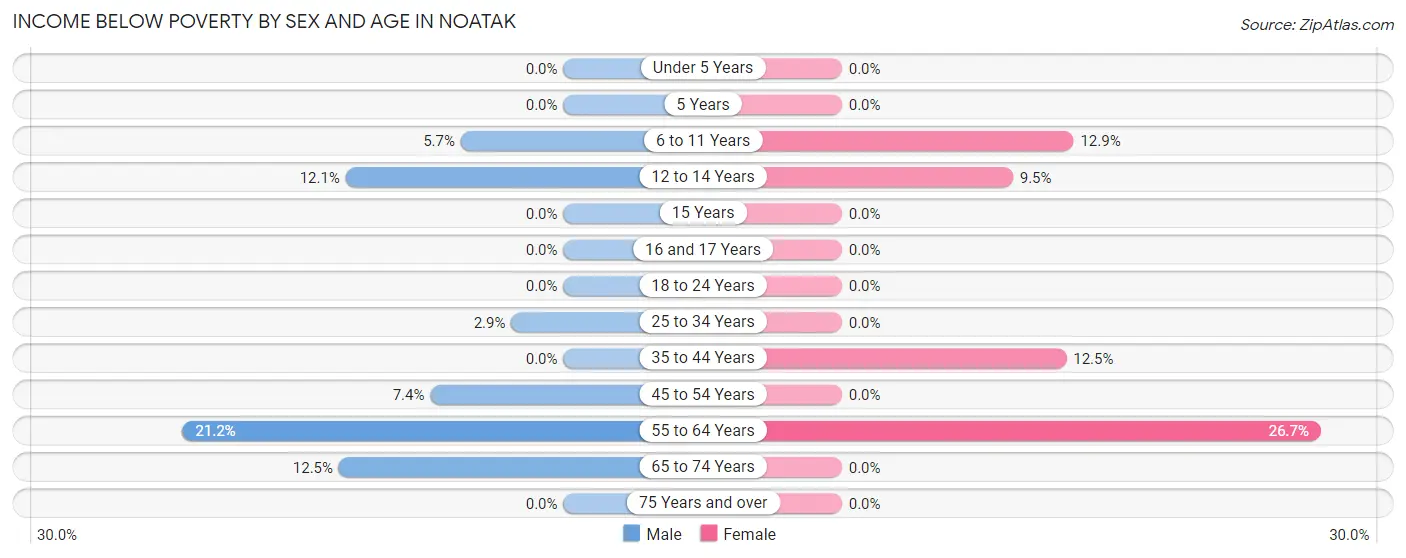
| Age Bracket | Male | Female |
| Under 5 Years | 0 (0.0%) | 0 (0.0%) |
| 5 Years | 0 (0.0%) | 0 (0.0%) |
| 6 to 11 Years | 2 (5.7%) | 4 (12.9%) |
| 12 to 14 Years | 4 (12.1%) | 2 (9.5%) |
| 15 Years | 0 (0.0%) | 0 (0.0%) |
| 16 and 17 Years | 0 (0.0%) | 0 (0.0%) |
| 18 to 24 Years | 0 (0.0%) | 0 (0.0%) |
| 25 to 34 Years | 2 (2.9%) | 0 (0.0%) |
| 35 to 44 Years | 0 (0.0%) | 2 (12.5%) |
| 45 to 54 Years | 2 (7.4%) | 0 (0.0%) |
| 55 to 64 Years | 7 (21.2%) | 8 (26.7%) |
| 65 to 74 Years | 2 (12.5%) | 0 (0.0%) |
| 75 Years and over | 0 (0.0%) | 0 (0.0%) |
| Total | 19 (6.0%) | 16 (7.3%) |
Income Above Poverty by Sex and Age in Noatak
According to the poverty statistics in Noatak, males aged under 5 years and females aged under 5 years are the age groups that are most secure financially, with 100.0% of males and 100.0% of females in these age groups living above the poverty line.
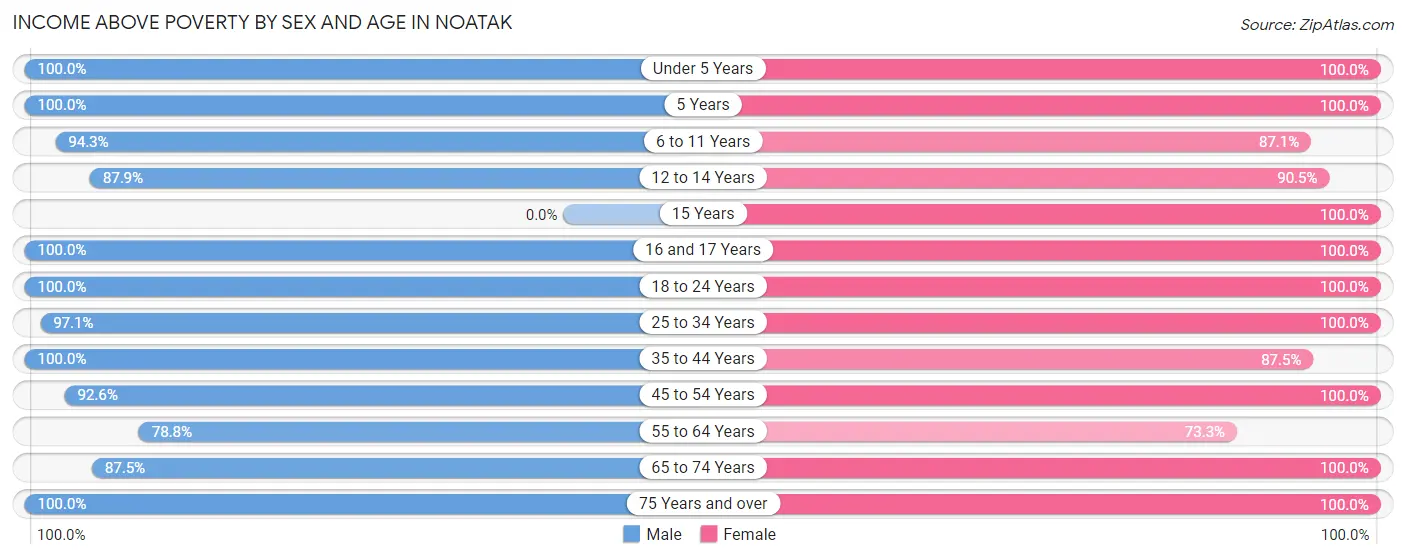
| Age Bracket | Male | Female |
| Under 5 Years | 22 (100.0%) | 21 (100.0%) |
| 5 Years | 11 (100.0%) | 2 (100.0%) |
| 6 to 11 Years | 33 (94.3%) | 27 (87.1%) |
| 12 to 14 Years | 29 (87.9%) | 19 (90.5%) |
| 15 Years | 0 (0.0%) | 2 (100.0%) |
| 16 and 17 Years | 16 (100.0%) | 6 (100.0%) |
| 18 to 24 Years | 33 (100.0%) | 28 (100.0%) |
| 25 to 34 Years | 67 (97.1%) | 17 (100.0%) |
| 35 to 44 Years | 16 (100.0%) | 14 (87.5%) |
| 45 to 54 Years | 25 (92.6%) | 30 (100.0%) |
| 55 to 64 Years | 26 (78.8%) | 22 (73.3%) |
| 65 to 74 Years | 14 (87.5%) | 8 (100.0%) |
| 75 Years and over | 6 (100.0%) | 7 (100.0%) |
| Total | 298 (94.0%) | 203 (92.7%) |
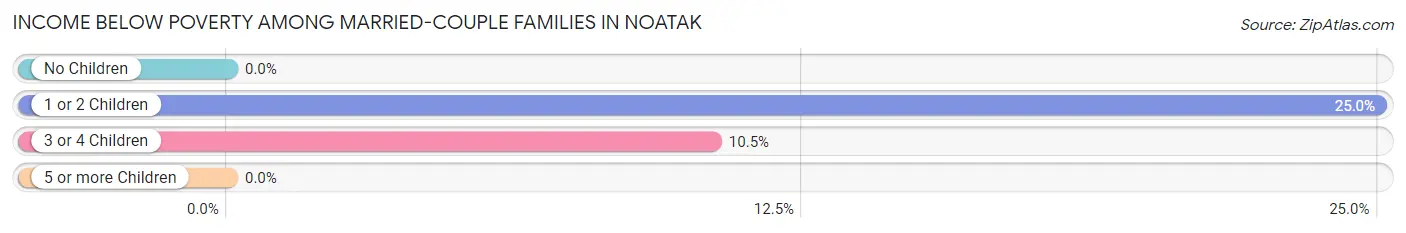
Income Below Poverty Among Married-Couple Families in Noatak
The poverty statistics for married-couple families in Noatak show that 16.1% or 10 of the total 62 families live below the poverty line. Families with 1 or 2 children have the highest poverty rate of 25.0%, comprising of 8 families. On the other hand, families with no children have the lowest poverty rate of 0.0%, which includes 0 families.
| Children | Above Poverty | Below Poverty |
| No Children | 3 (100.0%) | 0 (0.0%) |
| 1 or 2 Children | 24 (75.0%) | 8 (25.0%) |
| 3 or 4 Children | 17 (89.5%) | 2 (10.5%) |
| 5 or more Children | 8 (100.0%) | 0 (0.0%) |
| Total | 52 (83.9%) | 10 (16.1%) |
Income Below Poverty Among Single-Parent Households in Noatak
| Children | Single Father | Single Mother |
| No Children | 0 (0.0%) | 0 (0.0%) |
| 1 or 2 Children | 0 (0.0%) | 0 (0.0%) |
| 3 or 4 Children | 0 (0.0%) | 0 (0.0%) |
| 5 or more Children | 0 (0.0%) | 0 (0.0%) |
| Total | 0 (0.0%) | 0 (0.0%) |
Income Below Poverty Among Married-Couple vs Single-Parent Households in Noatak
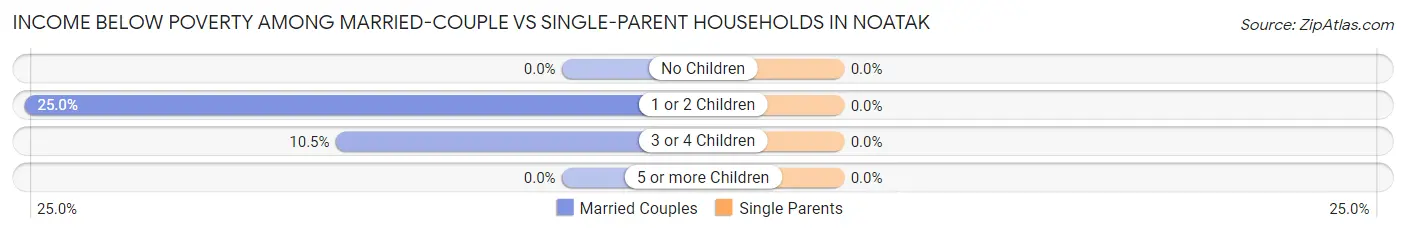
| Children | Married-Couple Families | Single-Parent Households |
| No Children | 0 (0.0%) | 0 (0.0%) |
| 1 or 2 Children | 8 (25.0%) | 0 (0.0%) |
| 3 or 4 Children | 2 (10.5%) | 0 (0.0%) |
| 5 or more Children | 0 (0.0%) | 0 (0.0%) |
| Total | 10 (16.1%) | 0 (0.0%) |
Race in Noatak
The most populous races in Noatak are Native / Alaskan (526 | 98.1%), White / Caucasian (6 | 1.1%), and Black / African American (4 | 0.7%).
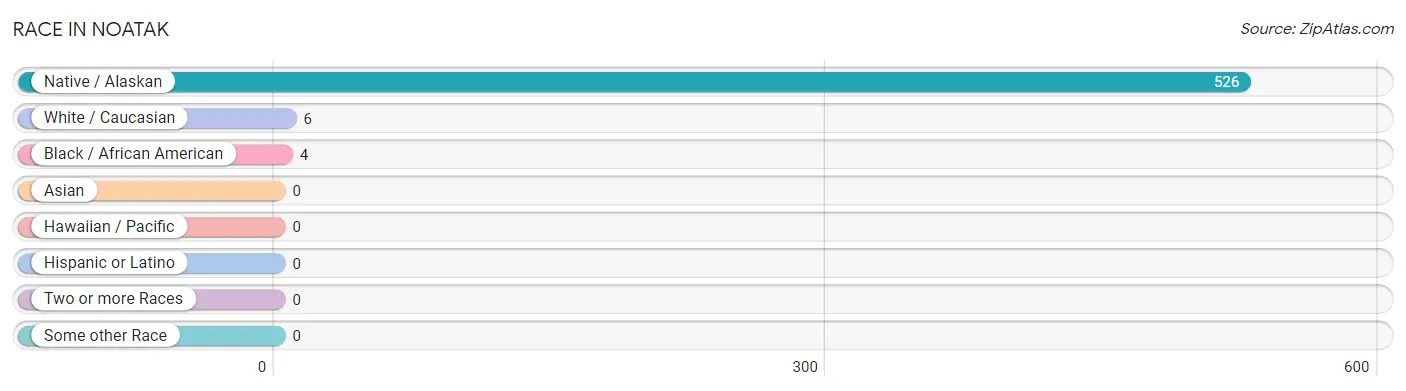
| Race | # Population | % Population |
| Asian | 0 | 0.0% |
| Black / African American | 4 | 0.7% |
| Hawaiian / Pacific | 0 | 0.0% |
| Hispanic or Latino | 0 | 0.0% |
| Native / Alaskan | 526 | 98.1% |
| White / Caucasian | 6 | 1.1% |
| Two or more Races | 0 | 0.0% |
| Some other Race | 0 | 0.0% |
| Total | 536 | 100.0% |
Ancestry in Noatak
The most populous ancestries reported in Noatak are Inupiat (515 | 96.1%), Alaskan Athabascan (9 | 1.7%), and Yup'ik (2 | 0.4%), together accounting for 98.1% of all Noatak residents.
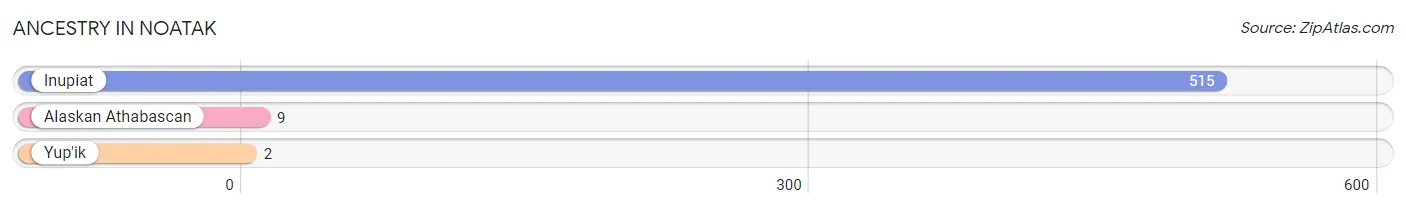
| Ancestry | # Population | % Population |
| Alaskan Athabascan | 9 | 1.7% |
| Inupiat | 515 | 96.1% |
| Yup'ik | 2 | 0.4% | View All 3 Rows |
Immigrants in Noatak

| Immigration Origin | # Population | % Population | View All 0 Rows |
Sex and Age in Noatak
Sex and Age in Noatak
The most populous age groups in Noatak are 10 to 14 Years (51 | 16.1%) for men and 10 to 14 Years (41 | 18.7%) for women.
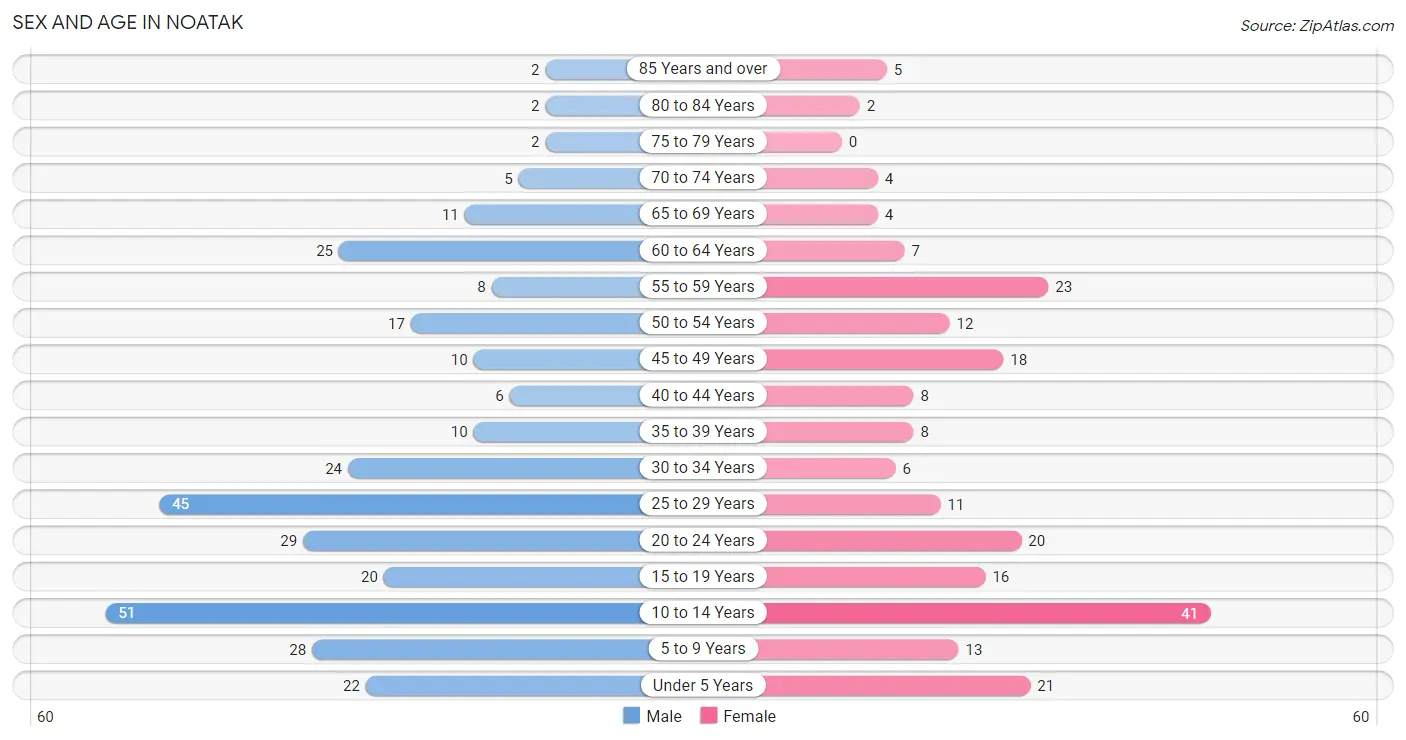
| Age Bracket | Male | Female |
| Under 5 Years | 22 (6.9%) | 21 (9.6%) |
| 5 to 9 Years | 28 (8.8%) | 13 (5.9%) |
| 10 to 14 Years | 51 (16.1%) | 41 (18.7%) |
| 15 to 19 Years | 20 (6.3%) | 16 (7.3%) |
| 20 to 24 Years | 29 (9.1%) | 20 (9.1%) |
| 25 to 29 Years | 45 (14.2%) | 11 (5.0%) |
| 30 to 34 Years | 24 (7.6%) | 6 (2.7%) |
| 35 to 39 Years | 10 (3.2%) | 8 (3.6%) |
| 40 to 44 Years | 6 (1.9%) | 8 (3.6%) |
| 45 to 49 Years | 10 (3.2%) | 18 (8.2%) |
| 50 to 54 Years | 17 (5.4%) | 12 (5.5%) |
| 55 to 59 Years | 8 (2.5%) | 23 (10.5%) |
| 60 to 64 Years | 25 (7.9%) | 7 (3.2%) |
| 65 to 69 Years | 11 (3.5%) | 4 (1.8%) |
| 70 to 74 Years | 5 (1.6%) | 4 (1.8%) |
| 75 to 79 Years | 2 (0.6%) | 0 (0.0%) |
| 80 to 84 Years | 2 (0.6%) | 2 (0.9%) |
| 85 Years and over | 2 (0.6%) | 5 (2.3%) |
| Total | 317 (100.0%) | 219 (100.0%) |
Families and Households in Noatak
Median Family Size in Noatak
The median family size in Noatak is 5.56 persons per family, with married-couple families (62 | 66.0%) accounting for the largest median family size of 6.05 persons per family. On the other hand, single female/mother families (21 | 22.3%) represent the smallest median family size with 4.33 persons per family.
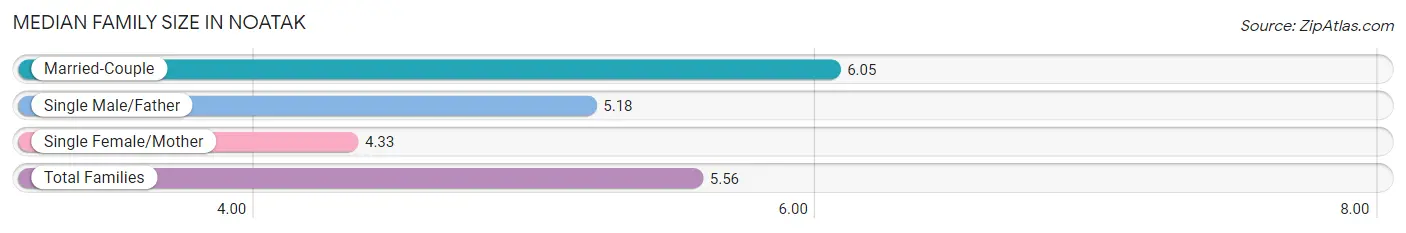
| Family Type | # Families | Family Size |
| Married-Couple | 62 (66.0%) | 6.05 |
| Single Male/Father | 11 (11.7%) | 5.18 |
| Single Female/Mother | 21 (22.3%) | 4.33 |
| Total Families | 94 (100.0%) | 5.56 |
Median Household Size in Noatak
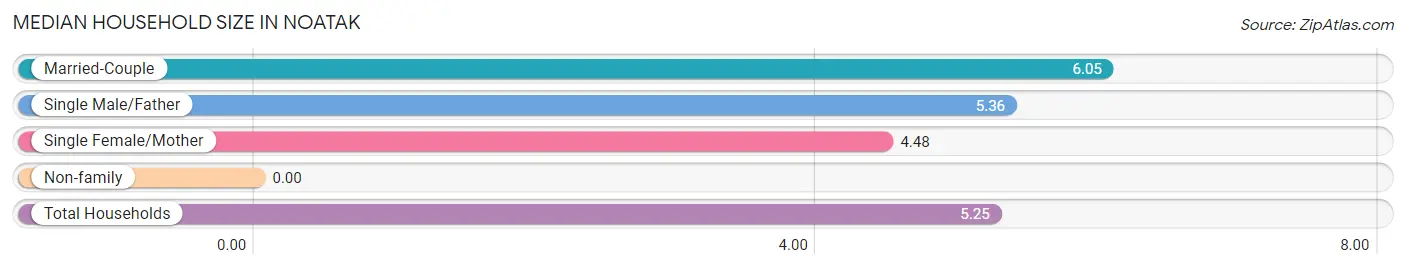
| Household Type | # Households | Household Size |
| Married-Couple | 62 (60.8%) | 6.05 |
| Single Male/Father | 11 (10.8%) | 5.36 |
| Single Female/Mother | 21 (20.6%) | 4.48 |
| Non-family | 8 (7.8%) | - |
| Total Households | 102 (100.0%) | 5.25 |
Household Size by Marriage Status in Noatak
Out of a total of 102 households in Noatak, 94 (92.2%) are family households, while 8 (7.8%) are nonfamily households. The most numerous type of family households are 4-person households, comprising 23, and the most common type of nonfamily households are 1-person households, comprising 8.
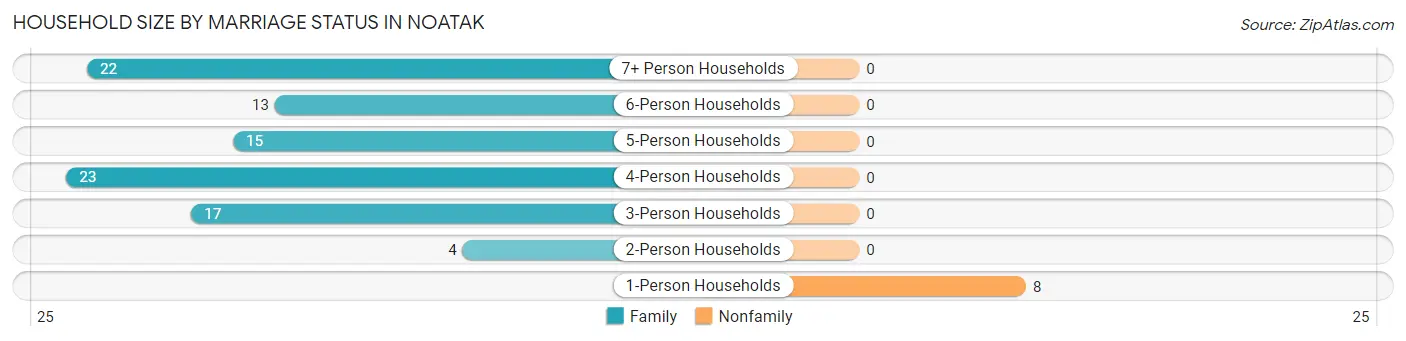
| Household Size | Family Households | Nonfamily Households |
| 1-Person Households | - | 8 (7.8%) |
| 2-Person Households | 4 (3.9%) | 0 (0.0%) |
| 3-Person Households | 17 (16.7%) | 0 (0.0%) |
| 4-Person Households | 23 (22.6%) | 0 (0.0%) |
| 5-Person Households | 15 (14.7%) | 0 (0.0%) |
| 6-Person Households | 13 (12.8%) | 0 (0.0%) |
| 7+ Person Households | 22 (21.6%) | 0 (0.0%) |
| Total | 94 (92.2%) | 8 (7.8%) |
Female Fertility in Noatak
Fertility by Age in Noatak
Average fertility rate in Noatak is 55.0 births per 1,000 women. Women in the age bracket of 20 to 34 years have the highest fertility rate with 135.0 births per 1,000 women. Women in the age bracket of 20 to 34 years acount for 100.0% of all women with births.
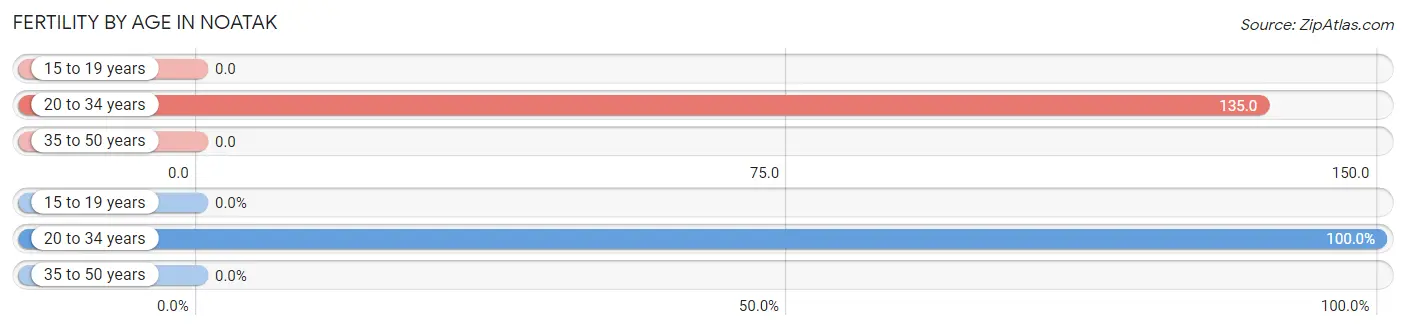
| Age Bracket | Women with Births | Births / 1,000 Women |
| 15 to 19 years | 0 (0.0%) | 0.0 |
| 20 to 34 years | 5 (100.0%) | 135.0 |
| 35 to 50 years | 0 (0.0%) | 0.0 |
| Total | 5 (100.0%) | 55.0 |
Fertility by Age by Marriage Status in Noatak
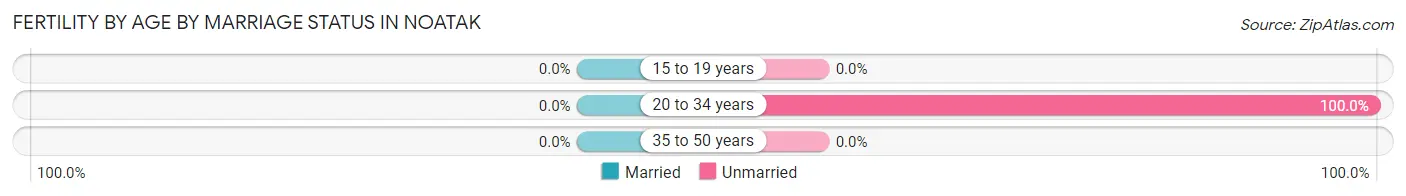
| Age Bracket | Married | Unmarried |
| 15 to 19 years | 0 (0.0%) | 0 (0.0%) |
| 20 to 34 years | 0 (0.0%) | 5 (100.0%) |
| 35 to 50 years | 0 (0.0%) | 0 (0.0%) |
| Total | 0 (0.0%) | 5 (100.0%) |
Fertility by Education in Noatak
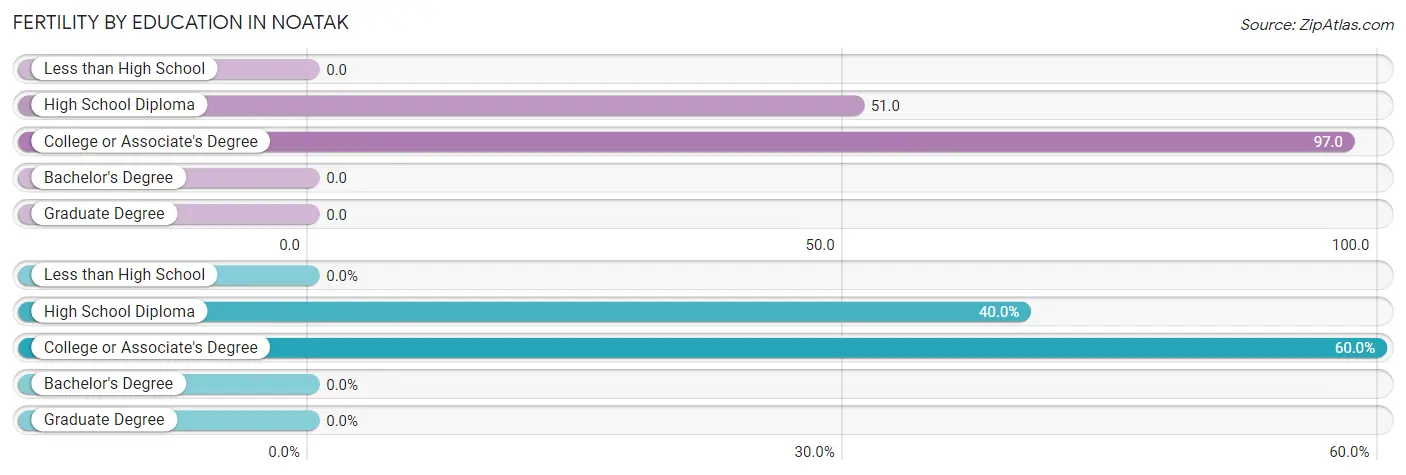
| Educational Attainment | Women with Births | Births / 1,000 Women |
| Less than High School | 0 (0.0%) | 0.0 |
| High School Diploma | 2 (40.0%) | 51.0 |
| College or Associate's Degree | 3 (60.0%) | 97.0 |
| Bachelor's Degree | 0 (0.0%) | 0.0 |
| Graduate Degree | 0 (0.0%) | 0.0 |
| Total | 5 (100.0%) | 55.0 |
Fertility by Education by Marriage Status in Noatak
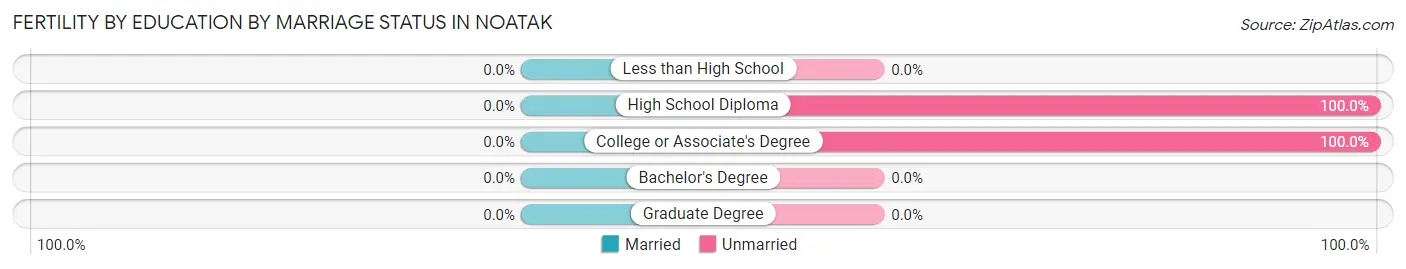
| Educational Attainment | Married | Unmarried |
| Less than High School | 0 (0.0%) | 0 (0.0%) |
| High School Diploma | 0 (0.0%) | 2 (100.0%) |
| College or Associate's Degree | 0 (0.0%) | 3 (100.0%) |
| Bachelor's Degree | 0 (0.0%) | 0 (0.0%) |
| Graduate Degree | 0 (0.0%) | 0 (0.0%) |
| Total | 0 (0.0%) | 5 (100.0%) |
Employment Characteristics in Noatak
Employment by Class of Employer in Noatak
Among the 114 employed individuals in Noatak, private company employees (50 | 43.9%), local government employees (38 | 33.3%), and not-for-profit organizations (11 | 9.7%) make up the most common classes of employment.
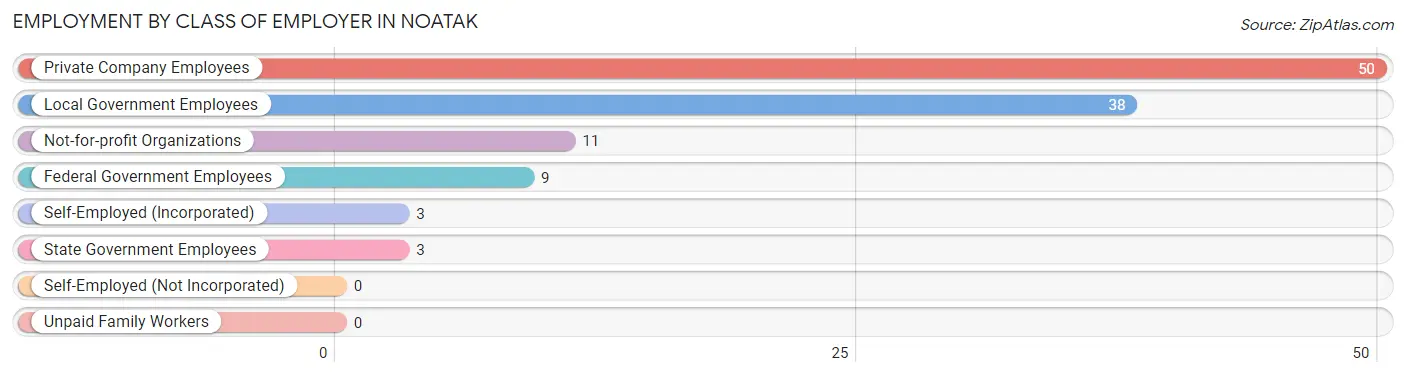
| Employer Class | # Employees | % Employees |
| Private Company Employees | 50 | 43.9% |
| Self-Employed (Incorporated) | 3 | 2.6% |
| Self-Employed (Not Incorporated) | 0 | 0.0% |
| Not-for-profit Organizations | 11 | 9.7% |
| Local Government Employees | 38 | 33.3% |
| State Government Employees | 3 | 2.6% |
| Federal Government Employees | 9 | 7.9% |
| Unpaid Family Workers | 0 | 0.0% |
| Total | 114 | 100.0% |
Employment Status by Age in Noatak
According to the labor force statistics for Noatak, out of the total population over 16 years of age (358), 55.0% or 197 individuals are in the labor force, with 35.5% or 70 of them unemployed. The age group with the highest labor force participation rate is 30 to 34 years, with 90.0% or 27 individuals in the labor force. Within the labor force, the 16 to 19 years age range has the highest percentage of unemployed individuals, with 100.0% or 3 of them being unemployed.
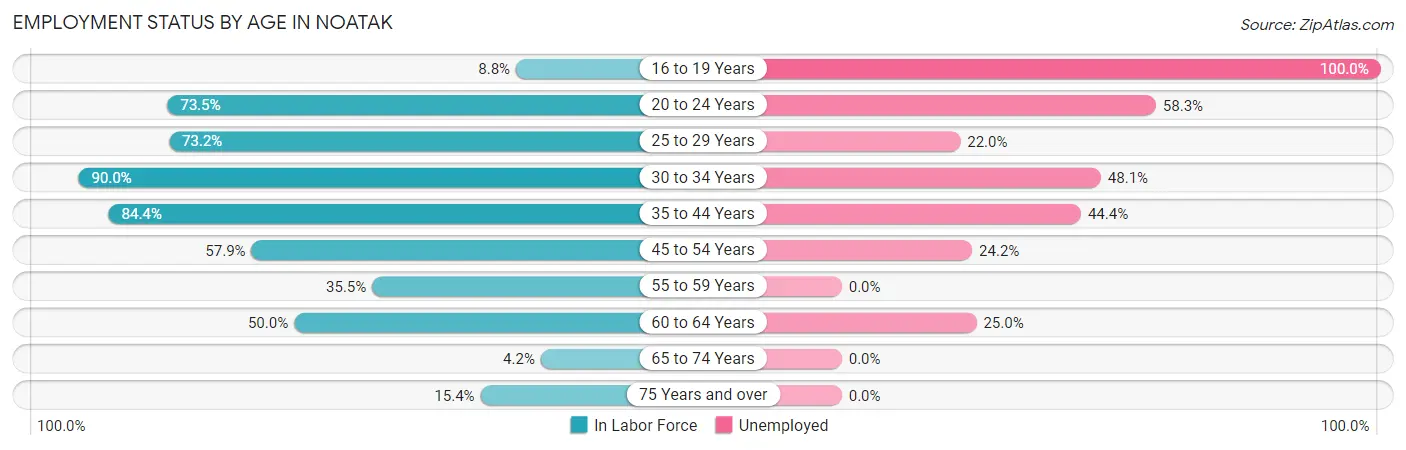
| Age Bracket | In Labor Force | Unemployed |
| 16 to 19 Years | 3 (8.8%) | 3 (100.0%) |
| 20 to 24 Years | 36 (73.5%) | 21 (58.3%) |
| 25 to 29 Years | 41 (73.2%) | 9 (22.0%) |
| 30 to 34 Years | 27 (90.0%) | 13 (48.1%) |
| 35 to 44 Years | 27 (84.4%) | 12 (44.4%) |
| 45 to 54 Years | 33 (57.9%) | 8 (24.2%) |
| 55 to 59 Years | 11 (35.5%) | 0 (0.0%) |
| 60 to 64 Years | 16 (50.0%) | 4 (25.0%) |
| 65 to 74 Years | 1 (4.2%) | 0 (0.0%) |
| 75 Years and over | 2 (15.4%) | 0 (0.0%) |
| Total | 197 (55.0%) | 70 (35.5%) |
Employment Status by Educational Attainment in Noatak
According to labor force statistics for Noatak, 65.1% of individuals (155) out of the total population between 25 and 64 years of age (238) are in the labor force, with 29.7% or 46 of them being unemployed. The group with the highest labor force participation rate are those with the educational attainment of bachelor's degree or higher, with 100.0% or 11 individuals in the labor force. Within the labor force, individuals with less than high school education have the highest percentage of unemployment, with 50.0% or 7 of them being unemployed.
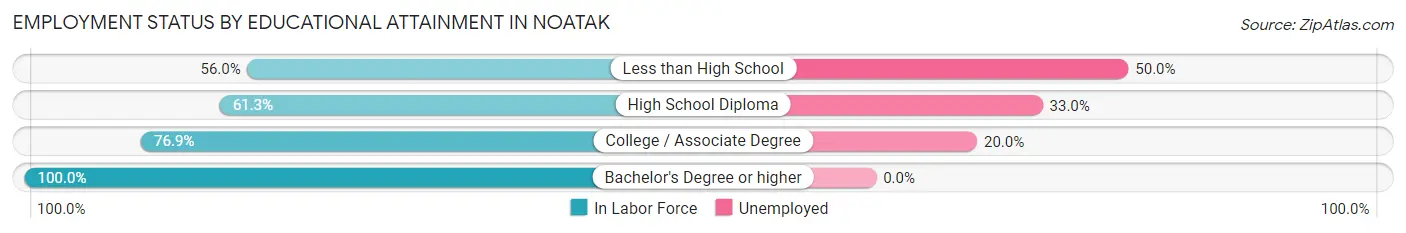
| Educational Attainment | In Labor Force | Unemployed |
| Less than High School | 14 (56.0%) | 12 (50.0%) |
| High School Diploma | 100 (61.3%) | 54 (33.0%) |
| College / Associate Degree | 30 (76.9%) | 8 (20.0%) |
| Bachelor's Degree or higher | 11 (100.0%) | 0 (0.0%) |
| Total | 155 (65.1%) | 71 (29.7%) |
Employment Occupations by Sex in Noatak
Management, Business, Science and Arts Occupations
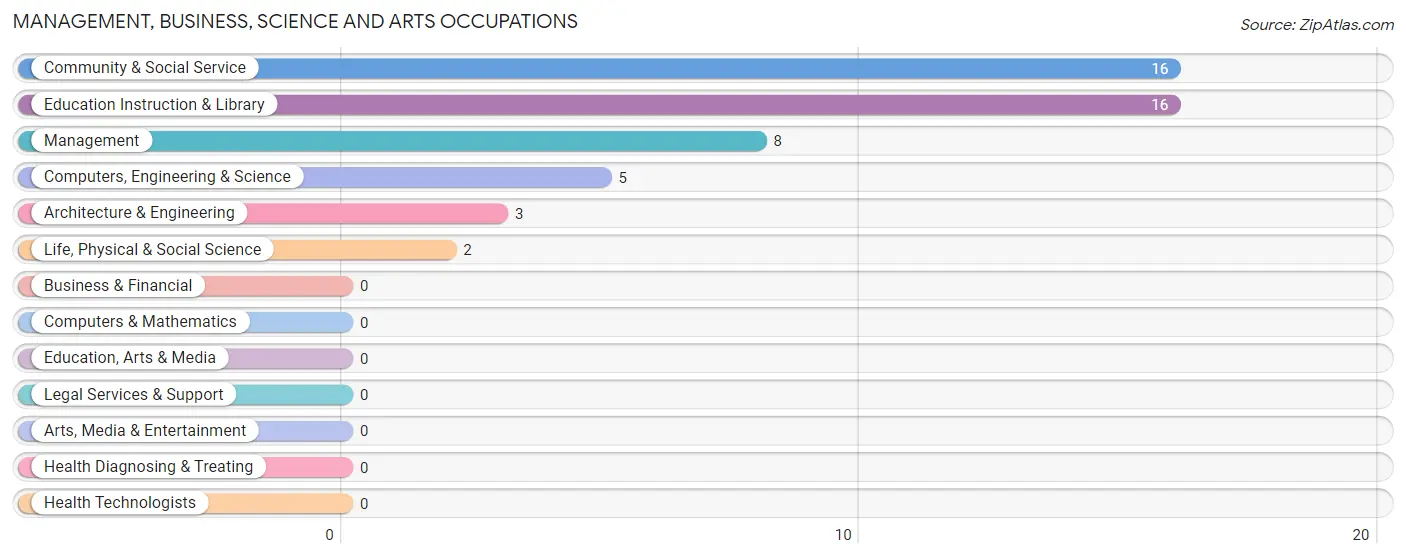
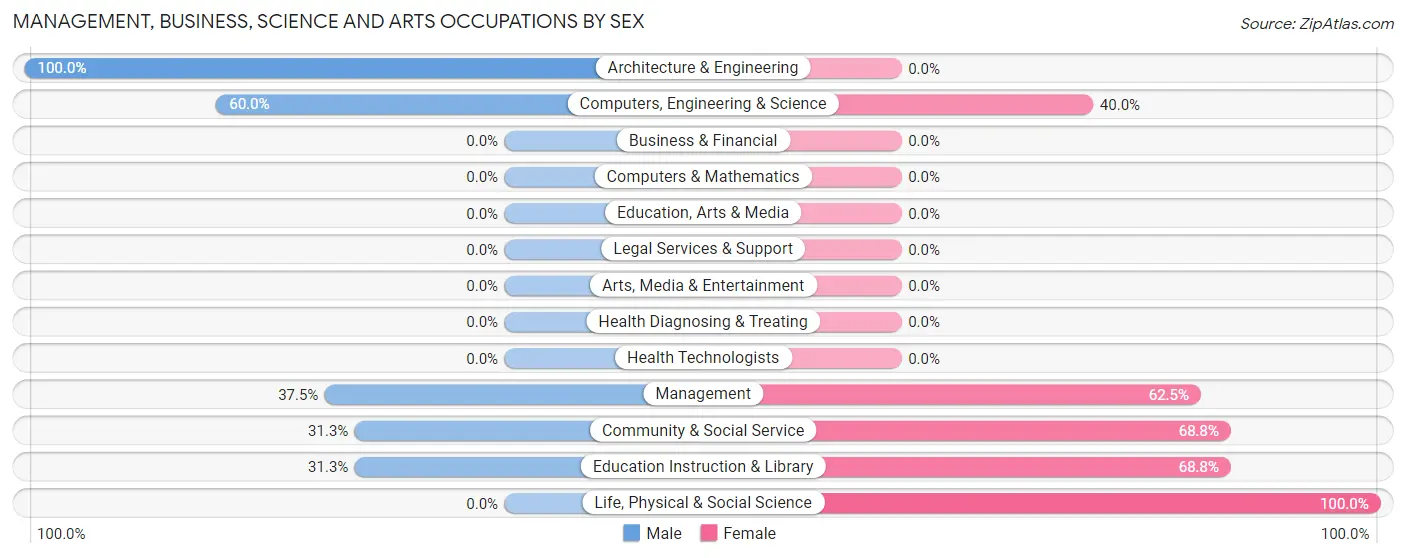
The most common Management, Business, Science and Arts occupations in Noatak are Community & Social Service (16 | 12.6%), Education Instruction & Library (16 | 12.6%), Management (8 | 6.3%), Computers, Engineering & Science (5 | 3.9%), and Architecture & Engineering (3 | 2.4%).
Management, Business, Science and Arts Occupations by Sex
Within the Management, Business, Science and Arts occupations in Noatak, the most male-oriented occupations are Architecture & Engineering (100.0%), Computers, Engineering & Science (60.0%), and Management (37.5%), while the most female-oriented occupations are Life, Physical & Social Science (100.0%), Community & Social Service (68.8%), and Education Instruction & Library (68.8%).
| Occupation | Male | Female |
| Management | 3 (37.5%) | 5 (62.5%) |
| Business & Financial | 0 (0.0%) | 0 (0.0%) |
| Computers, Engineering & Science | 3 (60.0%) | 2 (40.0%) |
| Computers & Mathematics | 0 (0.0%) | 0 (0.0%) |
| Architecture & Engineering | 3 (100.0%) | 0 (0.0%) |
| Life, Physical & Social Science | 0 (0.0%) | 2 (100.0%) |
| Community & Social Service | 5 (31.2%) | 11 (68.8%) |
| Education, Arts & Media | 0 (0.0%) | 0 (0.0%) |
| Legal Services & Support | 0 (0.0%) | 0 (0.0%) |
| Education Instruction & Library | 5 (31.2%) | 11 (68.8%) |
| Arts, Media & Entertainment | 0 (0.0%) | 0 (0.0%) |
| Health Diagnosing & Treating | 0 (0.0%) | 0 (0.0%) |
| Health Technologists | 0 (0.0%) | 0 (0.0%) |
| Total (Category) | 11 (37.9%) | 18 (62.1%) |
| Total (Overall) | 82 (64.6%) | 45 (35.4%) |
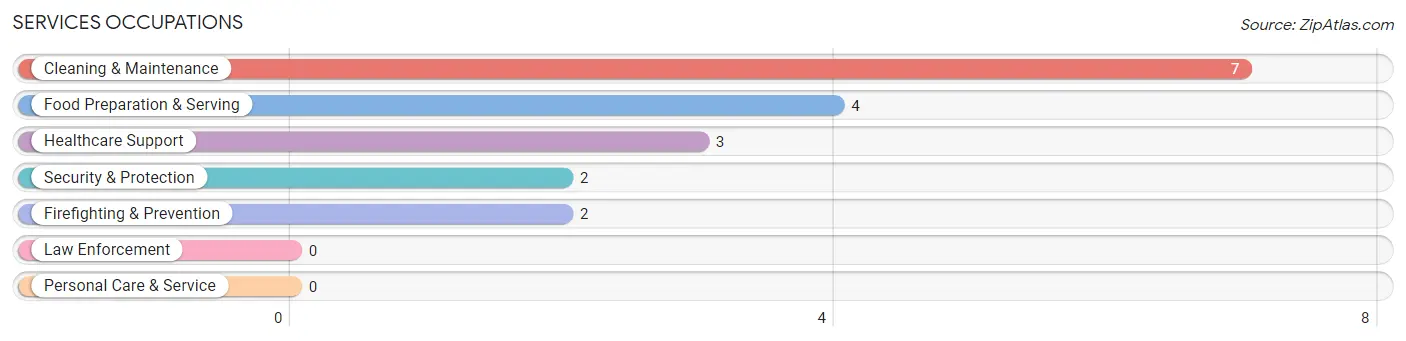
Services Occupations
The most common Services occupations in Noatak are Cleaning & Maintenance (7 | 5.5%), Food Preparation & Serving (4 | 3.2%), Healthcare Support (3 | 2.4%), Security & Protection (2 | 1.6%), and Firefighting & Prevention (2 | 1.6%).
Services Occupations by Sex
Within the Services occupations in Noatak, the most male-oriented occupations are Security & Protection (100.0%), Firefighting & Prevention (100.0%), and Food Preparation & Serving (100.0%), while the most female-oriented occupations are Healthcare Support (66.7%), and Cleaning & Maintenance (28.6%).
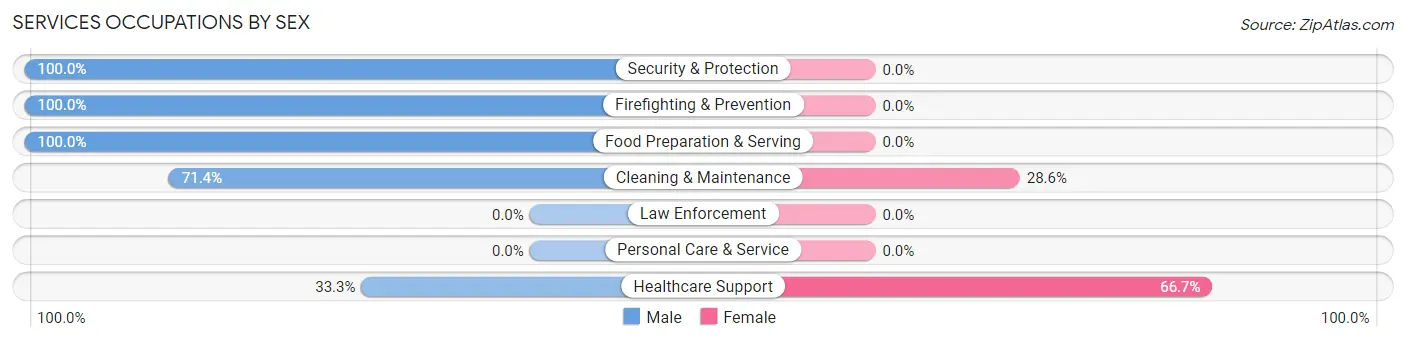
| Occupation | Male | Female |
| Healthcare Support | 1 (33.3%) | 2 (66.7%) |
| Security & Protection | 2 (100.0%) | 0 (0.0%) |
| Firefighting & Prevention | 2 (100.0%) | 0 (0.0%) |
| Law Enforcement | 0 (0.0%) | 0 (0.0%) |
| Food Preparation & Serving | 4 (100.0%) | 0 (0.0%) |
| Cleaning & Maintenance | 5 (71.4%) | 2 (28.6%) |
| Personal Care & Service | 0 (0.0%) | 0 (0.0%) |
| Total (Category) | 12 (75.0%) | 4 (25.0%) |
| Total (Overall) | 82 (64.6%) | 45 (35.4%) |
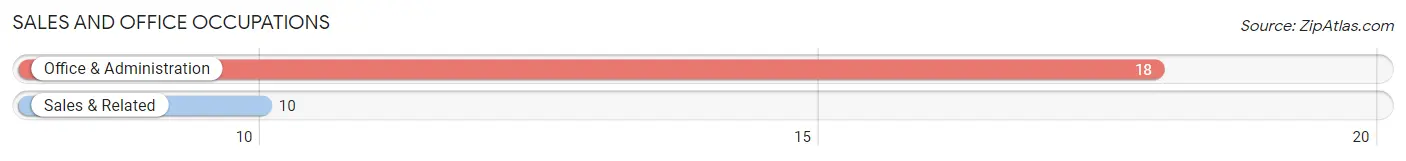
Sales and Office Occupations
The most common Sales and Office occupations in Noatak are Office & Administration (18 | 14.2%), and Sales & Related (10 | 7.9%).
Sales and Office Occupations by Sex
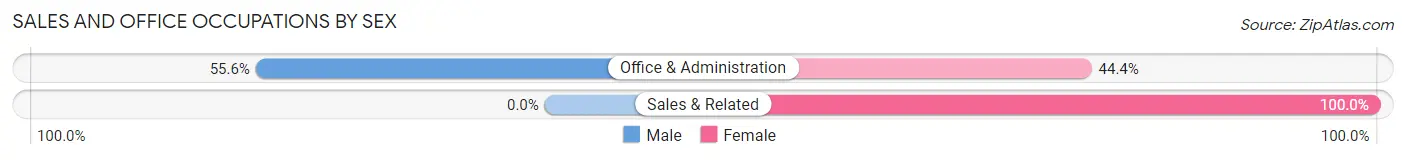
| Occupation | Male | Female |
| Sales & Related | 0 (0.0%) | 10 (100.0%) |
| Office & Administration | 10 (55.6%) | 8 (44.4%) |
| Total (Category) | 10 (35.7%) | 18 (64.3%) |
| Total (Overall) | 82 (64.6%) | 45 (35.4%) |
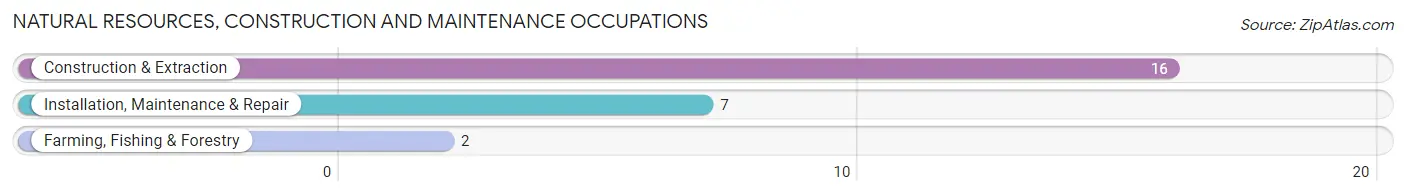
Natural Resources, Construction and Maintenance Occupations
The most common Natural Resources, Construction and Maintenance occupations in Noatak are Construction & Extraction (16 | 12.6%), Installation, Maintenance & Repair (7 | 5.5%), and Farming, Fishing & Forestry (2 | 1.6%).
Natural Resources, Construction and Maintenance Occupations by Sex
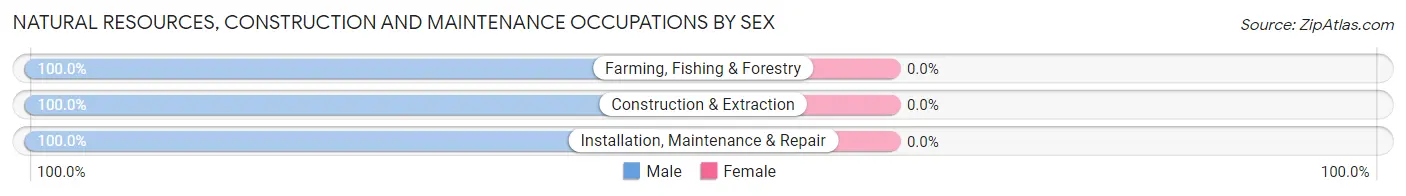
| Occupation | Male | Female |
| Farming, Fishing & Forestry | 2 (100.0%) | 0 (0.0%) |
| Construction & Extraction | 16 (100.0%) | 0 (0.0%) |
| Installation, Maintenance & Repair | 7 (100.0%) | 0 (0.0%) |
| Total (Category) | 25 (100.0%) | 0 (0.0%) |
| Total (Overall) | 82 (64.6%) | 45 (35.4%) |
Production, Transportation and Moving Occupations
The most common Production, Transportation and Moving occupations in Noatak are Material Moving (17 | 13.4%), Production (10 | 7.9%), and Transportation (2 | 1.6%).
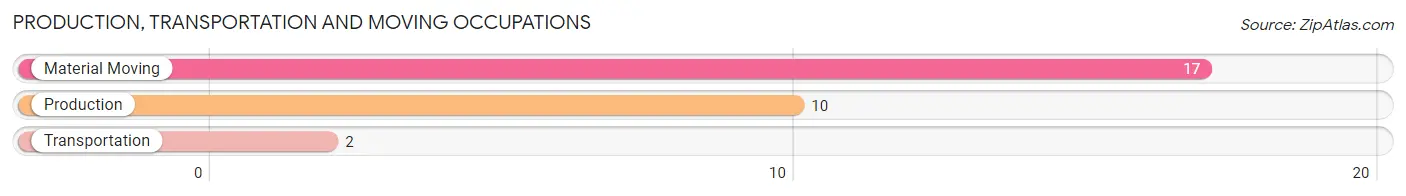
Production, Transportation and Moving Occupations by Sex
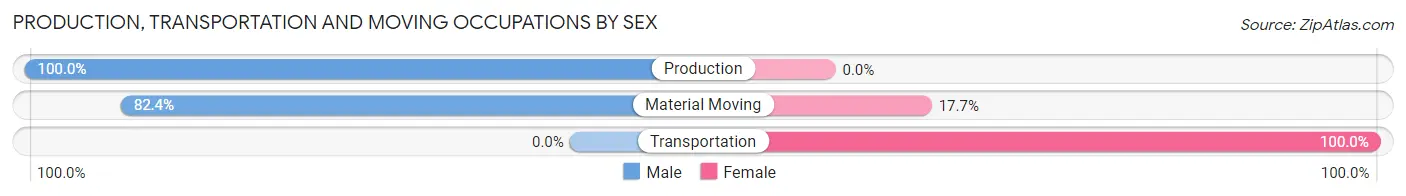
| Occupation | Male | Female |
| Production | 10 (100.0%) | 0 (0.0%) |
| Transportation | 0 (0.0%) | 2 (100.0%) |
| Material Moving | 14 (82.4%) | 3 (17.6%) |
| Total (Category) | 24 (82.8%) | 5 (17.2%) |
| Total (Overall) | 82 (64.6%) | 45 (35.4%) |
Employment Industries by Sex in Noatak
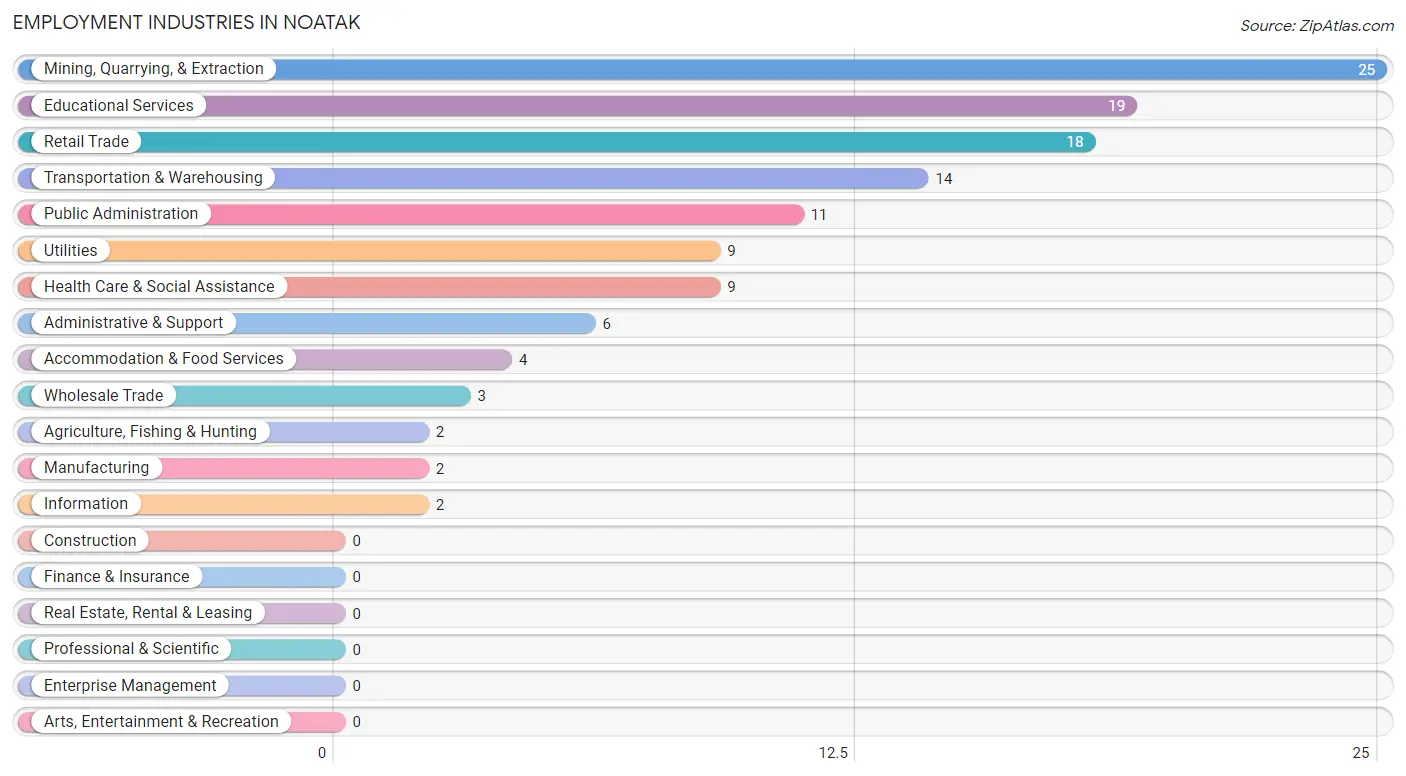
Employment Industries in Noatak
The major employment industries in Noatak include Mining, Quarrying, & Extraction (25 | 19.7%), Educational Services (19 | 15.0%), Retail Trade (18 | 14.2%), Transportation & Warehousing (14 | 11.0%), and Public Administration (11 | 8.7%).
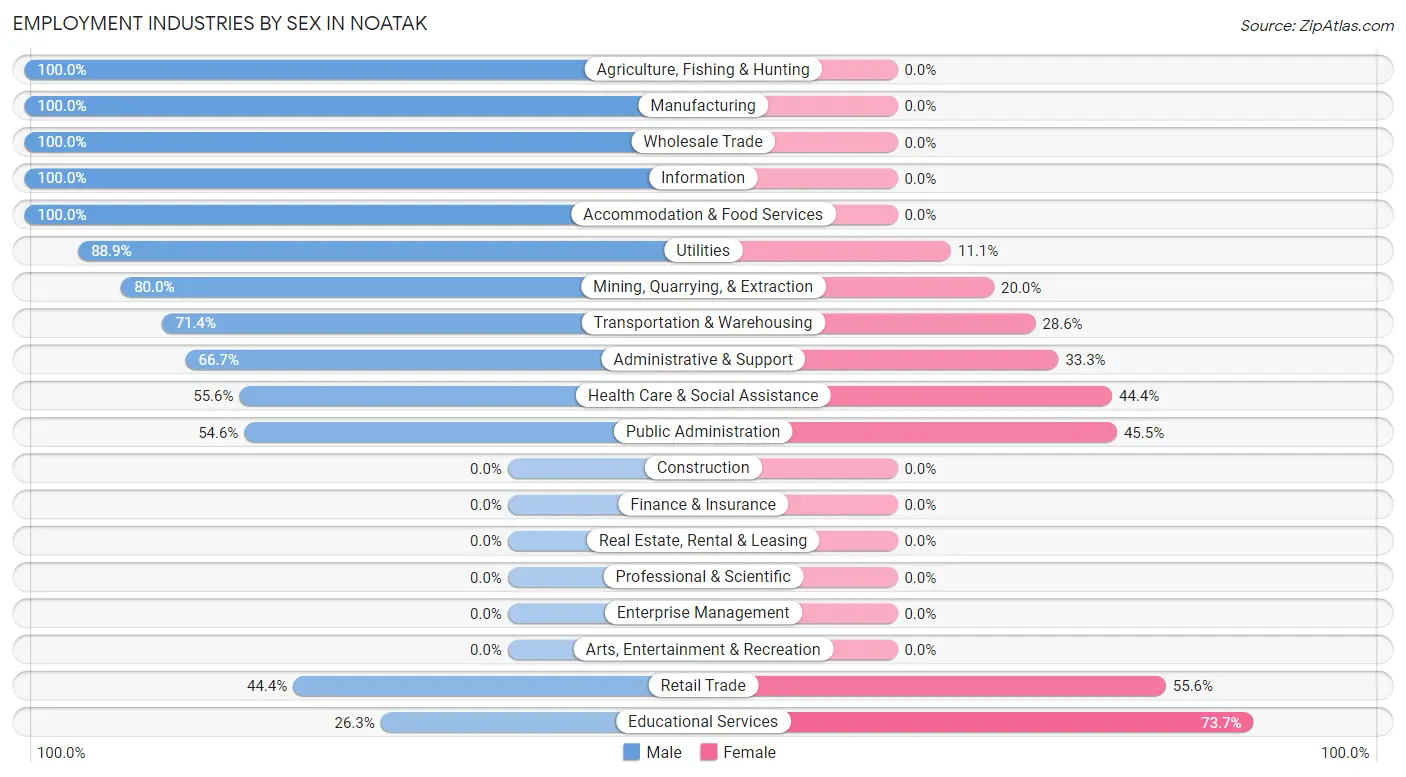
Employment Industries by Sex in Noatak
The Noatak industries that see more men than women are Agriculture, Fishing & Hunting (100.0%), Manufacturing (100.0%), and Wholesale Trade (100.0%), whereas the industries that tend to have a higher number of women are Educational Services (73.7%), Retail Trade (55.6%), and Public Administration (45.5%).
| Industry | Male | Female |
| Agriculture, Fishing & Hunting | 2 (100.0%) | 0 (0.0%) |
| Mining, Quarrying, & Extraction | 20 (80.0%) | 5 (20.0%) |
| Construction | 0 (0.0%) | 0 (0.0%) |
| Manufacturing | 2 (100.0%) | 0 (0.0%) |
| Wholesale Trade | 3 (100.0%) | 0 (0.0%) |
| Retail Trade | 8 (44.4%) | 10 (55.6%) |
| Transportation & Warehousing | 10 (71.4%) | 4 (28.6%) |
| Utilities | 8 (88.9%) | 1 (11.1%) |
| Information | 2 (100.0%) | 0 (0.0%) |
| Finance & Insurance | 0 (0.0%) | 0 (0.0%) |
| Real Estate, Rental & Leasing | 0 (0.0%) | 0 (0.0%) |
| Professional & Scientific | 0 (0.0%) | 0 (0.0%) |
| Enterprise Management | 0 (0.0%) | 0 (0.0%) |
| Administrative & Support | 4 (66.7%) | 2 (33.3%) |
| Educational Services | 5 (26.3%) | 14 (73.7%) |
| Health Care & Social Assistance | 5 (55.6%) | 4 (44.4%) |
| Arts, Entertainment & Recreation | 0 (0.0%) | 0 (0.0%) |
| Accommodation & Food Services | 4 (100.0%) | 0 (0.0%) |
| Public Administration | 6 (54.5%) | 5 (45.5%) |
| Total | 82 (64.6%) | 45 (35.4%) |
Education in Noatak
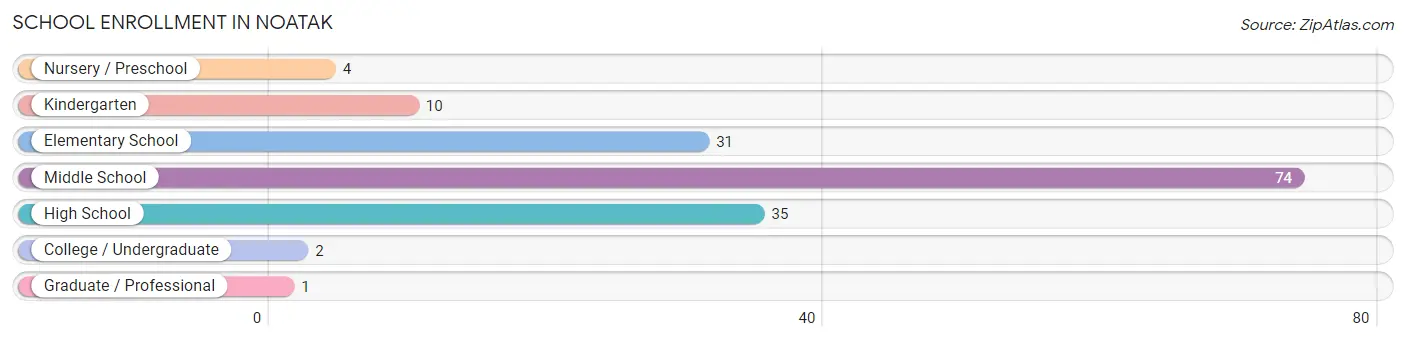
School Enrollment in Noatak
The most common levels of schooling among the 157 students in Noatak are middle school (74 | 47.1%), high school (35 | 22.3%), and elementary school (31 | 19.8%).
| School Level | # Students | % Students |
| Nursery / Preschool | 4 | 2.5% |
| Kindergarten | 10 | 6.4% |
| Elementary School | 31 | 19.8% |
| Middle School | 74 | 47.1% |
| High School | 35 | 22.3% |
| College / Undergraduate | 2 | 1.3% |
| Graduate / Professional | 1 | 0.6% |
| Total | 157 | 100.0% |
School Enrollment by Age by Funding Source in Noatak
Out of a total of 157 students who are enrolled in schools in Noatak, 4 (2.5%) attend a private institution, while the remaining 153 (97.5%) are enrolled in public schools. The age group of 5 to 9 year old has the highest likelihood of being enrolled in private schools, with 2 (5.7% in the age bracket) enrolled. Conversely, the age group of 3 to 4 year olds has the lowest likelihood of being enrolled in a private school, with 4 (100.0% in the age bracket) attending a public institution.
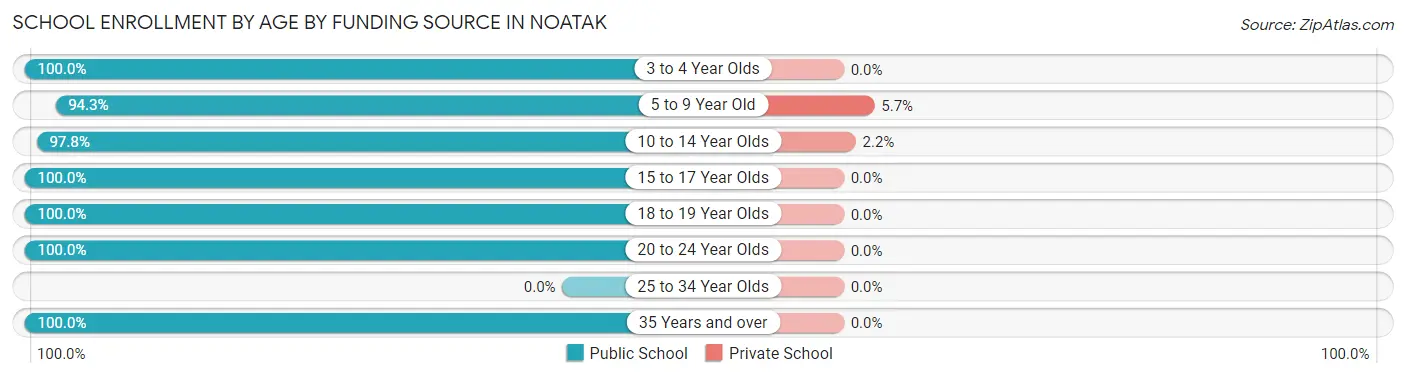
| Age Bracket | Public School | Private School |
| 3 to 4 Year Olds | 4 (100.0%) | 0 (0.0%) |
| 5 to 9 Year Old | 33 (94.3%) | 2 (5.7%) |
| 10 to 14 Year Olds | 88 (97.8%) | 2 (2.2%) |
| 15 to 17 Year Olds | 22 (100.0%) | 0 (0.0%) |
| 18 to 19 Year Olds | 3 (100.0%) | 0 (0.0%) |
| 20 to 24 Year Olds | 1 (100.0%) | 0 (0.0%) |
| 25 to 34 Year Olds | 0 (0.0%) | 0 (0.0%) |
| 35 Years and over | 2 (100.0%) | 0 (0.0%) |
| Total | 153 (97.5%) | 4 (2.5%) |
Educational Attainment by Field of Study in Noatak
Engineering (3 | 21.4%), literature & languages (3 | 21.4%), visual & performing arts (3 | 21.4%), bio, nature & agricultural (2 | 14.3%), and liberal arts & history (2 | 14.3%) are the most common fields of study among 14 individuals in Noatak who have obtained a bachelor's degree or higher.
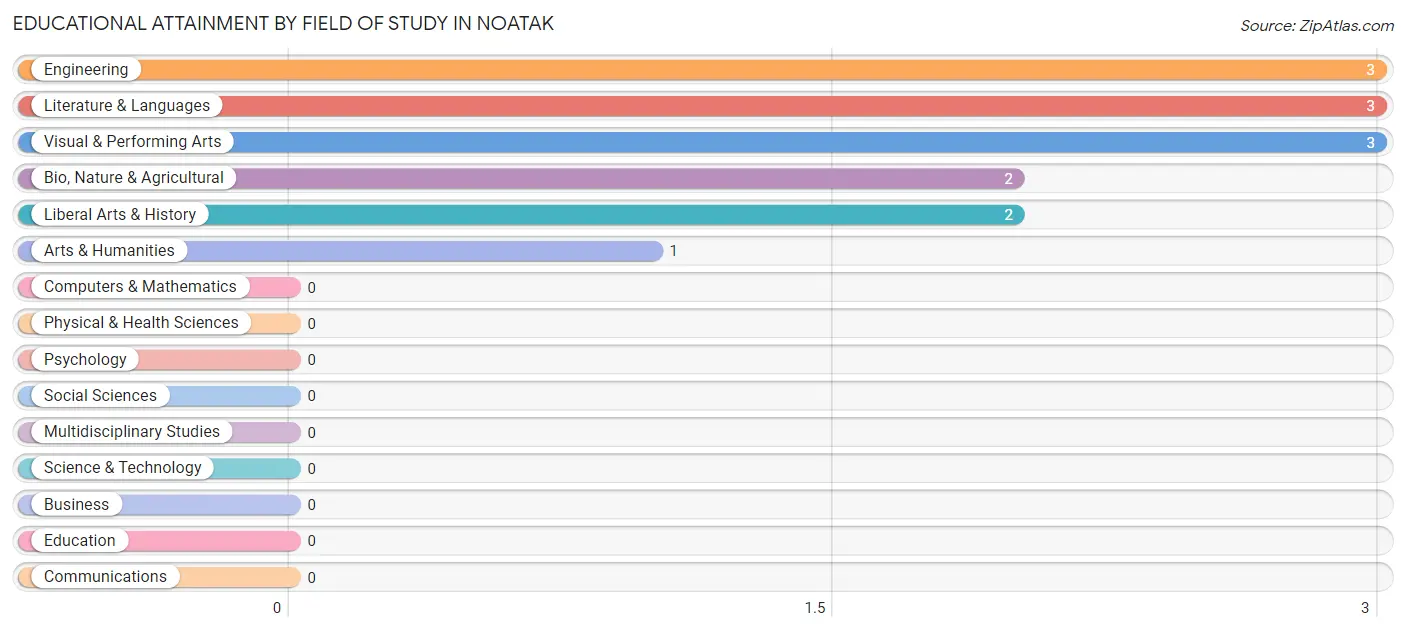
| Field of Study | # Graduates | % Graduates |
| Computers & Mathematics | 0 | 0.0% |
| Bio, Nature & Agricultural | 2 | 14.3% |
| Physical & Health Sciences | 0 | 0.0% |
| Psychology | 0 | 0.0% |
| Social Sciences | 0 | 0.0% |
| Engineering | 3 | 21.4% |
| Multidisciplinary Studies | 0 | 0.0% |
| Science & Technology | 0 | 0.0% |
| Business | 0 | 0.0% |
| Education | 0 | 0.0% |
| Literature & Languages | 3 | 21.4% |
| Liberal Arts & History | 2 | 14.3% |
| Visual & Performing Arts | 3 | 21.4% |
| Communications | 0 | 0.0% |
| Arts & Humanities | 1 | 7.1% |
| Total | 14 | 100.0% |
Transportation & Commute in Noatak
Vehicle Availability by Sex in Noatak
The most prevalent vehicle ownership categories in Noatak are males with no vehicle (55, accounting for 72.4%) and females with no vehicle (30, making up 144.7%).
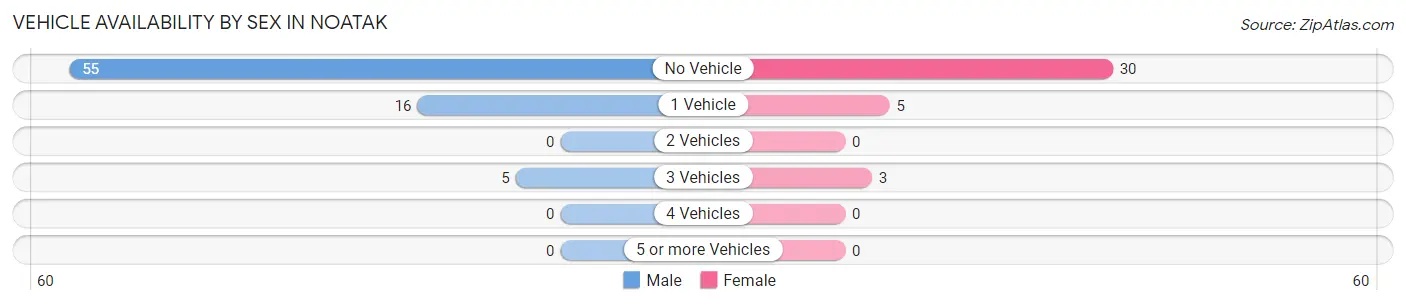
| Vehicles Available | Male | Female |
| No Vehicle | 55 (72.4%) | 30 (78.9%) |
| 1 Vehicle | 16 (21.0%) | 5 (13.2%) |
| 2 Vehicles | 0 (0.0%) | 0 (0.0%) |
| 3 Vehicles | 5 (6.6%) | 3 (7.9%) |
| 4 Vehicles | 0 (0.0%) | 0 (0.0%) |
| 5 or more Vehicles | 0 (0.0%) | 0 (0.0%) |
| Total | 76 (100.0%) | 38 (100.0%) |
Commute Time in Noatak
The most frequently occuring commute durations in Noatak are less than 5 minutes (55 commuters, 56.1%), 5 to 9 minutes (20 commuters, 20.4%), and 15 to 19 minutes (9 commuters, 9.2%).
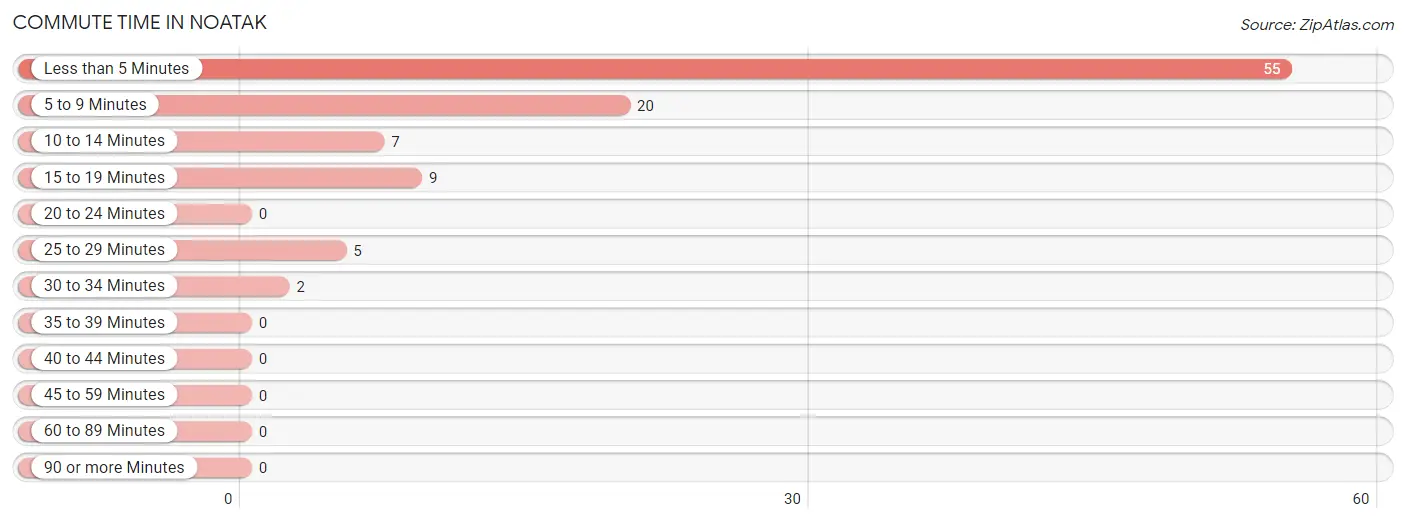
| Commute Time | # Commuters | % Commuters |
| Less than 5 Minutes | 55 | 56.1% |
| 5 to 9 Minutes | 20 | 20.4% |
| 10 to 14 Minutes | 7 | 7.1% |
| 15 to 19 Minutes | 9 | 9.2% |
| 20 to 24 Minutes | 0 | 0.0% |
| 25 to 29 Minutes | 5 | 5.1% |
| 30 to 34 Minutes | 2 | 2.0% |
| 35 to 39 Minutes | 0 | 0.0% |
| 40 to 44 Minutes | 0 | 0.0% |
| 45 to 59 Minutes | 0 | 0.0% |
| 60 to 89 Minutes | 0 | 0.0% |
| 90 or more Minutes | 0 | 0.0% |
Commute Time by Sex in Noatak
The most common commute times in Noatak are less than 5 minutes (31 commuters, 48.4%) for males and less than 5 minutes (24 commuters, 70.6%) for females.
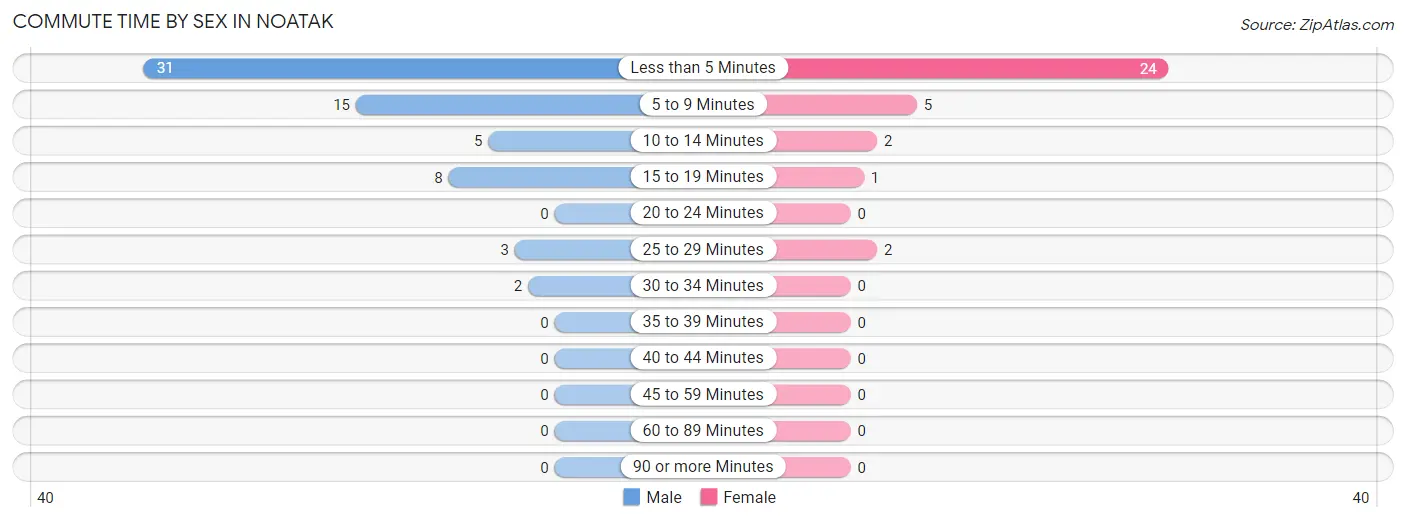
| Commute Time | Male | Female |
| Less than 5 Minutes | 31 (48.4%) | 24 (70.6%) |
| 5 to 9 Minutes | 15 (23.4%) | 5 (14.7%) |
| 10 to 14 Minutes | 5 (7.8%) | 2 (5.9%) |
| 15 to 19 Minutes | 8 (12.5%) | 1 (2.9%) |
| 20 to 24 Minutes | 0 (0.0%) | 0 (0.0%) |
| 25 to 29 Minutes | 3 (4.7%) | 2 (5.9%) |
| 30 to 34 Minutes | 2 (3.1%) | 0 (0.0%) |
| 35 to 39 Minutes | 0 (0.0%) | 0 (0.0%) |
| 40 to 44 Minutes | 0 (0.0%) | 0 (0.0%) |
| 45 to 59 Minutes | 0 (0.0%) | 0 (0.0%) |
| 60 to 89 Minutes | 0 (0.0%) | 0 (0.0%) |
| 90 or more Minutes | 0 (0.0%) | 0 (0.0%) |
Time of Departure to Work by Sex in Noatak
The most frequent times of departure to work in Noatak are 8:30 AM to 8:59 AM (26, 40.6%) for males and 8:30 AM to 8:59 AM (10, 29.4%) for females.
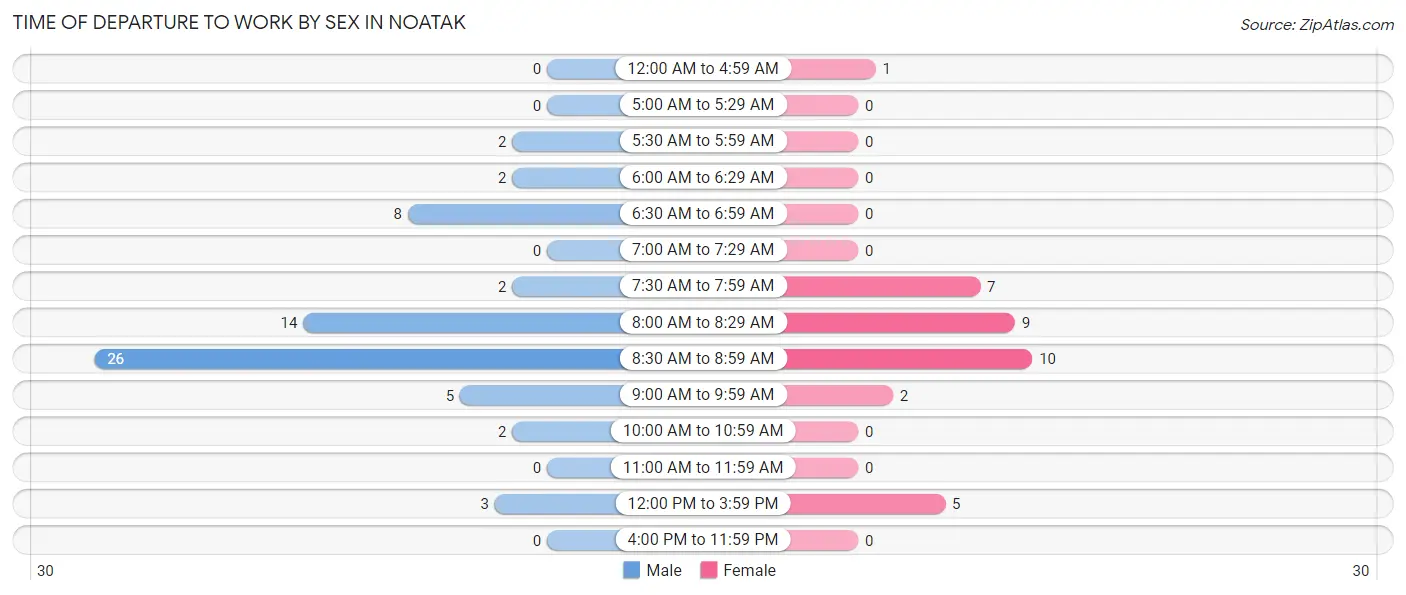
| Time of Departure | Male | Female |
| 12:00 AM to 4:59 AM | 0 (0.0%) | 1 (2.9%) |
| 5:00 AM to 5:29 AM | 0 (0.0%) | 0 (0.0%) |
| 5:30 AM to 5:59 AM | 2 (3.1%) | 0 (0.0%) |
| 6:00 AM to 6:29 AM | 2 (3.1%) | 0 (0.0%) |
| 6:30 AM to 6:59 AM | 8 (12.5%) | 0 (0.0%) |
| 7:00 AM to 7:29 AM | 0 (0.0%) | 0 (0.0%) |
| 7:30 AM to 7:59 AM | 2 (3.1%) | 7 (20.6%) |
| 8:00 AM to 8:29 AM | 14 (21.9%) | 9 (26.5%) |
| 8:30 AM to 8:59 AM | 26 (40.6%) | 10 (29.4%) |
| 9:00 AM to 9:59 AM | 5 (7.8%) | 2 (5.9%) |
| 10:00 AM to 10:59 AM | 2 (3.1%) | 0 (0.0%) |
| 11:00 AM to 11:59 AM | 0 (0.0%) | 0 (0.0%) |
| 12:00 PM to 3:59 PM | 3 (4.7%) | 5 (14.7%) |
| 4:00 PM to 11:59 PM | 0 (0.0%) | 0 (0.0%) |
| Total | 64 (100.0%) | 34 (100.0%) |
Housing Occupancy in Noatak
Occupancy by Ownership in Noatak
Of the total 102 dwellings in Noatak, owner-occupied units account for 85 (83.3%), while renter-occupied units make up 17 (16.7%).
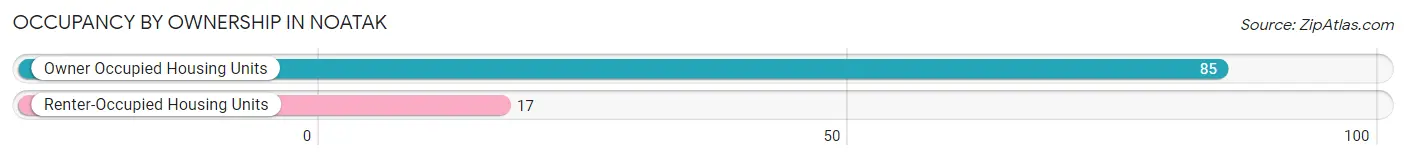
| Occupancy | # Housing Units | % Housing Units |
| Owner Occupied Housing Units | 85 | 83.3% |
| Renter-Occupied Housing Units | 17 | 16.7% |
| Total Occupied Housing Units | 102 | 100.0% |
Occupancy by Household Size in Noatak
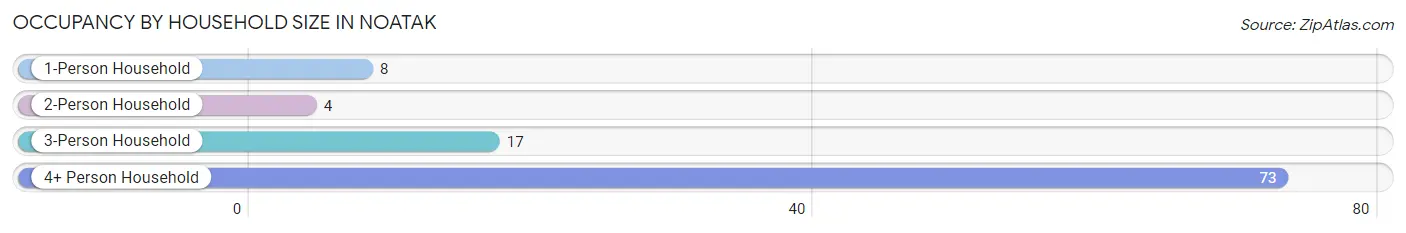
| Household Size | # Housing Units | % Housing Units |
| 1-Person Household | 8 | 7.8% |
| 2-Person Household | 4 | 3.9% |
| 3-Person Household | 17 | 16.7% |
| 4+ Person Household | 73 | 71.6% |
| Total Housing Units | 102 | 100.0% |
Occupancy by Ownership by Household Size in Noatak
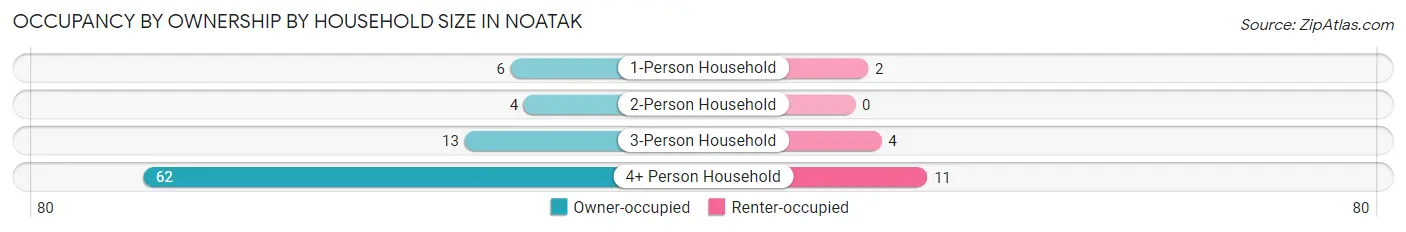
| Household Size | Owner-occupied | Renter-occupied |
| 1-Person Household | 6 (75.0%) | 2 (25.0%) |
| 2-Person Household | 4 (100.0%) | 0 (0.0%) |
| 3-Person Household | 13 (76.5%) | 4 (23.5%) |
| 4+ Person Household | 62 (84.9%) | 11 (15.1%) |
| Total Housing Units | 85 (83.3%) | 17 (16.7%) |
Occupancy by Educational Attainment in Noatak
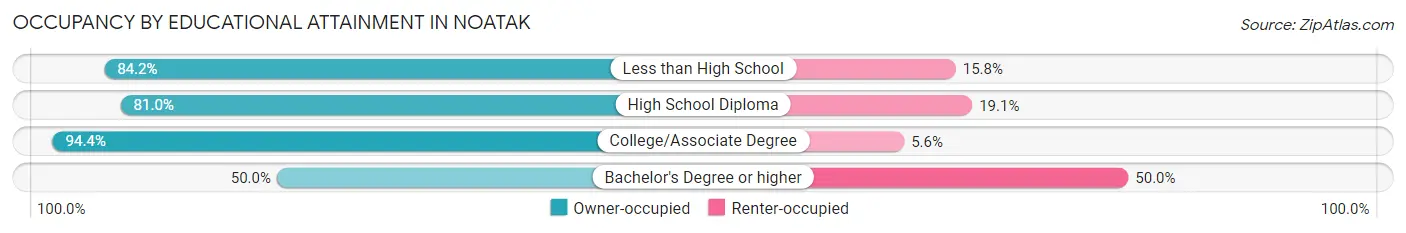
| Household Size | Owner-occupied | Renter-occupied |
| Less than High School | 16 (84.2%) | 3 (15.8%) |
| High School Diploma | 51 (80.9%) | 12 (19.1%) |
| College/Associate Degree | 17 (94.4%) | 1 (5.6%) |
| Bachelor's Degree or higher | 1 (50.0%) | 1 (50.0%) |
Occupancy by Age of Householder in Noatak
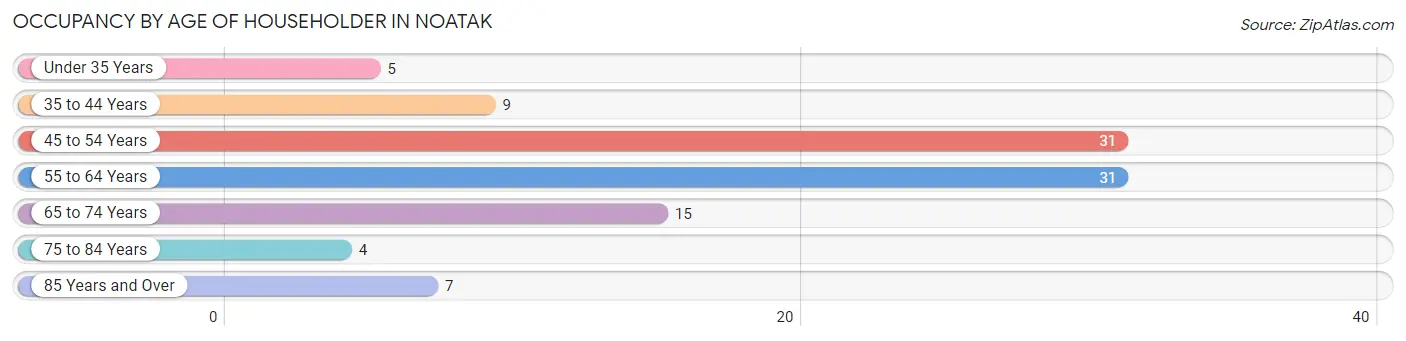
| Age Bracket | # Households | % Households |
| Under 35 Years | 5 | 4.9% |
| 35 to 44 Years | 9 | 8.8% |
| 45 to 54 Years | 31 | 30.4% |
| 55 to 64 Years | 31 | 30.4% |
| 65 to 74 Years | 15 | 14.7% |
| 75 to 84 Years | 4 | 3.9% |
| 85 Years and Over | 7 | 6.9% |
| Total | 102 | 100.0% |
Housing Finances in Noatak
Median Income by Occupancy in Noatak
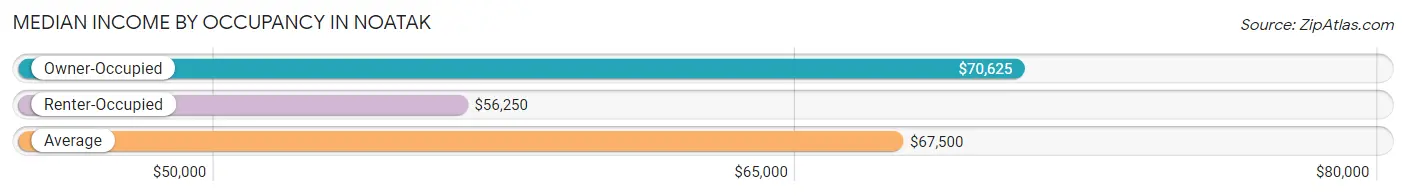
| Occupancy Type | # Households | Median Income |
| Owner-Occupied | 85 (83.3%) | $70,625 |
| Renter-Occupied | 17 (16.7%) | $56,250 |
| Average | 102 (100.0%) | $67,500 |
Occupancy by Householder Income Bracket in Noatak
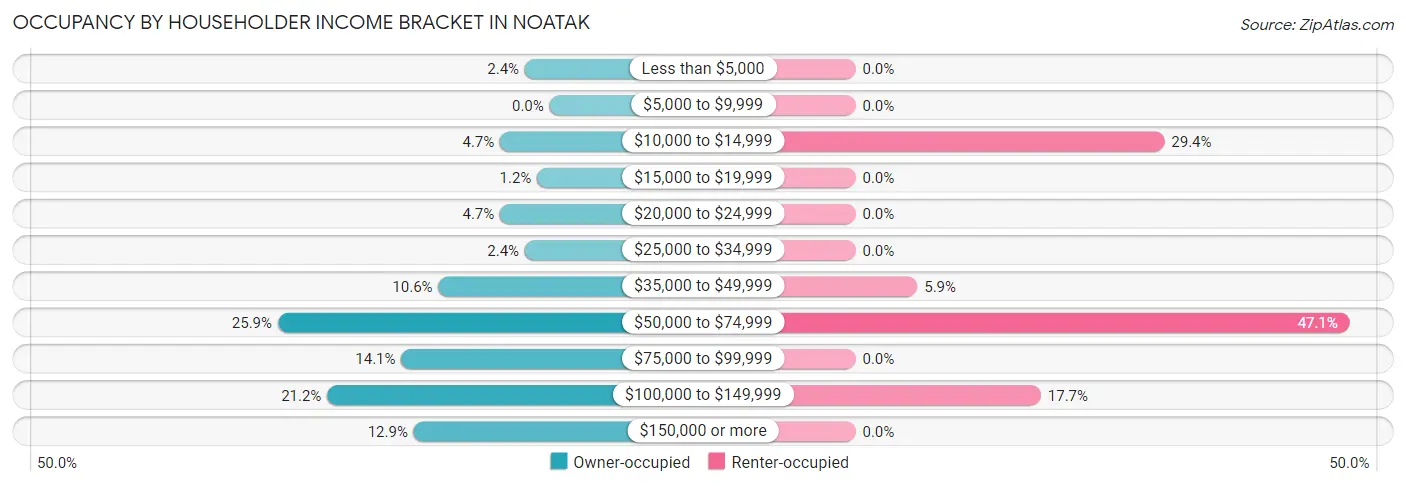
| Income Bracket | Owner-occupied | Renter-occupied |
| Less than $5,000 | 2 (2.4%) | 0 (0.0%) |
| $5,000 to $9,999 | 0 (0.0%) | 0 (0.0%) |
| $10,000 to $14,999 | 4 (4.7%) | 5 (29.4%) |
| $15,000 to $19,999 | 1 (1.2%) | 0 (0.0%) |
| $20,000 to $24,999 | 4 (4.7%) | 0 (0.0%) |
| $25,000 to $34,999 | 2 (2.4%) | 0 (0.0%) |
| $35,000 to $49,999 | 9 (10.6%) | 1 (5.9%) |
| $50,000 to $74,999 | 22 (25.9%) | 8 (47.1%) |
| $75,000 to $99,999 | 12 (14.1%) | 0 (0.0%) |
| $100,000 to $149,999 | 18 (21.2%) | 3 (17.6%) |
| $150,000 or more | 11 (12.9%) | 0 (0.0%) |
| Total | 85 (100.0%) | 17 (100.0%) |
Monthly Housing Cost Tiers in Noatak
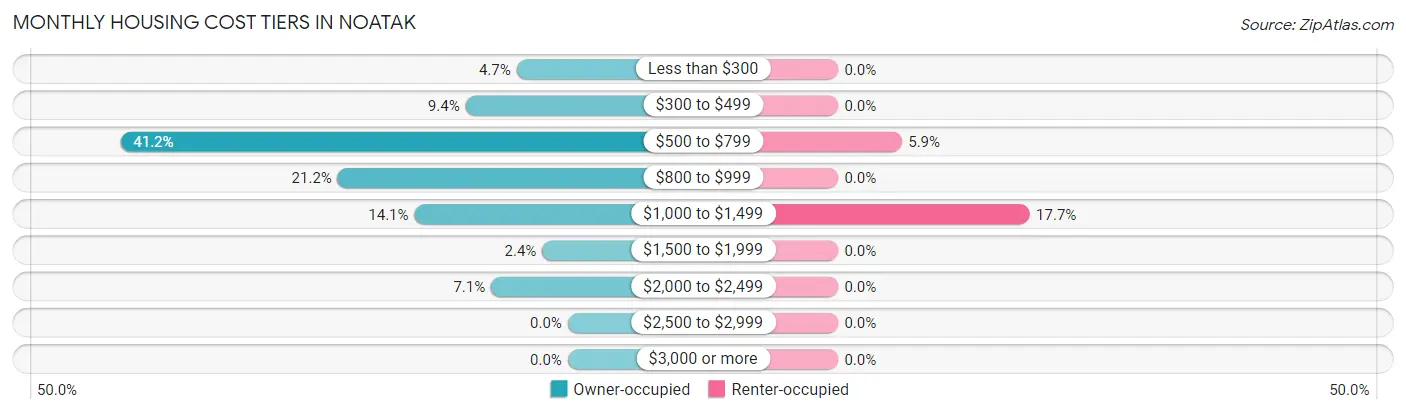
| Monthly Cost | Owner-occupied | Renter-occupied |
| Less than $300 | 4 (4.7%) | 0 (0.0%) |
| $300 to $499 | 8 (9.4%) | 0 (0.0%) |
| $500 to $799 | 35 (41.2%) | 1 (5.9%) |
| $800 to $999 | 18 (21.2%) | 0 (0.0%) |
| $1,000 to $1,499 | 12 (14.1%) | 3 (17.6%) |
| $1,500 to $1,999 | 2 (2.4%) | 0 (0.0%) |
| $2,000 to $2,499 | 6 (7.1%) | 0 (0.0%) |
| $2,500 to $2,999 | 0 (0.0%) | 0 (0.0%) |
| $3,000 or more | 0 (0.0%) | 0 (0.0%) |
| Total | 85 (100.0%) | 17 (100.0%) |
Physical Housing Characteristics in Noatak
Housing Structures in Noatak
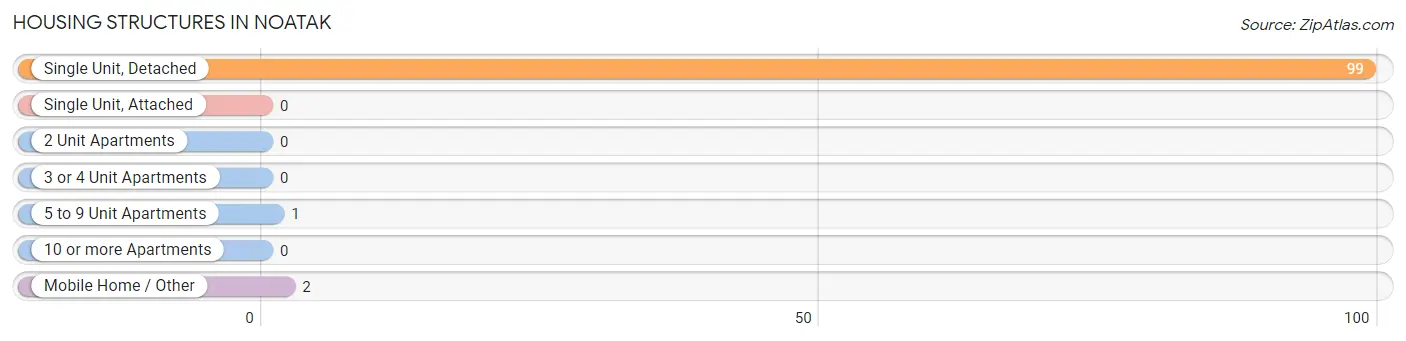
| Structure Type | # Housing Units | % Housing Units |
| Single Unit, Detached | 99 | 97.1% |
| Single Unit, Attached | 0 | 0.0% |
| 2 Unit Apartments | 0 | 0.0% |
| 3 or 4 Unit Apartments | 0 | 0.0% |
| 5 to 9 Unit Apartments | 1 | 1.0% |
| 10 or more Apartments | 0 | 0.0% |
| Mobile Home / Other | 2 | 2.0% |
| Total | 102 | 100.0% |
Housing Structures by Occupancy in Noatak
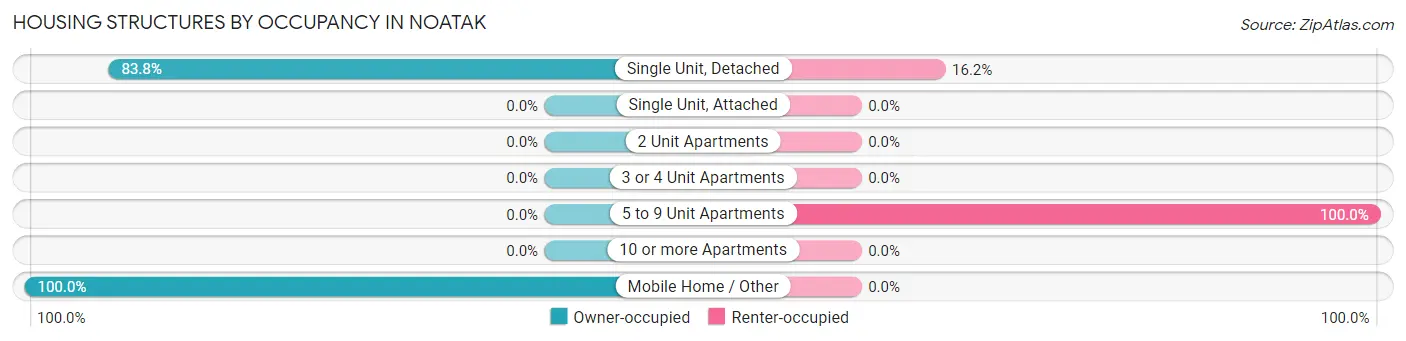
| Structure Type | Owner-occupied | Renter-occupied |
| Single Unit, Detached | 83 (83.8%) | 16 (16.2%) |
| Single Unit, Attached | 0 (0.0%) | 0 (0.0%) |
| 2 Unit Apartments | 0 (0.0%) | 0 (0.0%) |
| 3 or 4 Unit Apartments | 0 (0.0%) | 0 (0.0%) |
| 5 to 9 Unit Apartments | 0 (0.0%) | 1 (100.0%) |
| 10 or more Apartments | 0 (0.0%) | 0 (0.0%) |
| Mobile Home / Other | 2 (100.0%) | 0 (0.0%) |
| Total | 85 (83.3%) | 17 (16.7%) |
Housing Structures by Number of Rooms in Noatak
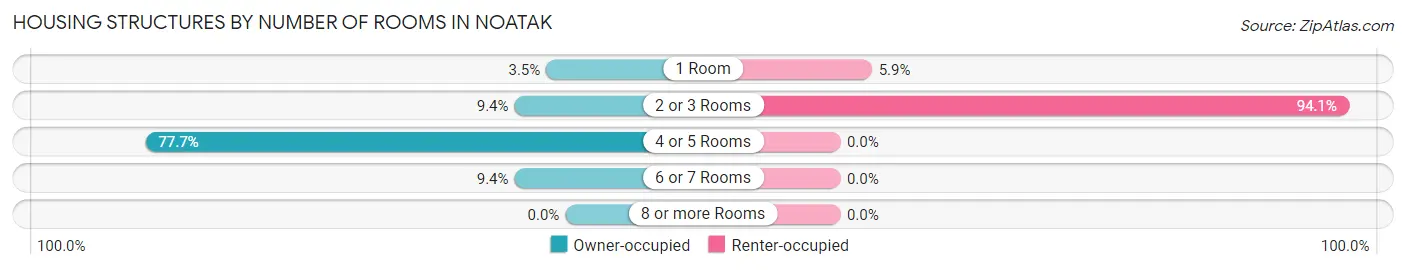
| Number of Rooms | Owner-occupied | Renter-occupied |
| 1 Room | 3 (3.5%) | 1 (5.9%) |
| 2 or 3 Rooms | 8 (9.4%) | 16 (94.1%) |
| 4 or 5 Rooms | 66 (77.6%) | 0 (0.0%) |
| 6 or 7 Rooms | 8 (9.4%) | 0 (0.0%) |
| 8 or more Rooms | 0 (0.0%) | 0 (0.0%) |
| Total | 85 (100.0%) | 17 (100.0%) |
Housing Structure by Heating Type in Noatak
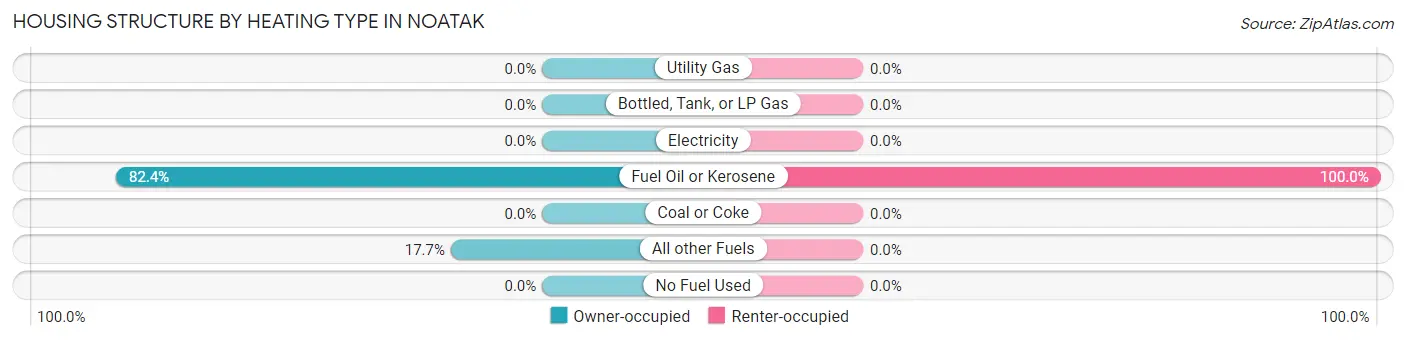
| Heating Type | Owner-occupied | Renter-occupied |
| Utility Gas | 0 (0.0%) | 0 (0.0%) |
| Bottled, Tank, or LP Gas | 0 (0.0%) | 0 (0.0%) |
| Electricity | 0 (0.0%) | 0 (0.0%) |
| Fuel Oil or Kerosene | 70 (82.4%) | 17 (100.0%) |
| Coal or Coke | 0 (0.0%) | 0 (0.0%) |
| All other Fuels | 15 (17.6%) | 0 (0.0%) |
| No Fuel Used | 0 (0.0%) | 0 (0.0%) |
| Total | 85 (100.0%) | 17 (100.0%) |
Household Vehicle Usage in Noatak
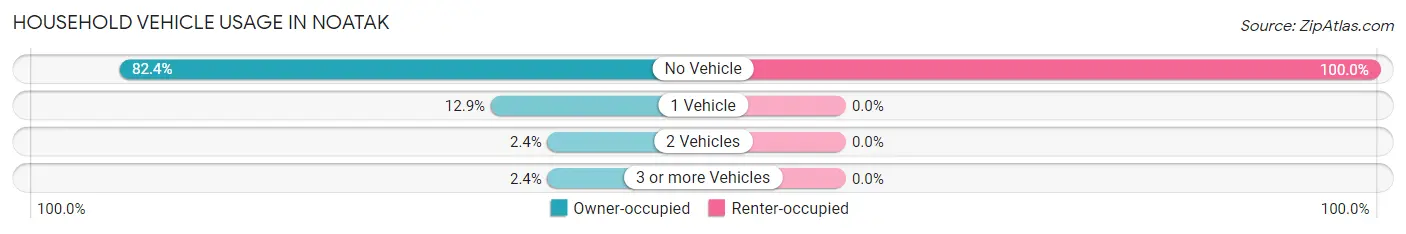
| Vehicles per Household | Owner-occupied | Renter-occupied |
| No Vehicle | 70 (82.4%) | 17 (100.0%) |
| 1 Vehicle | 11 (12.9%) | 0 (0.0%) |
| 2 Vehicles | 2 (2.4%) | 0 (0.0%) |
| 3 or more Vehicles | 2 (2.4%) | 0 (0.0%) |
| Total | 85 (100.0%) | 17 (100.0%) |
Real Estate & Mortgages in Noatak
Real Estate and Mortgage Overview in Noatak
| Characteristic | Without Mortgage | With Mortgage |
| Housing Units | 59 | 26 |
| Median Property Value | $120,300 | $0 |
| Median Household Income | $77,813 | $4 |
| Monthly Housing Costs | $675 | $0 |
| Real Estate Taxes | - | - |
Property Value by Mortgage Status in Noatak
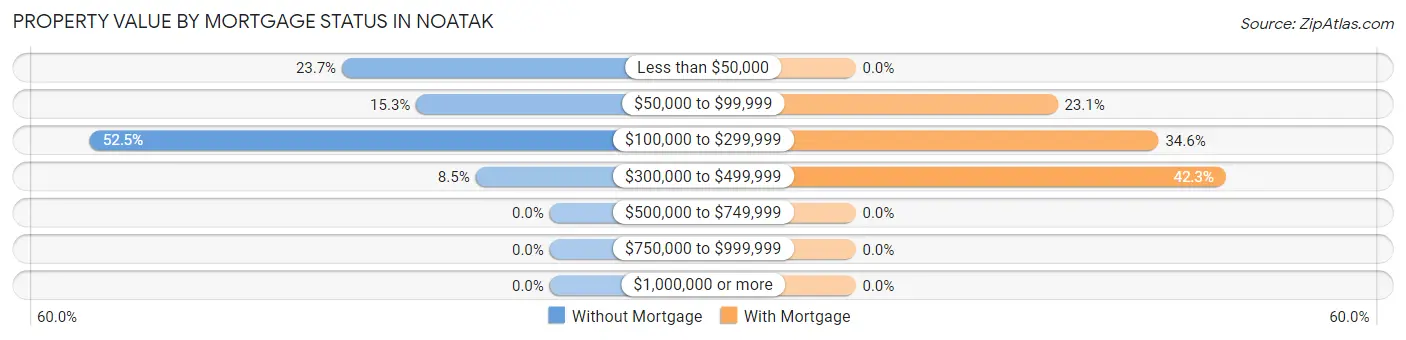
| Property Value | Without Mortgage | With Mortgage |
| Less than $50,000 | 14 (23.7%) | 0 (0.0%) |
| $50,000 to $99,999 | 9 (15.2%) | 6 (23.1%) |
| $100,000 to $299,999 | 31 (52.5%) | 9 (34.6%) |
| $300,000 to $499,999 | 5 (8.5%) | 11 (42.3%) |
| $500,000 to $749,999 | 0 (0.0%) | 0 (0.0%) |
| $750,000 to $999,999 | 0 (0.0%) | 0 (0.0%) |
| $1,000,000 or more | 0 (0.0%) | 0 (0.0%) |
| Total | 59 (100.0%) | 26 (100.0%) |
Household Income by Mortgage Status in Noatak
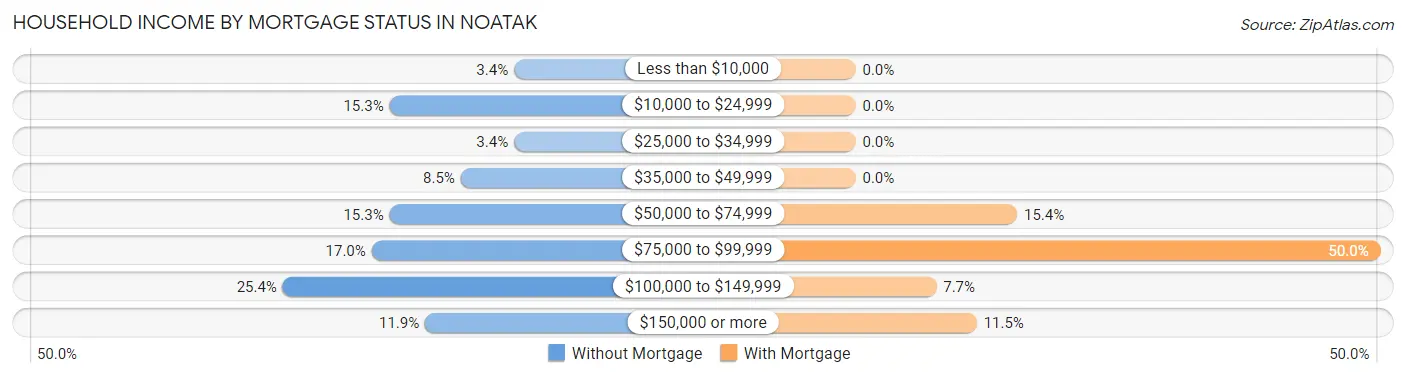
| Household Income | Without Mortgage | With Mortgage |
| Less than $10,000 | 2 (3.4%) | 0 (0.0%) |
| $10,000 to $24,999 | 9 (15.2%) | 0 (0.0%) |
| $25,000 to $34,999 | 2 (3.4%) | 0 (0.0%) |
| $35,000 to $49,999 | 5 (8.5%) | 0 (0.0%) |
| $50,000 to $74,999 | 9 (15.2%) | 4 (15.4%) |
| $75,000 to $99,999 | 10 (17.0%) | 13 (50.0%) |
| $100,000 to $149,999 | 15 (25.4%) | 2 (7.7%) |
| $150,000 or more | 7 (11.9%) | 3 (11.5%) |
| Total | 59 (100.0%) | 26 (100.0%) |
Property Value to Household Income Ratio in Noatak
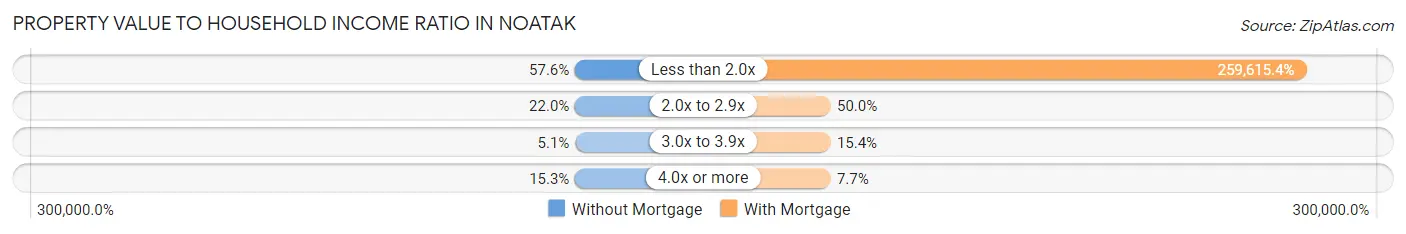
| Value-to-Income Ratio | Without Mortgage | With Mortgage |
| Less than 2.0x | 34 (57.6%) | 67,500 (259,615.4%) |
| 2.0x to 2.9x | 13 (22.0%) | 13 (50.0%) |
| 3.0x to 3.9x | 3 (5.1%) | 4 (15.4%) |
| 4.0x or more | 9 (15.2%) | 2 (7.7%) |
| Total | 59 (100.0%) | 26 (100.0%) |
Real Estate Taxes by Mortgage Status in Noatak
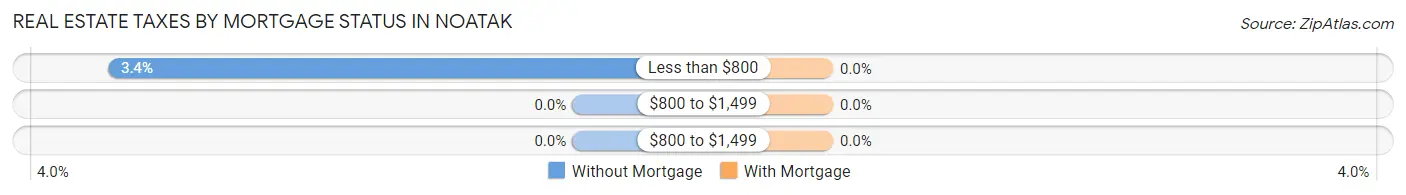
| Property Taxes | Without Mortgage | With Mortgage |
| Less than $800 | 2 (3.4%) | 0 (0.0%) |
| $800 to $1,499 | 0 (0.0%) | 0 (0.0%) |
| $800 to $1,499 | 0 (0.0%) | 0 (0.0%) |
| Total | 59 (100.0%) | 26 (100.0%) |
Health & Disability in Noatak
Health Insurance Coverage by Age in Noatak
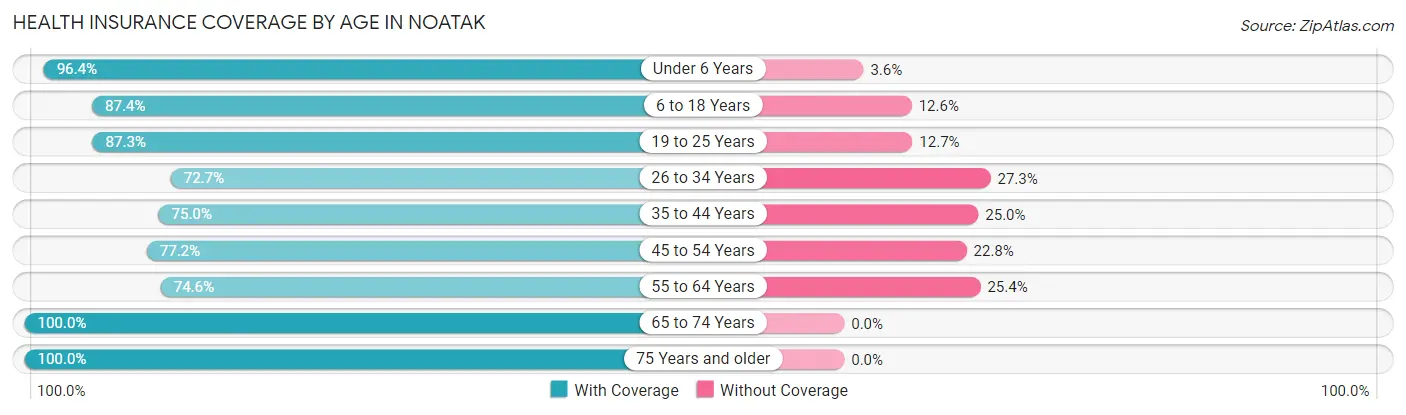
| Age Bracket | With Coverage | Without Coverage |
| Under 6 Years | 54 (96.4%) | 2 (3.6%) |
| 6 to 18 Years | 132 (87.4%) | 19 (12.6%) |
| 19 to 25 Years | 55 (87.3%) | 8 (12.7%) |
| 26 to 34 Years | 56 (72.7%) | 21 (27.3%) |
| 35 to 44 Years | 24 (75.0%) | 8 (25.0%) |
| 45 to 54 Years | 44 (77.2%) | 13 (22.8%) |
| 55 to 64 Years | 47 (74.6%) | 16 (25.4%) |
| 65 to 74 Years | 24 (100.0%) | 0 (0.0%) |
| 75 Years and older | 13 (100.0%) | 0 (0.0%) |
| Total | 449 (83.8%) | 87 (16.2%) |
Health Insurance Coverage by Citizenship Status in Noatak
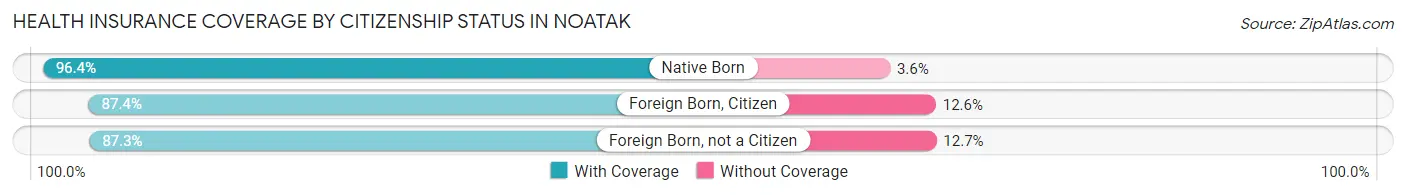
| Citizenship Status | With Coverage | Without Coverage |
| Native Born | 54 (96.4%) | 2 (3.6%) |
| Foreign Born, Citizen | 132 (87.4%) | 19 (12.6%) |
| Foreign Born, not a Citizen | 55 (87.3%) | 8 (12.7%) |
Health Insurance Coverage by Household Income in Noatak
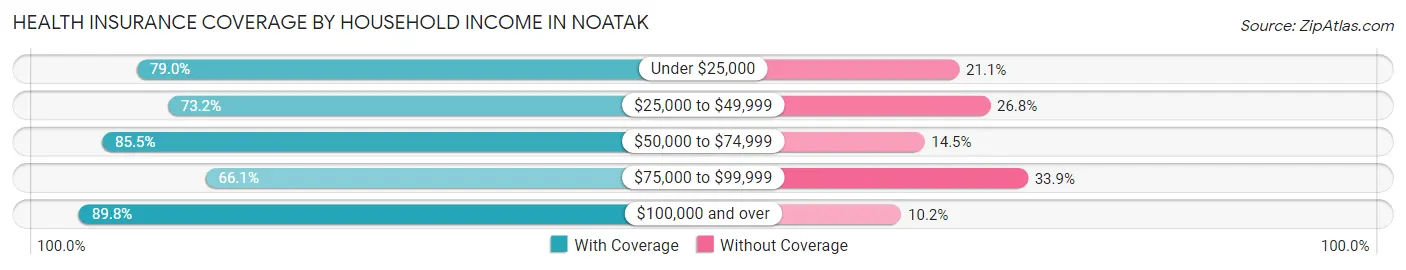
| Household Income | With Coverage | Without Coverage |
| Under $25,000 | 30 (78.9%) | 8 (21.0%) |
| $25,000 to $49,999 | 30 (73.2%) | 11 (26.8%) |
| $50,000 to $74,999 | 147 (85.5%) | 25 (14.5%) |
| $75,000 to $99,999 | 39 (66.1%) | 20 (33.9%) |
| $100,000 and over | 203 (89.8%) | 23 (10.2%) |
Public vs Private Health Insurance Coverage by Age in Noatak
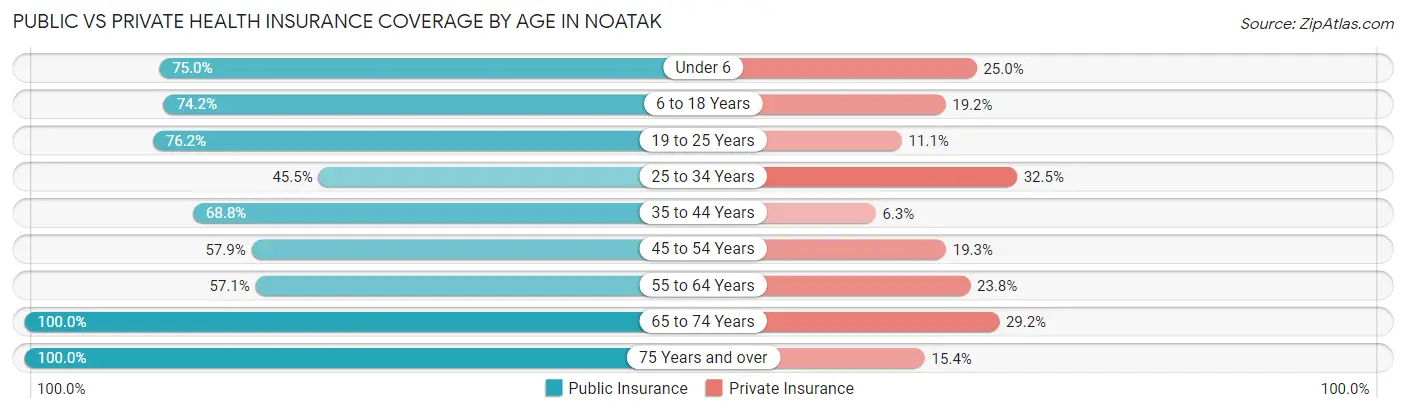
| Age Bracket | Public Insurance | Private Insurance |
| Under 6 | 42 (75.0%) | 14 (25.0%) |
| 6 to 18 Years | 112 (74.2%) | 29 (19.2%) |
| 19 to 25 Years | 48 (76.2%) | 7 (11.1%) |
| 25 to 34 Years | 35 (45.5%) | 25 (32.5%) |
| 35 to 44 Years | 22 (68.8%) | 2 (6.2%) |
| 45 to 54 Years | 33 (57.9%) | 11 (19.3%) |
| 55 to 64 Years | 36 (57.1%) | 15 (23.8%) |
| 65 to 74 Years | 24 (100.0%) | 7 (29.2%) |
| 75 Years and over | 13 (100.0%) | 2 (15.4%) |
| Total | 365 (68.1%) | 112 (20.9%) |
Disability Status by Sex by Age in Noatak
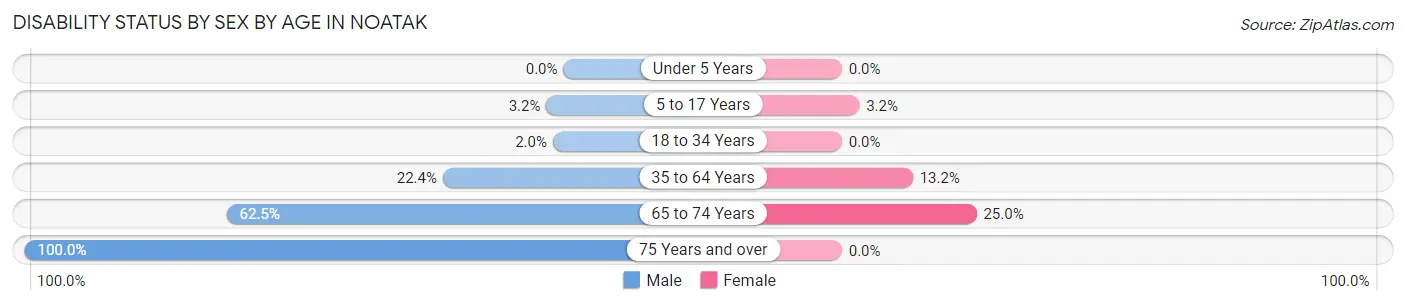
| Age Bracket | Male | Female |
| Under 5 Years | 0 (0.0%) | 0 (0.0%) |
| 5 to 17 Years | 3 (3.2%) | 2 (3.2%) |
| 18 to 34 Years | 2 (2.0%) | 0 (0.0%) |
| 35 to 64 Years | 17 (22.4%) | 10 (13.2%) |
| 65 to 74 Years | 10 (62.5%) | 2 (25.0%) |
| 75 Years and over | 6 (100.0%) | 0 (0.0%) |
Disability Class by Sex by Age in Noatak
Disability Class: Hearing Difficulty
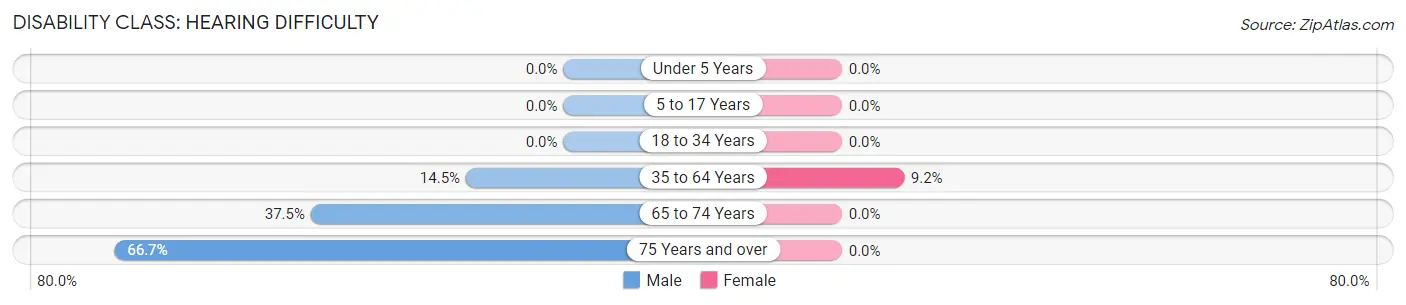
| Age Bracket | Male | Female |
| Under 5 Years | 0 (0.0%) | 0 (0.0%) |
| 5 to 17 Years | 0 (0.0%) | 0 (0.0%) |
| 18 to 34 Years | 0 (0.0%) | 0 (0.0%) |
| 35 to 64 Years | 11 (14.5%) | 7 (9.2%) |
| 65 to 74 Years | 6 (37.5%) | 0 (0.0%) |
| 75 Years and over | 4 (66.7%) | 0 (0.0%) |
Disability Class: Vision Difficulty
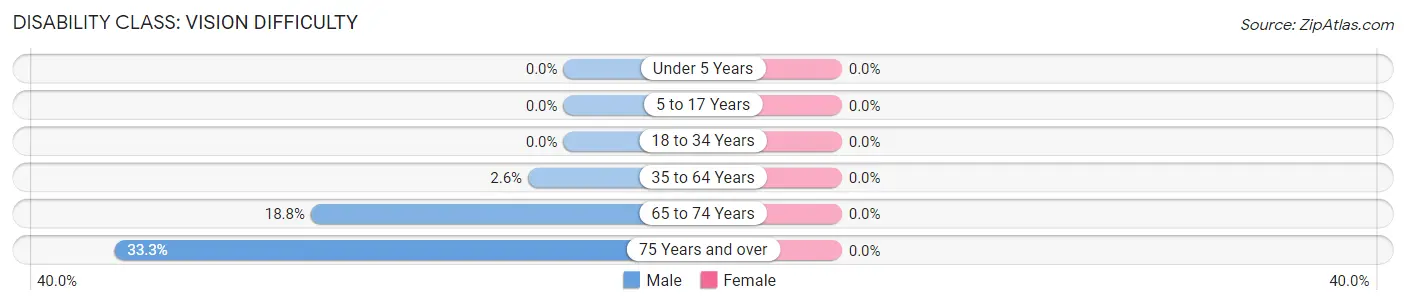
| Age Bracket | Male | Female |
| Under 5 Years | 0 (0.0%) | 0 (0.0%) |
| 5 to 17 Years | 0 (0.0%) | 0 (0.0%) |
| 18 to 34 Years | 0 (0.0%) | 0 (0.0%) |
| 35 to 64 Years | 2 (2.6%) | 0 (0.0%) |
| 65 to 74 Years | 3 (18.8%) | 0 (0.0%) |
| 75 Years and over | 2 (33.3%) | 0 (0.0%) |
Disability Class: Cognitive Difficulty
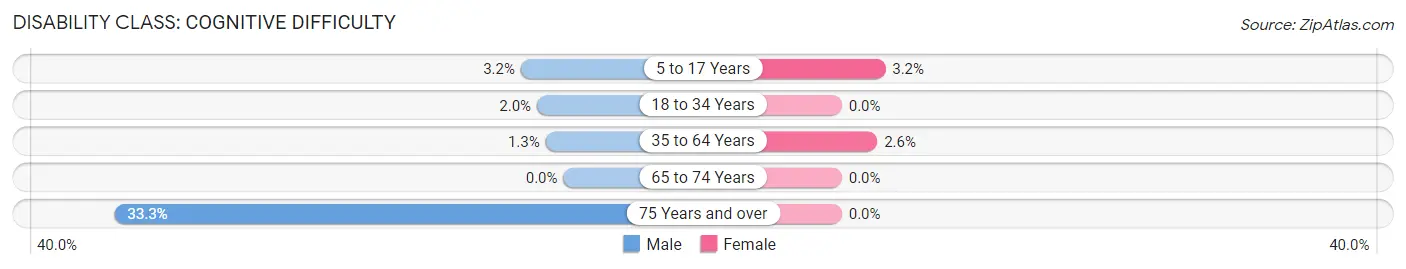
| Age Bracket | Male | Female |
| 5 to 17 Years | 3 (3.2%) | 2 (3.2%) |
| 18 to 34 Years | 2 (2.0%) | 0 (0.0%) |
| 35 to 64 Years | 1 (1.3%) | 2 (2.6%) |
| 65 to 74 Years | 0 (0.0%) | 0 (0.0%) |
| 75 Years and over | 2 (33.3%) | 0 (0.0%) |
Disability Class: Ambulatory Difficulty
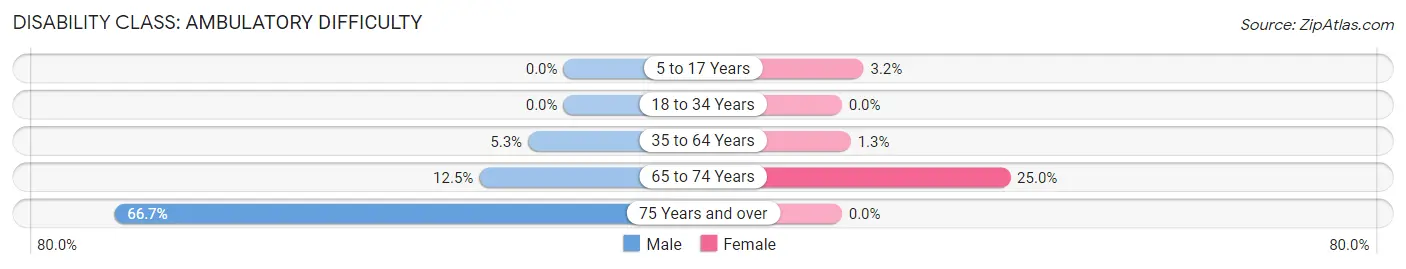
| Age Bracket | Male | Female |
| 5 to 17 Years | 0 (0.0%) | 2 (3.2%) |
| 18 to 34 Years | 0 (0.0%) | 0 (0.0%) |
| 35 to 64 Years | 4 (5.3%) | 1 (1.3%) |
| 65 to 74 Years | 2 (12.5%) | 2 (25.0%) |
| 75 Years and over | 4 (66.7%) | 0 (0.0%) |
Disability Class: Self-Care Difficulty
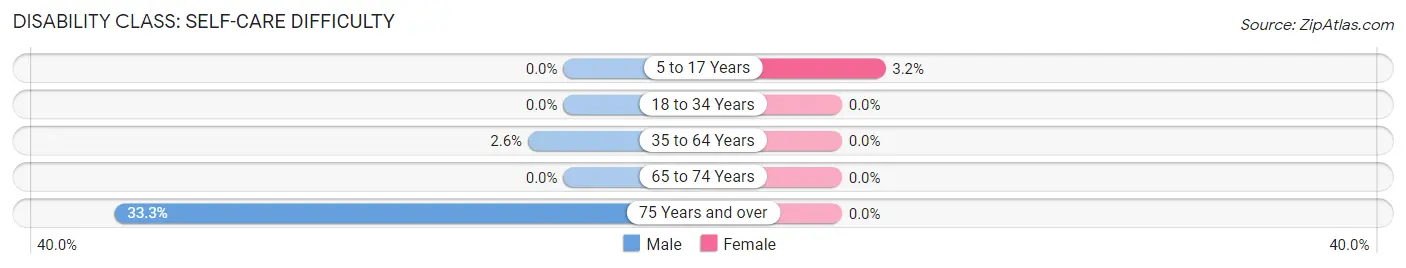
| Age Bracket | Male | Female |
| 5 to 17 Years | 0 (0.0%) | 2 (3.2%) |
| 18 to 34 Years | 0 (0.0%) | 0 (0.0%) |
| 35 to 64 Years | 2 (2.6%) | 0 (0.0%) |
| 65 to 74 Years | 0 (0.0%) | 0 (0.0%) |
| 75 Years and over | 2 (33.3%) | 0 (0.0%) |
Technology Access in Noatak
Computing Device Access in Noatak
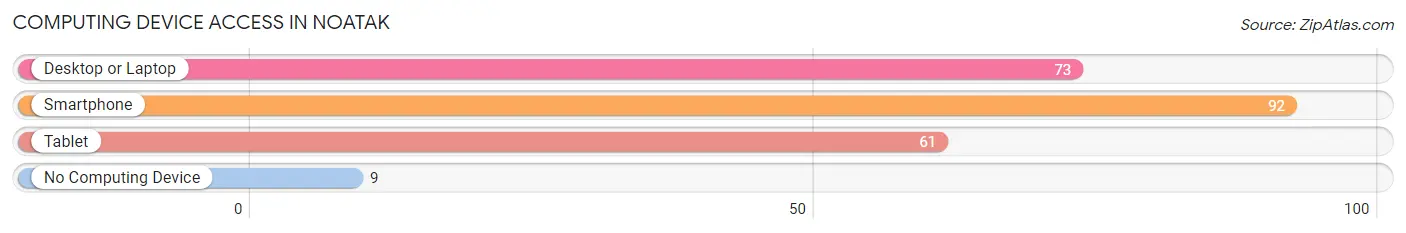
| Device Type | # Households | % Households |
| Desktop or Laptop | 73 | 71.6% |
| Smartphone | 92 | 90.2% |
| Tablet | 61 | 59.8% |
| No Computing Device | 9 | 8.8% |
| Total | 102 | 100.0% |
Internet Access in Noatak
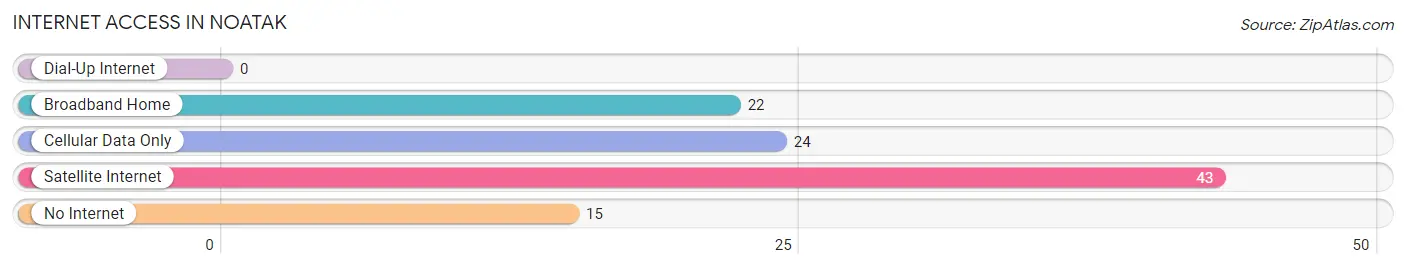
| Internet Type | # Households | % Households |
| Dial-Up Internet | 0 | 0.0% |
| Broadband Home | 22 | 21.6% |
| Cellular Data Only | 24 | 23.5% |
| Satellite Internet | 43 | 42.2% |
| No Internet | 15 | 14.7% |
| Total | 102 | 100.0% |
Noatak Summary
Noatak is a small city located in Northwest Alaska, in the United States. It is situated on the Noatak River, approximately 40 miles from the Arctic Ocean. The city is part of the Noatak National Preserve, which is the largest national park in the United States. The city is home to approximately 500 people, most of whom are of Inupiat Eskimo descent.
History
Noatak has a long and rich history. The area has been inhabited by the Inupiat Eskimos for thousands of years. The first Europeans to visit the area were Russian explorers in the late 18th century. The area was later explored by American whalers in the 19th century. In the early 20th century, the area was settled by Inupiat Eskimos who were looking for a better life.
The city of Noatak was officially founded in 1921. It was named after the Noatak River, which was named by the explorer Robert Peary in 1891. The city was initially a trading post and a supply center for the surrounding area. In the 1950s, the city began to grow as more people moved to the area to take advantage of the abundant natural resources.
Geography
Noatak is located in the Northwest Arctic Borough of Alaska. It is situated on the Noatak River, approximately 40 miles from the Arctic Ocean. The city is surrounded by the Noatak National Preserve, which is the largest national park in the United States. The city is located in a tundra climate, with cold winters and mild summers. The average temperature in the summer is around 50°F, while the average temperature in the winter is around -20°F.
The city is located in a remote area, and is only accessible by air or boat. The nearest major city is Kotzebue, which is located approximately 100 miles away.
Economy
Noatak’s economy is largely based on subsistence hunting and fishing. The city is home to a number of small businesses, including a grocery store, a hardware store, and a restaurant. The city also has a small airport, which serves as a hub for air travel in the region.
The city is also home to a number of government agencies, including the Bureau of Indian Affairs, the National Park Service, and the U.S. Fish and Wildlife Service. These agencies provide employment opportunities for the local population.
Demographics
As of the 2010 census, the population of Noatak was 498. The racial makeup of the city was 97.2% Native American, 0.8% White, 0.2% Asian, and 1.8% from two or more races. The median age of the population was 28.7 years.
The median household income in Noatak was $30,000, and the median family income was $31,000. The per capita income was $14,000. The poverty rate was 40.3%.
Conclusion
Noatak is a small city located in Northwest Alaska. It is situated on the Noatak River, approximately 40 miles from the Arctic Ocean. The city is part of the Noatak National Preserve, which is the largest national park in the United States. The city is home to approximately 500 people, most of whom are of Inupiat Eskimo descent. The city’s economy is largely based on subsistence hunting and fishing, and the city is also home to a number of government agencies. The population of Noatak is largely Native American, and the median household income is $30,000.
Common Questions
What is Per Capita Income in Noatak?
Per Capita income in Noatak is $18,241.
What is the Median Family Income in Noatak?
Median Family Income in Noatak is $68,750.
What is the Median Household income in Noatak?
Median Household Income in Noatak is $67,500.
What is Income or Wage Gap in Noatak?
Income or Wage Gap in Noatak is 47.1%.
Women in Noatak earn 52.9 cents for every dollar earned by a man.
What is Family Income Deficit in Noatak?
Family Income Deficit in Noatak is $13,690.
Families that are below poverty line in Noatak earn $13,690 less on average than the poverty threshold level.
What is Inequality or Gini Index in Noatak?
Inequality or Gini Index in Noatak is 0.41.
What is the Total Population of Noatak?
Total Population of Noatak is 536.
What is the Total Male Population of Noatak?
Total Male Population of Noatak is 317.
What is the Total Female Population of Noatak?
Total Female Population of Noatak is 219.
What is the Ratio of Males per 100 Females in Noatak?
There are 144.75 Males per 100 Females in Noatak.
What is the Ratio of Females per 100 Males in Noatak?
There are 69.09 Females per 100 Males in Noatak.
What is the Median Population Age in Noatak?
Median Population Age in Noatak is 25.8 Years.
What is the Average Family Size in Noatak
Average Family Size in Noatak is 5.6 People.
What is the Average Household Size in Noatak
Average Household Size in Noatak is 5.2 People.
How Large is the Labor Force in Noatak?
There are 197 People in the Labor Forcein in Noatak.
What is the Percentage of People in the Labor Force in Noatak?
55.0% of People are in the Labor Force in Noatak.
What is the Unemployment Rate in Noatak?
Unemployment Rate in Noatak is 35.5%.