Hooper Bay, AK Map & Demographics
Hooper Bay Map
Hooper Bay Overview
$15,903
PER CAPITA INCOME
$40,893
AVG FAMILY INCOME
$35,179
AVG HOUSEHOLD INCOME
$21,364
FAMILY INCOME DEFICIT
0.45
INEQUALITY / GINI INDEX
801
TOTAL POPULATION
365
MALE POPULATION
436
FEMALE POPULATION
83.72
MALES / 100 FEMALES
119.45
FEMALES / 100 MALES
30.2
MEDIAN AGE
4.4
AVG FAMILY SIZE
4.1
AVG HOUSEHOLD SIZE
337
LABOR FORCE [ PEOPLE ]
65.8%
PERCENT IN LABOR FORCE
25.8%
UNEMPLOYMENT RATE
Hooper Bay Zip Codes
Hooper Bay Area Codes
Income in Hooper Bay
Income Overview in Hooper Bay
Per Capita Income in Hooper Bay is $15,903, while median incomes of families and households are $40,893 and $35,179 respectively.
| Characteristic | Number | Measure |
| Per Capita Income | 801 | $15,903 |
| Median Family Income | 139 | $40,893 |
| Mean Family Income | 139 | $43,667 |
| Median Household Income | 169 | $35,179 |
| Mean Household Income | 169 | $40,096 |
| Income Deficit | 139 | $21,364 |
| Wage / Income Gap (%) | 801 | 0.00% |
| Wage / Income Gap ($) | 801 | 100.00¢ per $1 |
| Gini / Inequality Index | 801 | 0.45 |
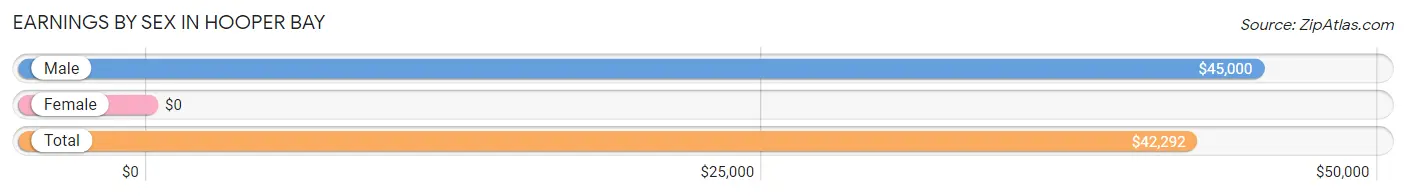
Earnings by Sex in Hooper Bay
| Sex | Number | Average Earnings |
| Male | 132 (46.3%) | $45,000 |
| Female | 153 (53.7%) | $0 |
| Total | 285 (100.0%) | $42,292 |
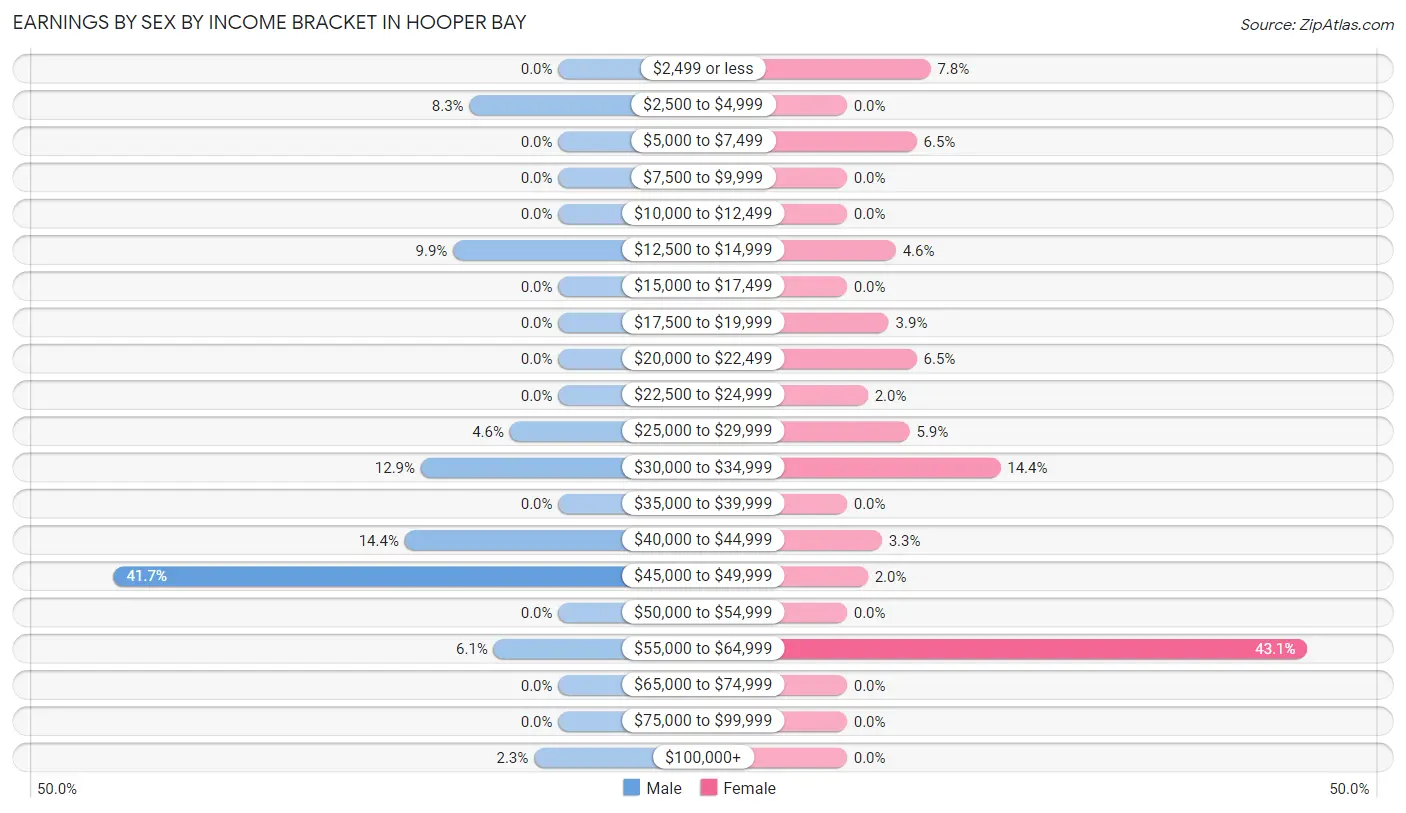
Earnings by Sex by Income Bracket in Hooper Bay
The most common earnings brackets in Hooper Bay are $45,000 to $49,999 for men (55 | 41.7%) and $55,000 to $64,999 for women (66 | 43.1%).
| Income | Male | Female |
| $2,499 or less | 0 (0.0%) | 12 (7.8%) |
| $2,500 to $4,999 | 11 (8.3%) | 0 (0.0%) |
| $5,000 to $7,499 | 0 (0.0%) | 10 (6.5%) |
| $7,500 to $9,999 | 0 (0.0%) | 0 (0.0%) |
| $10,000 to $12,499 | 0 (0.0%) | 0 (0.0%) |
| $12,500 to $14,999 | 13 (9.9%) | 7 (4.6%) |
| $15,000 to $17,499 | 0 (0.0%) | 0 (0.0%) |
| $17,500 to $19,999 | 0 (0.0%) | 6 (3.9%) |
| $20,000 to $22,499 | 0 (0.0%) | 10 (6.5%) |
| $22,500 to $24,999 | 0 (0.0%) | 3 (2.0%) |
| $25,000 to $29,999 | 6 (4.5%) | 9 (5.9%) |
| $30,000 to $34,999 | 17 (12.9%) | 22 (14.4%) |
| $35,000 to $39,999 | 0 (0.0%) | 0 (0.0%) |
| $40,000 to $44,999 | 19 (14.4%) | 5 (3.3%) |
| $45,000 to $49,999 | 55 (41.7%) | 3 (2.0%) |
| $50,000 to $54,999 | 0 (0.0%) | 0 (0.0%) |
| $55,000 to $64,999 | 8 (6.1%) | 66 (43.1%) |
| $65,000 to $74,999 | 0 (0.0%) | 0 (0.0%) |
| $75,000 to $99,999 | 0 (0.0%) | 0 (0.0%) |
| $100,000+ | 3 (2.3%) | 0 (0.0%) |
| Total | 132 (100.0%) | 153 (100.0%) |
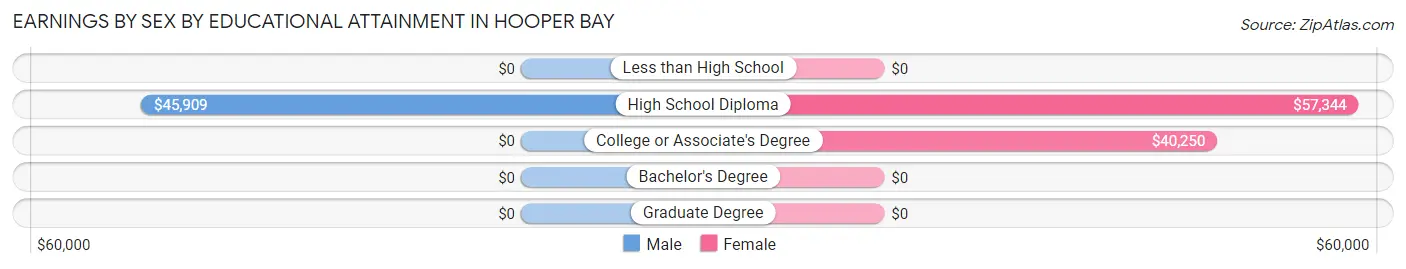
Earnings by Sex by Educational Attainment in Hooper Bay
| Educational Attainment | Male Income | Female Income |
| Less than High School | - | - |
| High School Diploma | $45,909 | $57,344 |
| College or Associate's Degree | - | - |
| Bachelor's Degree | - | - |
| Graduate Degree | - | - |
| Total | $45,136 | $0 |
Family Income in Hooper Bay
Family Income Brackets in Hooper Bay
According to the Hooper Bay family income data, there are 39 families falling into the $50,000 to $74,999 income range, which is the most common income bracket and makes up 28.1% of all families.
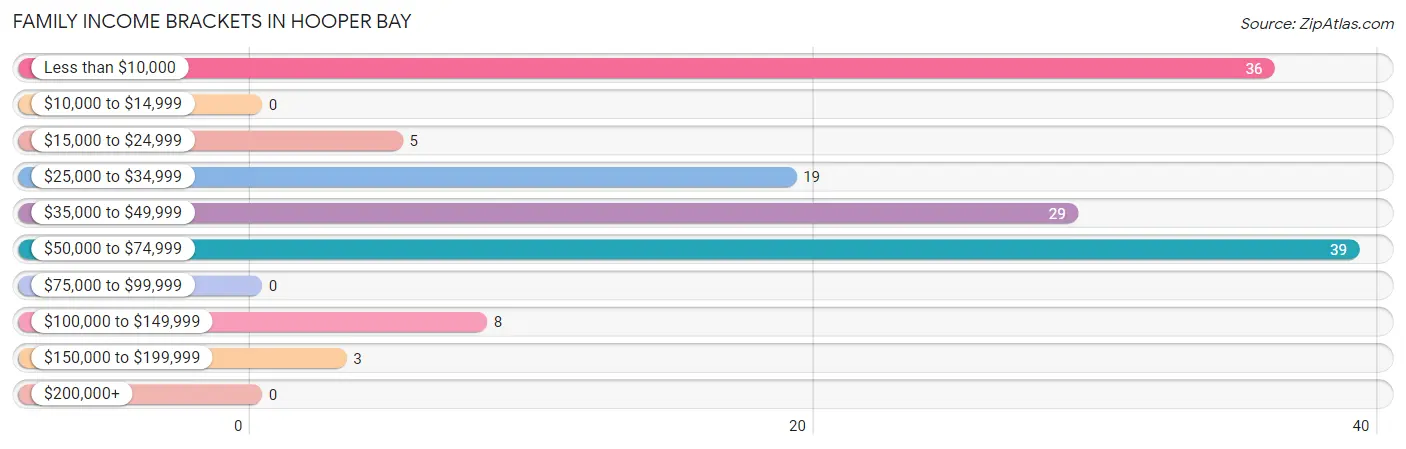
| Income Bracket | # Families | % Families |
| Less than $10,000 | 36 | 25.9% |
| $10,000 to $14,999 | 0 | 0.0% |
| $15,000 to $24,999 | 5 | 3.6% |
| $25,000 to $34,999 | 19 | 13.7% |
| $35,000 to $49,999 | 29 | 20.9% |
| $50,000 to $74,999 | 39 | 28.1% |
| $75,000 to $99,999 | 0 | 0.0% |
| $100,000 to $149,999 | 8 | 5.8% |
| $150,000 to $199,999 | 3 | 2.2% |
| $200,000+ | 0 | 0.0% |
Family Income by Famaliy Size in Hooper Bay
7+ person families (24 | 17.3%) account for the highest median family income in Hooper Bay with $66,250 per family, while 4-person families (43 | 30.9%) have the highest median income of $10,312 per family member.
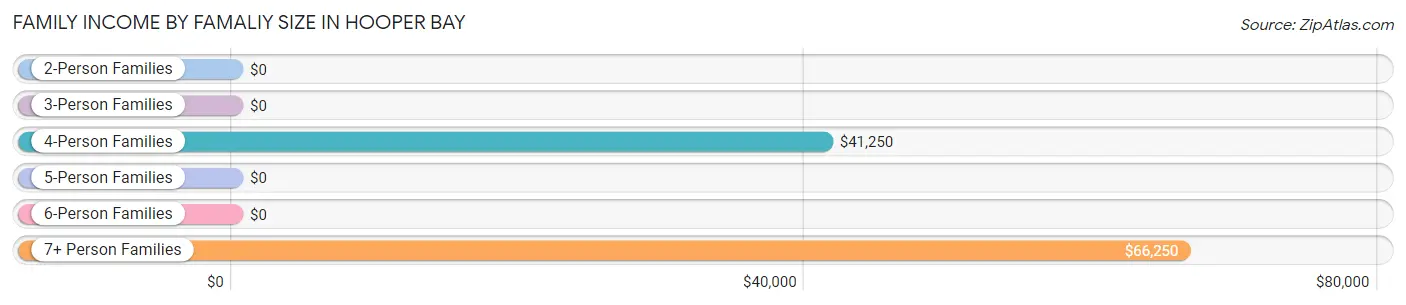
| Income Bracket | # Families | Median Income |
| 2-Person Families | 10 (7.2%) | $0 |
| 3-Person Families | 34 (24.5%) | $0 |
| 4-Person Families | 43 (30.9%) | $41,250 |
| 5-Person Families | 23 (16.6%) | $0 |
| 6-Person Families | 5 (3.6%) | $0 |
| 7+ Person Families | 24 (17.3%) | $66,250 |
| Total | 139 (100.0%) | $40,893 |
Family Income by Number of Earners in Hooper Bay
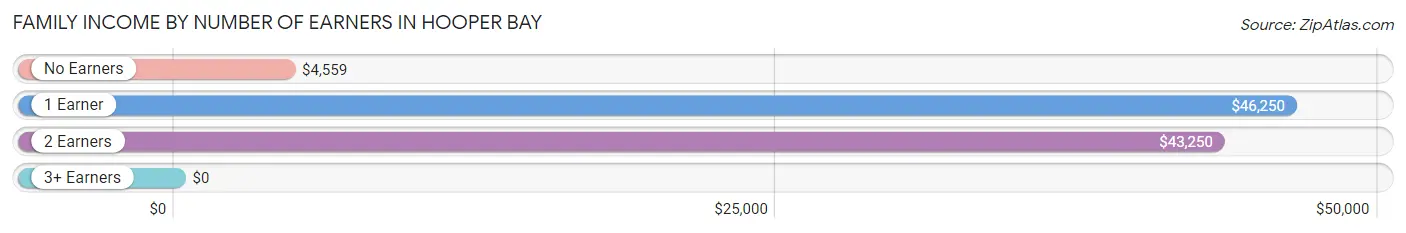
| Number of Earners | # Families | Median Income |
| No Earners | 28 (20.1%) | $4,559 |
| 1 Earner | 68 (48.9%) | $46,250 |
| 2 Earners | 37 (26.6%) | $43,250 |
| 3+ Earners | 6 (4.3%) | $0 |
| Total | 139 (100.0%) | $40,893 |
Household Income in Hooper Bay
Household Income Brackets in Hooper Bay
With 50 households falling in the category, the less than $10,000 income range is the most frequent in Hooper Bay, accounting for 29.6% of all households.
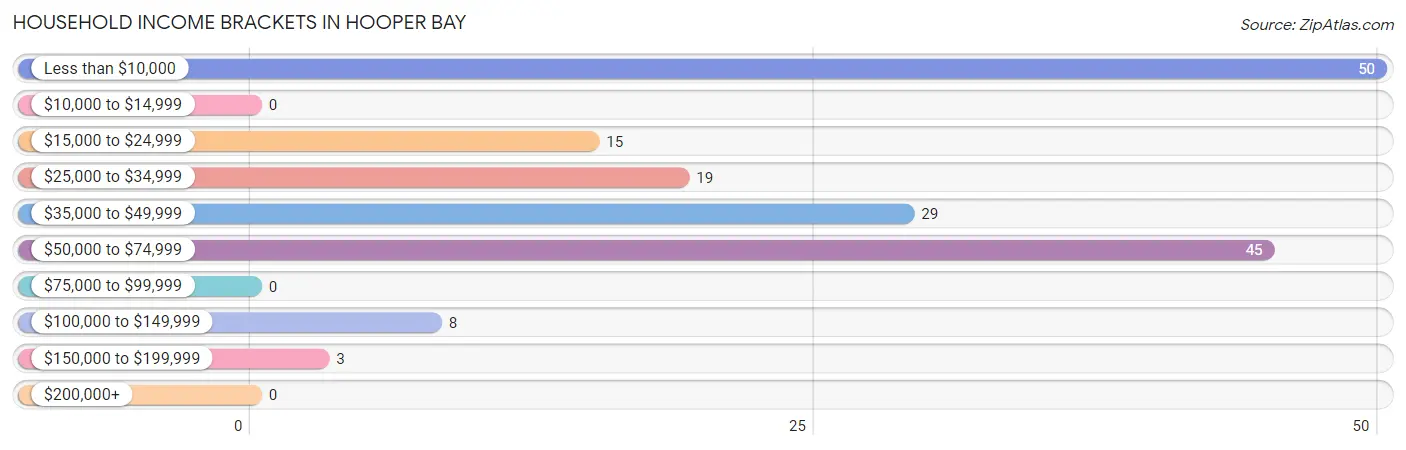
| Income Bracket | # Households | % Households |
| Less than $10,000 | 50 | 29.6% |
| $10,000 to $14,999 | 0 | 0.0% |
| $15,000 to $24,999 | 15 | 8.9% |
| $25,000 to $34,999 | 19 | 11.2% |
| $35,000 to $49,999 | 29 | 17.2% |
| $50,000 to $74,999 | 45 | 26.6% |
| $75,000 to $99,999 | 0 | 0.0% |
| $100,000 to $149,999 | 8 | 4.7% |
| $150,000 to $199,999 | 3 | 1.8% |
| $200,000+ | 0 | 0.0% |
Household Income by Householder Age in Hooper Bay
The median household income in Hooper Bay is $35,179, with the highest median household income of $44,000 found in the 45 to 64 years age bracket for the primary householder. A total of 78 households (46.2%) fall into this category.
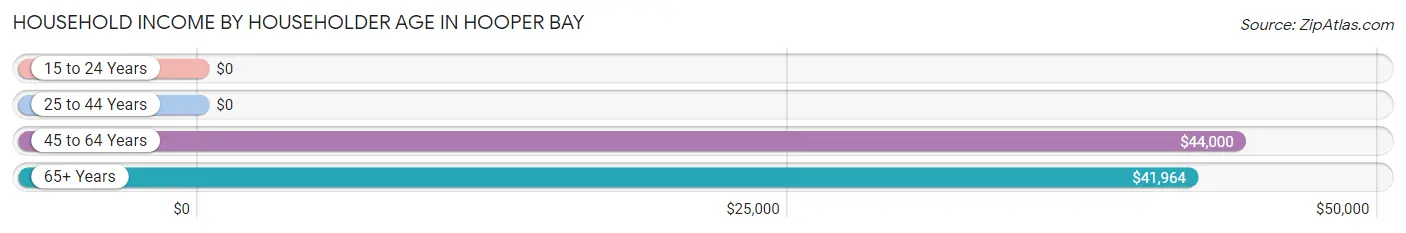
| Income Bracket | # Households | Median Income |
| 15 to 24 Years | 0 (0.0%) | $0 |
| 25 to 44 Years | 68 (40.2%) | $0 |
| 45 to 64 Years | 78 (46.2%) | $44,000 |
| 65+ Years | 23 (13.6%) | $41,964 |
| Total | 169 (100.0%) | $35,179 |
Poverty in Hooper Bay
Income Below Poverty by Sex and Age in Hooper Bay
With 42.5% poverty level for males and 32.8% for females among the residents of Hooper Bay, 25 to 34 year old males and 5 year old females are the most vulnerable to poverty, with 55 males (77.5%) and 6 females (100.0%) in their respective age groups living below the poverty level.
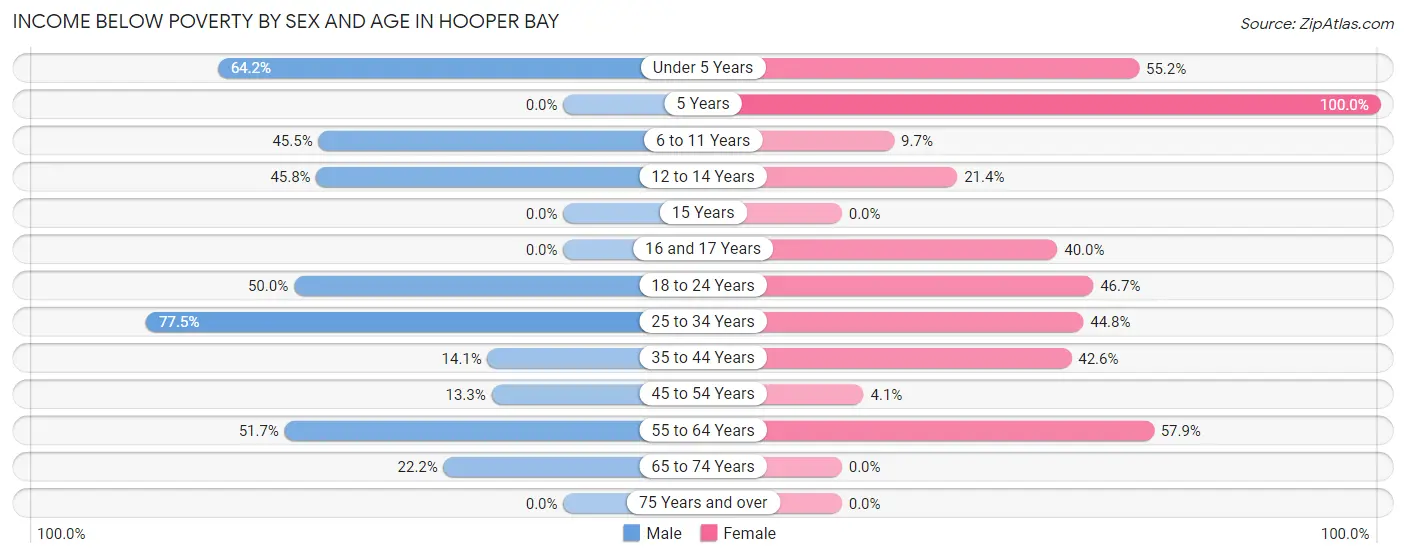
| Age Bracket | Male | Female |
| Under 5 Years | 34 (64.1%) | 32 (55.2%) |
| 5 Years | 0 (0.0%) | 6 (100.0%) |
| 6 to 11 Years | 15 (45.5%) | 7 (9.7%) |
| 12 to 14 Years | 11 (45.8%) | 6 (21.4%) |
| 15 Years | 0 (0.0%) | 0 (0.0%) |
| 16 and 17 Years | 0 (0.0%) | 4 (40.0%) |
| 18 to 24 Years | 6 (50.0%) | 14 (46.7%) |
| 25 to 34 Years | 55 (77.5%) | 26 (44.8%) |
| 35 to 44 Years | 9 (14.1%) | 23 (42.6%) |
| 45 to 54 Years | 4 (13.3%) | 3 (4.1%) |
| 55 to 64 Years | 15 (51.7%) | 22 (57.9%) |
| 65 to 74 Years | 6 (22.2%) | 0 (0.0%) |
| 75 Years and over | 0 (0.0%) | 0 (0.0%) |
| Total | 155 (42.5%) | 143 (32.8%) |
Income Above Poverty by Sex and Age in Hooper Bay
According to the poverty statistics in Hooper Bay, males aged 5 years and females aged 65 to 74 years are the age groups that are most secure financially, with 100.0% of males and 100.0% of females in these age groups living above the poverty line.
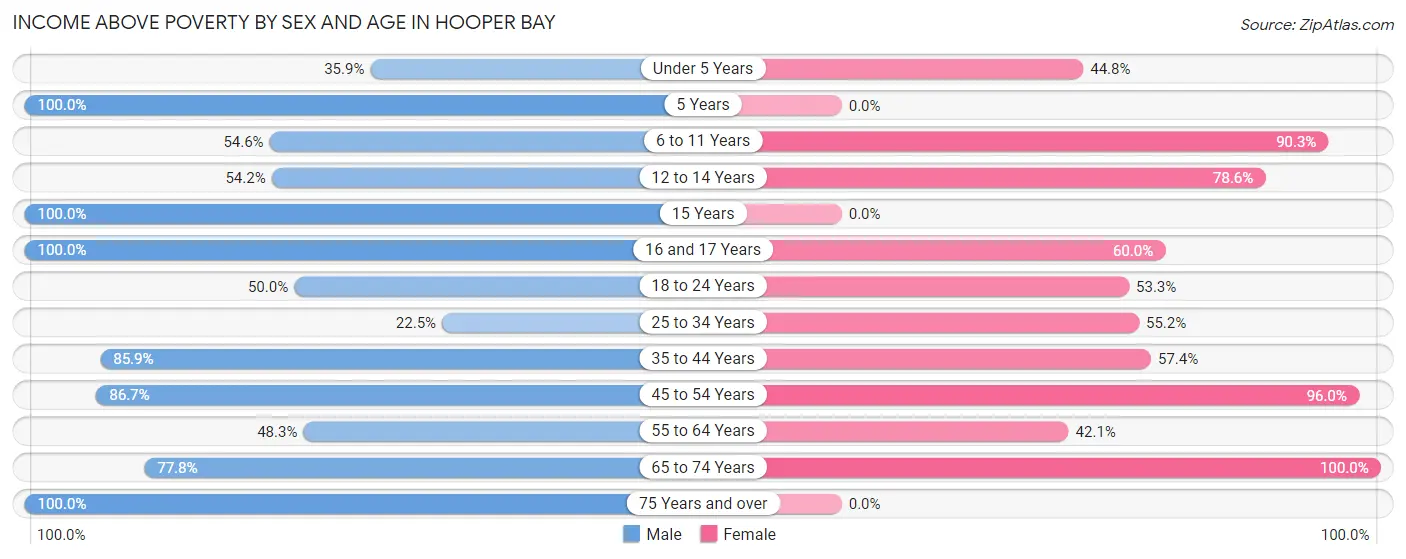
| Age Bracket | Male | Female |
| Under 5 Years | 19 (35.8%) | 26 (44.8%) |
| 5 Years | 10 (100.0%) | 0 (0.0%) |
| 6 to 11 Years | 18 (54.5%) | 65 (90.3%) |
| 12 to 14 Years | 13 (54.2%) | 22 (78.6%) |
| 15 Years | 5 (100.0%) | 0 (0.0%) |
| 16 and 17 Years | 5 (100.0%) | 6 (60.0%) |
| 18 to 24 Years | 6 (50.0%) | 16 (53.3%) |
| 25 to 34 Years | 16 (22.5%) | 32 (55.2%) |
| 35 to 44 Years | 55 (85.9%) | 31 (57.4%) |
| 45 to 54 Years | 26 (86.7%) | 71 (96.0%) |
| 55 to 64 Years | 14 (48.3%) | 16 (42.1%) |
| 65 to 74 Years | 21 (77.8%) | 8 (100.0%) |
| 75 Years and over | 2 (100.0%) | 0 (0.0%) |
| Total | 210 (57.5%) | 293 (67.2%) |
Income Below Poverty Among Married-Couple Families in Hooper Bay
The poverty statistics for married-couple families in Hooper Bay show that 33.8% or 25 of the total 74 families live below the poverty line. Families with 3 or 4 children have the highest poverty rate of 41.7%, comprising of 15 families. On the other hand, families with 1 or 2 children have the lowest poverty rate of 26.3%, which includes 10 families.
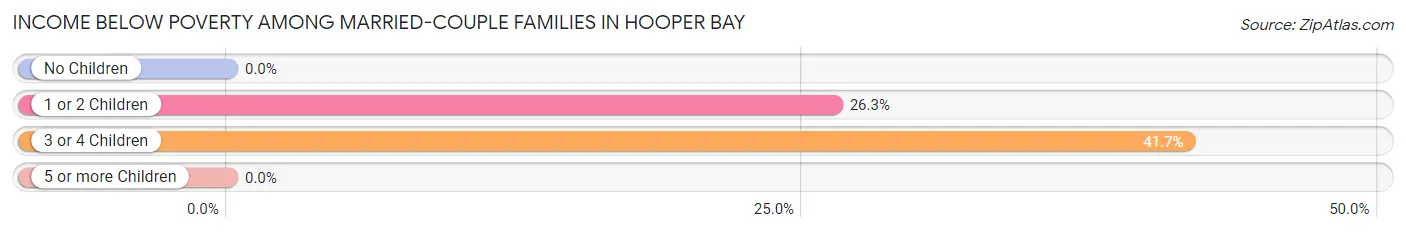
| Children | Above Poverty | Below Poverty |
| No Children | 0 (0.0%) | 0 (0.0%) |
| 1 or 2 Children | 28 (73.7%) | 10 (26.3%) |
| 3 or 4 Children | 21 (58.3%) | 15 (41.7%) |
| 5 or more Children | 0 (0.0%) | 0 (0.0%) |
| Total | 49 (66.2%) | 25 (33.8%) |
Income Below Poverty Among Single-Parent Households in Hooper Bay
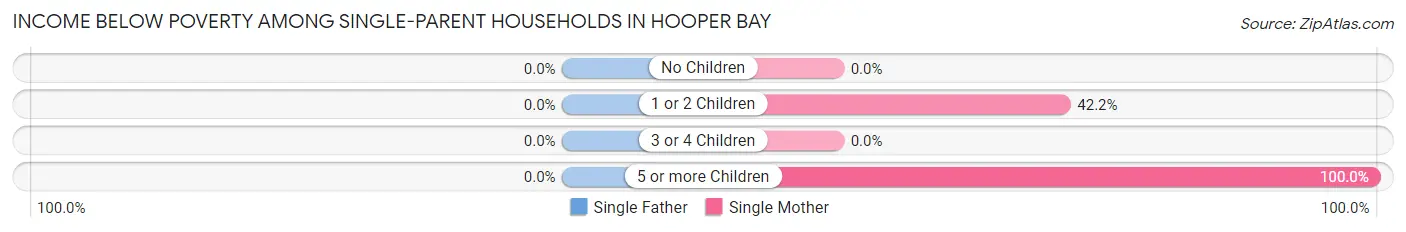
| Children | Single Father | Single Mother |
| No Children | 0 (0.0%) | 0 (0.0%) |
| 1 or 2 Children | 0 (0.0%) | 19 (42.2%) |
| 3 or 4 Children | 0 (0.0%) | 0 (0.0%) |
| 5 or more Children | 0 (0.0%) | 3 (100.0%) |
| Total | 0 (0.0%) | 22 (40.0%) |
Income Below Poverty Among Married-Couple vs Single-Parent Households in Hooper Bay
The poverty data for Hooper Bay shows that 25 of the married-couple family households (33.8%) and 22 of the single-parent households (33.9%) are living below the poverty level. Within the married-couple family households, those with 3 or 4 children have the highest poverty rate, with 15 households (41.7%) falling below the poverty line. Among the single-parent households, those with 5 or more children have the highest poverty rate, with 3 household (100.0%) living below poverty.
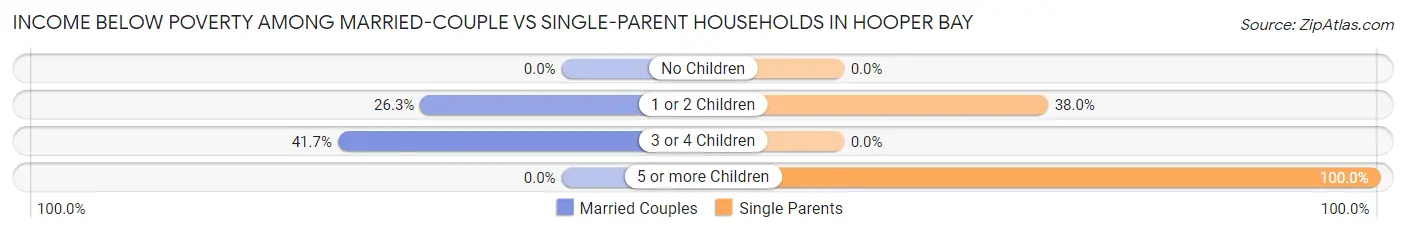
| Children | Married-Couple Families | Single-Parent Households |
| No Children | 0 (0.0%) | 0 (0.0%) |
| 1 or 2 Children | 10 (26.3%) | 19 (38.0%) |
| 3 or 4 Children | 15 (41.7%) | 0 (0.0%) |
| 5 or more Children | 0 (0.0%) | 3 (100.0%) |
| Total | 25 (33.8%) | 22 (33.9%) |
Race in Hooper Bay
The most populous races in Hooper Bay are Native / Alaskan (662 | 82.7%), White / Caucasian (64 | 8.0%), and Hispanic or Latino (55 | 6.9%).
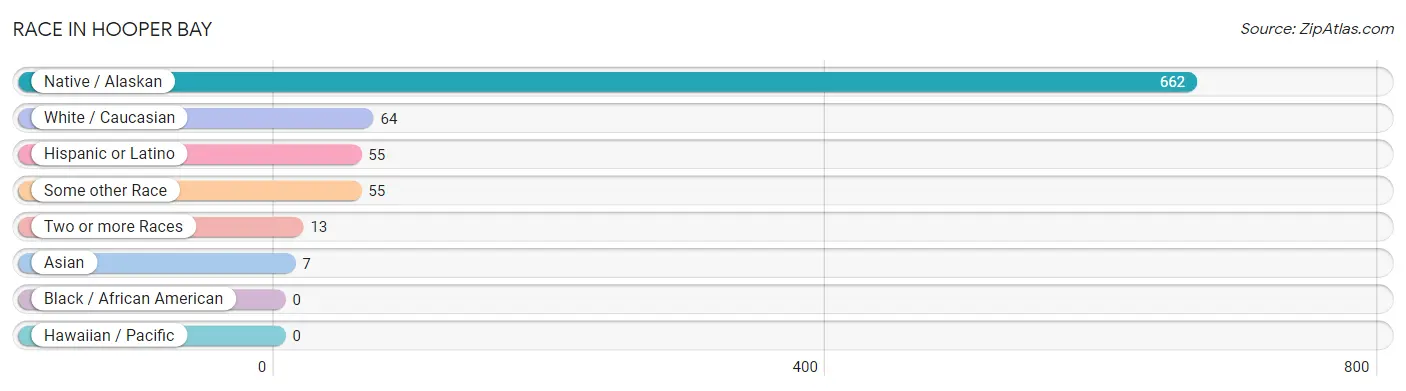
| Race | # Population | % Population |
| Asian | 7 | 0.9% |
| Black / African American | 0 | 0.0% |
| Hawaiian / Pacific | 0 | 0.0% |
| Hispanic or Latino | 55 | 6.9% |
| Native / Alaskan | 662 | 82.7% |
| White / Caucasian | 64 | 8.0% |
| Two or more Races | 13 | 1.6% |
| Some other Race | 55 | 6.9% |
| Total | 801 | 100.0% |
Ancestry in Hooper Bay
The most populous ancestries reported in Hooper Bay are Yup'ik (467 | 58.3%), Alaska Native (165 | 20.6%), Mexican (55 | 6.9%), Alaskan Athabascan (20 | 2.5%), and Inupiat (15 | 1.9%), together accounting for 90.1% of all Hooper Bay residents.
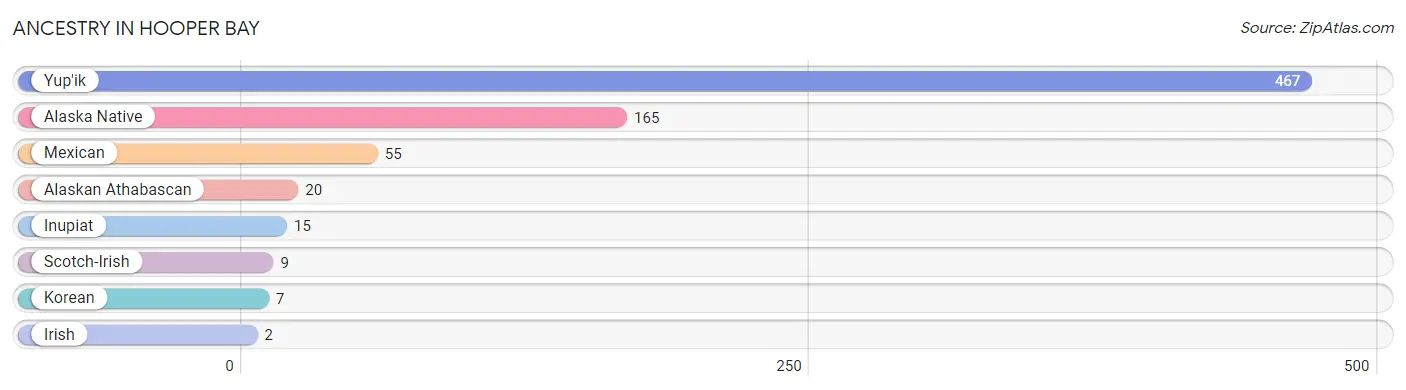
| Ancestry | # Population | % Population |
| Alaska Native | 165 | 20.6% |
| Alaskan Athabascan | 20 | 2.5% |
| Inupiat | 15 | 1.9% |
| Irish | 2 | 0.3% |
| Korean | 7 | 0.9% |
| Mexican | 55 | 6.9% |
| Scotch-Irish | 9 | 1.1% |
| Yup'ik | 467 | 58.3% | View All 8 Rows |
Immigrants in Hooper Bay
The most numerous immigrant groups reported in Hooper Bay came from Asia (7 | 0.9%), Philippines (7 | 0.9%), and South Eastern Asia (7 | 0.9%), together accounting for 2.6% of all Hooper Bay residents.
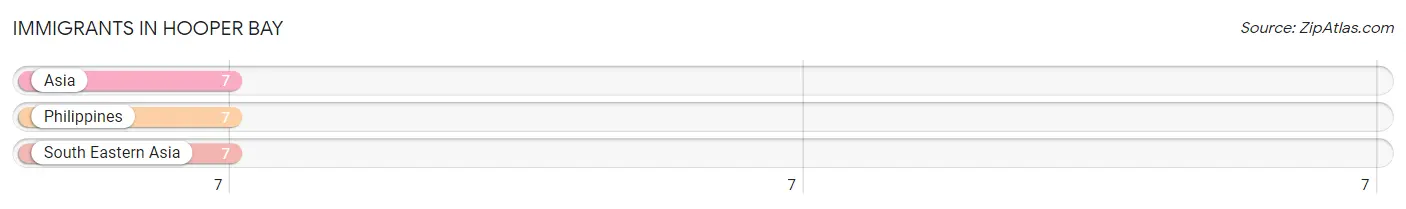
| Immigration Origin | # Population | % Population |
| Asia | 7 | 0.9% |
| Philippines | 7 | 0.9% |
| South Eastern Asia | 7 | 0.9% | View All 3 Rows |
Sex and Age in Hooper Bay
Sex and Age in Hooper Bay
The most populous age groups in Hooper Bay are 35 to 39 Years (64 | 17.5%) for men and 50 to 54 Years (64 | 14.7%) for women.
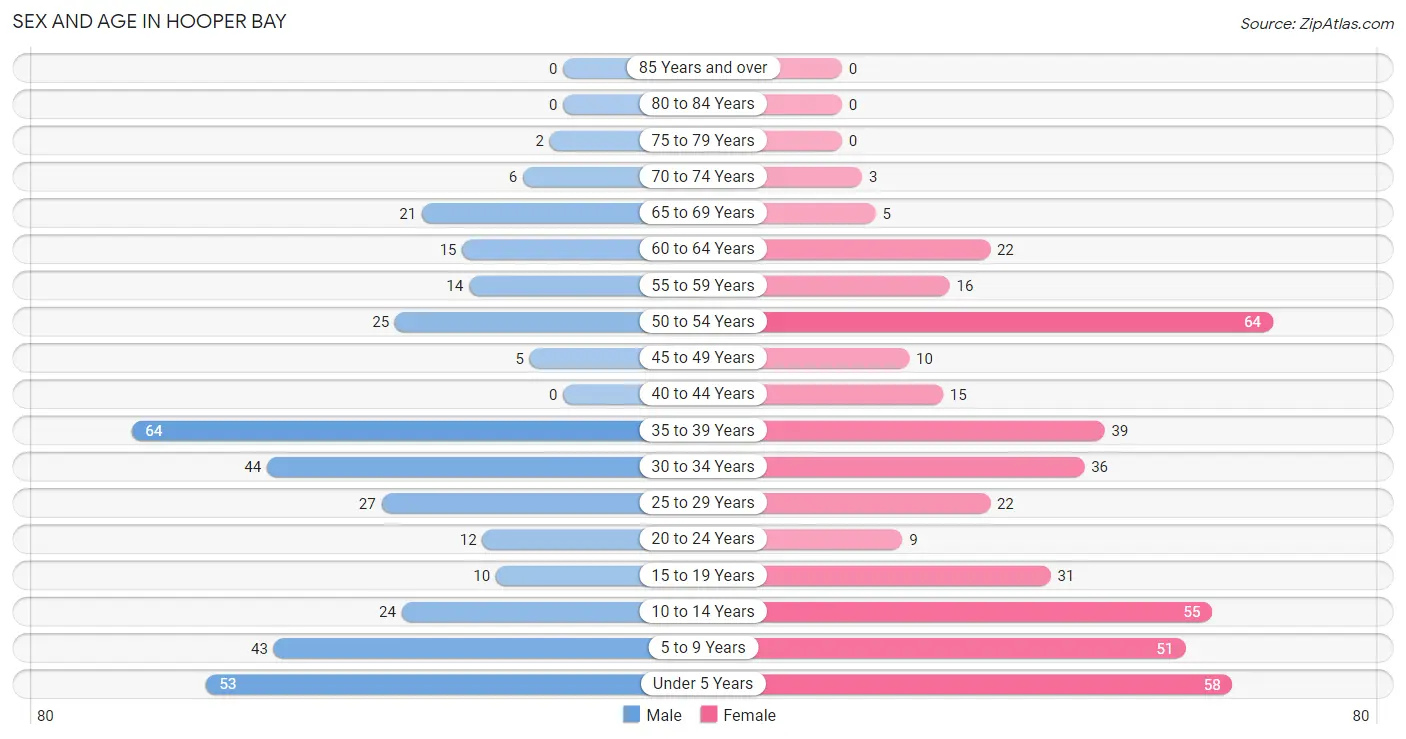
| Age Bracket | Male | Female |
| Under 5 Years | 53 (14.5%) | 58 (13.3%) |
| 5 to 9 Years | 43 (11.8%) | 51 (11.7%) |
| 10 to 14 Years | 24 (6.6%) | 55 (12.6%) |
| 15 to 19 Years | 10 (2.7%) | 31 (7.1%) |
| 20 to 24 Years | 12 (3.3%) | 9 (2.1%) |
| 25 to 29 Years | 27 (7.4%) | 22 (5.1%) |
| 30 to 34 Years | 44 (12.0%) | 36 (8.3%) |
| 35 to 39 Years | 64 (17.5%) | 39 (8.9%) |
| 40 to 44 Years | 0 (0.0%) | 15 (3.4%) |
| 45 to 49 Years | 5 (1.4%) | 10 (2.3%) |
| 50 to 54 Years | 25 (6.9%) | 64 (14.7%) |
| 55 to 59 Years | 14 (3.8%) | 16 (3.7%) |
| 60 to 64 Years | 15 (4.1%) | 22 (5.1%) |
| 65 to 69 Years | 21 (5.8%) | 5 (1.1%) |
| 70 to 74 Years | 6 (1.6%) | 3 (0.7%) |
| 75 to 79 Years | 2 (0.5%) | 0 (0.0%) |
| 80 to 84 Years | 0 (0.0%) | 0 (0.0%) |
| 85 Years and over | 0 (0.0%) | 0 (0.0%) |
| Total | 365 (100.0%) | 436 (100.0%) |
Families and Households in Hooper Bay
Median Family Size in Hooper Bay
The median family size in Hooper Bay is 4.44 persons per family, with married-couple families (74 | 53.2%) accounting for the largest median family size of 5.01 persons per family. On the other hand, single male/father families (10 | 7.2%) represent the smallest median family size with 2.00 persons per family.
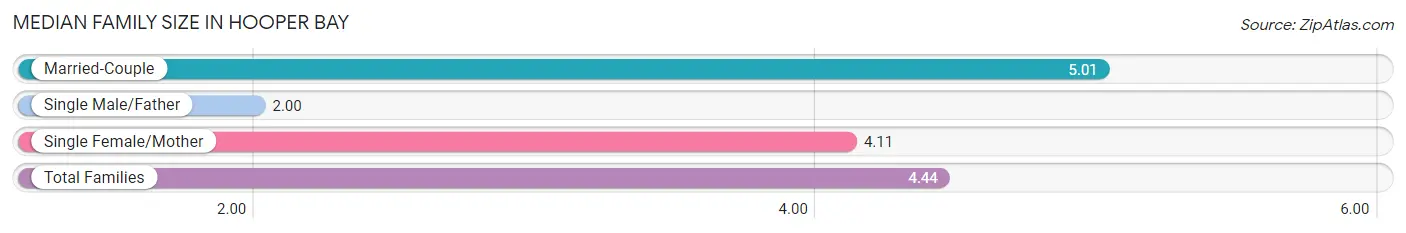
| Family Type | # Families | Family Size |
| Married-Couple | 74 (53.2%) | 5.01 |
| Single Male/Father | 10 (7.2%) | 2.00 |
| Single Female/Mother | 55 (39.6%) | 4.11 |
| Total Families | 139 (100.0%) | 4.44 |
Median Household Size in Hooper Bay
The median household size in Hooper Bay is 4.09 persons per household, with married-couple households (74 | 43.8%) accounting for the largest median household size of 5.01 persons per household. non-family households (30 | 17.7%) represent the smallest median household size with 1.90 persons per household.
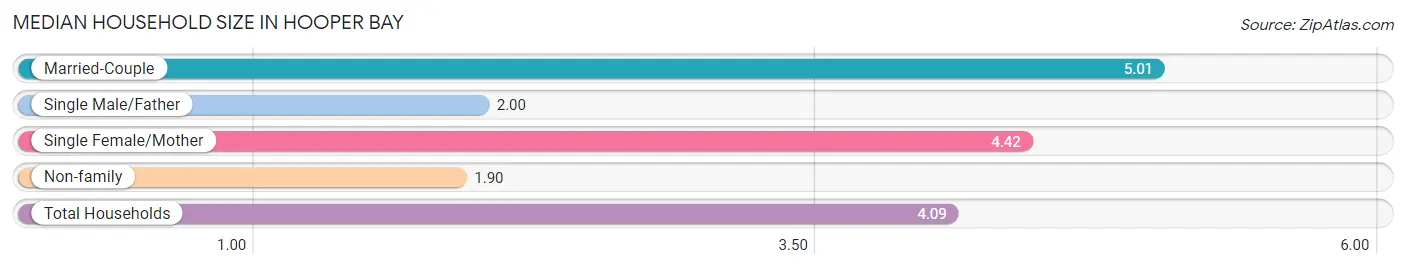
| Household Type | # Households | Household Size |
| Married-Couple | 74 (43.8%) | 5.01 |
| Single Male/Father | 10 (5.9%) | 2.00 |
| Single Female/Mother | 55 (32.5%) | 4.42 |
| Non-family | 30 (17.7%) | 1.90 |
| Total Households | 169 (100.0%) | 4.09 |
Household Size by Marriage Status in Hooper Bay
Out of a total of 169 households in Hooper Bay, 139 (82.3%) are family households, while 30 (17.7%) are nonfamily households. The most numerous type of family households are 4-person households, comprising 56, and the most common type of nonfamily households are 2-person households, comprising 25.
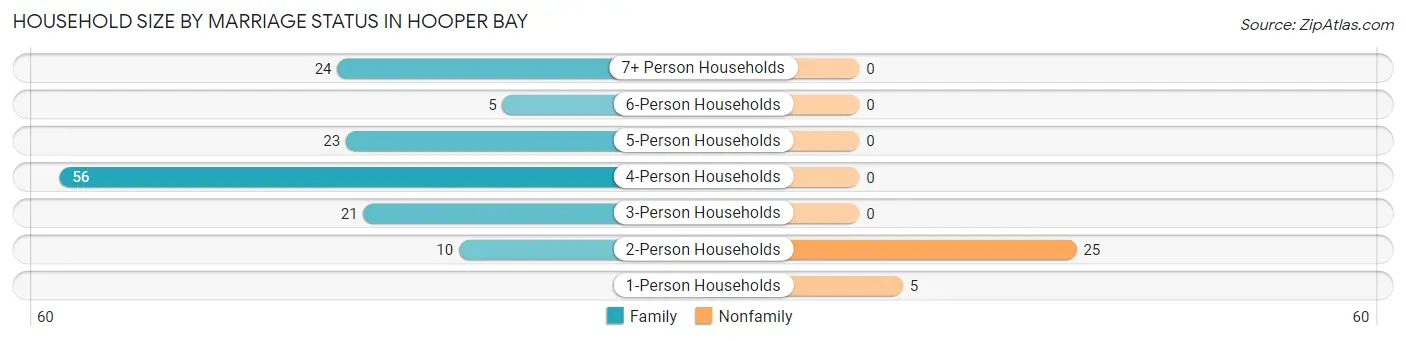
| Household Size | Family Households | Nonfamily Households |
| 1-Person Households | - | 5 (3.0%) |
| 2-Person Households | 10 (5.9%) | 25 (14.8%) |
| 3-Person Households | 21 (12.4%) | 0 (0.0%) |
| 4-Person Households | 56 (33.1%) | 0 (0.0%) |
| 5-Person Households | 23 (13.6%) | 0 (0.0%) |
| 6-Person Households | 5 (3.0%) | 0 (0.0%) |
| 7+ Person Households | 24 (14.2%) | 0 (0.0%) |
| Total | 139 (82.3%) | 30 (17.7%) |
Female Fertility in Hooper Bay
Fertility by Age in Hooper Bay
Average fertility rate in Hooper Bay is 165.0 births per 1,000 women. Women in the age bracket of 35 to 50 years have the highest fertility rate with 212.0 births per 1,000 women. Women in the age bracket of 35 to 50 years acount for 51.8% of all women with births.
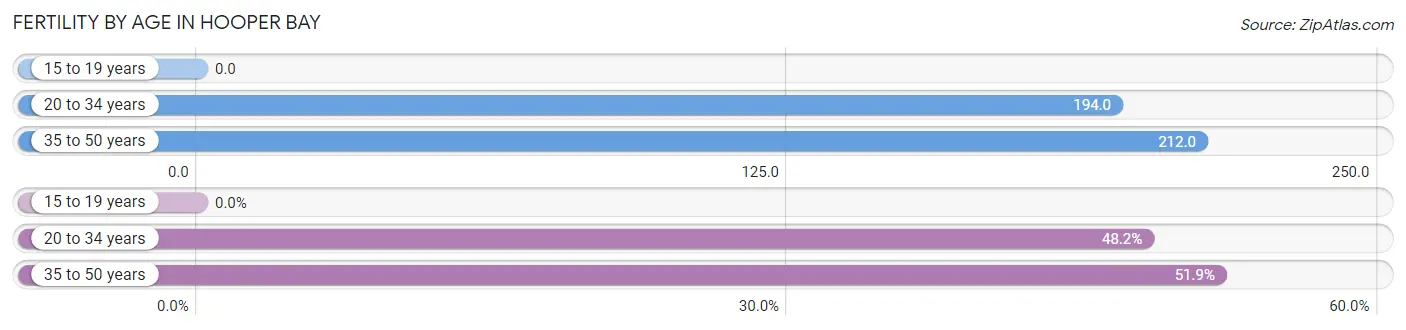
| Age Bracket | Women with Births | Births / 1,000 Women |
| 15 to 19 years | 0 (0.0%) | 0.0 |
| 20 to 34 years | 13 (48.1%) | 194.0 |
| 35 to 50 years | 14 (51.8%) | 212.0 |
| Total | 27 (100.0%) | 165.0 |
Fertility by Age by Marriage Status in Hooper Bay
22.2% of women with births (27) in Hooper Bay are married. The highest percentage of unmarried women with births falls into 20 to 34 years age bracket with 100.0% of them unmarried at the time of birth, while the lowest percentage of unmarried women with births belong to 35 to 50 years age bracket with 57.1% of them unmarried.
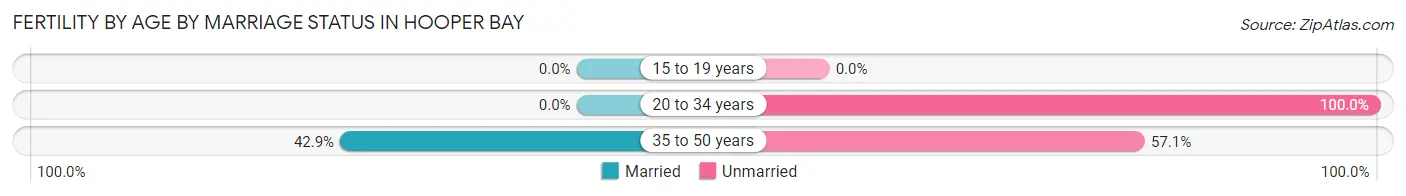
| Age Bracket | Married | Unmarried |
| 15 to 19 years | 0 (0.0%) | 0 (0.0%) |
| 20 to 34 years | 0 (0.0%) | 13 (100.0%) |
| 35 to 50 years | 6 (42.9%) | 8 (57.1%) |
| Total | 6 (22.2%) | 21 (77.8%) |
Fertility by Education in Hooper Bay
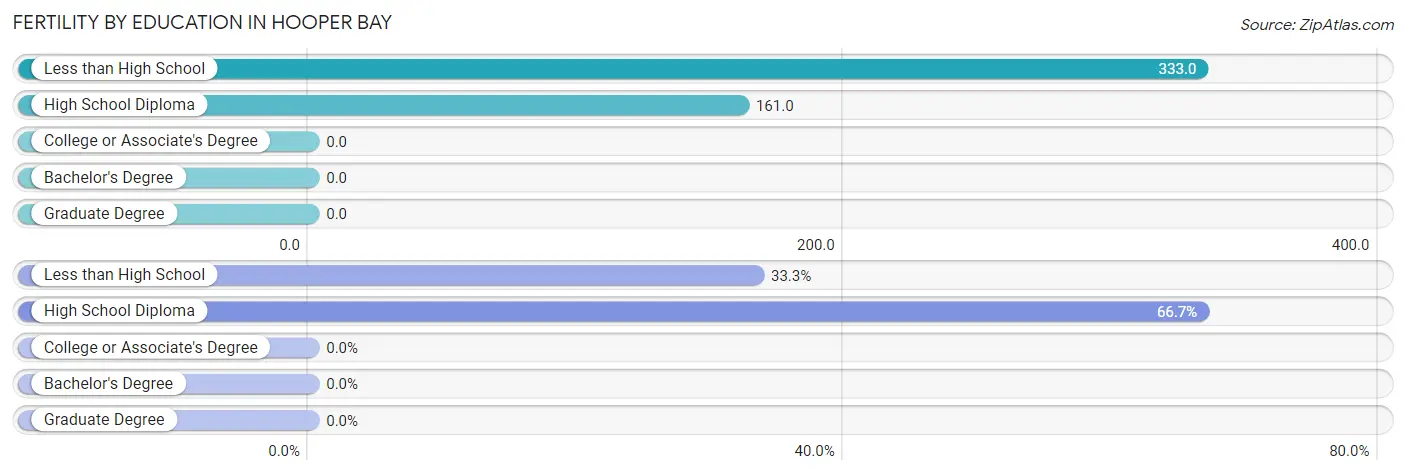
| Educational Attainment | Women with Births | Births / 1,000 Women |
| Less than High School | 9 (33.3%) | 333.0 |
| High School Diploma | 18 (66.7%) | 161.0 |
| College or Associate's Degree | 0 (0.0%) | 0.0 |
| Bachelor's Degree | 0 (0.0%) | 0.0 |
| Graduate Degree | 0 (0.0%) | 0.0 |
| Total | 27 (100.0%) | 165.0 |
Fertility by Education by Marriage Status in Hooper Bay
77.8% of women with births in Hooper Bay are unmarried. Women with the educational attainment of high school diploma are most likely to be married with 33.3% of them married at childbirth, while women with the educational attainment of less than high school are least likely to be married with 100.0% of them unmarried at childbirth.
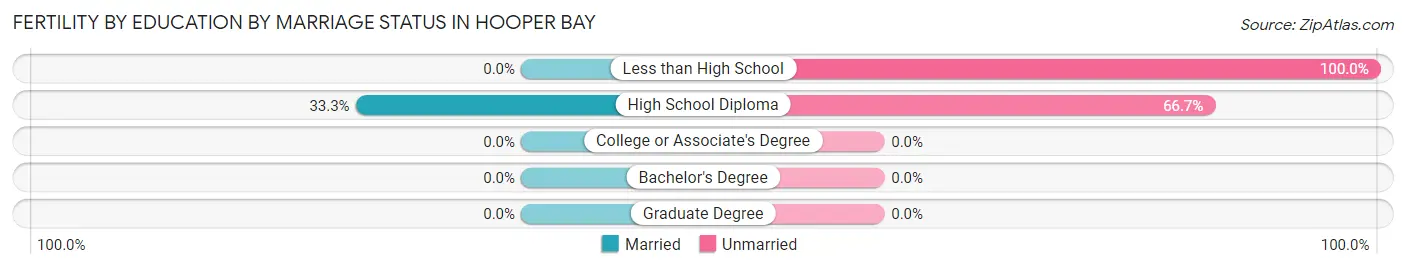
| Educational Attainment | Married | Unmarried |
| Less than High School | 0 (0.0%) | 9 (100.0%) |
| High School Diploma | 6 (33.3%) | 12 (66.7%) |
| College or Associate's Degree | 0 (0.0%) | 0 (0.0%) |
| Bachelor's Degree | 0 (0.0%) | 0 (0.0%) |
| Graduate Degree | 0 (0.0%) | 0 (0.0%) |
| Total | 6 (22.2%) | 21 (77.8%) |
Employment Characteristics in Hooper Bay
Employment by Class of Employer in Hooper Bay
Among the 250 employed individuals in Hooper Bay, private company employees (159 | 63.6%), local government employees (62 | 24.8%), and state government employees (24 | 9.6%) make up the most common classes of employment.
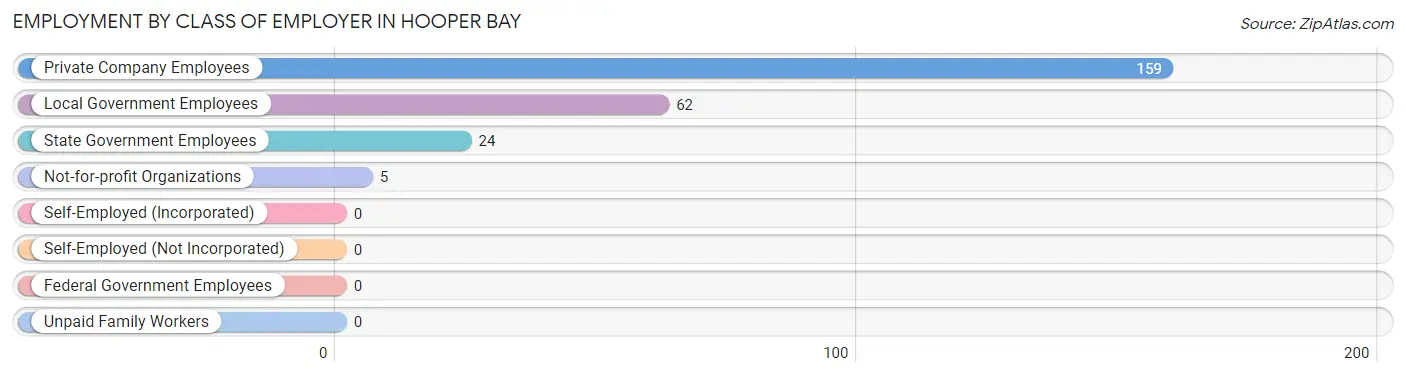
| Employer Class | # Employees | % Employees |
| Private Company Employees | 159 | 63.6% |
| Self-Employed (Incorporated) | 0 | 0.0% |
| Self-Employed (Not Incorporated) | 0 | 0.0% |
| Not-for-profit Organizations | 5 | 2.0% |
| Local Government Employees | 62 | 24.8% |
| State Government Employees | 24 | 9.6% |
| Federal Government Employees | 0 | 0.0% |
| Unpaid Family Workers | 0 | 0.0% |
| Total | 250 | 100.0% |
Employment Status by Age in Hooper Bay
According to the labor force statistics for Hooper Bay, out of the total population over 16 years of age (512), 65.8% or 337 individuals are in the labor force, with 25.8% or 87 of them unemployed. The age group with the highest labor force participation rate is 45 to 54 years, with 79.8% or 83 individuals in the labor force. Within the labor force, the 25 to 29 years age range has the highest percentage of unemployed individuals, with 65.7% or 23 of them being unemployed.
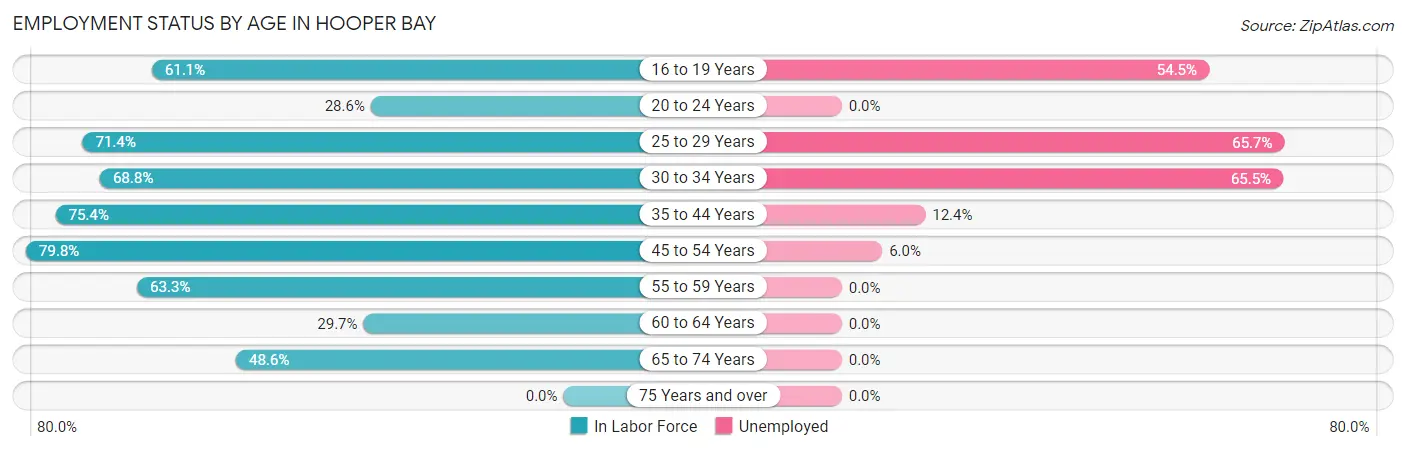
| Age Bracket | In Labor Force | Unemployed |
| 16 to 19 Years | 22 (61.1%) | 12 (54.5%) |
| 20 to 24 Years | 6 (28.6%) | 0 (0.0%) |
| 25 to 29 Years | 35 (71.4%) | 23 (65.7%) |
| 30 to 34 Years | 55 (68.8%) | 36 (65.5%) |
| 35 to 44 Years | 89 (75.4%) | 11 (12.4%) |
| 45 to 54 Years | 83 (79.8%) | 5 (6.0%) |
| 55 to 59 Years | 19 (63.3%) | 0 (0.0%) |
| 60 to 64 Years | 11 (29.7%) | 0 (0.0%) |
| 65 to 74 Years | 17 (48.6%) | 0 (0.0%) |
| 75 Years and over | 0 (0.0%) | 0 (0.0%) |
| Total | 337 (65.8%) | 87 (25.8%) |
Employment Status by Educational Attainment in Hooper Bay
According to labor force statistics for Hooper Bay, 69.9% of individuals (292) out of the total population between 25 and 64 years of age (418) are in the labor force, with 25.7% or 75 of them being unemployed. The group with the highest labor force participation rate are those with the educational attainment of bachelor's degree or higher, with 100.0% or 7 individuals in the labor force. Within the labor force, individuals with less than high school education have the highest percentage of unemployment, with 61.5% or 8 of them being unemployed.
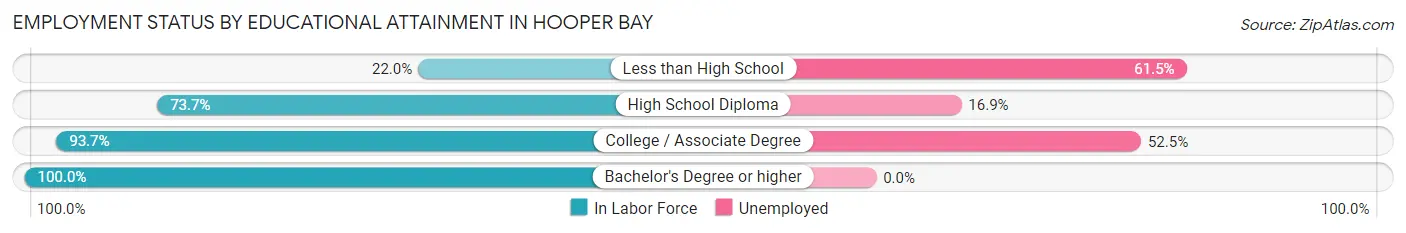
| Educational Attainment | In Labor Force | Unemployed |
| Less than High School | 13 (22.0%) | 36 (61.5%) |
| High School Diploma | 213 (73.7%) | 49 (16.9%) |
| College / Associate Degree | 59 (93.7%) | 33 (52.5%) |
| Bachelor's Degree or higher | 7 (100.0%) | 0 (0.0%) |
| Total | 292 (69.9%) | 107 (25.7%) |
Employment Occupations by Sex in Hooper Bay
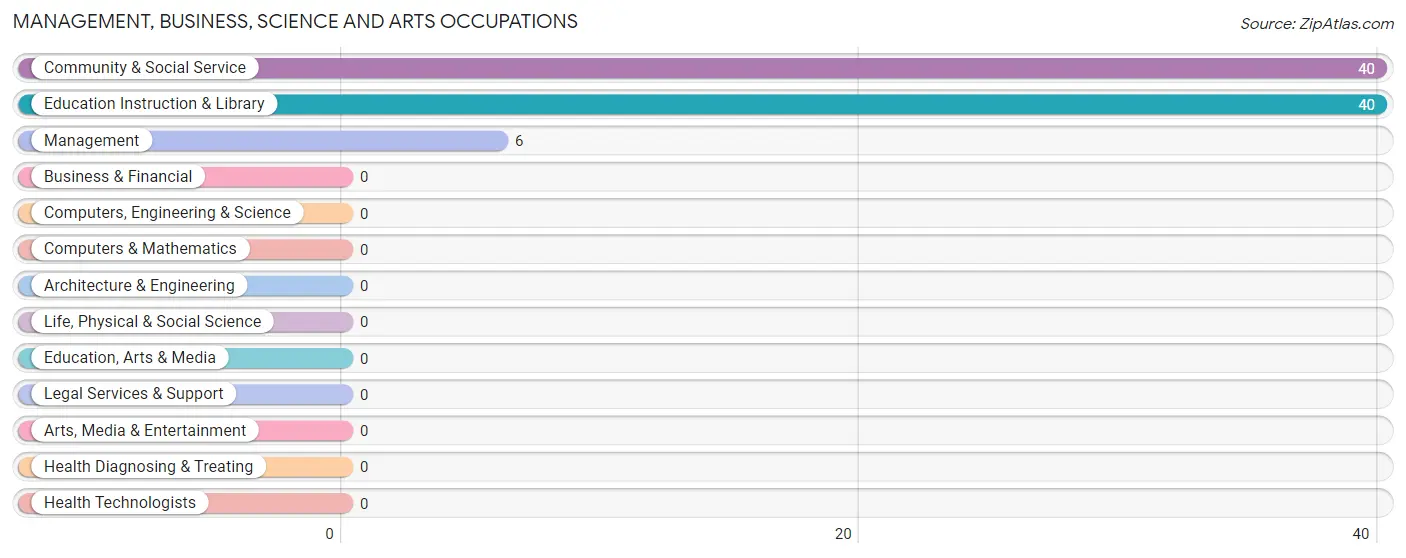
Management, Business, Science and Arts Occupations
The most common Management, Business, Science and Arts occupations in Hooper Bay are Community & Social Service (40 | 16.0%), Education Instruction & Library (40 | 16.0%), and Management (6 | 2.4%).
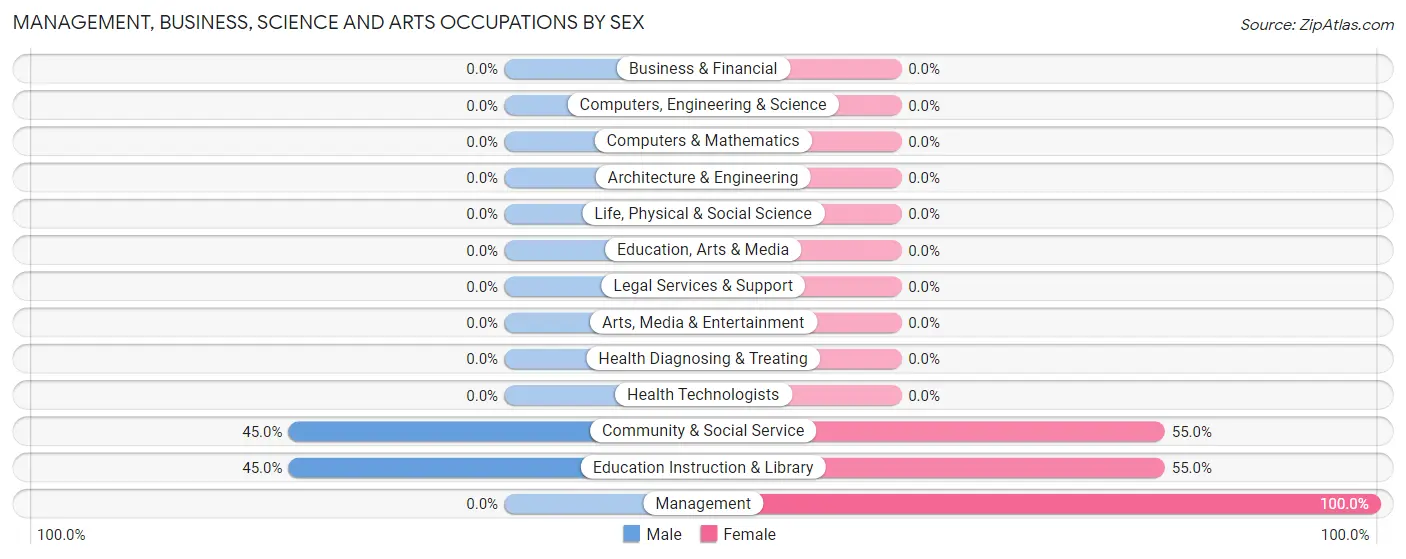
Management, Business, Science and Arts Occupations by Sex
Within the Management, Business, Science and Arts occupations in Hooper Bay, the most male-oriented occupations are Community & Social Service (45.0%), and Education Instruction & Library (45.0%), while the most female-oriented occupations are Management (100.0%), Community & Social Service (55.0%), and Education Instruction & Library (55.0%).
| Occupation | Male | Female |
| Management | 0 (0.0%) | 6 (100.0%) |
| Business & Financial | 0 (0.0%) | 0 (0.0%) |
| Computers, Engineering & Science | 0 (0.0%) | 0 (0.0%) |
| Computers & Mathematics | 0 (0.0%) | 0 (0.0%) |
| Architecture & Engineering | 0 (0.0%) | 0 (0.0%) |
| Life, Physical & Social Science | 0 (0.0%) | 0 (0.0%) |
| Community & Social Service | 18 (45.0%) | 22 (55.0%) |
| Education, Arts & Media | 0 (0.0%) | 0 (0.0%) |
| Legal Services & Support | 0 (0.0%) | 0 (0.0%) |
| Education Instruction & Library | 18 (45.0%) | 22 (55.0%) |
| Arts, Media & Entertainment | 0 (0.0%) | 0 (0.0%) |
| Health Diagnosing & Treating | 0 (0.0%) | 0 (0.0%) |
| Health Technologists | 0 (0.0%) | 0 (0.0%) |
| Total (Category) | 18 (39.1%) | 28 (60.9%) |
| Total (Overall) | 108 (43.2%) | 142 (56.8%) |
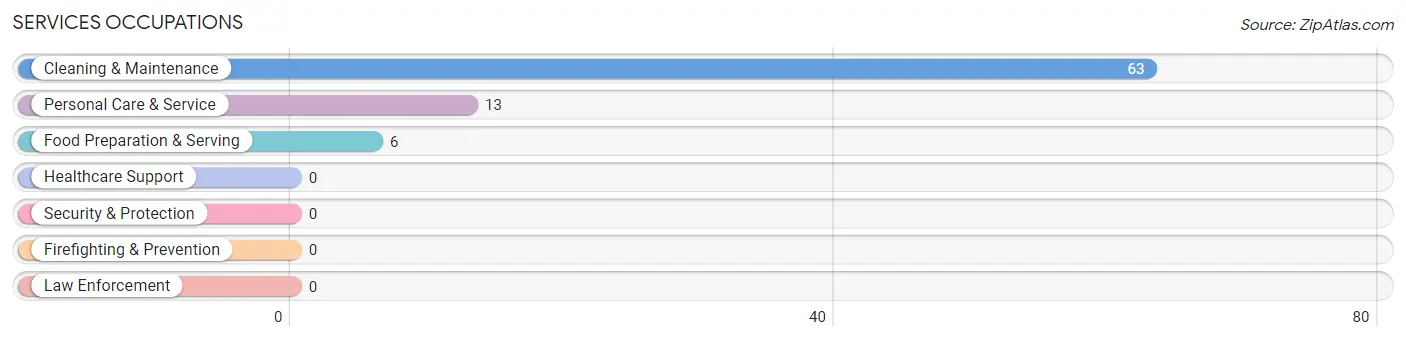
Services Occupations
The most common Services occupations in Hooper Bay are Cleaning & Maintenance (63 | 25.2%), Personal Care & Service (13 | 5.2%), and Food Preparation & Serving (6 | 2.4%).
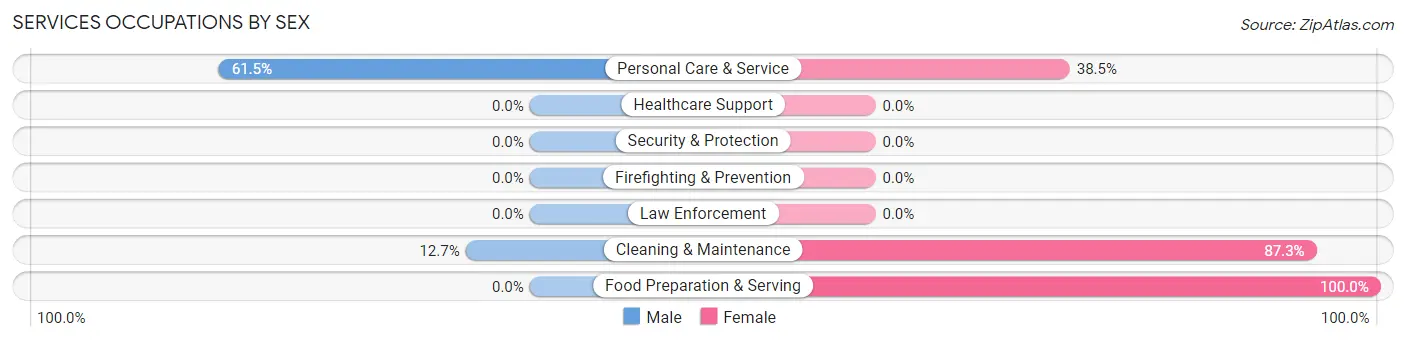
Services Occupations by Sex
Within the Services occupations in Hooper Bay, the most male-oriented occupations are Personal Care & Service (61.5%), and Cleaning & Maintenance (12.7%), while the most female-oriented occupations are Food Preparation & Serving (100.0%), Cleaning & Maintenance (87.3%), and Personal Care & Service (38.5%).
| Occupation | Male | Female |
| Healthcare Support | 0 (0.0%) | 0 (0.0%) |
| Security & Protection | 0 (0.0%) | 0 (0.0%) |
| Firefighting & Prevention | 0 (0.0%) | 0 (0.0%) |
| Law Enforcement | 0 (0.0%) | 0 (0.0%) |
| Food Preparation & Serving | 0 (0.0%) | 6 (100.0%) |
| Cleaning & Maintenance | 8 (12.7%) | 55 (87.3%) |
| Personal Care & Service | 8 (61.5%) | 5 (38.5%) |
| Total (Category) | 16 (19.5%) | 66 (80.5%) |
| Total (Overall) | 108 (43.2%) | 142 (56.8%) |
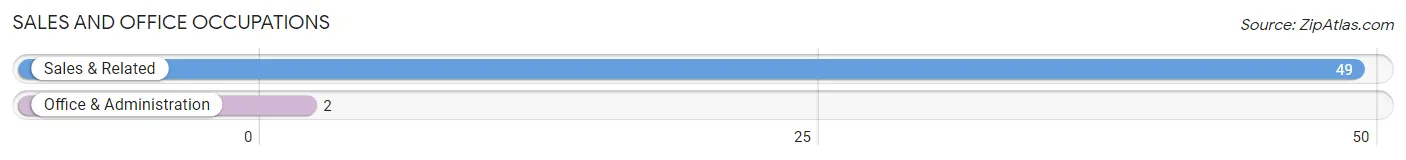
Sales and Office Occupations
The most common Sales and Office occupations in Hooper Bay are Sales & Related (49 | 19.6%), and Office & Administration (2 | 0.8%).
Sales and Office Occupations by Sex
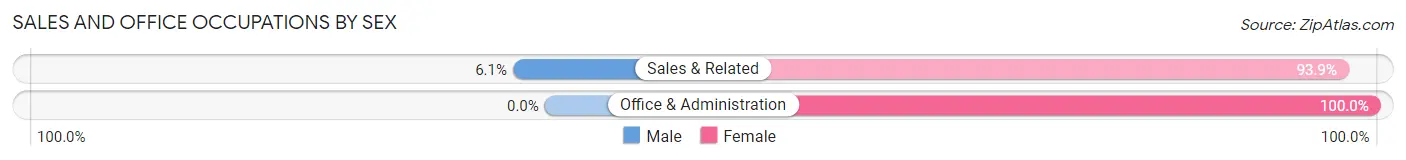
| Occupation | Male | Female |
| Sales & Related | 3 (6.1%) | 46 (93.9%) |
| Office & Administration | 0 (0.0%) | 2 (100.0%) |
| Total (Category) | 3 (5.9%) | 48 (94.1%) |
| Total (Overall) | 108 (43.2%) | 142 (56.8%) |
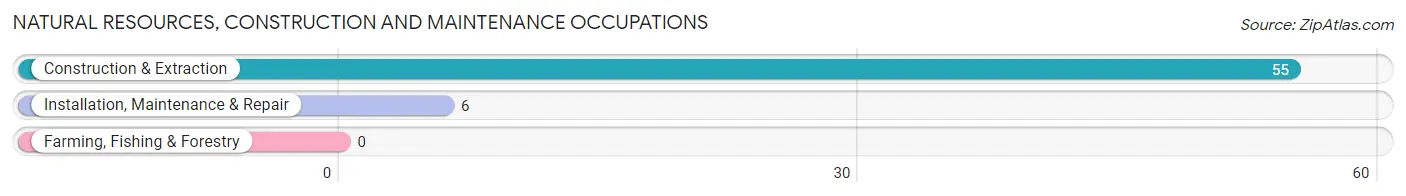
Natural Resources, Construction and Maintenance Occupations
The most common Natural Resources, Construction and Maintenance occupations in Hooper Bay are Construction & Extraction (55 | 22.0%), and Installation, Maintenance & Repair (6 | 2.4%).
Natural Resources, Construction and Maintenance Occupations by Sex
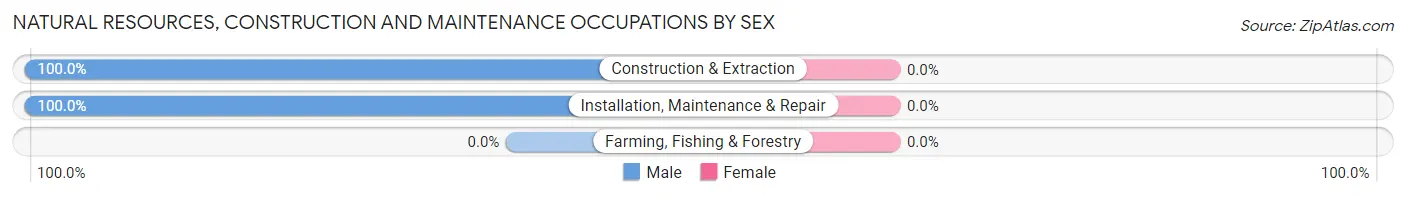
| Occupation | Male | Female |
| Farming, Fishing & Forestry | 0 (0.0%) | 0 (0.0%) |
| Construction & Extraction | 55 (100.0%) | 0 (0.0%) |
| Installation, Maintenance & Repair | 6 (100.0%) | 0 (0.0%) |
| Total (Category) | 61 (100.0%) | 0 (0.0%) |
| Total (Overall) | 108 (43.2%) | 142 (56.8%) |
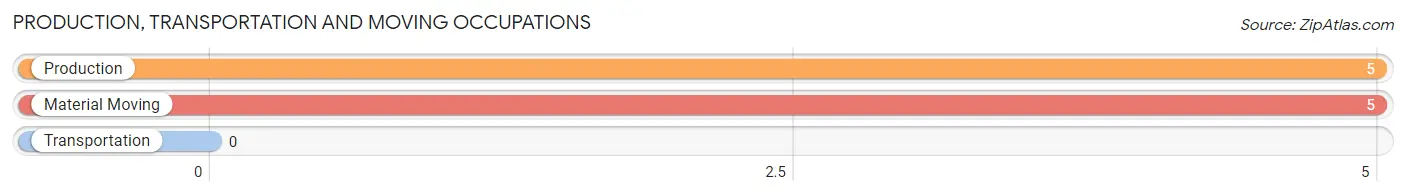
Production, Transportation and Moving Occupations
The most common Production, Transportation and Moving occupations in Hooper Bay are Production (5 | 2.0%), and Material Moving (5 | 2.0%).
Production, Transportation and Moving Occupations by Sex
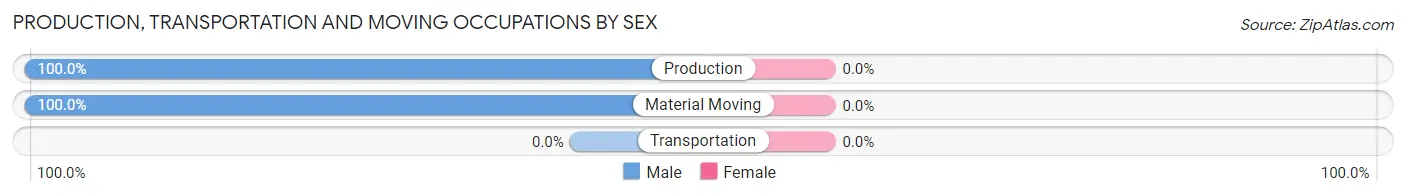
| Occupation | Male | Female |
| Production | 5 (100.0%) | 0 (0.0%) |
| Transportation | 0 (0.0%) | 0 (0.0%) |
| Material Moving | 5 (100.0%) | 0 (0.0%) |
| Total (Category) | 10 (100.0%) | 0 (0.0%) |
| Total (Overall) | 108 (43.2%) | 142 (56.8%) |
Employment Industries by Sex in Hooper Bay
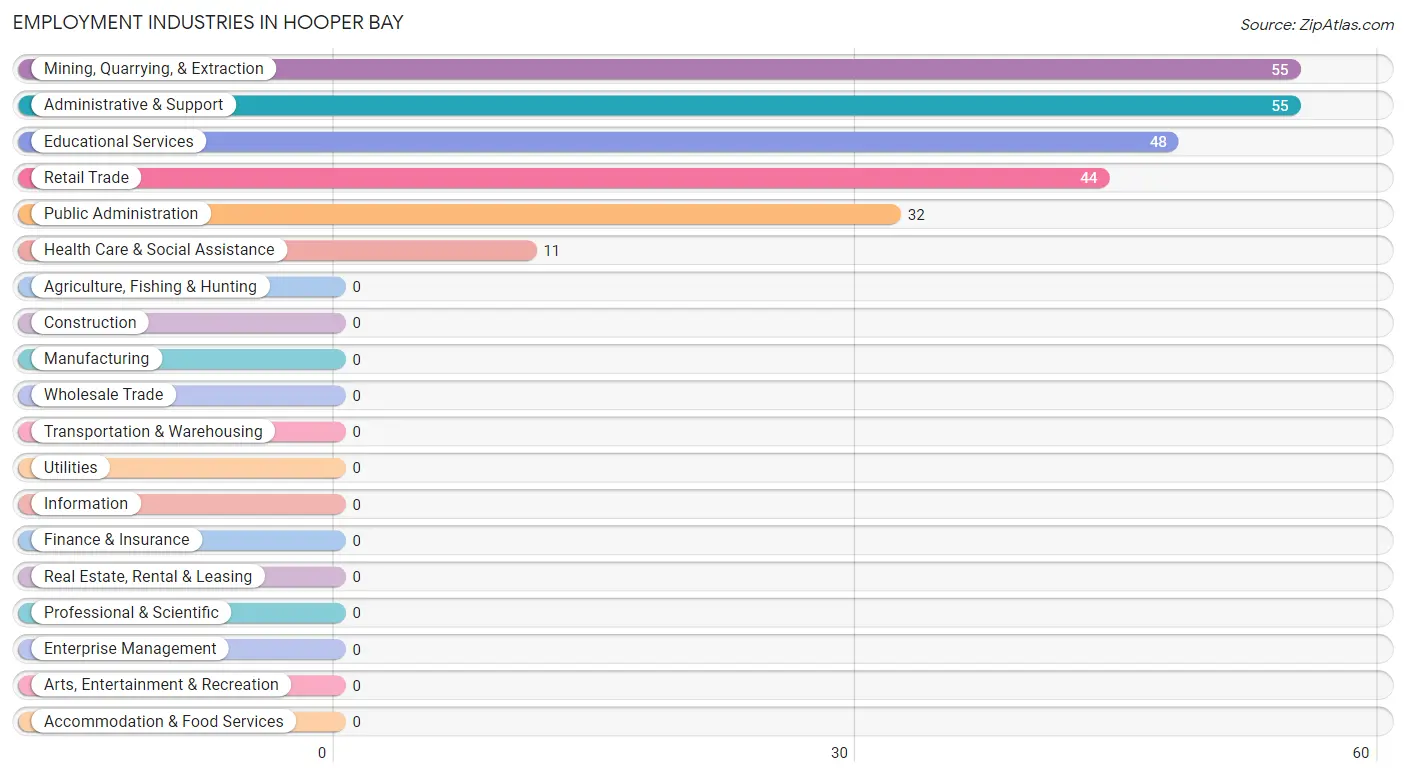
Employment Industries in Hooper Bay
The major employment industries in Hooper Bay include Mining, Quarrying, & Extraction (55 | 22.0%), Administrative & Support (55 | 22.0%), Educational Services (48 | 19.2%), Retail Trade (44 | 17.6%), and Public Administration (32 | 12.8%).
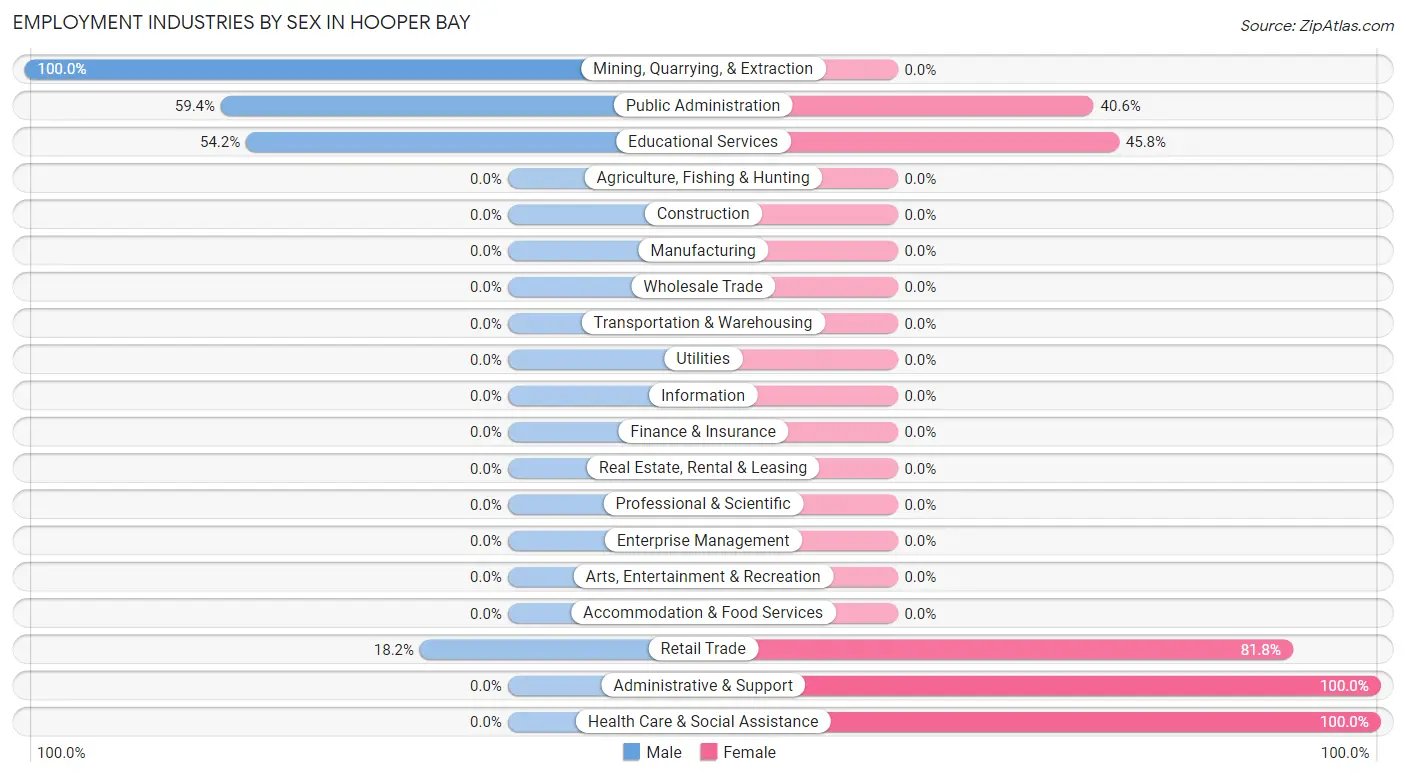
Employment Industries by Sex in Hooper Bay
The Hooper Bay industries that see more men than women are Mining, Quarrying, & Extraction (100.0%), Public Administration (59.4%), and Educational Services (54.2%), whereas the industries that tend to have a higher number of women are Administrative & Support (100.0%), Health Care & Social Assistance (100.0%), and Retail Trade (81.8%).
| Industry | Male | Female |
| Agriculture, Fishing & Hunting | 0 (0.0%) | 0 (0.0%) |
| Mining, Quarrying, & Extraction | 55 (100.0%) | 0 (0.0%) |
| Construction | 0 (0.0%) | 0 (0.0%) |
| Manufacturing | 0 (0.0%) | 0 (0.0%) |
| Wholesale Trade | 0 (0.0%) | 0 (0.0%) |
| Retail Trade | 8 (18.2%) | 36 (81.8%) |
| Transportation & Warehousing | 0 (0.0%) | 0 (0.0%) |
| Utilities | 0 (0.0%) | 0 (0.0%) |
| Information | 0 (0.0%) | 0 (0.0%) |
| Finance & Insurance | 0 (0.0%) | 0 (0.0%) |
| Real Estate, Rental & Leasing | 0 (0.0%) | 0 (0.0%) |
| Professional & Scientific | 0 (0.0%) | 0 (0.0%) |
| Enterprise Management | 0 (0.0%) | 0 (0.0%) |
| Administrative & Support | 0 (0.0%) | 55 (100.0%) |
| Educational Services | 26 (54.2%) | 22 (45.8%) |
| Health Care & Social Assistance | 0 (0.0%) | 11 (100.0%) |
| Arts, Entertainment & Recreation | 0 (0.0%) | 0 (0.0%) |
| Accommodation & Food Services | 0 (0.0%) | 0 (0.0%) |
| Public Administration | 19 (59.4%) | 13 (40.6%) |
| Total | 108 (43.2%) | 142 (56.8%) |
Education in Hooper Bay
School Enrollment in Hooper Bay
The most common levels of schooling among the 234 students in Hooper Bay are elementary school (85 | 36.3%), middle school (49 | 20.9%), and high school (45 | 19.2%).
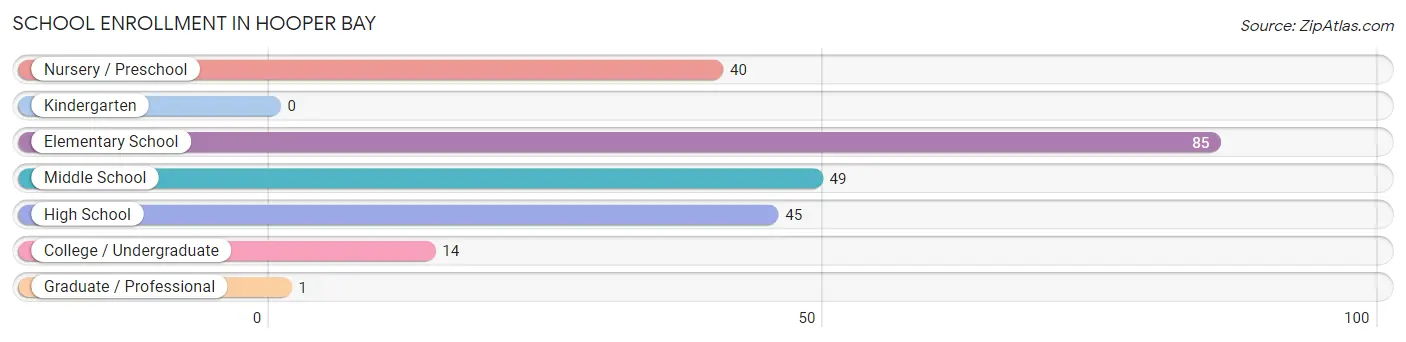
| School Level | # Students | % Students |
| Nursery / Preschool | 40 | 17.1% |
| Kindergarten | 0 | 0.0% |
| Elementary School | 85 | 36.3% |
| Middle School | 49 | 20.9% |
| High School | 45 | 19.2% |
| College / Undergraduate | 14 | 6.0% |
| Graduate / Professional | 1 | 0.4% |
| Total | 234 | 100.0% |
School Enrollment by Age by Funding Source in Hooper Bay
Out of a total of 234 students who are enrolled in schools in Hooper Bay, 6 (2.6%) attend a private institution, while the remaining 228 (97.4%) are enrolled in public schools. The age group of 10 to 14 year olds has the highest likelihood of being enrolled in private schools, with 6 (7.6% in the age bracket) enrolled. Conversely, the age group of 3 to 4 year olds has the lowest likelihood of being enrolled in a private school, with 30 (100.0% in the age bracket) attending a public institution.
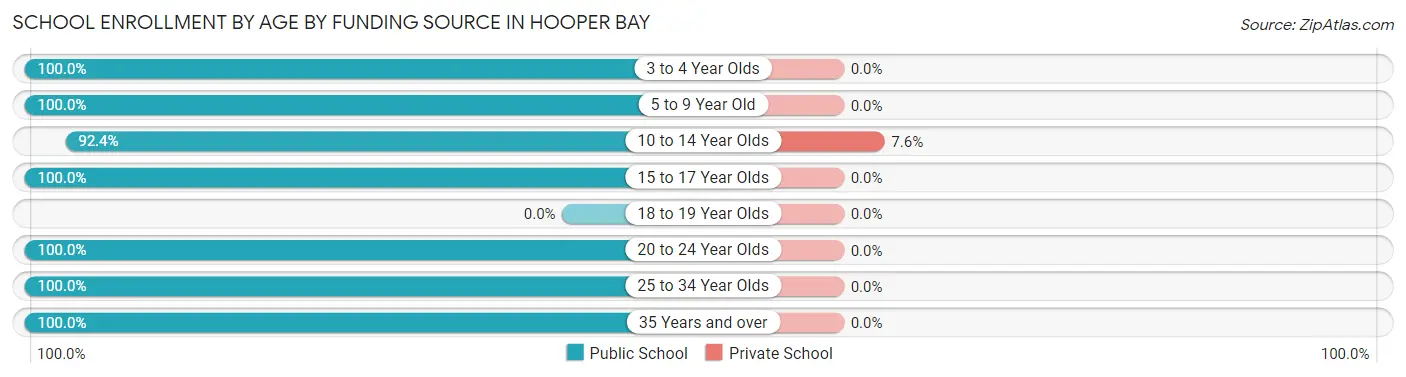
| Age Bracket | Public School | Private School |
| 3 to 4 Year Olds | 30 (100.0%) | 0 (0.0%) |
| 5 to 9 Year Old | 81 (100.0%) | 0 (0.0%) |
| 10 to 14 Year Olds | 73 (92.4%) | 6 (7.6%) |
| 15 to 17 Year Olds | 20 (100.0%) | 0 (0.0%) |
| 18 to 19 Year Olds | 0 (0.0%) | 0 (0.0%) |
| 20 to 24 Year Olds | 9 (100.0%) | 0 (0.0%) |
| 25 to 34 Year Olds | 14 (100.0%) | 0 (0.0%) |
| 35 Years and over | 1 (100.0%) | 0 (0.0%) |
| Total | 228 (97.4%) | 6 (2.6%) |
Educational Attainment by Field of Study in Hooper Bay
Engineering (6 | 85.7%), and education (1 | 14.3%) are the most common fields of study among 7 individuals in Hooper Bay who have obtained a bachelor's degree or higher.
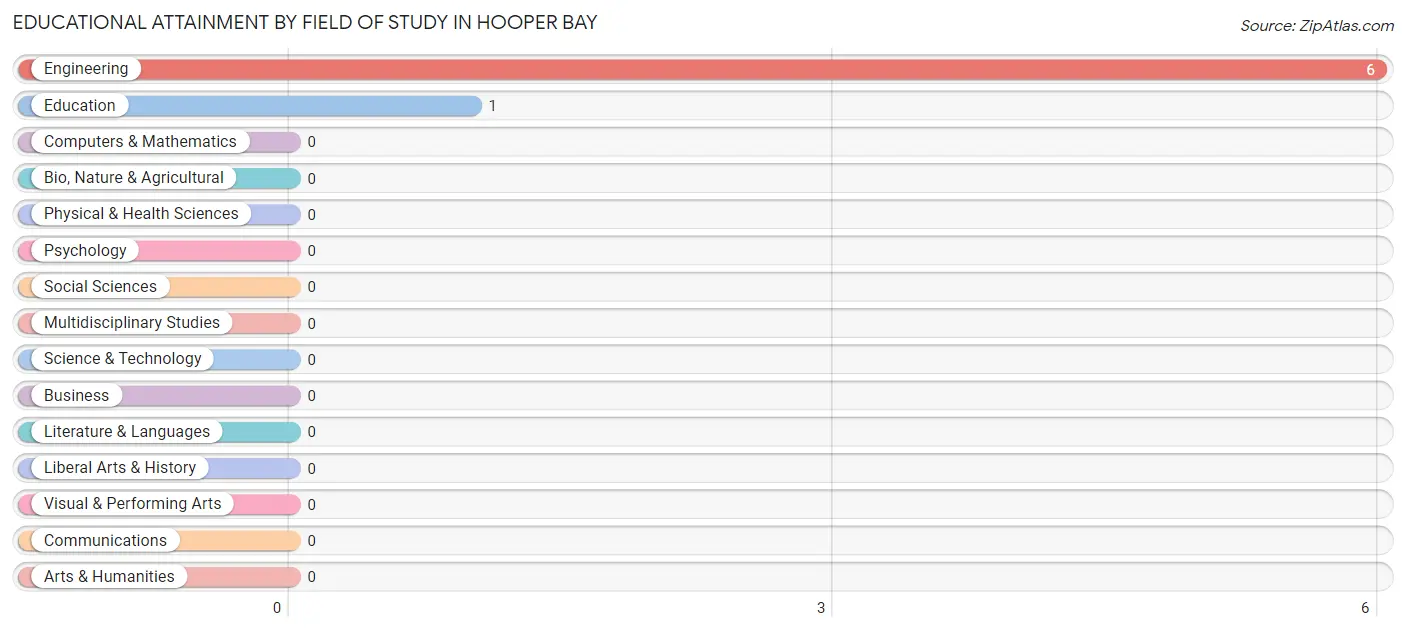
| Field of Study | # Graduates | % Graduates |
| Computers & Mathematics | 0 | 0.0% |
| Bio, Nature & Agricultural | 0 | 0.0% |
| Physical & Health Sciences | 0 | 0.0% |
| Psychology | 0 | 0.0% |
| Social Sciences | 0 | 0.0% |
| Engineering | 6 | 85.7% |
| Multidisciplinary Studies | 0 | 0.0% |
| Science & Technology | 0 | 0.0% |
| Business | 0 | 0.0% |
| Education | 1 | 14.3% |
| Literature & Languages | 0 | 0.0% |
| Liberal Arts & History | 0 | 0.0% |
| Visual & Performing Arts | 0 | 0.0% |
| Communications | 0 | 0.0% |
| Arts & Humanities | 0 | 0.0% |
| Total | 7 | 100.0% |
Transportation & Commute in Hooper Bay
Vehicle Availability by Sex in Hooper Bay
The most prevalent vehicle ownership categories in Hooper Bay are males with no vehicle (38, accounting for 71.7%) and females with no vehicle (80, making up 43.7%).
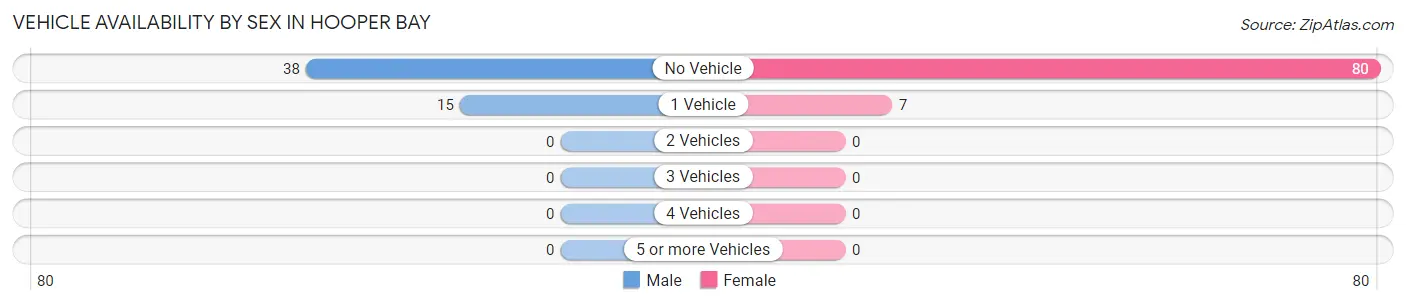
| Vehicles Available | Male | Female |
| No Vehicle | 38 (71.7%) | 80 (91.9%) |
| 1 Vehicle | 15 (28.3%) | 7 (8.1%) |
| 2 Vehicles | 0 (0.0%) | 0 (0.0%) |
| 3 Vehicles | 0 (0.0%) | 0 (0.0%) |
| 4 Vehicles | 0 (0.0%) | 0 (0.0%) |
| 5 or more Vehicles | 0 (0.0%) | 0 (0.0%) |
| Total | 53 (100.0%) | 87 (100.0%) |
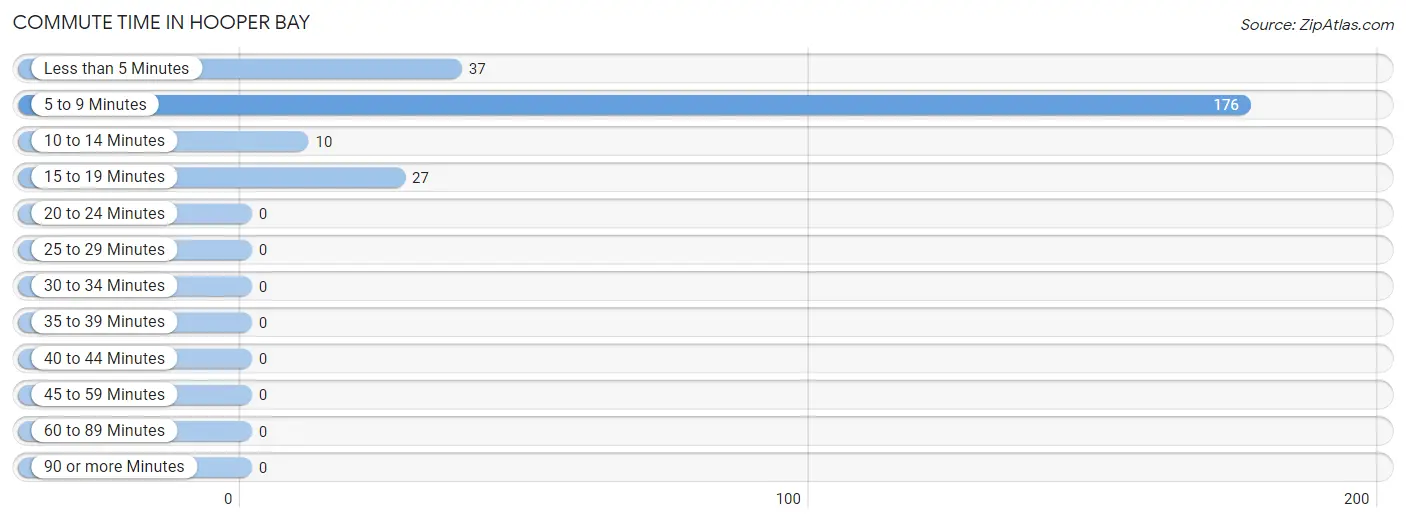
Commute Time in Hooper Bay
The most frequently occuring commute durations in Hooper Bay are 5 to 9 minutes (176 commuters, 70.4%), less than 5 minutes (37 commuters, 14.8%), and 15 to 19 minutes (27 commuters, 10.8%).
| Commute Time | # Commuters | % Commuters |
| Less than 5 Minutes | 37 | 14.8% |
| 5 to 9 Minutes | 176 | 70.4% |
| 10 to 14 Minutes | 10 | 4.0% |
| 15 to 19 Minutes | 27 | 10.8% |
| 20 to 24 Minutes | 0 | 0.0% |
| 25 to 29 Minutes | 0 | 0.0% |
| 30 to 34 Minutes | 0 | 0.0% |
| 35 to 39 Minutes | 0 | 0.0% |
| 40 to 44 Minutes | 0 | 0.0% |
| 45 to 59 Minutes | 0 | 0.0% |
| 60 to 89 Minutes | 0 | 0.0% |
| 90 or more Minutes | 0 | 0.0% |
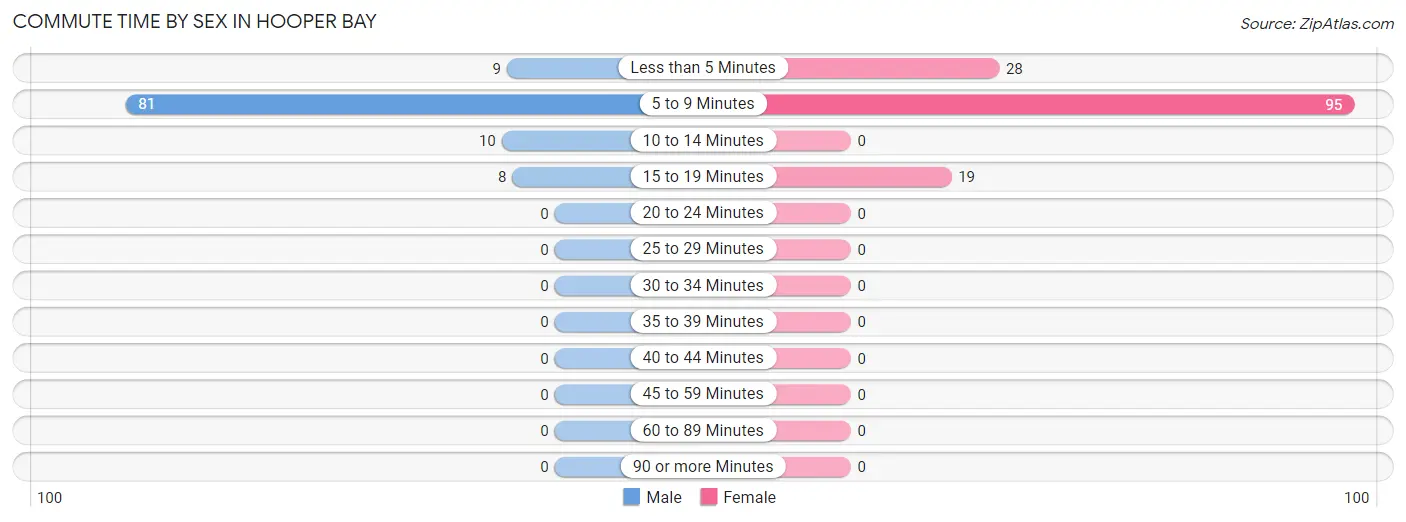
Commute Time by Sex in Hooper Bay
The most common commute times in Hooper Bay are 5 to 9 minutes (81 commuters, 75.0%) for males and 5 to 9 minutes (95 commuters, 66.9%) for females.
| Commute Time | Male | Female |
| Less than 5 Minutes | 9 (8.3%) | 28 (19.7%) |
| 5 to 9 Minutes | 81 (75.0%) | 95 (66.9%) |
| 10 to 14 Minutes | 10 (9.3%) | 0 (0.0%) |
| 15 to 19 Minutes | 8 (7.4%) | 19 (13.4%) |
| 20 to 24 Minutes | 0 (0.0%) | 0 (0.0%) |
| 25 to 29 Minutes | 0 (0.0%) | 0 (0.0%) |
| 30 to 34 Minutes | 0 (0.0%) | 0 (0.0%) |
| 35 to 39 Minutes | 0 (0.0%) | 0 (0.0%) |
| 40 to 44 Minutes | 0 (0.0%) | 0 (0.0%) |
| 45 to 59 Minutes | 0 (0.0%) | 0 (0.0%) |
| 60 to 89 Minutes | 0 (0.0%) | 0 (0.0%) |
| 90 or more Minutes | 0 (0.0%) | 0 (0.0%) |
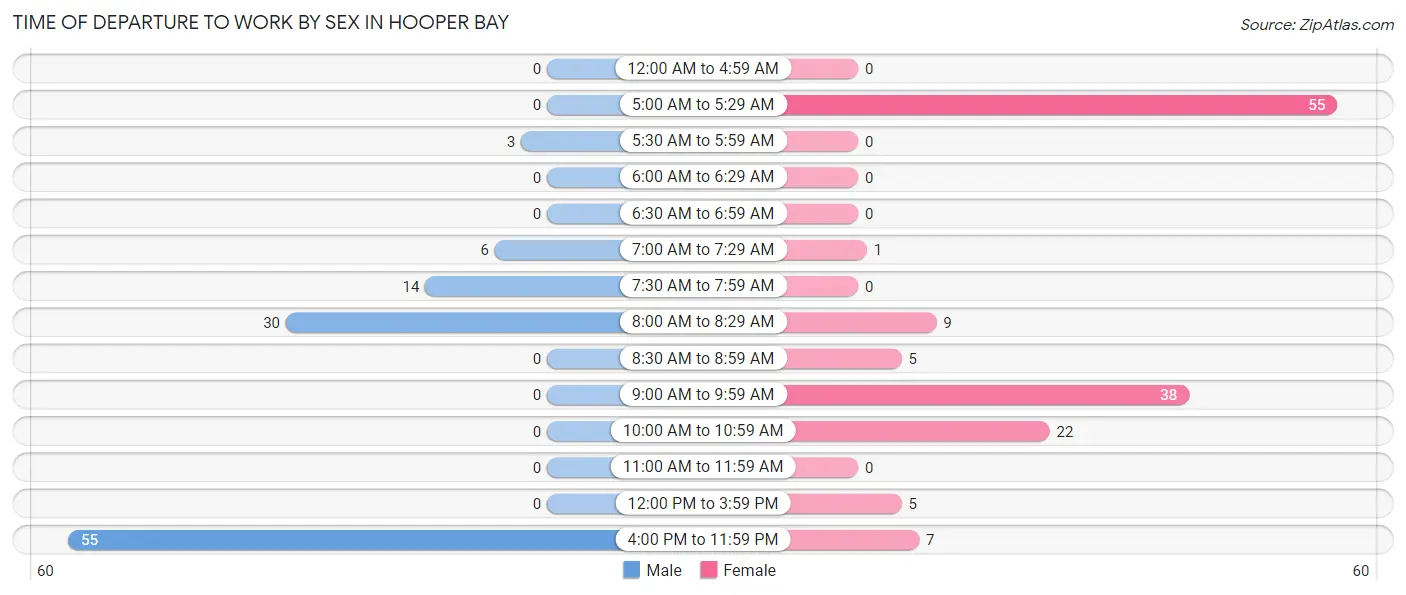
Time of Departure to Work by Sex in Hooper Bay
The most frequent times of departure to work in Hooper Bay are 4:00 PM to 11:59 PM (55, 50.9%) for males and 5:00 AM to 5:29 AM (55, 38.7%) for females.
| Time of Departure | Male | Female |
| 12:00 AM to 4:59 AM | 0 (0.0%) | 0 (0.0%) |
| 5:00 AM to 5:29 AM | 0 (0.0%) | 55 (38.7%) |
| 5:30 AM to 5:59 AM | 3 (2.8%) | 0 (0.0%) |
| 6:00 AM to 6:29 AM | 0 (0.0%) | 0 (0.0%) |
| 6:30 AM to 6:59 AM | 0 (0.0%) | 0 (0.0%) |
| 7:00 AM to 7:29 AM | 6 (5.6%) | 1 (0.7%) |
| 7:30 AM to 7:59 AM | 14 (13.0%) | 0 (0.0%) |
| 8:00 AM to 8:29 AM | 30 (27.8%) | 9 (6.3%) |
| 8:30 AM to 8:59 AM | 0 (0.0%) | 5 (3.5%) |
| 9:00 AM to 9:59 AM | 0 (0.0%) | 38 (26.8%) |
| 10:00 AM to 10:59 AM | 0 (0.0%) | 22 (15.5%) |
| 11:00 AM to 11:59 AM | 0 (0.0%) | 0 (0.0%) |
| 12:00 PM to 3:59 PM | 0 (0.0%) | 5 (3.5%) |
| 4:00 PM to 11:59 PM | 55 (50.9%) | 7 (4.9%) |
| Total | 108 (100.0%) | 142 (100.0%) |
Housing Occupancy in Hooper Bay
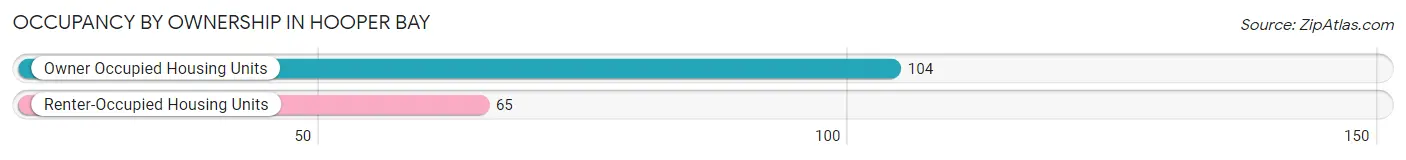
Occupancy by Ownership in Hooper Bay
Of the total 169 dwellings in Hooper Bay, owner-occupied units account for 104 (61.5%), while renter-occupied units make up 65 (38.5%).
| Occupancy | # Housing Units | % Housing Units |
| Owner Occupied Housing Units | 104 | 61.5% |
| Renter-Occupied Housing Units | 65 | 38.5% |
| Total Occupied Housing Units | 169 | 100.0% |
Occupancy by Household Size in Hooper Bay
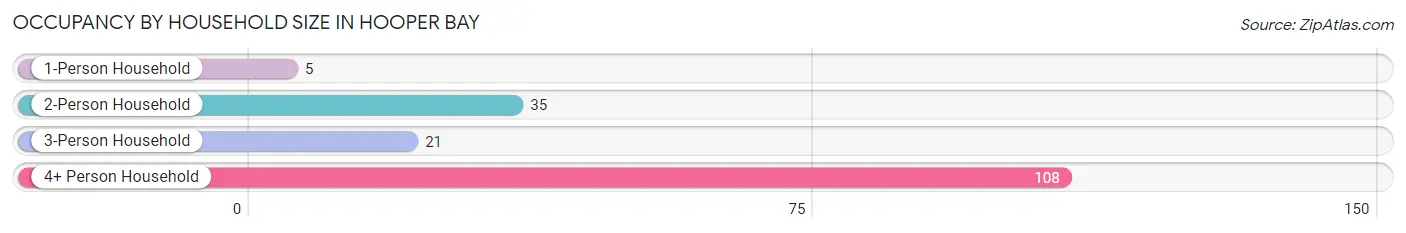
| Household Size | # Housing Units | % Housing Units |
| 1-Person Household | 5 | 3.0% |
| 2-Person Household | 35 | 20.7% |
| 3-Person Household | 21 | 12.4% |
| 4+ Person Household | 108 | 63.9% |
| Total Housing Units | 169 | 100.0% |
Occupancy by Ownership by Household Size in Hooper Bay
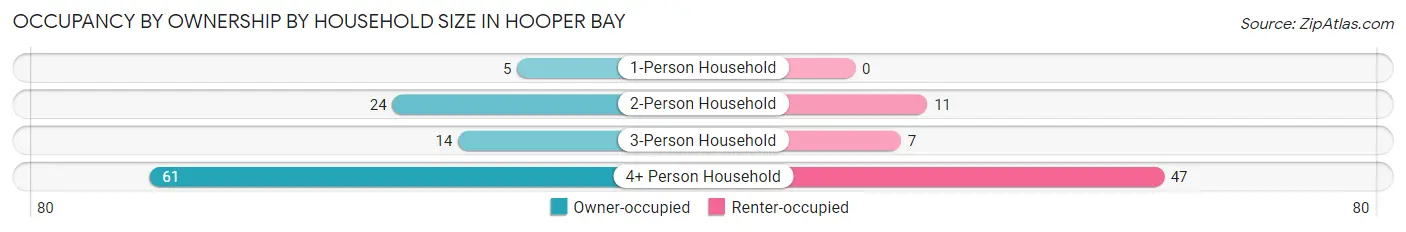
| Household Size | Owner-occupied | Renter-occupied |
| 1-Person Household | 5 (100.0%) | 0 (0.0%) |
| 2-Person Household | 24 (68.6%) | 11 (31.4%) |
| 3-Person Household | 14 (66.7%) | 7 (33.3%) |
| 4+ Person Household | 61 (56.5%) | 47 (43.5%) |
| Total Housing Units | 104 (61.5%) | 65 (38.5%) |
Occupancy by Educational Attainment in Hooper Bay
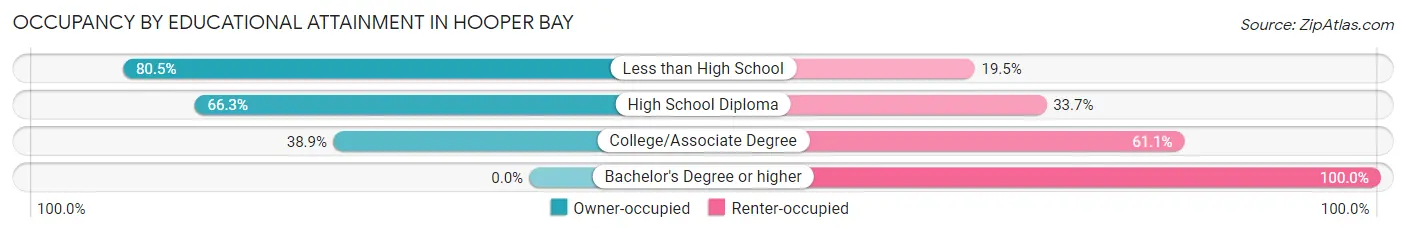
| Household Size | Owner-occupied | Renter-occupied |
| Less than High School | 33 (80.5%) | 8 (19.5%) |
| High School Diploma | 57 (66.3%) | 29 (33.7%) |
| College/Associate Degree | 14 (38.9%) | 22 (61.1%) |
| Bachelor's Degree or higher | 0 (0.0%) | 6 (100.0%) |
Occupancy by Age of Householder in Hooper Bay
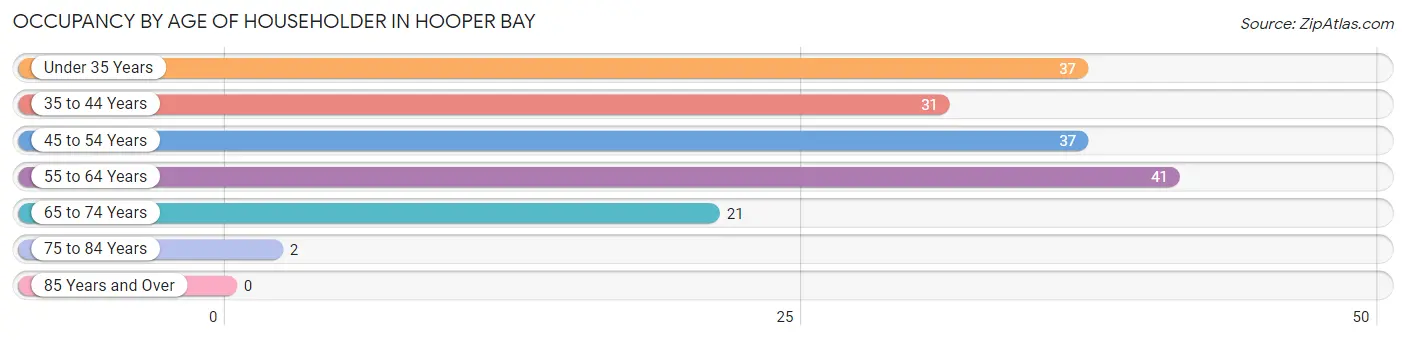
| Age Bracket | # Households | % Households |
| Under 35 Years | 37 | 21.9% |
| 35 to 44 Years | 31 | 18.3% |
| 45 to 54 Years | 37 | 21.9% |
| 55 to 64 Years | 41 | 24.3% |
| 65 to 74 Years | 21 | 12.4% |
| 75 to 84 Years | 2 | 1.2% |
| 85 Years and Over | 0 | 0.0% |
| Total | 169 | 100.0% |
Housing Finances in Hooper Bay
Median Income by Occupancy in Hooper Bay
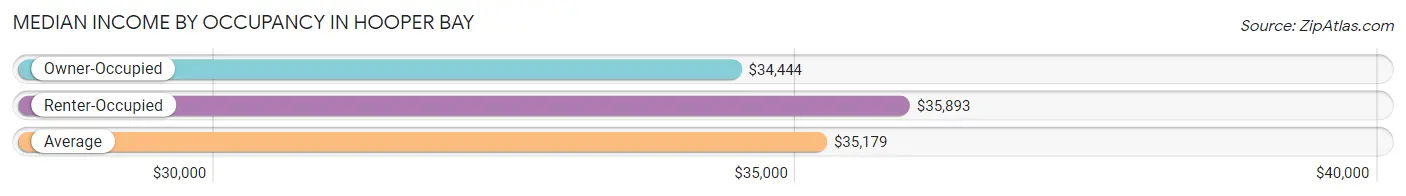
| Occupancy Type | # Households | Median Income |
| Owner-Occupied | 104 (61.5%) | $34,444 |
| Renter-Occupied | 65 (38.5%) | $35,893 |
| Average | 169 (100.0%) | $35,179 |
Occupancy by Householder Income Bracket in Hooper Bay
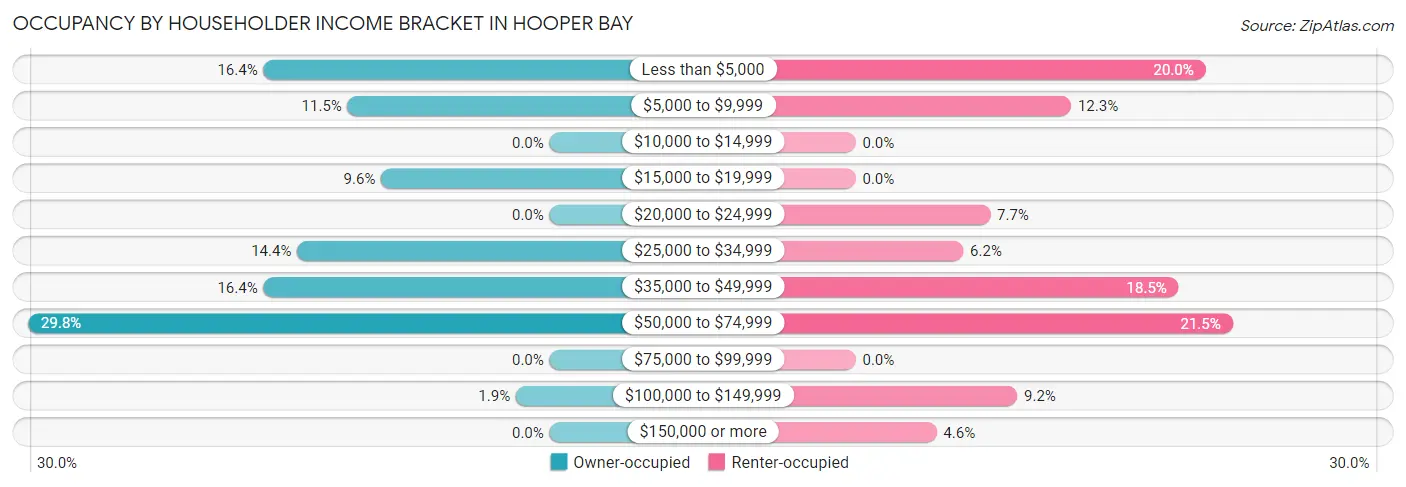
| Income Bracket | Owner-occupied | Renter-occupied |
| Less than $5,000 | 17 (16.4%) | 13 (20.0%) |
| $5,000 to $9,999 | 12 (11.5%) | 8 (12.3%) |
| $10,000 to $14,999 | 0 (0.0%) | 0 (0.0%) |
| $15,000 to $19,999 | 10 (9.6%) | 0 (0.0%) |
| $20,000 to $24,999 | 0 (0.0%) | 5 (7.7%) |
| $25,000 to $34,999 | 15 (14.4%) | 4 (6.1%) |
| $35,000 to $49,999 | 17 (16.4%) | 12 (18.5%) |
| $50,000 to $74,999 | 31 (29.8%) | 14 (21.5%) |
| $75,000 to $99,999 | 0 (0.0%) | 0 (0.0%) |
| $100,000 to $149,999 | 2 (1.9%) | 6 (9.2%) |
| $150,000 or more | 0 (0.0%) | 3 (4.6%) |
| Total | 104 (100.0%) | 65 (100.0%) |
Monthly Housing Cost Tiers in Hooper Bay
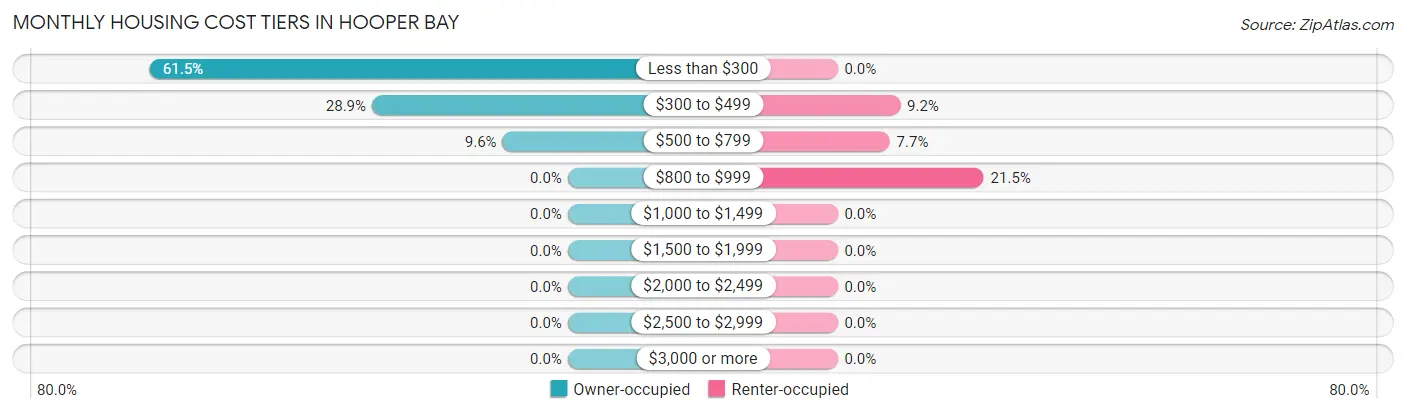
| Monthly Cost | Owner-occupied | Renter-occupied |
| Less than $300 | 64 (61.5%) | 0 (0.0%) |
| $300 to $499 | 30 (28.8%) | 6 (9.2%) |
| $500 to $799 | 10 (9.6%) | 5 (7.7%) |
| $800 to $999 | 0 (0.0%) | 14 (21.5%) |
| $1,000 to $1,499 | 0 (0.0%) | 0 (0.0%) |
| $1,500 to $1,999 | 0 (0.0%) | 0 (0.0%) |
| $2,000 to $2,499 | 0 (0.0%) | 0 (0.0%) |
| $2,500 to $2,999 | 0 (0.0%) | 0 (0.0%) |
| $3,000 or more | 0 (0.0%) | 0 (0.0%) |
| Total | 104 (100.0%) | 65 (100.0%) |
Physical Housing Characteristics in Hooper Bay
Housing Structures in Hooper Bay
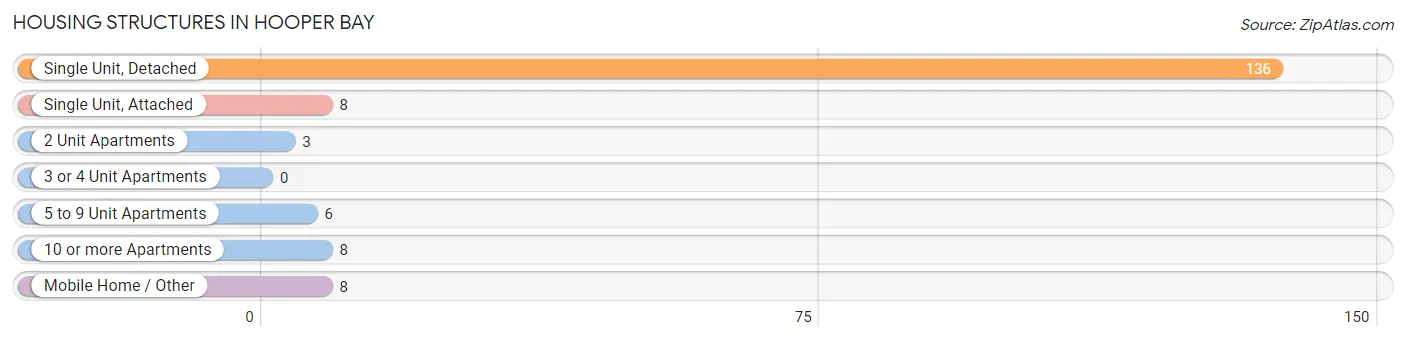
| Structure Type | # Housing Units | % Housing Units |
| Single Unit, Detached | 136 | 80.5% |
| Single Unit, Attached | 8 | 4.7% |
| 2 Unit Apartments | 3 | 1.8% |
| 3 or 4 Unit Apartments | 0 | 0.0% |
| 5 to 9 Unit Apartments | 6 | 3.5% |
| 10 or more Apartments | 8 | 4.7% |
| Mobile Home / Other | 8 | 4.7% |
| Total | 169 | 100.0% |
Housing Structures by Occupancy in Hooper Bay
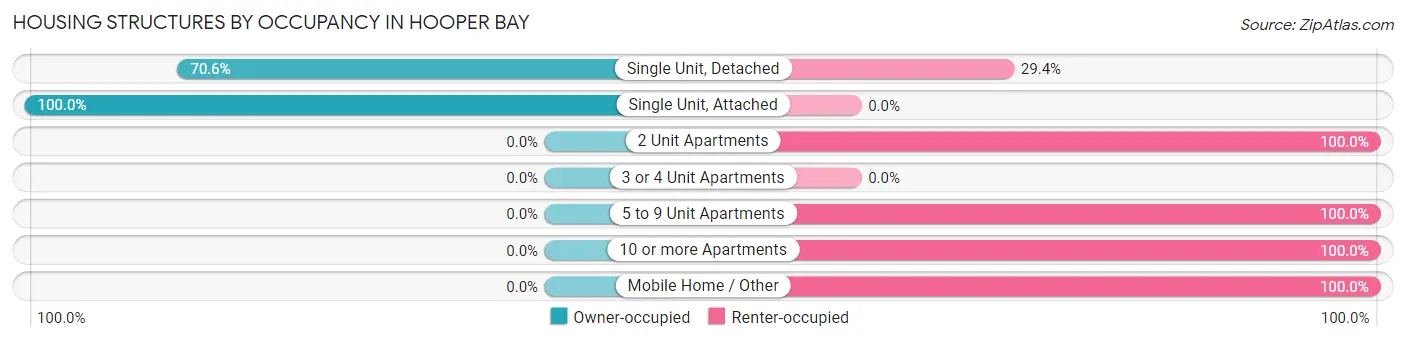
| Structure Type | Owner-occupied | Renter-occupied |
| Single Unit, Detached | 96 (70.6%) | 40 (29.4%) |
| Single Unit, Attached | 8 (100.0%) | 0 (0.0%) |
| 2 Unit Apartments | 0 (0.0%) | 3 (100.0%) |
| 3 or 4 Unit Apartments | 0 (0.0%) | 0 (0.0%) |
| 5 to 9 Unit Apartments | 0 (0.0%) | 6 (100.0%) |
| 10 or more Apartments | 0 (0.0%) | 8 (100.0%) |
| Mobile Home / Other | 0 (0.0%) | 8 (100.0%) |
| Total | 104 (61.5%) | 65 (38.5%) |
Housing Structures by Number of Rooms in Hooper Bay
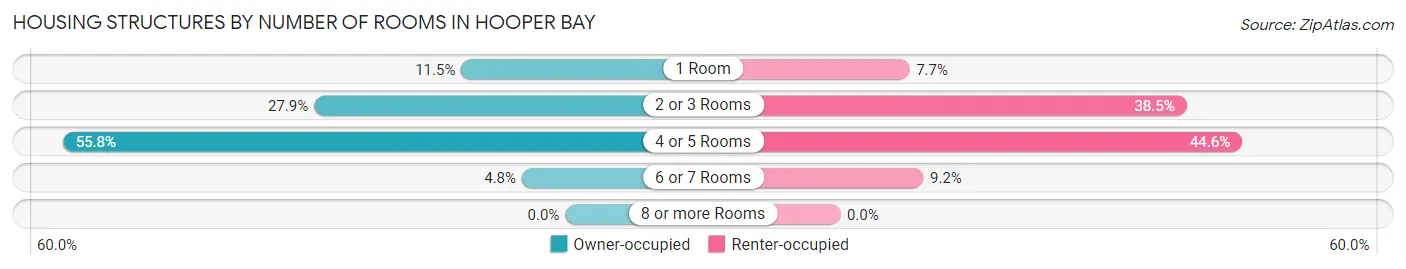
| Number of Rooms | Owner-occupied | Renter-occupied |
| 1 Room | 12 (11.5%) | 5 (7.7%) |
| 2 or 3 Rooms | 29 (27.9%) | 25 (38.5%) |
| 4 or 5 Rooms | 58 (55.8%) | 29 (44.6%) |
| 6 or 7 Rooms | 5 (4.8%) | 6 (9.2%) |
| 8 or more Rooms | 0 (0.0%) | 0 (0.0%) |
| Total | 104 (100.0%) | 65 (100.0%) |
Housing Structure by Heating Type in Hooper Bay
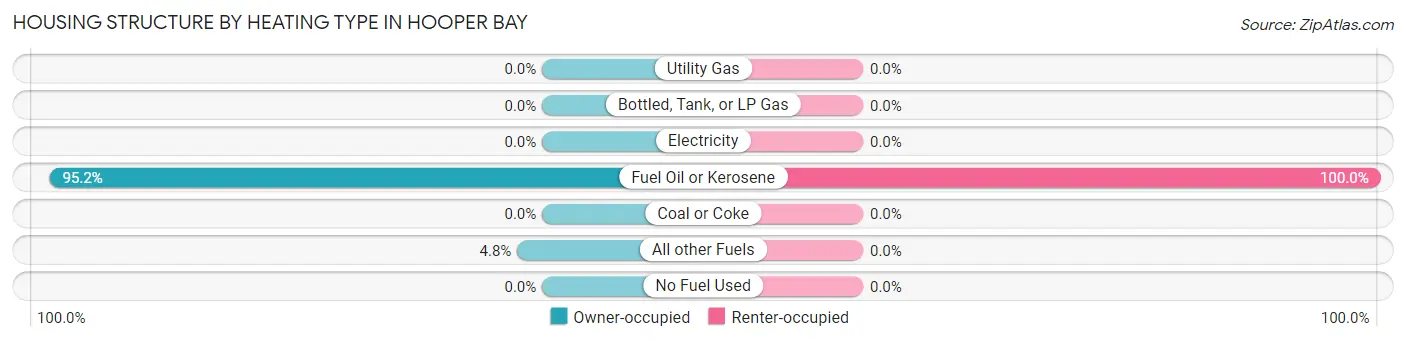
| Heating Type | Owner-occupied | Renter-occupied |
| Utility Gas | 0 (0.0%) | 0 (0.0%) |
| Bottled, Tank, or LP Gas | 0 (0.0%) | 0 (0.0%) |
| Electricity | 0 (0.0%) | 0 (0.0%) |
| Fuel Oil or Kerosene | 99 (95.2%) | 65 (100.0%) |
| Coal or Coke | 0 (0.0%) | 0 (0.0%) |
| All other Fuels | 5 (4.8%) | 0 (0.0%) |
| No Fuel Used | 0 (0.0%) | 0 (0.0%) |
| Total | 104 (100.0%) | 65 (100.0%) |
Household Vehicle Usage in Hooper Bay
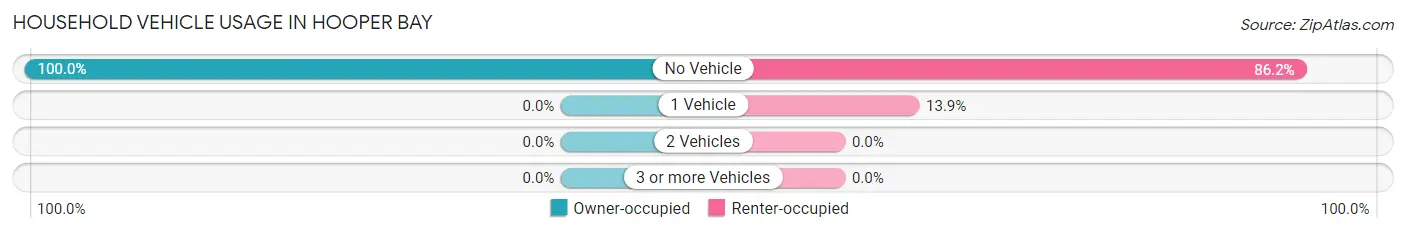
| Vehicles per Household | Owner-occupied | Renter-occupied |
| No Vehicle | 104 (100.0%) | 56 (86.2%) |
| 1 Vehicle | 0 (0.0%) | 9 (13.9%) |
| 2 Vehicles | 0 (0.0%) | 0 (0.0%) |
| 3 or more Vehicles | 0 (0.0%) | 0 (0.0%) |
| Total | 104 (100.0%) | 65 (100.0%) |
Real Estate & Mortgages in Hooper Bay
Real Estate and Mortgage Overview in Hooper Bay
| Characteristic | Without Mortgage | With Mortgage |
| Housing Units | 76 | 28 |
| Median Property Value | $80,000 | $116,700 |
| Median Household Income | $40,714 | $0 |
| Monthly Housing Costs | $179 | $0 |
| Real Estate Taxes | - | - |
Property Value by Mortgage Status in Hooper Bay
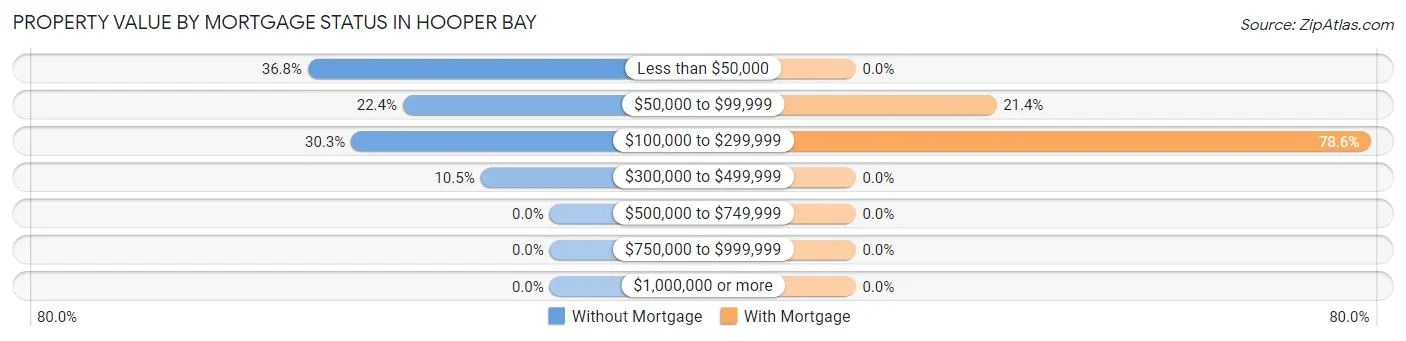
| Property Value | Without Mortgage | With Mortgage |
| Less than $50,000 | 28 (36.8%) | 0 (0.0%) |
| $50,000 to $99,999 | 17 (22.4%) | 6 (21.4%) |
| $100,000 to $299,999 | 23 (30.3%) | 22 (78.6%) |
| $300,000 to $499,999 | 8 (10.5%) | 0 (0.0%) |
| $500,000 to $749,999 | 0 (0.0%) | 0 (0.0%) |
| $750,000 to $999,999 | 0 (0.0%) | 0 (0.0%) |
| $1,000,000 or more | 0 (0.0%) | 0 (0.0%) |
| Total | 76 (100.0%) | 28 (100.0%) |
Household Income by Mortgage Status in Hooper Bay
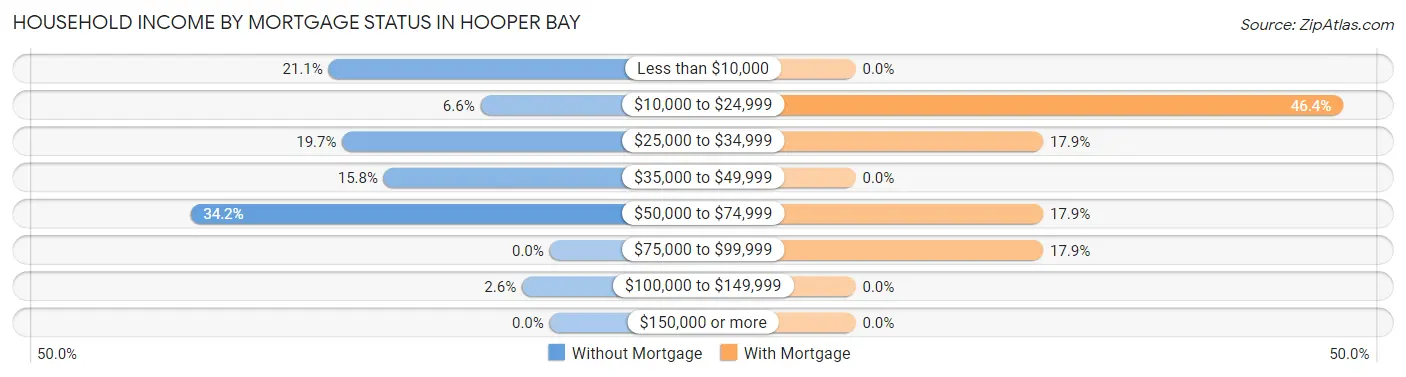
| Household Income | Without Mortgage | With Mortgage |
| Less than $10,000 | 16 (21.0%) | 0 (0.0%) |
| $10,000 to $24,999 | 5 (6.6%) | 13 (46.4%) |
| $25,000 to $34,999 | 15 (19.7%) | 5 (17.9%) |
| $35,000 to $49,999 | 12 (15.8%) | 0 (0.0%) |
| $50,000 to $74,999 | 26 (34.2%) | 5 (17.9%) |
| $75,000 to $99,999 | 0 (0.0%) | 5 (17.9%) |
| $100,000 to $149,999 | 2 (2.6%) | 0 (0.0%) |
| $150,000 or more | 0 (0.0%) | 0 (0.0%) |
| Total | 76 (100.0%) | 28 (100.0%) |
Property Value to Household Income Ratio in Hooper Bay
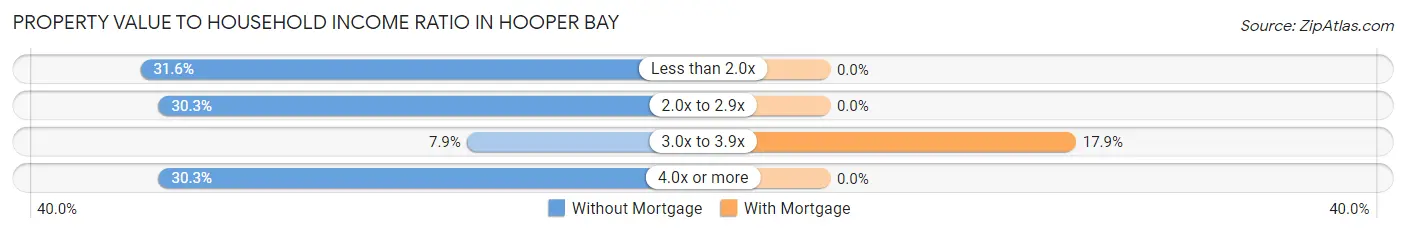
| Value-to-Income Ratio | Without Mortgage | With Mortgage |
| Less than 2.0x | 24 (31.6%) | 0 (0.0%) |
| 2.0x to 2.9x | 23 (30.3%) | 0 (0.0%) |
| 3.0x to 3.9x | 6 (7.9%) | 5 (17.9%) |
| 4.0x or more | 23 (30.3%) | 0 (0.0%) |
| Total | 76 (100.0%) | 28 (100.0%) |
Real Estate Taxes by Mortgage Status in Hooper Bay
| Property Taxes | Without Mortgage | With Mortgage |
| Less than $800 | 0 (0.0%) | 0 (0.0%) |
| $800 to $1,499 | 0 (0.0%) | 0 (0.0%) |
| $800 to $1,499 | 0 (0.0%) | 0 (0.0%) |
| Total | 76 (100.0%) | 28 (100.0%) |
Health & Disability in Hooper Bay
Health Insurance Coverage by Age in Hooper Bay
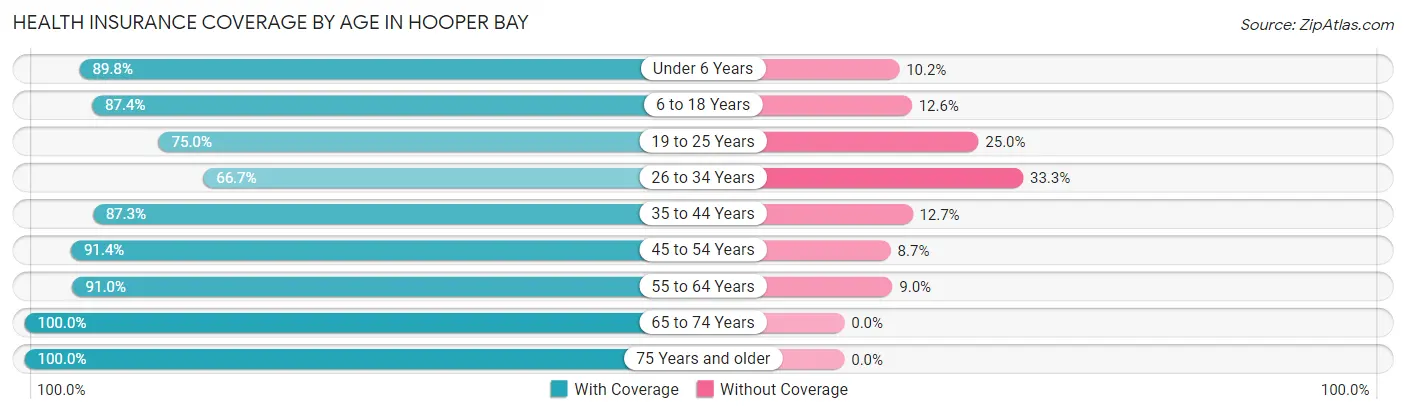
| Age Bracket | With Coverage | Without Coverage |
| Under 6 Years | 114 (89.8%) | 13 (10.2%) |
| 6 to 18 Years | 160 (87.4%) | 23 (12.6%) |
| 19 to 25 Years | 27 (75.0%) | 9 (25.0%) |
| 26 to 34 Years | 86 (66.7%) | 43 (33.3%) |
| 35 to 44 Years | 103 (87.3%) | 15 (12.7%) |
| 45 to 54 Years | 95 (91.3%) | 9 (8.6%) |
| 55 to 64 Years | 61 (91.0%) | 6 (9.0%) |
| 65 to 74 Years | 35 (100.0%) | 0 (0.0%) |
| 75 Years and older | 2 (100.0%) | 0 (0.0%) |
| Total | 683 (85.3%) | 118 (14.7%) |
Health Insurance Coverage by Citizenship Status in Hooper Bay
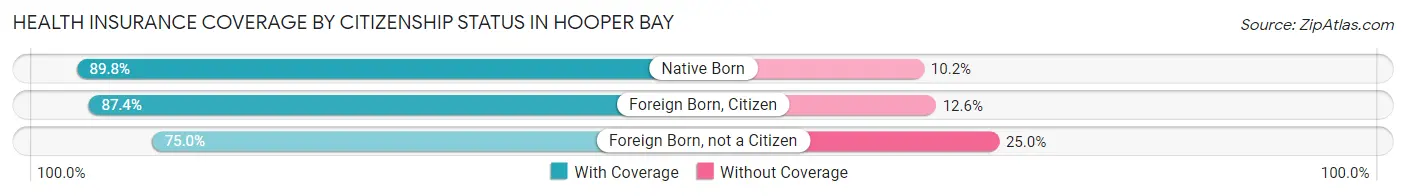
| Citizenship Status | With Coverage | Without Coverage |
| Native Born | 114 (89.8%) | 13 (10.2%) |
| Foreign Born, Citizen | 160 (87.4%) | 23 (12.6%) |
| Foreign Born, not a Citizen | 27 (75.0%) | 9 (25.0%) |
Health Insurance Coverage by Household Income in Hooper Bay
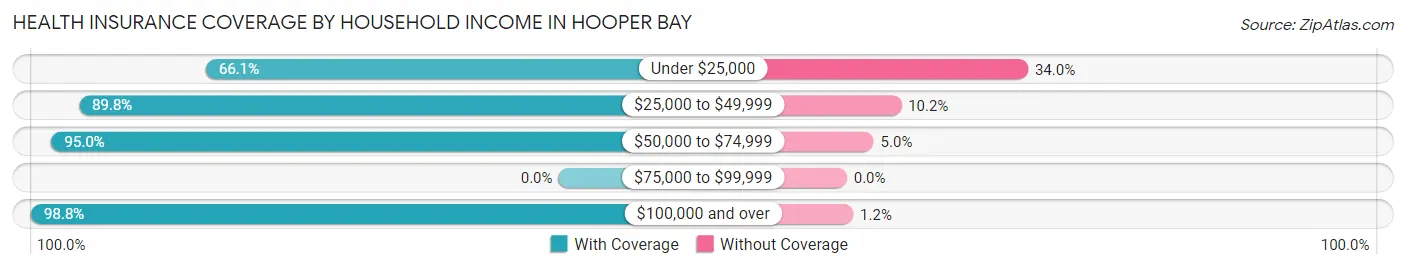
| Household Income | With Coverage | Without Coverage |
| Under $25,000 | 179 (66.0%) | 92 (34.0%) |
| $25,000 to $49,999 | 141 (89.8%) | 16 (10.2%) |
| $50,000 to $74,999 | 170 (95.0%) | 9 (5.0%) |
| $75,000 to $99,999 | 0 (0.0%) | 0 (0.0%) |
| $100,000 and over | 83 (98.8%) | 1 (1.2%) |
Public vs Private Health Insurance Coverage by Age in Hooper Bay
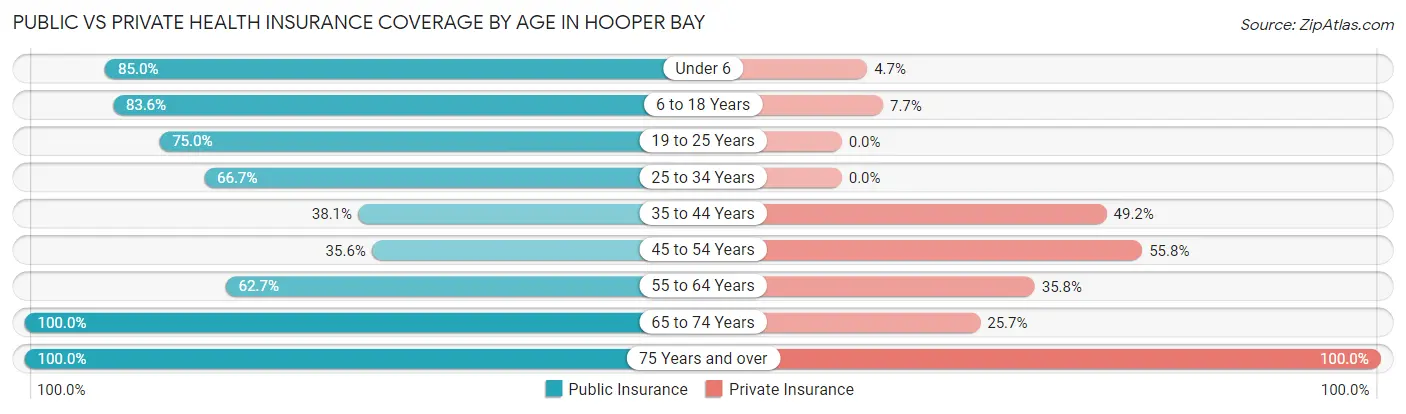
| Age Bracket | Public Insurance | Private Insurance |
| Under 6 | 108 (85.0%) | 6 (4.7%) |
| 6 to 18 Years | 153 (83.6%) | 14 (7.6%) |
| 19 to 25 Years | 27 (75.0%) | 0 (0.0%) |
| 25 to 34 Years | 86 (66.7%) | 0 (0.0%) |
| 35 to 44 Years | 45 (38.1%) | 58 (49.1%) |
| 45 to 54 Years | 37 (35.6%) | 58 (55.8%) |
| 55 to 64 Years | 42 (62.7%) | 24 (35.8%) |
| 65 to 74 Years | 35 (100.0%) | 9 (25.7%) |
| 75 Years and over | 2 (100.0%) | 2 (100.0%) |
| Total | 535 (66.8%) | 171 (21.3%) |
Disability Status by Sex by Age in Hooper Bay
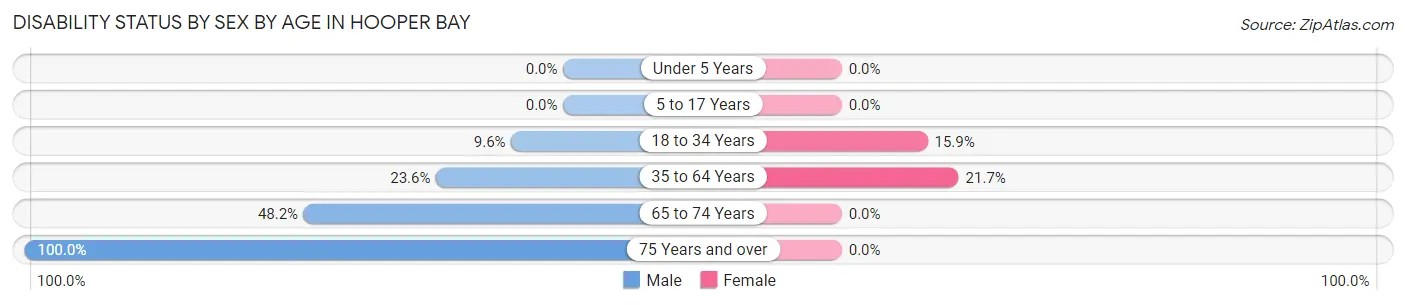
| Age Bracket | Male | Female |
| Under 5 Years | 0 (0.0%) | 0 (0.0%) |
| 5 to 17 Years | 0 (0.0%) | 0 (0.0%) |
| 18 to 34 Years | 8 (9.6%) | 14 (15.9%) |
| 35 to 64 Years | 29 (23.6%) | 36 (21.7%) |
| 65 to 74 Years | 13 (48.1%) | 0 (0.0%) |
| 75 Years and over | 2 (100.0%) | 0 (0.0%) |
Disability Class by Sex by Age in Hooper Bay
Disability Class: Hearing Difficulty
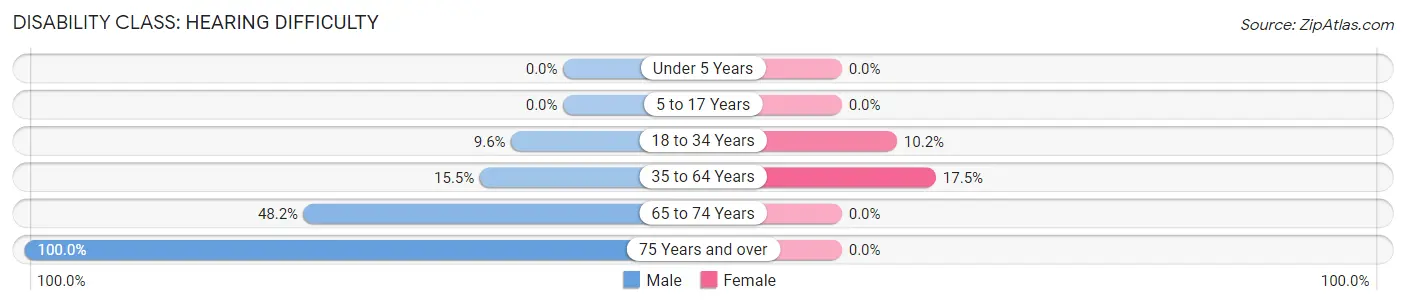
| Age Bracket | Male | Female |
| Under 5 Years | 0 (0.0%) | 0 (0.0%) |
| 5 to 17 Years | 0 (0.0%) | 0 (0.0%) |
| 18 to 34 Years | 8 (9.6%) | 9 (10.2%) |
| 35 to 64 Years | 19 (15.4%) | 29 (17.5%) |
| 65 to 74 Years | 13 (48.1%) | 0 (0.0%) |
| 75 Years and over | 2 (100.0%) | 0 (0.0%) |
Disability Class: Vision Difficulty
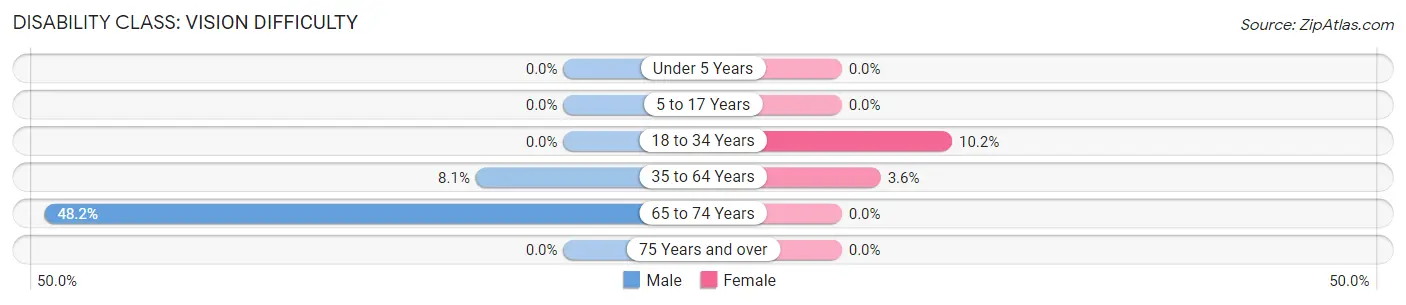
| Age Bracket | Male | Female |
| Under 5 Years | 0 (0.0%) | 0 (0.0%) |
| 5 to 17 Years | 0 (0.0%) | 0 (0.0%) |
| 18 to 34 Years | 0 (0.0%) | 9 (10.2%) |
| 35 to 64 Years | 10 (8.1%) | 6 (3.6%) |
| 65 to 74 Years | 13 (48.1%) | 0 (0.0%) |
| 75 Years and over | 0 (0.0%) | 0 (0.0%) |
Disability Class: Cognitive Difficulty
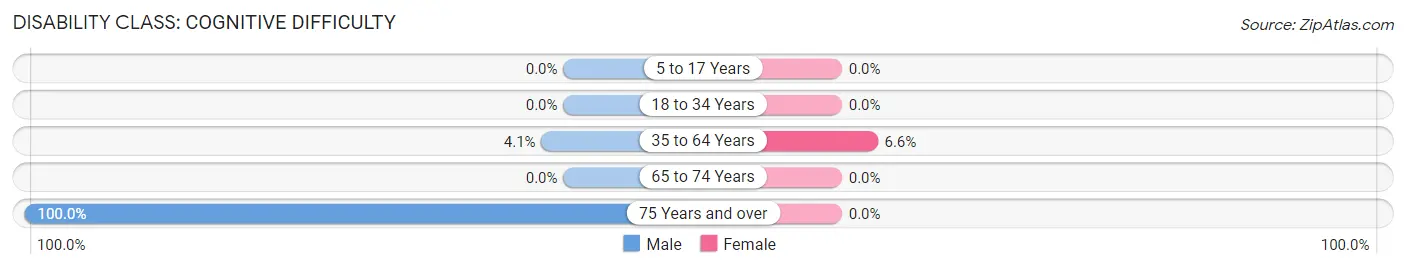
| Age Bracket | Male | Female |
| 5 to 17 Years | 0 (0.0%) | 0 (0.0%) |
| 18 to 34 Years | 0 (0.0%) | 0 (0.0%) |
| 35 to 64 Years | 5 (4.1%) | 11 (6.6%) |
| 65 to 74 Years | 0 (0.0%) | 0 (0.0%) |
| 75 Years and over | 2 (100.0%) | 0 (0.0%) |
Disability Class: Ambulatory Difficulty
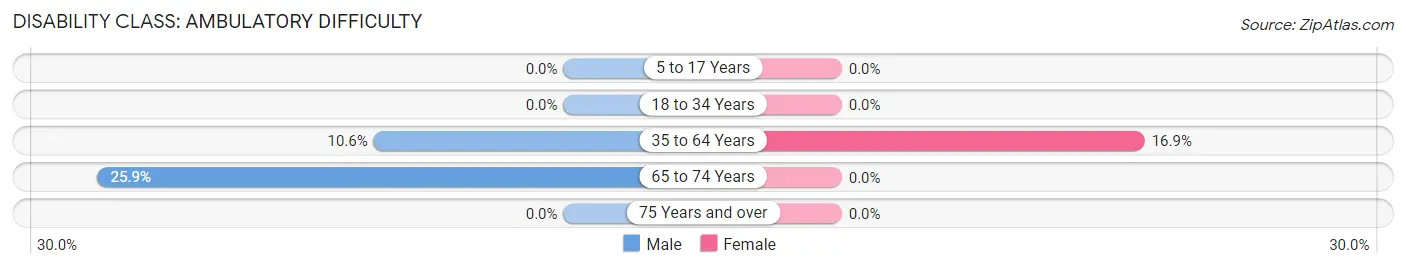
| Age Bracket | Male | Female |
| 5 to 17 Years | 0 (0.0%) | 0 (0.0%) |
| 18 to 34 Years | 0 (0.0%) | 0 (0.0%) |
| 35 to 64 Years | 13 (10.6%) | 28 (16.9%) |
| 65 to 74 Years | 7 (25.9%) | 0 (0.0%) |
| 75 Years and over | 0 (0.0%) | 0 (0.0%) |
Disability Class: Self-Care Difficulty
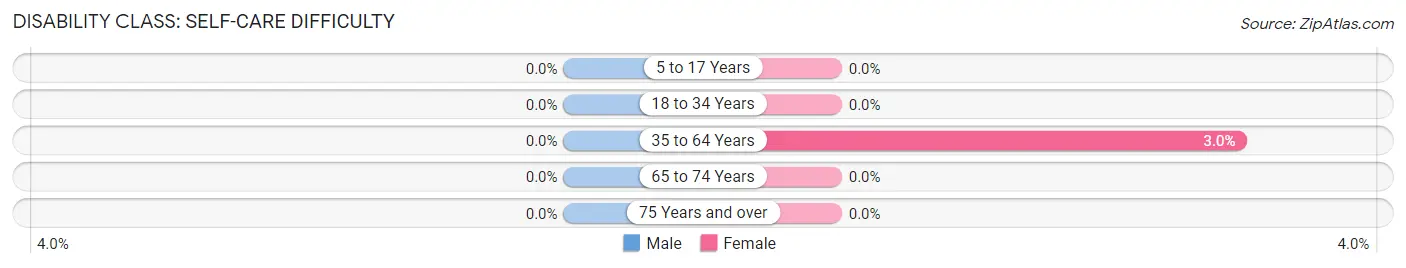
| Age Bracket | Male | Female |
| 5 to 17 Years | 0 (0.0%) | 0 (0.0%) |
| 18 to 34 Years | 0 (0.0%) | 0 (0.0%) |
| 35 to 64 Years | 0 (0.0%) | 5 (3.0%) |
| 65 to 74 Years | 0 (0.0%) | 0 (0.0%) |
| 75 Years and over | 0 (0.0%) | 0 (0.0%) |
Technology Access in Hooper Bay
Computing Device Access in Hooper Bay
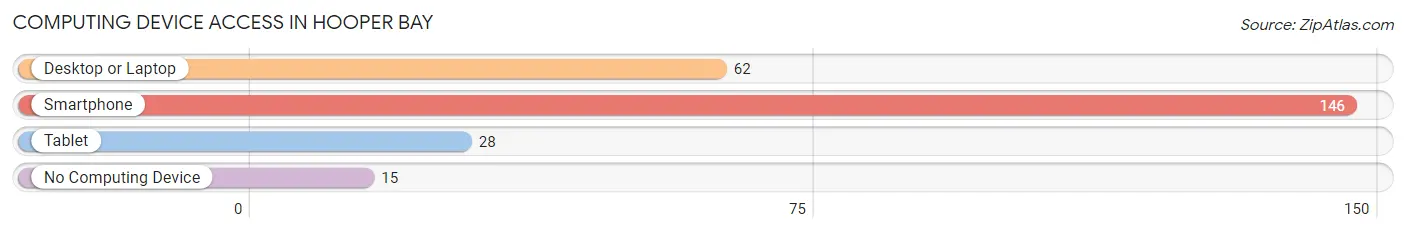
| Device Type | # Households | % Households |
| Desktop or Laptop | 62 | 36.7% |
| Smartphone | 146 | 86.4% |
| Tablet | 28 | 16.6% |
| No Computing Device | 15 | 8.9% |
| Total | 169 | 100.0% |
Internet Access in Hooper Bay
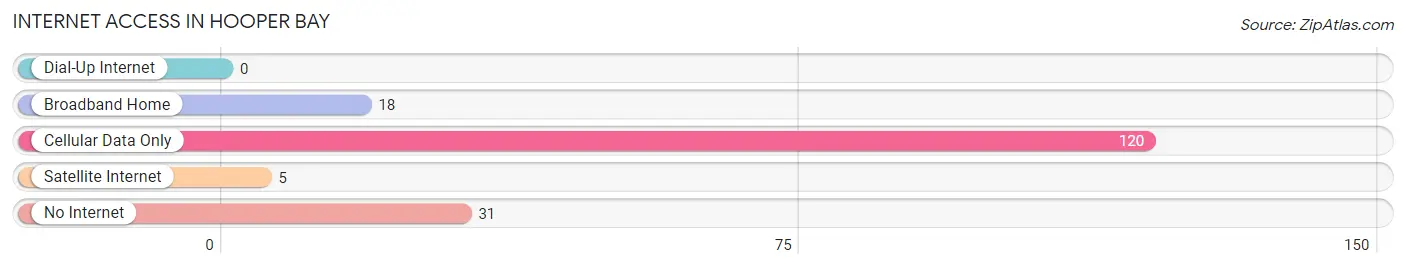
| Internet Type | # Households | % Households |
| Dial-Up Internet | 0 | 0.0% |
| Broadband Home | 18 | 10.6% |
| Cellular Data Only | 120 | 71.0% |
| Satellite Internet | 5 | 3.0% |
| No Internet | 31 | 18.3% |
| Total | 169 | 100.0% |
Hooper Bay Summary
Hooper Bay is a city located in the southwestern part of the U.S. state of Alaska. It is situated on the Bering Sea coast of the Yukon-Kuskokwim Delta, approximately 50 miles southwest of Bethel. The city is the largest settlement in the Yukon-Kuskokwim Delta region, with a population of 1,094 as of the 2010 census.
History
Hooper Bay was originally inhabited by the Yup'ik people, who have lived in the area for thousands of years. The first European settlers arrived in the area in the late 19th century, and the town was officially founded in 1912. The town was named after Captain William Hooper, a whaling captain who had visited the area in the late 1800s.
In the early 20th century, Hooper Bay became a major trading center for the region, with a fish cannery, a general store, and a post office. The town also served as a hub for the region's fur trade. In the 1950s, the town was connected to the rest of Alaska by the Alaska Railroad, and in the 1960s, the town was connected to the rest of the United States by the Alaska Highway.
Geography
Hooper Bay is located on the Bering Sea coast of the Yukon-Kuskokwim Delta, approximately 50 miles southwest of Bethel. The city is situated on a small peninsula, with the Hooper Bay Lagoon to the east and the Bering Sea to the west. The city is surrounded by wetlands and tundra, and is home to a variety of wildlife, including caribou, moose, and migratory birds.
The climate in Hooper Bay is subarctic, with long, cold winters and short, cool summers. The average temperature in January is -7°F, and the average temperature in July is 54°F. The average annual precipitation is 11.5 inches.
Economy
The economy of Hooper Bay is largely based on fishing and subsistence activities. The city is home to a fish processing plant, which processes salmon, cod, and other fish for the commercial market. The city also has a small commercial fishing fleet, which harvests salmon, cod, and other fish for the local market.
In addition to fishing, Hooper Bay is home to a variety of other businesses, including a general store, a post office, a hardware store, and a restaurant. The city also has a small tourism industry, with visitors coming to the area to fish, hunt, and observe wildlife.
Demographics
As of the 2010 census, Hooper Bay had a population of 1,094. The racial makeup of the city was 95.3% Native American, 2.2% White, 0.7% Asian, 0.3% Black, and 1.5% from other races. The median household income was $25,938, and the median family income was $30,625.
Hooper Bay is served by the Hooper Bay School District, which includes an elementary school, a middle school, and a high school. The city is also home to a branch of the University of Alaska Fairbanks, which offers a variety of degree programs.
Common Questions
What is Per Capita Income in Hooper Bay?
Per Capita income in Hooper Bay is $15,903.
What is the Median Family Income in Hooper Bay?
Median Family Income in Hooper Bay is $40,893.
What is the Median Household income in Hooper Bay?
Median Household Income in Hooper Bay is $35,179.
What is Family Income Deficit in Hooper Bay?
Family Income Deficit in Hooper Bay is $21,364.
Families that are below poverty line in Hooper Bay earn $21,364 less on average than the poverty threshold level.
What is Inequality or Gini Index in Hooper Bay?
Inequality or Gini Index in Hooper Bay is 0.45.
What is the Total Population of Hooper Bay?
Total Population of Hooper Bay is 801.
What is the Total Male Population of Hooper Bay?
Total Male Population of Hooper Bay is 365.
What is the Total Female Population of Hooper Bay?
Total Female Population of Hooper Bay is 436.
What is the Ratio of Males per 100 Females in Hooper Bay?
There are 83.72 Males per 100 Females in Hooper Bay.
What is the Ratio of Females per 100 Males in Hooper Bay?
There are 119.45 Females per 100 Males in Hooper Bay.
What is the Median Population Age in Hooper Bay?
Median Population Age in Hooper Bay is 30.2 Years.
What is the Average Family Size in Hooper Bay
Average Family Size in Hooper Bay is 4.4 People.
What is the Average Household Size in Hooper Bay
Average Household Size in Hooper Bay is 4.1 People.
How Large is the Labor Force in Hooper Bay?
There are 337 People in the Labor Forcein in Hooper Bay.
What is the Percentage of People in the Labor Force in Hooper Bay?
65.8% of People are in the Labor Force in Hooper Bay.
What is the Unemployment Rate in Hooper Bay?
Unemployment Rate in Hooper Bay is 25.8%.