North Pole, AK Map & Demographics
North Pole Map
North Pole Overview
$38,326
PER CAPITA INCOME
$97,462
AVG FAMILY INCOME
$91,583
AVG HOUSEHOLD INCOME
6.7%
WAGE / INCOME GAP [ % ]
93.3¢/ $1
WAGE / INCOME GAP [ $ ]
$17,083
FAMILY INCOME DEFICIT
0.32
INEQUALITY / GINI INDEX
2,816
TOTAL POPULATION
1,511
MALE POPULATION
1,305
FEMALE POPULATION
115.79
MALES / 100 FEMALES
86.37
FEMALES / 100 MALES
28.4
MEDIAN AGE
3.6
AVG FAMILY SIZE
2.8
AVG HOUSEHOLD SIZE
1,453
LABOR FORCE [ PEOPLE ]
77.4%
PERCENT IN LABOR FORCE
3.8%
UNEMPLOYMENT RATE
North Pole Zip Codes
North Pole Area Codes
Income in North Pole
Income Overview in North Pole
Per Capita Income in North Pole is $38,326, while median incomes of families and households are $97,462 and $91,583 respectively.
| Characteristic | Number | Measure |
| Per Capita Income | 2,816 | $38,326 |
| Median Family Income | 659 | $97,462 |
| Mean Family Income | 659 | $113,227 |
| Median Household Income | 1,013 | $91,583 |
| Mean Household Income | 1,013 | $106,846 |
| Income Deficit | 659 | $17,083 |
| Wage / Income Gap (%) | 2,816 | 6.71% |
| Wage / Income Gap ($) | 2,816 | 93.29¢ per $1 |
| Gini / Inequality Index | 2,816 | 0.32 |
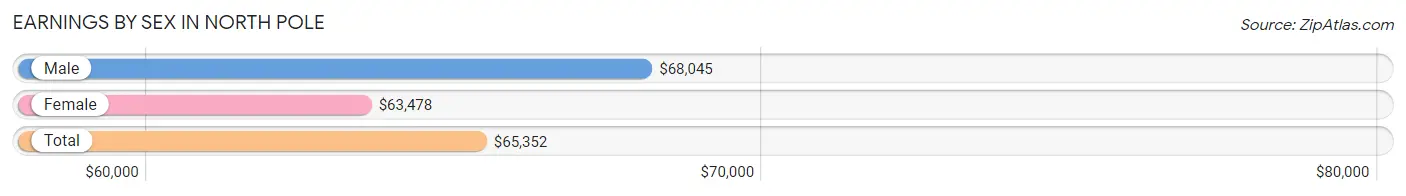
Earnings by Sex in North Pole
Average Earnings in North Pole are $65,352, $68,045 for men and $63,478 for women, a difference of 6.7%.
| Sex | Number | Average Earnings |
| Male | 797 (53.5%) | $68,045 |
| Female | 692 (46.5%) | $63,478 |
| Total | 1,489 (100.0%) | $65,352 |
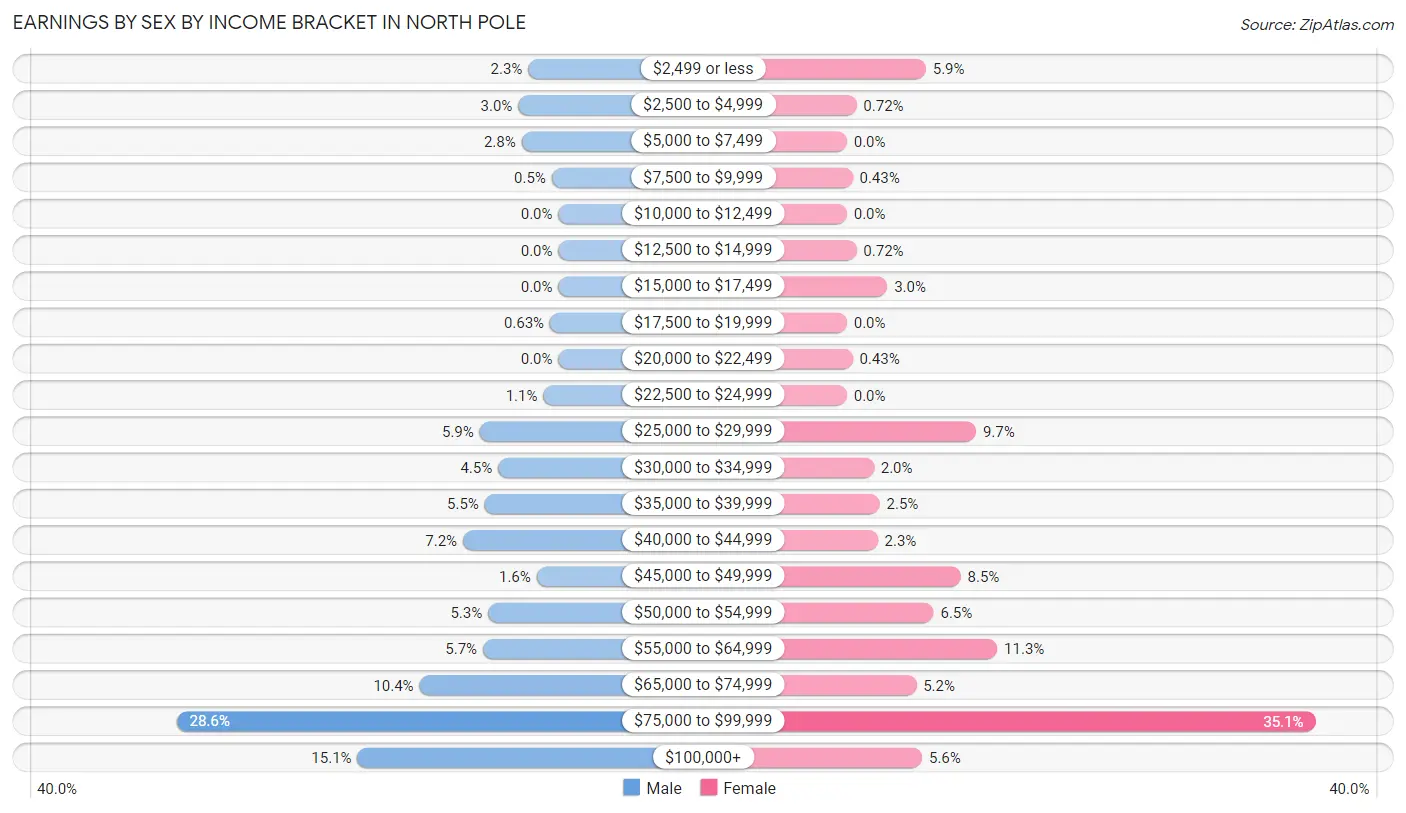
Earnings by Sex by Income Bracket in North Pole
The most common earnings brackets in North Pole are $75,000 to $99,999 for men (228 | 28.6%) and $75,000 to $99,999 for women (243 | 35.1%).
| Income | Male | Female |
| $2,499 or less | 18 (2.3%) | 41 (5.9%) |
| $2,500 to $4,999 | 24 (3.0%) | 5 (0.7%) |
| $5,000 to $7,499 | 22 (2.8%) | 0 (0.0%) |
| $7,500 to $9,999 | 4 (0.5%) | 3 (0.4%) |
| $10,000 to $12,499 | 0 (0.0%) | 0 (0.0%) |
| $12,500 to $14,999 | 0 (0.0%) | 5 (0.7%) |
| $15,000 to $17,499 | 0 (0.0%) | 21 (3.0%) |
| $17,500 to $19,999 | 5 (0.6%) | 0 (0.0%) |
| $20,000 to $22,499 | 0 (0.0%) | 3 (0.4%) |
| $22,500 to $24,999 | 9 (1.1%) | 0 (0.0%) |
| $25,000 to $29,999 | 47 (5.9%) | 67 (9.7%) |
| $30,000 to $34,999 | 36 (4.5%) | 14 (2.0%) |
| $35,000 to $39,999 | 44 (5.5%) | 17 (2.5%) |
| $40,000 to $44,999 | 57 (7.1%) | 16 (2.3%) |
| $45,000 to $49,999 | 13 (1.6%) | 59 (8.5%) |
| $50,000 to $54,999 | 42 (5.3%) | 45 (6.5%) |
| $55,000 to $64,999 | 45 (5.7%) | 78 (11.3%) |
| $65,000 to $74,999 | 83 (10.4%) | 36 (5.2%) |
| $75,000 to $99,999 | 228 (28.6%) | 243 (35.1%) |
| $100,000+ | 120 (15.1%) | 39 (5.6%) |
| Total | 797 (100.0%) | 692 (100.0%) |
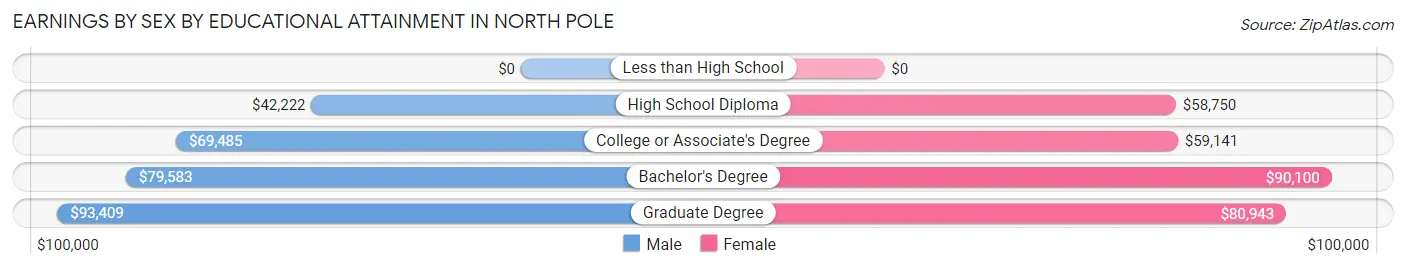
Earnings by Sex by Educational Attainment in North Pole
Average earnings in North Pole are $67,949 for men and $64,728 for women, a difference of 4.7%. Men with an educational attainment of graduate degree enjoy the highest average annual earnings of $93,409, while those with high school diploma education earn the least with $42,222. Women with an educational attainment of bachelor's degree earn the most with the average annual earnings of $90,100, while those with high school diploma education have the smallest earnings of $58,750.
| Educational Attainment | Male Income | Female Income |
| Less than High School | - | - |
| High School Diploma | $42,222 | $58,750 |
| College or Associate's Degree | $69,485 | $59,141 |
| Bachelor's Degree | $79,583 | $90,100 |
| Graduate Degree | $93,409 | $80,943 |
| Total | $67,949 | $64,728 |
Family Income in North Pole
Family Income Brackets in North Pole
According to the North Pole family income data, there are 190 families falling into the $75,000 to $99,999 income range, which is the most common income bracket and makes up 28.8% of all families. Conversely, the $15,000 to $24,999 income bracket is the least frequent group with only 2 families (0.3%) belonging to this category.
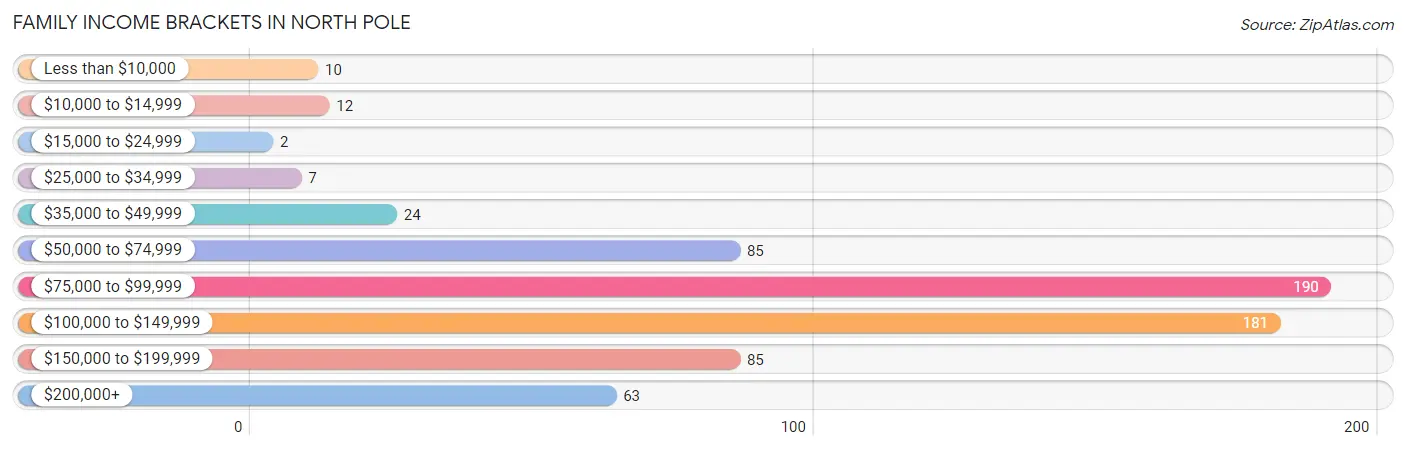
| Income Bracket | # Families | % Families |
| Less than $10,000 | 10 | 1.5% |
| $10,000 to $14,999 | 12 | 1.8% |
| $15,000 to $24,999 | 2 | 0.3% |
| $25,000 to $34,999 | 7 | 1.1% |
| $35,000 to $49,999 | 24 | 3.6% |
| $50,000 to $74,999 | 85 | 12.9% |
| $75,000 to $99,999 | 190 | 28.8% |
| $100,000 to $149,999 | 181 | 27.5% |
| $150,000 to $199,999 | 85 | 12.9% |
| $200,000+ | 63 | 9.6% |
Family Income by Famaliy Size in North Pole
4-person families (164 | 24.9%) account for the highest median family income in North Pole with $167,623 per family, while 4-person families (164 | 24.9%) have the highest median income of $41,906 per family member.
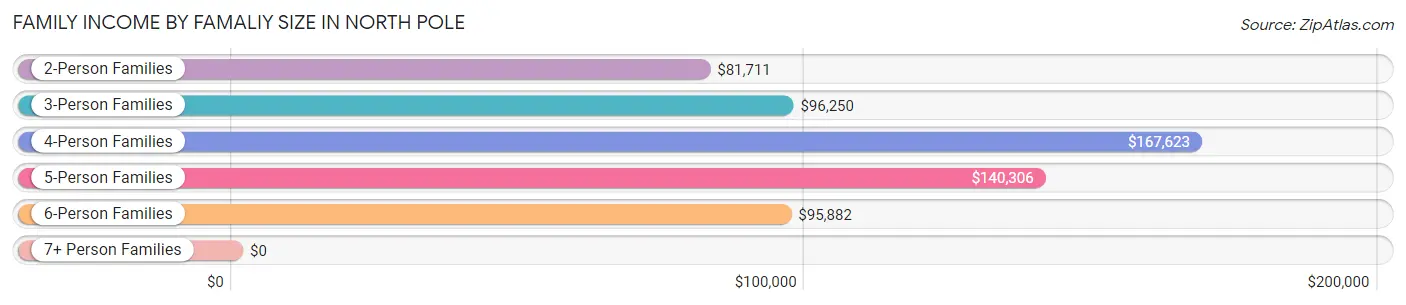
| Income Bracket | # Families | Median Income |
| 2-Person Families | 196 (29.7%) | $81,711 |
| 3-Person Families | 138 (20.9%) | $96,250 |
| 4-Person Families | 164 (24.9%) | $167,623 |
| 5-Person Families | 97 (14.7%) | $140,306 |
| 6-Person Families | 36 (5.5%) | $95,882 |
| 7+ Person Families | 28 (4.3%) | $0 |
| Total | 659 (100.0%) | $97,462 |
Family Income by Number of Earners in North Pole
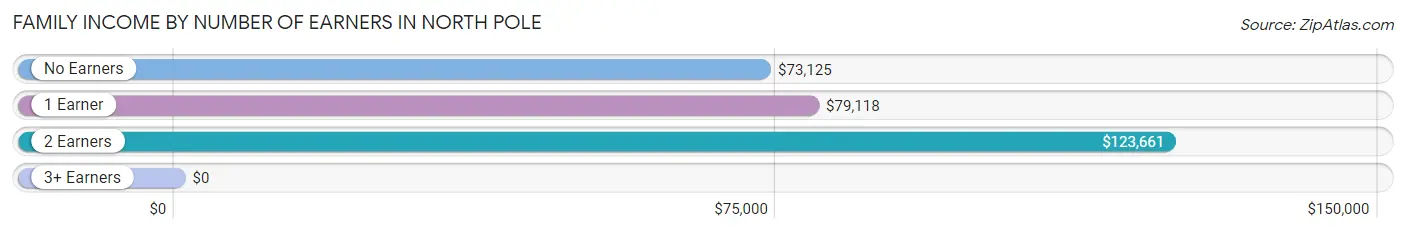
| Number of Earners | # Families | Median Income |
| No Earners | 32 (4.9%) | $73,125 |
| 1 Earner | 228 (34.6%) | $79,118 |
| 2 Earners | 381 (57.8%) | $123,661 |
| 3+ Earners | 18 (2.7%) | $0 |
| Total | 659 (100.0%) | $97,462 |
Household Income in North Pole
Household Income Brackets in North Pole
With 289 households falling in the category, the $75,000 to $99,999 income range is the most frequent in North Pole, accounting for 28.5% of all households. In contrast, only 14 households (1.4%) fall into the less than $10,000 income bracket, making it the least populous group.
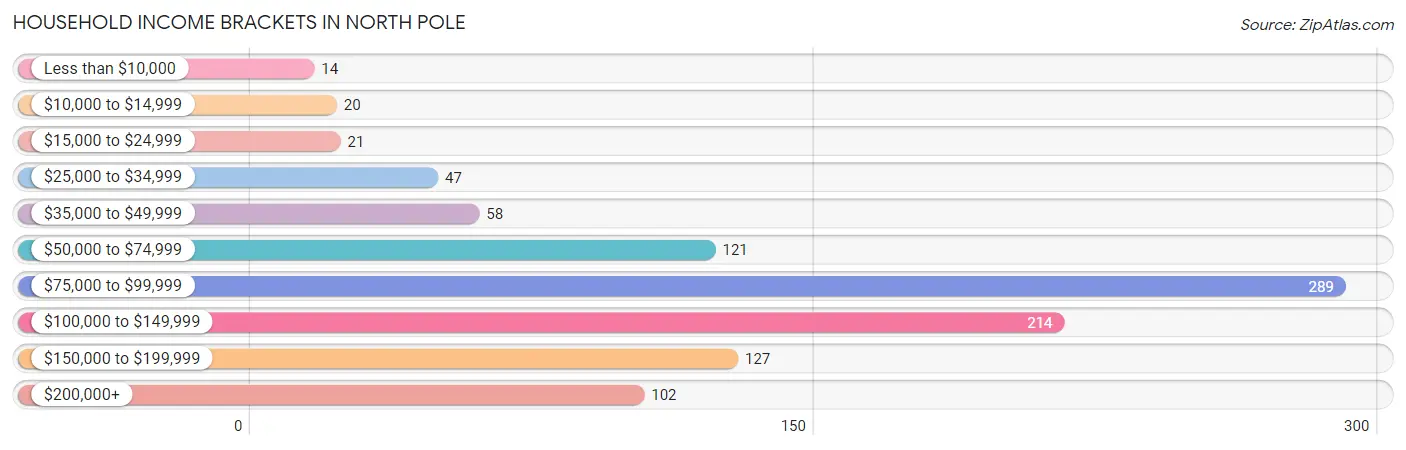
| Income Bracket | # Households | % Households |
| Less than $10,000 | 14 | 1.4% |
| $10,000 to $14,999 | 20 | 2.0% |
| $15,000 to $24,999 | 21 | 2.1% |
| $25,000 to $34,999 | 47 | 4.6% |
| $35,000 to $49,999 | 58 | 5.7% |
| $50,000 to $74,999 | 121 | 11.9% |
| $75,000 to $99,999 | 289 | 28.5% |
| $100,000 to $149,999 | 214 | 21.1% |
| $150,000 to $199,999 | 127 | 12.5% |
| $200,000+ | 102 | 10.1% |
Household Income by Householder Age in North Pole
The median household income in North Pole is $91,583, with the highest median household income of $95,081 found in the 25 to 44 years age bracket for the primary householder. A total of 642 households (63.4%) fall into this category. Meanwhile, the 15 to 24 years age bracket for the primary householder has the lowest median household income of $0, with 91 households (9.0%) in this group.
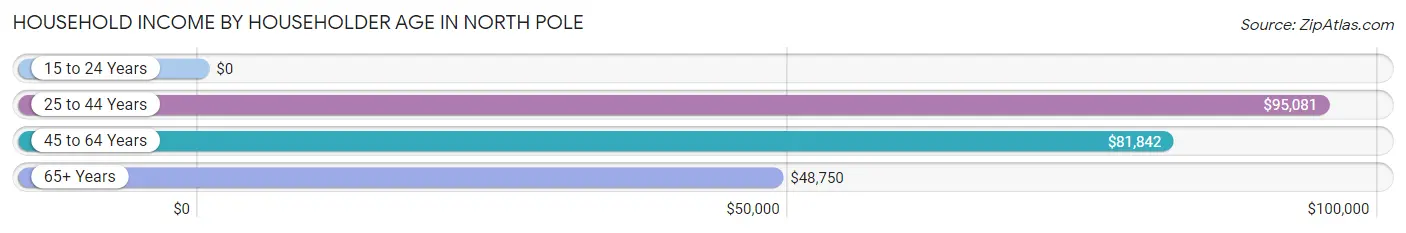
| Income Bracket | # Households | Median Income |
| 15 to 24 Years | 91 (9.0%) | $0 |
| 25 to 44 Years | 642 (63.4%) | $95,081 |
| 45 to 64 Years | 180 (17.8%) | $81,842 |
| 65+ Years | 100 (9.9%) | $48,750 |
| Total | 1,013 (100.0%) | $91,583 |
Poverty in North Pole
Income Below Poverty by Sex and Age in North Pole
With 7.9% poverty level for males and 5.5% for females among the residents of North Pole, 55 to 64 year old males and 12 to 14 year old females are the most vulnerable to poverty, with 13 males (19.1%) and 16 females (27.1%) in their respective age groups living below the poverty level.
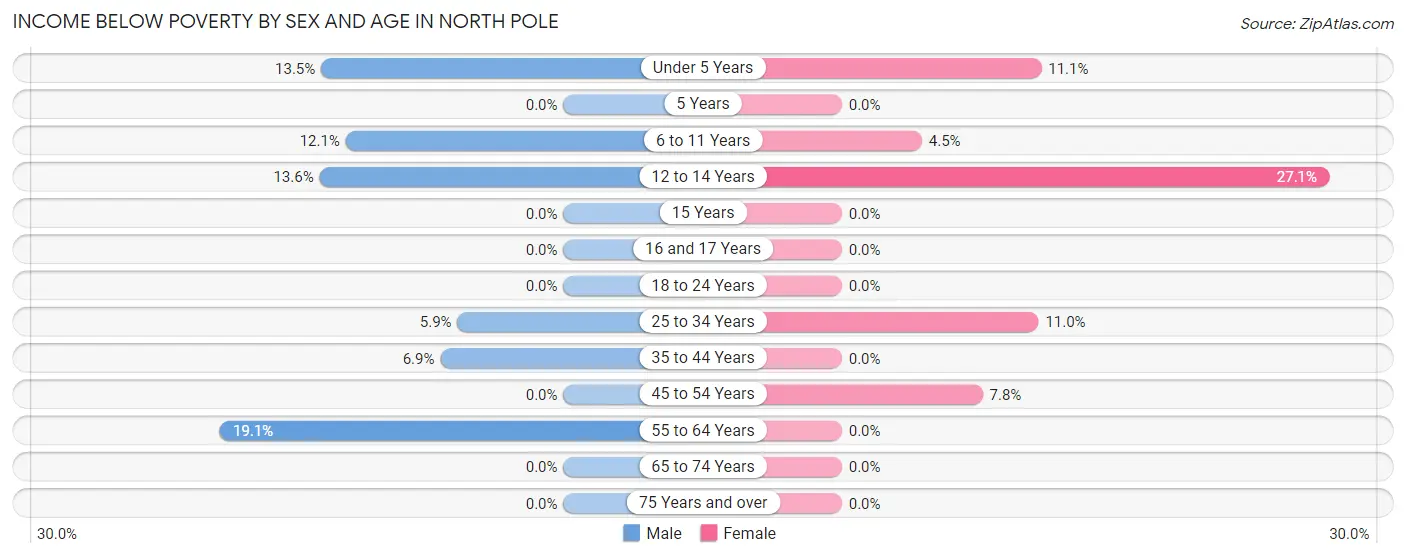
| Age Bracket | Male | Female |
| Under 5 Years | 29 (13.5%) | 7 (11.1%) |
| 5 Years | 0 (0.0%) | 0 (0.0%) |
| 6 to 11 Years | 28 (12.1%) | 7 (4.5%) |
| 12 to 14 Years | 11 (13.6%) | 16 (27.1%) |
| 15 Years | 0 (0.0%) | 0 (0.0%) |
| 16 and 17 Years | 0 (0.0%) | 0 (0.0%) |
| 18 to 24 Years | 0 (0.0%) | 0 (0.0%) |
| 25 to 34 Years | 20 (5.9%) | 38 (11.0%) |
| 35 to 44 Years | 17 (6.9%) | 0 (0.0%) |
| 45 to 54 Years | 0 (0.0%) | 4 (7.8%) |
| 55 to 64 Years | 13 (19.1%) | 0 (0.0%) |
| 65 to 74 Years | 0 (0.0%) | 0 (0.0%) |
| 75 Years and over | 0 (0.0%) | 0 (0.0%) |
| Total | 118 (7.9%) | 72 (5.5%) |
Income Above Poverty by Sex and Age in North Pole
According to the poverty statistics in North Pole, males aged 5 years and females aged 5 years are the age groups that are most secure financially, with 100.0% of males and 100.0% of females in these age groups living above the poverty line.
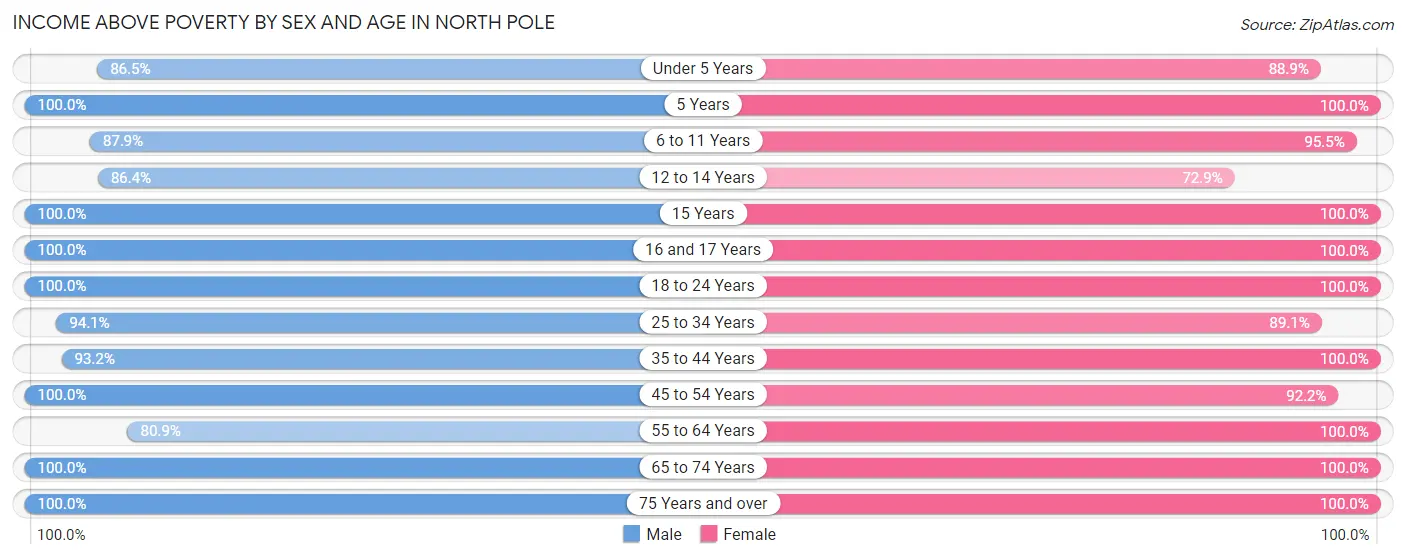
| Age Bracket | Male | Female |
| Under 5 Years | 186 (86.5%) | 56 (88.9%) |
| 5 Years | 55 (100.0%) | 51 (100.0%) |
| 6 to 11 Years | 203 (87.9%) | 150 (95.5%) |
| 12 to 14 Years | 70 (86.4%) | 43 (72.9%) |
| 15 Years | 17 (100.0%) | 10 (100.0%) |
| 16 and 17 Years | 11 (100.0%) | 20 (100.0%) |
| 18 to 24 Years | 120 (100.0%) | 146 (100.0%) |
| 25 to 34 Years | 319 (94.1%) | 309 (89.0%) |
| 35 to 44 Years | 231 (93.1%) | 222 (100.0%) |
| 45 to 54 Years | 42 (100.0%) | 47 (92.2%) |
| 55 to 64 Years | 55 (80.9%) | 94 (100.0%) |
| 65 to 74 Years | 49 (100.0%) | 74 (100.0%) |
| 75 Years and over | 18 (100.0%) | 7 (100.0%) |
| Total | 1,376 (92.1%) | 1,229 (94.5%) |
Income Below Poverty Among Married-Couple Families in North Pole
The poverty statistics for married-couple families in North Pole show that 5.3% or 29 of the total 544 families live below the poverty line. Families with 3 or 4 children have the highest poverty rate of 9.8%, comprising of 13 families. On the other hand, families with 5 or more children have the lowest poverty rate of 0.0%, which includes 0 families.
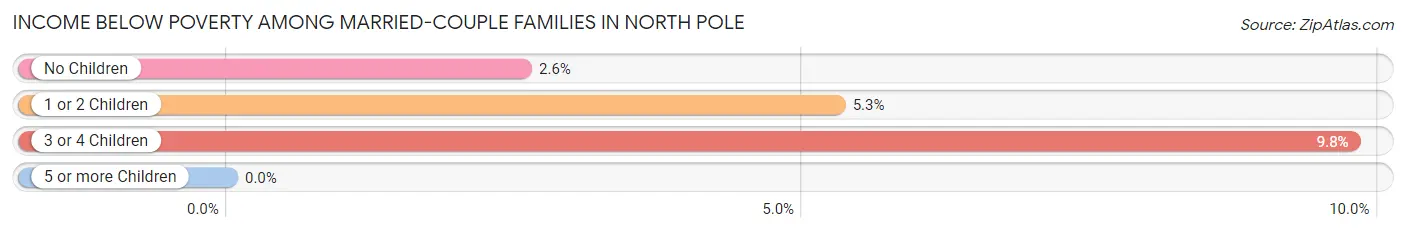
| Children | Above Poverty | Below Poverty |
| No Children | 152 (97.4%) | 4 (2.6%) |
| 1 or 2 Children | 215 (94.7%) | 12 (5.3%) |
| 3 or 4 Children | 120 (90.2%) | 13 (9.8%) |
| 5 or more Children | 28 (100.0%) | 0 (0.0%) |
| Total | 515 (94.7%) | 29 (5.3%) |
Income Below Poverty Among Single-Parent Households in North Pole
| Children | Single Father | Single Mother |
| No Children | 0 (0.0%) | 0 (0.0%) |
| 1 or 2 Children | 0 (0.0%) | 0 (0.0%) |
| 3 or 4 Children | 0 (0.0%) | 0 (0.0%) |
| 5 or more Children | 0 (0.0%) | 0 (0.0%) |
| Total | 0 (0.0%) | 0 (0.0%) |
Income Below Poverty Among Married-Couple vs Single-Parent Households in North Pole
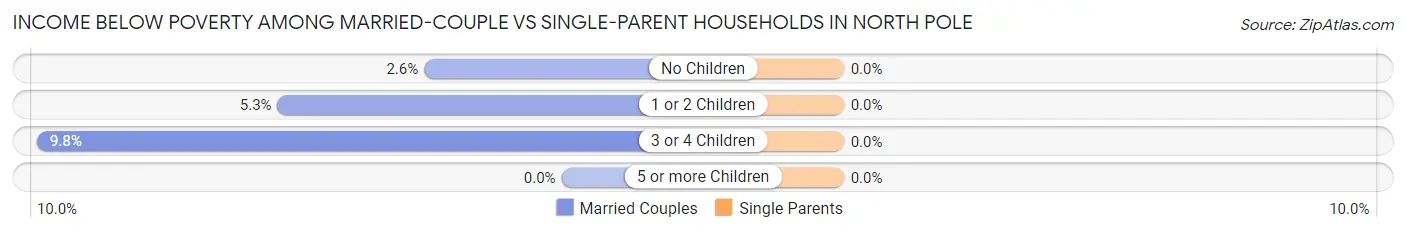
| Children | Married-Couple Families | Single-Parent Households |
| No Children | 4 (2.6%) | 0 (0.0%) |
| 1 or 2 Children | 12 (5.3%) | 0 (0.0%) |
| 3 or 4 Children | 13 (9.8%) | 0 (0.0%) |
| 5 or more Children | 0 (0.0%) | 0 (0.0%) |
| Total | 29 (5.3%) | 0 (0.0%) |
Race in North Pole
The most populous races in North Pole are White / Caucasian (1,964 | 69.7%), Two or more Races (400 | 14.2%), and Hispanic or Latino (254 | 9.0%).
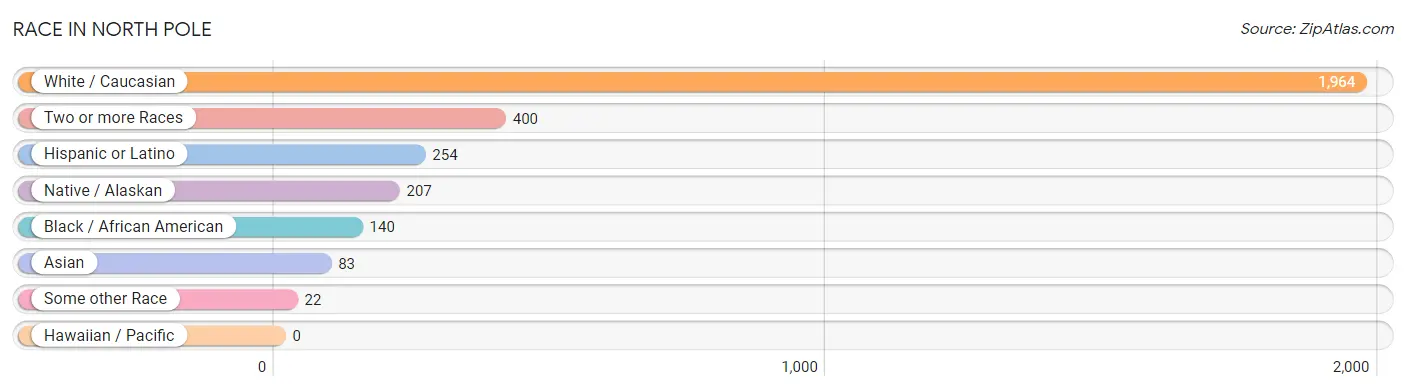
| Race | # Population | % Population |
| Asian | 83 | 2.9% |
| Black / African American | 140 | 5.0% |
| Hawaiian / Pacific | 0 | 0.0% |
| Hispanic or Latino | 254 | 9.0% |
| Native / Alaskan | 207 | 7.3% |
| White / Caucasian | 1,964 | 69.7% |
| Two or more Races | 400 | 14.2% |
| Some other Race | 22 | 0.8% |
| Total | 2,816 | 100.0% |
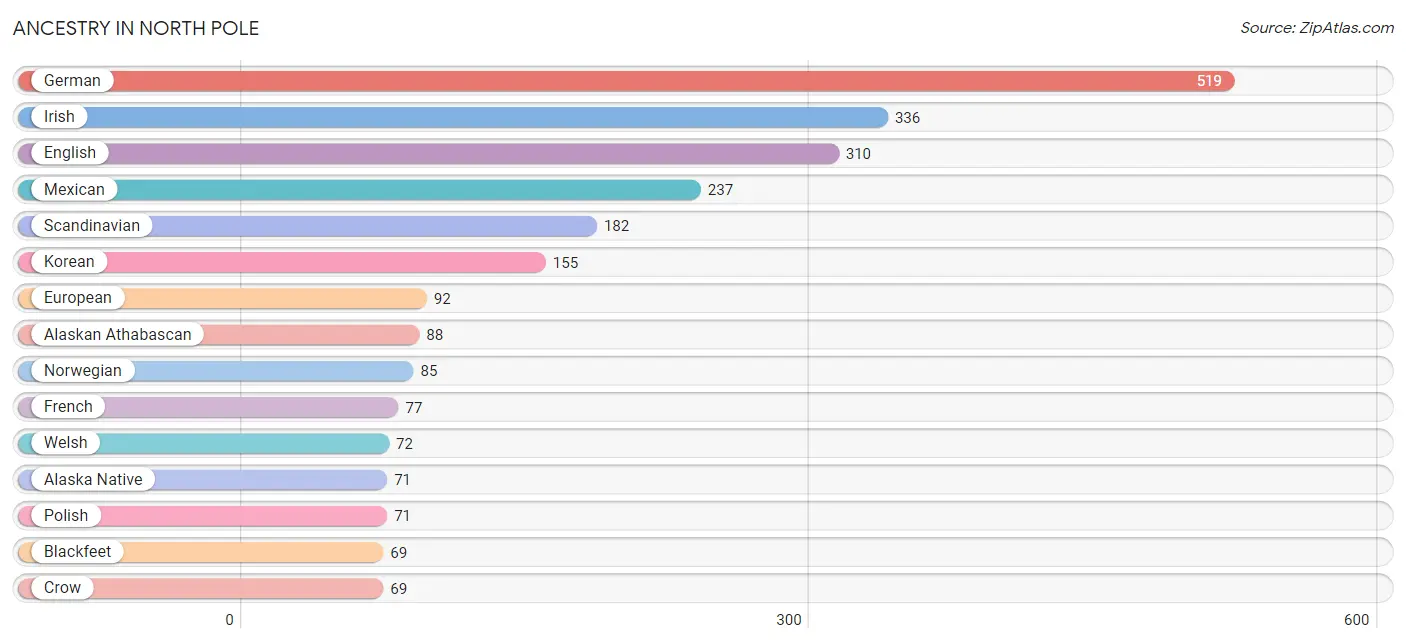
Ancestry in North Pole
The most populous ancestries reported in North Pole are German (519 | 18.4%), Irish (336 | 11.9%), English (310 | 11.0%), Mexican (237 | 8.4%), and Scandinavian (182 | 6.5%), together accounting for 56.2% of all North Pole residents.
| Ancestry | # Population | % Population |
| Alaska Native | 71 | 2.5% |
| Alaskan Athabascan | 88 | 3.1% |
| American | 55 | 1.9% |
| Apache | 10 | 0.4% |
| Bhutanese | 33 | 1.2% |
| Blackfeet | 69 | 2.5% |
| British | 12 | 0.4% |
| Burmese | 34 | 1.2% |
| Canadian | 17 | 0.6% |
| Cherokee | 51 | 1.8% |
| Chippewa | 21 | 0.7% |
| Colville | 5 | 0.2% |
| Crow | 69 | 2.5% |
| Cuban | 13 | 0.5% |
| Czech | 50 | 1.8% |
| Czechoslovakian | 9 | 0.3% |
| Dutch | 14 | 0.5% |
| English | 310 | 11.0% |
| European | 92 | 3.3% |
| Finnish | 4 | 0.1% |
| French | 77 | 2.7% |
| German | 519 | 18.4% |
| Guamanian / Chamorro | 14 | 0.5% |
| Icelander | 6 | 0.2% |
| Indian (Asian) | 14 | 0.5% |
| Inupiat | 42 | 1.5% |
| Irish | 336 | 11.9% |
| Italian | 66 | 2.3% |
| Korean | 155 | 5.5% |
| Mexican | 237 | 8.4% |
| Native Hawaiian | 28 | 1.0% |
| Navajo | 9 | 0.3% |
| Norwegian | 85 | 3.0% |
| Polish | 71 | 2.5% |
| Potawatomi | 31 | 1.1% |
| Romanian | 1 | 0.0% |
| Russian | 21 | 0.7% |
| Scandinavian | 182 | 6.5% |
| Scotch-Irish | 32 | 1.1% |
| Scottish | 52 | 1.8% |
| Sri Lankan | 19 | 0.7% |
| Swedish | 36 | 1.3% |
| Swiss | 4 | 0.1% |
| Tlingit-Haida | 52 | 1.8% |
| Tsimshian | 3 | 0.1% |
| Turkish | 5 | 0.2% |
| Welsh | 72 | 2.6% |
| Yup'ik | 31 | 1.1% | View All 48 Rows |
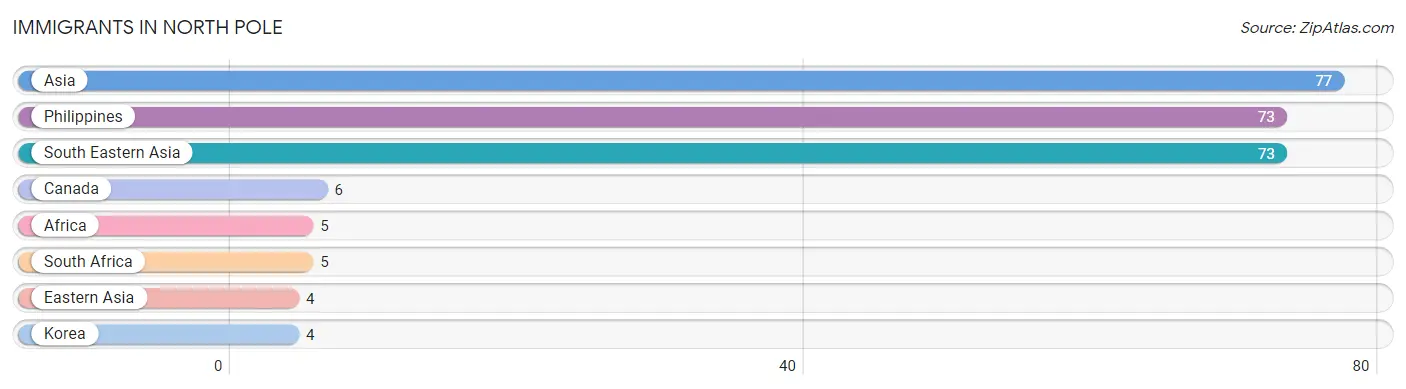
Immigrants in North Pole
The most numerous immigrant groups reported in North Pole came from Asia (77 | 2.7%), Philippines (73 | 2.6%), South Eastern Asia (73 | 2.6%), Canada (6 | 0.2%), and Africa (5 | 0.2%), together accounting for 8.3% of all North Pole residents.
| Immigration Origin | # Population | % Population |
| Africa | 5 | 0.2% |
| Asia | 77 | 2.7% |
| Canada | 6 | 0.2% |
| Eastern Asia | 4 | 0.1% |
| Korea | 4 | 0.1% |
| Philippines | 73 | 2.6% |
| South Africa | 5 | 0.2% |
| South Eastern Asia | 73 | 2.6% | View All 8 Rows |
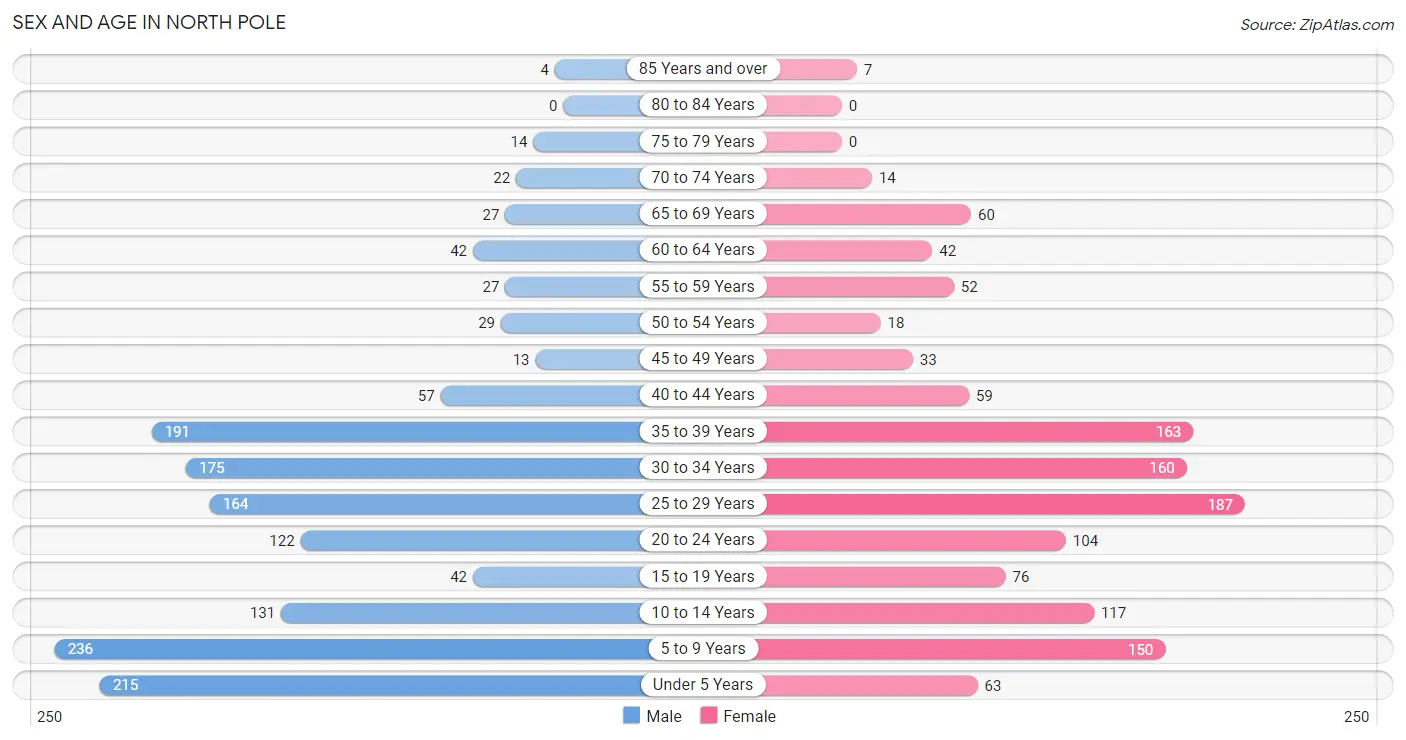
Sex and Age in North Pole
Sex and Age in North Pole
The most populous age groups in North Pole are 5 to 9 Years (236 | 15.6%) for men and 25 to 29 Years (187 | 14.3%) for women.
| Age Bracket | Male | Female |
| Under 5 Years | 215 (14.2%) | 63 (4.8%) |
| 5 to 9 Years | 236 (15.6%) | 150 (11.5%) |
| 10 to 14 Years | 131 (8.7%) | 117 (9.0%) |
| 15 to 19 Years | 42 (2.8%) | 76 (5.8%) |
| 20 to 24 Years | 122 (8.1%) | 104 (8.0%) |
| 25 to 29 Years | 164 (10.8%) | 187 (14.3%) |
| 30 to 34 Years | 175 (11.6%) | 160 (12.3%) |
| 35 to 39 Years | 191 (12.6%) | 163 (12.5%) |
| 40 to 44 Years | 57 (3.8%) | 59 (4.5%) |
| 45 to 49 Years | 13 (0.9%) | 33 (2.5%) |
| 50 to 54 Years | 29 (1.9%) | 18 (1.4%) |
| 55 to 59 Years | 27 (1.8%) | 52 (4.0%) |
| 60 to 64 Years | 42 (2.8%) | 42 (3.2%) |
| 65 to 69 Years | 27 (1.8%) | 60 (4.6%) |
| 70 to 74 Years | 22 (1.5%) | 14 (1.1%) |
| 75 to 79 Years | 14 (0.9%) | 0 (0.0%) |
| 80 to 84 Years | 0 (0.0%) | 0 (0.0%) |
| 85 Years and over | 4 (0.3%) | 7 (0.5%) |
| Total | 1,511 (100.0%) | 1,305 (100.0%) |
Families and Households in North Pole
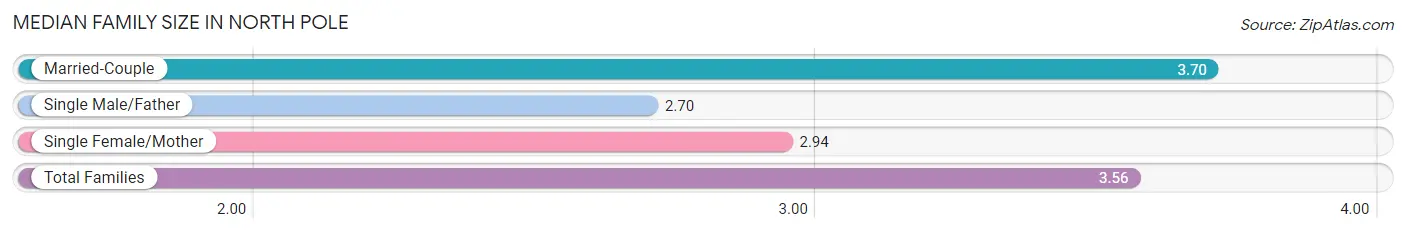
Median Family Size in North Pole
The median family size in North Pole is 3.56 persons per family, with married-couple families (544 | 82.6%) accounting for the largest median family size of 3.7 persons per family. On the other hand, single male/father families (27 | 4.1%) represent the smallest median family size with 2.70 persons per family.
| Family Type | # Families | Family Size |
| Married-Couple | 544 (82.6%) | 3.70 |
| Single Male/Father | 27 (4.1%) | 2.70 |
| Single Female/Mother | 88 (13.4%) | 2.94 |
| Total Families | 659 (100.0%) | 3.56 |
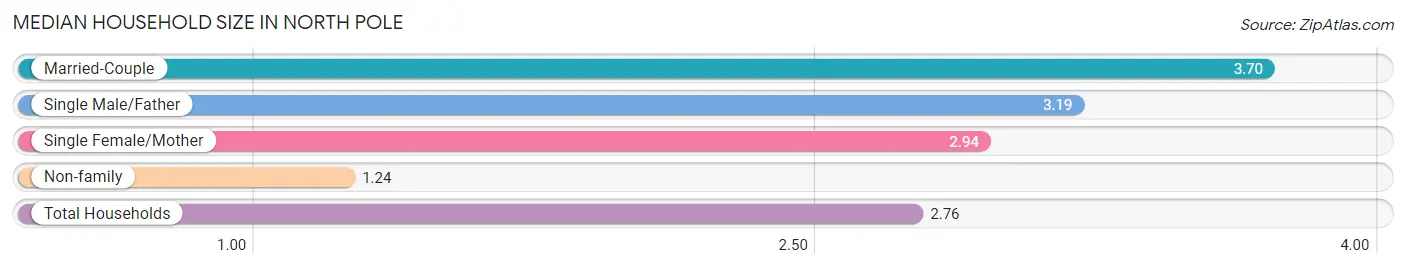
Median Household Size in North Pole
The median household size in North Pole is 2.76 persons per household, with married-couple households (544 | 53.7%) accounting for the largest median household size of 3.7 persons per household. non-family households (354 | 34.9%) represent the smallest median household size with 1.24 persons per household.
| Household Type | # Households | Household Size |
| Married-Couple | 544 (53.7%) | 3.70 |
| Single Male/Father | 27 (2.7%) | 3.19 |
| Single Female/Mother | 88 (8.7%) | 2.94 |
| Non-family | 354 (34.9%) | 1.24 |
| Total Households | 1,013 (100.0%) | 2.76 |
Household Size by Marriage Status in North Pole
Out of a total of 1,013 households in North Pole, 659 (65.0%) are family households, while 354 (34.9%) are nonfamily households. The most numerous type of family households are 2-person households, comprising 196, and the most common type of nonfamily households are 1-person households, comprising 256.
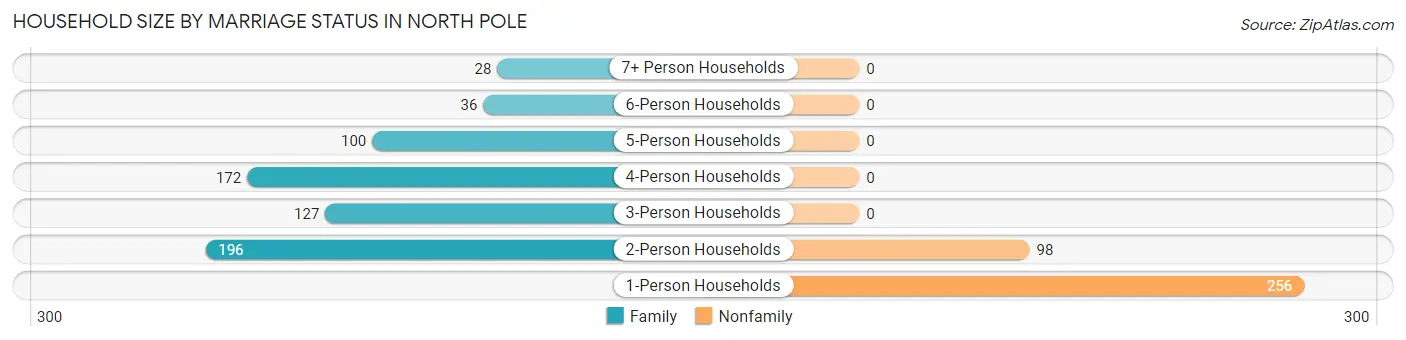
| Household Size | Family Households | Nonfamily Households |
| 1-Person Households | - | 256 (25.3%) |
| 2-Person Households | 196 (19.4%) | 98 (9.7%) |
| 3-Person Households | 127 (12.5%) | 0 (0.0%) |
| 4-Person Households | 172 (17.0%) | 0 (0.0%) |
| 5-Person Households | 100 (9.9%) | 0 (0.0%) |
| 6-Person Households | 36 (3.5%) | 0 (0.0%) |
| 7+ Person Households | 28 (2.8%) | 0 (0.0%) |
| Total | 659 (65.0%) | 354 (34.9%) |
Female Fertility in North Pole
Fertility by Age in North Pole
Average fertility rate in North Pole is 68.0 births per 1,000 women. Women in the age bracket of 35 to 50 years have the highest fertility rate with 110.0 births per 1,000 women. Women in the age bracket of 35 to 50 years acount for 52.8% of all women with births.
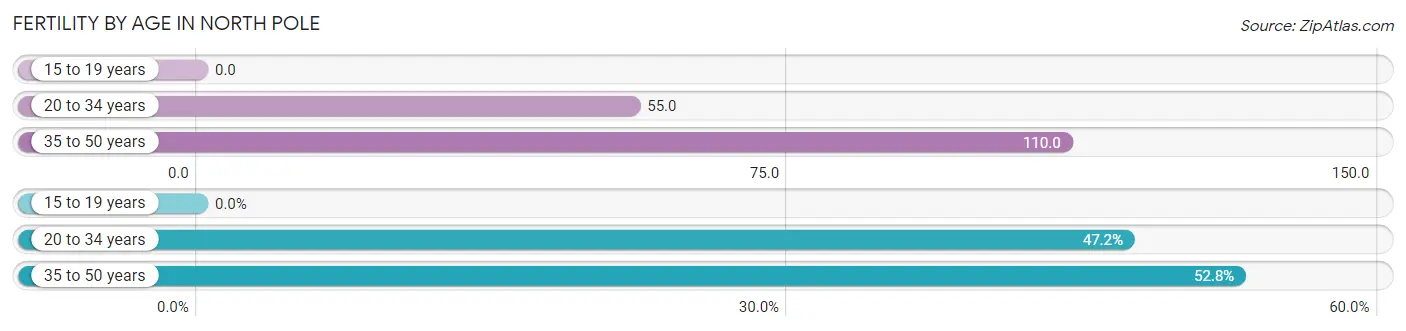
| Age Bracket | Women with Births | Births / 1,000 Women |
| 15 to 19 years | 0 (0.0%) | 0.0 |
| 20 to 34 years | 25 (47.2%) | 55.0 |
| 35 to 50 years | 28 (52.8%) | 110.0 |
| Total | 53 (100.0%) | 68.0 |
Fertility by Age by Marriage Status in North Pole
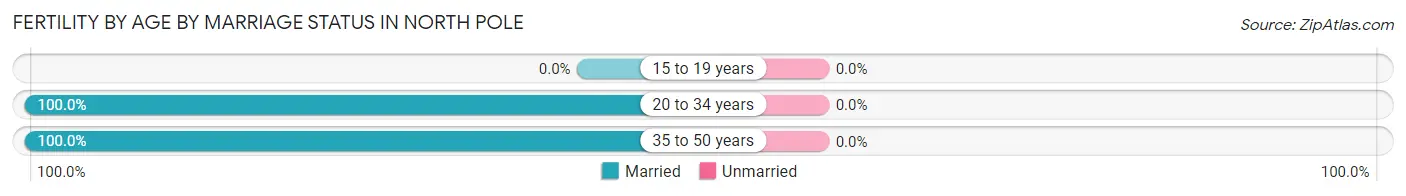
| Age Bracket | Married | Unmarried |
| 15 to 19 years | 0 (0.0%) | 0 (0.0%) |
| 20 to 34 years | 25 (100.0%) | 0 (0.0%) |
| 35 to 50 years | 28 (100.0%) | 0 (0.0%) |
| Total | 53 (100.0%) | 0 (0.0%) |
Fertility by Education in North Pole
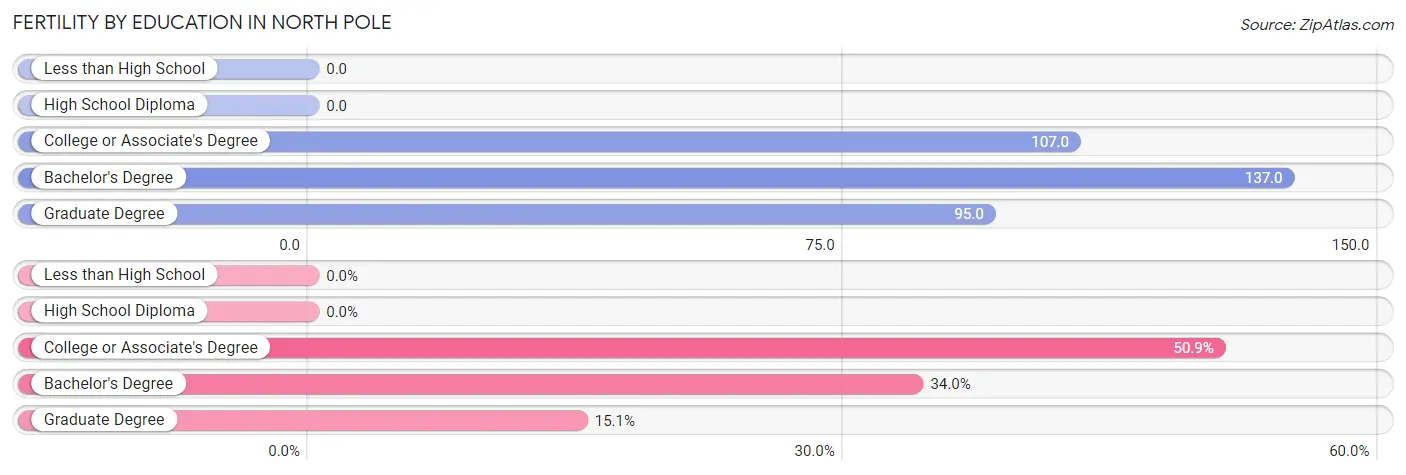
| Educational Attainment | Women with Births | Births / 1,000 Women |
| Less than High School | 0 (0.0%) | 0.0 |
| High School Diploma | 0 (0.0%) | 0.0 |
| College or Associate's Degree | 27 (50.9%) | 107.0 |
| Bachelor's Degree | 18 (34.0%) | 137.0 |
| Graduate Degree | 8 (15.1%) | 95.0 |
| Total | 53 (100.0%) | 68.0 |
Fertility by Education by Marriage Status in North Pole
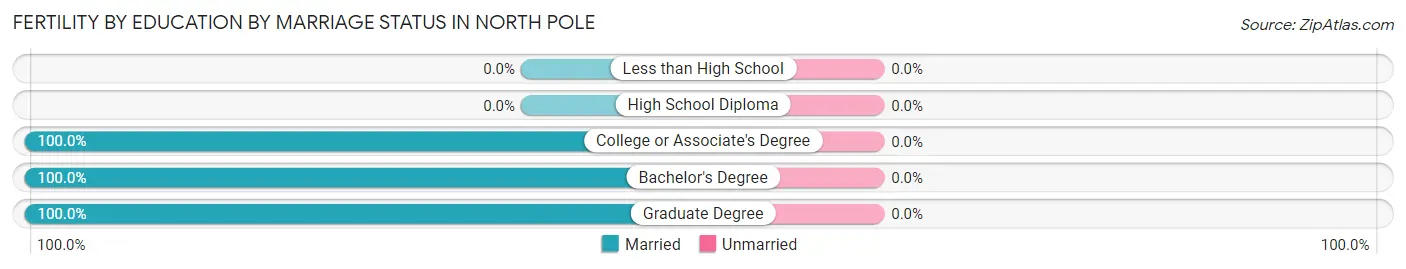
| Educational Attainment | Married | Unmarried |
| Less than High School | 0 (0.0%) | 0 (0.0%) |
| High School Diploma | 0 (0.0%) | 0 (0.0%) |
| College or Associate's Degree | 27 (100.0%) | 0 (0.0%) |
| Bachelor's Degree | 18 (100.0%) | 0 (0.0%) |
| Graduate Degree | 8 (100.0%) | 0 (0.0%) |
| Total | 53 (100.0%) | 0 (0.0%) |
Employment Characteristics in North Pole
Employment by Class of Employer in North Pole
Among the 1,335 employed individuals in North Pole, private company employees (607 | 45.5%), federal government employees (422 | 31.6%), and not-for-profit organizations (126 | 9.4%) make up the most common classes of employment.
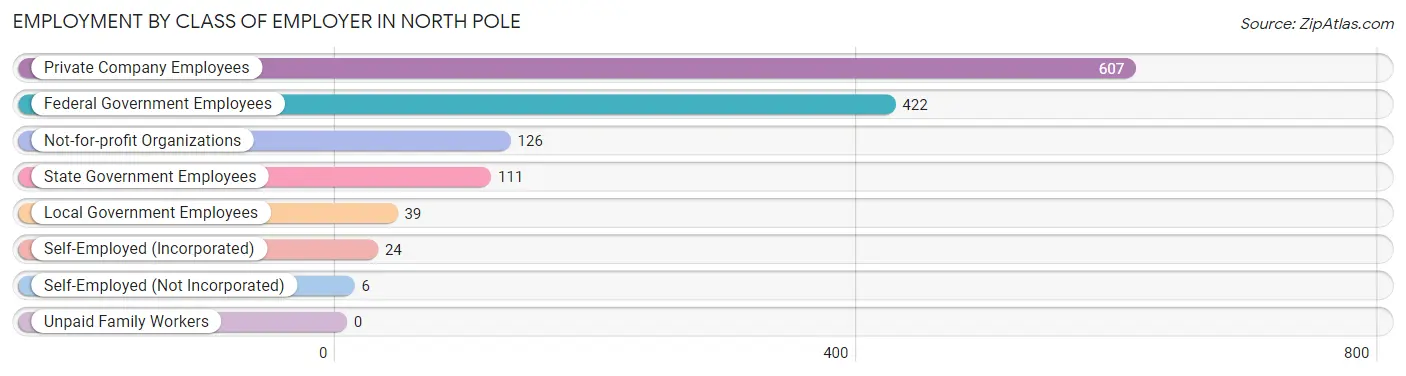
| Employer Class | # Employees | % Employees |
| Private Company Employees | 607 | 45.5% |
| Self-Employed (Incorporated) | 24 | 1.8% |
| Self-Employed (Not Incorporated) | 6 | 0.4% |
| Not-for-profit Organizations | 126 | 9.4% |
| Local Government Employees | 39 | 2.9% |
| State Government Employees | 111 | 8.3% |
| Federal Government Employees | 422 | 31.6% |
| Unpaid Family Workers | 0 | 0.0% |
| Total | 1,335 | 100.0% |
Employment Status by Age in North Pole
According to the labor force statistics for North Pole, out of the total population over 16 years of age (1,877), 77.4% or 1,453 individuals are in the labor force, with 3.8% or 55 of them unemployed. The age group with the highest labor force participation rate is 35 to 44 years, with 93.0% or 437 individuals in the labor force. Within the labor force, the 45 to 54 years age range has the highest percentage of unemployed individuals, with 16.0% or 12 of them being unemployed.
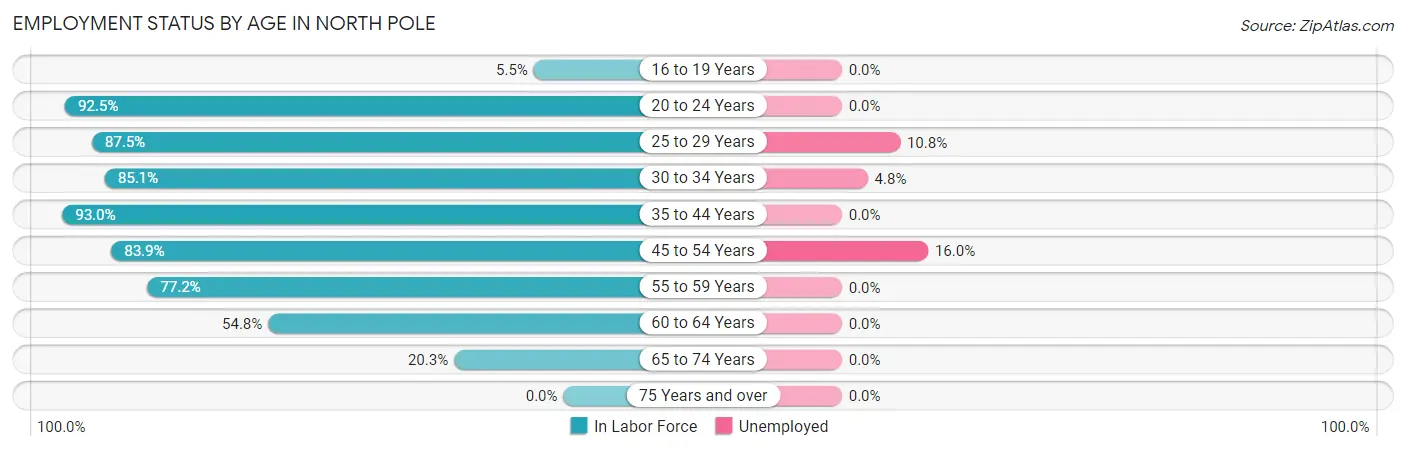
| Age Bracket | In Labor Force | Unemployed |
| 16 to 19 Years | 5 (5.5%) | 0 (0.0%) |
| 20 to 24 Years | 209 (92.5%) | 0 (0.0%) |
| 25 to 29 Years | 307 (87.5%) | 33 (10.8%) |
| 30 to 34 Years | 285 (85.1%) | 14 (4.8%) |
| 35 to 44 Years | 437 (93.0%) | 0 (0.0%) |
| 45 to 54 Years | 78 (83.9%) | 12 (16.0%) |
| 55 to 59 Years | 61 (77.2%) | 0 (0.0%) |
| 60 to 64 Years | 46 (54.8%) | 0 (0.0%) |
| 65 to 74 Years | 25 (20.3%) | 0 (0.0%) |
| 75 Years and over | 0 (0.0%) | 0 (0.0%) |
| Total | 1,453 (77.4%) | 55 (3.8%) |
Employment Status by Educational Attainment in North Pole
According to labor force statistics for North Pole, 86.0% of individuals (1,214) out of the total population between 25 and 64 years of age (1,412) are in the labor force, with 4.7% or 57 of them being unemployed. The group with the highest labor force participation rate are those with the educational attainment of high school diploma, with 88.7% or 368 individuals in the labor force. Within the labor force, individuals with bachelor's degree or higher education have the highest percentage of unemployment, with 5.5% or 20 of them being unemployed.
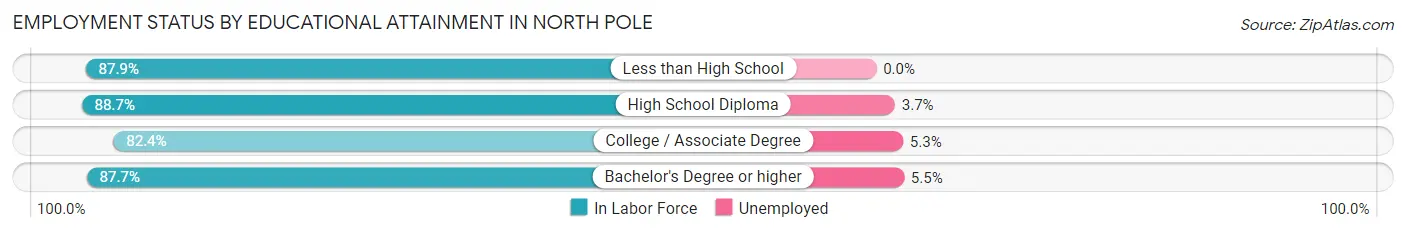
| Educational Attainment | In Labor Force | Unemployed |
| Less than High School | 29 (87.9%) | 0 (0.0%) |
| High School Diploma | 368 (88.7%) | 15 (3.7%) |
| College / Associate Degree | 445 (82.4%) | 29 (5.3%) |
| Bachelor's Degree or higher | 372 (87.7%) | 23 (5.5%) |
| Total | 1,214 (86.0%) | 66 (4.7%) |
Employment Occupations by Sex in North Pole
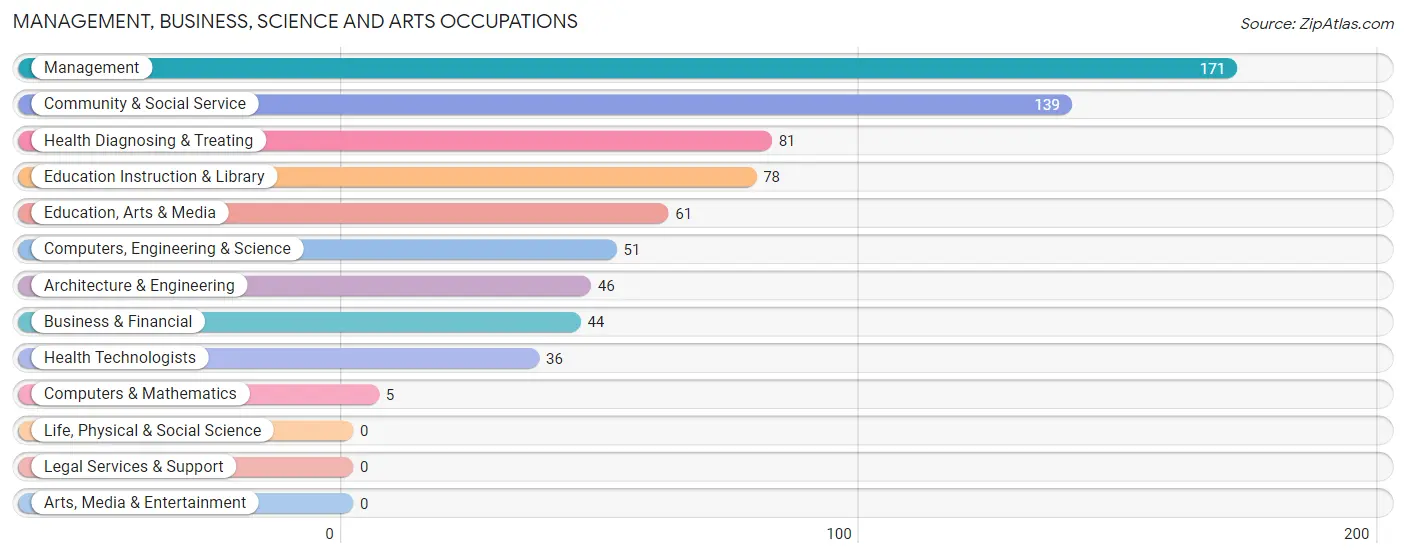
Management, Business, Science and Arts Occupations
The most common Management, Business, Science and Arts occupations in North Pole are Management (171 | 13.9%), Community & Social Service (139 | 11.3%), Health Diagnosing & Treating (81 | 6.6%), Education Instruction & Library (78 | 6.3%), and Education, Arts & Media (61 | 5.0%).
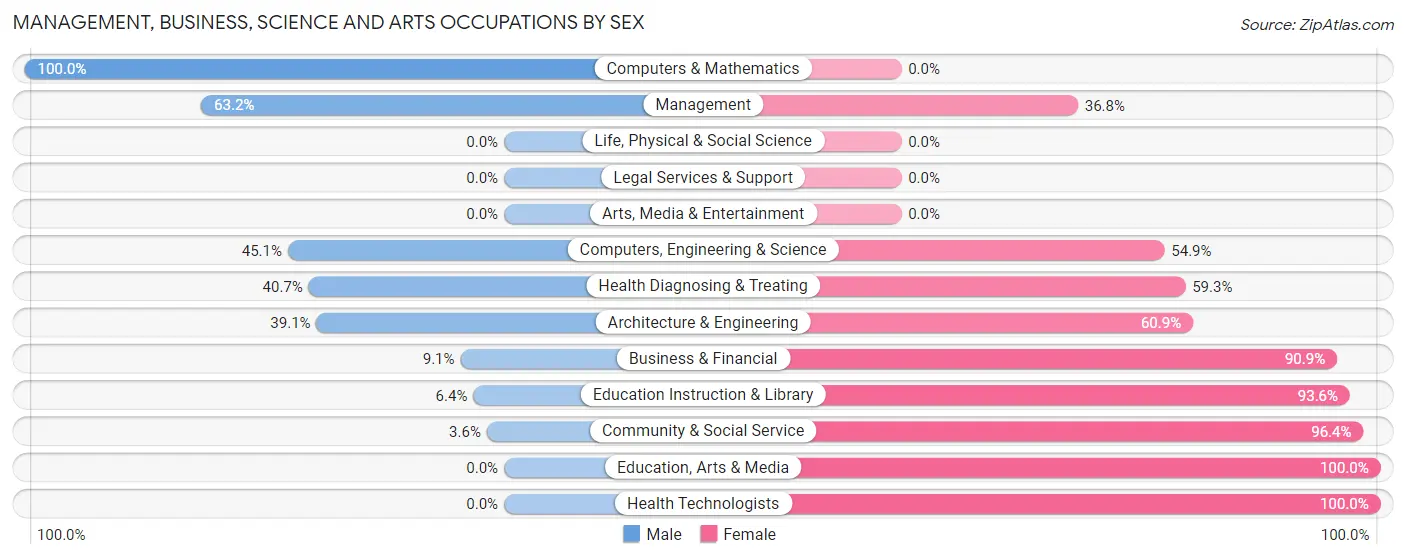
Management, Business, Science and Arts Occupations by Sex
Within the Management, Business, Science and Arts occupations in North Pole, the most male-oriented occupations are Computers & Mathematics (100.0%), Management (63.2%), and Computers, Engineering & Science (45.1%), while the most female-oriented occupations are Education, Arts & Media (100.0%), Health Technologists (100.0%), and Community & Social Service (96.4%).
| Occupation | Male | Female |
| Management | 108 (63.2%) | 63 (36.8%) |
| Business & Financial | 4 (9.1%) | 40 (90.9%) |
| Computers, Engineering & Science | 23 (45.1%) | 28 (54.9%) |
| Computers & Mathematics | 5 (100.0%) | 0 (0.0%) |
| Architecture & Engineering | 18 (39.1%) | 28 (60.9%) |
| Life, Physical & Social Science | 0 (0.0%) | 0 (0.0%) |
| Community & Social Service | 5 (3.6%) | 134 (96.4%) |
| Education, Arts & Media | 0 (0.0%) | 61 (100.0%) |
| Legal Services & Support | 0 (0.0%) | 0 (0.0%) |
| Education Instruction & Library | 5 (6.4%) | 73 (93.6%) |
| Arts, Media & Entertainment | 0 (0.0%) | 0 (0.0%) |
| Health Diagnosing & Treating | 33 (40.7%) | 48 (59.3%) |
| Health Technologists | 0 (0.0%) | 36 (100.0%) |
| Total (Category) | 173 (35.6%) | 313 (64.4%) |
| Total (Overall) | 600 (48.7%) | 632 (51.3%) |
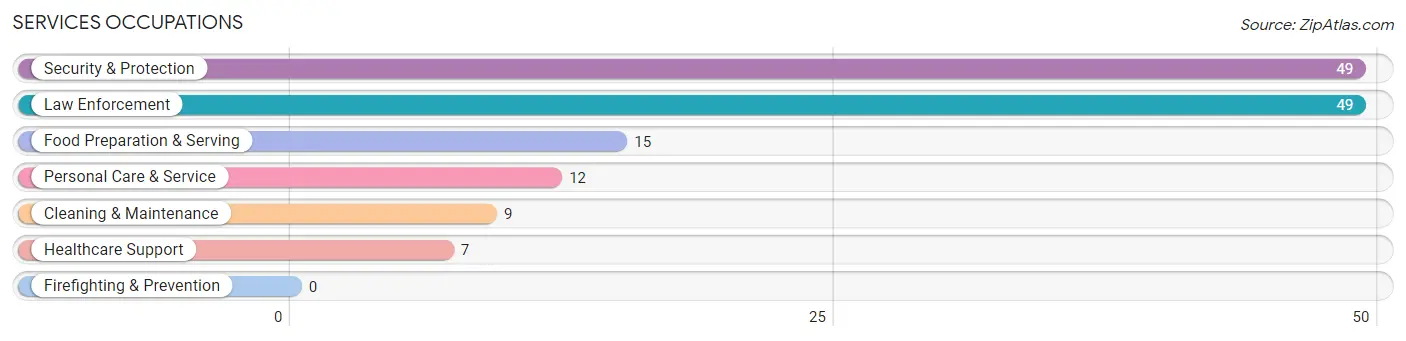
Services Occupations
The most common Services occupations in North Pole are Security & Protection (49 | 4.0%), Law Enforcement (49 | 4.0%), Food Preparation & Serving (15 | 1.2%), Personal Care & Service (12 | 1.0%), and Cleaning & Maintenance (9 | 0.7%).
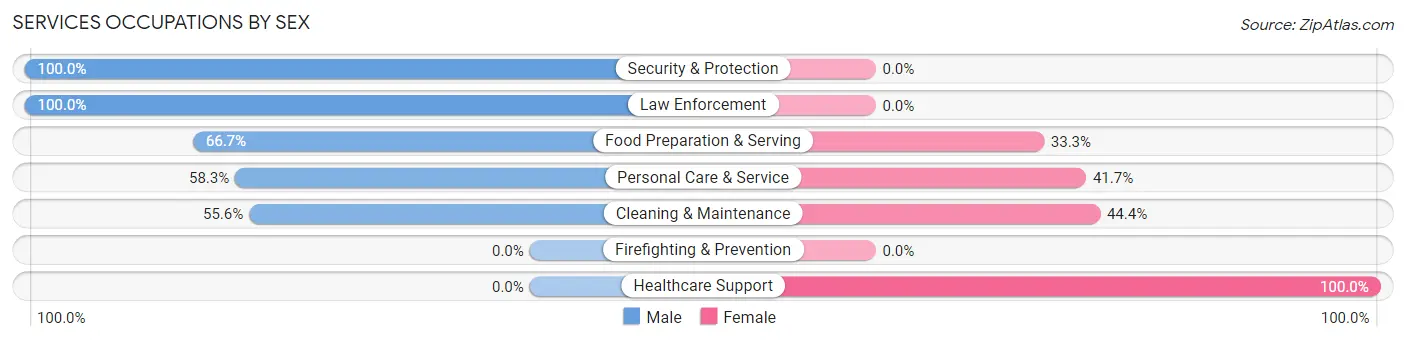
Services Occupations by Sex
Within the Services occupations in North Pole, the most male-oriented occupations are Security & Protection (100.0%), Law Enforcement (100.0%), and Food Preparation & Serving (66.7%), while the most female-oriented occupations are Healthcare Support (100.0%), Cleaning & Maintenance (44.4%), and Personal Care & Service (41.7%).
| Occupation | Male | Female |
| Healthcare Support | 0 (0.0%) | 7 (100.0%) |
| Security & Protection | 49 (100.0%) | 0 (0.0%) |
| Firefighting & Prevention | 0 (0.0%) | 0 (0.0%) |
| Law Enforcement | 49 (100.0%) | 0 (0.0%) |
| Food Preparation & Serving | 10 (66.7%) | 5 (33.3%) |
| Cleaning & Maintenance | 5 (55.6%) | 4 (44.4%) |
| Personal Care & Service | 7 (58.3%) | 5 (41.7%) |
| Total (Category) | 71 (77.2%) | 21 (22.8%) |
| Total (Overall) | 600 (48.7%) | 632 (51.3%) |
Sales and Office Occupations
The most common Sales and Office occupations in North Pole are Office & Administration (312 | 25.3%), and Sales & Related (71 | 5.8%).
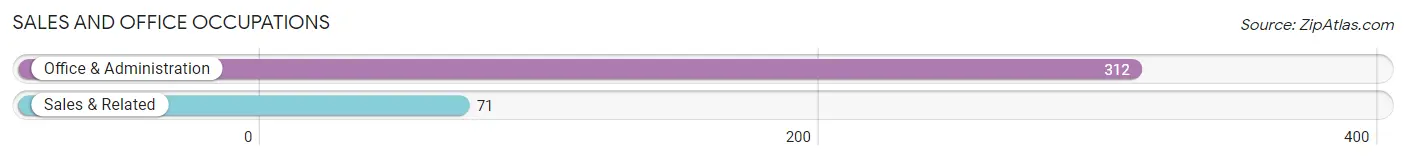
Sales and Office Occupations by Sex
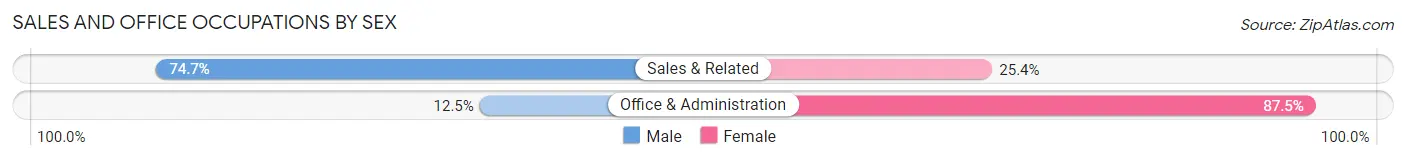
| Occupation | Male | Female |
| Sales & Related | 53 (74.7%) | 18 (25.4%) |
| Office & Administration | 39 (12.5%) | 273 (87.5%) |
| Total (Category) | 92 (24.0%) | 291 (76.0%) |
| Total (Overall) | 600 (48.7%) | 632 (51.3%) |
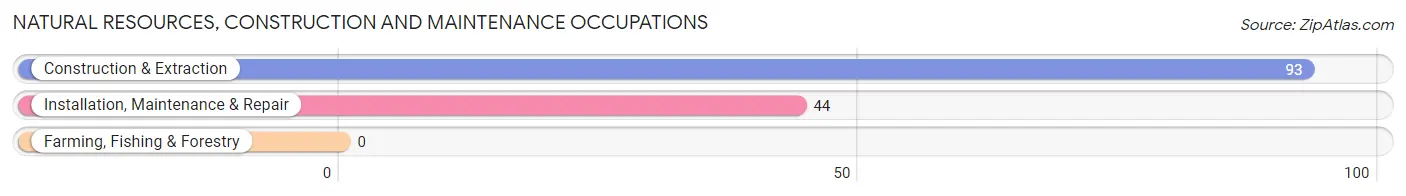
Natural Resources, Construction and Maintenance Occupations
The most common Natural Resources, Construction and Maintenance occupations in North Pole are Construction & Extraction (93 | 7.5%), and Installation, Maintenance & Repair (44 | 3.6%).
Natural Resources, Construction and Maintenance Occupations by Sex
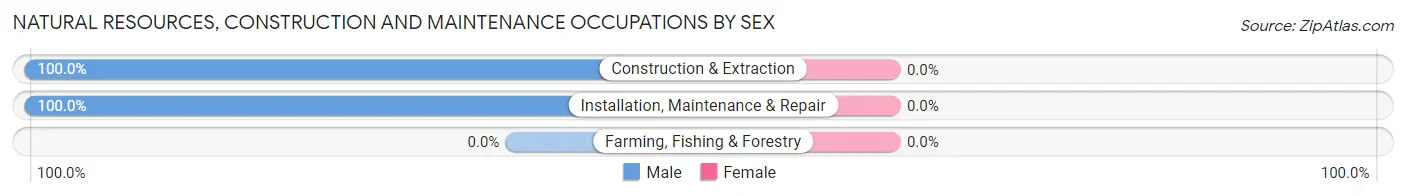
| Occupation | Male | Female |
| Farming, Fishing & Forestry | 0 (0.0%) | 0 (0.0%) |
| Construction & Extraction | 93 (100.0%) | 0 (0.0%) |
| Installation, Maintenance & Repair | 44 (100.0%) | 0 (0.0%) |
| Total (Category) | 137 (100.0%) | 0 (0.0%) |
| Total (Overall) | 600 (48.7%) | 632 (51.3%) |
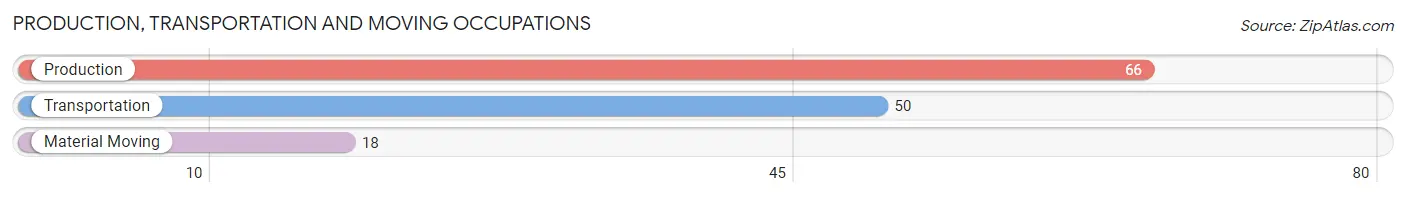
Production, Transportation and Moving Occupations
The most common Production, Transportation and Moving occupations in North Pole are Production (66 | 5.4%), Transportation (50 | 4.1%), and Material Moving (18 | 1.5%).
Production, Transportation and Moving Occupations by Sex
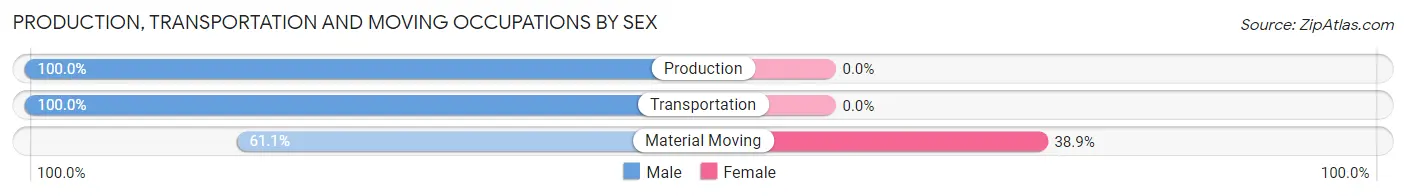
| Occupation | Male | Female |
| Production | 66 (100.0%) | 0 (0.0%) |
| Transportation | 50 (100.0%) | 0 (0.0%) |
| Material Moving | 11 (61.1%) | 7 (38.9%) |
| Total (Category) | 127 (94.8%) | 7 (5.2%) |
| Total (Overall) | 600 (48.7%) | 632 (51.3%) |
Employment Industries by Sex in North Pole
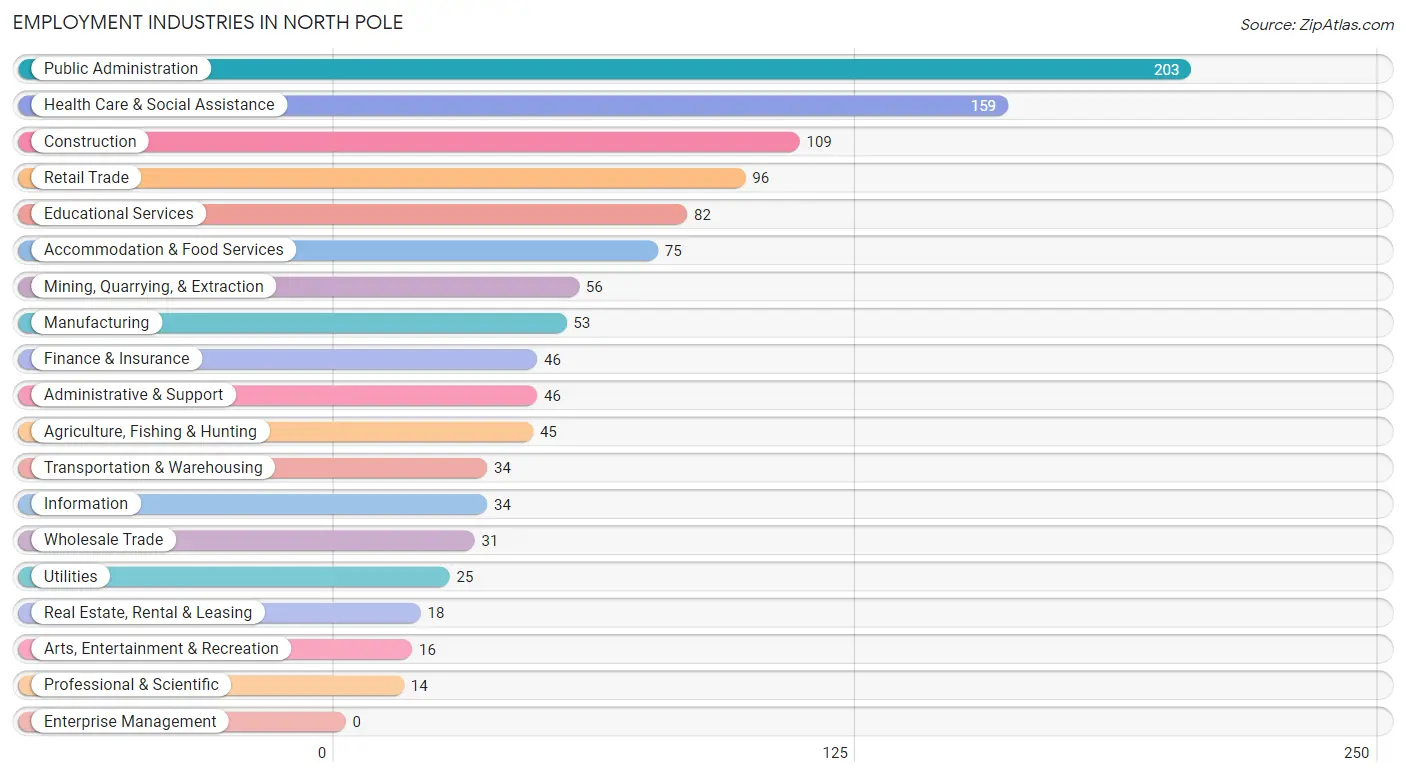
Employment Industries in North Pole
The major employment industries in North Pole include Public Administration (203 | 16.5%), Health Care & Social Assistance (159 | 12.9%), Construction (109 | 8.8%), Retail Trade (96 | 7.8%), and Educational Services (82 | 6.7%).
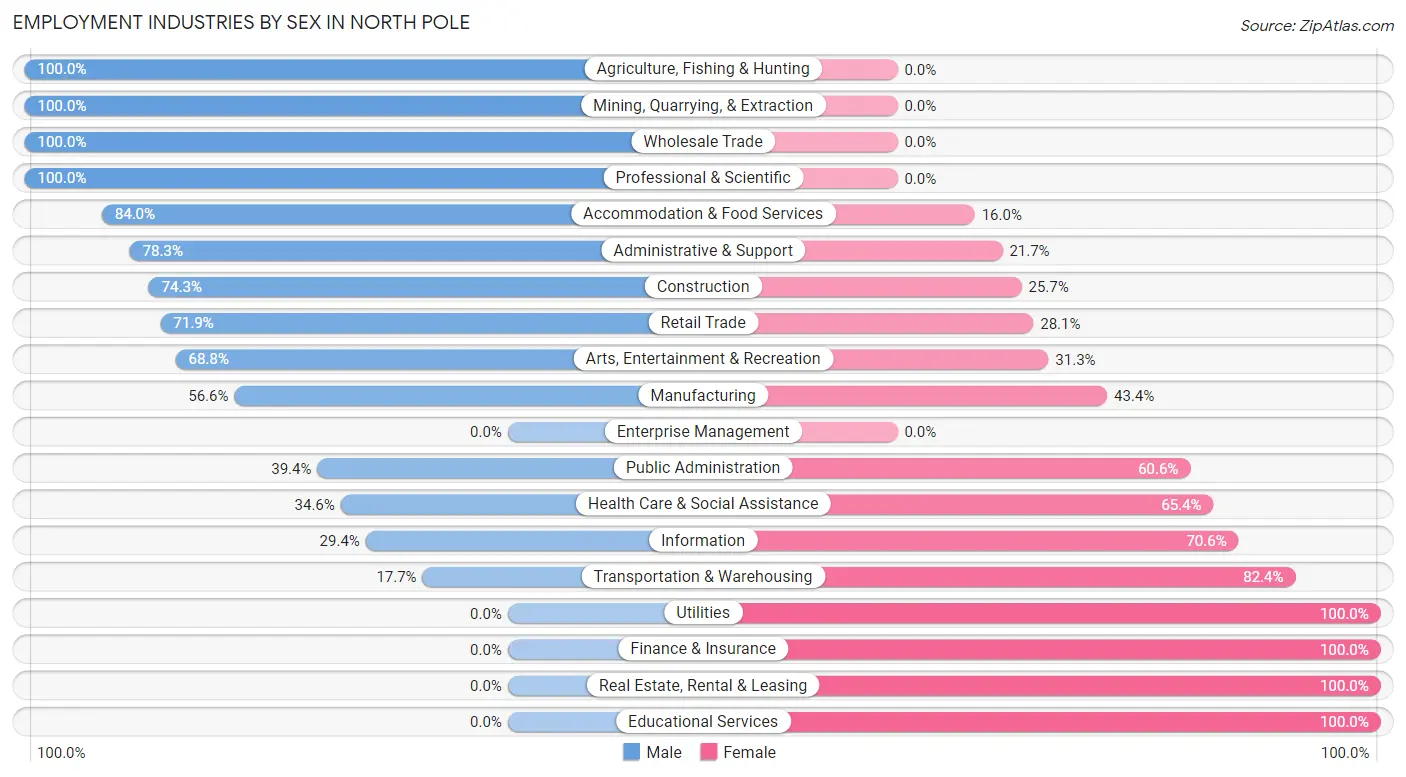
Employment Industries by Sex in North Pole
The North Pole industries that see more men than women are Agriculture, Fishing & Hunting (100.0%), Mining, Quarrying, & Extraction (100.0%), and Wholesale Trade (100.0%), whereas the industries that tend to have a higher number of women are Utilities (100.0%), Finance & Insurance (100.0%), and Real Estate, Rental & Leasing (100.0%).
| Industry | Male | Female |
| Agriculture, Fishing & Hunting | 45 (100.0%) | 0 (0.0%) |
| Mining, Quarrying, & Extraction | 56 (100.0%) | 0 (0.0%) |
| Construction | 81 (74.3%) | 28 (25.7%) |
| Manufacturing | 30 (56.6%) | 23 (43.4%) |
| Wholesale Trade | 31 (100.0%) | 0 (0.0%) |
| Retail Trade | 69 (71.9%) | 27 (28.1%) |
| Transportation & Warehousing | 6 (17.6%) | 28 (82.4%) |
| Utilities | 0 (0.0%) | 25 (100.0%) |
| Information | 10 (29.4%) | 24 (70.6%) |
| Finance & Insurance | 0 (0.0%) | 46 (100.0%) |
| Real Estate, Rental & Leasing | 0 (0.0%) | 18 (100.0%) |
| Professional & Scientific | 14 (100.0%) | 0 (0.0%) |
| Enterprise Management | 0 (0.0%) | 0 (0.0%) |
| Administrative & Support | 36 (78.3%) | 10 (21.7%) |
| Educational Services | 0 (0.0%) | 82 (100.0%) |
| Health Care & Social Assistance | 55 (34.6%) | 104 (65.4%) |
| Arts, Entertainment & Recreation | 11 (68.8%) | 5 (31.2%) |
| Accommodation & Food Services | 63 (84.0%) | 12 (16.0%) |
| Public Administration | 80 (39.4%) | 123 (60.6%) |
| Total | 600 (48.7%) | 632 (51.3%) |
Education in North Pole
School Enrollment in North Pole
The most common levels of schooling among the 874 students in North Pole are elementary school (322 | 36.8%), middle school (182 | 20.8%), and college / undergraduate (152 | 17.4%).
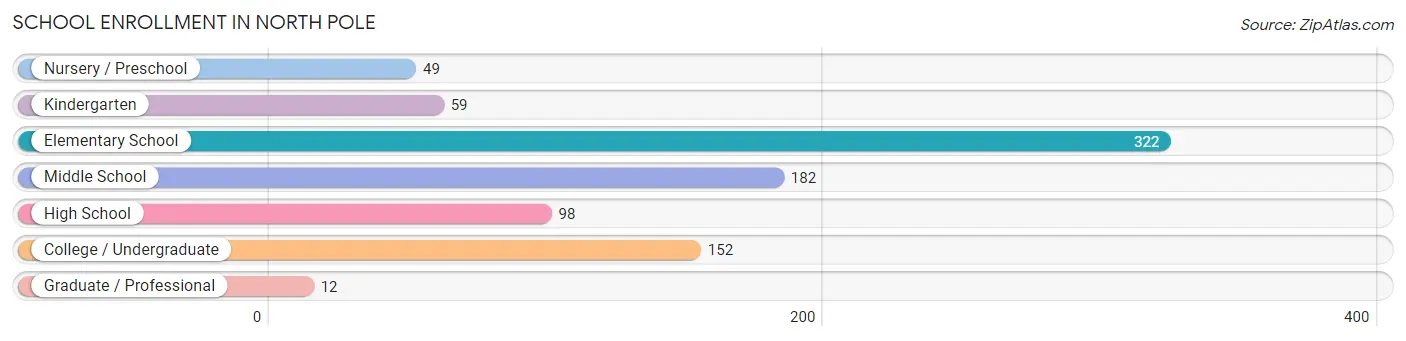
| School Level | # Students | % Students |
| Nursery / Preschool | 49 | 5.6% |
| Kindergarten | 59 | 6.8% |
| Elementary School | 322 | 36.8% |
| Middle School | 182 | 20.8% |
| High School | 98 | 11.2% |
| College / Undergraduate | 152 | 17.4% |
| Graduate / Professional | 12 | 1.4% |
| Total | 874 | 100.0% |
School Enrollment by Age by Funding Source in North Pole
Out of a total of 874 students who are enrolled in schools in North Pole, 139 (15.9%) attend a private institution, while the remaining 735 (84.1%) are enrolled in public schools. The age group of 35 years and over has the highest likelihood of being enrolled in private schools, with 7 (100.0% in the age bracket) enrolled. Conversely, the age group of 15 to 17 year olds has the lowest likelihood of being enrolled in a private school, with 58 (100.0% in the age bracket) attending a public institution.
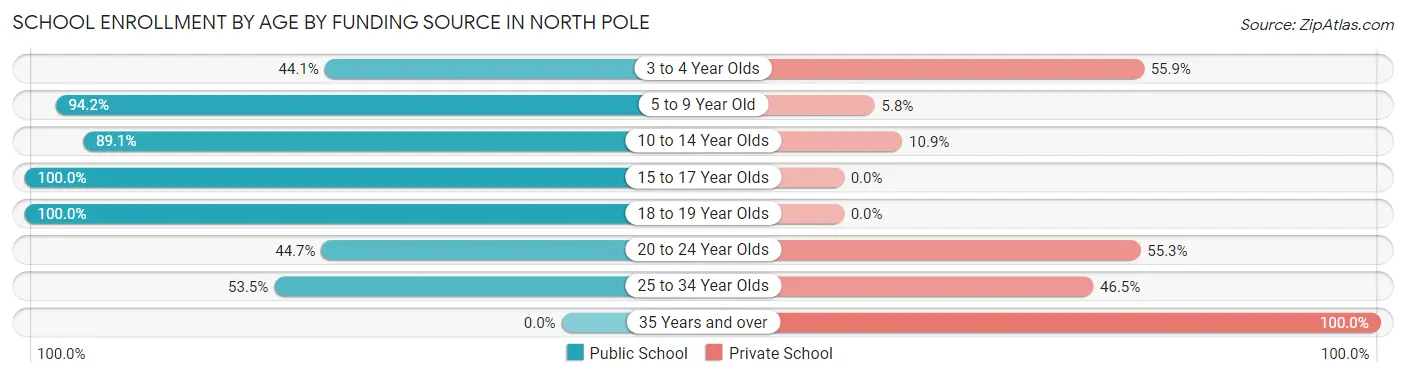
| Age Bracket | Public School | Private School |
| 3 to 4 Year Olds | 15 (44.1%) | 19 (55.9%) |
| 5 to 9 Year Old | 311 (94.2%) | 19 (5.8%) |
| 10 to 14 Year Olds | 221 (89.1%) | 27 (10.9%) |
| 15 to 17 Year Olds | 58 (100.0%) | 0 (0.0%) |
| 18 to 19 Year Olds | 60 (100.0%) | 0 (0.0%) |
| 20 to 24 Year Olds | 17 (44.7%) | 21 (55.3%) |
| 25 to 34 Year Olds | 53 (53.5%) | 46 (46.5%) |
| 35 Years and over | 0 (0.0%) | 7 (100.0%) |
| Total | 735 (84.1%) | 139 (15.9%) |
Educational Attainment by Field of Study in North Pole
Arts & humanities (100 | 20.8%), business (86 | 17.9%), liberal arts & history (79 | 16.4%), science & technology (52 | 10.8%), and social sciences (46 | 9.6%) are the most common fields of study among 481 individuals in North Pole who have obtained a bachelor's degree or higher.
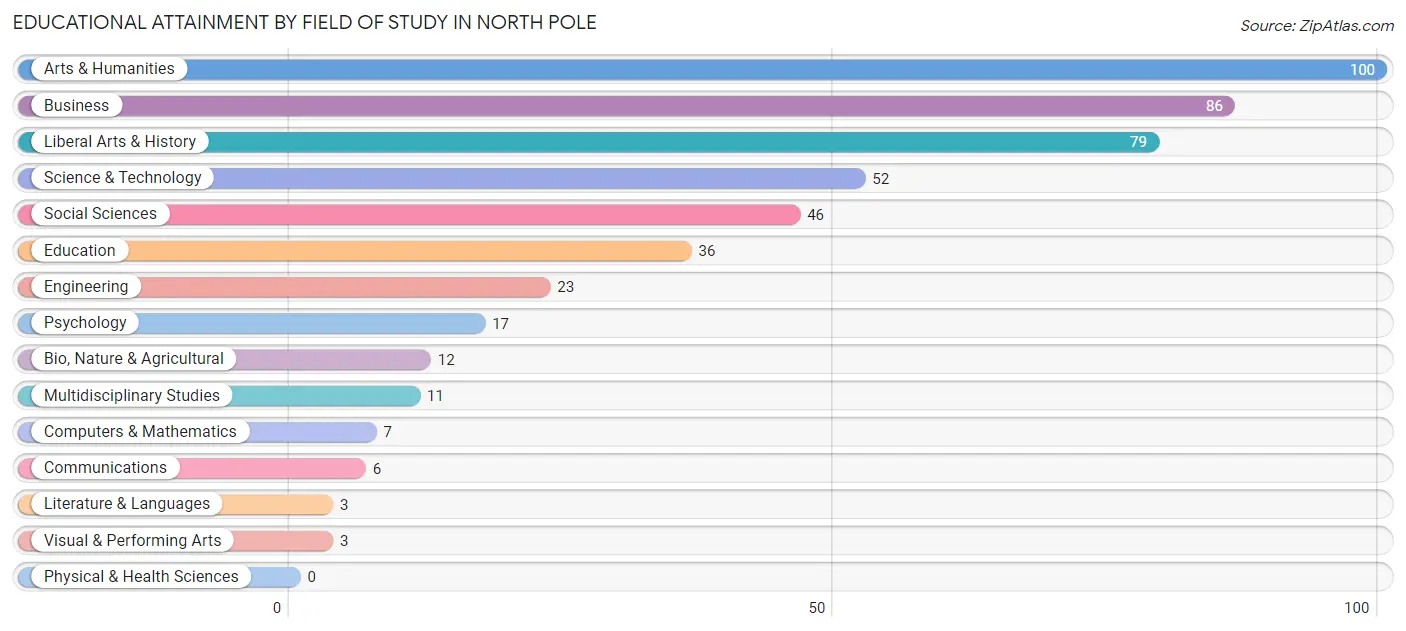
| Field of Study | # Graduates | % Graduates |
| Computers & Mathematics | 7 | 1.5% |
| Bio, Nature & Agricultural | 12 | 2.5% |
| Physical & Health Sciences | 0 | 0.0% |
| Psychology | 17 | 3.5% |
| Social Sciences | 46 | 9.6% |
| Engineering | 23 | 4.8% |
| Multidisciplinary Studies | 11 | 2.3% |
| Science & Technology | 52 | 10.8% |
| Business | 86 | 17.9% |
| Education | 36 | 7.5% |
| Literature & Languages | 3 | 0.6% |
| Liberal Arts & History | 79 | 16.4% |
| Visual & Performing Arts | 3 | 0.6% |
| Communications | 6 | 1.3% |
| Arts & Humanities | 100 | 20.8% |
| Total | 481 | 100.0% |
Transportation & Commute in North Pole
Vehicle Availability by Sex in North Pole
The most prevalent vehicle ownership categories in North Pole are males with 2 vehicles (293, accounting for 38.3%) and females with 2 vehicles (220, making up 51.5%).
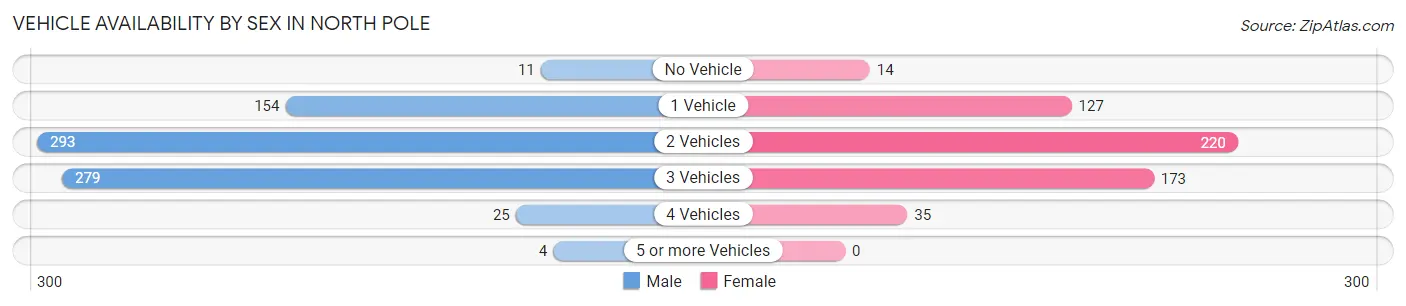
| Vehicles Available | Male | Female |
| No Vehicle | 11 (1.4%) | 14 (2.5%) |
| 1 Vehicle | 154 (20.1%) | 127 (22.3%) |
| 2 Vehicles | 293 (38.3%) | 220 (38.7%) |
| 3 Vehicles | 279 (36.4%) | 173 (30.4%) |
| 4 Vehicles | 25 (3.3%) | 35 (6.1%) |
| 5 or more Vehicles | 4 (0.5%) | 0 (0.0%) |
| Total | 766 (100.0%) | 569 (100.0%) |
Commute Time in North Pole
The most frequently occuring commute durations in North Pole are 20 to 24 minutes (354 commuters, 26.6%), 30 to 34 minutes (249 commuters, 18.7%), and 25 to 29 minutes (231 commuters, 17.4%).
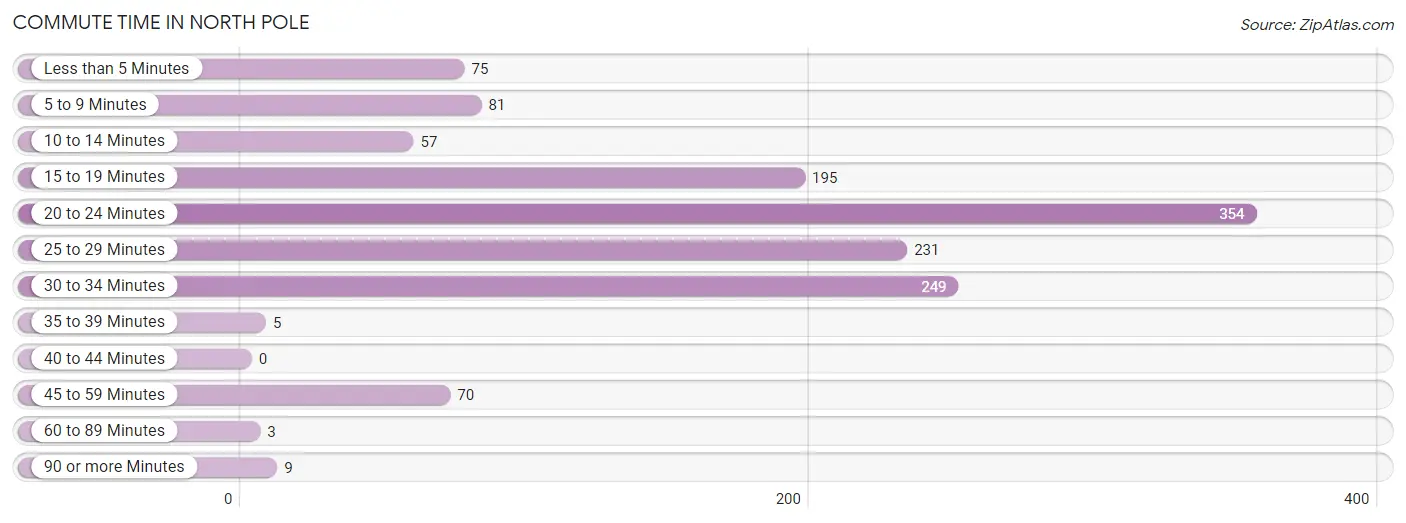
| Commute Time | # Commuters | % Commuters |
| Less than 5 Minutes | 75 | 5.6% |
| 5 to 9 Minutes | 81 | 6.1% |
| 10 to 14 Minutes | 57 | 4.3% |
| 15 to 19 Minutes | 195 | 14.7% |
| 20 to 24 Minutes | 354 | 26.6% |
| 25 to 29 Minutes | 231 | 17.4% |
| 30 to 34 Minutes | 249 | 18.7% |
| 35 to 39 Minutes | 5 | 0.4% |
| 40 to 44 Minutes | 0 | 0.0% |
| 45 to 59 Minutes | 70 | 5.3% |
| 60 to 89 Minutes | 3 | 0.2% |
| 90 or more Minutes | 9 | 0.7% |
Commute Time by Sex in North Pole
The most common commute times in North Pole are 20 to 24 minutes (228 commuters, 29.8%) for males and 30 to 34 minutes (147 commuters, 26.1%) for females.
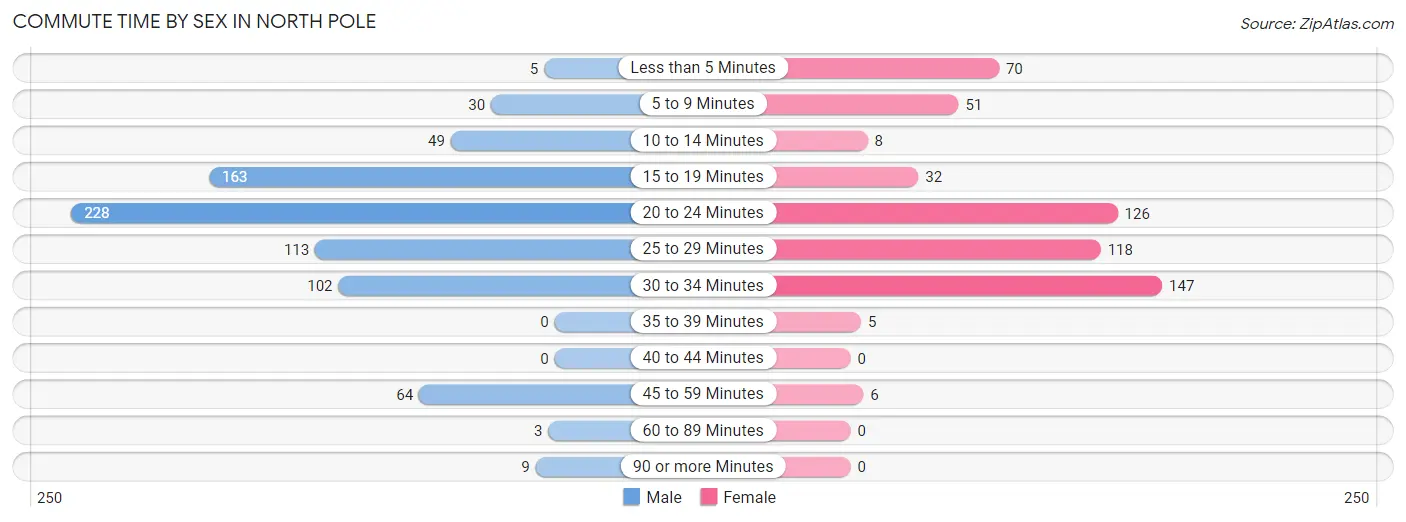
| Commute Time | Male | Female |
| Less than 5 Minutes | 5 (0.6%) | 70 (12.4%) |
| 5 to 9 Minutes | 30 (3.9%) | 51 (9.1%) |
| 10 to 14 Minutes | 49 (6.4%) | 8 (1.4%) |
| 15 to 19 Minutes | 163 (21.3%) | 32 (5.7%) |
| 20 to 24 Minutes | 228 (29.8%) | 126 (22.4%) |
| 25 to 29 Minutes | 113 (14.7%) | 118 (21.0%) |
| 30 to 34 Minutes | 102 (13.3%) | 147 (26.1%) |
| 35 to 39 Minutes | 0 (0.0%) | 5 (0.9%) |
| 40 to 44 Minutes | 0 (0.0%) | 0 (0.0%) |
| 45 to 59 Minutes | 64 (8.4%) | 6 (1.1%) |
| 60 to 89 Minutes | 3 (0.4%) | 0 (0.0%) |
| 90 or more Minutes | 9 (1.2%) | 0 (0.0%) |
Time of Departure to Work by Sex in North Pole
The most frequent times of departure to work in North Pole are 8:00 AM to 8:29 AM (86, 11.2%) for males and 7:00 AM to 7:29 AM (139, 24.7%) for females.
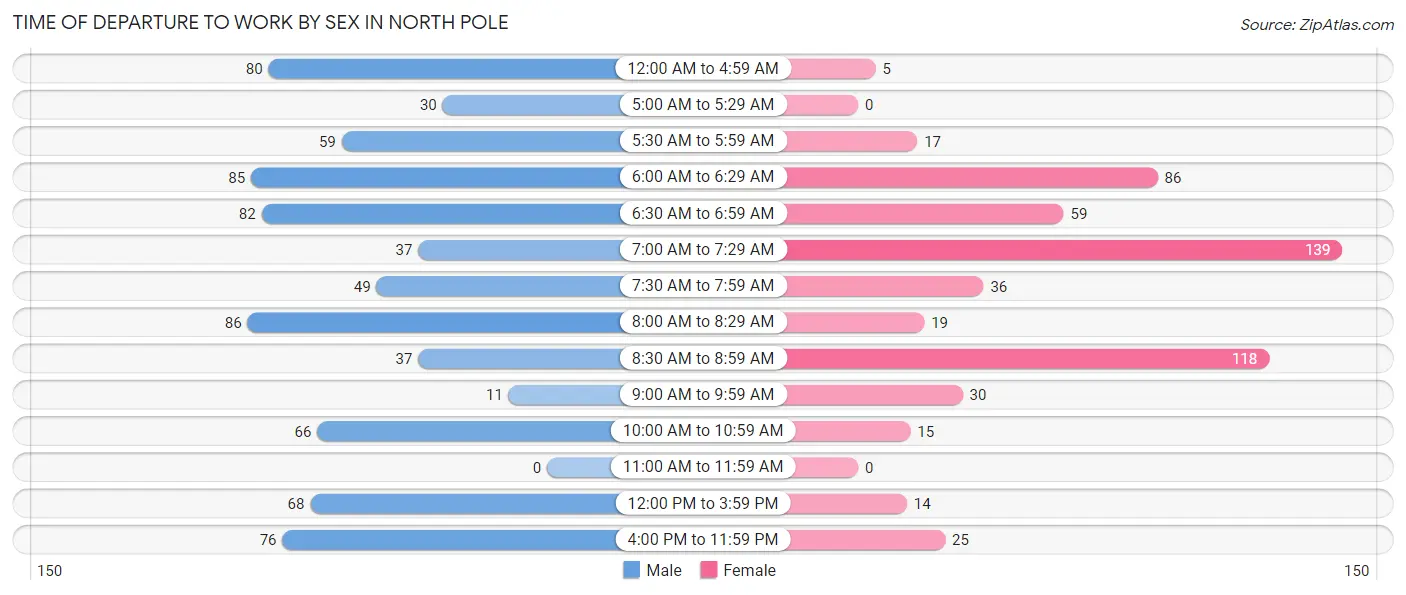
| Time of Departure | Male | Female |
| 12:00 AM to 4:59 AM | 80 (10.4%) | 5 (0.9%) |
| 5:00 AM to 5:29 AM | 30 (3.9%) | 0 (0.0%) |
| 5:30 AM to 5:59 AM | 59 (7.7%) | 17 (3.0%) |
| 6:00 AM to 6:29 AM | 85 (11.1%) | 86 (15.3%) |
| 6:30 AM to 6:59 AM | 82 (10.7%) | 59 (10.5%) |
| 7:00 AM to 7:29 AM | 37 (4.8%) | 139 (24.7%) |
| 7:30 AM to 7:59 AM | 49 (6.4%) | 36 (6.4%) |
| 8:00 AM to 8:29 AM | 86 (11.2%) | 19 (3.4%) |
| 8:30 AM to 8:59 AM | 37 (4.8%) | 118 (21.0%) |
| 9:00 AM to 9:59 AM | 11 (1.4%) | 30 (5.3%) |
| 10:00 AM to 10:59 AM | 66 (8.6%) | 15 (2.7%) |
| 11:00 AM to 11:59 AM | 0 (0.0%) | 0 (0.0%) |
| 12:00 PM to 3:59 PM | 68 (8.9%) | 14 (2.5%) |
| 4:00 PM to 11:59 PM | 76 (9.9%) | 25 (4.4%) |
| Total | 766 (100.0%) | 563 (100.0%) |
Housing Occupancy in North Pole
Occupancy by Ownership in North Pole
Of the total 1,013 dwellings in North Pole, owner-occupied units account for 554 (54.7%), while renter-occupied units make up 459 (45.3%).
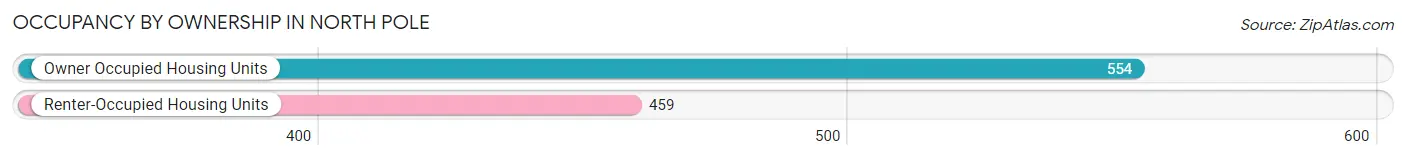
| Occupancy | # Housing Units | % Housing Units |
| Owner Occupied Housing Units | 554 | 54.7% |
| Renter-Occupied Housing Units | 459 | 45.3% |
| Total Occupied Housing Units | 1,013 | 100.0% |
Occupancy by Household Size in North Pole
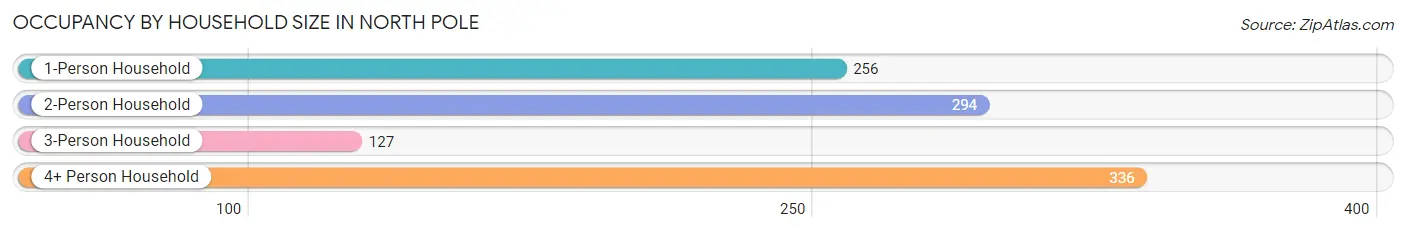
| Household Size | # Housing Units | % Housing Units |
| 1-Person Household | 256 | 25.3% |
| 2-Person Household | 294 | 29.0% |
| 3-Person Household | 127 | 12.5% |
| 4+ Person Household | 336 | 33.2% |
| Total Housing Units | 1,013 | 100.0% |
Occupancy by Ownership by Household Size in North Pole
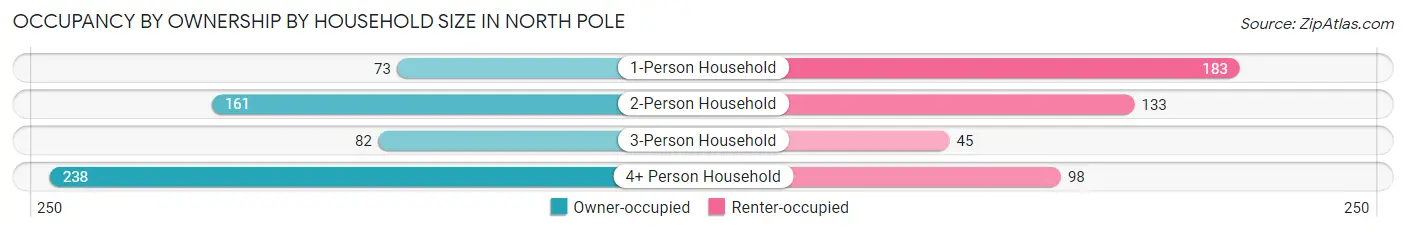
| Household Size | Owner-occupied | Renter-occupied |
| 1-Person Household | 73 (28.5%) | 183 (71.5%) |
| 2-Person Household | 161 (54.8%) | 133 (45.2%) |
| 3-Person Household | 82 (64.6%) | 45 (35.4%) |
| 4+ Person Household | 238 (70.8%) | 98 (29.2%) |
| Total Housing Units | 554 (54.7%) | 459 (45.3%) |
Occupancy by Educational Attainment in North Pole
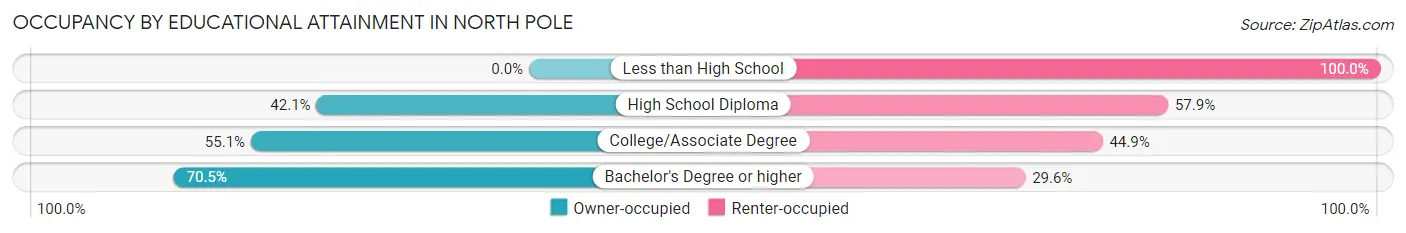
| Household Size | Owner-occupied | Renter-occupied |
| Less than High School | 0 (0.0%) | 11 (100.0%) |
| High School Diploma | 126 (42.1%) | 173 (57.9%) |
| College/Associate Degree | 242 (55.1%) | 197 (44.9%) |
| Bachelor's Degree or higher | 186 (70.5%) | 78 (29.5%) |
Occupancy by Age of Householder in North Pole
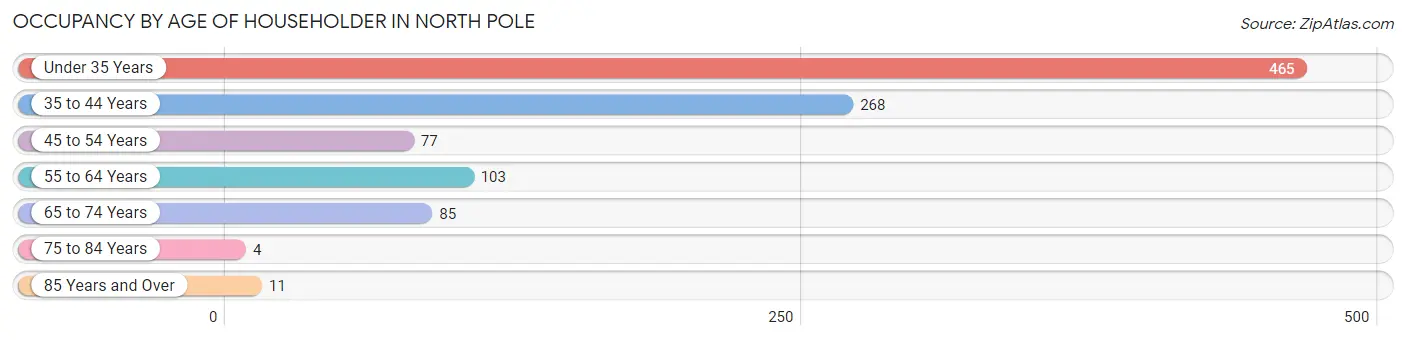
| Age Bracket | # Households | % Households |
| Under 35 Years | 465 | 45.9% |
| 35 to 44 Years | 268 | 26.5% |
| 45 to 54 Years | 77 | 7.6% |
| 55 to 64 Years | 103 | 10.2% |
| 65 to 74 Years | 85 | 8.4% |
| 75 to 84 Years | 4 | 0.4% |
| 85 Years and Over | 11 | 1.1% |
| Total | 1,013 | 100.0% |
Housing Finances in North Pole
Median Income by Occupancy in North Pole
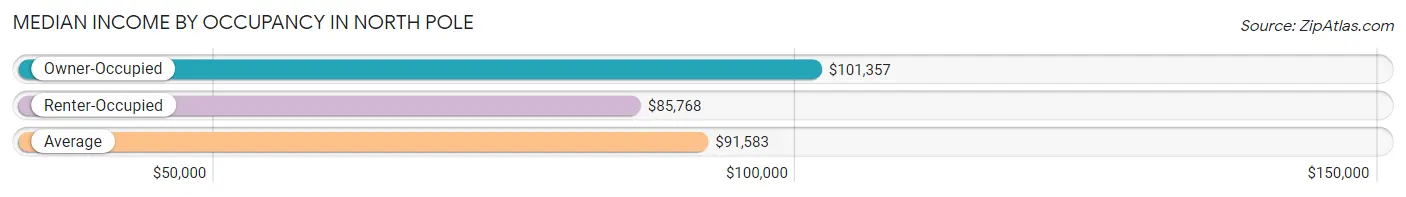
| Occupancy Type | # Households | Median Income |
| Owner-Occupied | 554 (54.7%) | $101,357 |
| Renter-Occupied | 459 (45.3%) | $85,768 |
| Average | 1,013 (100.0%) | $91,583 |
Occupancy by Householder Income Bracket in North Pole
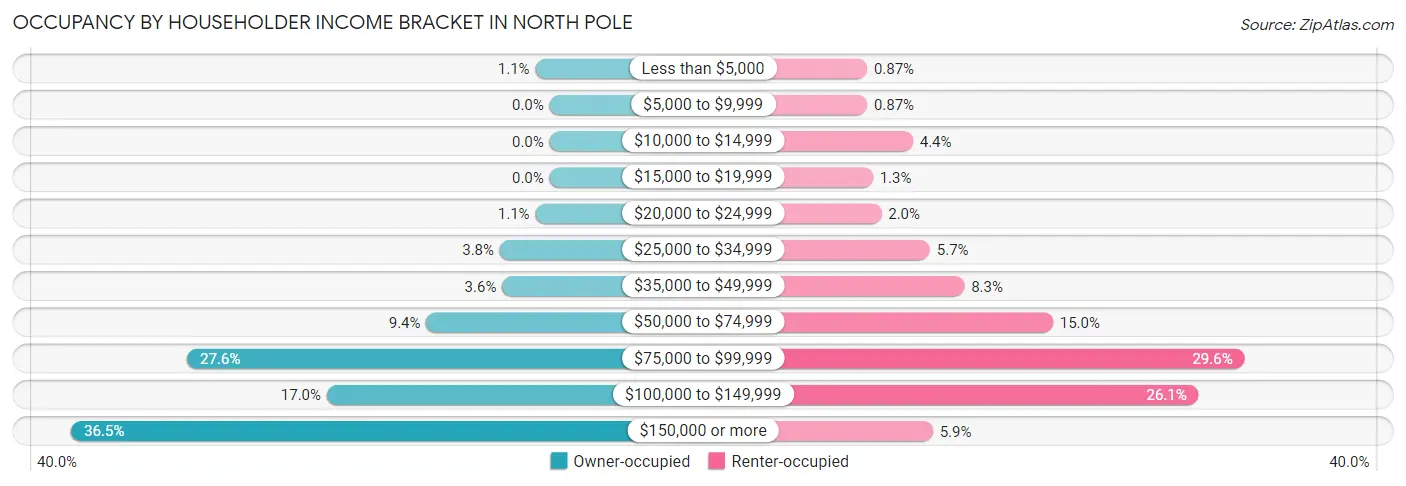
| Income Bracket | Owner-occupied | Renter-occupied |
| Less than $5,000 | 6 (1.1%) | 4 (0.9%) |
| $5,000 to $9,999 | 0 (0.0%) | 4 (0.9%) |
| $10,000 to $14,999 | 0 (0.0%) | 20 (4.4%) |
| $15,000 to $19,999 | 0 (0.0%) | 6 (1.3%) |
| $20,000 to $24,999 | 6 (1.1%) | 9 (2.0%) |
| $25,000 to $34,999 | 21 (3.8%) | 26 (5.7%) |
| $35,000 to $49,999 | 20 (3.6%) | 38 (8.3%) |
| $50,000 to $74,999 | 52 (9.4%) | 69 (15.0%) |
| $75,000 to $99,999 | 153 (27.6%) | 136 (29.6%) |
| $100,000 to $149,999 | 94 (17.0%) | 120 (26.1%) |
| $150,000 or more | 202 (36.5%) | 27 (5.9%) |
| Total | 554 (100.0%) | 459 (100.0%) |
Monthly Housing Cost Tiers in North Pole
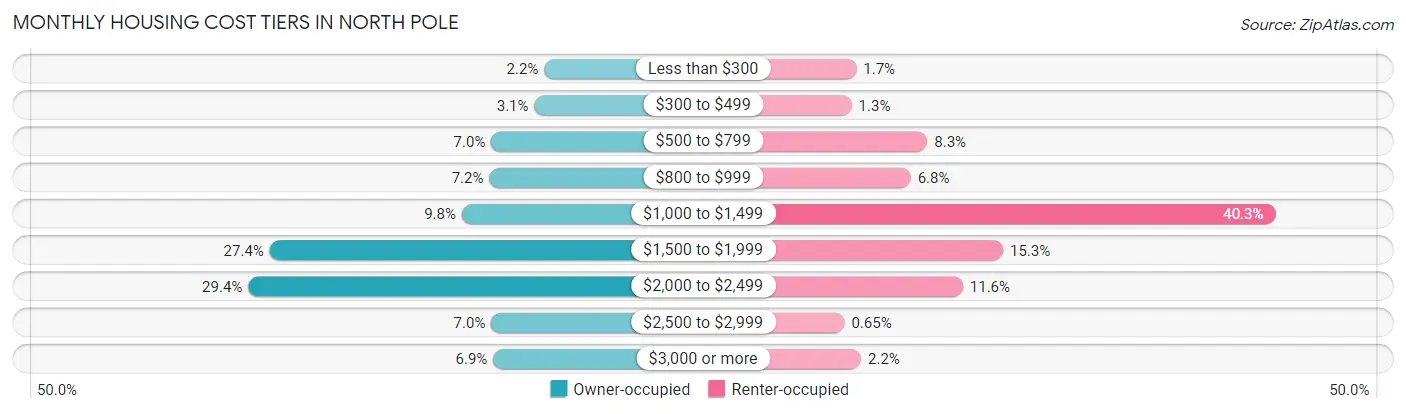
| Monthly Cost | Owner-occupied | Renter-occupied |
| Less than $300 | 12 (2.2%) | 8 (1.7%) |
| $300 to $499 | 17 (3.1%) | 6 (1.3%) |
| $500 to $799 | 39 (7.0%) | 38 (8.3%) |
| $800 to $999 | 40 (7.2%) | 31 (6.8%) |
| $1,000 to $1,499 | 54 (9.8%) | 185 (40.3%) |
| $1,500 to $1,999 | 152 (27.4%) | 70 (15.2%) |
| $2,000 to $2,499 | 163 (29.4%) | 53 (11.6%) |
| $2,500 to $2,999 | 39 (7.0%) | 3 (0.6%) |
| $3,000 or more | 38 (6.9%) | 10 (2.2%) |
| Total | 554 (100.0%) | 459 (100.0%) |
Physical Housing Characteristics in North Pole
Housing Structures in North Pole
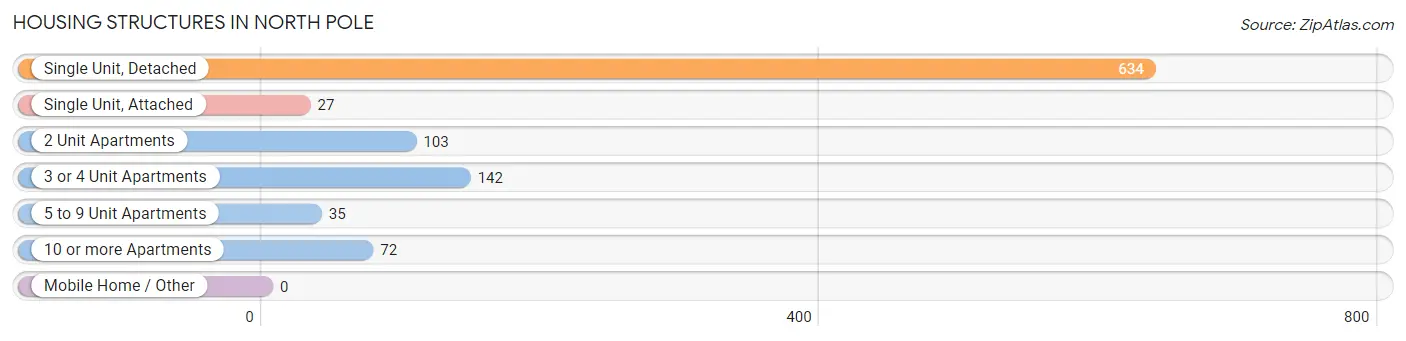
| Structure Type | # Housing Units | % Housing Units |
| Single Unit, Detached | 634 | 62.6% |
| Single Unit, Attached | 27 | 2.7% |
| 2 Unit Apartments | 103 | 10.2% |
| 3 or 4 Unit Apartments | 142 | 14.0% |
| 5 to 9 Unit Apartments | 35 | 3.5% |
| 10 or more Apartments | 72 | 7.1% |
| Mobile Home / Other | 0 | 0.0% |
| Total | 1,013 | 100.0% |
Housing Structures by Occupancy in North Pole
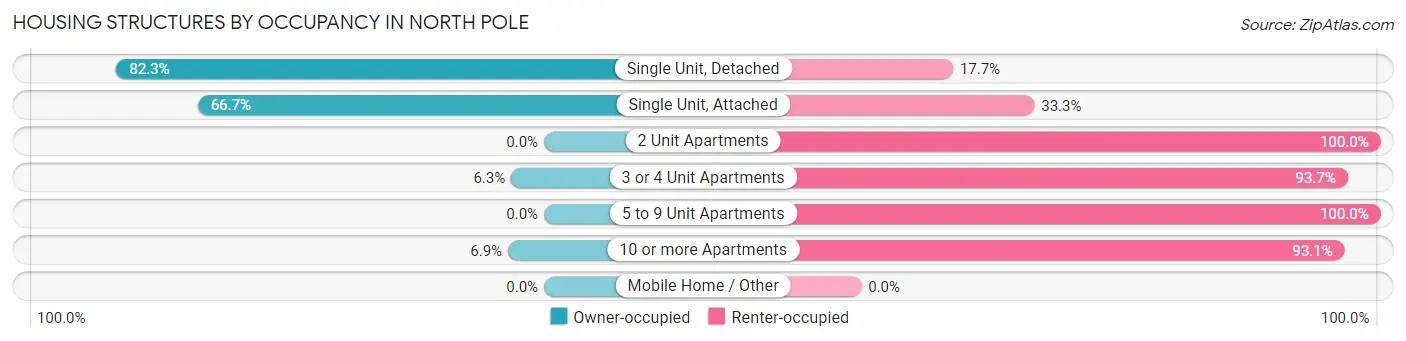
| Structure Type | Owner-occupied | Renter-occupied |
| Single Unit, Detached | 522 (82.3%) | 112 (17.7%) |
| Single Unit, Attached | 18 (66.7%) | 9 (33.3%) |
| 2 Unit Apartments | 0 (0.0%) | 103 (100.0%) |
| 3 or 4 Unit Apartments | 9 (6.3%) | 133 (93.7%) |
| 5 to 9 Unit Apartments | 0 (0.0%) | 35 (100.0%) |
| 10 or more Apartments | 5 (6.9%) | 67 (93.1%) |
| Mobile Home / Other | 0 (0.0%) | 0 (0.0%) |
| Total | 554 (54.7%) | 459 (45.3%) |
Housing Structures by Number of Rooms in North Pole
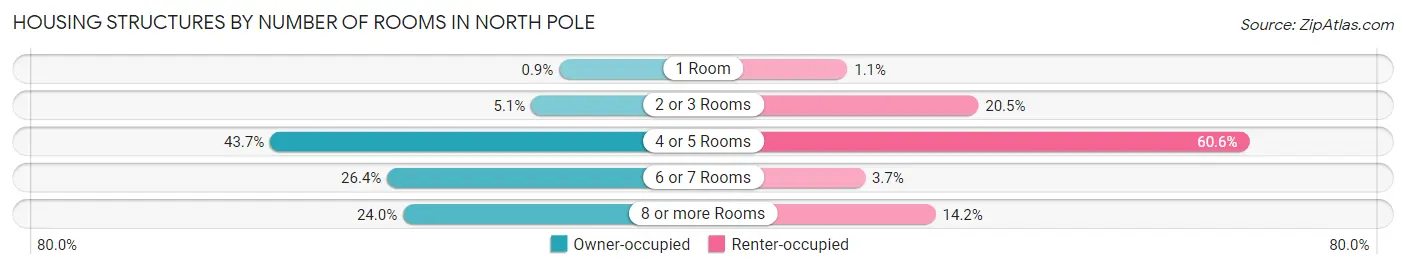
| Number of Rooms | Owner-occupied | Renter-occupied |
| 1 Room | 5 (0.9%) | 5 (1.1%) |
| 2 or 3 Rooms | 28 (5.1%) | 94 (20.5%) |
| 4 or 5 Rooms | 242 (43.7%) | 278 (60.6%) |
| 6 or 7 Rooms | 146 (26.4%) | 17 (3.7%) |
| 8 or more Rooms | 133 (24.0%) | 65 (14.2%) |
| Total | 554 (100.0%) | 459 (100.0%) |
Housing Structure by Heating Type in North Pole
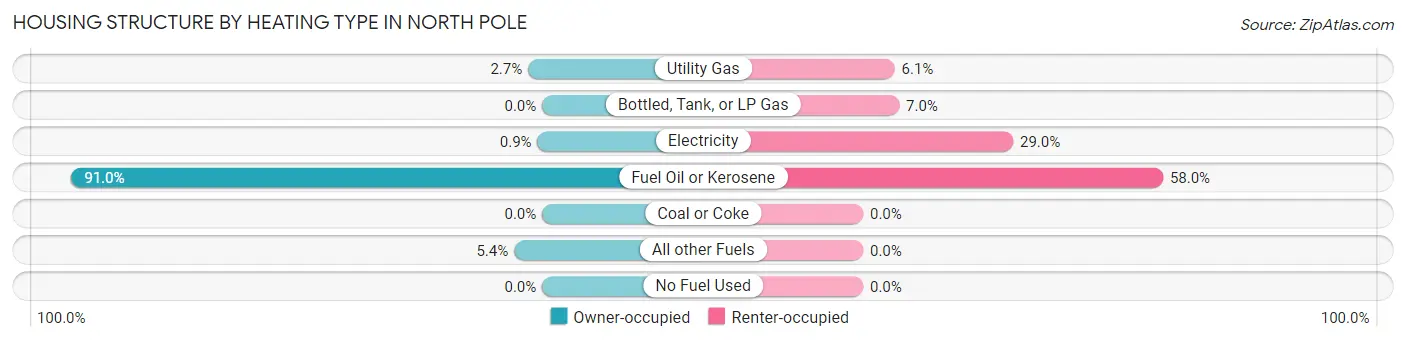
| Heating Type | Owner-occupied | Renter-occupied |
| Utility Gas | 15 (2.7%) | 28 (6.1%) |
| Bottled, Tank, or LP Gas | 0 (0.0%) | 32 (7.0%) |
| Electricity | 5 (0.9%) | 133 (29.0%) |
| Fuel Oil or Kerosene | 504 (91.0%) | 266 (58.0%) |
| Coal or Coke | 0 (0.0%) | 0 (0.0%) |
| All other Fuels | 30 (5.4%) | 0 (0.0%) |
| No Fuel Used | 0 (0.0%) | 0 (0.0%) |
| Total | 554 (100.0%) | 459 (100.0%) |
Household Vehicle Usage in North Pole
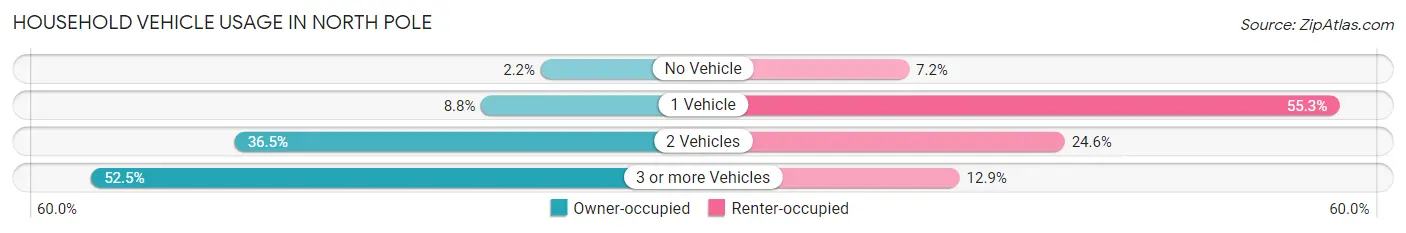
| Vehicles per Household | Owner-occupied | Renter-occupied |
| No Vehicle | 12 (2.2%) | 33 (7.2%) |
| 1 Vehicle | 49 (8.8%) | 254 (55.3%) |
| 2 Vehicles | 202 (36.5%) | 113 (24.6%) |
| 3 or more Vehicles | 291 (52.5%) | 59 (12.9%) |
| Total | 554 (100.0%) | 459 (100.0%) |
Real Estate & Mortgages in North Pole
Real Estate and Mortgage Overview in North Pole
| Characteristic | Without Mortgage | With Mortgage |
| Housing Units | 112 | 442 |
| Median Property Value | $173,700 | $279,000 |
| Median Household Income | $74,375 | $166 |
| Monthly Housing Costs | $750 | $38 |
| Real Estate Taxes | $2,596 | $19 |
Property Value by Mortgage Status in North Pole
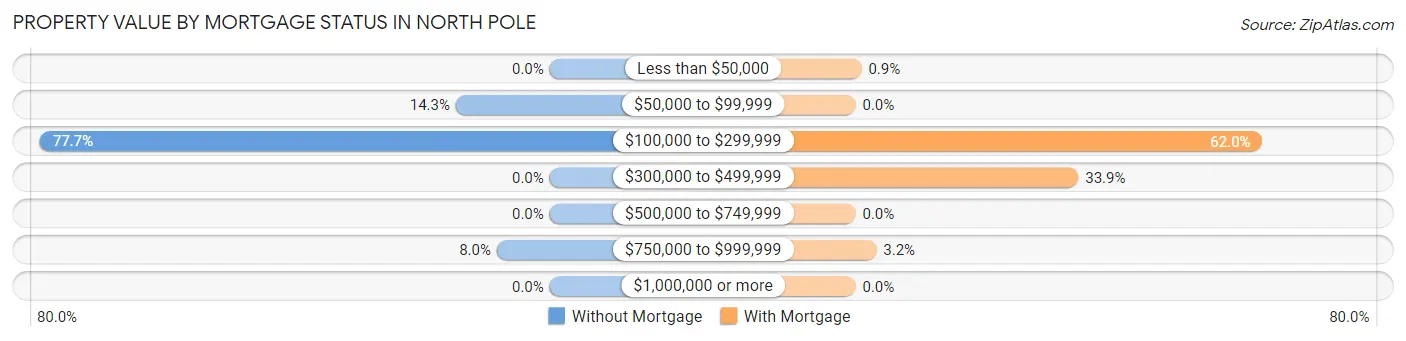
| Property Value | Without Mortgage | With Mortgage |
| Less than $50,000 | 0 (0.0%) | 4 (0.9%) |
| $50,000 to $99,999 | 16 (14.3%) | 0 (0.0%) |
| $100,000 to $299,999 | 87 (77.7%) | 274 (62.0%) |
| $300,000 to $499,999 | 0 (0.0%) | 150 (33.9%) |
| $500,000 to $749,999 | 0 (0.0%) | 0 (0.0%) |
| $750,000 to $999,999 | 9 (8.0%) | 14 (3.2%) |
| $1,000,000 or more | 0 (0.0%) | 0 (0.0%) |
| Total | 112 (100.0%) | 442 (100.0%) |
Household Income by Mortgage Status in North Pole
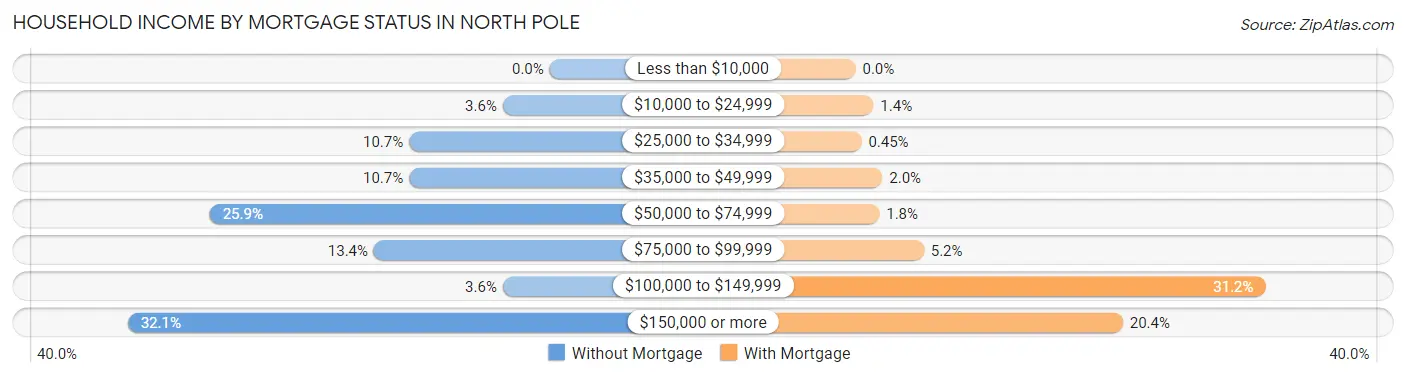
| Household Income | Without Mortgage | With Mortgage |
| Less than $10,000 | 0 (0.0%) | 0 (0.0%) |
| $10,000 to $24,999 | 4 (3.6%) | 6 (1.4%) |
| $25,000 to $34,999 | 12 (10.7%) | 2 (0.4%) |
| $35,000 to $49,999 | 12 (10.7%) | 9 (2.0%) |
| $50,000 to $74,999 | 29 (25.9%) | 8 (1.8%) |
| $75,000 to $99,999 | 15 (13.4%) | 23 (5.2%) |
| $100,000 to $149,999 | 4 (3.6%) | 138 (31.2%) |
| $150,000 or more | 36 (32.1%) | 90 (20.4%) |
| Total | 112 (100.0%) | 442 (100.0%) |
Property Value to Household Income Ratio in North Pole
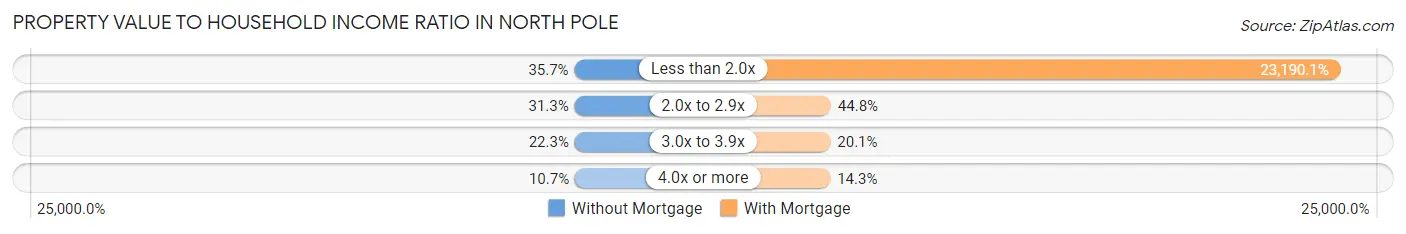
| Value-to-Income Ratio | Without Mortgage | With Mortgage |
| Less than 2.0x | 40 (35.7%) | 102,500 (23,190.0%) |
| 2.0x to 2.9x | 35 (31.2%) | 198 (44.8%) |
| 3.0x to 3.9x | 25 (22.3%) | 89 (20.1%) |
| 4.0x or more | 12 (10.7%) | 63 (14.2%) |
| Total | 112 (100.0%) | 442 (100.0%) |
Real Estate Taxes by Mortgage Status in North Pole
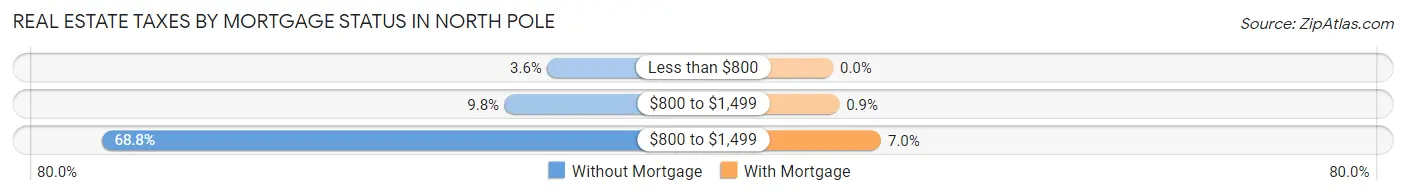
| Property Taxes | Without Mortgage | With Mortgage |
| Less than $800 | 4 (3.6%) | 0 (0.0%) |
| $800 to $1,499 | 11 (9.8%) | 4 (0.9%) |
| $800 to $1,499 | 77 (68.8%) | 31 (7.0%) |
| Total | 112 (100.0%) | 442 (100.0%) |
Health & Disability in North Pole
Health Insurance Coverage by Age in North Pole
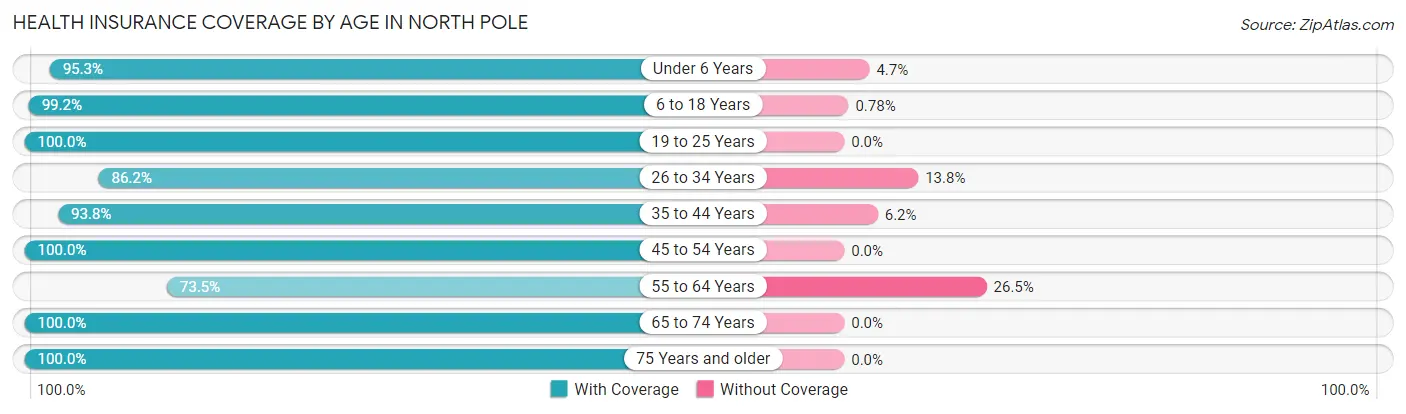
| Age Bracket | With Coverage | Without Coverage |
| Under 6 Years | 366 (95.3%) | 18 (4.7%) |
| 6 to 18 Years | 636 (99.2%) | 5 (0.8%) |
| 19 to 25 Years | 250 (100.0%) | 0 (0.0%) |
| 26 to 34 Years | 475 (86.2%) | 76 (13.8%) |
| 35 to 44 Years | 391 (93.8%) | 26 (6.2%) |
| 45 to 54 Years | 90 (100.0%) | 0 (0.0%) |
| 55 to 64 Years | 119 (73.5%) | 43 (26.5%) |
| 65 to 74 Years | 123 (100.0%) | 0 (0.0%) |
| 75 Years and older | 25 (100.0%) | 0 (0.0%) |
| Total | 2,475 (93.6%) | 168 (6.4%) |
Health Insurance Coverage by Citizenship Status in North Pole
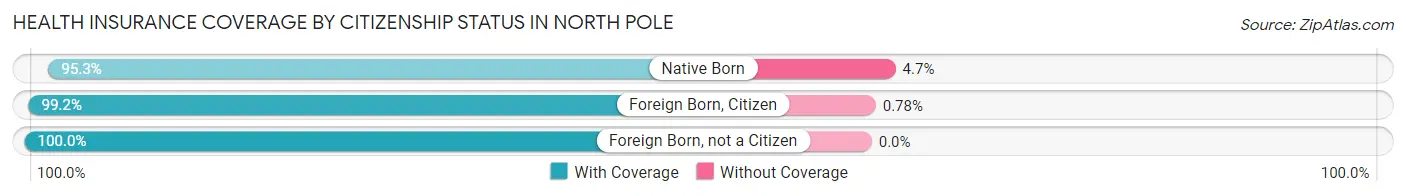
| Citizenship Status | With Coverage | Without Coverage |
| Native Born | 366 (95.3%) | 18 (4.7%) |
| Foreign Born, Citizen | 636 (99.2%) | 5 (0.8%) |
| Foreign Born, not a Citizen | 250 (100.0%) | 0 (0.0%) |
Health Insurance Coverage by Household Income in North Pole
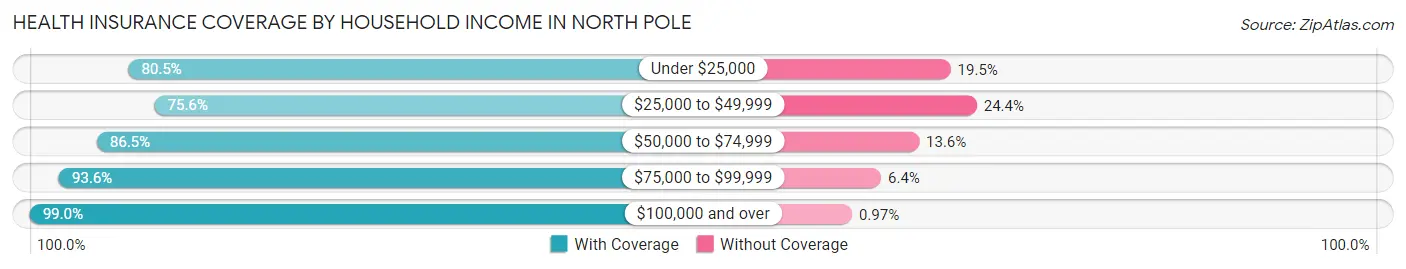
| Household Income | With Coverage | Without Coverage |
| Under $25,000 | 120 (80.5%) | 29 (19.5%) |
| $25,000 to $49,999 | 118 (75.6%) | 38 (24.4%) |
| $50,000 to $74,999 | 236 (86.5%) | 37 (13.6%) |
| $75,000 to $99,999 | 757 (93.6%) | 52 (6.4%) |
| $100,000 and over | 1,224 (99.0%) | 12 (1.0%) |
Public vs Private Health Insurance Coverage by Age in North Pole
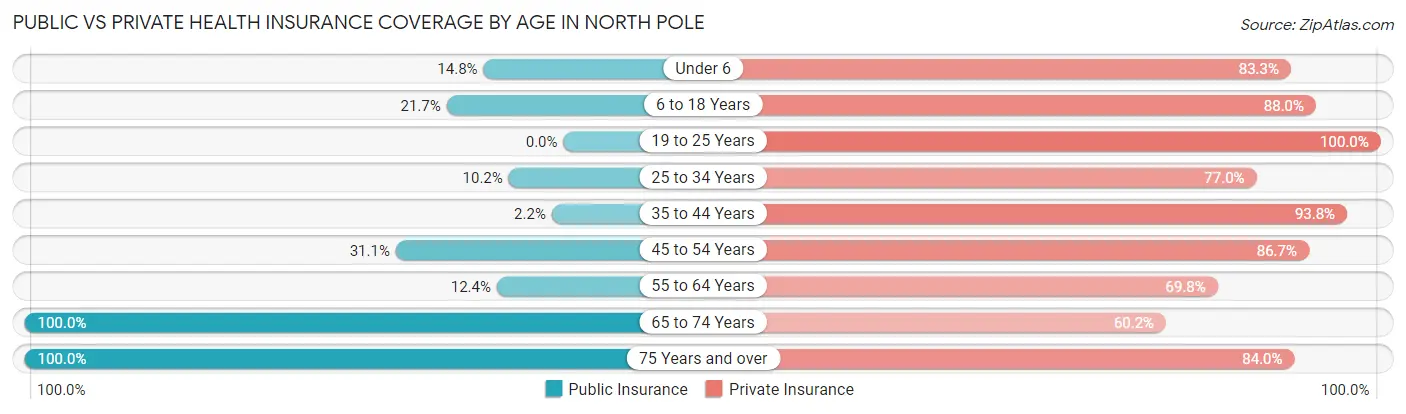
| Age Bracket | Public Insurance | Private Insurance |
| Under 6 | 57 (14.8%) | 320 (83.3%) |
| 6 to 18 Years | 139 (21.7%) | 564 (88.0%) |
| 19 to 25 Years | 0 (0.0%) | 250 (100.0%) |
| 25 to 34 Years | 56 (10.2%) | 424 (76.9%) |
| 35 to 44 Years | 9 (2.2%) | 391 (93.8%) |
| 45 to 54 Years | 28 (31.1%) | 78 (86.7%) |
| 55 to 64 Years | 20 (12.3%) | 113 (69.8%) |
| 65 to 74 Years | 123 (100.0%) | 74 (60.2%) |
| 75 Years and over | 25 (100.0%) | 21 (84.0%) |
| Total | 457 (17.3%) | 2,235 (84.6%) |
Disability Status by Sex by Age in North Pole
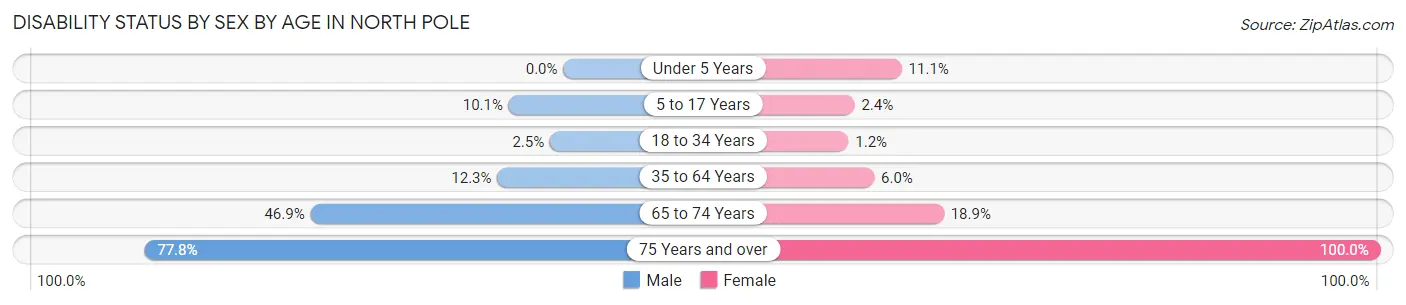
| Age Bracket | Male | Female |
| Under 5 Years | 0 (0.0%) | 7 (11.1%) |
| 5 to 17 Years | 40 (10.1%) | 7 (2.4%) |
| 18 to 34 Years | 9 (2.5%) | 6 (1.2%) |
| 35 to 64 Years | 37 (12.2%) | 22 (6.0%) |
| 65 to 74 Years | 23 (46.9%) | 14 (18.9%) |
| 75 Years and over | 14 (77.8%) | 7 (100.0%) |
Disability Class by Sex by Age in North Pole
Disability Class: Hearing Difficulty
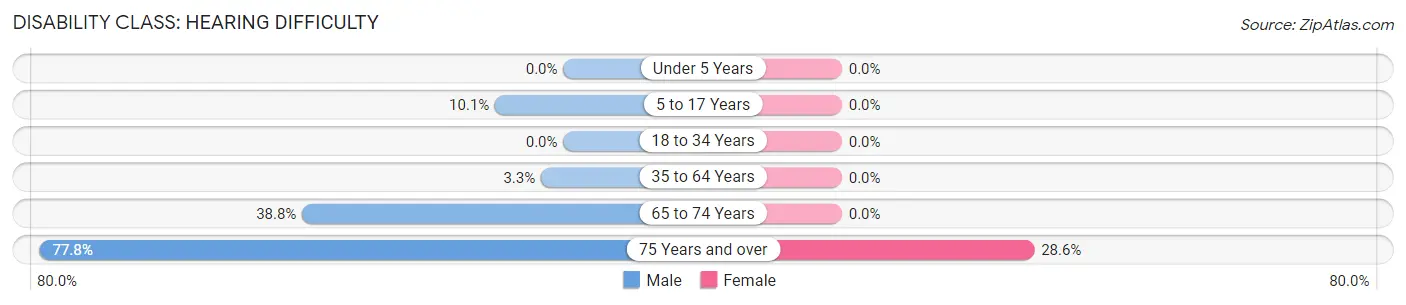
| Age Bracket | Male | Female |
| Under 5 Years | 0 (0.0%) | 0 (0.0%) |
| 5 to 17 Years | 40 (10.1%) | 0 (0.0%) |
| 18 to 34 Years | 0 (0.0%) | 0 (0.0%) |
| 35 to 64 Years | 10 (3.3%) | 0 (0.0%) |
| 65 to 74 Years | 19 (38.8%) | 0 (0.0%) |
| 75 Years and over | 14 (77.8%) | 2 (28.6%) |
Disability Class: Vision Difficulty
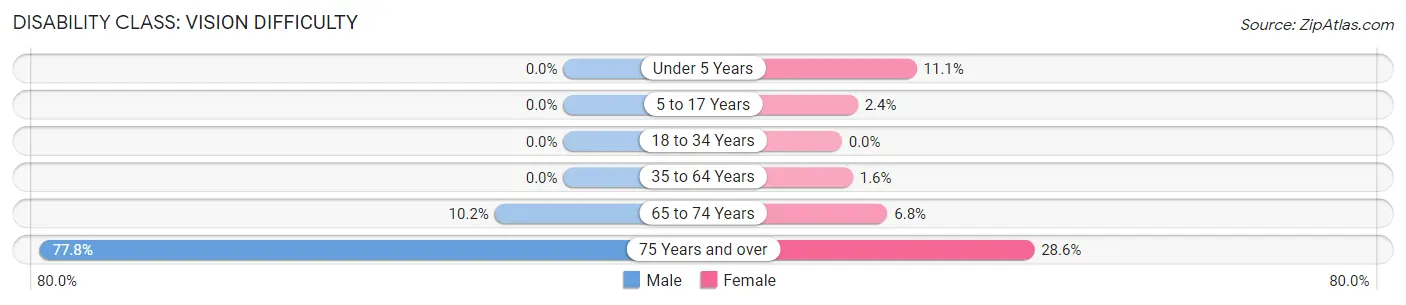
| Age Bracket | Male | Female |
| Under 5 Years | 0 (0.0%) | 7 (11.1%) |
| 5 to 17 Years | 0 (0.0%) | 7 (2.4%) |
| 18 to 34 Years | 0 (0.0%) | 0 (0.0%) |
| 35 to 64 Years | 0 (0.0%) | 6 (1.6%) |
| 65 to 74 Years | 5 (10.2%) | 5 (6.8%) |
| 75 Years and over | 14 (77.8%) | 2 (28.6%) |
Disability Class: Cognitive Difficulty
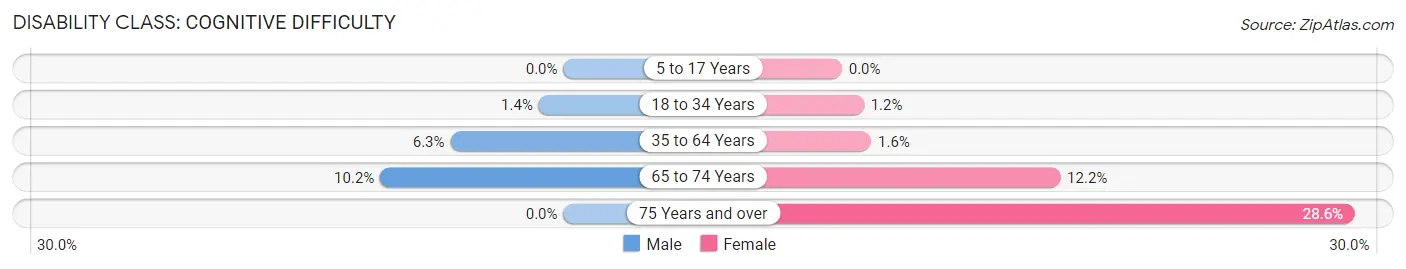
| Age Bracket | Male | Female |
| 5 to 17 Years | 0 (0.0%) | 0 (0.0%) |
| 18 to 34 Years | 5 (1.4%) | 6 (1.2%) |
| 35 to 64 Years | 19 (6.3%) | 6 (1.6%) |
| 65 to 74 Years | 5 (10.2%) | 9 (12.2%) |
| 75 Years and over | 0 (0.0%) | 2 (28.6%) |
Disability Class: Ambulatory Difficulty
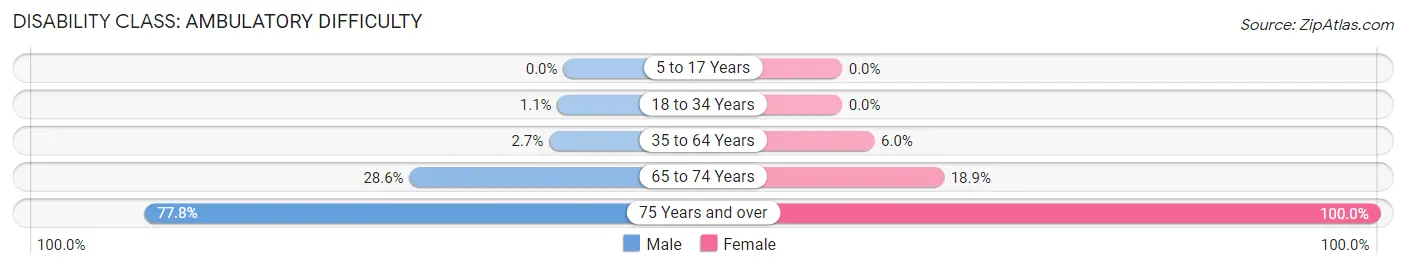
| Age Bracket | Male | Female |
| 5 to 17 Years | 0 (0.0%) | 0 (0.0%) |
| 18 to 34 Years | 4 (1.1%) | 0 (0.0%) |
| 35 to 64 Years | 8 (2.6%) | 22 (6.0%) |
| 65 to 74 Years | 14 (28.6%) | 14 (18.9%) |
| 75 Years and over | 14 (77.8%) | 7 (100.0%) |
Disability Class: Self-Care Difficulty
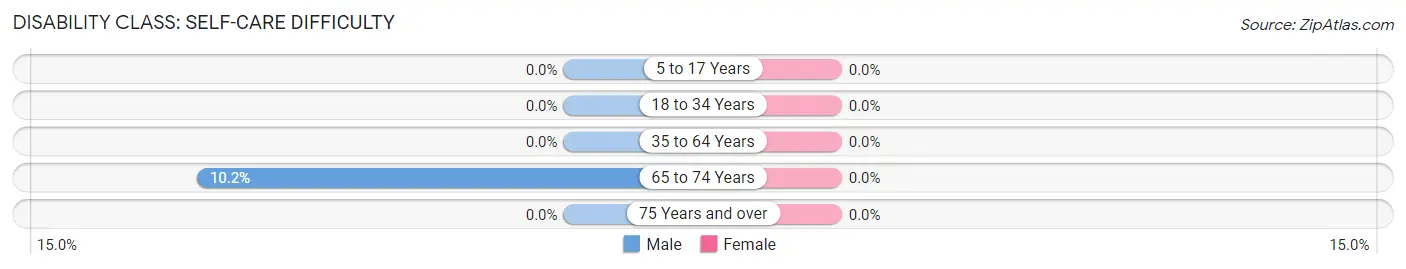
| Age Bracket | Male | Female |
| 5 to 17 Years | 0 (0.0%) | 0 (0.0%) |
| 18 to 34 Years | 0 (0.0%) | 0 (0.0%) |
| 35 to 64 Years | 0 (0.0%) | 0 (0.0%) |
| 65 to 74 Years | 5 (10.2%) | 0 (0.0%) |
| 75 Years and over | 0 (0.0%) | 0 (0.0%) |
Technology Access in North Pole
Computing Device Access in North Pole
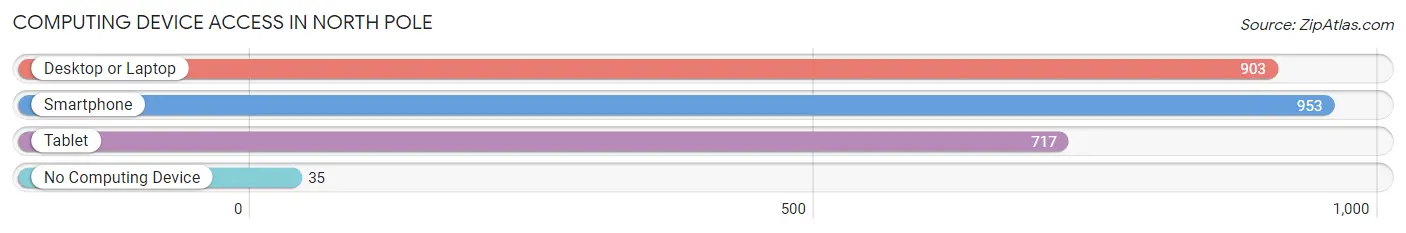
| Device Type | # Households | % Households |
| Desktop or Laptop | 903 | 89.1% |
| Smartphone | 953 | 94.1% |
| Tablet | 717 | 70.8% |
| No Computing Device | 35 | 3.5% |
| Total | 1,013 | 100.0% |
Internet Access in North Pole
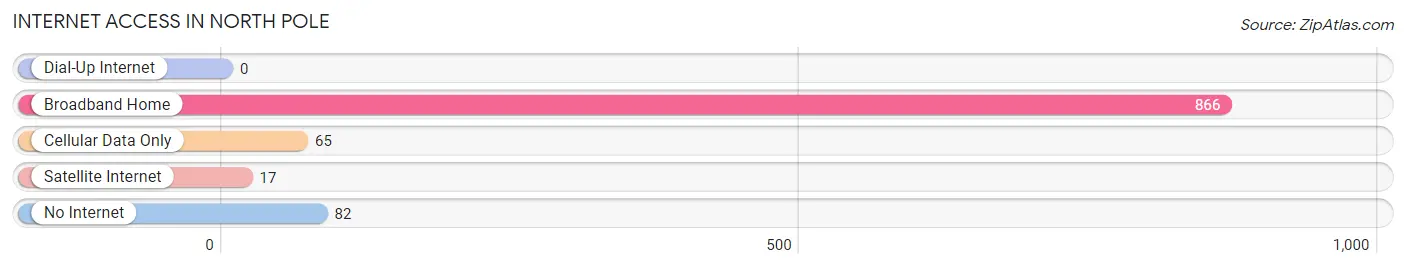
| Internet Type | # Households | % Households |
| Dial-Up Internet | 0 | 0.0% |
| Broadband Home | 866 | 85.5% |
| Cellular Data Only | 65 | 6.4% |
| Satellite Internet | 17 | 1.7% |
| No Internet | 82 | 8.1% |
| Total | 1,013 | 100.0% |
North Pole Summary
The North Pole, Alaska is a small city located in the Fairbanks North Star Borough of Alaska. It is situated at the northernmost point of the state, just south of the Arctic Circle. The city is home to approximately 2,200 people and is known for its Christmas-themed attractions and events.
History
The area that is now North Pole was first inhabited by the Athabascan people, who lived in the area for thousands of years. The first Europeans to visit the area were Russian fur traders in the late 18th century. In the early 1900s, the area was settled by gold miners and homesteaders.
In 1944, the U.S. Army established a military base in the area, which was later named Fort Wainwright. The base was used to train soldiers for World War II and the Korean War. In 1952, the city of North Pole was incorporated.
The city was named after the nearby North Pole, which is located just a few miles away. The city was originally intended to be a tourist destination, and it was designed to resemble a Christmas village. The city was decorated with Christmas lights and decorations, and it was home to a variety of Christmas-themed attractions.
Geography
North Pole is located in the Fairbanks North Star Borough of Alaska. It is situated at the northernmost point of the state, just south of the Arctic Circle. The city is located on the banks of the Chena River, which flows through the city.
The city has a total area of 8.3 square miles, of which 8.2 square miles is land and 0.1 square miles is water. The city is located in a subarctic climate zone, with cold winters and mild summers. The average temperature in the summer is around 60°F, and the average temperature in the winter is around -20°F.
Economy
The economy of North Pole is largely based on tourism. The city is home to a variety of Christmas-themed attractions, including Santa Claus House, the North Pole Experience, and the Santa Claus Lane. The city also hosts a variety of festivals and events throughout the year, including the North Pole Christmas Festival and the North Pole Marathon.
In addition to tourism, the city is also home to a variety of businesses, including retail stores, restaurants, and hotels. The city is also home to a number of manufacturing and industrial businesses, including a paper mill and a plastics factory.
Demographics
As of the 2010 census, the population of North Pole was 2,178. The racial makeup of the city was 87.2% White, 0.7% Black or African American, 5.2% Native American, 0.7% Asian, 0.1% Pacific Islander, 0.7% from other races, and 5.2% from two or more races. The median household income in the city was $50,945, and the median family income was $60,945.
Conclusion
North Pole, Alaska is a small city located in the Fairbanks North Star Borough of Alaska. It is situated at the northernmost point of the state, just south of the Arctic Circle. The city is home to approximately 2,200 people and is known for its Christmas-themed attractions and events. The economy of North Pole is largely based on tourism, and the city is also home to a variety of businesses, including retail stores, restaurants, and hotels. As of the 2010 census, the population of North Pole was 2,178. The racial makeup of the city was 87.2% White, 0.7% Black or African American, 5.2% Native American, 0.7% Asian, 0.1% Pacific Islander, 0.7% from other races, and 5.2% from two or more races. The median household income in the city was $50,945, and the median family income was $60,945.
Common Questions
What is Per Capita Income in North Pole?
Per Capita income in North Pole is $38,326.
What is the Median Family Income in North Pole?
Median Family Income in North Pole is $97,462.
What is the Median Household income in North Pole?
Median Household Income in North Pole is $91,583.
What is Income or Wage Gap in North Pole?
Income or Wage Gap in North Pole is 6.7%.
Women in North Pole earn 93.3 cents for every dollar earned by a man.
What is Family Income Deficit in North Pole?
Family Income Deficit in North Pole is $17,083.
Families that are below poverty line in North Pole earn $17,083 less on average than the poverty threshold level.
What is Inequality or Gini Index in North Pole?
Inequality or Gini Index in North Pole is 0.32.
What is the Total Population of North Pole?
Total Population of North Pole is 2,816.
What is the Total Male Population of North Pole?
Total Male Population of North Pole is 1,511.
What is the Total Female Population of North Pole?
Total Female Population of North Pole is 1,305.
What is the Ratio of Males per 100 Females in North Pole?
There are 115.79 Males per 100 Females in North Pole.
What is the Ratio of Females per 100 Males in North Pole?
There are 86.37 Females per 100 Males in North Pole.
What is the Median Population Age in North Pole?
Median Population Age in North Pole is 28.4 Years.
What is the Average Family Size in North Pole
Average Family Size in North Pole is 3.6 People.
What is the Average Household Size in North Pole
Average Household Size in North Pole is 2.8 People.
How Large is the Labor Force in North Pole?
There are 1,453 People in the Labor Forcein in North Pole.
What is the Percentage of People in the Labor Force in North Pole?
77.4% of People are in the Labor Force in North Pole.
What is the Unemployment Rate in North Pole?
Unemployment Rate in North Pole is 3.8%.