Gambell, AK Map & Demographics
Gambell Map
Gambell Overview
$14,773
PER CAPITA INCOME
$50,625
AVG FAMILY INCOME
$39,375
AVG HOUSEHOLD INCOME
42.6%
WAGE / INCOME GAP [ % ]
57.4¢/ $1
WAGE / INCOME GAP [ $ ]
0.47
INEQUALITY / GINI INDEX
426
TOTAL POPULATION
224
MALE POPULATION
202
FEMALE POPULATION
110.89
MALES / 100 FEMALES
90.18
FEMALES / 100 MALES
25.8
MEDIAN AGE
4.2
AVG FAMILY SIZE
3.4
AVG HOUSEHOLD SIZE
181
LABOR FORCE [ PEOPLE ]
58.4%
PERCENT IN LABOR FORCE
31.5%
UNEMPLOYMENT RATE
Gambell Zip Codes
Gambell Area Codes
Income in Gambell
Income Overview in Gambell
Per Capita Income in Gambell is $14,773, while median incomes of families and households are $50,625 and $39,375 respectively.
| Characteristic | Number | Measure |
| Per Capita Income | 426 | $14,773 |
| Median Family Income | 83 | $50,625 |
| Mean Family Income | 83 | $59,843 |
| Median Household Income | 124 | $39,375 |
| Mean Household Income | 124 | $52,804 |
| Income Deficit | 83 | $0 |
| Wage / Income Gap (%) | 426 | 42.55% |
| Wage / Income Gap ($) | 426 | 57.45¢ per $1 |
| Gini / Inequality Index | 426 | 0.47 |
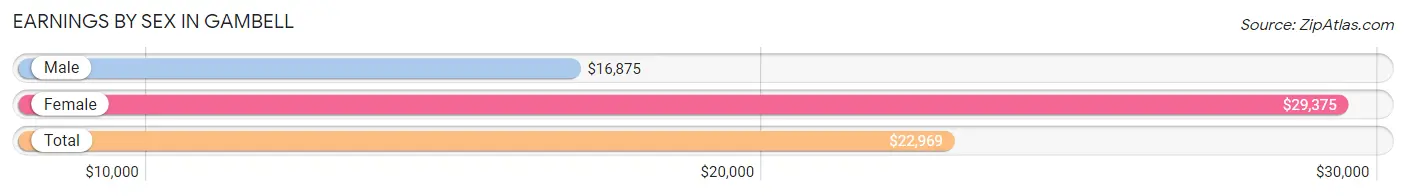
Earnings by Sex in Gambell
Average Earnings in Gambell are $22,969, $16,875 for men and $29,375 for women, a difference of 42.5%.
| Sex | Number | Average Earnings |
| Male | 91 (52.6%) | $16,875 |
| Female | 82 (47.4%) | $29,375 |
| Total | 173 (100.0%) | $22,969 |
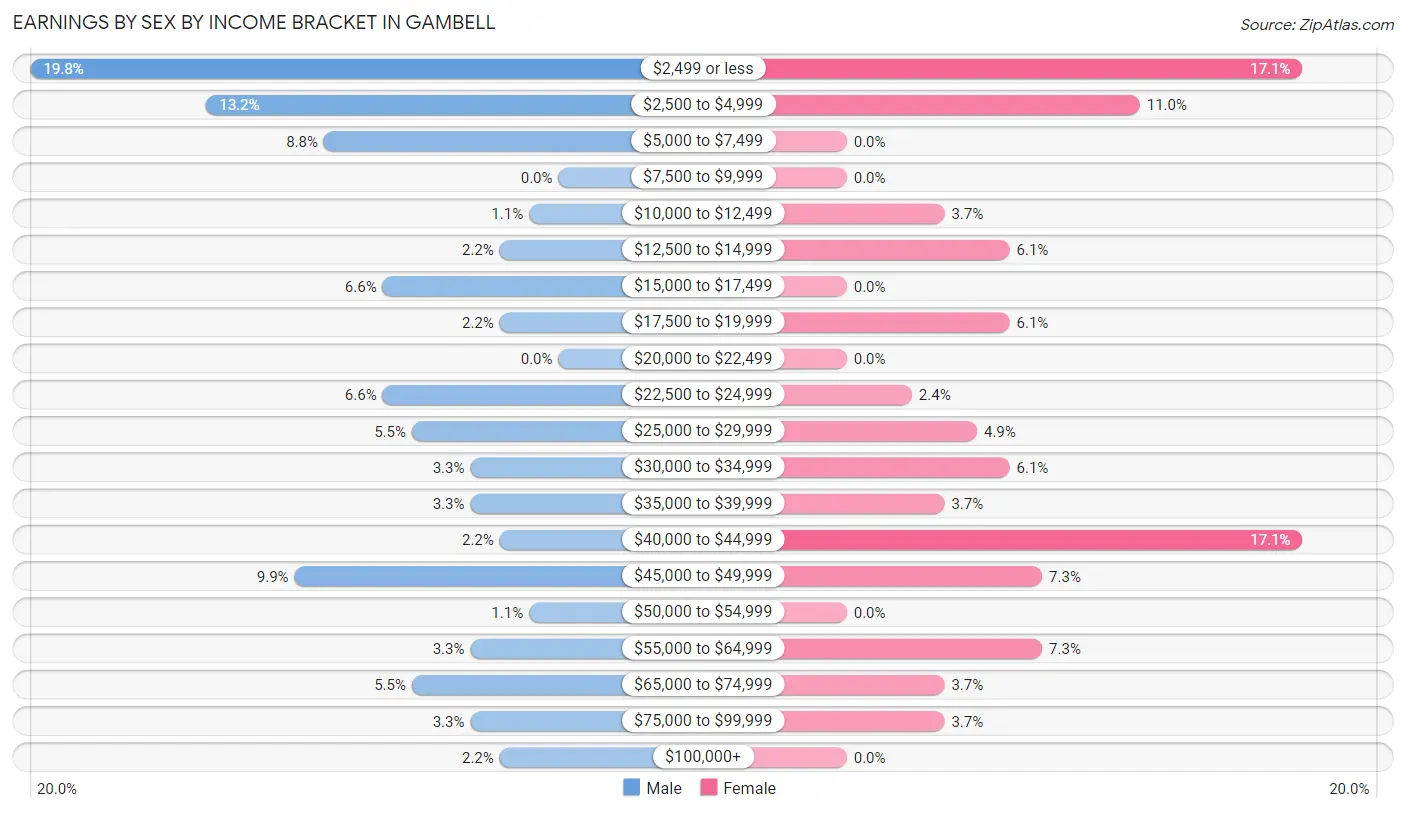
Earnings by Sex by Income Bracket in Gambell
The most common earnings brackets in Gambell are $2,499 or less for men (18 | 19.8%) and $2,499 or less for women (14 | 17.1%).
| Income | Male | Female |
| $2,499 or less | 18 (19.8%) | 14 (17.1%) |
| $2,500 to $4,999 | 12 (13.2%) | 9 (11.0%) |
| $5,000 to $7,499 | 8 (8.8%) | 0 (0.0%) |
| $7,500 to $9,999 | 0 (0.0%) | 0 (0.0%) |
| $10,000 to $12,499 | 1 (1.1%) | 3 (3.7%) |
| $12,500 to $14,999 | 2 (2.2%) | 5 (6.1%) |
| $15,000 to $17,499 | 6 (6.6%) | 0 (0.0%) |
| $17,500 to $19,999 | 2 (2.2%) | 5 (6.1%) |
| $20,000 to $22,499 | 0 (0.0%) | 0 (0.0%) |
| $22,500 to $24,999 | 6 (6.6%) | 2 (2.4%) |
| $25,000 to $29,999 | 5 (5.5%) | 4 (4.9%) |
| $30,000 to $34,999 | 3 (3.3%) | 5 (6.1%) |
| $35,000 to $39,999 | 3 (3.3%) | 3 (3.7%) |
| $40,000 to $44,999 | 2 (2.2%) | 14 (17.1%) |
| $45,000 to $49,999 | 9 (9.9%) | 6 (7.3%) |
| $50,000 to $54,999 | 1 (1.1%) | 0 (0.0%) |
| $55,000 to $64,999 | 3 (3.3%) | 6 (7.3%) |
| $65,000 to $74,999 | 5 (5.5%) | 3 (3.7%) |
| $75,000 to $99,999 | 3 (3.3%) | 3 (3.7%) |
| $100,000+ | 2 (2.2%) | 0 (0.0%) |
| Total | 91 (100.0%) | 82 (100.0%) |
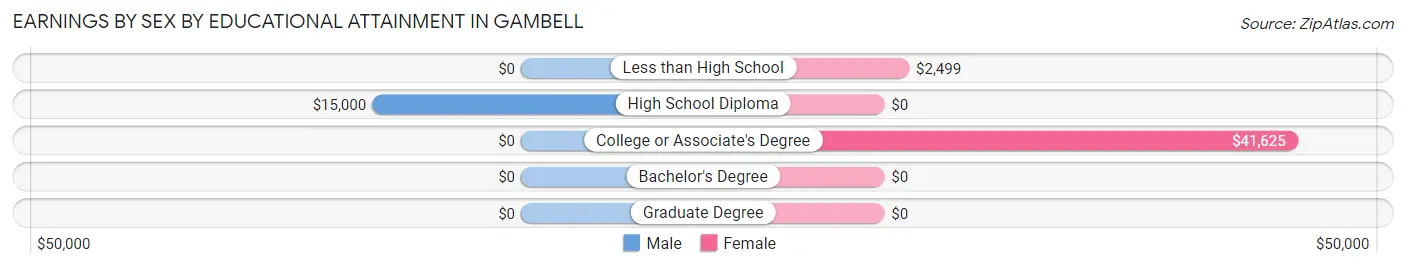
Earnings by Sex by Educational Attainment in Gambell
Average earnings in Gambell are $18,750 for men and $36,250 for women, a difference of 48.3%. Men with an educational attainment of high school diploma enjoy the highest average annual earnings of $15,000, while those with high school diploma education earn the least with $15,000. Women with an educational attainment of college or associate's degree earn the most with the average annual earnings of $41,625, while those with less than high school education have the smallest earnings of $2,499.
| Educational Attainment | Male Income | Female Income |
| Less than High School | - | - |
| High School Diploma | $15,000 | $0 |
| College or Associate's Degree | - | - |
| Bachelor's Degree | - | - |
| Graduate Degree | - | - |
| Total | $18,750 | $36,250 |
Family Income in Gambell
Family Income Brackets in Gambell
According to the Gambell family income data, there are 24 families falling into the $50,000 to $74,999 income range, which is the most common income bracket and makes up 28.9% of all families. Conversely, the $10,000 to $14,999 income bracket is the least frequent group with only 2 families (2.4%) belonging to this category.
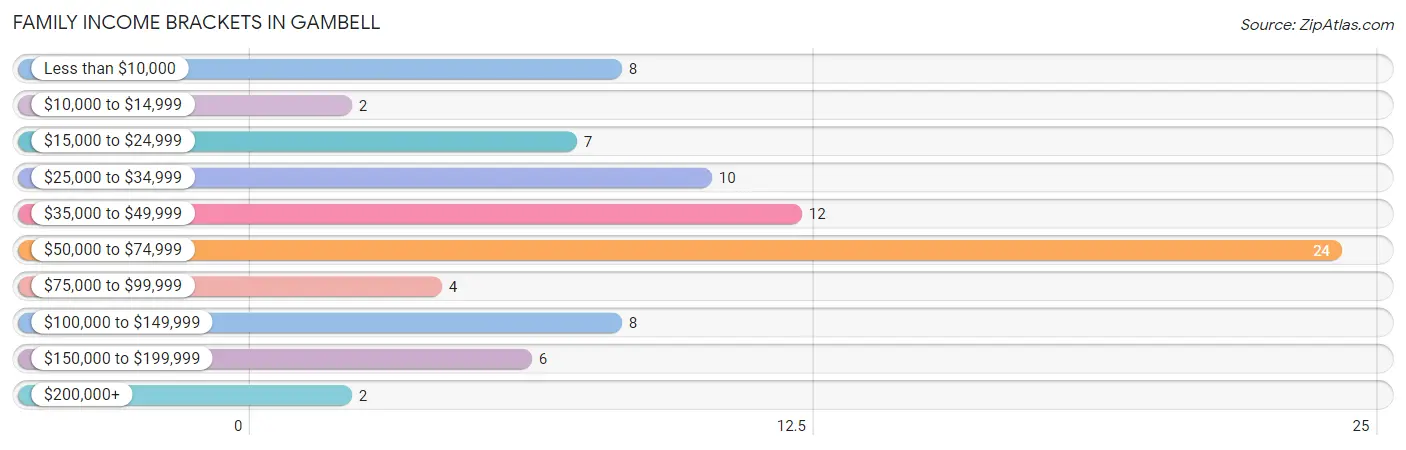
| Income Bracket | # Families | % Families |
| Less than $10,000 | 8 | 9.6% |
| $10,000 to $14,999 | 2 | 2.4% |
| $15,000 to $24,999 | 7 | 8.4% |
| $25,000 to $34,999 | 10 | 12.0% |
| $35,000 to $49,999 | 12 | 14.5% |
| $50,000 to $74,999 | 24 | 28.9% |
| $75,000 to $99,999 | 4 | 4.8% |
| $100,000 to $149,999 | 8 | 9.6% |
| $150,000 to $199,999 | 6 | 7.2% |
| $200,000+ | 2 | 2.4% |
Family Income by Famaliy Size in Gambell
7+ person families (17 | 20.5%) account for the highest median family income in Gambell with $68,750 per family, while 2-person families (21 | 25.3%) have the highest median income of $25,804 per family member.
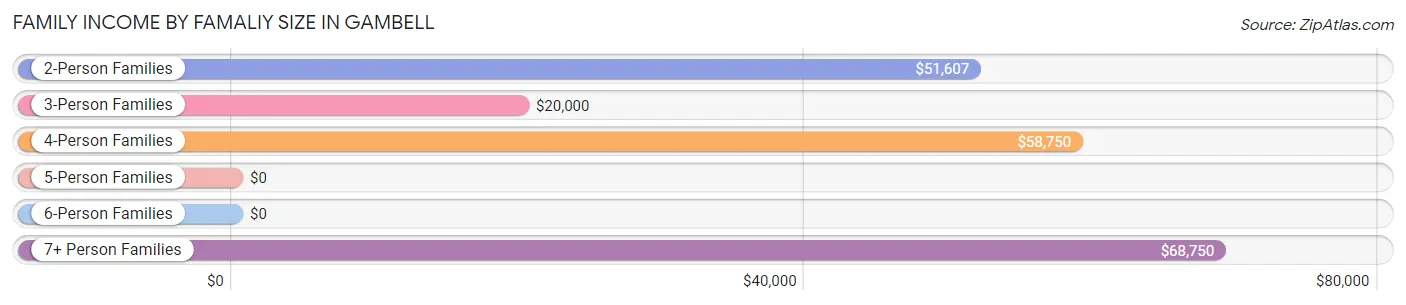
| Income Bracket | # Families | Median Income |
| 2-Person Families | 21 (25.3%) | $51,607 |
| 3-Person Families | 10 (12.0%) | $20,000 |
| 4-Person Families | 18 (21.7%) | $58,750 |
| 5-Person Families | 10 (12.0%) | $0 |
| 6-Person Families | 7 (8.4%) | $0 |
| 7+ Person Families | 17 (20.5%) | $68,750 |
| Total | 83 (100.0%) | $50,625 |
Family Income by Number of Earners in Gambell
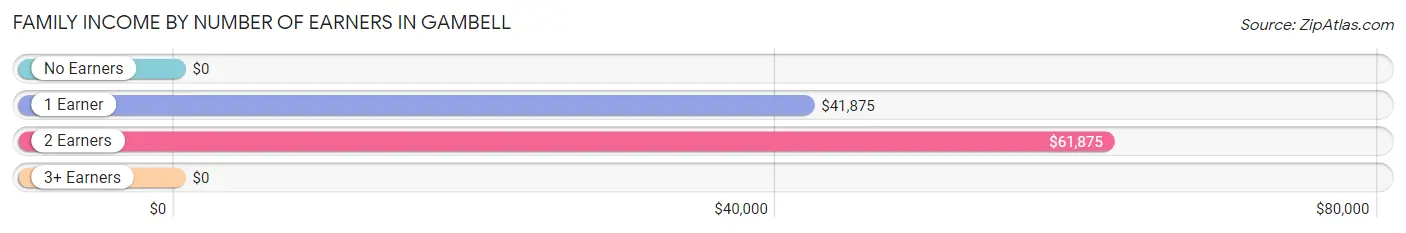
| Number of Earners | # Families | Median Income |
| No Earners | 13 (15.7%) | $0 |
| 1 Earner | 32 (38.6%) | $41,875 |
| 2 Earners | 21 (25.3%) | $61,875 |
| 3+ Earners | 17 (20.5%) | $0 |
| Total | 83 (100.0%) | $50,625 |
Household Income in Gambell
Household Income Brackets in Gambell
With 20 households falling in the category, the less than $10,000 income range is the most frequent in Gambell, accounting for 16.1% of all households. In contrast, only 2 households (1.6%) fall into the $200,000+ income bracket, making it the least populous group.
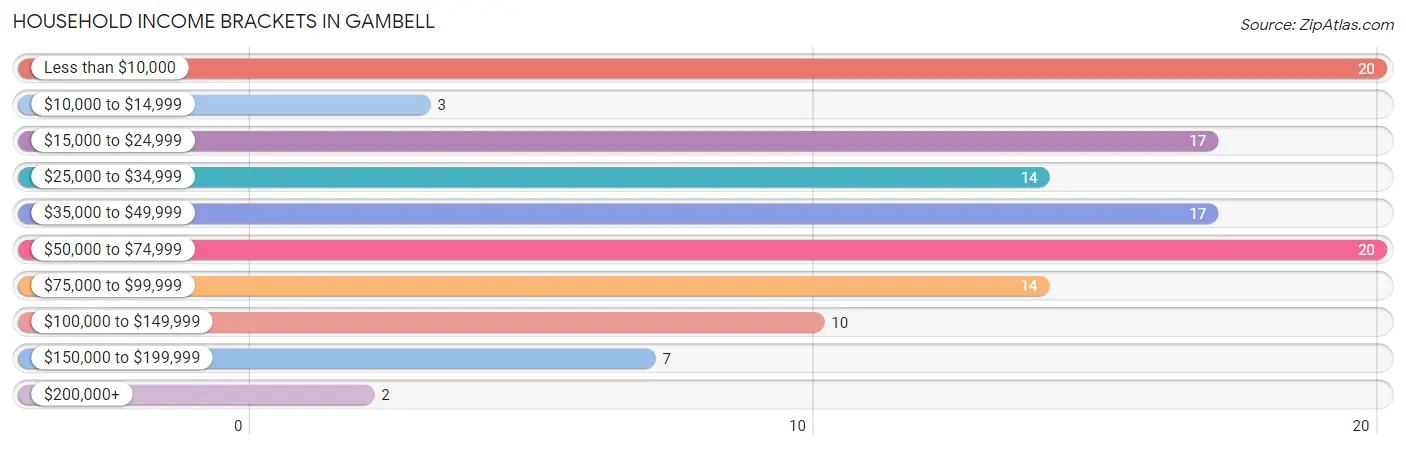
| Income Bracket | # Households | % Households |
| Less than $10,000 | 20 | 16.1% |
| $10,000 to $14,999 | 3 | 2.4% |
| $15,000 to $24,999 | 17 | 13.7% |
| $25,000 to $34,999 | 14 | 11.3% |
| $35,000 to $49,999 | 17 | 13.7% |
| $50,000 to $74,999 | 20 | 16.1% |
| $75,000 to $99,999 | 14 | 11.3% |
| $100,000 to $149,999 | 10 | 8.1% |
| $150,000 to $199,999 | 7 | 5.6% |
| $200,000+ | 2 | 1.6% |
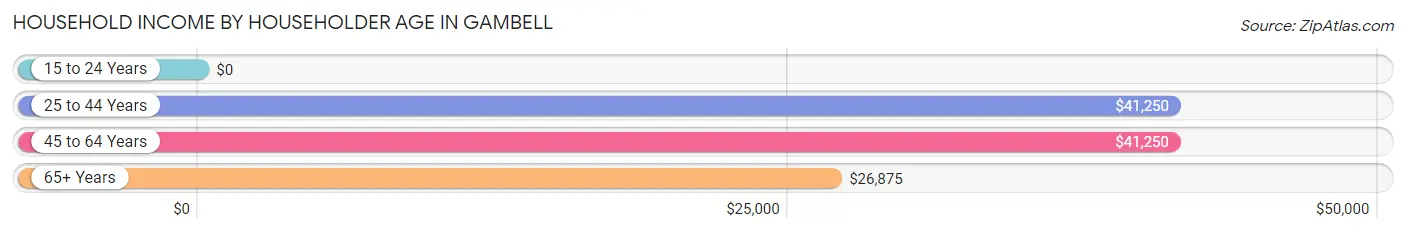
Household Income by Householder Age in Gambell
The median household income in Gambell is $39,375, with the highest median household income of $41,250 found in the 25 to 44 years age bracket for the primary householder. A total of 50 households (40.3%) fall into this category. Meanwhile, the 15 to 24 years age bracket for the primary householder has the lowest median household income of $0, with 6 households (4.8%) in this group.
| Income Bracket | # Households | Median Income |
| 15 to 24 Years | 6 (4.8%) | $0 |
| 25 to 44 Years | 50 (40.3%) | $41,250 |
| 45 to 64 Years | 49 (39.5%) | $41,250 |
| 65+ Years | 19 (15.3%) | $26,875 |
| Total | 124 (100.0%) | $39,375 |
Poverty in Gambell
Income Below Poverty by Sex and Age in Gambell
With 34.4% poverty level for males and 36.6% for females among the residents of Gambell, 75 year old and over males and 12 to 14 year old females are the most vulnerable to poverty, with 1 males (100.0%) and 6 females (75.0%) in their respective age groups living below the poverty level.
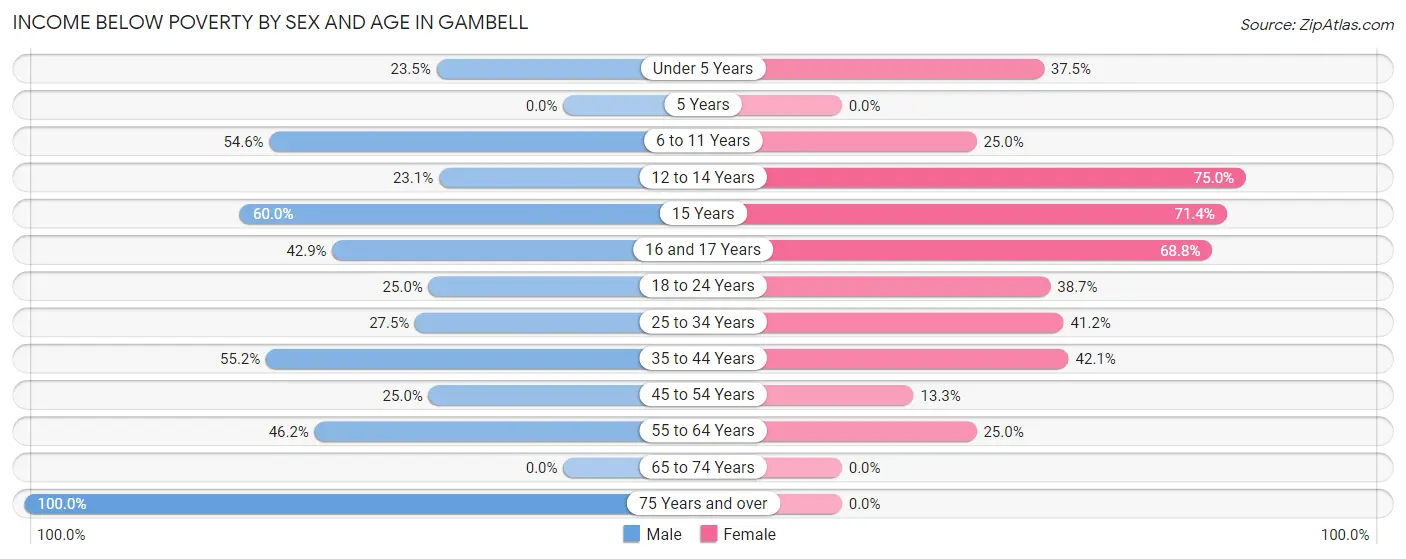
| Age Bracket | Male | Female |
| Under 5 Years | 4 (23.5%) | 6 (37.5%) |
| 5 Years | 0 (0.0%) | 0 (0.0%) |
| 6 to 11 Years | 12 (54.5%) | 6 (25.0%) |
| 12 to 14 Years | 3 (23.1%) | 6 (75.0%) |
| 15 Years | 3 (60.0%) | 5 (71.4%) |
| 16 and 17 Years | 3 (42.9%) | 11 (68.8%) |
| 18 to 24 Years | 7 (25.0%) | 12 (38.7%) |
| 25 to 34 Years | 11 (27.5%) | 14 (41.2%) |
| 35 to 44 Years | 16 (55.2%) | 8 (42.1%) |
| 45 to 54 Years | 5 (25.0%) | 2 (13.3%) |
| 55 to 64 Years | 12 (46.2%) | 4 (25.0%) |
| 65 to 74 Years | 0 (0.0%) | 0 (0.0%) |
| 75 Years and over | 1 (100.0%) | 0 (0.0%) |
| Total | 77 (34.4%) | 74 (36.6%) |
Income Above Poverty by Sex and Age in Gambell
According to the poverty statistics in Gambell, males aged 5 years and females aged 5 years are the age groups that are most secure financially, with 100.0% of males and 100.0% of females in these age groups living above the poverty line.
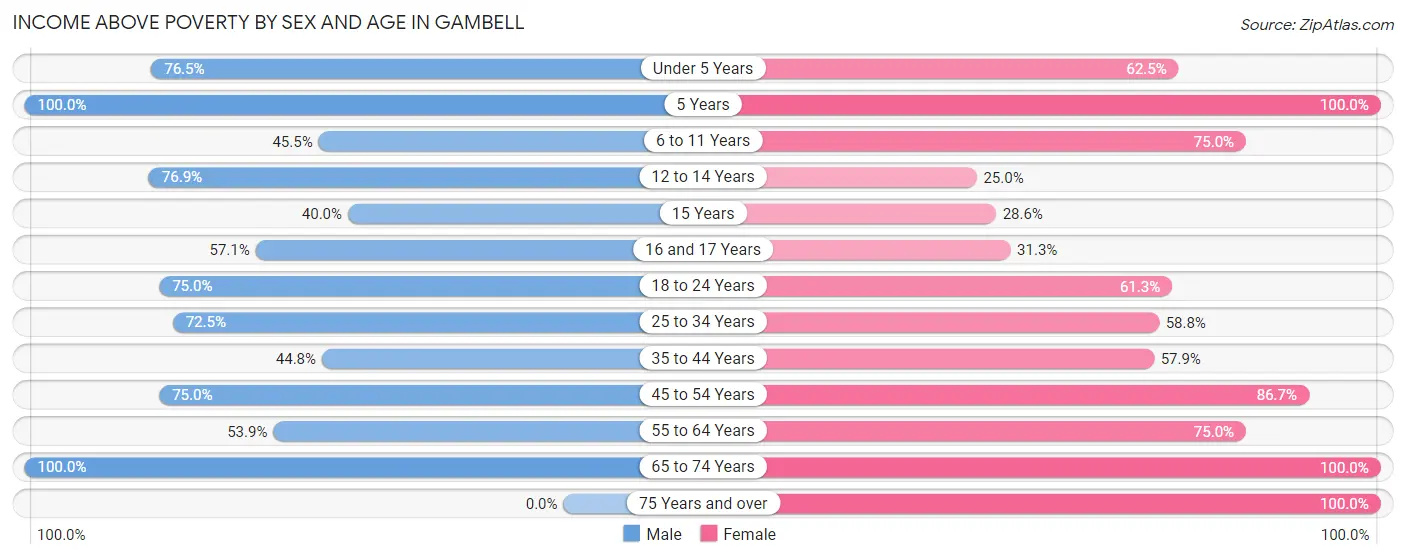
| Age Bracket | Male | Female |
| Under 5 Years | 13 (76.5%) | 10 (62.5%) |
| 5 Years | 2 (100.0%) | 2 (100.0%) |
| 6 to 11 Years | 10 (45.5%) | 18 (75.0%) |
| 12 to 14 Years | 10 (76.9%) | 2 (25.0%) |
| 15 Years | 2 (40.0%) | 2 (28.6%) |
| 16 and 17 Years | 4 (57.1%) | 5 (31.2%) |
| 18 to 24 Years | 21 (75.0%) | 19 (61.3%) |
| 25 to 34 Years | 29 (72.5%) | 20 (58.8%) |
| 35 to 44 Years | 13 (44.8%) | 11 (57.9%) |
| 45 to 54 Years | 15 (75.0%) | 13 (86.7%) |
| 55 to 64 Years | 14 (53.8%) | 12 (75.0%) |
| 65 to 74 Years | 14 (100.0%) | 7 (100.0%) |
| 75 Years and over | 0 (0.0%) | 7 (100.0%) |
| Total | 147 (65.6%) | 128 (63.4%) |
Income Below Poverty Among Married-Couple Families in Gambell
The poverty statistics for married-couple families in Gambell show that 10.3% or 3 of the total 29 families live below the poverty line. Families with 3 or 4 children have the highest poverty rate of 30.0%, comprising of 3 families. On the other hand, families with no children have the lowest poverty rate of 0.0%, which includes 0 families.
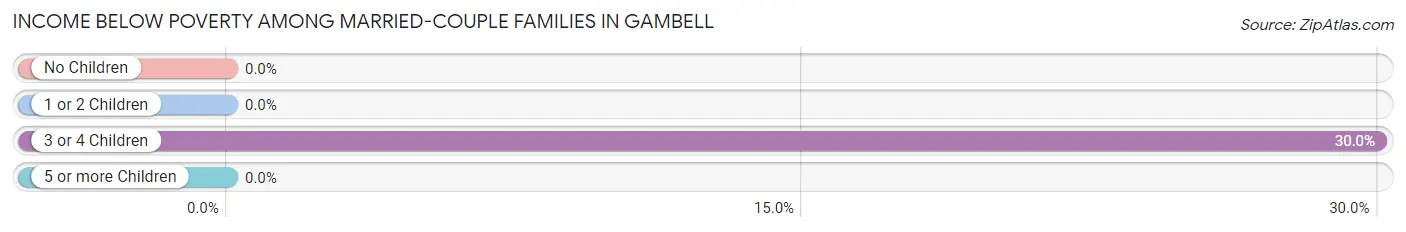
| Children | Above Poverty | Below Poverty |
| No Children | 4 (100.0%) | 0 (0.0%) |
| 1 or 2 Children | 14 (100.0%) | 0 (0.0%) |
| 3 or 4 Children | 7 (70.0%) | 3 (30.0%) |
| 5 or more Children | 1 (100.0%) | 0 (0.0%) |
| Total | 26 (89.7%) | 3 (10.3%) |
Income Below Poverty Among Single-Parent Households in Gambell
According to the poverty data in Gambell, 43.5% or 10 single-father households and 35.5% or 11 single-mother households are living below the poverty line. Among single-father households, those with 3 or 4 children have the highest poverty rate, with 4 households (100.0%) experiencing poverty. Likewise, among single-mother households, those with 3 or 4 children have the highest poverty rate, with 8 households (80.0%) falling below the poverty line.
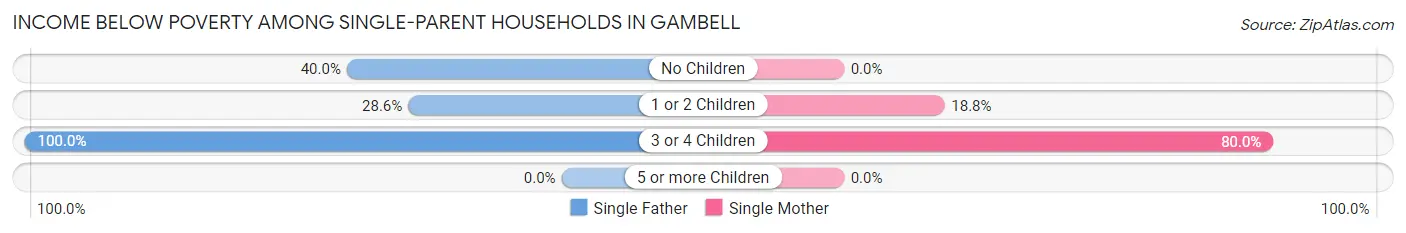
| Children | Single Father | Single Mother |
| No Children | 2 (40.0%) | 0 (0.0%) |
| 1 or 2 Children | 4 (28.6%) | 3 (18.8%) |
| 3 or 4 Children | 4 (100.0%) | 8 (80.0%) |
| 5 or more Children | 0 (0.0%) | 0 (0.0%) |
| Total | 10 (43.5%) | 11 (35.5%) |
Income Below Poverty Among Married-Couple vs Single-Parent Households in Gambell
The poverty data for Gambell shows that 3 of the married-couple family households (10.3%) and 21 of the single-parent households (38.9%) are living below the poverty level. Within the married-couple family households, those with 3 or 4 children have the highest poverty rate, with 3 households (30.0%) falling below the poverty line. Among the single-parent households, those with 3 or 4 children have the highest poverty rate, with 12 household (85.7%) living below poverty.
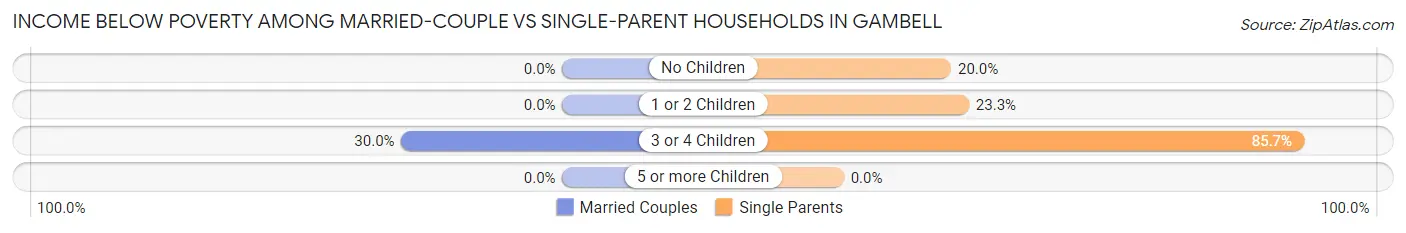
| Children | Married-Couple Families | Single-Parent Households |
| No Children | 0 (0.0%) | 2 (20.0%) |
| 1 or 2 Children | 0 (0.0%) | 7 (23.3%) |
| 3 or 4 Children | 3 (30.0%) | 12 (85.7%) |
| 5 or more Children | 0 (0.0%) | 0 (0.0%) |
| Total | 3 (10.3%) | 21 (38.9%) |
Race in Gambell
The most populous races in Gambell are Native / Alaskan (396 | 93.0%), Two or more Races (15 | 3.5%), and White / Caucasian (13 | 3.0%).
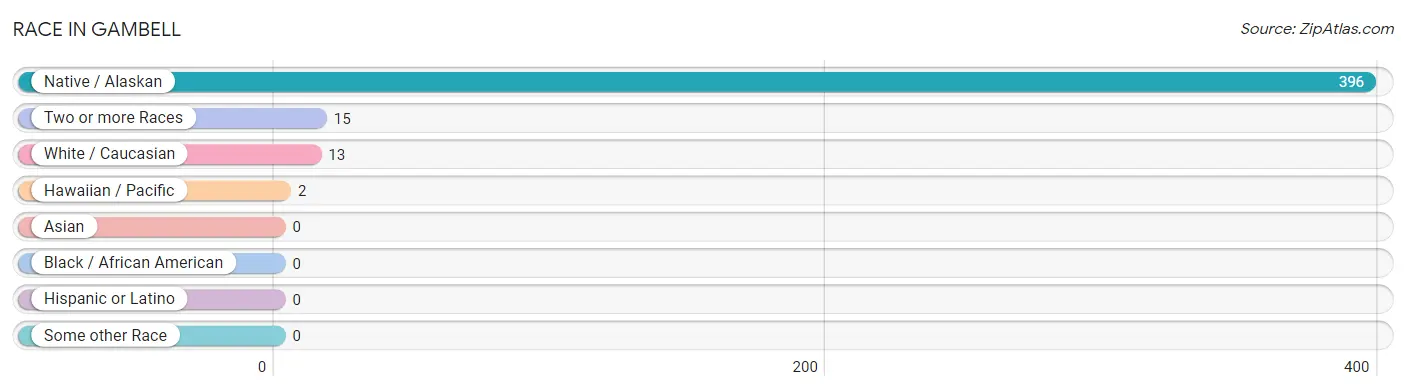
| Race | # Population | % Population |
| Asian | 0 | 0.0% |
| Black / African American | 0 | 0.0% |
| Hawaiian / Pacific | 2 | 0.5% |
| Hispanic or Latino | 0 | 0.0% |
| Native / Alaskan | 396 | 93.0% |
| White / Caucasian | 13 | 3.0% |
| Two or more Races | 15 | 3.5% |
| Some other Race | 0 | 0.0% |
| Total | 426 | 100.0% |
Ancestry in Gambell
The most populous ancestries reported in Gambell are Yup'ik (406 | 95.3%), American (28 | 6.6%), German (11 | 2.6%), Russian (10 | 2.4%), and Scottish (7 | 1.6%), together accounting for 108.5% of all Gambell residents.
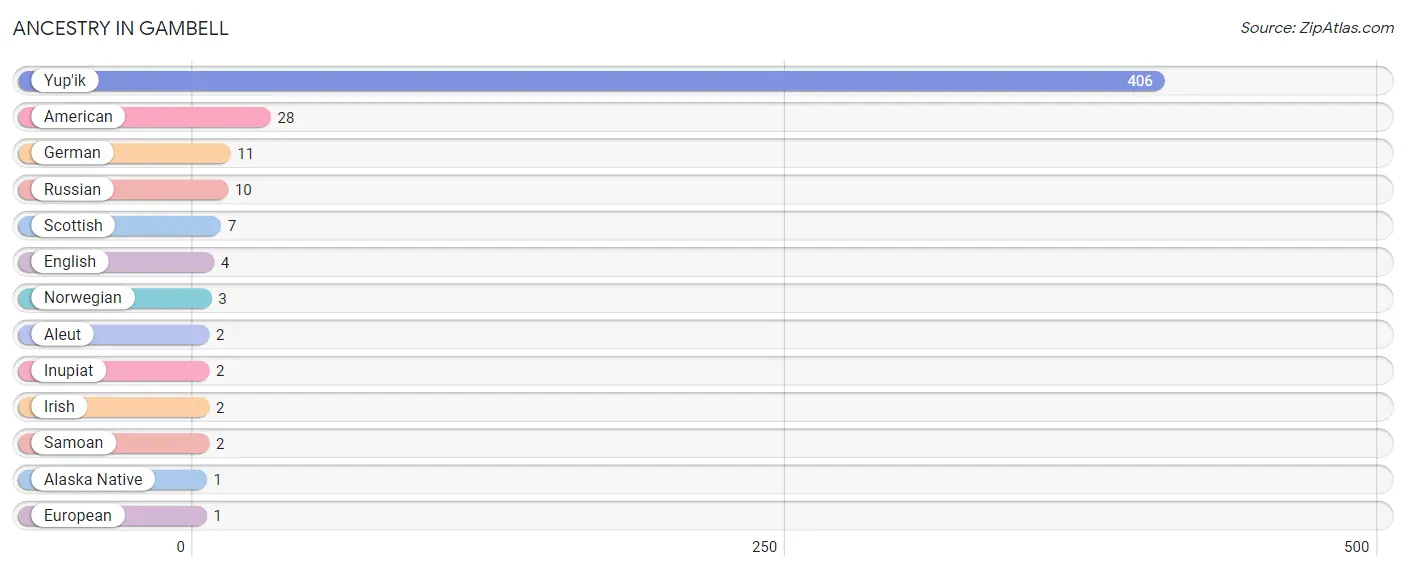
| Ancestry | # Population | % Population |
| Alaska Native | 1 | 0.2% |
| Aleut | 2 | 0.5% |
| American | 28 | 6.6% |
| English | 4 | 0.9% |
| European | 1 | 0.2% |
| German | 11 | 2.6% |
| Inupiat | 2 | 0.5% |
| Irish | 2 | 0.5% |
| Norwegian | 3 | 0.7% |
| Russian | 10 | 2.4% |
| Samoan | 2 | 0.5% |
| Scottish | 7 | 1.6% |
| Yup'ik | 406 | 95.3% | View All 13 Rows |
Immigrants in Gambell
The most numerous immigrant groups reported in Gambell came from , and Oceania (2 | 0.5%), together accounting for 0.5% of all Gambell residents.

| Immigration Origin | # Population | % Population |
| Oceania | 2 | 0.5% | View All 1 Rows |
Sex and Age in Gambell
Sex and Age in Gambell
The most populous age groups in Gambell are 25 to 29 Years (30 | 13.4%) for men and 15 to 19 Years (30 | 14.8%) for women.
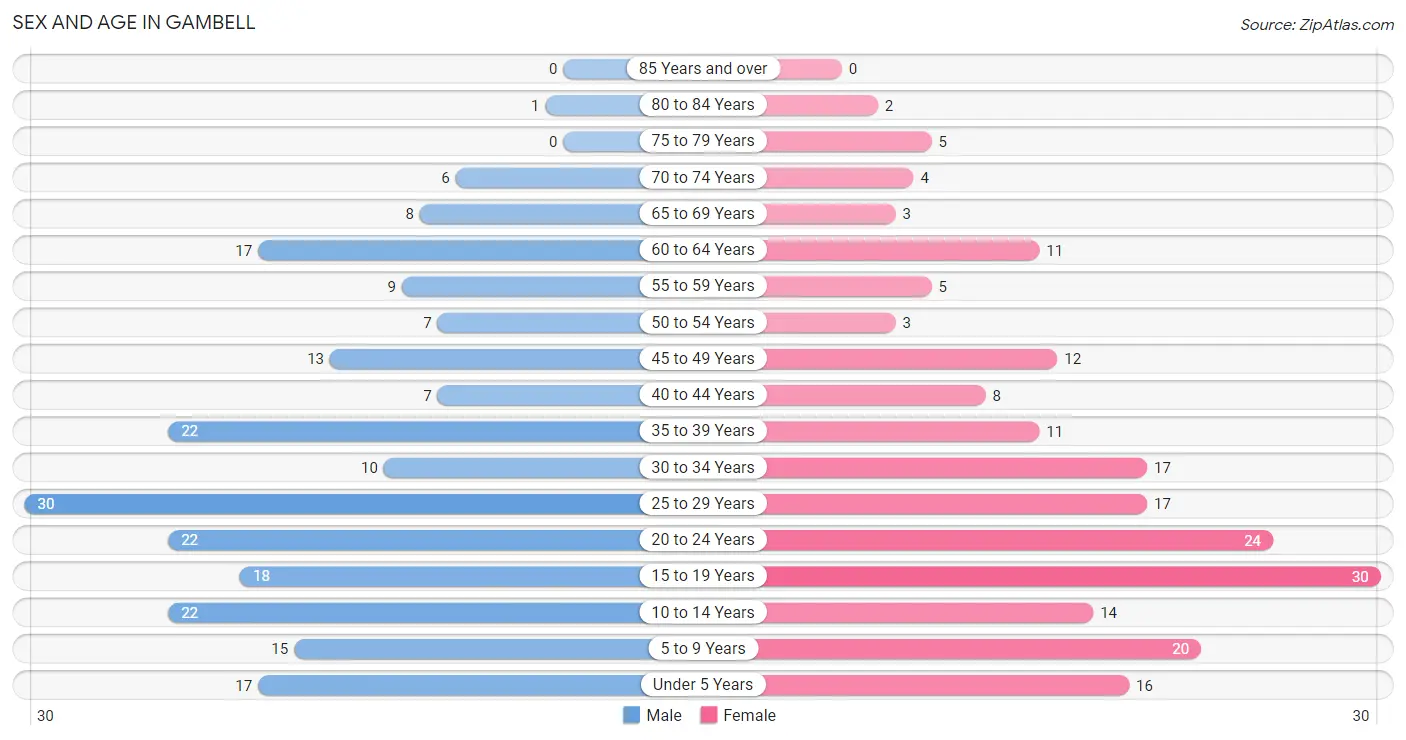
| Age Bracket | Male | Female |
| Under 5 Years | 17 (7.6%) | 16 (7.9%) |
| 5 to 9 Years | 15 (6.7%) | 20 (9.9%) |
| 10 to 14 Years | 22 (9.8%) | 14 (6.9%) |
| 15 to 19 Years | 18 (8.0%) | 30 (14.8%) |
| 20 to 24 Years | 22 (9.8%) | 24 (11.9%) |
| 25 to 29 Years | 30 (13.4%) | 17 (8.4%) |
| 30 to 34 Years | 10 (4.5%) | 17 (8.4%) |
| 35 to 39 Years | 22 (9.8%) | 11 (5.4%) |
| 40 to 44 Years | 7 (3.1%) | 8 (4.0%) |
| 45 to 49 Years | 13 (5.8%) | 12 (5.9%) |
| 50 to 54 Years | 7 (3.1%) | 3 (1.5%) |
| 55 to 59 Years | 9 (4.0%) | 5 (2.5%) |
| 60 to 64 Years | 17 (7.6%) | 11 (5.4%) |
| 65 to 69 Years | 8 (3.6%) | 3 (1.5%) |
| 70 to 74 Years | 6 (2.7%) | 4 (2.0%) |
| 75 to 79 Years | 0 (0.0%) | 5 (2.5%) |
| 80 to 84 Years | 1 (0.4%) | 2 (1.0%) |
| 85 Years and over | 0 (0.0%) | 0 (0.0%) |
| Total | 224 (100.0%) | 202 (100.0%) |
Families and Households in Gambell
Median Family Size in Gambell
The median family size in Gambell is 4.17 persons per family, with married-couple families (29 | 34.9%) accounting for the largest median family size of 5.72 persons per family. On the other hand, single male/father families (23 | 27.7%) represent the smallest median family size with 2.70 persons per family.
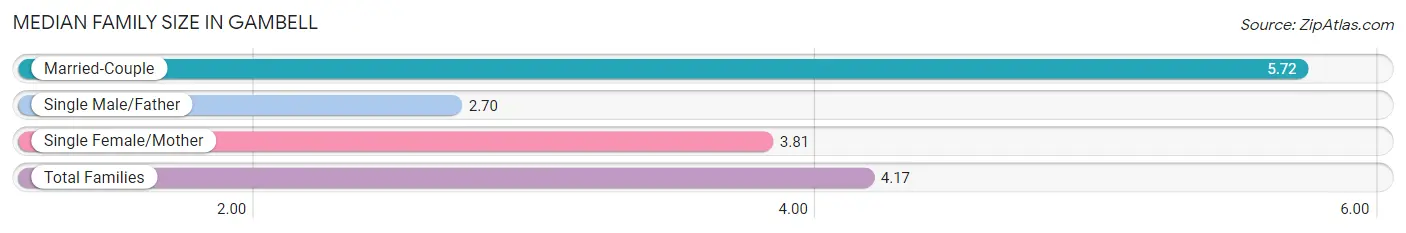
| Family Type | # Families | Family Size |
| Married-Couple | 29 (34.9%) | 5.72 |
| Single Male/Father | 23 (27.7%) | 2.70 |
| Single Female/Mother | 31 (37.3%) | 3.81 |
| Total Families | 83 (100.0%) | 4.17 |
Median Household Size in Gambell
The median household size in Gambell is 3.44 persons per household, with married-couple households (29 | 23.4%) accounting for the largest median household size of 6.03 persons per household. non-family households (41 | 33.1%) represent the smallest median household size with 1.22 persons per household.
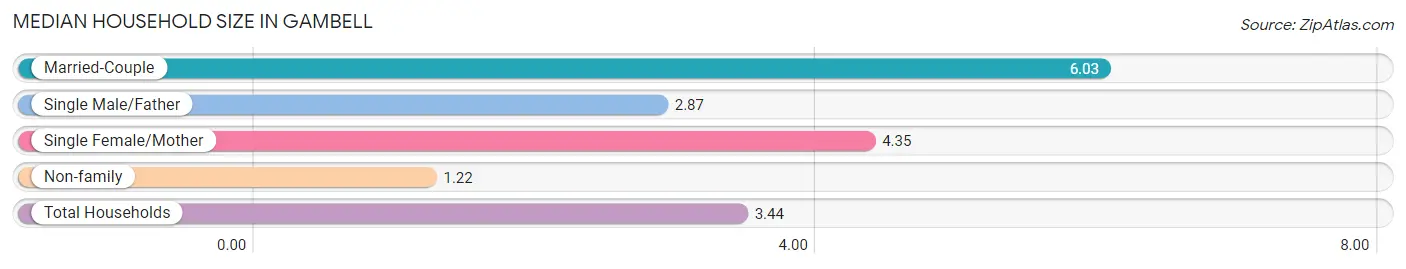
| Household Type | # Households | Household Size |
| Married-Couple | 29 (23.4%) | 6.03 |
| Single Male/Father | 23 (18.5%) | 2.87 |
| Single Female/Mother | 31 (25.0%) | 4.35 |
| Non-family | 41 (33.1%) | 1.22 |
| Total Households | 124 (100.0%) | 3.44 |
Household Size by Marriage Status in Gambell
Out of a total of 124 households in Gambell, 83 (66.9%) are family households, while 41 (33.1%) are nonfamily households. The most numerous type of family households are 7+ person households, comprising 24, and the most common type of nonfamily households are 1-person households, comprising 29.
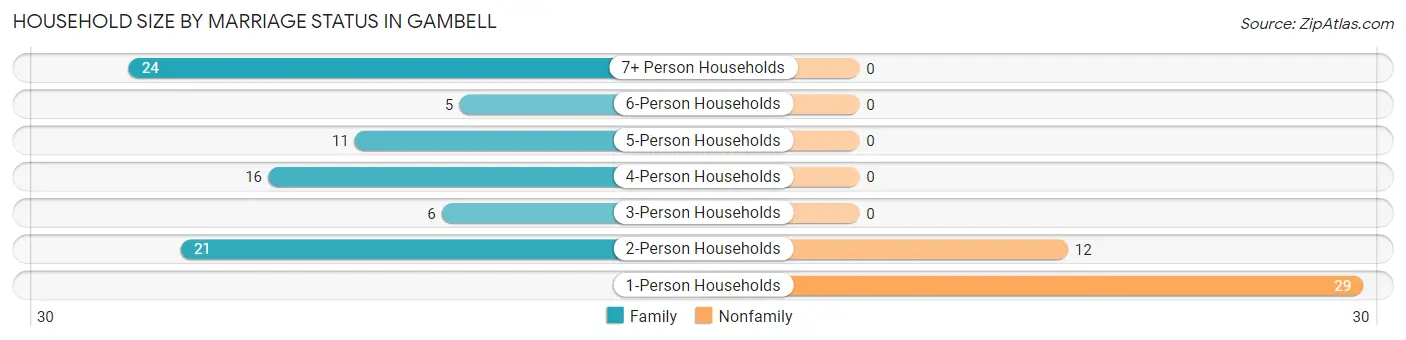
| Household Size | Family Households | Nonfamily Households |
| 1-Person Households | - | 29 (23.4%) |
| 2-Person Households | 21 (16.9%) | 12 (9.7%) |
| 3-Person Households | 6 (4.8%) | 0 (0.0%) |
| 4-Person Households | 16 (12.9%) | 0 (0.0%) |
| 5-Person Households | 11 (8.9%) | 0 (0.0%) |
| 6-Person Households | 5 (4.0%) | 0 (0.0%) |
| 7+ Person Households | 24 (19.4%) | 0 (0.0%) |
| Total | 83 (66.9%) | 41 (33.1%) |
Female Fertility in Gambell
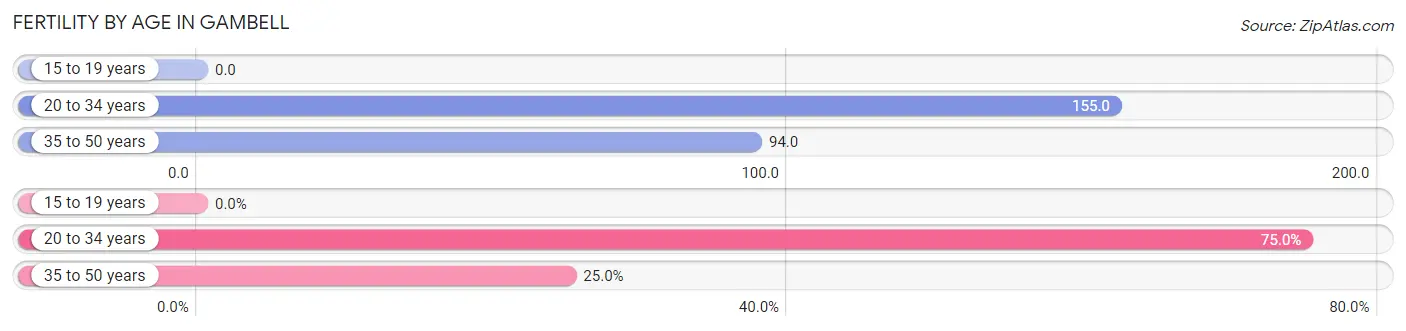
Fertility by Age in Gambell
Average fertility rate in Gambell is 100.0 births per 1,000 women. Women in the age bracket of 20 to 34 years have the highest fertility rate with 155.0 births per 1,000 women. Women in the age bracket of 20 to 34 years acount for 75.0% of all women with births.
| Age Bracket | Women with Births | Births / 1,000 Women |
| 15 to 19 years | 0 (0.0%) | 0.0 |
| 20 to 34 years | 9 (75.0%) | 155.0 |
| 35 to 50 years | 3 (25.0%) | 94.0 |
| Total | 12 (100.0%) | 100.0 |
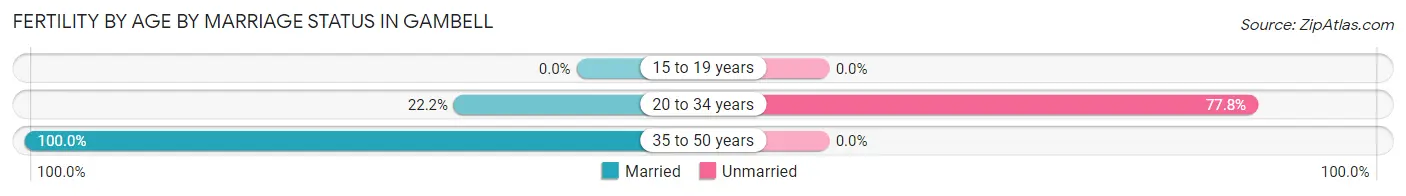
Fertility by Age by Marriage Status in Gambell
41.7% of women with births (12) in Gambell are married. The highest percentage of unmarried women with births falls into 20 to 34 years age bracket with 77.8% of them unmarried at the time of birth, while the lowest percentage of unmarried women with births belong to 35 to 50 years age bracket with 0.0% of them unmarried.
| Age Bracket | Married | Unmarried |
| 15 to 19 years | 0 (0.0%) | 0 (0.0%) |
| 20 to 34 years | 2 (22.2%) | 7 (77.8%) |
| 35 to 50 years | 3 (100.0%) | 0 (0.0%) |
| Total | 5 (41.7%) | 7 (58.3%) |
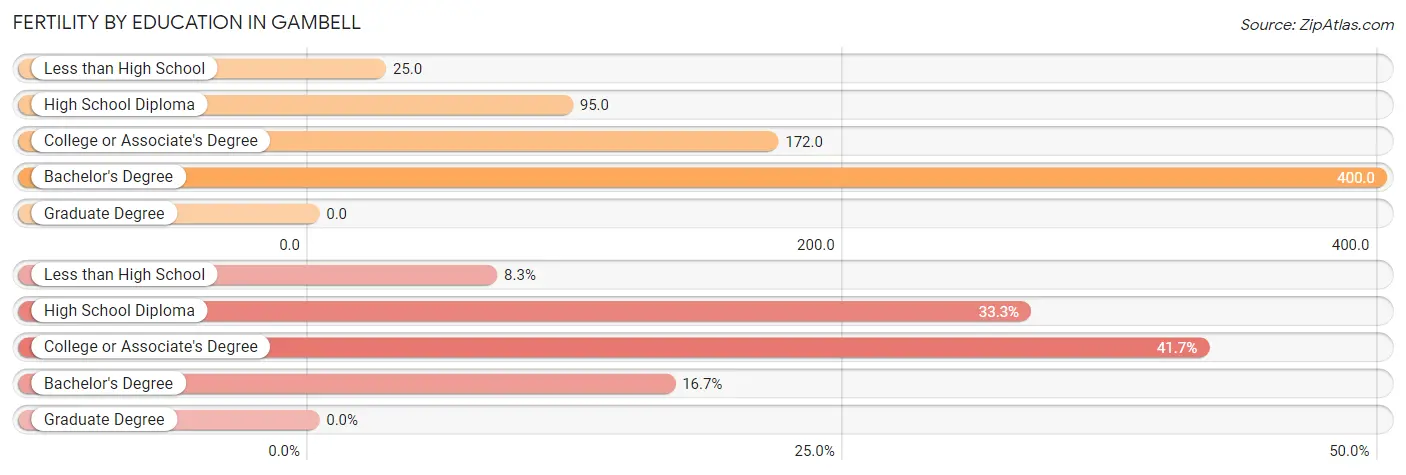
Fertility by Education in Gambell
| Educational Attainment | Women with Births | Births / 1,000 Women |
| Less than High School | 1 (8.3%) | 25.0 |
| High School Diploma | 4 (33.3%) | 95.0 |
| College or Associate's Degree | 5 (41.7%) | 172.0 |
| Bachelor's Degree | 2 (16.7%) | 400.0 |
| Graduate Degree | 0 (0.0%) | 0.0 |
| Total | 12 (100.0%) | 100.0 |
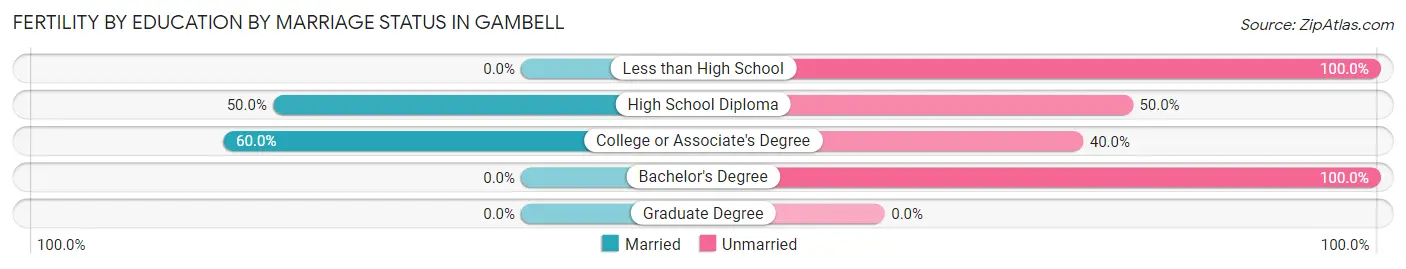
Fertility by Education by Marriage Status in Gambell
58.3% of women with births in Gambell are unmarried. Women with the educational attainment of college or associate's degree are most likely to be married with 60.0% of them married at childbirth, while women with the educational attainment of less than high school are least likely to be married with 100.0% of them unmarried at childbirth.
| Educational Attainment | Married | Unmarried |
| Less than High School | 0 (0.0%) | 1 (100.0%) |
| High School Diploma | 2 (50.0%) | 2 (50.0%) |
| College or Associate's Degree | 3 (60.0%) | 2 (40.0%) |
| Bachelor's Degree | 0 (0.0%) | 2 (100.0%) |
| Graduate Degree | 0 (0.0%) | 0 (0.0%) |
| Total | 5 (41.7%) | 7 (58.3%) |
Employment Characteristics in Gambell
Employment by Class of Employer in Gambell
Among the 122 employed individuals in Gambell, local government employees (40 | 32.8%), state government employees (35 | 28.7%), and private company employees (25 | 20.5%) make up the most common classes of employment.
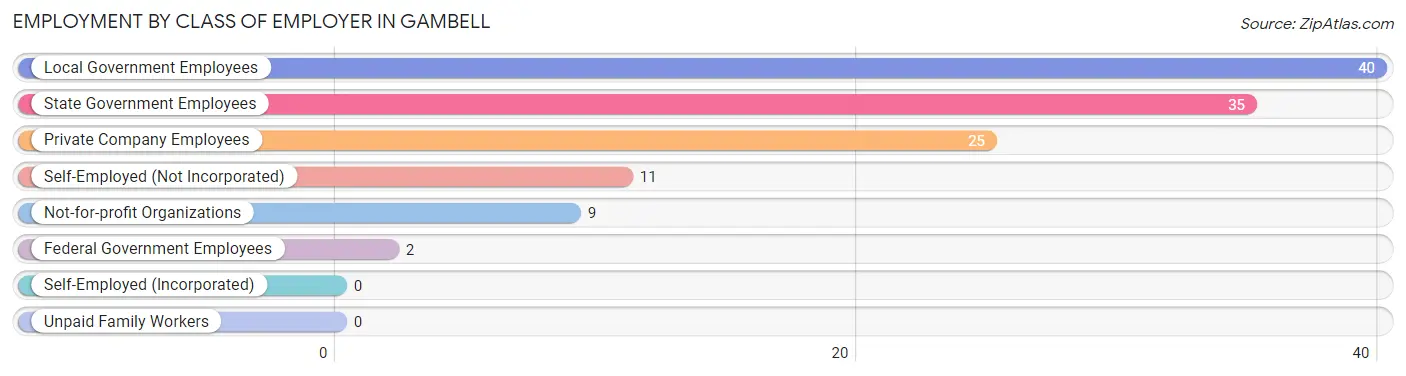
| Employer Class | # Employees | % Employees |
| Private Company Employees | 25 | 20.5% |
| Self-Employed (Incorporated) | 0 | 0.0% |
| Self-Employed (Not Incorporated) | 11 | 9.0% |
| Not-for-profit Organizations | 9 | 7.4% |
| Local Government Employees | 40 | 32.8% |
| State Government Employees | 35 | 28.7% |
| Federal Government Employees | 2 | 1.6% |
| Unpaid Family Workers | 0 | 0.0% |
| Total | 122 | 100.0% |
Employment Status by Age in Gambell
According to the labor force statistics for Gambell, out of the total population over 16 years of age (310), 58.4% or 181 individuals are in the labor force, with 31.5% or 57 of them unemployed. The age group with the highest labor force participation rate is 35 to 44 years, with 89.6% or 43 individuals in the labor force. Within the labor force, the 16 to 19 years age range has the highest percentage of unemployed individuals, with 100.0% or 3 of them being unemployed.
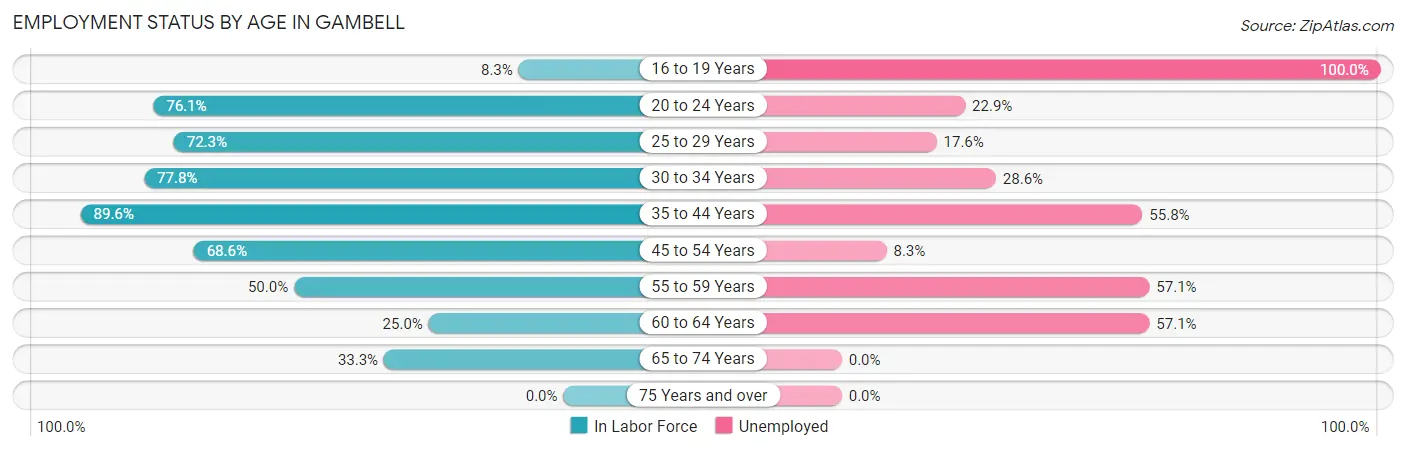
| Age Bracket | In Labor Force | Unemployed |
| 16 to 19 Years | 3 (8.3%) | 3 (100.0%) |
| 20 to 24 Years | 35 (76.1%) | 8 (22.9%) |
| 25 to 29 Years | 34 (72.3%) | 6 (17.6%) |
| 30 to 34 Years | 21 (77.8%) | 6 (28.6%) |
| 35 to 44 Years | 43 (89.6%) | 24 (55.8%) |
| 45 to 54 Years | 24 (68.6%) | 2 (8.3%) |
| 55 to 59 Years | 7 (50.0%) | 4 (57.1%) |
| 60 to 64 Years | 7 (25.0%) | 4 (57.1%) |
| 65 to 74 Years | 7 (33.3%) | 0 (0.0%) |
| 75 Years and over | 0 (0.0%) | 0 (0.0%) |
| Total | 181 (58.4%) | 57 (31.5%) |
Employment Status by Educational Attainment in Gambell
According to labor force statistics for Gambell, 68.3% of individuals (136) out of the total population between 25 and 64 years of age (199) are in the labor force, with 33.8% or 46 of them being unemployed. The group with the highest labor force participation rate are those with the educational attainment of bachelor's degree or higher, with 100.0% or 6 individuals in the labor force. Within the labor force, individuals with less than high school education have the highest percentage of unemployment, with 47.8% or 11 of them being unemployed.
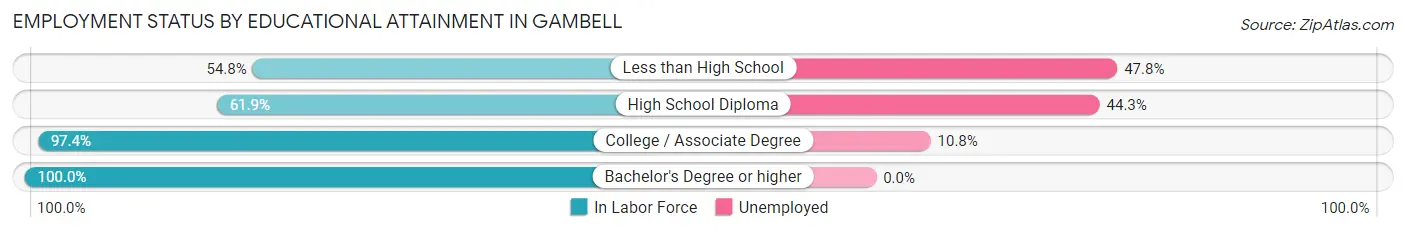
| Educational Attainment | In Labor Force | Unemployed |
| Less than High School | 23 (54.8%) | 20 (47.8%) |
| High School Diploma | 70 (61.9%) | 50 (44.3%) |
| College / Associate Degree | 37 (97.4%) | 4 (10.8%) |
| Bachelor's Degree or higher | 6 (100.0%) | 0 (0.0%) |
| Total | 136 (68.3%) | 67 (33.8%) |
Employment Occupations by Sex in Gambell
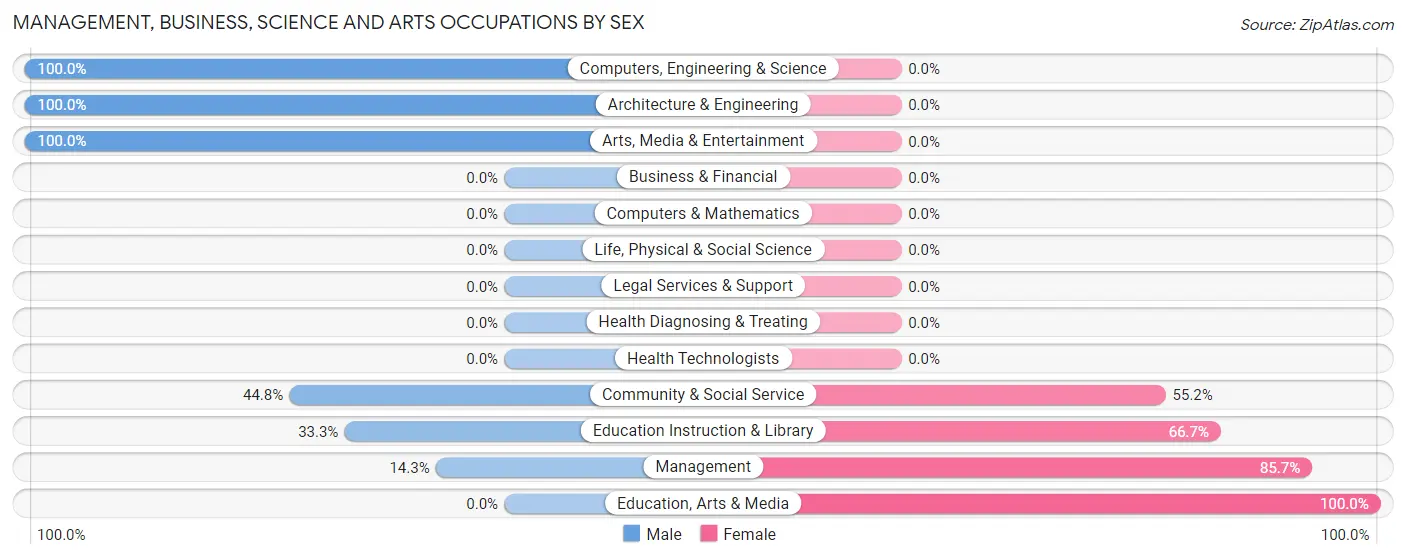
Management, Business, Science and Arts Occupations
The most common Management, Business, Science and Arts occupations in Gambell are Community & Social Service (29 | 23.4%), Education Instruction & Library (21 | 16.9%), Management (14 | 11.3%), Arts, Media & Entertainment (6 | 4.8%), and Computers, Engineering & Science (2 | 1.6%).
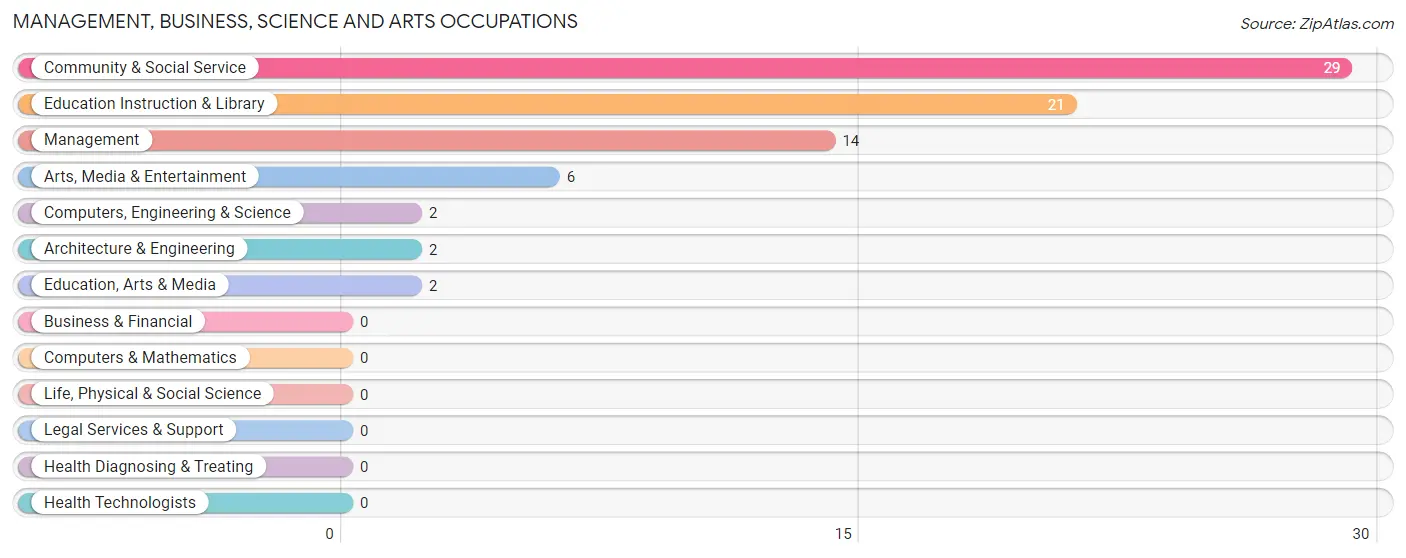
Management, Business, Science and Arts Occupations by Sex
Within the Management, Business, Science and Arts occupations in Gambell, the most male-oriented occupations are Computers, Engineering & Science (100.0%), Architecture & Engineering (100.0%), and Arts, Media & Entertainment (100.0%), while the most female-oriented occupations are Education, Arts & Media (100.0%), Management (85.7%), and Education Instruction & Library (66.7%).
| Occupation | Male | Female |
| Management | 2 (14.3%) | 12 (85.7%) |
| Business & Financial | 0 (0.0%) | 0 (0.0%) |
| Computers, Engineering & Science | 2 (100.0%) | 0 (0.0%) |
| Computers & Mathematics | 0 (0.0%) | 0 (0.0%) |
| Architecture & Engineering | 2 (100.0%) | 0 (0.0%) |
| Life, Physical & Social Science | 0 (0.0%) | 0 (0.0%) |
| Community & Social Service | 13 (44.8%) | 16 (55.2%) |
| Education, Arts & Media | 0 (0.0%) | 2 (100.0%) |
| Legal Services & Support | 0 (0.0%) | 0 (0.0%) |
| Education Instruction & Library | 7 (33.3%) | 14 (66.7%) |
| Arts, Media & Entertainment | 6 (100.0%) | 0 (0.0%) |
| Health Diagnosing & Treating | 0 (0.0%) | 0 (0.0%) |
| Health Technologists | 0 (0.0%) | 0 (0.0%) |
| Total (Category) | 17 (37.8%) | 28 (62.2%) |
| Total (Overall) | 59 (47.6%) | 65 (52.4%) |
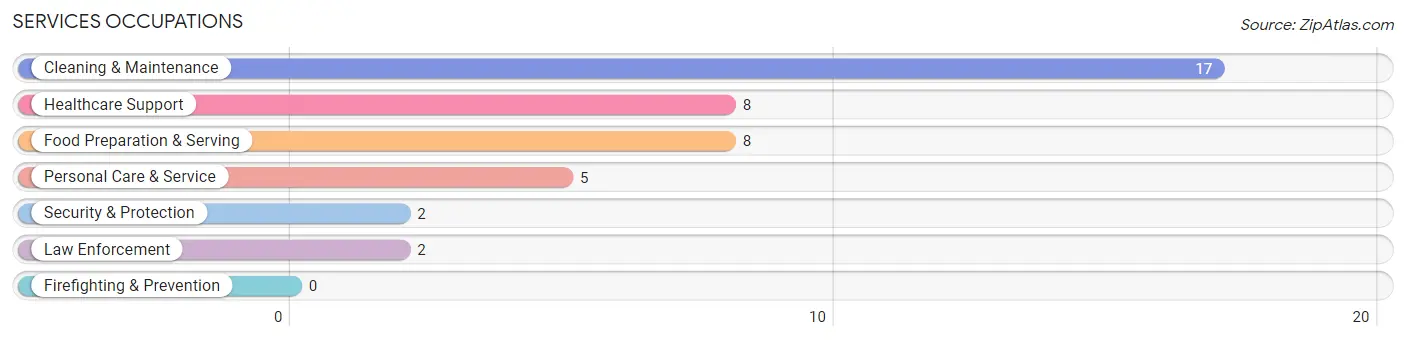
Services Occupations
The most common Services occupations in Gambell are Cleaning & Maintenance (17 | 13.7%), Healthcare Support (8 | 6.5%), Food Preparation & Serving (8 | 6.5%), Personal Care & Service (5 | 4.0%), and Security & Protection (2 | 1.6%).
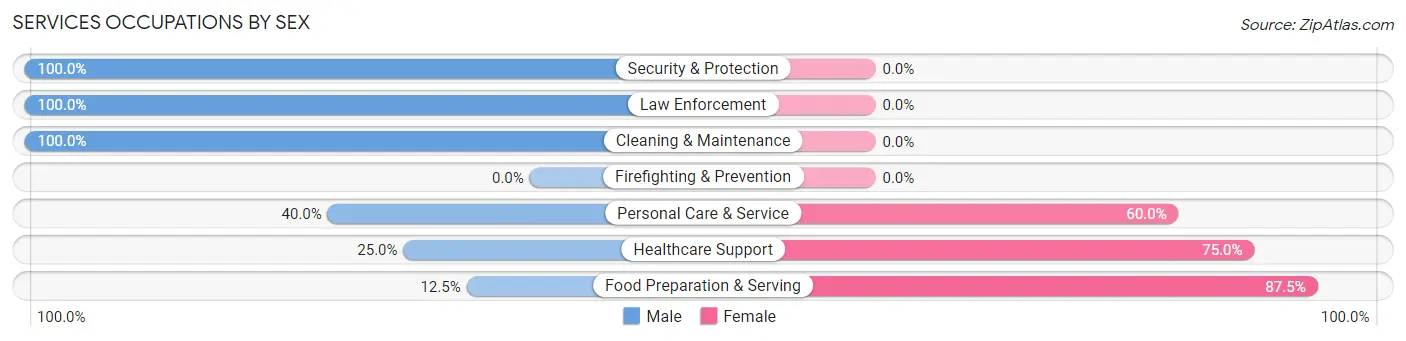
Services Occupations by Sex
Within the Services occupations in Gambell, the most male-oriented occupations are Security & Protection (100.0%), Law Enforcement (100.0%), and Cleaning & Maintenance (100.0%), while the most female-oriented occupations are Food Preparation & Serving (87.5%), Healthcare Support (75.0%), and Personal Care & Service (60.0%).
| Occupation | Male | Female |
| Healthcare Support | 2 (25.0%) | 6 (75.0%) |
| Security & Protection | 2 (100.0%) | 0 (0.0%) |
| Firefighting & Prevention | 0 (0.0%) | 0 (0.0%) |
| Law Enforcement | 2 (100.0%) | 0 (0.0%) |
| Food Preparation & Serving | 1 (12.5%) | 7 (87.5%) |
| Cleaning & Maintenance | 17 (100.0%) | 0 (0.0%) |
| Personal Care & Service | 2 (40.0%) | 3 (60.0%) |
| Total (Category) | 24 (60.0%) | 16 (40.0%) |
| Total (Overall) | 59 (47.6%) | 65 (52.4%) |
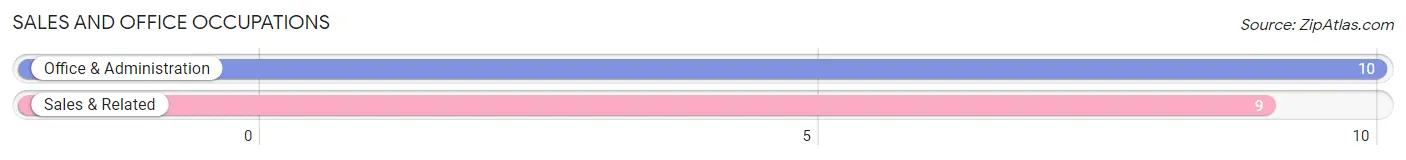
Sales and Office Occupations
The most common Sales and Office occupations in Gambell are Office & Administration (10 | 8.1%), and Sales & Related (9 | 7.3%).
Sales and Office Occupations by Sex
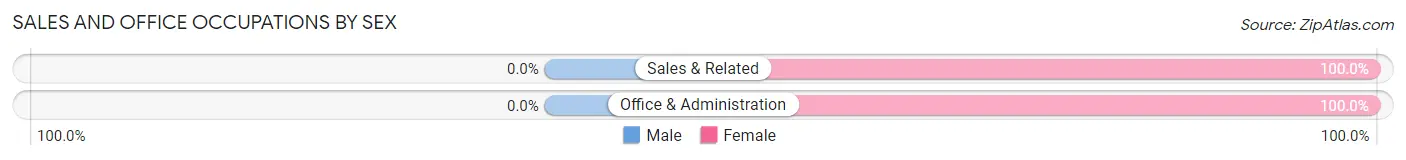
| Occupation | Male | Female |
| Sales & Related | 0 (0.0%) | 9 (100.0%) |
| Office & Administration | 0 (0.0%) | 10 (100.0%) |
| Total (Category) | 0 (0.0%) | 19 (100.0%) |
| Total (Overall) | 59 (47.6%) | 65 (52.4%) |
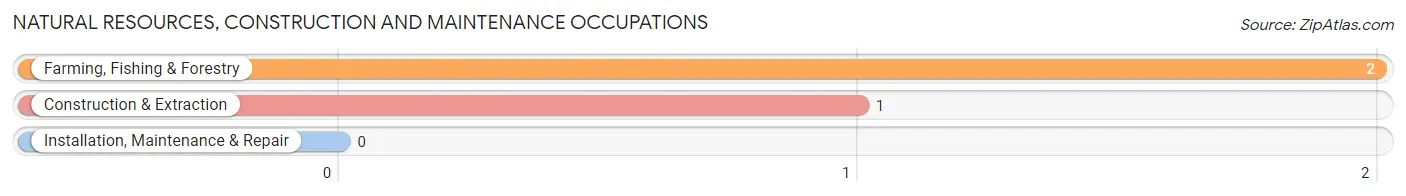
Natural Resources, Construction and Maintenance Occupations
The most common Natural Resources, Construction and Maintenance occupations in Gambell are Farming, Fishing & Forestry (2 | 1.6%), and Construction & Extraction (1 | 0.8%).
Natural Resources, Construction and Maintenance Occupations by Sex
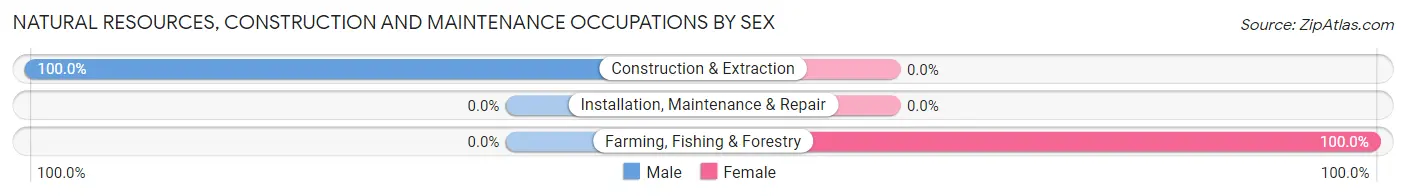
| Occupation | Male | Female |
| Farming, Fishing & Forestry | 0 (0.0%) | 2 (100.0%) |
| Construction & Extraction | 1 (100.0%) | 0 (0.0%) |
| Installation, Maintenance & Repair | 0 (0.0%) | 0 (0.0%) |
| Total (Category) | 1 (33.3%) | 2 (66.7%) |
| Total (Overall) | 59 (47.6%) | 65 (52.4%) |
Production, Transportation and Moving Occupations
The most common Production, Transportation and Moving occupations in Gambell are Production (9 | 7.3%), Material Moving (6 | 4.8%), and Transportation (2 | 1.6%).
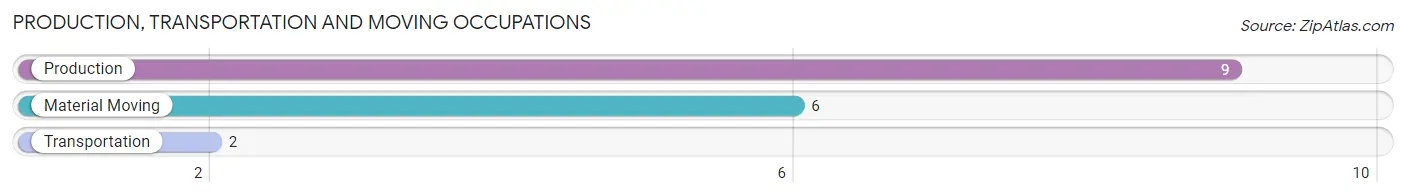
Production, Transportation and Moving Occupations by Sex
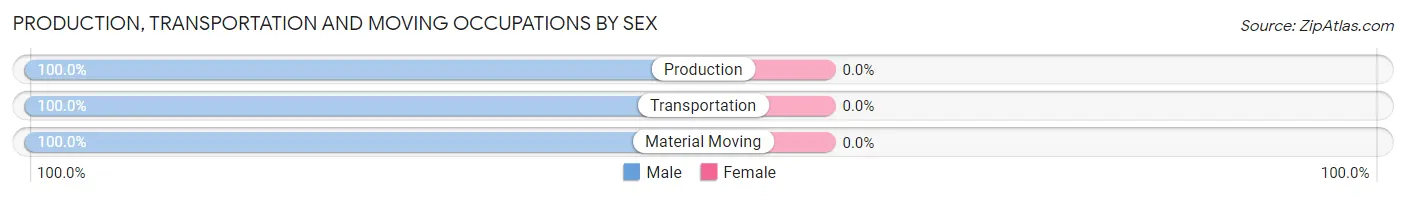
| Occupation | Male | Female |
| Production | 9 (100.0%) | 0 (0.0%) |
| Transportation | 2 (100.0%) | 0 (0.0%) |
| Material Moving | 6 (100.0%) | 0 (0.0%) |
| Total (Category) | 17 (100.0%) | 0 (0.0%) |
| Total (Overall) | 59 (47.6%) | 65 (52.4%) |
Employment Industries by Sex in Gambell
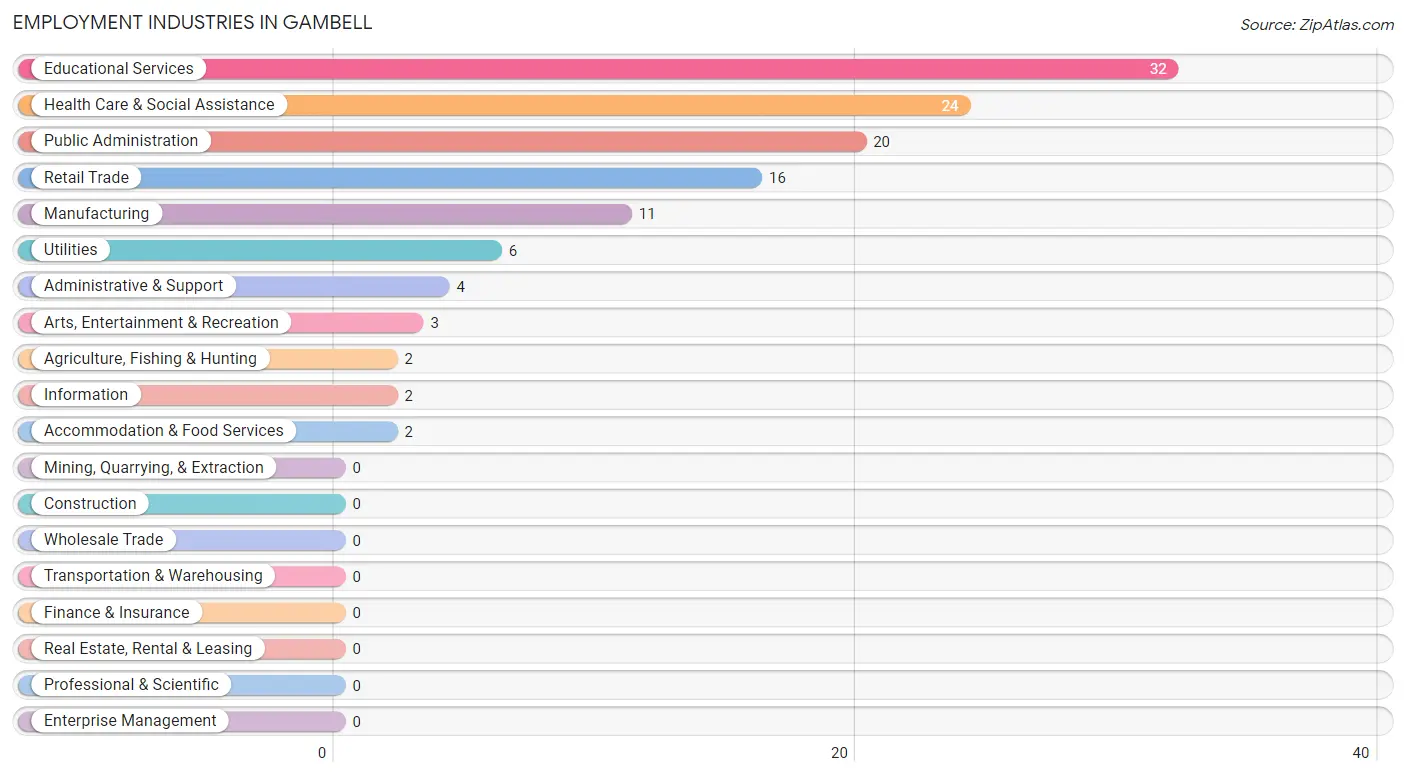
Employment Industries in Gambell
The major employment industries in Gambell include Educational Services (32 | 25.8%), Health Care & Social Assistance (24 | 19.4%), Public Administration (20 | 16.1%), Retail Trade (16 | 12.9%), and Manufacturing (11 | 8.9%).
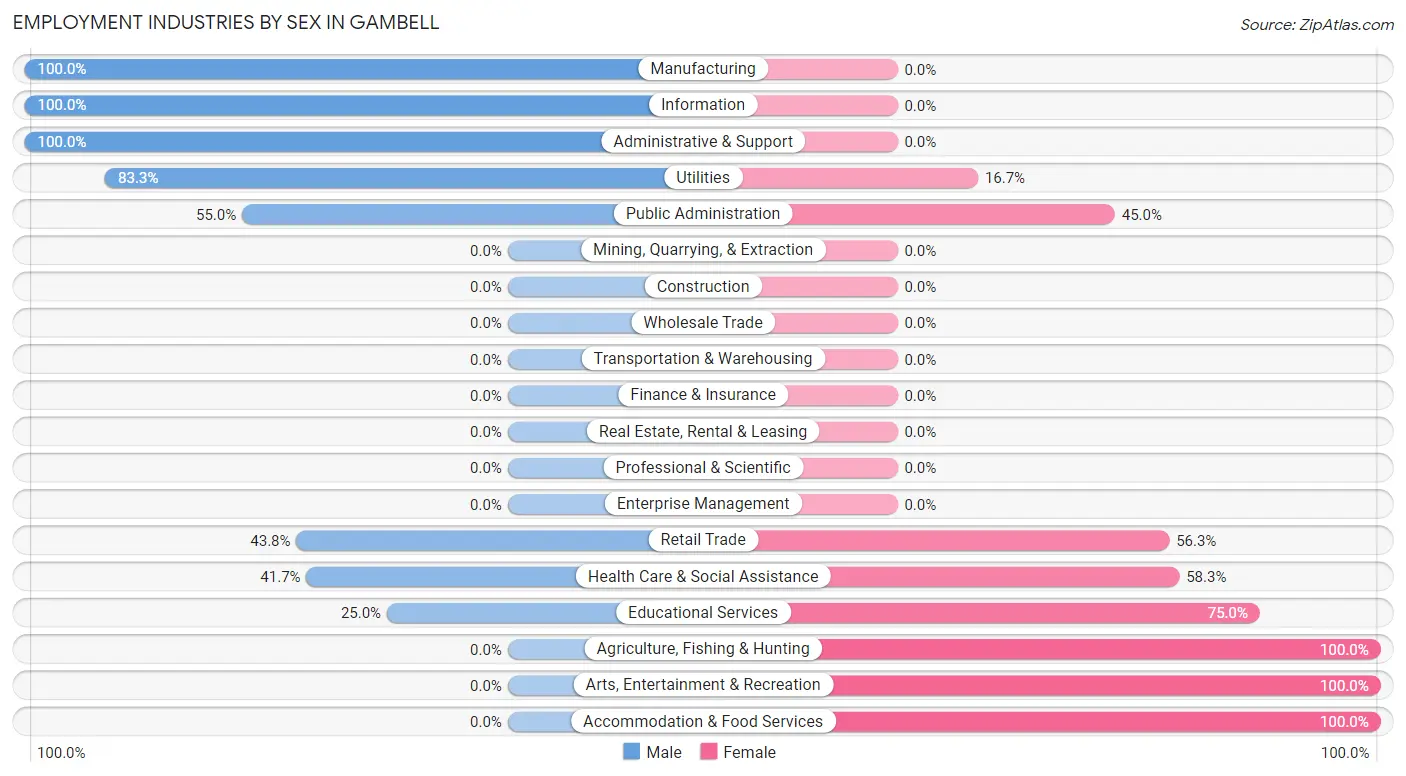
Employment Industries by Sex in Gambell
The Gambell industries that see more men than women are Manufacturing (100.0%), Information (100.0%), and Administrative & Support (100.0%), whereas the industries that tend to have a higher number of women are Agriculture, Fishing & Hunting (100.0%), Arts, Entertainment & Recreation (100.0%), and Accommodation & Food Services (100.0%).
| Industry | Male | Female |
| Agriculture, Fishing & Hunting | 0 (0.0%) | 2 (100.0%) |
| Mining, Quarrying, & Extraction | 0 (0.0%) | 0 (0.0%) |
| Construction | 0 (0.0%) | 0 (0.0%) |
| Manufacturing | 11 (100.0%) | 0 (0.0%) |
| Wholesale Trade | 0 (0.0%) | 0 (0.0%) |
| Retail Trade | 7 (43.8%) | 9 (56.2%) |
| Transportation & Warehousing | 0 (0.0%) | 0 (0.0%) |
| Utilities | 5 (83.3%) | 1 (16.7%) |
| Information | 2 (100.0%) | 0 (0.0%) |
| Finance & Insurance | 0 (0.0%) | 0 (0.0%) |
| Real Estate, Rental & Leasing | 0 (0.0%) | 0 (0.0%) |
| Professional & Scientific | 0 (0.0%) | 0 (0.0%) |
| Enterprise Management | 0 (0.0%) | 0 (0.0%) |
| Administrative & Support | 4 (100.0%) | 0 (0.0%) |
| Educational Services | 8 (25.0%) | 24 (75.0%) |
| Health Care & Social Assistance | 10 (41.7%) | 14 (58.3%) |
| Arts, Entertainment & Recreation | 0 (0.0%) | 3 (100.0%) |
| Accommodation & Food Services | 0 (0.0%) | 2 (100.0%) |
| Public Administration | 11 (55.0%) | 9 (45.0%) |
| Total | 59 (47.6%) | 65 (52.4%) |
Education in Gambell
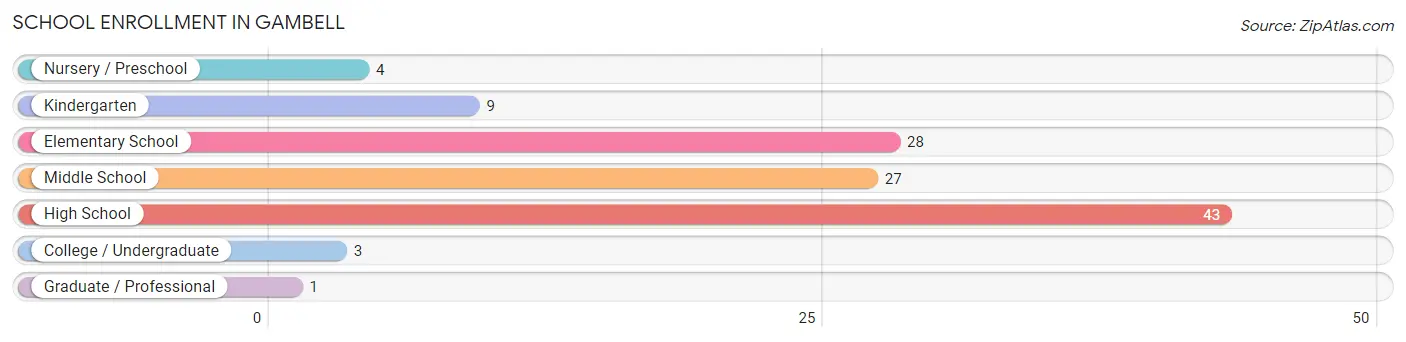
School Enrollment in Gambell
The most common levels of schooling among the 115 students in Gambell are high school (43 | 37.4%), elementary school (28 | 24.3%), and middle school (27 | 23.5%).
| School Level | # Students | % Students |
| Nursery / Preschool | 4 | 3.5% |
| Kindergarten | 9 | 7.8% |
| Elementary School | 28 | 24.3% |
| Middle School | 27 | 23.5% |
| High School | 43 | 37.4% |
| College / Undergraduate | 3 | 2.6% |
| Graduate / Professional | 1 | 0.9% |
| Total | 115 | 100.0% |
School Enrollment by Age by Funding Source in Gambell
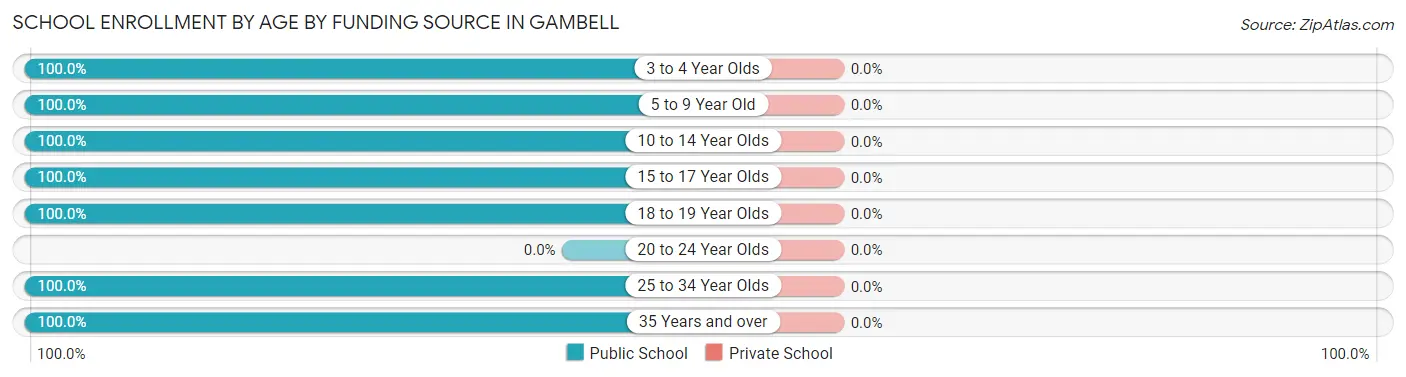
| Age Bracket | Public School | Private School |
| 3 to 4 Year Olds | 5 (100.0%) | 0 (0.0%) |
| 5 to 9 Year Old | 32 (100.0%) | 0 (0.0%) |
| 10 to 14 Year Olds | 36 (100.0%) | 0 (0.0%) |
| 15 to 17 Year Olds | 35 (100.0%) | 0 (0.0%) |
| 18 to 19 Year Olds | 3 (100.0%) | 0 (0.0%) |
| 20 to 24 Year Olds | 0 (0.0%) | 0 (0.0%) |
| 25 to 34 Year Olds | 1 (100.0%) | 0 (0.0%) |
| 35 Years and over | 3 (100.0%) | 0 (0.0%) |
| Total | 115 (100.0%) | 0 (0.0%) |
Educational Attainment by Field of Study in Gambell
Education (10 | 62.5%), business (4 | 25.0%), psychology (1 | 6.2%), and social sciences (1 | 6.2%) are the most common fields of study among 16 individuals in Gambell who have obtained a bachelor's degree or higher.
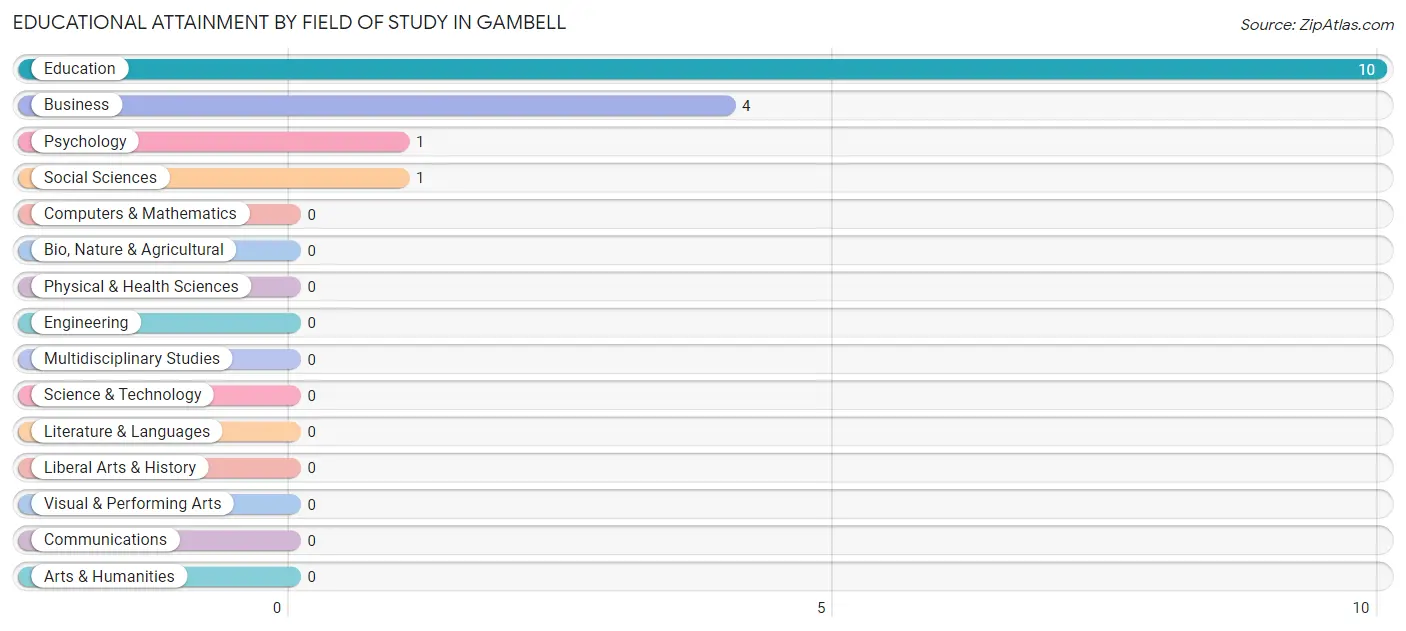
| Field of Study | # Graduates | % Graduates |
| Computers & Mathematics | 0 | 0.0% |
| Bio, Nature & Agricultural | 0 | 0.0% |
| Physical & Health Sciences | 0 | 0.0% |
| Psychology | 1 | 6.2% |
| Social Sciences | 1 | 6.2% |
| Engineering | 0 | 0.0% |
| Multidisciplinary Studies | 0 | 0.0% |
| Science & Technology | 0 | 0.0% |
| Business | 4 | 25.0% |
| Education | 10 | 62.5% |
| Literature & Languages | 0 | 0.0% |
| Liberal Arts & History | 0 | 0.0% |
| Visual & Performing Arts | 0 | 0.0% |
| Communications | 0 | 0.0% |
| Arts & Humanities | 0 | 0.0% |
| Total | 16 | 100.0% |
Transportation & Commute in Gambell
Vehicle Availability by Sex in Gambell
The most prevalent vehicle ownership categories in Gambell are males with no vehicle (53, accounting for 89.8%) and females with no vehicle (55, making up 84.1%).
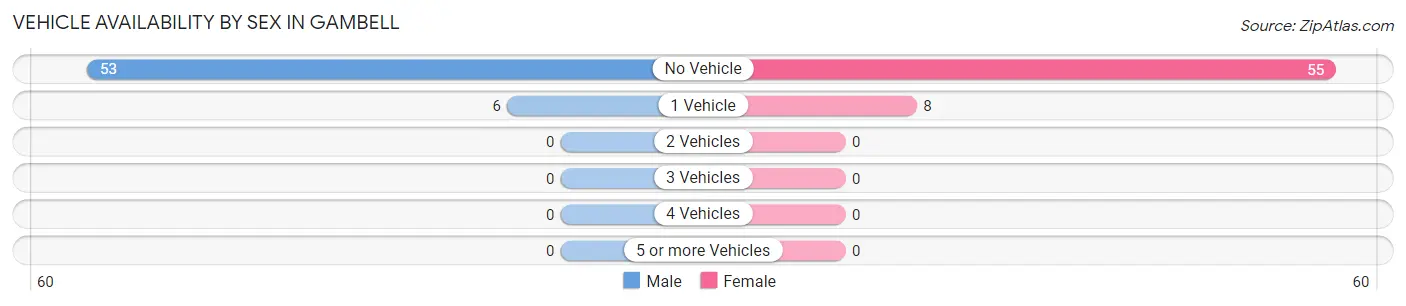
| Vehicles Available | Male | Female |
| No Vehicle | 53 (89.8%) | 55 (87.3%) |
| 1 Vehicle | 6 (10.2%) | 8 (12.7%) |
| 2 Vehicles | 0 (0.0%) | 0 (0.0%) |
| 3 Vehicles | 0 (0.0%) | 0 (0.0%) |
| 4 Vehicles | 0 (0.0%) | 0 (0.0%) |
| 5 or more Vehicles | 0 (0.0%) | 0 (0.0%) |
| Total | 59 (100.0%) | 63 (100.0%) |
Commute Time in Gambell
The most frequently occuring commute durations in Gambell are less than 5 minutes (90 commuters, 82.6%), 5 to 9 minutes (8 commuters, 7.3%), and 10 to 14 minutes (7 commuters, 6.4%).
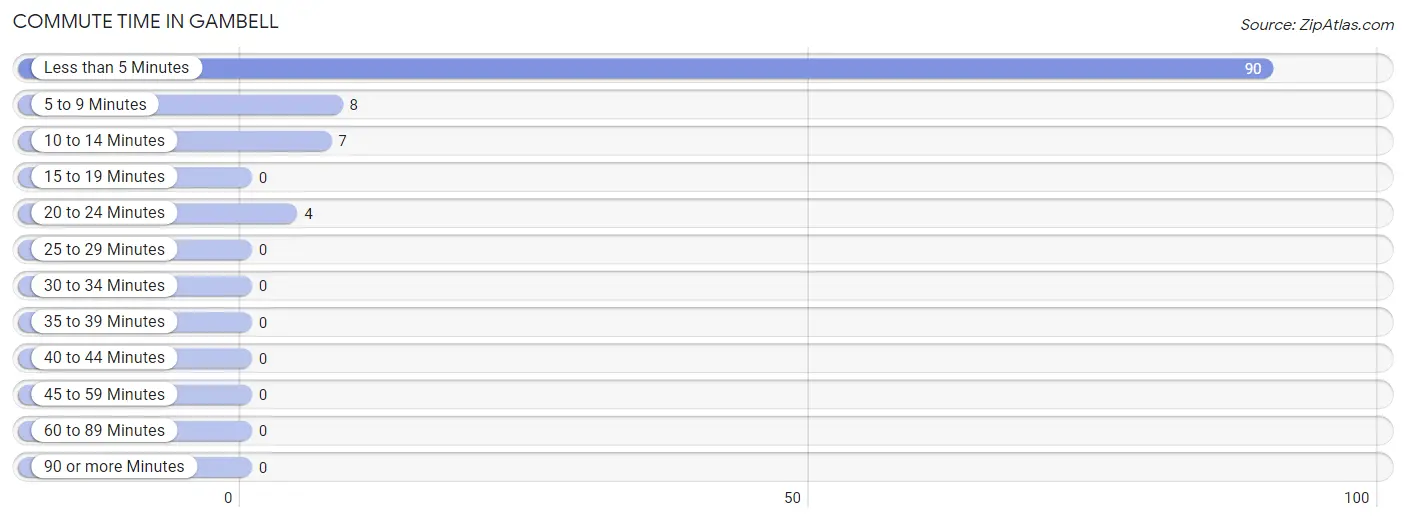
| Commute Time | # Commuters | % Commuters |
| Less than 5 Minutes | 90 | 82.6% |
| 5 to 9 Minutes | 8 | 7.3% |
| 10 to 14 Minutes | 7 | 6.4% |
| 15 to 19 Minutes | 0 | 0.0% |
| 20 to 24 Minutes | 4 | 3.7% |
| 25 to 29 Minutes | 0 | 0.0% |
| 30 to 34 Minutes | 0 | 0.0% |
| 35 to 39 Minutes | 0 | 0.0% |
| 40 to 44 Minutes | 0 | 0.0% |
| 45 to 59 Minutes | 0 | 0.0% |
| 60 to 89 Minutes | 0 | 0.0% |
| 90 or more Minutes | 0 | 0.0% |
Commute Time by Sex in Gambell
The most common commute times in Gambell are less than 5 minutes (37 commuters, 80.4%) for males and less than 5 minutes (53 commuters, 84.1%) for females.
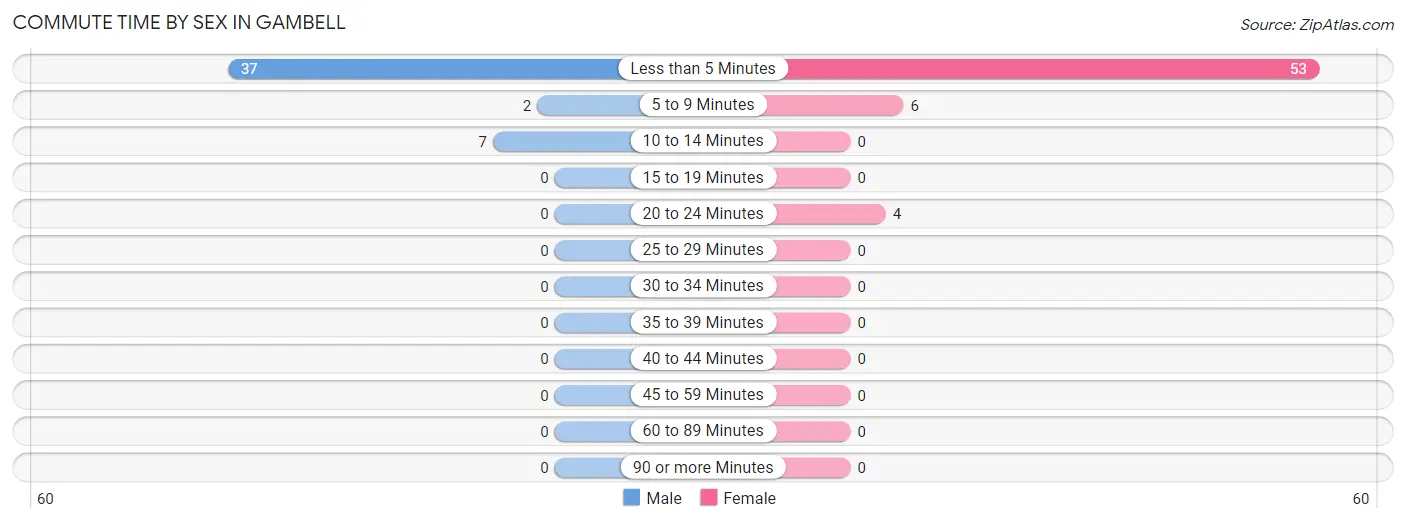
| Commute Time | Male | Female |
| Less than 5 Minutes | 37 (80.4%) | 53 (84.1%) |
| 5 to 9 Minutes | 2 (4.3%) | 6 (9.5%) |
| 10 to 14 Minutes | 7 (15.2%) | 0 (0.0%) |
| 15 to 19 Minutes | 0 (0.0%) | 0 (0.0%) |
| 20 to 24 Minutes | 0 (0.0%) | 4 (6.4%) |
| 25 to 29 Minutes | 0 (0.0%) | 0 (0.0%) |
| 30 to 34 Minutes | 0 (0.0%) | 0 (0.0%) |
| 35 to 39 Minutes | 0 (0.0%) | 0 (0.0%) |
| 40 to 44 Minutes | 0 (0.0%) | 0 (0.0%) |
| 45 to 59 Minutes | 0 (0.0%) | 0 (0.0%) |
| 60 to 89 Minutes | 0 (0.0%) | 0 (0.0%) |
| 90 or more Minutes | 0 (0.0%) | 0 (0.0%) |
Time of Departure to Work by Sex in Gambell
The most frequent times of departure to work in Gambell are 8:30 AM to 8:59 AM (19, 41.3%) for males and 7:30 AM to 7:59 AM (14, 22.2%) for females.
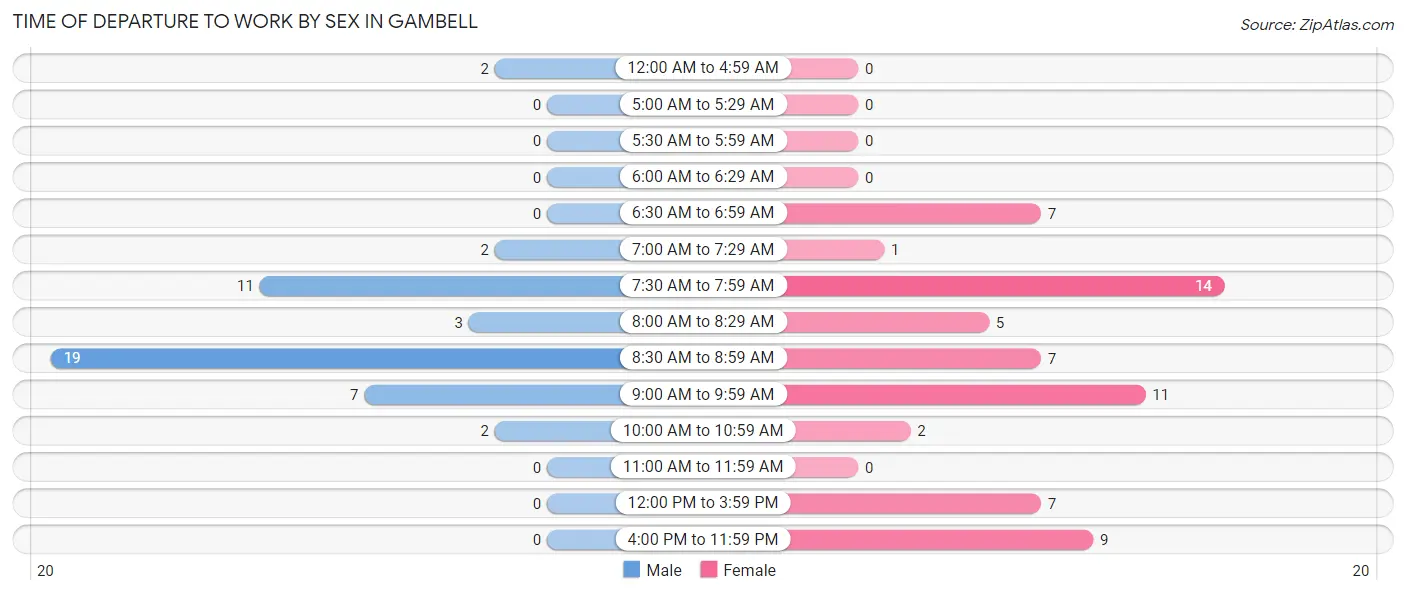
| Time of Departure | Male | Female |
| 12:00 AM to 4:59 AM | 2 (4.3%) | 0 (0.0%) |
| 5:00 AM to 5:29 AM | 0 (0.0%) | 0 (0.0%) |
| 5:30 AM to 5:59 AM | 0 (0.0%) | 0 (0.0%) |
| 6:00 AM to 6:29 AM | 0 (0.0%) | 0 (0.0%) |
| 6:30 AM to 6:59 AM | 0 (0.0%) | 7 (11.1%) |
| 7:00 AM to 7:29 AM | 2 (4.3%) | 1 (1.6%) |
| 7:30 AM to 7:59 AM | 11 (23.9%) | 14 (22.2%) |
| 8:00 AM to 8:29 AM | 3 (6.5%) | 5 (7.9%) |
| 8:30 AM to 8:59 AM | 19 (41.3%) | 7 (11.1%) |
| 9:00 AM to 9:59 AM | 7 (15.2%) | 11 (17.5%) |
| 10:00 AM to 10:59 AM | 2 (4.3%) | 2 (3.2%) |
| 11:00 AM to 11:59 AM | 0 (0.0%) | 0 (0.0%) |
| 12:00 PM to 3:59 PM | 0 (0.0%) | 7 (11.1%) |
| 4:00 PM to 11:59 PM | 0 (0.0%) | 9 (14.3%) |
| Total | 46 (100.0%) | 63 (100.0%) |
Housing Occupancy in Gambell
Occupancy by Ownership in Gambell
Of the total 124 dwellings in Gambell, owner-occupied units account for 104 (83.9%), while renter-occupied units make up 20 (16.1%).
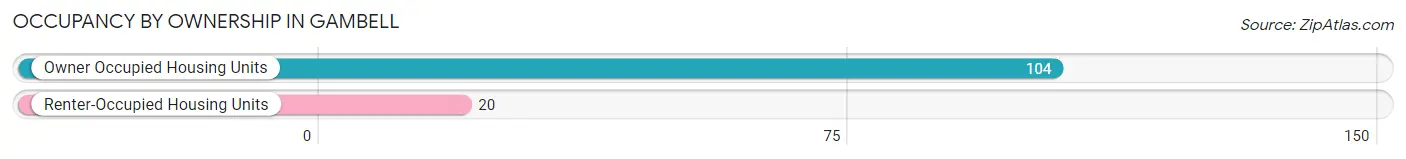
| Occupancy | # Housing Units | % Housing Units |
| Owner Occupied Housing Units | 104 | 83.9% |
| Renter-Occupied Housing Units | 20 | 16.1% |
| Total Occupied Housing Units | 124 | 100.0% |
Occupancy by Household Size in Gambell
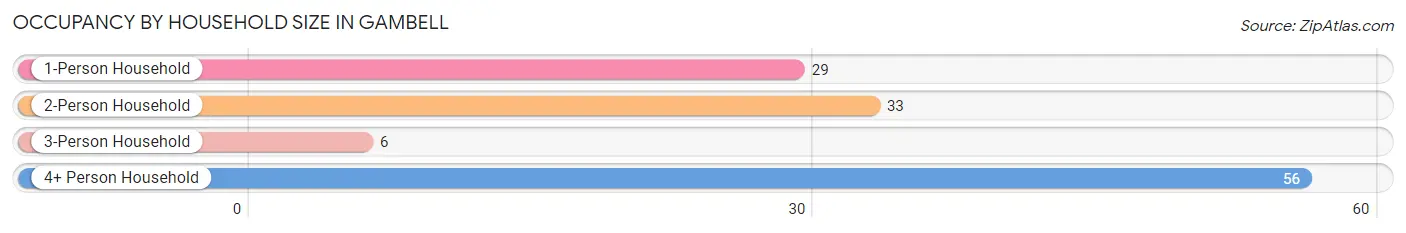
| Household Size | # Housing Units | % Housing Units |
| 1-Person Household | 29 | 23.4% |
| 2-Person Household | 33 | 26.6% |
| 3-Person Household | 6 | 4.8% |
| 4+ Person Household | 56 | 45.2% |
| Total Housing Units | 124 | 100.0% |
Occupancy by Ownership by Household Size in Gambell
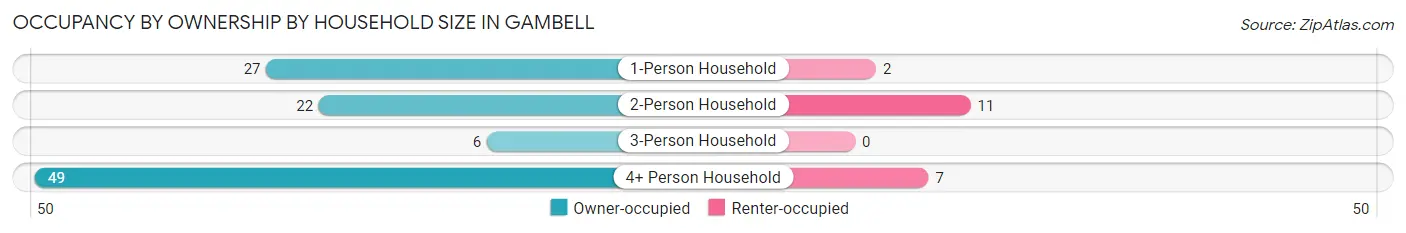
| Household Size | Owner-occupied | Renter-occupied |
| 1-Person Household | 27 (93.1%) | 2 (6.9%) |
| 2-Person Household | 22 (66.7%) | 11 (33.3%) |
| 3-Person Household | 6 (100.0%) | 0 (0.0%) |
| 4+ Person Household | 49 (87.5%) | 7 (12.5%) |
| Total Housing Units | 104 (83.9%) | 20 (16.1%) |
Occupancy by Educational Attainment in Gambell
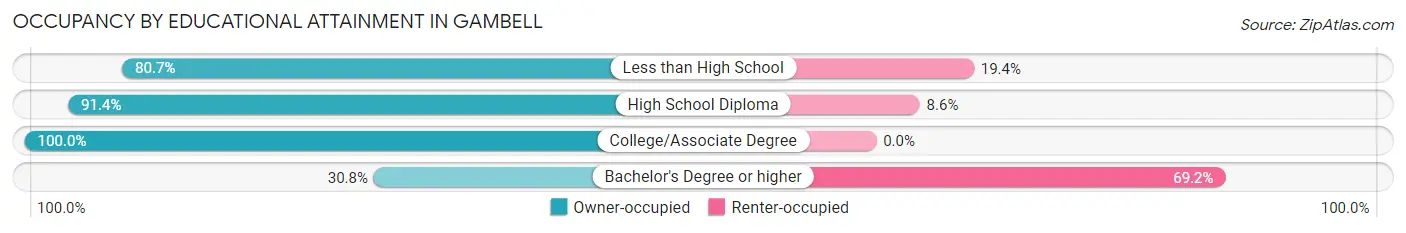
| Household Size | Owner-occupied | Renter-occupied |
| Less than High School | 25 (80.6%) | 6 (19.4%) |
| High School Diploma | 53 (91.4%) | 5 (8.6%) |
| College/Associate Degree | 22 (100.0%) | 0 (0.0%) |
| Bachelor's Degree or higher | 4 (30.8%) | 9 (69.2%) |
Occupancy by Age of Householder in Gambell
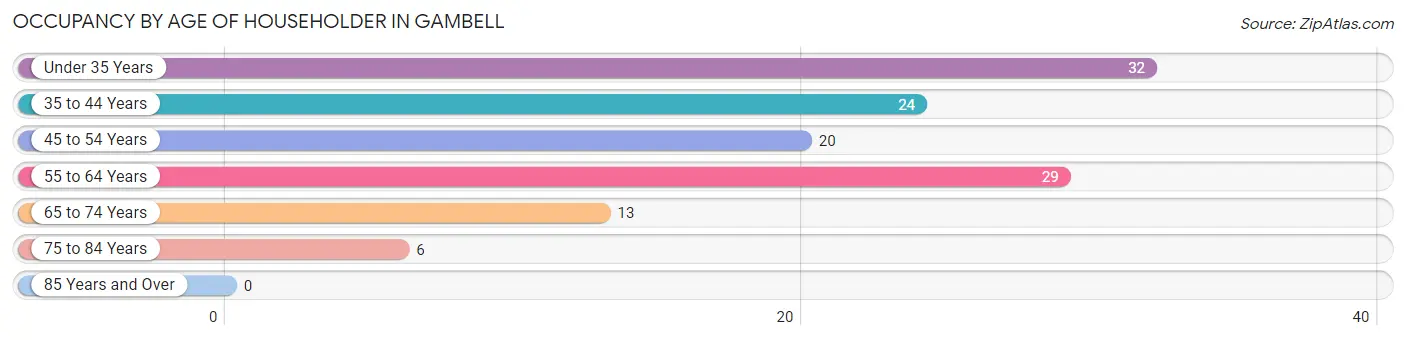
| Age Bracket | # Households | % Households |
| Under 35 Years | 32 | 25.8% |
| 35 to 44 Years | 24 | 19.4% |
| 45 to 54 Years | 20 | 16.1% |
| 55 to 64 Years | 29 | 23.4% |
| 65 to 74 Years | 13 | 10.5% |
| 75 to 84 Years | 6 | 4.8% |
| 85 Years and Over | 0 | 0.0% |
| Total | 124 | 100.0% |
Housing Finances in Gambell
Median Income by Occupancy in Gambell
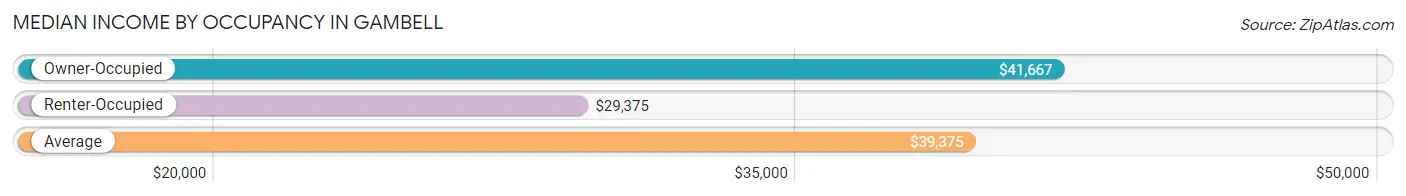
| Occupancy Type | # Households | Median Income |
| Owner-Occupied | 104 (83.9%) | $41,667 |
| Renter-Occupied | 20 (16.1%) | $29,375 |
| Average | 124 (100.0%) | $39,375 |
Occupancy by Householder Income Bracket in Gambell
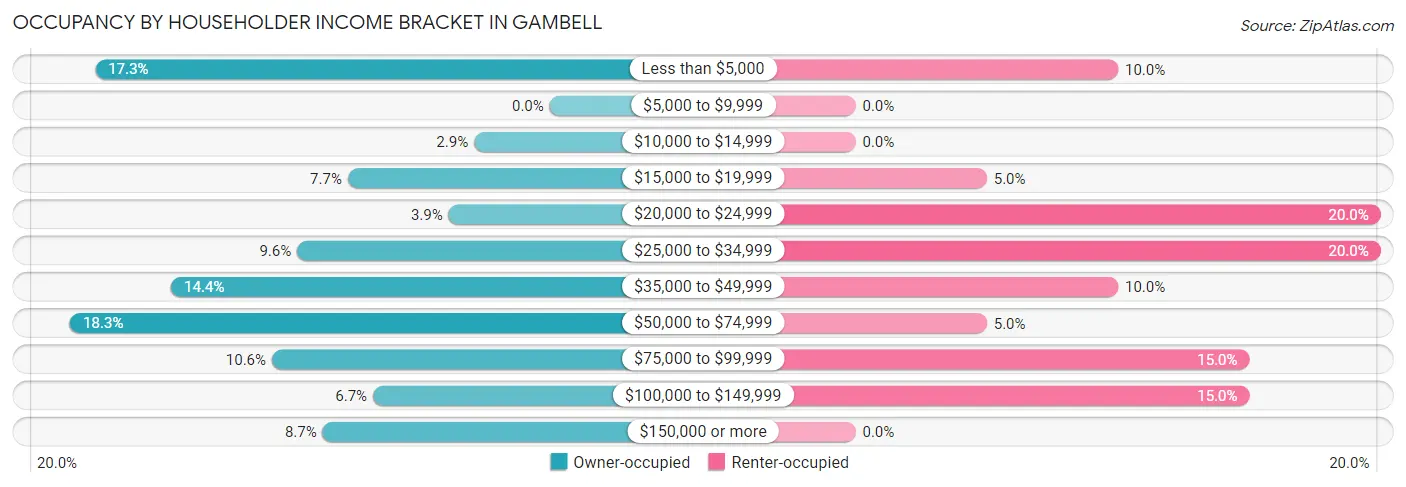
| Income Bracket | Owner-occupied | Renter-occupied |
| Less than $5,000 | 18 (17.3%) | 2 (10.0%) |
| $5,000 to $9,999 | 0 (0.0%) | 0 (0.0%) |
| $10,000 to $14,999 | 3 (2.9%) | 0 (0.0%) |
| $15,000 to $19,999 | 8 (7.7%) | 1 (5.0%) |
| $20,000 to $24,999 | 4 (3.8%) | 4 (20.0%) |
| $25,000 to $34,999 | 10 (9.6%) | 4 (20.0%) |
| $35,000 to $49,999 | 15 (14.4%) | 2 (10.0%) |
| $50,000 to $74,999 | 19 (18.3%) | 1 (5.0%) |
| $75,000 to $99,999 | 11 (10.6%) | 3 (15.0%) |
| $100,000 to $149,999 | 7 (6.7%) | 3 (15.0%) |
| $150,000 or more | 9 (8.6%) | 0 (0.0%) |
| Total | 104 (100.0%) | 20 (100.0%) |
Monthly Housing Cost Tiers in Gambell
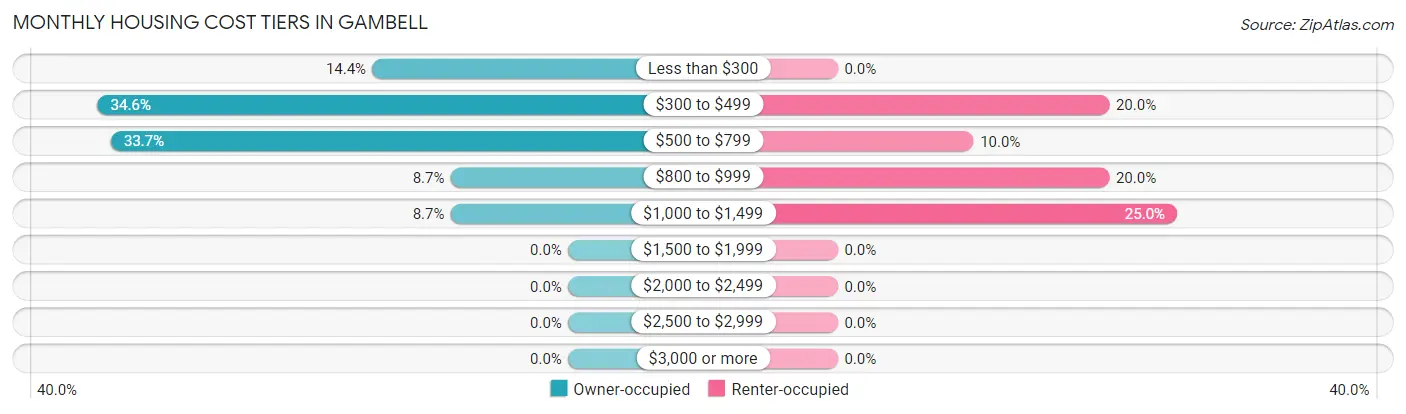
| Monthly Cost | Owner-occupied | Renter-occupied |
| Less than $300 | 15 (14.4%) | 0 (0.0%) |
| $300 to $499 | 36 (34.6%) | 4 (20.0%) |
| $500 to $799 | 35 (33.7%) | 2 (10.0%) |
| $800 to $999 | 9 (8.6%) | 4 (20.0%) |
| $1,000 to $1,499 | 9 (8.6%) | 5 (25.0%) |
| $1,500 to $1,999 | 0 (0.0%) | 0 (0.0%) |
| $2,000 to $2,499 | 0 (0.0%) | 0 (0.0%) |
| $2,500 to $2,999 | 0 (0.0%) | 0 (0.0%) |
| $3,000 or more | 0 (0.0%) | 0 (0.0%) |
| Total | 104 (100.0%) | 20 (100.0%) |
Physical Housing Characteristics in Gambell
Housing Structures in Gambell
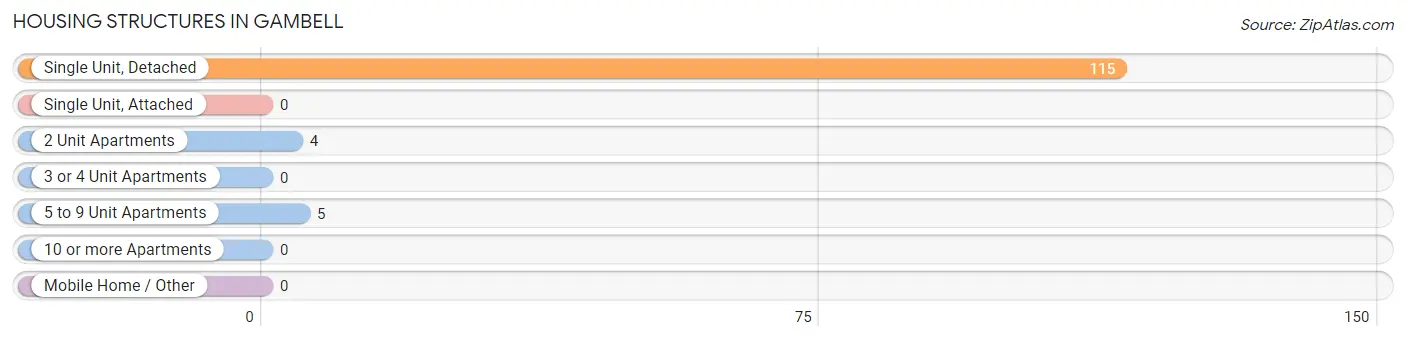
| Structure Type | # Housing Units | % Housing Units |
| Single Unit, Detached | 115 | 92.7% |
| Single Unit, Attached | 0 | 0.0% |
| 2 Unit Apartments | 4 | 3.2% |
| 3 or 4 Unit Apartments | 0 | 0.0% |
| 5 to 9 Unit Apartments | 5 | 4.0% |
| 10 or more Apartments | 0 | 0.0% |
| Mobile Home / Other | 0 | 0.0% |
| Total | 124 | 100.0% |
Housing Structures by Occupancy in Gambell
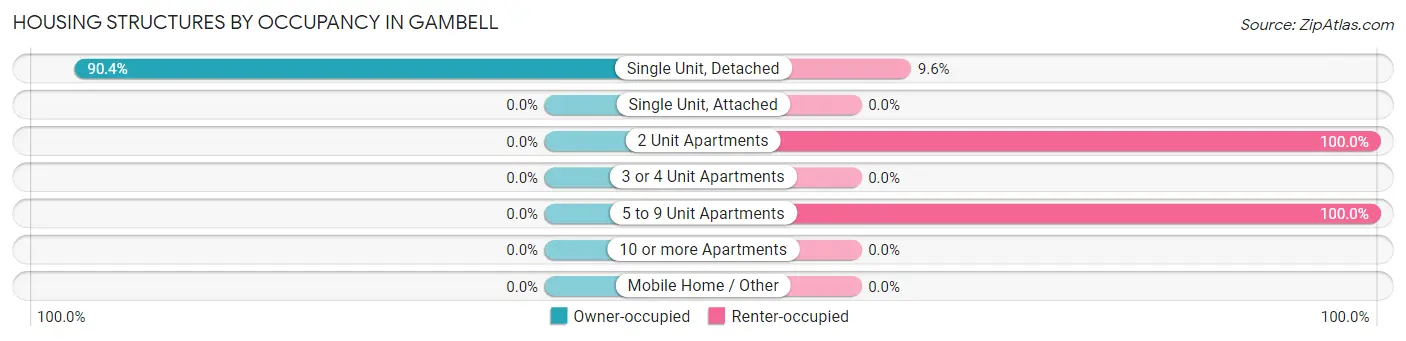
| Structure Type | Owner-occupied | Renter-occupied |
| Single Unit, Detached | 104 (90.4%) | 11 (9.6%) |
| Single Unit, Attached | 0 (0.0%) | 0 (0.0%) |
| 2 Unit Apartments | 0 (0.0%) | 4 (100.0%) |
| 3 or 4 Unit Apartments | 0 (0.0%) | 0 (0.0%) |
| 5 to 9 Unit Apartments | 0 (0.0%) | 5 (100.0%) |
| 10 or more Apartments | 0 (0.0%) | 0 (0.0%) |
| Mobile Home / Other | 0 (0.0%) | 0 (0.0%) |
| Total | 104 (83.9%) | 20 (16.1%) |
Housing Structures by Number of Rooms in Gambell
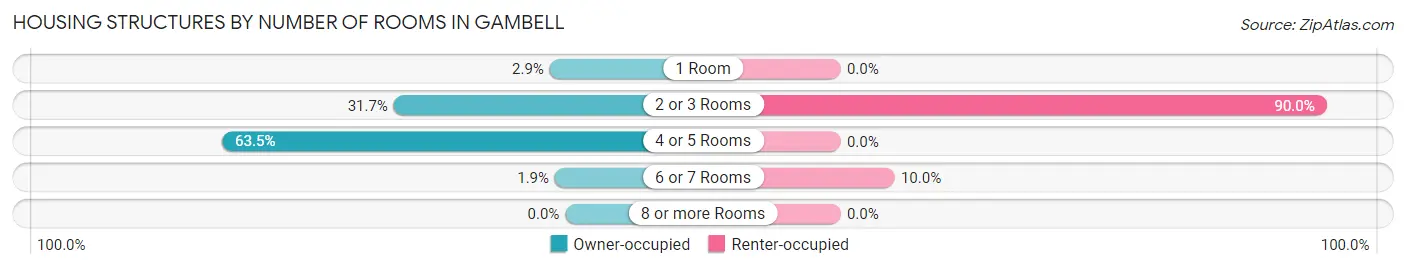
| Number of Rooms | Owner-occupied | Renter-occupied |
| 1 Room | 3 (2.9%) | 0 (0.0%) |
| 2 or 3 Rooms | 33 (31.7%) | 18 (90.0%) |
| 4 or 5 Rooms | 66 (63.5%) | 0 (0.0%) |
| 6 or 7 Rooms | 2 (1.9%) | 2 (10.0%) |
| 8 or more Rooms | 0 (0.0%) | 0 (0.0%) |
| Total | 104 (100.0%) | 20 (100.0%) |
Housing Structure by Heating Type in Gambell
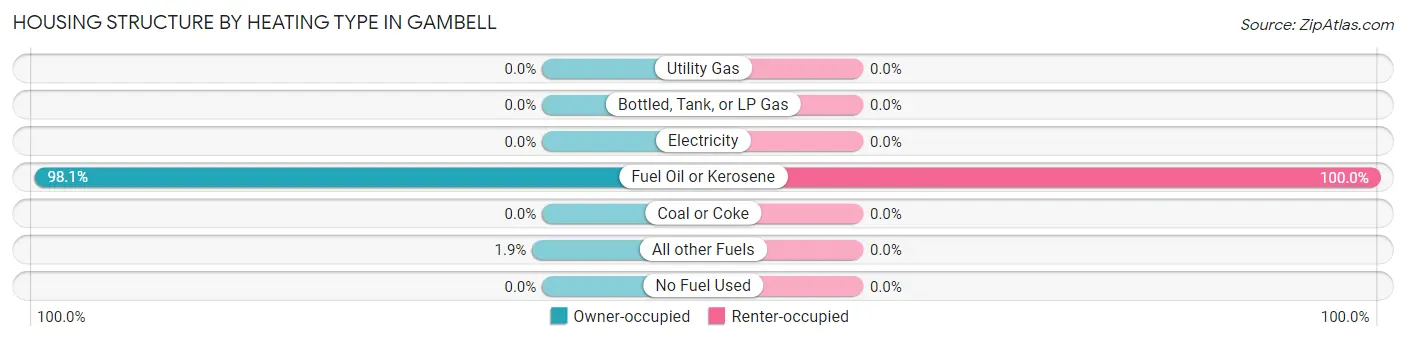
| Heating Type | Owner-occupied | Renter-occupied |
| Utility Gas | 0 (0.0%) | 0 (0.0%) |
| Bottled, Tank, or LP Gas | 0 (0.0%) | 0 (0.0%) |
| Electricity | 0 (0.0%) | 0 (0.0%) |
| Fuel Oil or Kerosene | 102 (98.1%) | 20 (100.0%) |
| Coal or Coke | 0 (0.0%) | 0 (0.0%) |
| All other Fuels | 2 (1.9%) | 0 (0.0%) |
| No Fuel Used | 0 (0.0%) | 0 (0.0%) |
| Total | 104 (100.0%) | 20 (100.0%) |
Household Vehicle Usage in Gambell
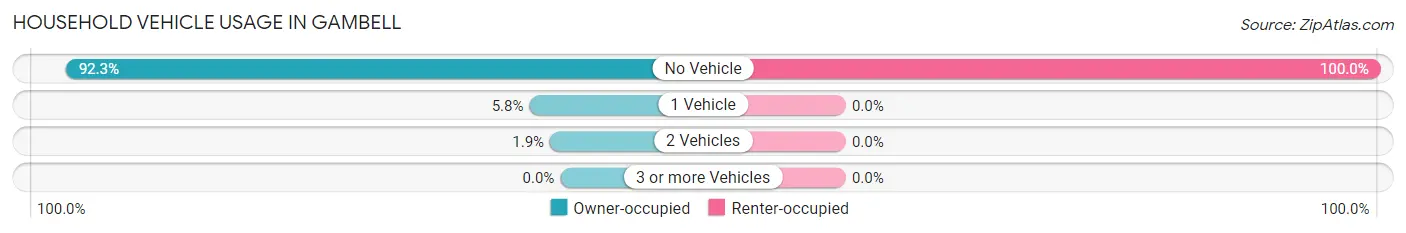
| Vehicles per Household | Owner-occupied | Renter-occupied |
| No Vehicle | 96 (92.3%) | 20 (100.0%) |
| 1 Vehicle | 6 (5.8%) | 0 (0.0%) |
| 2 Vehicles | 2 (1.9%) | 0 (0.0%) |
| 3 or more Vehicles | 0 (0.0%) | 0 (0.0%) |
| Total | 104 (100.0%) | 20 (100.0%) |
Real Estate & Mortgages in Gambell
Real Estate and Mortgage Overview in Gambell
| Characteristic | Without Mortgage | With Mortgage |
| Housing Units | 91 | 13 |
| Median Property Value | $73,200 | $108,900 |
| Median Household Income | $39,375 | $2 |
| Monthly Housing Costs | $483 | $0 |
| Real Estate Taxes | - | - |
Property Value by Mortgage Status in Gambell
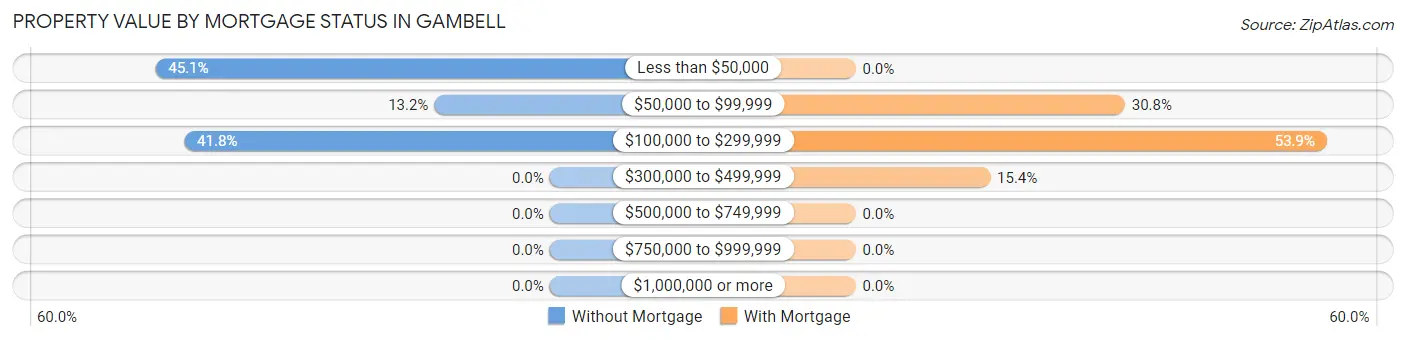
| Property Value | Without Mortgage | With Mortgage |
| Less than $50,000 | 41 (45.1%) | 0 (0.0%) |
| $50,000 to $99,999 | 12 (13.2%) | 4 (30.8%) |
| $100,000 to $299,999 | 38 (41.8%) | 7 (53.8%) |
| $300,000 to $499,999 | 0 (0.0%) | 2 (15.4%) |
| $500,000 to $749,999 | 0 (0.0%) | 0 (0.0%) |
| $750,000 to $999,999 | 0 (0.0%) | 0 (0.0%) |
| $1,000,000 or more | 0 (0.0%) | 0 (0.0%) |
| Total | 91 (100.0%) | 13 (100.0%) |
Household Income by Mortgage Status in Gambell
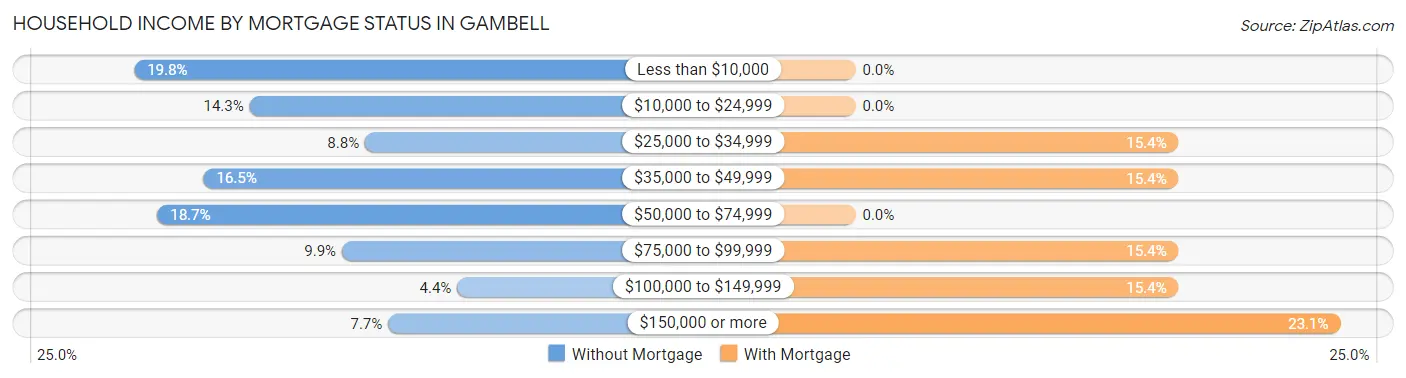
| Household Income | Without Mortgage | With Mortgage |
| Less than $10,000 | 18 (19.8%) | 0 (0.0%) |
| $10,000 to $24,999 | 13 (14.3%) | 0 (0.0%) |
| $25,000 to $34,999 | 8 (8.8%) | 2 (15.4%) |
| $35,000 to $49,999 | 15 (16.5%) | 2 (15.4%) |
| $50,000 to $74,999 | 17 (18.7%) | 0 (0.0%) |
| $75,000 to $99,999 | 9 (9.9%) | 2 (15.4%) |
| $100,000 to $149,999 | 4 (4.4%) | 2 (15.4%) |
| $150,000 or more | 7 (7.7%) | 3 (23.1%) |
| Total | 91 (100.0%) | 13 (100.0%) |
Property Value to Household Income Ratio in Gambell
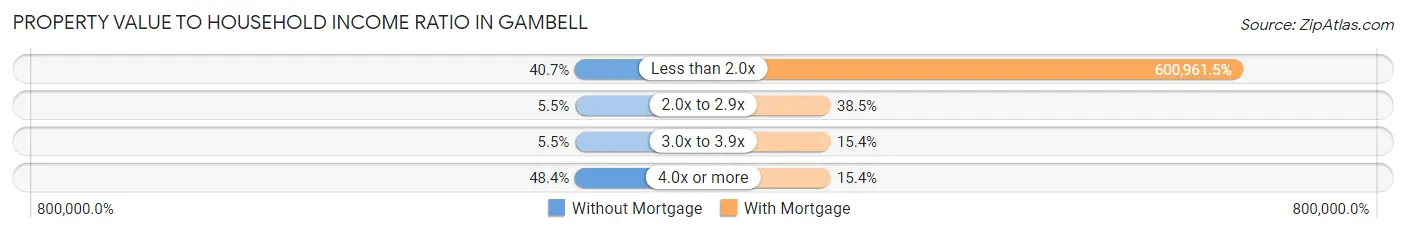
| Value-to-Income Ratio | Without Mortgage | With Mortgage |
| Less than 2.0x | 37 (40.7%) | 78,125 (600,961.5%) |
| 2.0x to 2.9x | 5 (5.5%) | 5 (38.5%) |
| 3.0x to 3.9x | 5 (5.5%) | 2 (15.4%) |
| 4.0x or more | 44 (48.3%) | 2 (15.4%) |
| Total | 91 (100.0%) | 13 (100.0%) |
Real Estate Taxes by Mortgage Status in Gambell
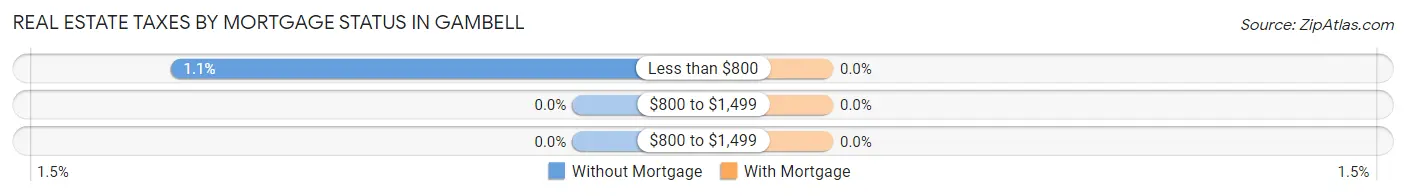
| Property Taxes | Without Mortgage | With Mortgage |
| Less than $800 | 1 (1.1%) | 0 (0.0%) |
| $800 to $1,499 | 0 (0.0%) | 0 (0.0%) |
| $800 to $1,499 | 0 (0.0%) | 0 (0.0%) |
| Total | 91 (100.0%) | 13 (100.0%) |
Health & Disability in Gambell
Health Insurance Coverage by Age in Gambell
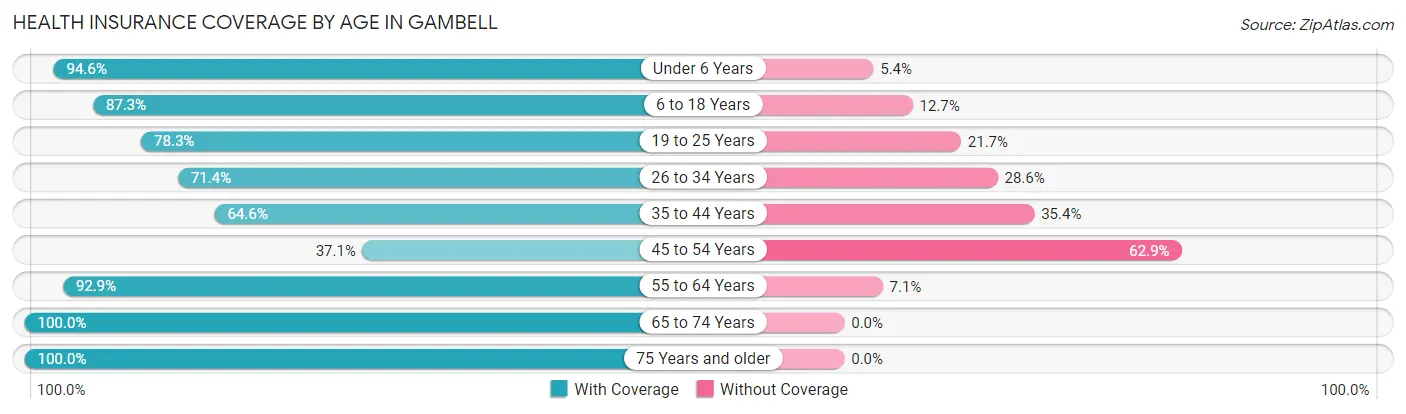
| Age Bracket | With Coverage | Without Coverage |
| Under 6 Years | 35 (94.6%) | 2 (5.4%) |
| 6 to 18 Years | 96 (87.3%) | 14 (12.7%) |
| 19 to 25 Years | 54 (78.3%) | 15 (21.7%) |
| 26 to 34 Years | 40 (71.4%) | 16 (28.6%) |
| 35 to 44 Years | 31 (64.6%) | 17 (35.4%) |
| 45 to 54 Years | 13 (37.1%) | 22 (62.9%) |
| 55 to 64 Years | 39 (92.9%) | 3 (7.1%) |
| 65 to 74 Years | 21 (100.0%) | 0 (0.0%) |
| 75 Years and older | 8 (100.0%) | 0 (0.0%) |
| Total | 337 (79.1%) | 89 (20.9%) |
Health Insurance Coverage by Citizenship Status in Gambell
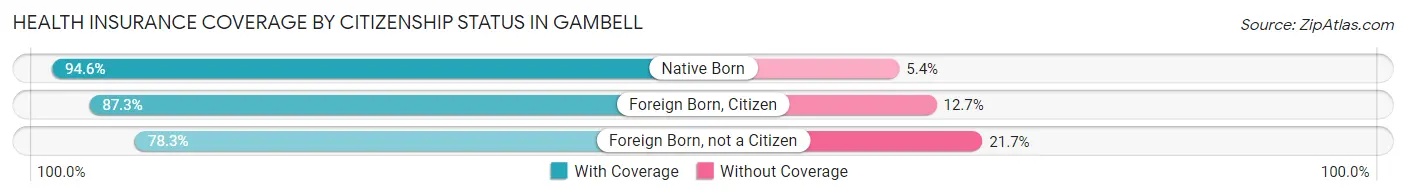
| Citizenship Status | With Coverage | Without Coverage |
| Native Born | 35 (94.6%) | 2 (5.4%) |
| Foreign Born, Citizen | 96 (87.3%) | 14 (12.7%) |
| Foreign Born, not a Citizen | 54 (78.3%) | 15 (21.7%) |
Health Insurance Coverage by Household Income in Gambell
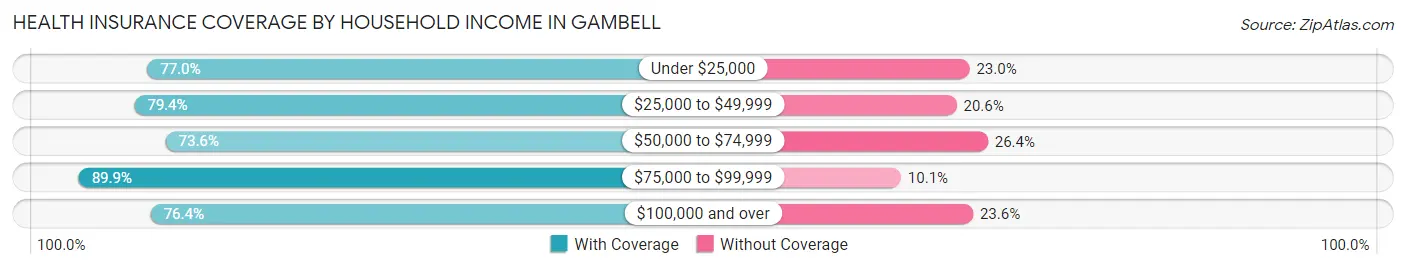
| Household Income | With Coverage | Without Coverage |
| Under $25,000 | 67 (77.0%) | 20 (23.0%) |
| $25,000 to $49,999 | 85 (79.4%) | 22 (20.6%) |
| $50,000 to $74,999 | 39 (73.6%) | 14 (26.4%) |
| $75,000 to $99,999 | 62 (89.9%) | 7 (10.1%) |
| $100,000 and over | 84 (76.4%) | 26 (23.6%) |
Public vs Private Health Insurance Coverage by Age in Gambell
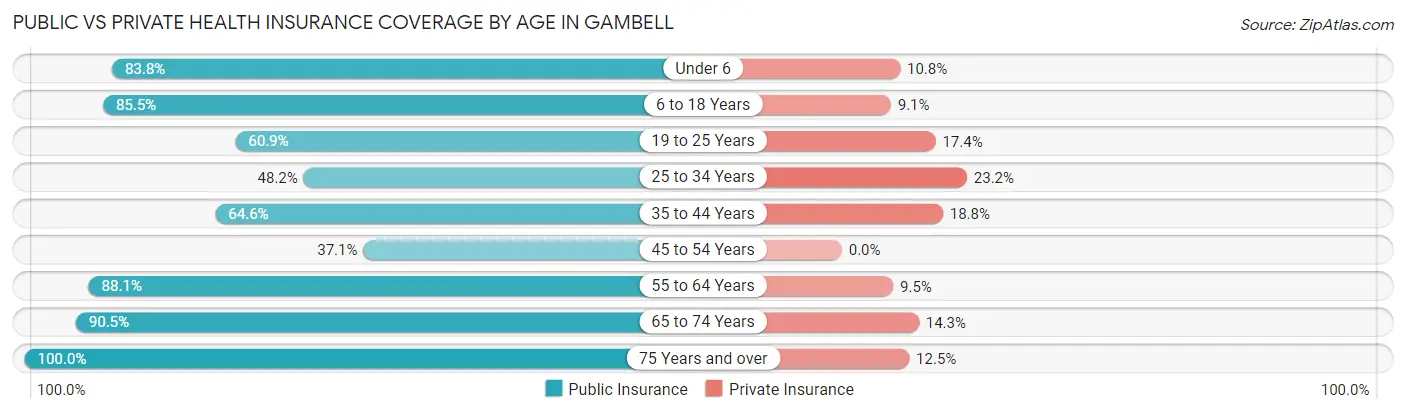
| Age Bracket | Public Insurance | Private Insurance |
| Under 6 | 31 (83.8%) | 4 (10.8%) |
| 6 to 18 Years | 94 (85.5%) | 10 (9.1%) |
| 19 to 25 Years | 42 (60.9%) | 12 (17.4%) |
| 25 to 34 Years | 27 (48.2%) | 13 (23.2%) |
| 35 to 44 Years | 31 (64.6%) | 9 (18.8%) |
| 45 to 54 Years | 13 (37.1%) | 0 (0.0%) |
| 55 to 64 Years | 37 (88.1%) | 4 (9.5%) |
| 65 to 74 Years | 19 (90.5%) | 3 (14.3%) |
| 75 Years and over | 8 (100.0%) | 1 (12.5%) |
| Total | 302 (70.9%) | 56 (13.2%) |
Disability Status by Sex by Age in Gambell
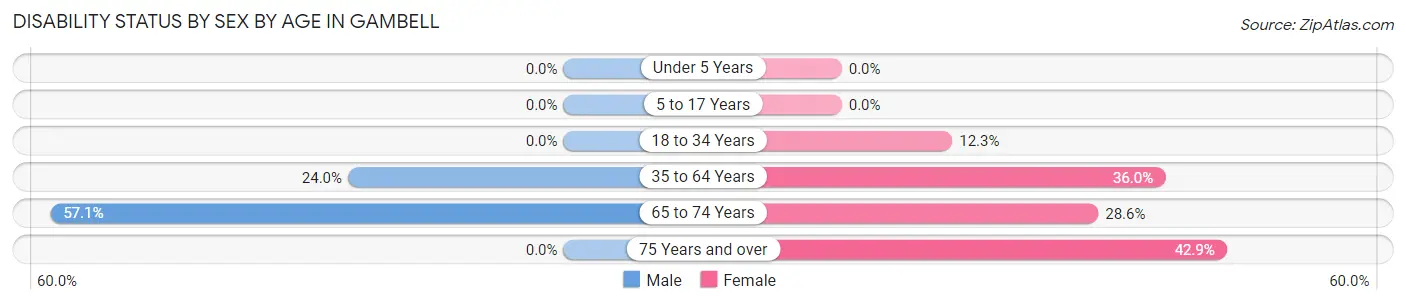
| Age Bracket | Male | Female |
| Under 5 Years | 0 (0.0%) | 0 (0.0%) |
| 5 to 17 Years | 0 (0.0%) | 0 (0.0%) |
| 18 to 34 Years | 0 (0.0%) | 8 (12.3%) |
| 35 to 64 Years | 18 (24.0%) | 18 (36.0%) |
| 65 to 74 Years | 8 (57.1%) | 2 (28.6%) |
| 75 Years and over | 0 (0.0%) | 3 (42.9%) |
Disability Class by Sex by Age in Gambell
Disability Class: Hearing Difficulty
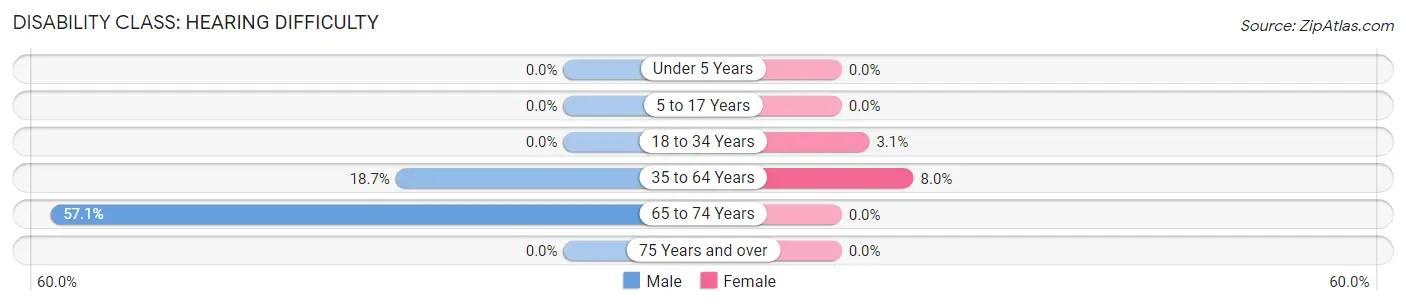
| Age Bracket | Male | Female |
| Under 5 Years | 0 (0.0%) | 0 (0.0%) |
| 5 to 17 Years | 0 (0.0%) | 0 (0.0%) |
| 18 to 34 Years | 0 (0.0%) | 2 (3.1%) |
| 35 to 64 Years | 14 (18.7%) | 4 (8.0%) |
| 65 to 74 Years | 8 (57.1%) | 0 (0.0%) |
| 75 Years and over | 0 (0.0%) | 0 (0.0%) |
Disability Class: Vision Difficulty
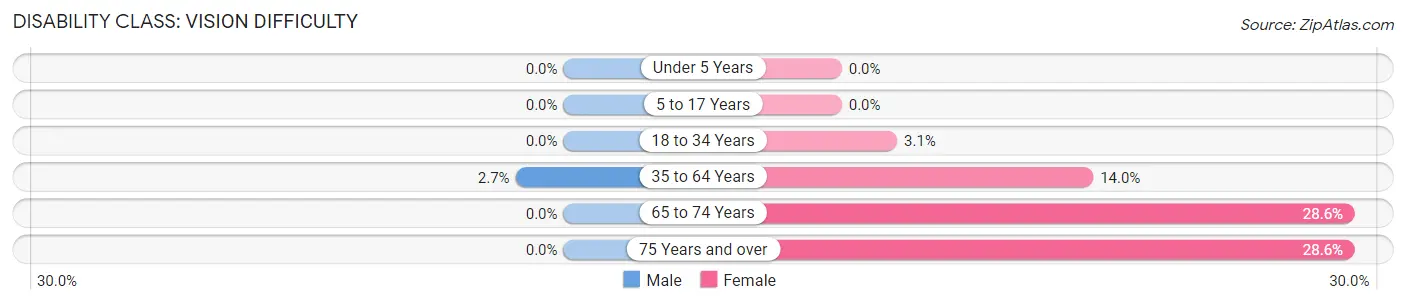
| Age Bracket | Male | Female |
| Under 5 Years | 0 (0.0%) | 0 (0.0%) |
| 5 to 17 Years | 0 (0.0%) | 0 (0.0%) |
| 18 to 34 Years | 0 (0.0%) | 2 (3.1%) |
| 35 to 64 Years | 2 (2.7%) | 7 (14.0%) |
| 65 to 74 Years | 0 (0.0%) | 2 (28.6%) |
| 75 Years and over | 0 (0.0%) | 2 (28.6%) |
Disability Class: Cognitive Difficulty
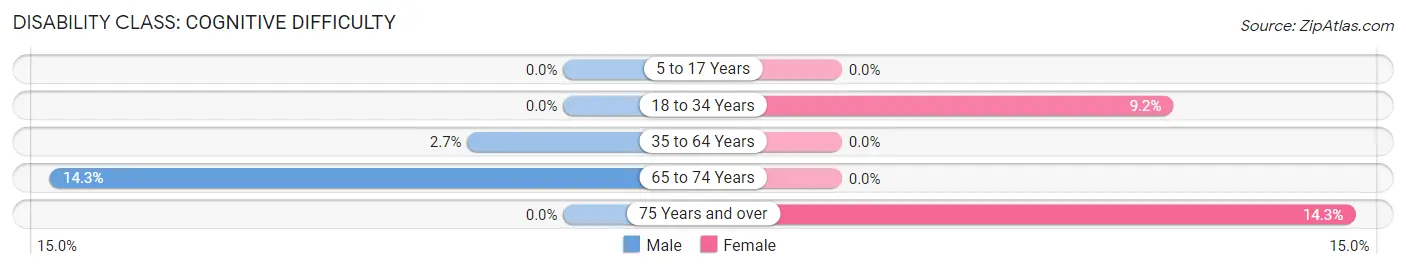
| Age Bracket | Male | Female |
| 5 to 17 Years | 0 (0.0%) | 0 (0.0%) |
| 18 to 34 Years | 0 (0.0%) | 6 (9.2%) |
| 35 to 64 Years | 2 (2.7%) | 0 (0.0%) |
| 65 to 74 Years | 2 (14.3%) | 0 (0.0%) |
| 75 Years and over | 0 (0.0%) | 1 (14.3%) |
Disability Class: Ambulatory Difficulty
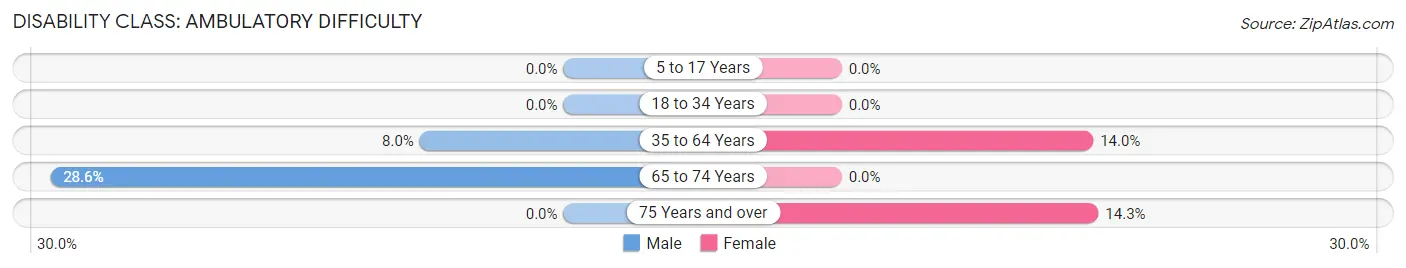
| Age Bracket | Male | Female |
| 5 to 17 Years | 0 (0.0%) | 0 (0.0%) |
| 18 to 34 Years | 0 (0.0%) | 0 (0.0%) |
| 35 to 64 Years | 6 (8.0%) | 7 (14.0%) |
| 65 to 74 Years | 4 (28.6%) | 0 (0.0%) |
| 75 Years and over | 0 (0.0%) | 1 (14.3%) |
Disability Class: Self-Care Difficulty
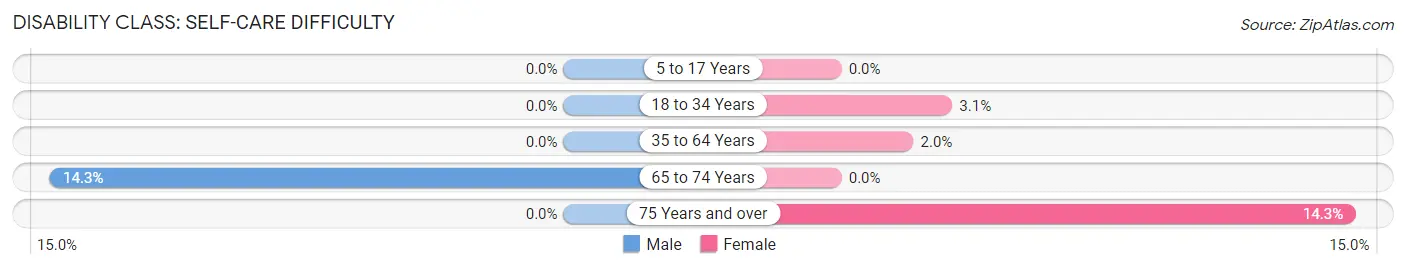
| Age Bracket | Male | Female |
| 5 to 17 Years | 0 (0.0%) | 0 (0.0%) |
| 18 to 34 Years | 0 (0.0%) | 2 (3.1%) |
| 35 to 64 Years | 0 (0.0%) | 1 (2.0%) |
| 65 to 74 Years | 2 (14.3%) | 0 (0.0%) |
| 75 Years and over | 0 (0.0%) | 1 (14.3%) |
Technology Access in Gambell
Computing Device Access in Gambell
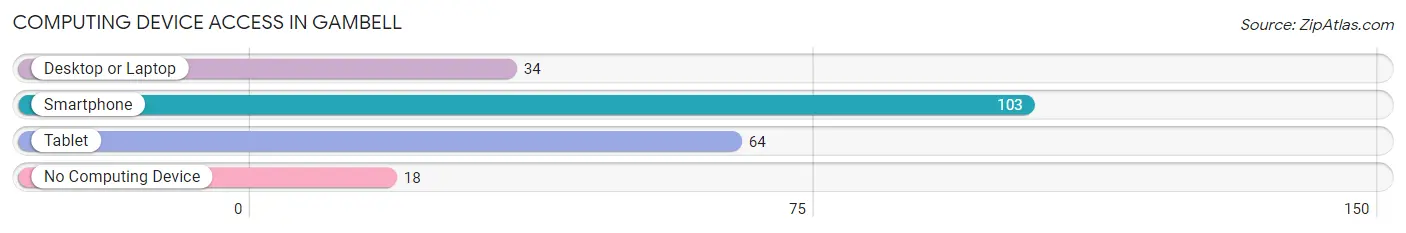
| Device Type | # Households | % Households |
| Desktop or Laptop | 34 | 27.4% |
| Smartphone | 103 | 83.1% |
| Tablet | 64 | 51.6% |
| No Computing Device | 18 | 14.5% |
| Total | 124 | 100.0% |
Internet Access in Gambell
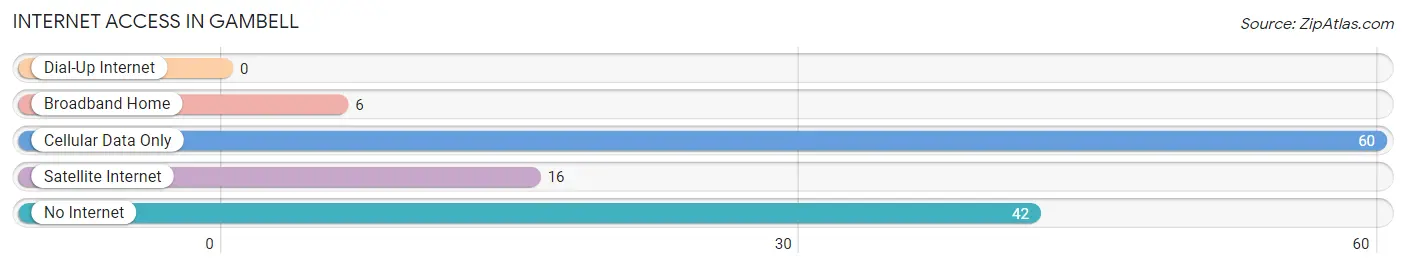
| Internet Type | # Households | % Households |
| Dial-Up Internet | 0 | 0.0% |
| Broadband Home | 6 | 4.8% |
| Cellular Data Only | 60 | 48.4% |
| Satellite Internet | 16 | 12.9% |
| No Internet | 42 | 33.9% |
| Total | 124 | 100.0% |
Gambell Summary
Gambell is a small city located on St. Lawrence Island in the Bering Sea, off the coast of Alaska. It is part of the Bering Strait region and is the most populous city in the region. The population of Gambell was 590 in the 2010 census, making it the smallest incorporated city in Alaska.
Geography
Gambell is located on the northwest coast of St. Lawrence Island, which is part of the Bering Strait region. The island is located between the Chukchi Sea to the north and the Bering Sea to the south. The city is located on the northern tip of the island, and is the most northerly city in the United States. The city is surrounded by tundra and is located on a flat plain. The climate is subarctic, with cold winters and mild summers.
Economy
Gambell’s economy is largely based on subsistence hunting and fishing. The city is home to a large population of Yup’ik Eskimos, who rely on the sea for their livelihood. The city is also home to a small commercial fishing industry, which provides employment for some of the residents. The city also has a small tourism industry, with visitors coming to experience the unique culture and wildlife of the region.
Demographics
Gambell is home to a population of 590 people, according to the 2010 census. The population is largely Yup’ik Eskimos, who make up the majority of the population. The city also has a small population of non-native residents, mostly from the United States. The median age of the population is 24.7 years, and the median household income is $25,000.
Conclusion
Gambell is a small city located on St. Lawrence Island in the Bering Sea, off the coast of Alaska. It is part of the Bering Strait region and is the most populous city in the region. The city’s economy is largely based on subsistence hunting and fishing, and the population is largely Yup’ik Eskimos. The city also has a small commercial fishing industry and a small tourism industry. The population of Gambell was 590 in the 2010 census, making it the smallest incorporated city in Alaska.
Common Questions
What is Per Capita Income in Gambell?
Per Capita income in Gambell is $14,773.
What is the Median Family Income in Gambell?
Median Family Income in Gambell is $50,625.
What is the Median Household income in Gambell?
Median Household Income in Gambell is $39,375.
What is Income or Wage Gap in Gambell?
Income or Wage Gap in Gambell is 42.6%.
Women in Gambell earn 57.4 cents for every dollar earned by a man.
What is Inequality or Gini Index in Gambell?
Inequality or Gini Index in Gambell is 0.47.
What is the Total Population of Gambell?
Total Population of Gambell is 426.
What is the Total Male Population of Gambell?
Total Male Population of Gambell is 224.
What is the Total Female Population of Gambell?
Total Female Population of Gambell is 202.
What is the Ratio of Males per 100 Females in Gambell?
There are 110.89 Males per 100 Females in Gambell.
What is the Ratio of Females per 100 Males in Gambell?
There are 90.18 Females per 100 Males in Gambell.
What is the Median Population Age in Gambell?
Median Population Age in Gambell is 25.8 Years.
What is the Average Family Size in Gambell
Average Family Size in Gambell is 4.2 People.
What is the Average Household Size in Gambell
Average Household Size in Gambell is 3.4 People.
How Large is the Labor Force in Gambell?
There are 181 People in the Labor Forcein in Gambell.
What is the Percentage of People in the Labor Force in Gambell?
58.4% of People are in the Labor Force in Gambell.
What is the Unemployment Rate in Gambell?
Unemployment Rate in Gambell is 31.5%.