Toksook Bay, AK Map & Demographics
Toksook Bay Map
Toksook Bay Overview
$15,550
PER CAPITA INCOME
$48,958
AVG FAMILY INCOME
$49,167
AVG HOUSEHOLD INCOME
27.9%
WAGE / INCOME GAP [ % ]
72.1¢/ $1
WAGE / INCOME GAP [ $ ]
0.40
INEQUALITY / GINI INDEX
914
TOTAL POPULATION
453
MALE POPULATION
461
FEMALE POPULATION
98.26
MALES / 100 FEMALES
101.77
FEMALES / 100 MALES
24.3
MEDIAN AGE
5.4
AVG FAMILY SIZE
5.0
AVG HOUSEHOLD SIZE
330
LABOR FORCE [ PEOPLE ]
56.8%
PERCENT IN LABOR FORCE
18.8%
UNEMPLOYMENT RATE
Toksook Bay Zip Codes
Toksook Bay Area Codes
Income in Toksook Bay
Income Overview in Toksook Bay
Per Capita Income in Toksook Bay is $15,550, while median incomes of families and households are $48,958 and $49,167 respectively.
| Characteristic | Number | Measure |
| Per Capita Income | 914 | $15,550 |
| Median Family Income | 163 | $48,958 |
| Mean Family Income | 163 | $72,171 |
| Median Household Income | 184 | $49,167 |
| Mean Household Income | 184 | $68,739 |
| Income Deficit | 163 | $0 |
| Wage / Income Gap (%) | 914 | 27.93% |
| Wage / Income Gap ($) | 914 | 72.07¢ per $1 |
| Gini / Inequality Index | 914 | 0.40 |
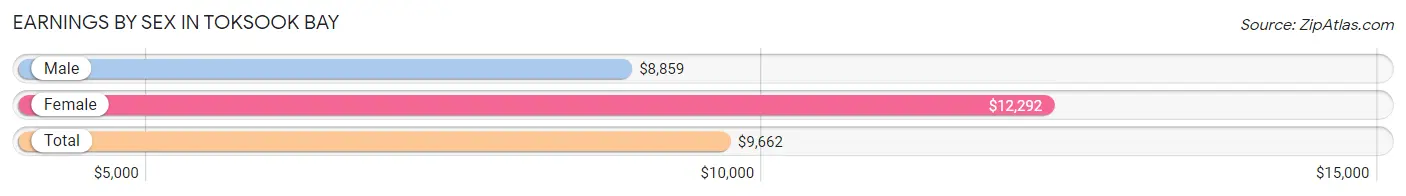
Earnings by Sex in Toksook Bay
Average Earnings in Toksook Bay are $9,662, $8,859 for men and $12,292 for women, a difference of 27.9%.
| Sex | Number | Average Earnings |
| Male | 227 (51.4%) | $8,859 |
| Female | 215 (48.6%) | $12,292 |
| Total | 442 (100.0%) | $9,662 |
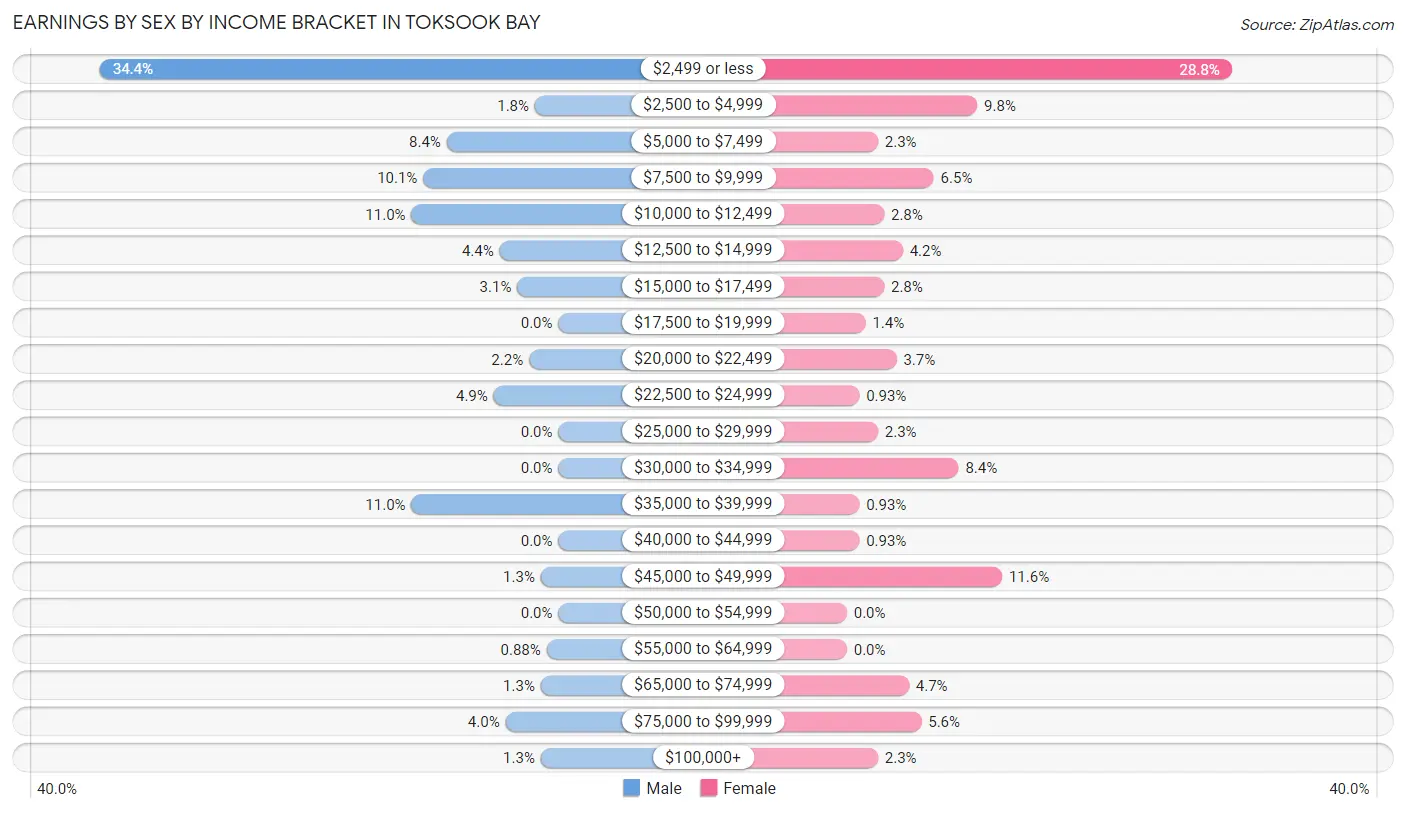
Earnings by Sex by Income Bracket in Toksook Bay
The most common earnings brackets in Toksook Bay are $2,499 or less for men (78 | 34.4%) and $2,499 or less for women (62 | 28.8%).
| Income | Male | Female |
| $2,499 or less | 78 (34.4%) | 62 (28.8%) |
| $2,500 to $4,999 | 4 (1.8%) | 21 (9.8%) |
| $5,000 to $7,499 | 19 (8.4%) | 5 (2.3%) |
| $7,500 to $9,999 | 23 (10.1%) | 14 (6.5%) |
| $10,000 to $12,499 | 25 (11.0%) | 6 (2.8%) |
| $12,500 to $14,999 | 10 (4.4%) | 9 (4.2%) |
| $15,000 to $17,499 | 7 (3.1%) | 6 (2.8%) |
| $17,500 to $19,999 | 0 (0.0%) | 3 (1.4%) |
| $20,000 to $22,499 | 5 (2.2%) | 8 (3.7%) |
| $22,500 to $24,999 | 11 (4.9%) | 2 (0.9%) |
| $25,000 to $29,999 | 0 (0.0%) | 5 (2.3%) |
| $30,000 to $34,999 | 0 (0.0%) | 18 (8.4%) |
| $35,000 to $39,999 | 25 (11.0%) | 2 (0.9%) |
| $40,000 to $44,999 | 0 (0.0%) | 2 (0.9%) |
| $45,000 to $49,999 | 3 (1.3%) | 25 (11.6%) |
| $50,000 to $54,999 | 0 (0.0%) | 0 (0.0%) |
| $55,000 to $64,999 | 2 (0.9%) | 0 (0.0%) |
| $65,000 to $74,999 | 3 (1.3%) | 10 (4.6%) |
| $75,000 to $99,999 | 9 (4.0%) | 12 (5.6%) |
| $100,000+ | 3 (1.3%) | 5 (2.3%) |
| Total | 227 (100.0%) | 215 (100.0%) |
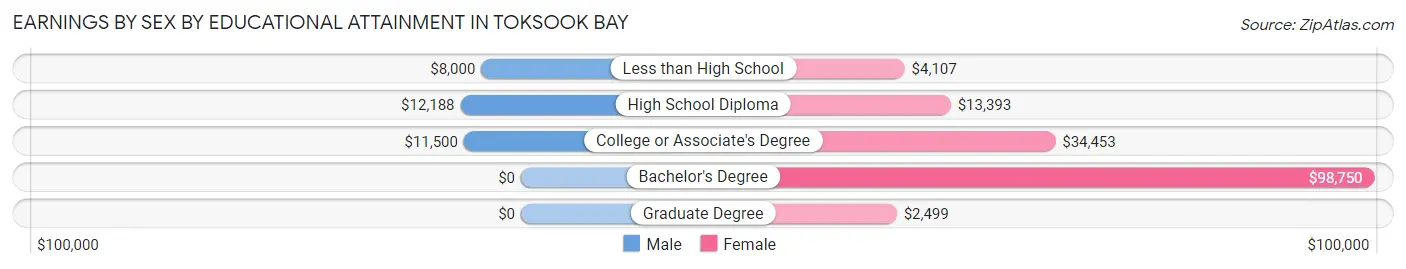
Earnings by Sex by Educational Attainment in Toksook Bay
Average earnings in Toksook Bay are $11,350 for men and $20,156 for women, a difference of 43.7%. Men with an educational attainment of high school diploma enjoy the highest average annual earnings of $12,188, while those with less than high school education earn the least with $8,000. Women with an educational attainment of bachelor's degree earn the most with the average annual earnings of $98,750, while those with graduate degree education have the smallest earnings of $2,499.
| Educational Attainment | Male Income | Female Income |
| Less than High School | $8,000 | $4,107 |
| High School Diploma | $12,188 | $13,393 |
| College or Associate's Degree | $11,500 | $34,453 |
| Bachelor's Degree | - | - |
| Graduate Degree | - | - |
| Total | $11,350 | $20,156 |
Family Income in Toksook Bay
Family Income Brackets in Toksook Bay
According to the Toksook Bay family income data, there are 50 families falling into the $35,000 to $49,999 income range, which is the most common income bracket and makes up 30.7% of all families.
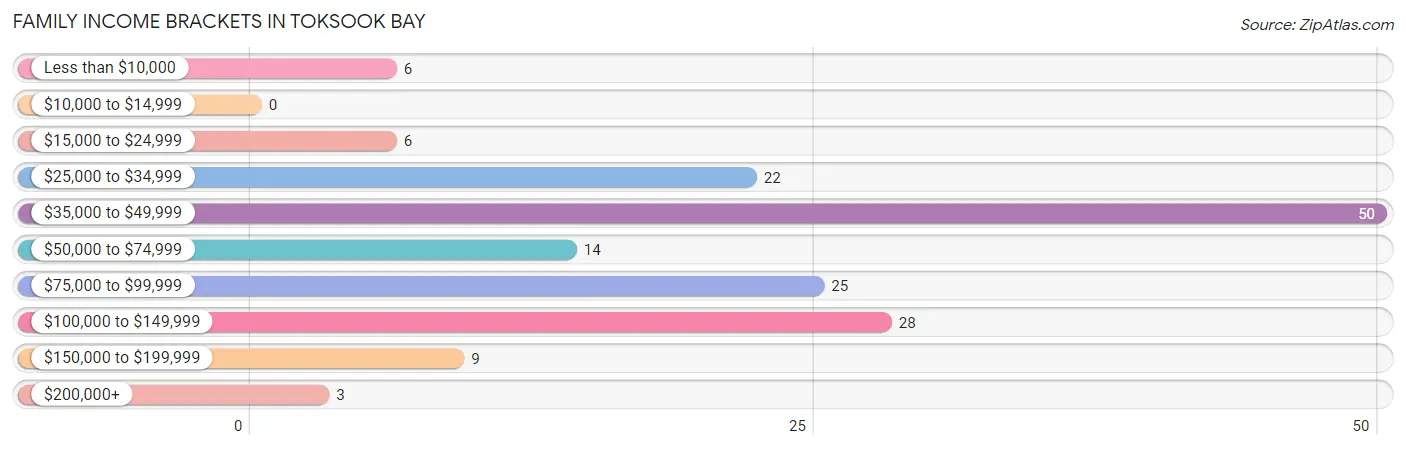
| Income Bracket | # Families | % Families |
| Less than $10,000 | 6 | 3.7% |
| $10,000 to $14,999 | 0 | 0.0% |
| $15,000 to $24,999 | 6 | 3.7% |
| $25,000 to $34,999 | 22 | 13.5% |
| $35,000 to $49,999 | 50 | 30.7% |
| $50,000 to $74,999 | 14 | 8.6% |
| $75,000 to $99,999 | 25 | 15.3% |
| $100,000 to $149,999 | 28 | 17.2% |
| $150,000 to $199,999 | 9 | 5.5% |
| $200,000+ | 3 | 1.8% |
Family Income by Famaliy Size in Toksook Bay
6-person families (54 | 33.1%) account for the highest median family income in Toksook Bay with $83,281 per family, while 3-person families (12 | 7.4%) have the highest median income of $13,958 per family member.
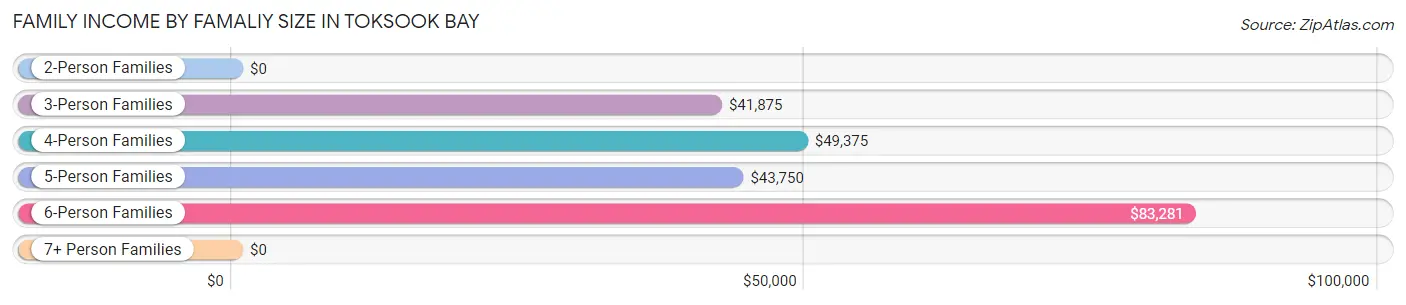
| Income Bracket | # Families | Median Income |
| 2-Person Families | 16 (9.8%) | $0 |
| 3-Person Families | 12 (7.4%) | $41,875 |
| 4-Person Families | 31 (19.0%) | $49,375 |
| 5-Person Families | 19 (11.7%) | $43,750 |
| 6-Person Families | 54 (33.1%) | $83,281 |
| 7+ Person Families | 31 (19.0%) | $0 |
| Total | 163 (100.0%) | $48,958 |
Family Income by Number of Earners in Toksook Bay
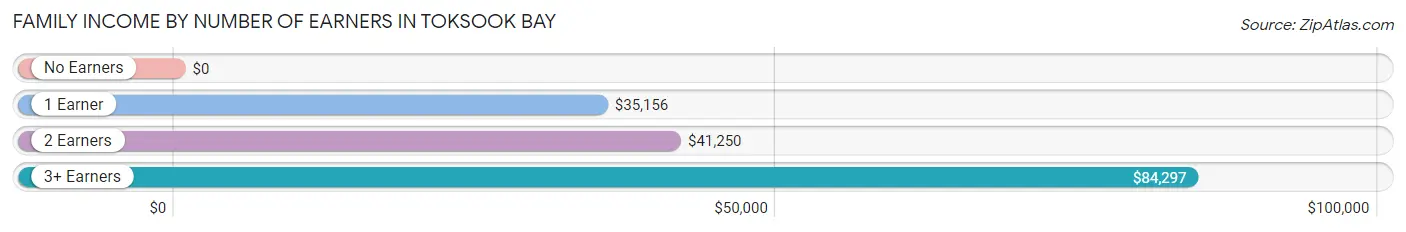
| Number of Earners | # Families | Median Income |
| No Earners | 3 (1.8%) | $0 |
| 1 Earner | 33 (20.3%) | $35,156 |
| 2 Earners | 60 (36.8%) | $41,250 |
| 3+ Earners | 67 (41.1%) | $84,297 |
| Total | 163 (100.0%) | $48,958 |
Household Income in Toksook Bay
Household Income Brackets in Toksook Bay
With 46 households falling in the category, the $35,000 to $49,999 income range is the most frequent in Toksook Bay, accounting for 25.0% of all households.
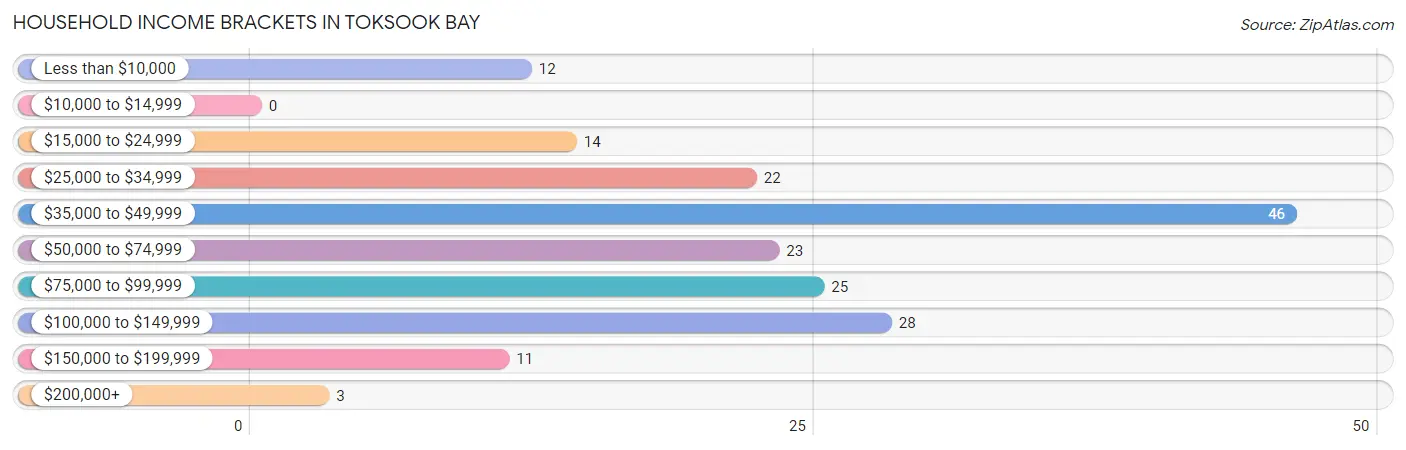
| Income Bracket | # Households | % Households |
| Less than $10,000 | 12 | 6.5% |
| $10,000 to $14,999 | 0 | 0.0% |
| $15,000 to $24,999 | 14 | 7.6% |
| $25,000 to $34,999 | 22 | 12.0% |
| $35,000 to $49,999 | 46 | 25.0% |
| $50,000 to $74,999 | 23 | 12.5% |
| $75,000 to $99,999 | 25 | 13.6% |
| $100,000 to $149,999 | 28 | 15.2% |
| $150,000 to $199,999 | 11 | 6.0% |
| $200,000+ | 3 | 1.6% |
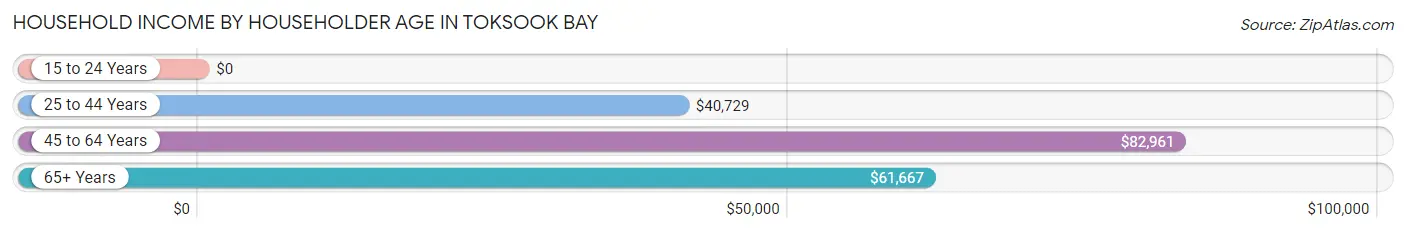
Household Income by Householder Age in Toksook Bay
The median household income in Toksook Bay is $49,167, with the highest median household income of $82,961 found in the 45 to 64 years age bracket for the primary householder. A total of 89 households (48.4%) fall into this category.
| Income Bracket | # Households | Median Income |
| 15 to 24 Years | 0 (0.0%) | $0 |
| 25 to 44 Years | 53 (28.8%) | $40,729 |
| 45 to 64 Years | 89 (48.4%) | $82,961 |
| 65+ Years | 42 (22.8%) | $61,667 |
| Total | 184 (100.0%) | $49,167 |
Poverty in Toksook Bay
Income Below Poverty by Sex and Age in Toksook Bay
With 28.3% poverty level for males and 26.7% for females among the residents of Toksook Bay, 15 year old males and 25 to 34 year old females are the most vulnerable to poverty, with 8 males (100.0%) and 23 females (59.0%) in their respective age groups living below the poverty level.
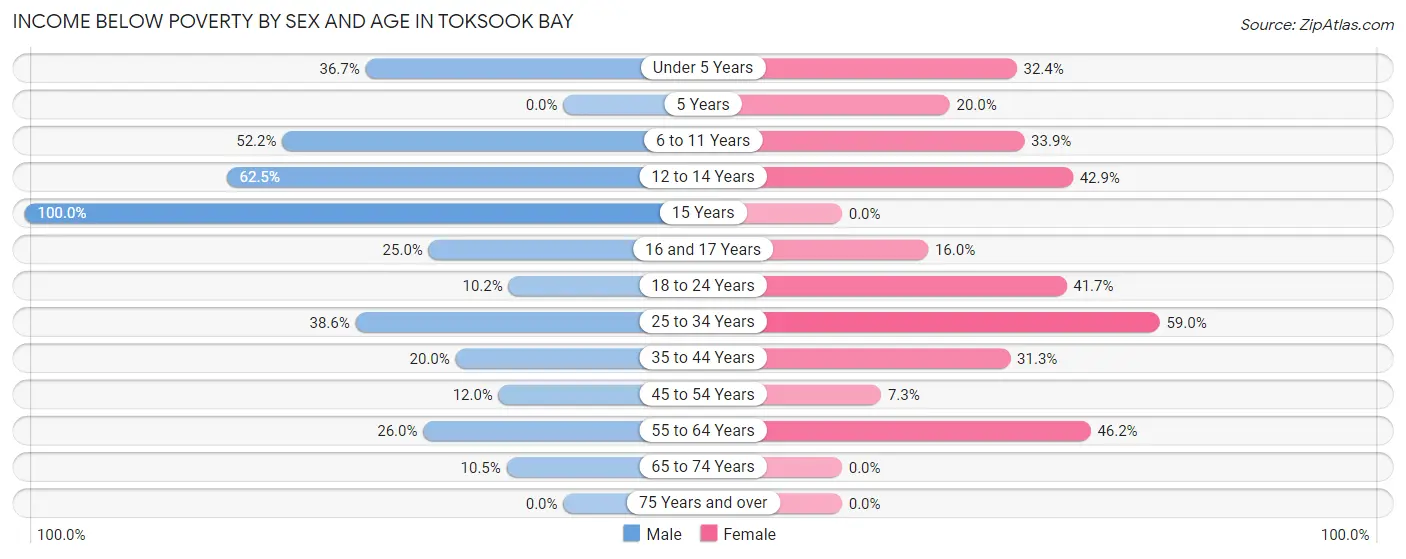
| Age Bracket | Male | Female |
| Under 5 Years | 29 (36.7%) | 24 (32.4%) |
| 5 Years | 0 (0.0%) | 1 (20.0%) |
| 6 to 11 Years | 24 (52.2%) | 22 (33.9%) |
| 12 to 14 Years | 5 (62.5%) | 9 (42.9%) |
| 15 Years | 8 (100.0%) | 0 (0.0%) |
| 16 and 17 Years | 2 (25.0%) | 4 (16.0%) |
| 18 to 24 Years | 6 (10.2%) | 15 (41.7%) |
| 25 to 34 Years | 27 (38.6%) | 23 (59.0%) |
| 35 to 44 Years | 6 (20.0%) | 15 (31.2%) |
| 45 to 54 Years | 6 (12.0%) | 4 (7.3%) |
| 55 to 64 Years | 13 (26.0%) | 6 (46.2%) |
| 65 to 74 Years | 2 (10.5%) | 0 (0.0%) |
| 75 Years and over | 0 (0.0%) | 0 (0.0%) |
| Total | 128 (28.3%) | 123 (26.7%) |
Income Above Poverty by Sex and Age in Toksook Bay
According to the poverty statistics in Toksook Bay, males aged 5 years and females aged 15 years are the age groups that are most secure financially, with 100.0% of males and 100.0% of females in these age groups living above the poverty line.
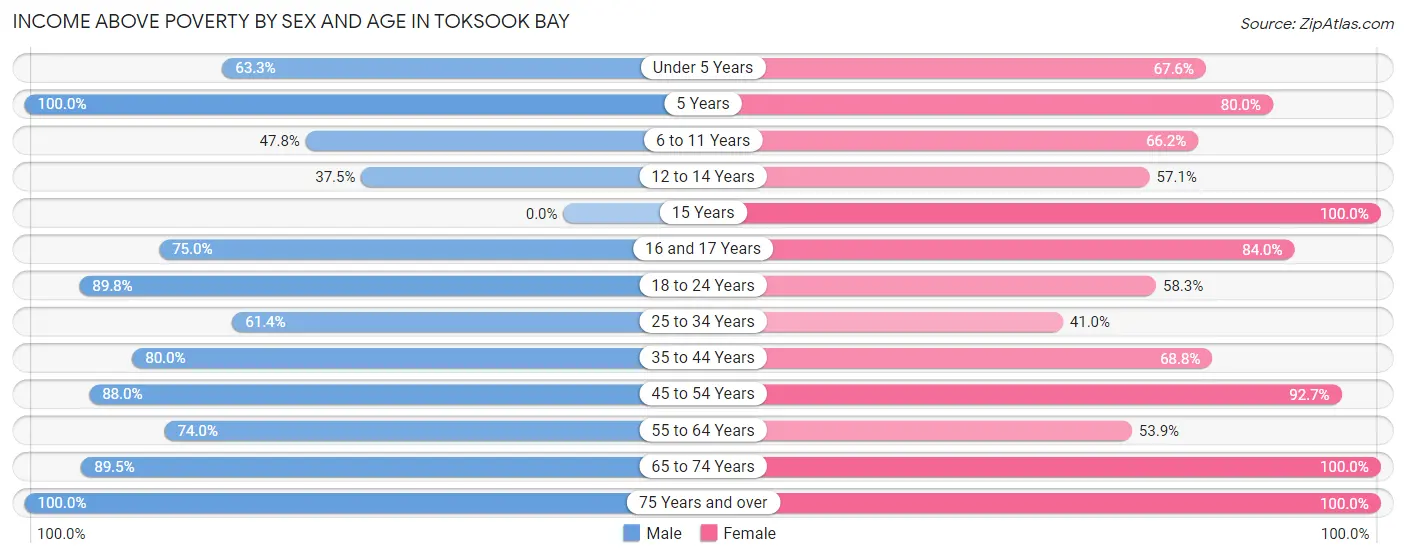
| Age Bracket | Male | Female |
| Under 5 Years | 50 (63.3%) | 50 (67.6%) |
| 5 Years | 8 (100.0%) | 4 (80.0%) |
| 6 to 11 Years | 22 (47.8%) | 43 (66.1%) |
| 12 to 14 Years | 3 (37.5%) | 12 (57.1%) |
| 15 Years | 0 (0.0%) | 19 (100.0%) |
| 16 and 17 Years | 6 (75.0%) | 21 (84.0%) |
| 18 to 24 Years | 53 (89.8%) | 21 (58.3%) |
| 25 to 34 Years | 43 (61.4%) | 16 (41.0%) |
| 35 to 44 Years | 24 (80.0%) | 33 (68.8%) |
| 45 to 54 Years | 44 (88.0%) | 51 (92.7%) |
| 55 to 64 Years | 37 (74.0%) | 7 (53.8%) |
| 65 to 74 Years | 17 (89.5%) | 40 (100.0%) |
| 75 Years and over | 18 (100.0%) | 21 (100.0%) |
| Total | 325 (71.7%) | 338 (73.3%) |
Income Below Poverty Among Married-Couple Families in Toksook Bay
The poverty statistics for married-couple families in Toksook Bay show that 21.4% or 28 of the total 131 families live below the poverty line. Families with 5 or more children have the highest poverty rate of 42.9%, comprising of 3 families. On the other hand, families with no children have the lowest poverty rate of 0.0%, which includes 0 families.
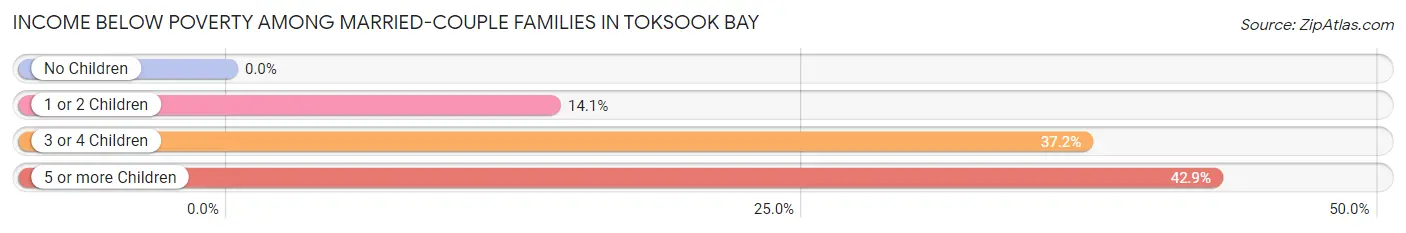
| Children | Above Poverty | Below Poverty |
| No Children | 17 (100.0%) | 0 (0.0%) |
| 1 or 2 Children | 55 (85.9%) | 9 (14.1%) |
| 3 or 4 Children | 27 (62.8%) | 16 (37.2%) |
| 5 or more Children | 4 (57.1%) | 3 (42.9%) |
| Total | 103 (78.6%) | 28 (21.4%) |
Income Below Poverty Among Single-Parent Households in Toksook Bay
According to the poverty data in Toksook Bay, 33.3% or 2 single-father households and 42.3% or 11 single-mother households are living below the poverty line. Among single-father households, those with 3 or 4 children have the highest poverty rate, with 2 households (50.0%) experiencing poverty. Likewise, among single-mother households, those with 3 or 4 children have the highest poverty rate, with 5 households (100.0%) falling below the poverty line.
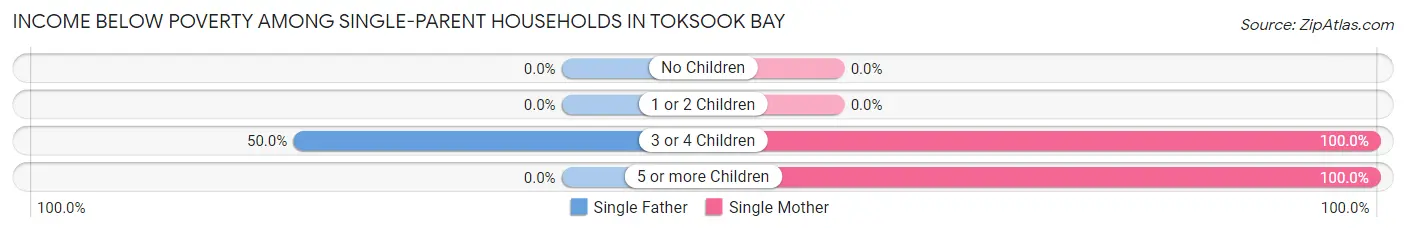
| Children | Single Father | Single Mother |
| No Children | 0 (0.0%) | 0 (0.0%) |
| 1 or 2 Children | 0 (0.0%) | 0 (0.0%) |
| 3 or 4 Children | 2 (50.0%) | 5 (100.0%) |
| 5 or more Children | 0 (0.0%) | 6 (100.0%) |
| Total | 2 (33.3%) | 11 (42.3%) |
Income Below Poverty Among Married-Couple vs Single-Parent Households in Toksook Bay
The poverty data for Toksook Bay shows that 28 of the married-couple family households (21.4%) and 13 of the single-parent households (40.6%) are living below the poverty level. Within the married-couple family households, those with 5 or more children have the highest poverty rate, with 3 households (42.9%) falling below the poverty line. Among the single-parent households, those with 5 or more children have the highest poverty rate, with 6 household (100.0%) living below poverty.
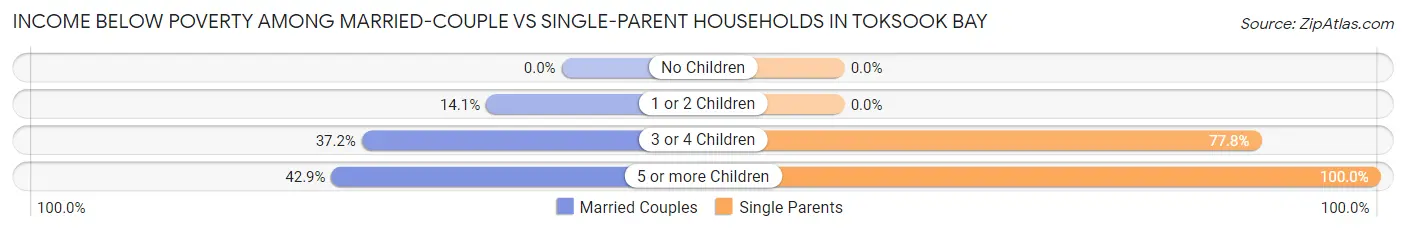
| Children | Married-Couple Families | Single-Parent Households |
| No Children | 0 (0.0%) | 0 (0.0%) |
| 1 or 2 Children | 9 (14.1%) | 0 (0.0%) |
| 3 or 4 Children | 16 (37.2%) | 7 (77.8%) |
| 5 or more Children | 3 (42.9%) | 6 (100.0%) |
| Total | 28 (21.4%) | 13 (40.6%) |
Race in Toksook Bay
The most populous races in Toksook Bay are Native / Alaskan (879 | 96.2%), Two or more Races (21 | 2.3%), and White / Caucasian (12 | 1.3%).
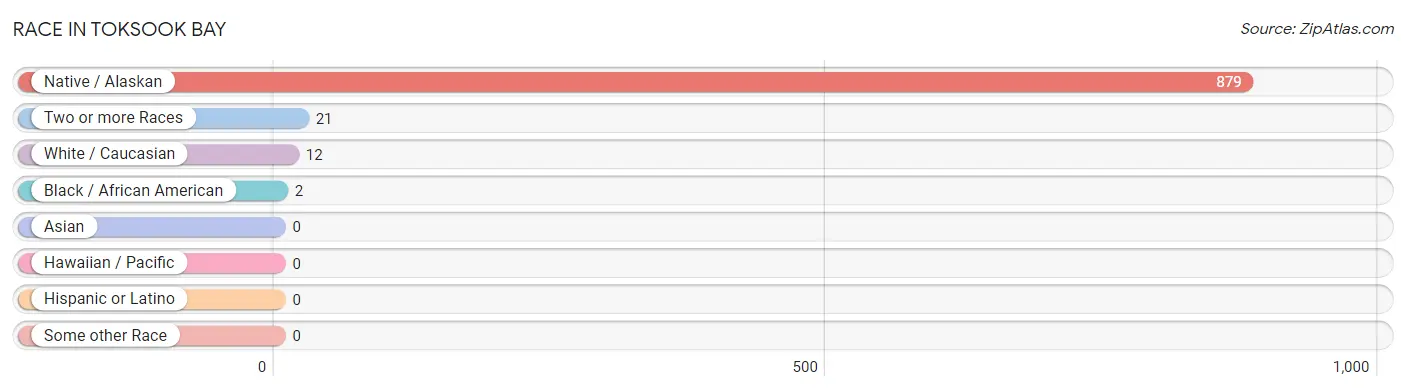
| Race | # Population | % Population |
| Asian | 0 | 0.0% |
| Black / African American | 2 | 0.2% |
| Hawaiian / Pacific | 0 | 0.0% |
| Hispanic or Latino | 0 | 0.0% |
| Native / Alaskan | 879 | 96.2% |
| White / Caucasian | 12 | 1.3% |
| Two or more Races | 21 | 2.3% |
| Some other Race | 0 | 0.0% |
| Total | 914 | 100.0% |
Ancestry in Toksook Bay
The most populous ancestries reported in Toksook Bay are Yup'ik (695 | 76.0%), Alaska Native (197 | 21.5%), British (6 | 0.7%), Eastern European (6 | 0.7%), and Aleut (5 | 0.5%), together accounting for 99.5% of all Toksook Bay residents.
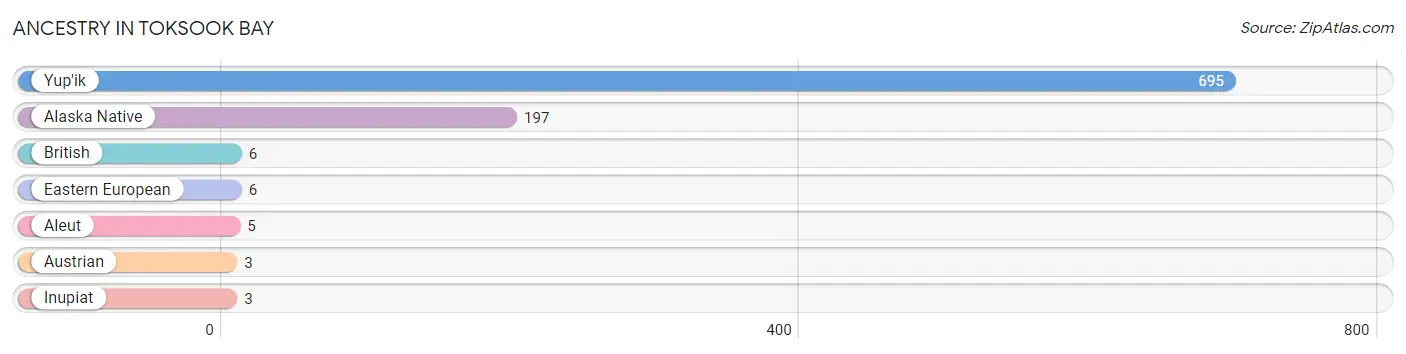
| Ancestry | # Population | % Population |
| Alaska Native | 197 | 21.5% |
| Aleut | 5 | 0.5% |
| Austrian | 3 | 0.3% |
| British | 6 | 0.7% |
| Eastern European | 6 | 0.7% |
| Inupiat | 3 | 0.3% |
| Yup'ik | 695 | 76.0% | View All 7 Rows |
Immigrants in Toksook Bay

| Immigration Origin | # Population | % Population | View All 0 Rows |
Sex and Age in Toksook Bay
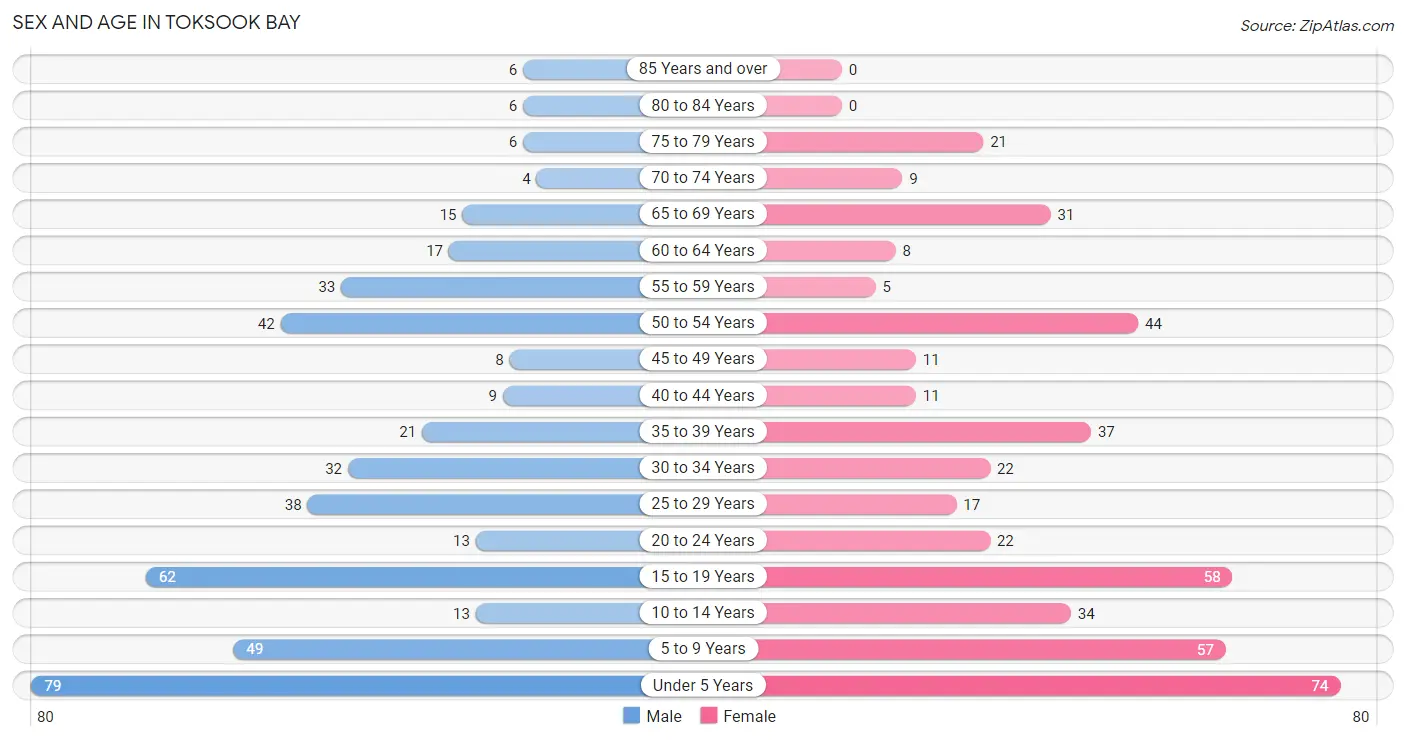
Sex and Age in Toksook Bay
The most populous age groups in Toksook Bay are Under 5 Years (79 | 17.4%) for men and Under 5 Years (74 | 16.1%) for women.
| Age Bracket | Male | Female |
| Under 5 Years | 79 (17.4%) | 74 (16.1%) |
| 5 to 9 Years | 49 (10.8%) | 57 (12.4%) |
| 10 to 14 Years | 13 (2.9%) | 34 (7.4%) |
| 15 to 19 Years | 62 (13.7%) | 58 (12.6%) |
| 20 to 24 Years | 13 (2.9%) | 22 (4.8%) |
| 25 to 29 Years | 38 (8.4%) | 17 (3.7%) |
| 30 to 34 Years | 32 (7.1%) | 22 (4.8%) |
| 35 to 39 Years | 21 (4.6%) | 37 (8.0%) |
| 40 to 44 Years | 9 (2.0%) | 11 (2.4%) |
| 45 to 49 Years | 8 (1.8%) | 11 (2.4%) |
| 50 to 54 Years | 42 (9.3%) | 44 (9.5%) |
| 55 to 59 Years | 33 (7.3%) | 5 (1.1%) |
| 60 to 64 Years | 17 (3.7%) | 8 (1.7%) |
| 65 to 69 Years | 15 (3.3%) | 31 (6.7%) |
| 70 to 74 Years | 4 (0.9%) | 9 (1.9%) |
| 75 to 79 Years | 6 (1.3%) | 21 (4.6%) |
| 80 to 84 Years | 6 (1.3%) | 0 (0.0%) |
| 85 Years and over | 6 (1.3%) | 0 (0.0%) |
| Total | 453 (100.0%) | 461 (100.0%) |
Families and Households in Toksook Bay
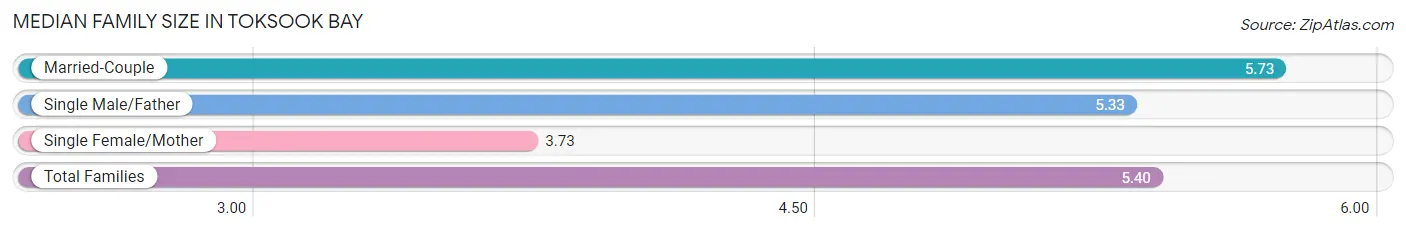
Median Family Size in Toksook Bay
The median family size in Toksook Bay is 5.40 persons per family, with married-couple families (131 | 80.4%) accounting for the largest median family size of 5.73 persons per family. On the other hand, single female/mother families (26 | 16.0%) represent the smallest median family size with 3.73 persons per family.
| Family Type | # Families | Family Size |
| Married-Couple | 131 (80.4%) | 5.73 |
| Single Male/Father | 6 (3.7%) | 5.33 |
| Single Female/Mother | 26 (16.0%) | 3.73 |
| Total Families | 163 (100.0%) | 5.40 |
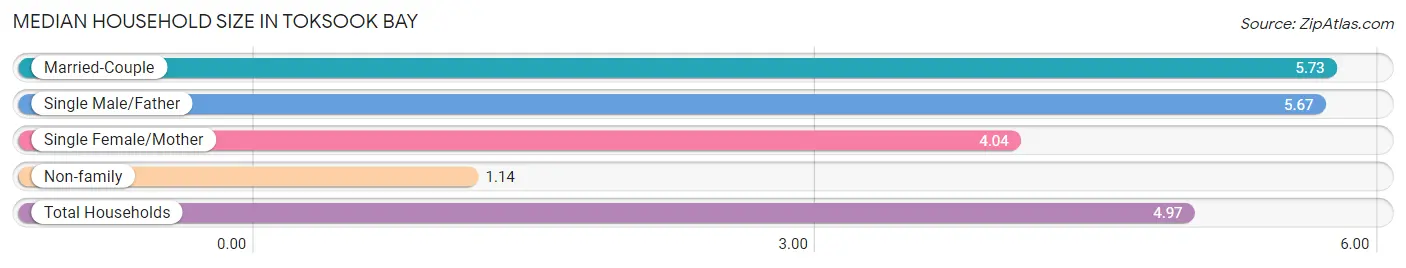
Median Household Size in Toksook Bay
The median household size in Toksook Bay is 4.97 persons per household, with married-couple households (131 | 71.2%) accounting for the largest median household size of 5.73 persons per household. non-family households (21 | 11.4%) represent the smallest median household size with 1.14 persons per household.
| Household Type | # Households | Household Size |
| Married-Couple | 131 (71.2%) | 5.73 |
| Single Male/Father | 6 (3.3%) | 5.67 |
| Single Female/Mother | 26 (14.1%) | 4.04 |
| Non-family | 21 (11.4%) | 1.14 |
| Total Households | 184 (100.0%) | 4.97 |
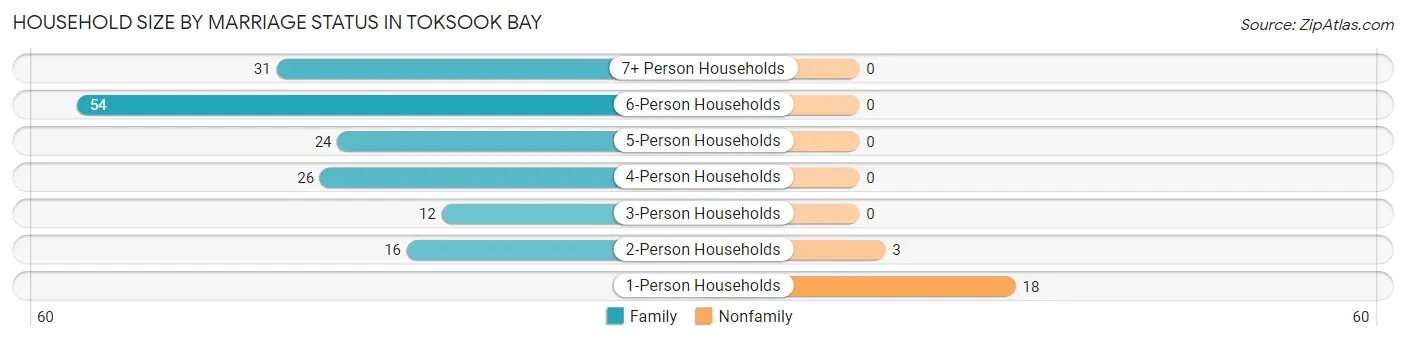
Household Size by Marriage Status in Toksook Bay
Out of a total of 184 households in Toksook Bay, 163 (88.6%) are family households, while 21 (11.4%) are nonfamily households. The most numerous type of family households are 6-person households, comprising 54, and the most common type of nonfamily households are 1-person households, comprising 18.
| Household Size | Family Households | Nonfamily Households |
| 1-Person Households | - | 18 (9.8%) |
| 2-Person Households | 16 (8.7%) | 3 (1.6%) |
| 3-Person Households | 12 (6.5%) | 0 (0.0%) |
| 4-Person Households | 26 (14.1%) | 0 (0.0%) |
| 5-Person Households | 24 (13.0%) | 0 (0.0%) |
| 6-Person Households | 54 (29.3%) | 0 (0.0%) |
| 7+ Person Households | 31 (16.9%) | 0 (0.0%) |
| Total | 163 (88.6%) | 21 (11.4%) |
Female Fertility in Toksook Bay
Fertility by Age in Toksook Bay
Average fertility rate in Toksook Bay is 147.0 births per 1,000 women. Women in the age bracket of 20 to 34 years have the highest fertility rate with 328.0 births per 1,000 women. Women in the age bracket of 20 to 34 years acount for 74.1% of all women with births.
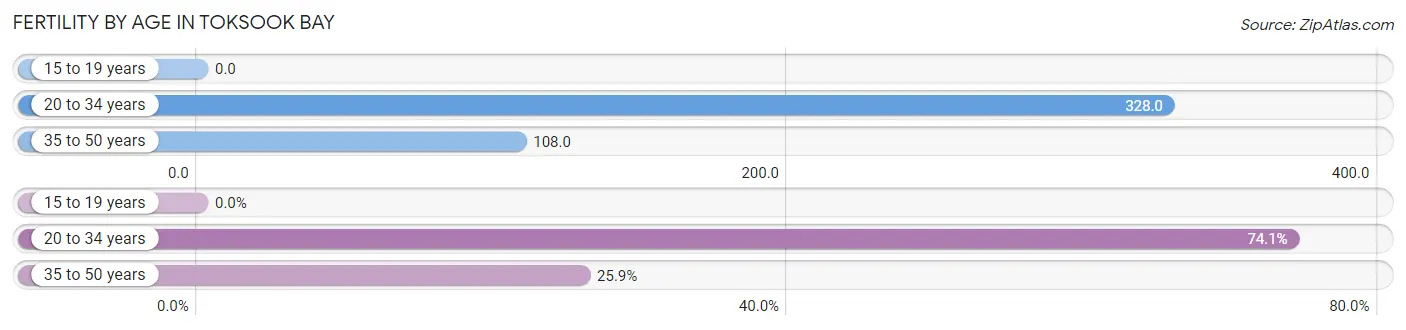
| Age Bracket | Women with Births | Births / 1,000 Women |
| 15 to 19 years | 0 (0.0%) | 0.0 |
| 20 to 34 years | 20 (74.1%) | 328.0 |
| 35 to 50 years | 7 (25.9%) | 108.0 |
| Total | 27 (100.0%) | 147.0 |
Fertility by Age by Marriage Status in Toksook Bay
63.0% of women with births (27) in Toksook Bay are married. The highest percentage of unmarried women with births falls into 35 to 50 years age bracket with 42.9% of them unmarried at the time of birth, while the lowest percentage of unmarried women with births belong to 20 to 34 years age bracket with 35.0% of them unmarried.
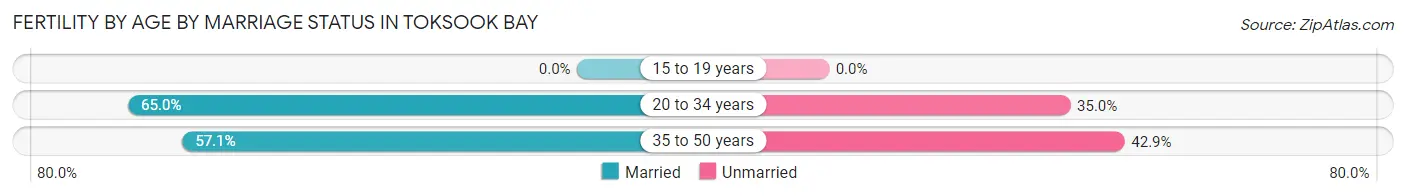
| Age Bracket | Married | Unmarried |
| 15 to 19 years | 0 (0.0%) | 0 (0.0%) |
| 20 to 34 years | 13 (65.0%) | 7 (35.0%) |
| 35 to 50 years | 4 (57.1%) | 3 (42.9%) |
| Total | 17 (63.0%) | 10 (37.0%) |
Fertility by Education in Toksook Bay
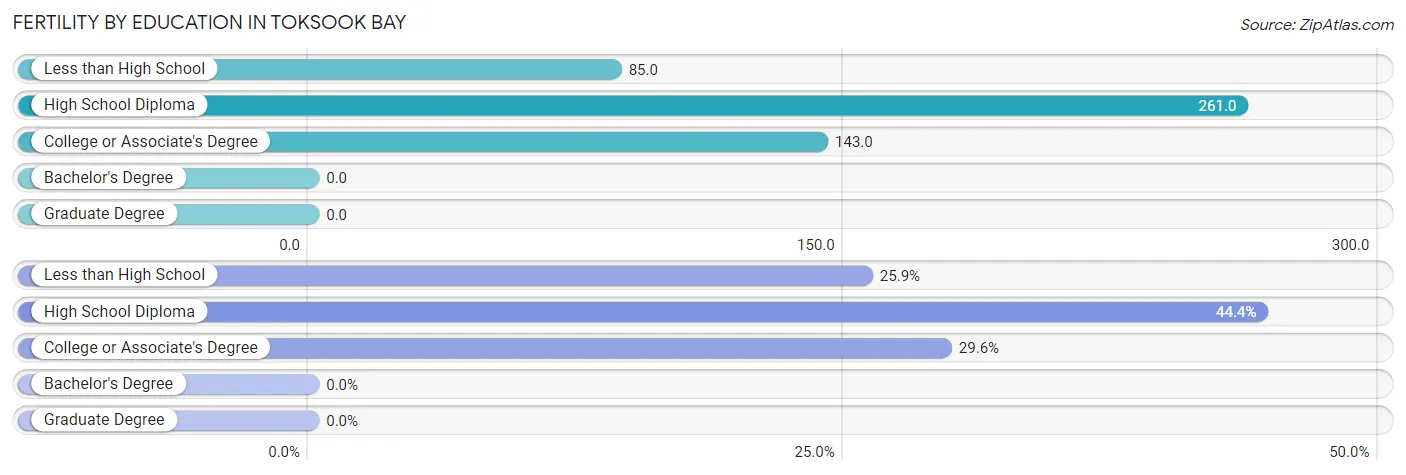
| Educational Attainment | Women with Births | Births / 1,000 Women |
| Less than High School | 7 (25.9%) | 85.0 |
| High School Diploma | 12 (44.4%) | 261.0 |
| College or Associate's Degree | 8 (29.6%) | 143.0 |
| Bachelor's Degree | 0 (0.0%) | 0.0 |
| Graduate Degree | 0 (0.0%) | 0.0 |
| Total | 27 (100.0%) | 147.0 |
Fertility by Education by Marriage Status in Toksook Bay
37.0% of women with births in Toksook Bay are unmarried. Women with the educational attainment of college or associate's degree are most likely to be married with 75.0% of them married at childbirth, while women with the educational attainment of less than high school are least likely to be married with 42.9% of them unmarried at childbirth.
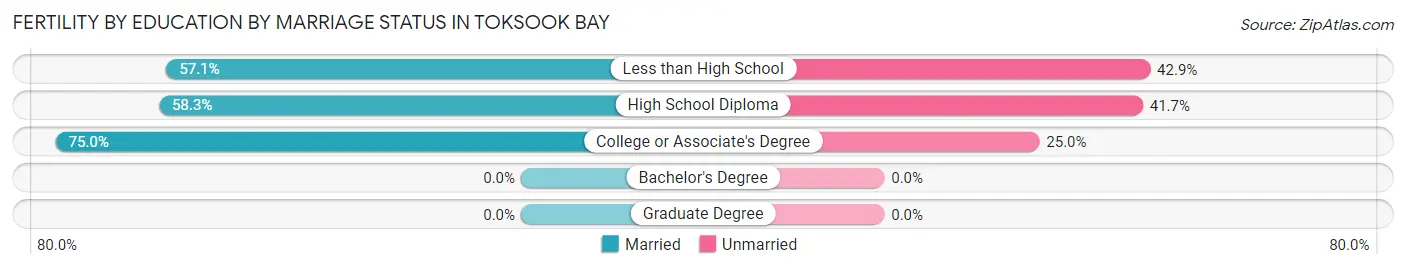
| Educational Attainment | Married | Unmarried |
| Less than High School | 4 (57.1%) | 3 (42.9%) |
| High School Diploma | 7 (58.3%) | 5 (41.7%) |
| College or Associate's Degree | 6 (75.0%) | 2 (25.0%) |
| Bachelor's Degree | 0 (0.0%) | 0 (0.0%) |
| Graduate Degree | 0 (0.0%) | 0 (0.0%) |
| Total | 17 (63.0%) | 10 (37.0%) |
Employment Characteristics in Toksook Bay
Employment by Class of Employer in Toksook Bay
Among the 266 employed individuals in Toksook Bay, not-for-profit organizations (86 | 32.3%), local government employees (86 | 32.3%), and state government employees (56 | 21.0%) make up the most common classes of employment.
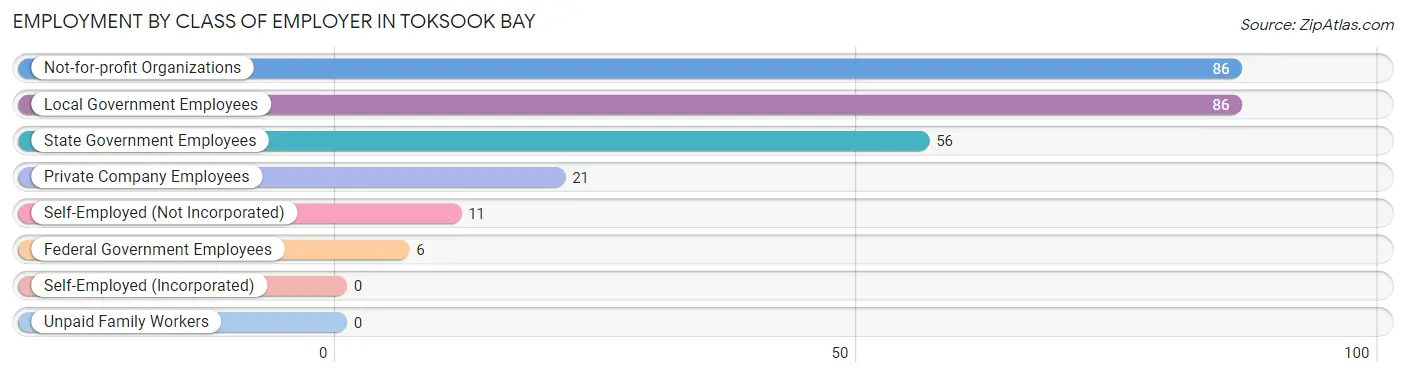
| Employer Class | # Employees | % Employees |
| Private Company Employees | 21 | 7.9% |
| Self-Employed (Incorporated) | 0 | 0.0% |
| Self-Employed (Not Incorporated) | 11 | 4.1% |
| Not-for-profit Organizations | 86 | 32.3% |
| Local Government Employees | 86 | 32.3% |
| State Government Employees | 56 | 21.0% |
| Federal Government Employees | 6 | 2.3% |
| Unpaid Family Workers | 0 | 0.0% |
| Total | 266 | 100.0% |
Employment Status by Age in Toksook Bay
According to the labor force statistics for Toksook Bay, out of the total population over 16 years of age (581), 56.8% or 330 individuals are in the labor force, with 18.8% or 62 of them unemployed. The age group with the highest labor force participation rate is 45 to 54 years, with 83.8% or 88 individuals in the labor force. Within the labor force, the 16 to 19 years age range has the highest percentage of unemployed individuals, with 100.0% or 8 of them being unemployed.
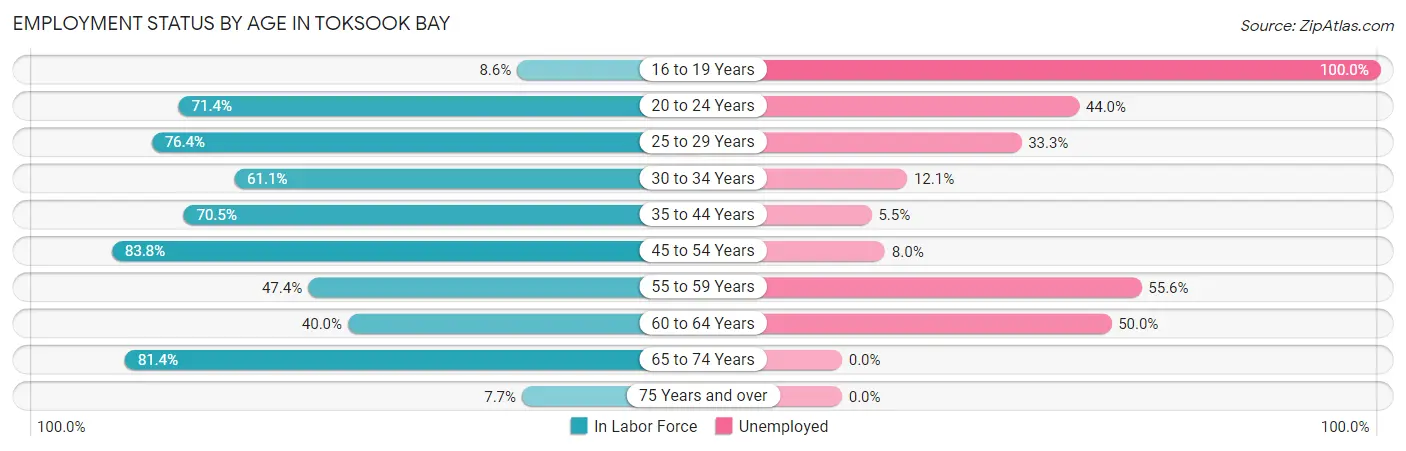
| Age Bracket | In Labor Force | Unemployed |
| 16 to 19 Years | 8 (8.6%) | 8 (100.0%) |
| 20 to 24 Years | 25 (71.4%) | 11 (44.0%) |
| 25 to 29 Years | 42 (76.4%) | 14 (33.3%) |
| 30 to 34 Years | 33 (61.1%) | 4 (12.1%) |
| 35 to 44 Years | 55 (70.5%) | 3 (5.5%) |
| 45 to 54 Years | 88 (83.8%) | 7 (8.0%) |
| 55 to 59 Years | 18 (47.4%) | 10 (55.6%) |
| 60 to 64 Years | 10 (40.0%) | 5 (50.0%) |
| 65 to 74 Years | 48 (81.4%) | 0 (0.0%) |
| 75 Years and over | 3 (7.7%) | 0 (0.0%) |
| Total | 330 (56.8%) | 62 (18.8%) |
Employment Status by Educational Attainment in Toksook Bay
According to labor force statistics for Toksook Bay, 69.3% of individuals (246) out of the total population between 25 and 64 years of age (355) are in the labor force, with 17.5% or 43 of them being unemployed. The group with the highest labor force participation rate are those with the educational attainment of bachelor's degree or higher, with 100.0% or 11 individuals in the labor force. Within the labor force, individuals with less than high school education have the highest percentage of unemployment, with 40.9% or 9 of them being unemployed.
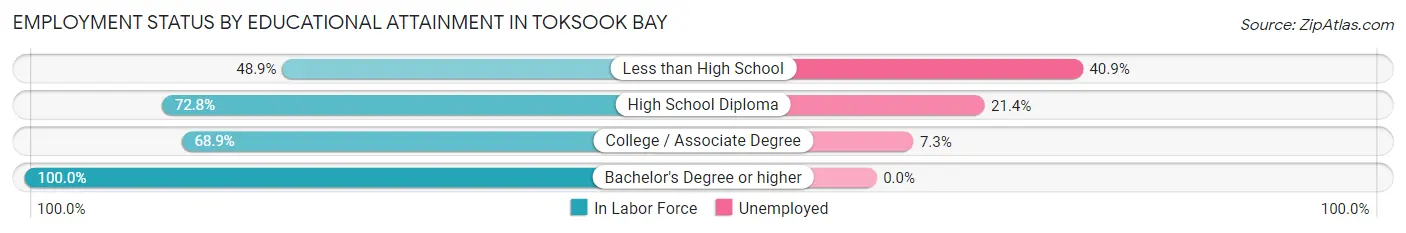
| Educational Attainment | In Labor Force | Unemployed |
| Less than High School | 22 (48.9%) | 18 (40.9%) |
| High School Diploma | 131 (72.8%) | 39 (21.4%) |
| College / Associate Degree | 82 (68.9%) | 9 (7.3%) |
| Bachelor's Degree or higher | 11 (100.0%) | 0 (0.0%) |
| Total | 246 (69.3%) | 62 (17.5%) |
Employment Occupations by Sex in Toksook Bay
Management, Business, Science and Arts Occupations
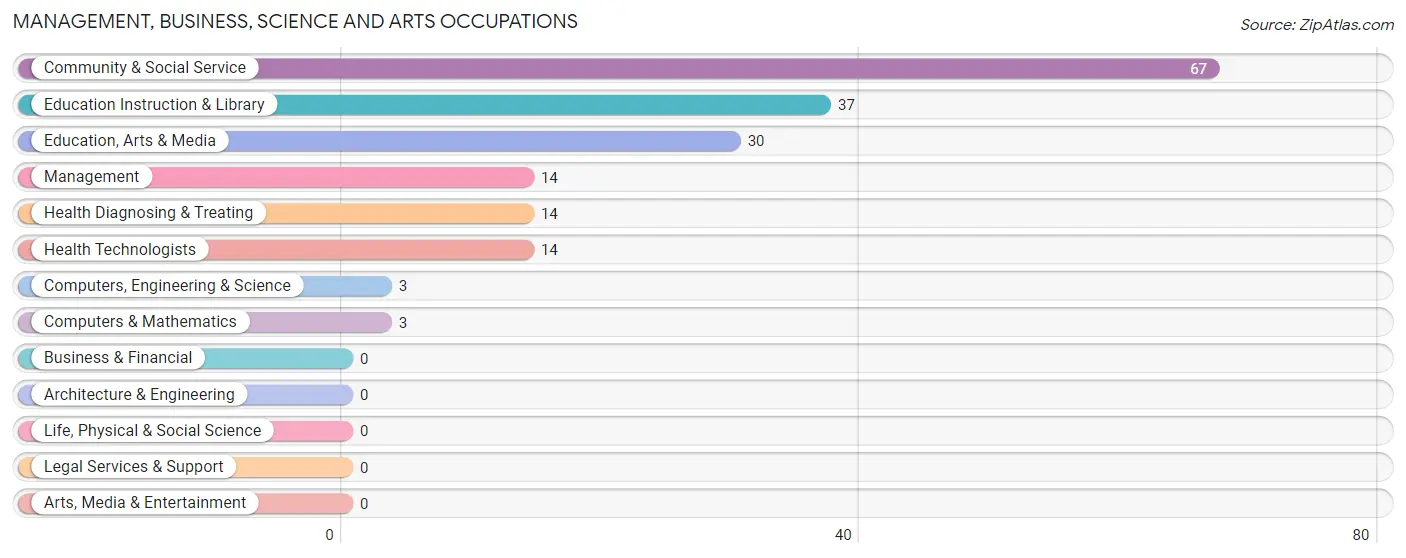
The most common Management, Business, Science and Arts occupations in Toksook Bay are Community & Social Service (67 | 25.0%), Education Instruction & Library (37 | 13.8%), Education, Arts & Media (30 | 11.2%), Management (14 | 5.2%), and Health Diagnosing & Treating (14 | 5.2%).
Management, Business, Science and Arts Occupations by Sex
Within the Management, Business, Science and Arts occupations in Toksook Bay, the most male-oriented occupations are Computers, Engineering & Science (100.0%), Computers & Mathematics (100.0%), and Health Diagnosing & Treating (42.9%), while the most female-oriented occupations are Education Instruction & Library (100.0%), Community & Social Service (97.0%), and Education, Arts & Media (93.3%).
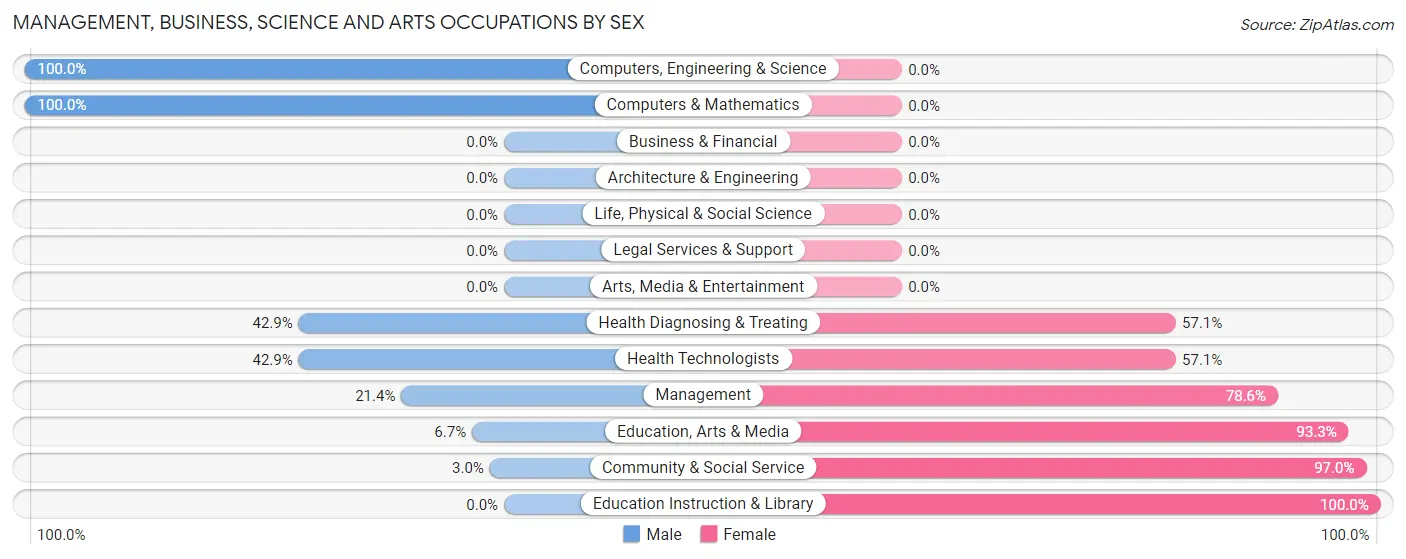
| Occupation | Male | Female |
| Management | 3 (21.4%) | 11 (78.6%) |
| Business & Financial | 0 (0.0%) | 0 (0.0%) |
| Computers, Engineering & Science | 3 (100.0%) | 0 (0.0%) |
| Computers & Mathematics | 3 (100.0%) | 0 (0.0%) |
| Architecture & Engineering | 0 (0.0%) | 0 (0.0%) |
| Life, Physical & Social Science | 0 (0.0%) | 0 (0.0%) |
| Community & Social Service | 2 (3.0%) | 65 (97.0%) |
| Education, Arts & Media | 2 (6.7%) | 28 (93.3%) |
| Legal Services & Support | 0 (0.0%) | 0 (0.0%) |
| Education Instruction & Library | 0 (0.0%) | 37 (100.0%) |
| Arts, Media & Entertainment | 0 (0.0%) | 0 (0.0%) |
| Health Diagnosing & Treating | 6 (42.9%) | 8 (57.1%) |
| Health Technologists | 6 (42.9%) | 8 (57.1%) |
| Total (Category) | 14 (14.3%) | 84 (85.7%) |
| Total (Overall) | 111 (41.4%) | 157 (58.6%) |
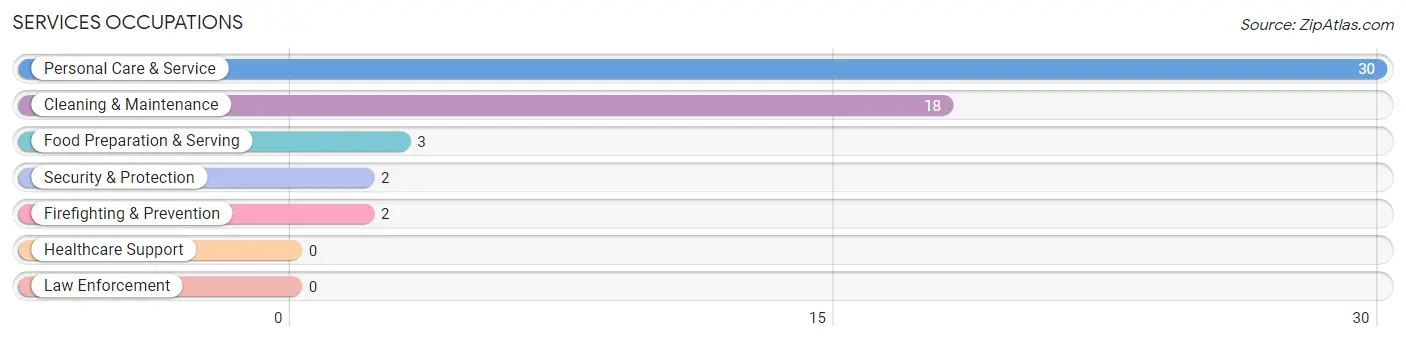
Services Occupations
The most common Services occupations in Toksook Bay are Personal Care & Service (30 | 11.2%), Cleaning & Maintenance (18 | 6.7%), Food Preparation & Serving (3 | 1.1%), Security & Protection (2 | 0.7%), and Firefighting & Prevention (2 | 0.7%).
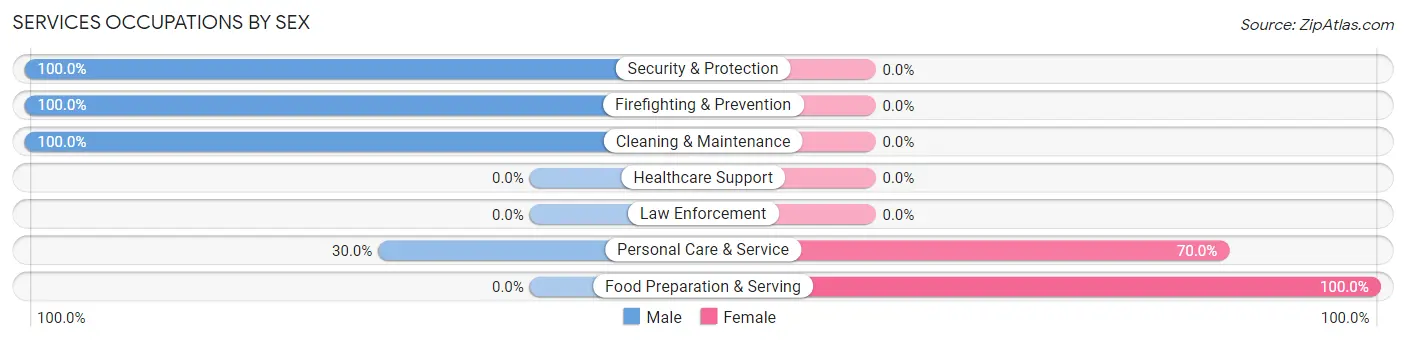
Services Occupations by Sex
Within the Services occupations in Toksook Bay, the most male-oriented occupations are Security & Protection (100.0%), Firefighting & Prevention (100.0%), and Cleaning & Maintenance (100.0%), while the most female-oriented occupations are Food Preparation & Serving (100.0%), and Personal Care & Service (70.0%).
| Occupation | Male | Female |
| Healthcare Support | 0 (0.0%) | 0 (0.0%) |
| Security & Protection | 2 (100.0%) | 0 (0.0%) |
| Firefighting & Prevention | 2 (100.0%) | 0 (0.0%) |
| Law Enforcement | 0 (0.0%) | 0 (0.0%) |
| Food Preparation & Serving | 0 (0.0%) | 3 (100.0%) |
| Cleaning & Maintenance | 18 (100.0%) | 0 (0.0%) |
| Personal Care & Service | 9 (30.0%) | 21 (70.0%) |
| Total (Category) | 29 (54.7%) | 24 (45.3%) |
| Total (Overall) | 111 (41.4%) | 157 (58.6%) |
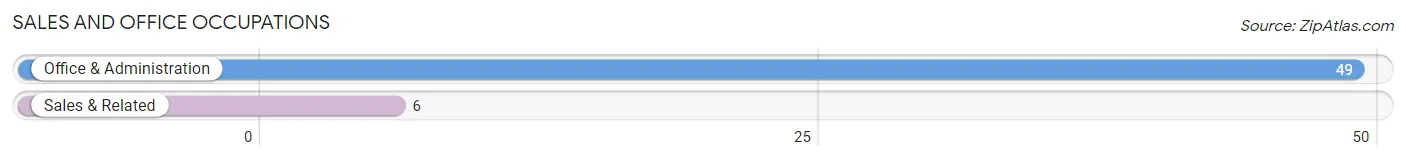
Sales and Office Occupations
The most common Sales and Office occupations in Toksook Bay are Office & Administration (49 | 18.3%), and Sales & Related (6 | 2.2%).
Sales and Office Occupations by Sex
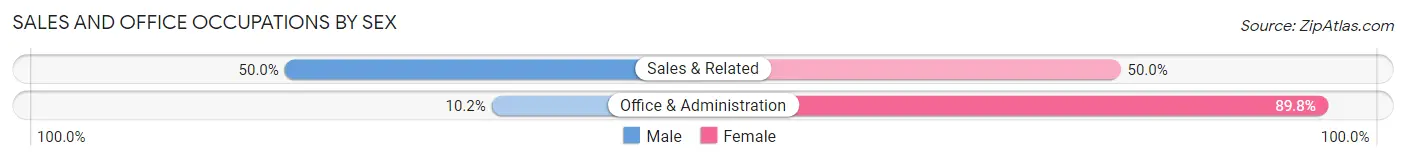
| Occupation | Male | Female |
| Sales & Related | 3 (50.0%) | 3 (50.0%) |
| Office & Administration | 5 (10.2%) | 44 (89.8%) |
| Total (Category) | 8 (14.5%) | 47 (85.5%) |
| Total (Overall) | 111 (41.4%) | 157 (58.6%) |
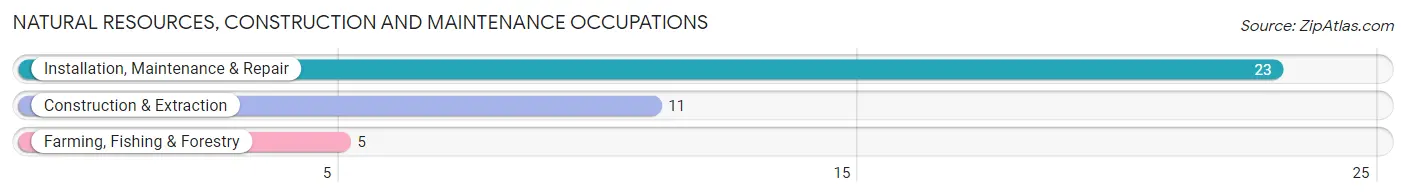
Natural Resources, Construction and Maintenance Occupations
The most common Natural Resources, Construction and Maintenance occupations in Toksook Bay are Installation, Maintenance & Repair (23 | 8.6%), Construction & Extraction (11 | 4.1%), and Farming, Fishing & Forestry (5 | 1.9%).
Natural Resources, Construction and Maintenance Occupations by Sex
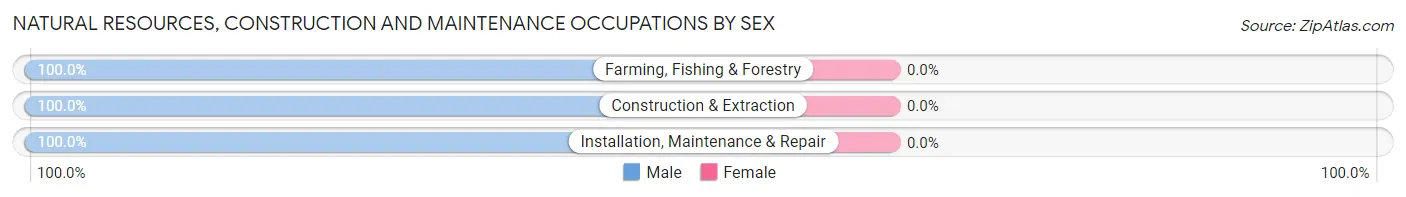
| Occupation | Male | Female |
| Farming, Fishing & Forestry | 5 (100.0%) | 0 (0.0%) |
| Construction & Extraction | 11 (100.0%) | 0 (0.0%) |
| Installation, Maintenance & Repair | 23 (100.0%) | 0 (0.0%) |
| Total (Category) | 39 (100.0%) | 0 (0.0%) |
| Total (Overall) | 111 (41.4%) | 157 (58.6%) |
Production, Transportation and Moving Occupations
The most common Production, Transportation and Moving occupations in Toksook Bay are Transportation (10 | 3.7%), Material Moving (10 | 3.7%), and Production (3 | 1.1%).
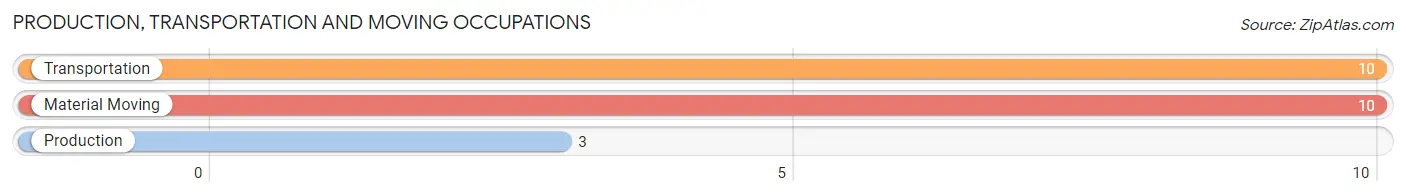
Production, Transportation and Moving Occupations by Sex
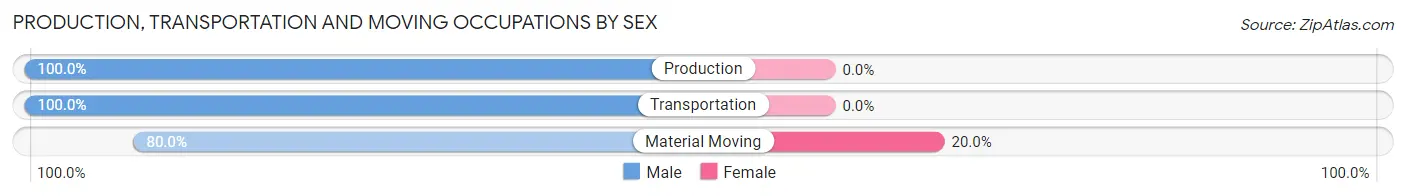
| Occupation | Male | Female |
| Production | 3 (100.0%) | 0 (0.0%) |
| Transportation | 10 (100.0%) | 0 (0.0%) |
| Material Moving | 8 (80.0%) | 2 (20.0%) |
| Total (Category) | 21 (91.3%) | 2 (8.7%) |
| Total (Overall) | 111 (41.4%) | 157 (58.6%) |
Employment Industries by Sex in Toksook Bay
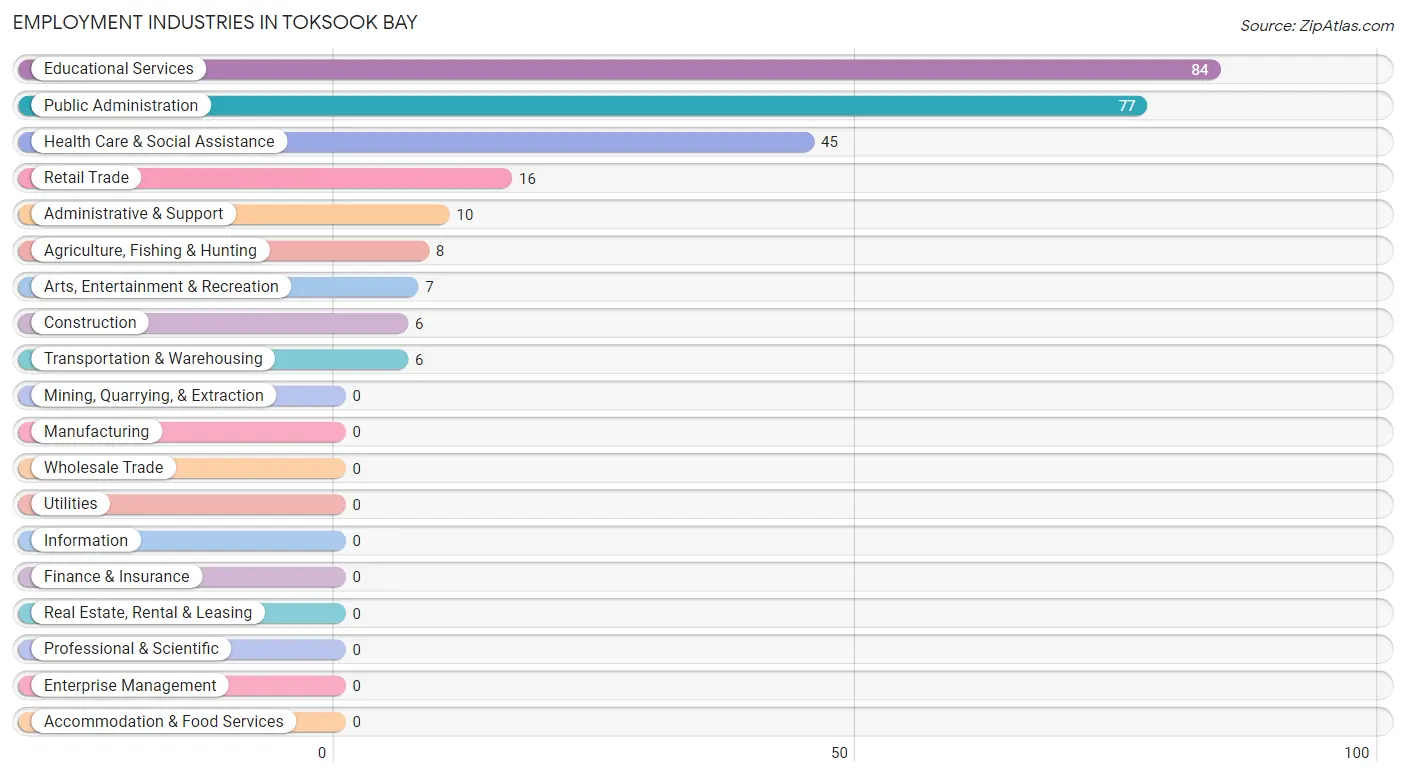
Employment Industries in Toksook Bay
The major employment industries in Toksook Bay include Educational Services (84 | 31.3%), Public Administration (77 | 28.7%), Health Care & Social Assistance (45 | 16.8%), Retail Trade (16 | 6.0%), and Administrative & Support (10 | 3.7%).
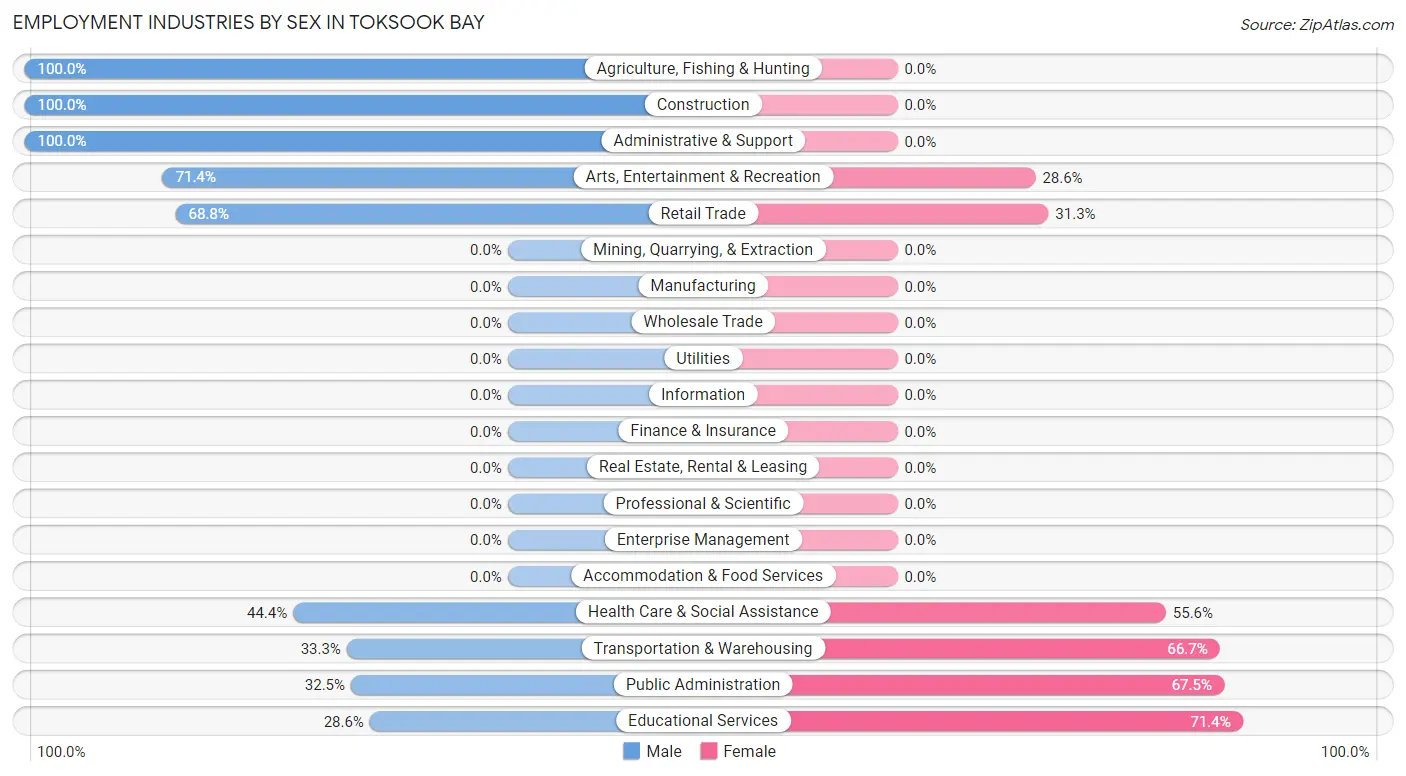
Employment Industries by Sex in Toksook Bay
The Toksook Bay industries that see more men than women are Agriculture, Fishing & Hunting (100.0%), Construction (100.0%), and Administrative & Support (100.0%), whereas the industries that tend to have a higher number of women are Educational Services (71.4%), Public Administration (67.5%), and Transportation & Warehousing (66.7%).
| Industry | Male | Female |
| Agriculture, Fishing & Hunting | 8 (100.0%) | 0 (0.0%) |
| Mining, Quarrying, & Extraction | 0 (0.0%) | 0 (0.0%) |
| Construction | 6 (100.0%) | 0 (0.0%) |
| Manufacturing | 0 (0.0%) | 0 (0.0%) |
| Wholesale Trade | 0 (0.0%) | 0 (0.0%) |
| Retail Trade | 11 (68.8%) | 5 (31.2%) |
| Transportation & Warehousing | 2 (33.3%) | 4 (66.7%) |
| Utilities | 0 (0.0%) | 0 (0.0%) |
| Information | 0 (0.0%) | 0 (0.0%) |
| Finance & Insurance | 0 (0.0%) | 0 (0.0%) |
| Real Estate, Rental & Leasing | 0 (0.0%) | 0 (0.0%) |
| Professional & Scientific | 0 (0.0%) | 0 (0.0%) |
| Enterprise Management | 0 (0.0%) | 0 (0.0%) |
| Administrative & Support | 10 (100.0%) | 0 (0.0%) |
| Educational Services | 24 (28.6%) | 60 (71.4%) |
| Health Care & Social Assistance | 20 (44.4%) | 25 (55.6%) |
| Arts, Entertainment & Recreation | 5 (71.4%) | 2 (28.6%) |
| Accommodation & Food Services | 0 (0.0%) | 0 (0.0%) |
| Public Administration | 25 (32.5%) | 52 (67.5%) |
| Total | 111 (41.4%) | 157 (58.6%) |
Education in Toksook Bay
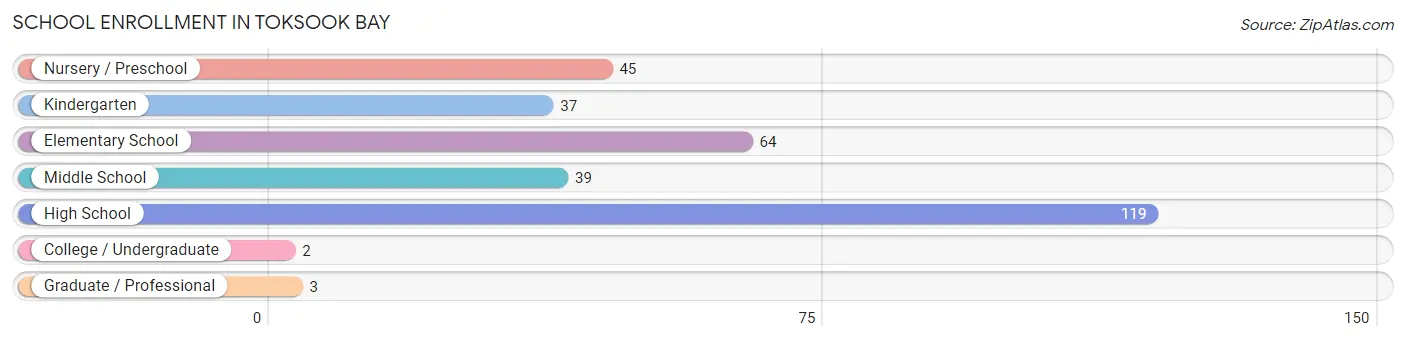
School Enrollment in Toksook Bay
The most common levels of schooling among the 309 students in Toksook Bay are high school (119 | 38.5%), elementary school (64 | 20.7%), and nursery / preschool (45 | 14.6%).
| School Level | # Students | % Students |
| Nursery / Preschool | 45 | 14.6% |
| Kindergarten | 37 | 12.0% |
| Elementary School | 64 | 20.7% |
| Middle School | 39 | 12.6% |
| High School | 119 | 38.5% |
| College / Undergraduate | 2 | 0.6% |
| Graduate / Professional | 3 | 1.0% |
| Total | 309 | 100.0% |
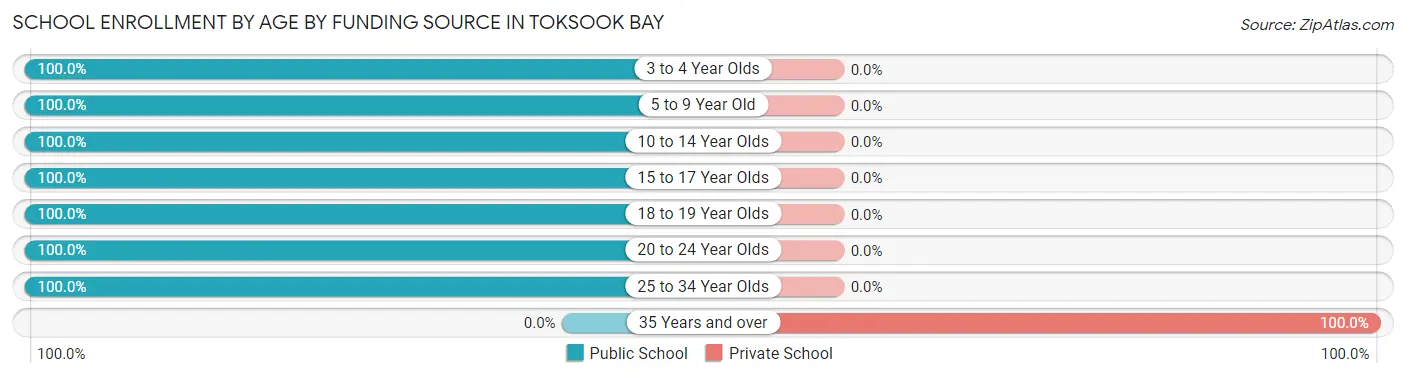
School Enrollment by Age by Funding Source in Toksook Bay
Out of a total of 309 students who are enrolled in schools in Toksook Bay, 3 (1.0%) attend a private institution, while the remaining 306 (99.0%) are enrolled in public schools. The age group of 35 years and over has the highest likelihood of being enrolled in private schools, with 3 (100.0% in the age bracket) enrolled. Conversely, the age group of 3 to 4 year olds has the lowest likelihood of being enrolled in a private school, with 43 (100.0% in the age bracket) attending a public institution.
| Age Bracket | Public School | Private School |
| 3 to 4 Year Olds | 43 (100.0%) | 0 (0.0%) |
| 5 to 9 Year Old | 103 (100.0%) | 0 (0.0%) |
| 10 to 14 Year Olds | 47 (100.0%) | 0 (0.0%) |
| 15 to 17 Year Olds | 57 (100.0%) | 0 (0.0%) |
| 18 to 19 Year Olds | 50 (100.0%) | 0 (0.0%) |
| 20 to 24 Year Olds | 4 (100.0%) | 0 (0.0%) |
| 25 to 34 Year Olds | 2 (100.0%) | 0 (0.0%) |
| 35 Years and over | 0 (0.0%) | 3 (100.0%) |
| Total | 306 (99.0%) | 3 (1.0%) |
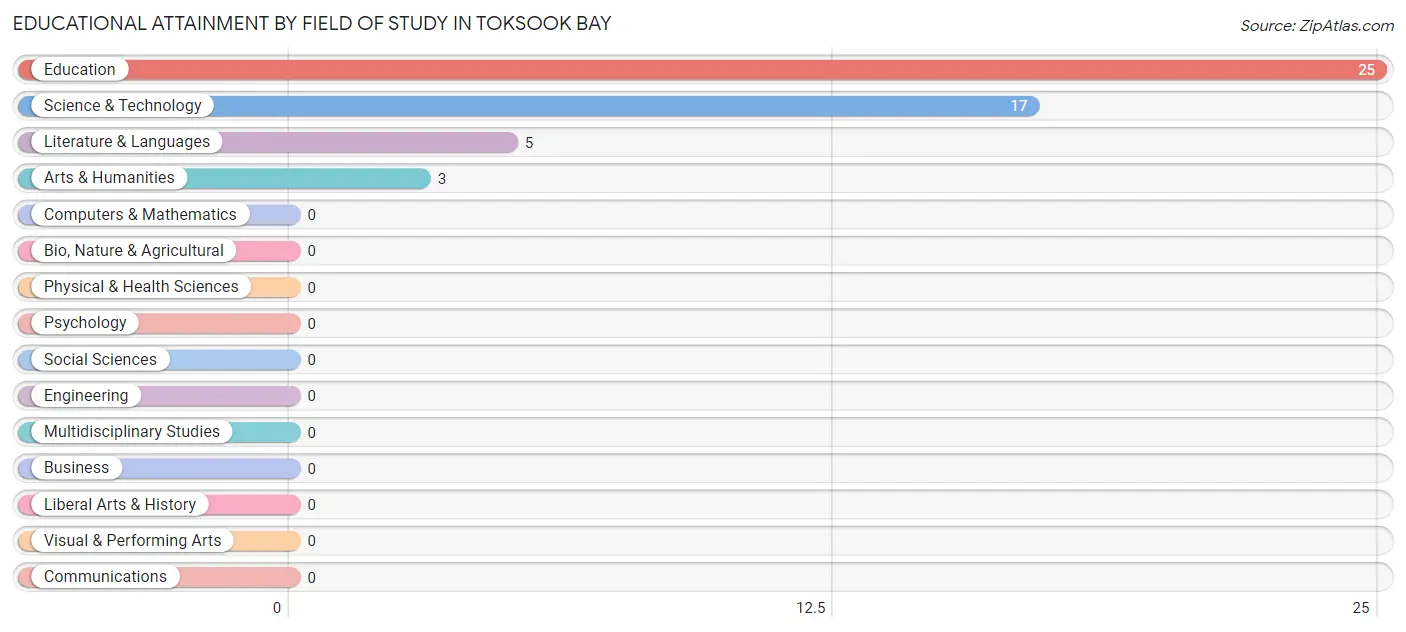
Educational Attainment by Field of Study in Toksook Bay
Education (25 | 50.0%), science & technology (17 | 34.0%), literature & languages (5 | 10.0%), and arts & humanities (3 | 6.0%) are the most common fields of study among 50 individuals in Toksook Bay who have obtained a bachelor's degree or higher.
| Field of Study | # Graduates | % Graduates |
| Computers & Mathematics | 0 | 0.0% |
| Bio, Nature & Agricultural | 0 | 0.0% |
| Physical & Health Sciences | 0 | 0.0% |
| Psychology | 0 | 0.0% |
| Social Sciences | 0 | 0.0% |
| Engineering | 0 | 0.0% |
| Multidisciplinary Studies | 0 | 0.0% |
| Science & Technology | 17 | 34.0% |
| Business | 0 | 0.0% |
| Education | 25 | 50.0% |
| Literature & Languages | 5 | 10.0% |
| Liberal Arts & History | 0 | 0.0% |
| Visual & Performing Arts | 0 | 0.0% |
| Communications | 0 | 0.0% |
| Arts & Humanities | 3 | 6.0% |
| Total | 50 | 100.0% |
Transportation & Commute in Toksook Bay
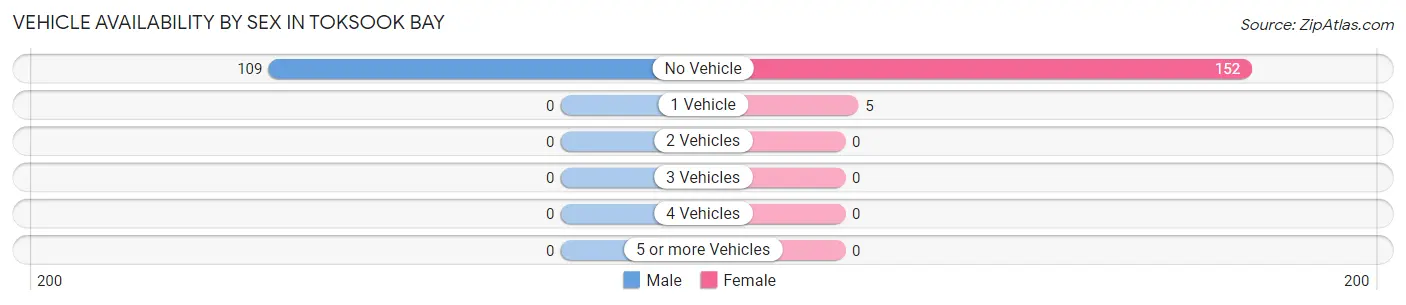
Vehicle Availability by Sex in Toksook Bay
The most prevalent vehicle ownership categories in Toksook Bay are males with no vehicle (109, accounting for 100.0%) and females with no vehicle (152, making up 69.4%).
| Vehicles Available | Male | Female |
| No Vehicle | 109 (100.0%) | 152 (96.8%) |
| 1 Vehicle | 0 (0.0%) | 5 (3.2%) |
| 2 Vehicles | 0 (0.0%) | 0 (0.0%) |
| 3 Vehicles | 0 (0.0%) | 0 (0.0%) |
| 4 Vehicles | 0 (0.0%) | 0 (0.0%) |
| 5 or more Vehicles | 0 (0.0%) | 0 (0.0%) |
| Total | 109 (100.0%) | 157 (100.0%) |
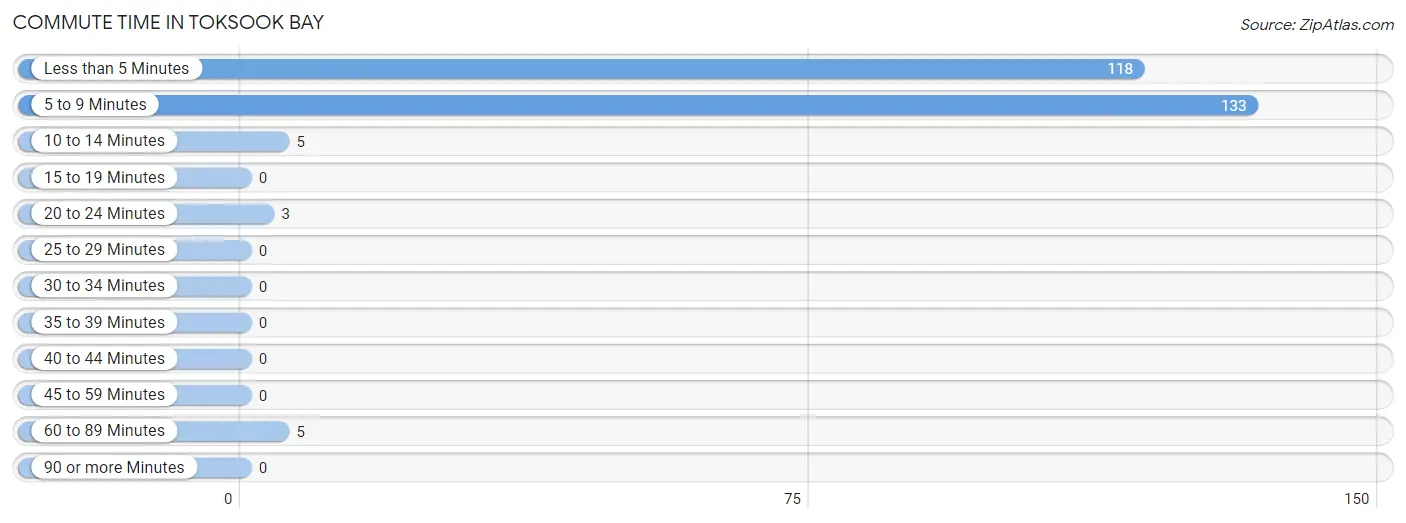
Commute Time in Toksook Bay
The most frequently occuring commute durations in Toksook Bay are 5 to 9 minutes (133 commuters, 50.4%), less than 5 minutes (118 commuters, 44.7%), and 10 to 14 minutes (5 commuters, 1.9%).
| Commute Time | # Commuters | % Commuters |
| Less than 5 Minutes | 118 | 44.7% |
| 5 to 9 Minutes | 133 | 50.4% |
| 10 to 14 Minutes | 5 | 1.9% |
| 15 to 19 Minutes | 0 | 0.0% |
| 20 to 24 Minutes | 3 | 1.1% |
| 25 to 29 Minutes | 0 | 0.0% |
| 30 to 34 Minutes | 0 | 0.0% |
| 35 to 39 Minutes | 0 | 0.0% |
| 40 to 44 Minutes | 0 | 0.0% |
| 45 to 59 Minutes | 0 | 0.0% |
| 60 to 89 Minutes | 5 | 1.9% |
| 90 or more Minutes | 0 | 0.0% |
Commute Time by Sex in Toksook Bay
The most common commute times in Toksook Bay are 5 to 9 minutes (52 commuters, 47.7%) for males and 5 to 9 minutes (81 commuters, 52.3%) for females.
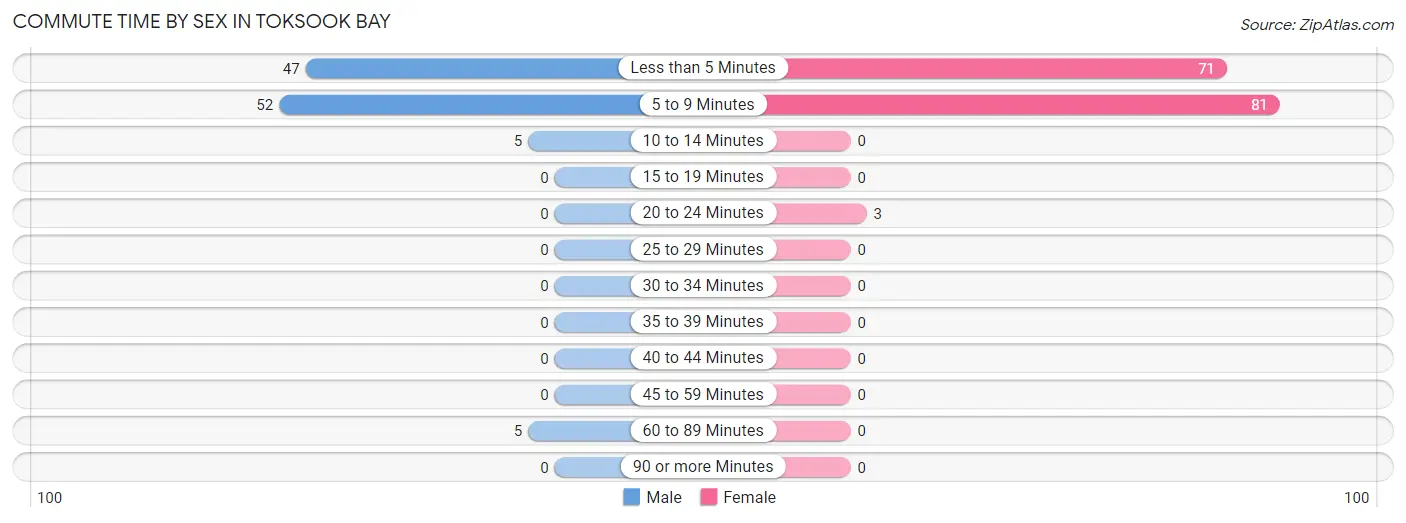
| Commute Time | Male | Female |
| Less than 5 Minutes | 47 (43.1%) | 71 (45.8%) |
| 5 to 9 Minutes | 52 (47.7%) | 81 (52.3%) |
| 10 to 14 Minutes | 5 (4.6%) | 0 (0.0%) |
| 15 to 19 Minutes | 0 (0.0%) | 0 (0.0%) |
| 20 to 24 Minutes | 0 (0.0%) | 3 (1.9%) |
| 25 to 29 Minutes | 0 (0.0%) | 0 (0.0%) |
| 30 to 34 Minutes | 0 (0.0%) | 0 (0.0%) |
| 35 to 39 Minutes | 0 (0.0%) | 0 (0.0%) |
| 40 to 44 Minutes | 0 (0.0%) | 0 (0.0%) |
| 45 to 59 Minutes | 0 (0.0%) | 0 (0.0%) |
| 60 to 89 Minutes | 5 (4.6%) | 0 (0.0%) |
| 90 or more Minutes | 0 (0.0%) | 0 (0.0%) |
Time of Departure to Work by Sex in Toksook Bay
The most frequent times of departure to work in Toksook Bay are 9:00 AM to 9:59 AM (25, 22.9%) for males and 8:00 AM to 8:29 AM (38, 24.5%) for females.
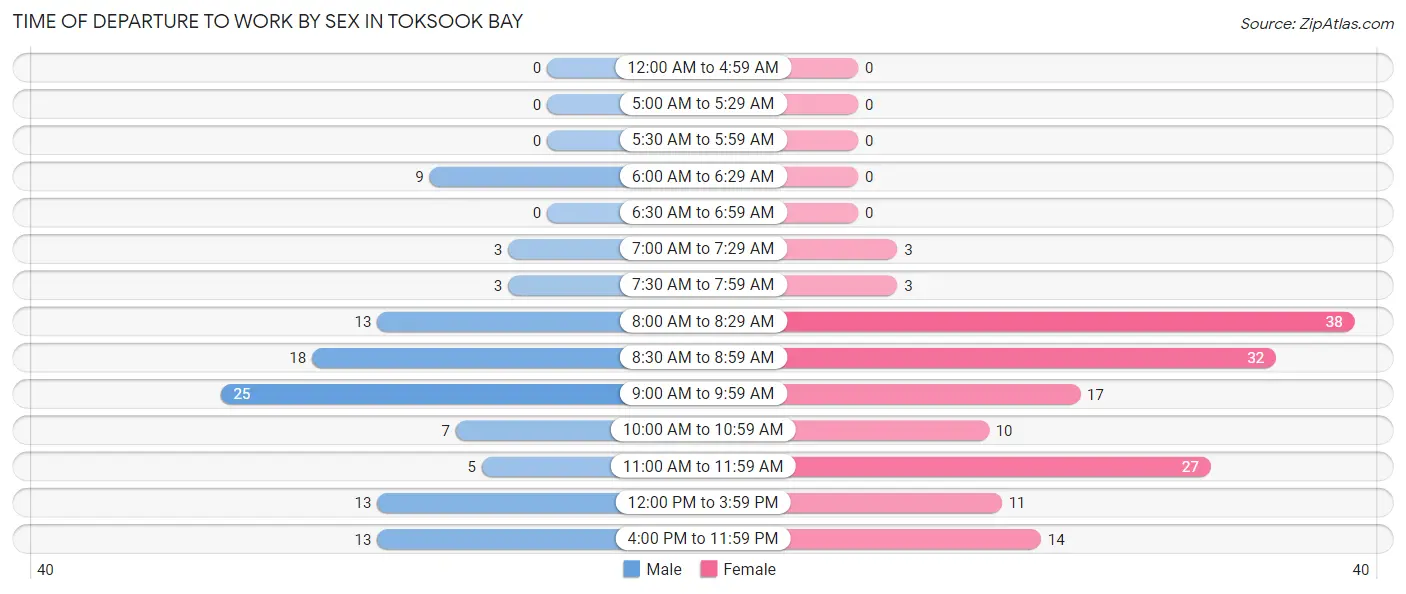
| Time of Departure | Male | Female |
| 12:00 AM to 4:59 AM | 0 (0.0%) | 0 (0.0%) |
| 5:00 AM to 5:29 AM | 0 (0.0%) | 0 (0.0%) |
| 5:30 AM to 5:59 AM | 0 (0.0%) | 0 (0.0%) |
| 6:00 AM to 6:29 AM | 9 (8.3%) | 0 (0.0%) |
| 6:30 AM to 6:59 AM | 0 (0.0%) | 0 (0.0%) |
| 7:00 AM to 7:29 AM | 3 (2.8%) | 3 (1.9%) |
| 7:30 AM to 7:59 AM | 3 (2.8%) | 3 (1.9%) |
| 8:00 AM to 8:29 AM | 13 (11.9%) | 38 (24.5%) |
| 8:30 AM to 8:59 AM | 18 (16.5%) | 32 (20.6%) |
| 9:00 AM to 9:59 AM | 25 (22.9%) | 17 (11.0%) |
| 10:00 AM to 10:59 AM | 7 (6.4%) | 10 (6.5%) |
| 11:00 AM to 11:59 AM | 5 (4.6%) | 27 (17.4%) |
| 12:00 PM to 3:59 PM | 13 (11.9%) | 11 (7.1%) |
| 4:00 PM to 11:59 PM | 13 (11.9%) | 14 (9.0%) |
| Total | 109 (100.0%) | 155 (100.0%) |
Housing Occupancy in Toksook Bay
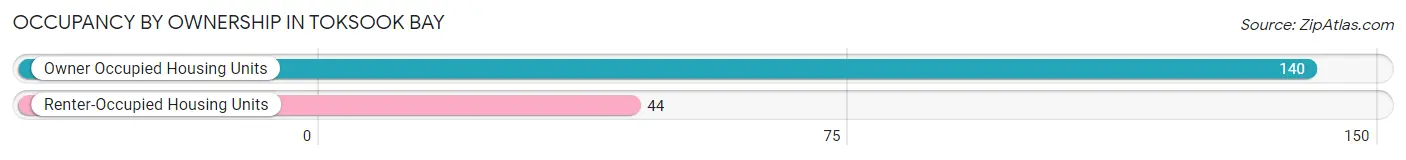
Occupancy by Ownership in Toksook Bay
Of the total 184 dwellings in Toksook Bay, owner-occupied units account for 140 (76.1%), while renter-occupied units make up 44 (23.9%).
| Occupancy | # Housing Units | % Housing Units |
| Owner Occupied Housing Units | 140 | 76.1% |
| Renter-Occupied Housing Units | 44 | 23.9% |
| Total Occupied Housing Units | 184 | 100.0% |
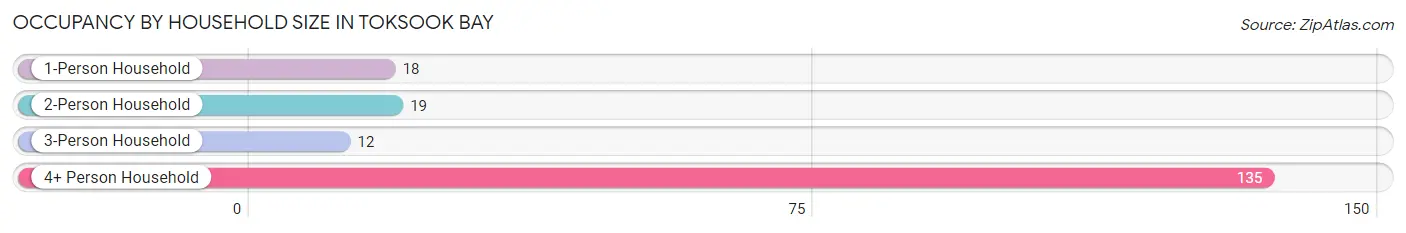
Occupancy by Household Size in Toksook Bay
| Household Size | # Housing Units | % Housing Units |
| 1-Person Household | 18 | 9.8% |
| 2-Person Household | 19 | 10.3% |
| 3-Person Household | 12 | 6.5% |
| 4+ Person Household | 135 | 73.4% |
| Total Housing Units | 184 | 100.0% |
Occupancy by Ownership by Household Size in Toksook Bay
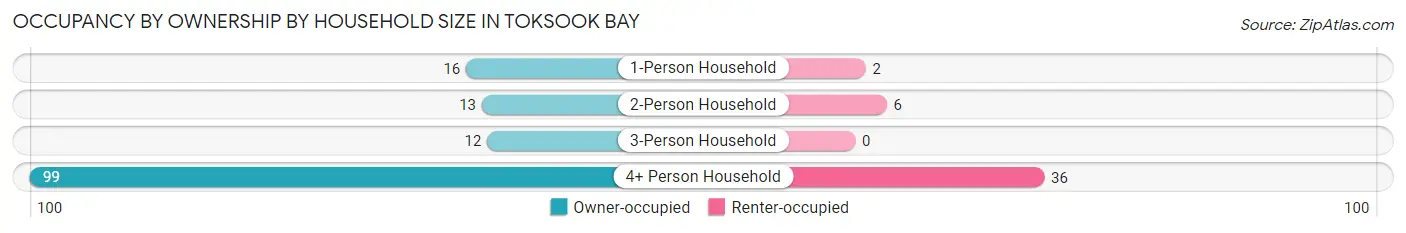
| Household Size | Owner-occupied | Renter-occupied |
| 1-Person Household | 16 (88.9%) | 2 (11.1%) |
| 2-Person Household | 13 (68.4%) | 6 (31.6%) |
| 3-Person Household | 12 (100.0%) | 0 (0.0%) |
| 4+ Person Household | 99 (73.3%) | 36 (26.7%) |
| Total Housing Units | 140 (76.1%) | 44 (23.9%) |
Occupancy by Educational Attainment in Toksook Bay
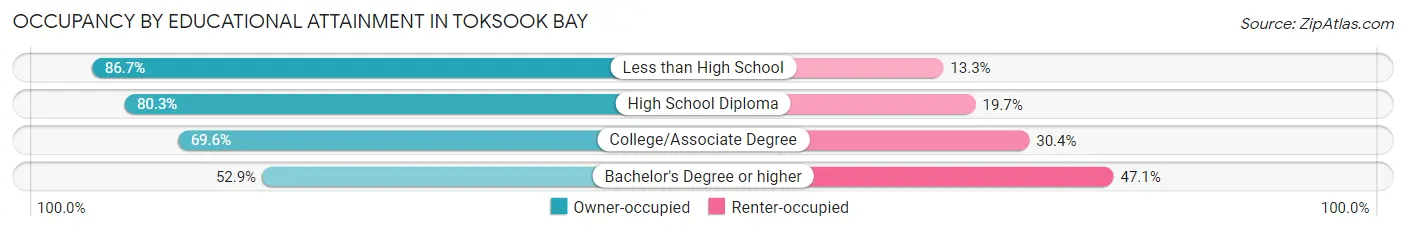
| Household Size | Owner-occupied | Renter-occupied |
| Less than High School | 39 (86.7%) | 6 (13.3%) |
| High School Diploma | 53 (80.3%) | 13 (19.7%) |
| College/Associate Degree | 39 (69.6%) | 17 (30.4%) |
| Bachelor's Degree or higher | 9 (52.9%) | 8 (47.1%) |
Occupancy by Age of Householder in Toksook Bay
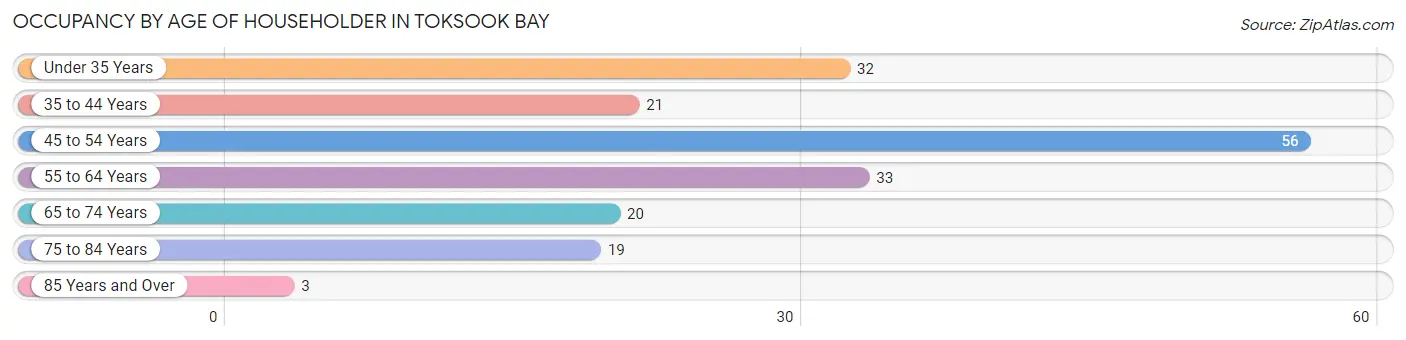
| Age Bracket | # Households | % Households |
| Under 35 Years | 32 | 17.4% |
| 35 to 44 Years | 21 | 11.4% |
| 45 to 54 Years | 56 | 30.4% |
| 55 to 64 Years | 33 | 17.9% |
| 65 to 74 Years | 20 | 10.9% |
| 75 to 84 Years | 19 | 10.3% |
| 85 Years and Over | 3 | 1.6% |
| Total | 184 | 100.0% |
Housing Finances in Toksook Bay
Median Income by Occupancy in Toksook Bay
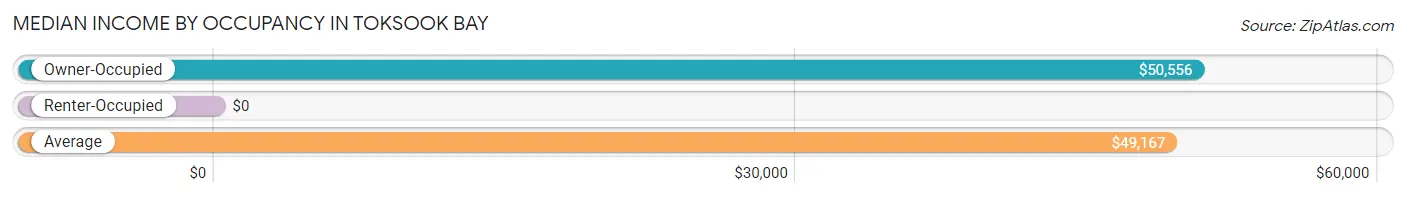
| Occupancy Type | # Households | Median Income |
| Owner-Occupied | 140 (76.1%) | $50,556 |
| Renter-Occupied | 44 (23.9%) | $0 |
| Average | 184 (100.0%) | $49,167 |
Occupancy by Householder Income Bracket in Toksook Bay
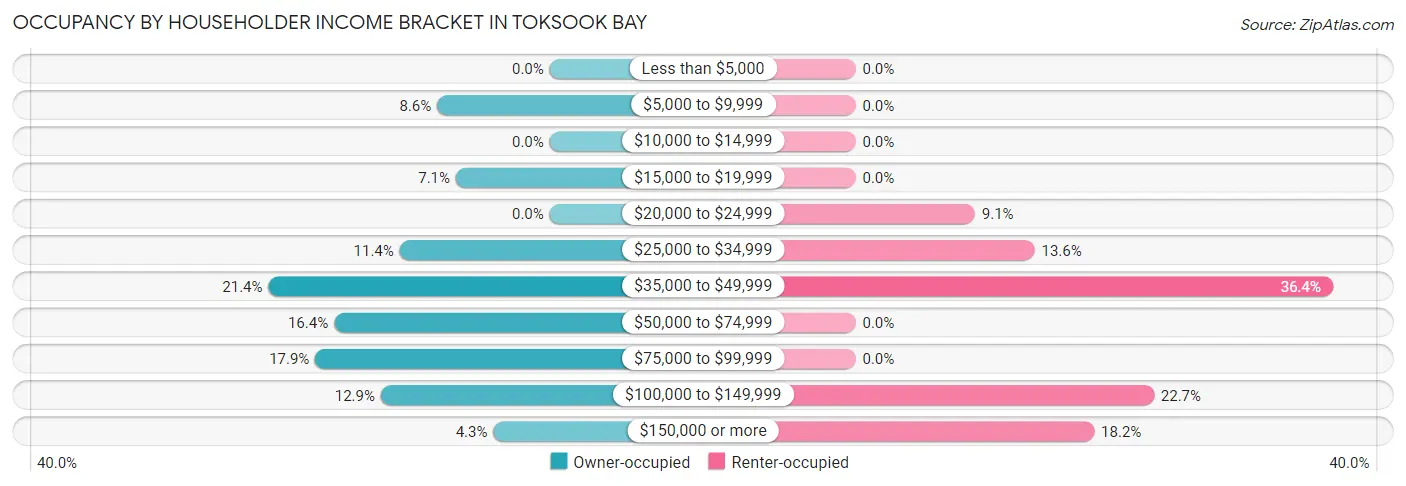
| Income Bracket | Owner-occupied | Renter-occupied |
| Less than $5,000 | 0 (0.0%) | 0 (0.0%) |
| $5,000 to $9,999 | 12 (8.6%) | 0 (0.0%) |
| $10,000 to $14,999 | 0 (0.0%) | 0 (0.0%) |
| $15,000 to $19,999 | 10 (7.1%) | 0 (0.0%) |
| $20,000 to $24,999 | 0 (0.0%) | 4 (9.1%) |
| $25,000 to $34,999 | 16 (11.4%) | 6 (13.6%) |
| $35,000 to $49,999 | 30 (21.4%) | 16 (36.4%) |
| $50,000 to $74,999 | 23 (16.4%) | 0 (0.0%) |
| $75,000 to $99,999 | 25 (17.9%) | 0 (0.0%) |
| $100,000 to $149,999 | 18 (12.9%) | 10 (22.7%) |
| $150,000 or more | 6 (4.3%) | 8 (18.2%) |
| Total | 140 (100.0%) | 44 (100.0%) |
Monthly Housing Cost Tiers in Toksook Bay
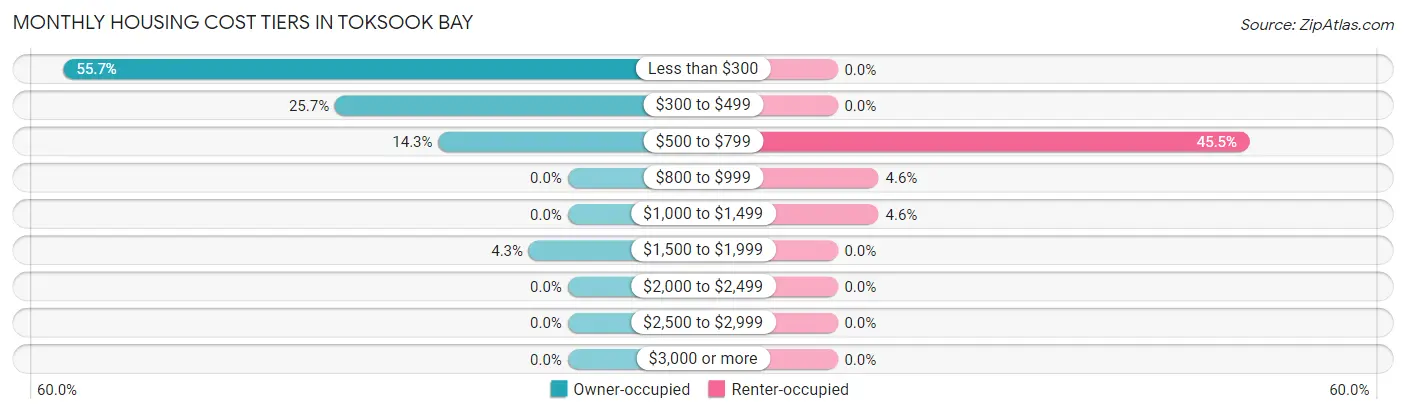
| Monthly Cost | Owner-occupied | Renter-occupied |
| Less than $300 | 78 (55.7%) | 0 (0.0%) |
| $300 to $499 | 36 (25.7%) | 0 (0.0%) |
| $500 to $799 | 20 (14.3%) | 20 (45.5%) |
| $800 to $999 | 0 (0.0%) | 2 (4.5%) |
| $1,000 to $1,499 | 0 (0.0%) | 2 (4.5%) |
| $1,500 to $1,999 | 6 (4.3%) | 0 (0.0%) |
| $2,000 to $2,499 | 0 (0.0%) | 0 (0.0%) |
| $2,500 to $2,999 | 0 (0.0%) | 0 (0.0%) |
| $3,000 or more | 0 (0.0%) | 0 (0.0%) |
| Total | 140 (100.0%) | 44 (100.0%) |
Physical Housing Characteristics in Toksook Bay
Housing Structures in Toksook Bay
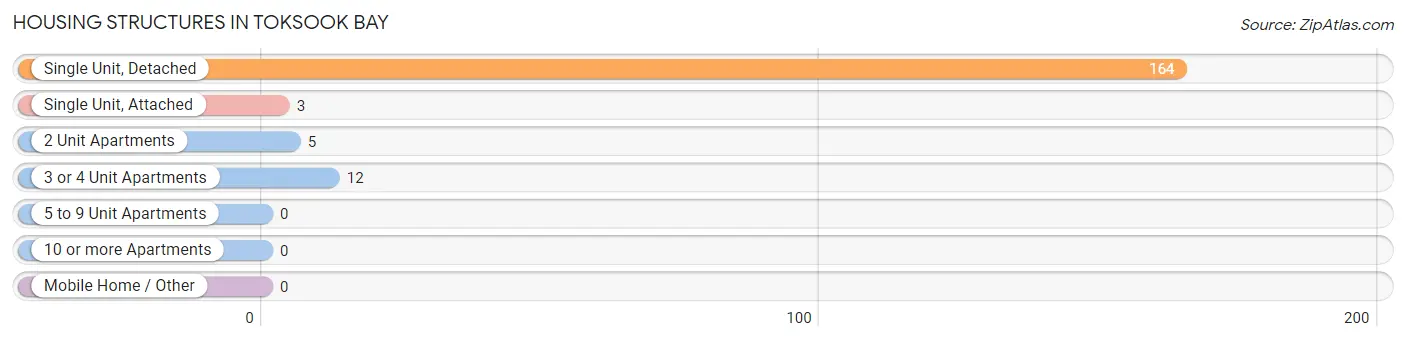
| Structure Type | # Housing Units | % Housing Units |
| Single Unit, Detached | 164 | 89.1% |
| Single Unit, Attached | 3 | 1.6% |
| 2 Unit Apartments | 5 | 2.7% |
| 3 or 4 Unit Apartments | 12 | 6.5% |
| 5 to 9 Unit Apartments | 0 | 0.0% |
| 10 or more Apartments | 0 | 0.0% |
| Mobile Home / Other | 0 | 0.0% |
| Total | 184 | 100.0% |
Housing Structures by Occupancy in Toksook Bay
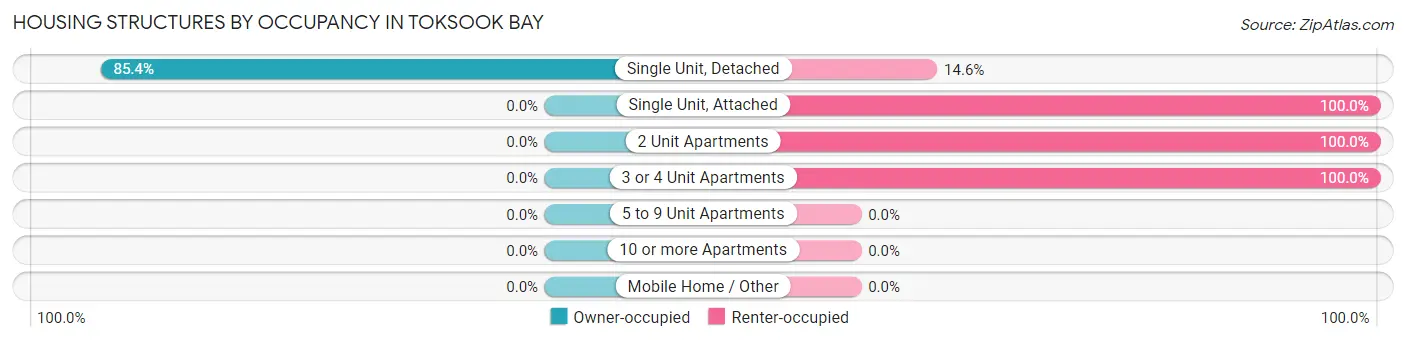
| Structure Type | Owner-occupied | Renter-occupied |
| Single Unit, Detached | 140 (85.4%) | 24 (14.6%) |
| Single Unit, Attached | 0 (0.0%) | 3 (100.0%) |
| 2 Unit Apartments | 0 (0.0%) | 5 (100.0%) |
| 3 or 4 Unit Apartments | 0 (0.0%) | 12 (100.0%) |
| 5 to 9 Unit Apartments | 0 (0.0%) | 0 (0.0%) |
| 10 or more Apartments | 0 (0.0%) | 0 (0.0%) |
| Mobile Home / Other | 0 (0.0%) | 0 (0.0%) |
| Total | 140 (76.1%) | 44 (23.9%) |
Housing Structures by Number of Rooms in Toksook Bay
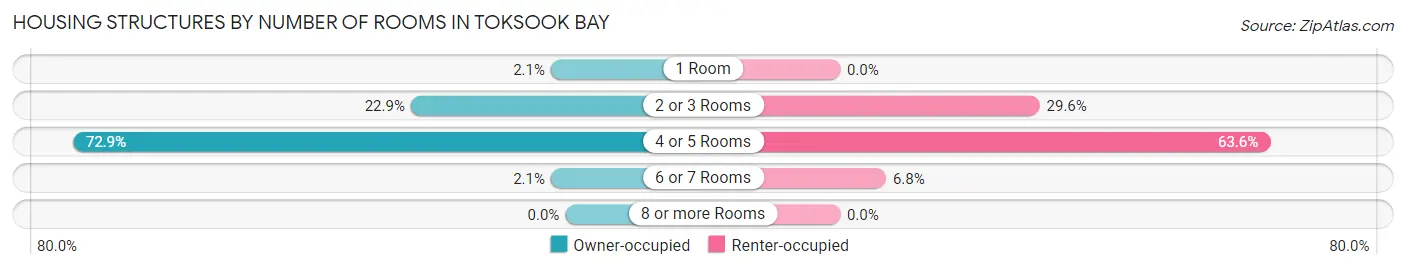
| Number of Rooms | Owner-occupied | Renter-occupied |
| 1 Room | 3 (2.1%) | 0 (0.0%) |
| 2 or 3 Rooms | 32 (22.9%) | 13 (29.5%) |
| 4 or 5 Rooms | 102 (72.9%) | 28 (63.6%) |
| 6 or 7 Rooms | 3 (2.1%) | 3 (6.8%) |
| 8 or more Rooms | 0 (0.0%) | 0 (0.0%) |
| Total | 140 (100.0%) | 44 (100.0%) |
Housing Structure by Heating Type in Toksook Bay
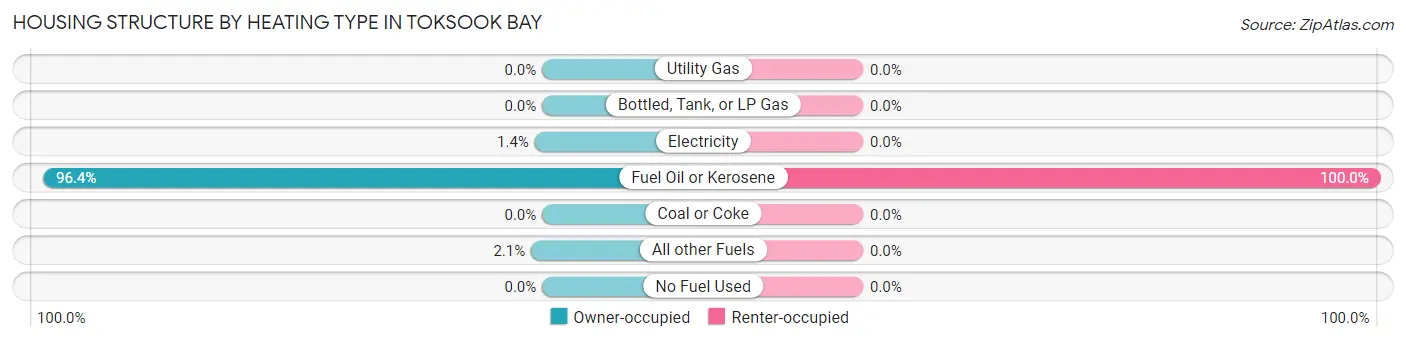
| Heating Type | Owner-occupied | Renter-occupied |
| Utility Gas | 0 (0.0%) | 0 (0.0%) |
| Bottled, Tank, or LP Gas | 0 (0.0%) | 0 (0.0%) |
| Electricity | 2 (1.4%) | 0 (0.0%) |
| Fuel Oil or Kerosene | 135 (96.4%) | 44 (100.0%) |
| Coal or Coke | 0 (0.0%) | 0 (0.0%) |
| All other Fuels | 3 (2.1%) | 0 (0.0%) |
| No Fuel Used | 0 (0.0%) | 0 (0.0%) |
| Total | 140 (100.0%) | 44 (100.0%) |
Household Vehicle Usage in Toksook Bay
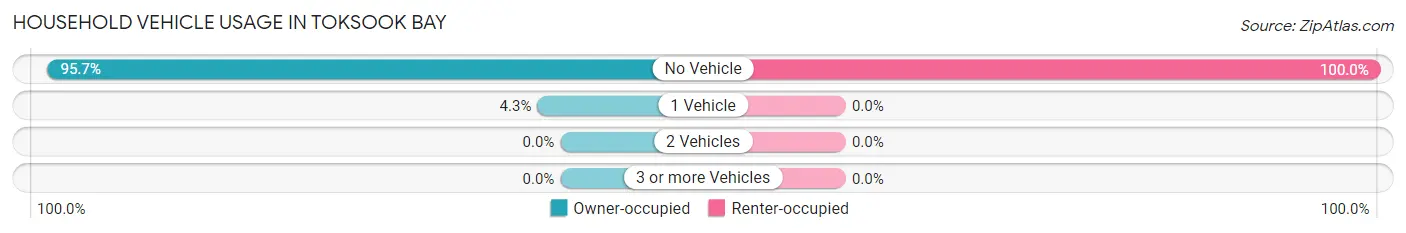
| Vehicles per Household | Owner-occupied | Renter-occupied |
| No Vehicle | 134 (95.7%) | 44 (100.0%) |
| 1 Vehicle | 6 (4.3%) | 0 (0.0%) |
| 2 Vehicles | 0 (0.0%) | 0 (0.0%) |
| 3 or more Vehicles | 0 (0.0%) | 0 (0.0%) |
| Total | 140 (100.0%) | 44 (100.0%) |
Real Estate & Mortgages in Toksook Bay
Real Estate and Mortgage Overview in Toksook Bay
| Characteristic | Without Mortgage | With Mortgage |
| Housing Units | 126 | 14 |
| Median Property Value | $84,200 | $0 |
| Median Household Income | $46,667 | $3 |
| Monthly Housing Costs | $242 | $0 |
| Real Estate Taxes | - | - |
Property Value by Mortgage Status in Toksook Bay
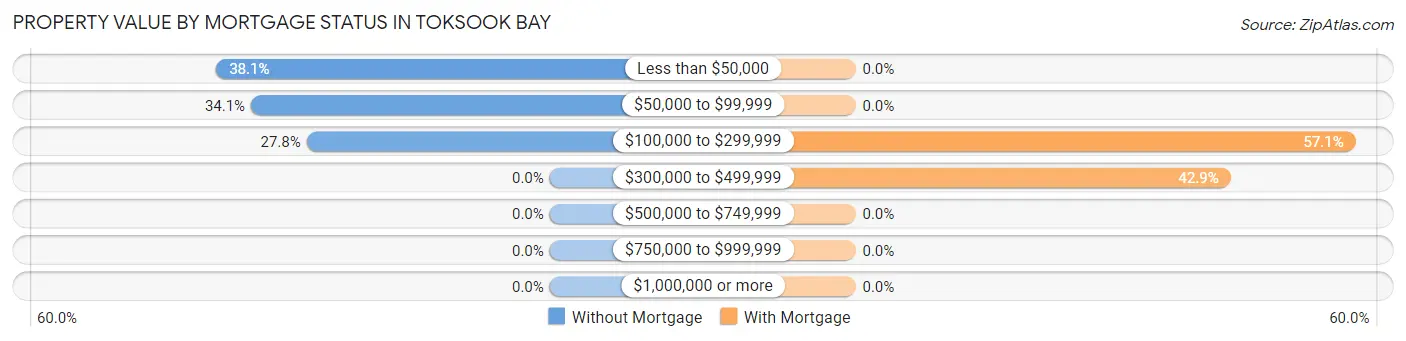
| Property Value | Without Mortgage | With Mortgage |
| Less than $50,000 | 48 (38.1%) | 0 (0.0%) |
| $50,000 to $99,999 | 43 (34.1%) | 0 (0.0%) |
| $100,000 to $299,999 | 35 (27.8%) | 8 (57.1%) |
| $300,000 to $499,999 | 0 (0.0%) | 6 (42.9%) |
| $500,000 to $749,999 | 0 (0.0%) | 0 (0.0%) |
| $750,000 to $999,999 | 0 (0.0%) | 0 (0.0%) |
| $1,000,000 or more | 0 (0.0%) | 0 (0.0%) |
| Total | 126 (100.0%) | 14 (100.0%) |
Household Income by Mortgage Status in Toksook Bay
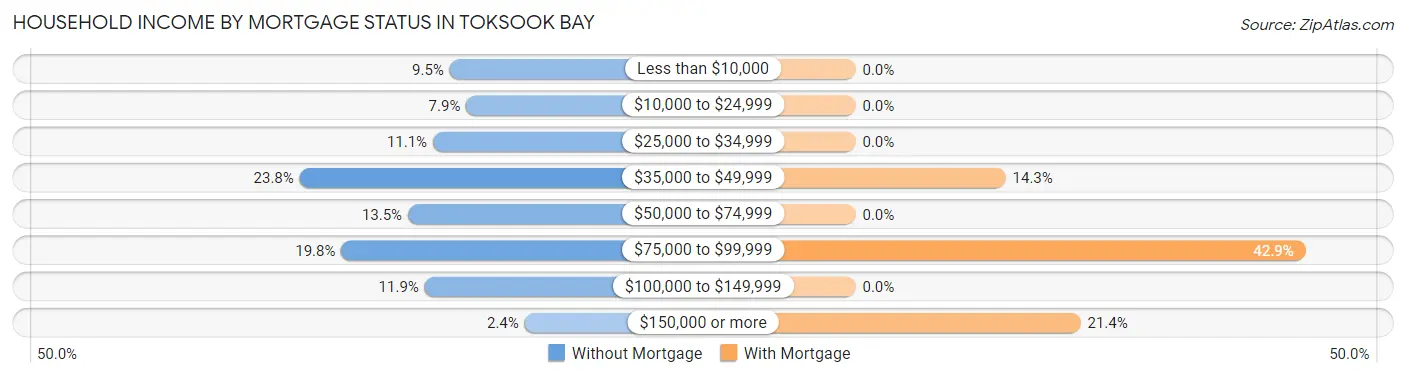
| Household Income | Without Mortgage | With Mortgage |
| Less than $10,000 | 12 (9.5%) | 0 (0.0%) |
| $10,000 to $24,999 | 10 (7.9%) | 0 (0.0%) |
| $25,000 to $34,999 | 14 (11.1%) | 0 (0.0%) |
| $35,000 to $49,999 | 30 (23.8%) | 2 (14.3%) |
| $50,000 to $74,999 | 17 (13.5%) | 0 (0.0%) |
| $75,000 to $99,999 | 25 (19.8%) | 6 (42.9%) |
| $100,000 to $149,999 | 15 (11.9%) | 0 (0.0%) |
| $150,000 or more | 3 (2.4%) | 3 (21.4%) |
| Total | 126 (100.0%) | 14 (100.0%) |
Property Value to Household Income Ratio in Toksook Bay
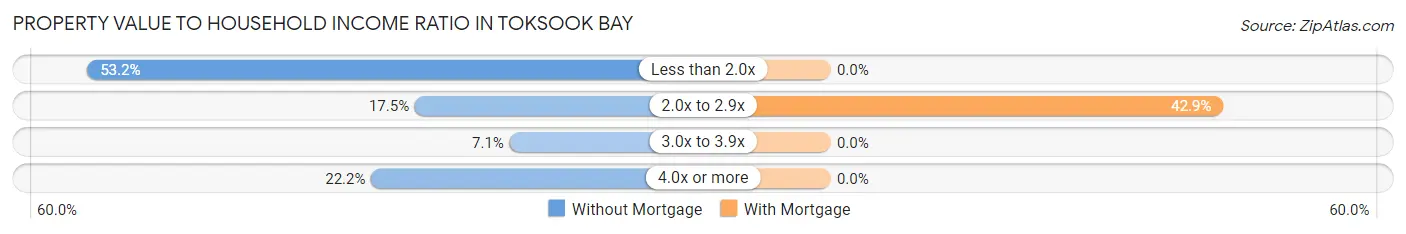
| Value-to-Income Ratio | Without Mortgage | With Mortgage |
| Less than 2.0x | 67 (53.2%) | 0 (0.0%) |
| 2.0x to 2.9x | 22 (17.5%) | 6 (42.9%) |
| 3.0x to 3.9x | 9 (7.1%) | 0 (0.0%) |
| 4.0x or more | 28 (22.2%) | 0 (0.0%) |
| Total | 126 (100.0%) | 14 (100.0%) |
Real Estate Taxes by Mortgage Status in Toksook Bay
| Property Taxes | Without Mortgage | With Mortgage |
| Less than $800 | 0 (0.0%) | 0 (0.0%) |
| $800 to $1,499 | 0 (0.0%) | 0 (0.0%) |
| $800 to $1,499 | 0 (0.0%) | 0 (0.0%) |
| Total | 126 (100.0%) | 14 (100.0%) |
Health & Disability in Toksook Bay
Health Insurance Coverage by Age in Toksook Bay
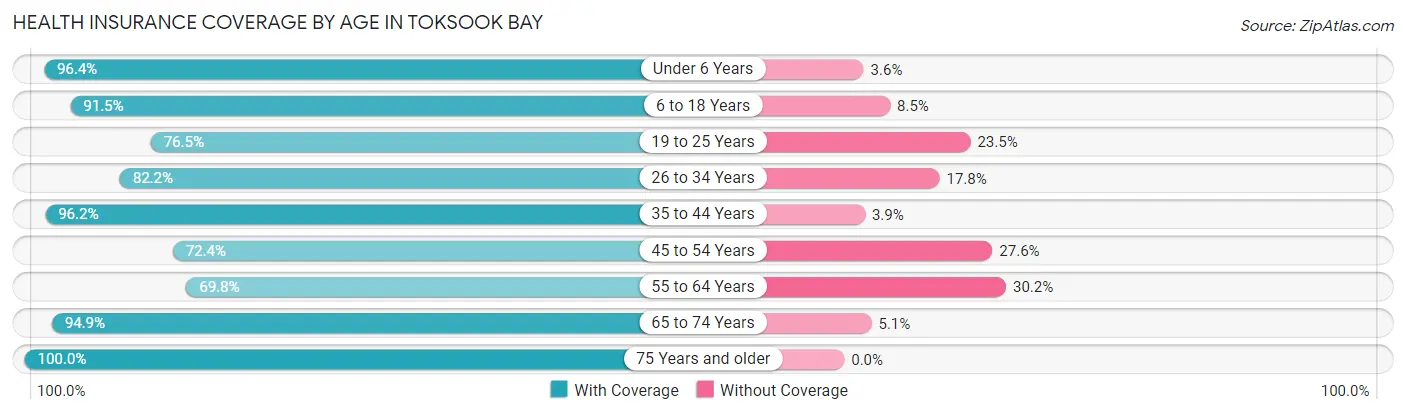
| Age Bracket | With Coverage | Without Coverage |
| Under 6 Years | 160 (96.4%) | 6 (3.6%) |
| 6 to 18 Years | 225 (91.5%) | 21 (8.5%) |
| 19 to 25 Years | 39 (76.5%) | 12 (23.5%) |
| 26 to 34 Years | 88 (82.2%) | 19 (17.8%) |
| 35 to 44 Years | 75 (96.2%) | 3 (3.8%) |
| 45 to 54 Years | 76 (72.4%) | 29 (27.6%) |
| 55 to 64 Years | 44 (69.8%) | 19 (30.2%) |
| 65 to 74 Years | 56 (94.9%) | 3 (5.1%) |
| 75 Years and older | 39 (100.0%) | 0 (0.0%) |
| Total | 802 (87.7%) | 112 (12.2%) |
Health Insurance Coverage by Citizenship Status in Toksook Bay
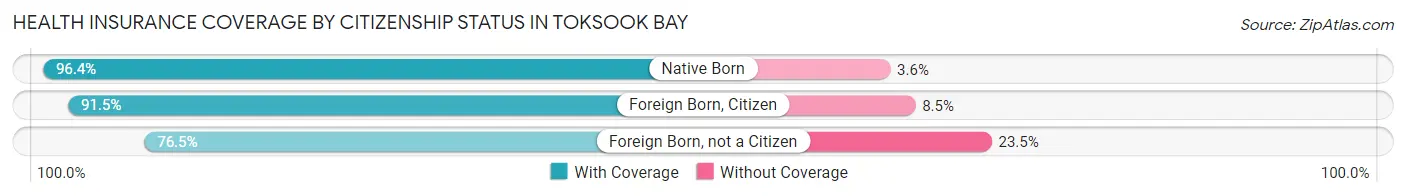
| Citizenship Status | With Coverage | Without Coverage |
| Native Born | 160 (96.4%) | 6 (3.6%) |
| Foreign Born, Citizen | 225 (91.5%) | 21 (8.5%) |
| Foreign Born, not a Citizen | 39 (76.5%) | 12 (23.5%) |
Health Insurance Coverage by Household Income in Toksook Bay
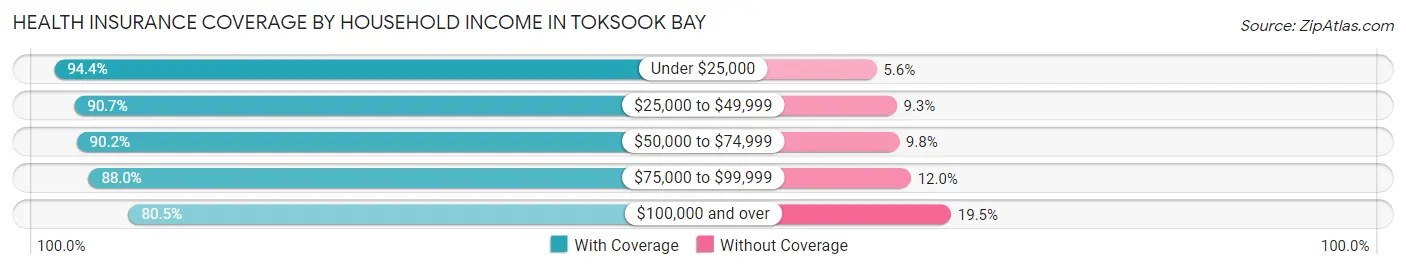
| Household Income | With Coverage | Without Coverage |
| Under $25,000 | 51 (94.4%) | 3 (5.6%) |
| $25,000 to $49,999 | 321 (90.7%) | 33 (9.3%) |
| $50,000 to $74,999 | 111 (90.2%) | 12 (9.8%) |
| $75,000 to $99,999 | 125 (88.0%) | 17 (12.0%) |
| $100,000 and over | 194 (80.5%) | 47 (19.5%) |
Public vs Private Health Insurance Coverage by Age in Toksook Bay
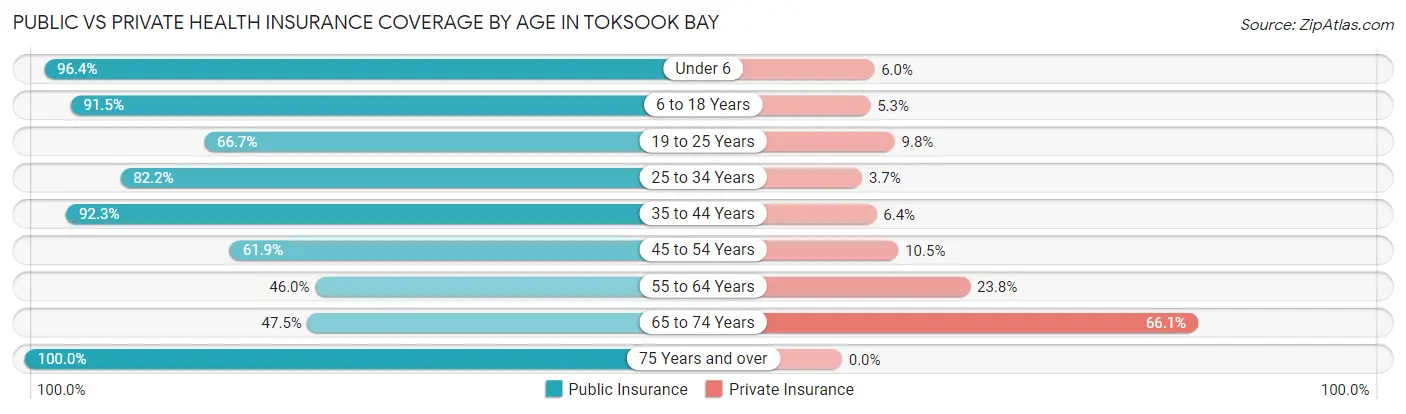
| Age Bracket | Public Insurance | Private Insurance |
| Under 6 | 160 (96.4%) | 10 (6.0%) |
| 6 to 18 Years | 225 (91.5%) | 13 (5.3%) |
| 19 to 25 Years | 34 (66.7%) | 5 (9.8%) |
| 25 to 34 Years | 88 (82.2%) | 4 (3.7%) |
| 35 to 44 Years | 72 (92.3%) | 5 (6.4%) |
| 45 to 54 Years | 65 (61.9%) | 11 (10.5%) |
| 55 to 64 Years | 29 (46.0%) | 15 (23.8%) |
| 65 to 74 Years | 28 (47.5%) | 39 (66.1%) |
| 75 Years and over | 39 (100.0%) | 0 (0.0%) |
| Total | 740 (81.0%) | 102 (11.2%) |
Disability Status by Sex by Age in Toksook Bay
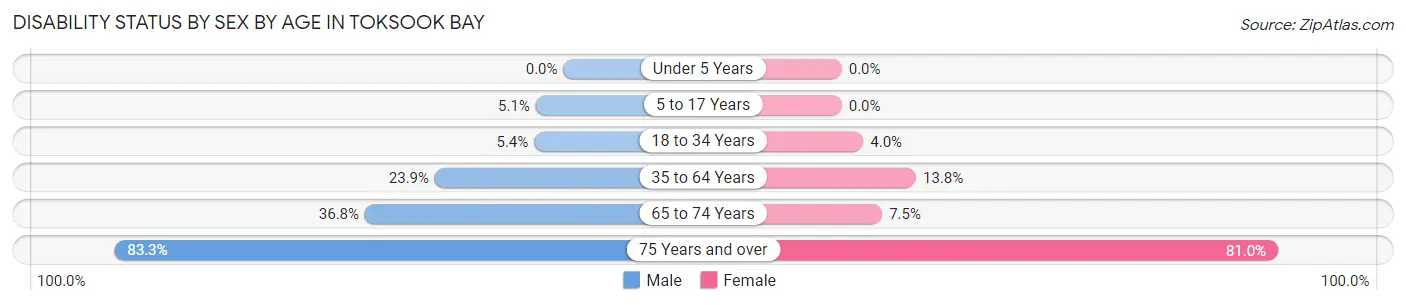
| Age Bracket | Male | Female |
| Under 5 Years | 0 (0.0%) | 0 (0.0%) |
| 5 to 17 Years | 4 (5.1%) | 0 (0.0%) |
| 18 to 34 Years | 7 (5.4%) | 3 (4.0%) |
| 35 to 64 Years | 31 (23.8%) | 16 (13.8%) |
| 65 to 74 Years | 7 (36.8%) | 3 (7.5%) |
| 75 Years and over | 15 (83.3%) | 17 (80.9%) |
Disability Class by Sex by Age in Toksook Bay
Disability Class: Hearing Difficulty
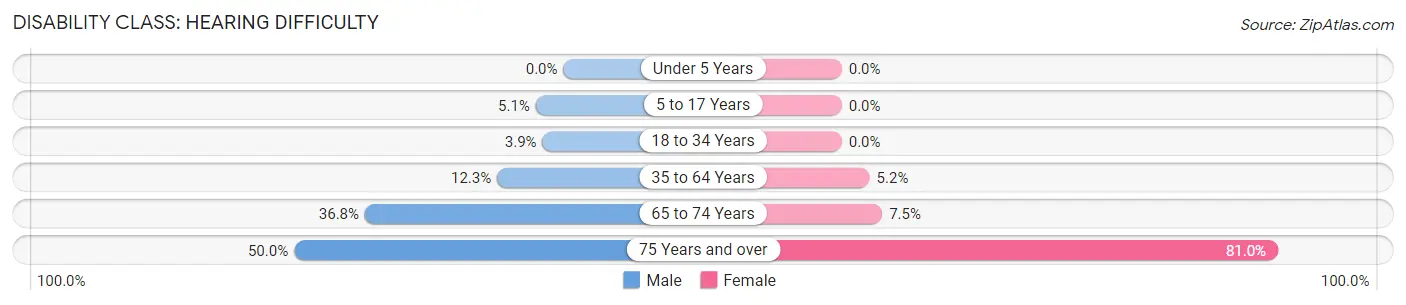
| Age Bracket | Male | Female |
| Under 5 Years | 0 (0.0%) | 0 (0.0%) |
| 5 to 17 Years | 4 (5.1%) | 0 (0.0%) |
| 18 to 34 Years | 5 (3.9%) | 0 (0.0%) |
| 35 to 64 Years | 16 (12.3%) | 6 (5.2%) |
| 65 to 74 Years | 7 (36.8%) | 3 (7.5%) |
| 75 Years and over | 9 (50.0%) | 17 (80.9%) |
Disability Class: Vision Difficulty
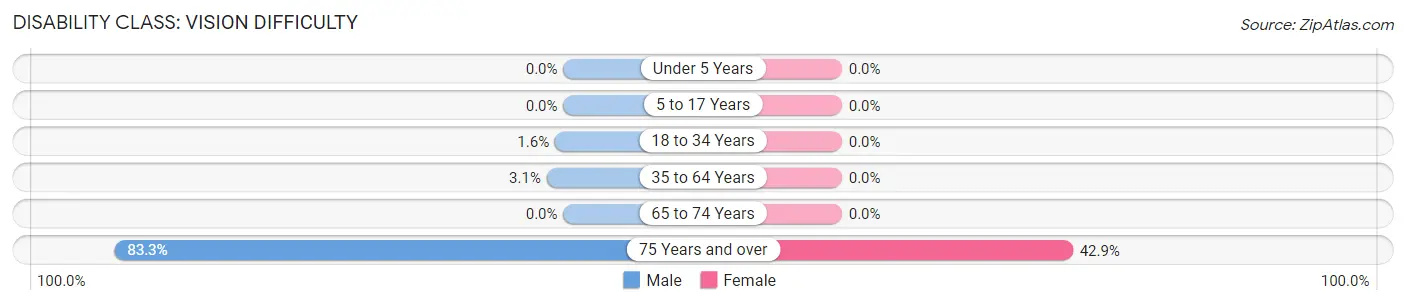
| Age Bracket | Male | Female |
| Under 5 Years | 0 (0.0%) | 0 (0.0%) |
| 5 to 17 Years | 0 (0.0%) | 0 (0.0%) |
| 18 to 34 Years | 2 (1.5%) | 0 (0.0%) |
| 35 to 64 Years | 4 (3.1%) | 0 (0.0%) |
| 65 to 74 Years | 0 (0.0%) | 0 (0.0%) |
| 75 Years and over | 15 (83.3%) | 9 (42.9%) |
Disability Class: Cognitive Difficulty
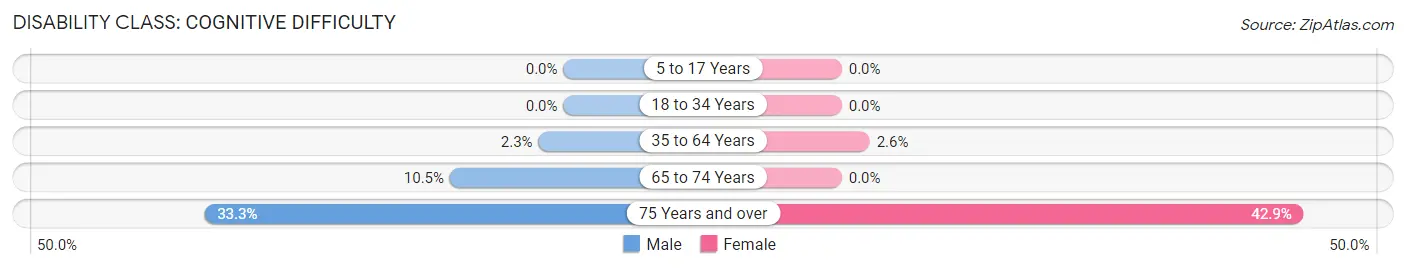
| Age Bracket | Male | Female |
| 5 to 17 Years | 0 (0.0%) | 0 (0.0%) |
| 18 to 34 Years | 0 (0.0%) | 0 (0.0%) |
| 35 to 64 Years | 3 (2.3%) | 3 (2.6%) |
| 65 to 74 Years | 2 (10.5%) | 0 (0.0%) |
| 75 Years and over | 6 (33.3%) | 9 (42.9%) |
Disability Class: Ambulatory Difficulty
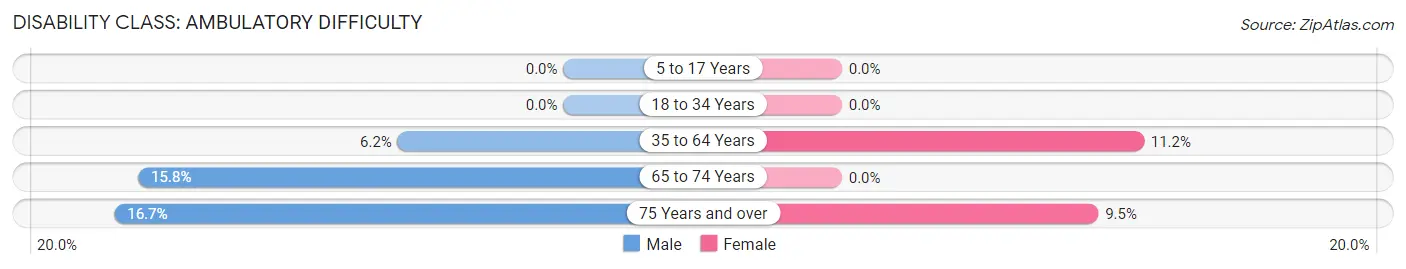
| Age Bracket | Male | Female |
| 5 to 17 Years | 0 (0.0%) | 0 (0.0%) |
| 18 to 34 Years | 0 (0.0%) | 0 (0.0%) |
| 35 to 64 Years | 8 (6.1%) | 13 (11.2%) |
| 65 to 74 Years | 3 (15.8%) | 0 (0.0%) |
| 75 Years and over | 3 (16.7%) | 2 (9.5%) |
Disability Class: Self-Care Difficulty
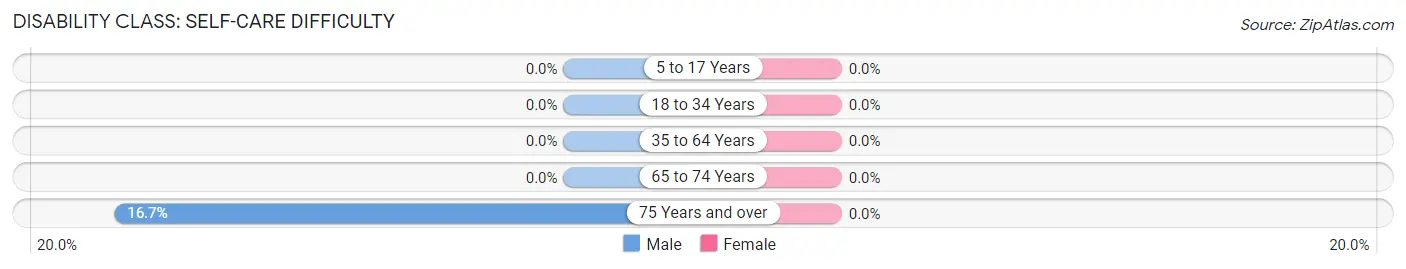
| Age Bracket | Male | Female |
| 5 to 17 Years | 0 (0.0%) | 0 (0.0%) |
| 18 to 34 Years | 0 (0.0%) | 0 (0.0%) |
| 35 to 64 Years | 0 (0.0%) | 0 (0.0%) |
| 65 to 74 Years | 0 (0.0%) | 0 (0.0%) |
| 75 Years and over | 3 (16.7%) | 0 (0.0%) |
Technology Access in Toksook Bay
Computing Device Access in Toksook Bay
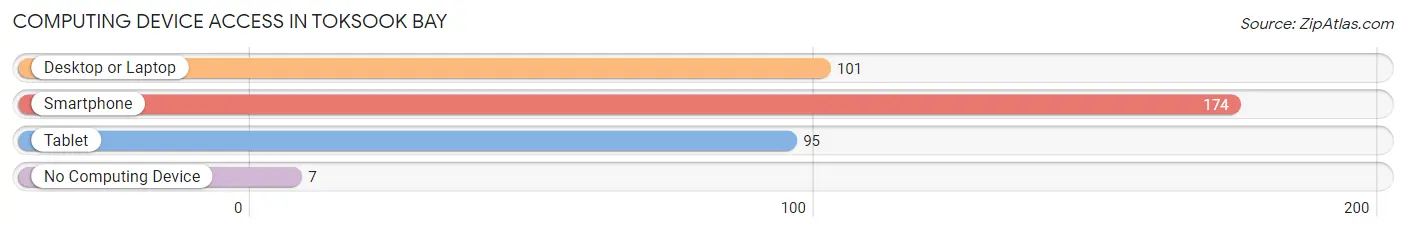
| Device Type | # Households | % Households |
| Desktop or Laptop | 101 | 54.9% |
| Smartphone | 174 | 94.6% |
| Tablet | 95 | 51.6% |
| No Computing Device | 7 | 3.8% |
| Total | 184 | 100.0% |
Internet Access in Toksook Bay
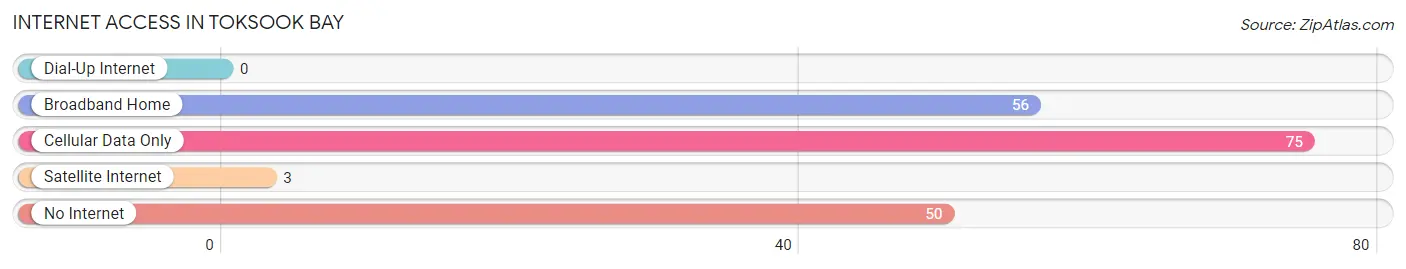
| Internet Type | # Households | % Households |
| Dial-Up Internet | 0 | 0.0% |
| Broadband Home | 56 | 30.4% |
| Cellular Data Only | 75 | 40.8% |
| Satellite Internet | 3 | 1.6% |
| No Internet | 50 | 27.2% |
| Total | 184 | 100.0% |
Toksook Bay Summary
Toksook Bay is a small, remote village located on the northern coast of Alaska, in the Bethel Census Area. It is situated on the shores of the Bering Sea, and is part of the Nunivak Island region. The village is home to the Nuniwarmiut, an Alaskan Native tribe, and is the only village in the region. The population of Toksook Bay was 602 people as of the 2010 census.
History
The Nuniwarmiut people have lived in the area for thousands of years, and the village of Toksook Bay was established in the late 1800s. The village was originally known as Nuniwarmiut, and was later renamed Toksook Bay in the early 1900s. The name is derived from the Yup'ik word “toksuk”, which means “to be in a place”.
The village was traditionally a fishing and hunting community, and the Nuniwarmiut people relied on the resources of the Bering Sea for their subsistence. In the early 1900s, the village was visited by traders and missionaries, and the population began to grow. In the 1950s, the village was connected to the outside world by a road, and the population continued to grow.
Geography
Toksook Bay is located on the northern coast of Alaska, in the Bethel Census Area. It is situated on the shores of the Bering Sea, and is part of the Nunivak Island region. The village is located on the Nuniwarmiut River, and is surrounded by mountains and tundra. The climate in the area is subarctic, with cold winters and mild summers.
Economy
The economy of Toksook Bay is largely based on subsistence activities, such as fishing and hunting. The village is also home to a small commercial fishing fleet, and the local economy is supplemented by income from the sale of fish and other seafood. The village also receives income from the sale of arts and crafts, and from tourism.
Demographics
As of the 2010 census, the population of Toksook Bay was 602 people. The population is predominantly Alaska Native, with the majority of the population being of Yup'ik descent. The median age of the population is 24.7 years, and the median household income is $25,000. The village is served by the Toksook Bay School, which is part of the Lower Kuskokwim School District.
Conclusion
Toksook Bay is a small, remote village located on the northern coast of Alaska, in the Bethel Census Area. It is home to the Nuniwarmiut, an Alaskan Native tribe, and is the only village in the region. The economy of Toksook Bay is largely based on subsistence activities, such as fishing and hunting, and the population is predominantly Alaska Native, with the majority of the population being of Yup'ik descent. The village is served by the Toksook Bay School, and is connected to the outside world by a road.
Common Questions
What is Per Capita Income in Toksook Bay?
Per Capita income in Toksook Bay is $15,550.
What is the Median Family Income in Toksook Bay?
Median Family Income in Toksook Bay is $48,958.
What is the Median Household income in Toksook Bay?
Median Household Income in Toksook Bay is $49,167.
What is Income or Wage Gap in Toksook Bay?
Income or Wage Gap in Toksook Bay is 27.9%.
Women in Toksook Bay earn 72.1 cents for every dollar earned by a man.
What is Inequality or Gini Index in Toksook Bay?
Inequality or Gini Index in Toksook Bay is 0.40.
What is the Total Population of Toksook Bay?
Total Population of Toksook Bay is 914.
What is the Total Male Population of Toksook Bay?
Total Male Population of Toksook Bay is 453.
What is the Total Female Population of Toksook Bay?
Total Female Population of Toksook Bay is 461.
What is the Ratio of Males per 100 Females in Toksook Bay?
There are 98.26 Males per 100 Females in Toksook Bay.
What is the Ratio of Females per 100 Males in Toksook Bay?
There are 101.77 Females per 100 Males in Toksook Bay.
What is the Median Population Age in Toksook Bay?
Median Population Age in Toksook Bay is 24.3 Years.
What is the Average Family Size in Toksook Bay
Average Family Size in Toksook Bay is 5.4 People.
What is the Average Household Size in Toksook Bay
Average Household Size in Toksook Bay is 5.0 People.
How Large is the Labor Force in Toksook Bay?
There are 330 People in the Labor Forcein in Toksook Bay.
What is the Percentage of People in the Labor Force in Toksook Bay?
56.8% of People are in the Labor Force in Toksook Bay.
What is the Unemployment Rate in Toksook Bay?
Unemployment Rate in Toksook Bay is 18.8%.