Houston, AK Map & Demographics
Houston Map
Houston Overview
$35,792
PER CAPITA INCOME
$75,096
AVG FAMILY INCOME
$53,750
AVG HOUSEHOLD INCOME
30.2%
WAGE / INCOME GAP [ % ]
69.8¢/ $1
WAGE / INCOME GAP [ $ ]
$9,397
FAMILY INCOME DEFICIT
0.53
INEQUALITY / GINI INDEX
1,613
TOTAL POPULATION
908
MALE POPULATION
705
FEMALE POPULATION
128.79
MALES / 100 FEMALES
77.64
FEMALES / 100 MALES
46.1
MEDIAN AGE
2.9
AVG FAMILY SIZE
2.2
AVG HOUSEHOLD SIZE
796
LABOR FORCE [ PEOPLE ]
58.3%
PERCENT IN LABOR FORCE
12.6%
UNEMPLOYMENT RATE
Houston Zip Codes
Houston Area Codes
Income in Houston
Income Overview in Houston
Per Capita Income in Houston is $35,792, while median incomes of families and households are $75,096 and $53,750 respectively.
| Characteristic | Number | Measure |
| Per Capita Income | 1,613 | $35,792 |
| Median Family Income | 411 | $75,096 |
| Mean Family Income | 411 | $108,785 |
| Median Household Income | 726 | $53,750 |
| Mean Household Income | 726 | $81,581 |
| Income Deficit | 411 | $9,397 |
| Wage / Income Gap (%) | 1,613 | 30.21% |
| Wage / Income Gap ($) | 1,613 | 69.79¢ per $1 |
| Gini / Inequality Index | 1,613 | 0.53 |
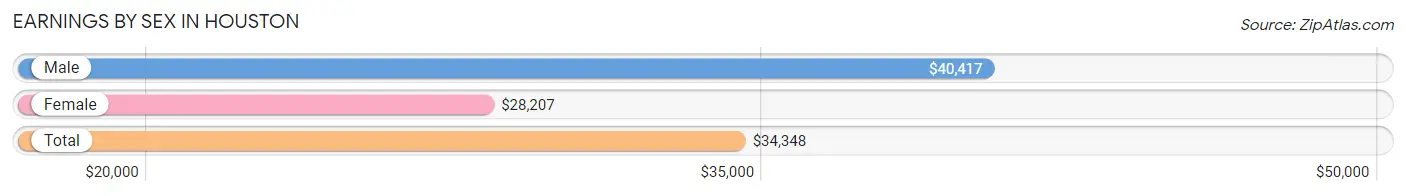
Earnings by Sex in Houston
Average Earnings in Houston are $34,348, $40,417 for men and $28,207 for women, a difference of 30.2%.
| Sex | Number | Average Earnings |
| Male | 493 (60.3%) | $40,417 |
| Female | 325 (39.7%) | $28,207 |
| Total | 818 (100.0%) | $34,348 |
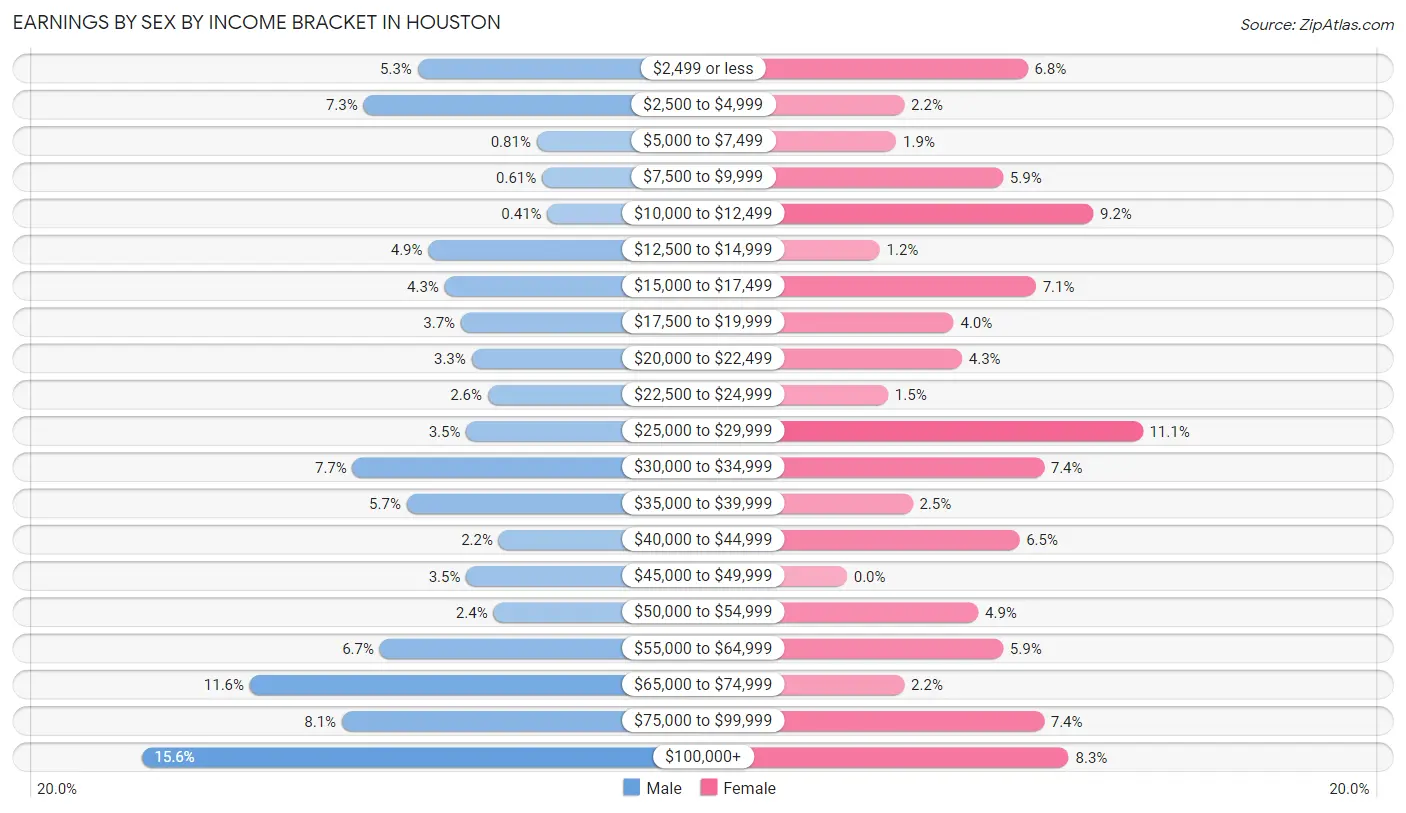
Earnings by Sex by Income Bracket in Houston
The most common earnings brackets in Houston are $100,000+ for men (77 | 15.6%) and $25,000 to $29,999 for women (36 | 11.1%).
| Income | Male | Female |
| $2,499 or less | 26 (5.3%) | 22 (6.8%) |
| $2,500 to $4,999 | 36 (7.3%) | 7 (2.1%) |
| $5,000 to $7,499 | 4 (0.8%) | 6 (1.8%) |
| $7,500 to $9,999 | 3 (0.6%) | 19 (5.9%) |
| $10,000 to $12,499 | 2 (0.4%) | 30 (9.2%) |
| $12,500 to $14,999 | 24 (4.9%) | 4 (1.2%) |
| $15,000 to $17,499 | 21 (4.3%) | 23 (7.1%) |
| $17,500 to $19,999 | 18 (3.6%) | 13 (4.0%) |
| $20,000 to $22,499 | 16 (3.3%) | 14 (4.3%) |
| $22,500 to $24,999 | 13 (2.6%) | 5 (1.5%) |
| $25,000 to $29,999 | 17 (3.5%) | 36 (11.1%) |
| $30,000 to $34,999 | 38 (7.7%) | 24 (7.4%) |
| $35,000 to $39,999 | 28 (5.7%) | 8 (2.5%) |
| $40,000 to $44,999 | 11 (2.2%) | 21 (6.5%) |
| $45,000 to $49,999 | 17 (3.5%) | 0 (0.0%) |
| $50,000 to $54,999 | 12 (2.4%) | 16 (4.9%) |
| $55,000 to $64,999 | 33 (6.7%) | 19 (5.9%) |
| $65,000 to $74,999 | 57 (11.6%) | 7 (2.1%) |
| $75,000 to $99,999 | 40 (8.1%) | 24 (7.4%) |
| $100,000+ | 77 (15.6%) | 27 (8.3%) |
| Total | 493 (100.0%) | 325 (100.0%) |
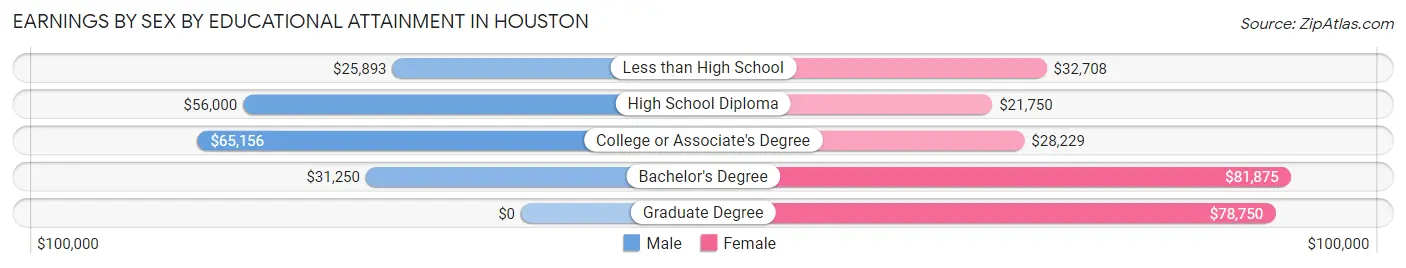
Earnings by Sex by Educational Attainment in Houston
Average earnings in Houston are $53,523 for men and $28,563 for women, a difference of 46.6%. Men with an educational attainment of college or associate's degree enjoy the highest average annual earnings of $65,156, while those with less than high school education earn the least with $25,893. Women with an educational attainment of bachelor's degree earn the most with the average annual earnings of $81,875, while those with high school diploma education have the smallest earnings of $21,750.
| Educational Attainment | Male Income | Female Income |
| Less than High School | $25,893 | $32,708 |
| High School Diploma | $56,000 | $21,750 |
| College or Associate's Degree | $65,156 | $28,229 |
| Bachelor's Degree | $31,250 | $81,875 |
| Graduate Degree | - | - |
| Total | $53,523 | $28,563 |
Family Income in Houston
Family Income Brackets in Houston
According to the Houston family income data, there are 67 families falling into the $100,000 to $149,999 income range, which is the most common income bracket and makes up 16.3% of all families.
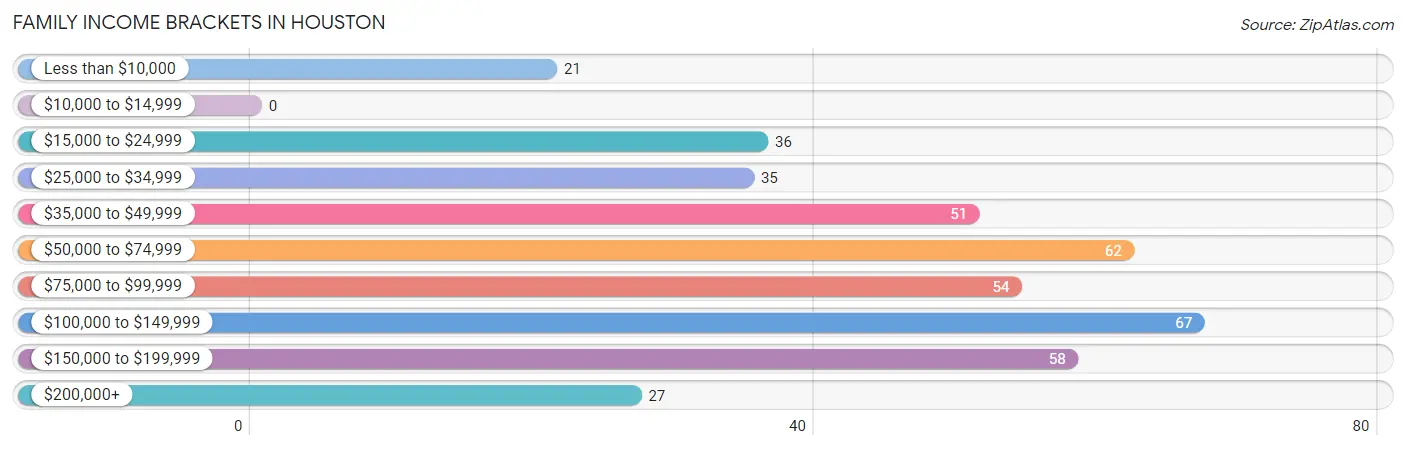
| Income Bracket | # Families | % Families |
| Less than $10,000 | 21 | 5.1% |
| $10,000 to $14,999 | 0 | 0.0% |
| $15,000 to $24,999 | 36 | 8.8% |
| $25,000 to $34,999 | 35 | 8.5% |
| $35,000 to $49,999 | 51 | 12.4% |
| $50,000 to $74,999 | 62 | 15.1% |
| $75,000 to $99,999 | 54 | 13.1% |
| $100,000 to $149,999 | 67 | 16.3% |
| $150,000 to $199,999 | 58 | 14.1% |
| $200,000+ | 27 | 6.6% |
Family Income by Famaliy Size in Houston
3-person families (63 | 15.3%) account for the highest median family income in Houston with $104,063 per family, while 2-person families (228 | 55.5%) have the highest median income of $35,809 per family member.
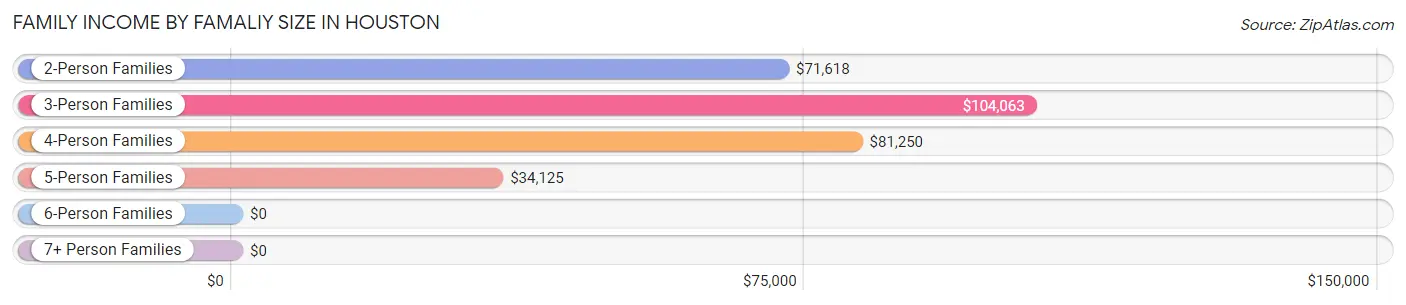
| Income Bracket | # Families | Median Income |
| 2-Person Families | 228 (55.5%) | $71,618 |
| 3-Person Families | 63 (15.3%) | $104,063 |
| 4-Person Families | 85 (20.7%) | $81,250 |
| 5-Person Families | 29 (7.1%) | $34,125 |
| 6-Person Families | 6 (1.5%) | $0 |
| 7+ Person Families | 0 (0.0%) | $0 |
| Total | 411 (100.0%) | $75,096 |
Family Income by Number of Earners in Houston
The median family income in Houston is $75,096, with families comprising 3+ earners (30) having the highest median family income of $130,000, while families with no earners (71) have the lowest median family income of $38,542, accounting for 7.3% and 17.3% of families, respectively.
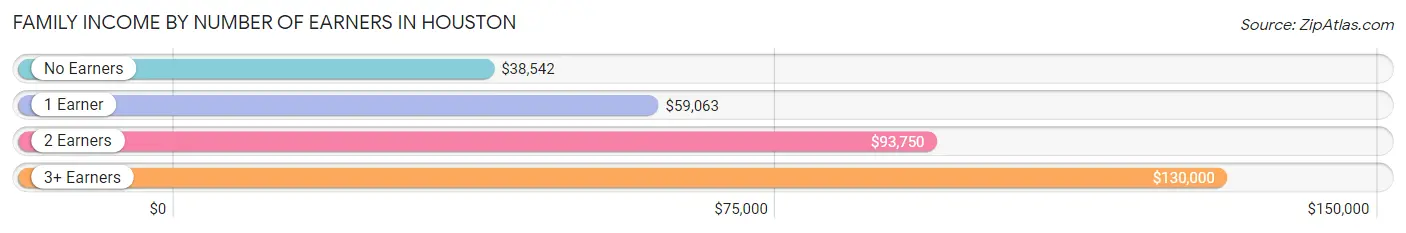
| Number of Earners | # Families | Median Income |
| No Earners | 71 (17.3%) | $38,542 |
| 1 Earner | 149 (36.2%) | $59,063 |
| 2 Earners | 161 (39.2%) | $93,750 |
| 3+ Earners | 30 (7.3%) | $130,000 |
| Total | 411 (100.0%) | $75,096 |
Household Income in Houston
Household Income Brackets in Houston
With 111 households falling in the category, the $50,000 to $74,999 income range is the most frequent in Houston, accounting for 15.3% of all households. In contrast, only 23 households (3.2%) fall into the $10,000 to $14,999 income bracket, making it the least populous group.
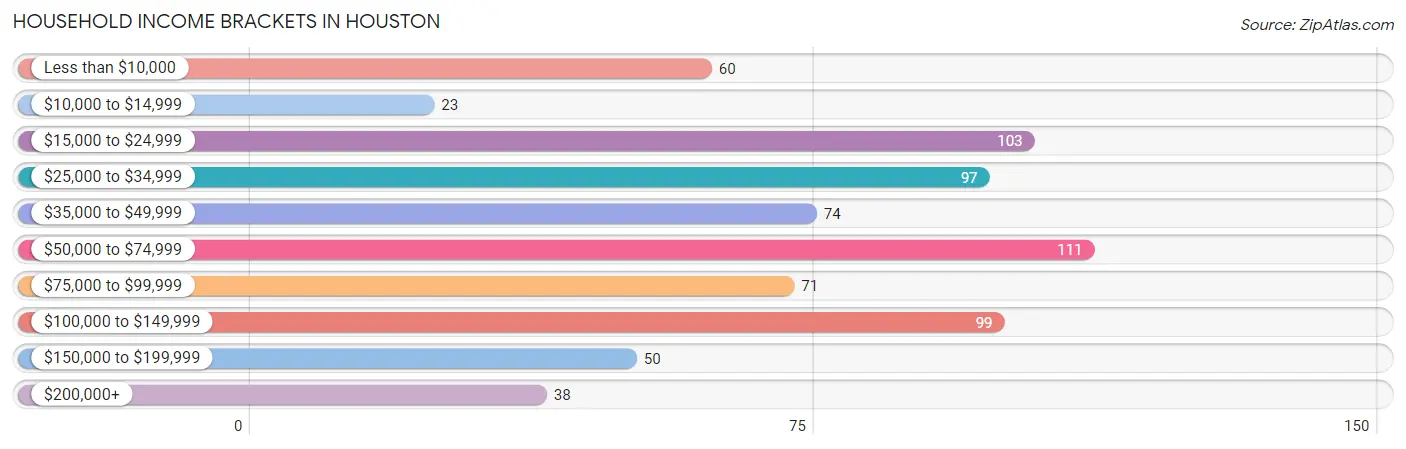
| Income Bracket | # Households | % Households |
| Less than $10,000 | 60 | 8.3% |
| $10,000 to $14,999 | 23 | 3.2% |
| $15,000 to $24,999 | 103 | 14.2% |
| $25,000 to $34,999 | 97 | 13.4% |
| $35,000 to $49,999 | 74 | 10.2% |
| $50,000 to $74,999 | 111 | 15.3% |
| $75,000 to $99,999 | 71 | 9.8% |
| $100,000 to $149,999 | 99 | 13.6% |
| $150,000 to $199,999 | 50 | 6.9% |
| $200,000+ | 38 | 5.2% |
Household Income by Householder Age in Houston
The median household income in Houston is $53,750, with the highest median household income of $72,917 found in the 25 to 44 years age bracket for the primary householder. A total of 196 households (27.0%) fall into this category. Meanwhile, the 15 to 24 years age bracket for the primary householder has the lowest median household income of $0, with 14 households (1.9%) in this group.
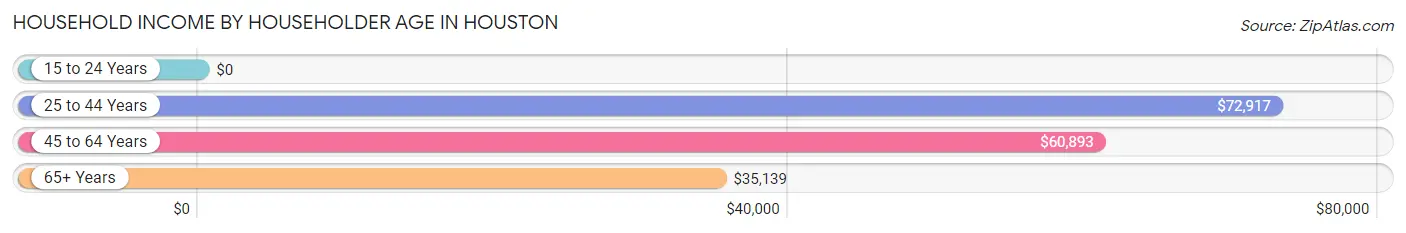
| Income Bracket | # Households | Median Income |
| 15 to 24 Years | 14 (1.9%) | $0 |
| 25 to 44 Years | 196 (27.0%) | $72,917 |
| 45 to 64 Years | 317 (43.7%) | $60,893 |
| 65+ Years | 199 (27.4%) | $35,139 |
| Total | 726 (100.0%) | $53,750 |
Poverty in Houston
Income Below Poverty by Sex and Age in Houston
With 17.6% poverty level for males and 23.0% for females among the residents of Houston, 5 year old males and 5 year old females are the most vulnerable to poverty, with 15 males (60.0%) and 3 females (100.0%) in their respective age groups living below the poverty level.
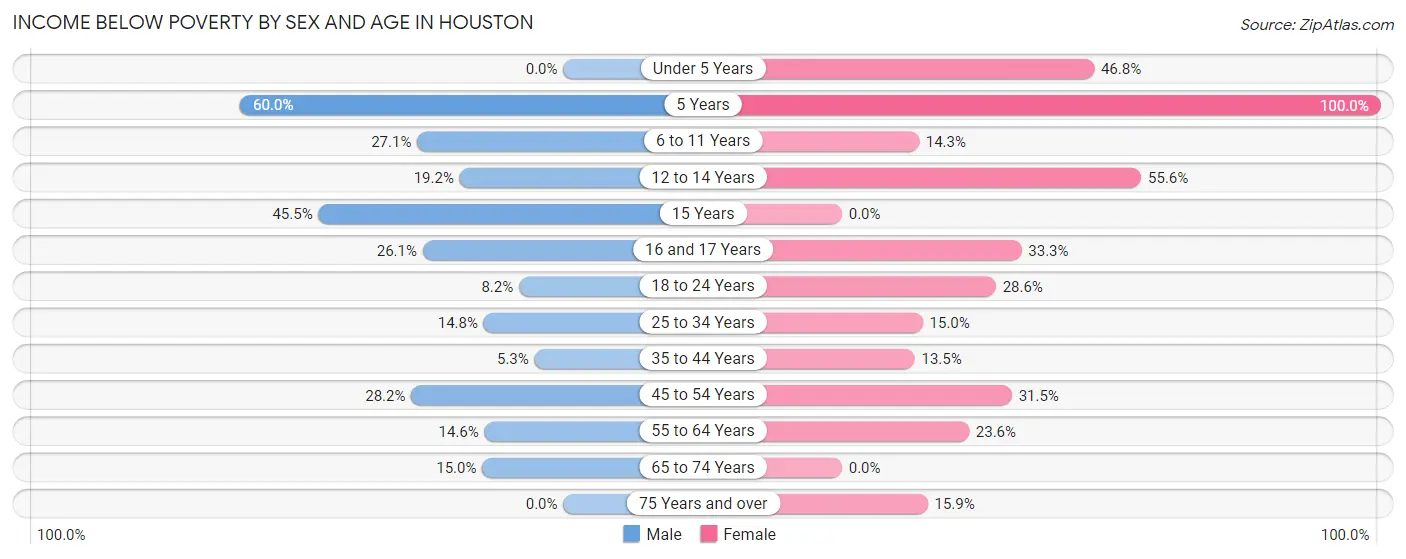
| Age Bracket | Male | Female |
| Under 5 Years | 0 (0.0%) | 22 (46.8%) |
| 5 Years | 15 (60.0%) | 3 (100.0%) |
| 6 to 11 Years | 16 (27.1%) | 3 (14.3%) |
| 12 to 14 Years | 5 (19.2%) | 15 (55.6%) |
| 15 Years | 5 (45.5%) | 0 (0.0%) |
| 16 and 17 Years | 6 (26.1%) | 4 (33.3%) |
| 18 to 24 Years | 6 (8.2%) | 16 (28.6%) |
| 25 to 34 Years | 22 (14.8%) | 12 (15.0%) |
| 35 to 44 Years | 4 (5.3%) | 10 (13.5%) |
| 45 to 54 Years | 35 (28.2%) | 41 (31.5%) |
| 55 to 64 Years | 26 (14.6%) | 29 (23.6%) |
| 65 to 74 Years | 20 (15.0%) | 0 (0.0%) |
| 75 Years and over | 0 (0.0%) | 7 (15.9%) |
| Total | 160 (17.6%) | 162 (23.0%) |
Income Above Poverty by Sex and Age in Houston
According to the poverty statistics in Houston, males aged under 5 years and females aged 15 years are the age groups that are most secure financially, with 100.0% of males and 100.0% of females in these age groups living above the poverty line.
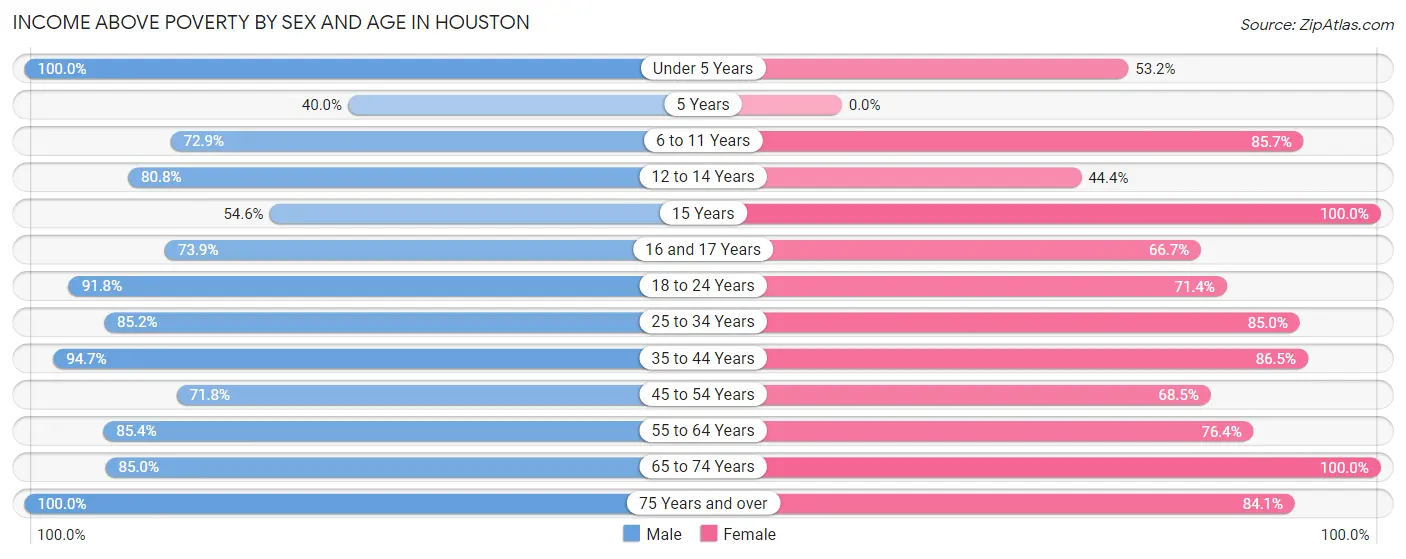
| Age Bracket | Male | Female |
| Under 5 Years | 22 (100.0%) | 25 (53.2%) |
| 5 Years | 10 (40.0%) | 0 (0.0%) |
| 6 to 11 Years | 43 (72.9%) | 18 (85.7%) |
| 12 to 14 Years | 21 (80.8%) | 12 (44.4%) |
| 15 Years | 6 (54.5%) | 6 (100.0%) |
| 16 and 17 Years | 17 (73.9%) | 8 (66.7%) |
| 18 to 24 Years | 67 (91.8%) | 40 (71.4%) |
| 25 to 34 Years | 127 (85.2%) | 68 (85.0%) |
| 35 to 44 Years | 71 (94.7%) | 64 (86.5%) |
| 45 to 54 Years | 89 (71.8%) | 89 (68.5%) |
| 55 to 64 Years | 152 (85.4%) | 94 (76.4%) |
| 65 to 74 Years | 113 (85.0%) | 81 (100.0%) |
| 75 Years and over | 10 (100.0%) | 37 (84.1%) |
| Total | 748 (82.4%) | 542 (77.0%) |
Income Below Poverty Among Married-Couple Families in Houston
The poverty statistics for married-couple families in Houston show that 9.3% or 27 of the total 290 families live below the poverty line. Families with no children have the highest poverty rate of 11.1%, comprising of 22 families. On the other hand, families with 3 or 4 children have the lowest poverty rate of 0.0%, which includes 0 families.
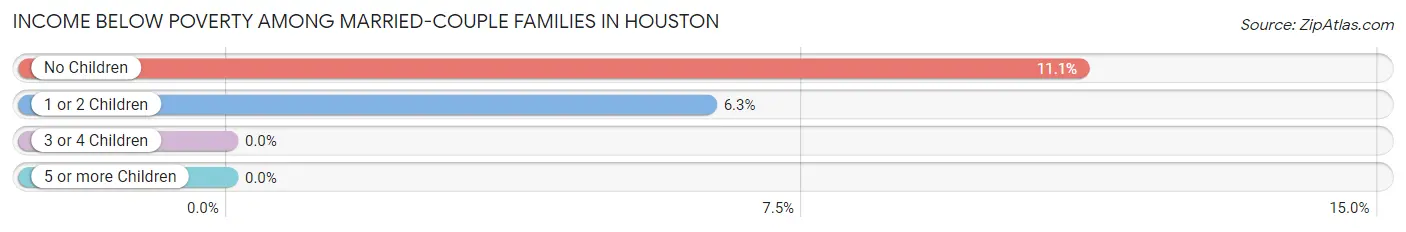
| Children | Above Poverty | Below Poverty |
| No Children | 176 (88.9%) | 22 (11.1%) |
| 1 or 2 Children | 75 (93.8%) | 5 (6.2%) |
| 3 or 4 Children | 12 (100.0%) | 0 (0.0%) |
| 5 or more Children | 0 (0.0%) | 0 (0.0%) |
| Total | 263 (90.7%) | 27 (9.3%) |
Income Below Poverty Among Single-Parent Households in Houston
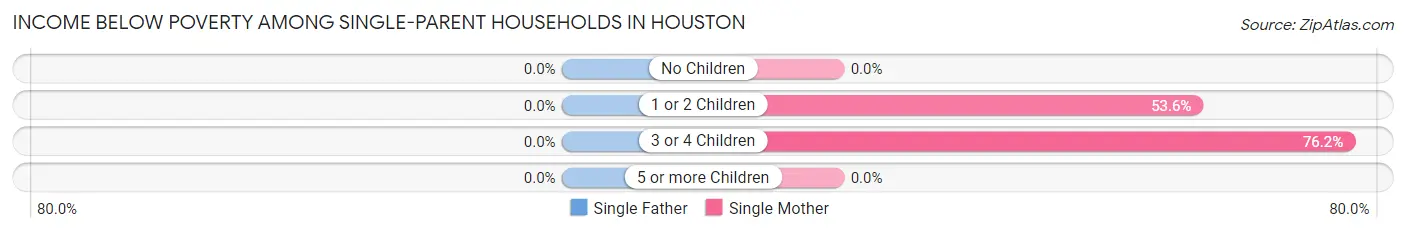
| Children | Single Father | Single Mother |
| No Children | 0 (0.0%) | 0 (0.0%) |
| 1 or 2 Children | 0 (0.0%) | 15 (53.6%) |
| 3 or 4 Children | 0 (0.0%) | 16 (76.2%) |
| 5 or more Children | 0 (0.0%) | 0 (0.0%) |
| Total | 0 (0.0%) | 31 (38.8%) |
Income Below Poverty Among Married-Couple vs Single-Parent Households in Houston
The poverty data for Houston shows that 27 of the married-couple family households (9.3%) and 31 of the single-parent households (25.6%) are living below the poverty level. Within the married-couple family households, those with no children have the highest poverty rate, with 22 households (11.1%) falling below the poverty line. Among the single-parent households, those with 3 or 4 children have the highest poverty rate, with 16 household (76.2%) living below poverty.
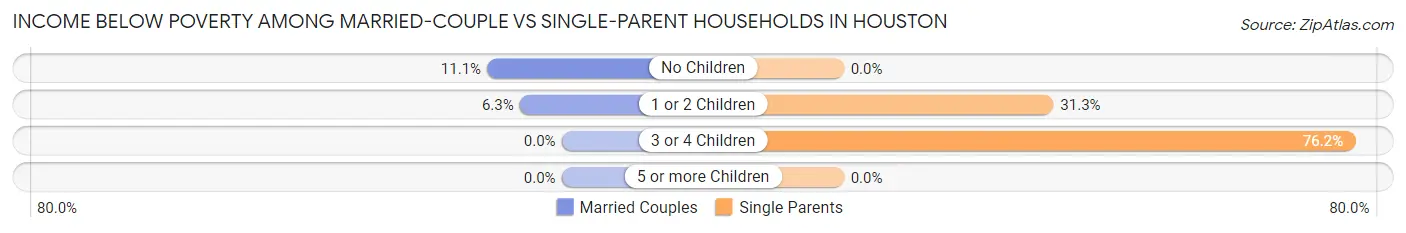
| Children | Married-Couple Families | Single-Parent Households |
| No Children | 22 (11.1%) | 0 (0.0%) |
| 1 or 2 Children | 5 (6.2%) | 15 (31.2%) |
| 3 or 4 Children | 0 (0.0%) | 16 (76.2%) |
| 5 or more Children | 0 (0.0%) | 0 (0.0%) |
| Total | 27 (9.3%) | 31 (25.6%) |
Race in Houston
The most populous races in Houston are White / Caucasian (1,334 | 82.7%), Two or more Races (173 | 10.7%), and Hispanic or Latino (65 | 4.0%).
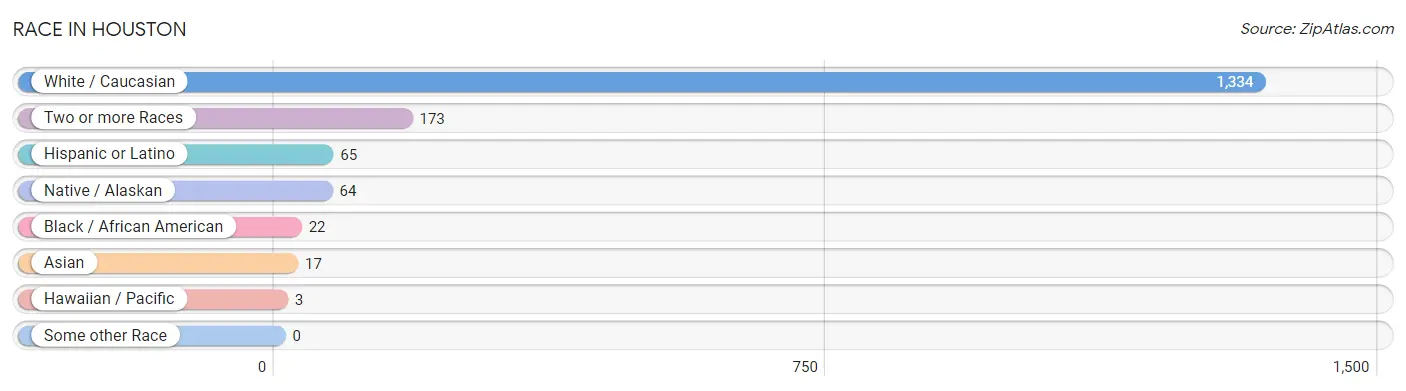
| Race | # Population | % Population |
| Asian | 17 | 1.1% |
| Black / African American | 22 | 1.4% |
| Hawaiian / Pacific | 3 | 0.2% |
| Hispanic or Latino | 65 | 4.0% |
| Native / Alaskan | 64 | 4.0% |
| White / Caucasian | 1,334 | 82.7% |
| Two or more Races | 173 | 10.7% |
| Some other Race | 0 | 0.0% |
| Total | 1,613 | 100.0% |
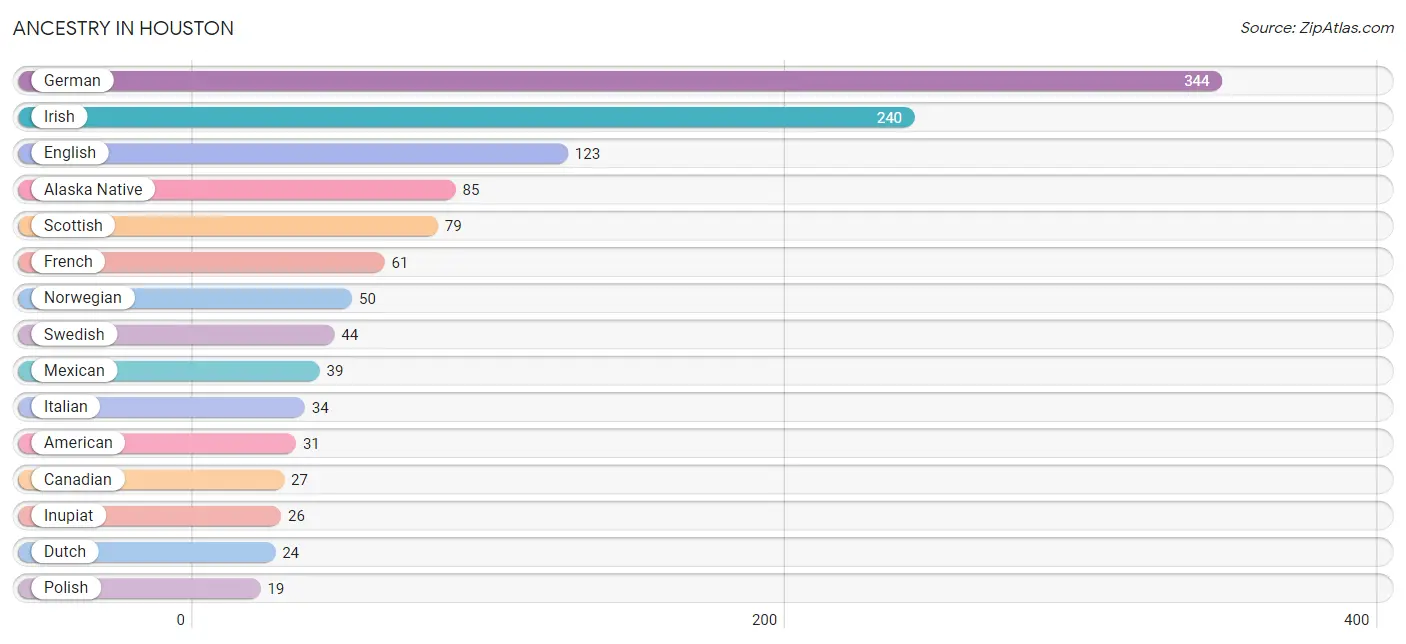
Ancestry in Houston
The most populous ancestries reported in Houston are German (344 | 21.3%), Irish (240 | 14.9%), English (123 | 7.6%), Alaska Native (85 | 5.3%), and Scottish (79 | 4.9%), together accounting for 54.0% of all Houston residents.
| Ancestry | # Population | % Population |
| Alaska Native | 85 | 5.3% |
| Alaskan Athabascan | 8 | 0.5% |
| Aleut | 13 | 0.8% |
| American | 31 | 1.9% |
| Apache | 4 | 0.3% |
| Armenian | 8 | 0.5% |
| Bhutanese | 6 | 0.4% |
| Blackfeet | 16 | 1.0% |
| British | 14 | 0.9% |
| Bulgarian | 8 | 0.5% |
| Canadian | 27 | 1.7% |
| Cherokee | 18 | 1.1% |
| Choctaw | 5 | 0.3% |
| Colombian | 4 | 0.3% |
| Creek | 10 | 0.6% |
| Czech | 7 | 0.4% |
| Danish | 3 | 0.2% |
| Dutch | 24 | 1.5% |
| English | 123 | 7.6% |
| European | 9 | 0.6% |
| French | 61 | 3.8% |
| French Canadian | 9 | 0.6% |
| German | 344 | 21.3% |
| Indian (Asian) | 9 | 0.6% |
| Inupiat | 26 | 1.6% |
| Irish | 240 | 14.9% |
| Italian | 34 | 2.1% |
| Jamaican | 8 | 0.5% |
| Korean | 13 | 0.8% |
| Malaysian | 3 | 0.2% |
| Mexican | 39 | 2.4% |
| Native Hawaiian | 3 | 0.2% |
| Norwegian | 50 | 3.1% |
| Polish | 19 | 1.2% |
| Portuguese | 5 | 0.3% |
| Puerto Rican | 5 | 0.3% |
| Russian | 1 | 0.1% |
| Scotch-Irish | 19 | 1.2% |
| Scottish | 79 | 4.9% |
| Serbian | 6 | 0.4% |
| Slavic | 2 | 0.1% |
| Slovak | 7 | 0.4% |
| South American | 4 | 0.3% |
| Spaniard | 13 | 0.8% |
| Sri Lankan | 2 | 0.1% |
| Swedish | 44 | 2.7% |
| Ukrainian | 4 | 0.3% | View All 47 Rows |
Immigrants in Houston
The most numerous immigrant groups reported in Houston came from Europe (29 | 1.8%), Eastern Europe (14 | 0.9%), Asia (12 | 0.7%), Western Europe (12 | 0.7%), and South Eastern Asia (9 | 0.6%), together accounting for 4.7% of all Houston residents.
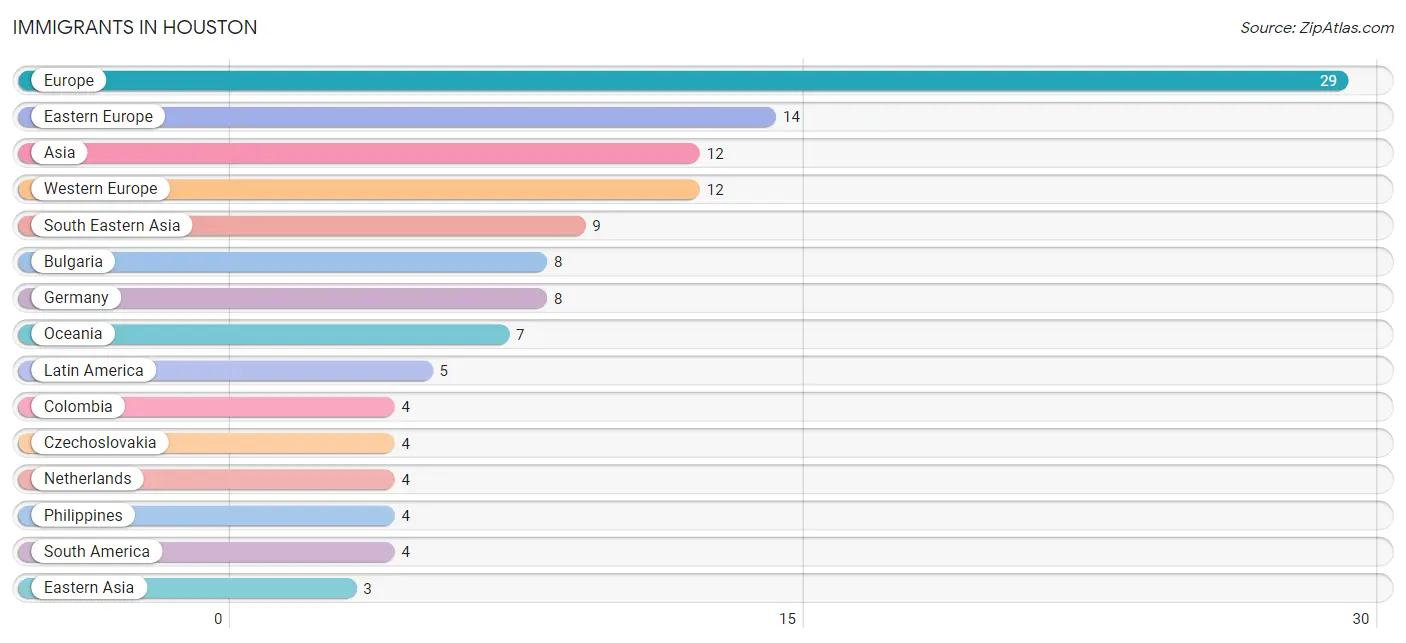
| Immigration Origin | # Population | % Population |
| Asia | 12 | 0.7% |
| Bulgaria | 8 | 0.5% |
| Central America | 1 | 0.1% |
| Colombia | 4 | 0.3% |
| Czechoslovakia | 4 | 0.3% |
| Eastern Asia | 3 | 0.2% |
| Eastern Europe | 14 | 0.9% |
| England | 3 | 0.2% |
| Europe | 29 | 1.8% |
| Germany | 8 | 0.5% |
| Japan | 3 | 0.2% |
| Laos | 3 | 0.2% |
| Latin America | 5 | 0.3% |
| Mexico | 1 | 0.1% |
| Netherlands | 4 | 0.3% |
| Northern Europe | 3 | 0.2% |
| Oceania | 7 | 0.4% |
| Philippines | 4 | 0.3% |
| South America | 4 | 0.3% |
| South Eastern Asia | 9 | 0.6% |
| Ukraine | 2 | 0.1% |
| Vietnam | 2 | 0.1% |
| Western Europe | 12 | 0.7% | View All 23 Rows |
Sex and Age in Houston
Sex and Age in Houston
The most populous age groups in Houston are 25 to 29 Years (102 | 11.2%) for men and 50 to 54 Years (76 | 10.8%) for women.
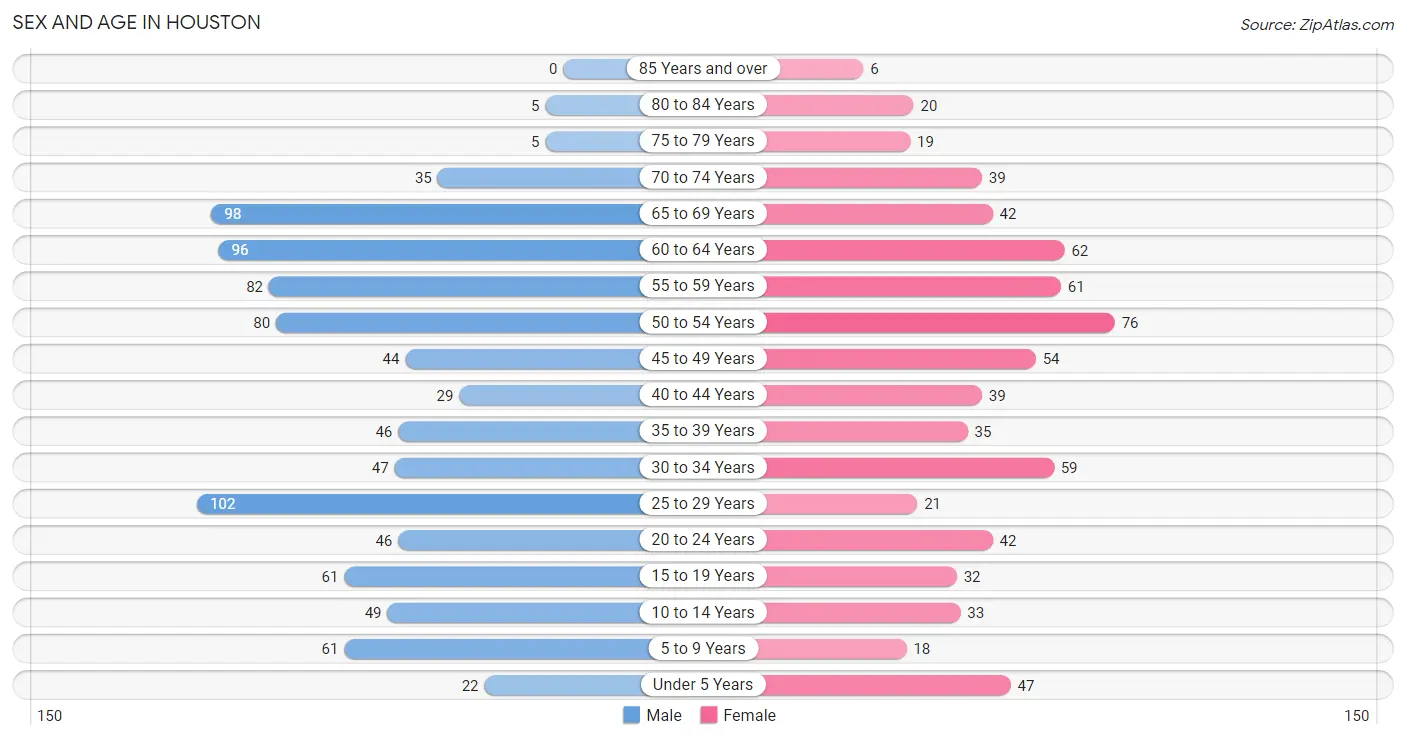
| Age Bracket | Male | Female |
| Under 5 Years | 22 (2.4%) | 47 (6.7%) |
| 5 to 9 Years | 61 (6.7%) | 18 (2.5%) |
| 10 to 14 Years | 49 (5.4%) | 33 (4.7%) |
| 15 to 19 Years | 61 (6.7%) | 32 (4.5%) |
| 20 to 24 Years | 46 (5.1%) | 42 (6.0%) |
| 25 to 29 Years | 102 (11.2%) | 21 (3.0%) |
| 30 to 34 Years | 47 (5.2%) | 59 (8.4%) |
| 35 to 39 Years | 46 (5.1%) | 35 (5.0%) |
| 40 to 44 Years | 29 (3.2%) | 39 (5.5%) |
| 45 to 49 Years | 44 (4.9%) | 54 (7.7%) |
| 50 to 54 Years | 80 (8.8%) | 76 (10.8%) |
| 55 to 59 Years | 82 (9.0%) | 61 (8.6%) |
| 60 to 64 Years | 96 (10.6%) | 62 (8.8%) |
| 65 to 69 Years | 98 (10.8%) | 42 (6.0%) |
| 70 to 74 Years | 35 (3.8%) | 39 (5.5%) |
| 75 to 79 Years | 5 (0.5%) | 19 (2.7%) |
| 80 to 84 Years | 5 (0.5%) | 20 (2.8%) |
| 85 Years and over | 0 (0.0%) | 6 (0.9%) |
| Total | 908 (100.0%) | 705 (100.0%) |
Families and Households in Houston
Median Family Size in Houston
The median family size in Houston is 2.85 persons per family, with single female/mother families (80 | 19.5%) accounting for the largest median family size of 3.39 persons per family. On the other hand, single male/father families (41 | 10.0%) represent the smallest median family size with 2.22 persons per family.
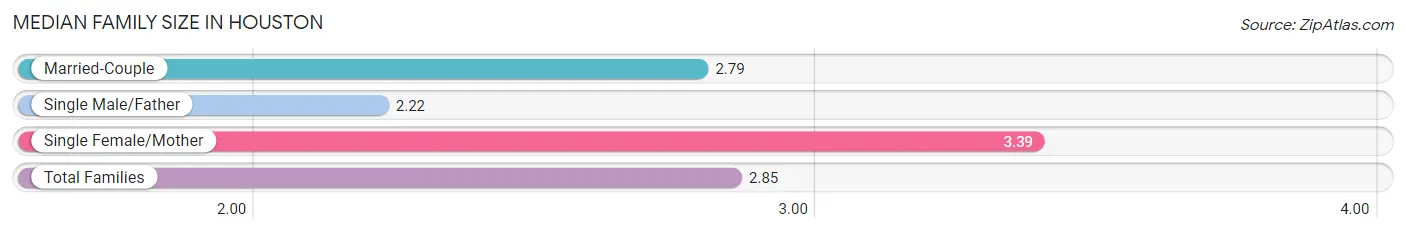
| Family Type | # Families | Family Size |
| Married-Couple | 290 (70.6%) | 2.79 |
| Single Male/Father | 41 (10.0%) | 2.22 |
| Single Female/Mother | 80 (19.5%) | 3.39 |
| Total Families | 411 (100.0%) | 2.85 |
Median Household Size in Houston
The median household size in Houston is 2.21 persons per household, with single female/mother households (80 | 11.0%) accounting for the largest median household size of 3.46 persons per household. non-family households (315 | 43.4%) represent the smallest median household size with 1.25 persons per household.
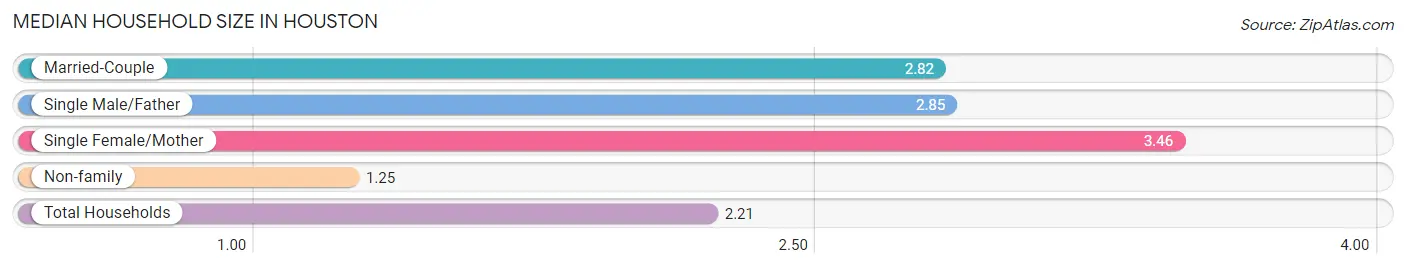
| Household Type | # Households | Household Size |
| Married-Couple | 290 (39.9%) | 2.82 |
| Single Male/Father | 41 (5.7%) | 2.85 |
| Single Female/Mother | 80 (11.0%) | 3.46 |
| Non-family | 315 (43.4%) | 1.25 |
| Total Households | 726 (100.0%) | 2.21 |
Household Size by Marriage Status in Houston
Out of a total of 726 households in Houston, 411 (56.6%) are family households, while 315 (43.4%) are nonfamily households. The most numerous type of family households are 2-person households, comprising 212, and the most common type of nonfamily households are 1-person households, comprising 257.
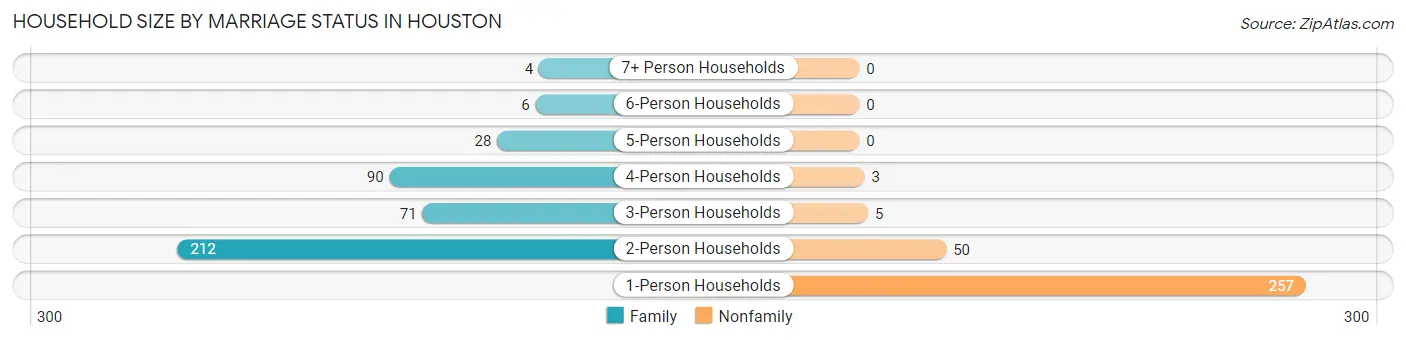
| Household Size | Family Households | Nonfamily Households |
| 1-Person Households | - | 257 (35.4%) |
| 2-Person Households | 212 (29.2%) | 50 (6.9%) |
| 3-Person Households | 71 (9.8%) | 5 (0.7%) |
| 4-Person Households | 90 (12.4%) | 3 (0.4%) |
| 5-Person Households | 28 (3.9%) | 0 (0.0%) |
| 6-Person Households | 6 (0.8%) | 0 (0.0%) |
| 7+ Person Households | 4 (0.5%) | 0 (0.0%) |
| Total | 411 (56.6%) | 315 (43.4%) |
Female Fertility in Houston
Fertility by Age in Houston
Average fertility rate in Houston is 84.0 births per 1,000 women. Women in the age bracket of 20 to 34 years have the highest fertility rate with 172.0 births per 1,000 women. Women in the age bracket of 20 to 34 years acount for 87.5% of all women with births.
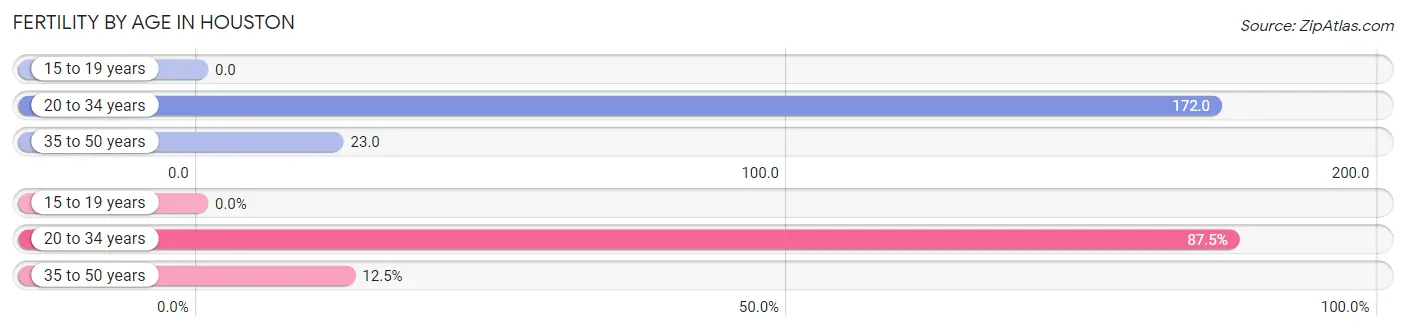
| Age Bracket | Women with Births | Births / 1,000 Women |
| 15 to 19 years | 0 (0.0%) | 0.0 |
| 20 to 34 years | 21 (87.5%) | 172.0 |
| 35 to 50 years | 3 (12.5%) | 23.0 |
| Total | 24 (100.0%) | 84.0 |
Fertility by Age by Marriage Status in Houston
70.8% of women with births (24) in Houston are married. The highest percentage of unmarried women with births falls into 35 to 50 years age bracket with 100.0% of them unmarried at the time of birth, while the lowest percentage of unmarried women with births belong to 20 to 34 years age bracket with 19.1% of them unmarried.
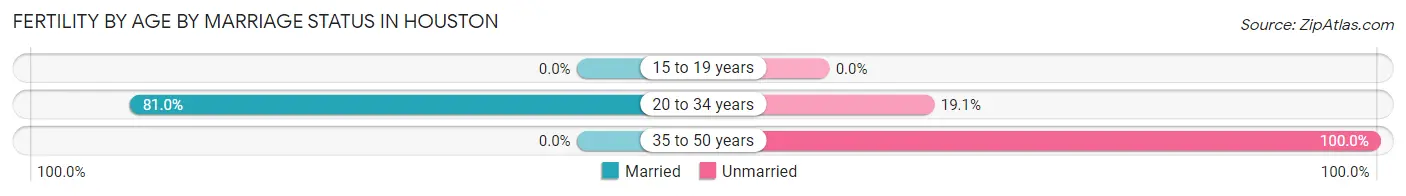
| Age Bracket | Married | Unmarried |
| 15 to 19 years | 0 (0.0%) | 0 (0.0%) |
| 20 to 34 years | 17 (80.9%) | 4 (19.1%) |
| 35 to 50 years | 0 (0.0%) | 3 (100.0%) |
| Total | 17 (70.8%) | 7 (29.2%) |
Fertility by Education in Houston
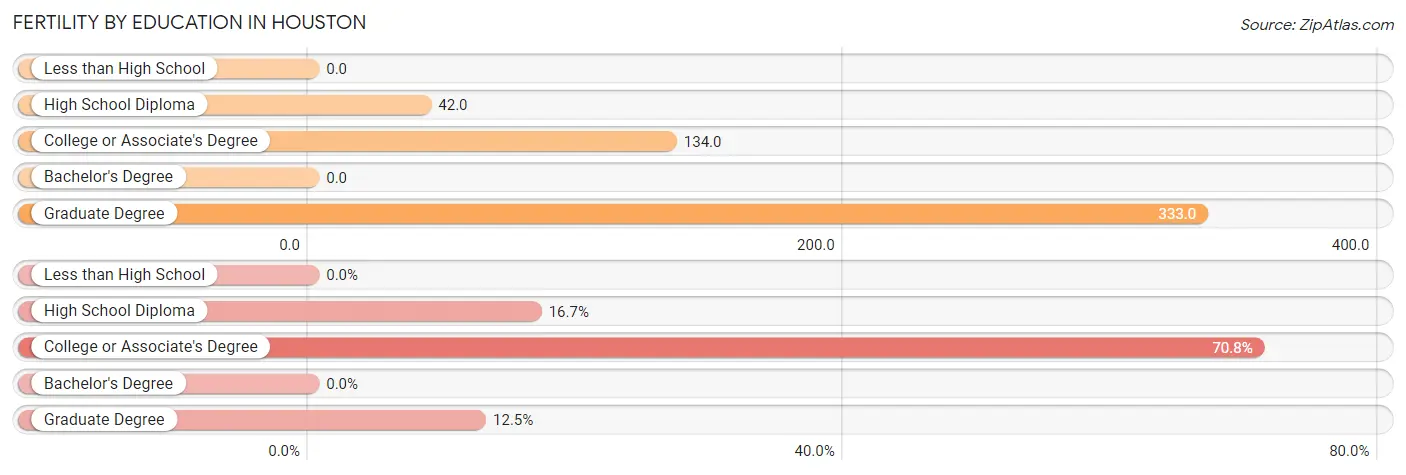
| Educational Attainment | Women with Births | Births / 1,000 Women |
| Less than High School | 0 (0.0%) | 0.0 |
| High School Diploma | 4 (16.7%) | 42.0 |
| College or Associate's Degree | 17 (70.8%) | 134.0 |
| Bachelor's Degree | 0 (0.0%) | 0.0 |
| Graduate Degree | 3 (12.5%) | 333.0 |
| Total | 24 (100.0%) | 84.0 |
Fertility by Education by Marriage Status in Houston
29.2% of women with births in Houston are unmarried. Women with the educational attainment of college or associate's degree are most likely to be married with 100.0% of them married at childbirth, while women with the educational attainment of high school diploma are least likely to be married with 100.0% of them unmarried at childbirth.
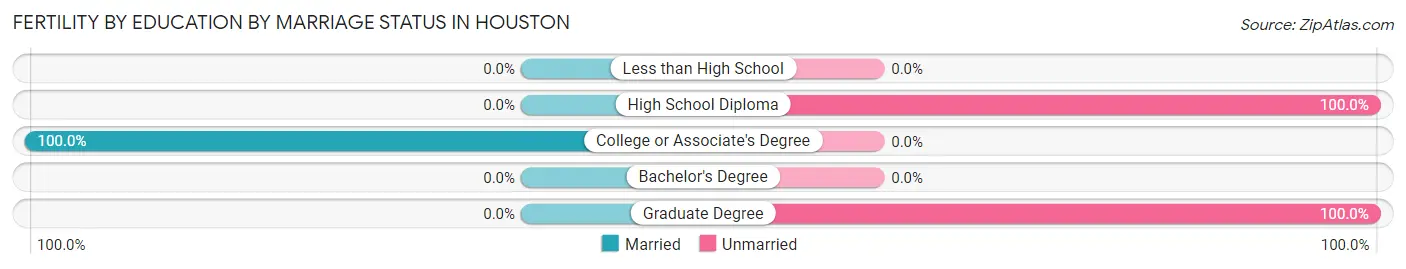
| Educational Attainment | Married | Unmarried |
| Less than High School | 0 (0.0%) | 0 (0.0%) |
| High School Diploma | 0 (0.0%) | 4 (100.0%) |
| College or Associate's Degree | 17 (100.0%) | 0 (0.0%) |
| Bachelor's Degree | 0 (0.0%) | 0 (0.0%) |
| Graduate Degree | 0 (0.0%) | 3 (100.0%) |
| Total | 17 (70.8%) | 7 (29.2%) |
Employment Characteristics in Houston
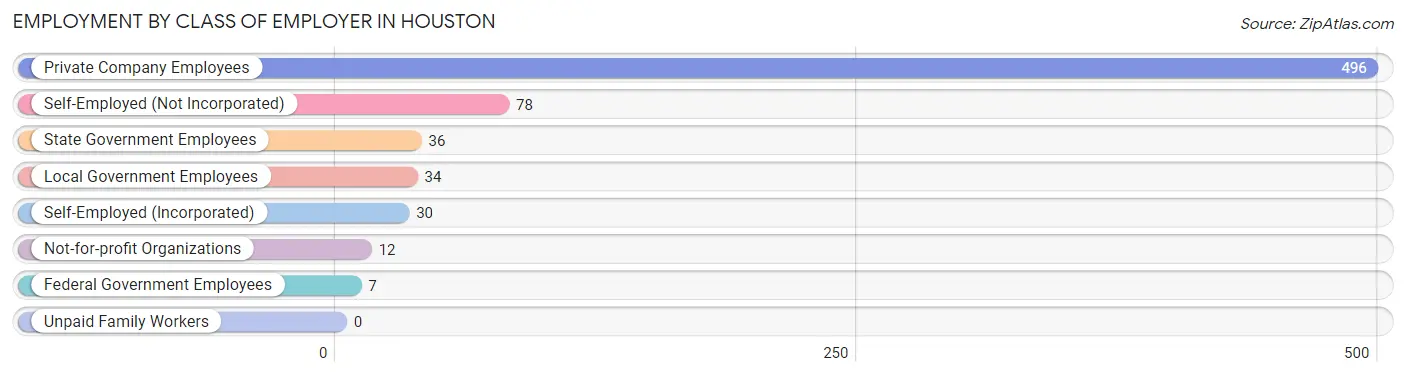
Employment by Class of Employer in Houston
Among the 693 employed individuals in Houston, private company employees (496 | 71.6%), self-employed (not incorporated) (78 | 11.3%), and state government employees (36 | 5.2%) make up the most common classes of employment.
| Employer Class | # Employees | % Employees |
| Private Company Employees | 496 | 71.6% |
| Self-Employed (Incorporated) | 30 | 4.3% |
| Self-Employed (Not Incorporated) | 78 | 11.3% |
| Not-for-profit Organizations | 12 | 1.7% |
| Local Government Employees | 34 | 4.9% |
| State Government Employees | 36 | 5.2% |
| Federal Government Employees | 7 | 1.0% |
| Unpaid Family Workers | 0 | 0.0% |
| Total | 693 | 100.0% |
Employment Status by Age in Houston
According to the labor force statistics for Houston, out of the total population over 16 years of age (1,366), 58.3% or 796 individuals are in the labor force, with 12.6% or 100 of them unemployed. The age group with the highest labor force participation rate is 25 to 29 years, with 90.2% or 111 individuals in the labor force. Within the labor force, the 45 to 54 years age range has the highest percentage of unemployed individuals, with 20.8% or 37 of them being unemployed.
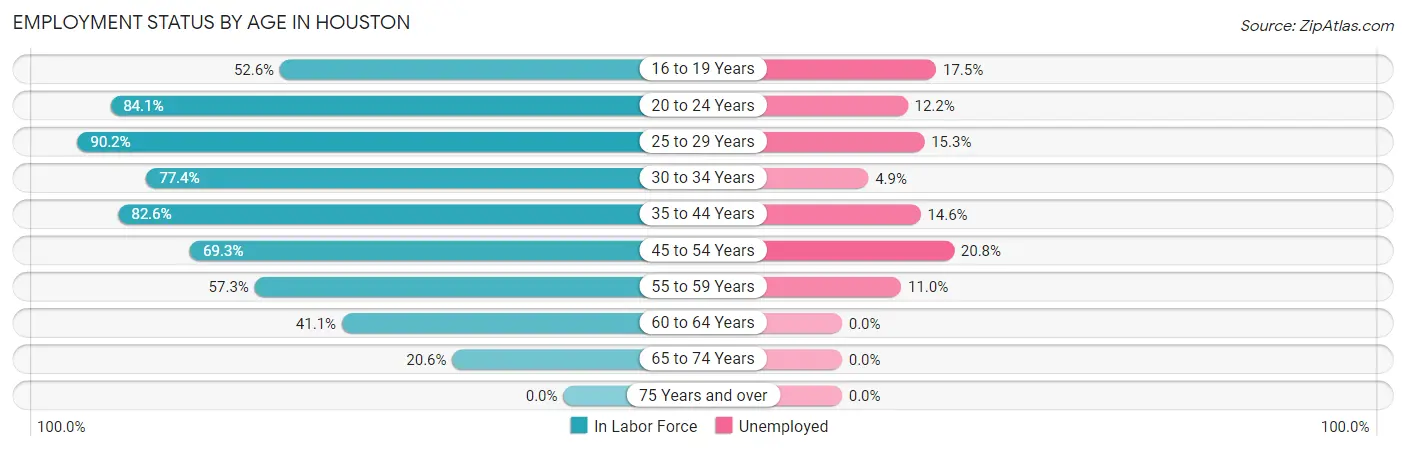
| Age Bracket | In Labor Force | Unemployed |
| 16 to 19 Years | 40 (52.6%) | 7 (17.5%) |
| 20 to 24 Years | 74 (84.1%) | 9 (12.2%) |
| 25 to 29 Years | 111 (90.2%) | 17 (15.3%) |
| 30 to 34 Years | 82 (77.4%) | 4 (4.9%) |
| 35 to 44 Years | 123 (82.6%) | 18 (14.6%) |
| 45 to 54 Years | 176 (69.3%) | 37 (20.8%) |
| 55 to 59 Years | 82 (57.3%) | 9 (11.0%) |
| 60 to 64 Years | 65 (41.1%) | 0 (0.0%) |
| 65 to 74 Years | 44 (20.6%) | 0 (0.0%) |
| 75 Years and over | 0 (0.0%) | 0 (0.0%) |
| Total | 796 (58.3%) | 100 (12.6%) |
Employment Status by Educational Attainment in Houston
According to labor force statistics for Houston, 68.5% of individuals (639) out of the total population between 25 and 64 years of age (933) are in the labor force, with 13.2% or 84 of them being unemployed. The group with the highest labor force participation rate are those with the educational attainment of high school diploma, with 73.5% or 299 individuals in the labor force. Within the labor force, individuals with high school diploma education have the highest percentage of unemployment, with 20.4% or 61 of them being unemployed.
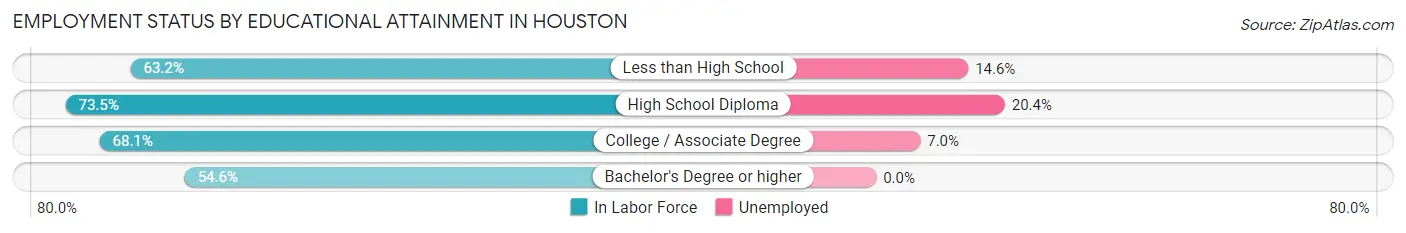
| Educational Attainment | In Labor Force | Unemployed |
| Less than High School | 48 (63.2%) | 11 (14.6%) |
| High School Diploma | 299 (73.5%) | 83 (20.4%) |
| College / Associate Degree | 233 (68.1%) | 24 (7.0%) |
| Bachelor's Degree or higher | 59 (54.6%) | 0 (0.0%) |
| Total | 639 (68.5%) | 123 (13.2%) |
Employment Occupations by Sex in Houston
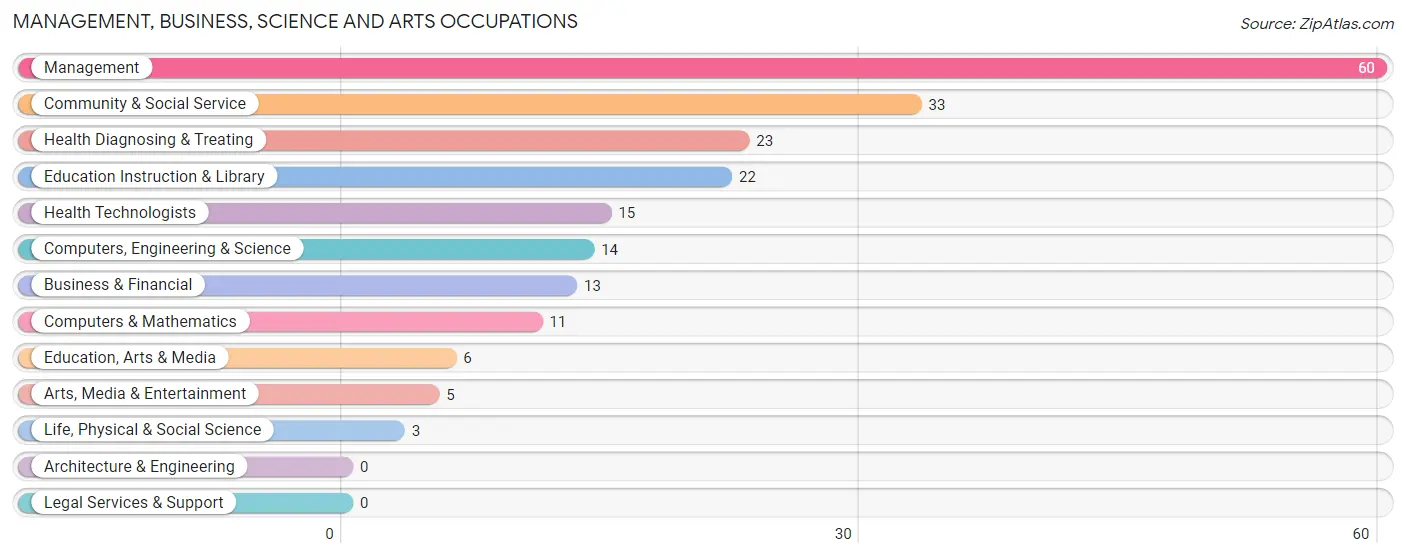
Management, Business, Science and Arts Occupations
The most common Management, Business, Science and Arts occupations in Houston are Management (60 | 8.6%), Community & Social Service (33 | 4.8%), Health Diagnosing & Treating (23 | 3.3%), Education Instruction & Library (22 | 3.2%), and Health Technologists (15 | 2.2%).
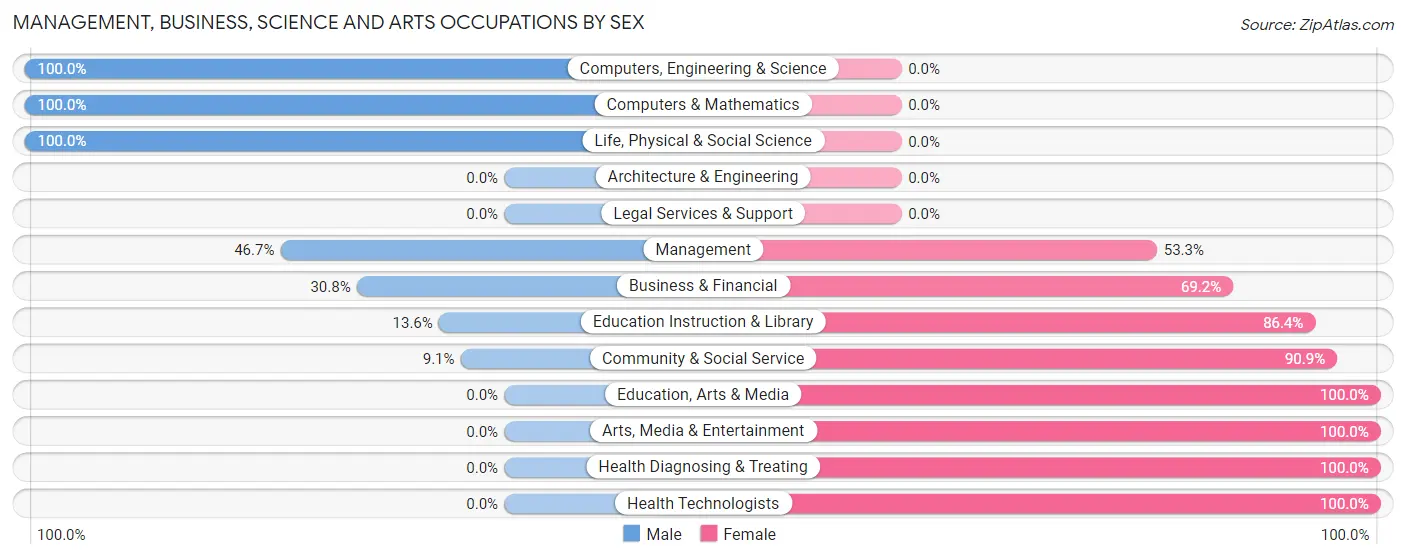
Management, Business, Science and Arts Occupations by Sex
Within the Management, Business, Science and Arts occupations in Houston, the most male-oriented occupations are Computers, Engineering & Science (100.0%), Computers & Mathematics (100.0%), and Life, Physical & Social Science (100.0%), while the most female-oriented occupations are Education, Arts & Media (100.0%), Arts, Media & Entertainment (100.0%), and Health Diagnosing & Treating (100.0%).
| Occupation | Male | Female |
| Management | 28 (46.7%) | 32 (53.3%) |
| Business & Financial | 4 (30.8%) | 9 (69.2%) |
| Computers, Engineering & Science | 14 (100.0%) | 0 (0.0%) |
| Computers & Mathematics | 11 (100.0%) | 0 (0.0%) |
| Architecture & Engineering | 0 (0.0%) | 0 (0.0%) |
| Life, Physical & Social Science | 3 (100.0%) | 0 (0.0%) |
| Community & Social Service | 3 (9.1%) | 30 (90.9%) |
| Education, Arts & Media | 0 (0.0%) | 6 (100.0%) |
| Legal Services & Support | 0 (0.0%) | 0 (0.0%) |
| Education Instruction & Library | 3 (13.6%) | 19 (86.4%) |
| Arts, Media & Entertainment | 0 (0.0%) | 5 (100.0%) |
| Health Diagnosing & Treating | 0 (0.0%) | 23 (100.0%) |
| Health Technologists | 0 (0.0%) | 15 (100.0%) |
| Total (Category) | 49 (34.3%) | 94 (65.7%) |
| Total (Overall) | 420 (60.5%) | 274 (39.5%) |
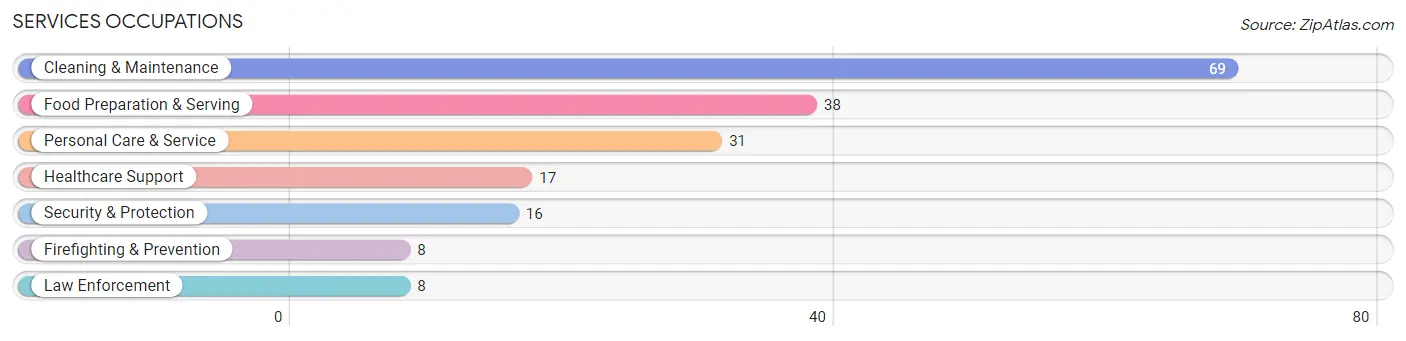
Services Occupations
The most common Services occupations in Houston are Cleaning & Maintenance (69 | 9.9%), Food Preparation & Serving (38 | 5.5%), Personal Care & Service (31 | 4.5%), Healthcare Support (17 | 2.5%), and Security & Protection (16 | 2.3%).
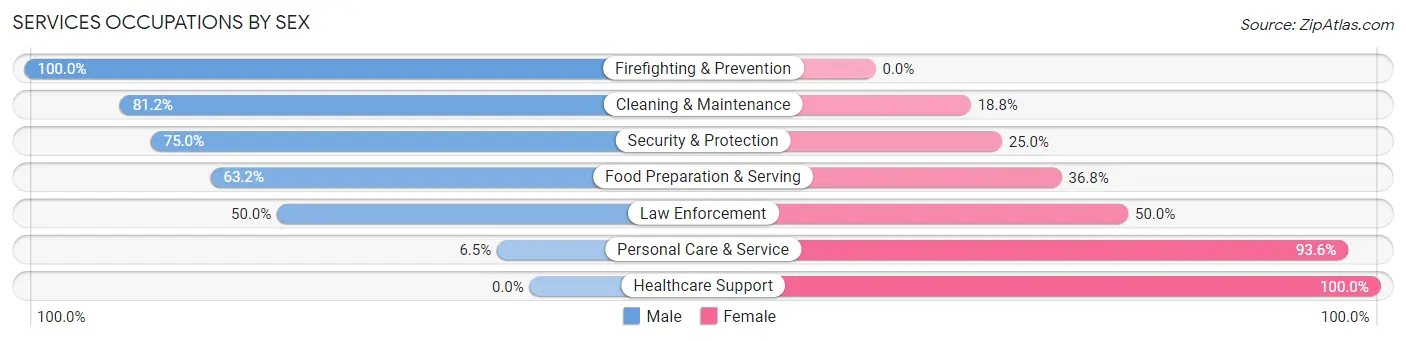
Services Occupations by Sex
Within the Services occupations in Houston, the most male-oriented occupations are Firefighting & Prevention (100.0%), Cleaning & Maintenance (81.2%), and Security & Protection (75.0%), while the most female-oriented occupations are Healthcare Support (100.0%), Personal Care & Service (93.5%), and Law Enforcement (50.0%).
| Occupation | Male | Female |
| Healthcare Support | 0 (0.0%) | 17 (100.0%) |
| Security & Protection | 12 (75.0%) | 4 (25.0%) |
| Firefighting & Prevention | 8 (100.0%) | 0 (0.0%) |
| Law Enforcement | 4 (50.0%) | 4 (50.0%) |
| Food Preparation & Serving | 24 (63.2%) | 14 (36.8%) |
| Cleaning & Maintenance | 56 (81.2%) | 13 (18.8%) |
| Personal Care & Service | 2 (6.5%) | 29 (93.5%) |
| Total (Category) | 94 (55.0%) | 77 (45.0%) |
| Total (Overall) | 420 (60.5%) | 274 (39.5%) |
Sales and Office Occupations
The most common Sales and Office occupations in Houston are Sales & Related (61 | 8.8%), and Office & Administration (58 | 8.4%).

Sales and Office Occupations by Sex
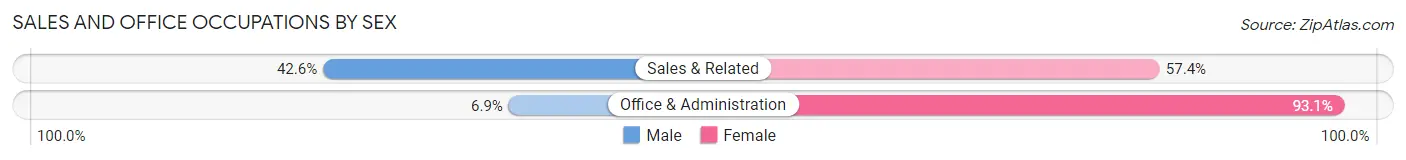
| Occupation | Male | Female |
| Sales & Related | 26 (42.6%) | 35 (57.4%) |
| Office & Administration | 4 (6.9%) | 54 (93.1%) |
| Total (Category) | 30 (25.2%) | 89 (74.8%) |
| Total (Overall) | 420 (60.5%) | 274 (39.5%) |
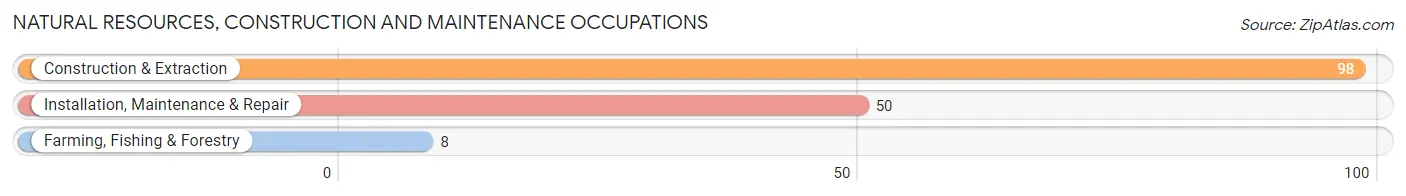
Natural Resources, Construction and Maintenance Occupations
The most common Natural Resources, Construction and Maintenance occupations in Houston are Construction & Extraction (98 | 14.1%), Installation, Maintenance & Repair (50 | 7.2%), and Farming, Fishing & Forestry (8 | 1.1%).
Natural Resources, Construction and Maintenance Occupations by Sex
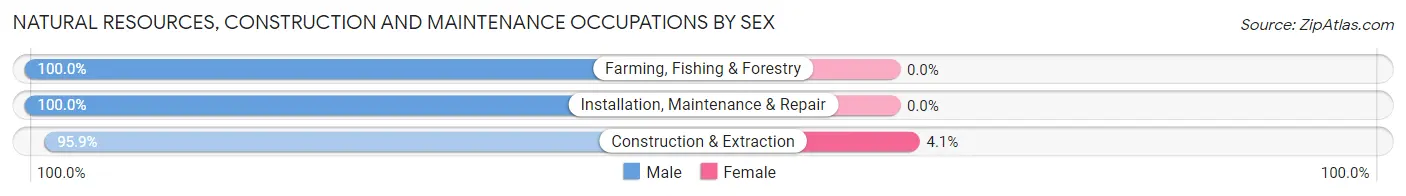
| Occupation | Male | Female |
| Farming, Fishing & Forestry | 8 (100.0%) | 0 (0.0%) |
| Construction & Extraction | 94 (95.9%) | 4 (4.1%) |
| Installation, Maintenance & Repair | 50 (100.0%) | 0 (0.0%) |
| Total (Category) | 152 (97.4%) | 4 (2.6%) |
| Total (Overall) | 420 (60.5%) | 274 (39.5%) |
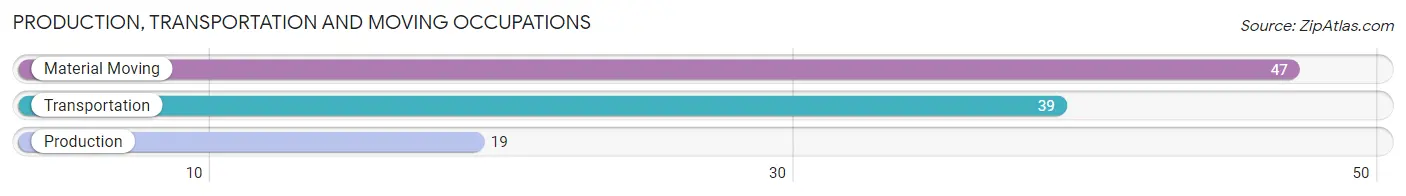
Production, Transportation and Moving Occupations
The most common Production, Transportation and Moving occupations in Houston are Material Moving (47 | 6.8%), Transportation (39 | 5.6%), and Production (19 | 2.7%).
Production, Transportation and Moving Occupations by Sex
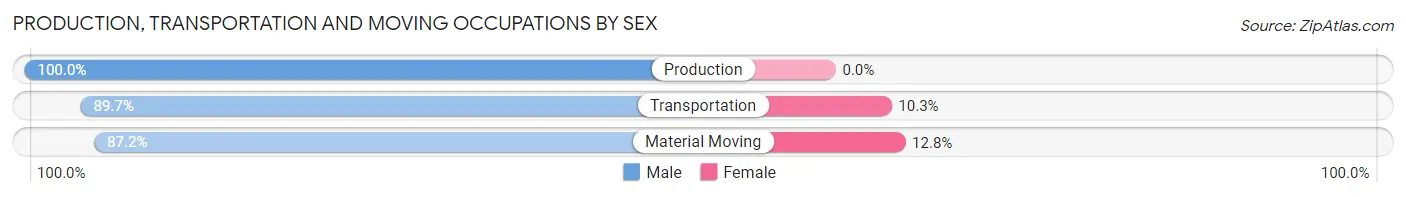
| Occupation | Male | Female |
| Production | 19 (100.0%) | 0 (0.0%) |
| Transportation | 35 (89.7%) | 4 (10.3%) |
| Material Moving | 41 (87.2%) | 6 (12.8%) |
| Total (Category) | 95 (90.5%) | 10 (9.5%) |
| Total (Overall) | 420 (60.5%) | 274 (39.5%) |
Employment Industries by Sex in Houston
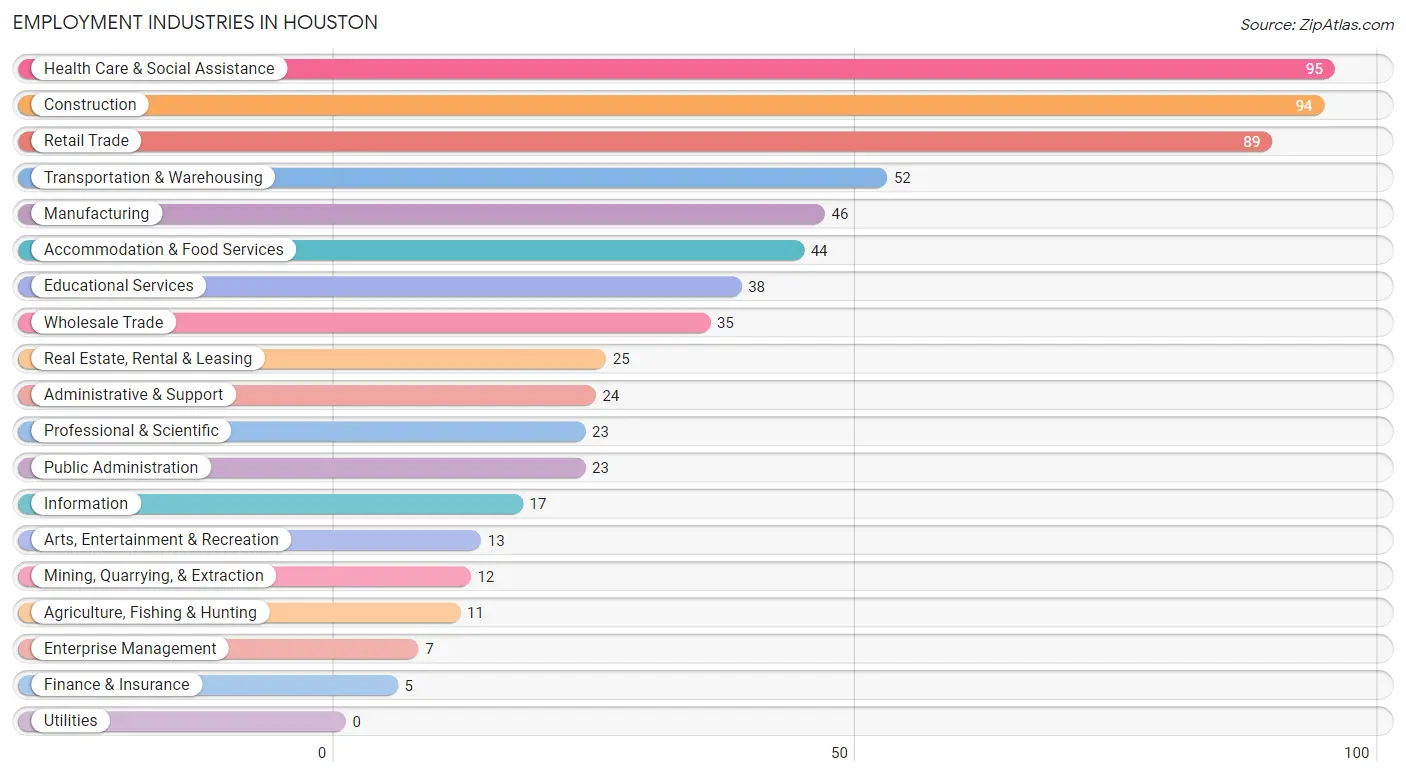
Employment Industries in Houston
The major employment industries in Houston include Health Care & Social Assistance (95 | 13.7%), Construction (94 | 13.5%), Retail Trade (89 | 12.8%), Transportation & Warehousing (52 | 7.5%), and Manufacturing (46 | 6.6%).
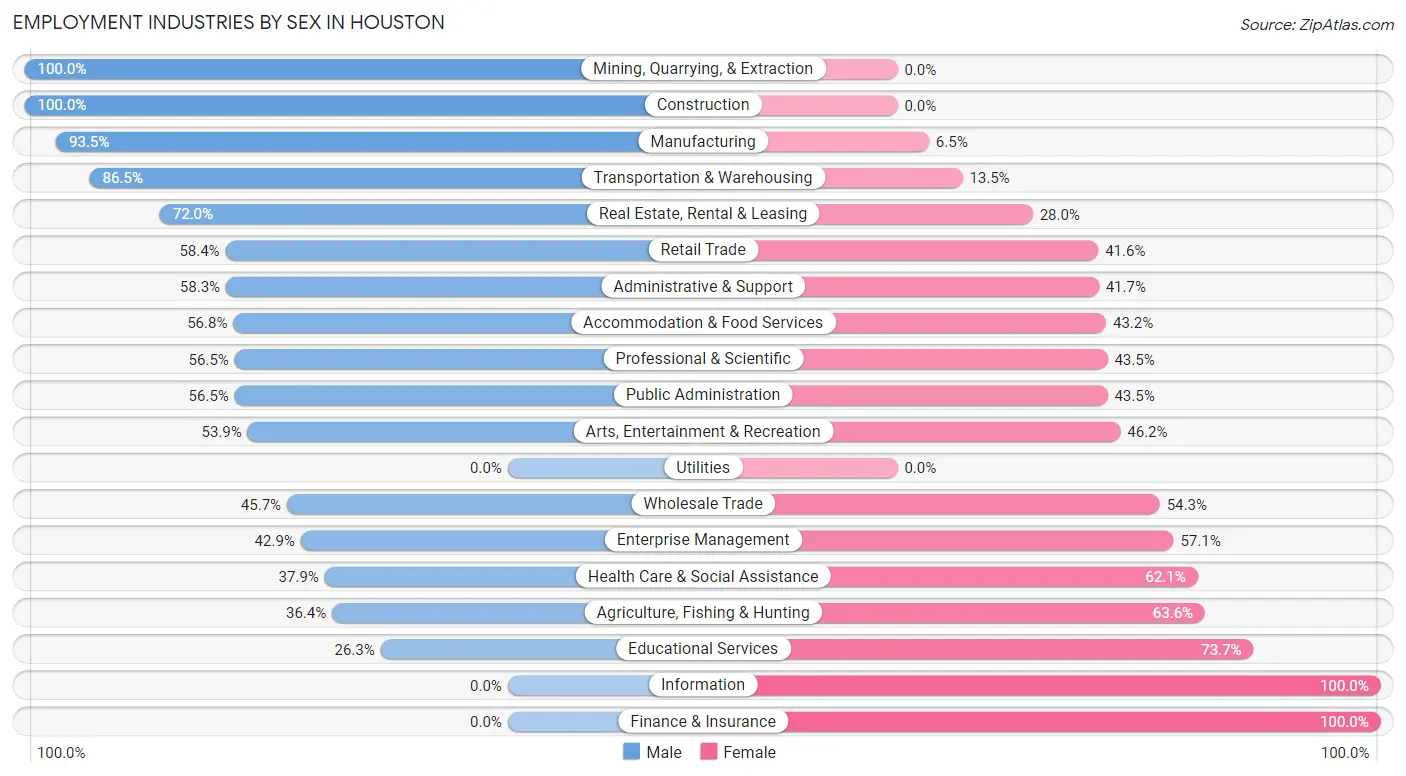
Employment Industries by Sex in Houston
The Houston industries that see more men than women are Mining, Quarrying, & Extraction (100.0%), Construction (100.0%), and Manufacturing (93.5%), whereas the industries that tend to have a higher number of women are Information (100.0%), Finance & Insurance (100.0%), and Educational Services (73.7%).
| Industry | Male | Female |
| Agriculture, Fishing & Hunting | 4 (36.4%) | 7 (63.6%) |
| Mining, Quarrying, & Extraction | 12 (100.0%) | 0 (0.0%) |
| Construction | 94 (100.0%) | 0 (0.0%) |
| Manufacturing | 43 (93.5%) | 3 (6.5%) |
| Wholesale Trade | 16 (45.7%) | 19 (54.3%) |
| Retail Trade | 52 (58.4%) | 37 (41.6%) |
| Transportation & Warehousing | 45 (86.5%) | 7 (13.5%) |
| Utilities | 0 (0.0%) | 0 (0.0%) |
| Information | 0 (0.0%) | 17 (100.0%) |
| Finance & Insurance | 0 (0.0%) | 5 (100.0%) |
| Real Estate, Rental & Leasing | 18 (72.0%) | 7 (28.0%) |
| Professional & Scientific | 13 (56.5%) | 10 (43.5%) |
| Enterprise Management | 3 (42.9%) | 4 (57.1%) |
| Administrative & Support | 14 (58.3%) | 10 (41.7%) |
| Educational Services | 10 (26.3%) | 28 (73.7%) |
| Health Care & Social Assistance | 36 (37.9%) | 59 (62.1%) |
| Arts, Entertainment & Recreation | 7 (53.8%) | 6 (46.2%) |
| Accommodation & Food Services | 25 (56.8%) | 19 (43.2%) |
| Public Administration | 13 (56.5%) | 10 (43.5%) |
| Total | 420 (60.5%) | 274 (39.5%) |
Education in Houston
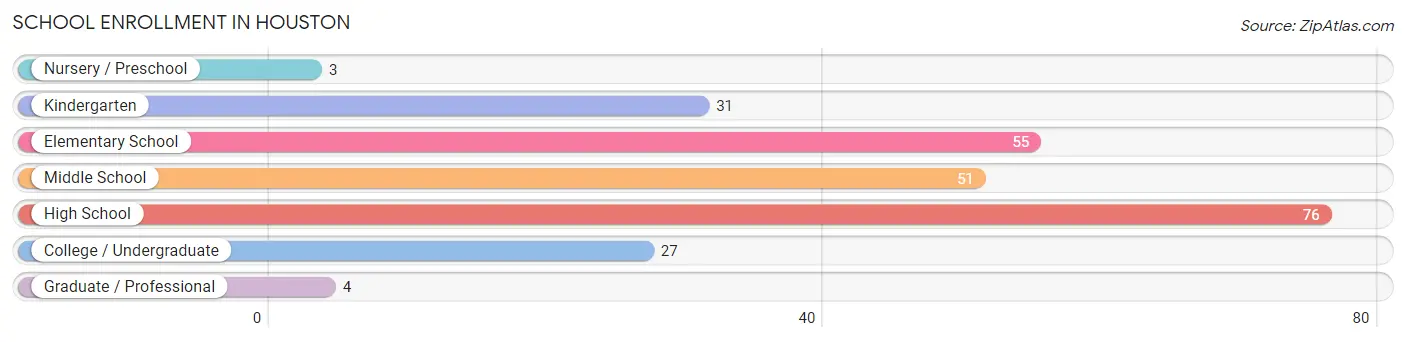
School Enrollment in Houston
The most common levels of schooling among the 247 students in Houston are high school (76 | 30.8%), elementary school (55 | 22.3%), and middle school (51 | 20.6%).
| School Level | # Students | % Students |
| Nursery / Preschool | 3 | 1.2% |
| Kindergarten | 31 | 12.6% |
| Elementary School | 55 | 22.3% |
| Middle School | 51 | 20.6% |
| High School | 76 | 30.8% |
| College / Undergraduate | 27 | 10.9% |
| Graduate / Professional | 4 | 1.6% |
| Total | 247 | 100.0% |
School Enrollment by Age by Funding Source in Houston
Out of a total of 247 students who are enrolled in schools in Houston, 31 (12.6%) attend a private institution, while the remaining 216 (87.4%) are enrolled in public schools. The age group of 20 to 24 year olds has the highest likelihood of being enrolled in private schools, with 10 (90.9% in the age bracket) enrolled. Conversely, the age group of 3 to 4 year olds has the lowest likelihood of being enrolled in a private school, with 4 (100.0% in the age bracket) attending a public institution.
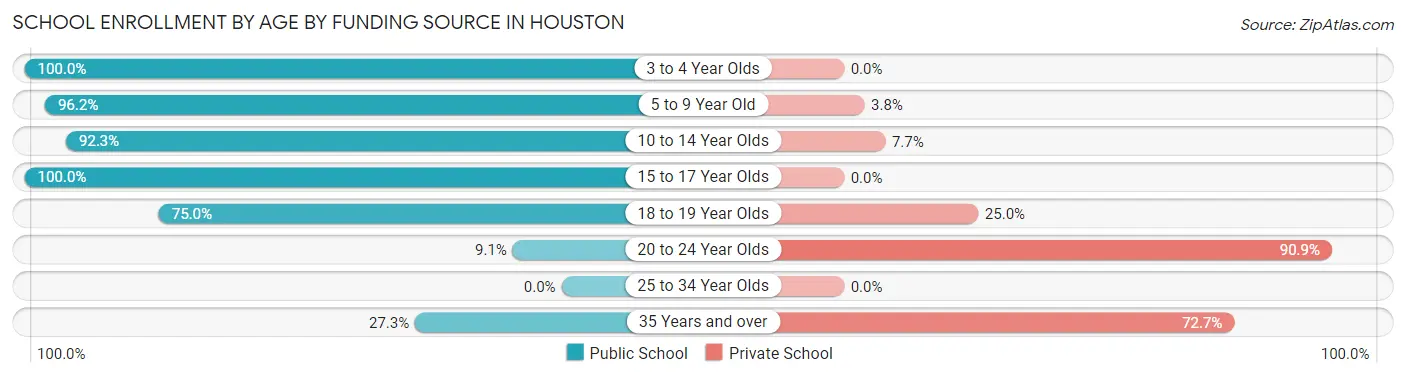
| Age Bracket | Public School | Private School |
| 3 to 4 Year Olds | 4 (100.0%) | 0 (0.0%) |
| 5 to 9 Year Old | 76 (96.2%) | 3 (3.8%) |
| 10 to 14 Year Olds | 72 (92.3%) | 6 (7.7%) |
| 15 to 17 Year Olds | 48 (100.0%) | 0 (0.0%) |
| 18 to 19 Year Olds | 12 (75.0%) | 4 (25.0%) |
| 20 to 24 Year Olds | 1 (9.1%) | 10 (90.9%) |
| 25 to 34 Year Olds | 0 (0.0%) | 0 (0.0%) |
| 35 Years and over | 3 (27.3%) | 8 (72.7%) |
| Total | 216 (87.4%) | 31 (12.6%) |
Educational Attainment by Field of Study in Houston
Education (30 | 18.1%), arts & humanities (21 | 12.7%), science & technology (19 | 11.5%), liberal arts & history (17 | 10.2%), and computers & mathematics (15 | 9.0%) are the most common fields of study among 166 individuals in Houston who have obtained a bachelor's degree or higher.
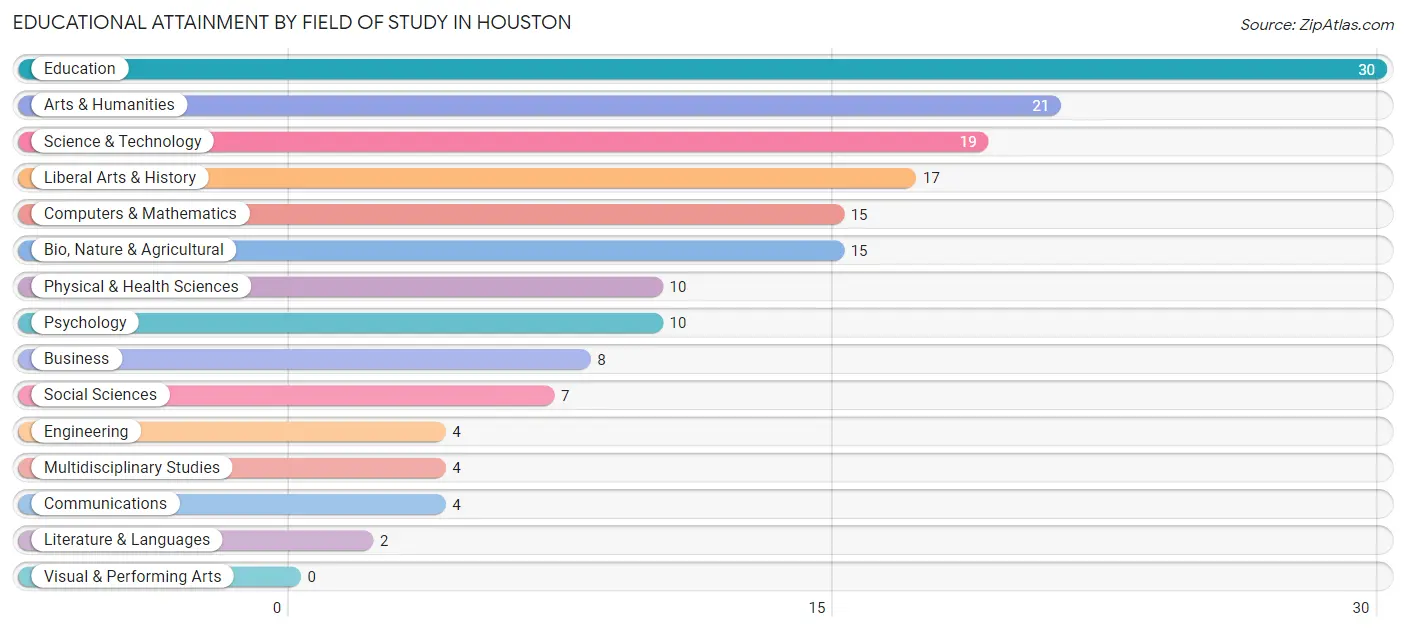
| Field of Study | # Graduates | % Graduates |
| Computers & Mathematics | 15 | 9.0% |
| Bio, Nature & Agricultural | 15 | 9.0% |
| Physical & Health Sciences | 10 | 6.0% |
| Psychology | 10 | 6.0% |
| Social Sciences | 7 | 4.2% |
| Engineering | 4 | 2.4% |
| Multidisciplinary Studies | 4 | 2.4% |
| Science & Technology | 19 | 11.5% |
| Business | 8 | 4.8% |
| Education | 30 | 18.1% |
| Literature & Languages | 2 | 1.2% |
| Liberal Arts & History | 17 | 10.2% |
| Visual & Performing Arts | 0 | 0.0% |
| Communications | 4 | 2.4% |
| Arts & Humanities | 21 | 12.7% |
| Total | 166 | 100.0% |
Transportation & Commute in Houston
Vehicle Availability by Sex in Houston
The most prevalent vehicle ownership categories in Houston are males with 2 vehicles (144, accounting for 34.2%) and females with 2 vehicles (94, making up 53.1%).
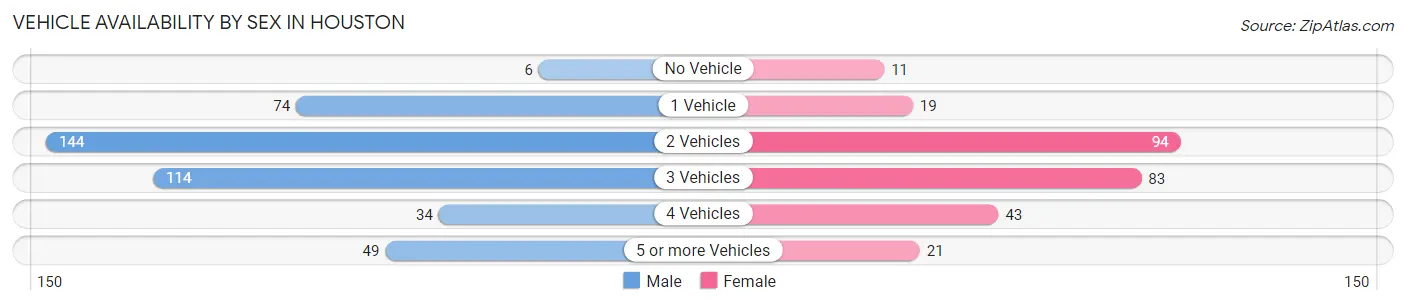
| Vehicles Available | Male | Female |
| No Vehicle | 6 (1.4%) | 11 (4.1%) |
| 1 Vehicle | 74 (17.6%) | 19 (7.0%) |
| 2 Vehicles | 144 (34.2%) | 94 (34.7%) |
| 3 Vehicles | 114 (27.1%) | 83 (30.6%) |
| 4 Vehicles | 34 (8.1%) | 43 (15.9%) |
| 5 or more Vehicles | 49 (11.6%) | 21 (7.7%) |
| Total | 421 (100.0%) | 271 (100.0%) |
Commute Time in Houston
The most frequently occuring commute durations in Houston are 90 or more minutes (105 commuters, 17.2%), 20 to 24 minutes (78 commuters, 12.8%), and 45 to 59 minutes (74 commuters, 12.1%).
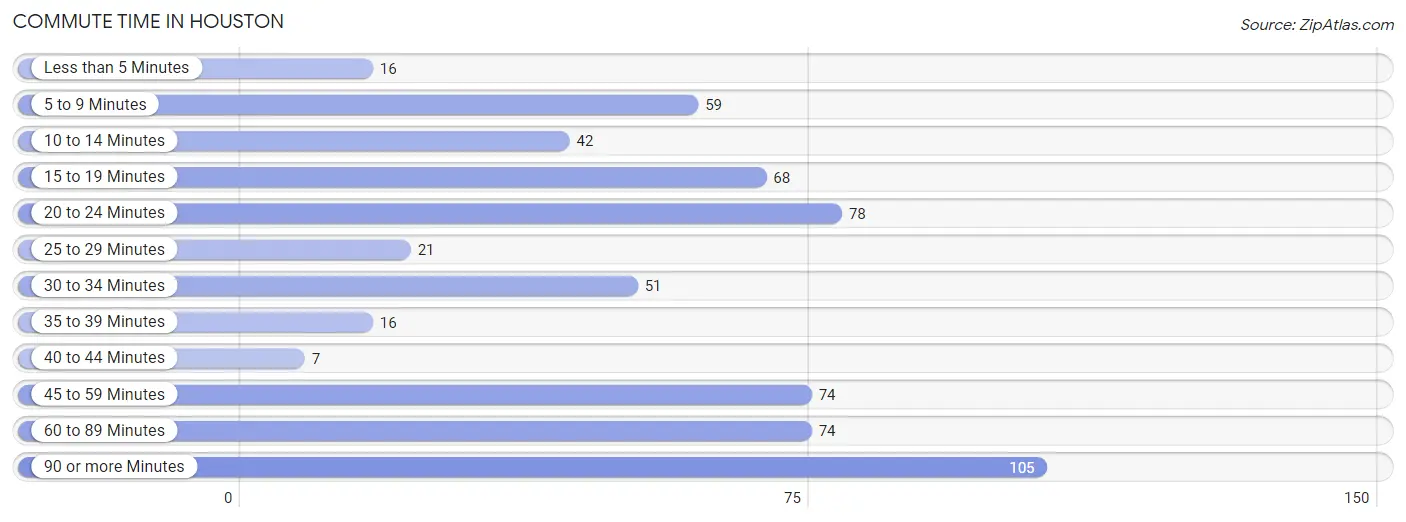
| Commute Time | # Commuters | % Commuters |
| Less than 5 Minutes | 16 | 2.6% |
| 5 to 9 Minutes | 59 | 9.7% |
| 10 to 14 Minutes | 42 | 6.9% |
| 15 to 19 Minutes | 68 | 11.1% |
| 20 to 24 Minutes | 78 | 12.8% |
| 25 to 29 Minutes | 21 | 3.4% |
| 30 to 34 Minutes | 51 | 8.4% |
| 35 to 39 Minutes | 16 | 2.6% |
| 40 to 44 Minutes | 7 | 1.1% |
| 45 to 59 Minutes | 74 | 12.1% |
| 60 to 89 Minutes | 74 | 12.1% |
| 90 or more Minutes | 105 | 17.2% |
Commute Time by Sex in Houston
The most common commute times in Houston are 90 or more minutes (94 commuters, 24.8%) for males and 15 to 19 minutes (39 commuters, 16.8%) for females.
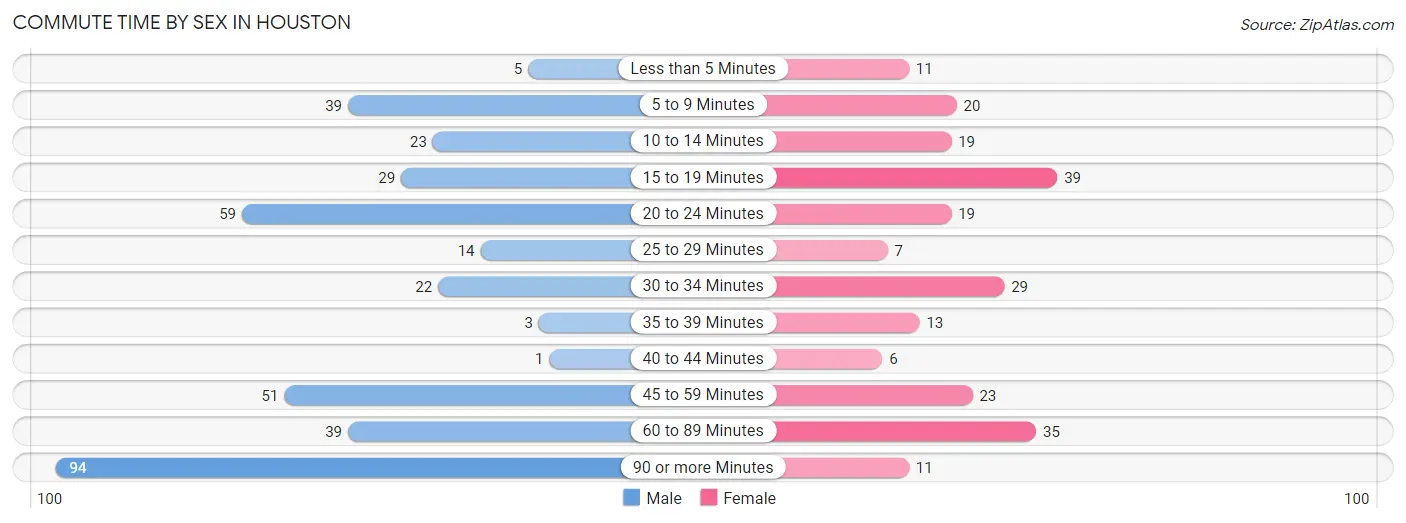
| Commute Time | Male | Female |
| Less than 5 Minutes | 5 (1.3%) | 11 (4.7%) |
| 5 to 9 Minutes | 39 (10.3%) | 20 (8.6%) |
| 10 to 14 Minutes | 23 (6.1%) | 19 (8.2%) |
| 15 to 19 Minutes | 29 (7.6%) | 39 (16.8%) |
| 20 to 24 Minutes | 59 (15.6%) | 19 (8.2%) |
| 25 to 29 Minutes | 14 (3.7%) | 7 (3.0%) |
| 30 to 34 Minutes | 22 (5.8%) | 29 (12.5%) |
| 35 to 39 Minutes | 3 (0.8%) | 13 (5.6%) |
| 40 to 44 Minutes | 1 (0.3%) | 6 (2.6%) |
| 45 to 59 Minutes | 51 (13.5%) | 23 (9.9%) |
| 60 to 89 Minutes | 39 (10.3%) | 35 (15.1%) |
| 90 or more Minutes | 94 (24.8%) | 11 (4.7%) |
Time of Departure to Work by Sex in Houston
The most frequent times of departure to work in Houston are 12:00 AM to 4:59 AM (59, 15.6%) for males and 7:30 AM to 7:59 AM (65, 28.0%) for females.
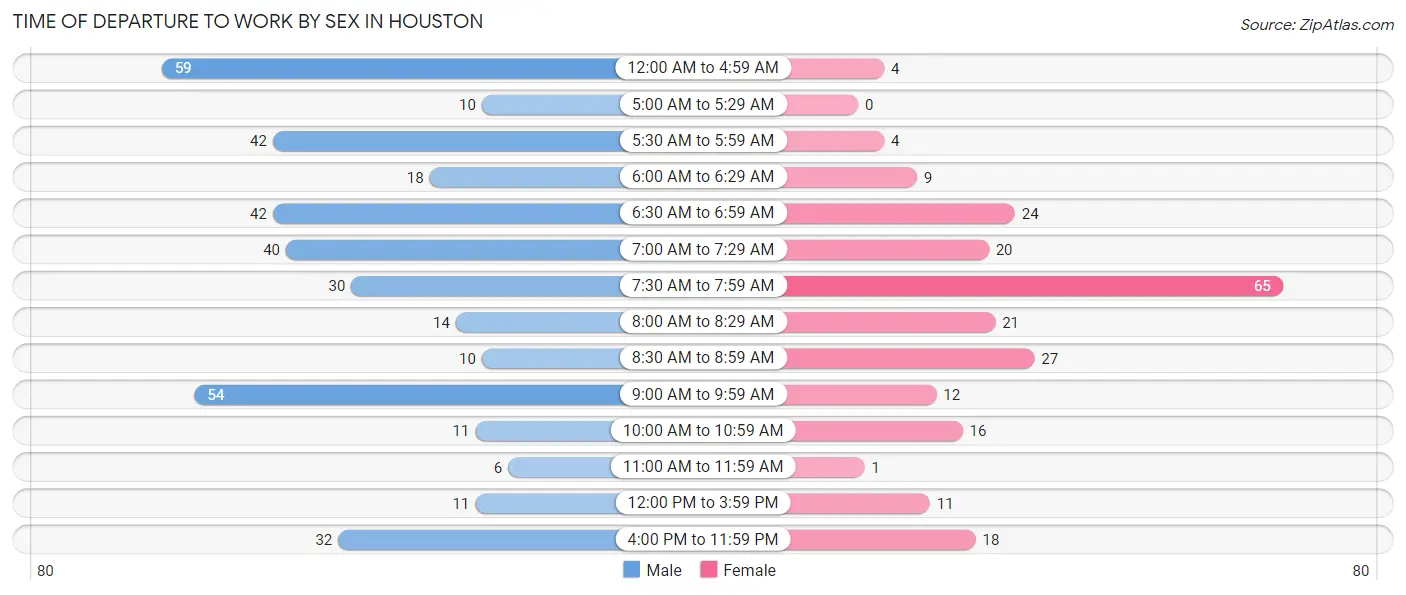
| Time of Departure | Male | Female |
| 12:00 AM to 4:59 AM | 59 (15.6%) | 4 (1.7%) |
| 5:00 AM to 5:29 AM | 10 (2.6%) | 0 (0.0%) |
| 5:30 AM to 5:59 AM | 42 (11.1%) | 4 (1.7%) |
| 6:00 AM to 6:29 AM | 18 (4.8%) | 9 (3.9%) |
| 6:30 AM to 6:59 AM | 42 (11.1%) | 24 (10.3%) |
| 7:00 AM to 7:29 AM | 40 (10.5%) | 20 (8.6%) |
| 7:30 AM to 7:59 AM | 30 (7.9%) | 65 (28.0%) |
| 8:00 AM to 8:29 AM | 14 (3.7%) | 21 (9.0%) |
| 8:30 AM to 8:59 AM | 10 (2.6%) | 27 (11.6%) |
| 9:00 AM to 9:59 AM | 54 (14.2%) | 12 (5.2%) |
| 10:00 AM to 10:59 AM | 11 (2.9%) | 16 (6.9%) |
| 11:00 AM to 11:59 AM | 6 (1.6%) | 1 (0.4%) |
| 12:00 PM to 3:59 PM | 11 (2.9%) | 11 (4.7%) |
| 4:00 PM to 11:59 PM | 32 (8.4%) | 18 (7.8%) |
| Total | 379 (100.0%) | 232 (100.0%) |
Housing Occupancy in Houston
Occupancy by Ownership in Houston
Of the total 726 dwellings in Houston, owner-occupied units account for 526 (72.5%), while renter-occupied units make up 200 (27.6%).
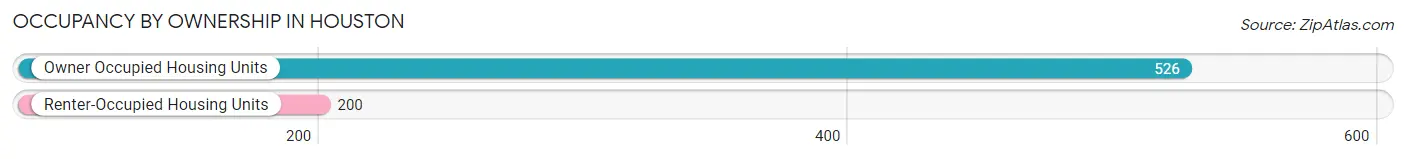
| Occupancy | # Housing Units | % Housing Units |
| Owner Occupied Housing Units | 526 | 72.5% |
| Renter-Occupied Housing Units | 200 | 27.6% |
| Total Occupied Housing Units | 726 | 100.0% |
Occupancy by Household Size in Houston
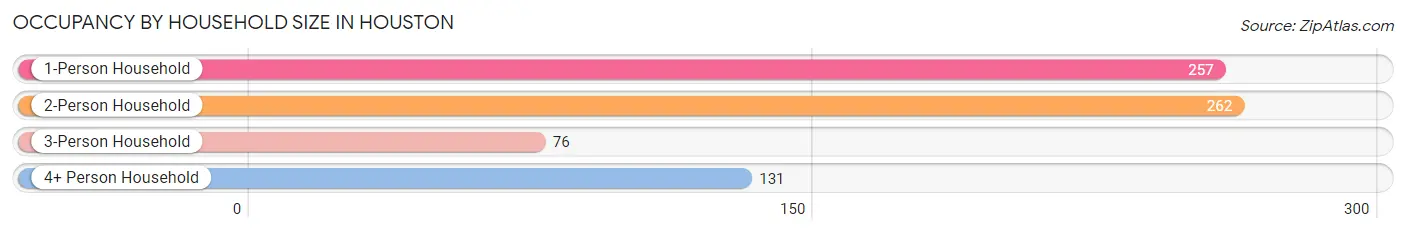
| Household Size | # Housing Units | % Housing Units |
| 1-Person Household | 257 | 35.4% |
| 2-Person Household | 262 | 36.1% |
| 3-Person Household | 76 | 10.5% |
| 4+ Person Household | 131 | 18.0% |
| Total Housing Units | 726 | 100.0% |
Occupancy by Ownership by Household Size in Houston
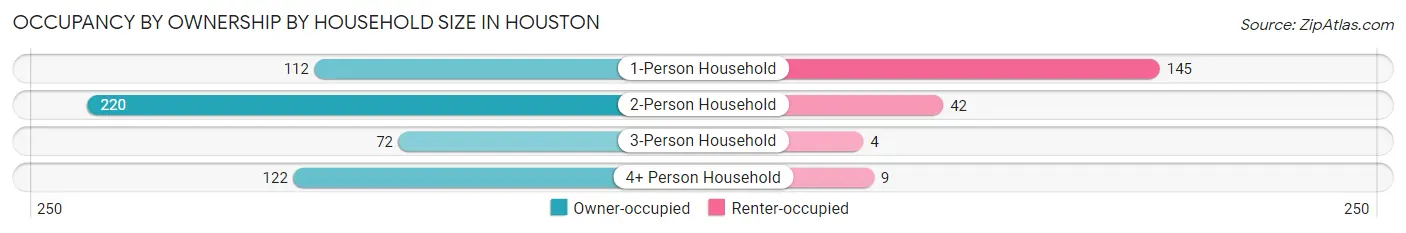
| Household Size | Owner-occupied | Renter-occupied |
| 1-Person Household | 112 (43.6%) | 145 (56.4%) |
| 2-Person Household | 220 (84.0%) | 42 (16.0%) |
| 3-Person Household | 72 (94.7%) | 4 (5.3%) |
| 4+ Person Household | 122 (93.1%) | 9 (6.9%) |
| Total Housing Units | 526 (72.5%) | 200 (27.6%) |
Occupancy by Educational Attainment in Houston
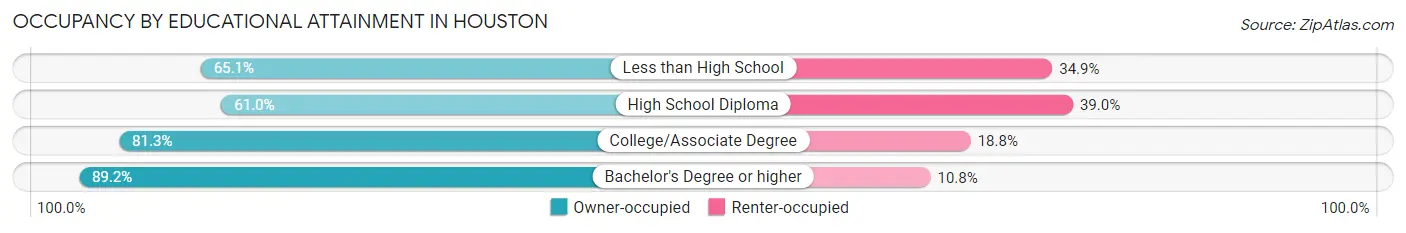
| Household Size | Owner-occupied | Renter-occupied |
| Less than High School | 41 (65.1%) | 22 (34.9%) |
| High School Diploma | 186 (61.0%) | 119 (39.0%) |
| College/Associate Degree | 208 (81.2%) | 48 (18.8%) |
| Bachelor's Degree or higher | 91 (89.2%) | 11 (10.8%) |
Occupancy by Age of Householder in Houston
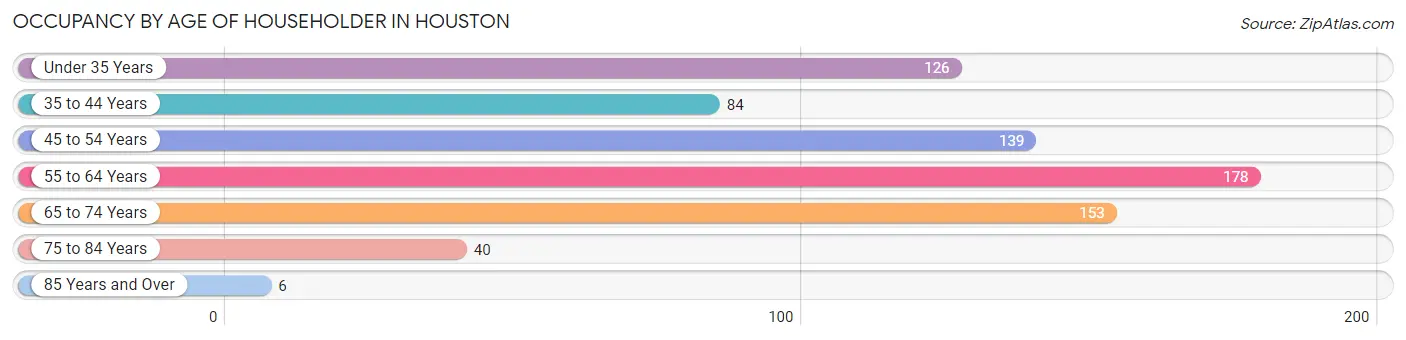
| Age Bracket | # Households | % Households |
| Under 35 Years | 126 | 17.4% |
| 35 to 44 Years | 84 | 11.6% |
| 45 to 54 Years | 139 | 19.2% |
| 55 to 64 Years | 178 | 24.5% |
| 65 to 74 Years | 153 | 21.1% |
| 75 to 84 Years | 40 | 5.5% |
| 85 Years and Over | 6 | 0.8% |
| Total | 726 | 100.0% |
Housing Finances in Houston
Median Income by Occupancy in Houston
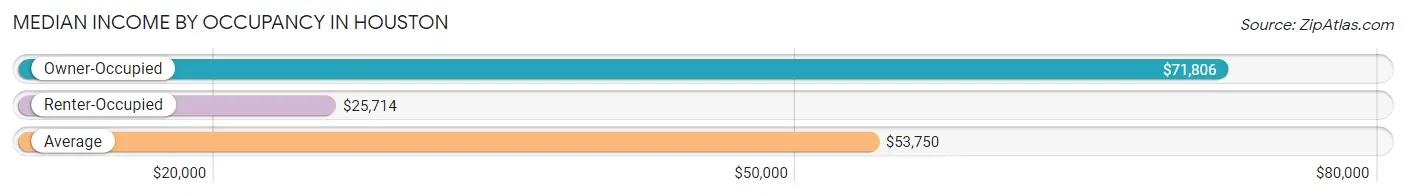
| Occupancy Type | # Households | Median Income |
| Owner-Occupied | 526 (72.5%) | $71,806 |
| Renter-Occupied | 200 (27.6%) | $25,714 |
| Average | 726 (100.0%) | $53,750 |
Occupancy by Householder Income Bracket in Houston
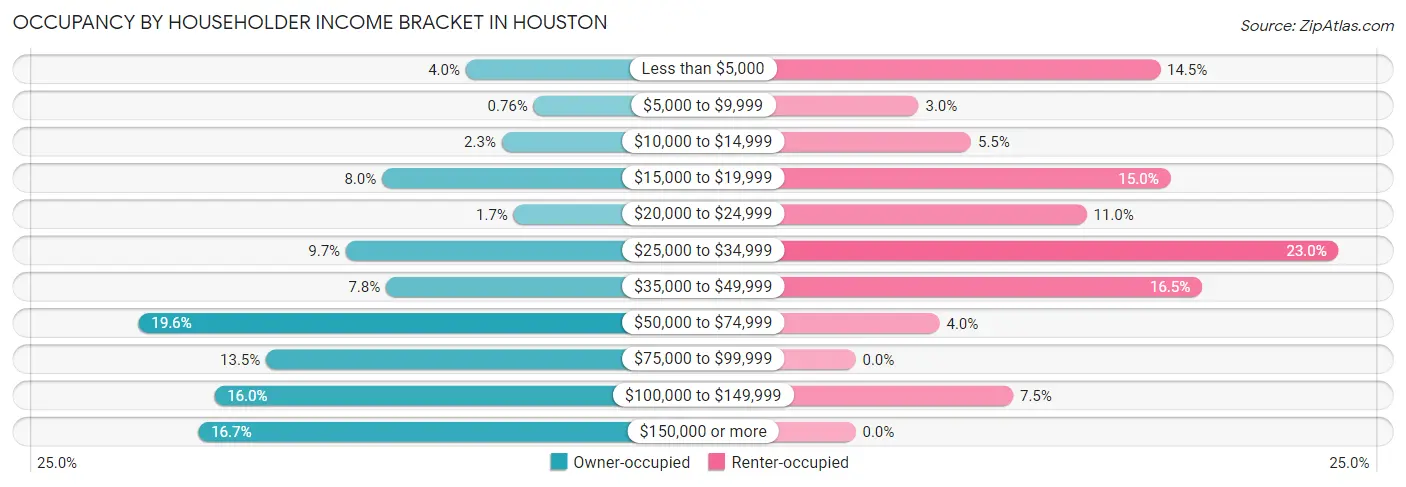
| Income Bracket | Owner-occupied | Renter-occupied |
| Less than $5,000 | 21 (4.0%) | 29 (14.5%) |
| $5,000 to $9,999 | 4 (0.8%) | 6 (3.0%) |
| $10,000 to $14,999 | 12 (2.3%) | 11 (5.5%) |
| $15,000 to $19,999 | 42 (8.0%) | 30 (15.0%) |
| $20,000 to $24,999 | 9 (1.7%) | 22 (11.0%) |
| $25,000 to $34,999 | 51 (9.7%) | 46 (23.0%) |
| $35,000 to $49,999 | 41 (7.8%) | 33 (16.5%) |
| $50,000 to $74,999 | 103 (19.6%) | 8 (4.0%) |
| $75,000 to $99,999 | 71 (13.5%) | 0 (0.0%) |
| $100,000 to $149,999 | 84 (16.0%) | 15 (7.5%) |
| $150,000 or more | 88 (16.7%) | 0 (0.0%) |
| Total | 526 (100.0%) | 200 (100.0%) |
Monthly Housing Cost Tiers in Houston
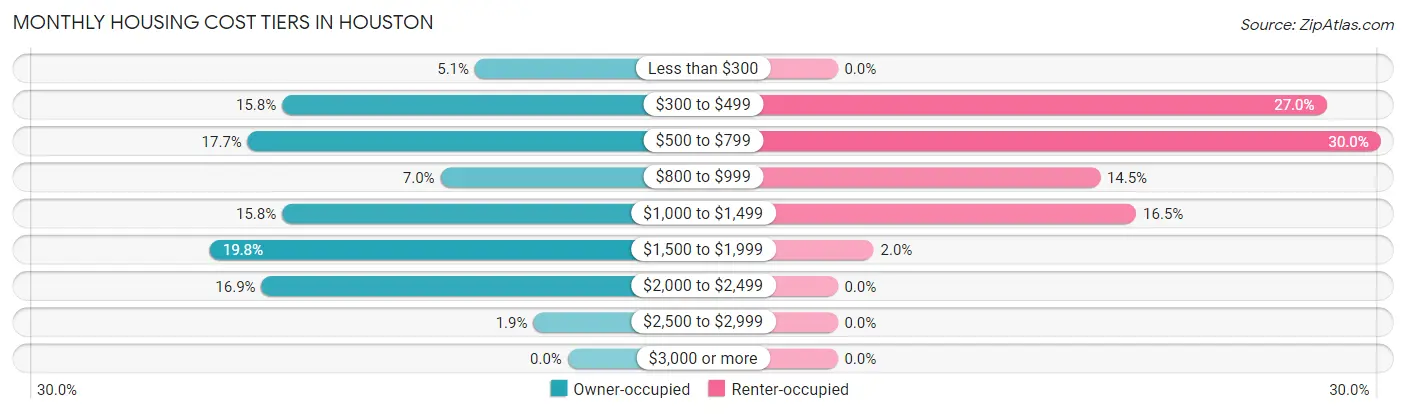
| Monthly Cost | Owner-occupied | Renter-occupied |
| Less than $300 | 27 (5.1%) | 0 (0.0%) |
| $300 to $499 | 83 (15.8%) | 54 (27.0%) |
| $500 to $799 | 93 (17.7%) | 60 (30.0%) |
| $800 to $999 | 37 (7.0%) | 29 (14.5%) |
| $1,000 to $1,499 | 83 (15.8%) | 33 (16.5%) |
| $1,500 to $1,999 | 104 (19.8%) | 4 (2.0%) |
| $2,000 to $2,499 | 89 (16.9%) | 0 (0.0%) |
| $2,500 to $2,999 | 10 (1.9%) | 0 (0.0%) |
| $3,000 or more | 0 (0.0%) | 0 (0.0%) |
| Total | 526 (100.0%) | 200 (100.0%) |
Physical Housing Characteristics in Houston
Housing Structures in Houston
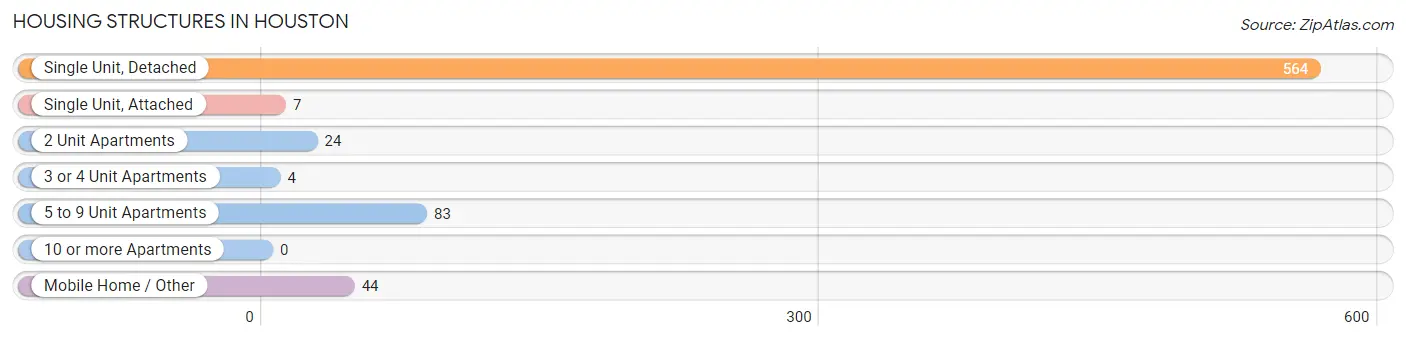
| Structure Type | # Housing Units | % Housing Units |
| Single Unit, Detached | 564 | 77.7% |
| Single Unit, Attached | 7 | 1.0% |
| 2 Unit Apartments | 24 | 3.3% |
| 3 or 4 Unit Apartments | 4 | 0.5% |
| 5 to 9 Unit Apartments | 83 | 11.4% |
| 10 or more Apartments | 0 | 0.0% |
| Mobile Home / Other | 44 | 6.1% |
| Total | 726 | 100.0% |
Housing Structures by Occupancy in Houston
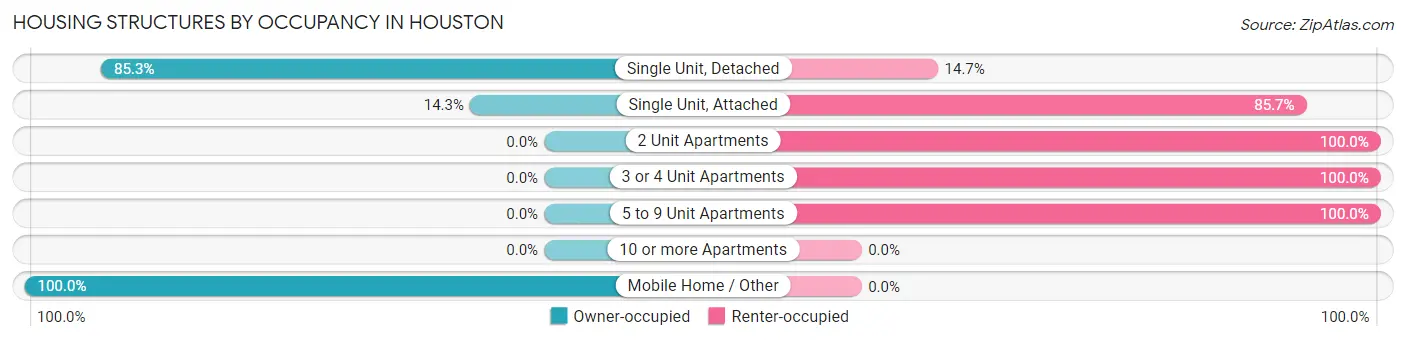
| Structure Type | Owner-occupied | Renter-occupied |
| Single Unit, Detached | 481 (85.3%) | 83 (14.7%) |
| Single Unit, Attached | 1 (14.3%) | 6 (85.7%) |
| 2 Unit Apartments | 0 (0.0%) | 24 (100.0%) |
| 3 or 4 Unit Apartments | 0 (0.0%) | 4 (100.0%) |
| 5 to 9 Unit Apartments | 0 (0.0%) | 83 (100.0%) |
| 10 or more Apartments | 0 (0.0%) | 0 (0.0%) |
| Mobile Home / Other | 44 (100.0%) | 0 (0.0%) |
| Total | 526 (72.5%) | 200 (27.6%) |
Housing Structures by Number of Rooms in Houston
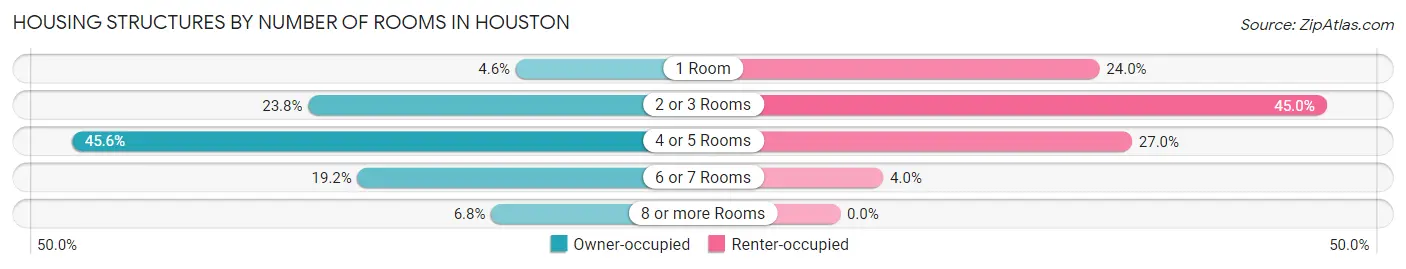
| Number of Rooms | Owner-occupied | Renter-occupied |
| 1 Room | 24 (4.6%) | 48 (24.0%) |
| 2 or 3 Rooms | 125 (23.8%) | 90 (45.0%) |
| 4 or 5 Rooms | 240 (45.6%) | 54 (27.0%) |
| 6 or 7 Rooms | 101 (19.2%) | 8 (4.0%) |
| 8 or more Rooms | 36 (6.8%) | 0 (0.0%) |
| Total | 526 (100.0%) | 200 (100.0%) |
Housing Structure by Heating Type in Houston
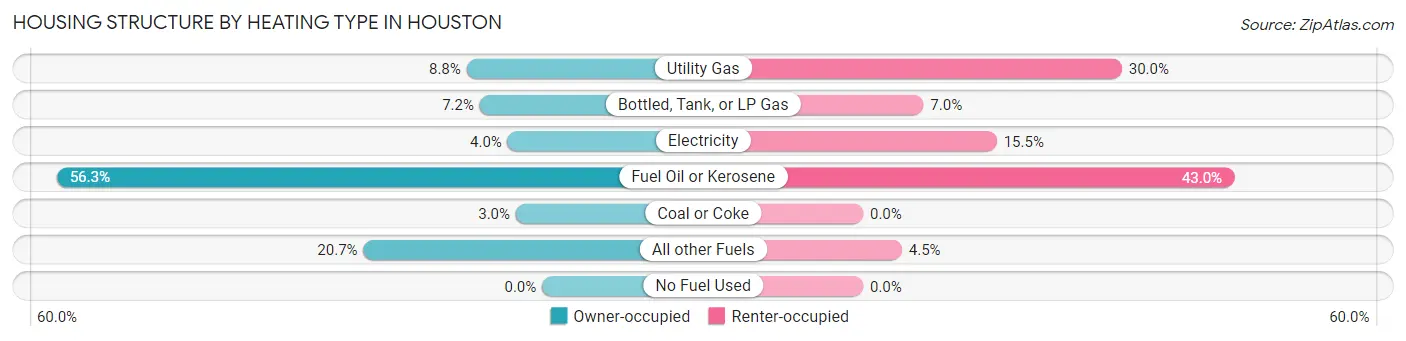
| Heating Type | Owner-occupied | Renter-occupied |
| Utility Gas | 46 (8.7%) | 60 (30.0%) |
| Bottled, Tank, or LP Gas | 38 (7.2%) | 14 (7.0%) |
| Electricity | 21 (4.0%) | 31 (15.5%) |
| Fuel Oil or Kerosene | 296 (56.3%) | 86 (43.0%) |
| Coal or Coke | 16 (3.0%) | 0 (0.0%) |
| All other Fuels | 109 (20.7%) | 9 (4.5%) |
| No Fuel Used | 0 (0.0%) | 0 (0.0%) |
| Total | 526 (100.0%) | 200 (100.0%) |
Household Vehicle Usage in Houston
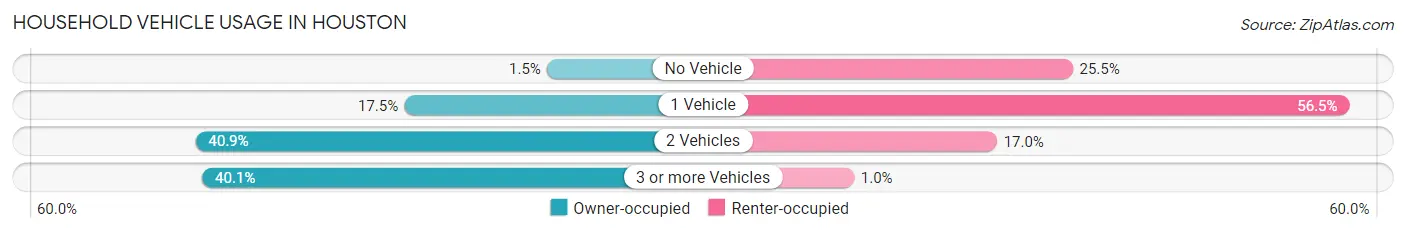
| Vehicles per Household | Owner-occupied | Renter-occupied |
| No Vehicle | 8 (1.5%) | 51 (25.5%) |
| 1 Vehicle | 92 (17.5%) | 113 (56.5%) |
| 2 Vehicles | 215 (40.9%) | 34 (17.0%) |
| 3 or more Vehicles | 211 (40.1%) | 2 (1.0%) |
| Total | 526 (100.0%) | 200 (100.0%) |
Real Estate & Mortgages in Houston
Real Estate and Mortgage Overview in Houston
| Characteristic | Without Mortgage | With Mortgage |
| Housing Units | 230 | 296 |
| Median Property Value | $167,600 | $238,000 |
| Median Household Income | $55,000 | $60 |
| Monthly Housing Costs | $541 | $0 |
| Real Estate Taxes | $1,486 | $24 |
Property Value by Mortgage Status in Houston
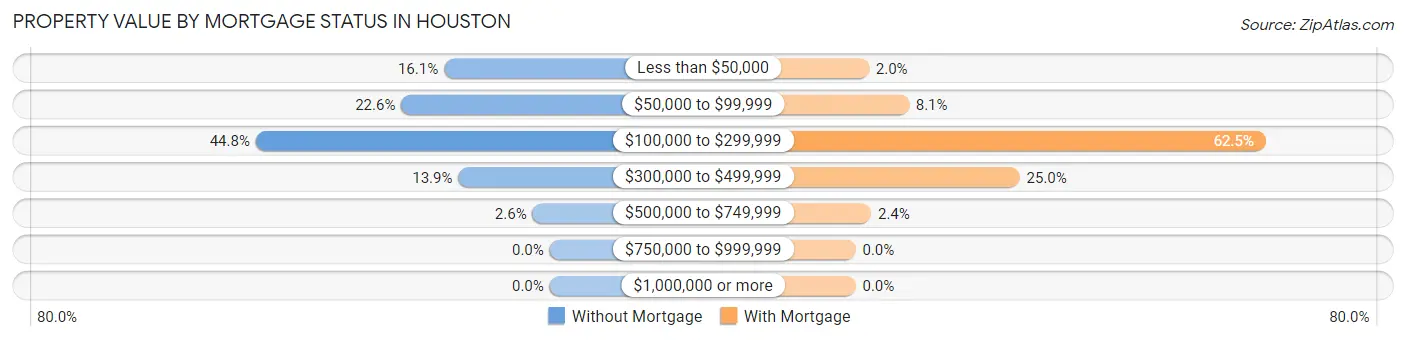
| Property Value | Without Mortgage | With Mortgage |
| Less than $50,000 | 37 (16.1%) | 6 (2.0%) |
| $50,000 to $99,999 | 52 (22.6%) | 24 (8.1%) |
| $100,000 to $299,999 | 103 (44.8%) | 185 (62.5%) |
| $300,000 to $499,999 | 32 (13.9%) | 74 (25.0%) |
| $500,000 to $749,999 | 6 (2.6%) | 7 (2.4%) |
| $750,000 to $999,999 | 0 (0.0%) | 0 (0.0%) |
| $1,000,000 or more | 0 (0.0%) | 0 (0.0%) |
| Total | 230 (100.0%) | 296 (100.0%) |
Household Income by Mortgage Status in Houston
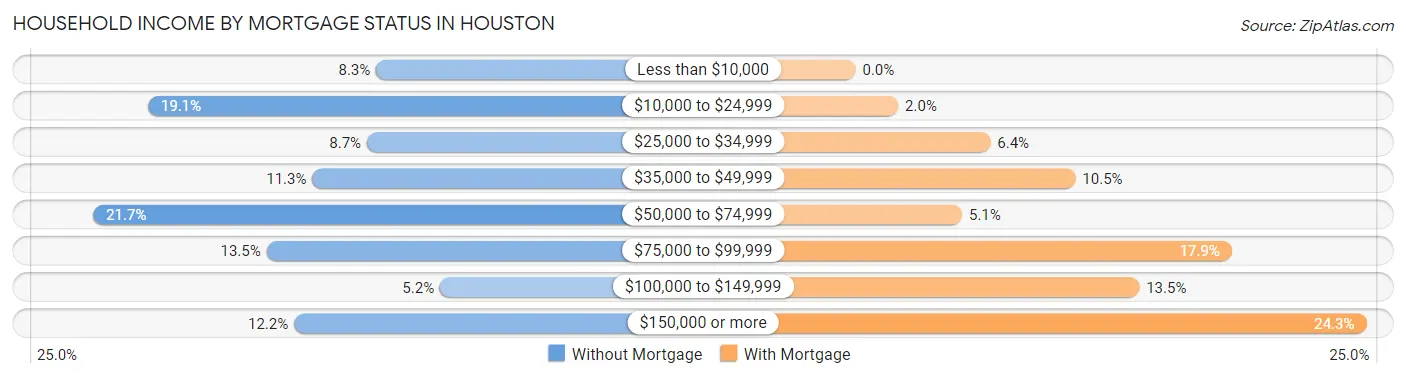
| Household Income | Without Mortgage | With Mortgage |
| Less than $10,000 | 19 (8.3%) | 0 (0.0%) |
| $10,000 to $24,999 | 44 (19.1%) | 6 (2.0%) |
| $25,000 to $34,999 | 20 (8.7%) | 19 (6.4%) |
| $35,000 to $49,999 | 26 (11.3%) | 31 (10.5%) |
| $50,000 to $74,999 | 50 (21.7%) | 15 (5.1%) |
| $75,000 to $99,999 | 31 (13.5%) | 53 (17.9%) |
| $100,000 to $149,999 | 12 (5.2%) | 40 (13.5%) |
| $150,000 or more | 28 (12.2%) | 72 (24.3%) |
| Total | 230 (100.0%) | 296 (100.0%) |
Property Value to Household Income Ratio in Houston
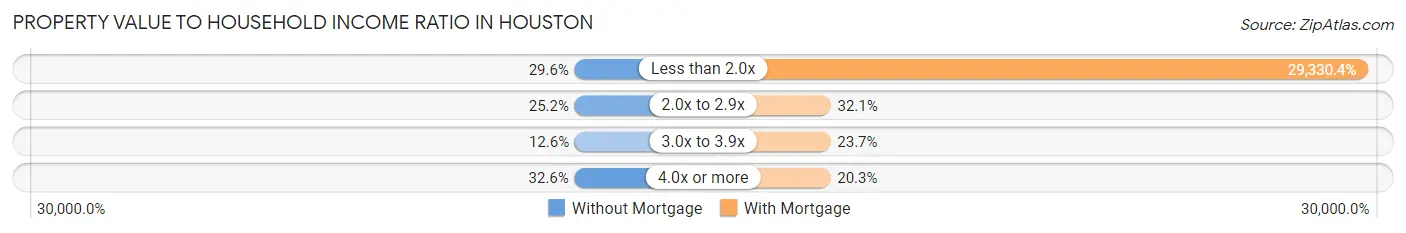
| Value-to-Income Ratio | Without Mortgage | With Mortgage |
| Less than 2.0x | 68 (29.6%) | 86,818 (29,330.4%) |
| 2.0x to 2.9x | 58 (25.2%) | 95 (32.1%) |
| 3.0x to 3.9x | 29 (12.6%) | 70 (23.6%) |
| 4.0x or more | 75 (32.6%) | 60 (20.3%) |
| Total | 230 (100.0%) | 296 (100.0%) |
Real Estate Taxes by Mortgage Status in Houston
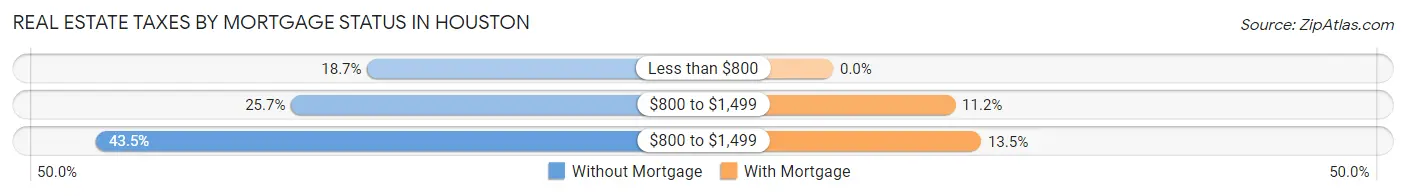
| Property Taxes | Without Mortgage | With Mortgage |
| Less than $800 | 43 (18.7%) | 0 (0.0%) |
| $800 to $1,499 | 59 (25.7%) | 33 (11.2%) |
| $800 to $1,499 | 100 (43.5%) | 40 (13.5%) |
| Total | 230 (100.0%) | 296 (100.0%) |
Health & Disability in Houston
Health Insurance Coverage by Age in Houston
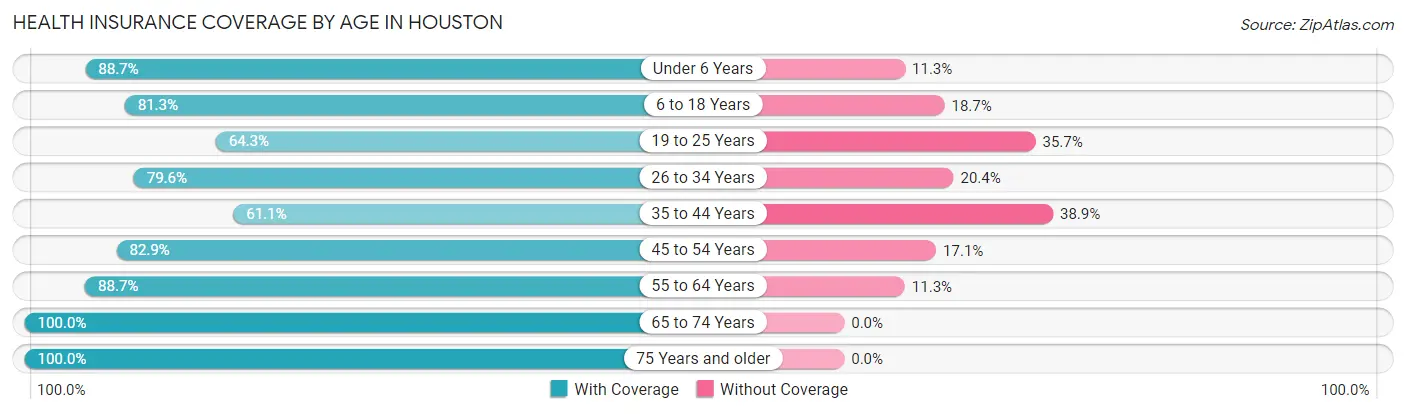
| Age Bracket | With Coverage | Without Coverage |
| Under 6 Years | 86 (88.7%) | 11 (11.3%) |
| 6 to 18 Years | 161 (81.3%) | 37 (18.7%) |
| 19 to 25 Years | 83 (64.3%) | 46 (35.7%) |
| 26 to 34 Years | 172 (79.6%) | 44 (20.4%) |
| 35 to 44 Years | 91 (61.1%) | 58 (38.9%) |
| 45 to 54 Years | 208 (82.9%) | 43 (17.1%) |
| 55 to 64 Years | 267 (88.7%) | 34 (11.3%) |
| 65 to 74 Years | 214 (100.0%) | 0 (0.0%) |
| 75 Years and older | 54 (100.0%) | 0 (0.0%) |
| Total | 1,336 (83.0%) | 273 (17.0%) |
Health Insurance Coverage by Citizenship Status in Houston
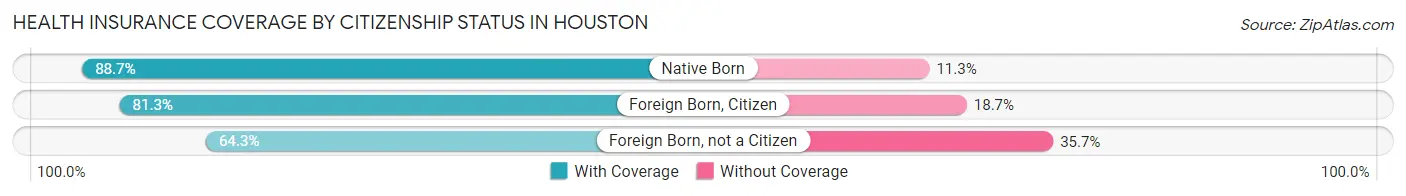
| Citizenship Status | With Coverage | Without Coverage |
| Native Born | 86 (88.7%) | 11 (11.3%) |
| Foreign Born, Citizen | 161 (81.3%) | 37 (18.7%) |
| Foreign Born, not a Citizen | 83 (64.3%) | 46 (35.7%) |
Health Insurance Coverage by Household Income in Houston
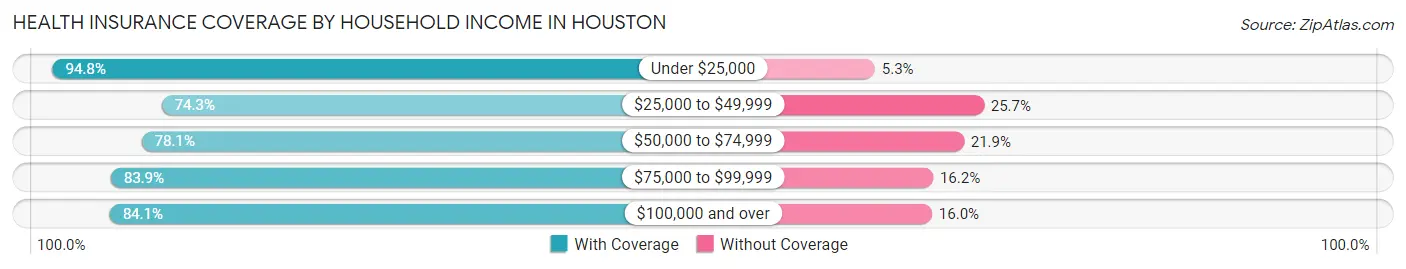
| Household Income | With Coverage | Without Coverage |
| Under $25,000 | 289 (94.8%) | 16 (5.2%) |
| $25,000 to $49,999 | 278 (74.3%) | 96 (25.7%) |
| $50,000 to $74,999 | 171 (78.1%) | 48 (21.9%) |
| $75,000 to $99,999 | 161 (83.9%) | 31 (16.2%) |
| $100,000 and over | 432 (84.1%) | 82 (16.0%) |
Public vs Private Health Insurance Coverage by Age in Houston
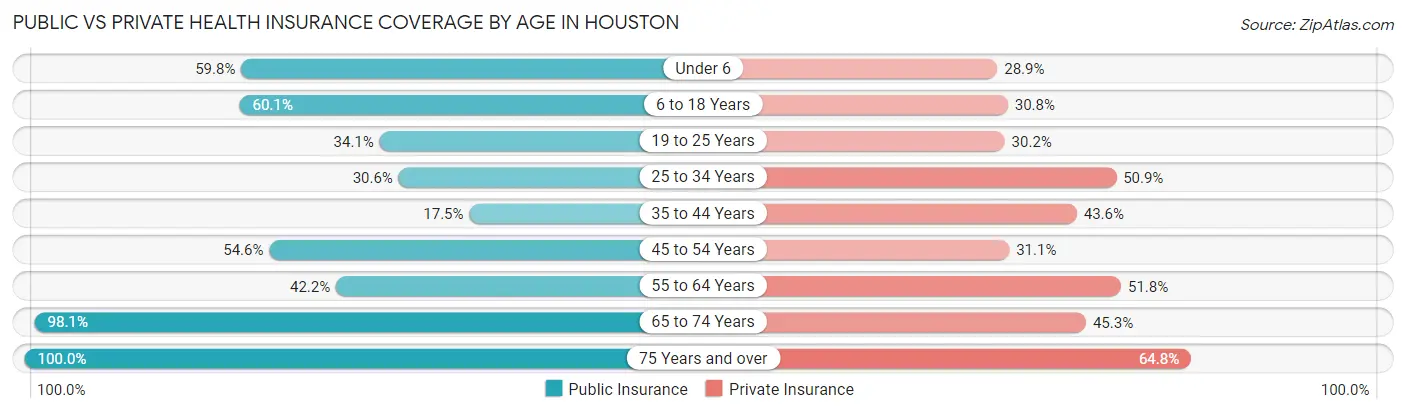
| Age Bracket | Public Insurance | Private Insurance |
| Under 6 | 58 (59.8%) | 28 (28.9%) |
| 6 to 18 Years | 119 (60.1%) | 61 (30.8%) |
| 19 to 25 Years | 44 (34.1%) | 39 (30.2%) |
| 25 to 34 Years | 66 (30.6%) | 110 (50.9%) |
| 35 to 44 Years | 26 (17.4%) | 65 (43.6%) |
| 45 to 54 Years | 137 (54.6%) | 78 (31.1%) |
| 55 to 64 Years | 127 (42.2%) | 156 (51.8%) |
| 65 to 74 Years | 210 (98.1%) | 97 (45.3%) |
| 75 Years and over | 54 (100.0%) | 35 (64.8%) |
| Total | 841 (52.3%) | 669 (41.6%) |
Disability Status by Sex by Age in Houston
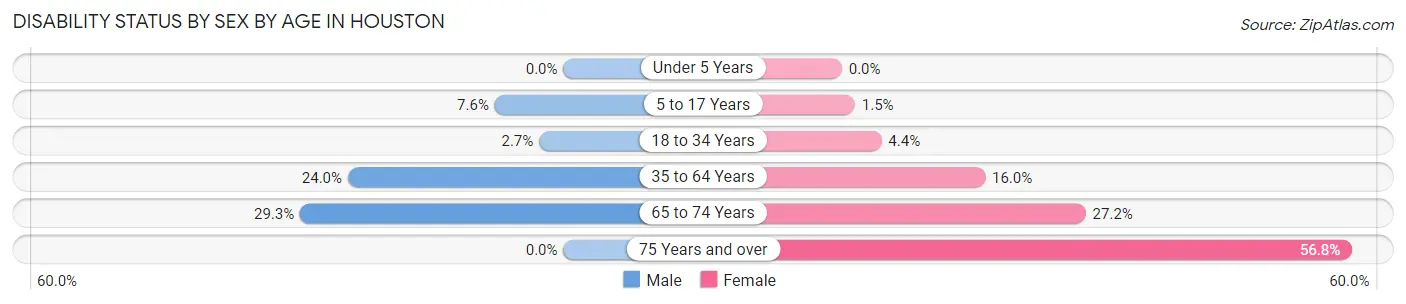
| Age Bracket | Male | Female |
| Under 5 Years | 0 (0.0%) | 0 (0.0%) |
| 5 to 17 Years | 11 (7.6%) | 1 (1.5%) |
| 18 to 34 Years | 6 (2.7%) | 6 (4.4%) |
| 35 to 64 Years | 90 (24.0%) | 52 (16.0%) |
| 65 to 74 Years | 39 (29.3%) | 22 (27.2%) |
| 75 Years and over | 0 (0.0%) | 25 (56.8%) |
Disability Class by Sex by Age in Houston
Disability Class: Hearing Difficulty
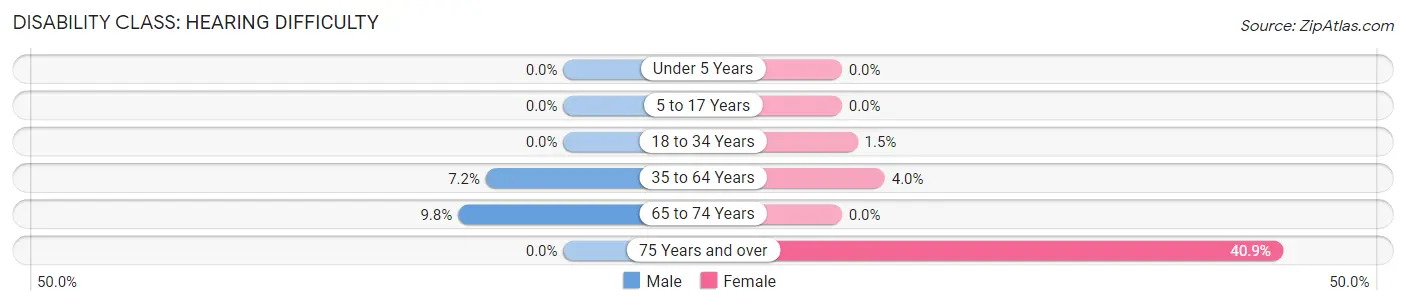
| Age Bracket | Male | Female |
| Under 5 Years | 0 (0.0%) | 0 (0.0%) |
| 5 to 17 Years | 0 (0.0%) | 0 (0.0%) |
| 18 to 34 Years | 0 (0.0%) | 2 (1.5%) |
| 35 to 64 Years | 27 (7.2%) | 13 (4.0%) |
| 65 to 74 Years | 13 (9.8%) | 0 (0.0%) |
| 75 Years and over | 0 (0.0%) | 18 (40.9%) |
Disability Class: Vision Difficulty
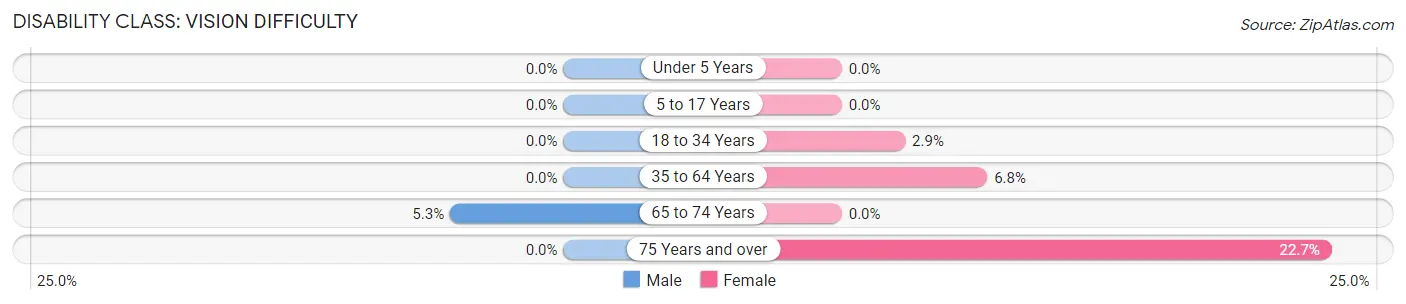
| Age Bracket | Male | Female |
| Under 5 Years | 0 (0.0%) | 0 (0.0%) |
| 5 to 17 Years | 0 (0.0%) | 0 (0.0%) |
| 18 to 34 Years | 0 (0.0%) | 4 (2.9%) |
| 35 to 64 Years | 0 (0.0%) | 22 (6.8%) |
| 65 to 74 Years | 7 (5.3%) | 0 (0.0%) |
| 75 Years and over | 0 (0.0%) | 10 (22.7%) |
Disability Class: Cognitive Difficulty
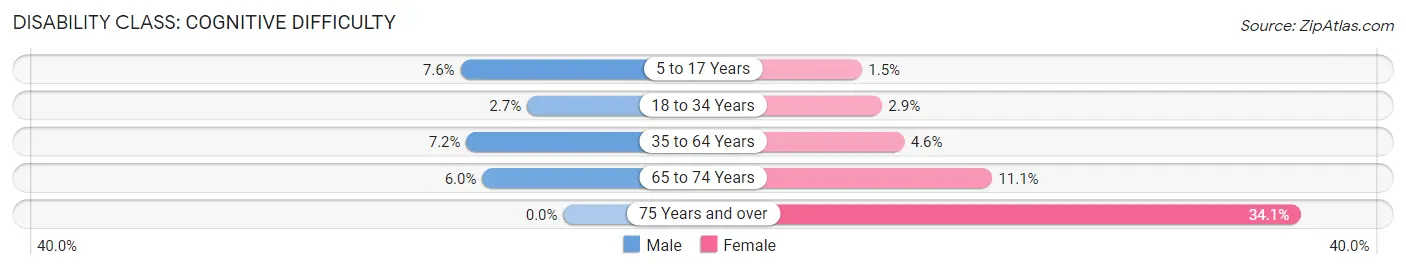
| Age Bracket | Male | Female |
| 5 to 17 Years | 11 (7.6%) | 1 (1.5%) |
| 18 to 34 Years | 6 (2.7%) | 4 (2.9%) |
| 35 to 64 Years | 27 (7.2%) | 15 (4.6%) |
| 65 to 74 Years | 8 (6.0%) | 9 (11.1%) |
| 75 Years and over | 0 (0.0%) | 15 (34.1%) |
Disability Class: Ambulatory Difficulty
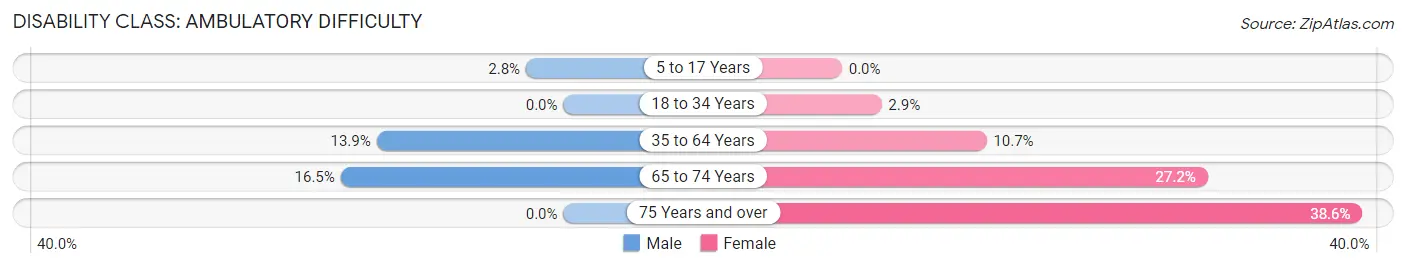
| Age Bracket | Male | Female |
| 5 to 17 Years | 4 (2.8%) | 0 (0.0%) |
| 18 to 34 Years | 0 (0.0%) | 4 (2.9%) |
| 35 to 64 Years | 52 (13.9%) | 35 (10.7%) |
| 65 to 74 Years | 22 (16.5%) | 22 (27.2%) |
| 75 Years and over | 0 (0.0%) | 17 (38.6%) |
Disability Class: Self-Care Difficulty
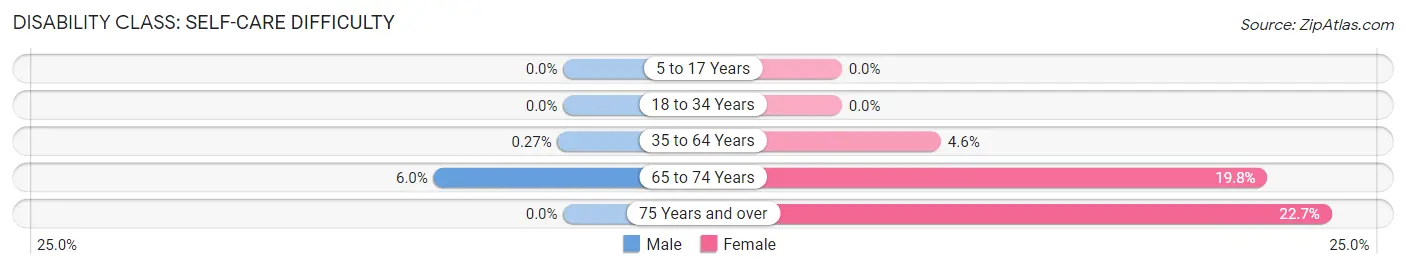
| Age Bracket | Male | Female |
| 5 to 17 Years | 0 (0.0%) | 0 (0.0%) |
| 18 to 34 Years | 0 (0.0%) | 0 (0.0%) |
| 35 to 64 Years | 1 (0.3%) | 15 (4.6%) |
| 65 to 74 Years | 8 (6.0%) | 16 (19.8%) |
| 75 Years and over | 0 (0.0%) | 10 (22.7%) |
Technology Access in Houston
Computing Device Access in Houston
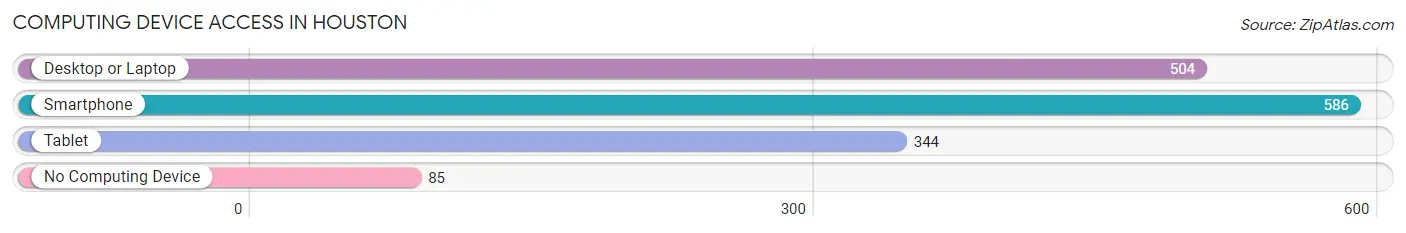
| Device Type | # Households | % Households |
| Desktop or Laptop | 504 | 69.4% |
| Smartphone | 586 | 80.7% |
| Tablet | 344 | 47.4% |
| No Computing Device | 85 | 11.7% |
| Total | 726 | 100.0% |
Internet Access in Houston
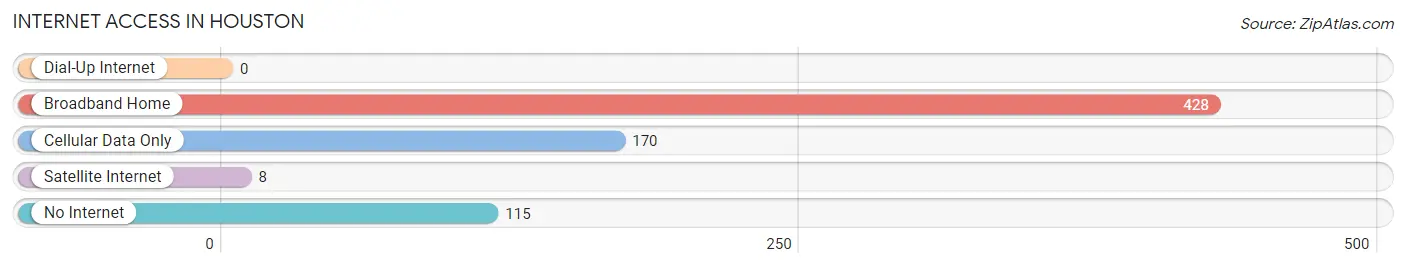
| Internet Type | # Households | % Households |
| Dial-Up Internet | 0 | 0.0% |
| Broadband Home | 428 | 59.0% |
| Cellular Data Only | 170 | 23.4% |
| Satellite Internet | 8 | 1.1% |
| No Internet | 115 | 15.8% |
| Total | 726 | 100.0% |
Houston Summary
Houston, Texas is the fourth largest city in the United States and the largest city in the state of Texas. It is located in the southeastern part of the state, along the Gulf Coast. Houston is the county seat of Harris County and is the economic and cultural center of the Houston–The Woodlands–Sugar Land metropolitan area, which is the fifth most populous metropolitan area in the United States.
History
Houston was founded in 1836 by two brothers, Augustus and John Allen, who named the city after the then-President of the Republic of Texas, Sam Houston. The city was incorporated in 1837 and quickly grew to become a major port and commercial center. In the late 19th century, Houston was a major railroad hub and the city’s economy was largely based on the cotton and lumber industries.
In 1901, the discovery of oil in nearby Spindletop Hill changed the city’s fortunes and made it a major center of the oil industry. The city’s population grew rapidly and by the mid-20th century, Houston had become a major center of industry, finance, and culture.
Geography
Houston is located in the southeastern part of Texas, along the Gulf Coast. The city is situated on the coastal plain of the Gulf of Mexico and is bordered by the Trinity River to the north and the San Jacinto River to the east. The city covers an area of 627 square miles and has a humid subtropical climate.
Economy
Houston is a major center of the oil and gas industry and is home to many of the world’s largest energy companies. The city is also a major center of the aerospace and biomedical industries and is home to the Johnson Space Center, the largest NASA facility in the world.
Houston is also a major center of finance and banking and is home to the headquarters of many major banks and financial institutions. The city is also a major center of trade and transportation and is home to the Port of Houston, the largest port in the United States.
Demographics
As of the 2010 census, the population of Houston was 2,099,451. The city is racially and ethnically diverse, with the largest racial/ethnic groups being White (44.8%), African American (25.9%), Hispanic or Latino (41.3%), and Asian (7.2%).
Houston is also home to a large immigrant population, with the largest immigrant groups being from Mexico (21.2%), India (3.2%), and Vietnam (2.2%). The city is also home to a large LGBT population, with an estimated 8.8% of the population identifying as LGBT.
Houston is a major center of education and is home to several major universities, including the University of Houston, Rice University, and Texas Southern University. The city is also home to several major museums, including the Museum of Fine Arts, Houston, and the Houston Museum of Natural Science.
Common Questions
What is Per Capita Income in Houston?
Per Capita income in Houston is $35,792.
What is the Median Family Income in Houston?
Median Family Income in Houston is $75,096.
What is the Median Household income in Houston?
Median Household Income in Houston is $53,750.
What is Income or Wage Gap in Houston?
Income or Wage Gap in Houston is 30.2%.
Women in Houston earn 69.8 cents for every dollar earned by a man.
What is Family Income Deficit in Houston?
Family Income Deficit in Houston is $9,397.
Families that are below poverty line in Houston earn $9,397 less on average than the poverty threshold level.
What is Inequality or Gini Index in Houston?
Inequality or Gini Index in Houston is 0.53.
What is the Total Population of Houston?
Total Population of Houston is 1,613.
What is the Total Male Population of Houston?
Total Male Population of Houston is 908.
What is the Total Female Population of Houston?
Total Female Population of Houston is 705.
What is the Ratio of Males per 100 Females in Houston?
There are 128.79 Males per 100 Females in Houston.
What is the Ratio of Females per 100 Males in Houston?
There are 77.64 Females per 100 Males in Houston.
What is the Median Population Age in Houston?
Median Population Age in Houston is 46.1 Years.
What is the Average Family Size in Houston
Average Family Size in Houston is 2.9 People.
What is the Average Household Size in Houston
Average Household Size in Houston is 2.2 People.
How Large is the Labor Force in Houston?
There are 796 People in the Labor Forcein in Houston.
What is the Percentage of People in the Labor Force in Houston?
58.3% of People are in the Labor Force in Houston.
What is the Unemployment Rate in Houston?
Unemployment Rate in Houston is 12.6%.