Tyonek, AK Map & Demographics
Tyonek Map
Tyonek Overview
$34,644
PER CAPITA INCOME
$64,375
AVG FAMILY INCOME
$42,159
AVG HOUSEHOLD INCOME
16.7%
WAGE / INCOME GAP [ % ]
83.3¢/ $1
WAGE / INCOME GAP [ $ ]
0.55
INEQUALITY / GINI INDEX
270
TOTAL POPULATION
163
MALE POPULATION
107
FEMALE POPULATION
152.34
MALES / 100 FEMALES
65.64
FEMALES / 100 MALES
34.5
MEDIAN AGE
3.4
AVG FAMILY SIZE
2.6
AVG HOUSEHOLD SIZE
162
LABOR FORCE [ PEOPLE ]
71.7%
PERCENT IN LABOR FORCE
20.3%
UNEMPLOYMENT RATE
Tyonek Zip Codes
Tyonek Area Codes
Income in Tyonek
Income Overview in Tyonek
Per Capita Income in Tyonek is $34,644, while median incomes of families and households are $64,375 and $42,159 respectively.
| Characteristic | Number | Measure |
| Per Capita Income | 270 | $34,644 |
| Median Family Income | 61 | $64,375 |
| Mean Family Income | 61 | $106,762 |
| Median Household Income | 105 | $42,159 |
| Mean Household Income | 105 | $79,156 |
| Income Deficit | 61 | $0 |
| Wage / Income Gap (%) | 270 | 16.73% |
| Wage / Income Gap ($) | 270 | 83.27¢ per $1 |
| Gini / Inequality Index | 270 | 0.55 |
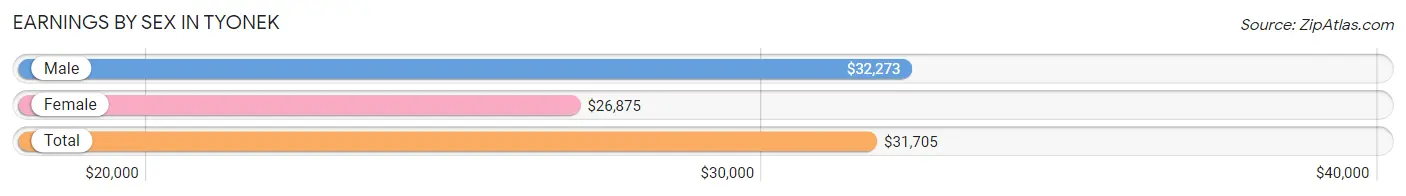
Earnings by Sex in Tyonek
Average Earnings in Tyonek are $31,705, $32,273 for men and $26,875 for women, a difference of 16.7%.
| Sex | Number | Average Earnings |
| Male | 92 (57.9%) | $32,273 |
| Female | 67 (42.1%) | $26,875 |
| Total | 159 (100.0%) | $31,705 |
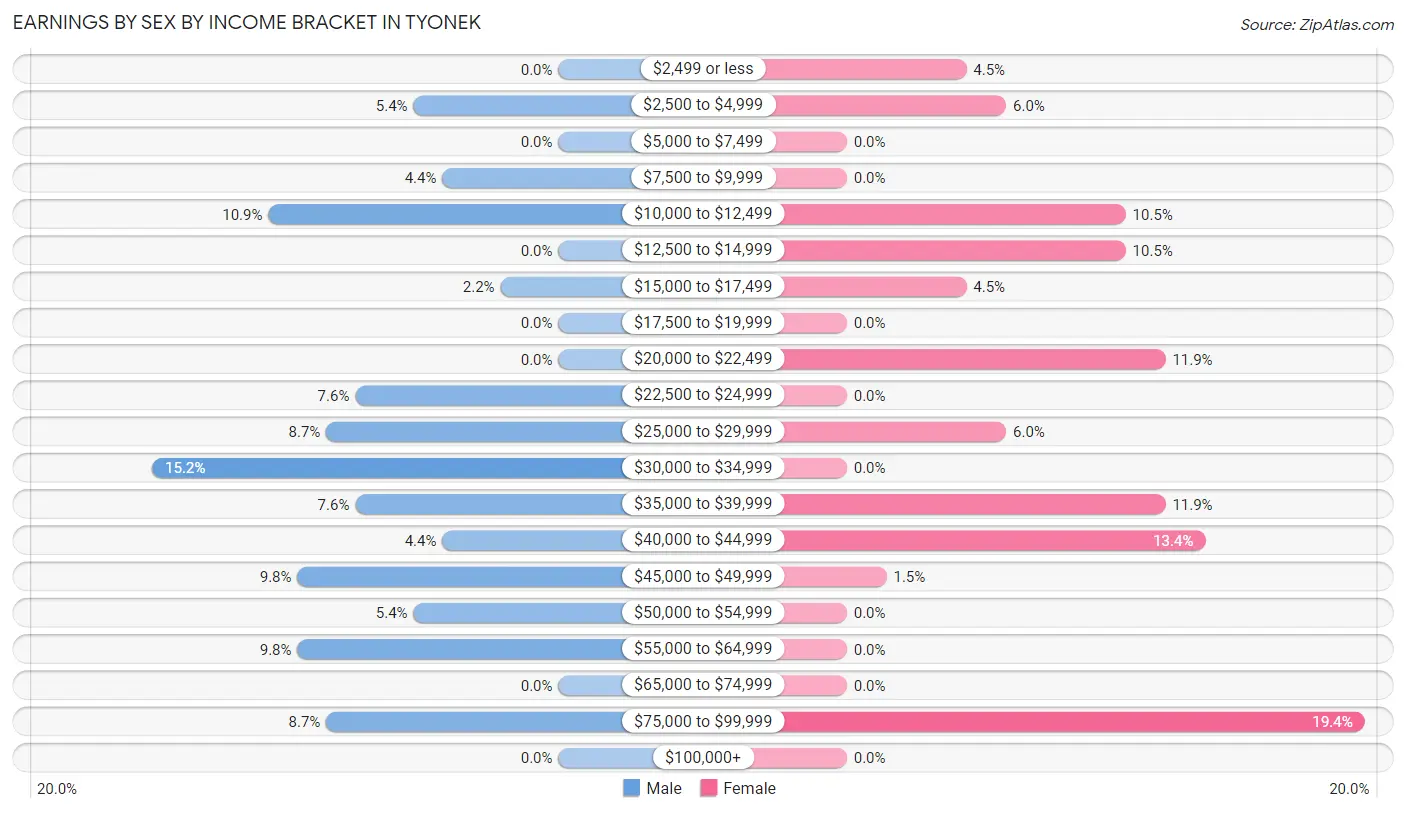
Earnings by Sex by Income Bracket in Tyonek
The most common earnings brackets in Tyonek are $30,000 to $34,999 for men (14 | 15.2%) and $75,000 to $99,999 for women (13 | 19.4%).
| Income | Male | Female |
| $2,499 or less | 0 (0.0%) | 3 (4.5%) |
| $2,500 to $4,999 | 5 (5.4%) | 4 (6.0%) |
| $5,000 to $7,499 | 0 (0.0%) | 0 (0.0%) |
| $7,500 to $9,999 | 4 (4.3%) | 0 (0.0%) |
| $10,000 to $12,499 | 10 (10.9%) | 7 (10.4%) |
| $12,500 to $14,999 | 0 (0.0%) | 7 (10.4%) |
| $15,000 to $17,499 | 2 (2.2%) | 3 (4.5%) |
| $17,500 to $19,999 | 0 (0.0%) | 0 (0.0%) |
| $20,000 to $22,499 | 0 (0.0%) | 8 (11.9%) |
| $22,500 to $24,999 | 7 (7.6%) | 0 (0.0%) |
| $25,000 to $29,999 | 8 (8.7%) | 4 (6.0%) |
| $30,000 to $34,999 | 14 (15.2%) | 0 (0.0%) |
| $35,000 to $39,999 | 7 (7.6%) | 8 (11.9%) |
| $40,000 to $44,999 | 4 (4.3%) | 9 (13.4%) |
| $45,000 to $49,999 | 9 (9.8%) | 1 (1.5%) |
| $50,000 to $54,999 | 5 (5.4%) | 0 (0.0%) |
| $55,000 to $64,999 | 9 (9.8%) | 0 (0.0%) |
| $65,000 to $74,999 | 0 (0.0%) | 0 (0.0%) |
| $75,000 to $99,999 | 8 (8.7%) | 13 (19.4%) |
| $100,000+ | 0 (0.0%) | 0 (0.0%) |
| Total | 92 (100.0%) | 67 (100.0%) |
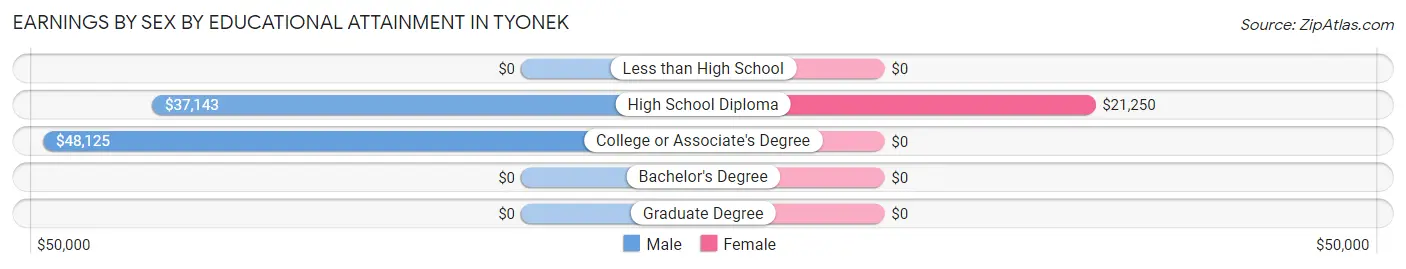
Earnings by Sex by Educational Attainment in Tyonek
Average earnings in Tyonek are $44,375 for men and $23,750 for women, a difference of 46.5%. Men with an educational attainment of college or associate's degree enjoy the highest average annual earnings of $48,125, while those with high school diploma education earn the least with $37,143. Women with an educational attainment of high school diploma earn the most with the average annual earnings of $21,250, while those with high school diploma education have the smallest earnings of $21,250.
| Educational Attainment | Male Income | Female Income |
| Less than High School | - | - |
| High School Diploma | $37,143 | $21,250 |
| College or Associate's Degree | $48,125 | $0 |
| Bachelor's Degree | - | - |
| Graduate Degree | - | - |
| Total | $44,375 | $23,750 |
Family Income in Tyonek
Family Income Brackets in Tyonek
According to the Tyonek family income data, there are 15 families falling into the $25,000 to $34,999 income range, which is the most common income bracket and makes up 24.6% of all families.
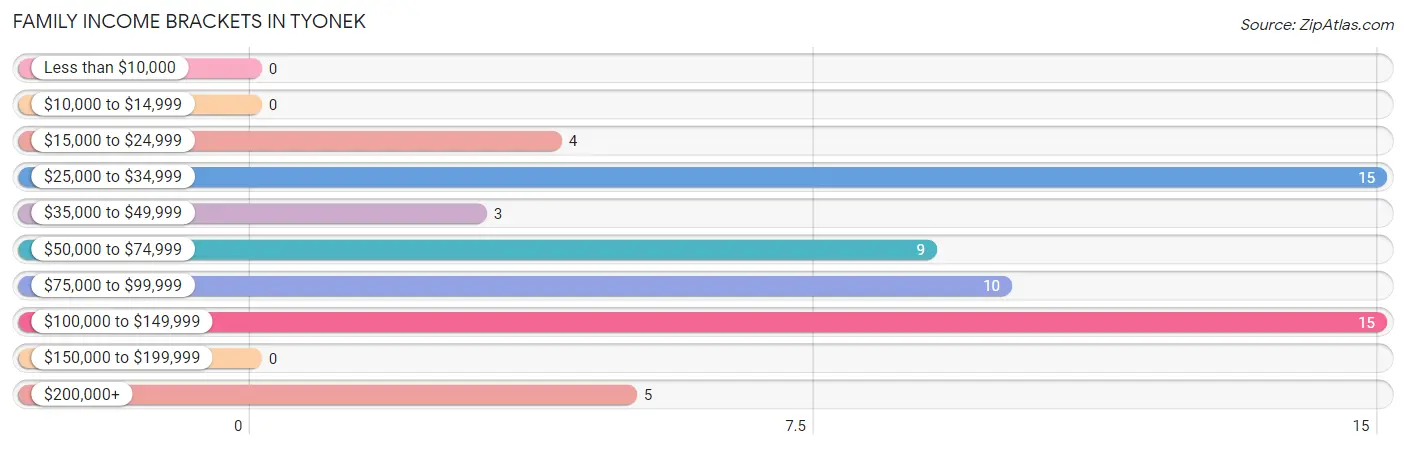
| Income Bracket | # Families | % Families |
| Less than $10,000 | 0 | 0.0% |
| $10,000 to $14,999 | 0 | 0.0% |
| $15,000 to $24,999 | 4 | 6.6% |
| $25,000 to $34,999 | 15 | 24.6% |
| $35,000 to $49,999 | 3 | 4.9% |
| $50,000 to $74,999 | 9 | 14.8% |
| $75,000 to $99,999 | 10 | 16.4% |
| $100,000 to $149,999 | 15 | 24.6% |
| $150,000 to $199,999 | 0 | 0.0% |
| $200,000+ | 5 | 8.2% |
Family Income by Famaliy Size in Tyonek
2-person families (18 | 29.5%) account for the highest median family income in Tyonek with $76,667 per family, while 2-person families (18 | 29.5%) have the highest median income of $38,334 per family member.
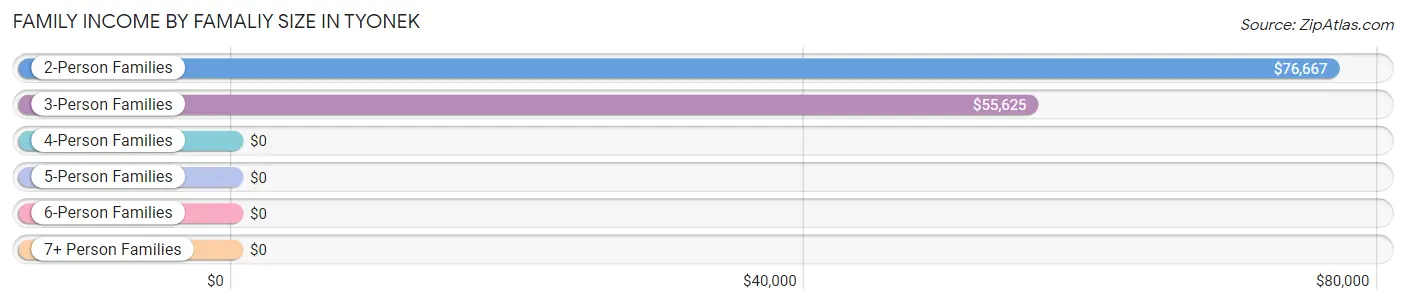
| Income Bracket | # Families | Median Income |
| 2-Person Families | 18 (29.5%) | $76,667 |
| 3-Person Families | 31 (50.8%) | $55,625 |
| 4-Person Families | 2 (3.3%) | $0 |
| 5-Person Families | 8 (13.1%) | $0 |
| 6-Person Families | 2 (3.3%) | $0 |
| 7+ Person Families | 0 (0.0%) | $0 |
| Total | 61 (100.0%) | $64,375 |
Family Income by Number of Earners in Tyonek
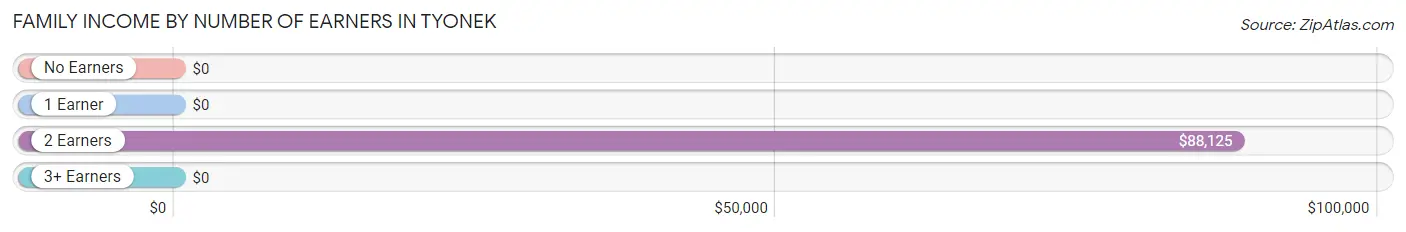
| Number of Earners | # Families | Median Income |
| No Earners | 3 (4.9%) | $0 |
| 1 Earner | 23 (37.7%) | $0 |
| 2 Earners | 33 (54.1%) | $88,125 |
| 3+ Earners | 2 (3.3%) | $0 |
| Total | 61 (100.0%) | $64,375 |
Household Income in Tyonek
Household Income Brackets in Tyonek
With 17 households falling in the category, the $35,000 to $49,999 income range is the most frequent in Tyonek, accounting for 16.2% of all households. In contrast, only 5 households (4.8%) fall into the $200,000+ income bracket, making it the least populous group.
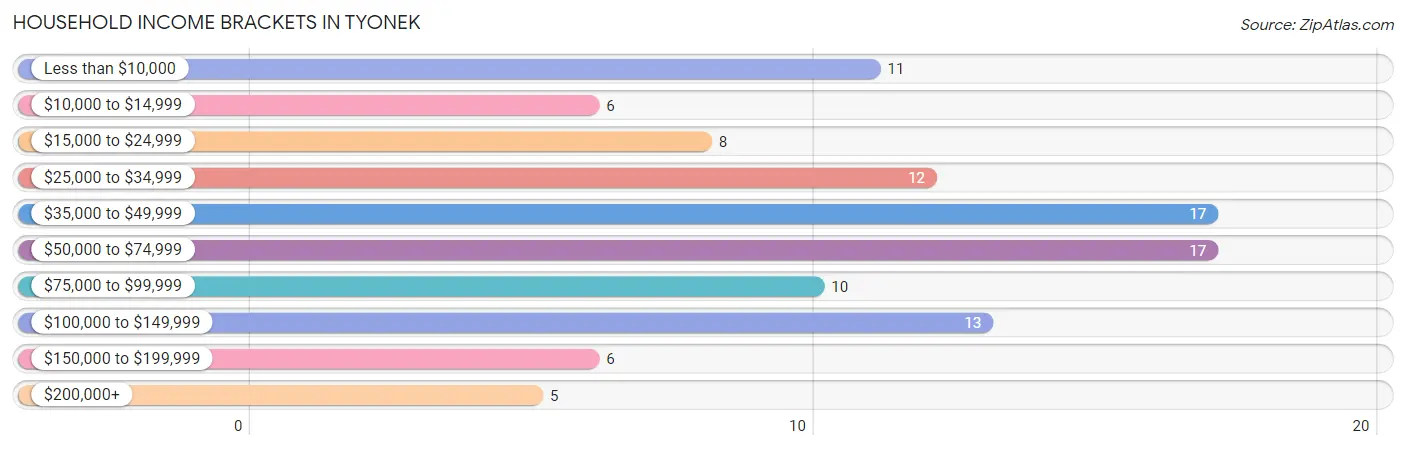
| Income Bracket | # Households | % Households |
| Less than $10,000 | 11 | 10.5% |
| $10,000 to $14,999 | 6 | 5.7% |
| $15,000 to $24,999 | 8 | 7.6% |
| $25,000 to $34,999 | 12 | 11.4% |
| $35,000 to $49,999 | 17 | 16.2% |
| $50,000 to $74,999 | 17 | 16.2% |
| $75,000 to $99,999 | 10 | 9.5% |
| $100,000 to $149,999 | 13 | 12.4% |
| $150,000 to $199,999 | 6 | 5.7% |
| $200,000+ | 5 | 4.8% |
Household Income by Householder Age in Tyonek
The median household income in Tyonek is $42,159, with the highest median household income of $113,750 found in the 25 to 44 years age bracket for the primary householder. A total of 20 households (19.1%) fall into this category. Meanwhile, the 15 to 24 years age bracket for the primary householder has the lowest median household income of $0, with 6 households (5.7%) in this group.
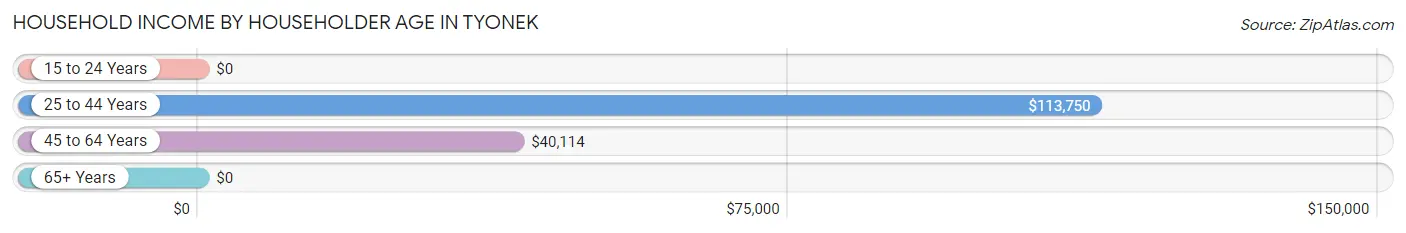
| Income Bracket | # Households | Median Income |
| 15 to 24 Years | 6 (5.7%) | $0 |
| 25 to 44 Years | 20 (19.1%) | $113,750 |
| 45 to 64 Years | 73 (69.5%) | $40,114 |
| 65+ Years | 6 (5.7%) | $0 |
| Total | 105 (100.0%) | $42,159 |
Poverty in Tyonek
Income Below Poverty by Sex and Age in Tyonek
With 14.7% poverty level for males and 18.7% for females among the residents of Tyonek, 16 and 17 year old males and under 5 year old females are the most vulnerable to poverty, with 4 males (100.0%) and 1 females (100.0%) in their respective age groups living below the poverty level.
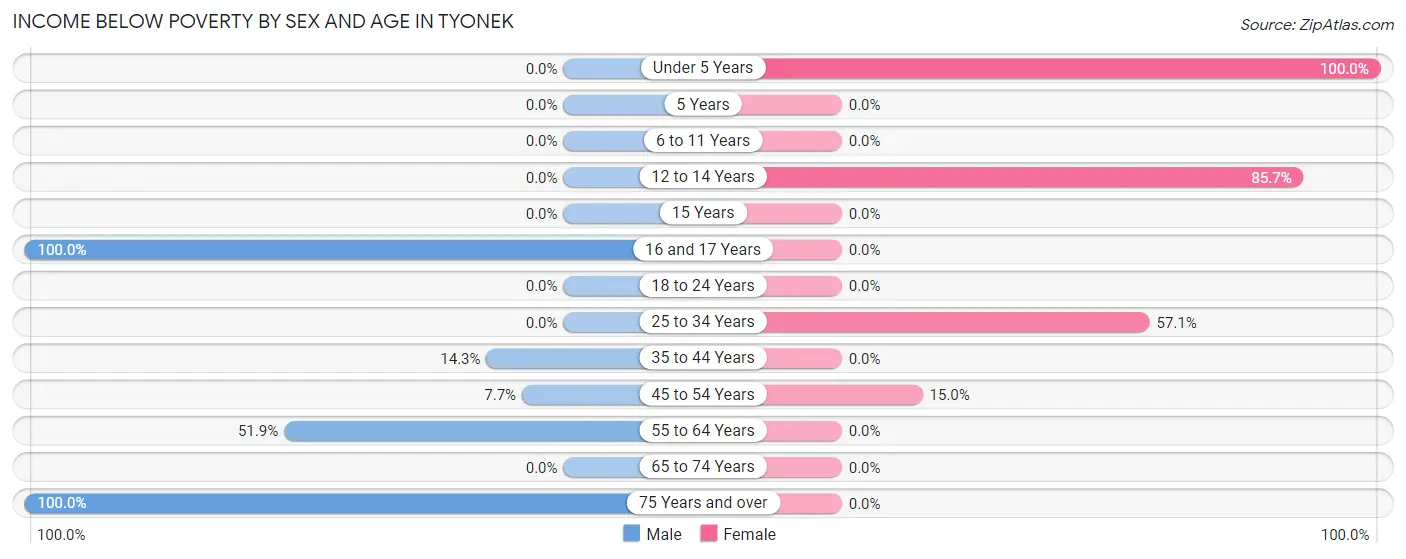
| Age Bracket | Male | Female |
| Under 5 Years | 0 (0.0%) | 1 (100.0%) |
| 5 Years | 0 (0.0%) | 0 (0.0%) |
| 6 to 11 Years | 0 (0.0%) | 0 (0.0%) |
| 12 to 14 Years | 0 (0.0%) | 12 (85.7%) |
| 15 Years | 0 (0.0%) | 0 (0.0%) |
| 16 and 17 Years | 4 (100.0%) | 0 (0.0%) |
| 18 to 24 Years | 0 (0.0%) | 0 (0.0%) |
| 25 to 34 Years | 0 (0.0%) | 4 (57.1%) |
| 35 to 44 Years | 2 (14.3%) | 0 (0.0%) |
| 45 to 54 Years | 2 (7.7%) | 3 (15.0%) |
| 55 to 64 Years | 14 (51.8%) | 0 (0.0%) |
| 65 to 74 Years | 0 (0.0%) | 0 (0.0%) |
| 75 Years and over | 2 (100.0%) | 0 (0.0%) |
| Total | 24 (14.7%) | 20 (18.7%) |
Income Above Poverty by Sex and Age in Tyonek
According to the poverty statistics in Tyonek, males aged under 5 years and females aged 5 years are the age groups that are most secure financially, with 100.0% of males and 100.0% of females in these age groups living above the poverty line.
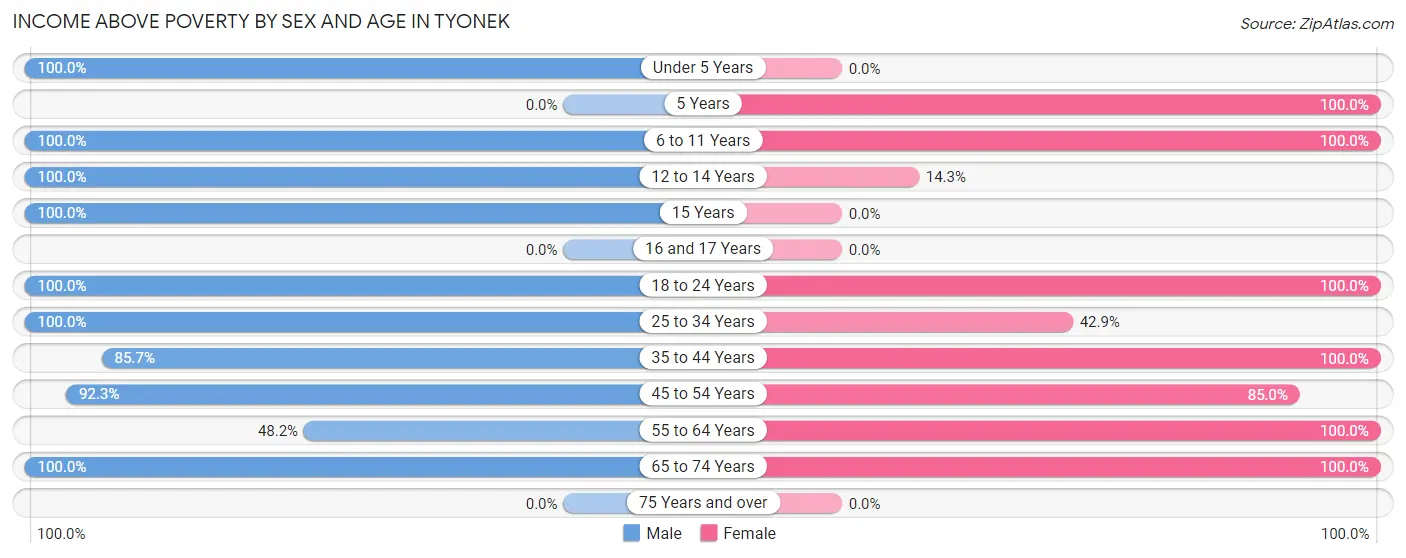
| Age Bracket | Male | Female |
| Under 5 Years | 4 (100.0%) | 0 (0.0%) |
| 5 Years | 0 (0.0%) | 2 (100.0%) |
| 6 to 11 Years | 7 (100.0%) | 5 (100.0%) |
| 12 to 14 Years | 6 (100.0%) | 2 (14.3%) |
| 15 Years | 5 (100.0%) | 0 (0.0%) |
| 16 and 17 Years | 0 (0.0%) | 0 (0.0%) |
| 18 to 24 Years | 36 (100.0%) | 17 (100.0%) |
| 25 to 34 Years | 29 (100.0%) | 3 (42.9%) |
| 35 to 44 Years | 12 (85.7%) | 16 (100.0%) |
| 45 to 54 Years | 24 (92.3%) | 17 (85.0%) |
| 55 to 64 Years | 13 (48.1%) | 22 (100.0%) |
| 65 to 74 Years | 3 (100.0%) | 3 (100.0%) |
| 75 Years and over | 0 (0.0%) | 0 (0.0%) |
| Total | 139 (85.3%) | 87 (81.3%) |
Income Below Poverty Among Married-Couple Families in Tyonek
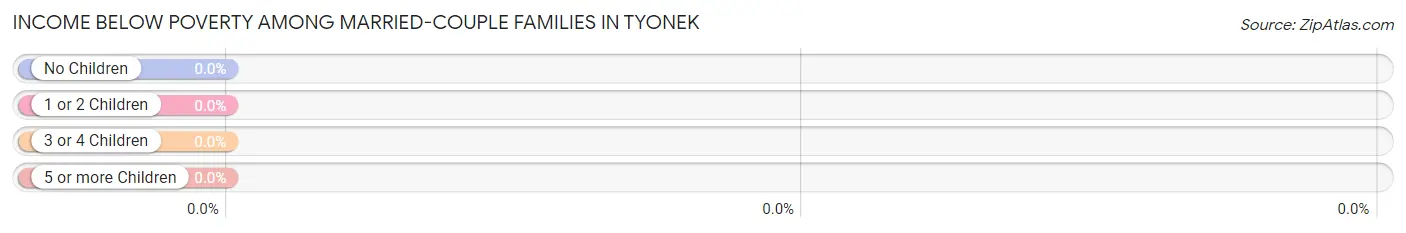
| Children | Above Poverty | Below Poverty |
| No Children | 18 (100.0%) | 0 (0.0%) |
| 1 or 2 Children | 10 (100.0%) | 0 (0.0%) |
| 3 or 4 Children | 4 (100.0%) | 0 (0.0%) |
| 5 or more Children | 0 (0.0%) | 0 (0.0%) |
| Total | 32 (100.0%) | 0 (0.0%) |
Income Below Poverty Among Single-Parent Households in Tyonek
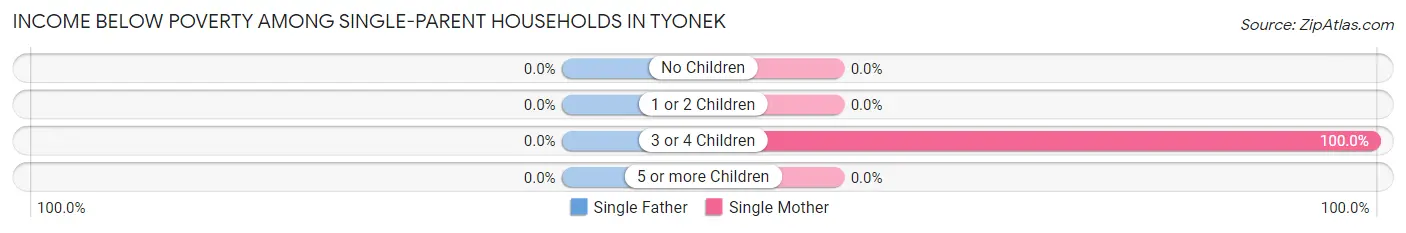
| Children | Single Father | Single Mother |
| No Children | 0 (0.0%) | 0 (0.0%) |
| 1 or 2 Children | 0 (0.0%) | 0 (0.0%) |
| 3 or 4 Children | 0 (0.0%) | 4 (100.0%) |
| 5 or more Children | 0 (0.0%) | 0 (0.0%) |
| Total | 0 (0.0%) | 4 (13.8%) |
Income Below Poverty Among Married-Couple vs Single-Parent Households in Tyonek
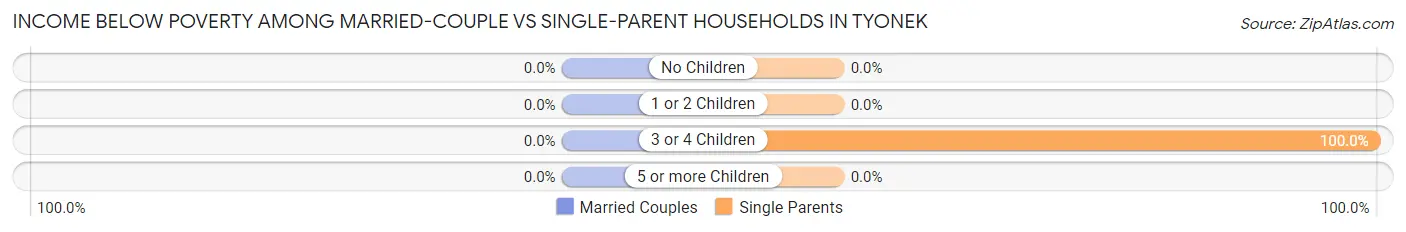
| Children | Married-Couple Families | Single-Parent Households |
| No Children | 0 (0.0%) | 0 (0.0%) |
| 1 or 2 Children | 0 (0.0%) | 0 (0.0%) |
| 3 or 4 Children | 0 (0.0%) | 4 (100.0%) |
| 5 or more Children | 0 (0.0%) | 0 (0.0%) |
| Total | 0 (0.0%) | 4 (13.8%) |
Race in Tyonek
The most populous races in Tyonek are Native / Alaskan (202 | 74.8%), Two or more Races (43 | 15.9%), and Hispanic or Latino (32 | 11.8%).
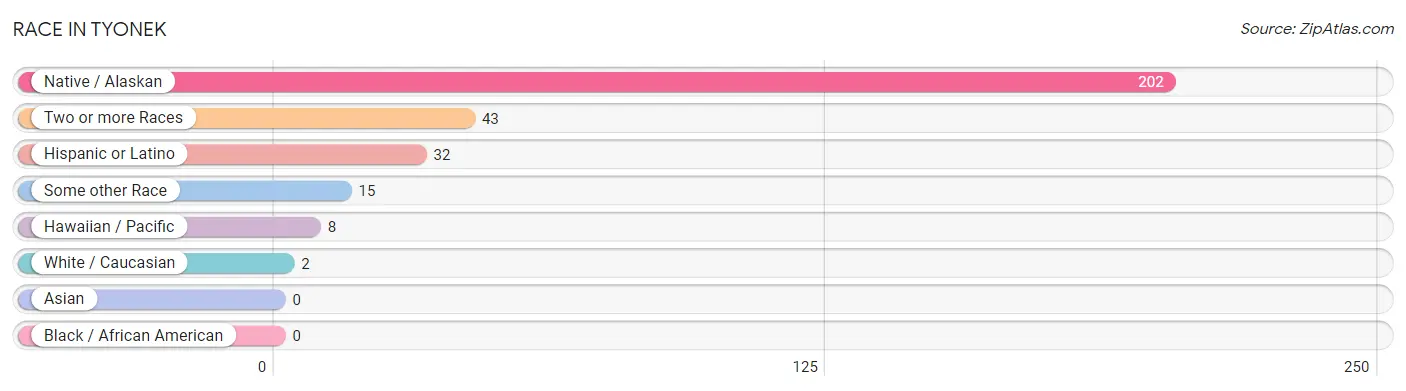
| Race | # Population | % Population |
| Asian | 0 | 0.0% |
| Black / African American | 0 | 0.0% |
| Hawaiian / Pacific | 8 | 3.0% |
| Hispanic or Latino | 32 | 11.8% |
| Native / Alaskan | 202 | 74.8% |
| White / Caucasian | 2 | 0.7% |
| Two or more Races | 43 | 15.9% |
| Some other Race | 15 | 5.6% |
| Total | 270 | 100.0% |
Ancestry in Tyonek
The most populous ancestries reported in Tyonek are Alaskan Athabascan (200 | 74.1%), Alaska Native (29 | 10.7%), Irish (29 | 10.7%), Mexican (21 | 7.8%), and German (12 | 4.4%), together accounting for 107.8% of all Tyonek residents.
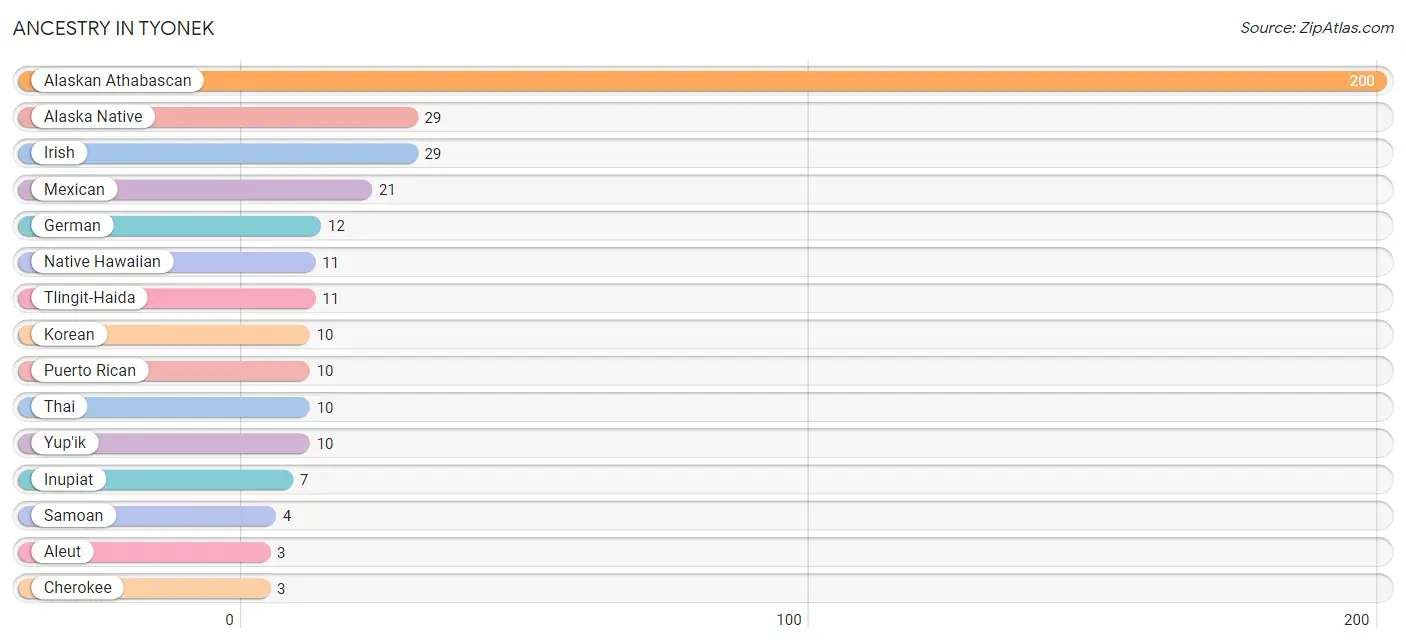
| Ancestry | # Population | % Population |
| Alaska Native | 29 | 10.7% |
| Alaskan Athabascan | 200 | 74.1% |
| Aleut | 3 | 1.1% |
| Cherokee | 3 | 1.1% |
| Dominican | 1 | 0.4% |
| English | 3 | 1.1% |
| German | 12 | 4.4% |
| Inupiat | 7 | 2.6% |
| Irish | 29 | 10.7% |
| Italian | 2 | 0.7% |
| Korean | 10 | 3.7% |
| Mexican | 21 | 7.8% |
| Native Hawaiian | 11 | 4.1% |
| Norwegian | 2 | 0.7% |
| Puerto Rican | 10 | 3.7% |
| Samoan | 4 | 1.5% |
| Thai | 10 | 3.7% |
| Tlingit-Haida | 11 | 4.1% |
| Yup'ik | 10 | 3.7% | View All 19 Rows |
Immigrants in Tyonek
The most numerous immigrant groups reported in Tyonek came from , and Oceania (4 | 1.5%), together accounting for 1.5% of all Tyonek residents.

| Immigration Origin | # Population | % Population |
| Oceania | 4 | 1.5% | View All 1 Rows |
Sex and Age in Tyonek
Sex and Age in Tyonek
The most populous age groups in Tyonek are 20 to 24 Years (36 | 22.1%) for men and 45 to 49 Years (20 | 18.7%) for women.
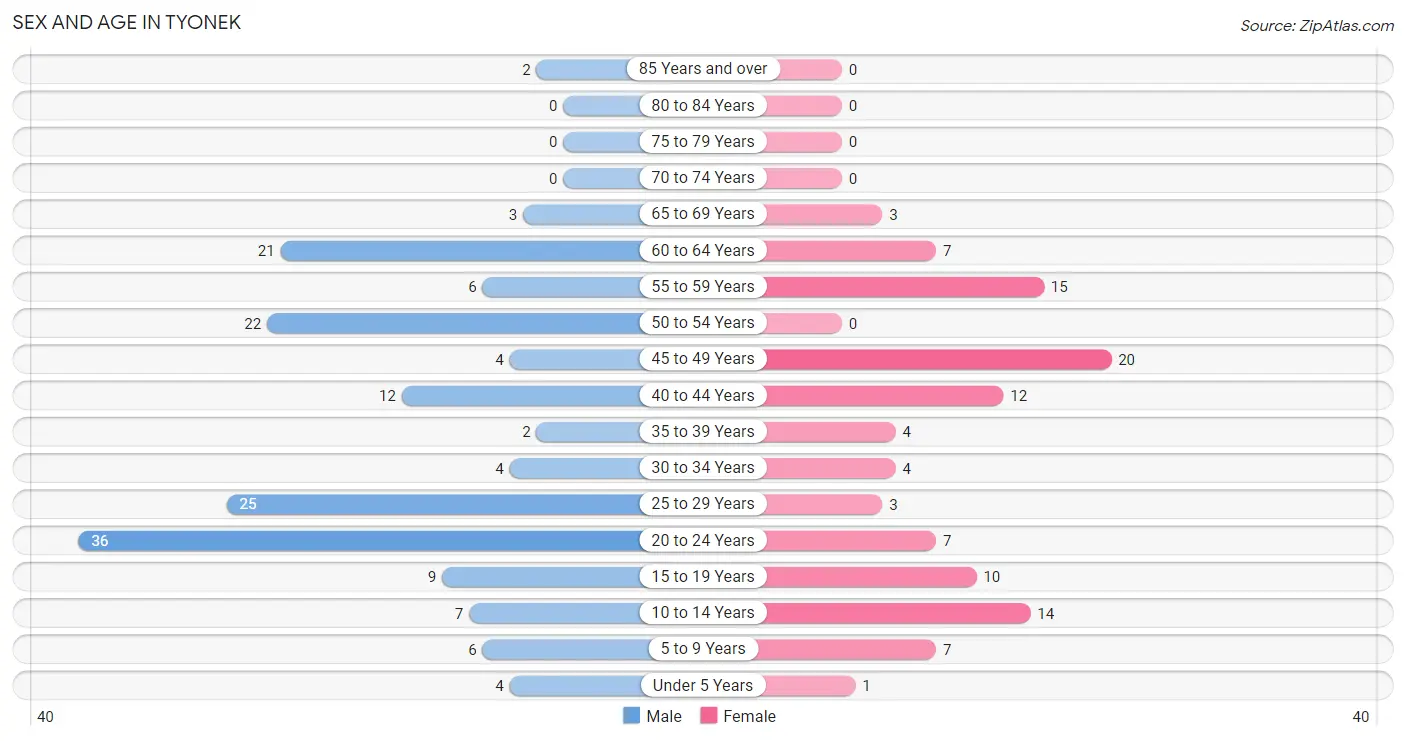
| Age Bracket | Male | Female |
| Under 5 Years | 4 (2.5%) | 1 (0.9%) |
| 5 to 9 Years | 6 (3.7%) | 7 (6.5%) |
| 10 to 14 Years | 7 (4.3%) | 14 (13.1%) |
| 15 to 19 Years | 9 (5.5%) | 10 (9.3%) |
| 20 to 24 Years | 36 (22.1%) | 7 (6.5%) |
| 25 to 29 Years | 25 (15.3%) | 3 (2.8%) |
| 30 to 34 Years | 4 (2.5%) | 4 (3.7%) |
| 35 to 39 Years | 2 (1.2%) | 4 (3.7%) |
| 40 to 44 Years | 12 (7.4%) | 12 (11.2%) |
| 45 to 49 Years | 4 (2.5%) | 20 (18.7%) |
| 50 to 54 Years | 22 (13.5%) | 0 (0.0%) |
| 55 to 59 Years | 6 (3.7%) | 15 (14.0%) |
| 60 to 64 Years | 21 (12.9%) | 7 (6.5%) |
| 65 to 69 Years | 3 (1.8%) | 3 (2.8%) |
| 70 to 74 Years | 0 (0.0%) | 0 (0.0%) |
| 75 to 79 Years | 0 (0.0%) | 0 (0.0%) |
| 80 to 84 Years | 0 (0.0%) | 0 (0.0%) |
| 85 Years and over | 2 (1.2%) | 0 (0.0%) |
| Total | 163 (100.0%) | 107 (100.0%) |
Families and Households in Tyonek
Median Family Size in Tyonek
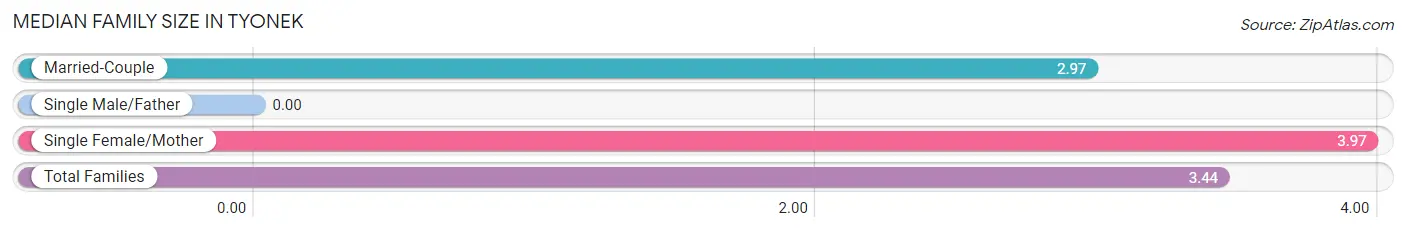
| Family Type | # Families | Family Size |
| Married-Couple | 32 (52.5%) | 2.97 |
| Single Male/Father | 0 (0.0%) | - |
| Single Female/Mother | 29 (47.5%) | 3.97 |
| Total Families | 61 (100.0%) | 3.44 |
Median Household Size in Tyonek
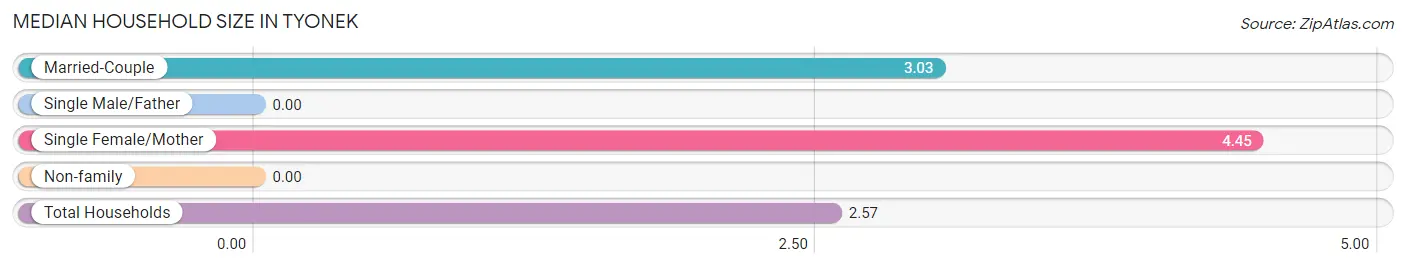
| Household Type | # Households | Household Size |
| Married-Couple | 32 (30.5%) | 3.03 |
| Single Male/Father | 0 (0.0%) | - |
| Single Female/Mother | 29 (27.6%) | 4.45 |
| Non-family | 44 (41.9%) | - |
| Total Households | 105 (100.0%) | 2.57 |
Household Size by Marriage Status in Tyonek
Out of a total of 105 households in Tyonek, 61 (58.1%) are family households, while 44 (41.9%) are nonfamily households. The most numerous type of family households are 3-person households, comprising 20, and the most common type of nonfamily households are 1-person households, comprising 44.
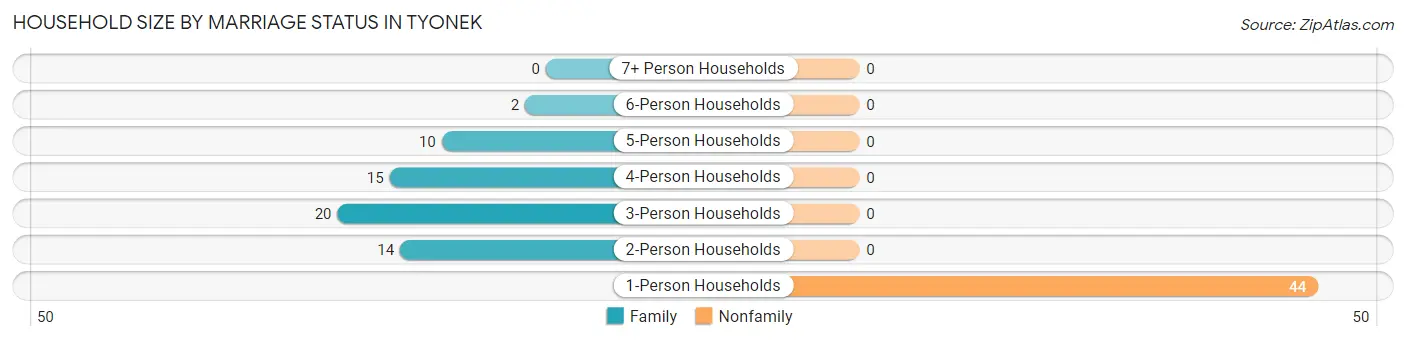
| Household Size | Family Households | Nonfamily Households |
| 1-Person Households | - | 44 (41.9%) |
| 2-Person Households | 14 (13.3%) | 0 (0.0%) |
| 3-Person Households | 20 (19.1%) | 0 (0.0%) |
| 4-Person Households | 15 (14.3%) | 0 (0.0%) |
| 5-Person Households | 10 (9.5%) | 0 (0.0%) |
| 6-Person Households | 2 (1.9%) | 0 (0.0%) |
| 7+ Person Households | 0 (0.0%) | 0 (0.0%) |
| Total | 61 (58.1%) | 44 (41.9%) |
Female Fertility in Tyonek
Fertility by Age in Tyonek
| Age Bracket | Women with Births | Births / 1,000 Women |
| 15 to 19 years | 0 (0.0%) | 0.0 |
| 20 to 34 years | 0 (0.0%) | 0.0 |
| 35 to 50 years | 0 (0.0%) | 0.0 |
| Total | 0 (0.0%) | 0.0 |
Fertility by Age by Marriage Status in Tyonek
| Age Bracket | Married | Unmarried |
| 15 to 19 years | 0 (0.0%) | 0 (0.0%) |
| 20 to 34 years | 0 (0.0%) | 0 (0.0%) |
| 35 to 50 years | 0 (0.0%) | 0 (0.0%) |
| Total | 0 (0.0%) | 0 (0.0%) |
Fertility by Education in Tyonek
| Educational Attainment | Women with Births | Births / 1,000 Women |
| Less than High School | 0 (0.0%) | 0.0 |
| High School Diploma | 0 (0.0%) | 0.0 |
| College or Associate's Degree | 0 (0.0%) | 0.0 |
| Bachelor's Degree | 0 (0.0%) | 0.0 |
| Graduate Degree | 0 (0.0%) | 0.0 |
| Total | 0 (0.0%) | 0.0 |
Fertility by Education by Marriage Status in Tyonek
| Educational Attainment | Married | Unmarried |
| Less than High School | 0 (0.0%) | 0 (0.0%) |
| High School Diploma | 0 (0.0%) | 0 (0.0%) |
| College or Associate's Degree | 0 (0.0%) | 0 (0.0%) |
| Bachelor's Degree | 0 (0.0%) | 0 (0.0%) |
| Graduate Degree | 0 (0.0%) | 0 (0.0%) |
| Total | 0 (0.0%) | 0 (0.0%) |
Employment Characteristics in Tyonek
Employment by Class of Employer in Tyonek
Among the 122 employed individuals in Tyonek, local government employees (54 | 44.3%), private company employees (33 | 27.1%), and federal government employees (30 | 24.6%) make up the most common classes of employment.
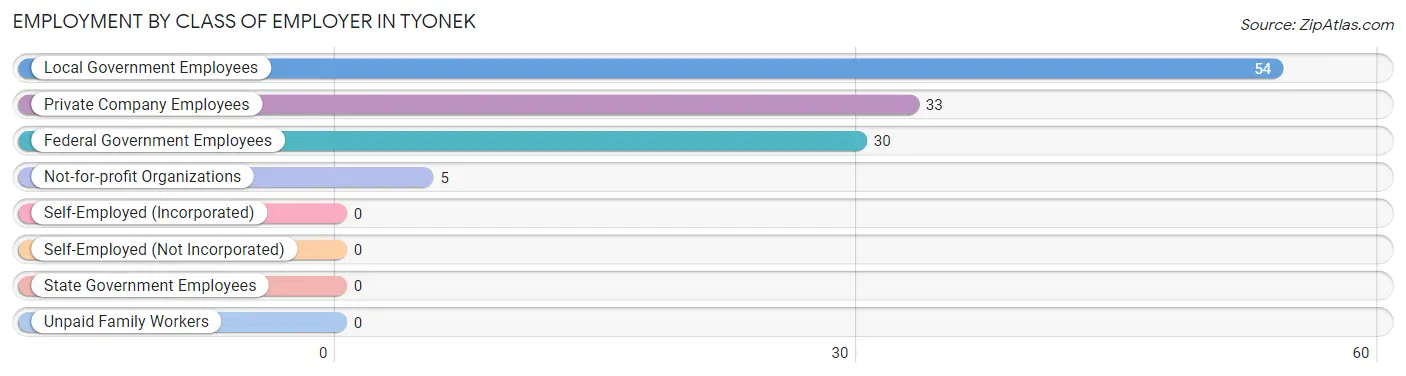
| Employer Class | # Employees | % Employees |
| Private Company Employees | 33 | 27.1% |
| Self-Employed (Incorporated) | 0 | 0.0% |
| Self-Employed (Not Incorporated) | 0 | 0.0% |
| Not-for-profit Organizations | 5 | 4.1% |
| Local Government Employees | 54 | 44.3% |
| State Government Employees | 0 | 0.0% |
| Federal Government Employees | 30 | 24.6% |
| Unpaid Family Workers | 0 | 0.0% |
| Total | 122 | 100.0% |
Employment Status by Age in Tyonek
According to the labor force statistics for Tyonek, out of the total population over 16 years of age (226), 71.7% or 162 individuals are in the labor force, with 20.3% or 33 of them unemployed. The age group with the highest labor force participation rate is 20 to 24 years, with 100.0% or 43 individuals in the labor force. Within the labor force, the 45 to 54 years age range has the highest percentage of unemployed individuals, with 34.9% or 15 of them being unemployed.
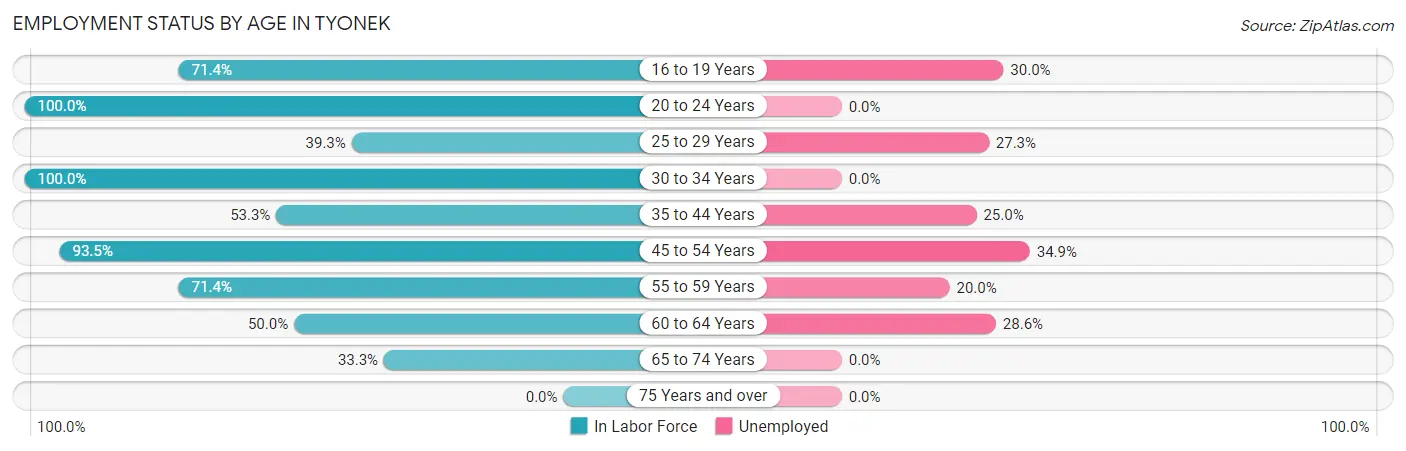
| Age Bracket | In Labor Force | Unemployed |
| 16 to 19 Years | 10 (71.4%) | 3 (30.0%) |
| 20 to 24 Years | 43 (100.0%) | 0 (0.0%) |
| 25 to 29 Years | 11 (39.3%) | 3 (27.3%) |
| 30 to 34 Years | 8 (100.0%) | 0 (0.0%) |
| 35 to 44 Years | 16 (53.3%) | 4 (25.0%) |
| 45 to 54 Years | 43 (93.5%) | 15 (34.9%) |
| 55 to 59 Years | 15 (71.4%) | 3 (20.0%) |
| 60 to 64 Years | 14 (50.0%) | 4 (28.6%) |
| 65 to 74 Years | 2 (33.3%) | 0 (0.0%) |
| 75 Years and over | 0 (0.0%) | 0 (0.0%) |
| Total | 162 (71.7%) | 33 (20.3%) |
Employment Status by Educational Attainment in Tyonek
According to labor force statistics for Tyonek, 66.5% of individuals (107) out of the total population between 25 and 64 years of age (161) are in the labor force, with 27.1% or 29 of them being unemployed. The group with the highest labor force participation rate are those with the educational attainment of less than high school, with 100.0% or 4 individuals in the labor force. Within the labor force, individuals with high school diploma education have the highest percentage of unemployment, with 30.5% or 18 of them being unemployed.
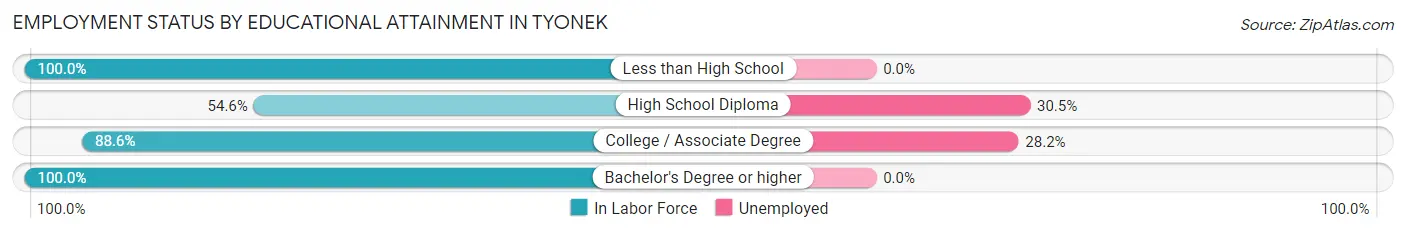
| Educational Attainment | In Labor Force | Unemployed |
| Less than High School | 4 (100.0%) | 0 (0.0%) |
| High School Diploma | 59 (54.6%) | 33 (30.5%) |
| College / Associate Degree | 39 (88.6%) | 12 (28.2%) |
| Bachelor's Degree or higher | 5 (100.0%) | 0 (0.0%) |
| Total | 107 (66.5%) | 44 (27.1%) |
Employment Occupations by Sex in Tyonek
Management, Business, Science and Arts Occupations
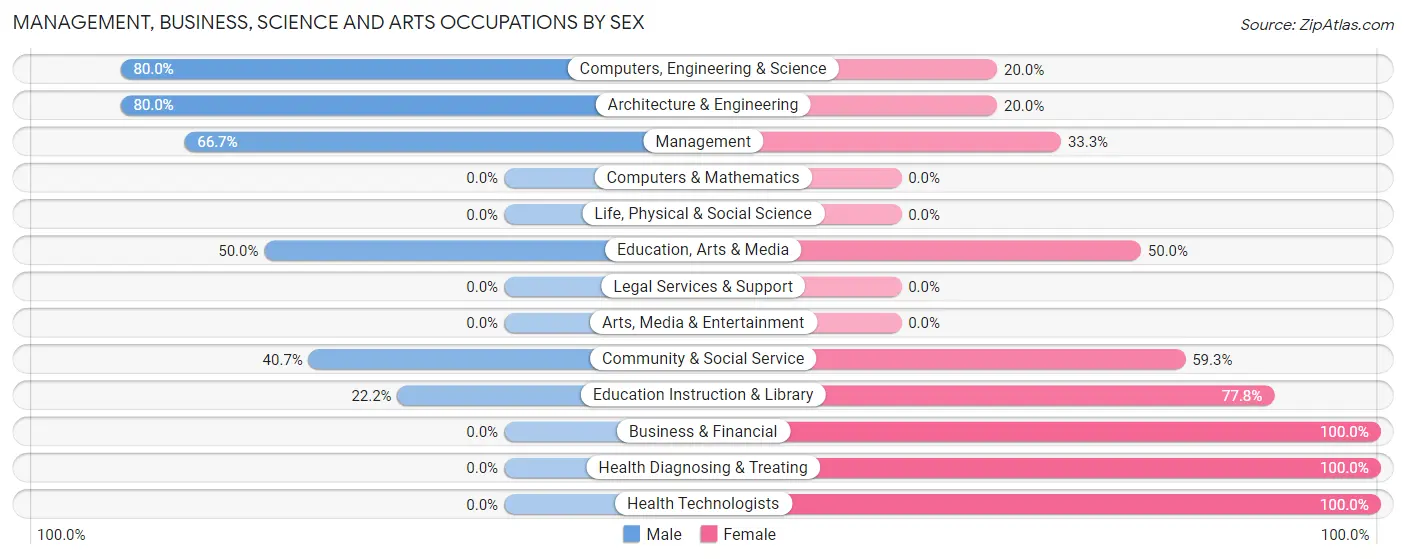
The most common Management, Business, Science and Arts occupations in Tyonek are Community & Social Service (27 | 21.4%), Education, Arts & Media (18 | 14.3%), Education Instruction & Library (9 | 7.1%), Management (6 | 4.8%), and Computers, Engineering & Science (5 | 4.0%).
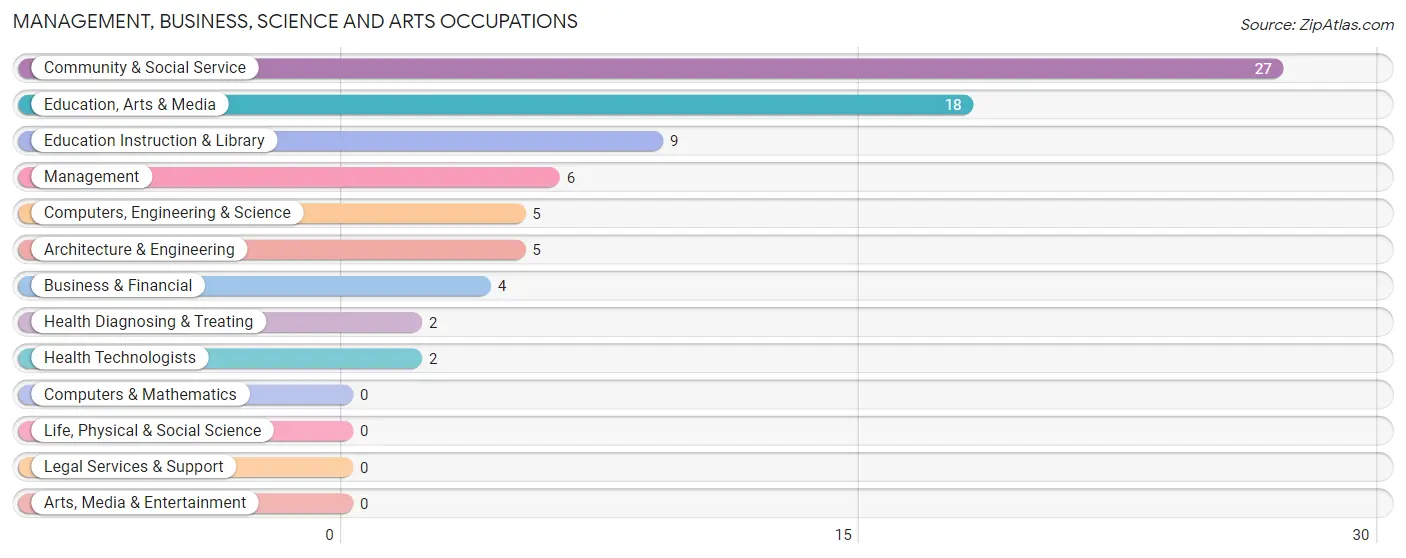
Management, Business, Science and Arts Occupations by Sex
Within the Management, Business, Science and Arts occupations in Tyonek, the most male-oriented occupations are Computers, Engineering & Science (80.0%), Architecture & Engineering (80.0%), and Management (66.7%), while the most female-oriented occupations are Business & Financial (100.0%), Health Diagnosing & Treating (100.0%), and Health Technologists (100.0%).
| Occupation | Male | Female |
| Management | 4 (66.7%) | 2 (33.3%) |
| Business & Financial | 0 (0.0%) | 4 (100.0%) |
| Computers, Engineering & Science | 4 (80.0%) | 1 (20.0%) |
| Computers & Mathematics | 0 (0.0%) | 0 (0.0%) |
| Architecture & Engineering | 4 (80.0%) | 1 (20.0%) |
| Life, Physical & Social Science | 0 (0.0%) | 0 (0.0%) |
| Community & Social Service | 11 (40.7%) | 16 (59.3%) |
| Education, Arts & Media | 9 (50.0%) | 9 (50.0%) |
| Legal Services & Support | 0 (0.0%) | 0 (0.0%) |
| Education Instruction & Library | 2 (22.2%) | 7 (77.8%) |
| Arts, Media & Entertainment | 0 (0.0%) | 0 (0.0%) |
| Health Diagnosing & Treating | 0 (0.0%) | 2 (100.0%) |
| Health Technologists | 0 (0.0%) | 2 (100.0%) |
| Total (Category) | 19 (43.2%) | 25 (56.8%) |
| Total (Overall) | 76 (60.3%) | 50 (39.7%) |
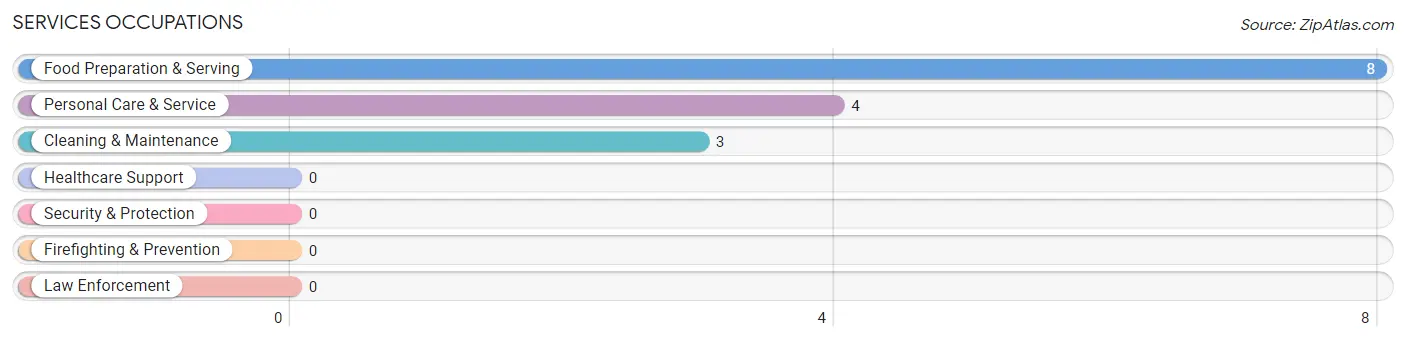
Services Occupations
The most common Services occupations in Tyonek are Food Preparation & Serving (8 | 6.4%), Personal Care & Service (4 | 3.2%), and Cleaning & Maintenance (3 | 2.4%).
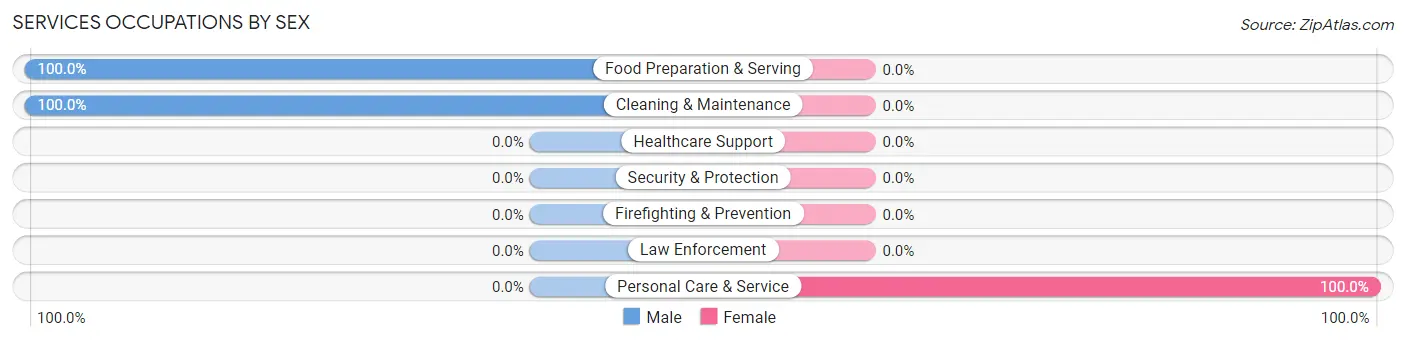
Services Occupations by Sex
| Occupation | Male | Female |
| Healthcare Support | 0 (0.0%) | 0 (0.0%) |
| Security & Protection | 0 (0.0%) | 0 (0.0%) |
| Firefighting & Prevention | 0 (0.0%) | 0 (0.0%) |
| Law Enforcement | 0 (0.0%) | 0 (0.0%) |
| Food Preparation & Serving | 8 (100.0%) | 0 (0.0%) |
| Cleaning & Maintenance | 3 (100.0%) | 0 (0.0%) |
| Personal Care & Service | 0 (0.0%) | 4 (100.0%) |
| Total (Category) | 11 (73.3%) | 4 (26.7%) |
| Total (Overall) | 76 (60.3%) | 50 (39.7%) |
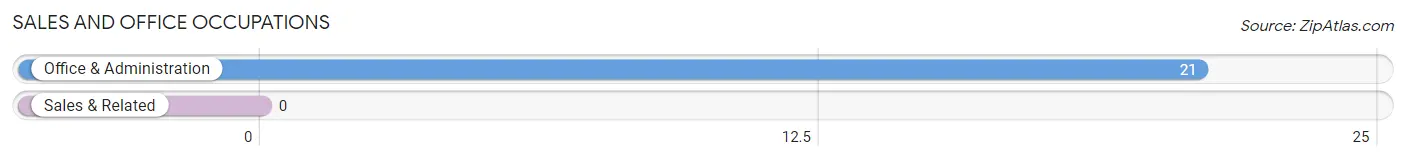
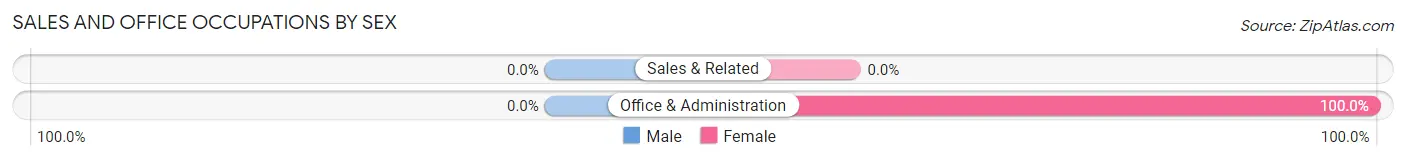
Sales and Office Occupations
The most common Sales and Office occupations in Tyonek are , and Office & Administration (21 | 16.7%).
Sales and Office Occupations by Sex
| Occupation | Male | Female |
| Sales & Related | 0 (0.0%) | 0 (0.0%) |
| Office & Administration | 0 (0.0%) | 21 (100.0%) |
| Total (Category) | 0 (0.0%) | 21 (100.0%) |
| Total (Overall) | 76 (60.3%) | 50 (39.7%) |
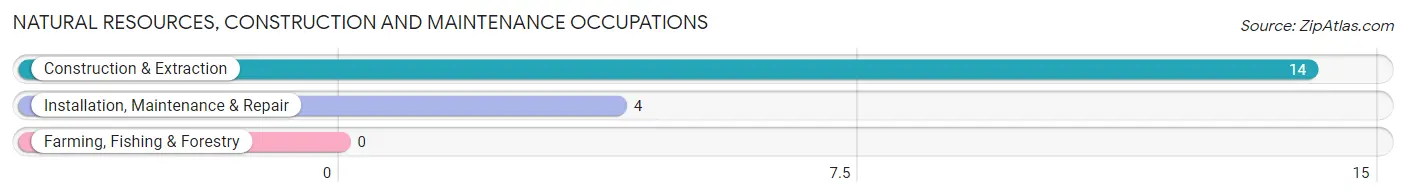
Natural Resources, Construction and Maintenance Occupations
The most common Natural Resources, Construction and Maintenance occupations in Tyonek are Construction & Extraction (14 | 11.1%), and Installation, Maintenance & Repair (4 | 3.2%).
Natural Resources, Construction and Maintenance Occupations by Sex
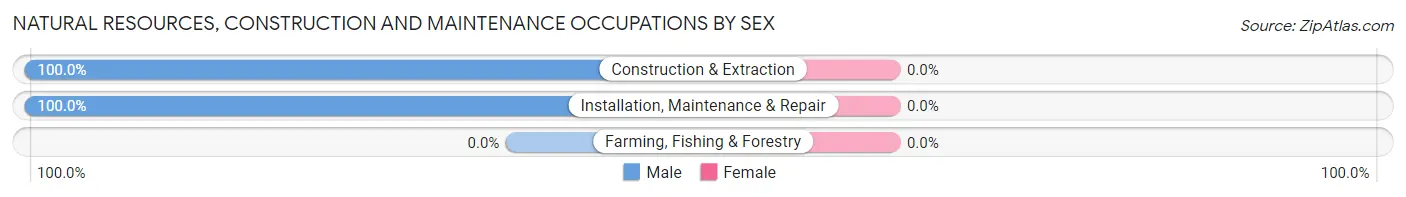
| Occupation | Male | Female |
| Farming, Fishing & Forestry | 0 (0.0%) | 0 (0.0%) |
| Construction & Extraction | 14 (100.0%) | 0 (0.0%) |
| Installation, Maintenance & Repair | 4 (100.0%) | 0 (0.0%) |
| Total (Category) | 18 (100.0%) | 0 (0.0%) |
| Total (Overall) | 76 (60.3%) | 50 (39.7%) |
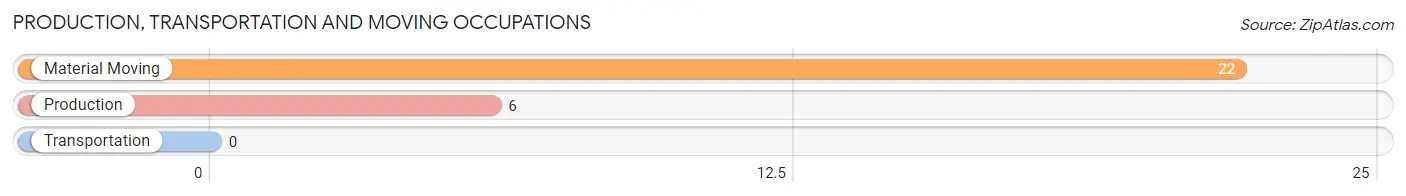
Production, Transportation and Moving Occupations
The most common Production, Transportation and Moving occupations in Tyonek are Material Moving (22 | 17.5%), and Production (6 | 4.8%).
Production, Transportation and Moving Occupations by Sex
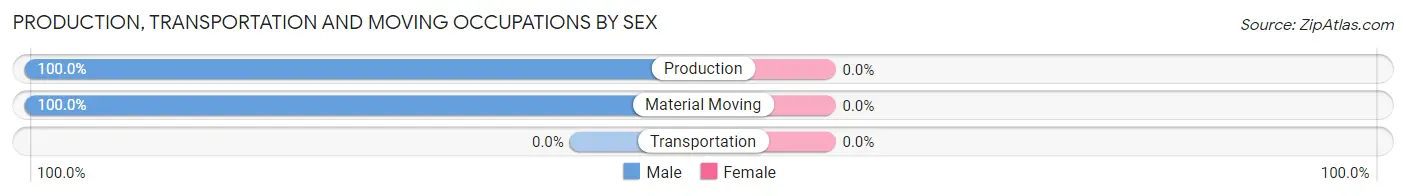
| Occupation | Male | Female |
| Production | 6 (100.0%) | 0 (0.0%) |
| Transportation | 0 (0.0%) | 0 (0.0%) |
| Material Moving | 22 (100.0%) | 0 (0.0%) |
| Total (Category) | 28 (100.0%) | 0 (0.0%) |
| Total (Overall) | 76 (60.3%) | 50 (39.7%) |
Employment Industries by Sex in Tyonek
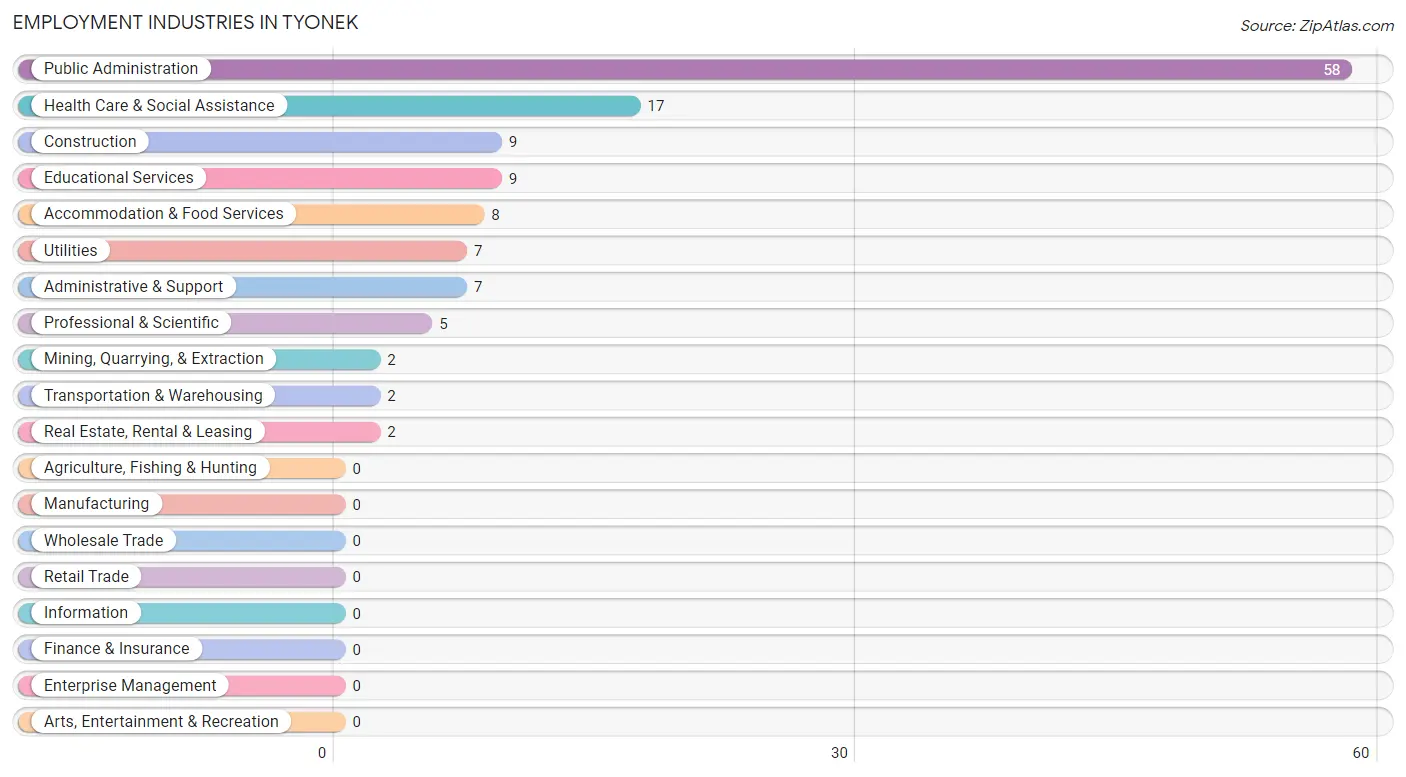
Employment Industries in Tyonek
The major employment industries in Tyonek include Public Administration (58 | 46.0%), Health Care & Social Assistance (17 | 13.5%), Construction (9 | 7.1%), Educational Services (9 | 7.1%), and Accommodation & Food Services (8 | 6.4%).
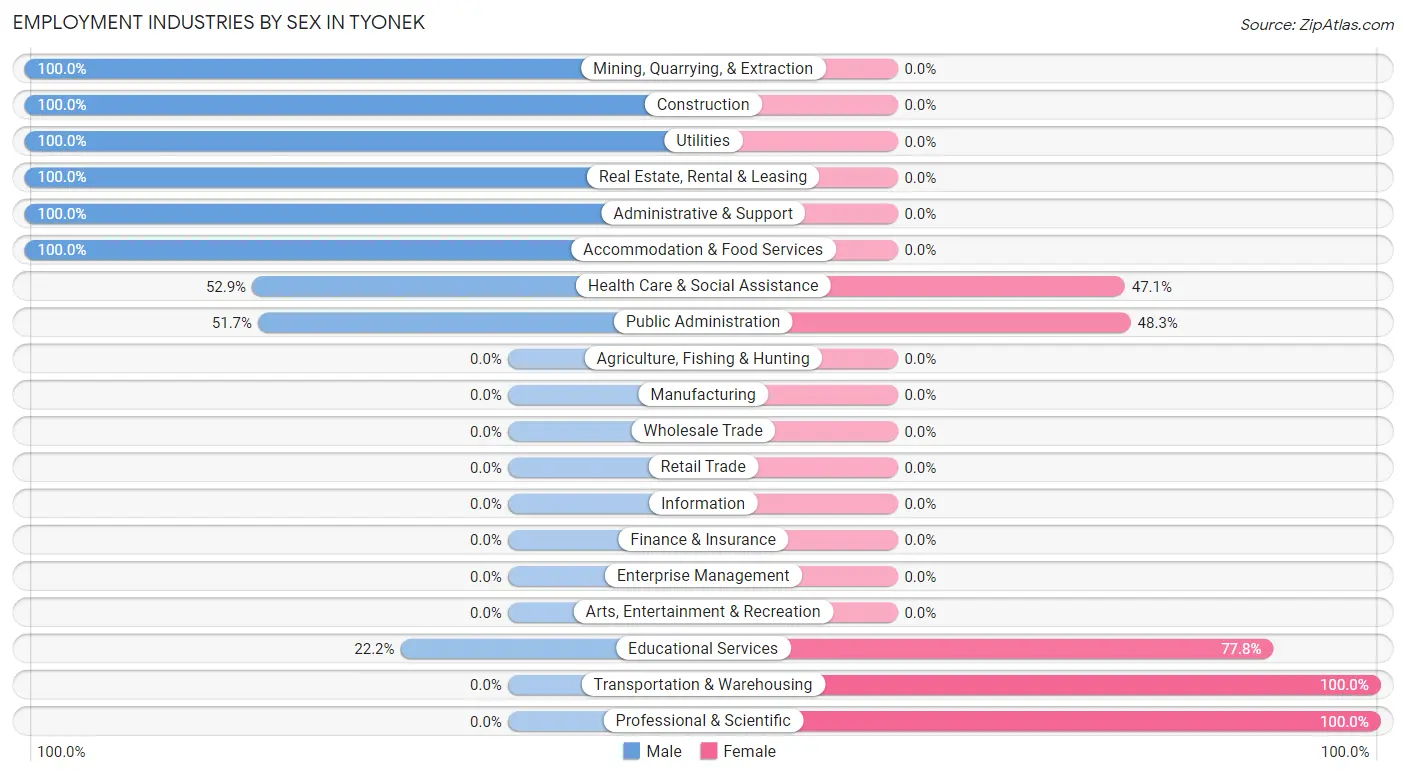
Employment Industries by Sex in Tyonek
The Tyonek industries that see more men than women are Mining, Quarrying, & Extraction (100.0%), Construction (100.0%), and Utilities (100.0%), whereas the industries that tend to have a higher number of women are Transportation & Warehousing (100.0%), Professional & Scientific (100.0%), and Educational Services (77.8%).
| Industry | Male | Female |
| Agriculture, Fishing & Hunting | 0 (0.0%) | 0 (0.0%) |
| Mining, Quarrying, & Extraction | 2 (100.0%) | 0 (0.0%) |
| Construction | 9 (100.0%) | 0 (0.0%) |
| Manufacturing | 0 (0.0%) | 0 (0.0%) |
| Wholesale Trade | 0 (0.0%) | 0 (0.0%) |
| Retail Trade | 0 (0.0%) | 0 (0.0%) |
| Transportation & Warehousing | 0 (0.0%) | 2 (100.0%) |
| Utilities | 7 (100.0%) | 0 (0.0%) |
| Information | 0 (0.0%) | 0 (0.0%) |
| Finance & Insurance | 0 (0.0%) | 0 (0.0%) |
| Real Estate, Rental & Leasing | 2 (100.0%) | 0 (0.0%) |
| Professional & Scientific | 0 (0.0%) | 5 (100.0%) |
| Enterprise Management | 0 (0.0%) | 0 (0.0%) |
| Administrative & Support | 7 (100.0%) | 0 (0.0%) |
| Educational Services | 2 (22.2%) | 7 (77.8%) |
| Health Care & Social Assistance | 9 (52.9%) | 8 (47.1%) |
| Arts, Entertainment & Recreation | 0 (0.0%) | 0 (0.0%) |
| Accommodation & Food Services | 8 (100.0%) | 0 (0.0%) |
| Public Administration | 30 (51.7%) | 28 (48.3%) |
| Total | 76 (60.3%) | 50 (39.7%) |
Education in Tyonek
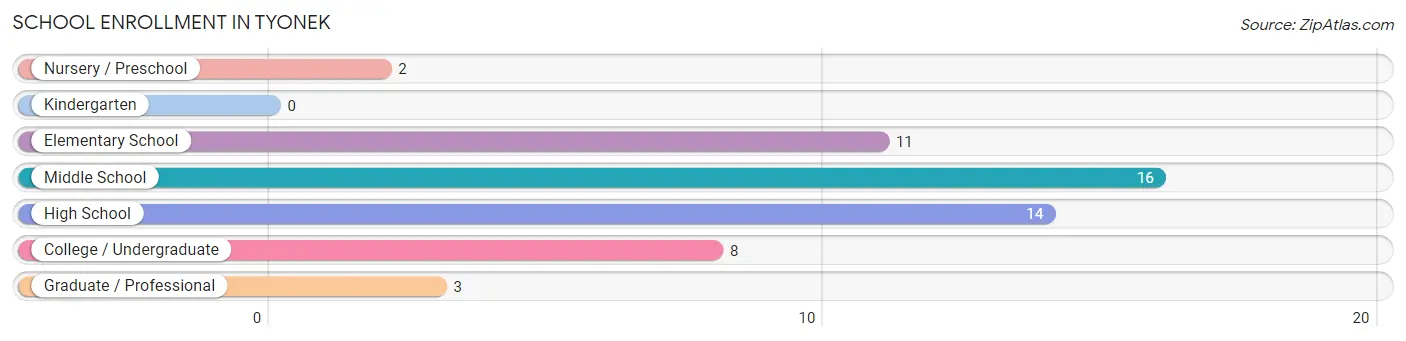
School Enrollment in Tyonek
The most common levels of schooling among the 54 students in Tyonek are middle school (16 | 29.6%), high school (14 | 25.9%), and elementary school (11 | 20.4%).
| School Level | # Students | % Students |
| Nursery / Preschool | 2 | 3.7% |
| Kindergarten | 0 | 0.0% |
| Elementary School | 11 | 20.4% |
| Middle School | 16 | 29.6% |
| High School | 14 | 25.9% |
| College / Undergraduate | 8 | 14.8% |
| Graduate / Professional | 3 | 5.6% |
| Total | 54 | 100.0% |
School Enrollment by Age by Funding Source in Tyonek
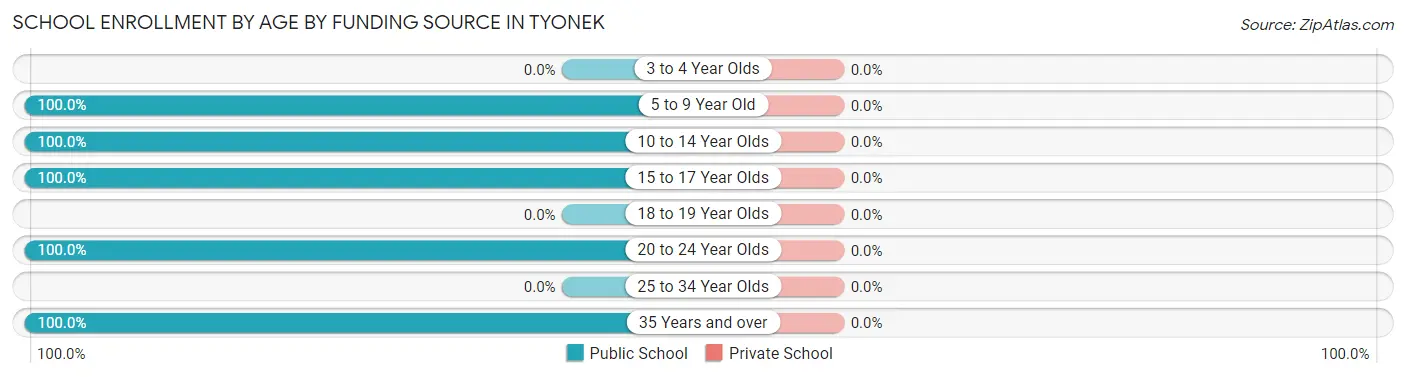
| Age Bracket | Public School | Private School |
| 3 to 4 Year Olds | 0 (0.0%) | 0 (0.0%) |
| 5 to 9 Year Old | 13 (100.0%) | 0 (0.0%) |
| 10 to 14 Year Olds | 21 (100.0%) | 0 (0.0%) |
| 15 to 17 Year Olds | 9 (100.0%) | 0 (0.0%) |
| 18 to 19 Year Olds | 0 (0.0%) | 0 (0.0%) |
| 20 to 24 Year Olds | 6 (100.0%) | 0 (0.0%) |
| 25 to 34 Year Olds | 0 (0.0%) | 0 (0.0%) |
| 35 Years and over | 5 (100.0%) | 0 (0.0%) |
| Total | 54 (100.0%) | 0 (0.0%) |
Educational Attainment by Field of Study in Tyonek
Education (3 | 60.0%), and business (2 | 40.0%) are the most common fields of study among 5 individuals in Tyonek who have obtained a bachelor's degree or higher.
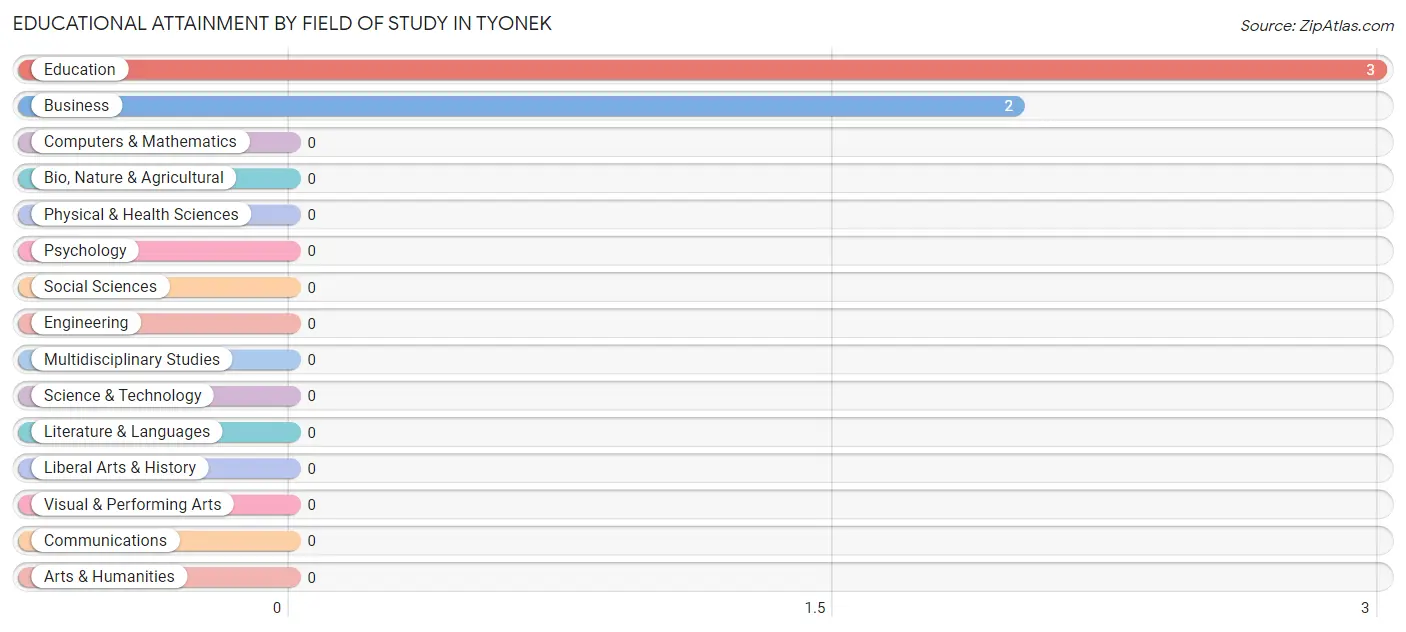
| Field of Study | # Graduates | % Graduates |
| Computers & Mathematics | 0 | 0.0% |
| Bio, Nature & Agricultural | 0 | 0.0% |
| Physical & Health Sciences | 0 | 0.0% |
| Psychology | 0 | 0.0% |
| Social Sciences | 0 | 0.0% |
| Engineering | 0 | 0.0% |
| Multidisciplinary Studies | 0 | 0.0% |
| Science & Technology | 0 | 0.0% |
| Business | 2 | 40.0% |
| Education | 3 | 60.0% |
| Literature & Languages | 0 | 0.0% |
| Liberal Arts & History | 0 | 0.0% |
| Visual & Performing Arts | 0 | 0.0% |
| Communications | 0 | 0.0% |
| Arts & Humanities | 0 | 0.0% |
| Total | 5 | 100.0% |
Transportation & Commute in Tyonek
Vehicle Availability by Sex in Tyonek
The most prevalent vehicle ownership categories in Tyonek are males with 1 vehicle (30, accounting for 41.7%) and females with 1 vehicle (19, making up 60.0%).
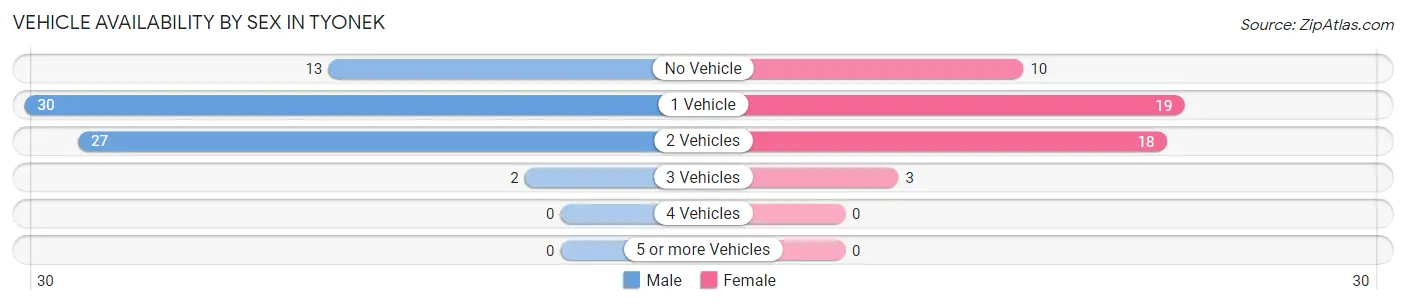
| Vehicles Available | Male | Female |
| No Vehicle | 13 (18.1%) | 10 (20.0%) |
| 1 Vehicle | 30 (41.7%) | 19 (38.0%) |
| 2 Vehicles | 27 (37.5%) | 18 (36.0%) |
| 3 Vehicles | 2 (2.8%) | 3 (6.0%) |
| 4 Vehicles | 0 (0.0%) | 0 (0.0%) |
| 5 or more Vehicles | 0 (0.0%) | 0 (0.0%) |
| Total | 72 (100.0%) | 50 (100.0%) |
Commute Time in Tyonek
The most frequently occuring commute durations in Tyonek are 5 to 9 minutes (46 commuters, 45.5%), less than 5 minutes (40 commuters, 39.6%), and 10 to 14 minutes (6 commuters, 5.9%).
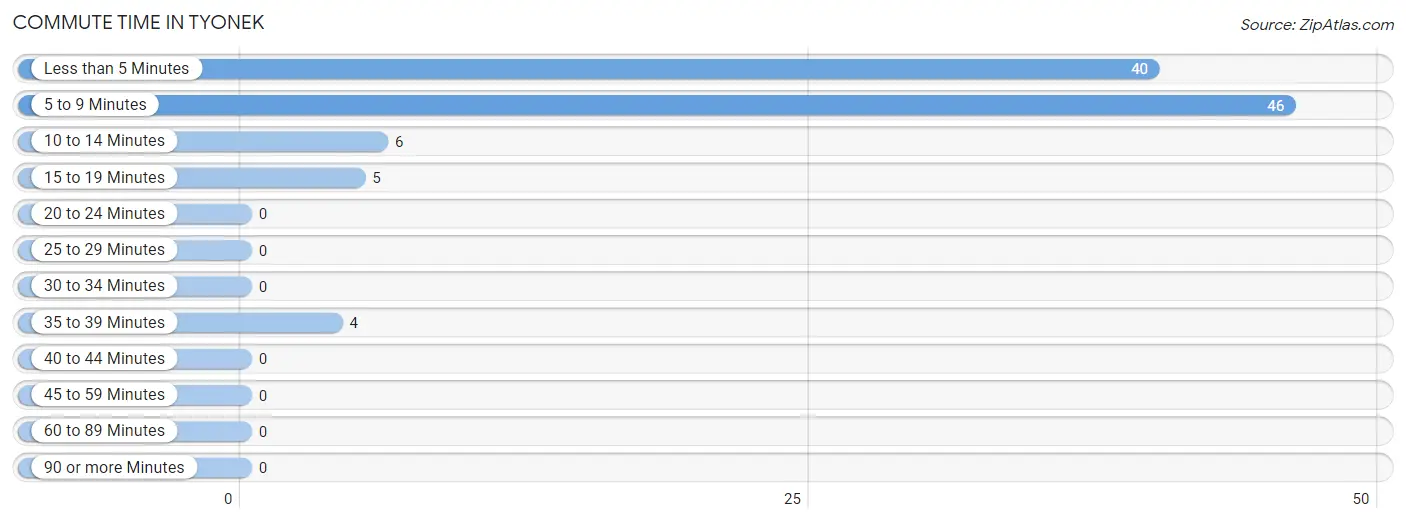
| Commute Time | # Commuters | % Commuters |
| Less than 5 Minutes | 40 | 39.6% |
| 5 to 9 Minutes | 46 | 45.5% |
| 10 to 14 Minutes | 6 | 5.9% |
| 15 to 19 Minutes | 5 | 5.0% |
| 20 to 24 Minutes | 0 | 0.0% |
| 25 to 29 Minutes | 0 | 0.0% |
| 30 to 34 Minutes | 0 | 0.0% |
| 35 to 39 Minutes | 4 | 4.0% |
| 40 to 44 Minutes | 0 | 0.0% |
| 45 to 59 Minutes | 0 | 0.0% |
| 60 to 89 Minutes | 0 | 0.0% |
| 90 or more Minutes | 0 | 0.0% |
Commute Time by Sex in Tyonek
The most common commute times in Tyonek are 5 to 9 minutes (27 commuters, 45.0%) for males and 5 to 9 minutes (19 commuters, 46.3%) for females.
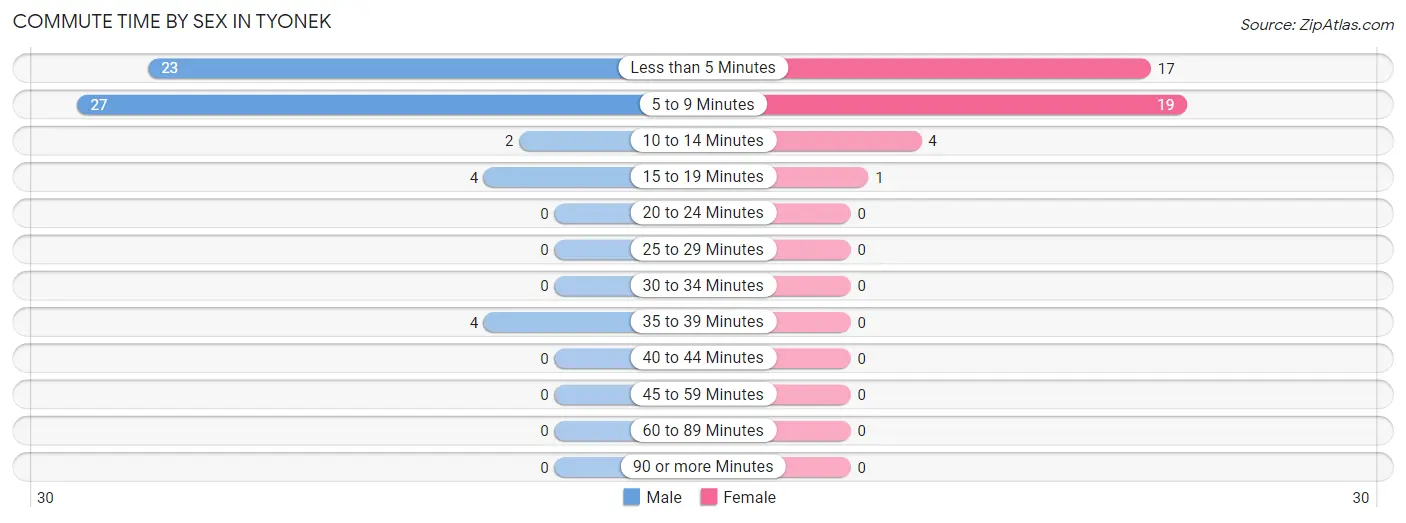
| Commute Time | Male | Female |
| Less than 5 Minutes | 23 (38.3%) | 17 (41.5%) |
| 5 to 9 Minutes | 27 (45.0%) | 19 (46.3%) |
| 10 to 14 Minutes | 2 (3.3%) | 4 (9.8%) |
| 15 to 19 Minutes | 4 (6.7%) | 1 (2.4%) |
| 20 to 24 Minutes | 0 (0.0%) | 0 (0.0%) |
| 25 to 29 Minutes | 0 (0.0%) | 0 (0.0%) |
| 30 to 34 Minutes | 0 (0.0%) | 0 (0.0%) |
| 35 to 39 Minutes | 4 (6.7%) | 0 (0.0%) |
| 40 to 44 Minutes | 0 (0.0%) | 0 (0.0%) |
| 45 to 59 Minutes | 0 (0.0%) | 0 (0.0%) |
| 60 to 89 Minutes | 0 (0.0%) | 0 (0.0%) |
| 90 or more Minutes | 0 (0.0%) | 0 (0.0%) |
Time of Departure to Work by Sex in Tyonek
The most frequent times of departure to work in Tyonek are 7:30 AM to 7:59 AM (13, 21.7%) for males and 8:30 AM to 8:59 AM (17, 41.5%) for females.
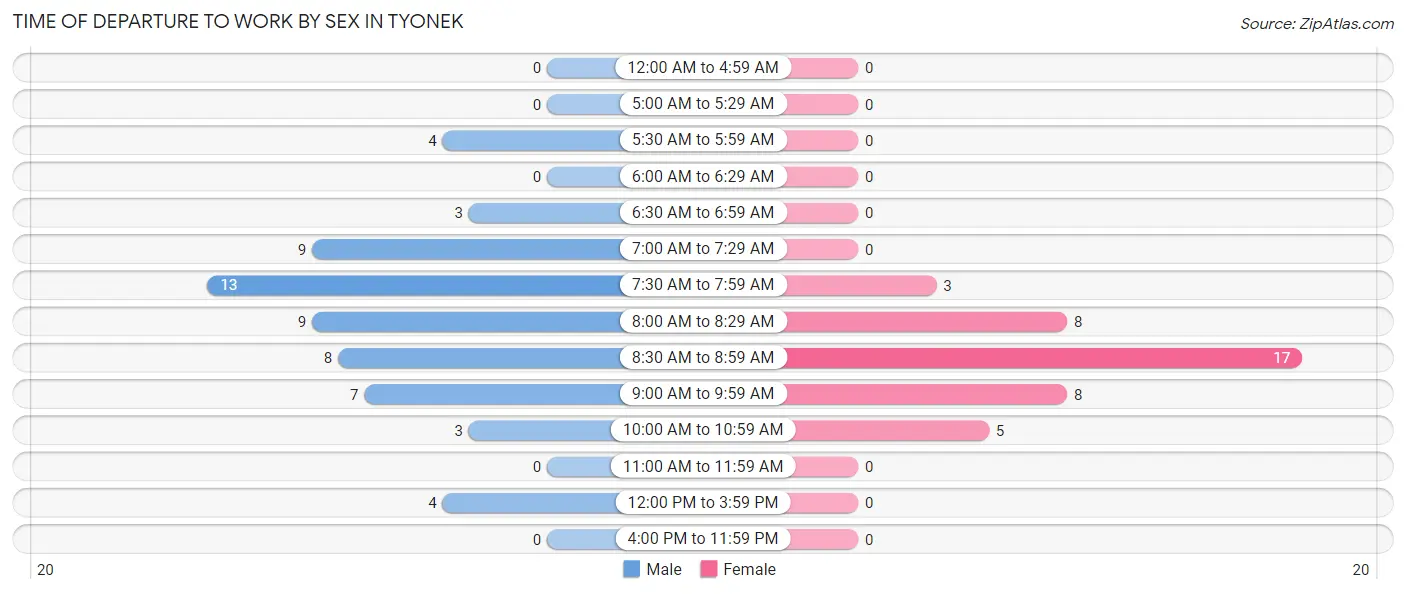
| Time of Departure | Male | Female |
| 12:00 AM to 4:59 AM | 0 (0.0%) | 0 (0.0%) |
| 5:00 AM to 5:29 AM | 0 (0.0%) | 0 (0.0%) |
| 5:30 AM to 5:59 AM | 4 (6.7%) | 0 (0.0%) |
| 6:00 AM to 6:29 AM | 0 (0.0%) | 0 (0.0%) |
| 6:30 AM to 6:59 AM | 3 (5.0%) | 0 (0.0%) |
| 7:00 AM to 7:29 AM | 9 (15.0%) | 0 (0.0%) |
| 7:30 AM to 7:59 AM | 13 (21.7%) | 3 (7.3%) |
| 8:00 AM to 8:29 AM | 9 (15.0%) | 8 (19.5%) |
| 8:30 AM to 8:59 AM | 8 (13.3%) | 17 (41.5%) |
| 9:00 AM to 9:59 AM | 7 (11.7%) | 8 (19.5%) |
| 10:00 AM to 10:59 AM | 3 (5.0%) | 5 (12.2%) |
| 11:00 AM to 11:59 AM | 0 (0.0%) | 0 (0.0%) |
| 12:00 PM to 3:59 PM | 4 (6.7%) | 0 (0.0%) |
| 4:00 PM to 11:59 PM | 0 (0.0%) | 0 (0.0%) |
| Total | 60 (100.0%) | 41 (100.0%) |
Housing Occupancy in Tyonek
Occupancy by Ownership in Tyonek
Of the total 105 dwellings in Tyonek, owner-occupied units account for 69 (65.7%), while renter-occupied units make up 36 (34.3%).
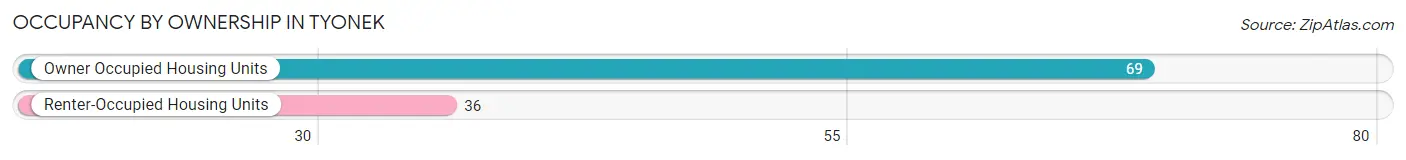
| Occupancy | # Housing Units | % Housing Units |
| Owner Occupied Housing Units | 69 | 65.7% |
| Renter-Occupied Housing Units | 36 | 34.3% |
| Total Occupied Housing Units | 105 | 100.0% |
Occupancy by Household Size in Tyonek
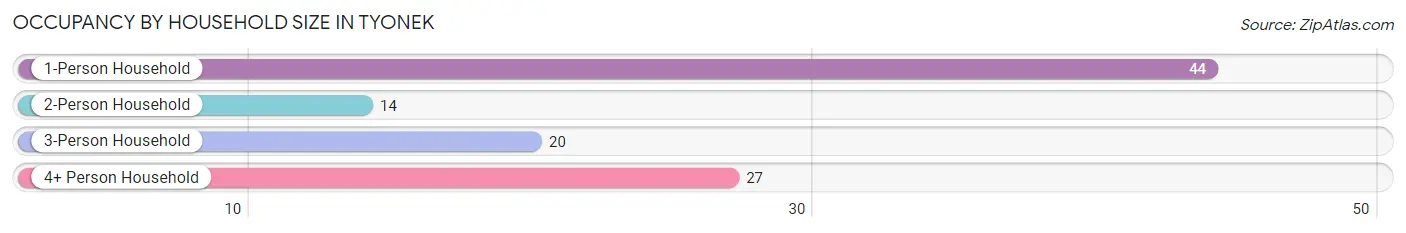
| Household Size | # Housing Units | % Housing Units |
| 1-Person Household | 44 | 41.9% |
| 2-Person Household | 14 | 13.3% |
| 3-Person Household | 20 | 19.1% |
| 4+ Person Household | 27 | 25.7% |
| Total Housing Units | 105 | 100.0% |
Occupancy by Ownership by Household Size in Tyonek
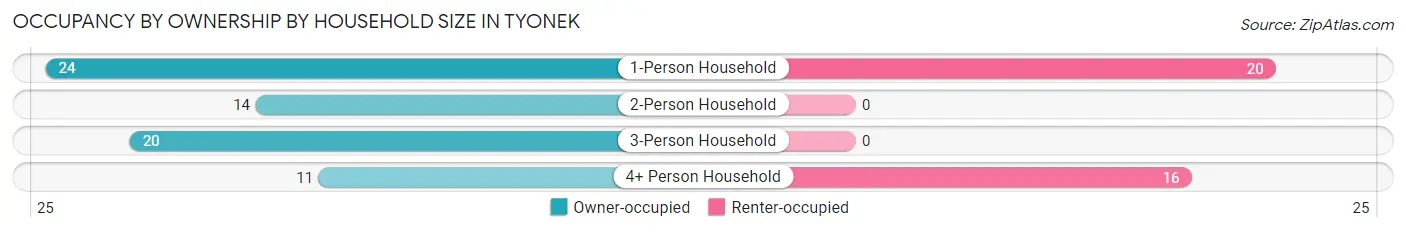
| Household Size | Owner-occupied | Renter-occupied |
| 1-Person Household | 24 (54.5%) | 20 (45.5%) |
| 2-Person Household | 14 (100.0%) | 0 (0.0%) |
| 3-Person Household | 20 (100.0%) | 0 (0.0%) |
| 4+ Person Household | 11 (40.7%) | 16 (59.3%) |
| Total Housing Units | 69 (65.7%) | 36 (34.3%) |
Occupancy by Educational Attainment in Tyonek
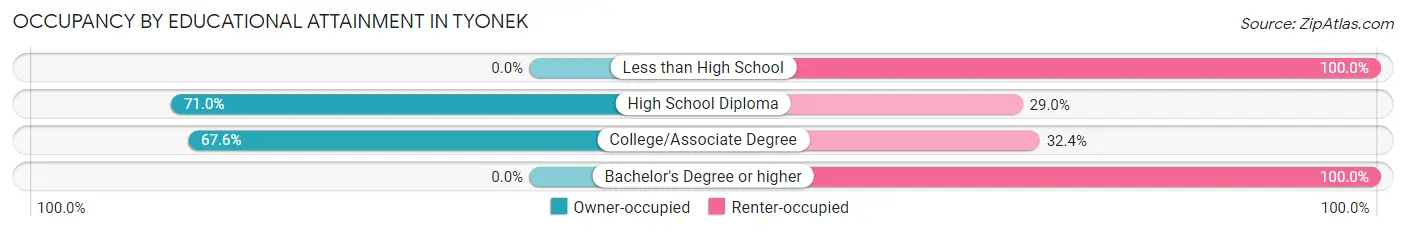
| Household Size | Owner-occupied | Renter-occupied |
| Less than High School | 0 (0.0%) | 4 (100.0%) |
| High School Diploma | 44 (71.0%) | 18 (29.0%) |
| College/Associate Degree | 25 (67.6%) | 12 (32.4%) |
| Bachelor's Degree or higher | 0 (0.0%) | 2 (100.0%) |
Occupancy by Age of Householder in Tyonek
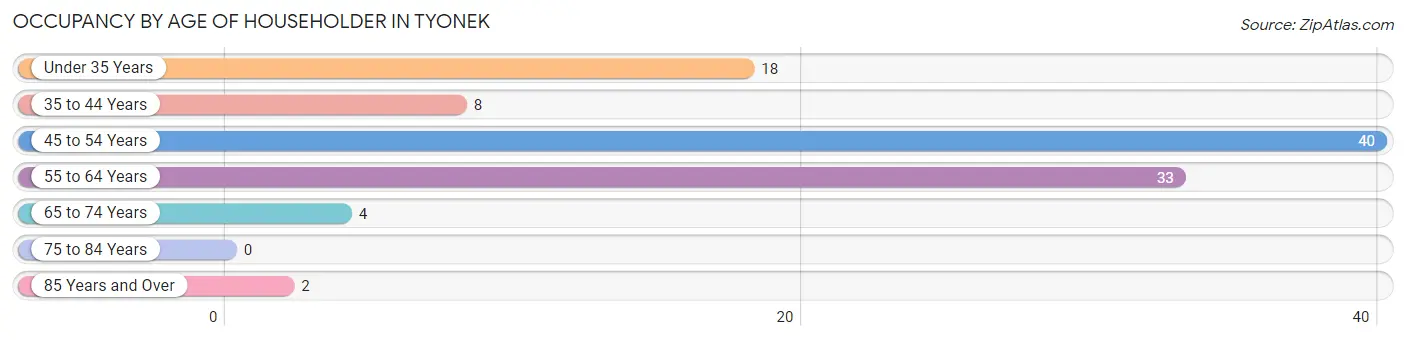
| Age Bracket | # Households | % Households |
| Under 35 Years | 18 | 17.1% |
| 35 to 44 Years | 8 | 7.6% |
| 45 to 54 Years | 40 | 38.1% |
| 55 to 64 Years | 33 | 31.4% |
| 65 to 74 Years | 4 | 3.8% |
| 75 to 84 Years | 0 | 0.0% |
| 85 Years and Over | 2 | 1.9% |
| Total | 105 | 100.0% |
Housing Finances in Tyonek
Median Income by Occupancy in Tyonek
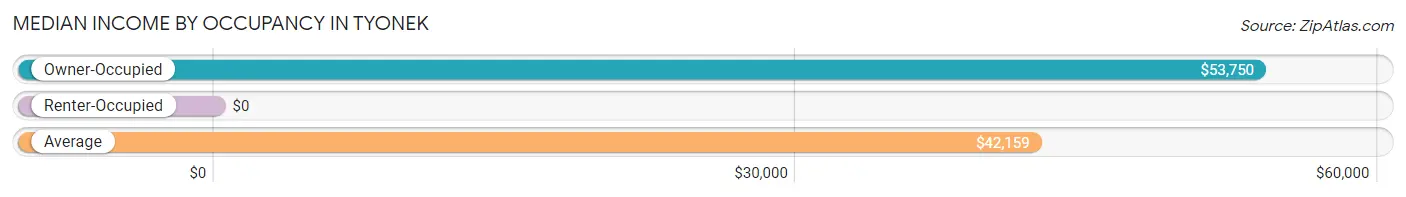
| Occupancy Type | # Households | Median Income |
| Owner-Occupied | 69 (65.7%) | $53,750 |
| Renter-Occupied | 36 (34.3%) | $0 |
| Average | 105 (100.0%) | $42,159 |
Occupancy by Householder Income Bracket in Tyonek
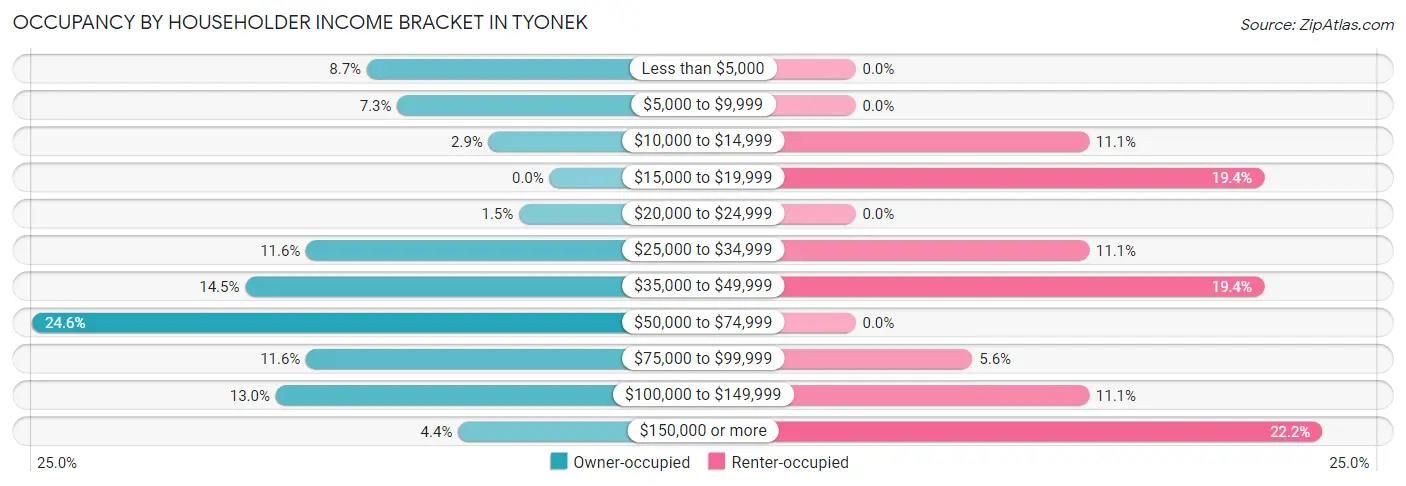
| Income Bracket | Owner-occupied | Renter-occupied |
| Less than $5,000 | 6 (8.7%) | 0 (0.0%) |
| $5,000 to $9,999 | 5 (7.2%) | 0 (0.0%) |
| $10,000 to $14,999 | 2 (2.9%) | 4 (11.1%) |
| $15,000 to $19,999 | 0 (0.0%) | 7 (19.4%) |
| $20,000 to $24,999 | 1 (1.5%) | 0 (0.0%) |
| $25,000 to $34,999 | 8 (11.6%) | 4 (11.1%) |
| $35,000 to $49,999 | 10 (14.5%) | 7 (19.4%) |
| $50,000 to $74,999 | 17 (24.6%) | 0 (0.0%) |
| $75,000 to $99,999 | 8 (11.6%) | 2 (5.6%) |
| $100,000 to $149,999 | 9 (13.0%) | 4 (11.1%) |
| $150,000 or more | 3 (4.3%) | 8 (22.2%) |
| Total | 69 (100.0%) | 36 (100.0%) |
Monthly Housing Cost Tiers in Tyonek
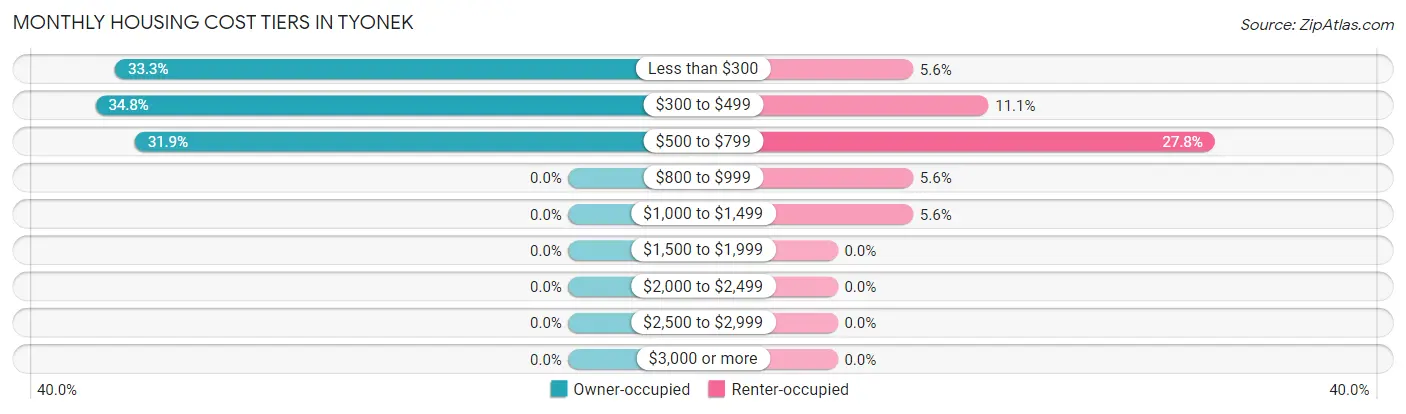
| Monthly Cost | Owner-occupied | Renter-occupied |
| Less than $300 | 23 (33.3%) | 2 (5.6%) |
| $300 to $499 | 24 (34.8%) | 4 (11.1%) |
| $500 to $799 | 22 (31.9%) | 10 (27.8%) |
| $800 to $999 | 0 (0.0%) | 2 (5.6%) |
| $1,000 to $1,499 | 0 (0.0%) | 2 (5.6%) |
| $1,500 to $1,999 | 0 (0.0%) | 0 (0.0%) |
| $2,000 to $2,499 | 0 (0.0%) | 0 (0.0%) |
| $2,500 to $2,999 | 0 (0.0%) | 0 (0.0%) |
| $3,000 or more | 0 (0.0%) | 0 (0.0%) |
| Total | 69 (100.0%) | 36 (100.0%) |
Physical Housing Characteristics in Tyonek
Housing Structures in Tyonek
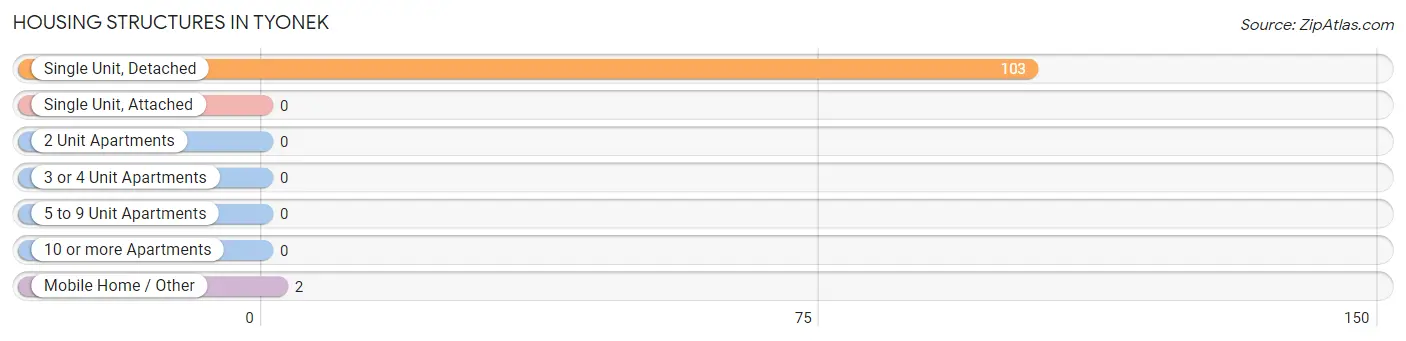
| Structure Type | # Housing Units | % Housing Units |
| Single Unit, Detached | 103 | 98.1% |
| Single Unit, Attached | 0 | 0.0% |
| 2 Unit Apartments | 0 | 0.0% |
| 3 or 4 Unit Apartments | 0 | 0.0% |
| 5 to 9 Unit Apartments | 0 | 0.0% |
| 10 or more Apartments | 0 | 0.0% |
| Mobile Home / Other | 2 | 1.9% |
| Total | 105 | 100.0% |
Housing Structures by Occupancy in Tyonek
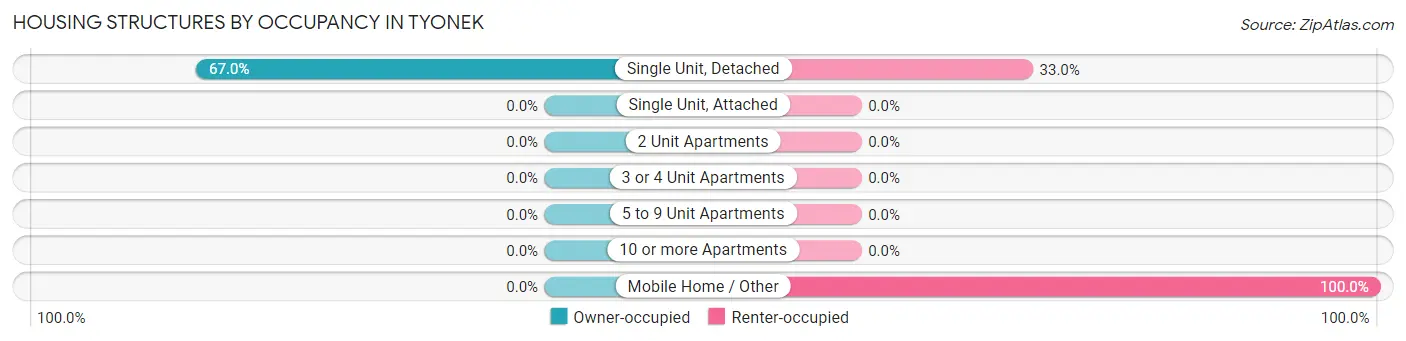
| Structure Type | Owner-occupied | Renter-occupied |
| Single Unit, Detached | 69 (67.0%) | 34 (33.0%) |
| Single Unit, Attached | 0 (0.0%) | 0 (0.0%) |
| 2 Unit Apartments | 0 (0.0%) | 0 (0.0%) |
| 3 or 4 Unit Apartments | 0 (0.0%) | 0 (0.0%) |
| 5 to 9 Unit Apartments | 0 (0.0%) | 0 (0.0%) |
| 10 or more Apartments | 0 (0.0%) | 0 (0.0%) |
| Mobile Home / Other | 0 (0.0%) | 2 (100.0%) |
| Total | 69 (65.7%) | 36 (34.3%) |
Housing Structures by Number of Rooms in Tyonek
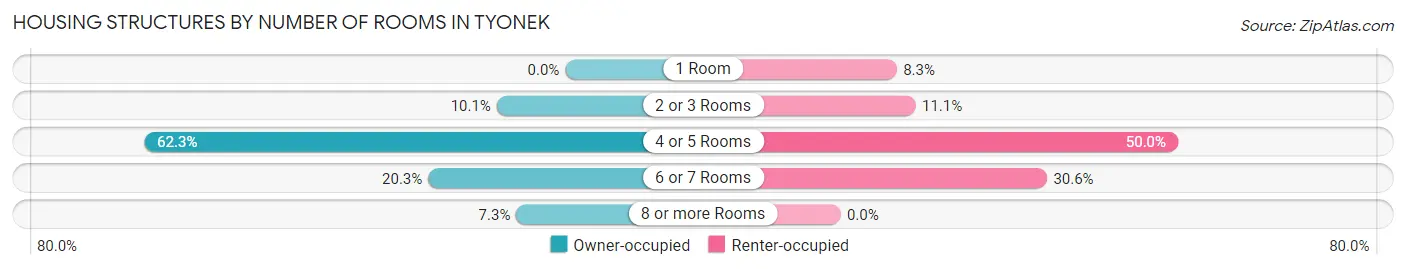
| Number of Rooms | Owner-occupied | Renter-occupied |
| 1 Room | 0 (0.0%) | 3 (8.3%) |
| 2 or 3 Rooms | 7 (10.1%) | 4 (11.1%) |
| 4 or 5 Rooms | 43 (62.3%) | 18 (50.0%) |
| 6 or 7 Rooms | 14 (20.3%) | 11 (30.6%) |
| 8 or more Rooms | 5 (7.2%) | 0 (0.0%) |
| Total | 69 (100.0%) | 36 (100.0%) |
Housing Structure by Heating Type in Tyonek
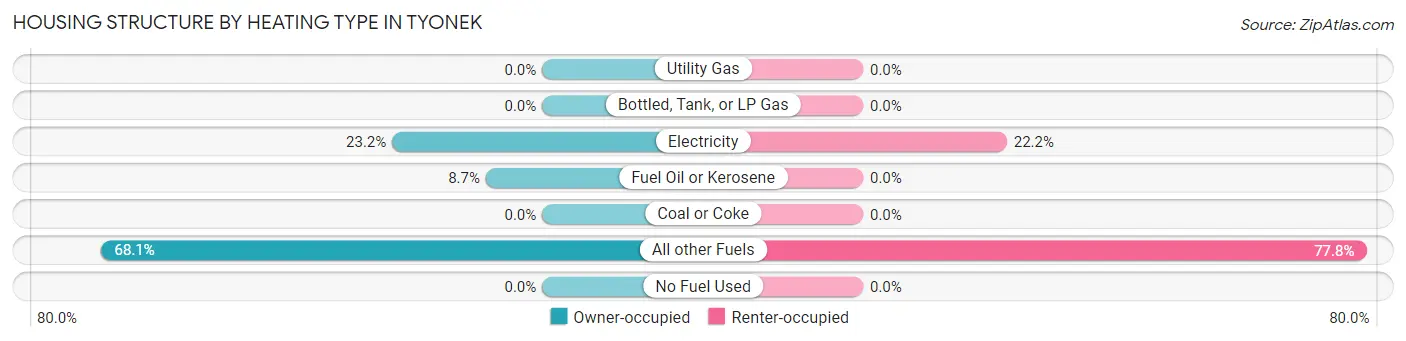
| Heating Type | Owner-occupied | Renter-occupied |
| Utility Gas | 0 (0.0%) | 0 (0.0%) |
| Bottled, Tank, or LP Gas | 0 (0.0%) | 0 (0.0%) |
| Electricity | 16 (23.2%) | 8 (22.2%) |
| Fuel Oil or Kerosene | 6 (8.7%) | 0 (0.0%) |
| Coal or Coke | 0 (0.0%) | 0 (0.0%) |
| All other Fuels | 47 (68.1%) | 28 (77.8%) |
| No Fuel Used | 0 (0.0%) | 0 (0.0%) |
| Total | 69 (100.0%) | 36 (100.0%) |
Household Vehicle Usage in Tyonek
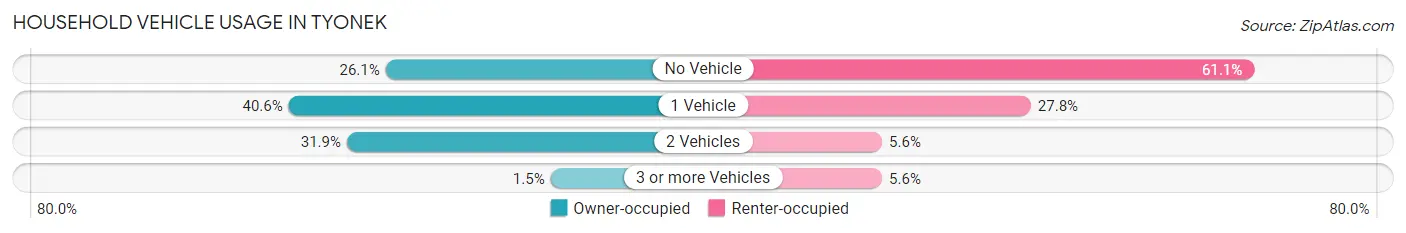
| Vehicles per Household | Owner-occupied | Renter-occupied |
| No Vehicle | 18 (26.1%) | 22 (61.1%) |
| 1 Vehicle | 28 (40.6%) | 10 (27.8%) |
| 2 Vehicles | 22 (31.9%) | 2 (5.6%) |
| 3 or more Vehicles | 1 (1.5%) | 2 (5.6%) |
| Total | 69 (100.0%) | 36 (100.0%) |
Real Estate & Mortgages in Tyonek
Real Estate and Mortgage Overview in Tyonek
| Characteristic | Without Mortgage | With Mortgage |
| Housing Units | 65 | 4 |
| Median Property Value | $48,300 | $0 |
| Median Household Income | $52,750 | $0 |
| Monthly Housing Costs | $369 | $0 |
| Real Estate Taxes | - | - |
Property Value by Mortgage Status in Tyonek
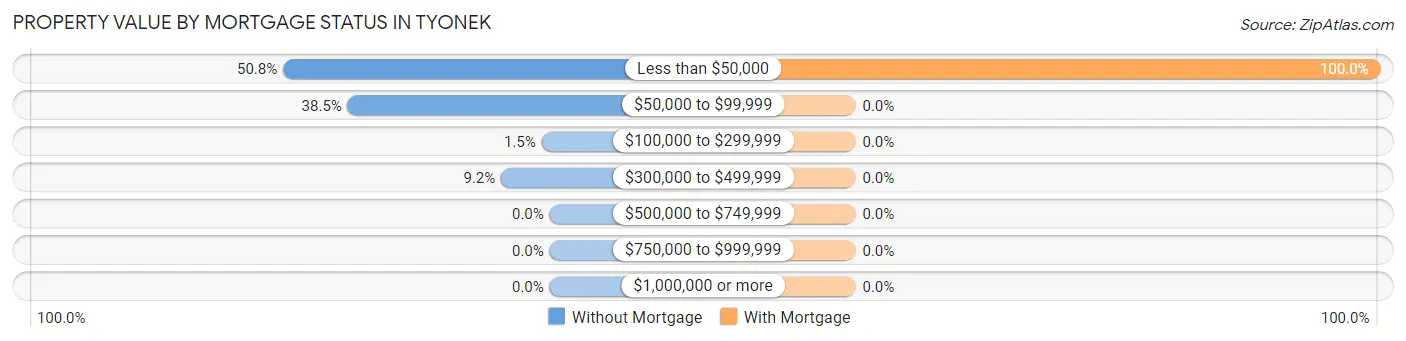
| Property Value | Without Mortgage | With Mortgage |
| Less than $50,000 | 33 (50.8%) | 4 (100.0%) |
| $50,000 to $99,999 | 25 (38.5%) | 0 (0.0%) |
| $100,000 to $299,999 | 1 (1.5%) | 0 (0.0%) |
| $300,000 to $499,999 | 6 (9.2%) | 0 (0.0%) |
| $500,000 to $749,999 | 0 (0.0%) | 0 (0.0%) |
| $750,000 to $999,999 | 0 (0.0%) | 0 (0.0%) |
| $1,000,000 or more | 0 (0.0%) | 0 (0.0%) |
| Total | 65 (100.0%) | 4 (100.0%) |
Household Income by Mortgage Status in Tyonek
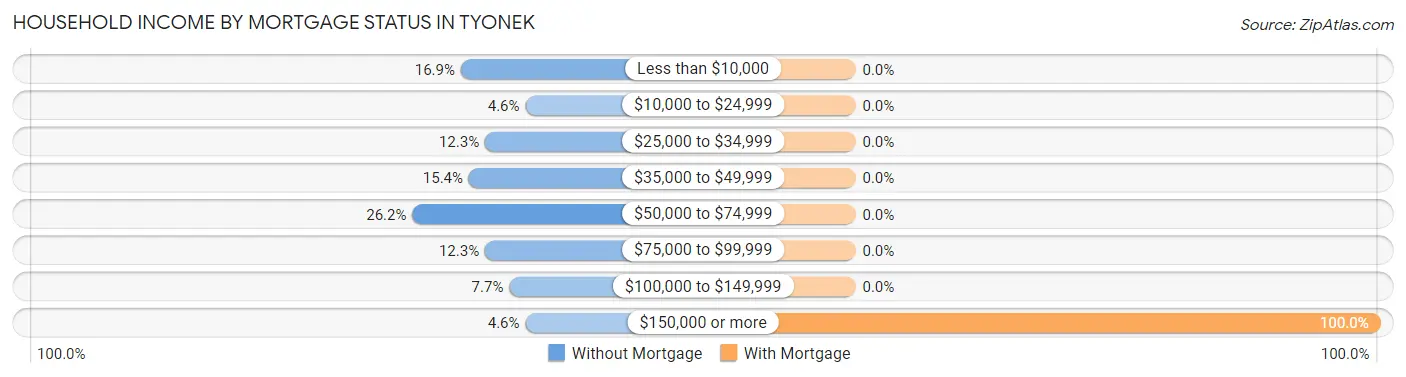
| Household Income | Without Mortgage | With Mortgage |
| Less than $10,000 | 11 (16.9%) | 0 (0.0%) |
| $10,000 to $24,999 | 3 (4.6%) | 0 (0.0%) |
| $25,000 to $34,999 | 8 (12.3%) | 0 (0.0%) |
| $35,000 to $49,999 | 10 (15.4%) | 0 (0.0%) |
| $50,000 to $74,999 | 17 (26.2%) | 0 (0.0%) |
| $75,000 to $99,999 | 8 (12.3%) | 0 (0.0%) |
| $100,000 to $149,999 | 5 (7.7%) | 0 (0.0%) |
| $150,000 or more | 3 (4.6%) | 4 (100.0%) |
| Total | 65 (100.0%) | 4 (100.0%) |
Property Value to Household Income Ratio in Tyonek
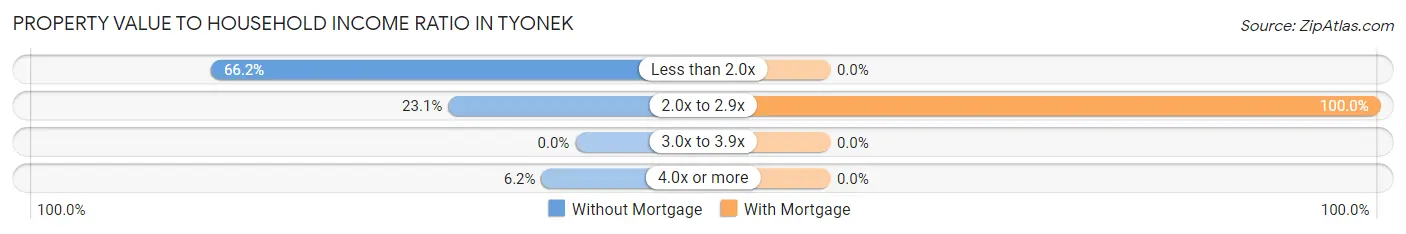
| Value-to-Income Ratio | Without Mortgage | With Mortgage |
| Less than 2.0x | 43 (66.1%) | 0 (0.0%) |
| 2.0x to 2.9x | 15 (23.1%) | 4 (100.0%) |
| 3.0x to 3.9x | 0 (0.0%) | 0 (0.0%) |
| 4.0x or more | 4 (6.1%) | 0 (0.0%) |
| Total | 65 (100.0%) | 4 (100.0%) |
Real Estate Taxes by Mortgage Status in Tyonek
| Property Taxes | Without Mortgage | With Mortgage |
| Less than $800 | 0 (0.0%) | 0 (0.0%) |
| $800 to $1,499 | 0 (0.0%) | 0 (0.0%) |
| $800 to $1,499 | 0 (0.0%) | 0 (0.0%) |
| Total | 65 (100.0%) | 4 (100.0%) |
Health & Disability in Tyonek
Health Insurance Coverage by Age in Tyonek
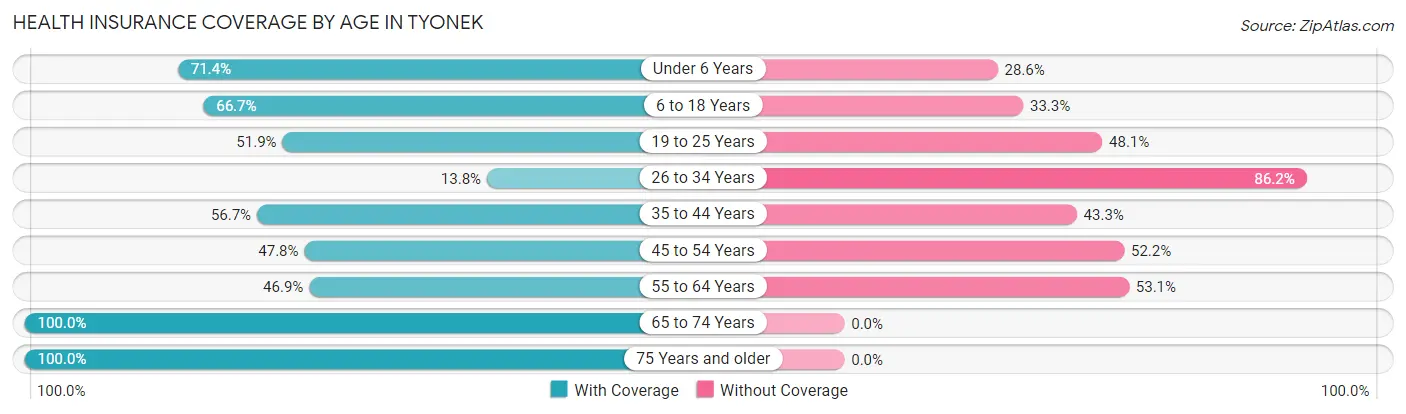
| Age Bracket | With Coverage | Without Coverage |
| Under 6 Years | 5 (71.4%) | 2 (28.6%) |
| 6 to 18 Years | 30 (66.7%) | 15 (33.3%) |
| 19 to 25 Years | 27 (51.9%) | 25 (48.1%) |
| 26 to 34 Years | 4 (13.8%) | 25 (86.2%) |
| 35 to 44 Years | 17 (56.7%) | 13 (43.3%) |
| 45 to 54 Years | 22 (47.8%) | 24 (52.2%) |
| 55 to 64 Years | 23 (46.9%) | 26 (53.1%) |
| 65 to 74 Years | 6 (100.0%) | 0 (0.0%) |
| 75 Years and older | 2 (100.0%) | 0 (0.0%) |
| Total | 136 (51.1%) | 130 (48.9%) |
Health Insurance Coverage by Citizenship Status in Tyonek
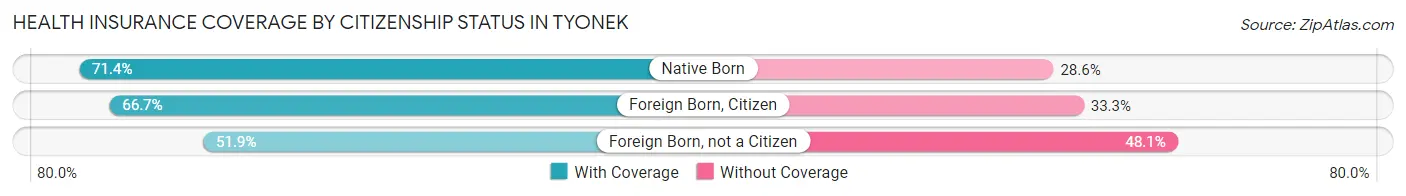
| Citizenship Status | With Coverage | Without Coverage |
| Native Born | 5 (71.4%) | 2 (28.6%) |
| Foreign Born, Citizen | 30 (66.7%) | 15 (33.3%) |
| Foreign Born, not a Citizen | 27 (51.9%) | 25 (48.1%) |
Health Insurance Coverage by Household Income in Tyonek
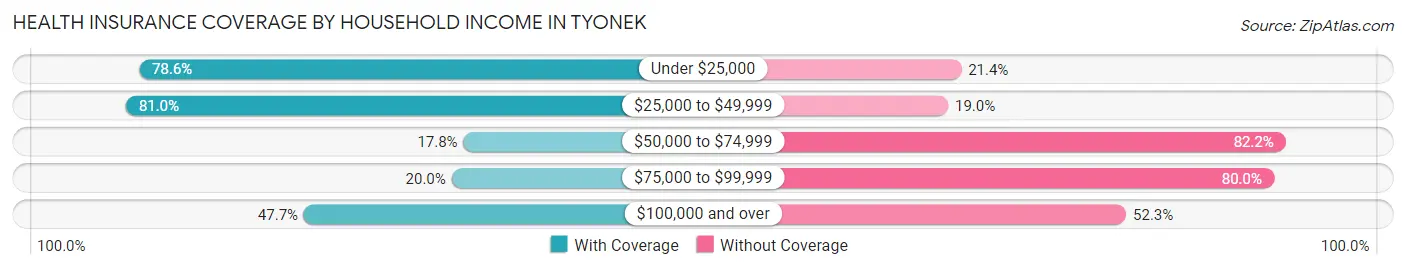
| Household Income | With Coverage | Without Coverage |
| Under $25,000 | 33 (78.6%) | 9 (21.4%) |
| $25,000 to $49,999 | 47 (81.0%) | 11 (19.0%) |
| $50,000 to $74,999 | 8 (17.8%) | 37 (82.2%) |
| $75,000 to $99,999 | 7 (20.0%) | 28 (80.0%) |
| $100,000 and over | 41 (47.7%) | 45 (52.3%) |
Public vs Private Health Insurance Coverage by Age in Tyonek
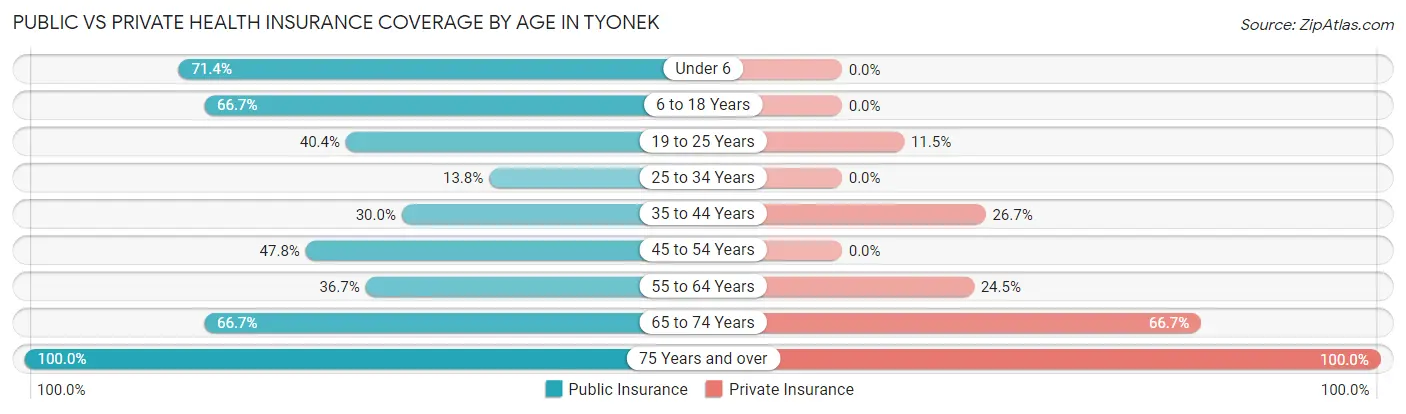
| Age Bracket | Public Insurance | Private Insurance |
| Under 6 | 5 (71.4%) | 0 (0.0%) |
| 6 to 18 Years | 30 (66.7%) | 0 (0.0%) |
| 19 to 25 Years | 21 (40.4%) | 6 (11.5%) |
| 25 to 34 Years | 4 (13.8%) | 0 (0.0%) |
| 35 to 44 Years | 9 (30.0%) | 8 (26.7%) |
| 45 to 54 Years | 22 (47.8%) | 0 (0.0%) |
| 55 to 64 Years | 18 (36.7%) | 12 (24.5%) |
| 65 to 74 Years | 4 (66.7%) | 4 (66.7%) |
| 75 Years and over | 2 (100.0%) | 2 (100.0%) |
| Total | 115 (43.2%) | 32 (12.0%) |
Disability Status by Sex by Age in Tyonek
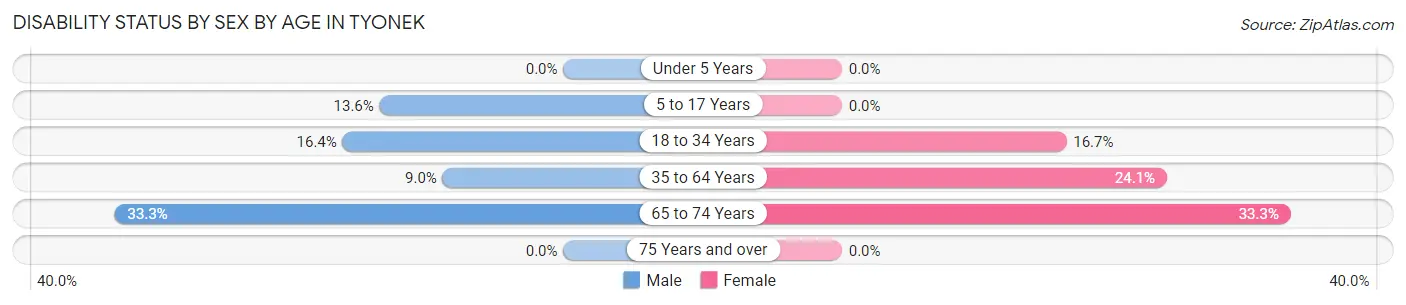
| Age Bracket | Male | Female |
| Under 5 Years | 0 (0.0%) | 0 (0.0%) |
| 5 to 17 Years | 3 (13.6%) | 0 (0.0%) |
| 18 to 34 Years | 10 (16.4%) | 4 (16.7%) |
| 35 to 64 Years | 6 (9.0%) | 14 (24.1%) |
| 65 to 74 Years | 1 (33.3%) | 1 (33.3%) |
| 75 Years and over | 0 (0.0%) | 0 (0.0%) |
Disability Class by Sex by Age in Tyonek
Disability Class: Hearing Difficulty
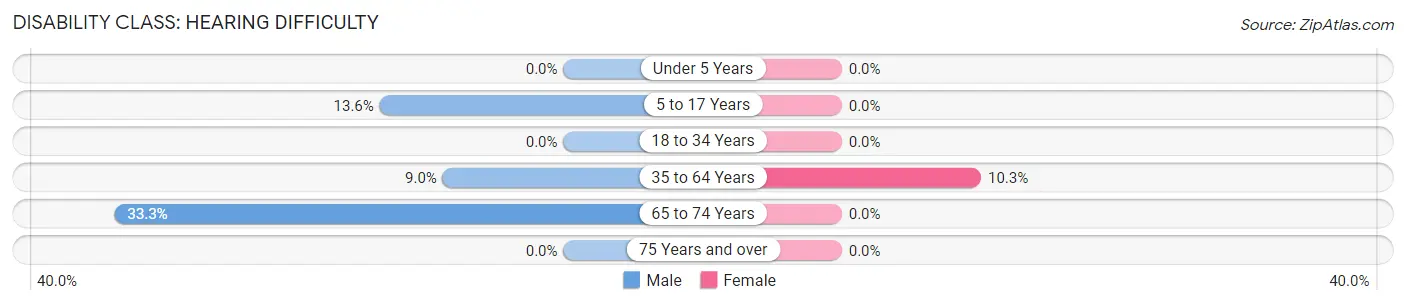
| Age Bracket | Male | Female |
| Under 5 Years | 0 (0.0%) | 0 (0.0%) |
| 5 to 17 Years | 3 (13.6%) | 0 (0.0%) |
| 18 to 34 Years | 0 (0.0%) | 0 (0.0%) |
| 35 to 64 Years | 6 (9.0%) | 6 (10.3%) |
| 65 to 74 Years | 1 (33.3%) | 0 (0.0%) |
| 75 Years and over | 0 (0.0%) | 0 (0.0%) |
Disability Class: Vision Difficulty
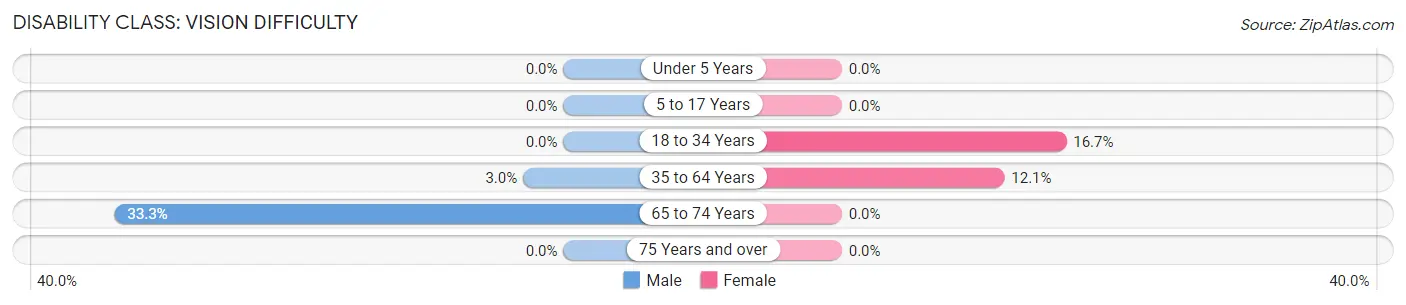
| Age Bracket | Male | Female |
| Under 5 Years | 0 (0.0%) | 0 (0.0%) |
| 5 to 17 Years | 0 (0.0%) | 0 (0.0%) |
| 18 to 34 Years | 0 (0.0%) | 4 (16.7%) |
| 35 to 64 Years | 2 (3.0%) | 7 (12.1%) |
| 65 to 74 Years | 1 (33.3%) | 0 (0.0%) |
| 75 Years and over | 0 (0.0%) | 0 (0.0%) |
Disability Class: Cognitive Difficulty
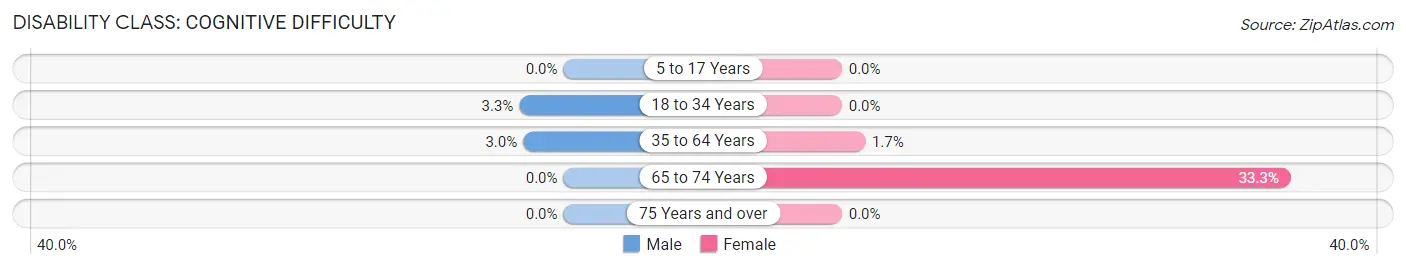
| Age Bracket | Male | Female |
| 5 to 17 Years | 0 (0.0%) | 0 (0.0%) |
| 18 to 34 Years | 2 (3.3%) | 0 (0.0%) |
| 35 to 64 Years | 2 (3.0%) | 1 (1.7%) |
| 65 to 74 Years | 0 (0.0%) | 1 (33.3%) |
| 75 Years and over | 0 (0.0%) | 0 (0.0%) |
Disability Class: Ambulatory Difficulty
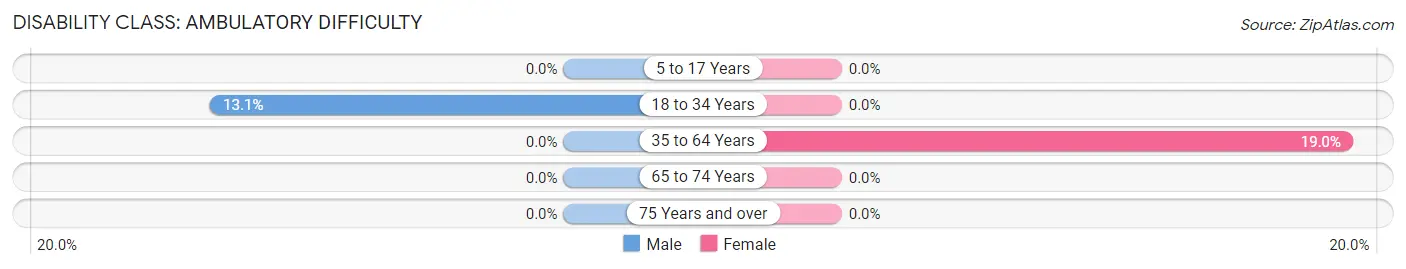
| Age Bracket | Male | Female |
| 5 to 17 Years | 0 (0.0%) | 0 (0.0%) |
| 18 to 34 Years | 8 (13.1%) | 0 (0.0%) |
| 35 to 64 Years | 0 (0.0%) | 11 (19.0%) |
| 65 to 74 Years | 0 (0.0%) | 0 (0.0%) |
| 75 Years and over | 0 (0.0%) | 0 (0.0%) |
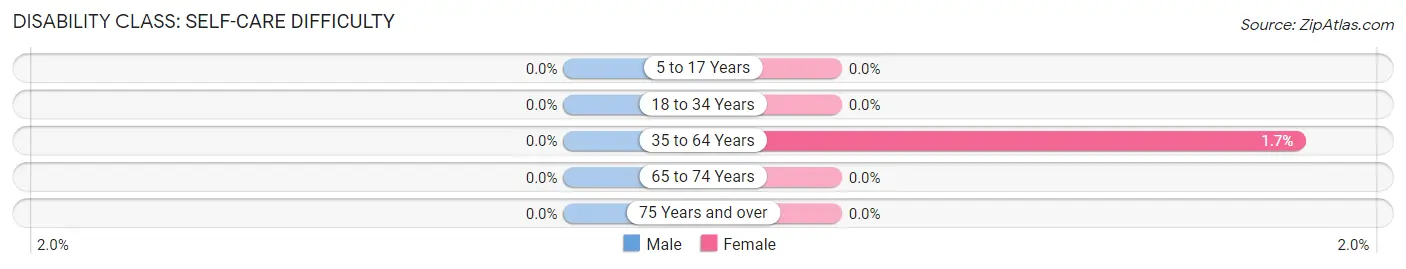
Disability Class: Self-Care Difficulty
| Age Bracket | Male | Female |
| 5 to 17 Years | 0 (0.0%) | 0 (0.0%) |
| 18 to 34 Years | 0 (0.0%) | 0 (0.0%) |
| 35 to 64 Years | 0 (0.0%) | 1 (1.7%) |
| 65 to 74 Years | 0 (0.0%) | 0 (0.0%) |
| 75 Years and over | 0 (0.0%) | 0 (0.0%) |
Technology Access in Tyonek
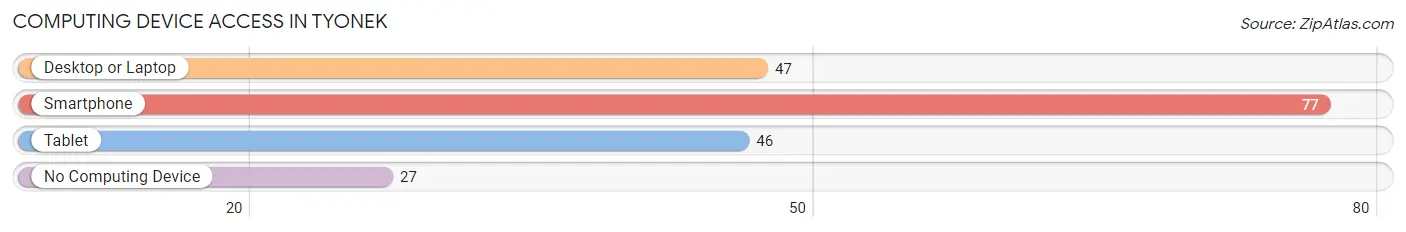
Computing Device Access in Tyonek
| Device Type | # Households | % Households |
| Desktop or Laptop | 47 | 44.8% |
| Smartphone | 77 | 73.3% |
| Tablet | 46 | 43.8% |
| No Computing Device | 27 | 25.7% |
| Total | 105 | 100.0% |
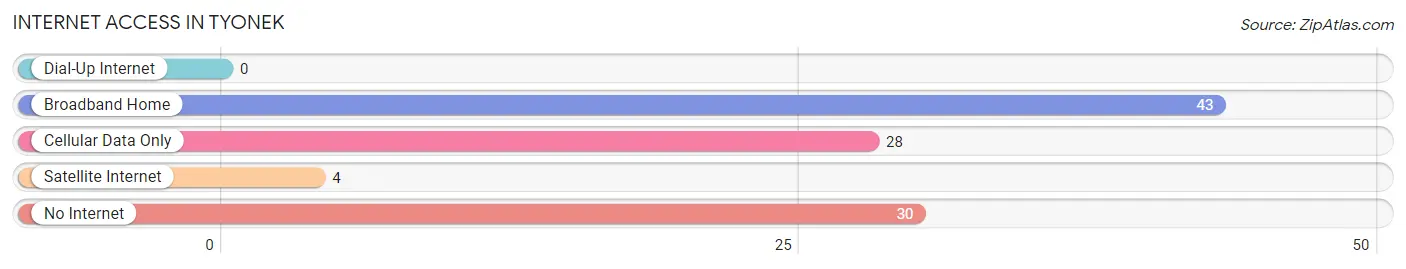
Internet Access in Tyonek
| Internet Type | # Households | % Households |
| Dial-Up Internet | 0 | 0.0% |
| Broadband Home | 43 | 40.9% |
| Cellular Data Only | 28 | 26.7% |
| Satellite Internet | 4 | 3.8% |
| No Internet | 30 | 28.6% |
| Total | 105 | 100.0% |
Tyonek Summary
Tyonek is a small unincorporated community located in the Matanuska-Susitna Borough of Alaska. It is situated on the west bank of the Cook Inlet, approximately 40 miles southwest of Anchorage. The population of Tyonek was estimated to be around 200 people in 2020.
History
The Dena'ina Athabascan people have lived in the area for thousands of years. The Dena'ina name for the area is "Tuyon," which means "big water." The first non-Native settlers arrived in the area in the late 1800s. They were mostly fishermen and trappers who were attracted to the area by the abundance of fish and wildlife.
In the early 1900s, the U.S. Army established a military post in the area. The post was used to protect the area from potential threats from the Soviet Union during the Cold War. The post was eventually abandoned in the late 1950s.
In the late 1960s, the Tyonek Native Corporation was established to manage the land and resources of the area. The corporation was created as part of the Alaska Native Claims Settlement Act of 1971. The corporation has since become a major employer in the area, providing jobs for many of the local residents.
Geography
Tyonek is located on the west bank of the Cook Inlet, approximately 40 miles southwest of Anchorage. The area is mostly flat, with some rolling hills. The terrain is mostly covered in tundra and grasses. The climate is subarctic, with cold winters and mild summers.
The area is home to a variety of wildlife, including moose, caribou, bears, wolves, and many species of birds. The nearby waters of the Cook Inlet are home to a variety of fish, including salmon, halibut, and cod.
Economy
The economy of Tyonek is largely based on fishing and tourism. The Tyonek Native Corporation is the largest employer in the area, providing jobs for many of the local residents. The corporation also owns and operates a fish processing plant, which processes and ships fish to markets around the world.
The area is also home to a number of small businesses, including a general store, a gas station, and a restaurant. Tourism is also an important part of the local economy, with many visitors coming to the area to take advantage of the fishing and wildlife viewing opportunities.
Demographics
The population of Tyonek was estimated to be around 200 people in 2020. The majority of the population is Native American, with the Dena'ina Athabascan people making up the largest group. The population is also diverse, with people of European, Asian, and Hispanic descent making up a small portion of the population.
The median household income in Tyonek is around $50,000, which is slightly lower than the median household income for the state of Alaska. The unemployment rate in the area is also slightly higher than the state average.
Conclusion
Tyonek is a small unincorporated community located in the Matanuska-Susitna Borough of Alaska. It has a long history of settlement by the Dena'ina Athabascan people, and has since become home to a diverse population. The economy of Tyonek is largely based on fishing and tourism, with the Tyonek Native Corporation providing many of the local jobs. The population of Tyonek was estimated to be around 200 people in 2020, with a median household income of around $50,000.
Common Questions
What is Per Capita Income in Tyonek?
Per Capita income in Tyonek is $34,644.
What is the Median Family Income in Tyonek?
Median Family Income in Tyonek is $64,375.
What is the Median Household income in Tyonek?
Median Household Income in Tyonek is $42,159.
What is Income or Wage Gap in Tyonek?
Income or Wage Gap in Tyonek is 16.7%.
Women in Tyonek earn 83.3 cents for every dollar earned by a man.
What is Inequality or Gini Index in Tyonek?
Inequality or Gini Index in Tyonek is 0.55.
What is the Total Population of Tyonek?
Total Population of Tyonek is 270.
What is the Total Male Population of Tyonek?
Total Male Population of Tyonek is 163.
What is the Total Female Population of Tyonek?
Total Female Population of Tyonek is 107.
What is the Ratio of Males per 100 Females in Tyonek?
There are 152.34 Males per 100 Females in Tyonek.
What is the Ratio of Females per 100 Males in Tyonek?
There are 65.64 Females per 100 Males in Tyonek.
What is the Median Population Age in Tyonek?
Median Population Age in Tyonek is 34.5 Years.
What is the Average Family Size in Tyonek
Average Family Size in Tyonek is 3.4 People.
What is the Average Household Size in Tyonek
Average Household Size in Tyonek is 2.6 People.
How Large is the Labor Force in Tyonek?
There are 162 People in the Labor Forcein in Tyonek.
What is the Percentage of People in the Labor Force in Tyonek?
71.7% of People are in the Labor Force in Tyonek.
What is the Unemployment Rate in Tyonek?
Unemployment Rate in Tyonek is 20.3%.