Grayling, AK Map & Demographics
Grayling Map
Grayling Overview
$16,326
PER CAPITA INCOME
$53,125
AVG FAMILY INCOME
$36,250
AVG HOUSEHOLD INCOME
$10,550
FAMILY INCOME DEFICIT
0.46
INEQUALITY / GINI INDEX
210
TOTAL POPULATION
116
MALE POPULATION
94
FEMALE POPULATION
123.40
MALES / 100 FEMALES
81.03
FEMALES / 100 MALES
31.0
MEDIAN AGE
3.5
AVG FAMILY SIZE
2.9
AVG HOUSEHOLD SIZE
92
LABOR FORCE [ PEOPLE ]
61.3%
PERCENT IN LABOR FORCE
31.5%
UNEMPLOYMENT RATE
Grayling Zip Codes
Grayling Area Codes
Income in Grayling
Income Overview in Grayling
Per Capita Income in Grayling is $16,326, while median incomes of families and households are $53,125 and $36,250 respectively.
| Characteristic | Number | Measure |
| Per Capita Income | 210 | $16,326 |
| Median Family Income | 45 | $53,125 |
| Mean Family Income | 45 | $52,336 |
| Median Household Income | 72 | $36,250 |
| Mean Household Income | 72 | $49,578 |
| Income Deficit | 45 | $10,550 |
| Wage / Income Gap (%) | 210 | 0.00% |
| Wage / Income Gap ($) | 210 | 100.00¢ per $1 |
| Gini / Inequality Index | 210 | 0.46 |
Earnings by Sex in Grayling
| Sex | Number | Average Earnings |
| Male | 55 (48.7%) | $0 |
| Female | 58 (51.3%) | $0 |
| Total | 113 (100.0%) | $0 |
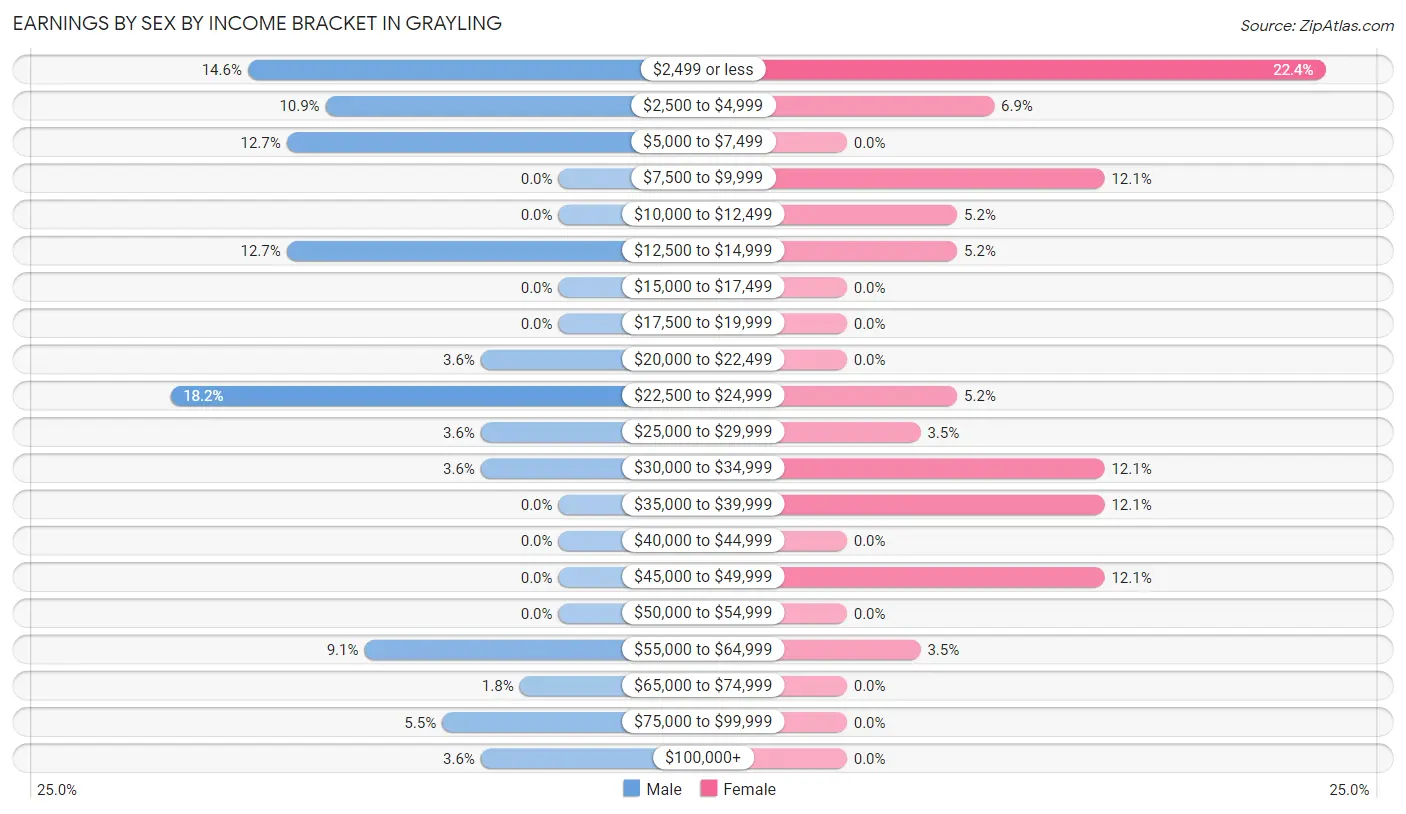
Earnings by Sex by Income Bracket in Grayling
The most common earnings brackets in Grayling are $22,500 to $24,999 for men (10 | 18.2%) and $2,499 or less for women (13 | 22.4%).
| Income | Male | Female |
| $2,499 or less | 8 (14.5%) | 13 (22.4%) |
| $2,500 to $4,999 | 6 (10.9%) | 4 (6.9%) |
| $5,000 to $7,499 | 7 (12.7%) | 0 (0.0%) |
| $7,500 to $9,999 | 0 (0.0%) | 7 (12.1%) |
| $10,000 to $12,499 | 0 (0.0%) | 3 (5.2%) |
| $12,500 to $14,999 | 7 (12.7%) | 3 (5.2%) |
| $15,000 to $17,499 | 0 (0.0%) | 0 (0.0%) |
| $17,500 to $19,999 | 0 (0.0%) | 0 (0.0%) |
| $20,000 to $22,499 | 2 (3.6%) | 0 (0.0%) |
| $22,500 to $24,999 | 10 (18.2%) | 3 (5.2%) |
| $25,000 to $29,999 | 2 (3.6%) | 2 (3.5%) |
| $30,000 to $34,999 | 2 (3.6%) | 7 (12.1%) |
| $35,000 to $39,999 | 0 (0.0%) | 7 (12.1%) |
| $40,000 to $44,999 | 0 (0.0%) | 0 (0.0%) |
| $45,000 to $49,999 | 0 (0.0%) | 7 (12.1%) |
| $50,000 to $54,999 | 0 (0.0%) | 0 (0.0%) |
| $55,000 to $64,999 | 5 (9.1%) | 2 (3.5%) |
| $65,000 to $74,999 | 1 (1.8%) | 0 (0.0%) |
| $75,000 to $99,999 | 3 (5.4%) | 0 (0.0%) |
| $100,000+ | 2 (3.6%) | 0 (0.0%) |
| Total | 55 (100.0%) | 58 (100.0%) |
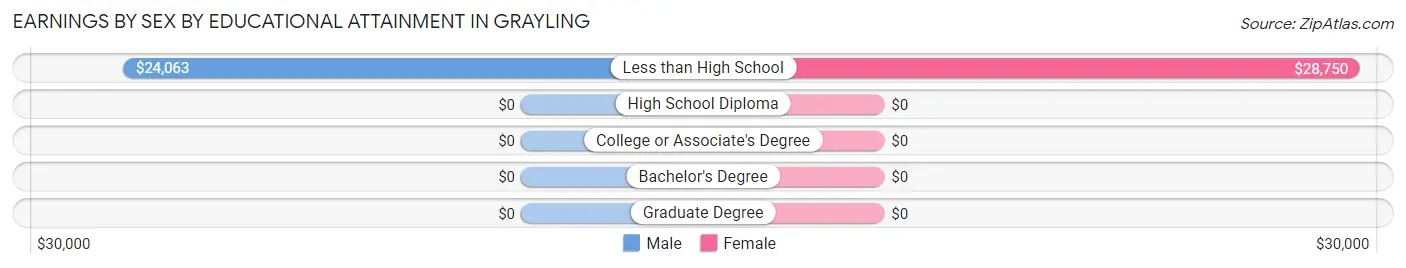
Earnings by Sex by Educational Attainment in Grayling
Average earnings in Grayling are $21,875 for men and $31,000 for women, a difference of 29.4%. Men with an educational attainment of less than high school enjoy the highest average annual earnings of $24,063, while those with less than high school education earn the least with $24,063. Women with an educational attainment of less than high school earn the most with the average annual earnings of $28,750, while those with less than high school education have the smallest earnings of $28,750.
| Educational Attainment | Male Income | Female Income |
| Less than High School | $24,063 | $28,750 |
| High School Diploma | - | - |
| College or Associate's Degree | - | - |
| Bachelor's Degree | - | - |
| Graduate Degree | - | - |
| Total | $21,875 | $31,000 |
Family Income in Grayling
Family Income Brackets in Grayling
According to the Grayling family income data, there are 14 families falling into the $50,000 to $74,999 income range, which is the most common income bracket and makes up 31.1% of all families.
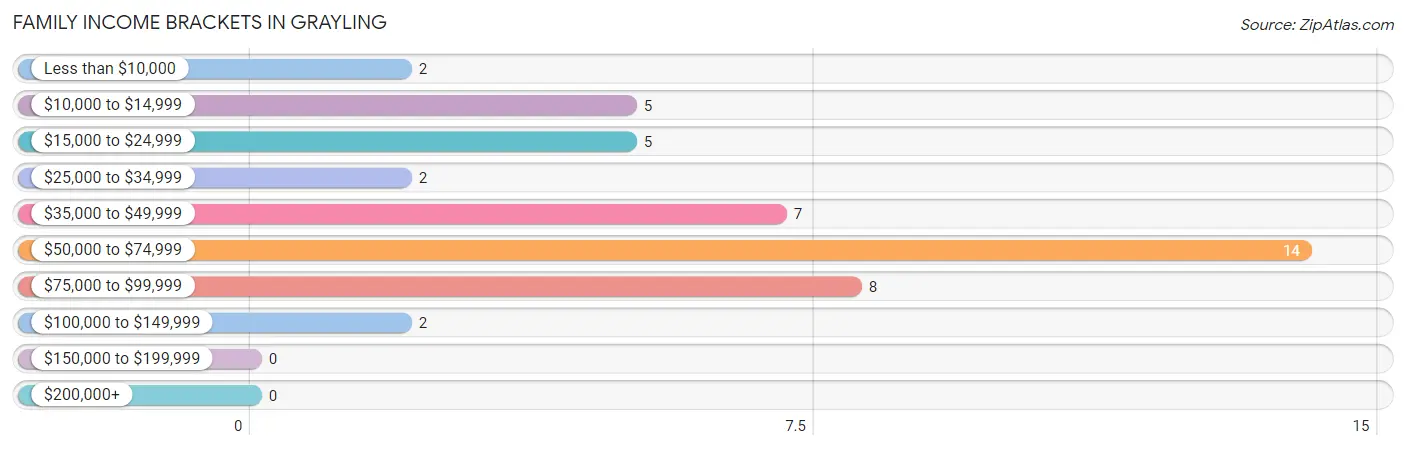
| Income Bracket | # Families | % Families |
| Less than $10,000 | 2 | 4.4% |
| $10,000 to $14,999 | 5 | 11.1% |
| $15,000 to $24,999 | 5 | 11.1% |
| $25,000 to $34,999 | 2 | 4.4% |
| $35,000 to $49,999 | 7 | 15.6% |
| $50,000 to $74,999 | 14 | 31.1% |
| $75,000 to $99,999 | 8 | 17.8% |
| $100,000 to $149,999 | 2 | 4.4% |
| $150,000 to $199,999 | 0 | 0.0% |
| $200,000+ | 0 | 0.0% |
Family Income by Famaliy Size in Grayling
4-person families (7 | 15.6%) account for the highest median family income in Grayling with $59,688 per family, while 2-person families (17 | 37.8%) have the highest median income of $24,792 per family member.
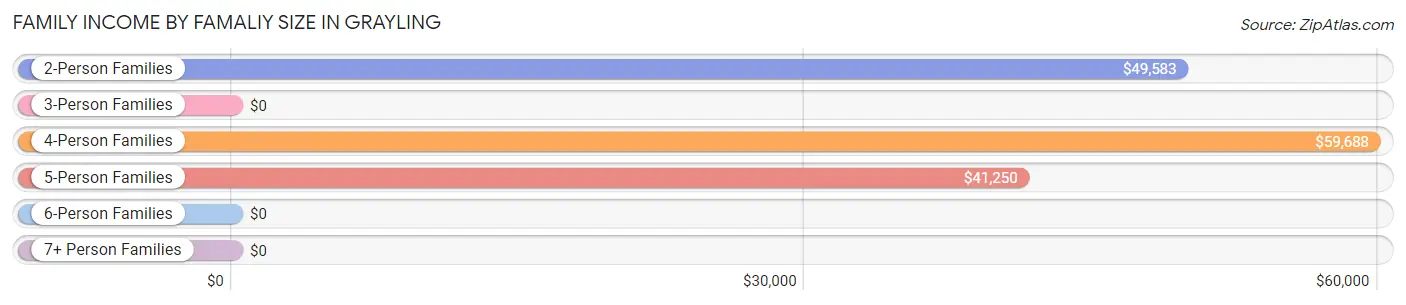
| Income Bracket | # Families | Median Income |
| 2-Person Families | 17 (37.8%) | $49,583 |
| 3-Person Families | 9 (20.0%) | $0 |
| 4-Person Families | 7 (15.6%) | $59,688 |
| 5-Person Families | 8 (17.8%) | $41,250 |
| 6-Person Families | 0 (0.0%) | $0 |
| 7+ Person Families | 4 (8.9%) | $0 |
| Total | 45 (100.0%) | $53,125 |
Family Income by Number of Earners in Grayling
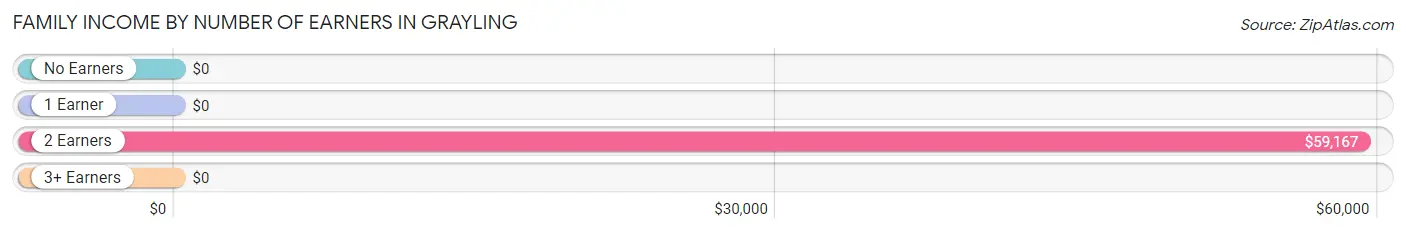
| Number of Earners | # Families | Median Income |
| No Earners | 7 (15.6%) | $0 |
| 1 Earner | 13 (28.9%) | $0 |
| 2 Earners | 16 (35.6%) | $59,167 |
| 3+ Earners | 9 (20.0%) | $0 |
| Total | 45 (100.0%) | $53,125 |
Household Income in Grayling
Household Income Brackets in Grayling
With 14 households falling in the category, the $50,000 to $74,999 income range is the most frequent in Grayling, accounting for 19.4% of all households.
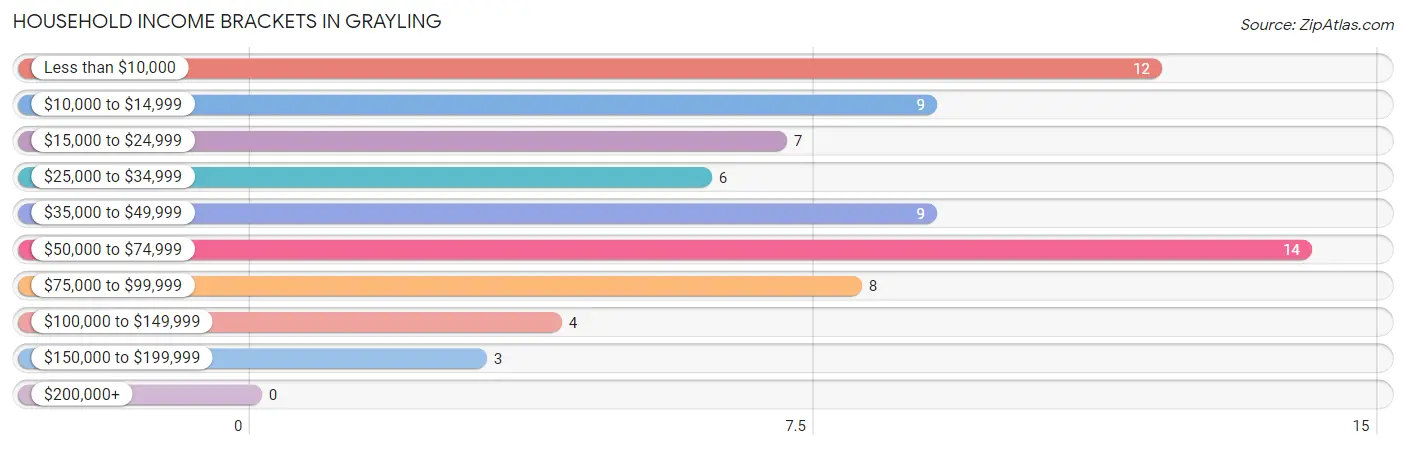
| Income Bracket | # Households | % Households |
| Less than $10,000 | 12 | 16.7% |
| $10,000 to $14,999 | 9 | 12.5% |
| $15,000 to $24,999 | 7 | 9.7% |
| $25,000 to $34,999 | 6 | 8.3% |
| $35,000 to $49,999 | 9 | 12.5% |
| $50,000 to $74,999 | 14 | 19.4% |
| $75,000 to $99,999 | 8 | 11.1% |
| $100,000 to $149,999 | 4 | 5.6% |
| $150,000 to $199,999 | 3 | 4.2% |
| $200,000+ | 0 | 0.0% |
Household Income by Householder Age in Grayling
The median household income in Grayling is $36,250, with the highest median household income of $53,750 found in the 45 to 64 years age bracket for the primary householder. A total of 24 households (33.3%) fall into this category.
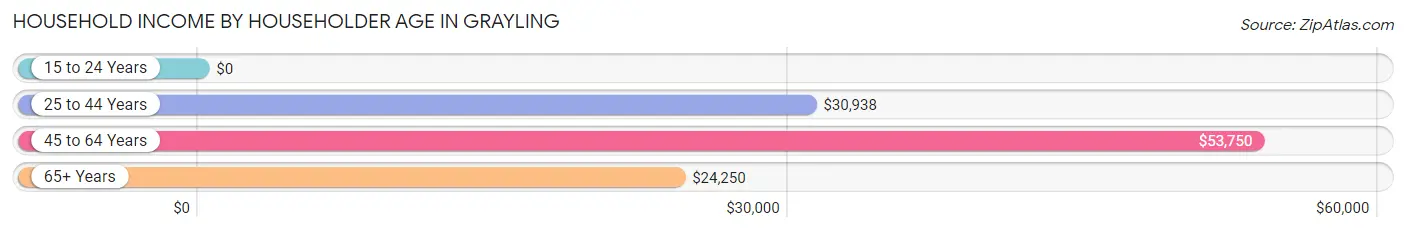
| Income Bracket | # Households | Median Income |
| 15 to 24 Years | 0 (0.0%) | $0 |
| 25 to 44 Years | 33 (45.8%) | $30,938 |
| 45 to 64 Years | 24 (33.3%) | $53,750 |
| 65+ Years | 15 (20.8%) | $24,250 |
| Total | 72 (100.0%) | $36,250 |
Poverty in Grayling
Income Below Poverty by Sex and Age in Grayling
With 31.9% poverty level for males and 21.3% for females among the residents of Grayling, under 5 year old males and 25 to 34 year old females are the most vulnerable to poverty, with 8 males (66.7%) and 9 females (64.3%) in their respective age groups living below the poverty level.
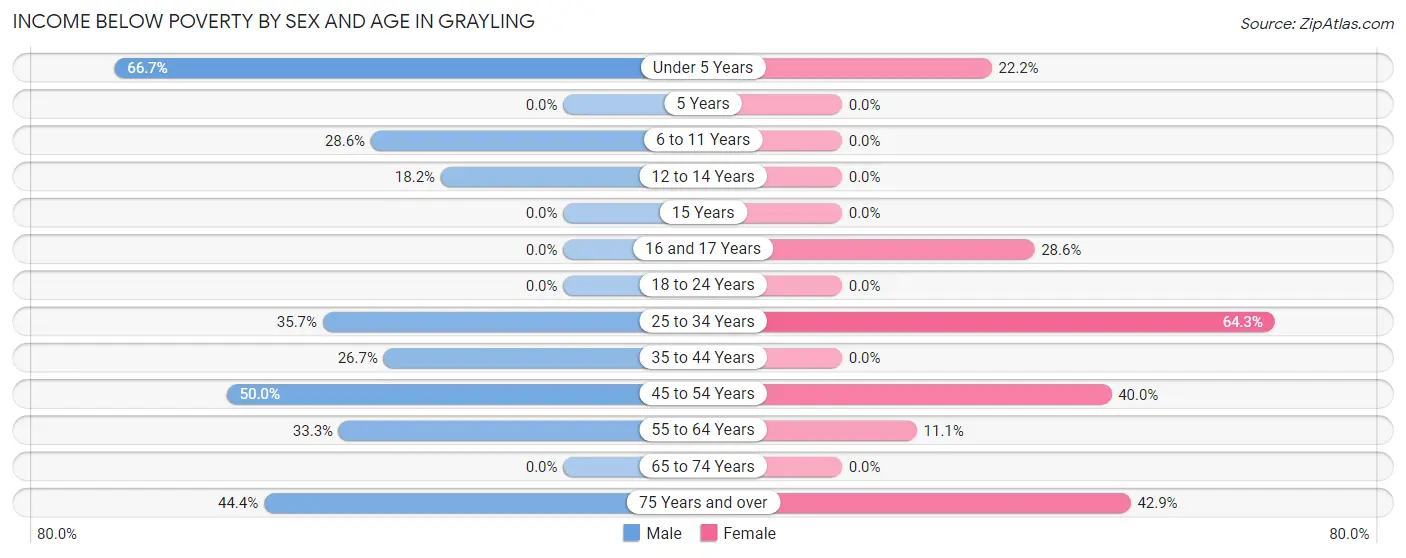
| Age Bracket | Male | Female |
| Under 5 Years | 8 (66.7%) | 2 (22.2%) |
| 5 Years | 0 (0.0%) | 0 (0.0%) |
| 6 to 11 Years | 4 (28.6%) | 0 (0.0%) |
| 12 to 14 Years | 2 (18.2%) | 0 (0.0%) |
| 15 Years | 0 (0.0%) | 0 (0.0%) |
| 16 and 17 Years | 0 (0.0%) | 2 (28.6%) |
| 18 to 24 Years | 0 (0.0%) | 0 (0.0%) |
| 25 to 34 Years | 5 (35.7%) | 9 (64.3%) |
| 35 to 44 Years | 8 (26.7%) | 0 (0.0%) |
| 45 to 54 Years | 2 (50.0%) | 2 (40.0%) |
| 55 to 64 Years | 4 (33.3%) | 2 (11.1%) |
| 65 to 74 Years | 0 (0.0%) | 0 (0.0%) |
| 75 Years and over | 4 (44.4%) | 3 (42.9%) |
| Total | 37 (31.9%) | 20 (21.3%) |
Income Above Poverty by Sex and Age in Grayling
According to the poverty statistics in Grayling, males aged 16 and 17 years and females aged 5 years are the age groups that are most secure financially, with 100.0% of males and 100.0% of females in these age groups living above the poverty line.
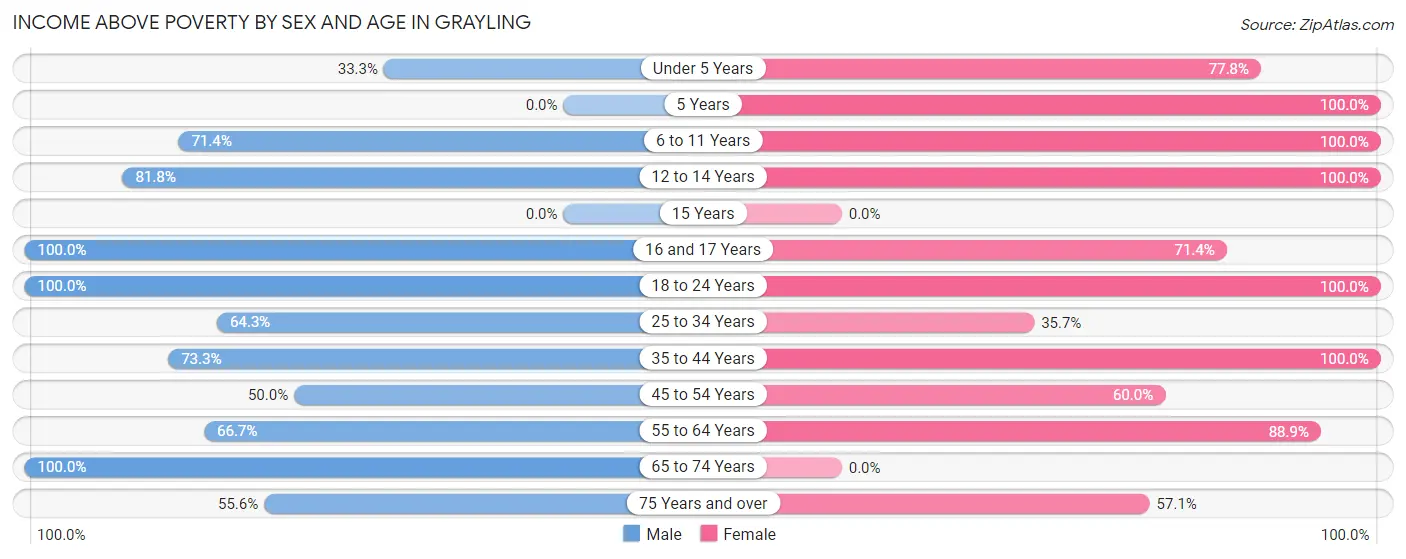
| Age Bracket | Male | Female |
| Under 5 Years | 4 (33.3%) | 7 (77.8%) |
| 5 Years | 0 (0.0%) | 2 (100.0%) |
| 6 to 11 Years | 10 (71.4%) | 9 (100.0%) |
| 12 to 14 Years | 9 (81.8%) | 3 (100.0%) |
| 15 Years | 0 (0.0%) | 0 (0.0%) |
| 16 and 17 Years | 2 (100.0%) | 5 (71.4%) |
| 18 to 24 Years | 2 (100.0%) | 13 (100.0%) |
| 25 to 34 Years | 9 (64.3%) | 5 (35.7%) |
| 35 to 44 Years | 22 (73.3%) | 7 (100.0%) |
| 45 to 54 Years | 2 (50.0%) | 3 (60.0%) |
| 55 to 64 Years | 8 (66.7%) | 16 (88.9%) |
| 65 to 74 Years | 6 (100.0%) | 0 (0.0%) |
| 75 Years and over | 5 (55.6%) | 4 (57.1%) |
| Total | 79 (68.1%) | 74 (78.7%) |
Income Below Poverty Among Married-Couple Families in Grayling
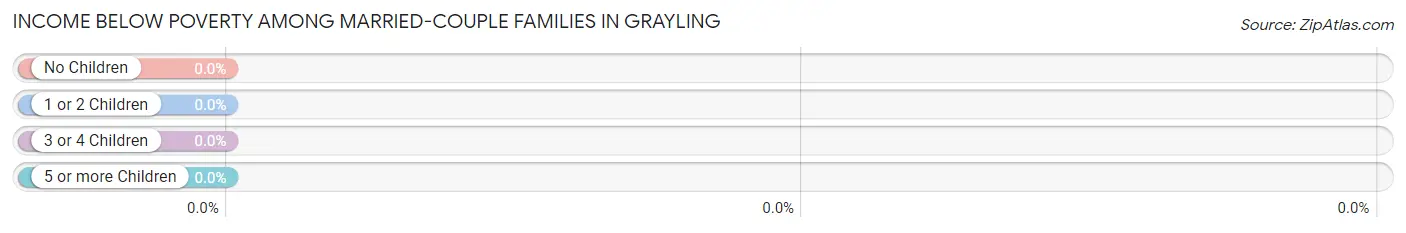
| Children | Above Poverty | Below Poverty |
| No Children | 13 (100.0%) | 0 (0.0%) |
| 1 or 2 Children | 5 (100.0%) | 0 (0.0%) |
| 3 or 4 Children | 1 (100.0%) | 0 (0.0%) |
| 5 or more Children | 0 (0.0%) | 0 (0.0%) |
| Total | 19 (100.0%) | 0 (0.0%) |
Income Below Poverty Among Single-Parent Households in Grayling
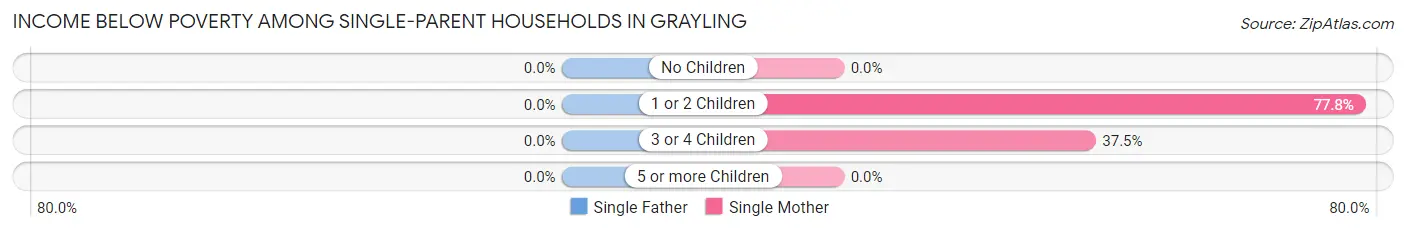
| Children | Single Father | Single Mother |
| No Children | 0 (0.0%) | 0 (0.0%) |
| 1 or 2 Children | 0 (0.0%) | 7 (77.8%) |
| 3 or 4 Children | 0 (0.0%) | 3 (37.5%) |
| 5 or more Children | 0 (0.0%) | 0 (0.0%) |
| Total | 0 (0.0%) | 10 (41.7%) |
Income Below Poverty Among Married-Couple vs Single-Parent Households in Grayling
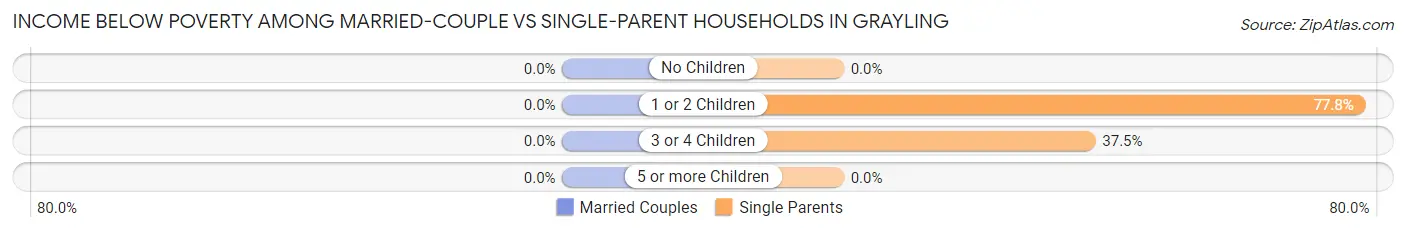
| Children | Married-Couple Families | Single-Parent Households |
| No Children | 0 (0.0%) | 0 (0.0%) |
| 1 or 2 Children | 0 (0.0%) | 7 (77.8%) |
| 3 or 4 Children | 0 (0.0%) | 3 (37.5%) |
| 5 or more Children | 0 (0.0%) | 0 (0.0%) |
| Total | 0 (0.0%) | 10 (38.5%) |
Race in Grayling
The most populous races in Grayling are Native / Alaskan (202 | 96.2%), Some other Race (6 | 2.9%), and Hawaiian / Pacific (2 | 0.9%).
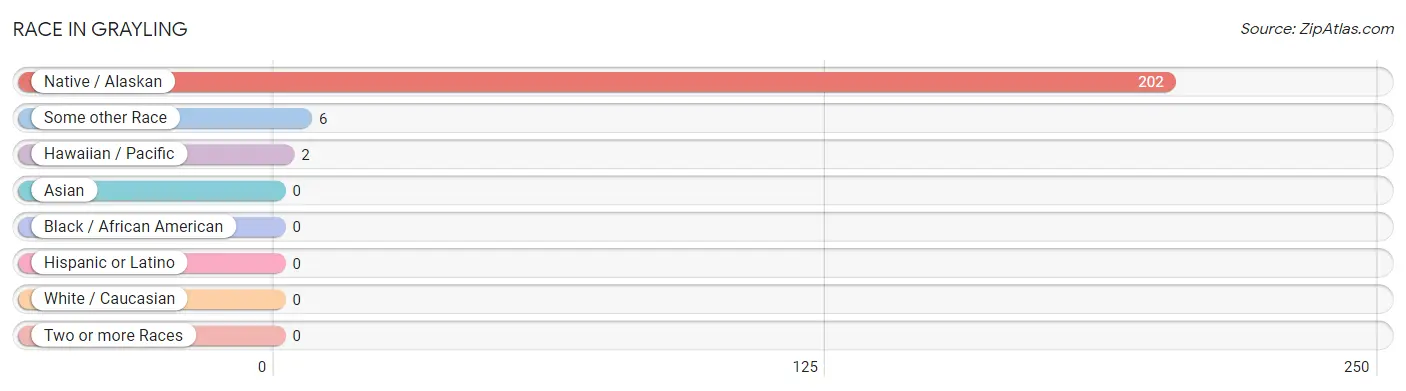
| Race | # Population | % Population |
| Asian | 0 | 0.0% |
| Black / African American | 0 | 0.0% |
| Hawaiian / Pacific | 2 | 0.9% |
| Hispanic or Latino | 0 | 0.0% |
| Native / Alaskan | 202 | 96.2% |
| White / Caucasian | 0 | 0.0% |
| Two or more Races | 0 | 0.0% |
| Some other Race | 6 | 2.9% |
| Total | 210 | 100.0% |
Ancestry in Grayling
The most populous ancestries reported in Grayling are Alaskan Athabascan (184 | 87.6%), Tlingit-Haida (11 | 5.2%), Yup'ik (7 | 3.3%), English (4 | 1.9%), and Dutch (3 | 1.4%), together accounting for 99.5% of all Grayling residents.
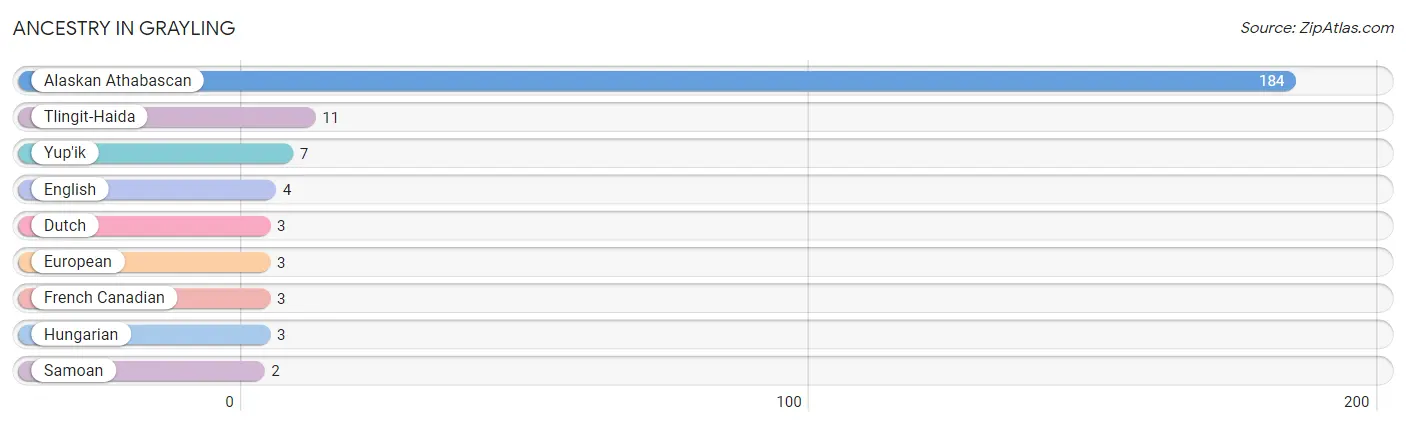
| Ancestry | # Population | % Population |
| Alaskan Athabascan | 184 | 87.6% |
| Dutch | 3 | 1.4% |
| English | 4 | 1.9% |
| European | 3 | 1.4% |
| French Canadian | 3 | 1.4% |
| Hungarian | 3 | 1.4% |
| Samoan | 2 | 0.9% |
| Tlingit-Haida | 11 | 5.2% |
| Yup'ik | 7 | 3.3% | View All 9 Rows |
Immigrants in Grayling
The most numerous immigrant groups reported in Grayling came from , and Oceania (2 | 0.9%), together accounting for 0.9% of all Grayling residents.

| Immigration Origin | # Population | % Population |
| Oceania | 2 | 0.9% | View All 1 Rows |
Sex and Age in Grayling
Sex and Age in Grayling
The most populous age groups in Grayling are 10 to 14 Years (19 | 16.4%) for men and 15 to 19 Years (14 | 14.9%) for women.
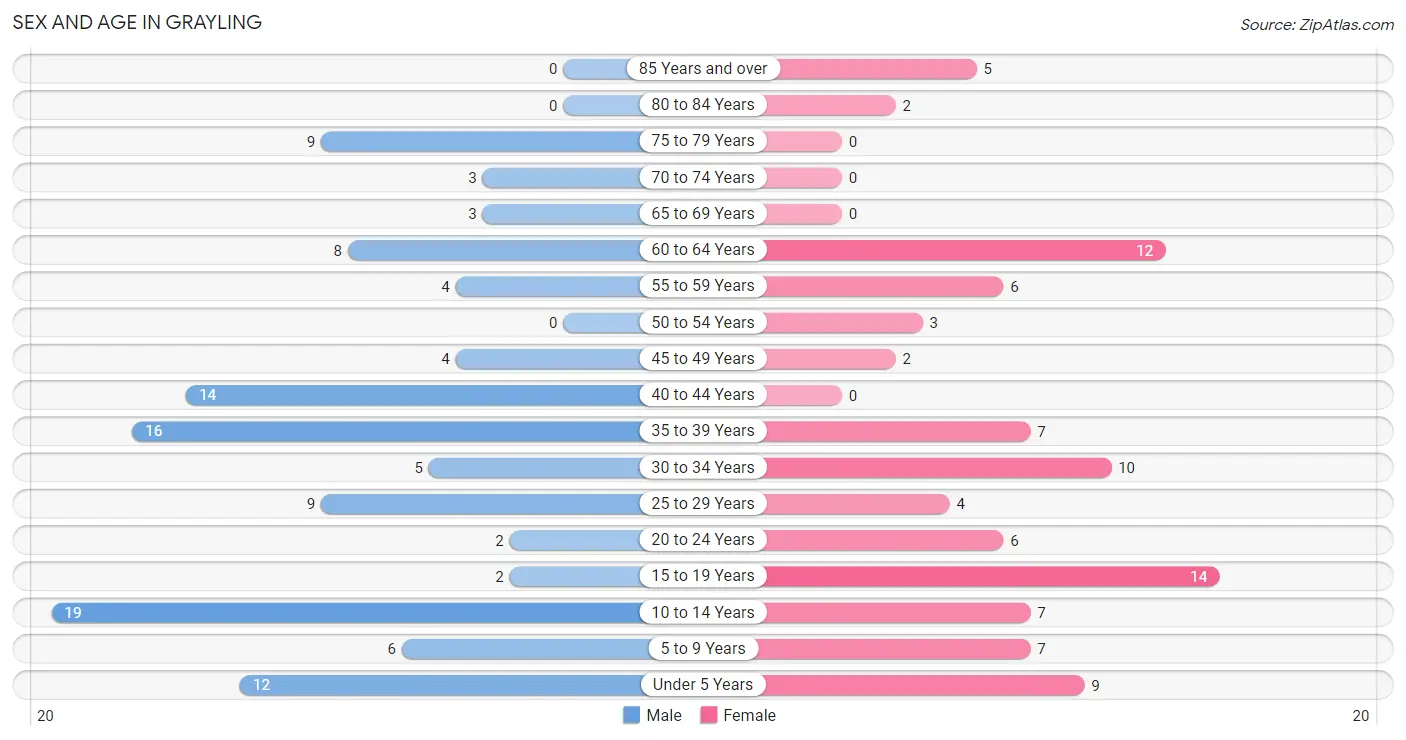
| Age Bracket | Male | Female |
| Under 5 Years | 12 (10.3%) | 9 (9.6%) |
| 5 to 9 Years | 6 (5.2%) | 7 (7.4%) |
| 10 to 14 Years | 19 (16.4%) | 7 (7.4%) |
| 15 to 19 Years | 2 (1.7%) | 14 (14.9%) |
| 20 to 24 Years | 2 (1.7%) | 6 (6.4%) |
| 25 to 29 Years | 9 (7.8%) | 4 (4.3%) |
| 30 to 34 Years | 5 (4.3%) | 10 (10.6%) |
| 35 to 39 Years | 16 (13.8%) | 7 (7.4%) |
| 40 to 44 Years | 14 (12.1%) | 0 (0.0%) |
| 45 to 49 Years | 4 (3.5%) | 2 (2.1%) |
| 50 to 54 Years | 0 (0.0%) | 3 (3.2%) |
| 55 to 59 Years | 4 (3.5%) | 6 (6.4%) |
| 60 to 64 Years | 8 (6.9%) | 12 (12.8%) |
| 65 to 69 Years | 3 (2.6%) | 0 (0.0%) |
| 70 to 74 Years | 3 (2.6%) | 0 (0.0%) |
| 75 to 79 Years | 9 (7.8%) | 0 (0.0%) |
| 80 to 84 Years | 0 (0.0%) | 2 (2.1%) |
| 85 Years and over | 0 (0.0%) | 5 (5.3%) |
| Total | 116 (100.0%) | 94 (100.0%) |
Families and Households in Grayling
Median Family Size in Grayling
The median family size in Grayling is 3.53 persons per family, with single male/father families (2 | 4.4%) accounting for the largest median family size of 4.5 persons per family. On the other hand, married-couple families (19 | 42.2%) represent the smallest median family size with 3.00 persons per family.
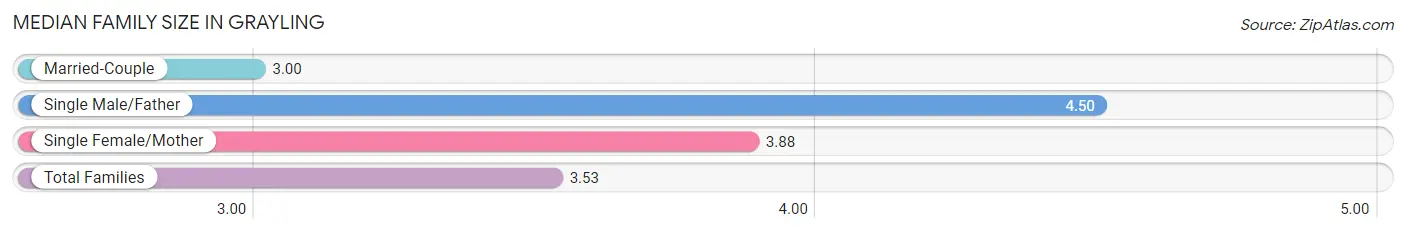
| Family Type | # Families | Family Size |
| Married-Couple | 19 (42.2%) | 3.00 |
| Single Male/Father | 2 (4.4%) | 4.50 |
| Single Female/Mother | 24 (53.3%) | 3.88 |
| Total Families | 45 (100.0%) | 3.53 |
Median Household Size in Grayling
The median household size in Grayling is 2.92 persons per household, with single female/mother households (24 | 33.3%) accounting for the largest median household size of 4.67 persons per household. non-family households (27 | 37.5%) represent the smallest median household size with 1.19 persons per household.
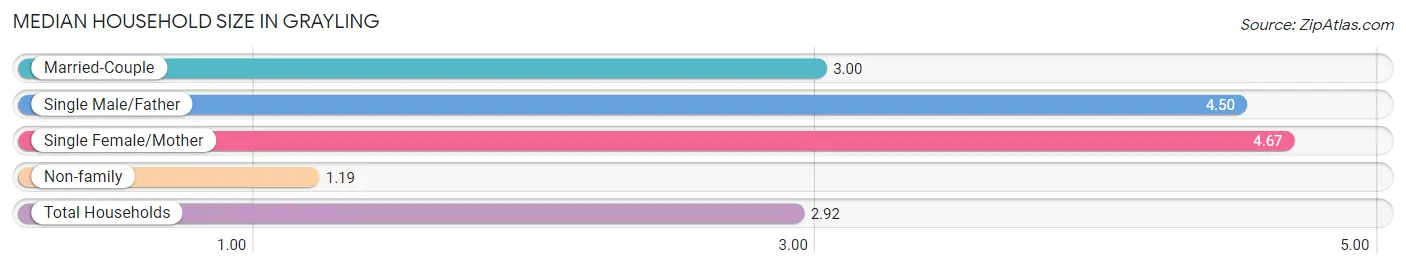
| Household Type | # Households | Household Size |
| Married-Couple | 19 (26.4%) | 3.00 |
| Single Male/Father | 2 (2.8%) | 4.50 |
| Single Female/Mother | 24 (33.3%) | 4.67 |
| Non-family | 27 (37.5%) | 1.19 |
| Total Households | 72 (100.0%) | 2.92 |
Household Size by Marriage Status in Grayling
Out of a total of 72 households in Grayling, 45 (62.5%) are family households, while 27 (37.5%) are nonfamily households. The most numerous type of family households are 2-person households, comprising 15, and the most common type of nonfamily households are 1-person households, comprising 23.
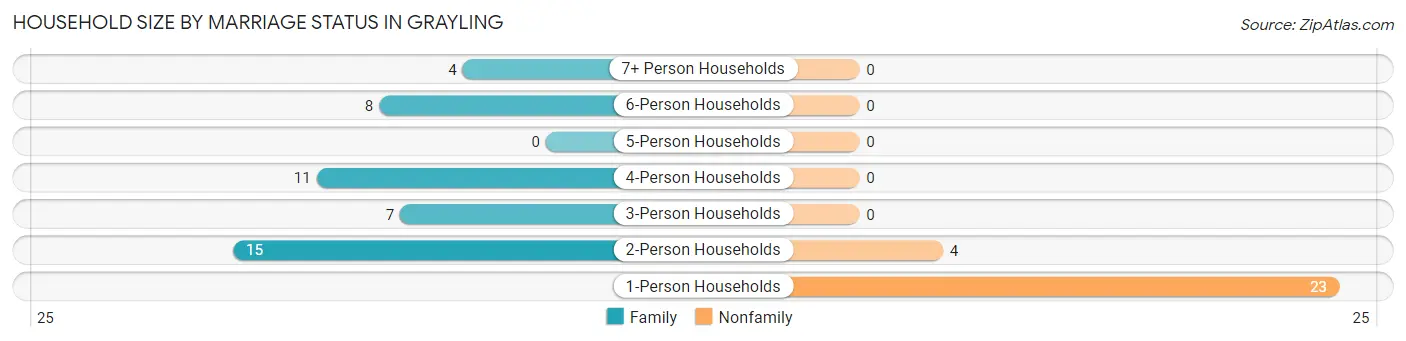
| Household Size | Family Households | Nonfamily Households |
| 1-Person Households | - | 23 (31.9%) |
| 2-Person Households | 15 (20.8%) | 4 (5.6%) |
| 3-Person Households | 7 (9.7%) | 0 (0.0%) |
| 4-Person Households | 11 (15.3%) | 0 (0.0%) |
| 5-Person Households | 0 (0.0%) | 0 (0.0%) |
| 6-Person Households | 8 (11.1%) | 0 (0.0%) |
| 7+ Person Households | 4 (5.6%) | 0 (0.0%) |
| Total | 45 (62.5%) | 27 (37.5%) |
Female Fertility in Grayling
Fertility by Age in Grayling
| Age Bracket | Women with Births | Births / 1,000 Women |
| 15 to 19 years | 0 (0.0%) | 0.0 |
| 20 to 34 years | 0 (0.0%) | 0.0 |
| 35 to 50 years | 0 (0.0%) | 0.0 |
| Total | 0 (0.0%) | 0.0 |
Fertility by Age by Marriage Status in Grayling
| Age Bracket | Married | Unmarried |
| 15 to 19 years | 0 (0.0%) | 0 (0.0%) |
| 20 to 34 years | 0 (0.0%) | 0 (0.0%) |
| 35 to 50 years | 0 (0.0%) | 0 (0.0%) |
| Total | 0 (0.0%) | 0 (0.0%) |
Fertility by Education in Grayling
| Educational Attainment | Women with Births | Births / 1,000 Women |
| Less than High School | 0 (0.0%) | 0.0 |
| High School Diploma | 0 (0.0%) | 0.0 |
| College or Associate's Degree | 0 (0.0%) | 0.0 |
| Bachelor's Degree | 0 (0.0%) | 0.0 |
| Graduate Degree | 0 (0.0%) | 0.0 |
| Total | 0 (0.0%) | 0.0 |
Fertility by Education by Marriage Status in Grayling
| Educational Attainment | Married | Unmarried |
| Less than High School | 0 (0.0%) | 0 (0.0%) |
| High School Diploma | 0 (0.0%) | 0 (0.0%) |
| College or Associate's Degree | 0 (0.0%) | 0 (0.0%) |
| Bachelor's Degree | 0 (0.0%) | 0 (0.0%) |
| Graduate Degree | 0 (0.0%) | 0 (0.0%) |
| Total | 0 (0.0%) | 0 (0.0%) |
Employment Characteristics in Grayling
Employment by Class of Employer in Grayling
Among the 63 employed individuals in Grayling, private company employees (15 | 23.8%), state government employees (15 | 23.8%), and local government employees (12 | 19.1%) make up the most common classes of employment.
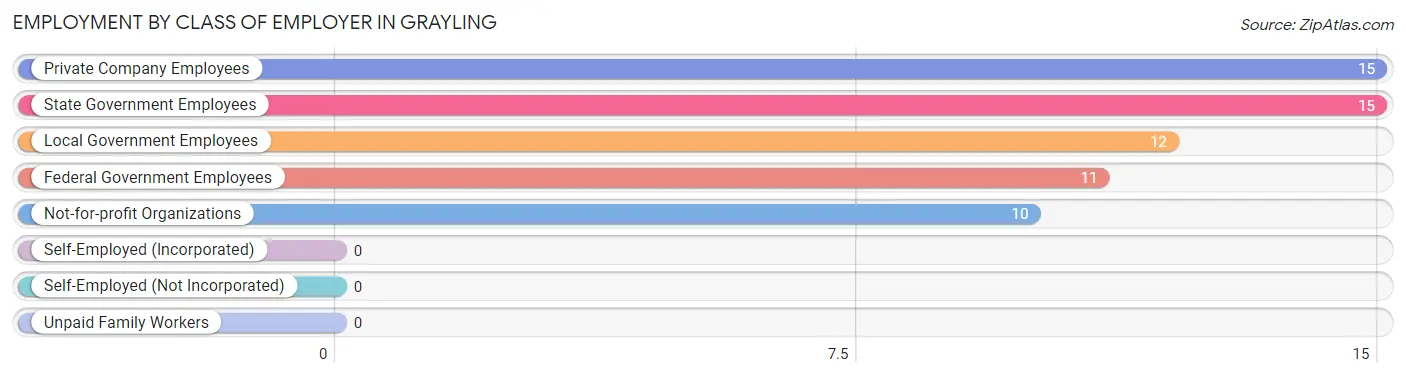
| Employer Class | # Employees | % Employees |
| Private Company Employees | 15 | 23.8% |
| Self-Employed (Incorporated) | 0 | 0.0% |
| Self-Employed (Not Incorporated) | 0 | 0.0% |
| Not-for-profit Organizations | 10 | 15.9% |
| Local Government Employees | 12 | 19.1% |
| State Government Employees | 15 | 23.8% |
| Federal Government Employees | 11 | 17.5% |
| Unpaid Family Workers | 0 | 0.0% |
| Total | 63 | 100.0% |
Employment Status by Age in Grayling
According to the labor force statistics for Grayling, out of the total population over 16 years of age (150), 61.3% or 92 individuals are in the labor force, with 31.5% or 29 of them unemployed. The age group with the highest labor force participation rate is 55 to 59 years, with 100.0% or 10 individuals in the labor force. Within the labor force, the 25 to 29 years age range has the highest percentage of unemployed individuals, with 54.5% or 6 of them being unemployed.
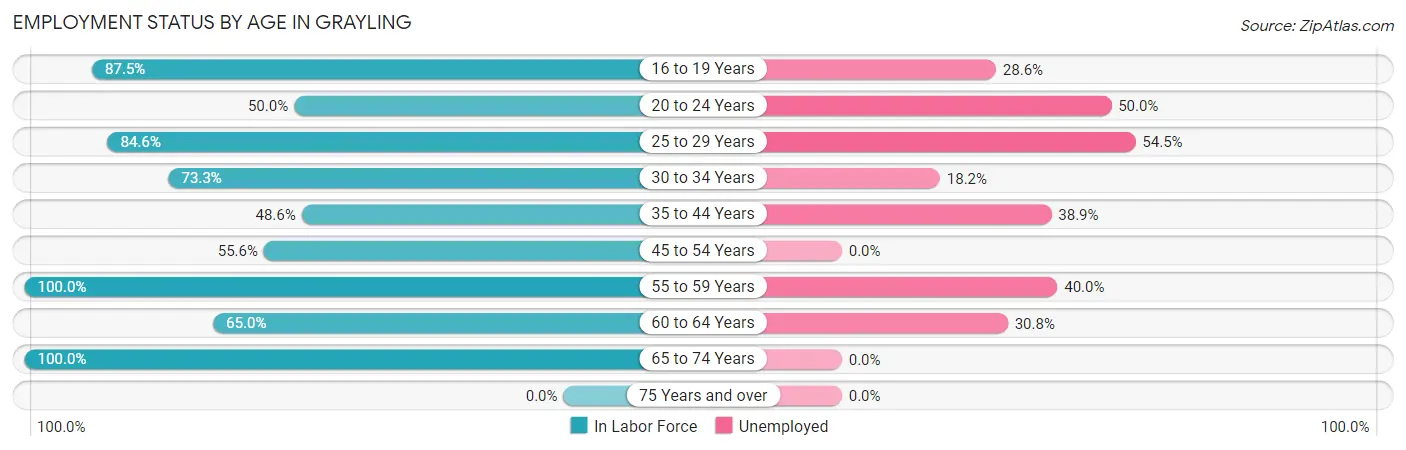
| Age Bracket | In Labor Force | Unemployed |
| 16 to 19 Years | 14 (87.5%) | 4 (28.6%) |
| 20 to 24 Years | 4 (50.0%) | 2 (50.0%) |
| 25 to 29 Years | 11 (84.6%) | 6 (54.5%) |
| 30 to 34 Years | 11 (73.3%) | 2 (18.2%) |
| 35 to 44 Years | 18 (48.6%) | 7 (38.9%) |
| 45 to 54 Years | 5 (55.6%) | 0 (0.0%) |
| 55 to 59 Years | 10 (100.0%) | 4 (40.0%) |
| 60 to 64 Years | 13 (65.0%) | 4 (30.8%) |
| 65 to 74 Years | 6 (100.0%) | 0 (0.0%) |
| 75 Years and over | 0 (0.0%) | 0 (0.0%) |
| Total | 92 (61.3%) | 29 (31.5%) |
Employment Status by Educational Attainment in Grayling
According to labor force statistics for Grayling, 65.4% of individuals (68) out of the total population between 25 and 64 years of age (104) are in the labor force, with 33.8% or 23 of them being unemployed. The group with the highest labor force participation rate are those with the educational attainment of college / associate degree, with 100.0% or 7 individuals in the labor force. Within the labor force, individuals with less than high school education have the highest percentage of unemployment, with 47.8% or 11 of them being unemployed.
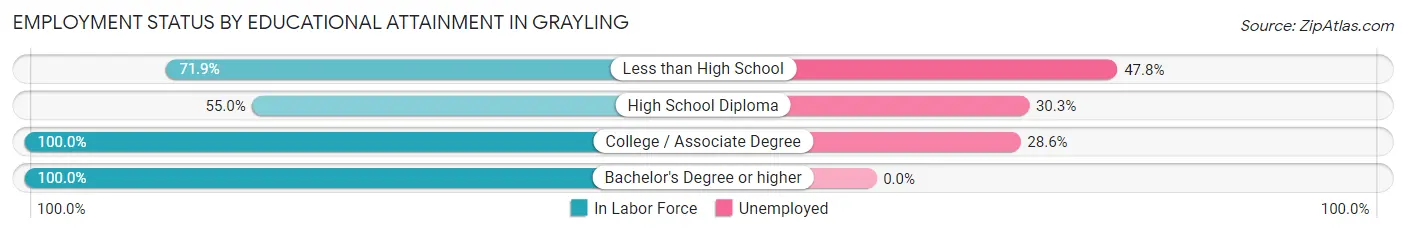
| Educational Attainment | In Labor Force | Unemployed |
| Less than High School | 23 (71.9%) | 15 (47.8%) |
| High School Diploma | 33 (55.0%) | 18 (30.3%) |
| College / Associate Degree | 7 (100.0%) | 2 (28.6%) |
| Bachelor's Degree or higher | 5 (100.0%) | 0 (0.0%) |
| Total | 68 (65.4%) | 35 (33.8%) |
Employment Occupations by Sex in Grayling
Management, Business, Science and Arts Occupations
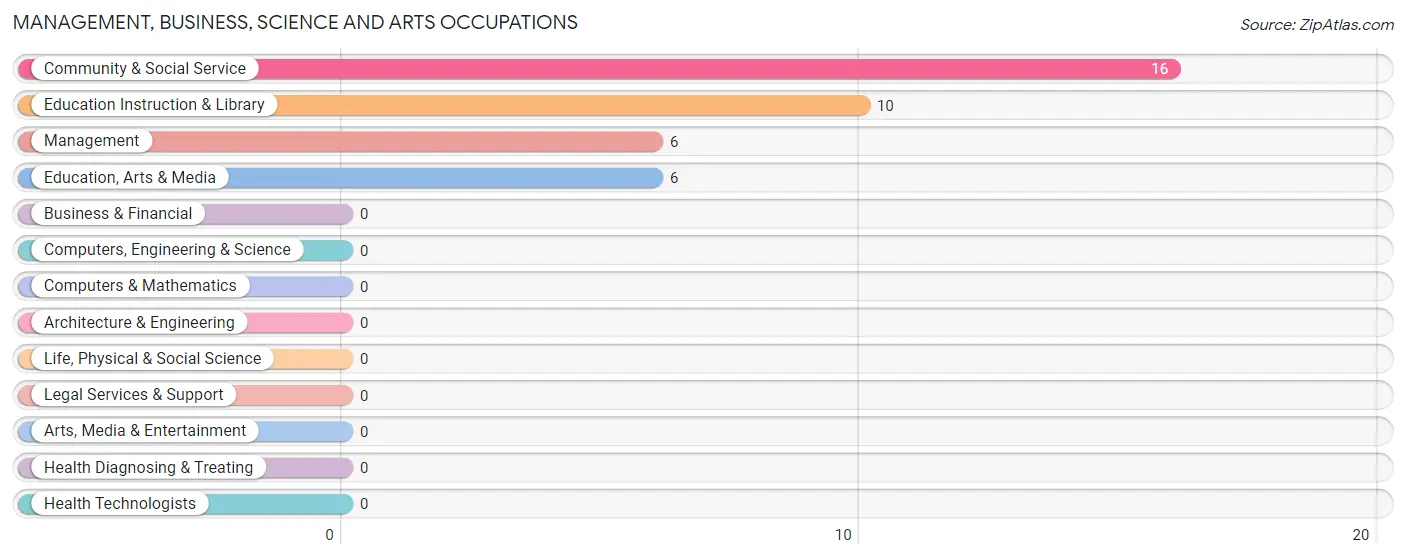
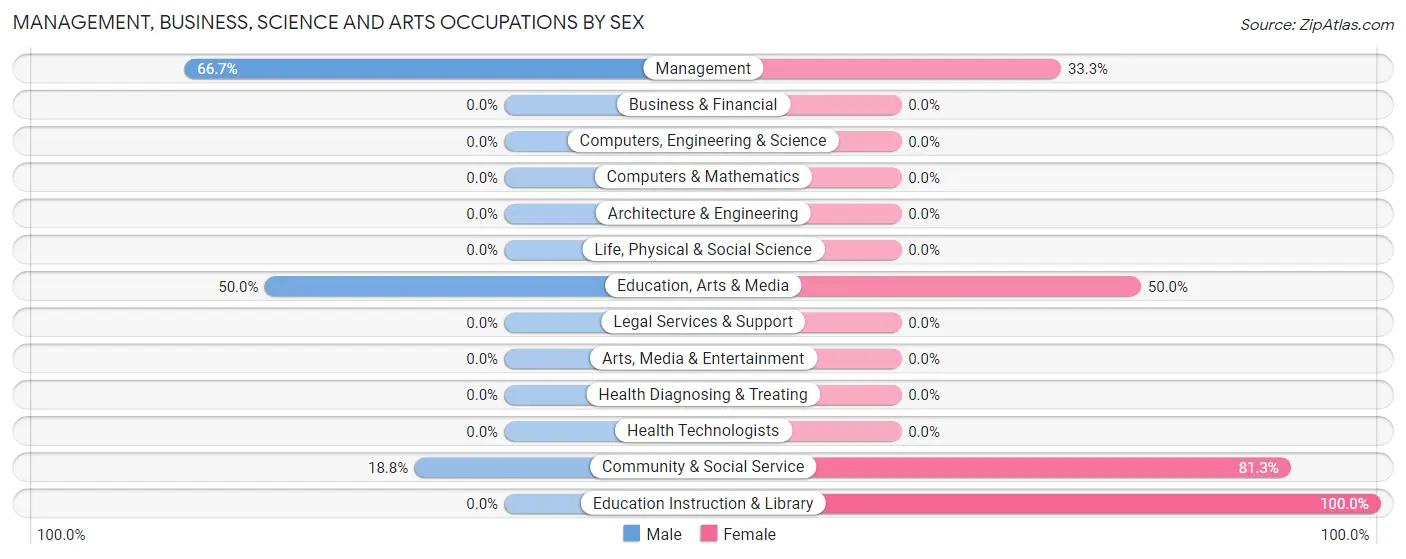
The most common Management, Business, Science and Arts occupations in Grayling are Community & Social Service (16 | 25.4%), Education Instruction & Library (10 | 15.9%), Management (6 | 9.5%), and Education, Arts & Media (6 | 9.5%).
Management, Business, Science and Arts Occupations by Sex
Within the Management, Business, Science and Arts occupations in Grayling, the most male-oriented occupations are Management (66.7%), Education, Arts & Media (50.0%), and Community & Social Service (18.8%), while the most female-oriented occupations are Education Instruction & Library (100.0%), Community & Social Service (81.2%), and Education, Arts & Media (50.0%).
| Occupation | Male | Female |
| Management | 4 (66.7%) | 2 (33.3%) |
| Business & Financial | 0 (0.0%) | 0 (0.0%) |
| Computers, Engineering & Science | 0 (0.0%) | 0 (0.0%) |
| Computers & Mathematics | 0 (0.0%) | 0 (0.0%) |
| Architecture & Engineering | 0 (0.0%) | 0 (0.0%) |
| Life, Physical & Social Science | 0 (0.0%) | 0 (0.0%) |
| Community & Social Service | 3 (18.8%) | 13 (81.2%) |
| Education, Arts & Media | 3 (50.0%) | 3 (50.0%) |
| Legal Services & Support | 0 (0.0%) | 0 (0.0%) |
| Education Instruction & Library | 0 (0.0%) | 10 (100.0%) |
| Arts, Media & Entertainment | 0 (0.0%) | 0 (0.0%) |
| Health Diagnosing & Treating | 0 (0.0%) | 0 (0.0%) |
| Health Technologists | 0 (0.0%) | 0 (0.0%) |
| Total (Category) | 7 (31.8%) | 15 (68.2%) |
| Total (Overall) | 22 (34.9%) | 41 (65.1%) |
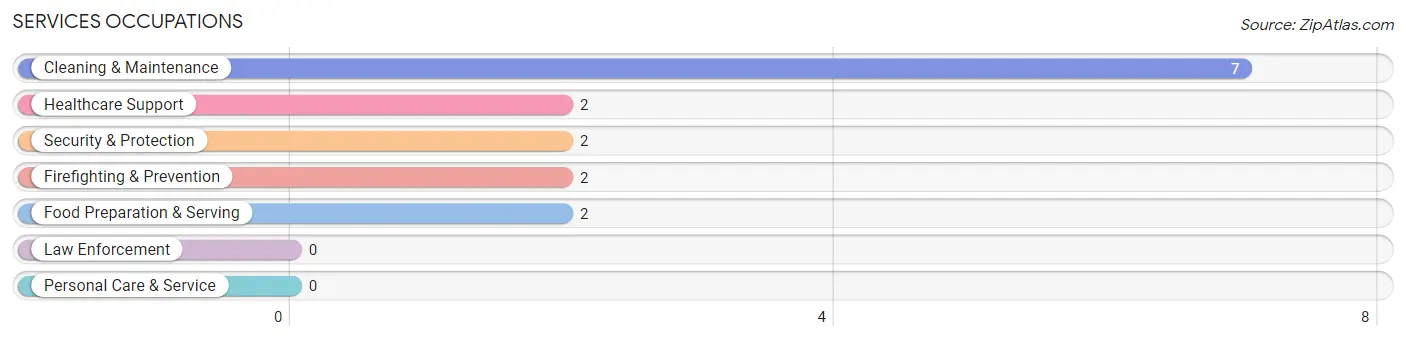
Services Occupations
The most common Services occupations in Grayling are Cleaning & Maintenance (7 | 11.1%), Healthcare Support (2 | 3.2%), Security & Protection (2 | 3.2%), Firefighting & Prevention (2 | 3.2%), and Food Preparation & Serving (2 | 3.2%).
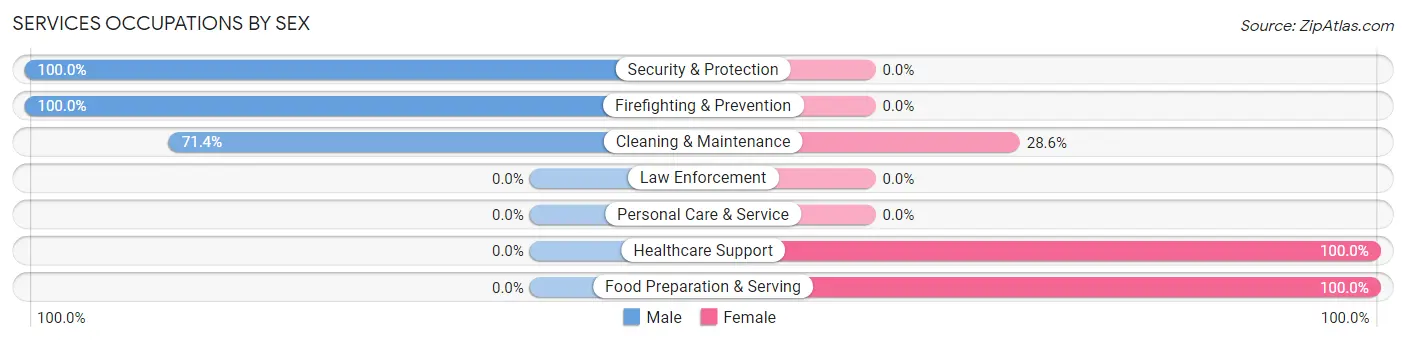
Services Occupations by Sex
Within the Services occupations in Grayling, the most male-oriented occupations are Security & Protection (100.0%), Firefighting & Prevention (100.0%), and Cleaning & Maintenance (71.4%), while the most female-oriented occupations are Healthcare Support (100.0%), Food Preparation & Serving (100.0%), and Cleaning & Maintenance (28.6%).
| Occupation | Male | Female |
| Healthcare Support | 0 (0.0%) | 2 (100.0%) |
| Security & Protection | 2 (100.0%) | 0 (0.0%) |
| Firefighting & Prevention | 2 (100.0%) | 0 (0.0%) |
| Law Enforcement | 0 (0.0%) | 0 (0.0%) |
| Food Preparation & Serving | 0 (0.0%) | 2 (100.0%) |
| Cleaning & Maintenance | 5 (71.4%) | 2 (28.6%) |
| Personal Care & Service | 0 (0.0%) | 0 (0.0%) |
| Total (Category) | 7 (53.8%) | 6 (46.2%) |
| Total (Overall) | 22 (34.9%) | 41 (65.1%) |
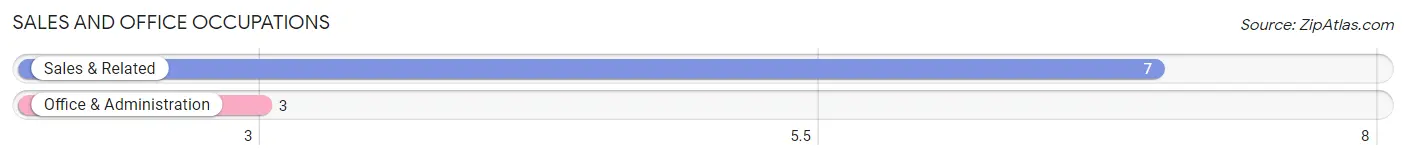
Sales and Office Occupations
The most common Sales and Office occupations in Grayling are Sales & Related (7 | 11.1%), and Office & Administration (3 | 4.8%).
Sales and Office Occupations by Sex
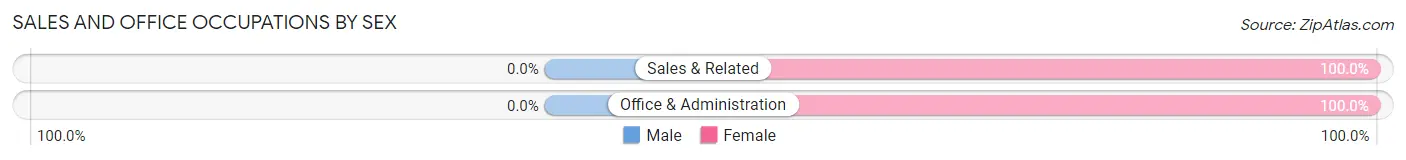
| Occupation | Male | Female |
| Sales & Related | 0 (0.0%) | 7 (100.0%) |
| Office & Administration | 0 (0.0%) | 3 (100.0%) |
| Total (Category) | 0 (0.0%) | 10 (100.0%) |
| Total (Overall) | 22 (34.9%) | 41 (65.1%) |
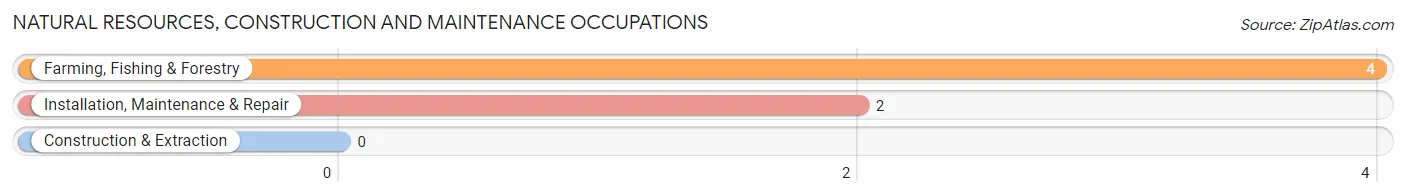
Natural Resources, Construction and Maintenance Occupations
The most common Natural Resources, Construction and Maintenance occupations in Grayling are Farming, Fishing & Forestry (4 | 6.4%), and Installation, Maintenance & Repair (2 | 3.2%).
Natural Resources, Construction and Maintenance Occupations by Sex
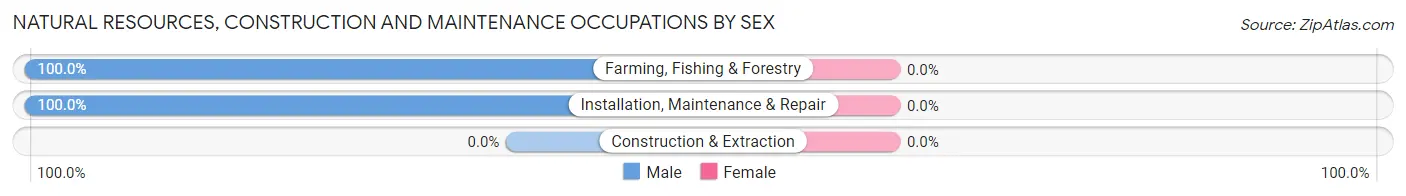
| Occupation | Male | Female |
| Farming, Fishing & Forestry | 4 (100.0%) | 0 (0.0%) |
| Construction & Extraction | 0 (0.0%) | 0 (0.0%) |
| Installation, Maintenance & Repair | 2 (100.0%) | 0 (0.0%) |
| Total (Category) | 6 (100.0%) | 0 (0.0%) |
| Total (Overall) | 22 (34.9%) | 41 (65.1%) |
Production, Transportation and Moving Occupations
The most common Production, Transportation and Moving occupations in Grayling are Material Moving (7 | 11.1%), Production (3 | 4.8%), and Transportation (2 | 3.2%).
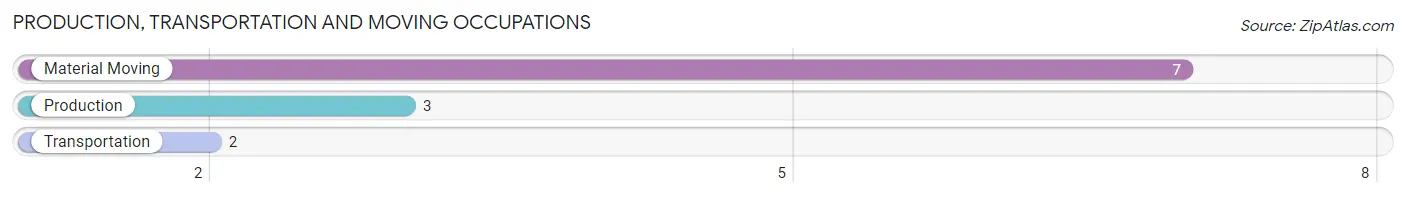
Production, Transportation and Moving Occupations by Sex
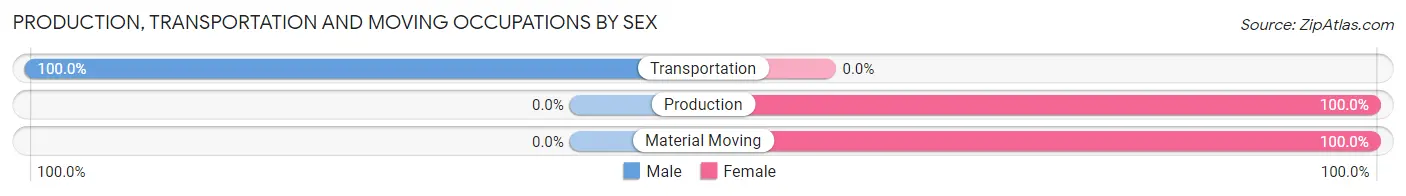
| Occupation | Male | Female |
| Production | 0 (0.0%) | 3 (100.0%) |
| Transportation | 2 (100.0%) | 0 (0.0%) |
| Material Moving | 0 (0.0%) | 7 (100.0%) |
| Total (Category) | 2 (16.7%) | 10 (83.3%) |
| Total (Overall) | 22 (34.9%) | 41 (65.1%) |
Employment Industries by Sex in Grayling
Employment Industries in Grayling
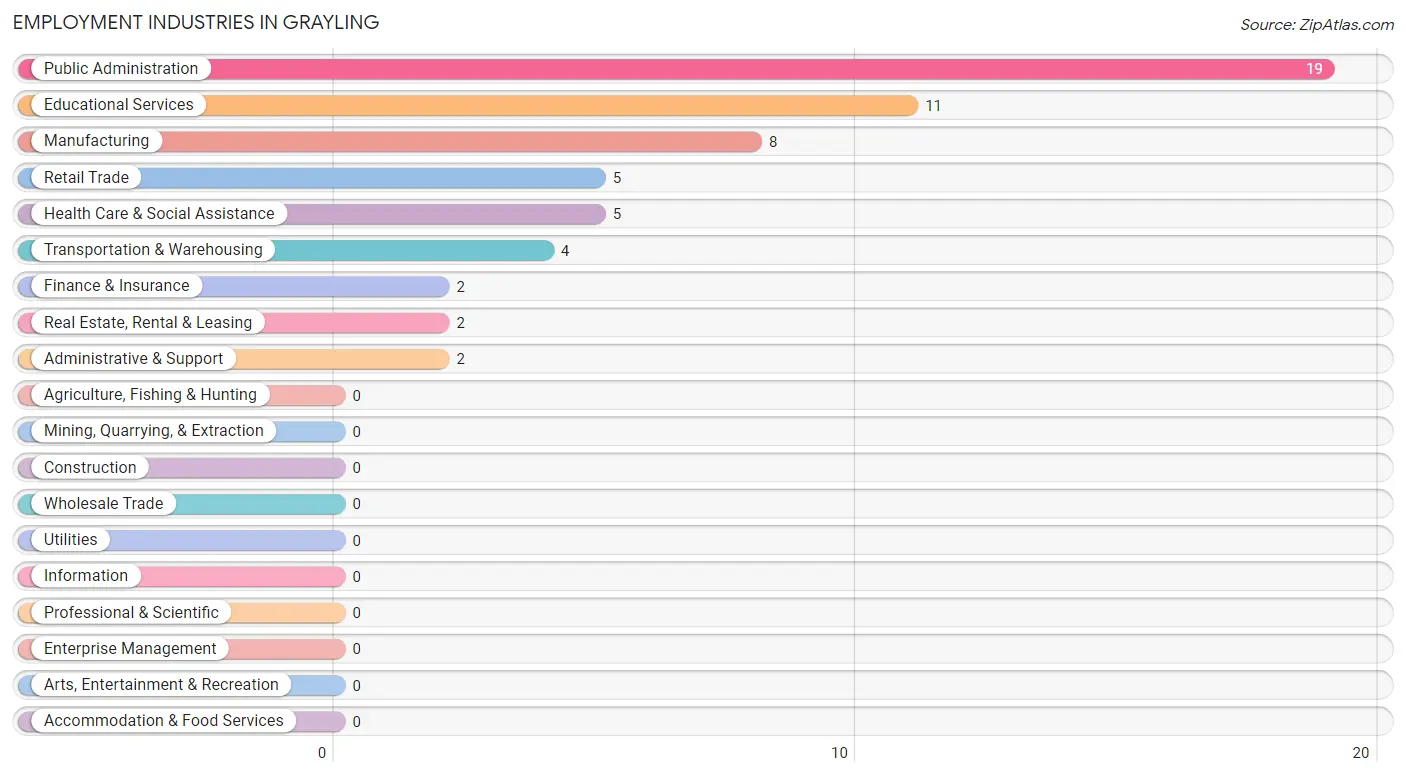
The major employment industries in Grayling include Public Administration (19 | 30.2%), Educational Services (11 | 17.5%), Manufacturing (8 | 12.7%), Retail Trade (5 | 7.9%), and Health Care & Social Assistance (5 | 7.9%).
Employment Industries by Sex in Grayling
The Grayling industries that see more men than women are Transportation & Warehousing (100.0%), Health Care & Social Assistance (60.0%), and Public Administration (57.9%), whereas the industries that tend to have a higher number of women are Manufacturing (100.0%), Retail Trade (100.0%), and Finance & Insurance (100.0%).
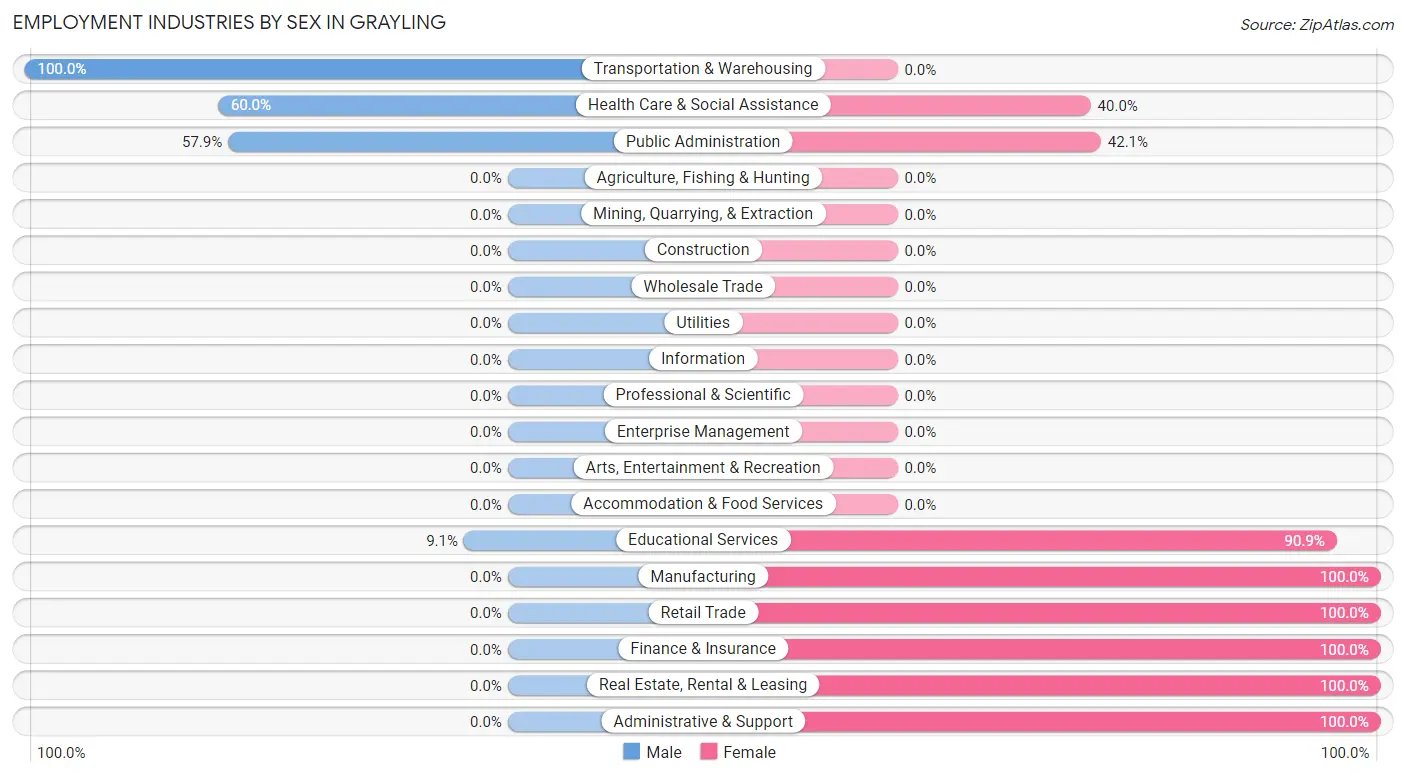
| Industry | Male | Female |
| Agriculture, Fishing & Hunting | 0 (0.0%) | 0 (0.0%) |
| Mining, Quarrying, & Extraction | 0 (0.0%) | 0 (0.0%) |
| Construction | 0 (0.0%) | 0 (0.0%) |
| Manufacturing | 0 (0.0%) | 8 (100.0%) |
| Wholesale Trade | 0 (0.0%) | 0 (0.0%) |
| Retail Trade | 0 (0.0%) | 5 (100.0%) |
| Transportation & Warehousing | 4 (100.0%) | 0 (0.0%) |
| Utilities | 0 (0.0%) | 0 (0.0%) |
| Information | 0 (0.0%) | 0 (0.0%) |
| Finance & Insurance | 0 (0.0%) | 2 (100.0%) |
| Real Estate, Rental & Leasing | 0 (0.0%) | 2 (100.0%) |
| Professional & Scientific | 0 (0.0%) | 0 (0.0%) |
| Enterprise Management | 0 (0.0%) | 0 (0.0%) |
| Administrative & Support | 0 (0.0%) | 2 (100.0%) |
| Educational Services | 1 (9.1%) | 10 (90.9%) |
| Health Care & Social Assistance | 3 (60.0%) | 2 (40.0%) |
| Arts, Entertainment & Recreation | 0 (0.0%) | 0 (0.0%) |
| Accommodation & Food Services | 0 (0.0%) | 0 (0.0%) |
| Public Administration | 11 (57.9%) | 8 (42.1%) |
| Total | 22 (34.9%) | 41 (65.1%) |
Education in Grayling
School Enrollment in Grayling
The most common levels of schooling among the 50 students in Grayling are middle school (22 | 44.0%), elementary school (11 | 22.0%), and high school (11 | 22.0%).
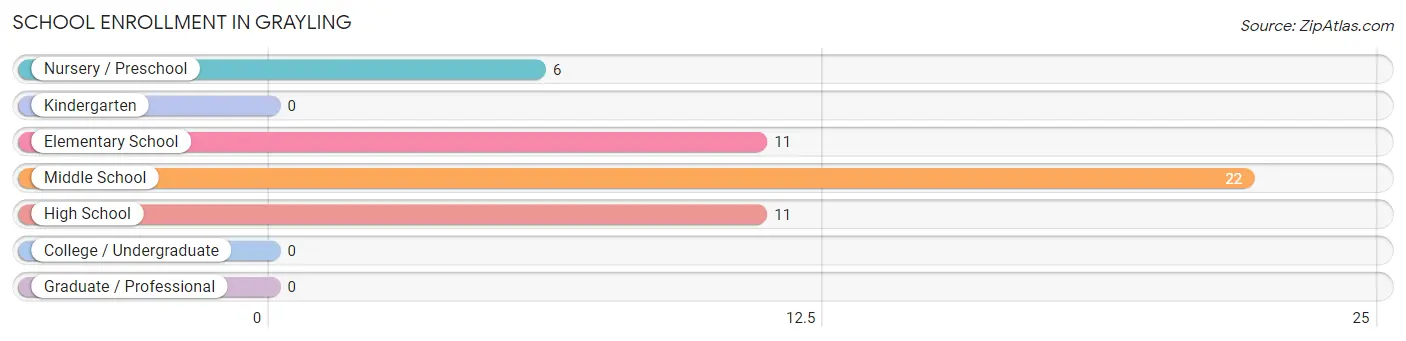
| School Level | # Students | % Students |
| Nursery / Preschool | 6 | 12.0% |
| Kindergarten | 0 | 0.0% |
| Elementary School | 11 | 22.0% |
| Middle School | 22 | 44.0% |
| High School | 11 | 22.0% |
| College / Undergraduate | 0 | 0.0% |
| Graduate / Professional | 0 | 0.0% |
| Total | 50 | 100.0% |
School Enrollment by Age by Funding Source in Grayling
Out of a total of 50 students who are enrolled in schools in Grayling, 2 (4.0%) attend a private institution, while the remaining 48 (96.0%) are enrolled in public schools. The age group of 35 years and over has the highest likelihood of being enrolled in private schools, with 2 (100.0% in the age bracket) enrolled. Conversely, the age group of 3 to 4 year olds has the lowest likelihood of being enrolled in a private school, with 6 (100.0% in the age bracket) attending a public institution.
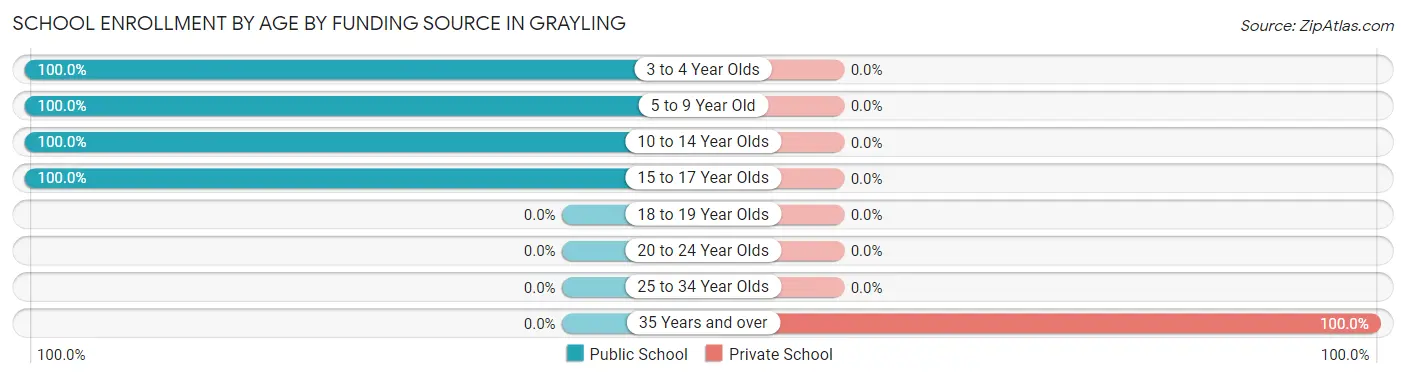
| Age Bracket | Public School | Private School |
| 3 to 4 Year Olds | 6 (100.0%) | 0 (0.0%) |
| 5 to 9 Year Old | 7 (100.0%) | 0 (0.0%) |
| 10 to 14 Year Olds | 26 (100.0%) | 0 (0.0%) |
| 15 to 17 Year Olds | 9 (100.0%) | 0 (0.0%) |
| 18 to 19 Year Olds | 0 (0.0%) | 0 (0.0%) |
| 20 to 24 Year Olds | 0 (0.0%) | 0 (0.0%) |
| 25 to 34 Year Olds | 0 (0.0%) | 0 (0.0%) |
| 35 Years and over | 0 (0.0%) | 2 (100.0%) |
| Total | 48 (96.0%) | 2 (4.0%) |
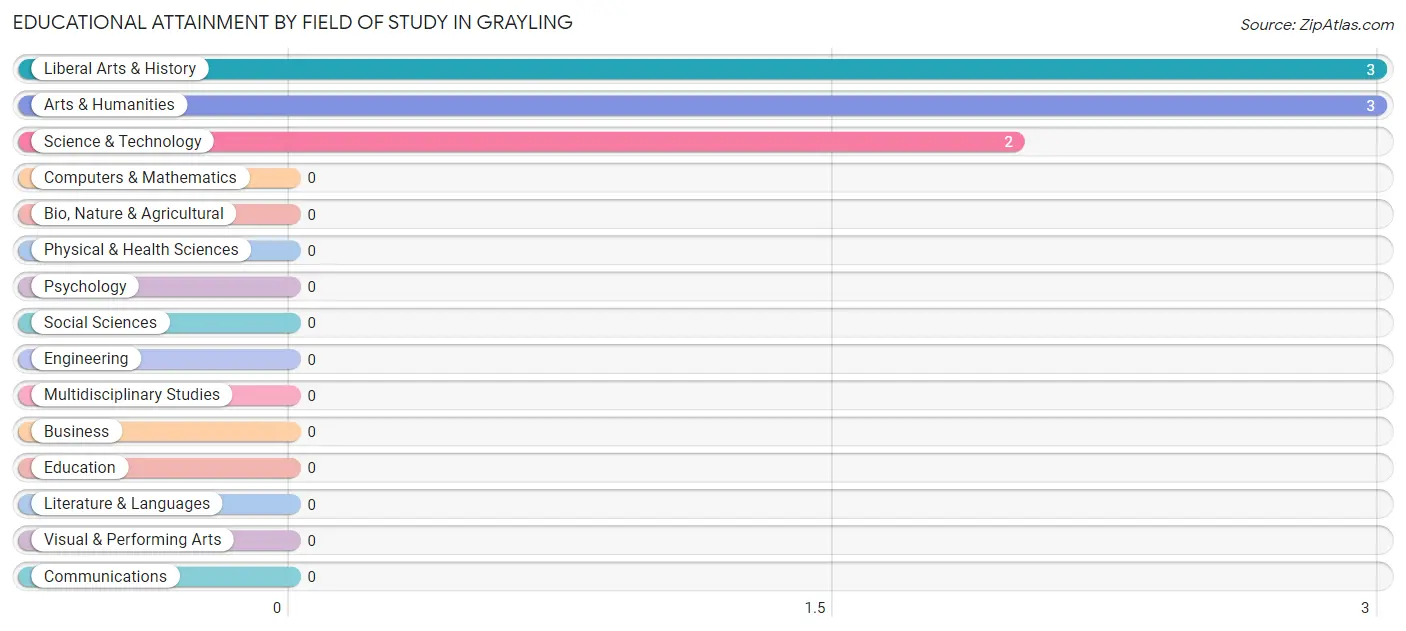
Educational Attainment by Field of Study in Grayling
Liberal arts & history (3 | 37.5%), arts & humanities (3 | 37.5%), and science & technology (2 | 25.0%) are the most common fields of study among 8 individuals in Grayling who have obtained a bachelor's degree or higher.
| Field of Study | # Graduates | % Graduates |
| Computers & Mathematics | 0 | 0.0% |
| Bio, Nature & Agricultural | 0 | 0.0% |
| Physical & Health Sciences | 0 | 0.0% |
| Psychology | 0 | 0.0% |
| Social Sciences | 0 | 0.0% |
| Engineering | 0 | 0.0% |
| Multidisciplinary Studies | 0 | 0.0% |
| Science & Technology | 2 | 25.0% |
| Business | 0 | 0.0% |
| Education | 0 | 0.0% |
| Literature & Languages | 0 | 0.0% |
| Liberal Arts & History | 3 | 37.5% |
| Visual & Performing Arts | 0 | 0.0% |
| Communications | 0 | 0.0% |
| Arts & Humanities | 3 | 37.5% |
| Total | 8 | 100.0% |
Transportation & Commute in Grayling
Vehicle Availability by Sex in Grayling
The most prevalent vehicle ownership categories in Grayling are males with no vehicle (15, accounting for 68.2%) and females with no vehicle (31, making up 36.6%).
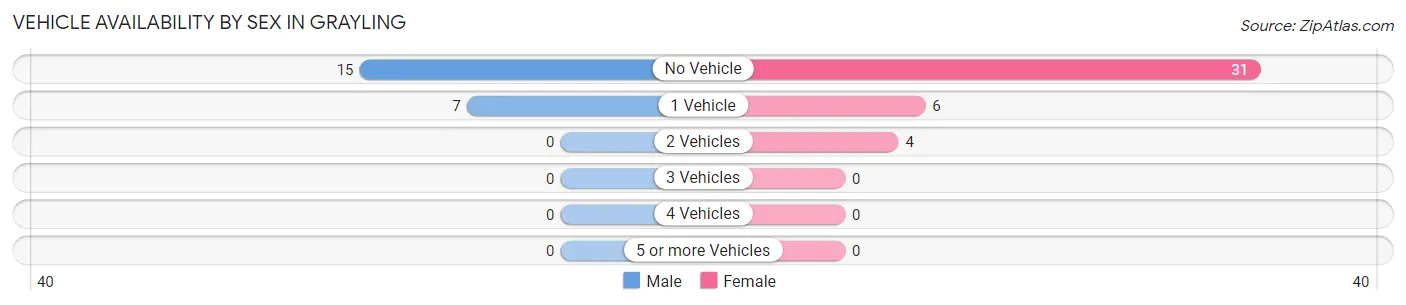
| Vehicles Available | Male | Female |
| No Vehicle | 15 (68.2%) | 31 (75.6%) |
| 1 Vehicle | 7 (31.8%) | 6 (14.6%) |
| 2 Vehicles | 0 (0.0%) | 4 (9.8%) |
| 3 Vehicles | 0 (0.0%) | 0 (0.0%) |
| 4 Vehicles | 0 (0.0%) | 0 (0.0%) |
| 5 or more Vehicles | 0 (0.0%) | 0 (0.0%) |
| Total | 22 (100.0%) | 41 (100.0%) |
Commute Time in Grayling
The most frequently occuring commute durations in Grayling are less than 5 minutes (35 commuters, 55.6%), 5 to 9 minutes (21 commuters, 33.3%), and 10 to 14 minutes (7 commuters, 11.1%).
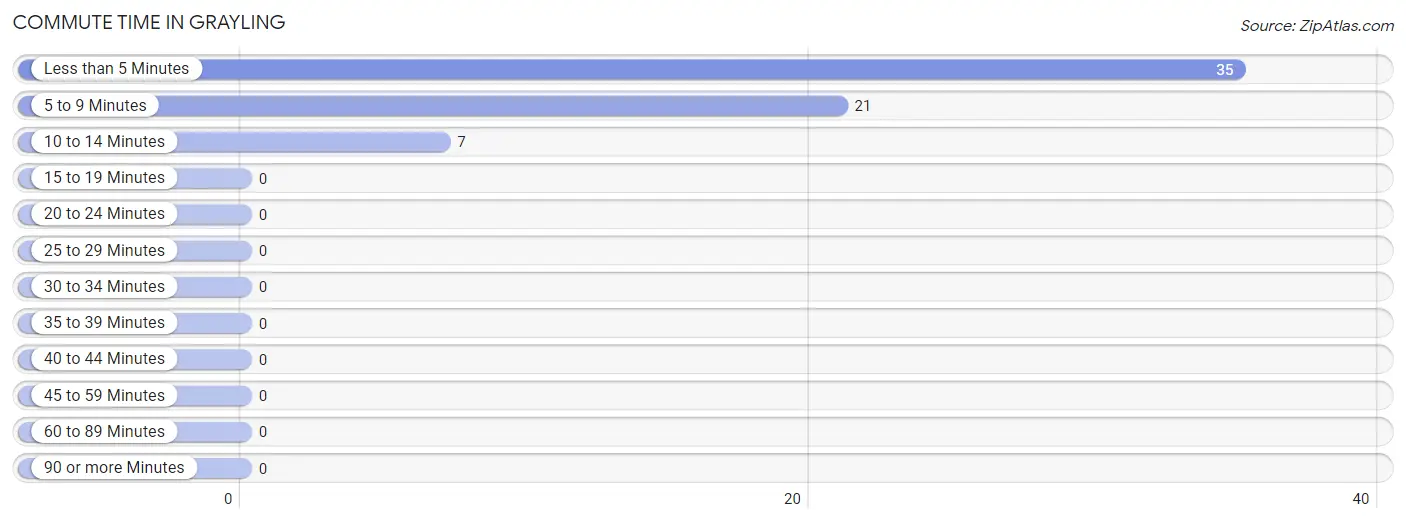
| Commute Time | # Commuters | % Commuters |
| Less than 5 Minutes | 35 | 55.6% |
| 5 to 9 Minutes | 21 | 33.3% |
| 10 to 14 Minutes | 7 | 11.1% |
| 15 to 19 Minutes | 0 | 0.0% |
| 20 to 24 Minutes | 0 | 0.0% |
| 25 to 29 Minutes | 0 | 0.0% |
| 30 to 34 Minutes | 0 | 0.0% |
| 35 to 39 Minutes | 0 | 0.0% |
| 40 to 44 Minutes | 0 | 0.0% |
| 45 to 59 Minutes | 0 | 0.0% |
| 60 to 89 Minutes | 0 | 0.0% |
| 90 or more Minutes | 0 | 0.0% |
Commute Time by Sex in Grayling
The most common commute times in Grayling are less than 5 minutes (13 commuters, 59.1%) for males and less than 5 minutes (22 commuters, 53.7%) for females.
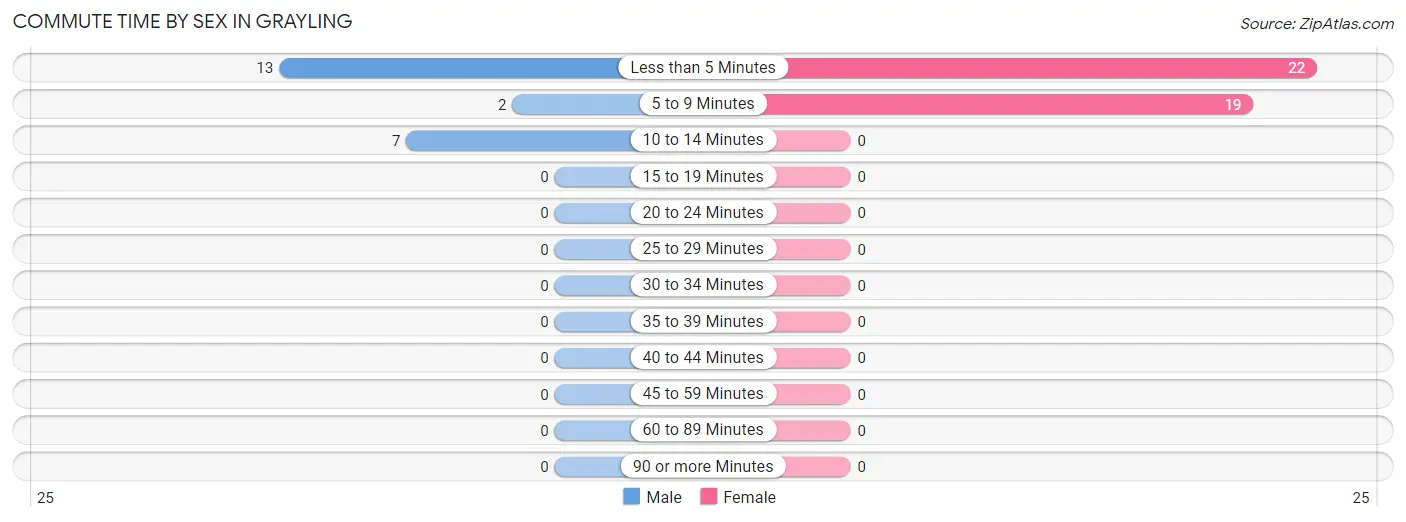
| Commute Time | Male | Female |
| Less than 5 Minutes | 13 (59.1%) | 22 (53.7%) |
| 5 to 9 Minutes | 2 (9.1%) | 19 (46.3%) |
| 10 to 14 Minutes | 7 (31.8%) | 0 (0.0%) |
| 15 to 19 Minutes | 0 (0.0%) | 0 (0.0%) |
| 20 to 24 Minutes | 0 (0.0%) | 0 (0.0%) |
| 25 to 29 Minutes | 0 (0.0%) | 0 (0.0%) |
| 30 to 34 Minutes | 0 (0.0%) | 0 (0.0%) |
| 35 to 39 Minutes | 0 (0.0%) | 0 (0.0%) |
| 40 to 44 Minutes | 0 (0.0%) | 0 (0.0%) |
| 45 to 59 Minutes | 0 (0.0%) | 0 (0.0%) |
| 60 to 89 Minutes | 0 (0.0%) | 0 (0.0%) |
| 90 or more Minutes | 0 (0.0%) | 0 (0.0%) |
Time of Departure to Work by Sex in Grayling
The most frequent times of departure to work in Grayling are 8:30 AM to 8:59 AM (8, 36.4%) for males and 8:30 AM to 8:59 AM (9, 22.0%) for females.
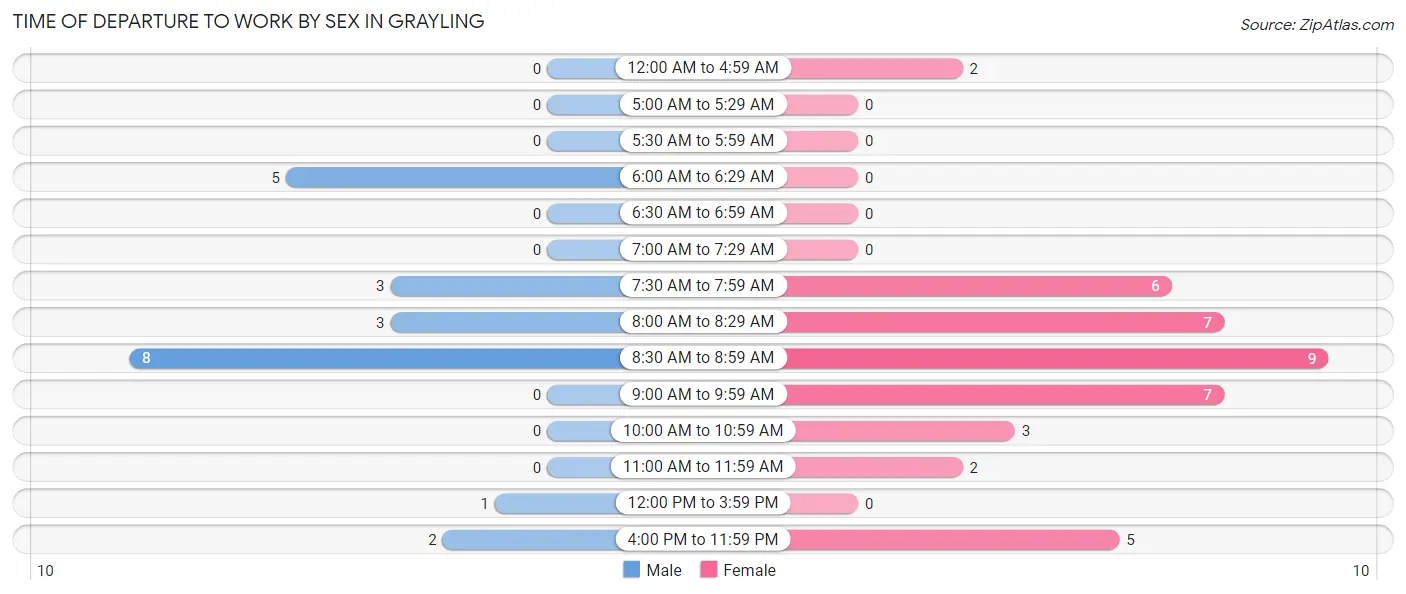
| Time of Departure | Male | Female |
| 12:00 AM to 4:59 AM | 0 (0.0%) | 2 (4.9%) |
| 5:00 AM to 5:29 AM | 0 (0.0%) | 0 (0.0%) |
| 5:30 AM to 5:59 AM | 0 (0.0%) | 0 (0.0%) |
| 6:00 AM to 6:29 AM | 5 (22.7%) | 0 (0.0%) |
| 6:30 AM to 6:59 AM | 0 (0.0%) | 0 (0.0%) |
| 7:00 AM to 7:29 AM | 0 (0.0%) | 0 (0.0%) |
| 7:30 AM to 7:59 AM | 3 (13.6%) | 6 (14.6%) |
| 8:00 AM to 8:29 AM | 3 (13.6%) | 7 (17.1%) |
| 8:30 AM to 8:59 AM | 8 (36.4%) | 9 (22.0%) |
| 9:00 AM to 9:59 AM | 0 (0.0%) | 7 (17.1%) |
| 10:00 AM to 10:59 AM | 0 (0.0%) | 3 (7.3%) |
| 11:00 AM to 11:59 AM | 0 (0.0%) | 2 (4.9%) |
| 12:00 PM to 3:59 PM | 1 (4.5%) | 0 (0.0%) |
| 4:00 PM to 11:59 PM | 2 (9.1%) | 5 (12.2%) |
| Total | 22 (100.0%) | 41 (100.0%) |
Housing Occupancy in Grayling
Occupancy by Ownership in Grayling
Of the total 72 dwellings in Grayling, owner-occupied units account for 57 (79.2%), while renter-occupied units make up 15 (20.8%).
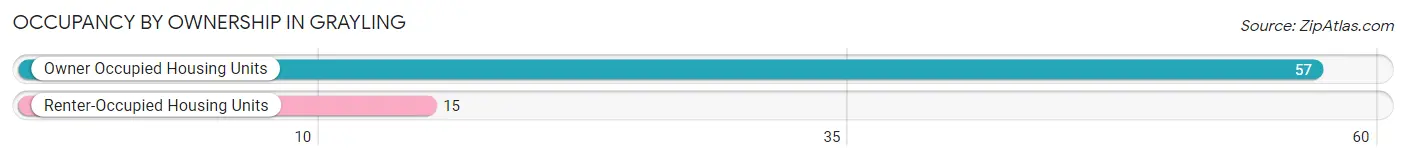
| Occupancy | # Housing Units | % Housing Units |
| Owner Occupied Housing Units | 57 | 79.2% |
| Renter-Occupied Housing Units | 15 | 20.8% |
| Total Occupied Housing Units | 72 | 100.0% |
Occupancy by Household Size in Grayling
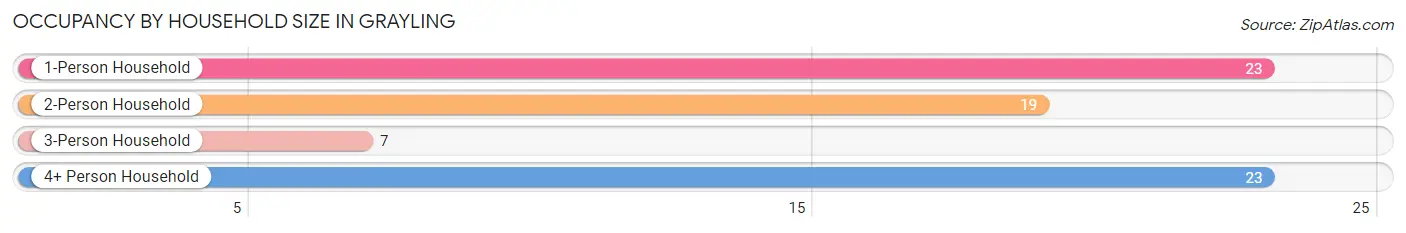
| Household Size | # Housing Units | % Housing Units |
| 1-Person Household | 23 | 31.9% |
| 2-Person Household | 19 | 26.4% |
| 3-Person Household | 7 | 9.7% |
| 4+ Person Household | 23 | 31.9% |
| Total Housing Units | 72 | 100.0% |
Occupancy by Ownership by Household Size in Grayling
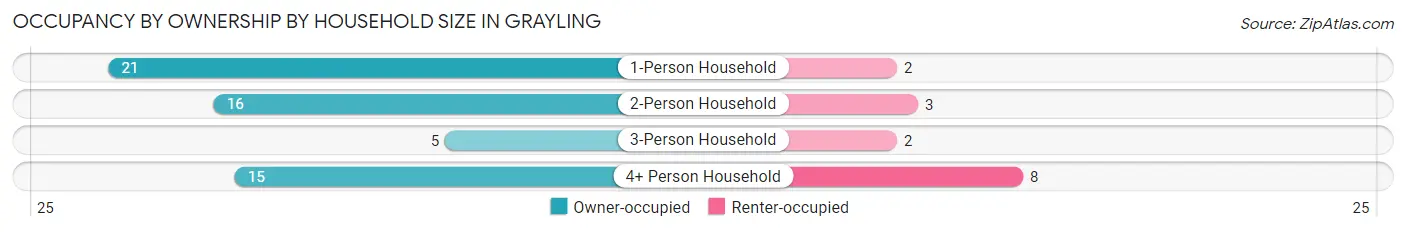
| Household Size | Owner-occupied | Renter-occupied |
| 1-Person Household | 21 (91.3%) | 2 (8.7%) |
| 2-Person Household | 16 (84.2%) | 3 (15.8%) |
| 3-Person Household | 5 (71.4%) | 2 (28.6%) |
| 4+ Person Household | 15 (65.2%) | 8 (34.8%) |
| Total Housing Units | 57 (79.2%) | 15 (20.8%) |
Occupancy by Educational Attainment in Grayling
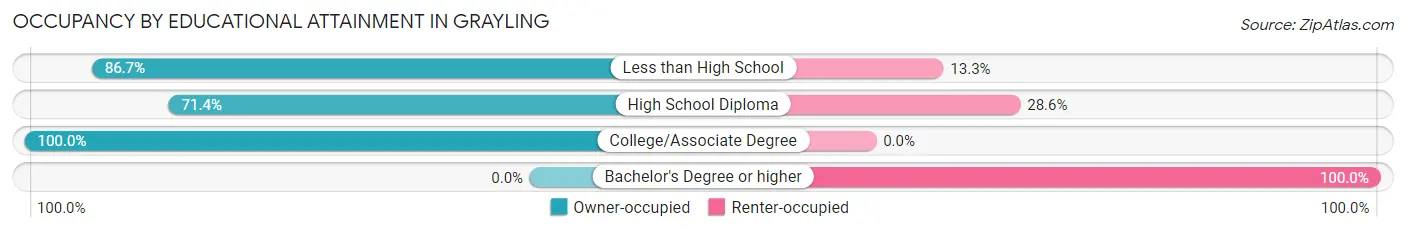
| Household Size | Owner-occupied | Renter-occupied |
| Less than High School | 26 (86.7%) | 4 (13.3%) |
| High School Diploma | 20 (71.4%) | 8 (28.6%) |
| College/Associate Degree | 11 (100.0%) | 0 (0.0%) |
| Bachelor's Degree or higher | 0 (0.0%) | 3 (100.0%) |
Occupancy by Age of Householder in Grayling
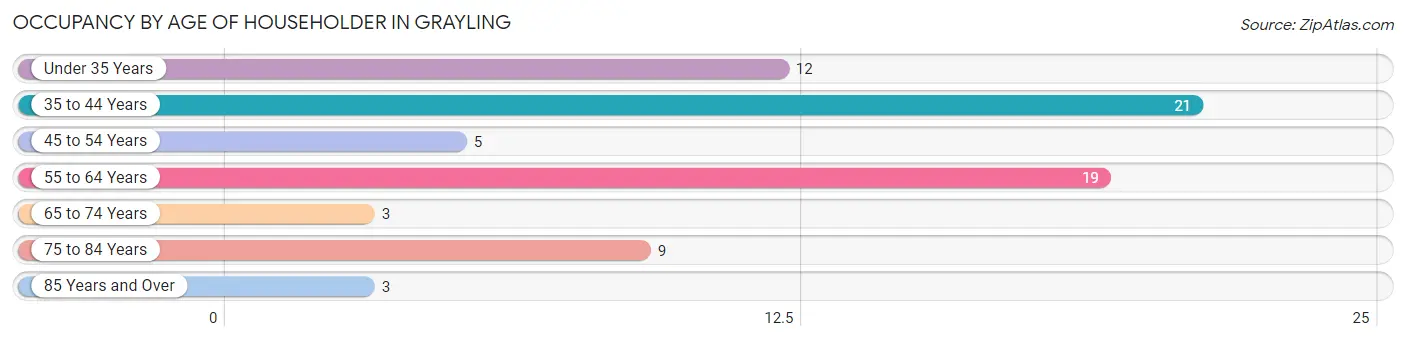
| Age Bracket | # Households | % Households |
| Under 35 Years | 12 | 16.7% |
| 35 to 44 Years | 21 | 29.2% |
| 45 to 54 Years | 5 | 6.9% |
| 55 to 64 Years | 19 | 26.4% |
| 65 to 74 Years | 3 | 4.2% |
| 75 to 84 Years | 9 | 12.5% |
| 85 Years and Over | 3 | 4.2% |
| Total | 72 | 100.0% |
Housing Finances in Grayling
Median Income by Occupancy in Grayling
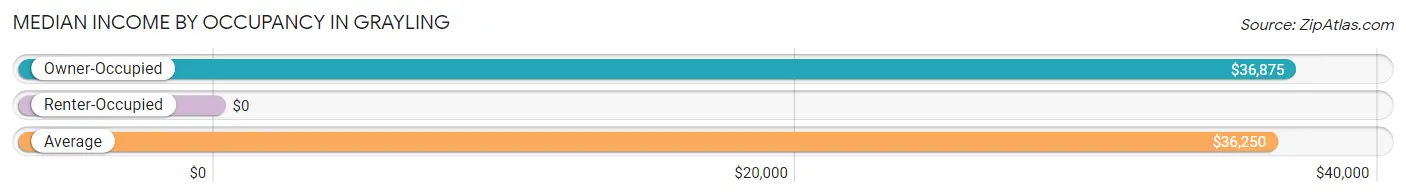
| Occupancy Type | # Households | Median Income |
| Owner-Occupied | 57 (79.2%) | $36,875 |
| Renter-Occupied | 15 (20.8%) | $0 |
| Average | 72 (100.0%) | $36,250 |
Occupancy by Householder Income Bracket in Grayling
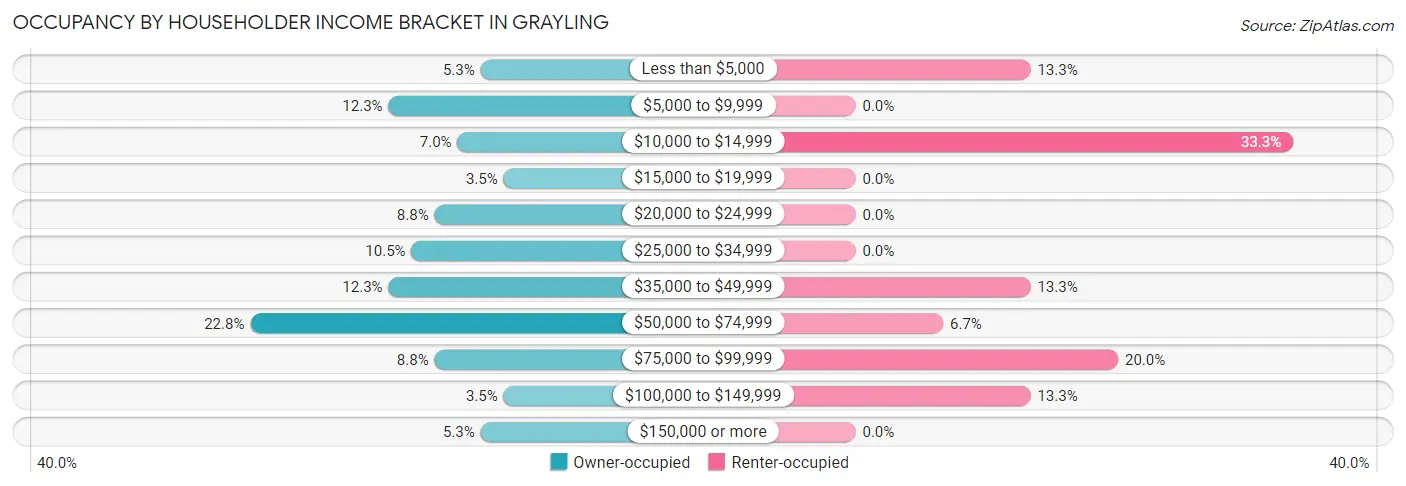
| Income Bracket | Owner-occupied | Renter-occupied |
| Less than $5,000 | 3 (5.3%) | 2 (13.3%) |
| $5,000 to $9,999 | 7 (12.3%) | 0 (0.0%) |
| $10,000 to $14,999 | 4 (7.0%) | 5 (33.3%) |
| $15,000 to $19,999 | 2 (3.5%) | 0 (0.0%) |
| $20,000 to $24,999 | 5 (8.8%) | 0 (0.0%) |
| $25,000 to $34,999 | 6 (10.5%) | 0 (0.0%) |
| $35,000 to $49,999 | 7 (12.3%) | 2 (13.3%) |
| $50,000 to $74,999 | 13 (22.8%) | 1 (6.7%) |
| $75,000 to $99,999 | 5 (8.8%) | 3 (20.0%) |
| $100,000 to $149,999 | 2 (3.5%) | 2 (13.3%) |
| $150,000 or more | 3 (5.3%) | 0 (0.0%) |
| Total | 57 (100.0%) | 15 (100.0%) |
Monthly Housing Cost Tiers in Grayling
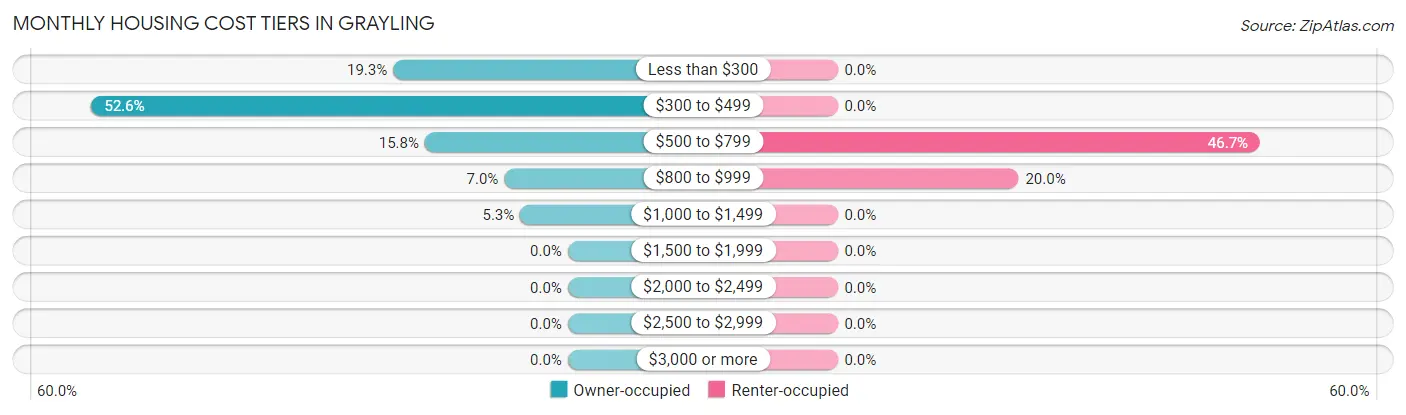
| Monthly Cost | Owner-occupied | Renter-occupied |
| Less than $300 | 11 (19.3%) | 0 (0.0%) |
| $300 to $499 | 30 (52.6%) | 0 (0.0%) |
| $500 to $799 | 9 (15.8%) | 7 (46.7%) |
| $800 to $999 | 4 (7.0%) | 3 (20.0%) |
| $1,000 to $1,499 | 3 (5.3%) | 0 (0.0%) |
| $1,500 to $1,999 | 0 (0.0%) | 0 (0.0%) |
| $2,000 to $2,499 | 0 (0.0%) | 0 (0.0%) |
| $2,500 to $2,999 | 0 (0.0%) | 0 (0.0%) |
| $3,000 or more | 0 (0.0%) | 0 (0.0%) |
| Total | 57 (100.0%) | 15 (100.0%) |
Physical Housing Characteristics in Grayling
Housing Structures in Grayling
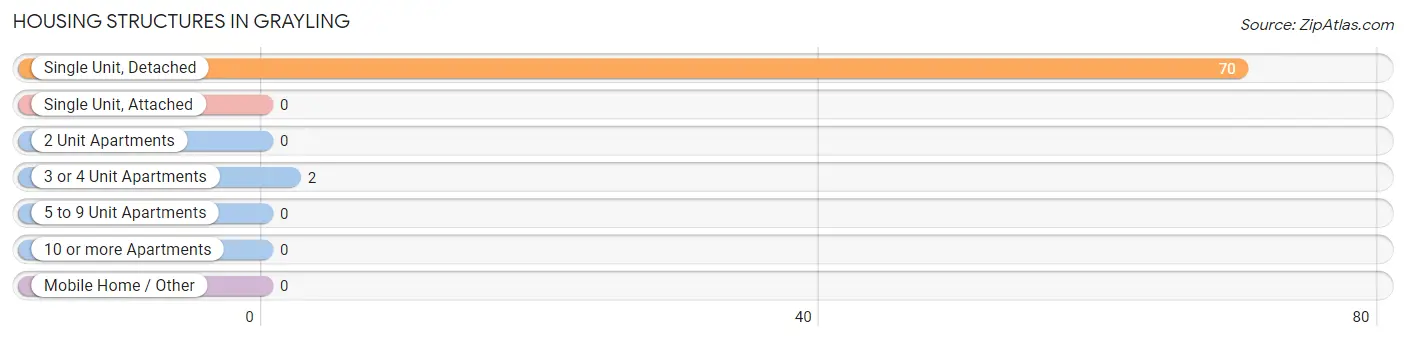
| Structure Type | # Housing Units | % Housing Units |
| Single Unit, Detached | 70 | 97.2% |
| Single Unit, Attached | 0 | 0.0% |
| 2 Unit Apartments | 0 | 0.0% |
| 3 or 4 Unit Apartments | 2 | 2.8% |
| 5 to 9 Unit Apartments | 0 | 0.0% |
| 10 or more Apartments | 0 | 0.0% |
| Mobile Home / Other | 0 | 0.0% |
| Total | 72 | 100.0% |
Housing Structures by Occupancy in Grayling
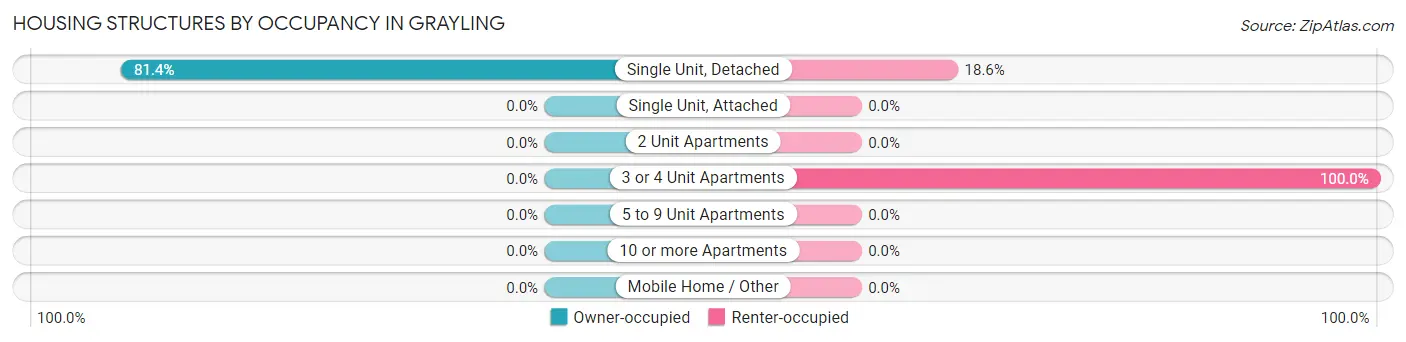
| Structure Type | Owner-occupied | Renter-occupied |
| Single Unit, Detached | 57 (81.4%) | 13 (18.6%) |
| Single Unit, Attached | 0 (0.0%) | 0 (0.0%) |
| 2 Unit Apartments | 0 (0.0%) | 0 (0.0%) |
| 3 or 4 Unit Apartments | 0 (0.0%) | 2 (100.0%) |
| 5 to 9 Unit Apartments | 0 (0.0%) | 0 (0.0%) |
| 10 or more Apartments | 0 (0.0%) | 0 (0.0%) |
| Mobile Home / Other | 0 (0.0%) | 0 (0.0%) |
| Total | 57 (79.2%) | 15 (20.8%) |
Housing Structures by Number of Rooms in Grayling
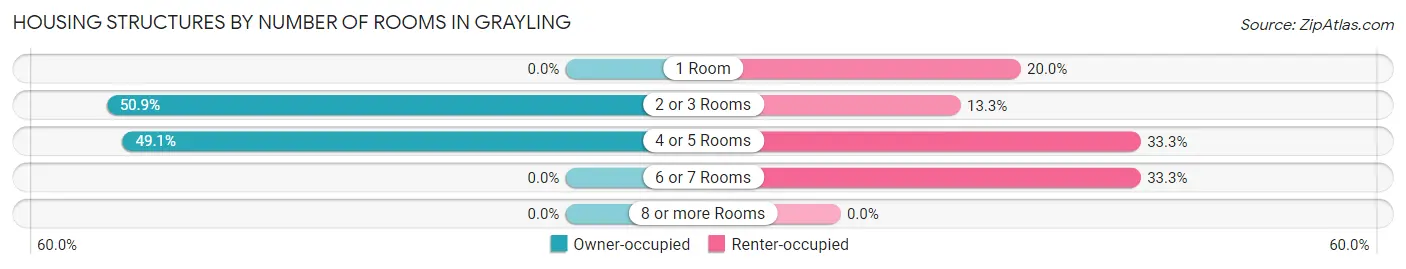
| Number of Rooms | Owner-occupied | Renter-occupied |
| 1 Room | 0 (0.0%) | 3 (20.0%) |
| 2 or 3 Rooms | 29 (50.9%) | 2 (13.3%) |
| 4 or 5 Rooms | 28 (49.1%) | 5 (33.3%) |
| 6 or 7 Rooms | 0 (0.0%) | 5 (33.3%) |
| 8 or more Rooms | 0 (0.0%) | 0 (0.0%) |
| Total | 57 (100.0%) | 15 (100.0%) |
Housing Structure by Heating Type in Grayling
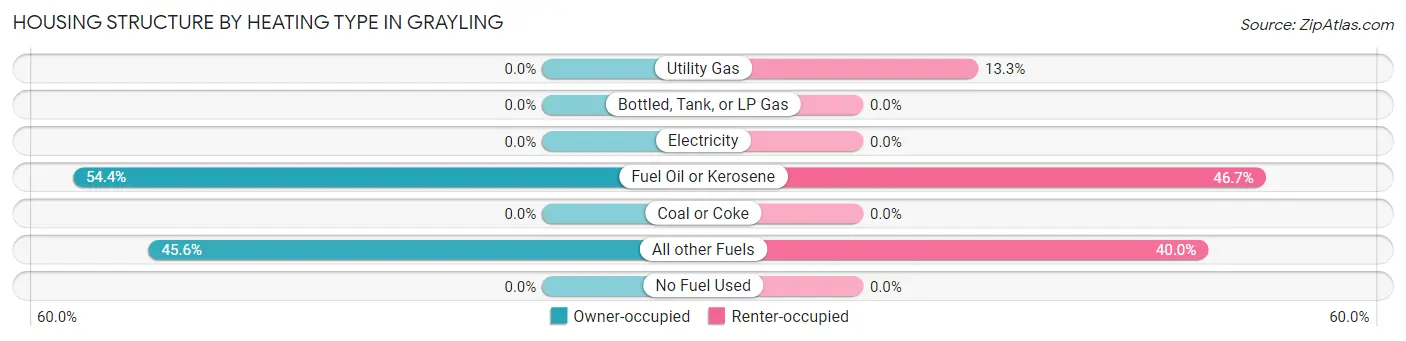
| Heating Type | Owner-occupied | Renter-occupied |
| Utility Gas | 0 (0.0%) | 2 (13.3%) |
| Bottled, Tank, or LP Gas | 0 (0.0%) | 0 (0.0%) |
| Electricity | 0 (0.0%) | 0 (0.0%) |
| Fuel Oil or Kerosene | 31 (54.4%) | 7 (46.7%) |
| Coal or Coke | 0 (0.0%) | 0 (0.0%) |
| All other Fuels | 26 (45.6%) | 6 (40.0%) |
| No Fuel Used | 0 (0.0%) | 0 (0.0%) |
| Total | 57 (100.0%) | 15 (100.0%) |
Household Vehicle Usage in Grayling
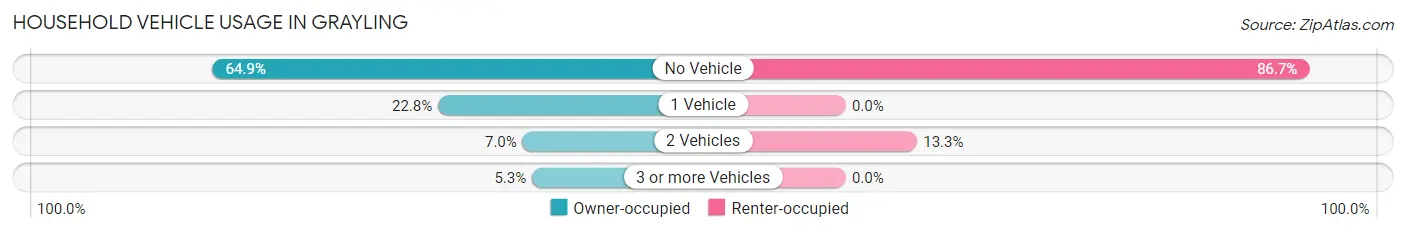
| Vehicles per Household | Owner-occupied | Renter-occupied |
| No Vehicle | 37 (64.9%) | 13 (86.7%) |
| 1 Vehicle | 13 (22.8%) | 0 (0.0%) |
| 2 Vehicles | 4 (7.0%) | 2 (13.3%) |
| 3 or more Vehicles | 3 (5.3%) | 0 (0.0%) |
| Total | 57 (100.0%) | 15 (100.0%) |
Real Estate & Mortgages in Grayling
Real Estate and Mortgage Overview in Grayling
| Characteristic | Without Mortgage | With Mortgage |
| Housing Units | 53 | 4 |
| Median Property Value | $92,500 | $0 |
| Median Household Income | $32,292 | $0 |
| Monthly Housing Costs | $389 | $0 |
| Real Estate Taxes | - | - |
Property Value by Mortgage Status in Grayling
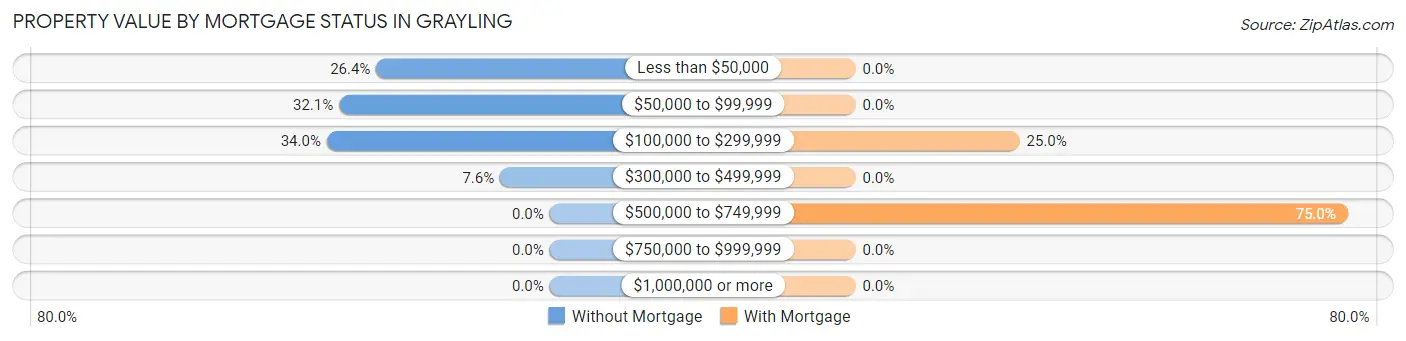
| Property Value | Without Mortgage | With Mortgage |
| Less than $50,000 | 14 (26.4%) | 0 (0.0%) |
| $50,000 to $99,999 | 17 (32.1%) | 0 (0.0%) |
| $100,000 to $299,999 | 18 (34.0%) | 1 (25.0%) |
| $300,000 to $499,999 | 4 (7.5%) | 0 (0.0%) |
| $500,000 to $749,999 | 0 (0.0%) | 3 (75.0%) |
| $750,000 to $999,999 | 0 (0.0%) | 0 (0.0%) |
| $1,000,000 or more | 0 (0.0%) | 0 (0.0%) |
| Total | 53 (100.0%) | 4 (100.0%) |
Household Income by Mortgage Status in Grayling
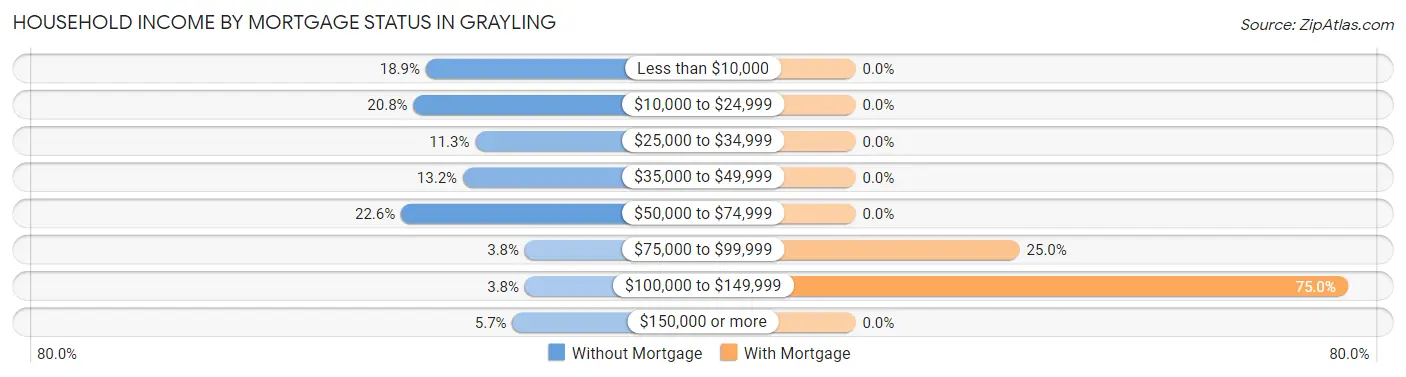
| Household Income | Without Mortgage | With Mortgage |
| Less than $10,000 | 10 (18.9%) | 0 (0.0%) |
| $10,000 to $24,999 | 11 (20.7%) | 0 (0.0%) |
| $25,000 to $34,999 | 6 (11.3%) | 0 (0.0%) |
| $35,000 to $49,999 | 7 (13.2%) | 0 (0.0%) |
| $50,000 to $74,999 | 12 (22.6%) | 0 (0.0%) |
| $75,000 to $99,999 | 2 (3.8%) | 1 (25.0%) |
| $100,000 to $149,999 | 2 (3.8%) | 3 (75.0%) |
| $150,000 or more | 3 (5.7%) | 0 (0.0%) |
| Total | 53 (100.0%) | 4 (100.0%) |
Property Value to Household Income Ratio in Grayling
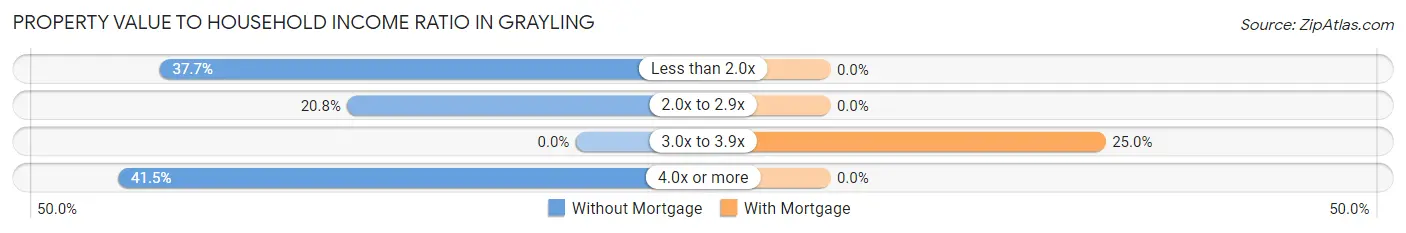
| Value-to-Income Ratio | Without Mortgage | With Mortgage |
| Less than 2.0x | 20 (37.7%) | 0 (0.0%) |
| 2.0x to 2.9x | 11 (20.7%) | 0 (0.0%) |
| 3.0x to 3.9x | 0 (0.0%) | 1 (25.0%) |
| 4.0x or more | 22 (41.5%) | 0 (0.0%) |
| Total | 53 (100.0%) | 4 (100.0%) |
Real Estate Taxes by Mortgage Status in Grayling
| Property Taxes | Without Mortgage | With Mortgage |
| Less than $800 | 0 (0.0%) | 0 (0.0%) |
| $800 to $1,499 | 0 (0.0%) | 0 (0.0%) |
| $800 to $1,499 | 0 (0.0%) | 0 (0.0%) |
| Total | 53 (100.0%) | 4 (100.0%) |
Health & Disability in Grayling
Health Insurance Coverage by Age in Grayling
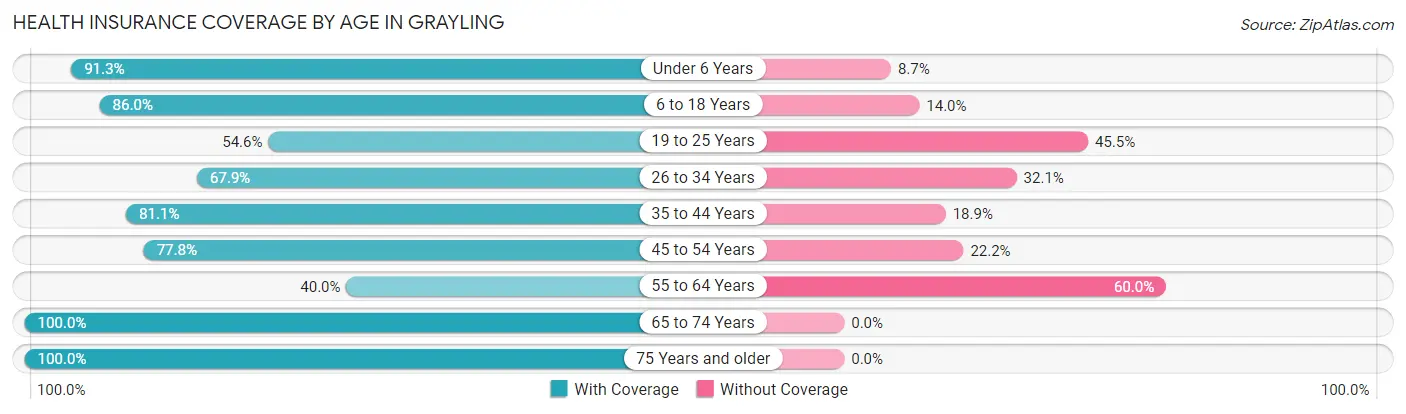
| Age Bracket | With Coverage | Without Coverage |
| Under 6 Years | 21 (91.3%) | 2 (8.7%) |
| 6 to 18 Years | 43 (86.0%) | 7 (14.0%) |
| 19 to 25 Years | 6 (54.5%) | 5 (45.5%) |
| 26 to 34 Years | 19 (67.9%) | 9 (32.1%) |
| 35 to 44 Years | 30 (81.1%) | 7 (18.9%) |
| 45 to 54 Years | 7 (77.8%) | 2 (22.2%) |
| 55 to 64 Years | 12 (40.0%) | 18 (60.0%) |
| 65 to 74 Years | 6 (100.0%) | 0 (0.0%) |
| 75 Years and older | 16 (100.0%) | 0 (0.0%) |
| Total | 160 (76.2%) | 50 (23.8%) |
Health Insurance Coverage by Citizenship Status in Grayling
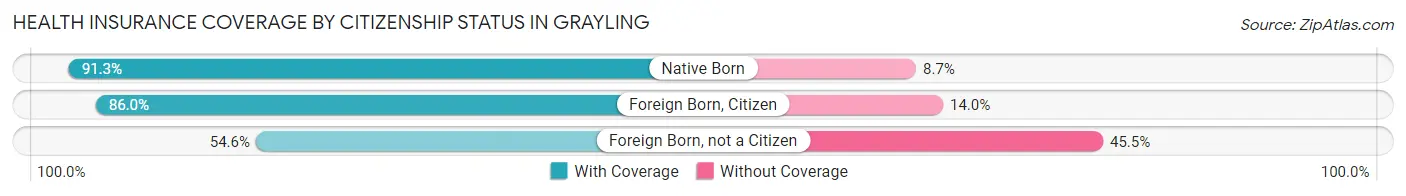
| Citizenship Status | With Coverage | Without Coverage |
| Native Born | 21 (91.3%) | 2 (8.7%) |
| Foreign Born, Citizen | 43 (86.0%) | 7 (14.0%) |
| Foreign Born, not a Citizen | 6 (54.5%) | 5 (45.5%) |
Health Insurance Coverage by Household Income in Grayling
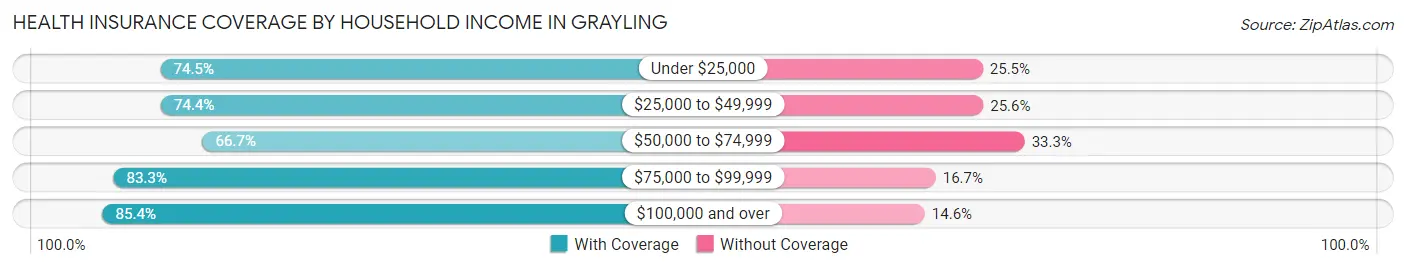
| Household Income | With Coverage | Without Coverage |
| Under $25,000 | 38 (74.5%) | 13 (25.5%) |
| $25,000 to $49,999 | 32 (74.4%) | 11 (25.6%) |
| $50,000 to $74,999 | 30 (66.7%) | 15 (33.3%) |
| $75,000 to $99,999 | 25 (83.3%) | 5 (16.7%) |
| $100,000 and over | 35 (85.4%) | 6 (14.6%) |
Public vs Private Health Insurance Coverage by Age in Grayling
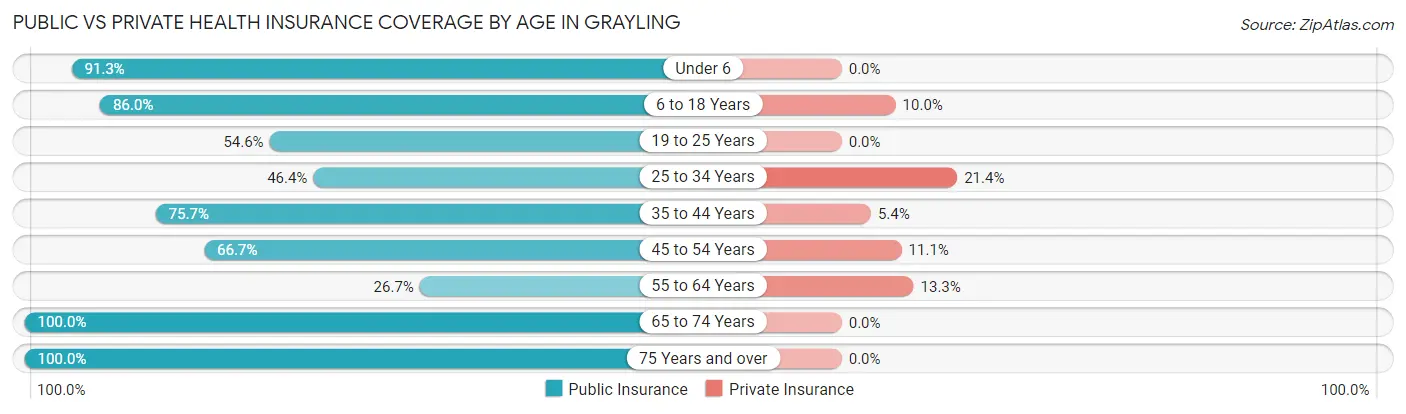
| Age Bracket | Public Insurance | Private Insurance |
| Under 6 | 21 (91.3%) | 0 (0.0%) |
| 6 to 18 Years | 43 (86.0%) | 5 (10.0%) |
| 19 to 25 Years | 6 (54.5%) | 0 (0.0%) |
| 25 to 34 Years | 13 (46.4%) | 6 (21.4%) |
| 35 to 44 Years | 28 (75.7%) | 2 (5.4%) |
| 45 to 54 Years | 6 (66.7%) | 1 (11.1%) |
| 55 to 64 Years | 8 (26.7%) | 4 (13.3%) |
| 65 to 74 Years | 6 (100.0%) | 0 (0.0%) |
| 75 Years and over | 16 (100.0%) | 0 (0.0%) |
| Total | 147 (70.0%) | 18 (8.6%) |
Disability Status by Sex by Age in Grayling
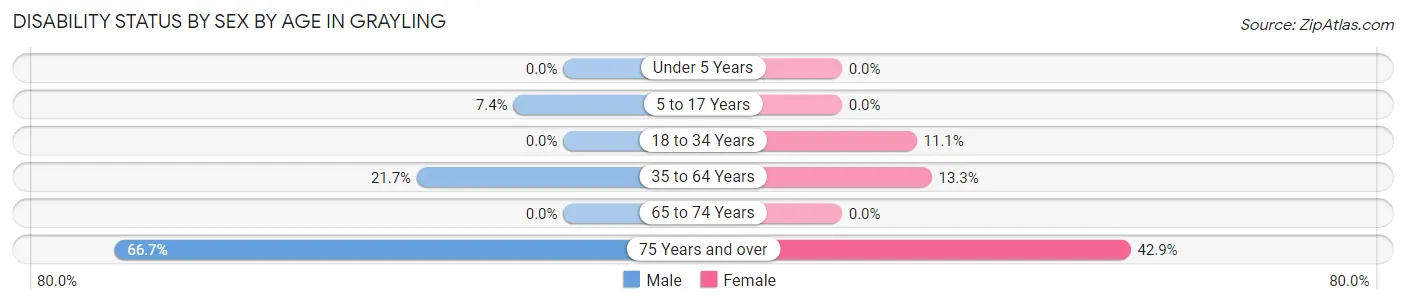
| Age Bracket | Male | Female |
| Under 5 Years | 0 (0.0%) | 0 (0.0%) |
| 5 to 17 Years | 2 (7.4%) | 0 (0.0%) |
| 18 to 34 Years | 0 (0.0%) | 3 (11.1%) |
| 35 to 64 Years | 10 (21.7%) | 4 (13.3%) |
| 65 to 74 Years | 0 (0.0%) | 0 (0.0%) |
| 75 Years and over | 6 (66.7%) | 3 (42.9%) |
Disability Class by Sex by Age in Grayling
Disability Class: Hearing Difficulty
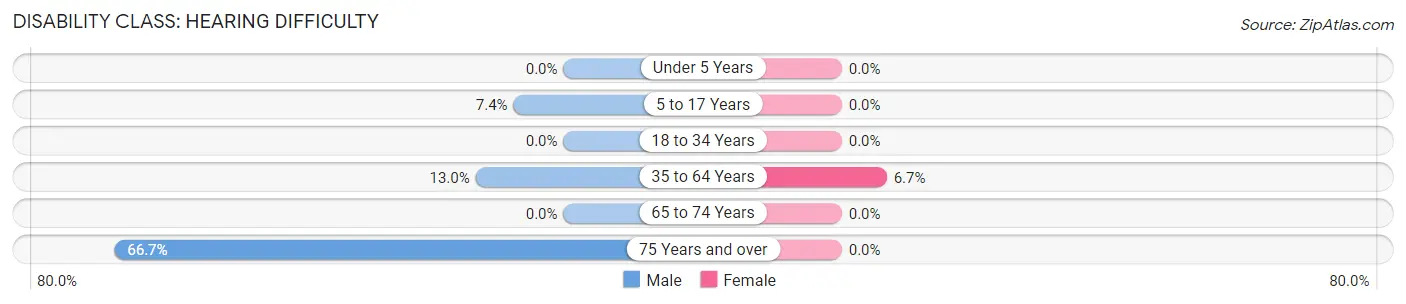
| Age Bracket | Male | Female |
| Under 5 Years | 0 (0.0%) | 0 (0.0%) |
| 5 to 17 Years | 2 (7.4%) | 0 (0.0%) |
| 18 to 34 Years | 0 (0.0%) | 0 (0.0%) |
| 35 to 64 Years | 6 (13.0%) | 2 (6.7%) |
| 65 to 74 Years | 0 (0.0%) | 0 (0.0%) |
| 75 Years and over | 6 (66.7%) | 0 (0.0%) |
Disability Class: Vision Difficulty
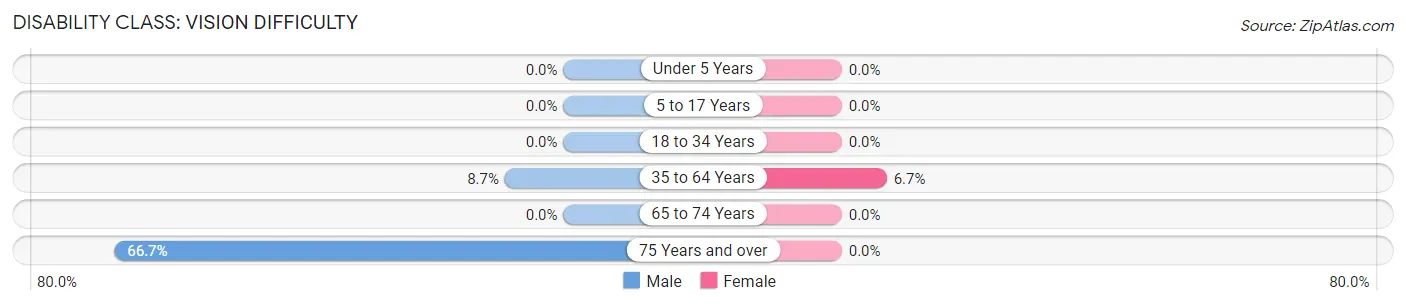
| Age Bracket | Male | Female |
| Under 5 Years | 0 (0.0%) | 0 (0.0%) |
| 5 to 17 Years | 0 (0.0%) | 0 (0.0%) |
| 18 to 34 Years | 0 (0.0%) | 0 (0.0%) |
| 35 to 64 Years | 4 (8.7%) | 2 (6.7%) |
| 65 to 74 Years | 0 (0.0%) | 0 (0.0%) |
| 75 Years and over | 6 (66.7%) | 0 (0.0%) |
Disability Class: Cognitive Difficulty
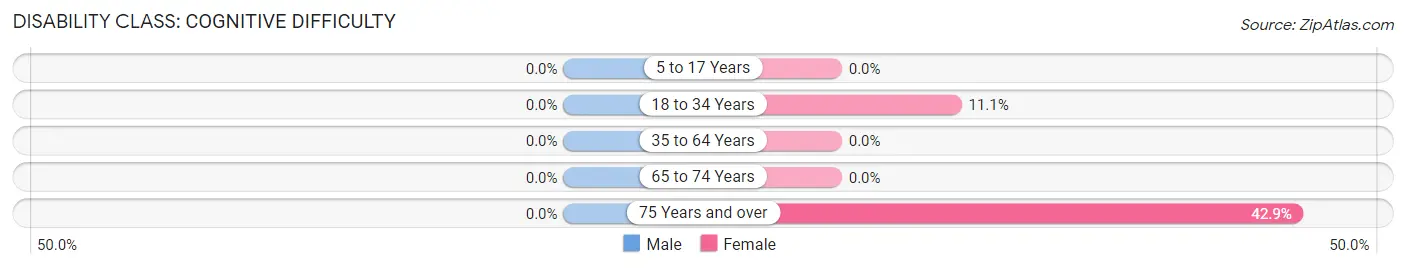
| Age Bracket | Male | Female |
| 5 to 17 Years | 0 (0.0%) | 0 (0.0%) |
| 18 to 34 Years | 0 (0.0%) | 3 (11.1%) |
| 35 to 64 Years | 0 (0.0%) | 0 (0.0%) |
| 65 to 74 Years | 0 (0.0%) | 0 (0.0%) |
| 75 Years and over | 0 (0.0%) | 3 (42.9%) |
Disability Class: Ambulatory Difficulty
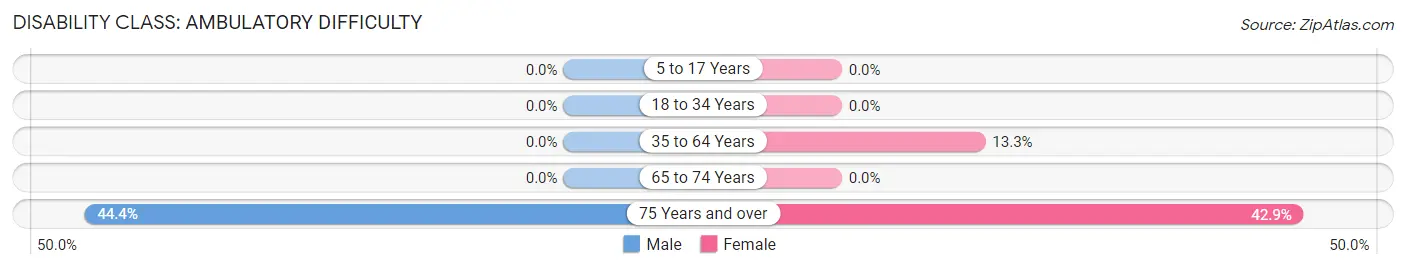
| Age Bracket | Male | Female |
| 5 to 17 Years | 0 (0.0%) | 0 (0.0%) |
| 18 to 34 Years | 0 (0.0%) | 0 (0.0%) |
| 35 to 64 Years | 0 (0.0%) | 4 (13.3%) |
| 65 to 74 Years | 0 (0.0%) | 0 (0.0%) |
| 75 Years and over | 4 (44.4%) | 3 (42.9%) |
Disability Class: Self-Care Difficulty
| Age Bracket | Male | Female |
| 5 to 17 Years | 0 (0.0%) | 0 (0.0%) |
| 18 to 34 Years | 0 (0.0%) | 0 (0.0%) |
| 35 to 64 Years | 0 (0.0%) | 0 (0.0%) |
| 65 to 74 Years | 0 (0.0%) | 0 (0.0%) |
| 75 Years and over | 0 (0.0%) | 0 (0.0%) |
Technology Access in Grayling
Computing Device Access in Grayling
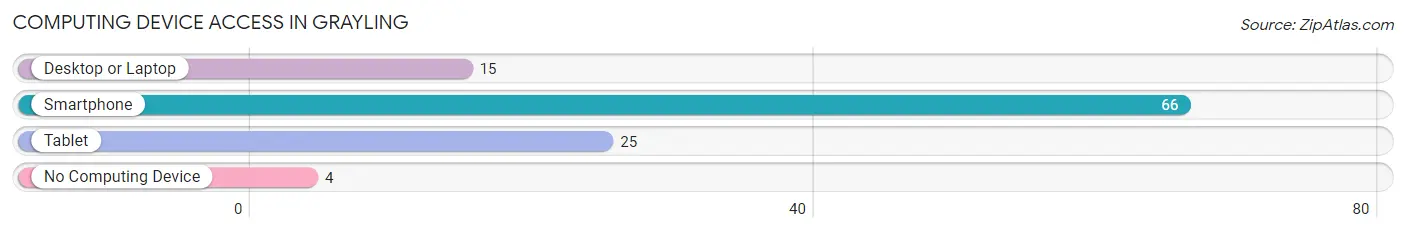
| Device Type | # Households | % Households |
| Desktop or Laptop | 15 | 20.8% |
| Smartphone | 66 | 91.7% |
| Tablet | 25 | 34.7% |
| No Computing Device | 4 | 5.6% |
| Total | 72 | 100.0% |
Internet Access in Grayling
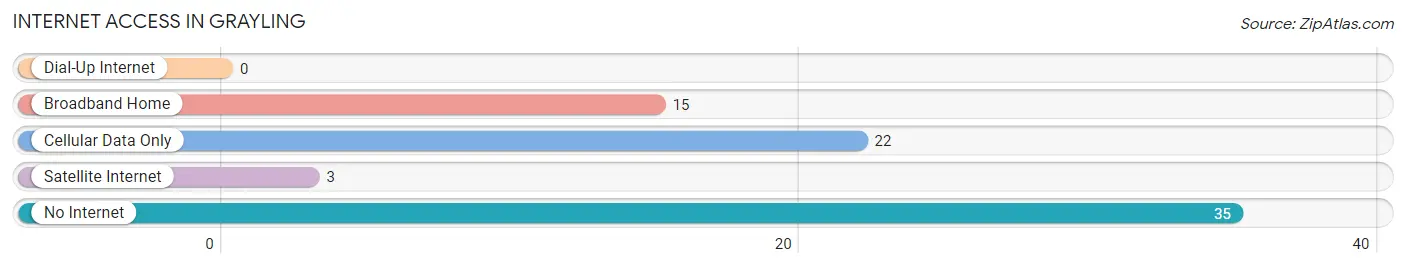
| Internet Type | # Households | % Households |
| Dial-Up Internet | 0 | 0.0% |
| Broadband Home | 15 | 20.8% |
| Cellular Data Only | 22 | 30.6% |
| Satellite Internet | 3 | 4.2% |
| No Internet | 35 | 48.6% |
| Total | 72 | 100.0% |
Grayling Summary
Grayling, Alaska is a small city located in the Yukon-Koyukuk Census Area of the U.S. state of Alaska. It is situated on the south bank of the Yukon River, approximately 40 miles (64 km) east of the city of Galena. The population of Grayling was estimated to be 517 in 2019.
History
The area around Grayling has been inhabited by the Koyukon Athabascan people for thousands of years. The first non-Native settlers arrived in the area in the late 19th century, and the town was officially founded in 1901. The town was named after the grayling fish, which is found in the nearby Yukon River.
In the early 20th century, Grayling was a bustling trading post and transportation hub. The town was connected to the outside world by the Yukon River, which was used to transport goods and people. The town also had a post office, a school, a general store, and a hotel.
In the 1950s, the construction of the Alaska Highway and the Trans-Alaska Pipeline brought new economic opportunities to the area. The town's population grew as people moved to the area to take advantage of the new jobs.
Geography
Grayling is located in the Yukon-Koyukuk Census Area of Alaska. It is situated on the south bank of the Yukon River, approximately 40 miles (64 km) east of the city of Galena. The town is surrounded by the Yukon-Koyukuk National Wildlife Refuge.
The climate in Grayling is subarctic, with long, cold winters and short, mild summers. The average temperature in January is -17°F (-27°C), and the average temperature in July is 59°F (15°C).
Economy
The economy of Grayling is largely based on subsistence activities, such as fishing, hunting, and trapping. The town also has a small tourism industry, with visitors coming to the area to take advantage of the outdoor activities, such as fishing, hunting, and camping.
The town is also home to a number of small businesses, including a general store, a restaurant, and a hotel. The town also has a post office and a school.
Demographics
As of 2019, the population of Grayling was estimated to be 517. The population is predominantly Native American, with the majority of residents being of Koyukon Athabascan descent. The median age in the town is 33.7 years, and the median household income is $37,500.
Conclusion
Grayling, Alaska is a small city located in the Yukon-Koyukuk Census Area of the U.S. state of Alaska. It is situated on the south bank of the Yukon River, approximately 40 miles (64 km) east of the city of Galena. The population of Grayling was estimated to be 517 in 2019. The economy of Grayling is largely based on subsistence activities, such as fishing, hunting, and trapping. The town also has a small tourism industry, with visitors coming to the area to take advantage of the outdoor activities. The population is predominantly Native American, with the majority of residents being of Koyukon Athabascan descent.
Common Questions
What is Per Capita Income in Grayling?
Per Capita income in Grayling is $16,326.
What is the Median Family Income in Grayling?
Median Family Income in Grayling is $53,125.
What is the Median Household income in Grayling?
Median Household Income in Grayling is $36,250.
What is Family Income Deficit in Grayling?
Family Income Deficit in Grayling is $10,550.
Families that are below poverty line in Grayling earn $10,550 less on average than the poverty threshold level.
What is Inequality or Gini Index in Grayling?
Inequality or Gini Index in Grayling is 0.46.
What is the Total Population of Grayling?
Total Population of Grayling is 210.
What is the Total Male Population of Grayling?
Total Male Population of Grayling is 116.
What is the Total Female Population of Grayling?
Total Female Population of Grayling is 94.
What is the Ratio of Males per 100 Females in Grayling?
There are 123.40 Males per 100 Females in Grayling.
What is the Ratio of Females per 100 Males in Grayling?
There are 81.03 Females per 100 Males in Grayling.
What is the Median Population Age in Grayling?
Median Population Age in Grayling is 31.0 Years.
What is the Average Family Size in Grayling
Average Family Size in Grayling is 3.5 People.
What is the Average Household Size in Grayling
Average Household Size in Grayling is 2.9 People.
How Large is the Labor Force in Grayling?
There are 92 People in the Labor Forcein in Grayling.
What is the Percentage of People in the Labor Force in Grayling?
61.3% of People are in the Labor Force in Grayling.
What is the Unemployment Rate in Grayling?
Unemployment Rate in Grayling is 31.5%.