Port Lions, AK Map & Demographics
Port Lions Map
Port Lions Overview
$39,884
PER CAPITA INCOME
$84,688
AVG FAMILY INCOME
$50,000
AVG HOUSEHOLD INCOME
2.0%
WAGE / INCOME GAP [ % ]
98.0¢/ $1
WAGE / INCOME GAP [ $ ]
0.38
INEQUALITY / GINI INDEX
124
TOTAL POPULATION
56
MALE POPULATION
68
FEMALE POPULATION
82.35
MALES / 100 FEMALES
121.43
FEMALES / 100 MALES
56.8
MEDIAN AGE
2.9
AVG FAMILY SIZE
1.9
AVG HOUSEHOLD SIZE
64
LABOR FORCE [ PEOPLE ]
56.6%
PERCENT IN LABOR FORCE
7.8%
UNEMPLOYMENT RATE
Port Lions Zip Codes
Port Lions Area Codes
Income in Port Lions
Income Overview in Port Lions
Per Capita Income in Port Lions is $39,884, while median incomes of families and households are $84,688 and $50,000 respectively.
| Characteristic | Number | Measure |
| Per Capita Income | 124 | $39,884 |
| Median Family Income | 29 | $84,688 |
| Mean Family Income | 29 | $102,366 |
| Median Household Income | 66 | $50,000 |
| Mean Household Income | 66 | $72,044 |
| Income Deficit | 29 | $0 |
| Wage / Income Gap (%) | 124 | 1.96% |
| Wage / Income Gap ($) | 124 | 98.04¢ per $1 |
| Gini / Inequality Index | 124 | 0.38 |
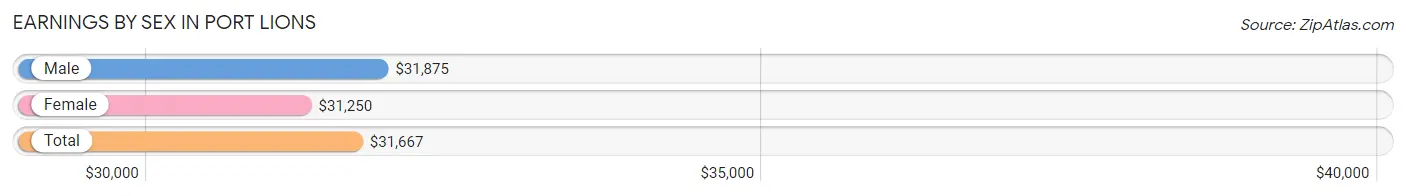
Earnings by Sex in Port Lions
Average Earnings in Port Lions are $31,667, $31,875 for men and $31,250 for women, a difference of 2.0%.
| Sex | Number | Average Earnings |
| Male | 31 (47.0%) | $31,875 |
| Female | 35 (53.0%) | $31,250 |
| Total | 66 (100.0%) | $31,667 |
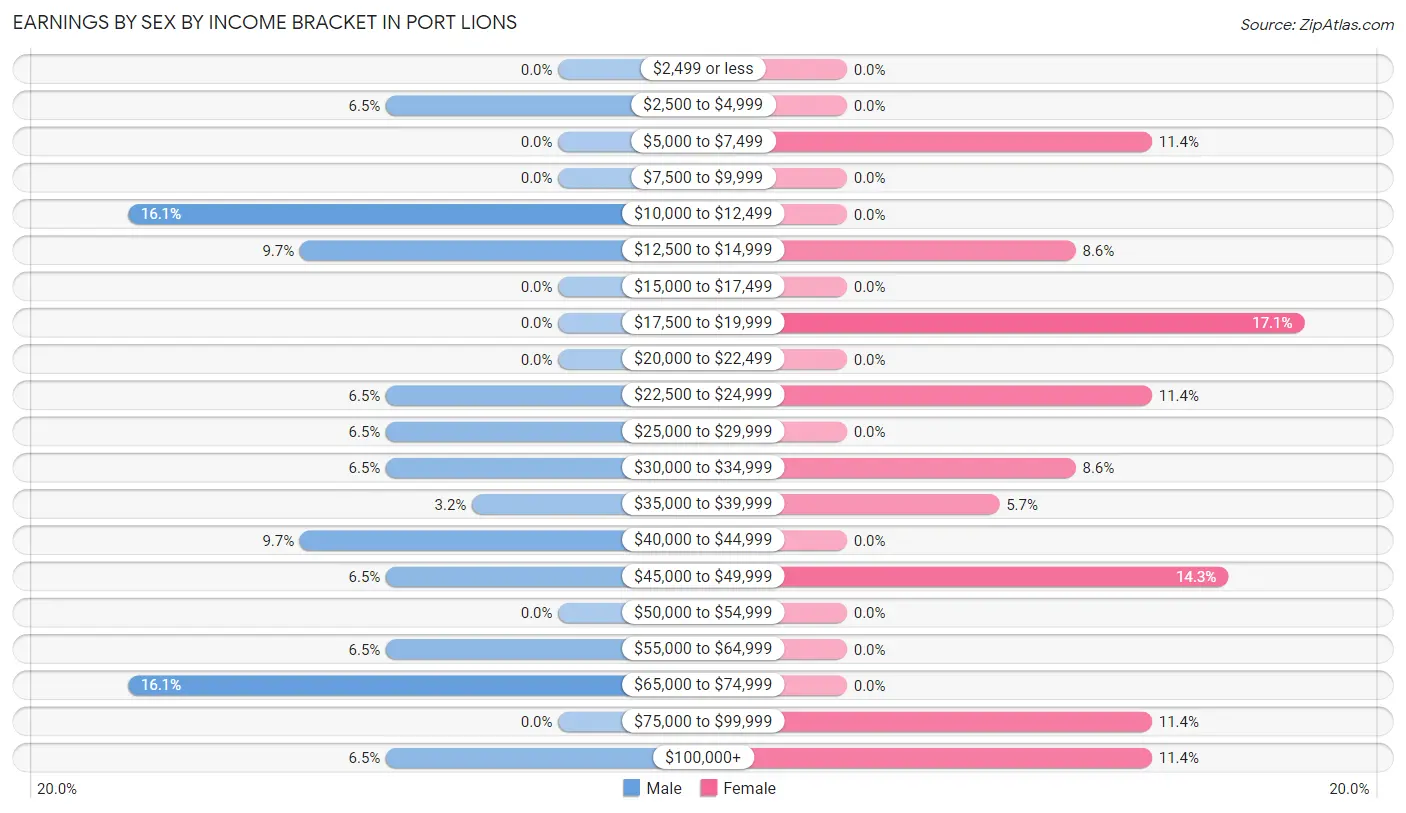
Earnings by Sex by Income Bracket in Port Lions
The most common earnings brackets in Port Lions are $10,000 to $12,499 for men (5 | 16.1%) and $17,500 to $19,999 for women (6 | 17.1%).
| Income | Male | Female |
| $2,499 or less | 0 (0.0%) | 0 (0.0%) |
| $2,500 to $4,999 | 2 (6.5%) | 0 (0.0%) |
| $5,000 to $7,499 | 0 (0.0%) | 4 (11.4%) |
| $7,500 to $9,999 | 0 (0.0%) | 0 (0.0%) |
| $10,000 to $12,499 | 5 (16.1%) | 0 (0.0%) |
| $12,500 to $14,999 | 3 (9.7%) | 3 (8.6%) |
| $15,000 to $17,499 | 0 (0.0%) | 0 (0.0%) |
| $17,500 to $19,999 | 0 (0.0%) | 6 (17.1%) |
| $20,000 to $22,499 | 0 (0.0%) | 0 (0.0%) |
| $22,500 to $24,999 | 2 (6.5%) | 4 (11.4%) |
| $25,000 to $29,999 | 2 (6.5%) | 0 (0.0%) |
| $30,000 to $34,999 | 2 (6.5%) | 3 (8.6%) |
| $35,000 to $39,999 | 1 (3.2%) | 2 (5.7%) |
| $40,000 to $44,999 | 3 (9.7%) | 0 (0.0%) |
| $45,000 to $49,999 | 2 (6.5%) | 5 (14.3%) |
| $50,000 to $54,999 | 0 (0.0%) | 0 (0.0%) |
| $55,000 to $64,999 | 2 (6.5%) | 0 (0.0%) |
| $65,000 to $74,999 | 5 (16.1%) | 0 (0.0%) |
| $75,000 to $99,999 | 0 (0.0%) | 4 (11.4%) |
| $100,000+ | 2 (6.5%) | 4 (11.4%) |
| Total | 31 (100.0%) | 35 (100.0%) |
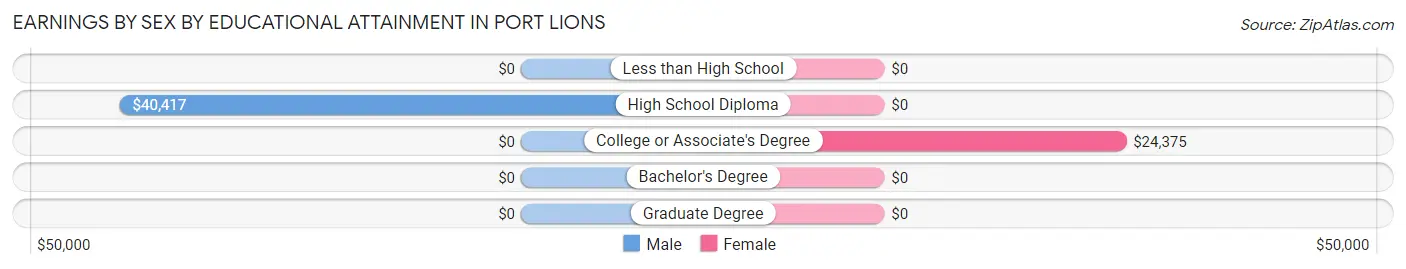
Earnings by Sex by Educational Attainment in Port Lions
| Educational Attainment | Male Income | Female Income |
| Less than High School | - | - |
| High School Diploma | $40,417 | $0 |
| College or Associate's Degree | - | - |
| Bachelor's Degree | - | - |
| Graduate Degree | - | - |
| Total | $41,250 | $0 |
Family Income in Port Lions
Family Income Brackets in Port Lions
According to the Port Lions family income data, there are 7 families falling into the $100,000 to $149,999 income range, which is the most common income bracket and makes up 24.1% of all families.
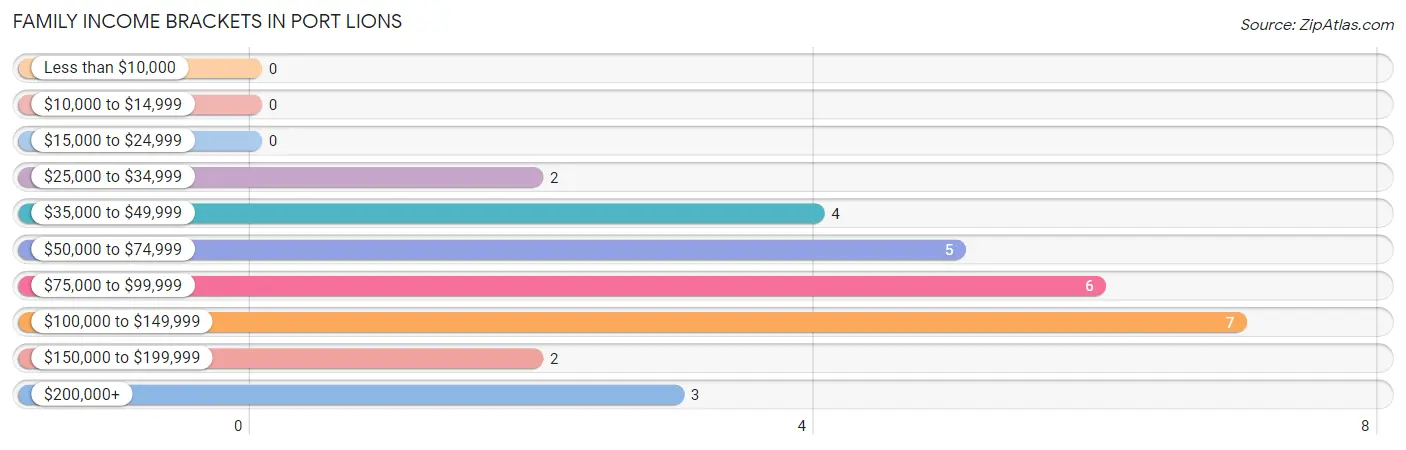
| Income Bracket | # Families | % Families |
| Less than $10,000 | 0 | 0.0% |
| $10,000 to $14,999 | 0 | 0.0% |
| $15,000 to $24,999 | 0 | 0.0% |
| $25,000 to $34,999 | 2 | 6.9% |
| $35,000 to $49,999 | 4 | 13.8% |
| $50,000 to $74,999 | 5 | 17.2% |
| $75,000 to $99,999 | 6 | 20.7% |
| $100,000 to $149,999 | 7 | 24.1% |
| $150,000 to $199,999 | 2 | 6.9% |
| $200,000+ | 3 | 10.3% |
Family Income by Famaliy Size in Port Lions
2-person families (20 | 69.0%) account for the highest median family income in Port Lions with $72,500 per family, while 2-person families (20 | 69.0%) have the highest median income of $36,250 per family member.
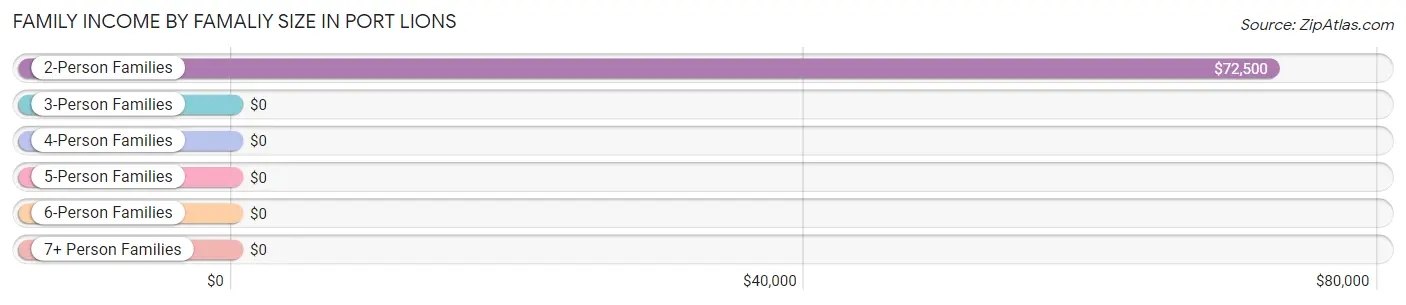
| Income Bracket | # Families | Median Income |
| 2-Person Families | 20 (69.0%) | $72,500 |
| 3-Person Families | 4 (13.8%) | $0 |
| 4-Person Families | 3 (10.3%) | $0 |
| 5-Person Families | 0 (0.0%) | $0 |
| 6-Person Families | 2 (6.9%) | $0 |
| 7+ Person Families | 0 (0.0%) | $0 |
| Total | 29 (100.0%) | $84,688 |
Family Income by Number of Earners in Port Lions
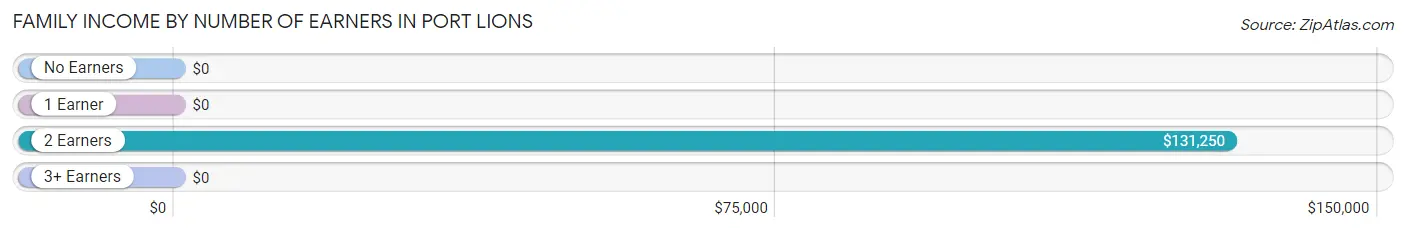
| Number of Earners | # Families | Median Income |
| No Earners | 6 (20.7%) | $0 |
| 1 Earner | 11 (37.9%) | $0 |
| 2 Earners | 8 (27.6%) | $131,250 |
| 3+ Earners | 4 (13.8%) | $0 |
| Total | 29 (100.0%) | $84,688 |
Household Income in Port Lions
Household Income Brackets in Port Lions
With 22 households falling in the category, the $35,000 to $49,999 income range is the most frequent in Port Lions, accounting for 33.3% of all households. In contrast, only 2 households (3.0%) fall into the less than $10,000 income bracket, making it the least populous group.
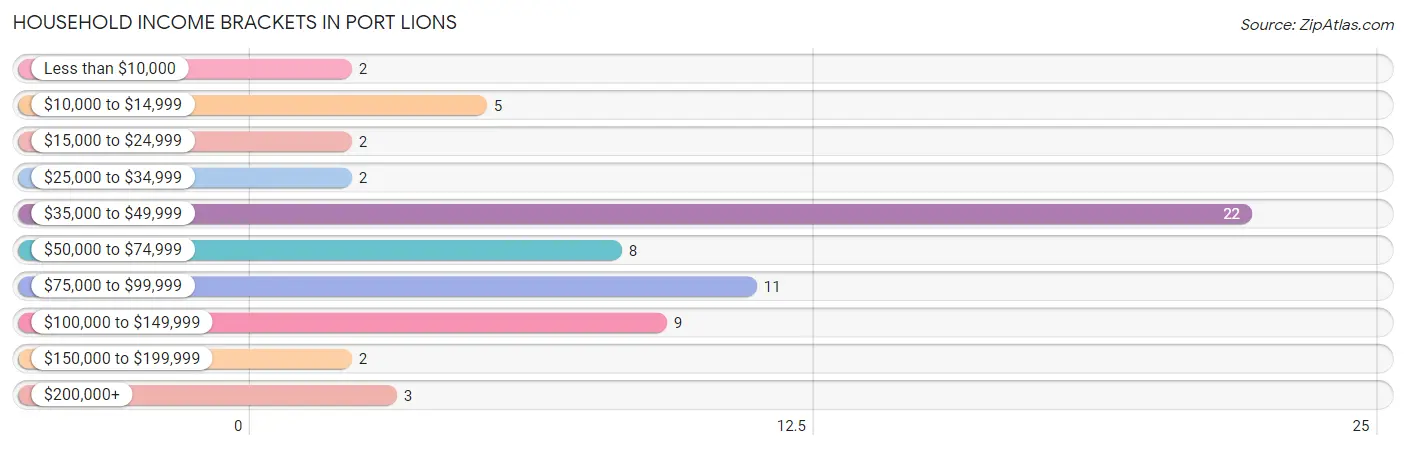
| Income Bracket | # Households | % Households |
| Less than $10,000 | 2 | 3.0% |
| $10,000 to $14,999 | 5 | 7.6% |
| $15,000 to $24,999 | 2 | 3.0% |
| $25,000 to $34,999 | 2 | 3.0% |
| $35,000 to $49,999 | 22 | 33.3% |
| $50,000 to $74,999 | 8 | 12.1% |
| $75,000 to $99,999 | 11 | 16.7% |
| $100,000 to $149,999 | 9 | 13.6% |
| $150,000 to $199,999 | 2 | 3.0% |
| $200,000+ | 3 | 4.5% |
Household Income by Householder Age in Port Lions
The median household income in Port Lions is $50,000, with the highest median household income of $131,875 found in the 25 to 44 years age bracket for the primary householder. A total of 5 households (7.6%) fall into this category. Meanwhile, the 15 to 24 years age bracket for the primary householder has the lowest median household income of $0, with 4 households (6.1%) in this group.
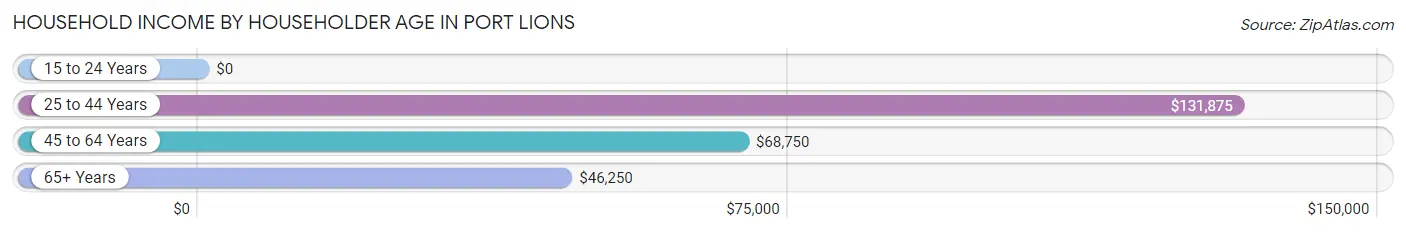
| Income Bracket | # Households | Median Income |
| 15 to 24 Years | 4 (6.1%) | $0 |
| 25 to 44 Years | 5 (7.6%) | $131,875 |
| 45 to 64 Years | 32 (48.5%) | $68,750 |
| 65+ Years | 25 (37.9%) | $46,250 |
| Total | 66 (100.0%) | $50,000 |
Poverty in Port Lions
Income Below Poverty by Sex and Age in Port Lions
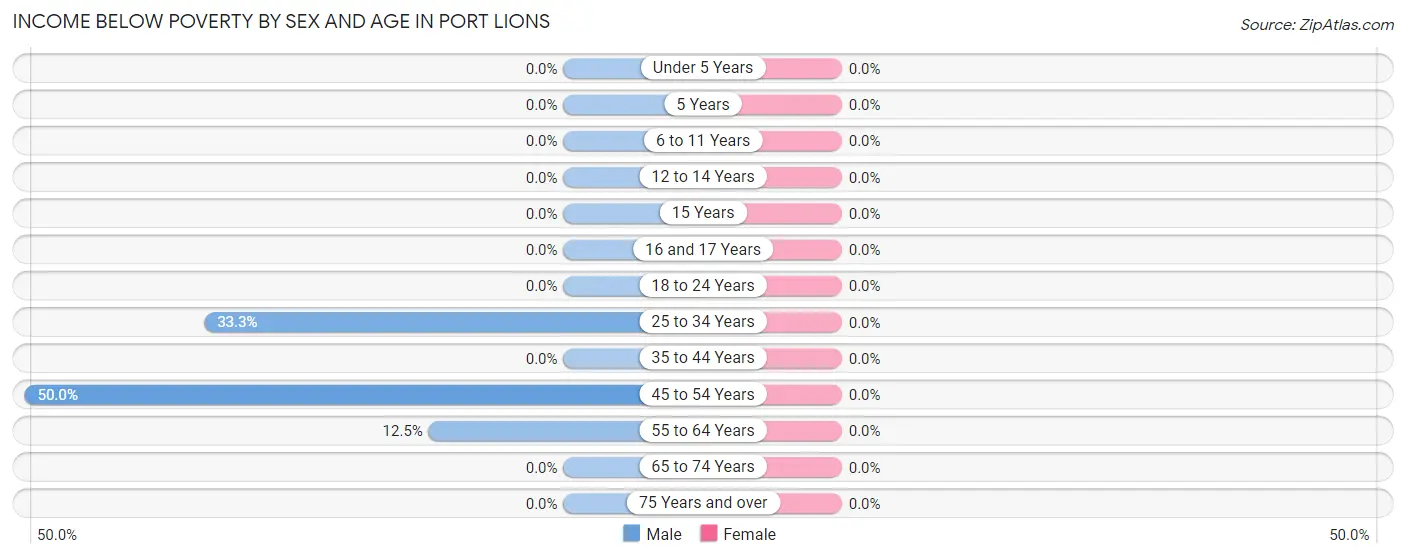
| Age Bracket | Male | Female |
| Under 5 Years | 0 (0.0%) | 0 (0.0%) |
| 5 Years | 0 (0.0%) | 0 (0.0%) |
| 6 to 11 Years | 0 (0.0%) | 0 (0.0%) |
| 12 to 14 Years | 0 (0.0%) | 0 (0.0%) |
| 15 Years | 0 (0.0%) | 0 (0.0%) |
| 16 and 17 Years | 0 (0.0%) | 0 (0.0%) |
| 18 to 24 Years | 0 (0.0%) | 0 (0.0%) |
| 25 to 34 Years | 1 (33.3%) | 0 (0.0%) |
| 35 to 44 Years | 0 (0.0%) | 0 (0.0%) |
| 45 to 54 Years | 2 (50.0%) | 0 (0.0%) |
| 55 to 64 Years | 2 (12.5%) | 0 (0.0%) |
| 65 to 74 Years | 0 (0.0%) | 0 (0.0%) |
| 75 Years and over | 0 (0.0%) | 0 (0.0%) |
| Total | 5 (8.9%) | 0 (0.0%) |
Income Above Poverty by Sex and Age in Port Lions
According to the poverty statistics in Port Lions, males aged under 5 years and females aged under 5 years are the age groups that are most secure financially, with 100.0% of males and 100.0% of females in these age groups living above the poverty line.
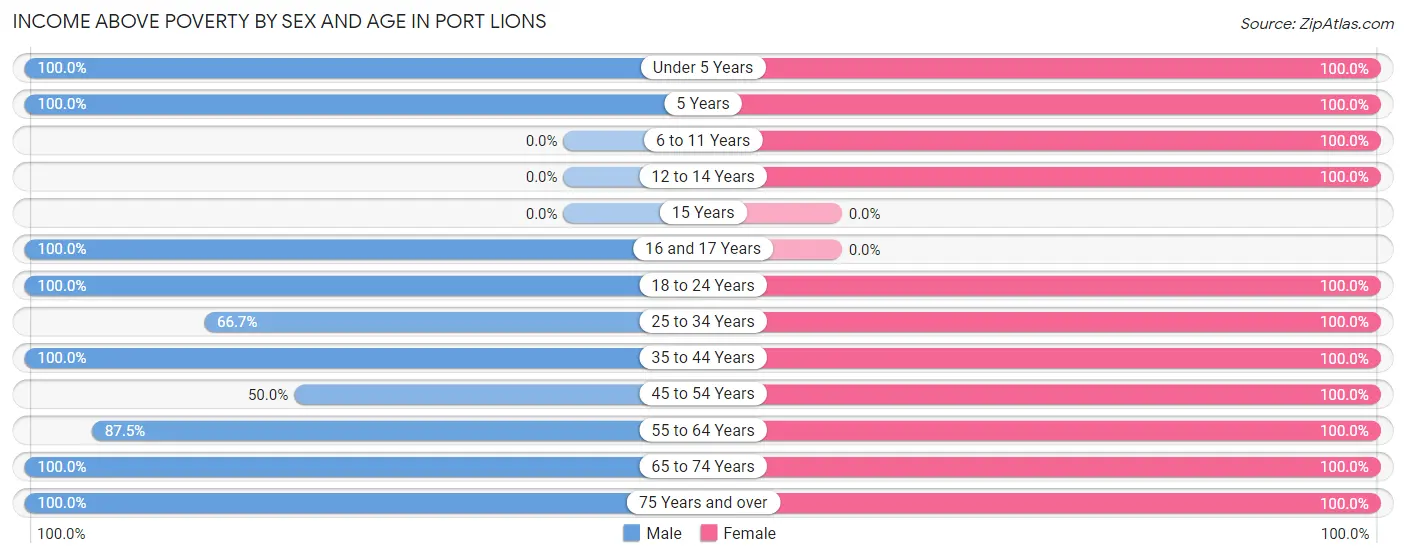
| Age Bracket | Male | Female |
| Under 5 Years | 1 (100.0%) | 1 (100.0%) |
| 5 Years | 1 (100.0%) | 4 (100.0%) |
| 6 to 11 Years | 0 (0.0%) | 1 (100.0%) |
| 12 to 14 Years | 0 (0.0%) | 3 (100.0%) |
| 15 Years | 0 (0.0%) | 0 (0.0%) |
| 16 and 17 Years | 3 (100.0%) | 0 (0.0%) |
| 18 to 24 Years | 3 (100.0%) | 8 (100.0%) |
| 25 to 34 Years | 2 (66.7%) | 10 (100.0%) |
| 35 to 44 Years | 7 (100.0%) | 2 (100.0%) |
| 45 to 54 Years | 2 (50.0%) | 4 (100.0%) |
| 55 to 64 Years | 14 (87.5%) | 16 (100.0%) |
| 65 to 74 Years | 10 (100.0%) | 14 (100.0%) |
| 75 Years and over | 8 (100.0%) | 5 (100.0%) |
| Total | 51 (91.1%) | 68 (100.0%) |
Income Below Poverty Among Married-Couple Families in Port Lions
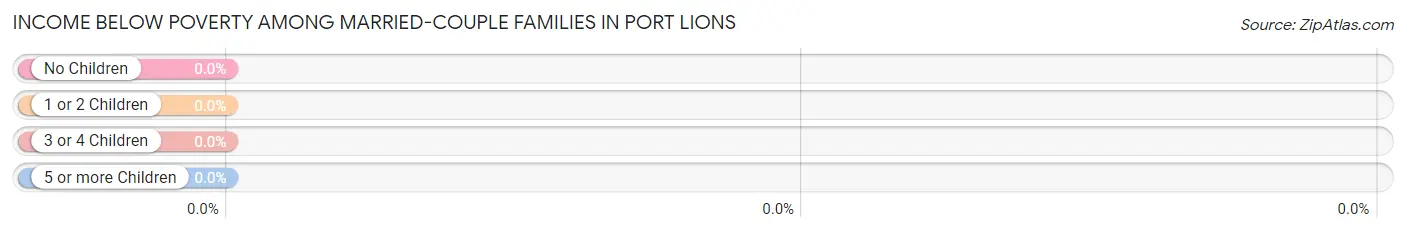
| Children | Above Poverty | Below Poverty |
| No Children | 19 (100.0%) | 0 (0.0%) |
| 1 or 2 Children | 7 (100.0%) | 0 (0.0%) |
| 3 or 4 Children | 0 (0.0%) | 0 (0.0%) |
| 5 or more Children | 0 (0.0%) | 0 (0.0%) |
| Total | 26 (100.0%) | 0 (0.0%) |
Income Below Poverty Among Single-Parent Households in Port Lions
| Children | Single Father | Single Mother |
| No Children | 0 (0.0%) | 0 (0.0%) |
| 1 or 2 Children | 0 (0.0%) | 0 (0.0%) |
| 3 or 4 Children | 0 (0.0%) | 0 (0.0%) |
| 5 or more Children | 0 (0.0%) | 0 (0.0%) |
| Total | 0 (0.0%) | 0 (0.0%) |
Income Below Poverty Among Married-Couple vs Single-Parent Households in Port Lions
| Children | Married-Couple Families | Single-Parent Households |
| No Children | 0 (0.0%) | 0 (0.0%) |
| 1 or 2 Children | 0 (0.0%) | 0 (0.0%) |
| 3 or 4 Children | 0 (0.0%) | 0 (0.0%) |
| 5 or more Children | 0 (0.0%) | 0 (0.0%) |
| Total | 0 (0.0%) | 0 (0.0%) |
Race in Port Lions
The most populous races in Port Lions are Native / Alaskan (54 | 43.5%), White / Caucasian (47 | 37.9%), and Two or more Races (23 | 18.5%).
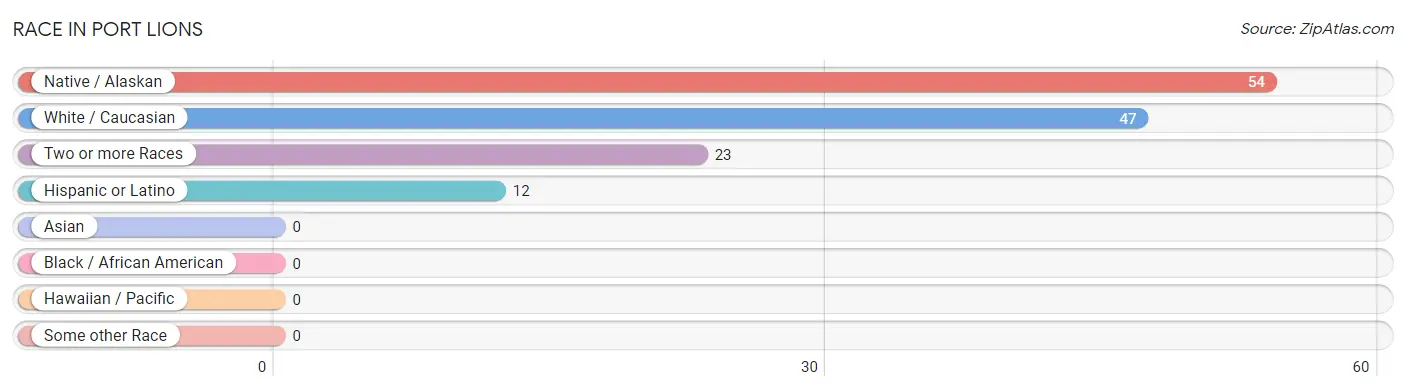
| Race | # Population | % Population |
| Asian | 0 | 0.0% |
| Black / African American | 0 | 0.0% |
| Hawaiian / Pacific | 0 | 0.0% |
| Hispanic or Latino | 12 | 9.7% |
| Native / Alaskan | 54 | 43.5% |
| White / Caucasian | 47 | 37.9% |
| Two or more Races | 23 | 18.5% |
| Some other Race | 0 | 0.0% |
| Total | 124 | 100.0% |
Ancestry in Port Lions
The most populous ancestries reported in Port Lions are Aleut (54 | 43.5%), Russian (19 | 15.3%), Alaska Native (18 | 14.5%), Mexican (12 | 9.7%), and Irish (11 | 8.9%), together accounting for 91.9% of all Port Lions residents.
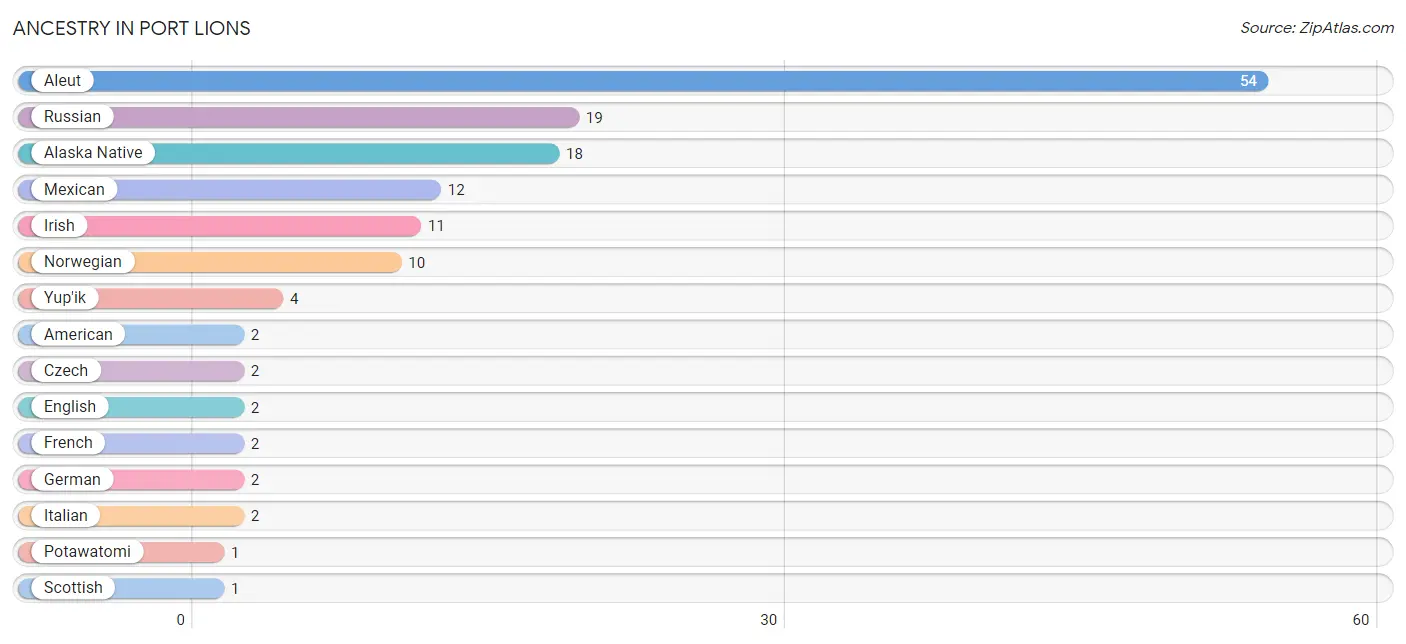
| Ancestry | # Population | % Population |
| Alaska Native | 18 | 14.5% |
| Aleut | 54 | 43.5% |
| American | 2 | 1.6% |
| Czech | 2 | 1.6% |
| English | 2 | 1.6% |
| French | 2 | 1.6% |
| German | 2 | 1.6% |
| Irish | 11 | 8.9% |
| Italian | 2 | 1.6% |
| Mexican | 12 | 9.7% |
| Norwegian | 10 | 8.1% |
| Potawatomi | 1 | 0.8% |
| Russian | 19 | 15.3% |
| Scottish | 1 | 0.8% |
| Swedish | 1 | 0.8% |
| Yup'ik | 4 | 3.2% | View All 16 Rows |
Immigrants in Port Lions

| Immigration Origin | # Population | % Population | View All 0 Rows |
Sex and Age in Port Lions
Sex and Age in Port Lions
The most populous age groups in Port Lions are 60 to 64 Years (12 | 21.4%) for men and 65 to 69 Years (10 | 14.7%) for women.
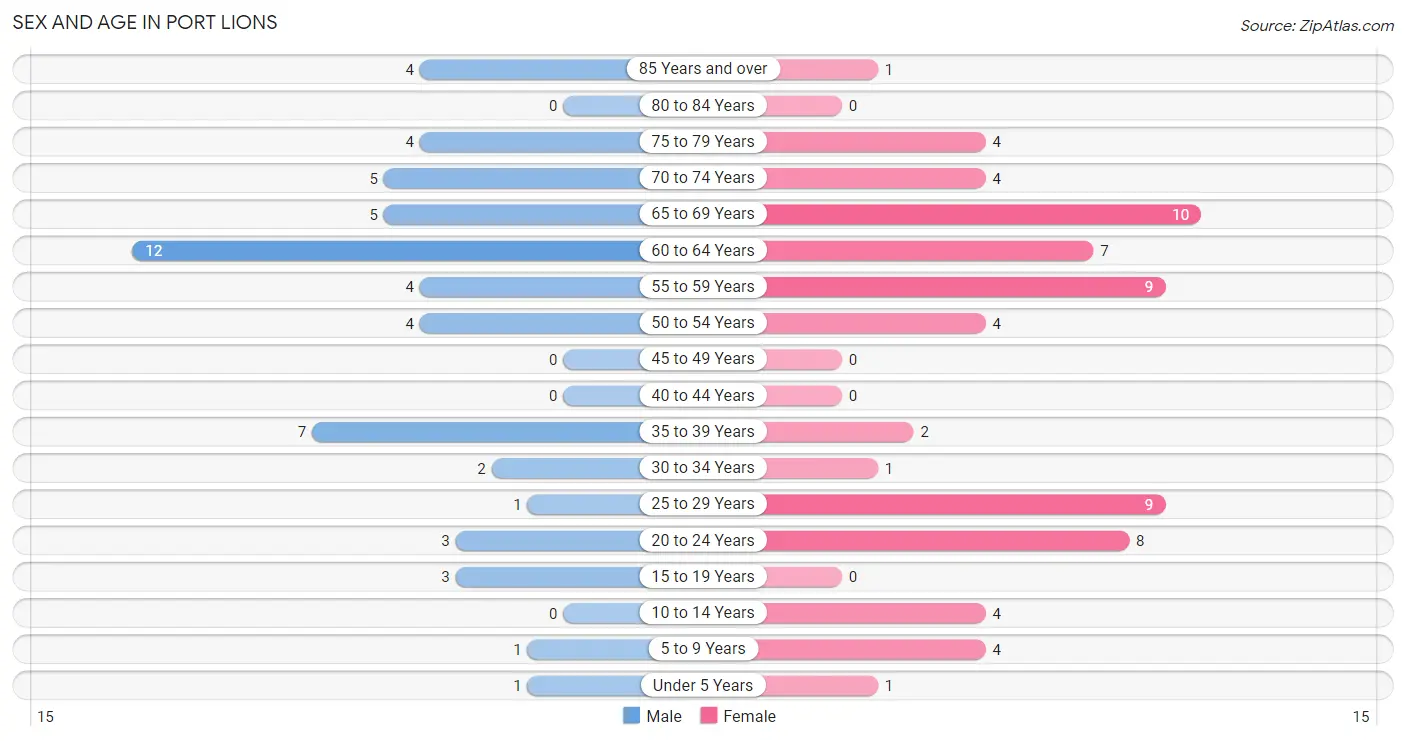
| Age Bracket | Male | Female |
| Under 5 Years | 1 (1.8%) | 1 (1.5%) |
| 5 to 9 Years | 1 (1.8%) | 4 (5.9%) |
| 10 to 14 Years | 0 (0.0%) | 4 (5.9%) |
| 15 to 19 Years | 3 (5.4%) | 0 (0.0%) |
| 20 to 24 Years | 3 (5.4%) | 8 (11.8%) |
| 25 to 29 Years | 1 (1.8%) | 9 (13.2%) |
| 30 to 34 Years | 2 (3.6%) | 1 (1.5%) |
| 35 to 39 Years | 7 (12.5%) | 2 (2.9%) |
| 40 to 44 Years | 0 (0.0%) | 0 (0.0%) |
| 45 to 49 Years | 0 (0.0%) | 0 (0.0%) |
| 50 to 54 Years | 4 (7.1%) | 4 (5.9%) |
| 55 to 59 Years | 4 (7.1%) | 9 (13.2%) |
| 60 to 64 Years | 12 (21.4%) | 7 (10.3%) |
| 65 to 69 Years | 5 (8.9%) | 10 (14.7%) |
| 70 to 74 Years | 5 (8.9%) | 4 (5.9%) |
| 75 to 79 Years | 4 (7.1%) | 4 (5.9%) |
| 80 to 84 Years | 0 (0.0%) | 0 (0.0%) |
| 85 Years and over | 4 (7.1%) | 1 (1.5%) |
| Total | 56 (100.0%) | 68 (100.0%) |
Families and Households in Port Lions
Median Family Size in Port Lions
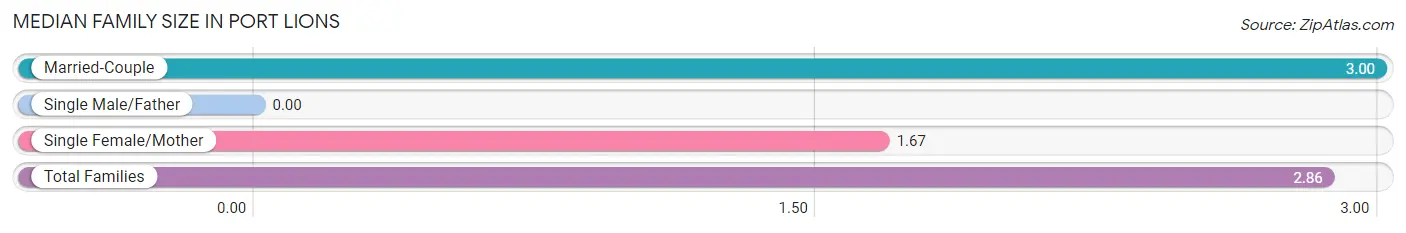
| Family Type | # Families | Family Size |
| Married-Couple | 26 (89.7%) | 3.00 |
| Single Male/Father | 0 (0.0%) | - |
| Single Female/Mother | 3 (10.3%) | 1.67 |
| Total Families | 29 (100.0%) | 2.86 |
Median Household Size in Port Lions
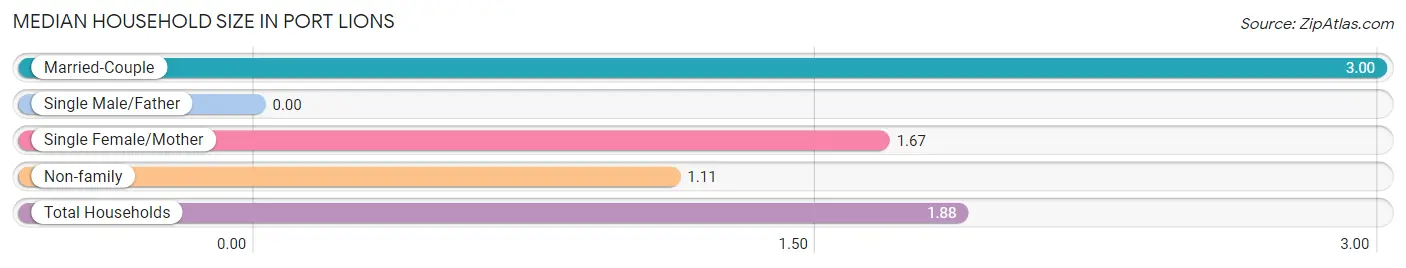
| Household Type | # Households | Household Size |
| Married-Couple | 26 (39.4%) | 3.00 |
| Single Male/Father | 0 (0.0%) | - |
| Single Female/Mother | 3 (4.5%) | 1.67 |
| Non-family | 37 (56.1%) | 1.11 |
| Total Households | 66 (100.0%) | 1.88 |
Household Size by Marriage Status in Port Lions
Out of a total of 66 households in Port Lions, 29 (43.9%) are family households, while 37 (56.1%) are nonfamily households. The most numerous type of family households are 2-person households, comprising 20, and the most common type of nonfamily households are 1-person households, comprising 33.
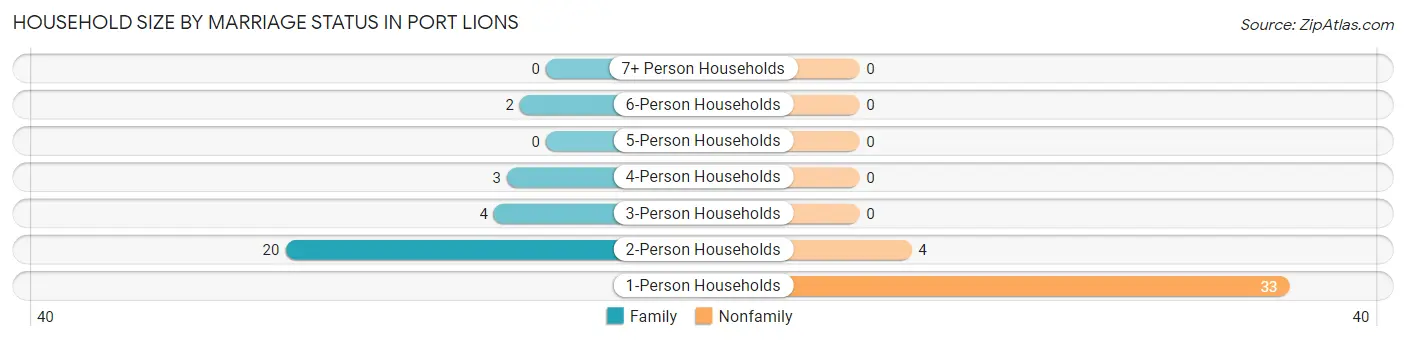
| Household Size | Family Households | Nonfamily Households |
| 1-Person Households | - | 33 (50.0%) |
| 2-Person Households | 20 (30.3%) | 4 (6.1%) |
| 3-Person Households | 4 (6.1%) | 0 (0.0%) |
| 4-Person Households | 3 (4.5%) | 0 (0.0%) |
| 5-Person Households | 0 (0.0%) | 0 (0.0%) |
| 6-Person Households | 2 (3.0%) | 0 (0.0%) |
| 7+ Person Households | 0 (0.0%) | 0 (0.0%) |
| Total | 29 (43.9%) | 37 (56.1%) |
Female Fertility in Port Lions
Fertility by Age in Port Lions
| Age Bracket | Women with Births | Births / 1,000 Women |
| 15 to 19 years | 0 (0.0%) | 0.0 |
| 20 to 34 years | 0 (0.0%) | 0.0 |
| 35 to 50 years | 0 (0.0%) | 0.0 |
| Total | 0 (0.0%) | 0.0 |
Fertility by Age by Marriage Status in Port Lions
| Age Bracket | Married | Unmarried |
| 15 to 19 years | 0 (0.0%) | 0 (0.0%) |
| 20 to 34 years | 0 (0.0%) | 0 (0.0%) |
| 35 to 50 years | 0 (0.0%) | 0 (0.0%) |
| Total | 0 (0.0%) | 0 (0.0%) |
Fertility by Education in Port Lions
| Educational Attainment | Women with Births | Births / 1,000 Women |
| Less than High School | 0 (0.0%) | 0.0 |
| High School Diploma | 0 (0.0%) | 0.0 |
| College or Associate's Degree | 0 (0.0%) | 0.0 |
| Bachelor's Degree | 0 (0.0%) | 0.0 |
| Graduate Degree | 0 (0.0%) | 0.0 |
| Total | 0 (0.0%) | 0.0 |
Fertility by Education by Marriage Status in Port Lions
| Educational Attainment | Married | Unmarried |
| Less than High School | 0 (0.0%) | 0 (0.0%) |
| High School Diploma | 0 (0.0%) | 0 (0.0%) |
| College or Associate's Degree | 0 (0.0%) | 0 (0.0%) |
| Bachelor's Degree | 0 (0.0%) | 0 (0.0%) |
| Graduate Degree | 0 (0.0%) | 0 (0.0%) |
| Total | 0 (0.0%) | 0 (0.0%) |
Employment Characteristics in Port Lions
Employment by Class of Employer in Port Lions
Among the 59 employed individuals in Port Lions, local government employees (30 | 50.8%), self-employed (not incorporated) (13 | 22.0%), and private company employees (7 | 11.9%) make up the most common classes of employment.
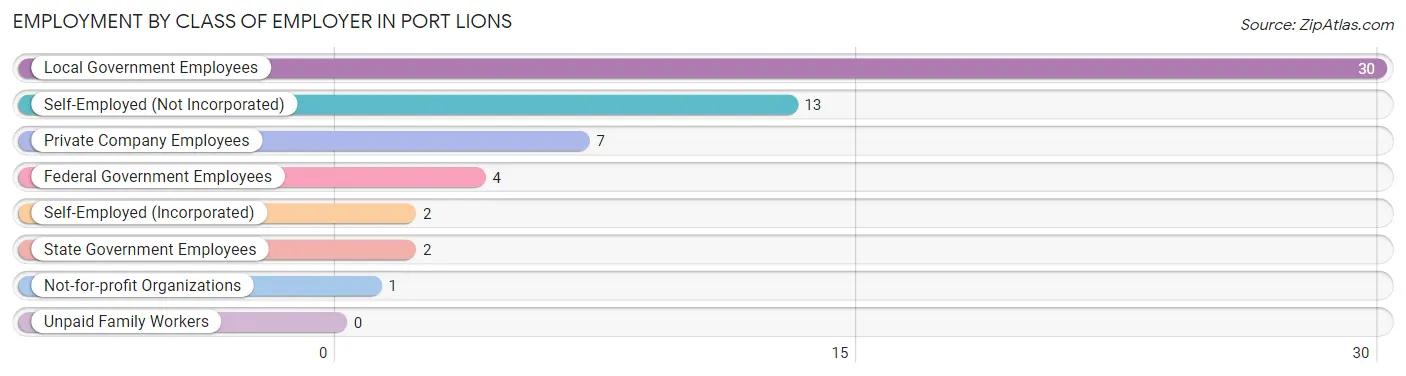
| Employer Class | # Employees | % Employees |
| Private Company Employees | 7 | 11.9% |
| Self-Employed (Incorporated) | 2 | 3.4% |
| Self-Employed (Not Incorporated) | 13 | 22.0% |
| Not-for-profit Organizations | 1 | 1.7% |
| Local Government Employees | 30 | 50.8% |
| State Government Employees | 2 | 3.4% |
| Federal Government Employees | 4 | 6.8% |
| Unpaid Family Workers | 0 | 0.0% |
| Total | 59 | 100.0% |
Employment Status by Age in Port Lions
According to the labor force statistics for Port Lions, out of the total population over 16 years of age (113), 56.6% or 64 individuals are in the labor force, with 7.8% or 5 of them unemployed. The age group with the highest labor force participation rate is 16 to 19 years, with 100.0% or 3 individuals in the labor force. Within the labor force, the 60 to 64 years age range has the highest percentage of unemployed individuals, with 50.0% or 3 of them being unemployed.
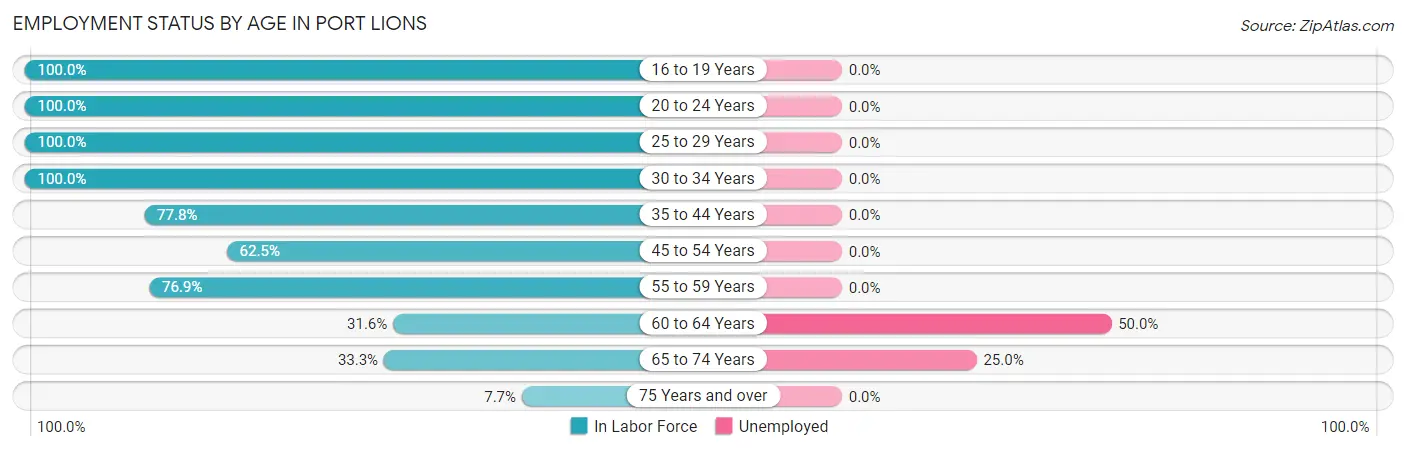
| Age Bracket | In Labor Force | Unemployed |
| 16 to 19 Years | 3 (100.0%) | 0 (0.0%) |
| 20 to 24 Years | 11 (100.0%) | 0 (0.0%) |
| 25 to 29 Years | 10 (100.0%) | 0 (0.0%) |
| 30 to 34 Years | 3 (100.0%) | 0 (0.0%) |
| 35 to 44 Years | 7 (77.8%) | 0 (0.0%) |
| 45 to 54 Years | 5 (62.5%) | 0 (0.0%) |
| 55 to 59 Years | 10 (76.9%) | 0 (0.0%) |
| 60 to 64 Years | 6 (31.6%) | 3 (50.0%) |
| 65 to 74 Years | 8 (33.3%) | 2 (25.0%) |
| 75 Years and over | 1 (7.7%) | 0 (0.0%) |
| Total | 64 (56.6%) | 5 (7.8%) |
Employment Status by Educational Attainment in Port Lions
According to labor force statistics for Port Lions, 66.1% of individuals (41) out of the total population between 25 and 64 years of age (62) are in the labor force, with 7.3% or 3 of them being unemployed. The group with the highest labor force participation rate are those with the educational attainment of high school diploma, with 67.4% or 29 individuals in the labor force. Within the labor force, individuals with high school diploma education have the highest percentage of unemployment, with 10.3% or 3 of them being unemployed.
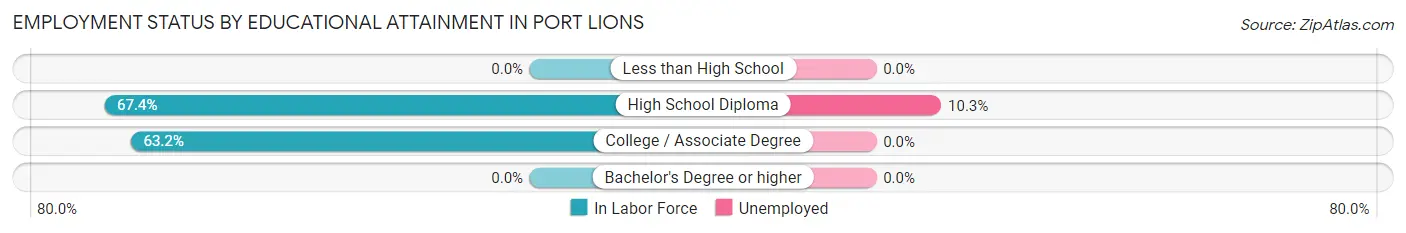
| Educational Attainment | In Labor Force | Unemployed |
| Less than High School | 0 (0.0%) | 0 (0.0%) |
| High School Diploma | 29 (67.4%) | 4 (10.3%) |
| College / Associate Degree | 12 (63.2%) | 0 (0.0%) |
| Bachelor's Degree or higher | 0 (0.0%) | 0 (0.0%) |
| Total | 41 (66.1%) | 5 (7.3%) |
Employment Occupations by Sex in Port Lions
Management, Business, Science and Arts Occupations
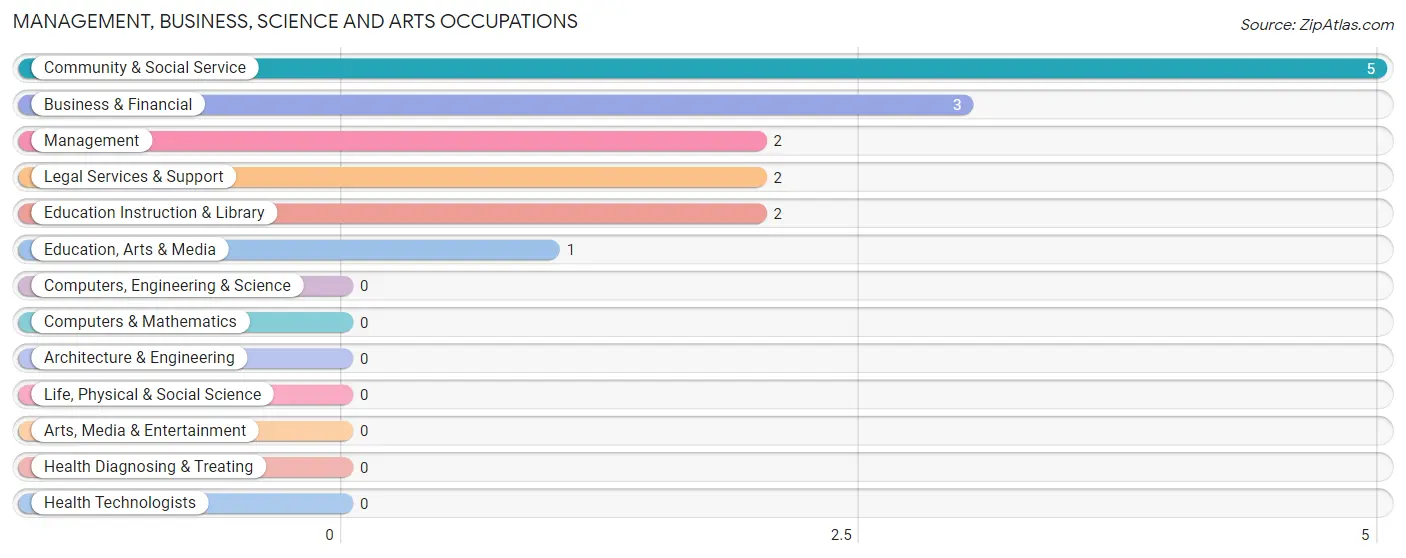
The most common Management, Business, Science and Arts occupations in Port Lions are Community & Social Service (5 | 8.5%), Business & Financial (3 | 5.1%), Management (2 | 3.4%), Legal Services & Support (2 | 3.4%), and Education Instruction & Library (2 | 3.4%).
Management, Business, Science and Arts Occupations by Sex
Within the Management, Business, Science and Arts occupations in Port Lions, the most male-oriented occupations are Business & Financial (100.0%), and Management (50.0%), while the most female-oriented occupations are Community & Social Service (100.0%), Education, Arts & Media (100.0%), and Legal Services & Support (100.0%).
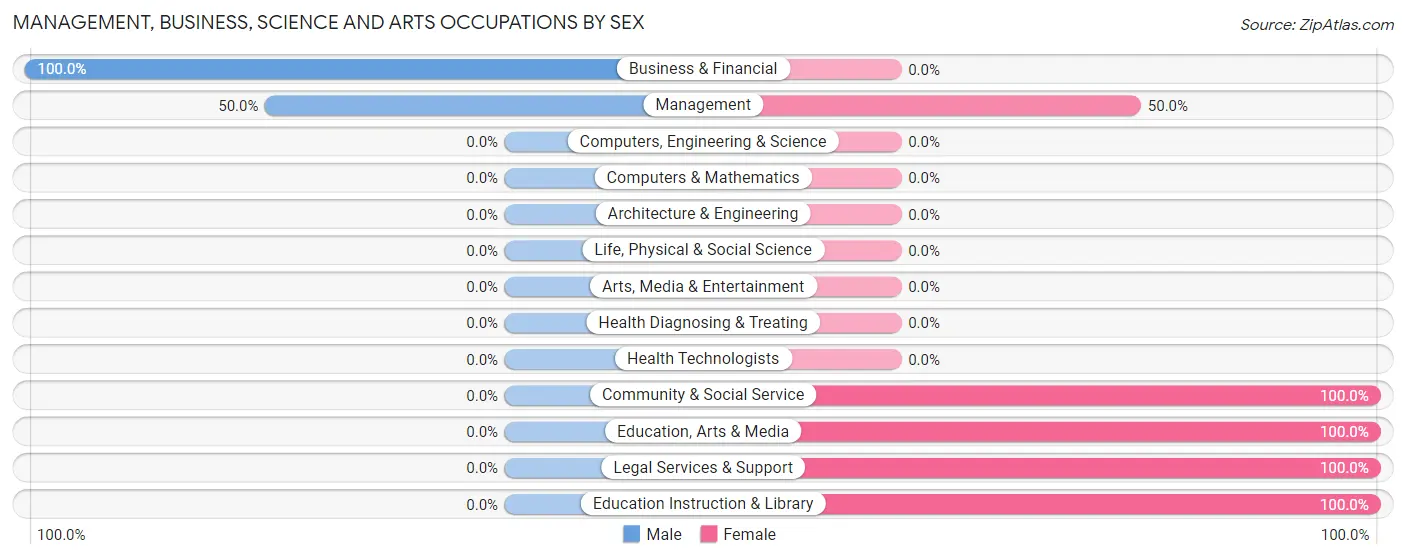
| Occupation | Male | Female |
| Management | 1 (50.0%) | 1 (50.0%) |
| Business & Financial | 3 (100.0%) | 0 (0.0%) |
| Computers, Engineering & Science | 0 (0.0%) | 0 (0.0%) |
| Computers & Mathematics | 0 (0.0%) | 0 (0.0%) |
| Architecture & Engineering | 0 (0.0%) | 0 (0.0%) |
| Life, Physical & Social Science | 0 (0.0%) | 0 (0.0%) |
| Community & Social Service | 0 (0.0%) | 5 (100.0%) |
| Education, Arts & Media | 0 (0.0%) | 1 (100.0%) |
| Legal Services & Support | 0 (0.0%) | 2 (100.0%) |
| Education Instruction & Library | 0 (0.0%) | 2 (100.0%) |
| Arts, Media & Entertainment | 0 (0.0%) | 0 (0.0%) |
| Health Diagnosing & Treating | 0 (0.0%) | 0 (0.0%) |
| Health Technologists | 0 (0.0%) | 0 (0.0%) |
| Total (Category) | 4 (40.0%) | 6 (60.0%) |
| Total (Overall) | 26 (44.1%) | 33 (55.9%) |
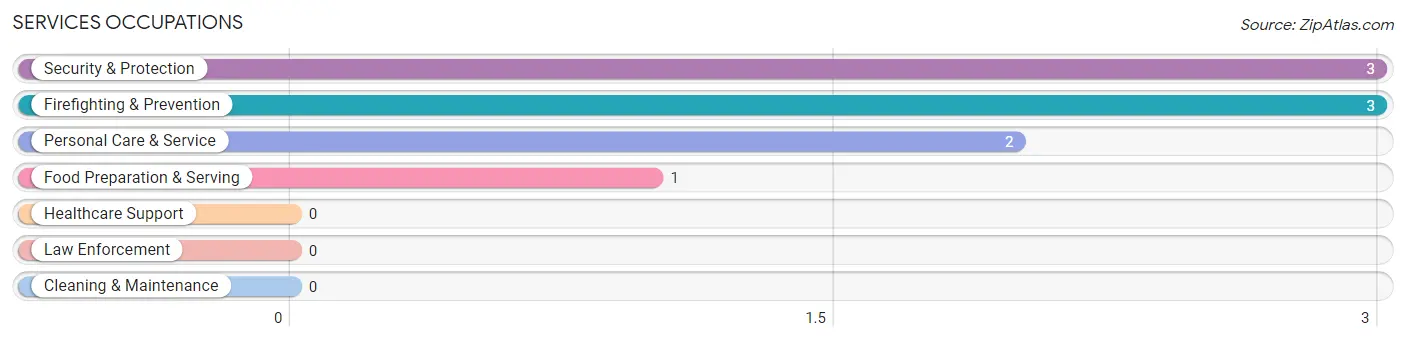
Services Occupations
The most common Services occupations in Port Lions are Security & Protection (3 | 5.1%), Firefighting & Prevention (3 | 5.1%), Personal Care & Service (2 | 3.4%), and Food Preparation & Serving (1 | 1.7%).
Services Occupations by Sex
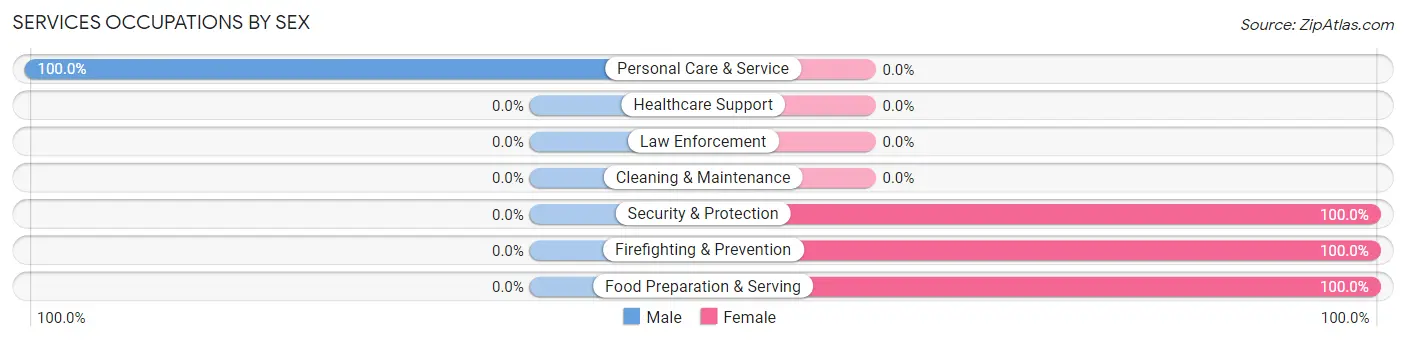
| Occupation | Male | Female |
| Healthcare Support | 0 (0.0%) | 0 (0.0%) |
| Security & Protection | 0 (0.0%) | 3 (100.0%) |
| Firefighting & Prevention | 0 (0.0%) | 3 (100.0%) |
| Law Enforcement | 0 (0.0%) | 0 (0.0%) |
| Food Preparation & Serving | 0 (0.0%) | 1 (100.0%) |
| Cleaning & Maintenance | 0 (0.0%) | 0 (0.0%) |
| Personal Care & Service | 2 (100.0%) | 0 (0.0%) |
| Total (Category) | 2 (33.3%) | 4 (66.7%) |
| Total (Overall) | 26 (44.1%) | 33 (55.9%) |
Sales and Office Occupations
The most common Sales and Office occupations in Port Lions are Office & Administration (16 | 27.1%), and Sales & Related (2 | 3.4%).
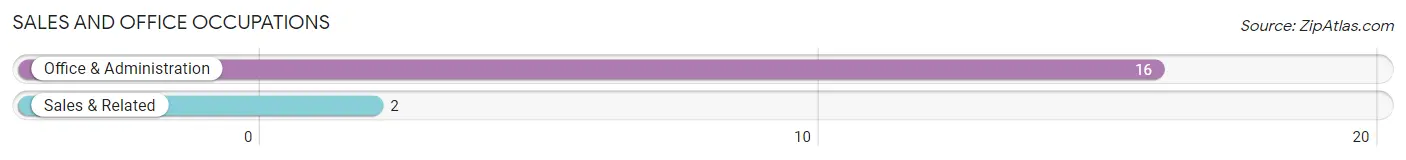
Sales and Office Occupations by Sex
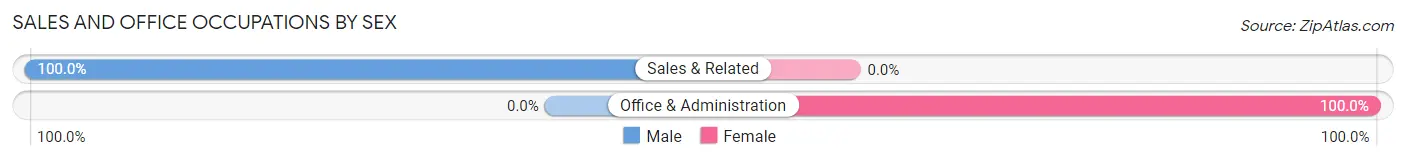
| Occupation | Male | Female |
| Sales & Related | 2 (100.0%) | 0 (0.0%) |
| Office & Administration | 0 (0.0%) | 16 (100.0%) |
| Total (Category) | 2 (11.1%) | 16 (88.9%) |
| Total (Overall) | 26 (44.1%) | 33 (55.9%) |
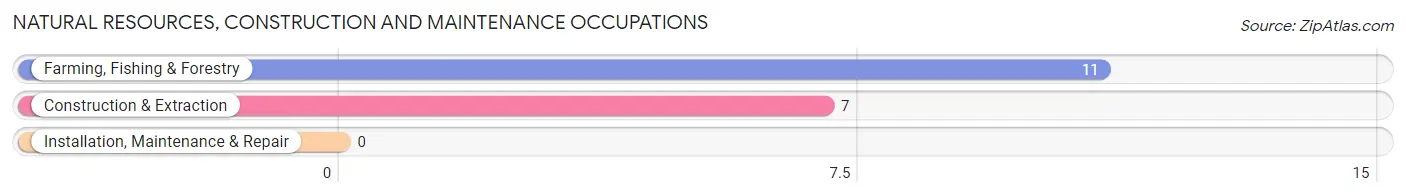
Natural Resources, Construction and Maintenance Occupations
The most common Natural Resources, Construction and Maintenance occupations in Port Lions are Farming, Fishing & Forestry (11 | 18.6%), and Construction & Extraction (7 | 11.9%).
Natural Resources, Construction and Maintenance Occupations by Sex
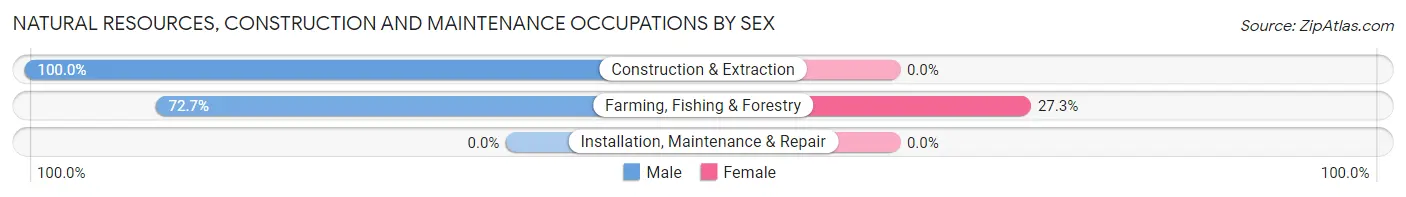
| Occupation | Male | Female |
| Farming, Fishing & Forestry | 8 (72.7%) | 3 (27.3%) |
| Construction & Extraction | 7 (100.0%) | 0 (0.0%) |
| Installation, Maintenance & Repair | 0 (0.0%) | 0 (0.0%) |
| Total (Category) | 15 (83.3%) | 3 (16.7%) |
| Total (Overall) | 26 (44.1%) | 33 (55.9%) |
Production, Transportation and Moving Occupations
The most common Production, Transportation and Moving occupations in Port Lions are Material Moving (4 | 6.8%), Production (2 | 3.4%), and Transportation (1 | 1.7%).
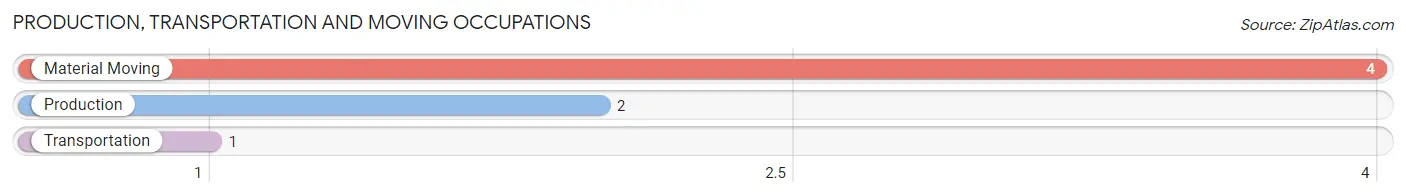
Production, Transportation and Moving Occupations by Sex
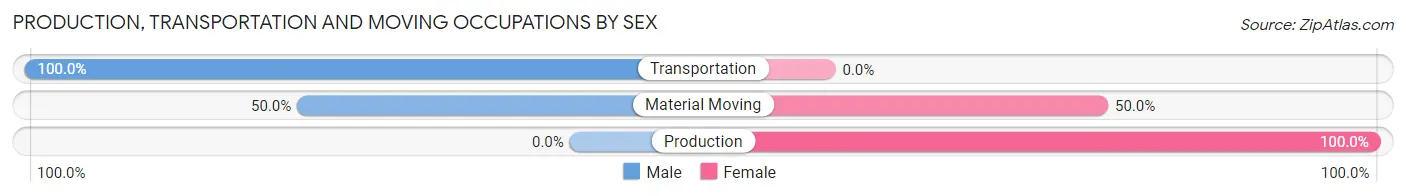
| Occupation | Male | Female |
| Production | 0 (0.0%) | 2 (100.0%) |
| Transportation | 1 (100.0%) | 0 (0.0%) |
| Material Moving | 2 (50.0%) | 2 (50.0%) |
| Total (Category) | 3 (42.9%) | 4 (57.1%) |
| Total (Overall) | 26 (44.1%) | 33 (55.9%) |
Employment Industries by Sex in Port Lions
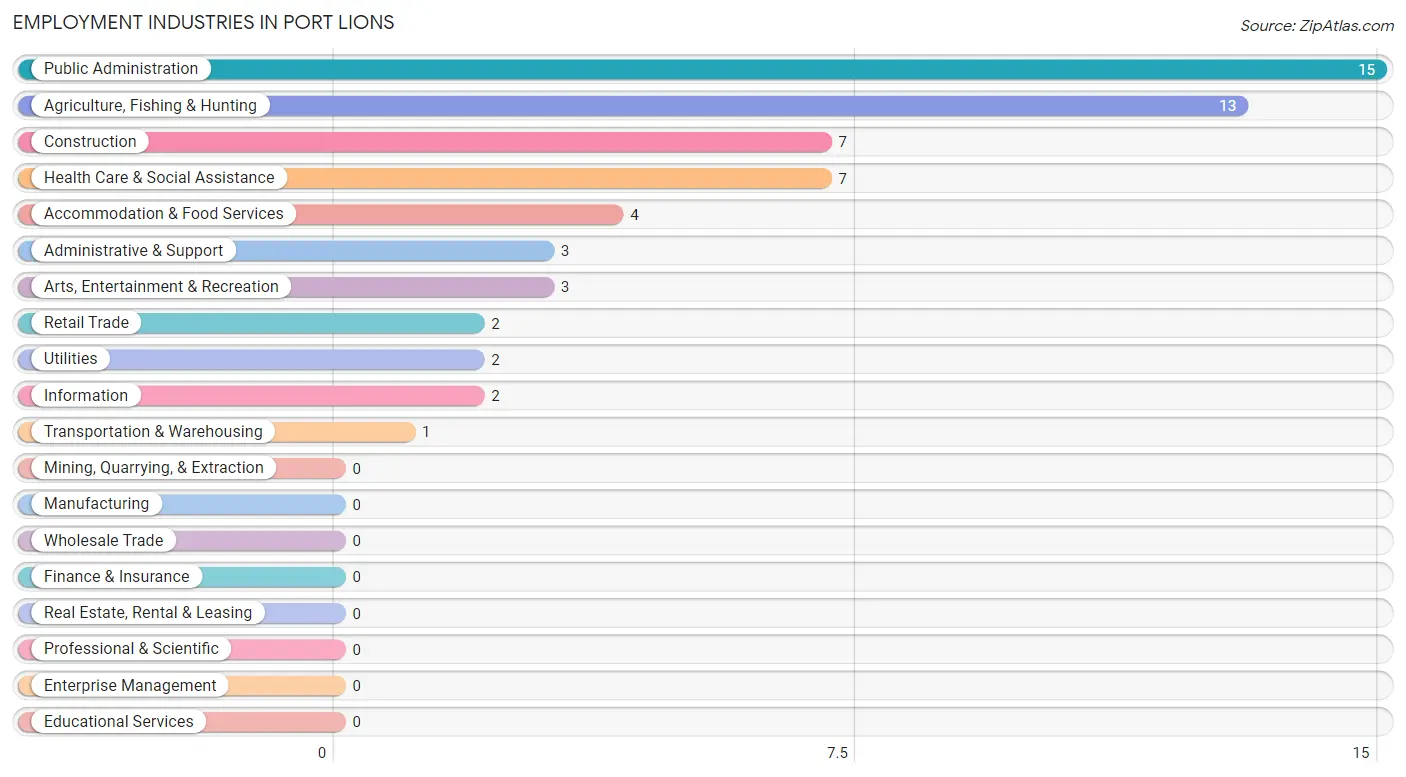
Employment Industries in Port Lions
The major employment industries in Port Lions include Public Administration (15 | 25.4%), Agriculture, Fishing & Hunting (13 | 22.0%), Construction (7 | 11.9%), Health Care & Social Assistance (7 | 11.9%), and Accommodation & Food Services (4 | 6.8%).
Employment Industries by Sex in Port Lions
The Port Lions industries that see more men than women are Construction (100.0%), Retail Trade (100.0%), and Administrative & Support (100.0%), whereas the industries that tend to have a higher number of women are Transportation & Warehousing (100.0%), Utilities (100.0%), and Information (100.0%).
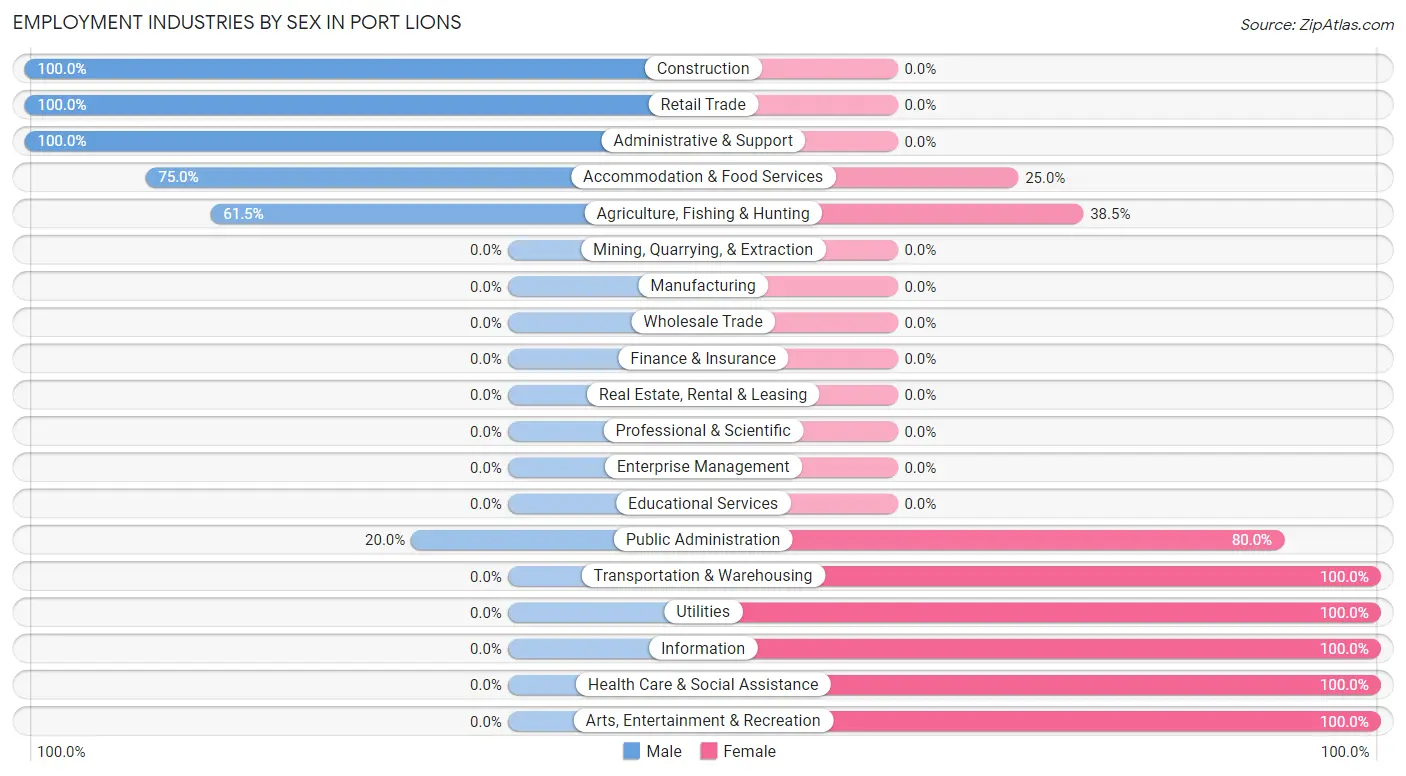
| Industry | Male | Female |
| Agriculture, Fishing & Hunting | 8 (61.5%) | 5 (38.5%) |
| Mining, Quarrying, & Extraction | 0 (0.0%) | 0 (0.0%) |
| Construction | 7 (100.0%) | 0 (0.0%) |
| Manufacturing | 0 (0.0%) | 0 (0.0%) |
| Wholesale Trade | 0 (0.0%) | 0 (0.0%) |
| Retail Trade | 2 (100.0%) | 0 (0.0%) |
| Transportation & Warehousing | 0 (0.0%) | 1 (100.0%) |
| Utilities | 0 (0.0%) | 2 (100.0%) |
| Information | 0 (0.0%) | 2 (100.0%) |
| Finance & Insurance | 0 (0.0%) | 0 (0.0%) |
| Real Estate, Rental & Leasing | 0 (0.0%) | 0 (0.0%) |
| Professional & Scientific | 0 (0.0%) | 0 (0.0%) |
| Enterprise Management | 0 (0.0%) | 0 (0.0%) |
| Administrative & Support | 3 (100.0%) | 0 (0.0%) |
| Educational Services | 0 (0.0%) | 0 (0.0%) |
| Health Care & Social Assistance | 0 (0.0%) | 7 (100.0%) |
| Arts, Entertainment & Recreation | 0 (0.0%) | 3 (100.0%) |
| Accommodation & Food Services | 3 (75.0%) | 1 (25.0%) |
| Public Administration | 3 (20.0%) | 12 (80.0%) |
| Total | 26 (44.1%) | 33 (55.9%) |
Education in Port Lions
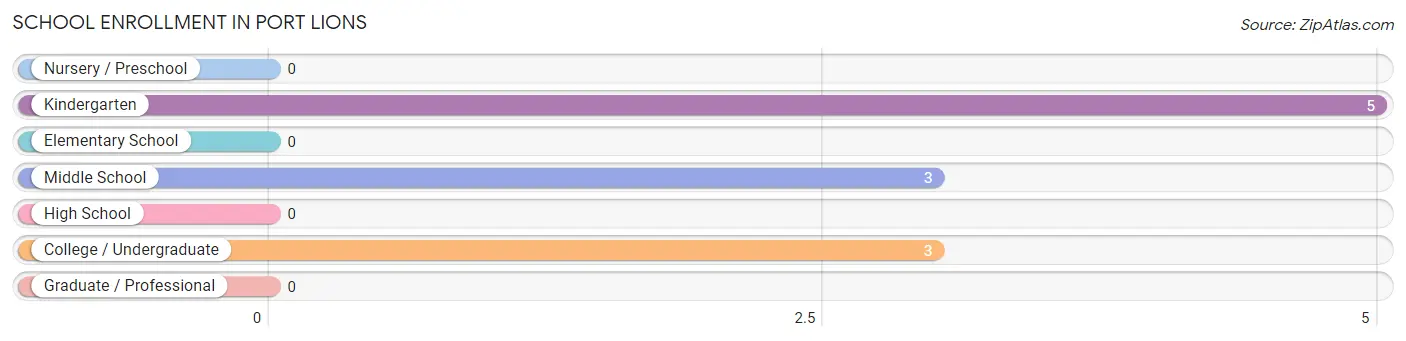
School Enrollment in Port Lions
The most common levels of schooling among the 11 students in Port Lions are kindergarten (5 | 45.5%), middle school (3 | 27.3%), and college / undergraduate (3 | 27.3%).
| School Level | # Students | % Students |
| Nursery / Preschool | 0 | 0.0% |
| Kindergarten | 5 | 45.5% |
| Elementary School | 0 | 0.0% |
| Middle School | 3 | 27.3% |
| High School | 0 | 0.0% |
| College / Undergraduate | 3 | 27.3% |
| Graduate / Professional | 0 | 0.0% |
| Total | 11 | 100.0% |
School Enrollment by Age by Funding Source in Port Lions
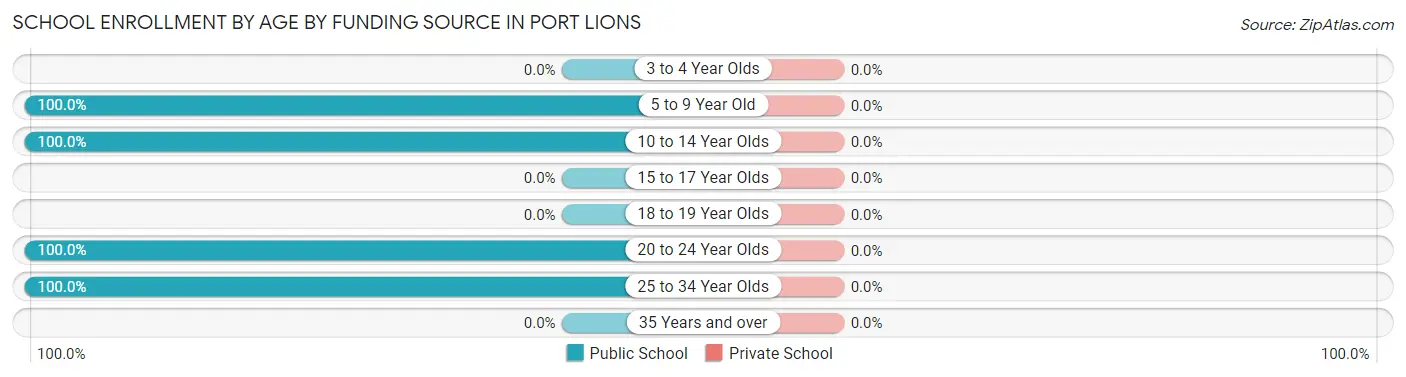
| Age Bracket | Public School | Private School |
| 3 to 4 Year Olds | 0 (0.0%) | 0 (0.0%) |
| 5 to 9 Year Old | 5 (100.0%) | 0 (0.0%) |
| 10 to 14 Year Olds | 3 (100.0%) | 0 (0.0%) |
| 15 to 17 Year Olds | 0 (0.0%) | 0 (0.0%) |
| 18 to 19 Year Olds | 0 (0.0%) | 0 (0.0%) |
| 20 to 24 Year Olds | 2 (100.0%) | 0 (0.0%) |
| 25 to 34 Year Olds | 1 (100.0%) | 0 (0.0%) |
| 35 Years and over | 0 (0.0%) | 0 (0.0%) |
| Total | 11 (100.0%) | 0 (0.0%) |
Educational Attainment by Field of Study in Port Lions
Education (4 | 57.1%), engineering (2 | 28.6%), and business (1 | 14.3%) are the most common fields of study among 7 individuals in Port Lions who have obtained a bachelor's degree or higher.
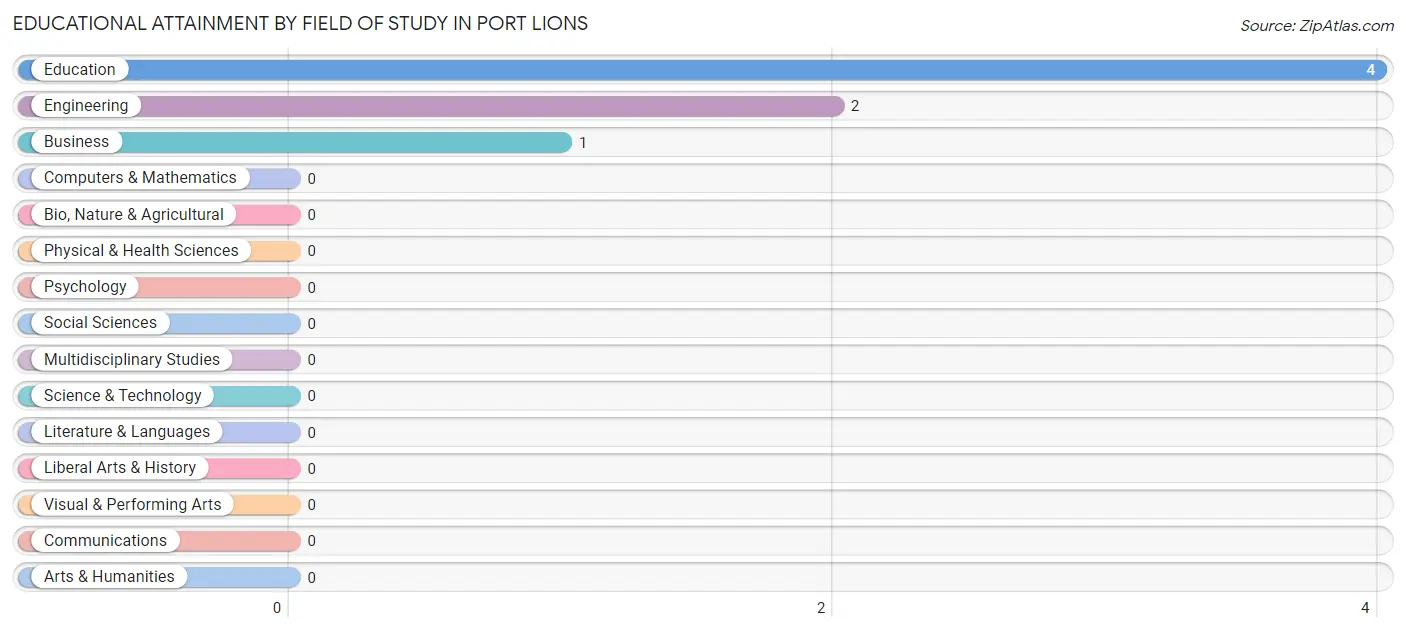
| Field of Study | # Graduates | % Graduates |
| Computers & Mathematics | 0 | 0.0% |
| Bio, Nature & Agricultural | 0 | 0.0% |
| Physical & Health Sciences | 0 | 0.0% |
| Psychology | 0 | 0.0% |
| Social Sciences | 0 | 0.0% |
| Engineering | 2 | 28.6% |
| Multidisciplinary Studies | 0 | 0.0% |
| Science & Technology | 0 | 0.0% |
| Business | 1 | 14.3% |
| Education | 4 | 57.1% |
| Literature & Languages | 0 | 0.0% |
| Liberal Arts & History | 0 | 0.0% |
| Visual & Performing Arts | 0 | 0.0% |
| Communications | 0 | 0.0% |
| Arts & Humanities | 0 | 0.0% |
| Total | 7 | 100.0% |
Transportation & Commute in Port Lions
Vehicle Availability by Sex in Port Lions
The most prevalent vehicle ownership categories in Port Lions are males with 2 vehicles (19, accounting for 73.1%) and females with 2 vehicles (20, making up 57.6%).
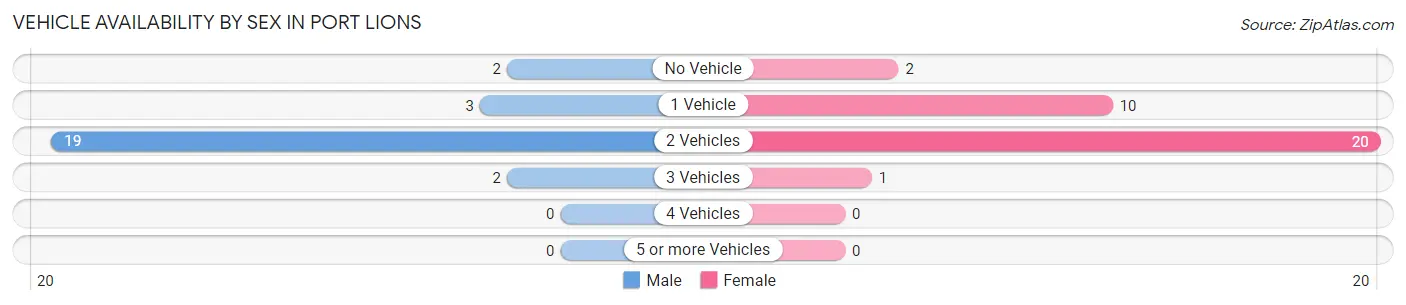
| Vehicles Available | Male | Female |
| No Vehicle | 2 (7.7%) | 2 (6.1%) |
| 1 Vehicle | 3 (11.5%) | 10 (30.3%) |
| 2 Vehicles | 19 (73.1%) | 20 (60.6%) |
| 3 Vehicles | 2 (7.7%) | 1 (3.0%) |
| 4 Vehicles | 0 (0.0%) | 0 (0.0%) |
| 5 or more Vehicles | 0 (0.0%) | 0 (0.0%) |
| Total | 26 (100.0%) | 33 (100.0%) |
Commute Time in Port Lions
The most frequently occuring commute durations in Port Lions are less than 5 minutes (23 commuters, 40.4%), 5 to 9 minutes (22 commuters, 38.6%), and 10 to 14 minutes (7 commuters, 12.3%).
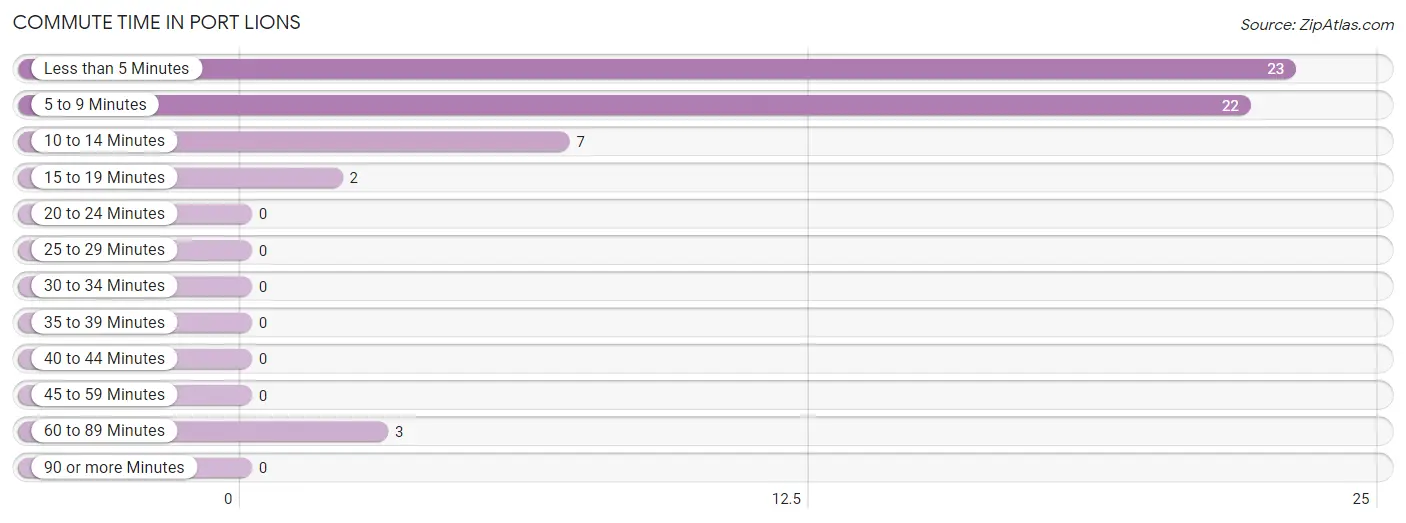
| Commute Time | # Commuters | % Commuters |
| Less than 5 Minutes | 23 | 40.4% |
| 5 to 9 Minutes | 22 | 38.6% |
| 10 to 14 Minutes | 7 | 12.3% |
| 15 to 19 Minutes | 2 | 3.5% |
| 20 to 24 Minutes | 0 | 0.0% |
| 25 to 29 Minutes | 0 | 0.0% |
| 30 to 34 Minutes | 0 | 0.0% |
| 35 to 39 Minutes | 0 | 0.0% |
| 40 to 44 Minutes | 0 | 0.0% |
| 45 to 59 Minutes | 0 | 0.0% |
| 60 to 89 Minutes | 3 | 5.3% |
| 90 or more Minutes | 0 | 0.0% |
Commute Time by Sex in Port Lions
The most common commute times in Port Lions are 5 to 9 minutes (12 commuters, 48.0%) for males and less than 5 minutes (20 commuters, 62.5%) for females.
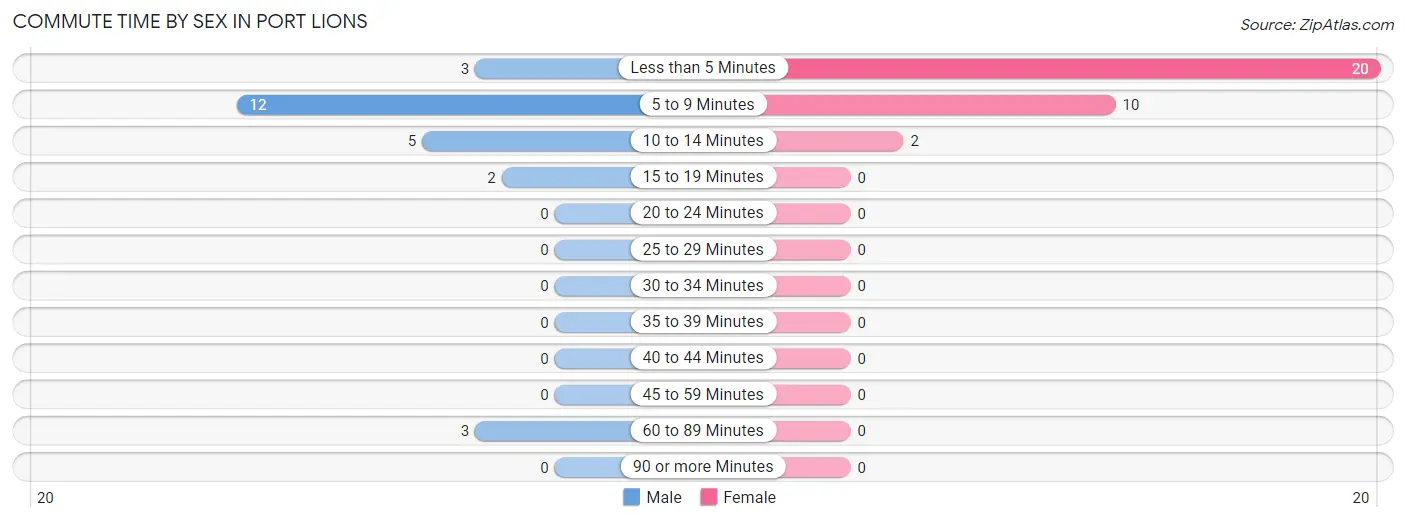
| Commute Time | Male | Female |
| Less than 5 Minutes | 3 (12.0%) | 20 (62.5%) |
| 5 to 9 Minutes | 12 (48.0%) | 10 (31.2%) |
| 10 to 14 Minutes | 5 (20.0%) | 2 (6.2%) |
| 15 to 19 Minutes | 2 (8.0%) | 0 (0.0%) |
| 20 to 24 Minutes | 0 (0.0%) | 0 (0.0%) |
| 25 to 29 Minutes | 0 (0.0%) | 0 (0.0%) |
| 30 to 34 Minutes | 0 (0.0%) | 0 (0.0%) |
| 35 to 39 Minutes | 0 (0.0%) | 0 (0.0%) |
| 40 to 44 Minutes | 0 (0.0%) | 0 (0.0%) |
| 45 to 59 Minutes | 0 (0.0%) | 0 (0.0%) |
| 60 to 89 Minutes | 3 (12.0%) | 0 (0.0%) |
| 90 or more Minutes | 0 (0.0%) | 0 (0.0%) |
Time of Departure to Work by Sex in Port Lions
The most frequent times of departure to work in Port Lions are 7:30 AM to 7:59 AM (12, 48.0%) for males and 8:00 AM to 8:29 AM (11, 34.4%) for females.
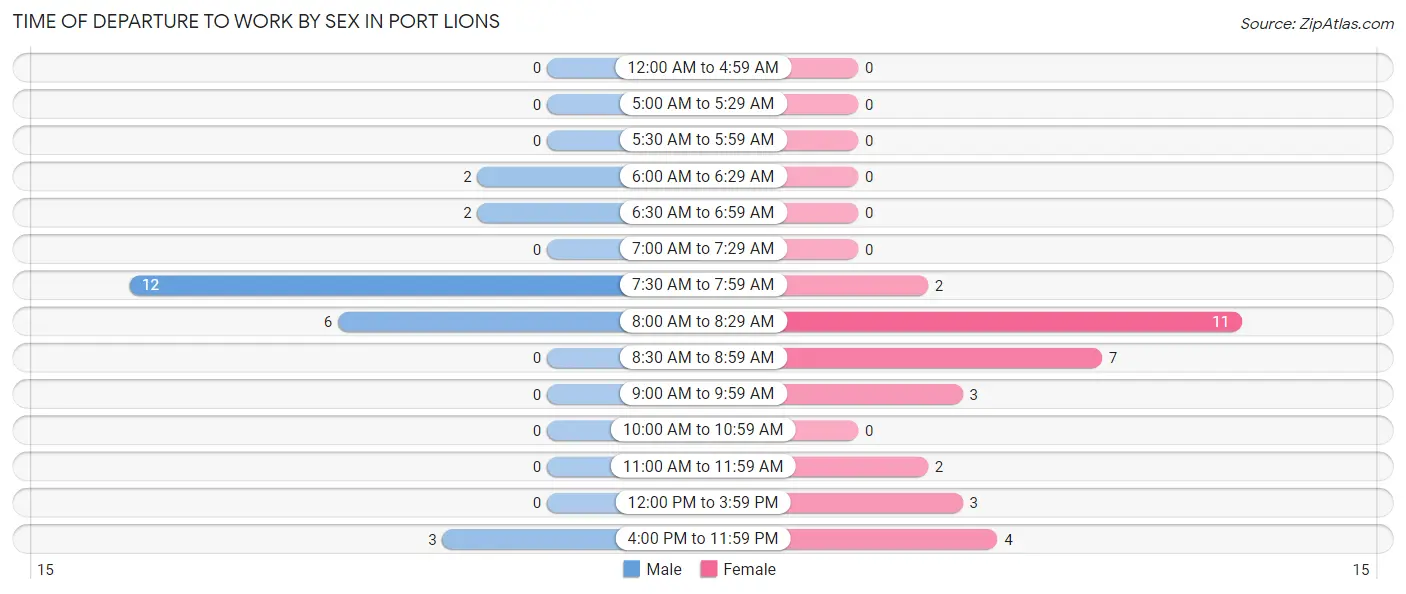
| Time of Departure | Male | Female |
| 12:00 AM to 4:59 AM | 0 (0.0%) | 0 (0.0%) |
| 5:00 AM to 5:29 AM | 0 (0.0%) | 0 (0.0%) |
| 5:30 AM to 5:59 AM | 0 (0.0%) | 0 (0.0%) |
| 6:00 AM to 6:29 AM | 2 (8.0%) | 0 (0.0%) |
| 6:30 AM to 6:59 AM | 2 (8.0%) | 0 (0.0%) |
| 7:00 AM to 7:29 AM | 0 (0.0%) | 0 (0.0%) |
| 7:30 AM to 7:59 AM | 12 (48.0%) | 2 (6.2%) |
| 8:00 AM to 8:29 AM | 6 (24.0%) | 11 (34.4%) |
| 8:30 AM to 8:59 AM | 0 (0.0%) | 7 (21.9%) |
| 9:00 AM to 9:59 AM | 0 (0.0%) | 3 (9.4%) |
| 10:00 AM to 10:59 AM | 0 (0.0%) | 0 (0.0%) |
| 11:00 AM to 11:59 AM | 0 (0.0%) | 2 (6.2%) |
| 12:00 PM to 3:59 PM | 0 (0.0%) | 3 (9.4%) |
| 4:00 PM to 11:59 PM | 3 (12.0%) | 4 (12.5%) |
| Total | 25 (100.0%) | 32 (100.0%) |
Housing Occupancy in Port Lions
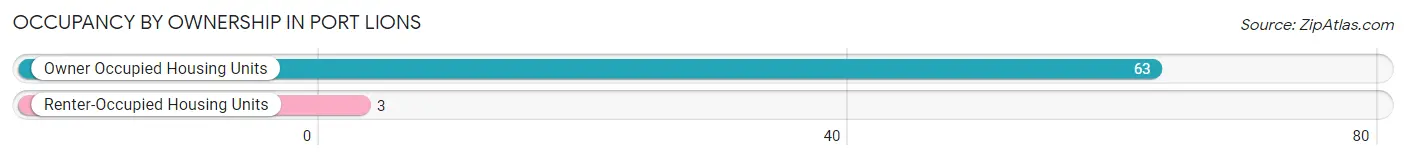
Occupancy by Ownership in Port Lions
Of the total 66 dwellings in Port Lions, owner-occupied units account for 63 (95.5%), while renter-occupied units make up 3 (4.5%).
| Occupancy | # Housing Units | % Housing Units |
| Owner Occupied Housing Units | 63 | 95.5% |
| Renter-Occupied Housing Units | 3 | 4.5% |
| Total Occupied Housing Units | 66 | 100.0% |
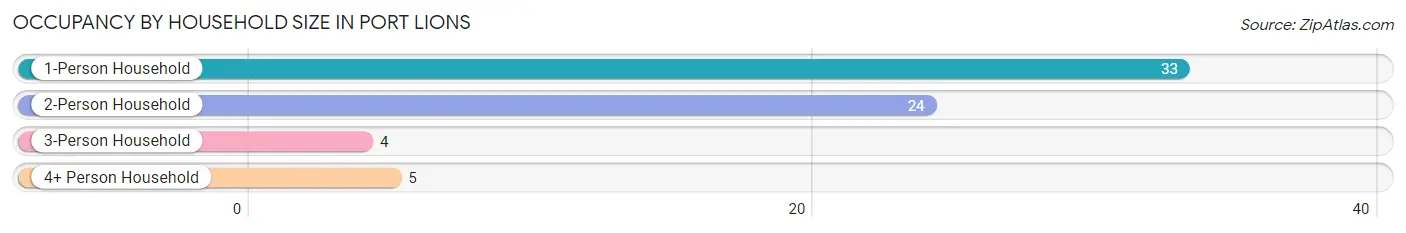
Occupancy by Household Size in Port Lions
| Household Size | # Housing Units | % Housing Units |
| 1-Person Household | 33 | 50.0% |
| 2-Person Household | 24 | 36.4% |
| 3-Person Household | 4 | 6.1% |
| 4+ Person Household | 5 | 7.6% |
| Total Housing Units | 66 | 100.0% |
Occupancy by Ownership by Household Size in Port Lions
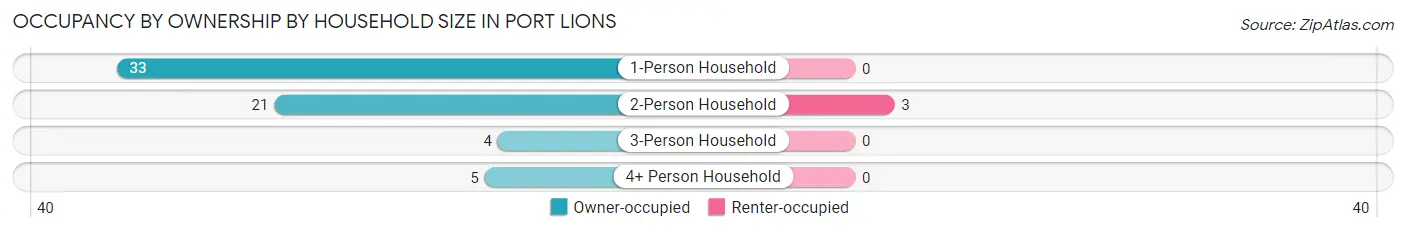
| Household Size | Owner-occupied | Renter-occupied |
| 1-Person Household | 33 (100.0%) | 0 (0.0%) |
| 2-Person Household | 21 (87.5%) | 3 (12.5%) |
| 3-Person Household | 4 (100.0%) | 0 (0.0%) |
| 4+ Person Household | 5 (100.0%) | 0 (0.0%) |
| Total Housing Units | 63 (95.5%) | 3 (4.5%) |
Occupancy by Educational Attainment in Port Lions
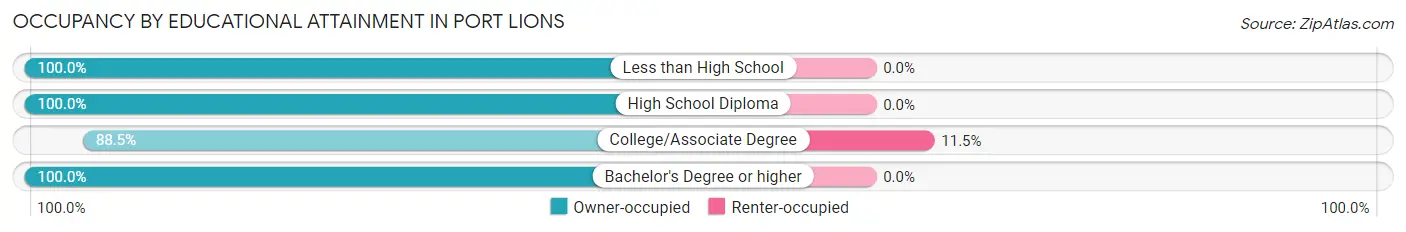
| Household Size | Owner-occupied | Renter-occupied |
| Less than High School | 6 (100.0%) | 0 (0.0%) |
| High School Diploma | 28 (100.0%) | 0 (0.0%) |
| College/Associate Degree | 23 (88.5%) | 3 (11.5%) |
| Bachelor's Degree or higher | 6 (100.0%) | 0 (0.0%) |
Occupancy by Age of Householder in Port Lions
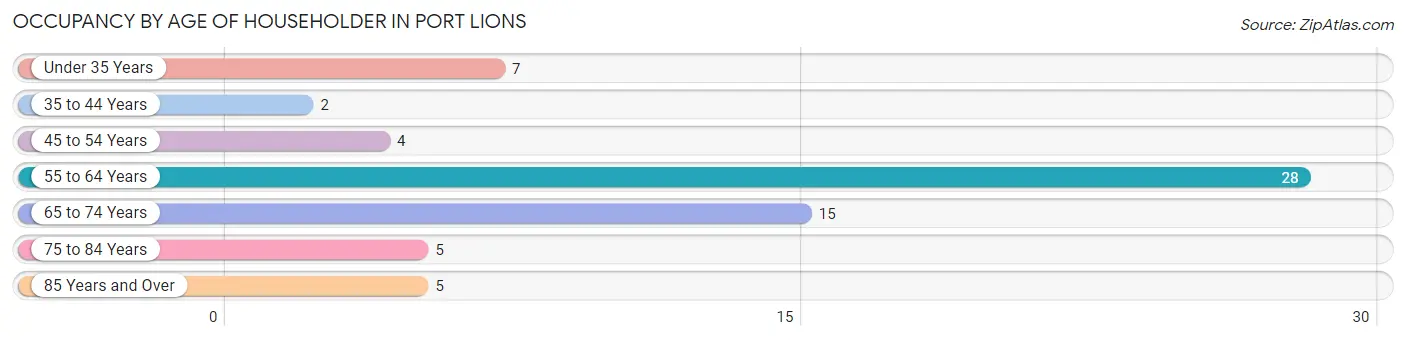
| Age Bracket | # Households | % Households |
| Under 35 Years | 7 | 10.6% |
| 35 to 44 Years | 2 | 3.0% |
| 45 to 54 Years | 4 | 6.1% |
| 55 to 64 Years | 28 | 42.4% |
| 65 to 74 Years | 15 | 22.7% |
| 75 to 84 Years | 5 | 7.6% |
| 85 Years and Over | 5 | 7.6% |
| Total | 66 | 100.0% |
Housing Finances in Port Lions
Median Income by Occupancy in Port Lions
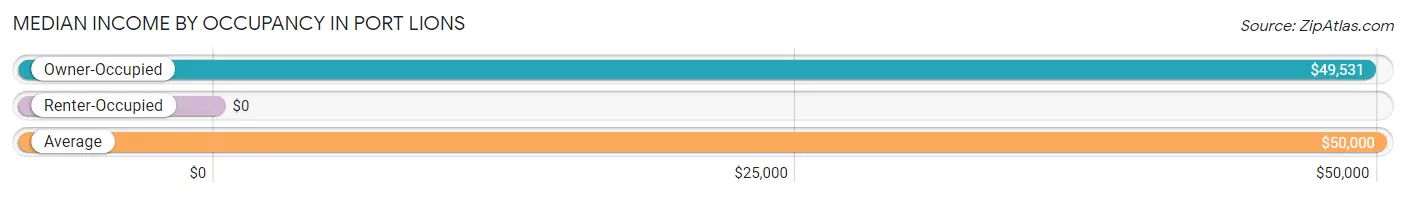
| Occupancy Type | # Households | Median Income |
| Owner-Occupied | 63 (95.5%) | $49,531 |
| Renter-Occupied | 3 (4.5%) | $0 |
| Average | 66 (100.0%) | $50,000 |
Occupancy by Householder Income Bracket in Port Lions
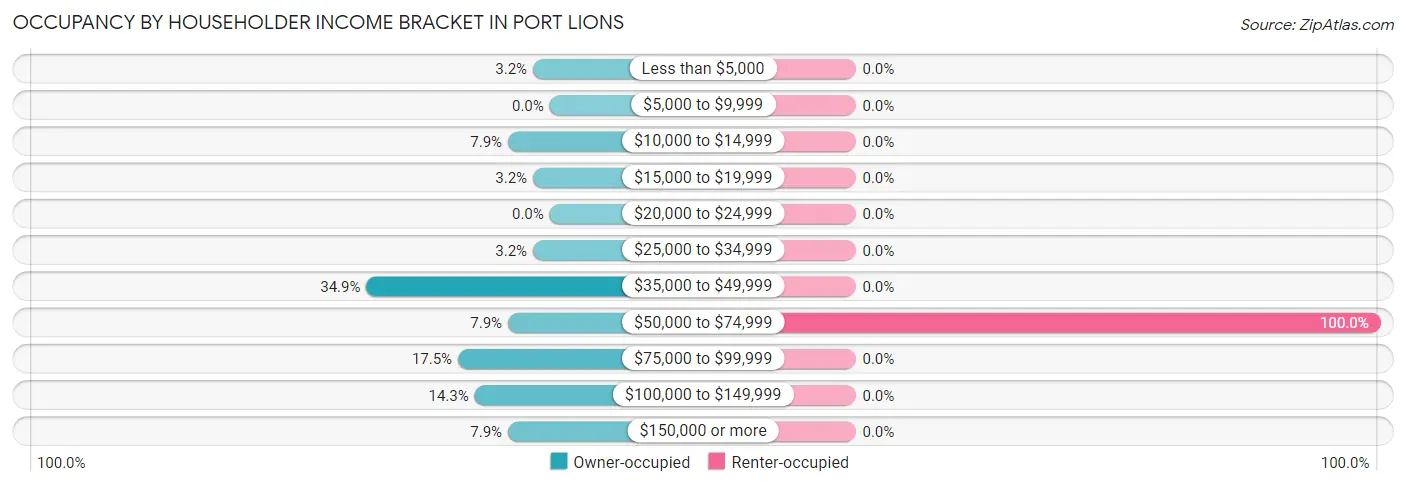
| Income Bracket | Owner-occupied | Renter-occupied |
| Less than $5,000 | 2 (3.2%) | 0 (0.0%) |
| $5,000 to $9,999 | 0 (0.0%) | 0 (0.0%) |
| $10,000 to $14,999 | 5 (7.9%) | 0 (0.0%) |
| $15,000 to $19,999 | 2 (3.2%) | 0 (0.0%) |
| $20,000 to $24,999 | 0 (0.0%) | 0 (0.0%) |
| $25,000 to $34,999 | 2 (3.2%) | 0 (0.0%) |
| $35,000 to $49,999 | 22 (34.9%) | 0 (0.0%) |
| $50,000 to $74,999 | 5 (7.9%) | 3 (100.0%) |
| $75,000 to $99,999 | 11 (17.5%) | 0 (0.0%) |
| $100,000 to $149,999 | 9 (14.3%) | 0 (0.0%) |
| $150,000 or more | 5 (7.9%) | 0 (0.0%) |
| Total | 63 (100.0%) | 3 (100.0%) |
Monthly Housing Cost Tiers in Port Lions
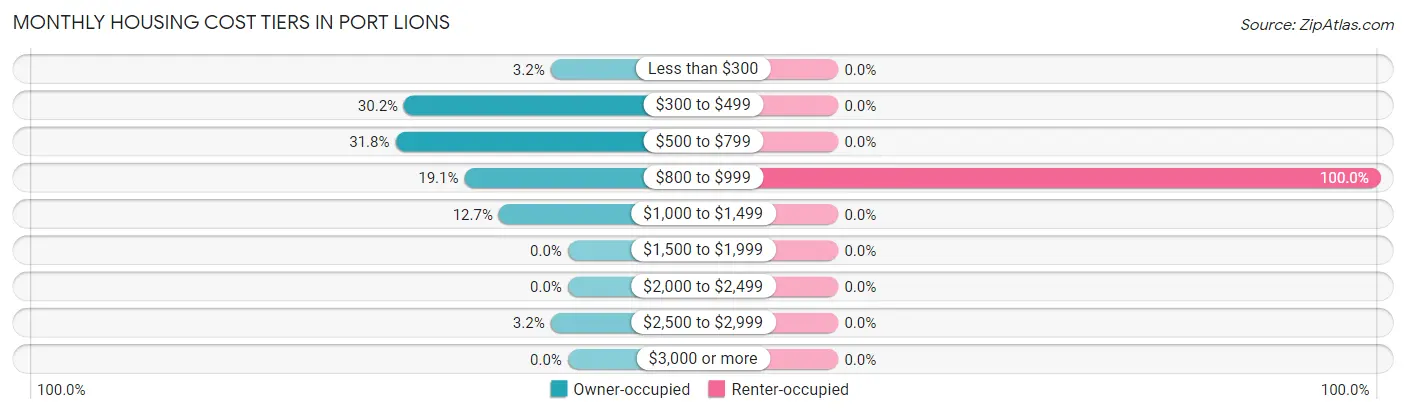
| Monthly Cost | Owner-occupied | Renter-occupied |
| Less than $300 | 2 (3.2%) | 0 (0.0%) |
| $300 to $499 | 19 (30.2%) | 0 (0.0%) |
| $500 to $799 | 20 (31.8%) | 0 (0.0%) |
| $800 to $999 | 12 (19.1%) | 3 (100.0%) |
| $1,000 to $1,499 | 8 (12.7%) | 0 (0.0%) |
| $1,500 to $1,999 | 0 (0.0%) | 0 (0.0%) |
| $2,000 to $2,499 | 0 (0.0%) | 0 (0.0%) |
| $2,500 to $2,999 | 2 (3.2%) | 0 (0.0%) |
| $3,000 or more | 0 (0.0%) | 0 (0.0%) |
| Total | 63 (100.0%) | 3 (100.0%) |
Physical Housing Characteristics in Port Lions
Housing Structures in Port Lions
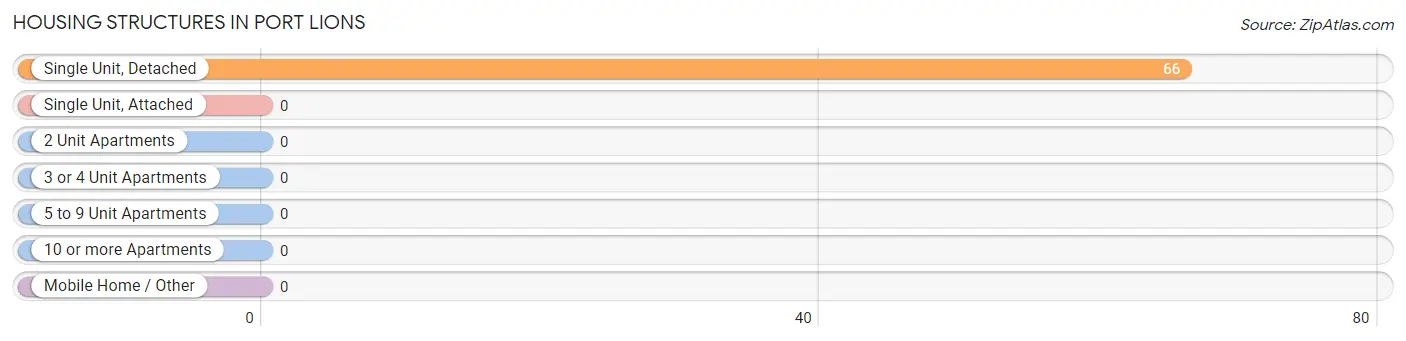
| Structure Type | # Housing Units | % Housing Units |
| Single Unit, Detached | 66 | 100.0% |
| Single Unit, Attached | 0 | 0.0% |
| 2 Unit Apartments | 0 | 0.0% |
| 3 or 4 Unit Apartments | 0 | 0.0% |
| 5 to 9 Unit Apartments | 0 | 0.0% |
| 10 or more Apartments | 0 | 0.0% |
| Mobile Home / Other | 0 | 0.0% |
| Total | 66 | 100.0% |
Housing Structures by Occupancy in Port Lions
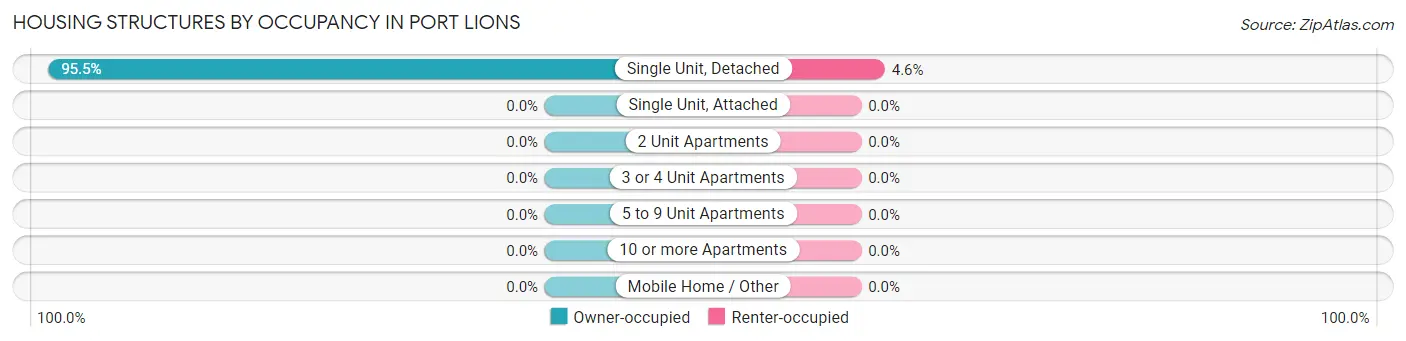
| Structure Type | Owner-occupied | Renter-occupied |
| Single Unit, Detached | 63 (95.5%) | 3 (4.5%) |
| Single Unit, Attached | 0 (0.0%) | 0 (0.0%) |
| 2 Unit Apartments | 0 (0.0%) | 0 (0.0%) |
| 3 or 4 Unit Apartments | 0 (0.0%) | 0 (0.0%) |
| 5 to 9 Unit Apartments | 0 (0.0%) | 0 (0.0%) |
| 10 or more Apartments | 0 (0.0%) | 0 (0.0%) |
| Mobile Home / Other | 0 (0.0%) | 0 (0.0%) |
| Total | 63 (95.5%) | 3 (4.5%) |
Housing Structures by Number of Rooms in Port Lions
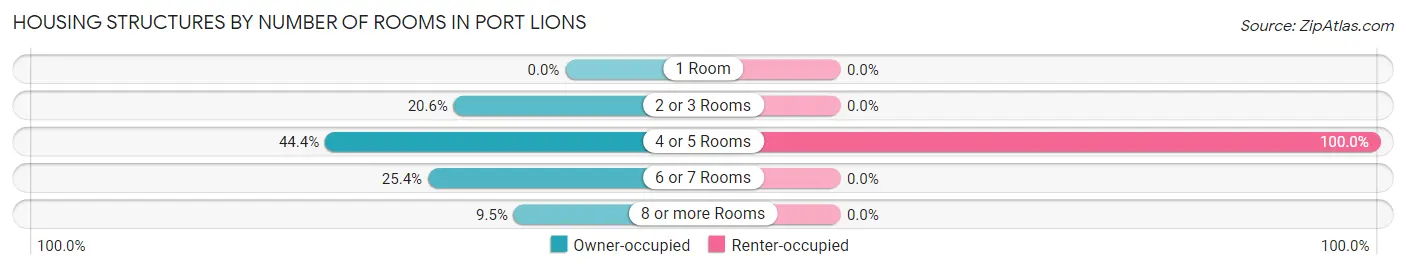
| Number of Rooms | Owner-occupied | Renter-occupied |
| 1 Room | 0 (0.0%) | 0 (0.0%) |
| 2 or 3 Rooms | 13 (20.6%) | 0 (0.0%) |
| 4 or 5 Rooms | 28 (44.4%) | 3 (100.0%) |
| 6 or 7 Rooms | 16 (25.4%) | 0 (0.0%) |
| 8 or more Rooms | 6 (9.5%) | 0 (0.0%) |
| Total | 63 (100.0%) | 3 (100.0%) |
Housing Structure by Heating Type in Port Lions
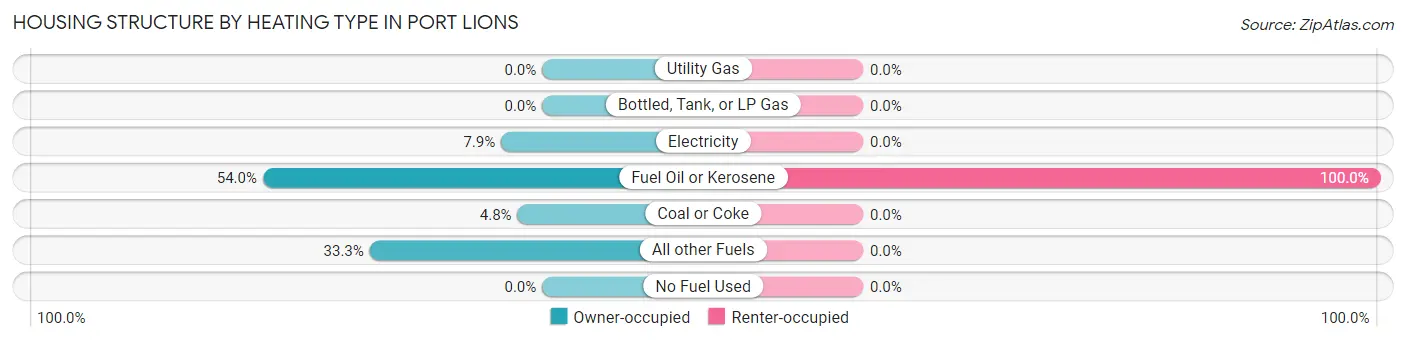
| Heating Type | Owner-occupied | Renter-occupied |
| Utility Gas | 0 (0.0%) | 0 (0.0%) |
| Bottled, Tank, or LP Gas | 0 (0.0%) | 0 (0.0%) |
| Electricity | 5 (7.9%) | 0 (0.0%) |
| Fuel Oil or Kerosene | 34 (54.0%) | 3 (100.0%) |
| Coal or Coke | 3 (4.8%) | 0 (0.0%) |
| All other Fuels | 21 (33.3%) | 0 (0.0%) |
| No Fuel Used | 0 (0.0%) | 0 (0.0%) |
| Total | 63 (100.0%) | 3 (100.0%) |
Household Vehicle Usage in Port Lions
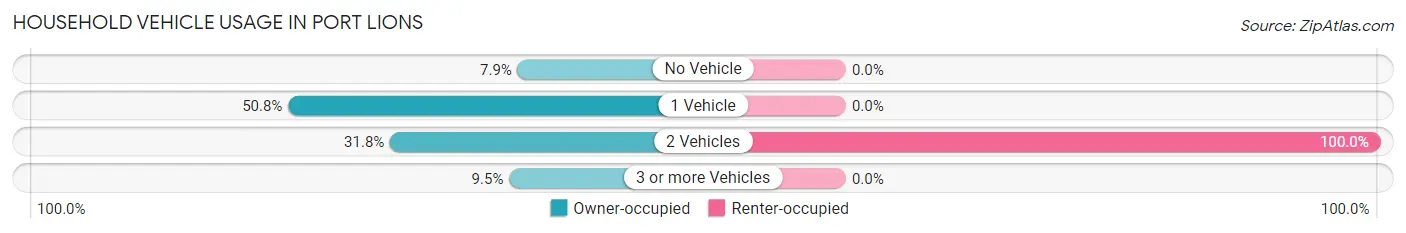
| Vehicles per Household | Owner-occupied | Renter-occupied |
| No Vehicle | 5 (7.9%) | 0 (0.0%) |
| 1 Vehicle | 32 (50.8%) | 0 (0.0%) |
| 2 Vehicles | 20 (31.8%) | 3 (100.0%) |
| 3 or more Vehicles | 6 (9.5%) | 0 (0.0%) |
| Total | 63 (100.0%) | 3 (100.0%) |
Real Estate & Mortgages in Port Lions
Real Estate and Mortgage Overview in Port Lions
| Characteristic | Without Mortgage | With Mortgage |
| Housing Units | 46 | 17 |
| Median Property Value | $207,100 | $256,300 |
| Median Household Income | $45,000 | $2 |
| Monthly Housing Costs | $540 | $0 |
| Real Estate Taxes | $1,125 | $1 |
Property Value by Mortgage Status in Port Lions
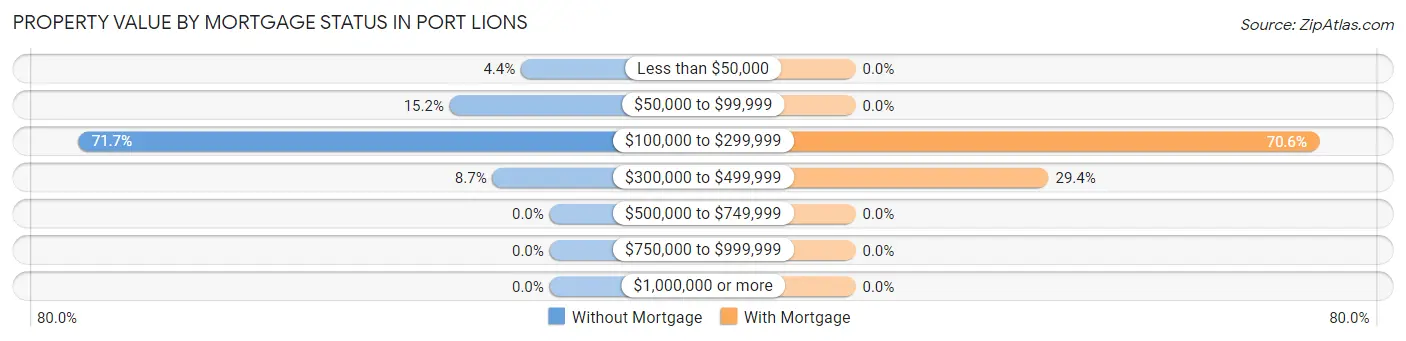
| Property Value | Without Mortgage | With Mortgage |
| Less than $50,000 | 2 (4.3%) | 0 (0.0%) |
| $50,000 to $99,999 | 7 (15.2%) | 0 (0.0%) |
| $100,000 to $299,999 | 33 (71.7%) | 12 (70.6%) |
| $300,000 to $499,999 | 4 (8.7%) | 5 (29.4%) |
| $500,000 to $749,999 | 0 (0.0%) | 0 (0.0%) |
| $750,000 to $999,999 | 0 (0.0%) | 0 (0.0%) |
| $1,000,000 or more | 0 (0.0%) | 0 (0.0%) |
| Total | 46 (100.0%) | 17 (100.0%) |
Household Income by Mortgage Status in Port Lions
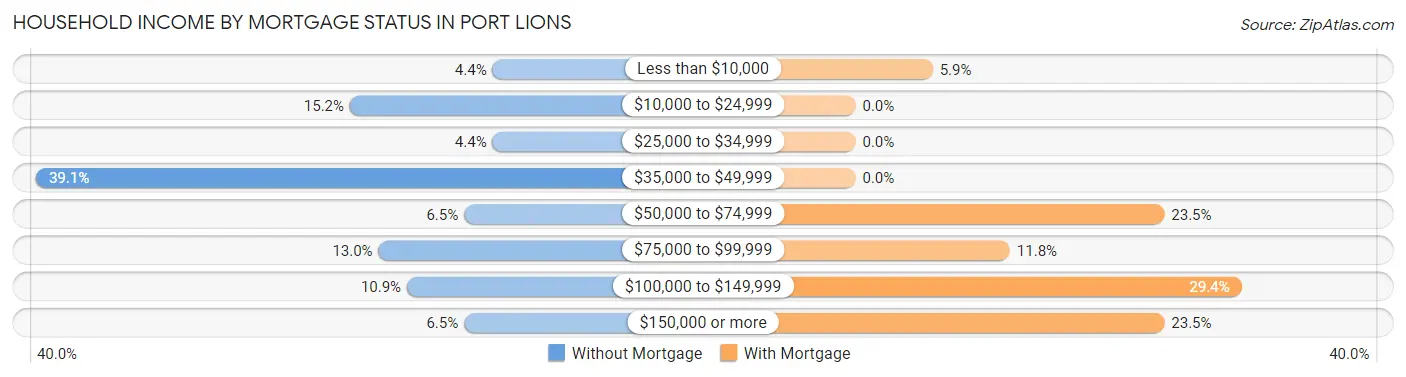
| Household Income | Without Mortgage | With Mortgage |
| Less than $10,000 | 2 (4.3%) | 1 (5.9%) |
| $10,000 to $24,999 | 7 (15.2%) | 0 (0.0%) |
| $25,000 to $34,999 | 2 (4.3%) | 0 (0.0%) |
| $35,000 to $49,999 | 18 (39.1%) | 0 (0.0%) |
| $50,000 to $74,999 | 3 (6.5%) | 4 (23.5%) |
| $75,000 to $99,999 | 6 (13.0%) | 2 (11.8%) |
| $100,000 to $149,999 | 5 (10.9%) | 5 (29.4%) |
| $150,000 or more | 3 (6.5%) | 4 (23.5%) |
| Total | 46 (100.0%) | 17 (100.0%) |
Property Value to Household Income Ratio in Port Lions
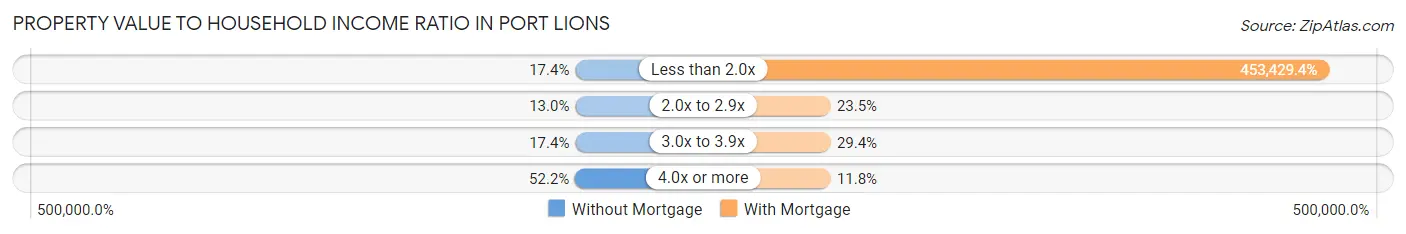
| Value-to-Income Ratio | Without Mortgage | With Mortgage |
| Less than 2.0x | 8 (17.4%) | 77,083 (453,429.4%) |
| 2.0x to 2.9x | 6 (13.0%) | 4 (23.5%) |
| 3.0x to 3.9x | 8 (17.4%) | 5 (29.4%) |
| 4.0x or more | 24 (52.2%) | 2 (11.8%) |
| Total | 46 (100.0%) | 17 (100.0%) |
Real Estate Taxes by Mortgage Status in Port Lions
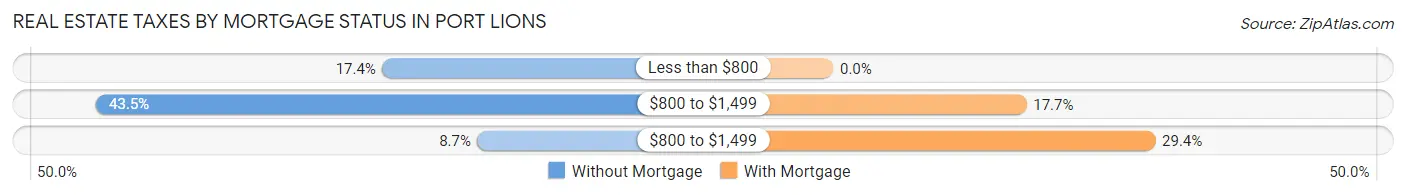
| Property Taxes | Without Mortgage | With Mortgage |
| Less than $800 | 8 (17.4%) | 0 (0.0%) |
| $800 to $1,499 | 20 (43.5%) | 3 (17.6%) |
| $800 to $1,499 | 4 (8.7%) | 5 (29.4%) |
| Total | 46 (100.0%) | 17 (100.0%) |
Health & Disability in Port Lions
Health Insurance Coverage by Age in Port Lions
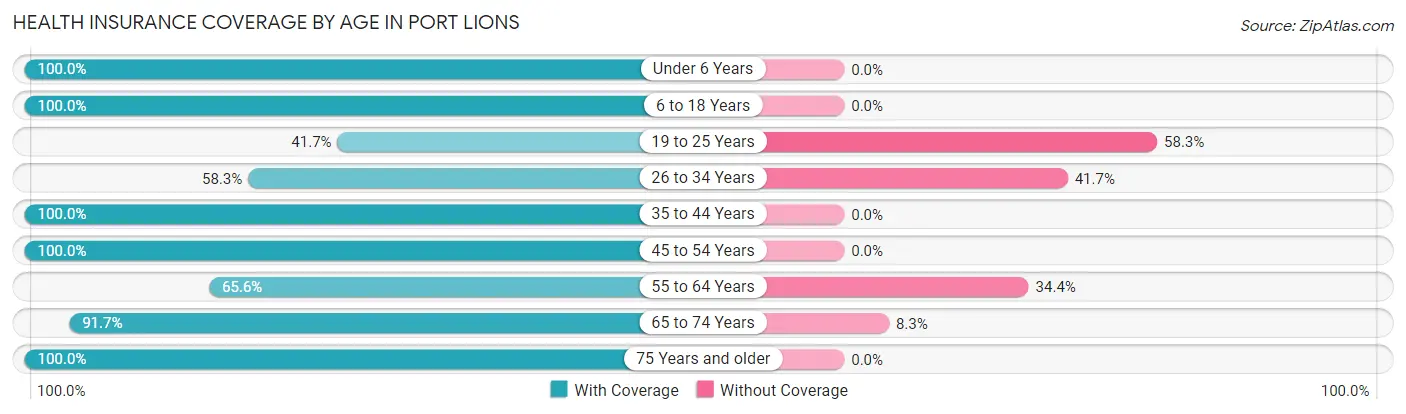
| Age Bracket | With Coverage | Without Coverage |
| Under 6 Years | 7 (100.0%) | 0 (0.0%) |
| 6 to 18 Years | 7 (100.0%) | 0 (0.0%) |
| 19 to 25 Years | 5 (41.7%) | 7 (58.3%) |
| 26 to 34 Years | 7 (58.3%) | 5 (41.7%) |
| 35 to 44 Years | 9 (100.0%) | 0 (0.0%) |
| 45 to 54 Years | 8 (100.0%) | 0 (0.0%) |
| 55 to 64 Years | 21 (65.6%) | 11 (34.4%) |
| 65 to 74 Years | 22 (91.7%) | 2 (8.3%) |
| 75 Years and older | 13 (100.0%) | 0 (0.0%) |
| Total | 99 (79.8%) | 25 (20.2%) |
Health Insurance Coverage by Citizenship Status in Port Lions
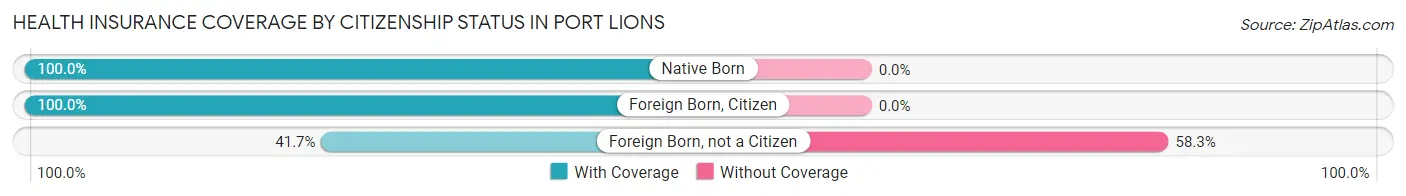
| Citizenship Status | With Coverage | Without Coverage |
| Native Born | 7 (100.0%) | 0 (0.0%) |
| Foreign Born, Citizen | 7 (100.0%) | 0 (0.0%) |
| Foreign Born, not a Citizen | 5 (41.7%) | 7 (58.3%) |
Health Insurance Coverage by Household Income in Port Lions
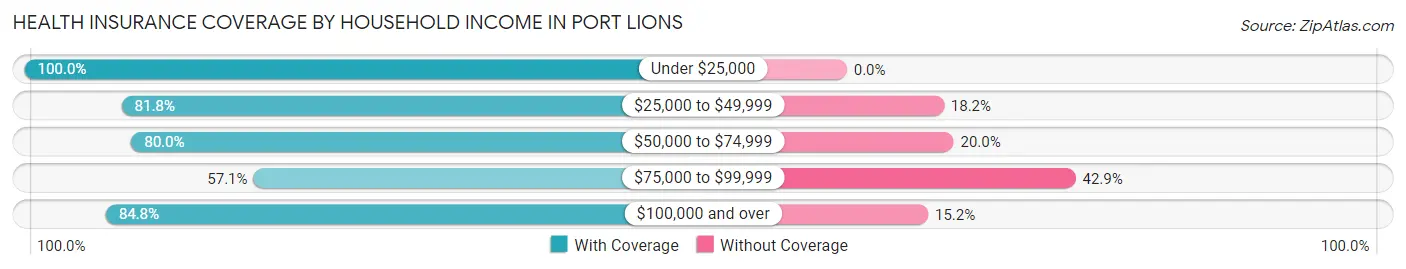
| Household Income | With Coverage | Without Coverage |
| Under $25,000 | 9 (100.0%) | 0 (0.0%) |
| $25,000 to $49,999 | 27 (81.8%) | 6 (18.2%) |
| $50,000 to $74,999 | 12 (80.0%) | 3 (20.0%) |
| $75,000 to $99,999 | 12 (57.1%) | 9 (42.9%) |
| $100,000 and over | 39 (84.8%) | 7 (15.2%) |
Public vs Private Health Insurance Coverage by Age in Port Lions
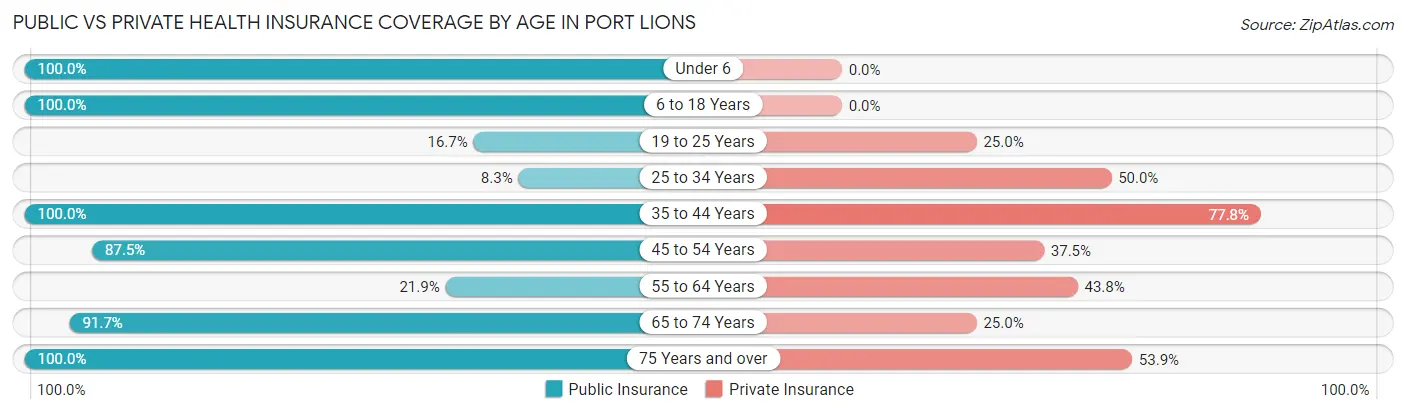
| Age Bracket | Public Insurance | Private Insurance |
| Under 6 | 7 (100.0%) | 0 (0.0%) |
| 6 to 18 Years | 7 (100.0%) | 0 (0.0%) |
| 19 to 25 Years | 2 (16.7%) | 3 (25.0%) |
| 25 to 34 Years | 1 (8.3%) | 6 (50.0%) |
| 35 to 44 Years | 9 (100.0%) | 7 (77.8%) |
| 45 to 54 Years | 7 (87.5%) | 3 (37.5%) |
| 55 to 64 Years | 7 (21.9%) | 14 (43.8%) |
| 65 to 74 Years | 22 (91.7%) | 6 (25.0%) |
| 75 Years and over | 13 (100.0%) | 7 (53.8%) |
| Total | 75 (60.5%) | 46 (37.1%) |
Disability Status by Sex by Age in Port Lions
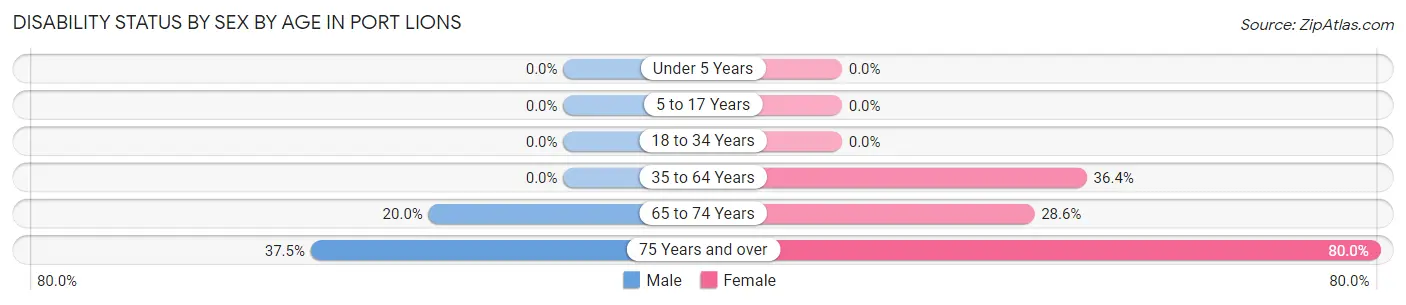
| Age Bracket | Male | Female |
| Under 5 Years | 0 (0.0%) | 0 (0.0%) |
| 5 to 17 Years | 0 (0.0%) | 0 (0.0%) |
| 18 to 34 Years | 0 (0.0%) | 0 (0.0%) |
| 35 to 64 Years | 0 (0.0%) | 8 (36.4%) |
| 65 to 74 Years | 2 (20.0%) | 4 (28.6%) |
| 75 Years and over | 3 (37.5%) | 4 (80.0%) |
Disability Class by Sex by Age in Port Lions
Disability Class: Hearing Difficulty
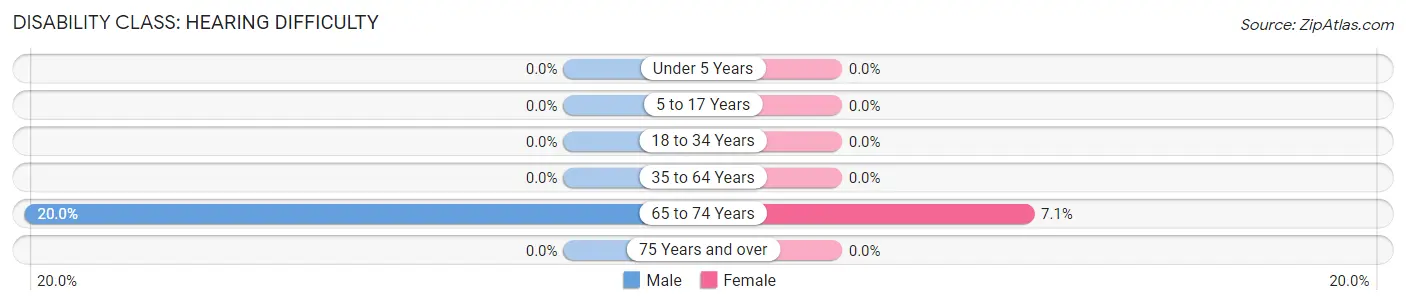
| Age Bracket | Male | Female |
| Under 5 Years | 0 (0.0%) | 0 (0.0%) |
| 5 to 17 Years | 0 (0.0%) | 0 (0.0%) |
| 18 to 34 Years | 0 (0.0%) | 0 (0.0%) |
| 35 to 64 Years | 0 (0.0%) | 0 (0.0%) |
| 65 to 74 Years | 2 (20.0%) | 1 (7.1%) |
| 75 Years and over | 0 (0.0%) | 0 (0.0%) |
Disability Class: Vision Difficulty
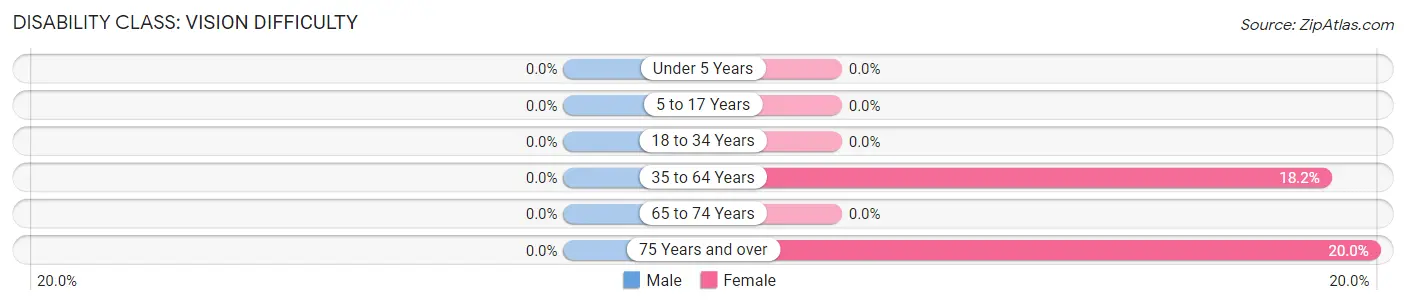
| Age Bracket | Male | Female |
| Under 5 Years | 0 (0.0%) | 0 (0.0%) |
| 5 to 17 Years | 0 (0.0%) | 0 (0.0%) |
| 18 to 34 Years | 0 (0.0%) | 0 (0.0%) |
| 35 to 64 Years | 0 (0.0%) | 4 (18.2%) |
| 65 to 74 Years | 0 (0.0%) | 0 (0.0%) |
| 75 Years and over | 0 (0.0%) | 1 (20.0%) |
Disability Class: Cognitive Difficulty
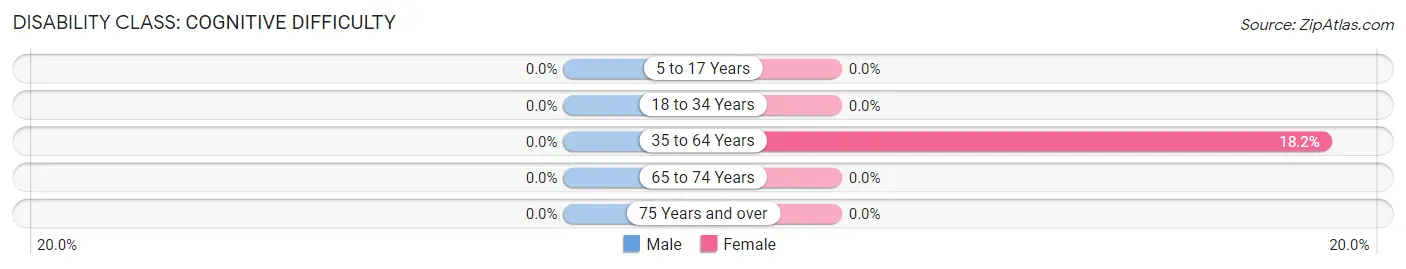
| Age Bracket | Male | Female |
| 5 to 17 Years | 0 (0.0%) | 0 (0.0%) |
| 18 to 34 Years | 0 (0.0%) | 0 (0.0%) |
| 35 to 64 Years | 0 (0.0%) | 4 (18.2%) |
| 65 to 74 Years | 0 (0.0%) | 0 (0.0%) |
| 75 Years and over | 0 (0.0%) | 0 (0.0%) |
Disability Class: Ambulatory Difficulty
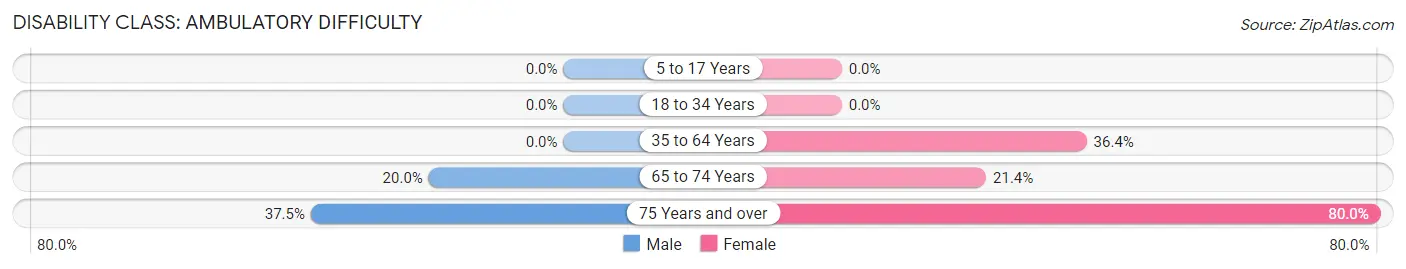
| Age Bracket | Male | Female |
| 5 to 17 Years | 0 (0.0%) | 0 (0.0%) |
| 18 to 34 Years | 0 (0.0%) | 0 (0.0%) |
| 35 to 64 Years | 0 (0.0%) | 8 (36.4%) |
| 65 to 74 Years | 2 (20.0%) | 3 (21.4%) |
| 75 Years and over | 3 (37.5%) | 4 (80.0%) |
Disability Class: Self-Care Difficulty
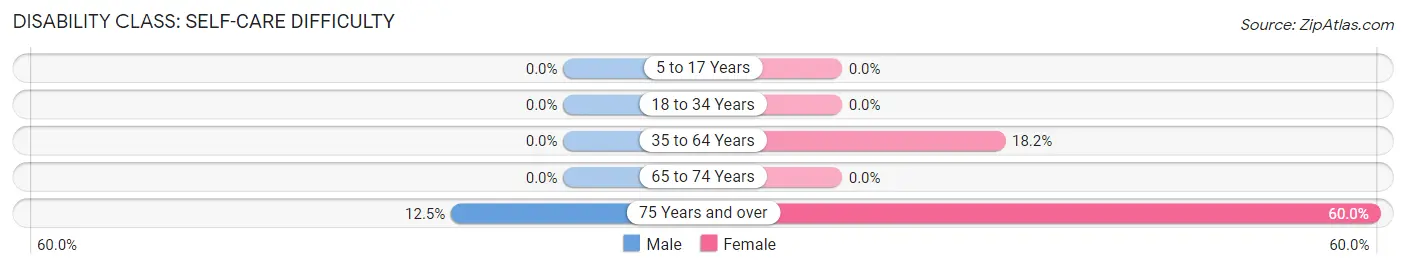
| Age Bracket | Male | Female |
| 5 to 17 Years | 0 (0.0%) | 0 (0.0%) |
| 18 to 34 Years | 0 (0.0%) | 0 (0.0%) |
| 35 to 64 Years | 0 (0.0%) | 4 (18.2%) |
| 65 to 74 Years | 0 (0.0%) | 0 (0.0%) |
| 75 Years and over | 1 (12.5%) | 3 (60.0%) |
Technology Access in Port Lions
Computing Device Access in Port Lions
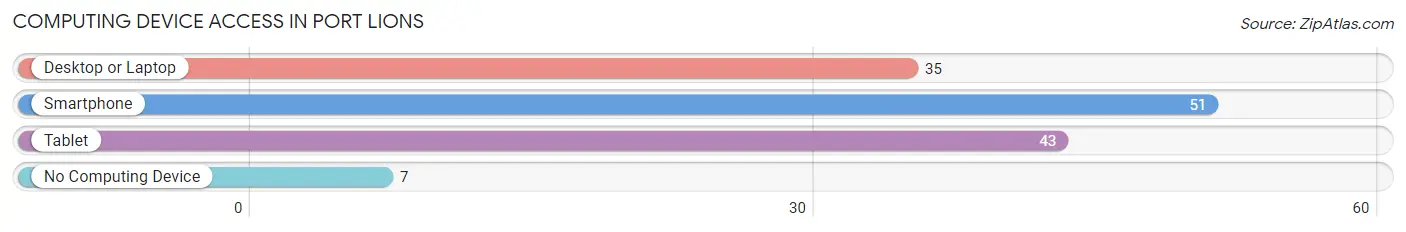
| Device Type | # Households | % Households |
| Desktop or Laptop | 35 | 53.0% |
| Smartphone | 51 | 77.3% |
| Tablet | 43 | 65.1% |
| No Computing Device | 7 | 10.6% |
| Total | 66 | 100.0% |
Internet Access in Port Lions
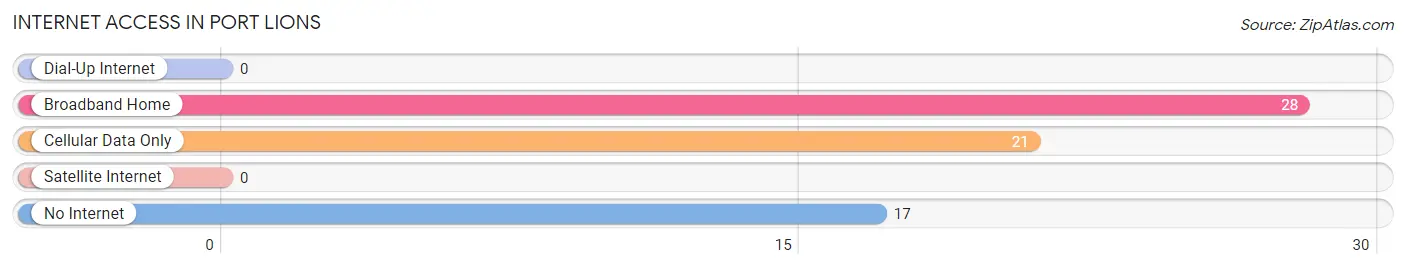
| Internet Type | # Households | % Households |
| Dial-Up Internet | 0 | 0.0% |
| Broadband Home | 28 | 42.4% |
| Cellular Data Only | 21 | 31.8% |
| Satellite Internet | 0 | 0.0% |
| No Internet | 17 | 25.8% |
| Total | 66 | 100.0% |
Port Lions Summary
History
Port Lions is a small city located on Kodiak Island in the state of Alaska. It is the only incorporated city on the island and is home to about 500 people. The city was originally established in the late 1800s as a fishing village by the Russian-American Company. It was named after the nearby Port Lions Bay, which was named after the sea lions that were often seen in the area.
The city was a major hub for the fishing industry in the early 1900s, and it was also a popular destination for tourists. In the 1950s, the city was connected to the mainland by a ferry service, which allowed for increased access to the city.
In the 1960s, the city was chosen as the site of a new military base, which was built to protect the nearby Kodiak Naval Base. This brought a large influx of military personnel to the city, and it also helped to spur economic growth.
In the 1970s, the city was chosen as the site of a new airport, which allowed for increased access to the city. This also helped to spur economic growth, as the airport allowed for increased tourism and business opportunities.
In the 1980s, the city was chosen as the site of a new fish processing plant, which helped to further spur economic growth. The plant was eventually closed in the 1990s, but the city still remains a major hub for the fishing industry.
Geography
Port Lions is located on Kodiak Island in the Gulf of Alaska. The city is situated on the eastern side of the island, and it is surrounded by the Shelikof Strait to the north and the Pacific Ocean to the south. The city is located about 40 miles from the mainland, and it is about 30 miles from the nearest major city, Kodiak.
The city is located in a temperate rainforest climate, and it receives an average of about 60 inches of precipitation per year. The city is also located in an area that is prone to earthquakes, and it has experienced several major earthquakes in the past.
Economy
The economy of Port Lions is largely based on fishing and tourism. The city is home to several fishing fleets, and it is also a popular destination for tourists. The city is also home to several small businesses, including restaurants, shops, and hotels.
The city is also home to a large military base, which provides jobs for many of the city’s residents. The base also provides a large economic boost to the city, as it brings in a large amount of money from the military.
Demographics
As of the 2010 census, the population of Port Lions was 498. The city is predominantly white, with about 85% of the population being white. The city also has a large Native American population, with about 10% of the population being Native American. The city also has a small Hispanic population, with about 3% of the population being Hispanic.
The median household income in the city is about $50,000, and the median home value is about $200,000. The city has a high rate of homeownership, with about 75% of the population owning their own homes. The city also has a high rate of educational attainment, with about 90% of the population having at least a high school diploma.
Common Questions
What is Per Capita Income in Port Lions?
Per Capita income in Port Lions is $39,884.
What is the Median Family Income in Port Lions?
Median Family Income in Port Lions is $84,688.
What is the Median Household income in Port Lions?
Median Household Income in Port Lions is $50,000.
What is Income or Wage Gap in Port Lions?
Income or Wage Gap in Port Lions is 2.0%.
Women in Port Lions earn 98.0 cents for every dollar earned by a man.
What is Inequality or Gini Index in Port Lions?
Inequality or Gini Index in Port Lions is 0.38.
What is the Total Population of Port Lions?
Total Population of Port Lions is 124.
What is the Total Male Population of Port Lions?
Total Male Population of Port Lions is 56.
What is the Total Female Population of Port Lions?
Total Female Population of Port Lions is 68.
What is the Ratio of Males per 100 Females in Port Lions?
There are 82.35 Males per 100 Females in Port Lions.
What is the Ratio of Females per 100 Males in Port Lions?
There are 121.43 Females per 100 Males in Port Lions.
What is the Median Population Age in Port Lions?
Median Population Age in Port Lions is 56.8 Years.
What is the Average Family Size in Port Lions
Average Family Size in Port Lions is 2.9 People.
What is the Average Household Size in Port Lions
Average Household Size in Port Lions is 1.9 People.
How Large is the Labor Force in Port Lions?
There are 64 People in the Labor Forcein in Port Lions.
What is the Percentage of People in the Labor Force in Port Lions?
56.6% of People are in the Labor Force in Port Lions.
What is the Unemployment Rate in Port Lions?
Unemployment Rate in Port Lions is 7.8%.