Trapper Creek, AK Map & Demographics
Trapper Creek Map
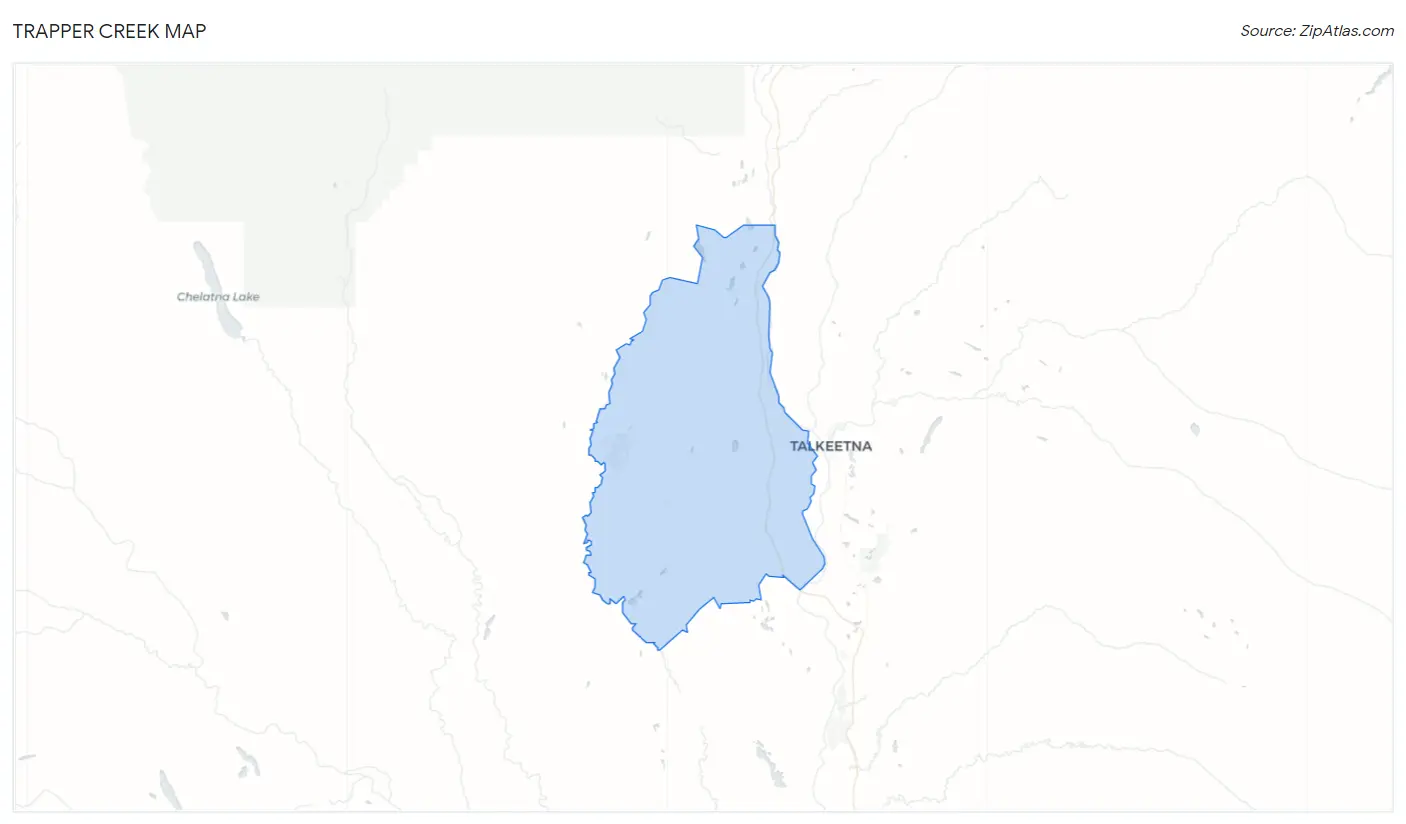
Trapper Creek Overview
$44,776
PER CAPITA INCOME
$86,667
AVG FAMILY INCOME
$51,071
AVG HOUSEHOLD INCOME
0.47
INEQUALITY / GINI INDEX
303
TOTAL POPULATION
181
MALE POPULATION
122
FEMALE POPULATION
148.36
MALES / 100 FEMALES
67.40
FEMALES / 100 MALES
63.4
MEDIAN AGE
2.3
AVG FAMILY SIZE
1.7
AVG HOUSEHOLD SIZE
142
LABOR FORCE [ PEOPLE ]
49.0%
PERCENT IN LABOR FORCE
8.5%
UNEMPLOYMENT RATE
Trapper Creek Zip Codes
Trapper Creek Area Codes
Income in Trapper Creek
Income Overview in Trapper Creek
Per Capita Income in Trapper Creek is $44,776, while median incomes of families and households are $86,667 and $51,071 respectively.
| Characteristic | Number | Measure |
| Per Capita Income | 303 | $44,776 |
| Median Family Income | 92 | $86,667 |
| Mean Family Income | 92 | $108,193 |
| Median Household Income | 176 | $51,071 |
| Mean Household Income | 176 | $78,385 |
| Income Deficit | 92 | $0 |
| Wage / Income Gap (%) | 303 | 0.00% |
| Wage / Income Gap ($) | 303 | 100.00¢ per $1 |
| Gini / Inequality Index | 303 | 0.47 |
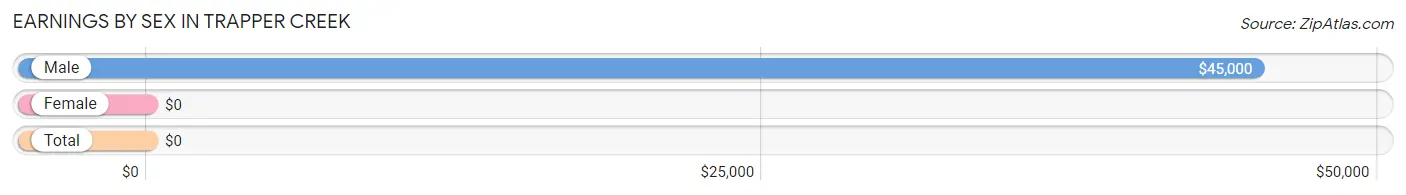
Earnings by Sex in Trapper Creek
| Sex | Number | Average Earnings |
| Male | 104 (65.0%) | $45,000 |
| Female | 56 (35.0%) | $0 |
| Total | 160 (100.0%) | $0 |
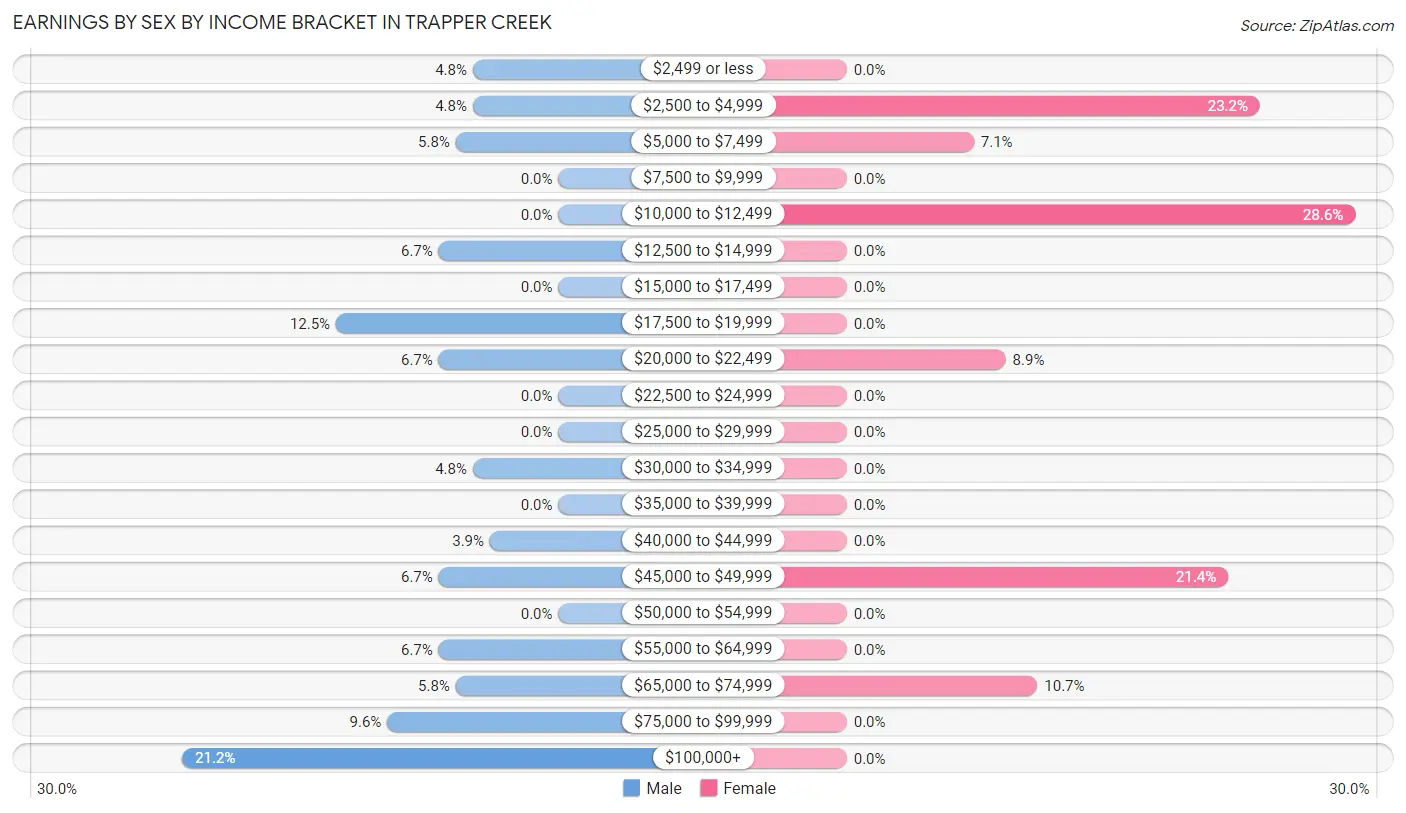
Earnings by Sex by Income Bracket in Trapper Creek
The most common earnings brackets in Trapper Creek are $100,000+ for men (22 | 21.1%) and $10,000 to $12,499 for women (16 | 28.6%).
| Income | Male | Female |
| $2,499 or less | 5 (4.8%) | 0 (0.0%) |
| $2,500 to $4,999 | 5 (4.8%) | 13 (23.2%) |
| $5,000 to $7,499 | 6 (5.8%) | 4 (7.1%) |
| $7,500 to $9,999 | 0 (0.0%) | 0 (0.0%) |
| $10,000 to $12,499 | 0 (0.0%) | 16 (28.6%) |
| $12,500 to $14,999 | 7 (6.7%) | 0 (0.0%) |
| $15,000 to $17,499 | 0 (0.0%) | 0 (0.0%) |
| $17,500 to $19,999 | 13 (12.5%) | 0 (0.0%) |
| $20,000 to $22,499 | 7 (6.7%) | 5 (8.9%) |
| $22,500 to $24,999 | 0 (0.0%) | 0 (0.0%) |
| $25,000 to $29,999 | 0 (0.0%) | 0 (0.0%) |
| $30,000 to $34,999 | 5 (4.8%) | 0 (0.0%) |
| $35,000 to $39,999 | 0 (0.0%) | 0 (0.0%) |
| $40,000 to $44,999 | 4 (3.8%) | 0 (0.0%) |
| $45,000 to $49,999 | 7 (6.7%) | 12 (21.4%) |
| $50,000 to $54,999 | 0 (0.0%) | 0 (0.0%) |
| $55,000 to $64,999 | 7 (6.7%) | 0 (0.0%) |
| $65,000 to $74,999 | 6 (5.8%) | 6 (10.7%) |
| $75,000 to $99,999 | 10 (9.6%) | 0 (0.0%) |
| $100,000+ | 22 (21.1%) | 0 (0.0%) |
| Total | 104 (100.0%) | 56 (100.0%) |
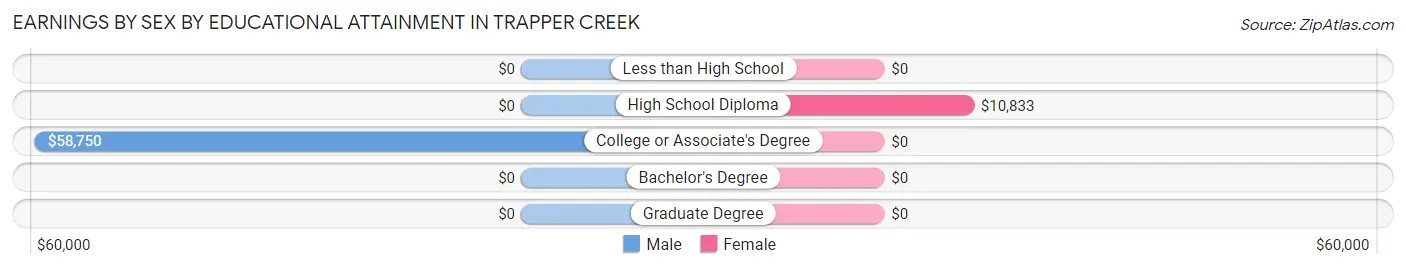
Earnings by Sex by Educational Attainment in Trapper Creek
| Educational Attainment | Male Income | Female Income |
| Less than High School | - | - |
| High School Diploma | - | - |
| College or Associate's Degree | $58,750 | $0 |
| Bachelor's Degree | - | - |
| Graduate Degree | - | - |
| Total | $48,214 | $0 |
Family Income in Trapper Creek
Family Income Brackets in Trapper Creek
According to the Trapper Creek family income data, there are 21 families falling into the $100,000 to $149,999 income range, which is the most common income bracket and makes up 22.8% of all families.
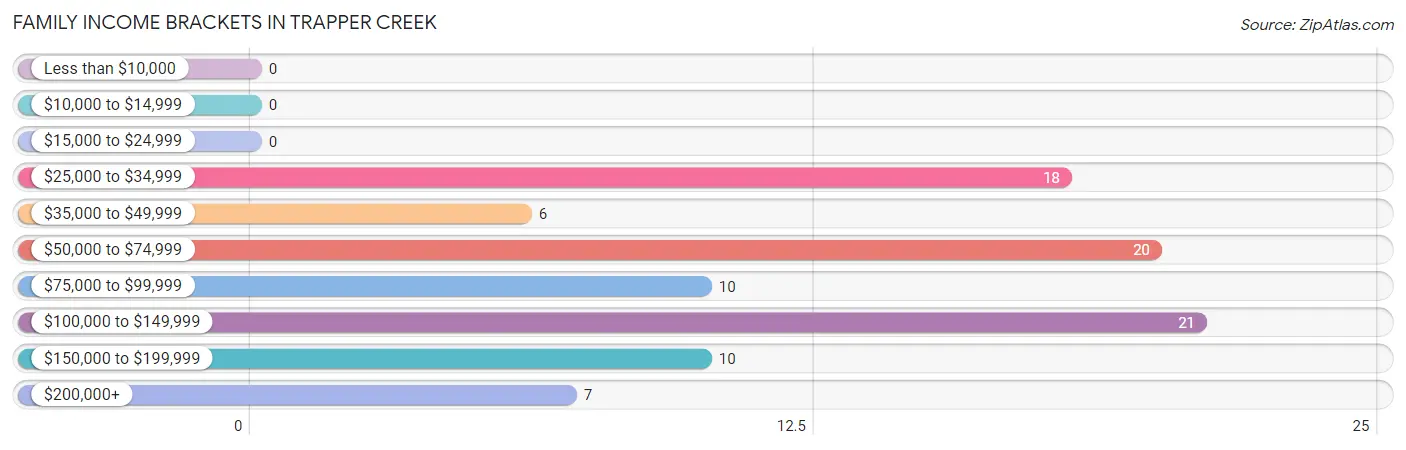
| Income Bracket | # Families | % Families |
| Less than $10,000 | 0 | 0.0% |
| $10,000 to $14,999 | 0 | 0.0% |
| $15,000 to $24,999 | 0 | 0.0% |
| $25,000 to $34,999 | 18 | 19.6% |
| $35,000 to $49,999 | 6 | 6.5% |
| $50,000 to $74,999 | 20 | 21.7% |
| $75,000 to $99,999 | 10 | 10.9% |
| $100,000 to $149,999 | 21 | 22.8% |
| $150,000 to $199,999 | 10 | 10.9% |
| $200,000+ | 7 | 7.6% |
Family Income by Famaliy Size in Trapper Creek
2-person families (68 | 73.9%) account for the highest median family income in Trapper Creek with $95,357 per family, while 2-person families (68 | 73.9%) have the highest median income of $47,678 per family member.
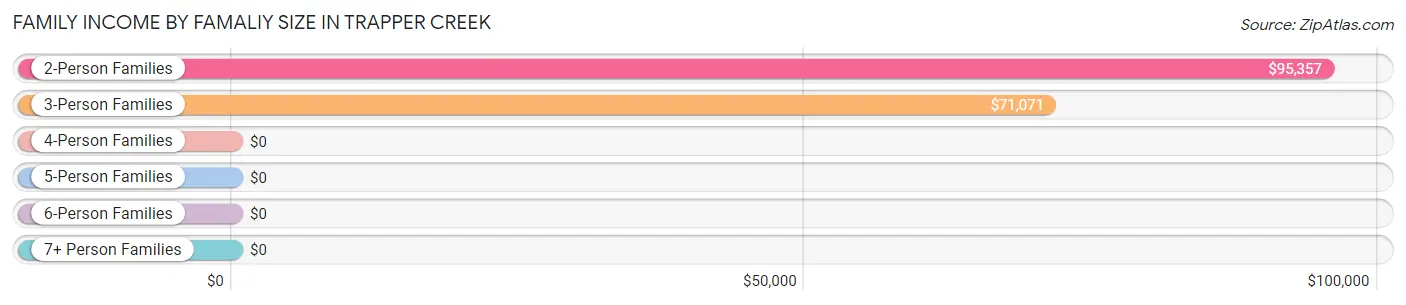
| Income Bracket | # Families | Median Income |
| 2-Person Families | 68 (73.9%) | $95,357 |
| 3-Person Families | 20 (21.7%) | $71,071 |
| 4-Person Families | 4 (4.3%) | $0 |
| 5-Person Families | 0 (0.0%) | $0 |
| 6-Person Families | 0 (0.0%) | $0 |
| 7+ Person Families | 0 (0.0%) | $0 |
| Total | 92 (100.0%) | $86,667 |
Family Income by Number of Earners in Trapper Creek
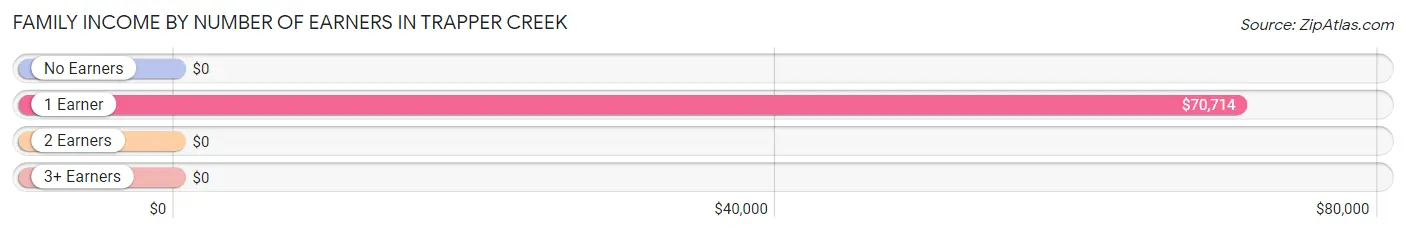
| Number of Earners | # Families | Median Income |
| No Earners | 19 (20.6%) | $0 |
| 1 Earner | 54 (58.7%) | $70,714 |
| 2 Earners | 9 (9.8%) | $0 |
| 3+ Earners | 10 (10.9%) | $0 |
| Total | 92 (100.0%) | $86,667 |
Household Income in Trapper Creek
Household Income Brackets in Trapper Creek
With 31 households falling in the category, the $100,000 to $149,999 income range is the most frequent in Trapper Creek, accounting for 17.6% of all households. In contrast, only 5 households (2.8%) fall into the less than $10,000 income bracket, making it the least populous group.
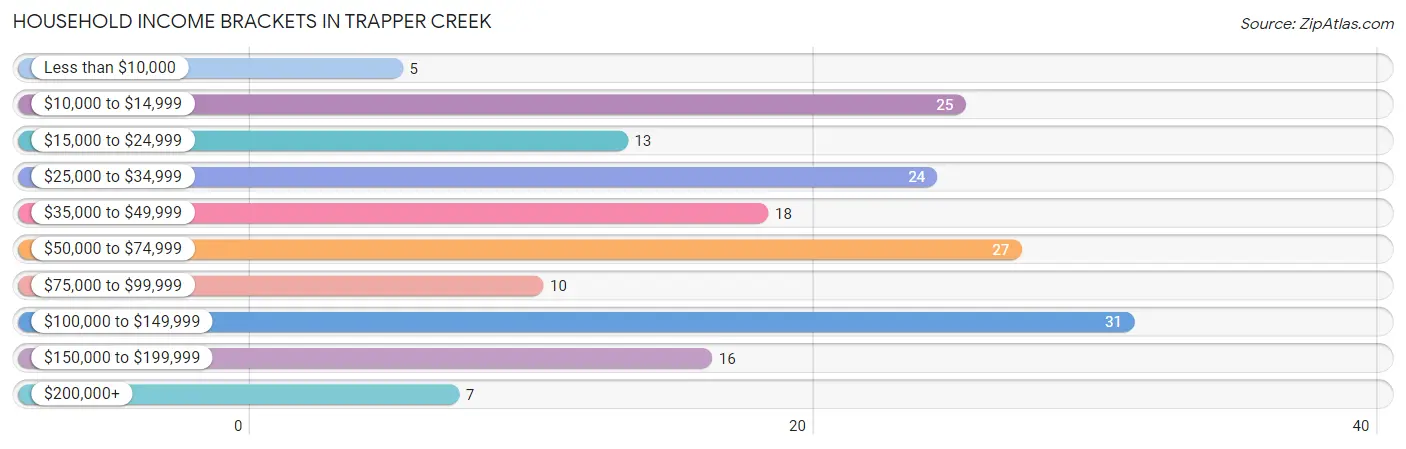
| Income Bracket | # Households | % Households |
| Less than $10,000 | 5 | 2.8% |
| $10,000 to $14,999 | 25 | 14.2% |
| $15,000 to $24,999 | 13 | 7.4% |
| $25,000 to $34,999 | 24 | 13.6% |
| $35,000 to $49,999 | 18 | 10.2% |
| $50,000 to $74,999 | 27 | 15.3% |
| $75,000 to $99,999 | 10 | 5.7% |
| $100,000 to $149,999 | 31 | 17.6% |
| $150,000 to $199,999 | 16 | 9.1% |
| $200,000+ | 7 | 4.0% |
Household Income by Householder Age in Trapper Creek
The median household income in Trapper Creek is $51,071, with the highest median household income of $49,375 found in the 45 to 64 years age bracket for the primary householder. A total of 91 households (51.7%) fall into this category.
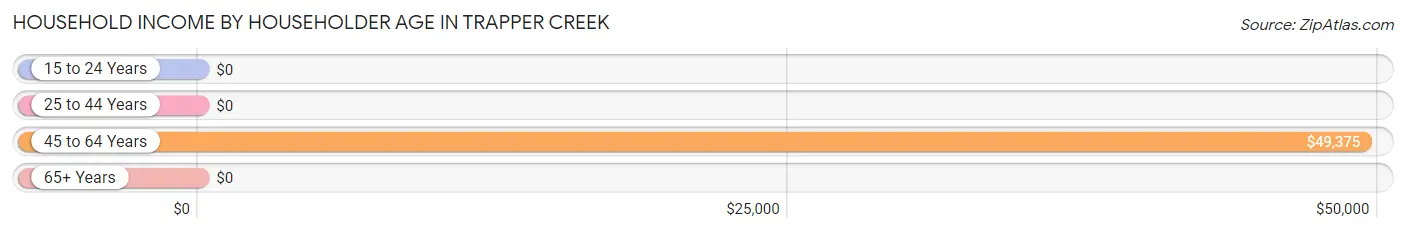
| Income Bracket | # Households | Median Income |
| 15 to 24 Years | 0 (0.0%) | $0 |
| 25 to 44 Years | 15 (8.5%) | $0 |
| 45 to 64 Years | 91 (51.7%) | $49,375 |
| 65+ Years | 70 (39.8%) | $0 |
| Total | 176 (100.0%) | $51,071 |
Poverty in Trapper Creek
Income Below Poverty by Sex and Age in Trapper Creek
With 16.6% poverty level for males and 5.7% for females among the residents of Trapper Creek, 55 to 64 year old males and 55 to 64 year old females are the most vulnerable to poverty, with 13 males (25.0%) and 7 females (14.3%) in their respective age groups living below the poverty level.
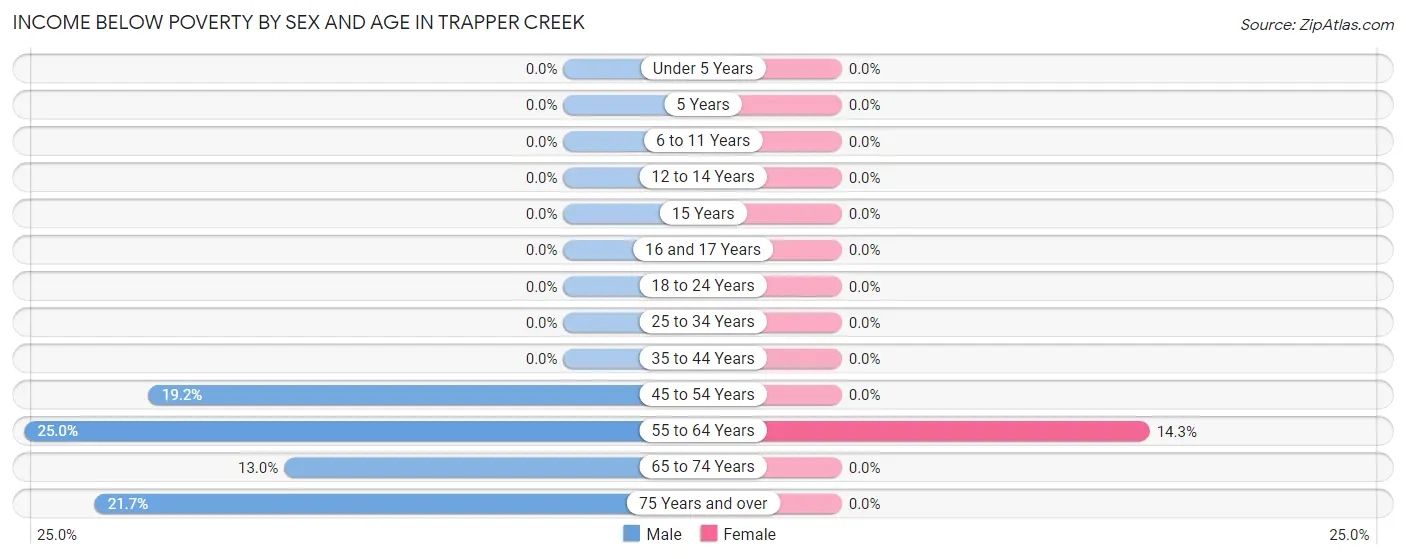
| Age Bracket | Male | Female |
| Under 5 Years | 0 (0.0%) | 0 (0.0%) |
| 5 Years | 0 (0.0%) | 0 (0.0%) |
| 6 to 11 Years | 0 (0.0%) | 0 (0.0%) |
| 12 to 14 Years | 0 (0.0%) | 0 (0.0%) |
| 15 Years | 0 (0.0%) | 0 (0.0%) |
| 16 and 17 Years | 0 (0.0%) | 0 (0.0%) |
| 18 to 24 Years | 0 (0.0%) | 0 (0.0%) |
| 25 to 34 Years | 0 (0.0%) | 0 (0.0%) |
| 35 to 44 Years | 0 (0.0%) | 0 (0.0%) |
| 45 to 54 Years | 5 (19.2%) | 0 (0.0%) |
| 55 to 64 Years | 13 (25.0%) | 7 (14.3%) |
| 65 to 74 Years | 7 (13.0%) | 0 (0.0%) |
| 75 Years and over | 5 (21.7%) | 0 (0.0%) |
| Total | 30 (16.6%) | 7 (5.7%) |
Income Above Poverty by Sex and Age in Trapper Creek
According to the poverty statistics in Trapper Creek, males aged 12 to 14 years and females aged 6 to 11 years are the age groups that are most secure financially, with 100.0% of males and 100.0% of females in these age groups living above the poverty line.
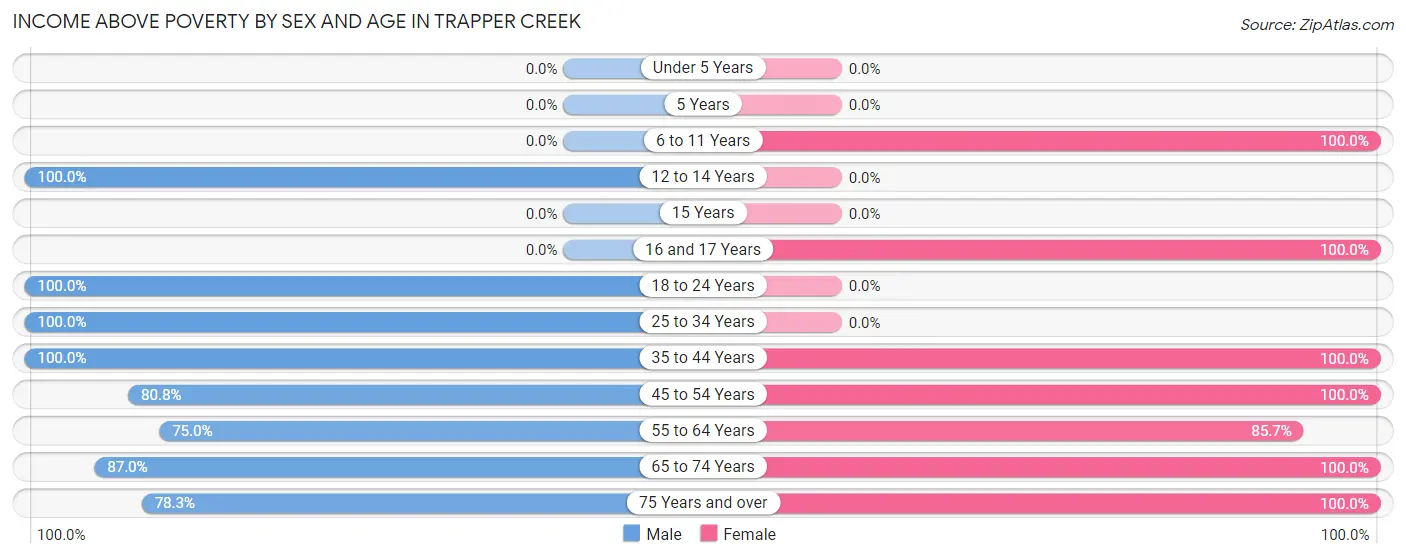
| Age Bracket | Male | Female |
| Under 5 Years | 0 (0.0%) | 0 (0.0%) |
| 5 Years | 0 (0.0%) | 0 (0.0%) |
| 6 to 11 Years | 0 (0.0%) | 6 (100.0%) |
| 12 to 14 Years | 7 (100.0%) | 0 (0.0%) |
| 15 Years | 0 (0.0%) | 0 (0.0%) |
| 16 and 17 Years | 0 (0.0%) | 10 (100.0%) |
| 18 to 24 Years | 4 (100.0%) | 0 (0.0%) |
| 25 to 34 Years | 8 (100.0%) | 0 (0.0%) |
| 35 to 44 Years | 7 (100.0%) | 5 (100.0%) |
| 45 to 54 Years | 21 (80.8%) | 19 (100.0%) |
| 55 to 64 Years | 39 (75.0%) | 42 (85.7%) |
| 65 to 74 Years | 47 (87.0%) | 27 (100.0%) |
| 75 Years and over | 18 (78.3%) | 6 (100.0%) |
| Total | 151 (83.4%) | 115 (94.3%) |
Income Below Poverty Among Married-Couple Families in Trapper Creek
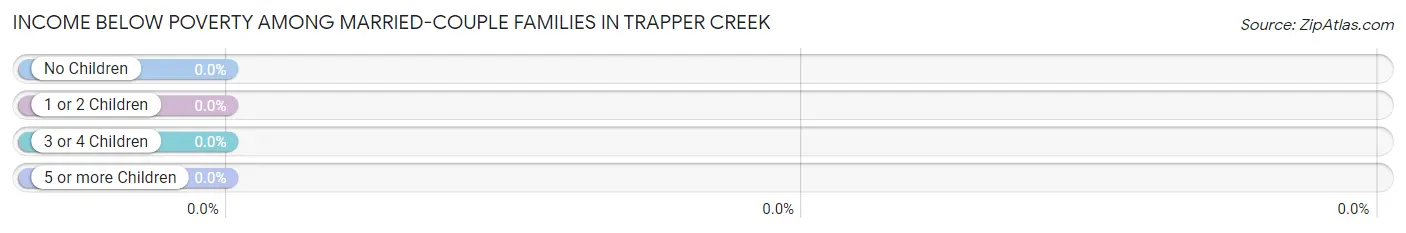
| Children | Above Poverty | Below Poverty |
| No Children | 63 (100.0%) | 0 (0.0%) |
| 1 or 2 Children | 17 (100.0%) | 0 (0.0%) |
| 3 or 4 Children | 0 (0.0%) | 0 (0.0%) |
| 5 or more Children | 0 (0.0%) | 0 (0.0%) |
| Total | 80 (100.0%) | 0 (0.0%) |
Income Below Poverty Among Single-Parent Households in Trapper Creek
| Children | Single Father | Single Mother |
| No Children | 0 (0.0%) | 0 (0.0%) |
| 1 or 2 Children | 0 (0.0%) | 0 (0.0%) |
| 3 or 4 Children | 0 (0.0%) | 0 (0.0%) |
| 5 or more Children | 0 (0.0%) | 0 (0.0%) |
| Total | 0 (0.0%) | 0 (0.0%) |
Income Below Poverty Among Married-Couple vs Single-Parent Households in Trapper Creek
| Children | Married-Couple Families | Single-Parent Households |
| No Children | 0 (0.0%) | 0 (0.0%) |
| 1 or 2 Children | 0 (0.0%) | 0 (0.0%) |
| 3 or 4 Children | 0 (0.0%) | 0 (0.0%) |
| 5 or more Children | 0 (0.0%) | 0 (0.0%) |
| Total | 0 (0.0%) | 0 (0.0%) |
Race in Trapper Creek
The most populous races in Trapper Creek are White / Caucasian (293 | 96.7%), and Two or more Races (10 | 3.3%).
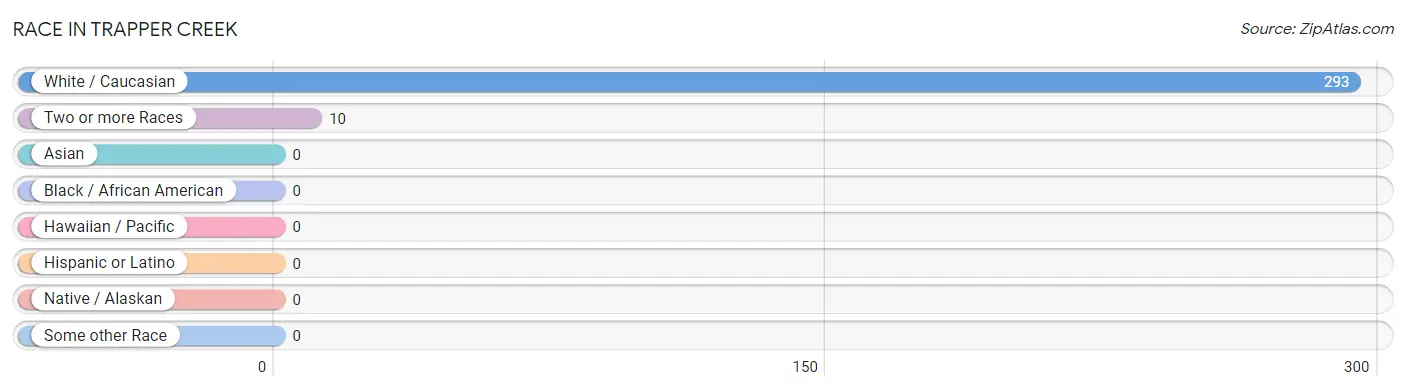
| Race | # Population | % Population |
| Asian | 0 | 0.0% |
| Black / African American | 0 | 0.0% |
| Hawaiian / Pacific | 0 | 0.0% |
| Hispanic or Latino | 0 | 0.0% |
| Native / Alaskan | 0 | 0.0% |
| White / Caucasian | 293 | 96.7% |
| Two or more Races | 10 | 3.3% |
| Some other Race | 0 | 0.0% |
| Total | 303 | 100.0% |
Ancestry in Trapper Creek
The most populous ancestries reported in Trapper Creek are German (78 | 25.7%), Irish (34 | 11.2%), Norwegian (27 | 8.9%), European (20 | 6.6%), and English (13 | 4.3%), together accounting for 56.8% of all Trapper Creek residents.
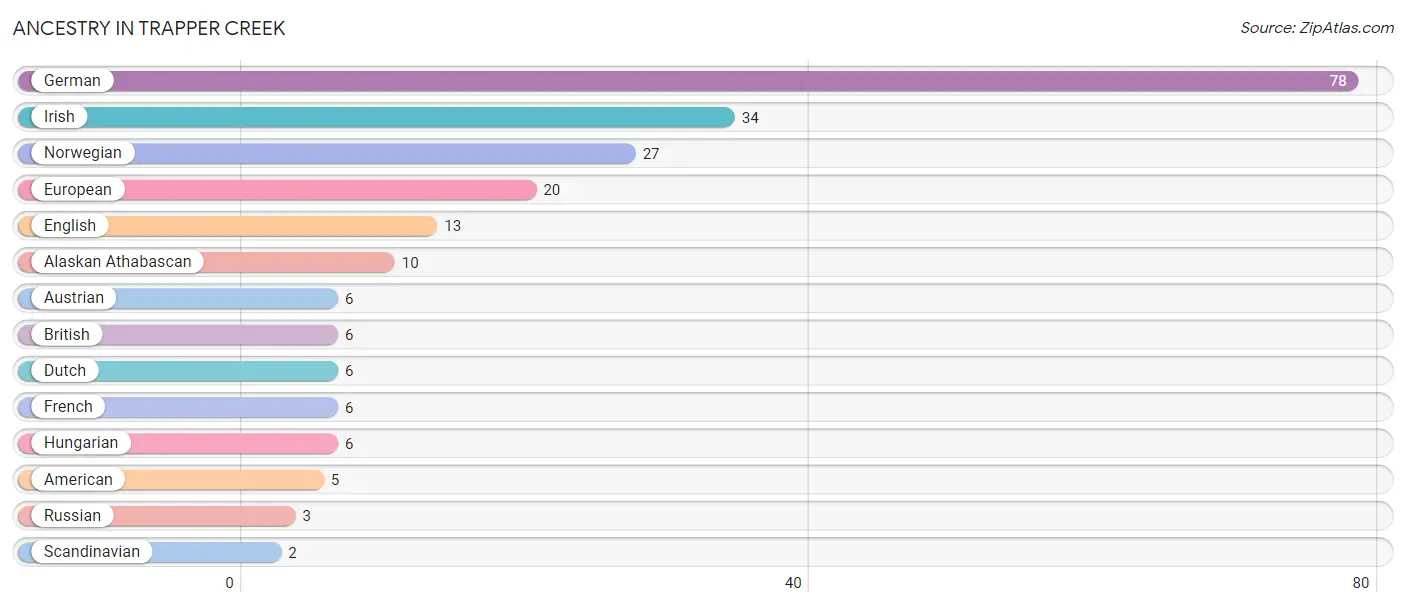
| Ancestry | # Population | % Population |
| Alaskan Athabascan | 10 | 3.3% |
| American | 5 | 1.7% |
| Austrian | 6 | 2.0% |
| British | 6 | 2.0% |
| Dutch | 6 | 2.0% |
| English | 13 | 4.3% |
| European | 20 | 6.6% |
| French | 6 | 2.0% |
| German | 78 | 25.7% |
| Hungarian | 6 | 2.0% |
| Irish | 34 | 11.2% |
| Norwegian | 27 | 8.9% |
| Russian | 3 | 1.0% |
| Scandinavian | 2 | 0.7% | View All 14 Rows |
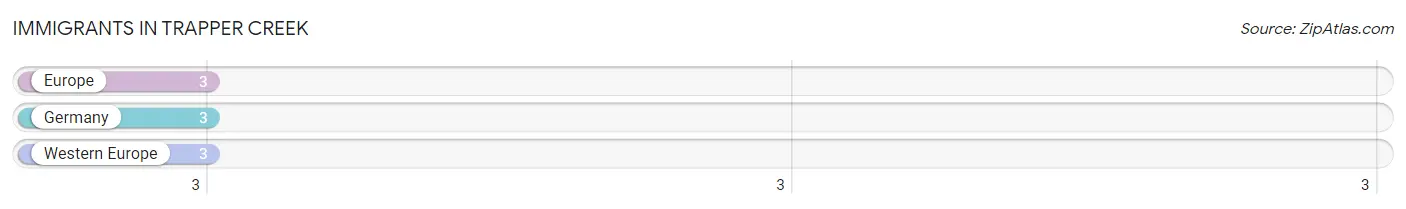
Immigrants in Trapper Creek
The most numerous immigrant groups reported in Trapper Creek came from Europe (3 | 1.0%), Germany (3 | 1.0%), and Western Europe (3 | 1.0%), together accounting for 3.0% of all Trapper Creek residents.
| Immigration Origin | # Population | % Population |
| Europe | 3 | 1.0% |
| Germany | 3 | 1.0% |
| Western Europe | 3 | 1.0% | View All 3 Rows |
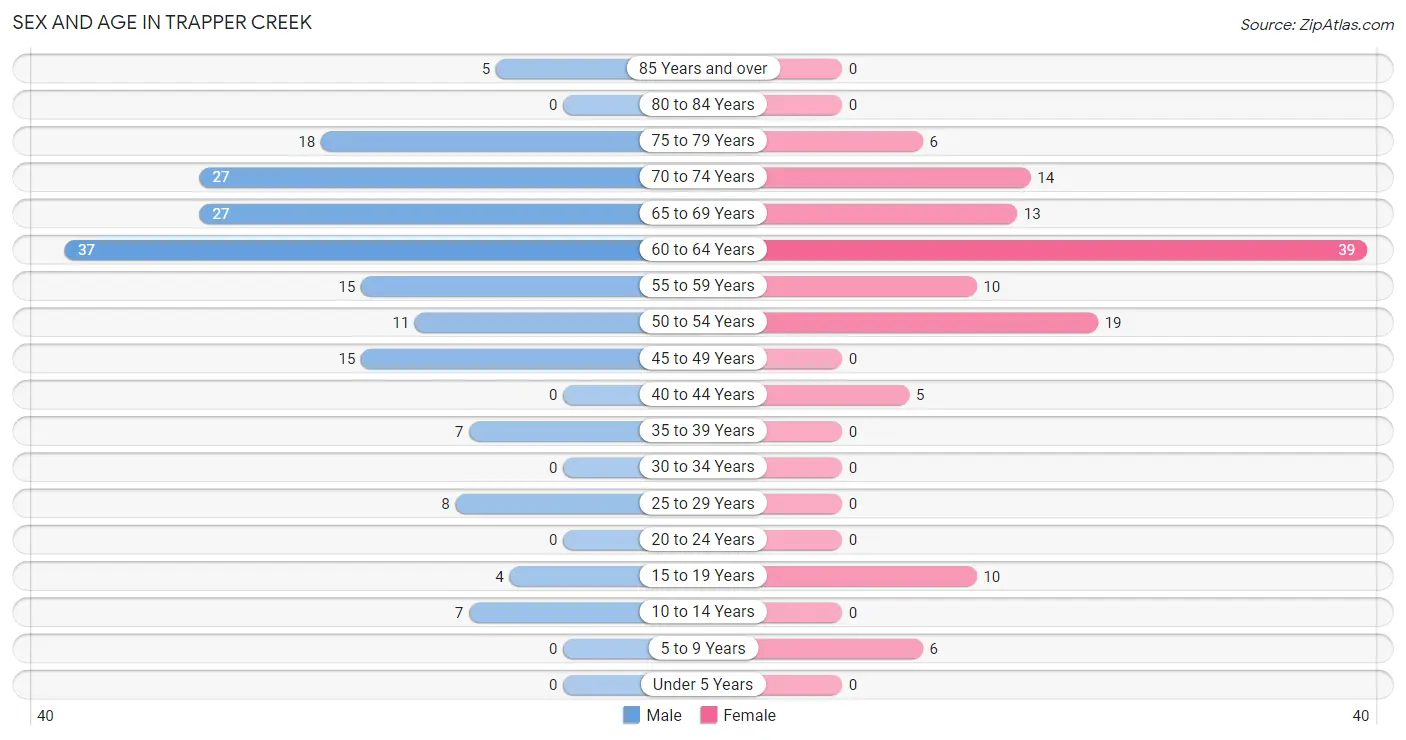
Sex and Age in Trapper Creek
Sex and Age in Trapper Creek
The most populous age groups in Trapper Creek are 60 to 64 Years (37 | 20.4%) for men and 60 to 64 Years (39 | 32.0%) for women.
| Age Bracket | Male | Female |
| Under 5 Years | 0 (0.0%) | 0 (0.0%) |
| 5 to 9 Years | 0 (0.0%) | 6 (4.9%) |
| 10 to 14 Years | 7 (3.9%) | 0 (0.0%) |
| 15 to 19 Years | 4 (2.2%) | 10 (8.2%) |
| 20 to 24 Years | 0 (0.0%) | 0 (0.0%) |
| 25 to 29 Years | 8 (4.4%) | 0 (0.0%) |
| 30 to 34 Years | 0 (0.0%) | 0 (0.0%) |
| 35 to 39 Years | 7 (3.9%) | 0 (0.0%) |
| 40 to 44 Years | 0 (0.0%) | 5 (4.1%) |
| 45 to 49 Years | 15 (8.3%) | 0 (0.0%) |
| 50 to 54 Years | 11 (6.1%) | 19 (15.6%) |
| 55 to 59 Years | 15 (8.3%) | 10 (8.2%) |
| 60 to 64 Years | 37 (20.4%) | 39 (32.0%) |
| 65 to 69 Years | 27 (14.9%) | 13 (10.7%) |
| 70 to 74 Years | 27 (14.9%) | 14 (11.5%) |
| 75 to 79 Years | 18 (9.9%) | 6 (4.9%) |
| 80 to 84 Years | 0 (0.0%) | 0 (0.0%) |
| 85 Years and over | 5 (2.8%) | 0 (0.0%) |
| Total | 181 (100.0%) | 122 (100.0%) |
Families and Households in Trapper Creek
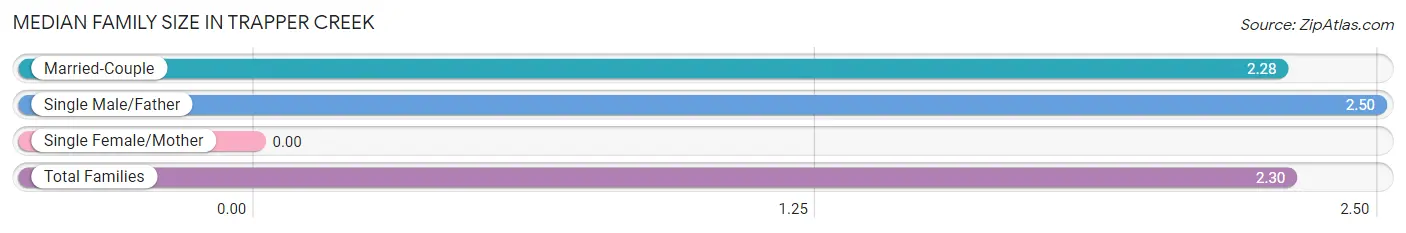
Median Family Size in Trapper Creek
| Family Type | # Families | Family Size |
| Married-Couple | 80 (87.0%) | 2.28 |
| Single Male/Father | 12 (13.0%) | 2.50 |
| Single Female/Mother | 0 (0.0%) | - |
| Total Families | 92 (100.0%) | 2.30 |
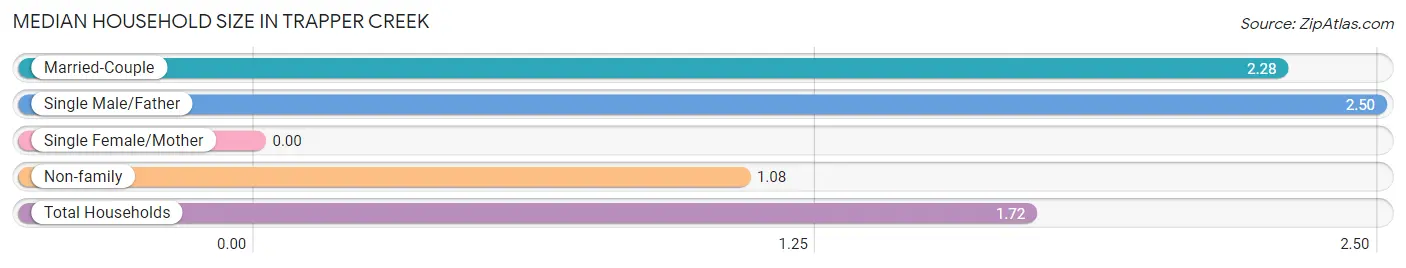
Median Household Size in Trapper Creek
| Household Type | # Households | Household Size |
| Married-Couple | 80 (45.5%) | 2.28 |
| Single Male/Father | 12 (6.8%) | 2.50 |
| Single Female/Mother | 0 (0.0%) | - |
| Non-family | 84 (47.7%) | 1.08 |
| Total Households | 176 (100.0%) | 1.72 |
Household Size by Marriage Status in Trapper Creek
Out of a total of 176 households in Trapper Creek, 92 (52.3%) are family households, while 84 (47.7%) are nonfamily households. The most numerous type of family households are 2-person households, comprising 68, and the most common type of nonfamily households are 1-person households, comprising 77.
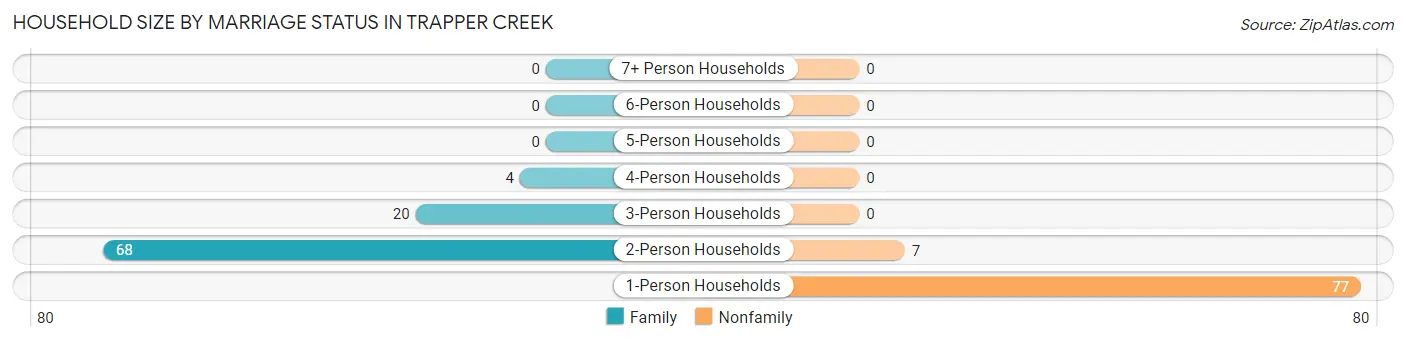
| Household Size | Family Households | Nonfamily Households |
| 1-Person Households | - | 77 (43.8%) |
| 2-Person Households | 68 (38.6%) | 7 (4.0%) |
| 3-Person Households | 20 (11.4%) | 0 (0.0%) |
| 4-Person Households | 4 (2.3%) | 0 (0.0%) |
| 5-Person Households | 0 (0.0%) | 0 (0.0%) |
| 6-Person Households | 0 (0.0%) | 0 (0.0%) |
| 7+ Person Households | 0 (0.0%) | 0 (0.0%) |
| Total | 92 (52.3%) | 84 (47.7%) |
Female Fertility in Trapper Creek
Fertility by Age in Trapper Creek
| Age Bracket | Women with Births | Births / 1,000 Women |
| 15 to 19 years | 0 (0.0%) | 0.0 |
| 20 to 34 years | 0 (0.0%) | 0.0 |
| 35 to 50 years | 0 (0.0%) | 0.0 |
| Total | 0 (0.0%) | 0.0 |
Fertility by Age by Marriage Status in Trapper Creek
| Age Bracket | Married | Unmarried |
| 15 to 19 years | 0 (0.0%) | 0 (0.0%) |
| 20 to 34 years | 0 (0.0%) | 0 (0.0%) |
| 35 to 50 years | 0 (0.0%) | 0 (0.0%) |
| Total | 0 (0.0%) | 0 (0.0%) |
Fertility by Education in Trapper Creek
| Educational Attainment | Women with Births | Births / 1,000 Women |
| Less than High School | 0 (0.0%) | 0.0 |
| High School Diploma | 0 (0.0%) | 0.0 |
| College or Associate's Degree | 0 (0.0%) | 0.0 |
| Bachelor's Degree | 0 (0.0%) | 0.0 |
| Graduate Degree | 0 (0.0%) | 0.0 |
| Total | 0 (0.0%) | 0.0 |
Fertility by Education by Marriage Status in Trapper Creek
| Educational Attainment | Married | Unmarried |
| Less than High School | 0 (0.0%) | 0 (0.0%) |
| High School Diploma | 0 (0.0%) | 0 (0.0%) |
| College or Associate's Degree | 0 (0.0%) | 0 (0.0%) |
| Bachelor's Degree | 0 (0.0%) | 0 (0.0%) |
| Graduate Degree | 0 (0.0%) | 0 (0.0%) |
| Total | 0 (0.0%) | 0 (0.0%) |
Employment Characteristics in Trapper Creek
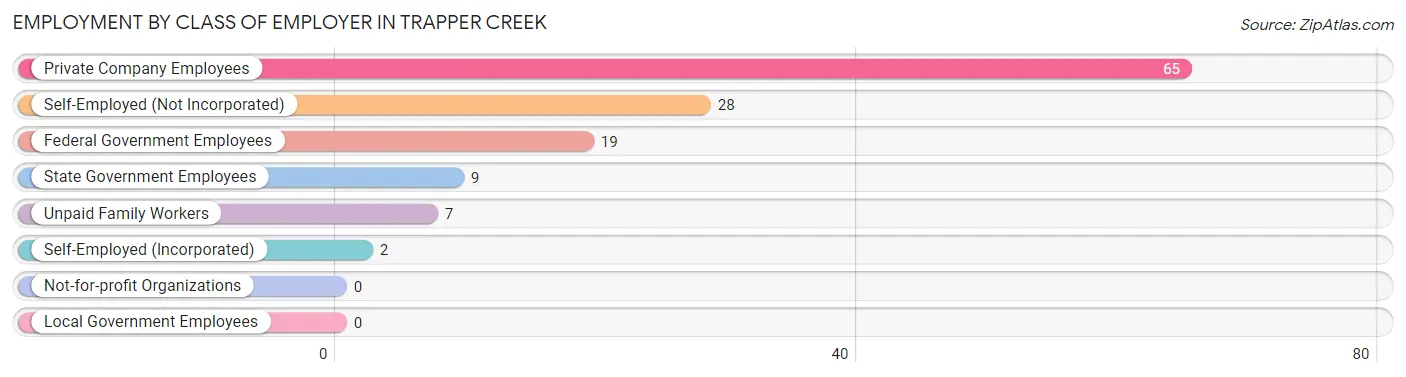
Employment by Class of Employer in Trapper Creek
Among the 130 employed individuals in Trapper Creek, private company employees (65 | 50.0%), self-employed (not incorporated) (28 | 21.5%), and federal government employees (19 | 14.6%) make up the most common classes of employment.
| Employer Class | # Employees | % Employees |
| Private Company Employees | 65 | 50.0% |
| Self-Employed (Incorporated) | 2 | 1.5% |
| Self-Employed (Not Incorporated) | 28 | 21.5% |
| Not-for-profit Organizations | 0 | 0.0% |
| Local Government Employees | 0 | 0.0% |
| State Government Employees | 9 | 6.9% |
| Federal Government Employees | 19 | 14.6% |
| Unpaid Family Workers | 7 | 5.4% |
| Total | 130 | 100.0% |
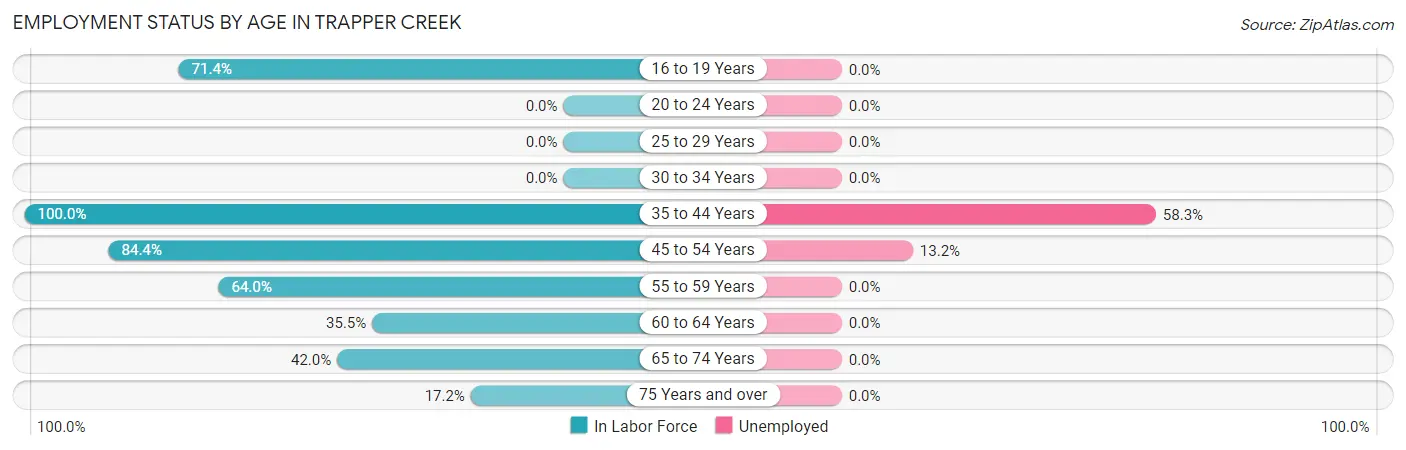
Employment Status by Age in Trapper Creek
According to the labor force statistics for Trapper Creek, out of the total population over 16 years of age (290), 49.0% or 142 individuals are in the labor force, with 8.5% or 12 of them unemployed. The age group with the highest labor force participation rate is 35 to 44 years, with 100.0% or 12 individuals in the labor force. Within the labor force, the 35 to 44 years age range has the highest percentage of unemployed individuals, with 58.3% or 7 of them being unemployed.
| Age Bracket | In Labor Force | Unemployed |
| 16 to 19 Years | 10 (71.4%) | 0 (0.0%) |
| 20 to 24 Years | 0 (0.0%) | 0 (0.0%) |
| 25 to 29 Years | 0 (0.0%) | 0 (0.0%) |
| 30 to 34 Years | 0 (0.0%) | 0 (0.0%) |
| 35 to 44 Years | 12 (100.0%) | 7 (58.3%) |
| 45 to 54 Years | 38 (84.4%) | 5 (13.2%) |
| 55 to 59 Years | 16 (64.0%) | 0 (0.0%) |
| 60 to 64 Years | 27 (35.5%) | 0 (0.0%) |
| 65 to 74 Years | 34 (42.0%) | 0 (0.0%) |
| 75 Years and over | 5 (17.2%) | 0 (0.0%) |
| Total | 142 (49.0%) | 12 (8.5%) |
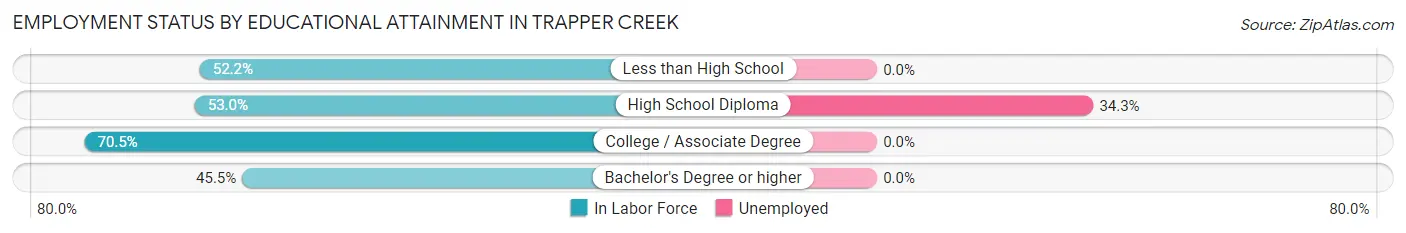
Employment Status by Educational Attainment in Trapper Creek
According to labor force statistics for Trapper Creek, 56.0% of individuals (93) out of the total population between 25 and 64 years of age (166) are in the labor force, with 12.9% or 12 of them being unemployed. The group with the highest labor force participation rate are those with the educational attainment of college / associate degree, with 70.5% or 31 individuals in the labor force. Within the labor force, individuals with high school diploma education have the highest percentage of unemployment, with 34.3% or 12 of them being unemployed.
| Educational Attainment | In Labor Force | Unemployed |
| Less than High School | 12 (52.2%) | 0 (0.0%) |
| High School Diploma | 35 (53.0%) | 23 (34.3%) |
| College / Associate Degree | 31 (70.5%) | 0 (0.0%) |
| Bachelor's Degree or higher | 15 (45.5%) | 0 (0.0%) |
| Total | 93 (56.0%) | 21 (12.9%) |
Employment Occupations by Sex in Trapper Creek
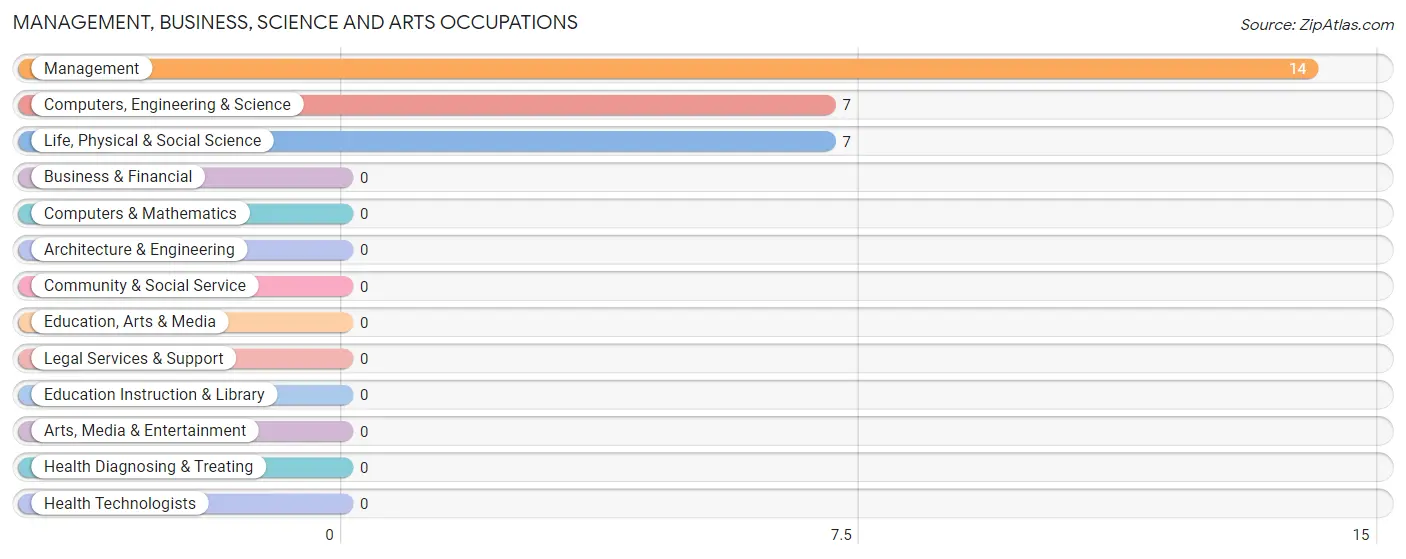
Management, Business, Science and Arts Occupations
The most common Management, Business, Science and Arts occupations in Trapper Creek are Management (14 | 10.8%), Computers, Engineering & Science (7 | 5.4%), and Life, Physical & Social Science (7 | 5.4%).
Management, Business, Science and Arts Occupations by Sex
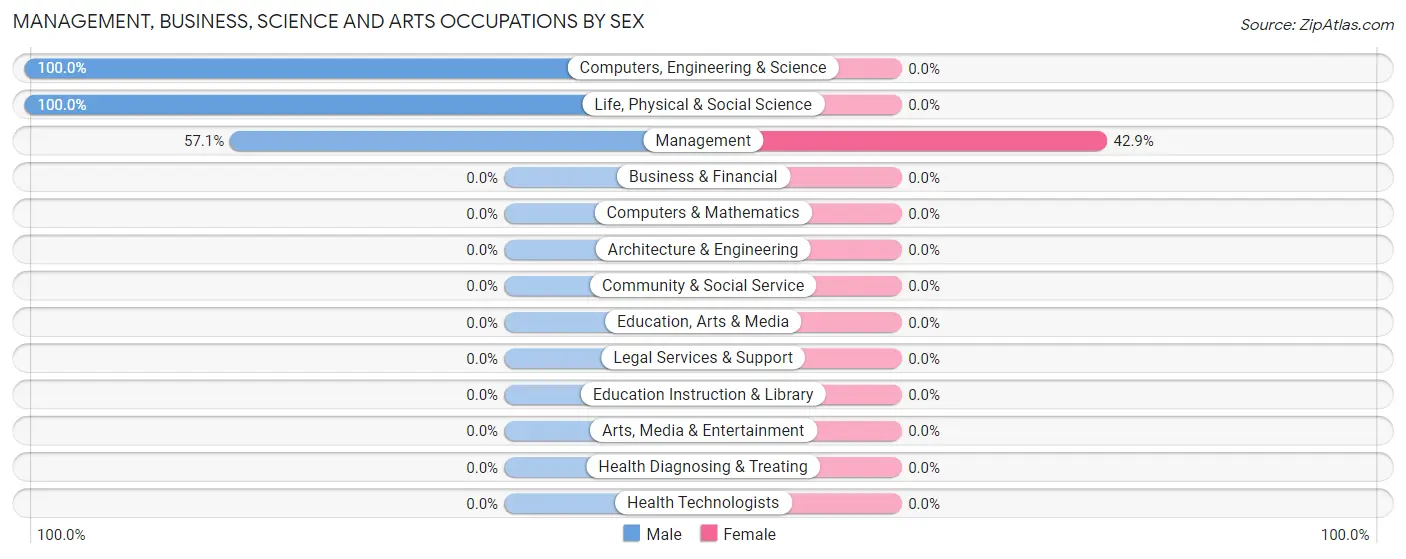
| Occupation | Male | Female |
| Management | 8 (57.1%) | 6 (42.9%) |
| Business & Financial | 0 (0.0%) | 0 (0.0%) |
| Computers, Engineering & Science | 7 (100.0%) | 0 (0.0%) |
| Computers & Mathematics | 0 (0.0%) | 0 (0.0%) |
| Architecture & Engineering | 0 (0.0%) | 0 (0.0%) |
| Life, Physical & Social Science | 7 (100.0%) | 0 (0.0%) |
| Community & Social Service | 0 (0.0%) | 0 (0.0%) |
| Education, Arts & Media | 0 (0.0%) | 0 (0.0%) |
| Legal Services & Support | 0 (0.0%) | 0 (0.0%) |
| Education Instruction & Library | 0 (0.0%) | 0 (0.0%) |
| Arts, Media & Entertainment | 0 (0.0%) | 0 (0.0%) |
| Health Diagnosing & Treating | 0 (0.0%) | 0 (0.0%) |
| Health Technologists | 0 (0.0%) | 0 (0.0%) |
| Total (Category) | 15 (71.4%) | 6 (28.6%) |
| Total (Overall) | 73 (56.1%) | 57 (43.9%) |
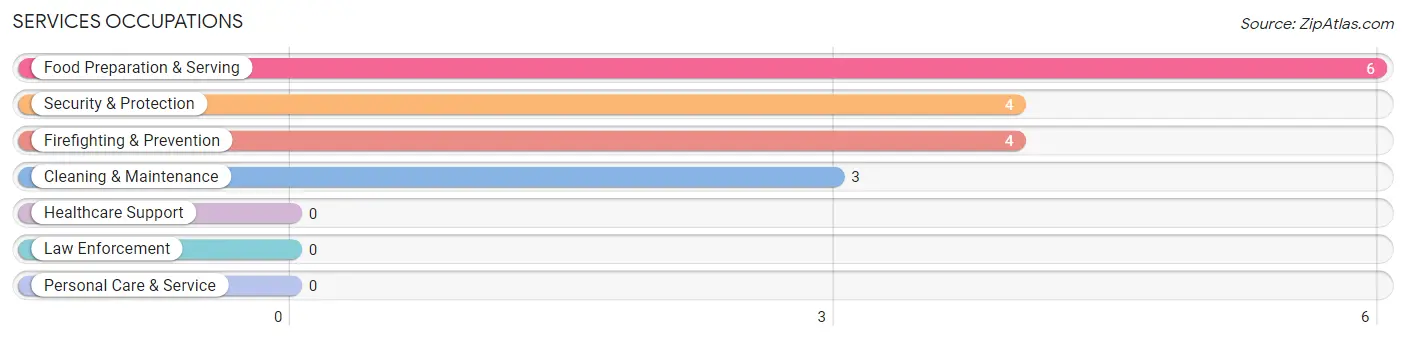
Services Occupations
The most common Services occupations in Trapper Creek are Food Preparation & Serving (6 | 4.6%), Security & Protection (4 | 3.1%), Firefighting & Prevention (4 | 3.1%), and Cleaning & Maintenance (3 | 2.3%).
Services Occupations by Sex
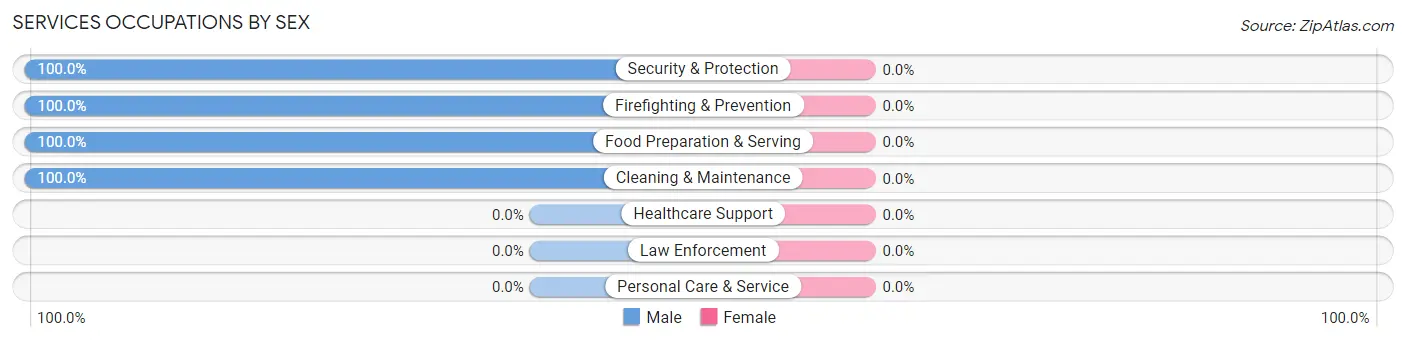
| Occupation | Male | Female |
| Healthcare Support | 0 (0.0%) | 0 (0.0%) |
| Security & Protection | 4 (100.0%) | 0 (0.0%) |
| Firefighting & Prevention | 4 (100.0%) | 0 (0.0%) |
| Law Enforcement | 0 (0.0%) | 0 (0.0%) |
| Food Preparation & Serving | 6 (100.0%) | 0 (0.0%) |
| Cleaning & Maintenance | 3 (100.0%) | 0 (0.0%) |
| Personal Care & Service | 0 (0.0%) | 0 (0.0%) |
| Total (Category) | 13 (100.0%) | 0 (0.0%) |
| Total (Overall) | 73 (56.1%) | 57 (43.9%) |
Sales and Office Occupations
The most common Sales and Office occupations in Trapper Creek are Office & Administration (42 | 32.3%), and Sales & Related (12 | 9.2%).
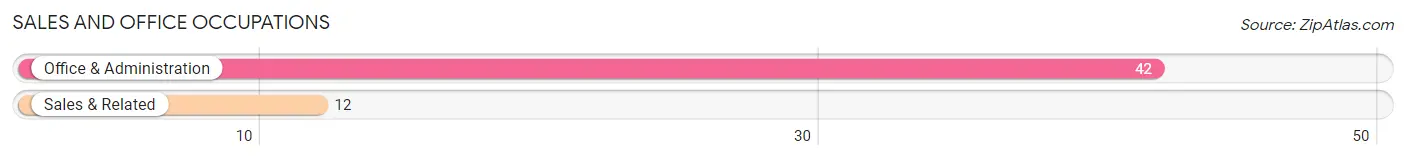
Sales and Office Occupations by Sex

| Occupation | Male | Female |
| Sales & Related | 12 (100.0%) | 0 (0.0%) |
| Office & Administration | 0 (0.0%) | 42 (100.0%) |
| Total (Category) | 12 (22.2%) | 42 (77.8%) |
| Total (Overall) | 73 (56.1%) | 57 (43.9%) |
Natural Resources, Construction and Maintenance Occupations
The most common Natural Resources, Construction and Maintenance occupations in Trapper Creek are Construction & Extraction (13 | 10.0%), Installation, Maintenance & Repair (6 | 4.6%), and Farming, Fishing & Forestry (4 | 3.1%).
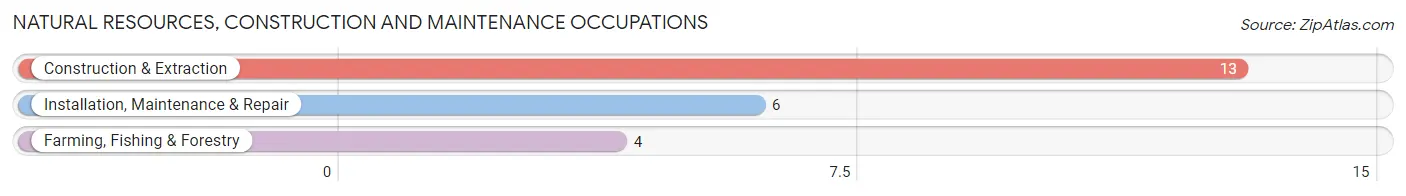
Natural Resources, Construction and Maintenance Occupations by Sex
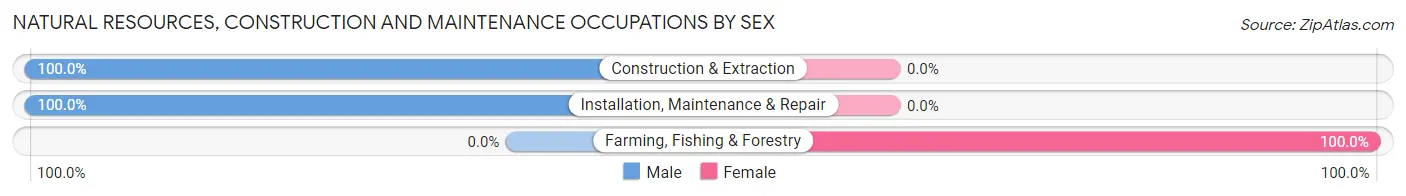
| Occupation | Male | Female |
| Farming, Fishing & Forestry | 0 (0.0%) | 4 (100.0%) |
| Construction & Extraction | 13 (100.0%) | 0 (0.0%) |
| Installation, Maintenance & Repair | 6 (100.0%) | 0 (0.0%) |
| Total (Category) | 19 (82.6%) | 4 (17.4%) |
| Total (Overall) | 73 (56.1%) | 57 (43.9%) |
Production, Transportation and Moving Occupations
The most common Production, Transportation and Moving occupations in Trapper Creek are Transportation (14 | 10.8%), and Production (5 | 3.8%).
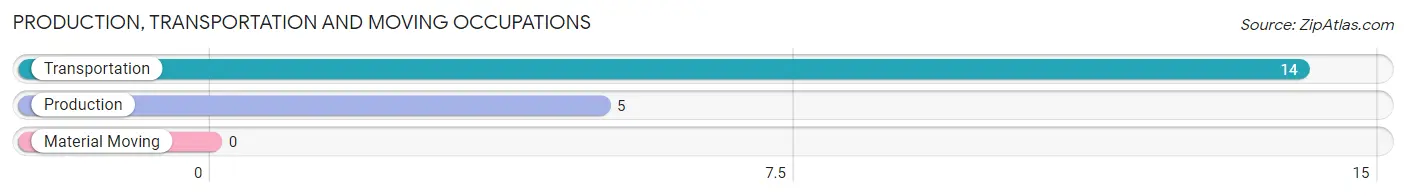
Production, Transportation and Moving Occupations by Sex
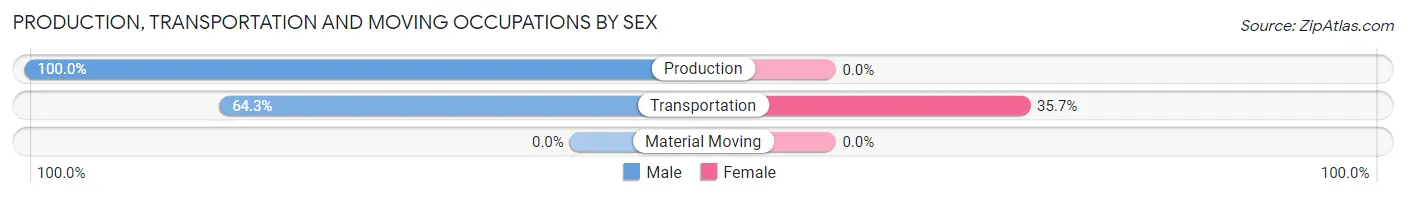
| Occupation | Male | Female |
| Production | 5 (100.0%) | 0 (0.0%) |
| Transportation | 9 (64.3%) | 5 (35.7%) |
| Material Moving | 0 (0.0%) | 0 (0.0%) |
| Total (Category) | 14 (73.7%) | 5 (26.3%) |
| Total (Overall) | 73 (56.1%) | 57 (43.9%) |
Employment Industries by Sex in Trapper Creek
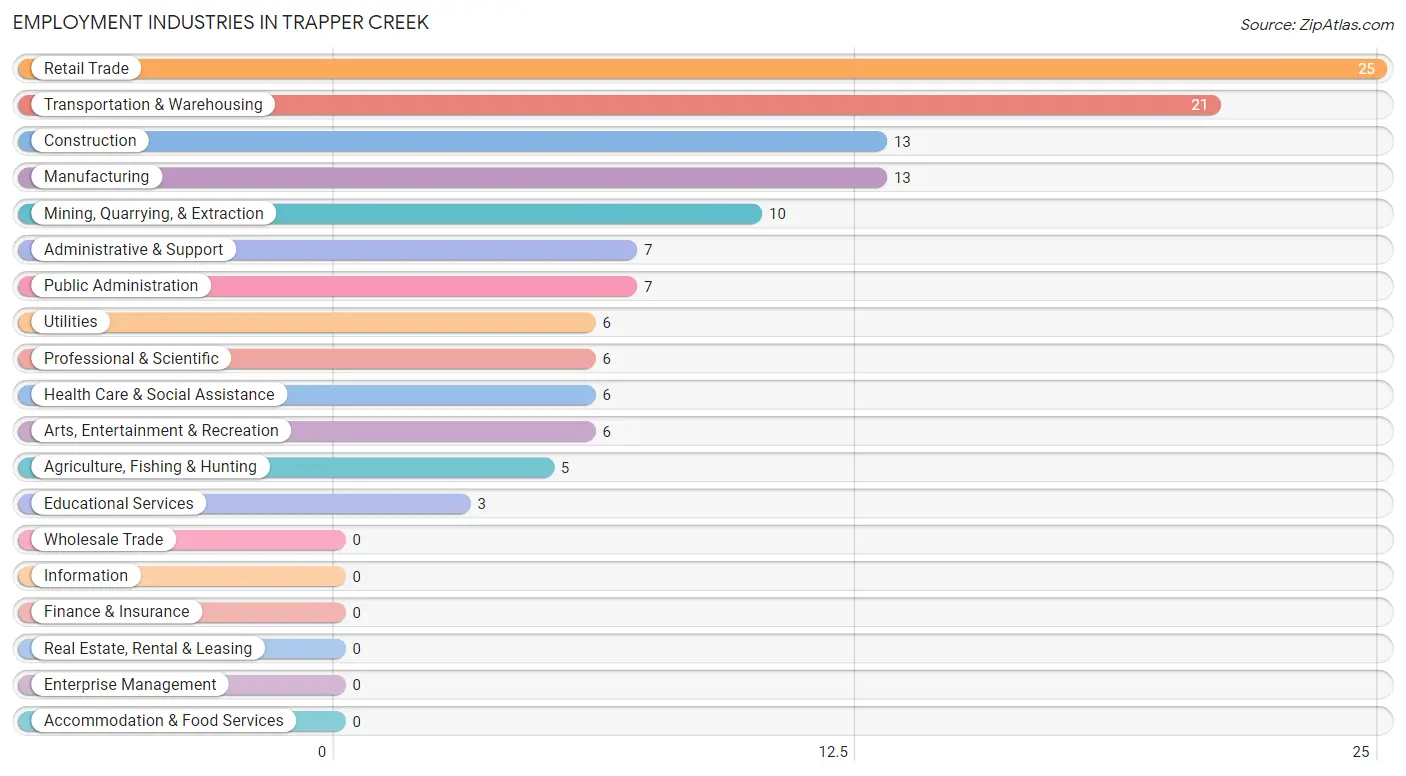
Employment Industries in Trapper Creek
The major employment industries in Trapper Creek include Retail Trade (25 | 19.2%), Transportation & Warehousing (21 | 16.2%), Construction (13 | 10.0%), Manufacturing (13 | 10.0%), and Mining, Quarrying, & Extraction (10 | 7.7%).
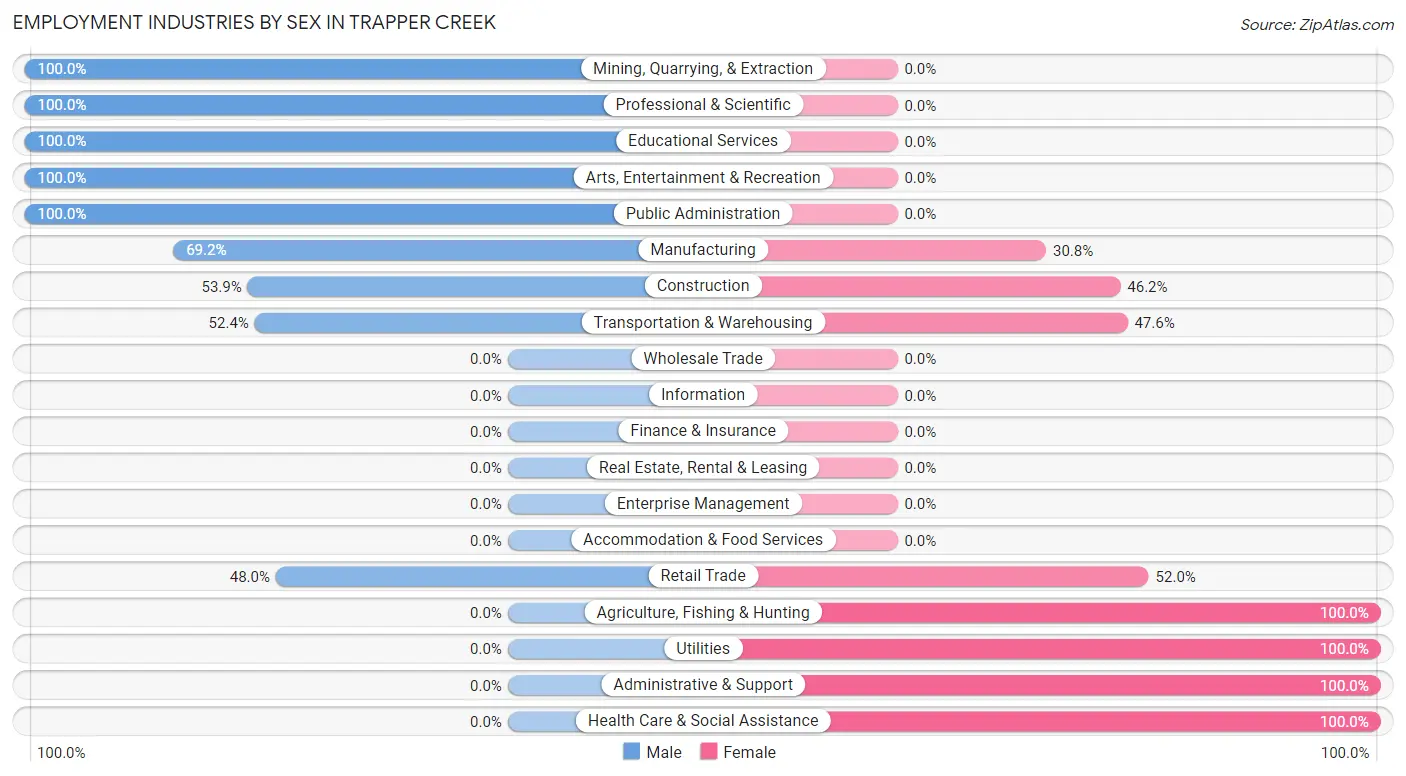
Employment Industries by Sex in Trapper Creek
The Trapper Creek industries that see more men than women are Mining, Quarrying, & Extraction (100.0%), Professional & Scientific (100.0%), and Educational Services (100.0%), whereas the industries that tend to have a higher number of women are Agriculture, Fishing & Hunting (100.0%), Utilities (100.0%), and Administrative & Support (100.0%).
| Industry | Male | Female |
| Agriculture, Fishing & Hunting | 0 (0.0%) | 5 (100.0%) |
| Mining, Quarrying, & Extraction | 10 (100.0%) | 0 (0.0%) |
| Construction | 7 (53.8%) | 6 (46.2%) |
| Manufacturing | 9 (69.2%) | 4 (30.8%) |
| Wholesale Trade | 0 (0.0%) | 0 (0.0%) |
| Retail Trade | 12 (48.0%) | 13 (52.0%) |
| Transportation & Warehousing | 11 (52.4%) | 10 (47.6%) |
| Utilities | 0 (0.0%) | 6 (100.0%) |
| Information | 0 (0.0%) | 0 (0.0%) |
| Finance & Insurance | 0 (0.0%) | 0 (0.0%) |
| Real Estate, Rental & Leasing | 0 (0.0%) | 0 (0.0%) |
| Professional & Scientific | 6 (100.0%) | 0 (0.0%) |
| Enterprise Management | 0 (0.0%) | 0 (0.0%) |
| Administrative & Support | 0 (0.0%) | 7 (100.0%) |
| Educational Services | 3 (100.0%) | 0 (0.0%) |
| Health Care & Social Assistance | 0 (0.0%) | 6 (100.0%) |
| Arts, Entertainment & Recreation | 6 (100.0%) | 0 (0.0%) |
| Accommodation & Food Services | 0 (0.0%) | 0 (0.0%) |
| Public Administration | 7 (100.0%) | 0 (0.0%) |
| Total | 73 (56.1%) | 57 (43.9%) |
Education in Trapper Creek
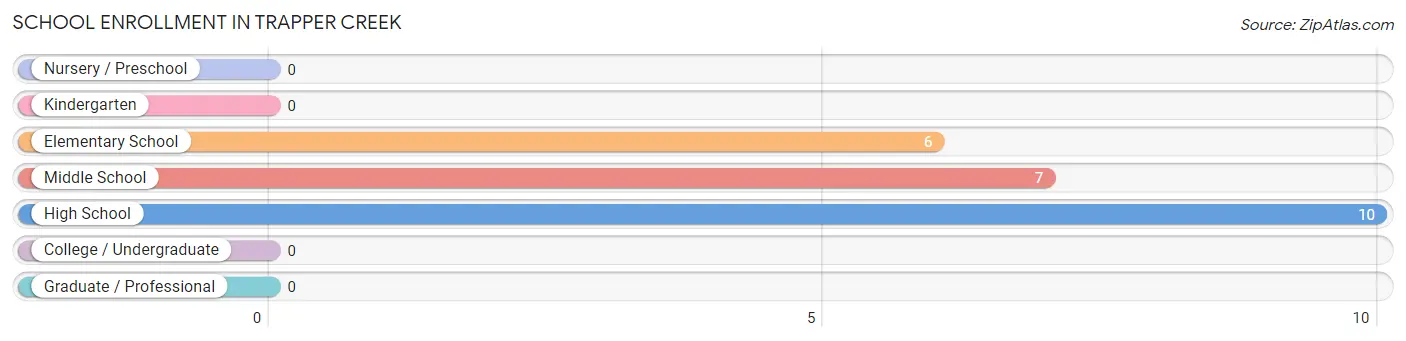
School Enrollment in Trapper Creek
The most common levels of schooling among the 23 students in Trapper Creek are high school (10 | 43.5%), middle school (7 | 30.4%), and elementary school (6 | 26.1%).
| School Level | # Students | % Students |
| Nursery / Preschool | 0 | 0.0% |
| Kindergarten | 0 | 0.0% |
| Elementary School | 6 | 26.1% |
| Middle School | 7 | 30.4% |
| High School | 10 | 43.5% |
| College / Undergraduate | 0 | 0.0% |
| Graduate / Professional | 0 | 0.0% |
| Total | 23 | 100.0% |
School Enrollment by Age by Funding Source in Trapper Creek
Out of a total of 23 students who are enrolled in schools in Trapper Creek, 7 (30.4%) attend a private institution, while the remaining 16 (69.6%) are enrolled in public schools. The age group of 10 to 14 year olds has the highest likelihood of being enrolled in private schools, with 7 (100.0% in the age bracket) enrolled. Conversely, the age group of 5 to 9 year old has the lowest likelihood of being enrolled in a private school, with 6 (100.0% in the age bracket) attending a public institution.
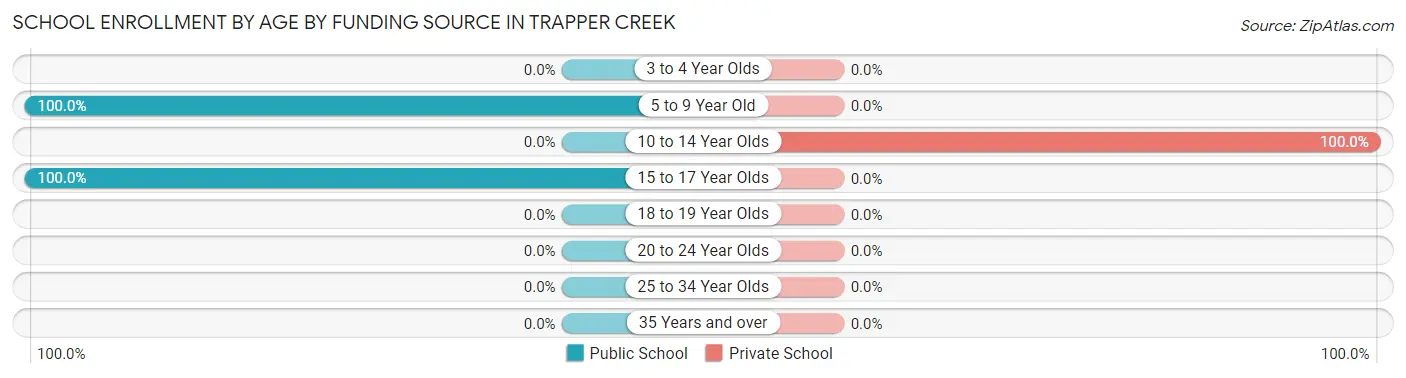
| Age Bracket | Public School | Private School |
| 3 to 4 Year Olds | 0 (0.0%) | 0 (0.0%) |
| 5 to 9 Year Old | 6 (100.0%) | 0 (0.0%) |
| 10 to 14 Year Olds | 0 (0.0%) | 7 (100.0%) |
| 15 to 17 Year Olds | 10 (100.0%) | 0 (0.0%) |
| 18 to 19 Year Olds | 0 (0.0%) | 0 (0.0%) |
| 20 to 24 Year Olds | 0 (0.0%) | 0 (0.0%) |
| 25 to 34 Year Olds | 0 (0.0%) | 0 (0.0%) |
| 35 Years and over | 0 (0.0%) | 0 (0.0%) |
| Total | 16 (69.6%) | 7 (30.4%) |
Educational Attainment by Field of Study in Trapper Creek
Bio, nature & agricultural (13 | 19.7%), science & technology (12 | 18.2%), education (12 | 18.2%), psychology (9 | 13.6%), and physical & health sciences (7 | 10.6%) are the most common fields of study among 66 individuals in Trapper Creek who have obtained a bachelor's degree or higher.
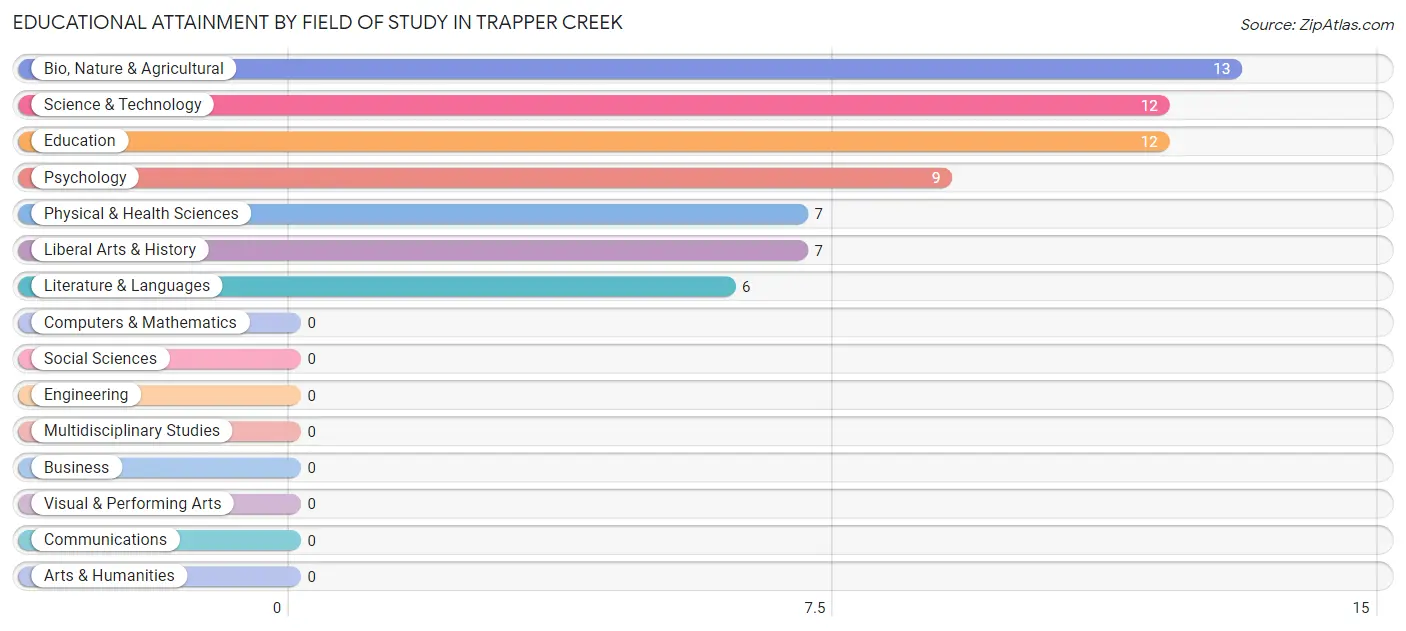
| Field of Study | # Graduates | % Graduates |
| Computers & Mathematics | 0 | 0.0% |
| Bio, Nature & Agricultural | 13 | 19.7% |
| Physical & Health Sciences | 7 | 10.6% |
| Psychology | 9 | 13.6% |
| Social Sciences | 0 | 0.0% |
| Engineering | 0 | 0.0% |
| Multidisciplinary Studies | 0 | 0.0% |
| Science & Technology | 12 | 18.2% |
| Business | 0 | 0.0% |
| Education | 12 | 18.2% |
| Literature & Languages | 6 | 9.1% |
| Liberal Arts & History | 7 | 10.6% |
| Visual & Performing Arts | 0 | 0.0% |
| Communications | 0 | 0.0% |
| Arts & Humanities | 0 | 0.0% |
| Total | 66 | 100.0% |
Transportation & Commute in Trapper Creek
Vehicle Availability by Sex in Trapper Creek
The most prevalent vehicle ownership categories in Trapper Creek are males with 2 vehicles (34, accounting for 46.6%) and females with 2 vehicles (25, making up 59.7%).
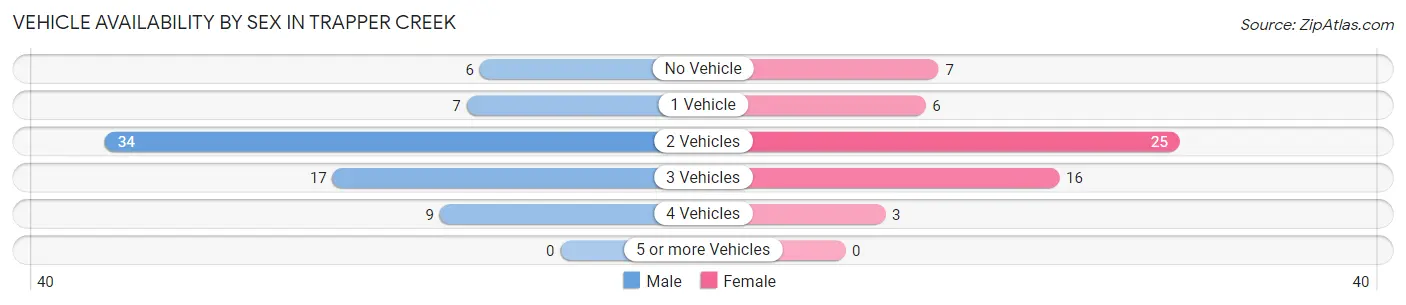
| Vehicles Available | Male | Female |
| No Vehicle | 6 (8.2%) | 7 (12.3%) |
| 1 Vehicle | 7 (9.6%) | 6 (10.5%) |
| 2 Vehicles | 34 (46.6%) | 25 (43.9%) |
| 3 Vehicles | 17 (23.3%) | 16 (28.1%) |
| 4 Vehicles | 9 (12.3%) | 3 (5.3%) |
| 5 or more Vehicles | 0 (0.0%) | 0 (0.0%) |
| Total | 73 (100.0%) | 57 (100.0%) |
Commute Time in Trapper Creek
The most frequently occuring commute durations in Trapper Creek are 90 or more minutes (39 commuters, 44.3%), 20 to 24 minutes (11 commuters, 12.5%), and 5 to 9 minutes (10 commuters, 11.4%).
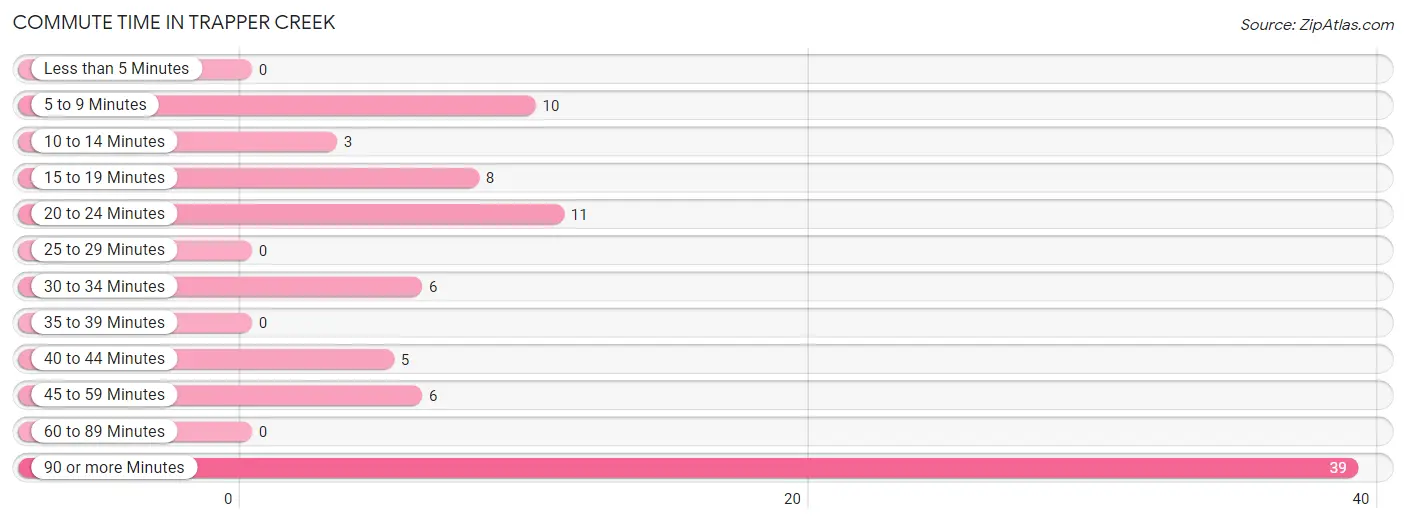
| Commute Time | # Commuters | % Commuters |
| Less than 5 Minutes | 0 | 0.0% |
| 5 to 9 Minutes | 10 | 11.4% |
| 10 to 14 Minutes | 3 | 3.4% |
| 15 to 19 Minutes | 8 | 9.1% |
| 20 to 24 Minutes | 11 | 12.5% |
| 25 to 29 Minutes | 0 | 0.0% |
| 30 to 34 Minutes | 6 | 6.8% |
| 35 to 39 Minutes | 0 | 0.0% |
| 40 to 44 Minutes | 5 | 5.7% |
| 45 to 59 Minutes | 6 | 6.8% |
| 60 to 89 Minutes | 0 | 0.0% |
| 90 or more Minutes | 39 | 44.3% |
Commute Time by Sex in Trapper Creek
The most common commute times in Trapper Creek are 90 or more minutes (33 commuters, 61.1%) for males and 5 to 9 minutes (7 commuters, 20.6%) for females.
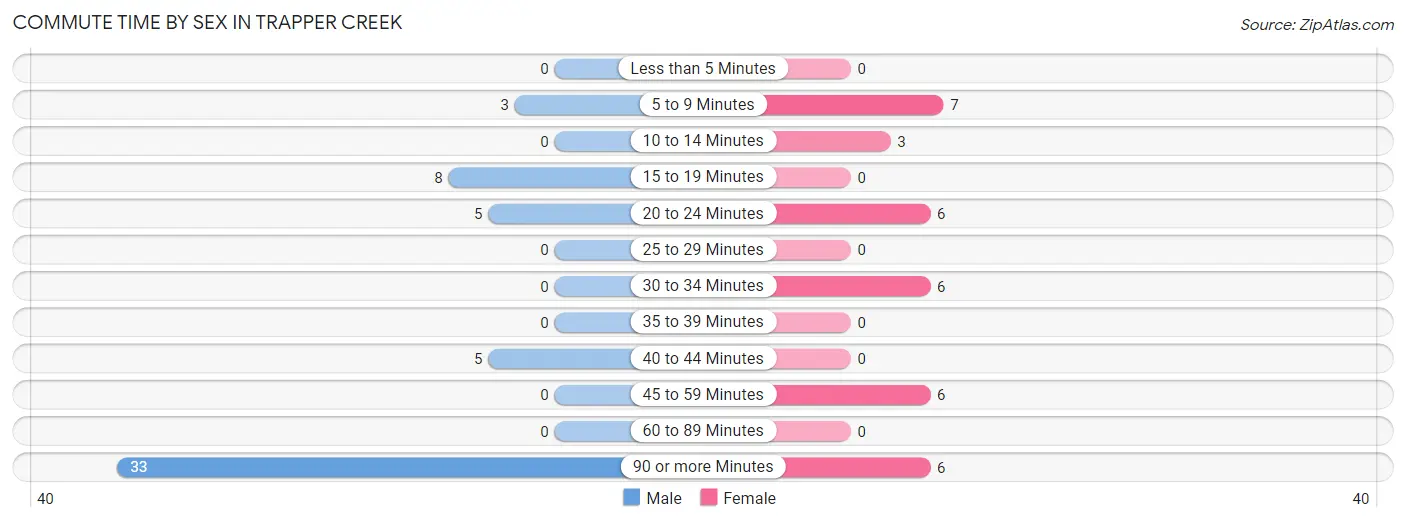
| Commute Time | Male | Female |
| Less than 5 Minutes | 0 (0.0%) | 0 (0.0%) |
| 5 to 9 Minutes | 3 (5.6%) | 7 (20.6%) |
| 10 to 14 Minutes | 0 (0.0%) | 3 (8.8%) |
| 15 to 19 Minutes | 8 (14.8%) | 0 (0.0%) |
| 20 to 24 Minutes | 5 (9.3%) | 6 (17.6%) |
| 25 to 29 Minutes | 0 (0.0%) | 0 (0.0%) |
| 30 to 34 Minutes | 0 (0.0%) | 6 (17.6%) |
| 35 to 39 Minutes | 0 (0.0%) | 0 (0.0%) |
| 40 to 44 Minutes | 5 (9.3%) | 0 (0.0%) |
| 45 to 59 Minutes | 0 (0.0%) | 6 (17.6%) |
| 60 to 89 Minutes | 0 (0.0%) | 0 (0.0%) |
| 90 or more Minutes | 33 (61.1%) | 6 (17.6%) |
Time of Departure to Work by Sex in Trapper Creek
The most frequent times of departure to work in Trapper Creek are 7:00 AM to 7:29 AM (12, 22.2%) for males and 12:00 PM to 3:59 PM (9, 26.5%) for females.
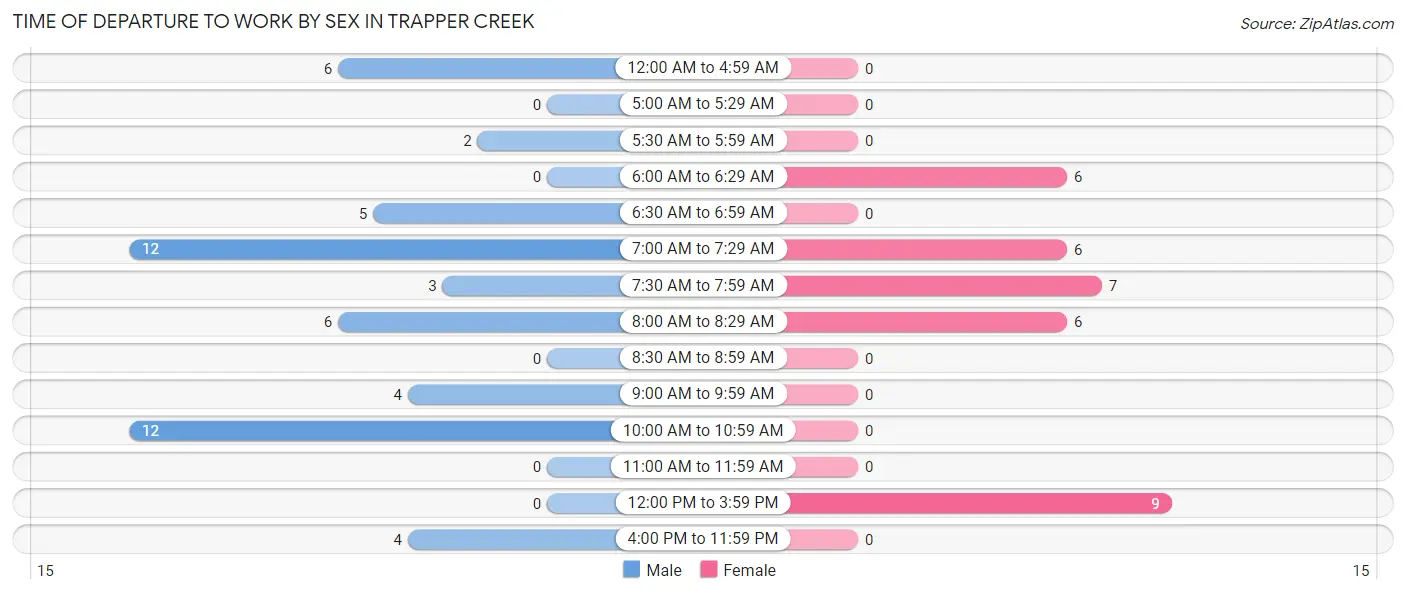
| Time of Departure | Male | Female |
| 12:00 AM to 4:59 AM | 6 (11.1%) | 0 (0.0%) |
| 5:00 AM to 5:29 AM | 0 (0.0%) | 0 (0.0%) |
| 5:30 AM to 5:59 AM | 2 (3.7%) | 0 (0.0%) |
| 6:00 AM to 6:29 AM | 0 (0.0%) | 6 (17.6%) |
| 6:30 AM to 6:59 AM | 5 (9.3%) | 0 (0.0%) |
| 7:00 AM to 7:29 AM | 12 (22.2%) | 6 (17.6%) |
| 7:30 AM to 7:59 AM | 3 (5.6%) | 7 (20.6%) |
| 8:00 AM to 8:29 AM | 6 (11.1%) | 6 (17.6%) |
| 8:30 AM to 8:59 AM | 0 (0.0%) | 0 (0.0%) |
| 9:00 AM to 9:59 AM | 4 (7.4%) | 0 (0.0%) |
| 10:00 AM to 10:59 AM | 12 (22.2%) | 0 (0.0%) |
| 11:00 AM to 11:59 AM | 0 (0.0%) | 0 (0.0%) |
| 12:00 PM to 3:59 PM | 0 (0.0%) | 9 (26.5%) |
| 4:00 PM to 11:59 PM | 4 (7.4%) | 0 (0.0%) |
| Total | 54 (100.0%) | 34 (100.0%) |
Housing Occupancy in Trapper Creek
Occupancy by Ownership in Trapper Creek
Of the total 176 dwellings in Trapper Creek, owner-occupied units account for 171 (97.2%), while renter-occupied units make up 5 (2.8%).
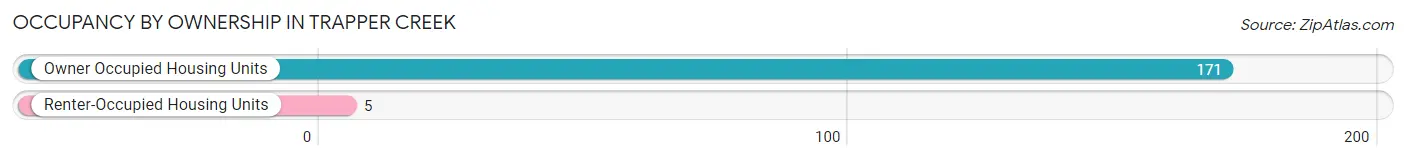
| Occupancy | # Housing Units | % Housing Units |
| Owner Occupied Housing Units | 171 | 97.2% |
| Renter-Occupied Housing Units | 5 | 2.8% |
| Total Occupied Housing Units | 176 | 100.0% |
Occupancy by Household Size in Trapper Creek
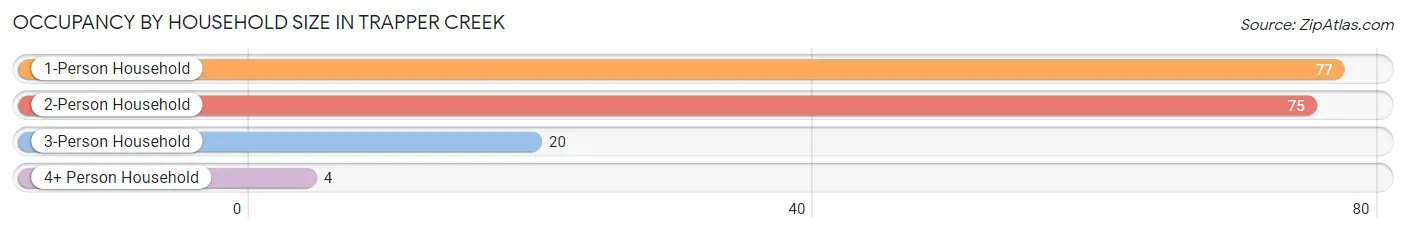
| Household Size | # Housing Units | % Housing Units |
| 1-Person Household | 77 | 43.8% |
| 2-Person Household | 75 | 42.6% |
| 3-Person Household | 20 | 11.4% |
| 4+ Person Household | 4 | 2.3% |
| Total Housing Units | 176 | 100.0% |
Occupancy by Ownership by Household Size in Trapper Creek
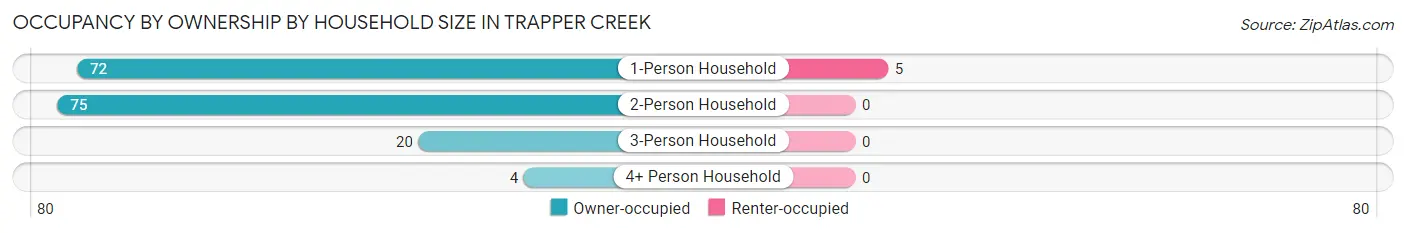
| Household Size | Owner-occupied | Renter-occupied |
| 1-Person Household | 72 (93.5%) | 5 (6.5%) |
| 2-Person Household | 75 (100.0%) | 0 (0.0%) |
| 3-Person Household | 20 (100.0%) | 0 (0.0%) |
| 4+ Person Household | 4 (100.0%) | 0 (0.0%) |
| Total Housing Units | 171 (97.2%) | 5 (2.8%) |
Occupancy by Educational Attainment in Trapper Creek
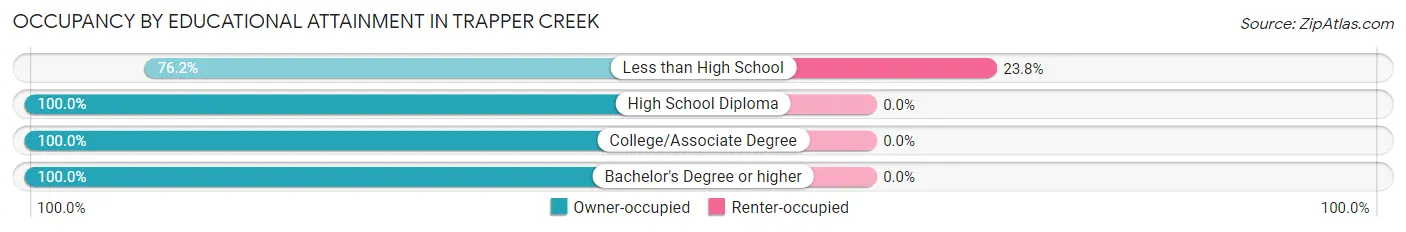
| Household Size | Owner-occupied | Renter-occupied |
| Less than High School | 16 (76.2%) | 5 (23.8%) |
| High School Diploma | 65 (100.0%) | 0 (0.0%) |
| College/Associate Degree | 56 (100.0%) | 0 (0.0%) |
| Bachelor's Degree or higher | 34 (100.0%) | 0 (0.0%) |
Occupancy by Age of Householder in Trapper Creek
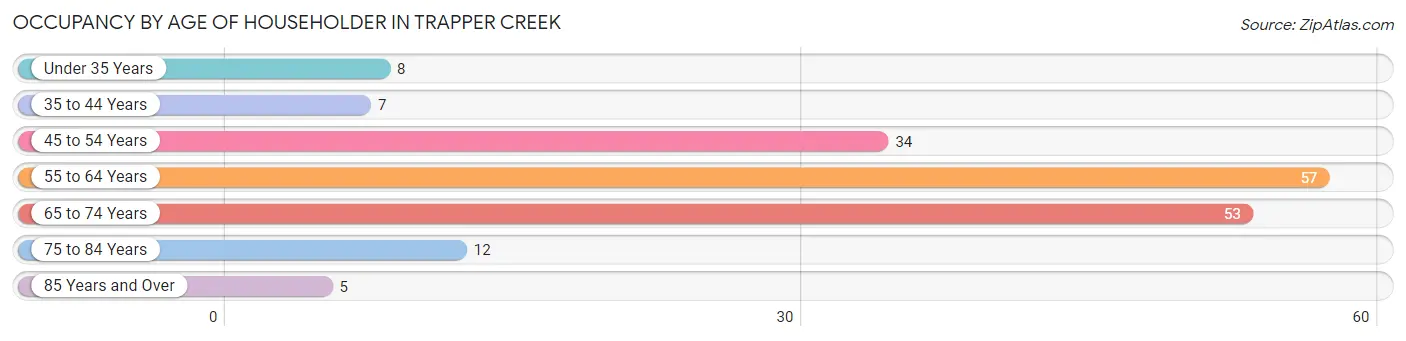
| Age Bracket | # Households | % Households |
| Under 35 Years | 8 | 4.5% |
| 35 to 44 Years | 7 | 4.0% |
| 45 to 54 Years | 34 | 19.3% |
| 55 to 64 Years | 57 | 32.4% |
| 65 to 74 Years | 53 | 30.1% |
| 75 to 84 Years | 12 | 6.8% |
| 85 Years and Over | 5 | 2.8% |
| Total | 176 | 100.0% |
Housing Finances in Trapper Creek
Median Income by Occupancy in Trapper Creek
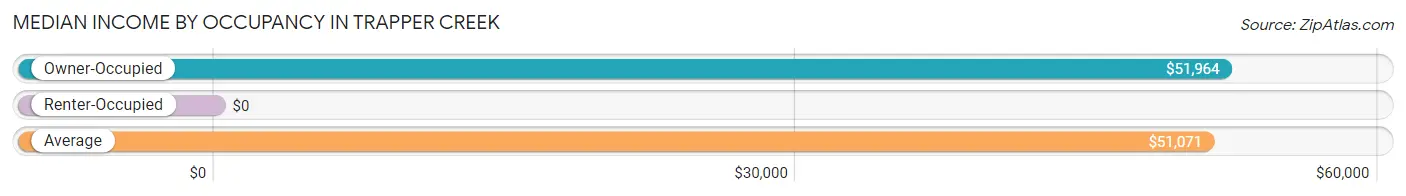
| Occupancy Type | # Households | Median Income |
| Owner-Occupied | 171 (97.2%) | $51,964 |
| Renter-Occupied | 5 (2.8%) | $0 |
| Average | 176 (100.0%) | $51,071 |
Occupancy by Householder Income Bracket in Trapper Creek
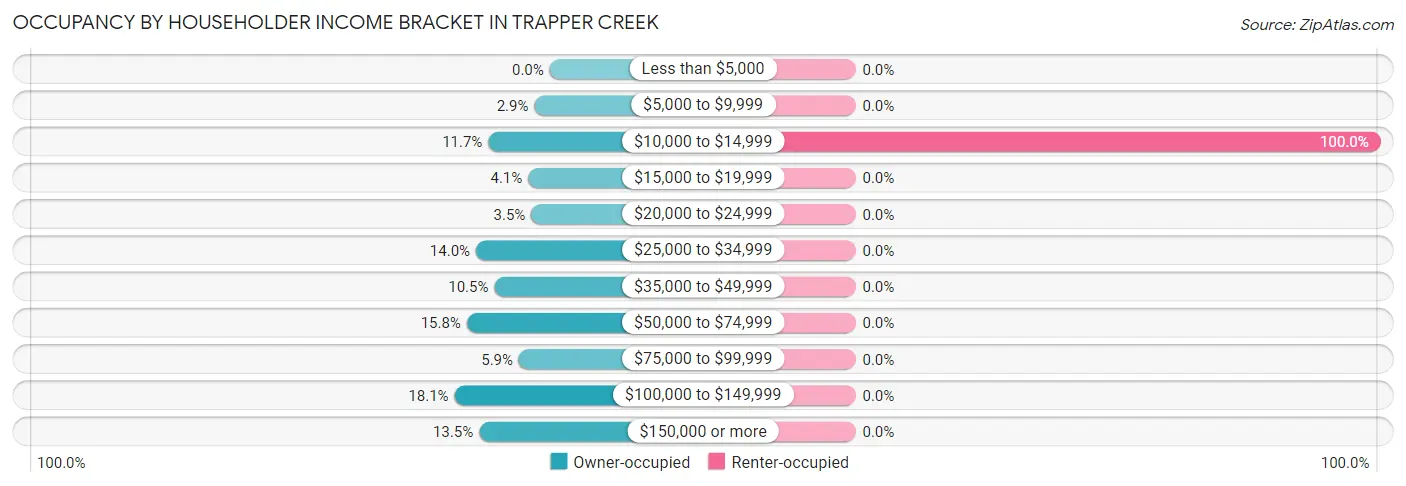
| Income Bracket | Owner-occupied | Renter-occupied |
| Less than $5,000 | 0 (0.0%) | 0 (0.0%) |
| $5,000 to $9,999 | 5 (2.9%) | 0 (0.0%) |
| $10,000 to $14,999 | 20 (11.7%) | 5 (100.0%) |
| $15,000 to $19,999 | 7 (4.1%) | 0 (0.0%) |
| $20,000 to $24,999 | 6 (3.5%) | 0 (0.0%) |
| $25,000 to $34,999 | 24 (14.0%) | 0 (0.0%) |
| $35,000 to $49,999 | 18 (10.5%) | 0 (0.0%) |
| $50,000 to $74,999 | 27 (15.8%) | 0 (0.0%) |
| $75,000 to $99,999 | 10 (5.9%) | 0 (0.0%) |
| $100,000 to $149,999 | 31 (18.1%) | 0 (0.0%) |
| $150,000 or more | 23 (13.5%) | 0 (0.0%) |
| Total | 171 (100.0%) | 5 (100.0%) |
Monthly Housing Cost Tiers in Trapper Creek
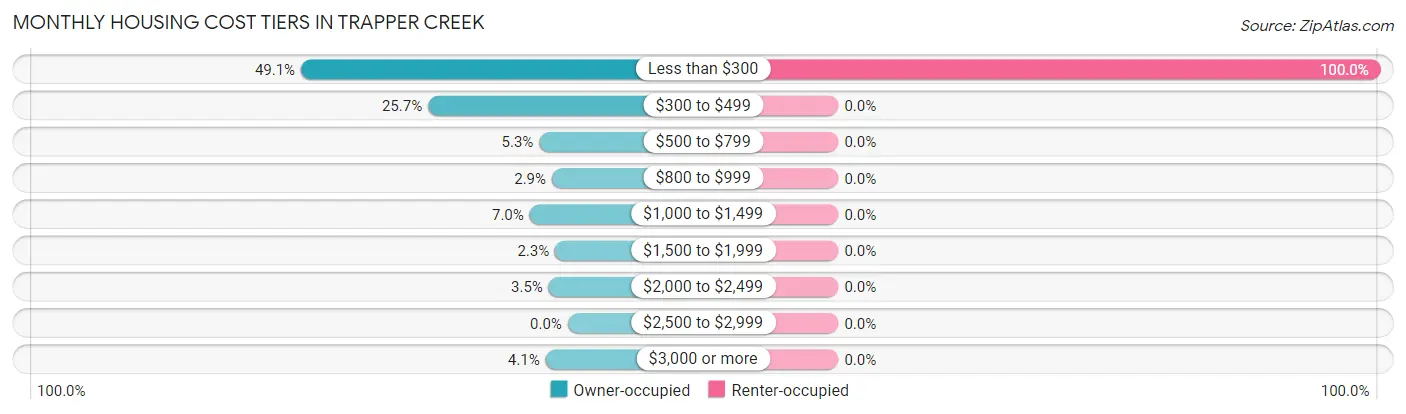
| Monthly Cost | Owner-occupied | Renter-occupied |
| Less than $300 | 84 (49.1%) | 5 (100.0%) |
| $300 to $499 | 44 (25.7%) | 0 (0.0%) |
| $500 to $799 | 9 (5.3%) | 0 (0.0%) |
| $800 to $999 | 5 (2.9%) | 0 (0.0%) |
| $1,000 to $1,499 | 12 (7.0%) | 0 (0.0%) |
| $1,500 to $1,999 | 4 (2.3%) | 0 (0.0%) |
| $2,000 to $2,499 | 6 (3.5%) | 0 (0.0%) |
| $2,500 to $2,999 | 0 (0.0%) | 0 (0.0%) |
| $3,000 or more | 7 (4.1%) | 0 (0.0%) |
| Total | 171 (100.0%) | 5 (100.0%) |
Physical Housing Characteristics in Trapper Creek
Housing Structures in Trapper Creek
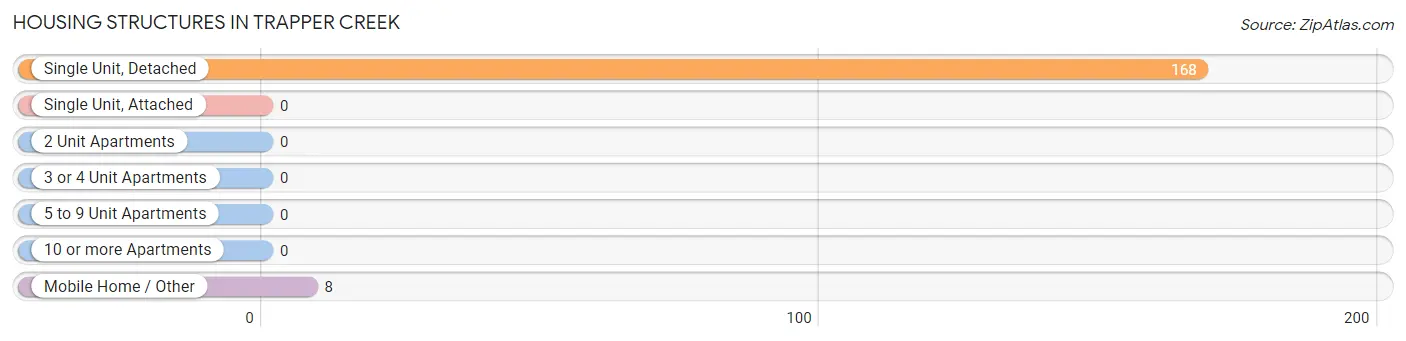
| Structure Type | # Housing Units | % Housing Units |
| Single Unit, Detached | 168 | 95.5% |
| Single Unit, Attached | 0 | 0.0% |
| 2 Unit Apartments | 0 | 0.0% |
| 3 or 4 Unit Apartments | 0 | 0.0% |
| 5 to 9 Unit Apartments | 0 | 0.0% |
| 10 or more Apartments | 0 | 0.0% |
| Mobile Home / Other | 8 | 4.5% |
| Total | 176 | 100.0% |
Housing Structures by Occupancy in Trapper Creek
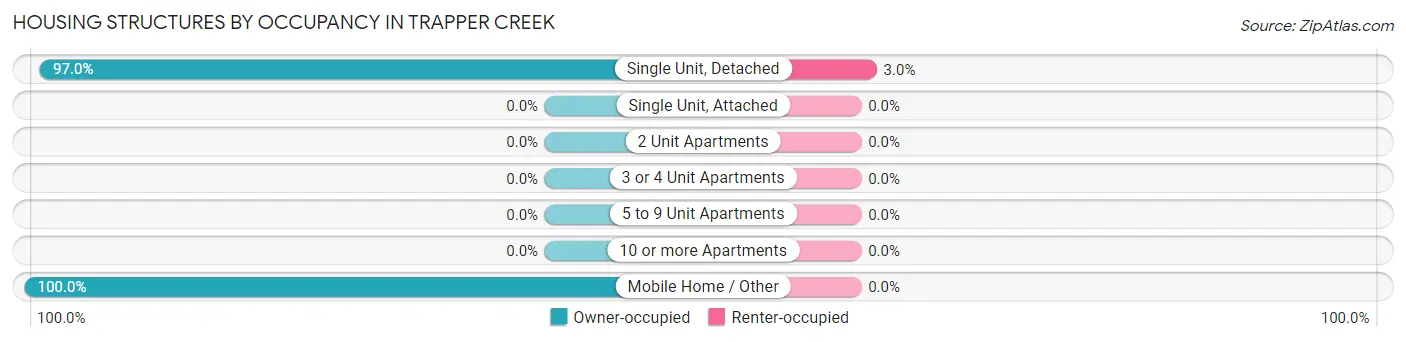
| Structure Type | Owner-occupied | Renter-occupied |
| Single Unit, Detached | 163 (97.0%) | 5 (3.0%) |
| Single Unit, Attached | 0 (0.0%) | 0 (0.0%) |
| 2 Unit Apartments | 0 (0.0%) | 0 (0.0%) |
| 3 or 4 Unit Apartments | 0 (0.0%) | 0 (0.0%) |
| 5 to 9 Unit Apartments | 0 (0.0%) | 0 (0.0%) |
| 10 or more Apartments | 0 (0.0%) | 0 (0.0%) |
| Mobile Home / Other | 8 (100.0%) | 0 (0.0%) |
| Total | 171 (97.2%) | 5 (2.8%) |
Housing Structures by Number of Rooms in Trapper Creek
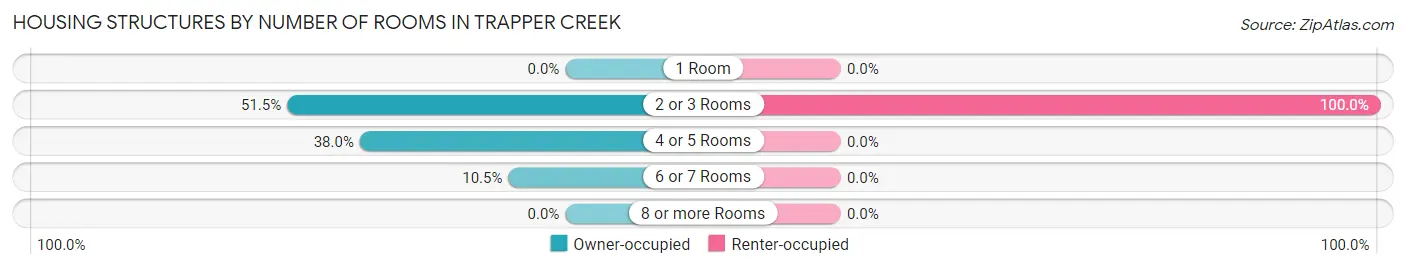
| Number of Rooms | Owner-occupied | Renter-occupied |
| 1 Room | 0 (0.0%) | 0 (0.0%) |
| 2 or 3 Rooms | 88 (51.5%) | 5 (100.0%) |
| 4 or 5 Rooms | 65 (38.0%) | 0 (0.0%) |
| 6 or 7 Rooms | 18 (10.5%) | 0 (0.0%) |
| 8 or more Rooms | 0 (0.0%) | 0 (0.0%) |
| Total | 171 (100.0%) | 5 (100.0%) |
Housing Structure by Heating Type in Trapper Creek
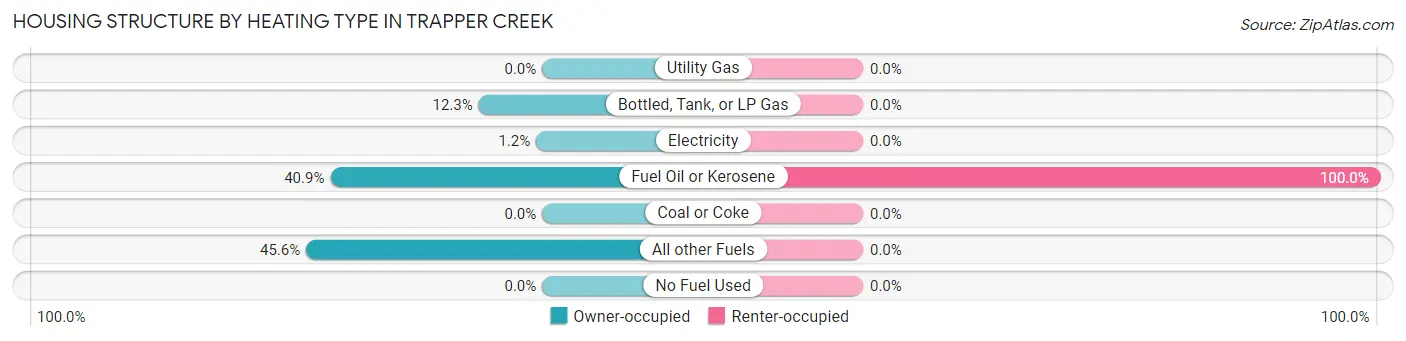
| Heating Type | Owner-occupied | Renter-occupied |
| Utility Gas | 0 (0.0%) | 0 (0.0%) |
| Bottled, Tank, or LP Gas | 21 (12.3%) | 0 (0.0%) |
| Electricity | 2 (1.2%) | 0 (0.0%) |
| Fuel Oil or Kerosene | 70 (40.9%) | 5 (100.0%) |
| Coal or Coke | 0 (0.0%) | 0 (0.0%) |
| All other Fuels | 78 (45.6%) | 0 (0.0%) |
| No Fuel Used | 0 (0.0%) | 0 (0.0%) |
| Total | 171 (100.0%) | 5 (100.0%) |
Household Vehicle Usage in Trapper Creek
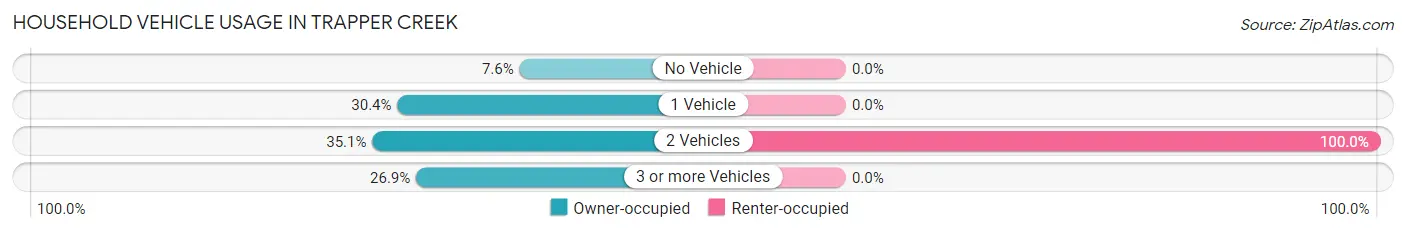
| Vehicles per Household | Owner-occupied | Renter-occupied |
| No Vehicle | 13 (7.6%) | 0 (0.0%) |
| 1 Vehicle | 52 (30.4%) | 0 (0.0%) |
| 2 Vehicles | 60 (35.1%) | 5 (100.0%) |
| 3 or more Vehicles | 46 (26.9%) | 0 (0.0%) |
| Total | 171 (100.0%) | 5 (100.0%) |
Real Estate & Mortgages in Trapper Creek
Real Estate and Mortgage Overview in Trapper Creek
| Characteristic | Without Mortgage | With Mortgage |
| Housing Units | 143 | 28 |
| Median Property Value | $156,400 | $371,400 |
| Median Household Income | $43,958 | $10 |
| Monthly Housing Costs | $252 | $7 |
| Real Estate Taxes | $1,088 | $7 |
Property Value by Mortgage Status in Trapper Creek
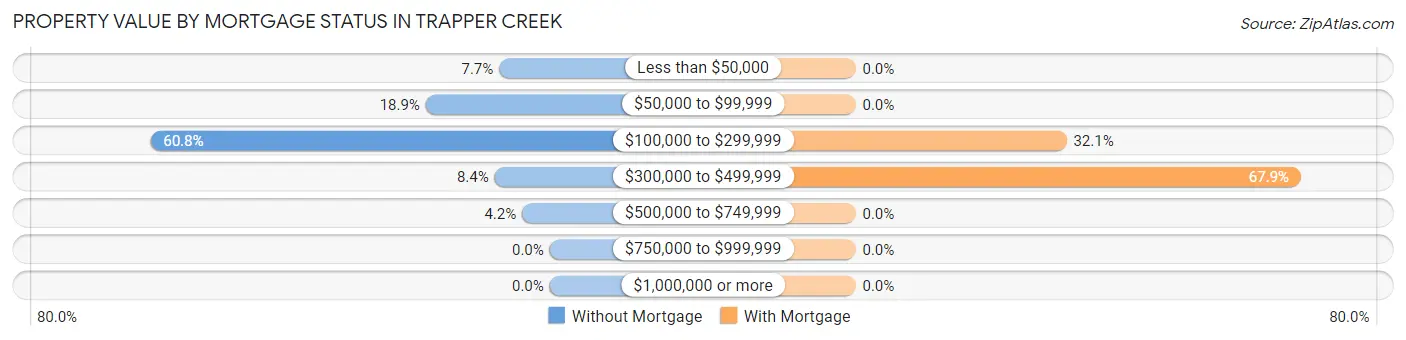
| Property Value | Without Mortgage | With Mortgage |
| Less than $50,000 | 11 (7.7%) | 0 (0.0%) |
| $50,000 to $99,999 | 27 (18.9%) | 0 (0.0%) |
| $100,000 to $299,999 | 87 (60.8%) | 9 (32.1%) |
| $300,000 to $499,999 | 12 (8.4%) | 19 (67.9%) |
| $500,000 to $749,999 | 6 (4.2%) | 0 (0.0%) |
| $750,000 to $999,999 | 0 (0.0%) | 0 (0.0%) |
| $1,000,000 or more | 0 (0.0%) | 0 (0.0%) |
| Total | 143 (100.0%) | 28 (100.0%) |
Household Income by Mortgage Status in Trapper Creek
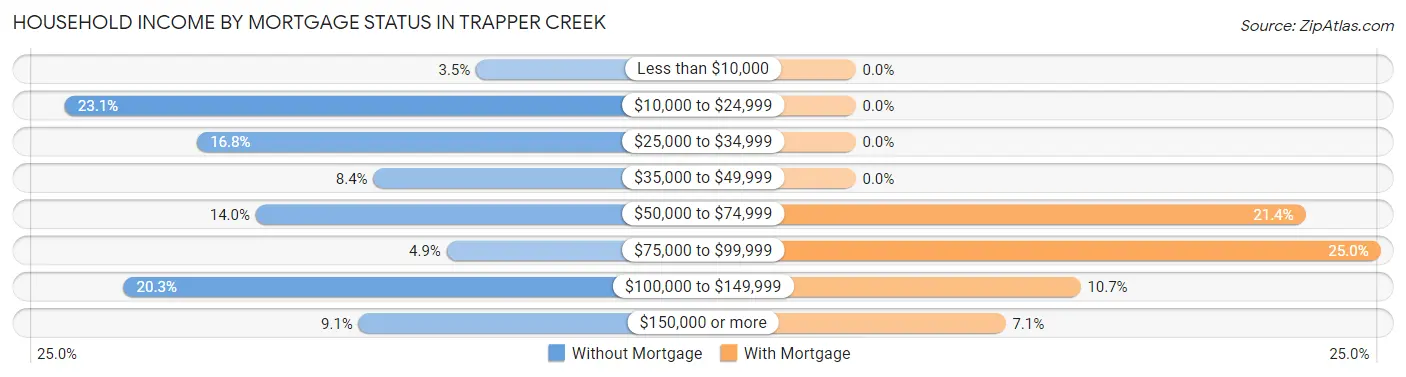
| Household Income | Without Mortgage | With Mortgage |
| Less than $10,000 | 5 (3.5%) | 0 (0.0%) |
| $10,000 to $24,999 | 33 (23.1%) | 0 (0.0%) |
| $25,000 to $34,999 | 24 (16.8%) | 0 (0.0%) |
| $35,000 to $49,999 | 12 (8.4%) | 0 (0.0%) |
| $50,000 to $74,999 | 20 (14.0%) | 6 (21.4%) |
| $75,000 to $99,999 | 7 (4.9%) | 7 (25.0%) |
| $100,000 to $149,999 | 29 (20.3%) | 3 (10.7%) |
| $150,000 or more | 13 (9.1%) | 2 (7.1%) |
| Total | 143 (100.0%) | 28 (100.0%) |
Property Value to Household Income Ratio in Trapper Creek
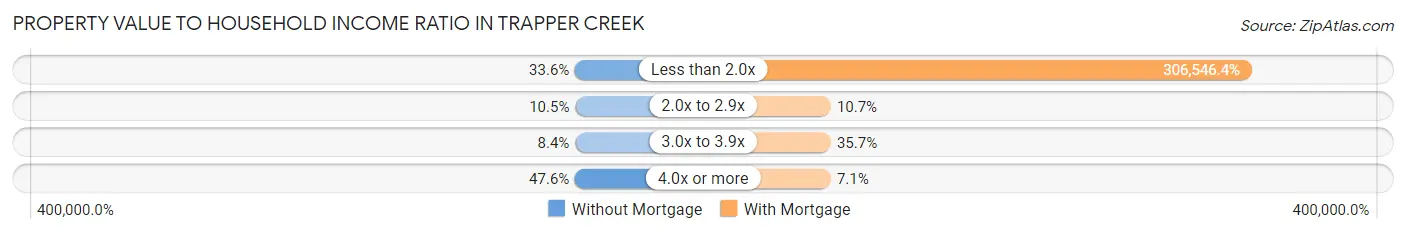
| Value-to-Income Ratio | Without Mortgage | With Mortgage |
| Less than 2.0x | 48 (33.6%) | 85,833 (306,546.4%) |
| 2.0x to 2.9x | 15 (10.5%) | 3 (10.7%) |
| 3.0x to 3.9x | 12 (8.4%) | 10 (35.7%) |
| 4.0x or more | 68 (47.5%) | 2 (7.1%) |
| Total | 143 (100.0%) | 28 (100.0%) |
Real Estate Taxes by Mortgage Status in Trapper Creek
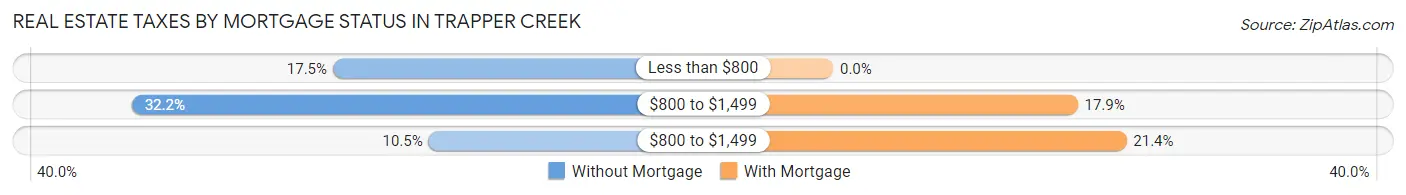
| Property Taxes | Without Mortgage | With Mortgage |
| Less than $800 | 25 (17.5%) | 0 (0.0%) |
| $800 to $1,499 | 46 (32.2%) | 5 (17.9%) |
| $800 to $1,499 | 15 (10.5%) | 6 (21.4%) |
| Total | 143 (100.0%) | 28 (100.0%) |
Health & Disability in Trapper Creek
Health Insurance Coverage by Age in Trapper Creek
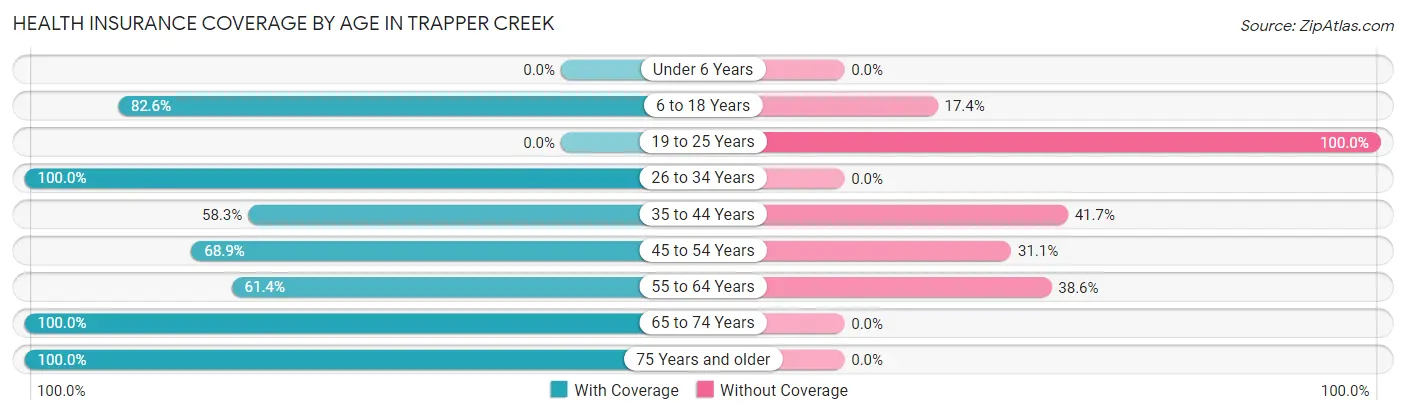
| Age Bracket | With Coverage | Without Coverage |
| Under 6 Years | 0 (0.0%) | 0 (0.0%) |
| 6 to 18 Years | 19 (82.6%) | 4 (17.4%) |
| 19 to 25 Years | 0 (0.0%) | 4 (100.0%) |
| 26 to 34 Years | 8 (100.0%) | 0 (0.0%) |
| 35 to 44 Years | 7 (58.3%) | 5 (41.7%) |
| 45 to 54 Years | 31 (68.9%) | 14 (31.1%) |
| 55 to 64 Years | 62 (61.4%) | 39 (38.6%) |
| 65 to 74 Years | 81 (100.0%) | 0 (0.0%) |
| 75 Years and older | 29 (100.0%) | 0 (0.0%) |
| Total | 237 (78.2%) | 66 (21.8%) |
Health Insurance Coverage by Citizenship Status in Trapper Creek
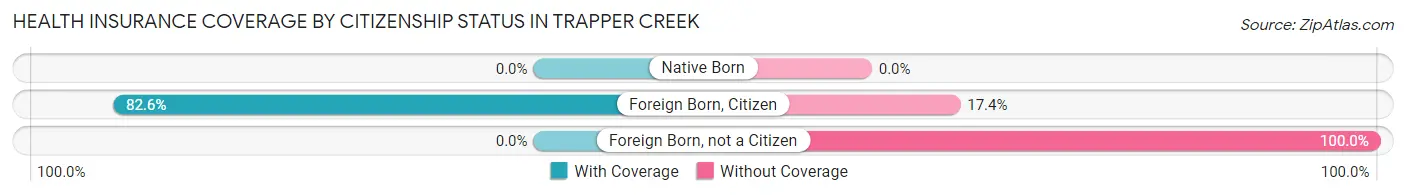
| Citizenship Status | With Coverage | Without Coverage |
| Native Born | 0 (0.0%) | 0 (0.0%) |
| Foreign Born, Citizen | 19 (82.6%) | 4 (17.4%) |
| Foreign Born, not a Citizen | 0 (0.0%) | 4 (100.0%) |
Health Insurance Coverage by Household Income in Trapper Creek
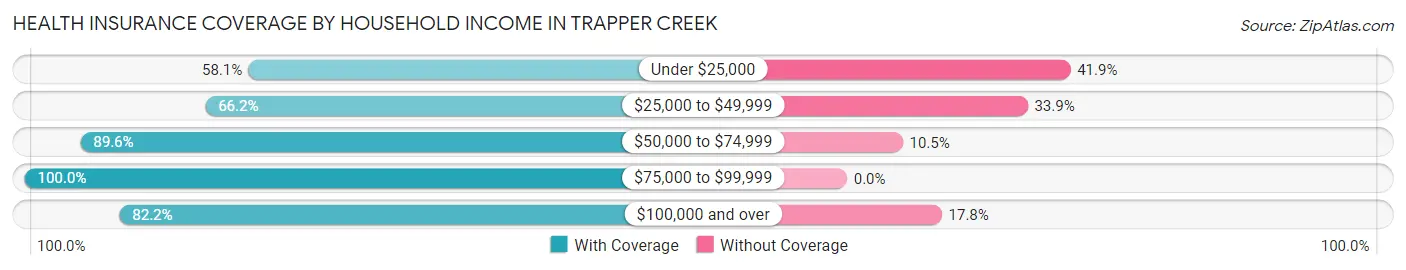
| Household Income | With Coverage | Without Coverage |
| Under $25,000 | 25 (58.1%) | 18 (41.9%) |
| $25,000 to $49,999 | 43 (66.1%) | 22 (33.9%) |
| $50,000 to $74,999 | 60 (89.5%) | 7 (10.4%) |
| $75,000 to $99,999 | 21 (100.0%) | 0 (0.0%) |
| $100,000 and over | 88 (82.2%) | 19 (17.8%) |
Public vs Private Health Insurance Coverage by Age in Trapper Creek
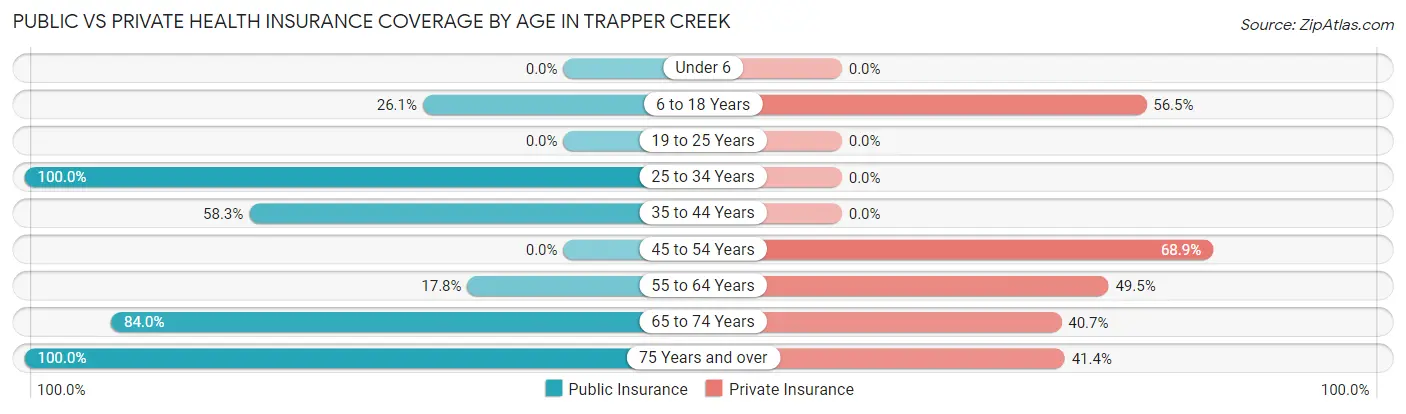
| Age Bracket | Public Insurance | Private Insurance |
| Under 6 | 0 (0.0%) | 0 (0.0%) |
| 6 to 18 Years | 6 (26.1%) | 13 (56.5%) |
| 19 to 25 Years | 0 (0.0%) | 0 (0.0%) |
| 25 to 34 Years | 8 (100.0%) | 0 (0.0%) |
| 35 to 44 Years | 7 (58.3%) | 0 (0.0%) |
| 45 to 54 Years | 0 (0.0%) | 31 (68.9%) |
| 55 to 64 Years | 18 (17.8%) | 50 (49.5%) |
| 65 to 74 Years | 68 (84.0%) | 33 (40.7%) |
| 75 Years and over | 29 (100.0%) | 12 (41.4%) |
| Total | 136 (44.9%) | 139 (45.9%) |
Disability Status by Sex by Age in Trapper Creek
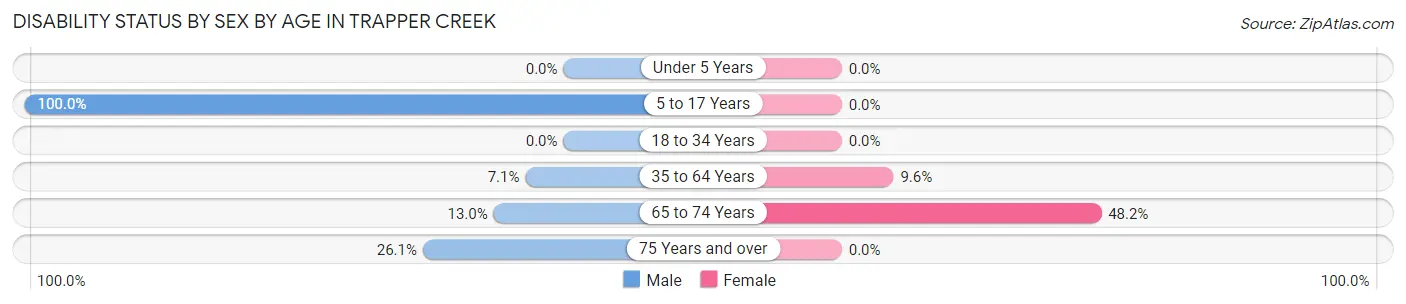
| Age Bracket | Male | Female |
| Under 5 Years | 0 (0.0%) | 0 (0.0%) |
| 5 to 17 Years | 7 (100.0%) | 0 (0.0%) |
| 18 to 34 Years | 0 (0.0%) | 0 (0.0%) |
| 35 to 64 Years | 6 (7.1%) | 7 (9.6%) |
| 65 to 74 Years | 7 (13.0%) | 13 (48.1%) |
| 75 Years and over | 6 (26.1%) | 0 (0.0%) |
Disability Class by Sex by Age in Trapper Creek
Disability Class: Hearing Difficulty
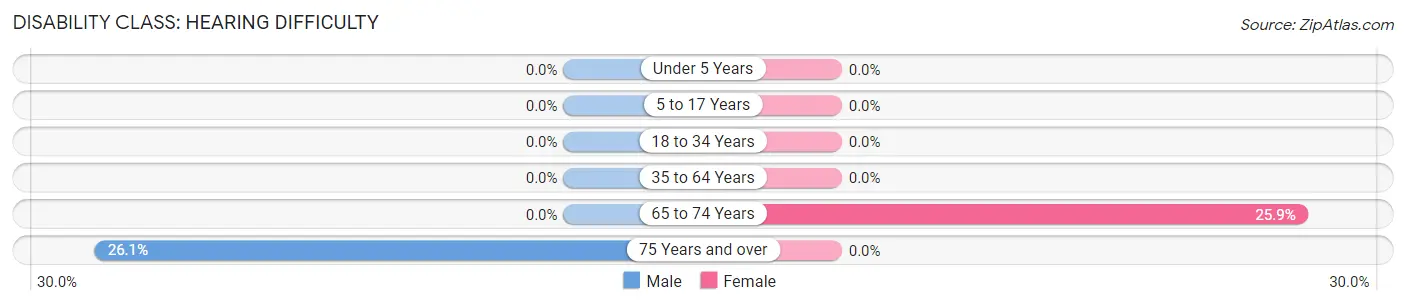
| Age Bracket | Male | Female |
| Under 5 Years | 0 (0.0%) | 0 (0.0%) |
| 5 to 17 Years | 0 (0.0%) | 0 (0.0%) |
| 18 to 34 Years | 0 (0.0%) | 0 (0.0%) |
| 35 to 64 Years | 0 (0.0%) | 0 (0.0%) |
| 65 to 74 Years | 0 (0.0%) | 7 (25.9%) |
| 75 Years and over | 6 (26.1%) | 0 (0.0%) |
Disability Class: Vision Difficulty
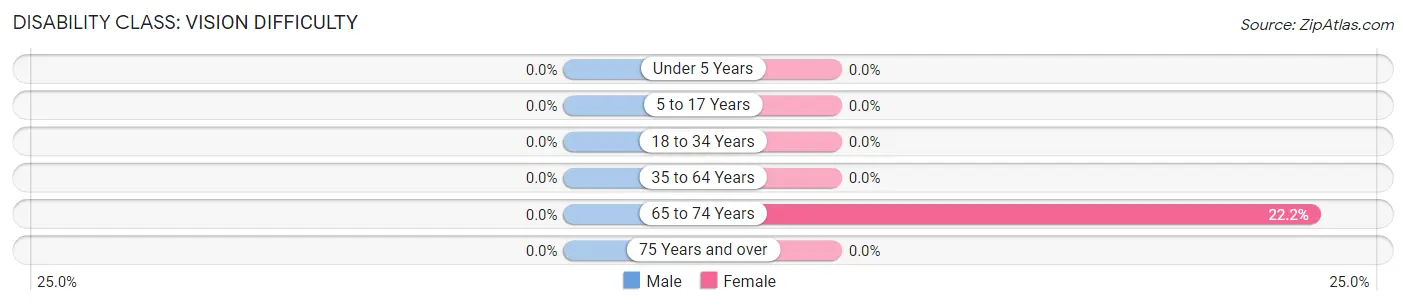
| Age Bracket | Male | Female |
| Under 5 Years | 0 (0.0%) | 0 (0.0%) |
| 5 to 17 Years | 0 (0.0%) | 0 (0.0%) |
| 18 to 34 Years | 0 (0.0%) | 0 (0.0%) |
| 35 to 64 Years | 0 (0.0%) | 0 (0.0%) |
| 65 to 74 Years | 0 (0.0%) | 6 (22.2%) |
| 75 Years and over | 0 (0.0%) | 0 (0.0%) |
Disability Class: Cognitive Difficulty
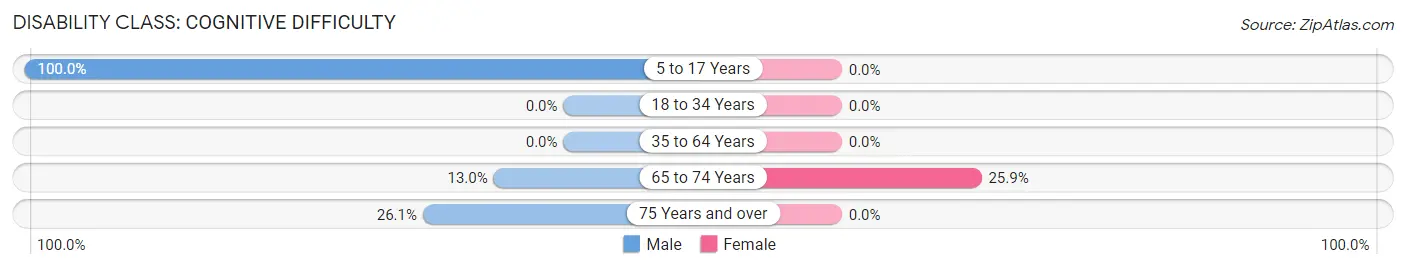
| Age Bracket | Male | Female |
| 5 to 17 Years | 7 (100.0%) | 0 (0.0%) |
| 18 to 34 Years | 0 (0.0%) | 0 (0.0%) |
| 35 to 64 Years | 0 (0.0%) | 0 (0.0%) |
| 65 to 74 Years | 7 (13.0%) | 7 (25.9%) |
| 75 Years and over | 6 (26.1%) | 0 (0.0%) |
Disability Class: Ambulatory Difficulty
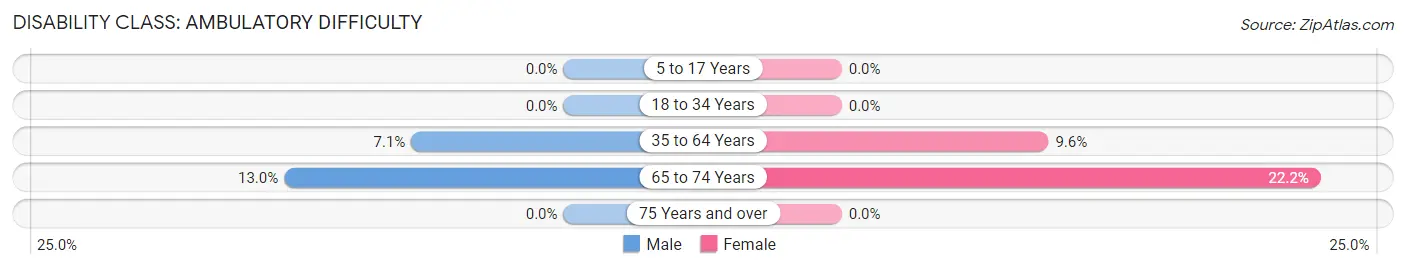
| Age Bracket | Male | Female |
| 5 to 17 Years | 0 (0.0%) | 0 (0.0%) |
| 18 to 34 Years | 0 (0.0%) | 0 (0.0%) |
| 35 to 64 Years | 6 (7.1%) | 7 (9.6%) |
| 65 to 74 Years | 7 (13.0%) | 6 (22.2%) |
| 75 Years and over | 0 (0.0%) | 0 (0.0%) |
Disability Class: Self-Care Difficulty
| Age Bracket | Male | Female |
| 5 to 17 Years | 0 (0.0%) | 0 (0.0%) |
| 18 to 34 Years | 0 (0.0%) | 0 (0.0%) |
| 35 to 64 Years | 0 (0.0%) | 0 (0.0%) |
| 65 to 74 Years | 0 (0.0%) | 0 (0.0%) |
| 75 Years and over | 0 (0.0%) | 0 (0.0%) |
Technology Access in Trapper Creek
Computing Device Access in Trapper Creek
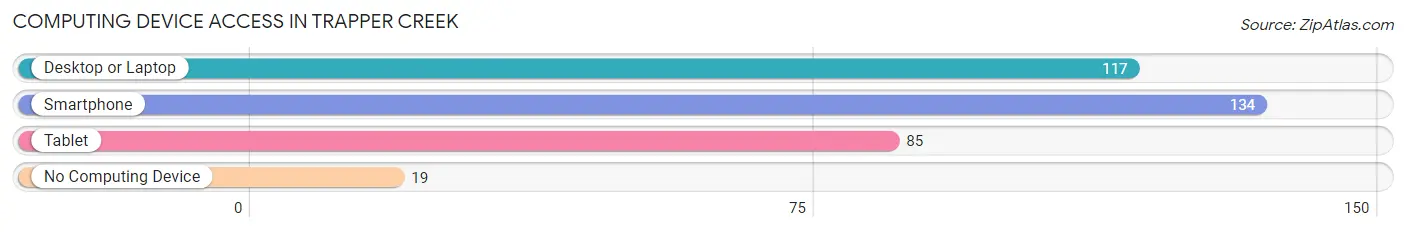
| Device Type | # Households | % Households |
| Desktop or Laptop | 117 | 66.5% |
| Smartphone | 134 | 76.1% |
| Tablet | 85 | 48.3% |
| No Computing Device | 19 | 10.8% |
| Total | 176 | 100.0% |
Internet Access in Trapper Creek
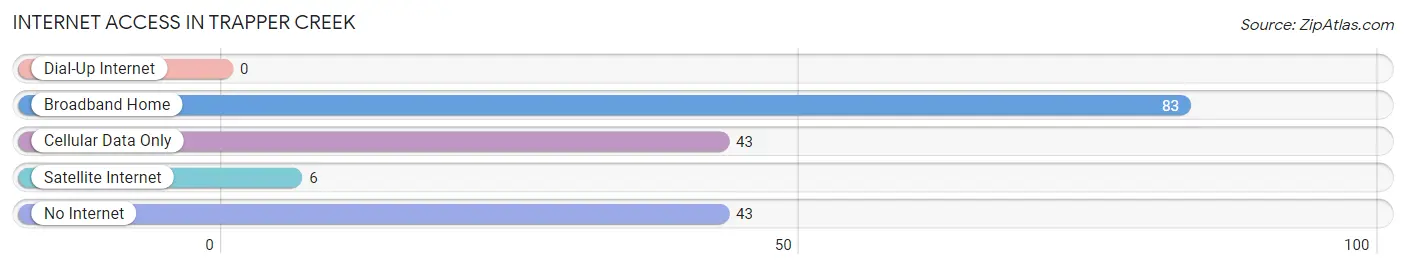
| Internet Type | # Households | % Households |
| Dial-Up Internet | 0 | 0.0% |
| Broadband Home | 83 | 47.2% |
| Cellular Data Only | 43 | 24.4% |
| Satellite Internet | 6 | 3.4% |
| No Internet | 43 | 24.4% |
| Total | 176 | 100.0% |
Trapper Creek Summary
Trapper Creek, Alaska is a small unincorporated community located in the Matanuska-Susitna Borough of Alaska. It is situated at the junction of the Parks Highway and the Old Glenn Highway, approximately 50 miles north of Anchorage. The population of Trapper Creek was estimated to be 1,072 in 2019.
History
The area around Trapper Creek was first inhabited by the Dena’ina Athabascan people. The Dena’ina people have lived in the area for thousands of years and continue to live in the area today. The first non-Native settlers in the area were gold miners who arrived in the late 19th century. The area was named after a trapper who lived in the area in the early 1900s.
The first post office in Trapper Creek was established in 1921. The community was officially incorporated in 1953. In the 1950s, the Alaska Railroad built a spur line to Trapper Creek, which allowed for the development of the community.
Geography
Trapper Creek is located in the Matanuska-Susitna Borough of Alaska. It is situated at the junction of the Parks Highway and the Old Glenn Highway, approximately 50 miles north of Anchorage. The community is located in the Matanuska Valley, which is surrounded by the Chugach Mountains to the east and the Talkeetna Mountains to the west.
The climate in Trapper Creek is generally mild, with temperatures ranging from -20°F in the winter to 80°F in the summer. The area receives an average of 20 inches of precipitation per year, with most of it falling in the form of snow.
Economy
The economy of Trapper Creek is largely based on tourism and recreation. The area is home to several popular tourist attractions, including the Trapper Creek Museum, the Trapper Creek Wilderness Park, and the Trapper Creek Golf Course. The area is also popular for its outdoor activities, such as fishing, hunting, and camping.
The area is also home to several businesses, including restaurants, gas stations, and lodging. The Trapper Creek Job Corps Center is located in the community and provides job training and educational opportunities for local residents.
Demographics
The population of Trapper Creek was estimated to be 1,072 in 2019. The racial makeup of the community is predominantly white (90.2%), with smaller percentages of Native American (4.2%), Asian (2.2%), and other races (3.4%). The median household income in Trapper Creek is $50,938, which is slightly lower than the median household income for the state of Alaska ($63,485). The median age in Trapper Creek is 44.3 years, which is slightly higher than the median age for the state of Alaska (37.7 years).
Conclusion
Trapper Creek, Alaska is a small unincorporated community located in the Matanuska-Susitna Borough of Alaska. It is situated at the junction of the Parks Highway and the Old Glenn Highway, approximately 50 miles north of Anchorage. The area was first inhabited by the Dena’ina Athabascan people and was later settled by gold miners in the late 19th century. The economy of Trapper Creek is largely based on tourism and recreation, and the population of the community was estimated to be 1,072 in 2019. The racial makeup of the community is predominantly white, with smaller percentages of Native American, Asian, and other races. The median household income in Trapper Creek is $50,938, and the median age is 44.3 years.
Common Questions
What is Per Capita Income in Trapper Creek?
Per Capita income in Trapper Creek is $44,776.
What is the Median Family Income in Trapper Creek?
Median Family Income in Trapper Creek is $86,667.
What is the Median Household income in Trapper Creek?
Median Household Income in Trapper Creek is $51,071.
What is Inequality or Gini Index in Trapper Creek?
Inequality or Gini Index in Trapper Creek is 0.47.
What is the Total Population of Trapper Creek?
Total Population of Trapper Creek is 303.
What is the Total Male Population of Trapper Creek?
Total Male Population of Trapper Creek is 181.
What is the Total Female Population of Trapper Creek?
Total Female Population of Trapper Creek is 122.
What is the Ratio of Males per 100 Females in Trapper Creek?
There are 148.36 Males per 100 Females in Trapper Creek.
What is the Ratio of Females per 100 Males in Trapper Creek?
There are 67.40 Females per 100 Males in Trapper Creek.
What is the Median Population Age in Trapper Creek?
Median Population Age in Trapper Creek is 63.4 Years.
What is the Average Family Size in Trapper Creek
Average Family Size in Trapper Creek is 2.3 People.
What is the Average Household Size in Trapper Creek
Average Household Size in Trapper Creek is 1.7 People.
How Large is the Labor Force in Trapper Creek?
There are 142 People in the Labor Forcein in Trapper Creek.
What is the Percentage of People in the Labor Force in Trapper Creek?
49.0% of People are in the Labor Force in Trapper Creek.
What is the Unemployment Rate in Trapper Creek?
Unemployment Rate in Trapper Creek is 8.5%.